Embed Size (px)
Citation preview
162
Effect of Environmental Corrosion on Sea Front Reinforced Concrete Structures
Chapter No. (6)
Materials and Test Methods
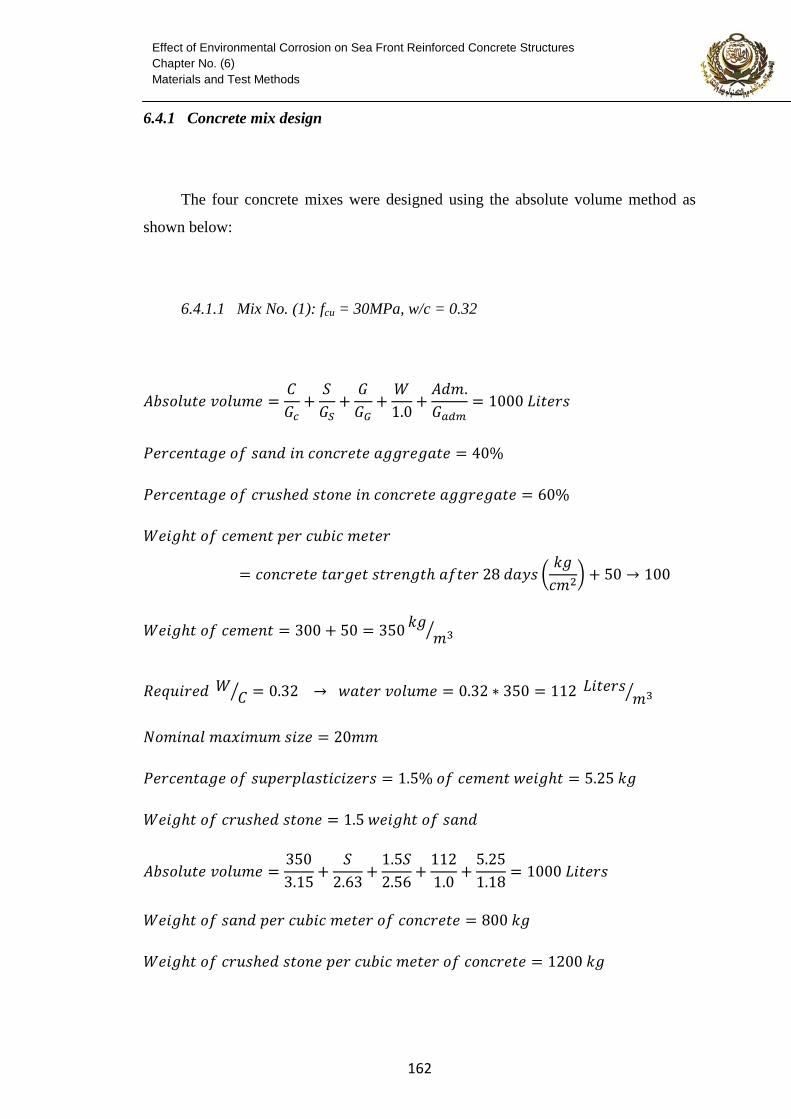
6.4.1 Concrete mix design
The four concrete mixes were designed using the absolute volume method as
shown below:
6.4.1.1 Mix No. (1): fcu = 30MPa, w/c = 0.32
163
Effect of Environmental Corrosion on Sea Front Reinforced Concrete Structures
Chapter No. (6)
Materials and Test Methods
6.4.1.2 Mix No. (2): fcu = 44MPa, w/c = 0.52
6.4.1.3 Mix No. (3): fcu = 44MPa, w/c = 0.32
164
Effect of Environmental Corrosion on Sea Front Reinforced Concrete Structures
Chapter No. (6)
Materials and Test Methods
6.4.1.4 Mix No. (4): fcu = 60MPa, w/c = 0.32
165
Effect of Environmental Corrosion on Sea Front Reinforced Concrete Structures
Chapter No. (6)
Materials and Test Methods
Table 6.14 summarizes the concrete mix proportioning for the four mixes.
Table 6.14: Concrete mix proportions per cubic meter
Cement
(kg) Sand (kg)
Coarse
aggregate
(kg)
Water
(Liters)
Admixtures
(kg)
Mix No.1 350 800 1200 112 5.25
Mix No.2 540 567 850 281 0.0
Mix No.3 490 705 1058 157 7.35
Mix No.4 650 595 892 208 13
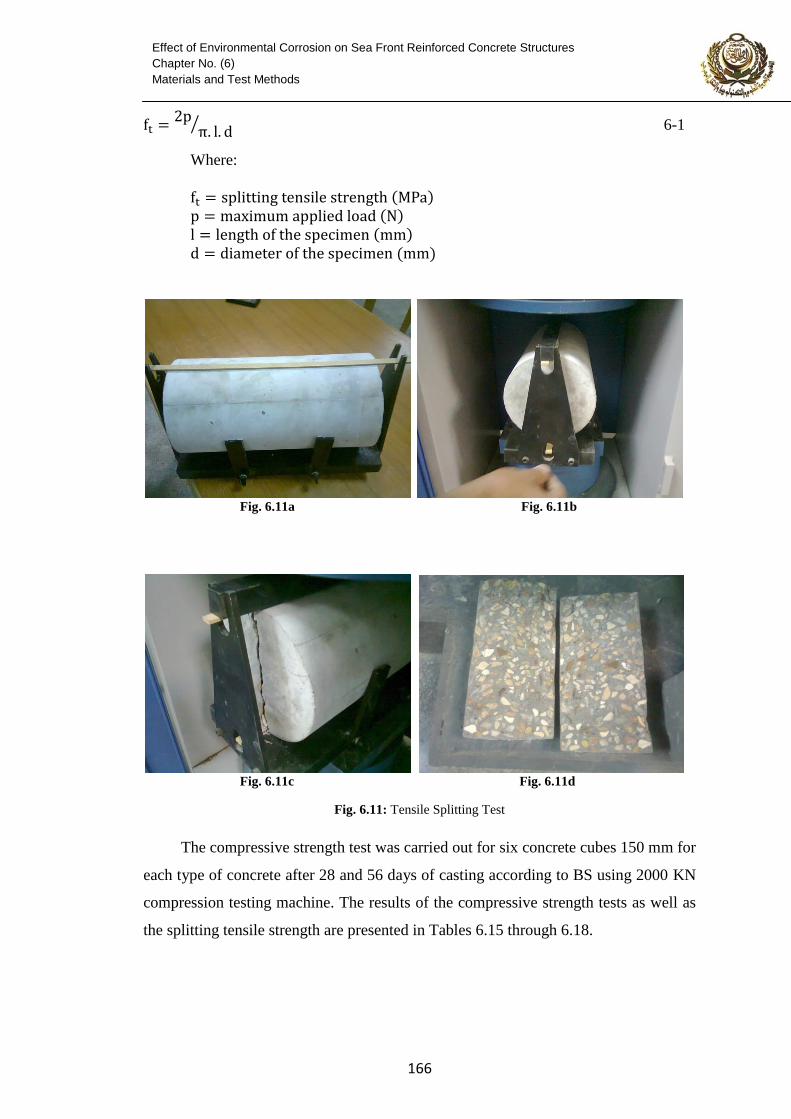
Six concrete cylinders (150 mm diameter and 300 mm height) for each concrete
type were prepared, measured and tested for tensile strengths (after 28 and 56 days of
casting) in accordance with ASTM C496-96 as shown in Figs. 6.11a through 6.11d,
and the splitting tensile strength (ft) was calculated as follows:
166
Effect of Environmental Corrosion on Sea Front Reinforced Concrete Structures
Chapter No. (6)
Materials and Test Methods
6-1
Where:
Fig. 6.11a Fig. 6.11b
Fig. 6.11c Fig. 6.11d
Fig. 6.11: Tensile Splitting Test
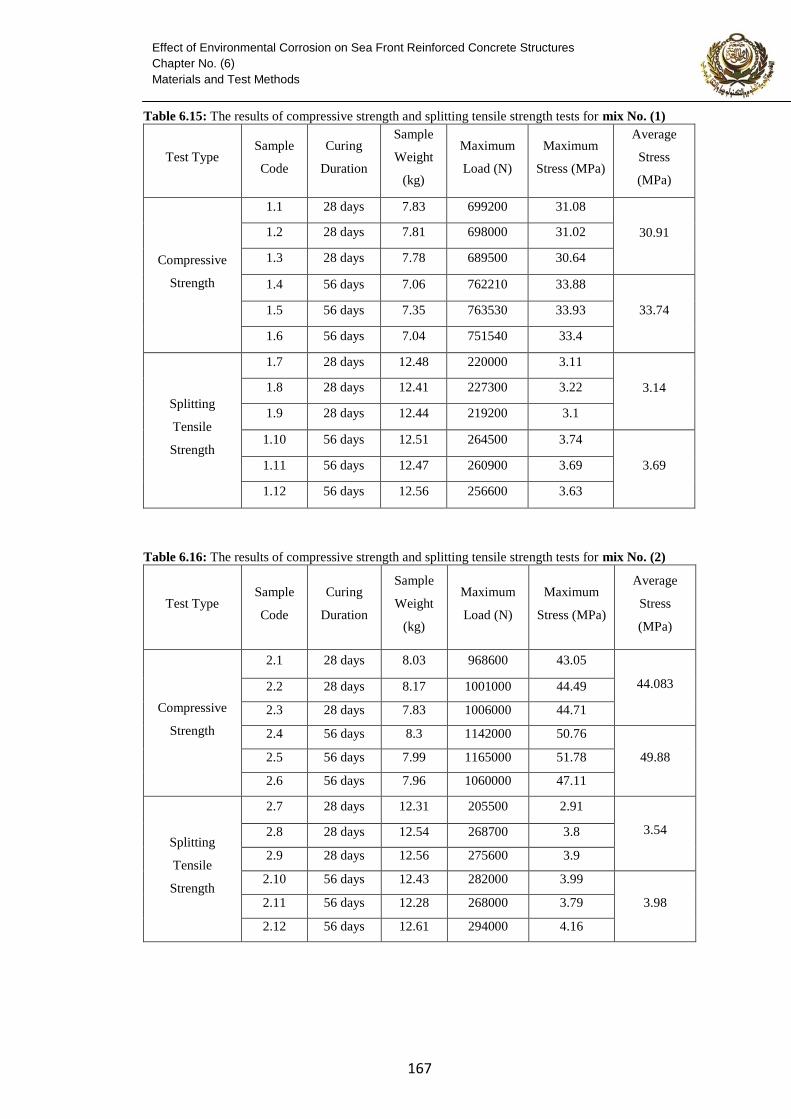
The compressive strength test was carried out for six concrete cubes 150 mm for
each type of concrete after 28 and 56 days of casting according to BS using 2000 KN
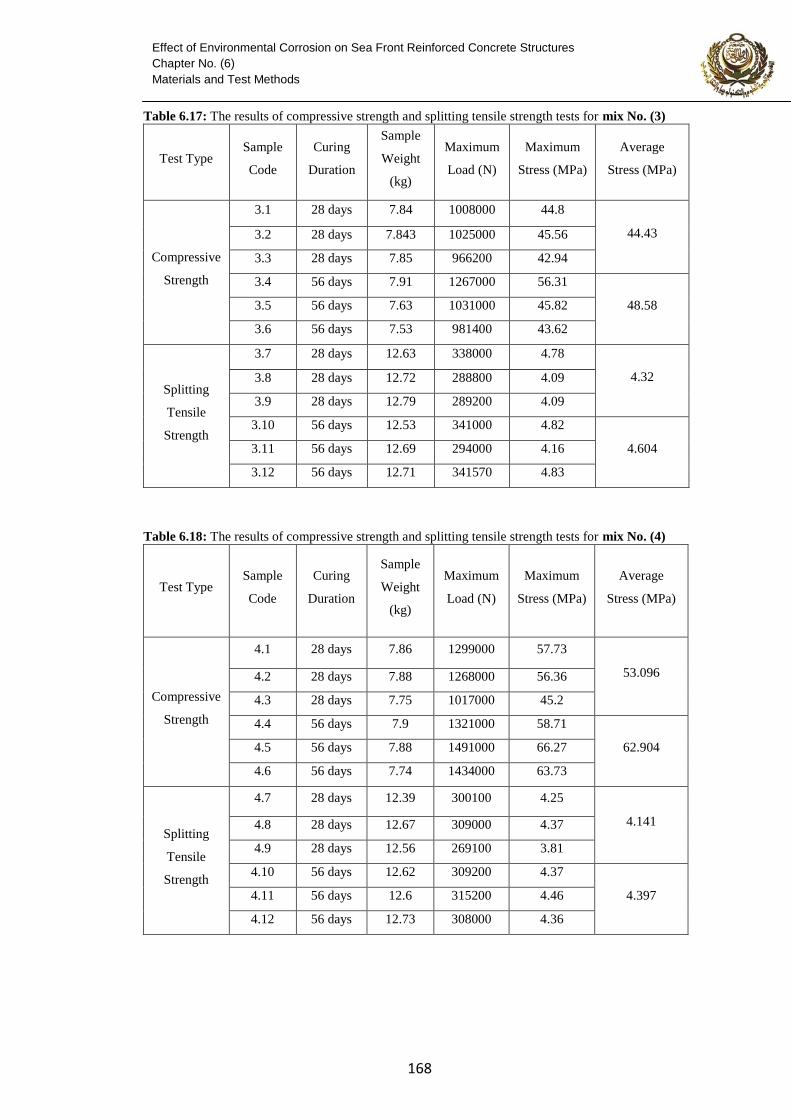
compression testing machine. The results of the compressive strength tests as well as
the splitting tensile strength are presented in Tables 6.15 through 6.18.
167
Effect of Environmental Corrosion on Sea Front Reinforced Concrete Structures
Chapter No. (6)
Materials and Test Methods
Table 6.15: The results of compressive strength and splitting tensile strength tests for mix No. (1)
Test Type Sample
Code
Curing
Duration
Sample
Weight
(kg)
Maximum
Load (N)
Maximum
Stress (MPa)
Average
Stress
(MPa)
Compressive
Strength
1.1 28 days 7.83 699200 31.08
30.91 1.2 28 days 7.81 698000 31.02
1.3 28 days 7.78 689500 30.64
1.4 56 days 7.06 762210 33.88
33.74 1.5 56 days 7.35 763530 33.93
1.6 56 days 7.04 751540 33.4
Splitting
Tensile
Strength
1.7 28 days 12.48 220000 3.11
3.14 1.8 28 days 12.41 227300 3.22
1.9 28 days 12.44 219200 3.1
1.10 56 days 12.51 264500 3.74
3.69 1.11 56 days 12.47 260900 3.69
1.12 56 days 12.56 256600 3.63
Table 6.16: The results of compressive strength and splitting tensile strength tests for mix No. (2)
Test Type Sample
Code
Curing
Duration
Sample
Weight
(kg)
Maximum
Load (N)
Maximum
Stress (MPa)
Average
Stress
(MPa)
Compressive
Strength
2.1 28 days 8.03 968600 43.05
44.083 2.2 28 days 8.17 1001000 44.49
2.3 28 days 7.83 1006000 44.71
2.4 56 days 8.3 1142000 50.76
49.88 2.5 56 days 7.99 1165000 51.78
2.6 56 days 7.96 1060000 47.11
Splitting
Tensile
Strength
2.7 28 days 12.31 205500 2.91
3.54 2.8 28 days 12.54 268700 3.8
2.9 28 days 12.56 275600 3.9
2.10 56 days 12.43 282000 3.99
3.98 2.11 56 days 12.28 268000 3.79
2.12 56 days 12.61 294000 4.16
168
Effect of Environmental Corrosion on Sea Front Reinforced Concrete Structures
Chapter No. (6)
Materials and Test Methods
Table 6.17: The results of compressive strength and splitting tensile strength tests for mix No. (3)
Test Type Sample
Code
Curing
Duration
Sample
Weight
(kg)
Maximum
Load (N)
Maximum
Stress (MPa)
Average
Stress (MPa)
Compressive
Strength
3.1 28 days 7.84 1008000 44.8
44.43 3.2 28 days 7.843 1025000 45.56
3.3 28 days 7.85 966200 42.94
3.4 56 days 7.91 1267000 56.31
48.58 3.5 56 days 7.63 1031000 45.82
3.6 56 days 7.53 981400 43.62
Splitting
Tensile
Strength
3.7 28 days 12.63 338000 4.78
4.32 3.8 28 days 12.72 288800 4.09
3.9 28 days 12.79 289200 4.09
3.10 56 days 12.53 341000 4.82
4.604 3.11 56 days 12.69 294000 4.16
3.12 56 days 12.71 341570 4.83
Table 6.18: The results of compressive strength and splitting tensile strength tests for mix No. (4)
Test Type Sample
Code
Curing
Duration
Sample
Weight
(kg)
Maximum
Load (N)
Maximum
Stress (MPa)
Average
Stress (MPa)
Compressive
Strength
4.1 28 days 7.86 1299000 57.73
53.096 4.2 28 days 7.88 1268000 56.36
4.3 28 days 7.75 1017000 45.2
4.4 56 days 7.9 1321000 58.71
62.904 4.5 56 days 7.88 1491000 66.27
4.6 56 days 7.74 1434000 63.73
Splitting
Tensile
Strength
4.7 28 days 12.39 300100 4.25
4.141 4.8 28 days 12.67 309000 4.37
4.9 28 days 12.56 269100 3.81
4.10 56 days 12.62 309200 4.37
4.397 4.11 56 days 12.6 315200 4.46
4.12 56 days 12.73 308000 4.36
169
Effect of Environmental Corrosion on Sea Front Reinforced Concrete Structures
Chapter No. (6)
Materials and Test Methods
6.5 Specimens preparation
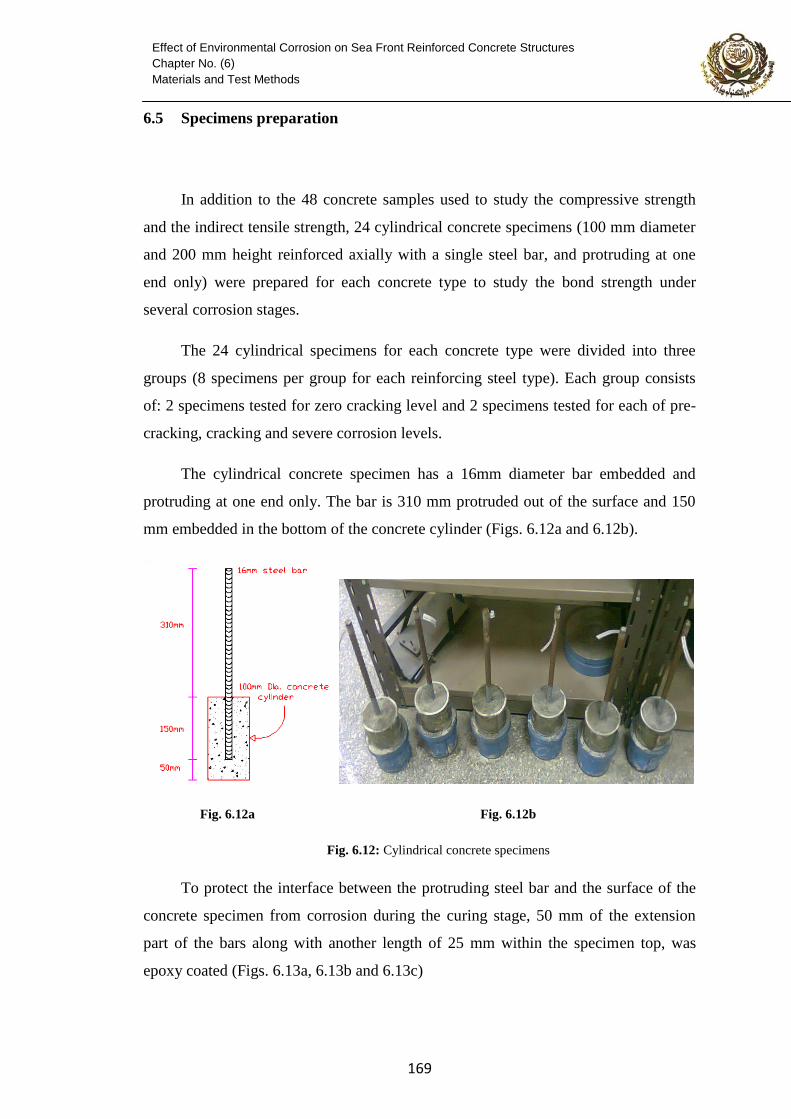
In addition to the 48 concrete samples used to study the compressive strength
and the indirect tensile strength, 24 cylindrical concrete specimens (100 mm diameter
and 200 mm height reinforced axially with a single steel bar, and protruding at one
end only) were prepared for each concrete type to study the bond strength under
several corrosion stages.
The 24 cylindrical specimens for each concrete type were divided into three
groups (8 specimens per group for each reinforcing steel type). Each group consists
of: 2 specimens tested for zero cracking level and 2 specimens tested for each of pre-
cracking, cracking and severe corrosion levels.
The cylindrical concrete specimen has a 16mm diameter bar embedded and
protruding at one end only. The bar is 310 mm protruded out of the surface and 150
mm embedded in the bottom of the concrete cylinder (Figs. 6.12a and 6.12b).
Fig. 6.12a Fig. 6.12b
Fig. 6.12: Cylindrical concrete specimens
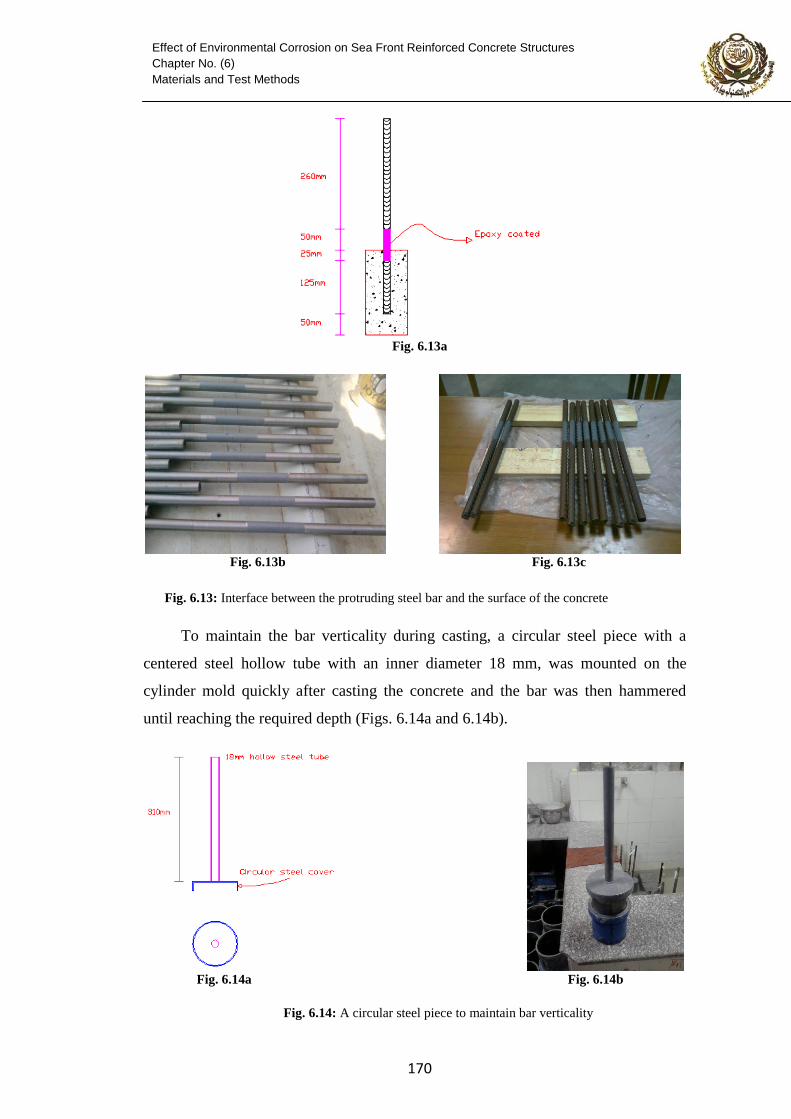
To protect the interface between the protruding steel bar and the surface of the
concrete specimen from corrosion during the curing stage, 50 mm of the extension
part of the bars along with another length of 25 mm within the specimen top, was
epoxy coated (Figs. 6.13a, 6.13b and 6.13c)
170
Effect of Environmental Corrosion on Sea Front Reinforced Concrete Structures
Chapter No. (6)
Materials and Test Methods
Fig. 6.13a
Fig. 6.13b Fig. 6.13c
Fig. 6.13: Interface between the protruding steel bar and the surface of the concrete
To maintain the bar verticality during casting, a circular steel piece with a
centered steel hollow tube with an inner diameter 18 mm, was mounted on the
cylinder mold quickly after casting the concrete and the bar was then hammered
until reaching the required depth (Figs. 6.14a and 6.14b).
Fig. 6.14a Fig. 6.14b
Fig. 6.14: A circular steel piece to maintain bar verticality
171
Effect of Environmental Corrosion on Sea Front Reinforced Concrete Structures
Chapter No. (6)
Materials and Test Methods
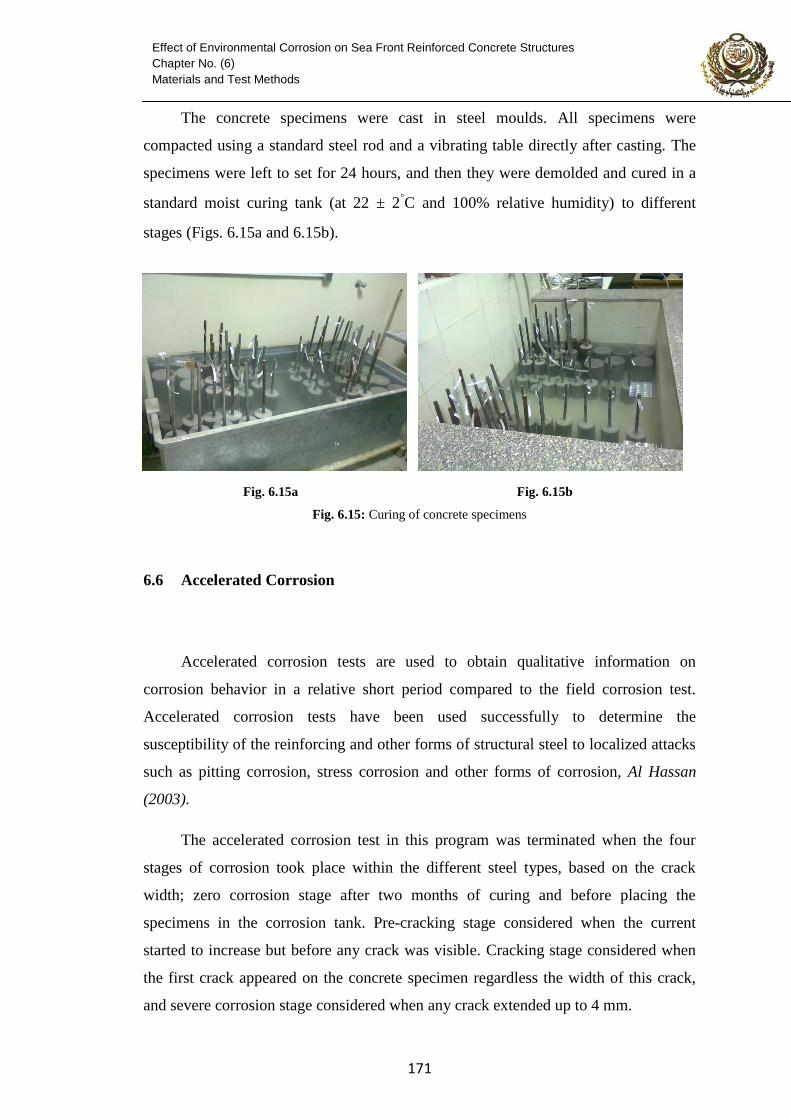
The concrete specimens were cast in steel moulds. All specimens were
compacted using a standard steel rod and a vibrating table directly after casting. The
specimens were left to set for 24 hours, and then they were demolded and cured in a
standard moist curing tank (at 22 ± 2◦C and 100% relative humidity) to different
stages (Figs. 6.15a and 6.15b).
Fig. 6.15a Fig. 6.15b
Fig. 6.15: Curing of concrete specimens
6.6 Accelerated Corrosion
Accelerated corrosion tests are used to obtain qualitative information on
corrosion behavior in a relative short period compared to the field corrosion test.
Accelerated corrosion tests have been used successfully to determine the
susceptibility of the reinforcing and other forms of structural steel to localized attacks
such as pitting corrosion, stress corrosion and other forms of corrosion, Al Hassan
(2003).
The accelerated corrosion test in this program was terminated when the four
stages of corrosion took place within the different steel types, based on the crack
width; zero corrosion stage after two months of curing and before placing the
specimens in the corrosion tank. Pre-cracking stage considered when the current
started to increase but before any crack was visible. Cracking stage considered when
the first crack appeared on the concrete specimen regardless the width of this crack,
and severe corrosion stage considered when any crack extended up to 4 mm.
172
Effect of Environmental Corrosion on Sea Front Reinforced Concrete Structures
Chapter No. (6)
Materials and Test Methods
6.6.1 Test set up
After the 96 pullout specimens were cast and cured, 72 specimens were
subjected to accelerated corrosion by placing them in the accelerated corrosion tank,
while the rest of the 24 specimens (2 specimens per steel type per concrete type)
served as the control specimens (zero corrosion stage).
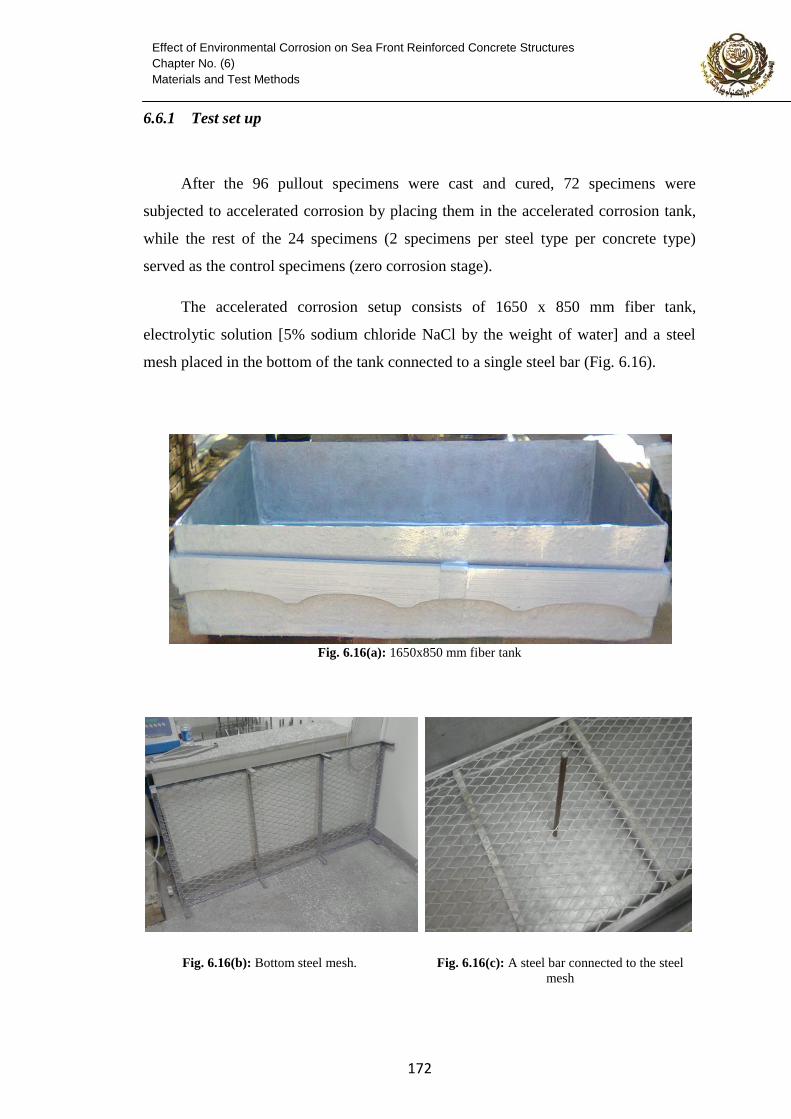
The accelerated corrosion setup consists of 1650 x 850 mm fiber tank,
electrolytic solution [5% sodium chloride NaCl by the weight of water] and a steel
mesh placed in the bottom of the tank connected to a single steel bar (Fig. 6.16).
Fig. 6.16(a): 1650x850 mm fiber tank
Fig. 6.16(b): Bottom steel mesh. Fig. 6.16(c): A steel bar connected to the steel
mesh
173
Effect of Environmental Corrosion on Sea Front Reinforced Concrete Structures
Chapter No. (6)
Materials and Test Methods
The specimens were placed in the accelerated corrosion tank and partially
immersed with the electrolytic solution up to two thirds of its height. To eliminate any
change in the concentration of the NaCl and ph of the solution, the electrolyte solution
was changed weekly.
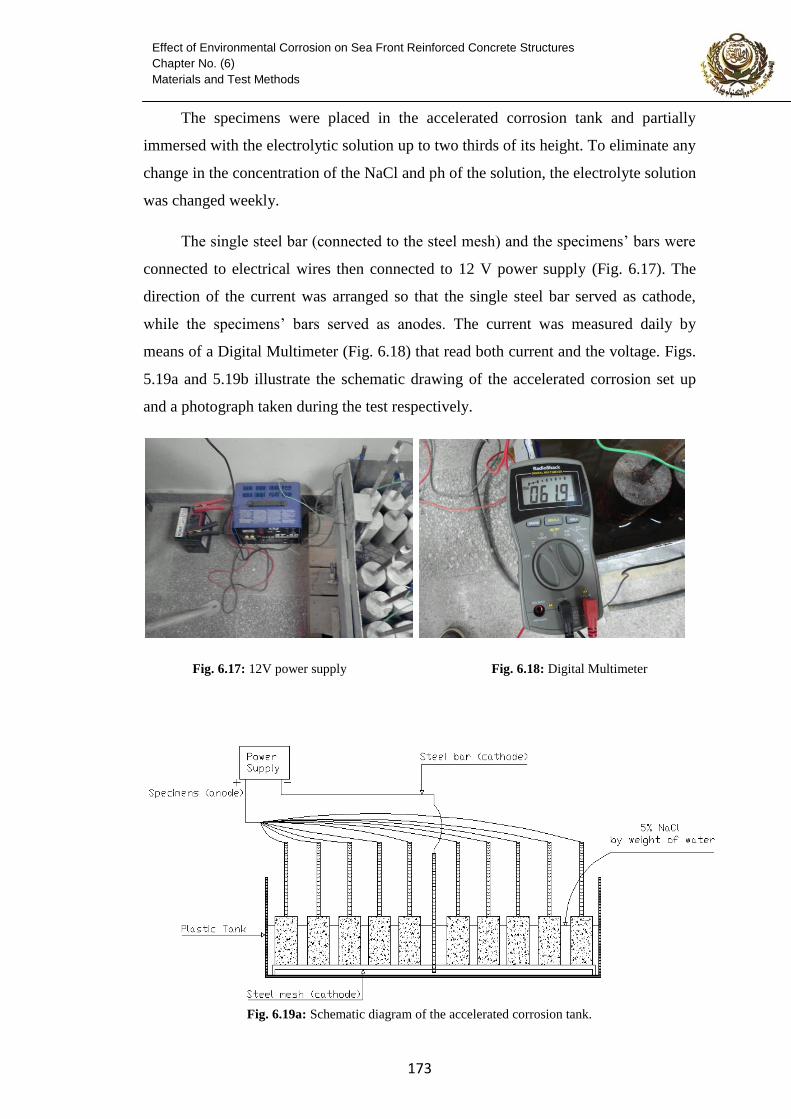
The single steel bar (connected to the steel mesh) and the specimens’ bars were
connected to electrical wires then connected to 12 V power supply (Fig. 6.17). The
direction of the current was arranged so that the single steel bar served as cathode,
while the specimens’ bars served as anodes. The current was measured daily by
means of a Digital Multimeter (Fig. 6.18) that read both current and the voltage. Figs.
5.19a and 5.19b illustrate the schematic drawing of the accelerated corrosion set up
and a photograph taken during the test respectively.
Fig. 6.17: 12V power supply Fig. 6.18: Digital Multimeter
Fig. 6.19a: Schematic diagram of the accelerated corrosion tank.
174
Effect of Environmental Corrosion on Sea Front Reinforced Concrete Structures
Chapter No. (6)
Materials and Test Methods
Fig. 6.19b: The accelerated corrosion tank during testing
6.7 Pull out test
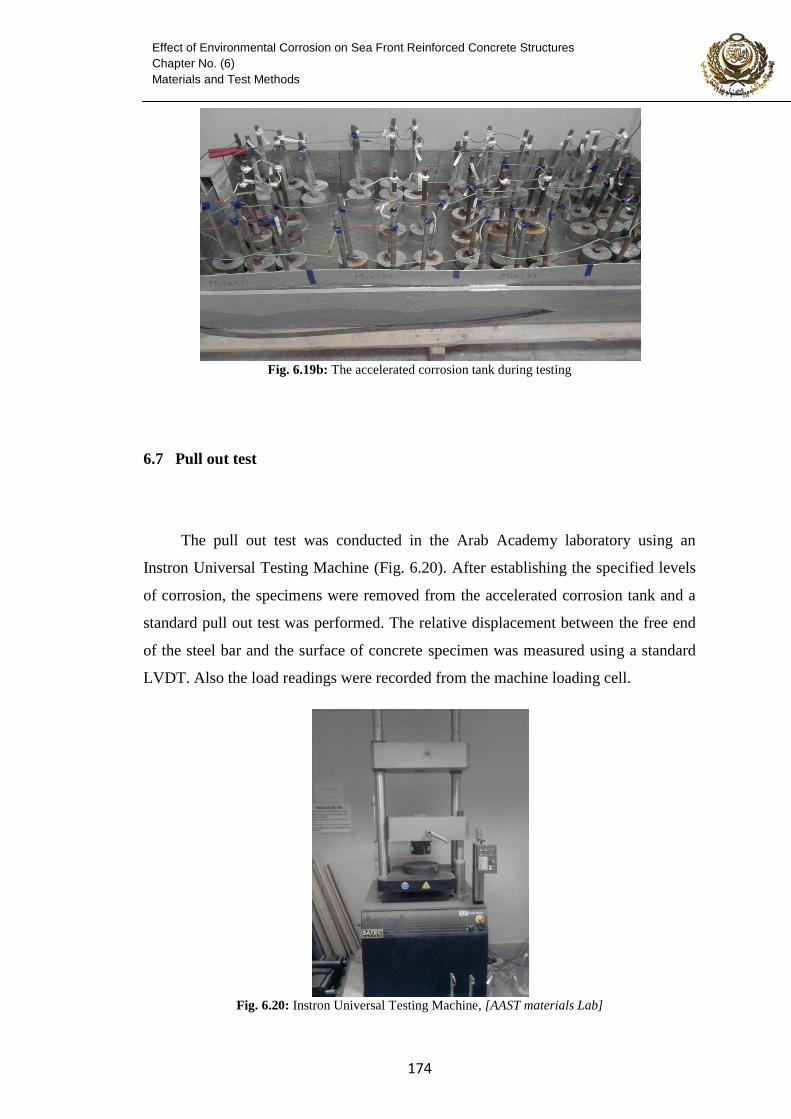
The pull out test was conducted in the Arab Academy laboratory using an
Instron Universal Testing Machine (Fig. 6.20). After establishing the specified levels
of corrosion, the specimens were removed from the accelerated corrosion tank and a
standard pull out test was performed. The relative displacement between the free end
of the steel bar and the surface of concrete specimen was measured using a standard
LVDT. Also the load readings were recorded from the machine loading cell.
Fig. 6.20: Instron Universal Testing Machine, [AAST materials Lab]
175
Effect of Environmental Corrosion on Sea Front Reinforced Concrete Structures
Chapter No. (6)
Materials and Test Methods
6.8 Percentage of mass loss
After the completion of the pull out test, the specimens were broken and then
the reinforcing bar for each specimen was cleaned and scrubbed with a stiff brush to
ensure that the bar was free from any adhering corrosion products. The mass loss of
the steel reinforcing bar was then obtained as the difference between the mass of the
corroded bar (after the removal of the loose corrosion products) and its mass before
corrosion, Amleh (2000).
6.9 Bar profile loss
The degradation in the rib profile was determined by measuring the rib height
before applying the impressed current and after the corrosion takes place in the steel
bar. The percentage of rib loss was determined as follows:
671
Effect of Environmental Corrosion on Sea Front Reinforced Concrete Structures
Chapter No. (7)
Test Results and Discussion for Accelerated Corrosion Specimens
TEST RESULTS AND DISCUSSION FOR ACCELERATED
CORROSION SPECIMENS
7.1 Introduction
The test results presented in this chapter are divided into four groups. The first
group uses the current measurements to study the effect of different concrete types
and the different steel types on steel passivation and corrosion initiation. The second
group uses the pullout test to study the bond strength for different steel-concrete
types. The third group shows the effect of corrosion on the mechanical properties of
steel including tensile strength and ductility. The fourth group shows the corrosion
effect on the physical properties of steel including its mass and rib profile.
7.2 Current Measurement Results
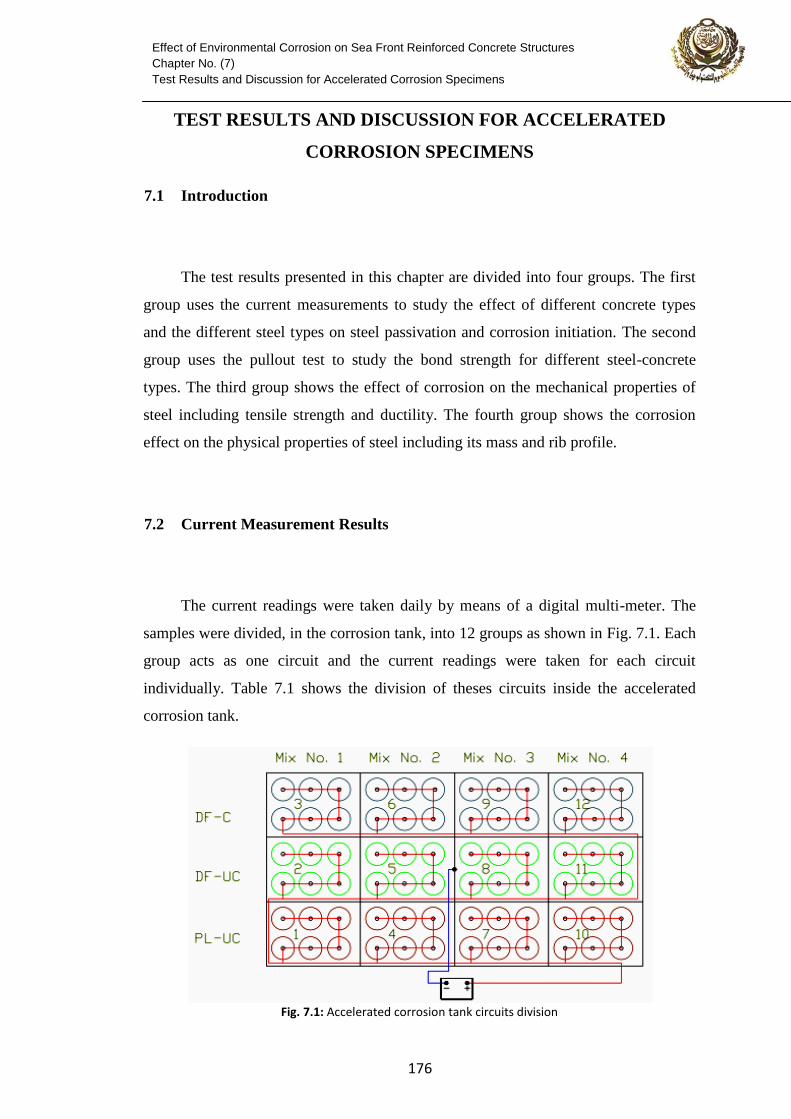
The current readings were taken daily by means of a digital multi-meter. The
samples were divided, in the corrosion tank, into 12 groups as shown in Fig. 7.1. Each
group acts as one circuit and the current readings were taken for each circuit
individually. Table 7.1 shows the division of theses circuits inside the accelerated
corrosion tank.
Fig. 7.1: Accelerated corrosion tank circuits division
677
Effect of Environmental Corrosion on Sea Front Reinforced Concrete Structures
Chapter No. (7)
Test Results and Discussion for Accelerated Corrosion Specimens
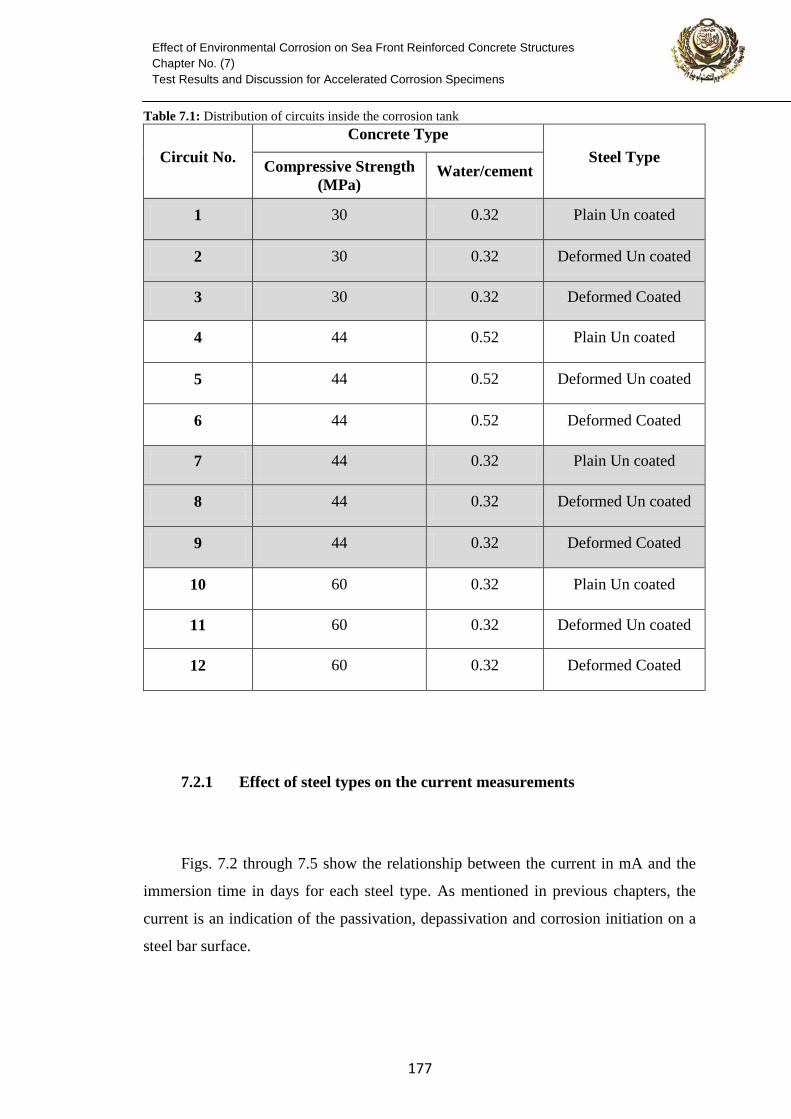
Table 7.1: Distribution of circuits inside the corrosion tank
Circuit No.
Concrete Type
Steel Type Compressive Strength
(MPa) Water/cement
1 30 0.32 Plain Un coated
2 30 0.32 Deformed Un coated
3 30 0.32 Deformed Coated
4 44 0.52 Plain Un coated
5 44 0.52 Deformed Un coated
6 44 0.52 Deformed Coated
7 44 0.32 Plain Un coated
8 44 0.32 Deformed Un coated
9 44 0.32 Deformed Coated
10 60 0.32 Plain Un coated
11 60 0.32 Deformed Un coated
12 60 0.32 Deformed Coated
7.2.1 Effect of steel types on the current measurements
Figs. 7.2 through 7.5 show the relationship between the current in mA and the
immersion time in days for each steel type. As mentioned in previous chapters, the
current is an indication of the passivation, depassivation and corrosion initiation on a
steel bar surface.
671
Effect of Environmental Corrosion on Sea Front Reinforced Concrete Structures
Chapter No. (7)
Test Results and Discussion for Accelerated Corrosion Specimens
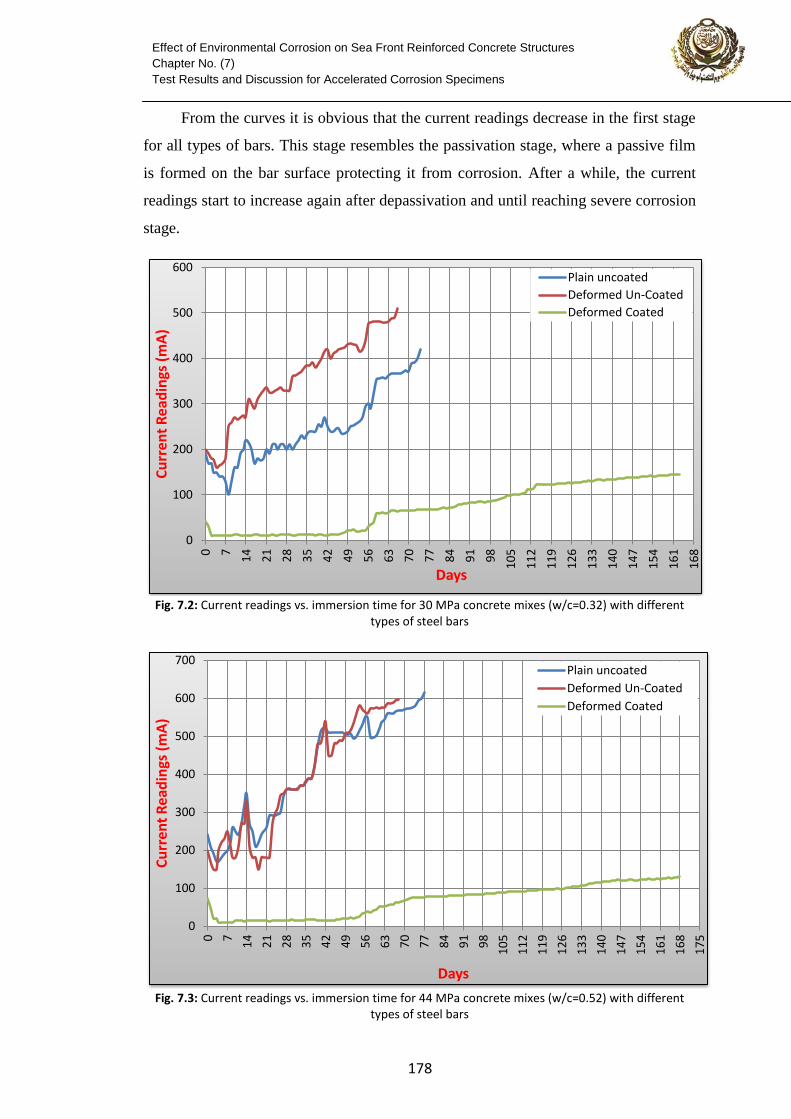
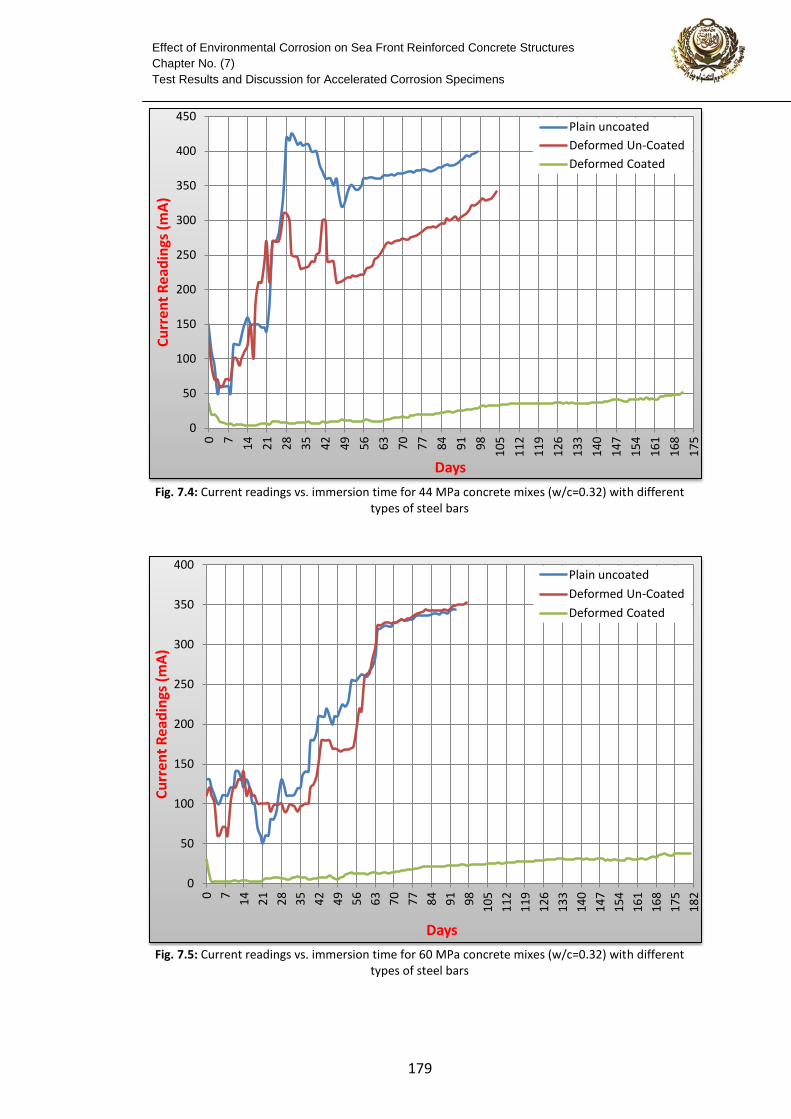
From the curves it is obvious that the current readings decrease in the first stage
for all types of bars. This stage resembles the passivation stage, where a passive film
is formed on the bar surface protecting it from corrosion. After a while, the current
readings start to increase again after depassivation and until reaching severe corrosion
stage.
Fig. 7.2: Current readings vs. immersion time for 30 MPa concrete mixes (w/c=0.32) with different
types of steel bars
Fig. 7.3: Current readings vs. immersion time for 44 MPa concrete mixes (w/c=0.52) with different
types of steel bars
0
100
200
300
400
500
600
0
7
14
21
28
35
42
49
56
63
70
77
84
91
98
10
5
11
2
11
9
12
6
13
3
14
0
14
7
15
4
16
1
16
8
Cu
rren
t R
ead
ings
(m
A)
Days
Plain uncoated
Deformed Un-Coated
Deformed Coated
0
100
200
300
400
500
600
700
0
7
14
21
28
35
42
49
56
63
70
77
84
91
98
10
5
11
2
11
9
12
6
13
3
14
0
14
7
15
4
16
1
16
8
17
5
Cu
rren
t R
ead
ings
(m
A)
Days
Plain uncoated
Deformed Un-Coated
Deformed Coated
671
Effect of Environmental Corrosion on Sea Front Reinforced Concrete Structures
Chapter No. (7)
Test Results and Discussion for Accelerated Corrosion Specimens
Fig. 7.4: Current readings vs. immersion time for 44 MPa concrete mixes (w/c=0.32) with different
types of steel bars
Fig. 7.5: Current readings vs. immersion time for 60 MPa concrete mixes (w/c=0.32) with different
types of steel bars
0
50
100
150
200
250
300
350
400
450
0
7
14
21
28
35
42
49
56
63
70
77
84
91
98
10
5
11
2
11
9
12
6
13
3
14
0
14
7
15
4
16
1
16
8
17
5
Cu
rren
t R
ead
ings
(m
A)
Days
Plain uncoated
Deformed Un-Coated
Deformed Coated
0
50
100
150
200
250
300
350
400
0
7
14
21
28
35
42
49
56
63
70
77
84
91
98
10
5
11
2
11
9
12
6
13
3
14
0
14
7
15
4
16
1
16
8
17
5
18
2
Cu
rren
t R
ead
ings
(m
A)
Days
Plain uncoated
Deformed Un-Coated
Deformed Coated
611
Effect of Environmental Corrosion on Sea Front Reinforced Concrete Structures
Chapter No. (7)
Test Results and Discussion for Accelerated Corrosion Specimens
The current passing through the deformed uncoated bars and the plain bars
started with a low level at an early age then rapidly increased after a certain time
according to the type of the steel and the concrete mix. This rapid increase is due to
the cracking of the concrete cover which left the steel without protection and in direct
contact with the electrolytic solution. In other words, the rate of corrosion of the steel
bars was very slow at first, until depassivation of the steel occurred when corrosion
started, and then the rate of corrosion increased significantly.
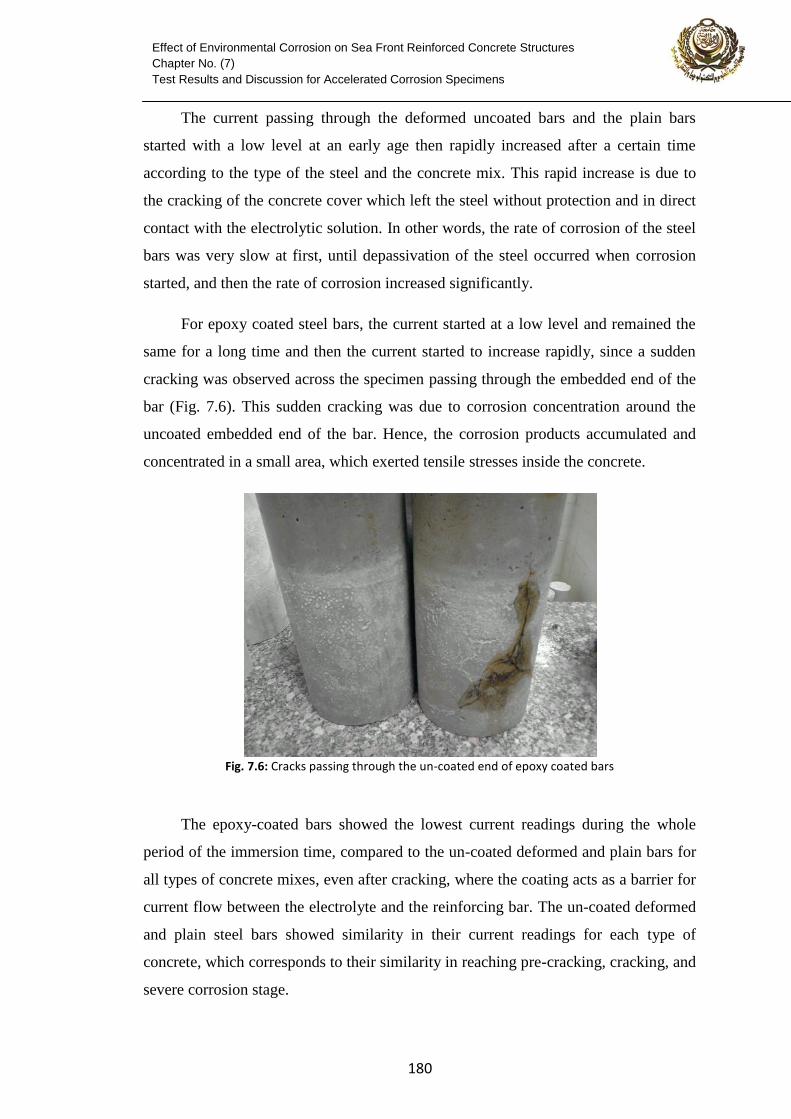
For epoxy coated steel bars, the current started at a low level and remained the
same for a long time and then the current started to increase rapidly, since a sudden
cracking was observed across the specimen passing through the embedded end of the
bar (Fig. 7.6). This sudden cracking was due to corrosion concentration around the
uncoated embedded end of the bar. Hence, the corrosion products accumulated and
concentrated in a small area, which exerted tensile stresses inside the concrete.
Fig. 7.6: Cracks passing through the un-coated end of epoxy coated bars
The epoxy-coated bars showed the lowest current readings during the whole
period of the immersion time, compared to the un-coated deformed and plain bars for
all types of concrete mixes, even after cracking, where the coating acts as a barrier for
current flow between the electrolyte and the reinforcing bar. The un-coated deformed
and plain steel bars showed similarity in their current readings for each type of
concrete, which corresponds to their similarity in reaching pre-cracking, cracking, and
severe corrosion stage.
616
Effect of Environmental Corrosion on Sea Front Reinforced Concrete Structures
Chapter No. (7)
Test Results and Discussion for Accelerated Corrosion Specimens
According to what was mentioned before that the current reading increases as
the crack width increases, the relationship plotted must be directly proportional.
However, some drops had appeared in the plotted curves during the test. This can be
attributed to one of these reasons:
1- The concentration of the electrolyte in the accelerated corrosion tank
decreased with time as the corrosion reactions continued between the
cathode and anode. The current started to return to its normal values as the
electrolyte was changed by the end of each weak.
2- The corrosion products formed a layer around the bar which acted as a
barrier to the current flow. As the reactions continued, these products
propagated away from the bar surface and the current started to increase
again.
7.2.2 Effect of concrete types on the current measurements
Figs. 7.7 through 7.9 show the relationship between the current readings in mA
and the immersion time in days for different concrete types for each type of steel bars.
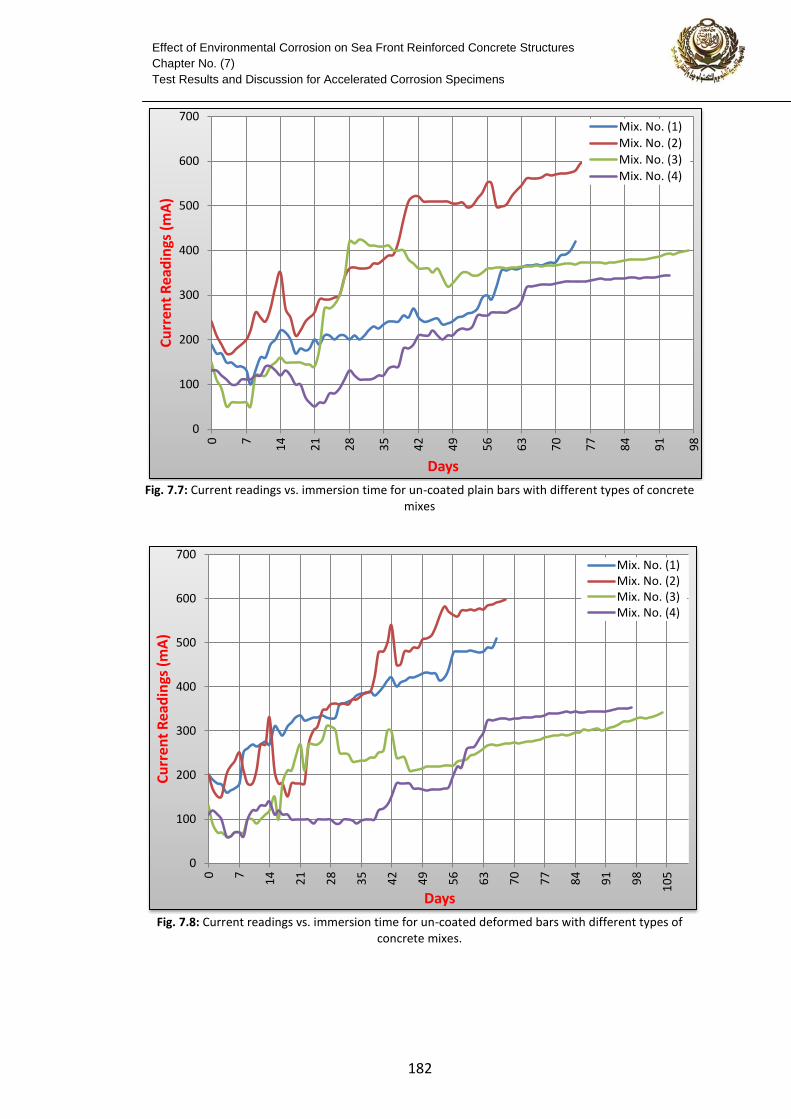
As expected, the [44MPa, 0.52 w/c mix] demonstrated the highest current
values in the beginning of the test, approximately 240 mA with plain bars, 200 mA
with deformed uncoated bars, and 72 mA with the epoxy coated bars, followed by the
[30MPa, 0.32 w/c mix], approximately 190 mA with plain bars, 200 mA with
deformed uncoated bars, and 34 mA with the epoxy coated bars. The [44MPa, 0.32
w/c mix] demonstrated lower initial current reading, approximately 150 mA with
plain bars, 130 mA with deformed uncoated bars, and 35 mA with the epoxy coated
bars. The [60MPa, 0.32 w/c mix] showed the lowest initial current reading,
approximately 130 mA with plain bars, 110 mA with deformed uncoated bars, and 30
mA with the epoxy coated bars.
611
Effect of Environmental Corrosion on Sea Front Reinforced Concrete Structures
Chapter No. (7)
Test Results and Discussion for Accelerated Corrosion Specimens
Fig. 7.7: Current readings vs. immersion time for un-coated plain bars with different types of concrete
mixes
Fig. 7.8: Current readings vs. immersion time for un-coated deformed bars with different types of
concrete mixes.
0
100
200
300
400
500
600
700
0
7
14
21
28
35
42
49
56
63
70
77
84
91
98
Cu
rren
t R
ead
ings
(m
A)
Days
Mix. No. (1) Mix. No. (2) Mix. No. (3) Mix. No. (4)
0
100
200
300
400
500
600
700
0
7
14
21
28
35
42
49
56
63
70
77
84
91
98
10
5
Cu
rren
t R
ead
ings
(m
A)
Days
Mix. No. (1) Mix. No. (2) Mix. No. (3) Mix. No. (4)
611
Effect of Environmental Corrosion on Sea Front Reinforced Concrete Structures
Chapter No. (7)
Test Results and Discussion for Accelerated Corrosion Specimens
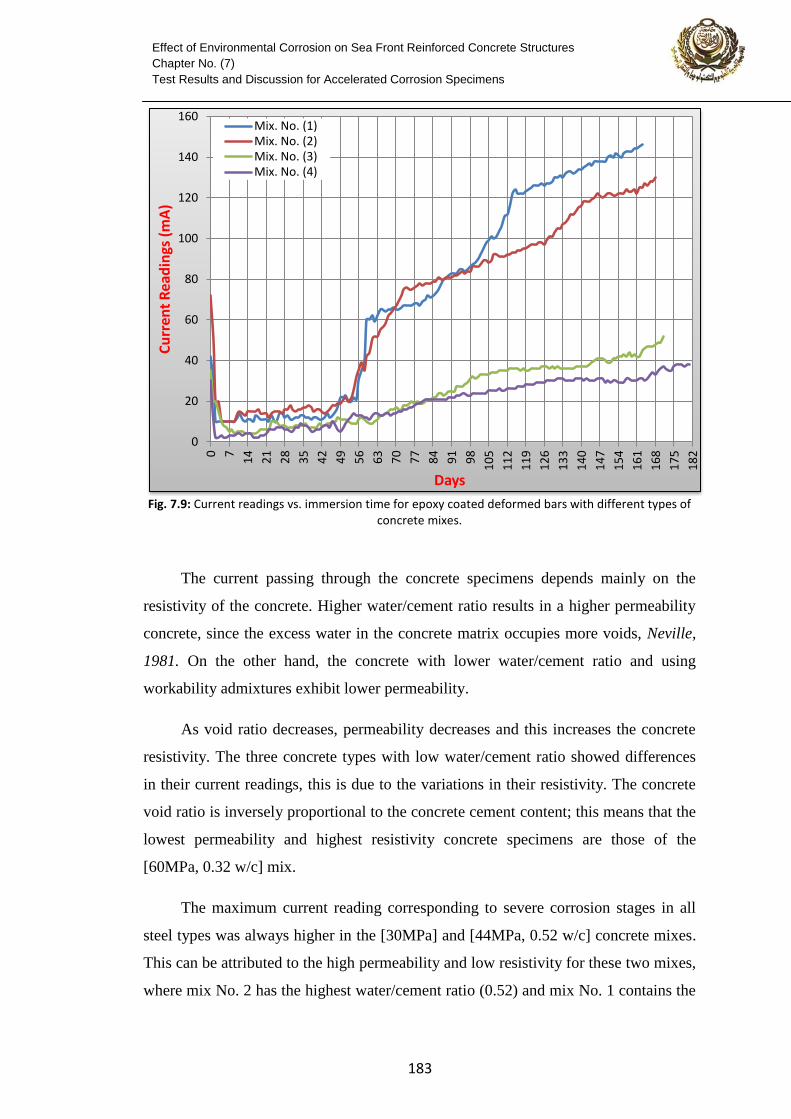
Fig. 7.9: Current readings vs. immersion time for epoxy coated deformed bars with different types of
concrete mixes.
The current passing through the concrete specimens depends mainly on the
resistivity of the concrete. Higher water/cement ratio results in a higher permeability
concrete, since the excess water in the concrete matrix occupies more voids, Neville,
1981. On the other hand, the concrete with lower water/cement ratio and using
workability admixtures exhibit lower permeability.
As void ratio decreases, permeability decreases and this increases the concrete
resistivity. The three concrete types with low water/cement ratio showed differences
in their current readings, this is due to the variations in their resistivity. The concrete
void ratio is inversely proportional to the concrete cement content; this means that the
lowest permeability and highest resistivity concrete specimens are those of the
[60MPa, 0.32 w/c] mix.
The maximum current reading corresponding to severe corrosion stages in all
steel types was always higher in the [30MPa] and [44MPa, 0.52 w/c] concrete mixes.
This can be attributed to the high permeability and low resistivity for these two mixes,
where mix No. 2 has the highest water/cement ratio (0.52) and mix No. 1 contains the
0
20
40
60
80
100
120
140
160
0
7
14
21
28
35
42
49
56
63
70
77
84
91
98
10
5
11
2
11
9
12
6
13
3
14
0
14
7
15
4
16
1
16
8
17
5
18
2
Cu
rren
t R
ead
ings
(m
A)
Days
Mix. No. (1) Mix. No. (2) Mix. No. (3) Mix. No. (4)
611
Effect of Environmental Corrosion on Sea Front Reinforced Concrete Structures
Chapter No. (7)
Test Results and Discussion for Accelerated Corrosion Specimens
lowest cement content (350 kg/m3). The [44MPa, 0.52 w/c] mix showed higher
current readings for both un-coated deformed and plain steel bars, however, the
[30MPa] was the highest for epoxy coated deformed bars. This can be attributed to the
lower strength of mix No. 1 (30MPa) which couldn’t withstand the high tensile
stresses caused by the corrosion products concentrations at the un-coated end of the
epoxy coated bars. However, in case of un-coated plain and deformed bars, the
corrosion was mainly uniform that caused uniform stresses along the steel bar.
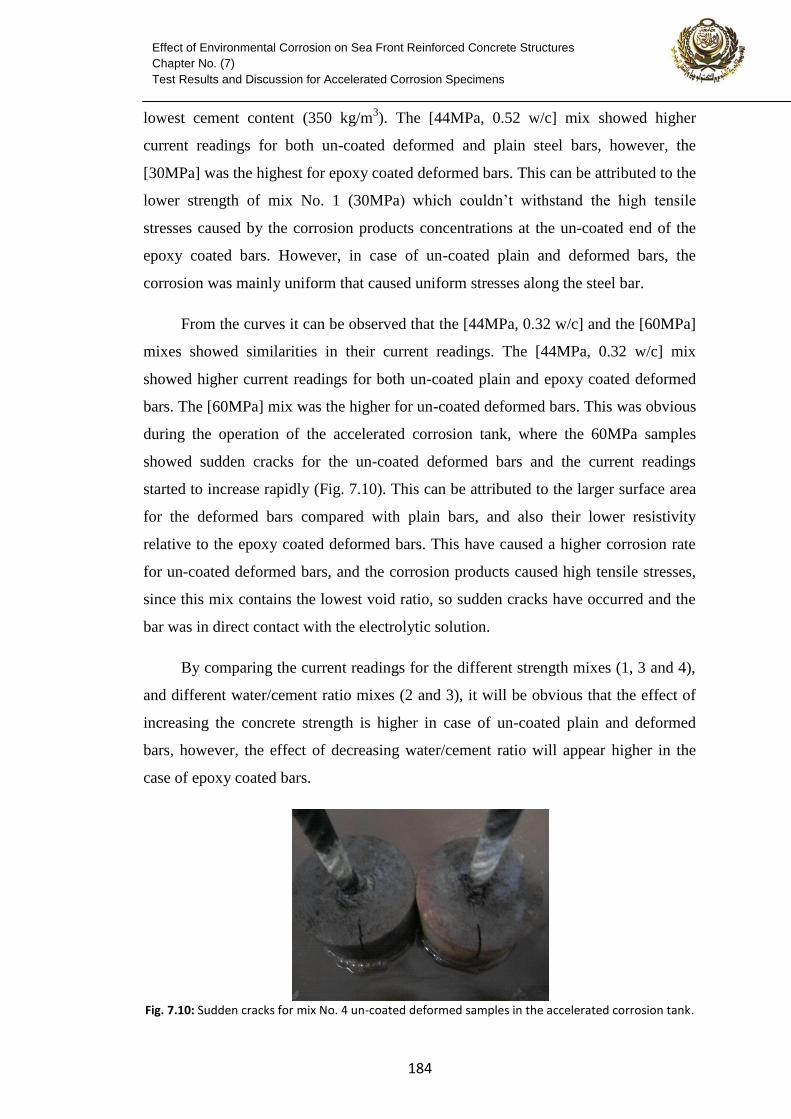
From the curves it can be observed that the [44MPa, 0.32 w/c] and the [60MPa]
mixes showed similarities in their current readings. The [44MPa, 0.32 w/c] mix
showed higher current readings for both un-coated plain and epoxy coated deformed
bars. The [60MPa] mix was the higher for un-coated deformed bars. This was obvious
during the operation of the accelerated corrosion tank, where the 60MPa samples
showed sudden cracks for the un-coated deformed bars and the current readings
started to increase rapidly (Fig. 7.10). This can be attributed to the larger surface area
for the deformed bars compared with plain bars, and also their lower resistivity
relative to the epoxy coated deformed bars. This have caused a higher corrosion rate
for un-coated deformed bars, and the corrosion products caused high tensile stresses,
since this mix contains the lowest void ratio, so sudden cracks have occurred and the
bar was in direct contact with the electrolytic solution.
By comparing the current readings for the different strength mixes (1, 3 and 4),
and different water/cement ratio mixes (2 and 3), it will be obvious that the effect of
increasing the concrete strength is higher in case of un-coated plain and deformed
bars, however, the effect of decreasing water/cement ratio will appear higher in the
case of epoxy coated bars.
Fig. 7.10: Sudden cracks for mix No. 4 un-coated deformed samples in the accelerated corrosion tank.
611
Effect of Environmental Corrosion on Sea Front Reinforced Concrete Structures
Chapter No. (7)
Test Results and Discussion for Accelerated Corrosion Specimens
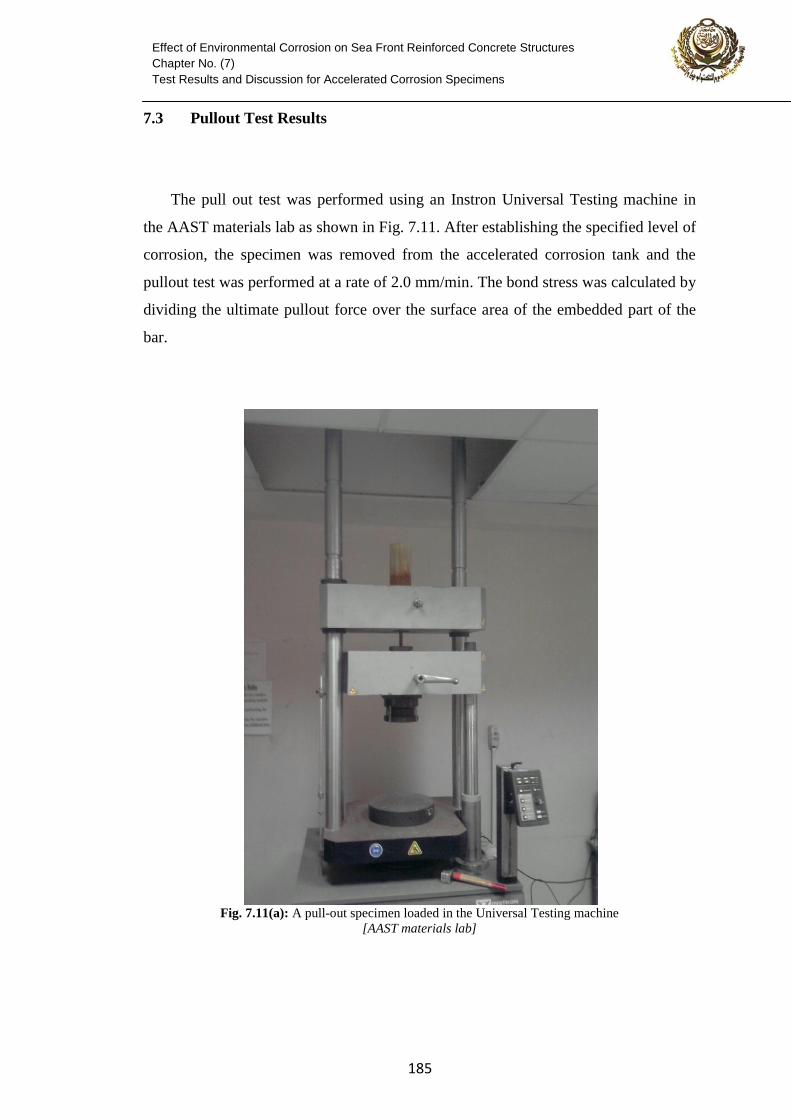
7.3 Pullout Test Results
The pull out test was performed using an Instron Universal Testing machine in
the AAST materials lab as shown in Fig. 7.11. After establishing the specified level of
corrosion, the specimen was removed from the accelerated corrosion tank and the
pullout test was performed at a rate of 2.0 mm/min. The bond stress was calculated by
dividing the ultimate pullout force over the surface area of the embedded part of the
bar.
Fig. 7.11(a): A pull-out specimen loaded in the Universal Testing machine
[AAST materials lab]
611
Effect of Environmental Corrosion on Sea Front Reinforced Concrete Structures
Chapter No. (7)
Test Results and Discussion for Accelerated Corrosion Specimens
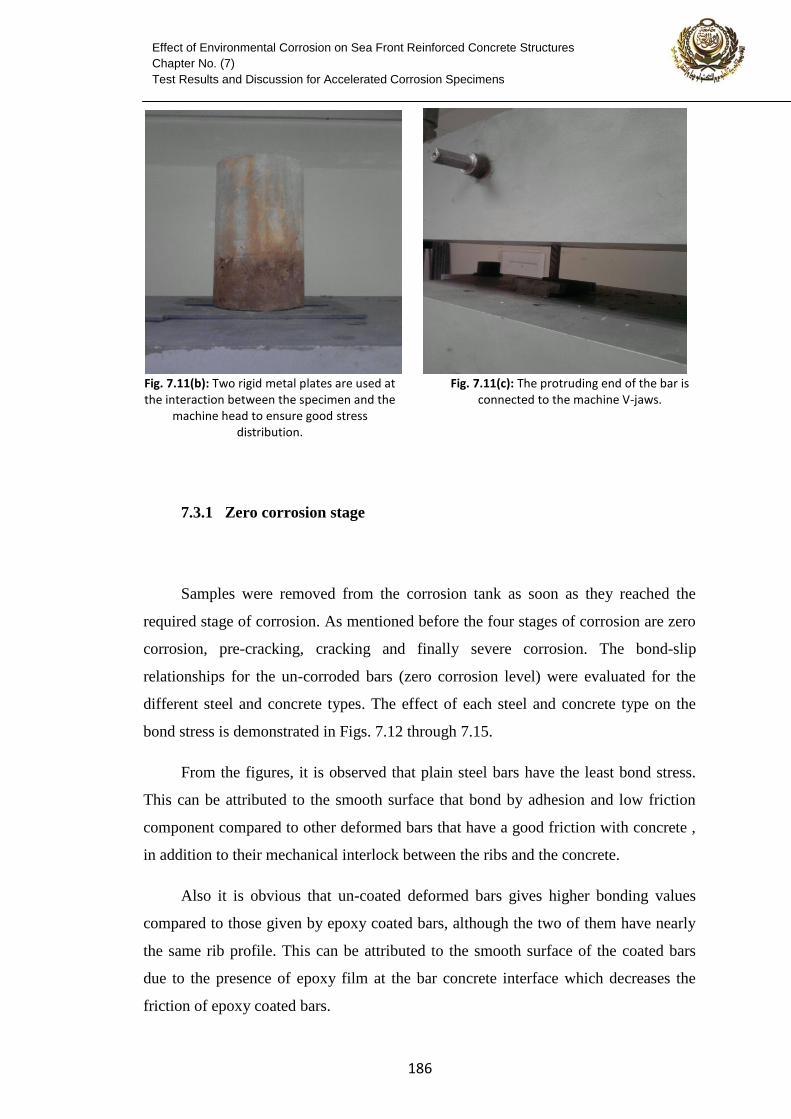
Fig. 7.11(b): Two rigid metal plates are used at the interaction between the specimen and the
machine head to ensure good stress distribution.
Fig. 7.11(c): The protruding end of the bar is connected to the machine V-jaws.
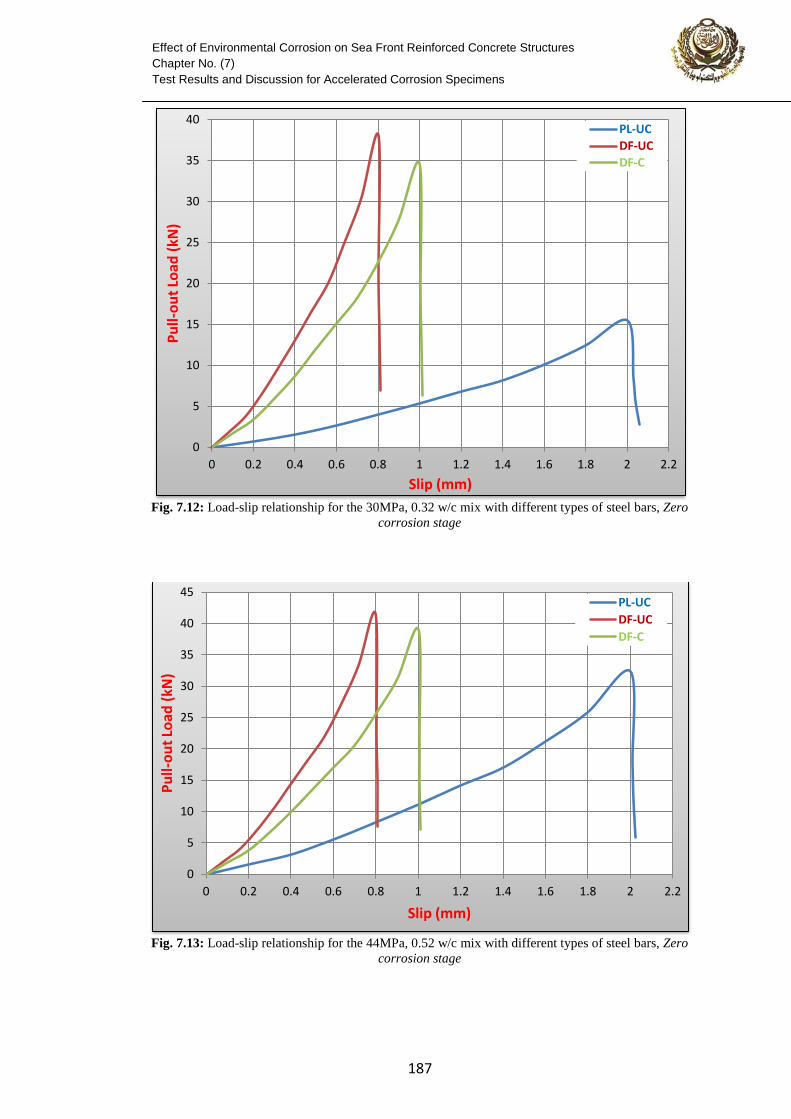
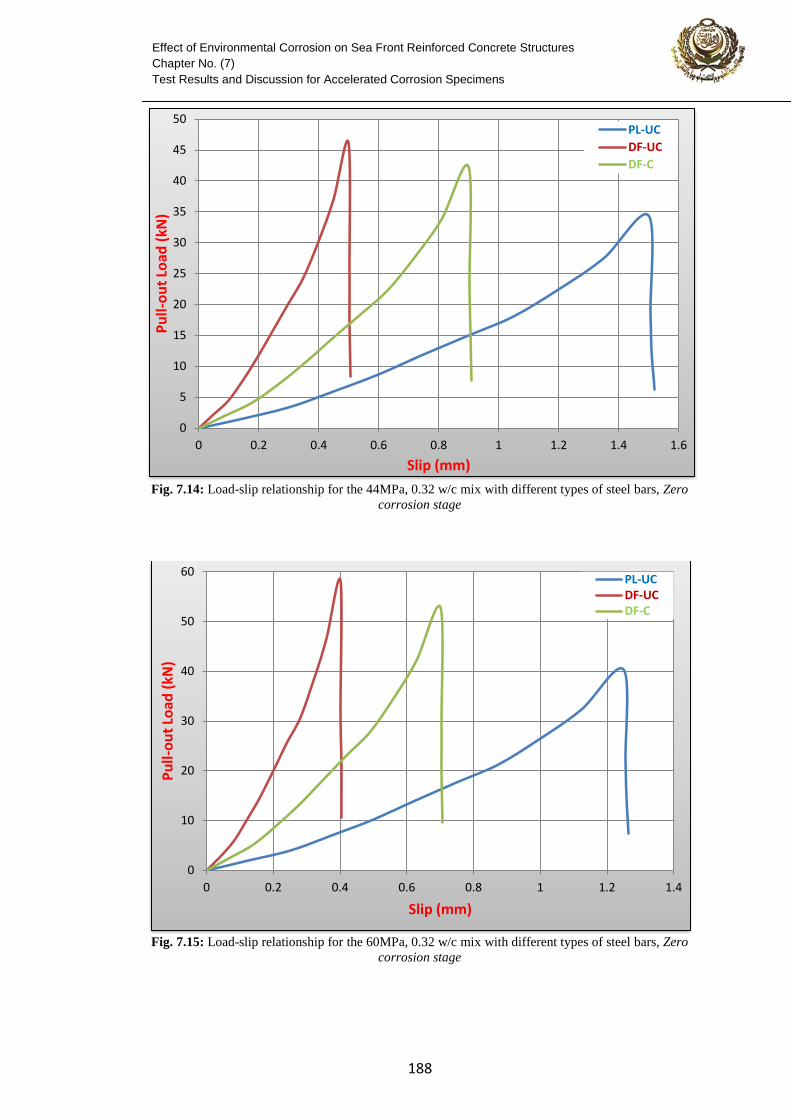
7.3.1 Zero corrosion stage
Samples were removed from the corrosion tank as soon as they reached the
required stage of corrosion. As mentioned before the four stages of corrosion are zero
corrosion, pre-cracking, cracking and finally severe corrosion. The bond-slip
relationships for the un-corroded bars (zero corrosion level) were evaluated for the
different steel and concrete types. The effect of each steel and concrete type on the
bond stress is demonstrated in Figs. 7.12 through 7.15.
From the figures, it is observed that plain steel bars have the least bond stress.
This can be attributed to the smooth surface that bond by adhesion and low friction
component compared to other deformed bars that have a good friction with concrete ,
in addition to their mechanical interlock between the ribs and the concrete.
Also it is obvious that un-coated deformed bars gives higher bonding values
compared to those given by epoxy coated bars, although the two of them have nearly
the same rib profile. This can be attributed to the smooth surface of the coated bars
due to the presence of epoxy film at the bar concrete interface which decreases the
friction of epoxy coated bars.
617
Effect of Environmental Corrosion on Sea Front Reinforced Concrete Structures
Chapter No. (7)
Test Results and Discussion for Accelerated Corrosion Specimens
Fig. 7.12: Load-slip relationship for the 30MPa, 0.32 w/c mix with different types of steel bars, Zero
corrosion stage
Fig. 7.13: Load-slip relationship for the 44MPa, 0.52 w/c mix with different types of steel bars, Zero
corrosion stage
0
5
10
15
20
25
30
35
40
0 0.2 0.4 0.6 0.8 1 1.2 1.4 1.6 1.8 2 2.2
Pu
ll-o
ut
Load
(kN
)
Slip (mm)
PL-UC
DF-UC
DF-C
0
5
10
15
20
25
30
35
40
45
0 0.2 0.4 0.6 0.8 1 1.2 1.4 1.6 1.8 2 2.2
Pu
ll-o
ut
Load
(kN
)
Slip (mm)
PL-UC
DF-UC
DF-C
611
Effect of Environmental Corrosion on Sea Front Reinforced Concrete Structures
Chapter No. (7)
Test Results and Discussion for Accelerated Corrosion Specimens
Fig. 7.14: Load-slip relationship for the 44MPa, 0.32 w/c mix with different types of steel bars, Zero
corrosion stage
Fig. 7.15: Load-slip relationship for the 60MPa, 0.32 w/c mix with different types of steel bars, Zero
corrosion stage
0
5
10
15
20
25
30
35
40
45
50
0 0.2 0.4 0.6 0.8 1 1.2 1.4 1.6
Pu
ll-o
ut
Load
(kN
)
Slip (mm)
PL-UC
DF-UC
DF-C
0
10
20
30
40
50
60
0 0.2 0.4 0.6 0.8 1 1.2 1.4
Pu
ll-o
ut
Load
(kN
)
Slip (mm)
PL-UC DF-UC DF-C
611
Effect of Environmental Corrosion on Sea Front Reinforced Concrete Structures
Chapter No. (7)
Test Results and Discussion for Accelerated Corrosion Specimens
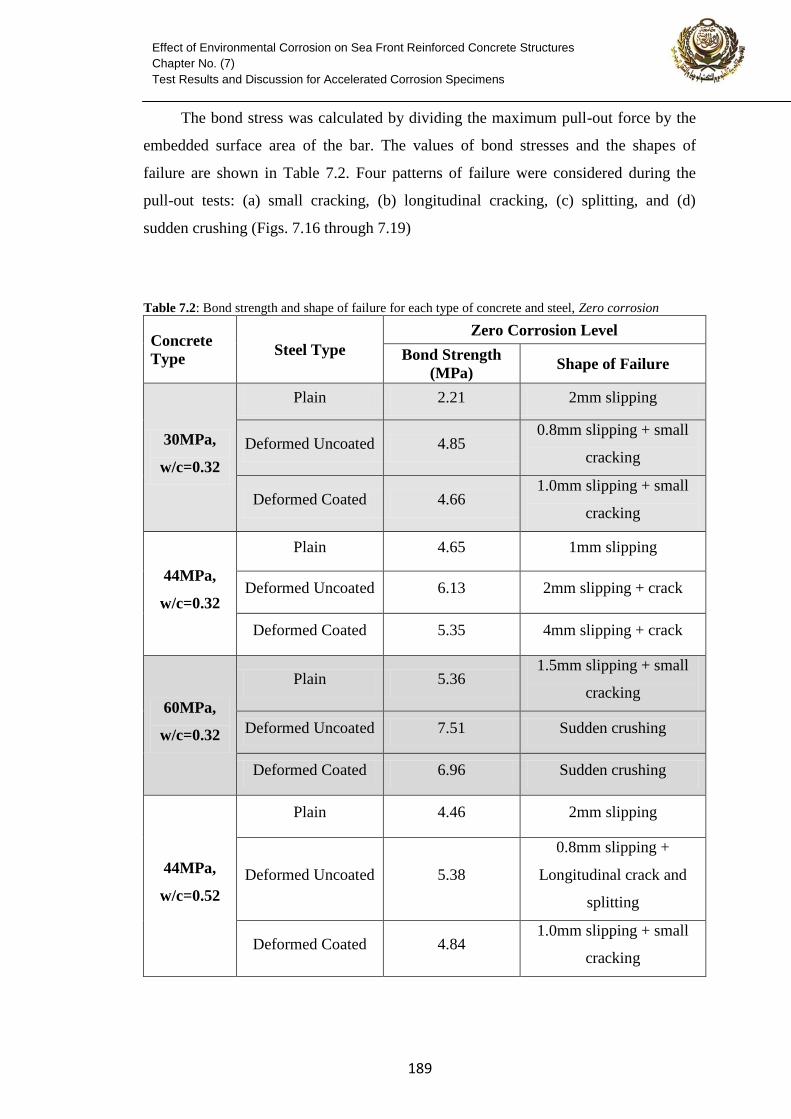
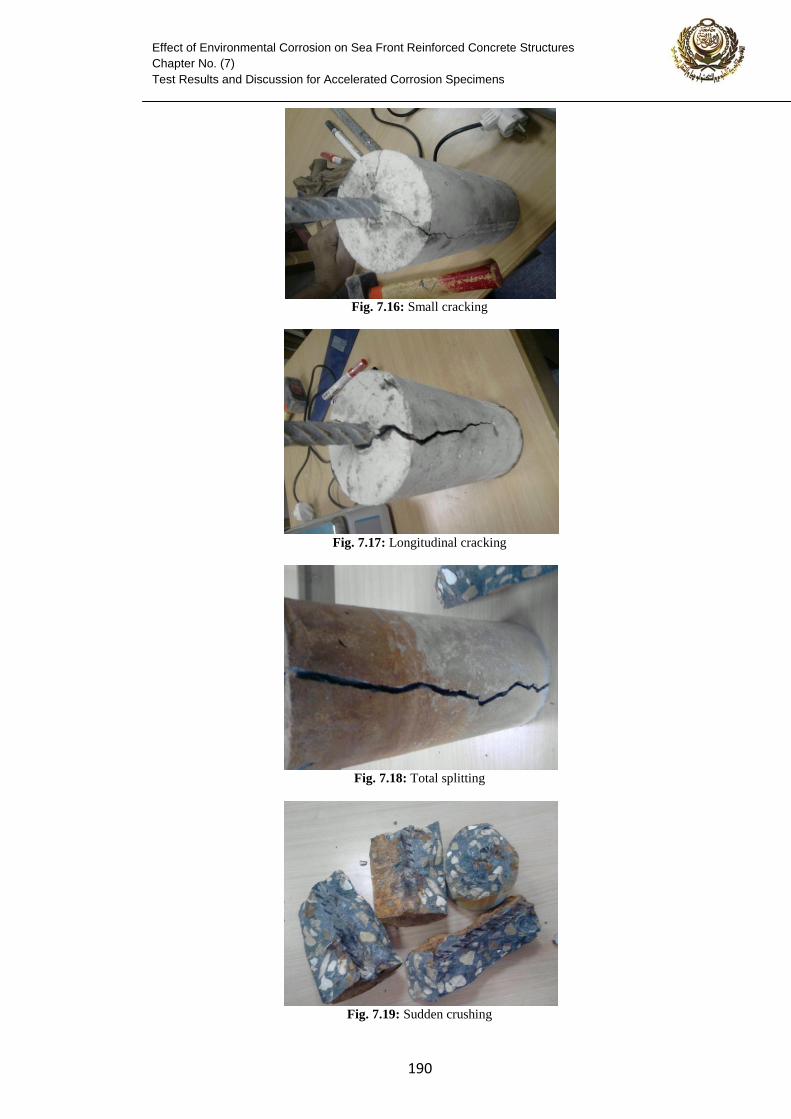
The bond stress was calculated by dividing the maximum pull-out force by the
embedded surface area of the bar. The values of bond stresses and the shapes of
failure are shown in Table 7.2. Four patterns of failure were considered during the
pull-out tests: (a) small cracking, (b) longitudinal cracking, (c) splitting, and (d)
sudden crushing (Figs. 7.16 through 7.19)
Table 7.2: Bond strength and shape of failure for each type of concrete and steel, Zero corrosion
Concrete
Type Steel Type
Zero Corrosion Level
Bond Strength
(MPa) Shape of Failure
30MPa,
w/c=0.32
Plain 2.21 2mm slipping
Deformed Uncoated 4.85 0.8mm slipping + small
cracking
Deformed Coated 4.66 1.0mm slipping + small
cracking
44MPa,
w/c=0.32
Plain 4.65 1mm slipping
Deformed Uncoated 6.13 2mm slipping + crack
Deformed Coated 5.35 4mm slipping + crack
60MPa,
w/c=0.32
Plain 5.36 1.5mm slipping + small
cracking
Deformed Uncoated 7.51 Sudden crushing
Deformed Coated 6.96 Sudden crushing
44MPa,
w/c=0.52
Plain 4.46 2mm slipping
Deformed Uncoated 5.38
0.8mm slipping +
Longitudinal crack and
splitting
Deformed Coated 4.84 1.0mm slipping + small
cracking
611
Effect of Environmental Corrosion on Sea Front Reinforced Concrete Structures
Chapter No. (7)
Test Results and Discussion for Accelerated Corrosion Specimens
Fig. 7.16: Small cracking
Fig. 7.17: Longitudinal cracking
Fig. 7.18: Total splitting
Fig. 7.19: Sudden crushing
616
Effect of Environmental Corrosion on Sea Front Reinforced Concrete Structures
Chapter No. (7)
Test Results and Discussion for Accelerated Corrosion Specimens
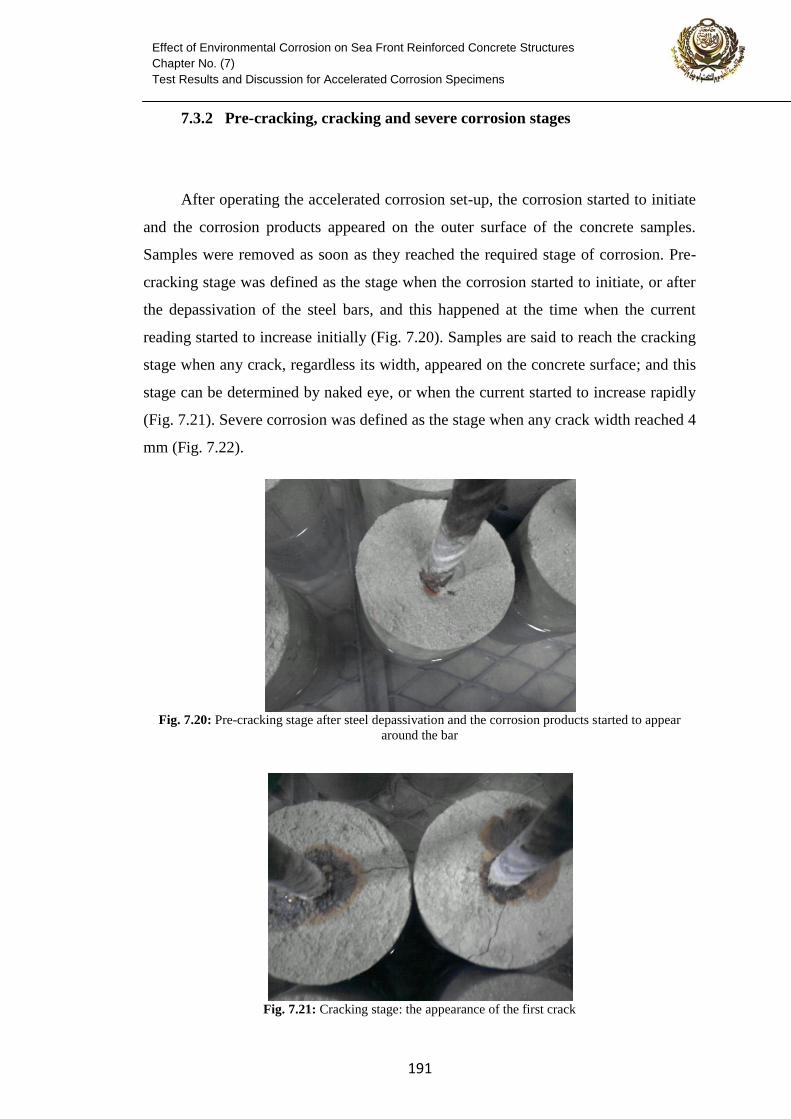
7.3.2 Pre-cracking, cracking and severe corrosion stages
After operating the accelerated corrosion set-up, the corrosion started to initiate
and the corrosion products appeared on the outer surface of the concrete samples.
Samples were removed as soon as they reached the required stage of corrosion. Pre-
cracking stage was defined as the stage when the corrosion started to initiate, or after
the depassivation of the steel bars, and this happened at the time when the current
reading started to increase initially (Fig. 7.20). Samples are said to reach the cracking
stage when any crack, regardless its width, appeared on the concrete surface; and this
stage can be determined by naked eye, or when the current started to increase rapidly
(Fig. 7.21). Severe corrosion was defined as the stage when any crack width reached 4
mm (Fig. 7.22).
Fig. 7.20: Pre-cracking stage after steel depassivation and the corrosion products started to appear
around the bar
Fig. 7.21: Cracking stage: the appearance of the first crack
611
Effect of Environmental Corrosion on Sea Front Reinforced Concrete Structures
Chapter No. (7)
Test Results and Discussion for Accelerated Corrosion Specimens
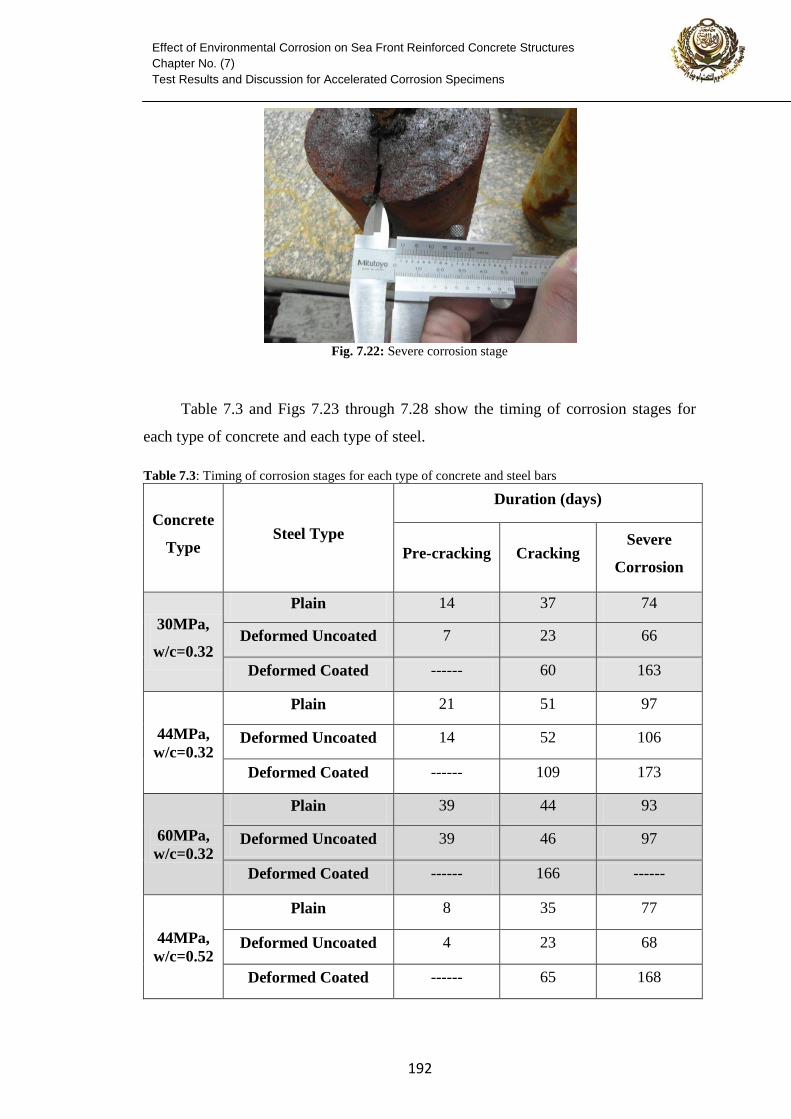
Fig. 7.22: Severe corrosion stage
Table 7.3 and Figs 7.23 through 7.28 show the timing of corrosion stages for
each type of concrete and each type of steel.
Table 7.3: Timing of corrosion stages for each type of concrete and steel bars
Concrete
Type Steel Type
Duration (days)
Pre-cracking Cracking Severe
Corrosion
30MPa,
w/c=0.32
Plain 14 37 74
Deformed Uncoated 7 23 66
Deformed Coated ------ 60 163
44MPa,
w/c=0.32
Plain 21 51 97
Deformed Uncoated 14 52 106
Deformed Coated ------ 109 173
60MPa,
w/c=0.32
Plain 39 44 93
Deformed Uncoated 39 46 97
Deformed Coated ------ 166 ------
44MPa,
w/c=0.52
Plain 8 35 77
Deformed Uncoated 4 23 68
Deformed Coated ------ 65 168
611
Effect of Environmental Corrosion on Sea Front Reinforced Concrete Structures
Chapter No. (7)
Test Results and Discussion for Accelerated Corrosion Specimens
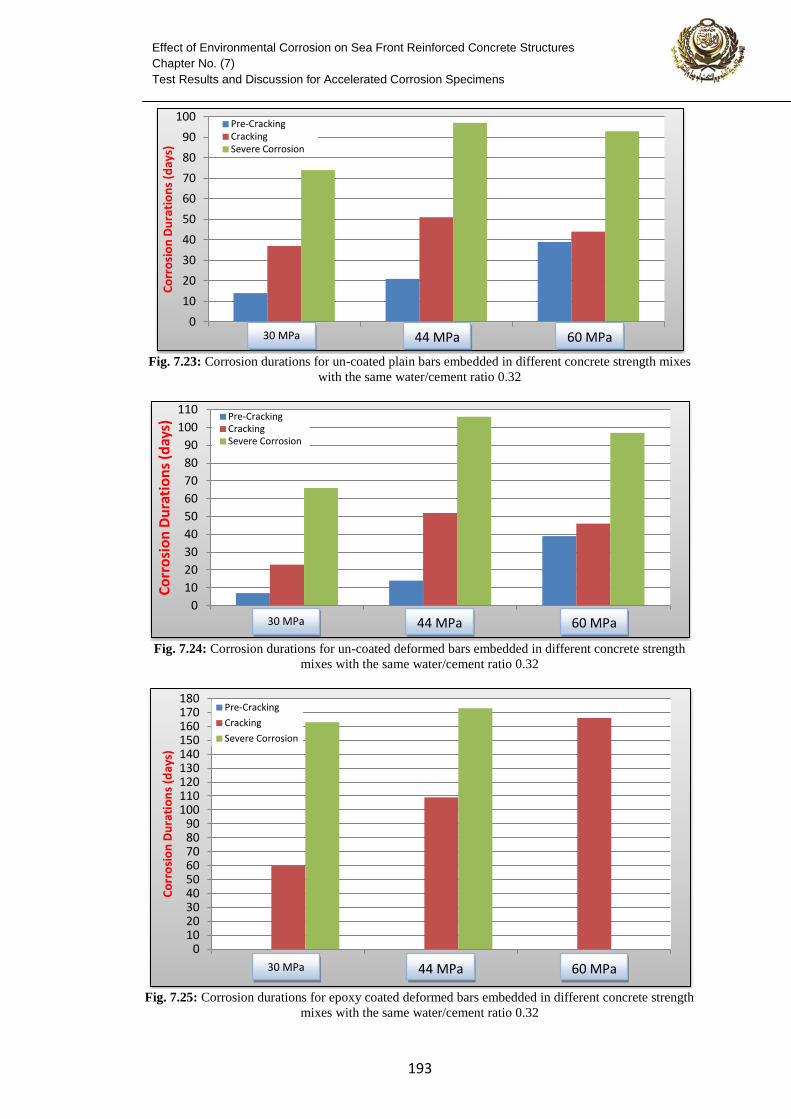
Fig. 7.23: Corrosion durations for un-coated plain bars embedded in different concrete strength mixes
with the same water/cement ratio 0.32
Fig. 7.24: Corrosion durations for un-coated deformed bars embedded in different concrete strength
mixes with the same water/cement ratio 0.32
Fig. 7.25: Corrosion durations for epoxy coated deformed bars embedded in different concrete strength
mixes with the same water/cement ratio 0.32
0
10
20
30
40
50
60
70
80
90
100
1 2 3
Co
rro
sio
n D
ura
tio
ns
(day
s)
Pre-Cracking Cracking Severe Corrosion
0
10
20
30
40
50
60
70
80
90
100
110
1 2 3
Co
rro
sio
n D
ura
tio
ns
(day
s) Pre-Cracking
Cracking Severe Corrosion
0 10 20 30 40 50 60 70 80 90
100 110 120 130 140 150 160 170 180
1 2 3
Co
rro
sio
n D
ura
tio
ns
(day
s)
Pre-Cracking
Cracking
Severe Corrosion
30 MPa 44 MPa 60 MPa
30 MPa 44 MPa 60 MPa
30 MPa 44 MPa 60 MPa
611
Effect of Environmental Corrosion on Sea Front Reinforced Concrete Structures
Chapter No. (7)
Test Results and Discussion for Accelerated Corrosion Specimens
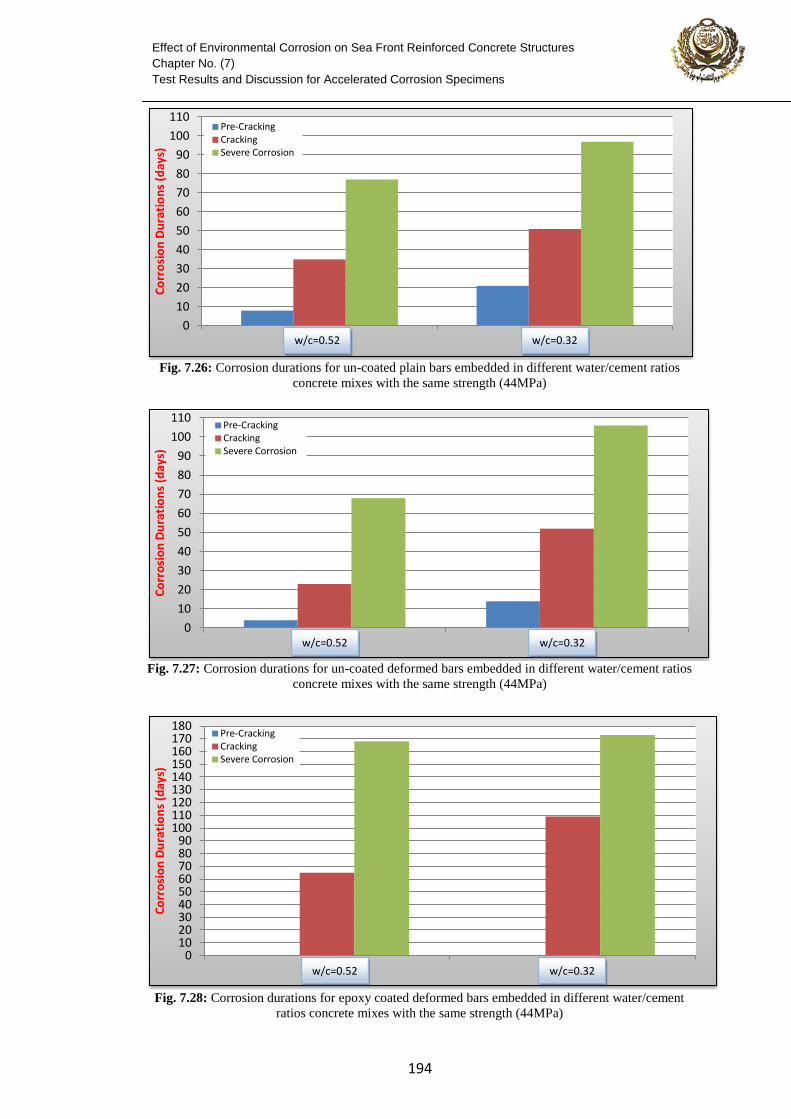
Fig. 7.26: Corrosion durations for un-coated plain bars embedded in different water/cement ratios
concrete mixes with the same strength (44MPa)
Fig. 7.27: Corrosion durations for un-coated deformed bars embedded in different water/cement ratios
concrete mixes with the same strength (44MPa)
Fig. 7.28: Corrosion durations for epoxy coated deformed bars embedded in different water/cement
ratios concrete mixes with the same strength (44MPa)
0
10
20
30
40
50
60
70
80
90
100
110
1 2
Co
rro
sio
n D
ura
tio
ns
(day
s)
Pre-Cracking Cracking Severe Corrosion
0
10
20
30
40
50
60
70
80
90
100
110
1 2
Co
rro
sio
n D
ura
tio
ns
(day
s)
Pre-Cracking Cracking Severe Corrosion
0 10 20 30 40 50 60 70 80 90
100 110 120 130 140 150 160 170 180
1 2
Co
rro
sio
n D
ura
tio
ns
(day
s)
Pre-Cracking Cracking Severe Corrosion
w/c=0.52 w/c=0.32
w/c=0.52 w/c=0.32
w/c=0.52 w/c=0.32
611
Effect of Environmental Corrosion on Sea Front Reinforced Concrete Structures
Chapter No. (7)
Test Results and Discussion for Accelerated Corrosion Specimens
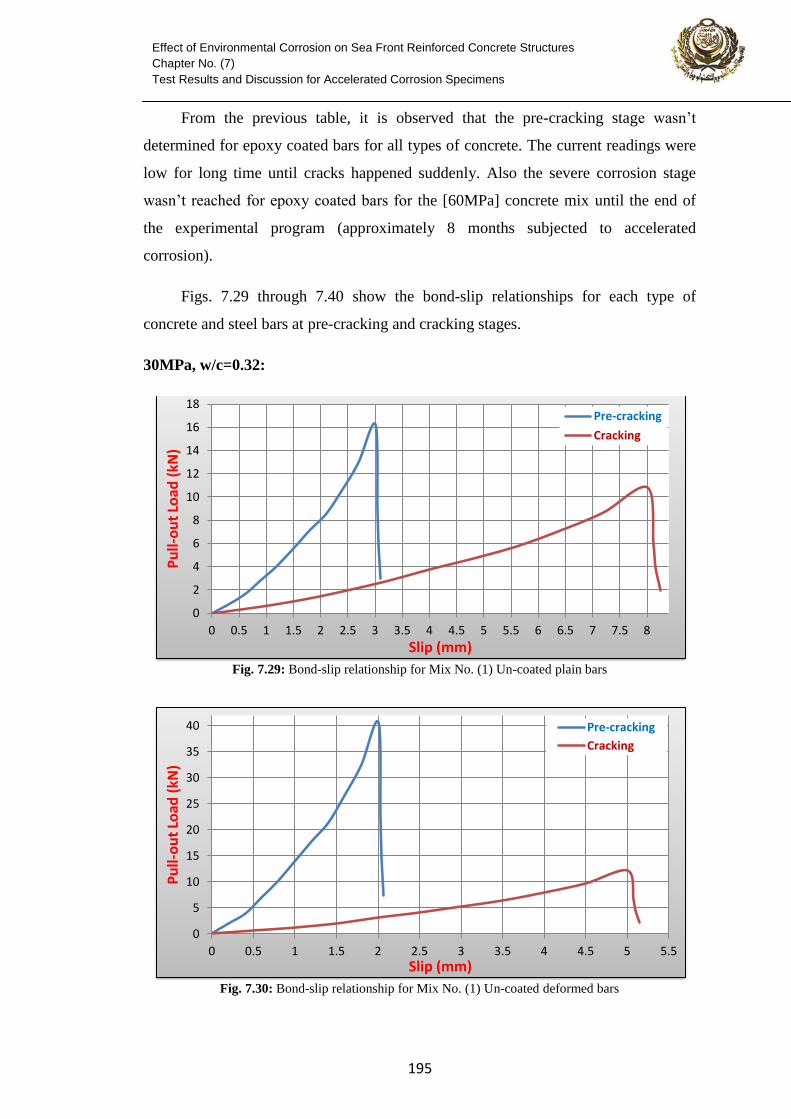
From the previous table, it is observed that the pre-cracking stage wasn’t
determined for epoxy coated bars for all types of concrete. The current readings were
low for long time until cracks happened suddenly. Also the severe corrosion stage
wasn’t reached for epoxy coated bars for the [60MPa] concrete mix until the end of
the experimental program (approximately 8 months subjected to accelerated
corrosion).
Figs. 7.29 through 7.40 show the bond-slip relationships for each type of
concrete and steel bars at pre-cracking and cracking stages.
30MPa, w/c=0.32:
Fig. 7.29: Bond-slip relationship for Mix No. (1) Un-coated plain bars
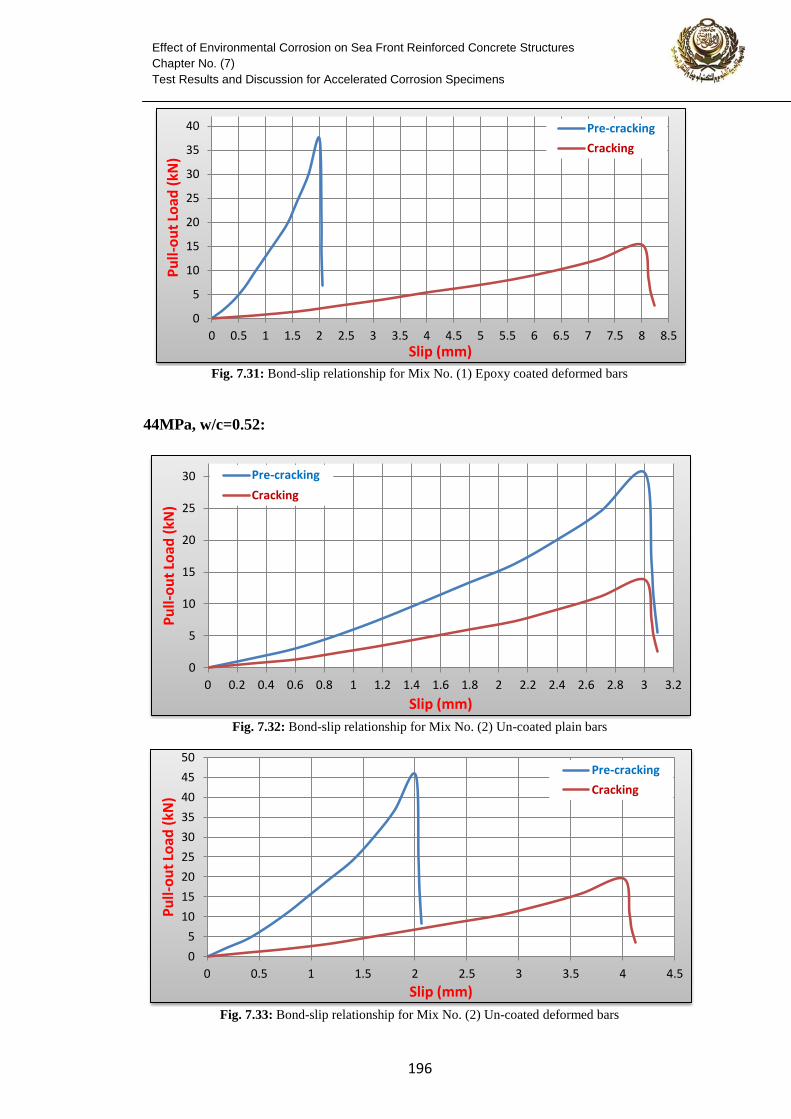
Fig. 7.30: Bond-slip relationship for Mix No. (1) Un-coated deformed bars
0
2
4
6
8
10
12
14
16
18
0 0.5 1 1.5 2 2.5 3 3.5 4 4.5 5 5.5 6 6.5 7 7.5 8
Pu
ll-o
ut
Load
(kN
)
Slip (mm)
Pre-cracking
Cracking
0
5
10
15
20
25
30
35
40
0 0.5 1 1.5 2 2.5 3 3.5 4 4.5 5 5.5
Pu
ll-o
ut
Load
(kN
)
Slip (mm)
Pre-cracking
Cracking
611
Effect of Environmental Corrosion on Sea Front Reinforced Concrete Structures
Chapter No. (7)
Test Results and Discussion for Accelerated Corrosion Specimens
Fig. 7.31: Bond-slip relationship for Mix No. (1) Epoxy coated deformed bars
44MPa, w/c=0.52:
Fig. 7.32: Bond-slip relationship for Mix No. (2) Un-coated plain bars
Fig. 7.33: Bond-slip relationship for Mix No. (2) Un-coated deformed bars
0
5
10
15
20
25
30
35
40
0 0.5 1 1.5 2 2.5 3 3.5 4 4.5 5 5.5 6 6.5 7 7.5 8 8.5
Pu
ll-o
ut
Load
(kN
)
Slip (mm)
Pre-cracking
Cracking
0
5
10
15
20
25
30
0 0.2 0.4 0.6 0.8 1 1.2 1.4 1.6 1.8 2 2.2 2.4 2.6 2.8 3 3.2
Pu
ll-o
ut
Load
(kN
)
Slip (mm)
Pre-cracking
Cracking
0
5
10
15
20
25
30
35
40
45
50
0 0.5 1 1.5 2 2.5 3 3.5 4 4.5
Pu
ll-o
ut
Load
(kN
)
Slip (mm)
Pre-cracking
Cracking
617
Effect of Environmental Corrosion on Sea Front Reinforced Concrete Structures
Chapter No. (7)
Test Results and Discussion for Accelerated Corrosion Specimens
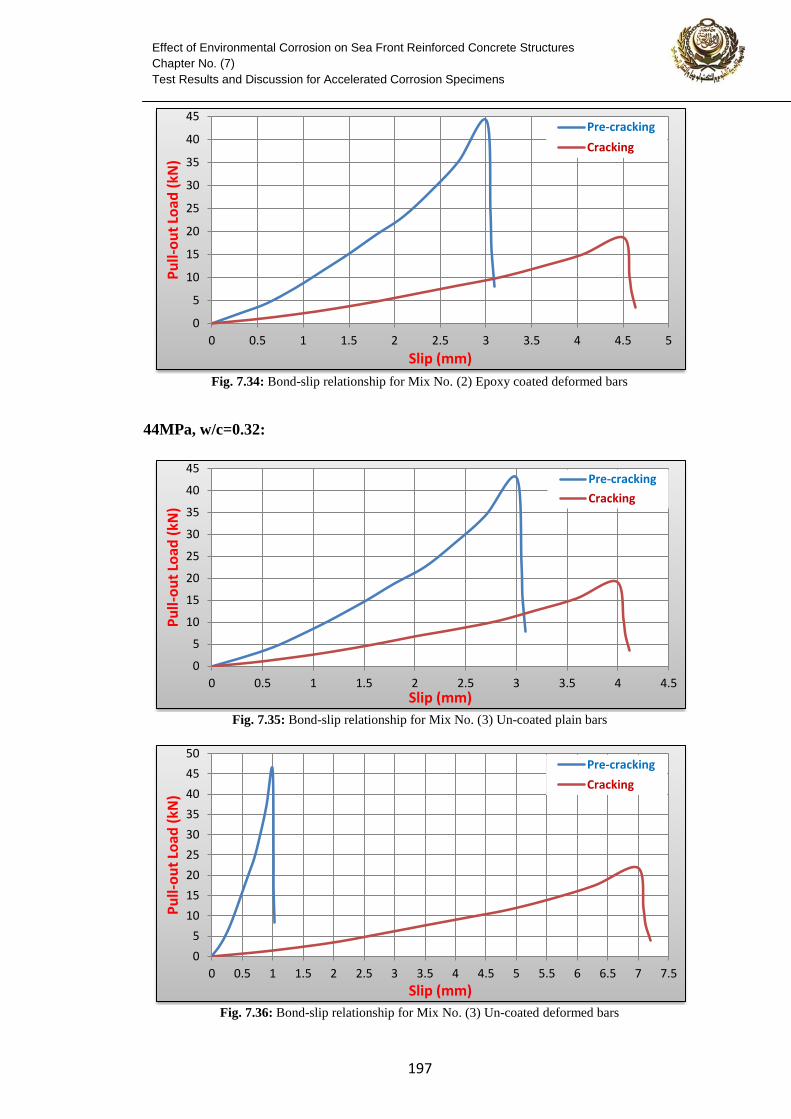
Fig. 7.34: Bond-slip relationship for Mix No. (2) Epoxy coated deformed bars
44MPa, w/c=0.32:
Fig. 7.35: Bond-slip relationship for Mix No. (3) Un-coated plain bars
Fig. 7.36: Bond-slip relationship for Mix No. (3) Un-coated deformed bars
0
5
10
15
20
25
30
35
40
45
0 0.5 1 1.5 2 2.5 3 3.5 4 4.5 5
Pu
ll-o
ut
Load
(kN
)
Slip (mm)
Pre-cracking
Cracking
0
5
10
15
20
25
30
35
40
45
0 0.5 1 1.5 2 2.5 3 3.5 4 4.5
Pu
ll-o
ut
Load
(kN
)
Slip (mm)
Pre-cracking
Cracking
0
5
10
15
20
25
30
35
40
45
50
0 0.5 1 1.5 2 2.5 3 3.5 4 4.5 5 5.5 6 6.5 7 7.5
Pu
ll-o
ut
Load
(kN
)
Slip (mm)
Pre-cracking
Cracking
611
Effect of Environmental Corrosion on Sea Front Reinforced Concrete Structures
Chapter No. (7)
Test Results and Discussion for Accelerated Corrosion Specimens
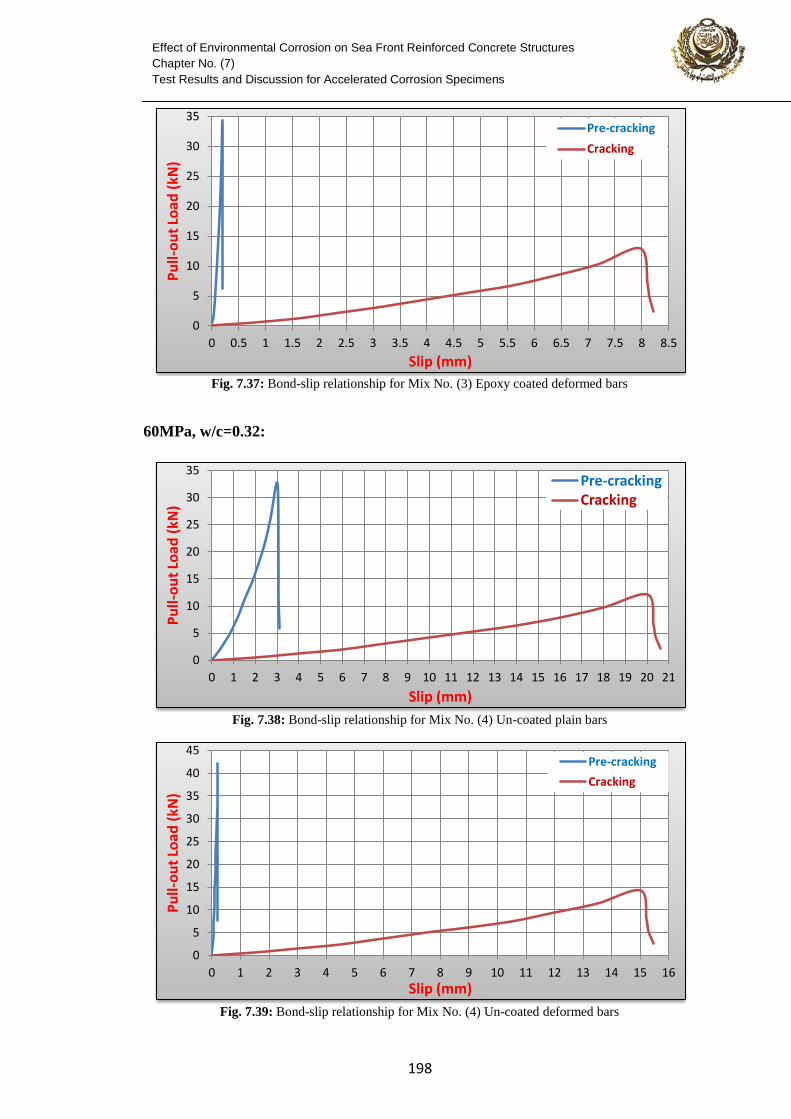
Fig. 7.37: Bond-slip relationship for Mix No. (3) Epoxy coated deformed bars
60MPa, w/c=0.32:
Fig. 7.38: Bond-slip relationship for Mix No. (4) Un-coated plain bars
Fig. 7.39: Bond-slip relationship for Mix No. (4) Un-coated deformed bars
0
5
10
15
20
25
30
35
0 0.5 1 1.5 2 2.5 3 3.5 4 4.5 5 5.5 6 6.5 7 7.5 8 8.5
Pu
ll-o
ut
Load
(kN
)
Slip (mm)
Pre-cracking
Cracking
0
5
10
15
20
25
30
35
0 1 2 3 4 5 6 7 8 9 10 11 12 13 14 15 16 17 18 19 20 21
Pu
ll-o
ut
Load
(kN
)
Slip (mm)
Pre-cracking Cracking
0
5
10
15
20
25
30
35
40
45
0 1 2 3 4 5 6 7 8 9 10 11 12 13 14 15 16
Pu
ll-o
ut
Load
(kN
)
Slip (mm)
Pre-cracking
Cracking
611
Effect of Environmental Corrosion on Sea Front Reinforced Concrete Structures
Chapter No. (7)
Test Results and Discussion for Accelerated Corrosion Specimens
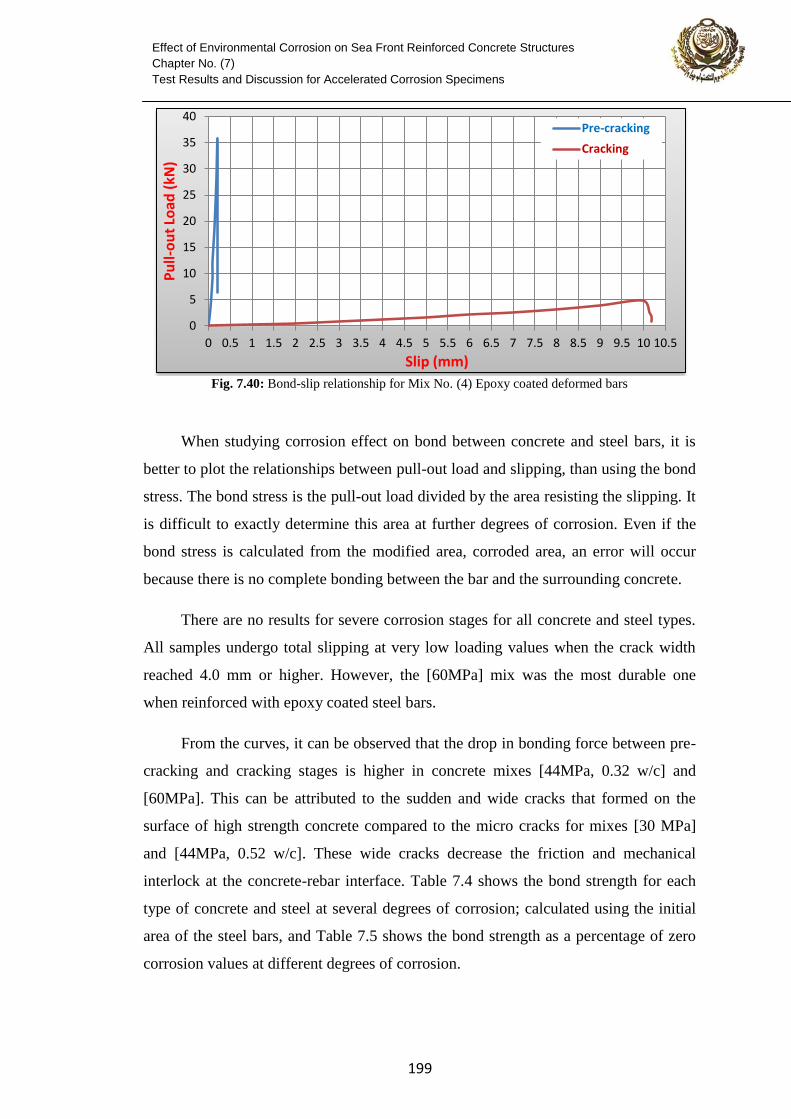
Fig. 7.40: Bond-slip relationship for Mix No. (4) Epoxy coated deformed bars
When studying corrosion effect on bond between concrete and steel bars, it is
better to plot the relationships between pull-out load and slipping, than using the bond
stress. The bond stress is the pull-out load divided by the area resisting the slipping. It
is difficult to exactly determine this area at further degrees of corrosion. Even if the
bond stress is calculated from the modified area, corroded area, an error will occur
because there is no complete bonding between the bar and the surrounding concrete.
There are no results for severe corrosion stages for all concrete and steel types.
All samples undergo total slipping at very low loading values when the crack width
reached 4.0 mm or higher. However, the [60MPa] mix was the most durable one
when reinforced with epoxy coated steel bars.
From the curves, it can be observed that the drop in bonding force between pre-
cracking and cracking stages is higher in concrete mixes [44MPa, 0.32 w/c] and
[60MPa]. This can be attributed to the sudden and wide cracks that formed on the
surface of high strength concrete compared to the micro cracks for mixes [30 MPa]
and [44MPa, 0.52 w/c]. These wide cracks decrease the friction and mechanical
interlock at the concrete-rebar interface. Table 7.4 shows the bond strength for each
type of concrete and steel at several degrees of corrosion; calculated using the initial
area of the steel bars, and Table 7.5 shows the bond strength as a percentage of zero
corrosion values at different degrees of corrosion.
0
5
10
15
20
25
30
35
40
0 0.5 1 1.5 2 2.5 3 3.5 4 4.5 5 5.5 6 6.5 7 7.5 8 8.5 9 9.5 10 10.5
Pu
ll-o
ut
Load
(kN
)
Slip (mm)
Pre-cracking
Cracking
111
Effect of Environmental Corrosion on Sea Front Reinforced Concrete Structures
Chapter No. (7)
Test Results and Discussion for Accelerated Corrosion Specimens
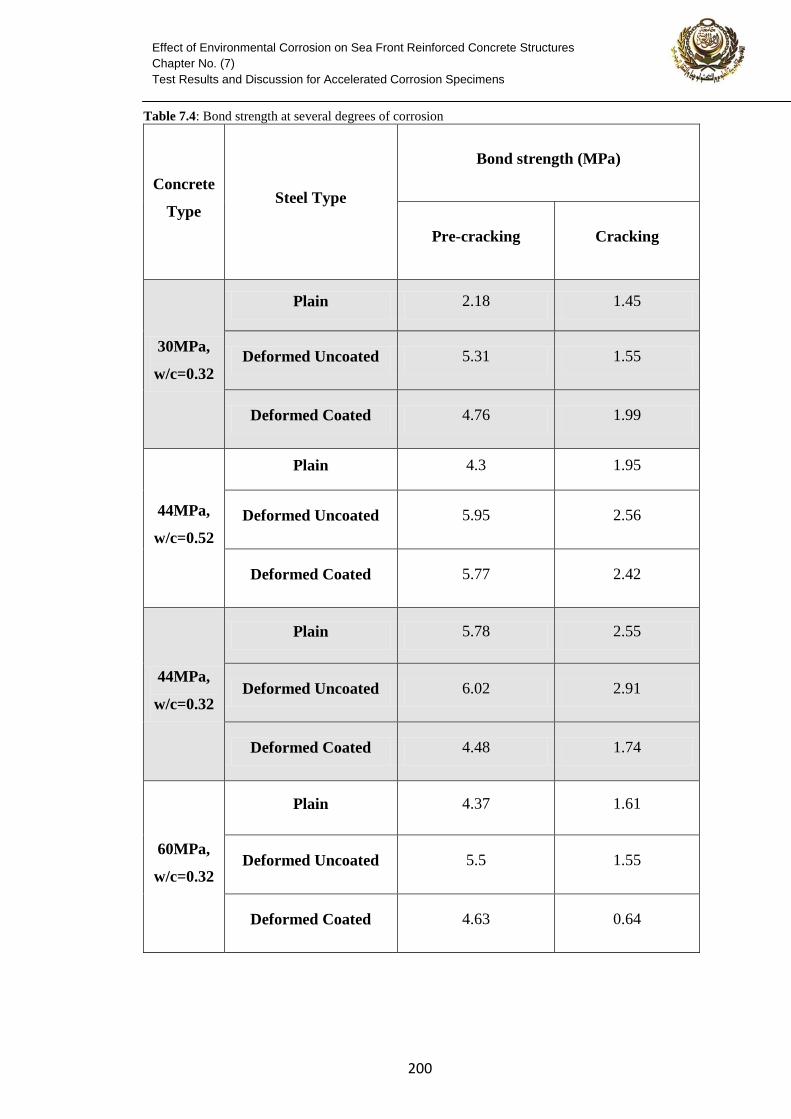
Table 7.4: Bond strength at several degrees of corrosion
Concrete
Type Steel Type
Bond strength (MPa)
Pre-cracking Cracking
30MPa,
w/c=0.32
Plain 2.18 1.45
Deformed Uncoated 5.31 1.55
Deformed Coated 4.76 1.99
44MPa,
w/c=0.52
Plain 4.3 1.95
Deformed Uncoated 5.95 2.56
Deformed Coated 5.77 2.42
44MPa,
w/c=0.32
Plain 5.78 2.55
Deformed Uncoated 6.02 2.91
Deformed Coated 4.48 1.74
60MPa,
w/c=0.32
Plain 4.37 1.61
Deformed Uncoated 5.5 1.55
Deformed Coated 4.63 0.64
116
Effect of Environmental Corrosion on Sea Front Reinforced Concrete Structures
Chapter No. (7)
Test Results and Discussion for Accelerated Corrosion Specimens
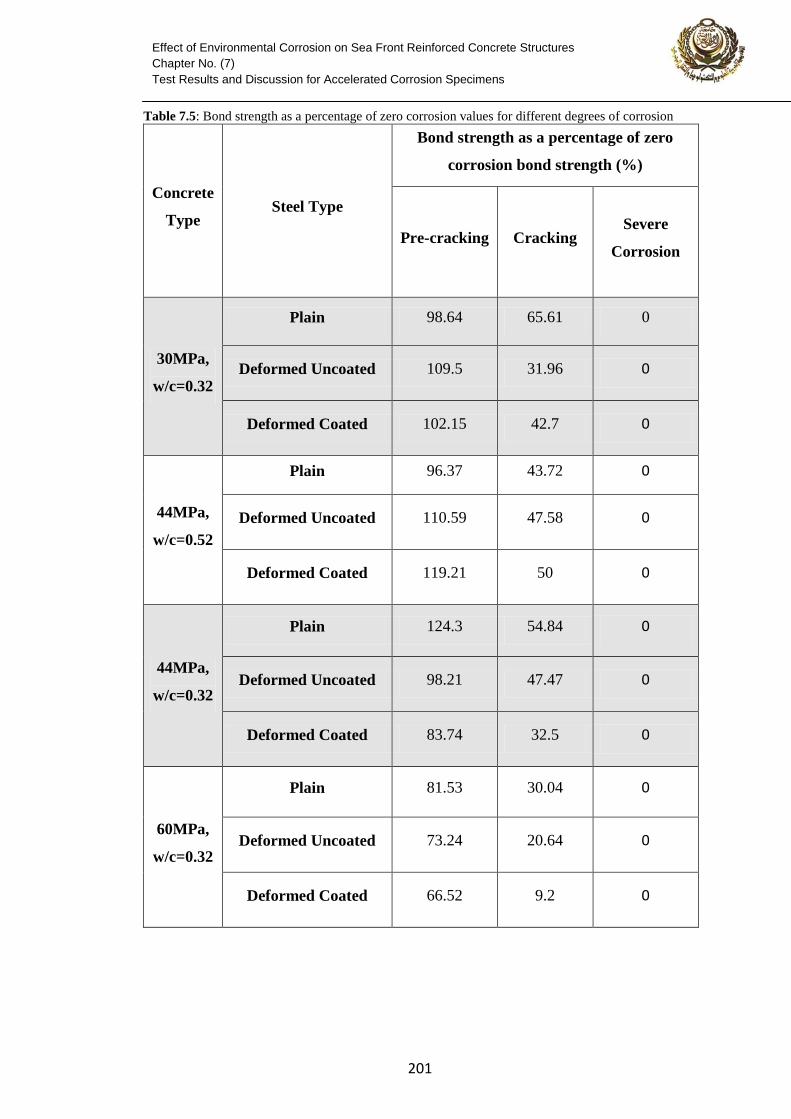
Table 7.5: Bond strength as a percentage of zero corrosion values for different degrees of corrosion
Concrete
Type Steel Type
Bond strength as a percentage of zero
corrosion bond strength (%)
Pre-cracking Cracking Severe
Corrosion
30MPa,
w/c=0.32
Plain 98.64 65.61 0
Deformed Uncoated 109.5 31.96 0
Deformed Coated 102.15 42.7 0
44MPa,
w/c=0.52
Plain 96.37 43.72 0
Deformed Uncoated 110.59 47.58 0
Deformed Coated 119.21 50 0
44MPa,
w/c=0.32
Plain 124.3 54.84 0
Deformed Uncoated 98.21 47.47 0
Deformed Coated 83.74 32.5 0
60MPa,
w/c=0.32
Plain 81.53 30.04 0
Deformed Uncoated 73.24 20.64 0
Deformed Coated 66.52 9.2 0
111
Effect of Environmental Corrosion on Sea Front Reinforced Concrete Structures
Chapter No. (7)
Test Results and Discussion for Accelerated Corrosion Specimens
From the results it can be concluded that higher strength concrete can withstand
corrosion attacks for longer durations, but at cracking it will show faster deterioration
than lower strength concrete.
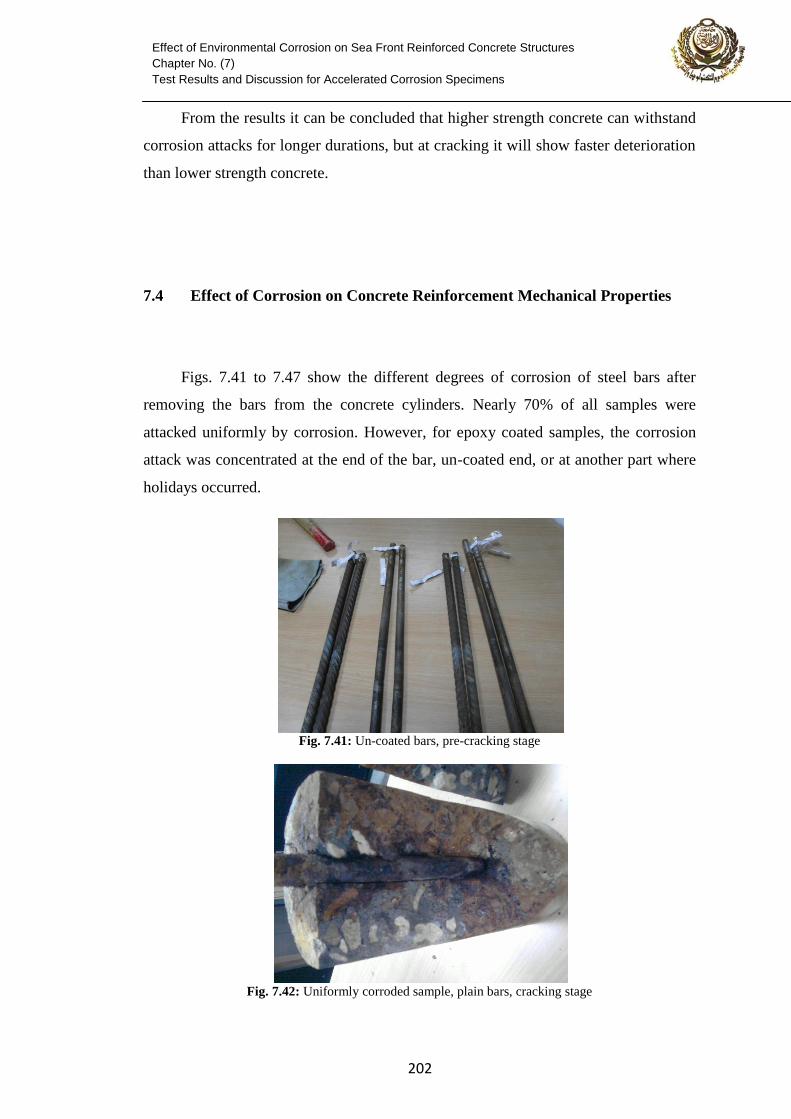
7.4 Effect of Corrosion on Concrete Reinforcement Mechanical Properties
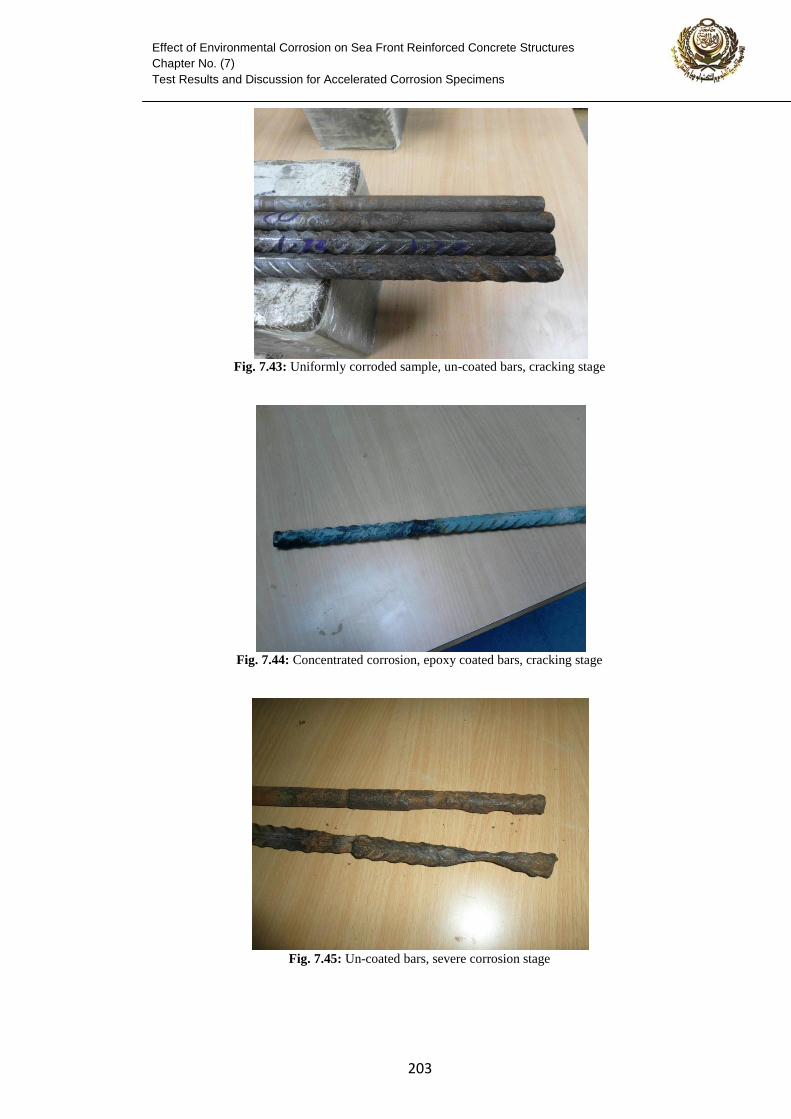
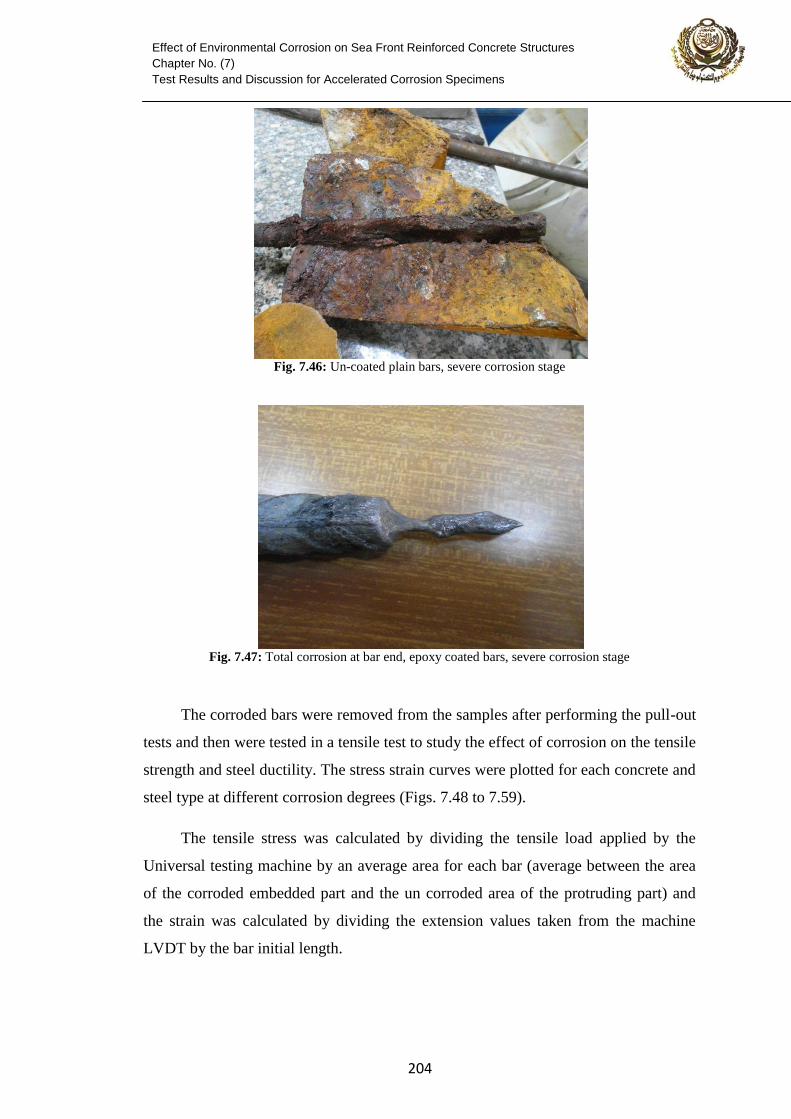
Figs. 7.41 to 7.47 show the different degrees of corrosion of steel bars after
removing the bars from the concrete cylinders. Nearly 70% of all samples were
attacked uniformly by corrosion. However, for epoxy coated samples, the corrosion
attack was concentrated at the end of the bar, un-coated end, or at another part where
holidays occurred.
Fig. 7.41: Un-coated bars, pre-cracking stage
Fig. 7.42: Uniformly corroded sample, plain bars, cracking stage
111
Effect of Environmental Corrosion on Sea Front Reinforced Concrete Structures
Chapter No. (7)
Test Results and Discussion for Accelerated Corrosion Specimens
Fig. 7.43: Uniformly corroded sample, un-coated bars, cracking stage
Fig. 7.44: Concentrated corrosion, epoxy coated bars, cracking stage
Fig. 7.45: Un-coated bars, severe corrosion stage
111
Effect of Environmental Corrosion on Sea Front Reinforced Concrete Structures
Chapter No. (7)
Test Results and Discussion for Accelerated Corrosion Specimens
Fig. 7.46: Un-coated plain bars, severe corrosion stage
Fig. 7.47: Total corrosion at bar end, epoxy coated bars, severe corrosion stage
The corroded bars were removed from the samples after performing the pull-out
tests and then were tested in a tensile test to study the effect of corrosion on the tensile
strength and steel ductility. The stress strain curves were plotted for each concrete and
steel type at different corrosion degrees (Figs. 7.48 to 7.59).
The tensile stress was calculated by dividing the tensile load applied by the
Universal testing machine by an average area for each bar (average between the area
of the corroded embedded part and the un corroded area of the protruding part) and
the strain was calculated by dividing the extension values taken from the machine
LVDT by the bar initial length.
111
Effect of Environmental Corrosion on Sea Front Reinforced Concrete Structures
Chapter No. (7)
Test Results and Discussion for Accelerated Corrosion Specimens
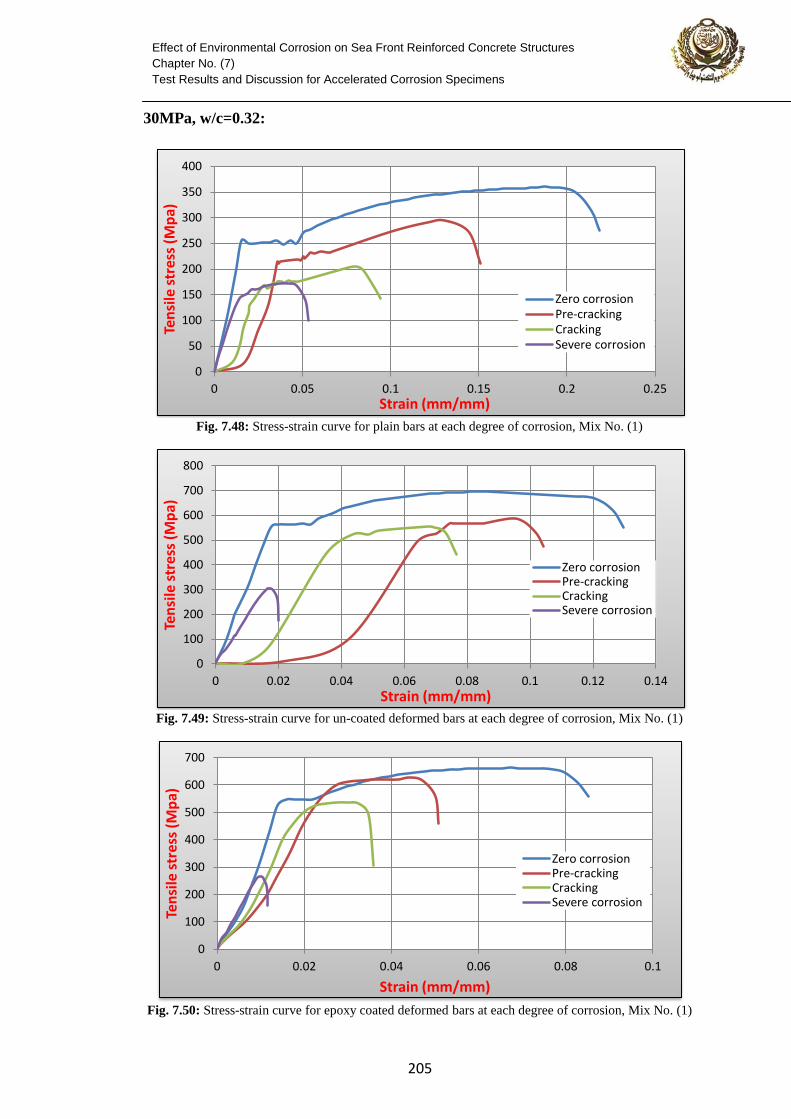
30MPa, w/c=0.32:
Fig. 7.48: Stress-strain curve for plain bars at each degree of corrosion, Mix No. (1)
Fig. 7.49: Stress-strain curve for un-coated deformed bars at each degree of corrosion, Mix No. (1)
Fig. 7.50: Stress-strain curve for epoxy coated deformed bars at each degree of corrosion, Mix No. (1)
0
50
100
150
200
250
300
350
400
0 0.05 0.1 0.15 0.2 0.25
Ten
sile
str
ess
(Mp
a)
Strain (mm/mm)
Zero corrosion Pre-cracking Cracking Severe corrosion
0
100
200
300
400
500
600
700
800
0 0.02 0.04 0.06 0.08 0.1 0.12 0.14
Ten
sile
str
ess
(Mp
a)
Strain (mm/mm)
Zero corrosion Pre-cracking Cracking Severe corrosion
0
100
200
300
400
500
600
700
0 0.02 0.04 0.06 0.08 0.1
Ten
sile
str
ess
(Mp
a)
Strain (mm/mm)
Zero corrosion Pre-cracking Cracking Severe corrosion
111
Effect of Environmental Corrosion on Sea Front Reinforced Concrete Structures
Chapter No. (7)
Test Results and Discussion for Accelerated Corrosion Specimens
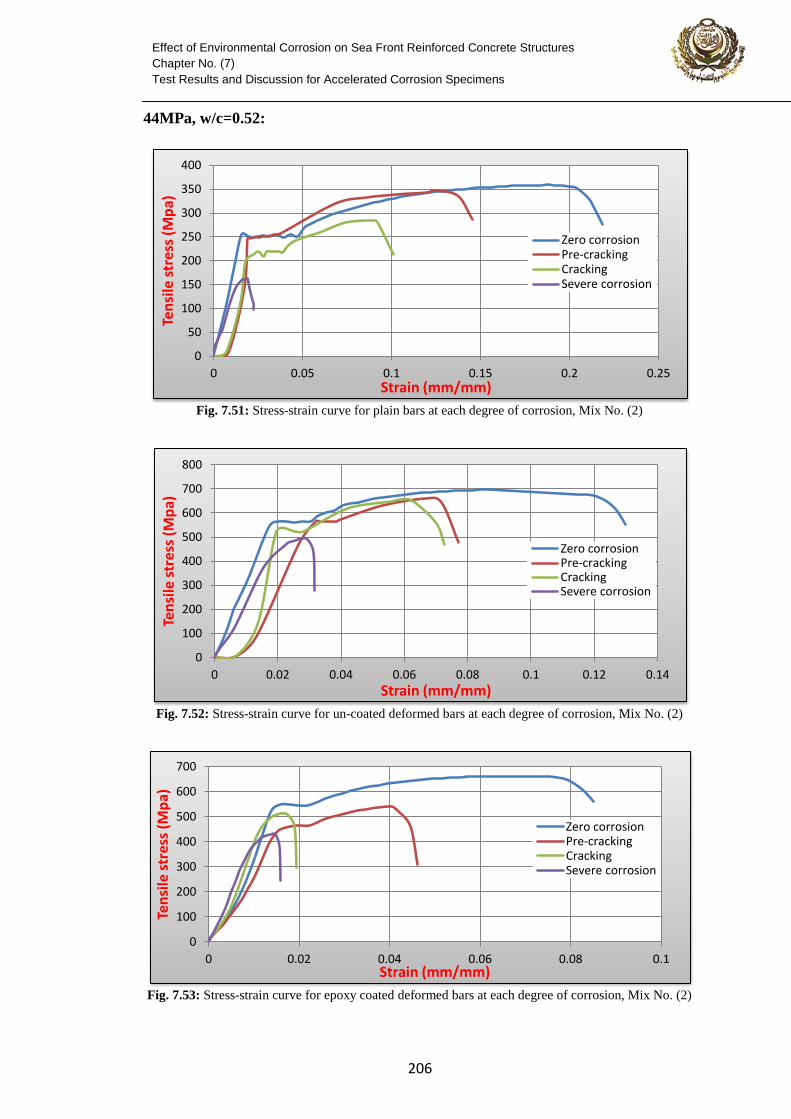
44MPa, w/c=0.52:
Fig. 7.51: Stress-strain curve for plain bars at each degree of corrosion, Mix No. (2)
Fig. 7.52: Stress-strain curve for un-coated deformed bars at each degree of corrosion, Mix No. (2)
Fig. 7.53: Stress-strain curve for epoxy coated deformed bars at each degree of corrosion, Mix No. (2)
0
50
100
150
200
250
300
350
400
0 0.05 0.1 0.15 0.2 0.25
Ten
sile
str
ess
(Mp
a)
Strain (mm/mm)
Zero corrosion Pre-cracking Cracking Severe corrosion
0
100
200
300
400
500
600
700
800
0 0.02 0.04 0.06 0.08 0.1 0.12 0.14
Ten
sile
str
ess
(Mp
a)
Strain (mm/mm)
Zero corrosion Pre-cracking Cracking Severe corrosion
0
100
200
300
400
500
600
700
0 0.02 0.04 0.06 0.08 0.1
Ten
sile
str
ess
(Mp
a)
Strain (mm/mm)
Zero corrosion Pre-cracking Cracking Severe corrosion
117
Effect of Environmental Corrosion on Sea Front Reinforced Concrete Structures
Chapter No. (7)
Test Results and Discussion for Accelerated Corrosion Specimens
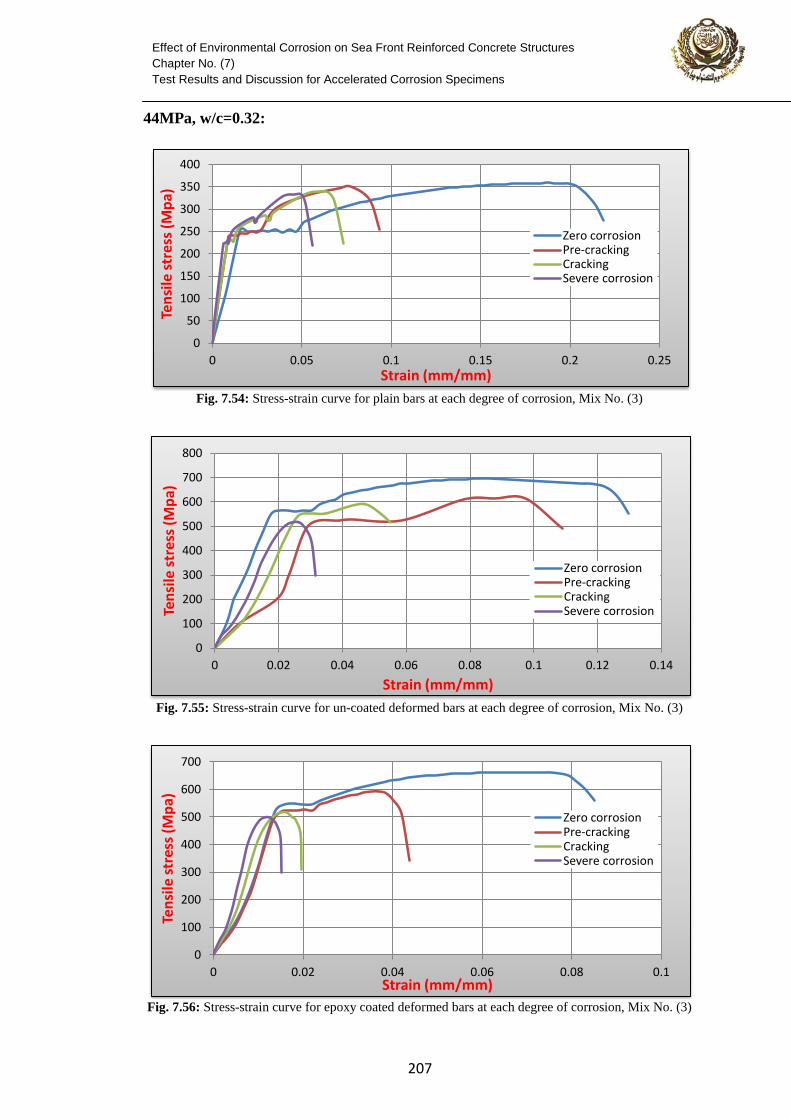
44MPa, w/c=0.32:
Fig. 7.54: Stress-strain curve for plain bars at each degree of corrosion, Mix No. (3)
Fig. 7.55: Stress-strain curve for un-coated deformed bars at each degree of corrosion, Mix No. (3)
Fig. 7.56: Stress-strain curve for epoxy coated deformed bars at each degree of corrosion, Mix No. (3)
0
50
100
150
200
250
300
350
400
0 0.05 0.1 0.15 0.2 0.25
Ten
sile
str
ess
(Mp
a)
Strain (mm/mm)
Zero corrosion Pre-cracking Cracking Severe corrosion
0
100
200
300
400
500
600
700
800
0 0.02 0.04 0.06 0.08 0.1 0.12 0.14
Ten
sile
str
ess
(Mp
a)
Strain (mm/mm)
Zero corrosion Pre-cracking Cracking Severe corrosion
0
100
200
300
400
500
600
700
0 0.02 0.04 0.06 0.08 0.1
Ten
sile
str
ess
(Mp
a)
Strain (mm/mm)
Zero corrosion Pre-cracking Cracking Severe corrosion
111
Effect of Environmental Corrosion on Sea Front Reinforced Concrete Structures
Chapter No. (7)
Test Results and Discussion for Accelerated Corrosion Specimens
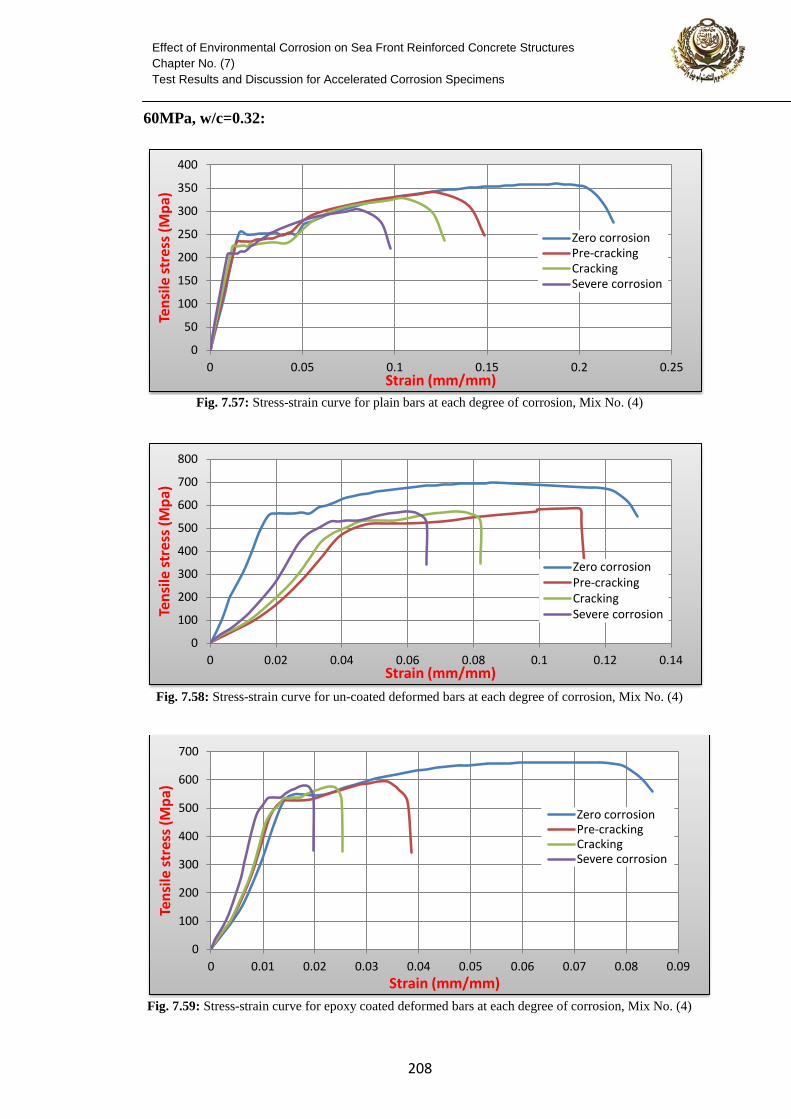
60MPa, w/c=0.32:
Fig. 7.57: Stress-strain curve for plain bars at each degree of corrosion, Mix No. (4)
Fig. 7.58: Stress-strain curve for un-coated deformed bars at each degree of corrosion, Mix No. (4)
Fig. 7.59: Stress-strain curve for epoxy coated deformed bars at each degree of corrosion, Mix No. (4)
0
50
100
150
200
250
300
350
400
0 0.05 0.1 0.15 0.2 0.25
Ten
sile
str
ess
(Mp
a)
Strain (mm/mm)
Zero corrosion Pre-cracking Cracking Severe corrosion
0
100
200
300
400
500
600
700
800
0 0.02 0.04 0.06 0.08 0.1 0.12 0.14
Ten
sile
str
ess
(Mp
a)
Strain (mm/mm)
Zero corrosion Pre-cracking Cracking Severe corrosion
0
100
200
300
400
500
600
700
0 0.01 0.02 0.03 0.04 0.05 0.06 0.07 0.08 0.09
Ten
sile
str
ess
(Mp
a)
Strain (mm/mm)
Zero corrosion Pre-cracking Cracking Severe corrosion
111
Effect of Environmental Corrosion on Sea Front Reinforced Concrete Structures
Chapter No. (7)
Test Results and Discussion for Accelerated Corrosion Specimens
From the curves, it is observed that the reduction in steel tensile strength is inversely
proportional to the increase in concrete strength. This is shown in the higher reduction
values of tensile stresses for the 30 MPa concrete (mix No. 1) compared to the higher
strength concrete. The minimum reduction in tensile stresses was observed in the 60
MPa concrete (mix No. 4).
On the other hand, the decrease in steel bars ductility is clearly obvious in all
concrete mixes. As corrosion propagates, the steel bars failed at lower extensions
compared to those before corrosion initiation. Nearly all steel types showed similarity
in reduction of their ductility values.
When designing a reinforced concrete section, the designer is interested in the
yielding values of steel, not the maximum values. All bars, plain and deformed,
showed yielding regions in their stress-strain curves before corrosion. However, these
regions started to disappear as the corrosion propagated from pre-cracking to severe
corrosion stage.
From the previous results, it can be concluded that corrosion affects the steel
mechanical properties negatively. This means that as corrosion propagates, the safety
factor used in the designing process will be consumed. Corrosion looses the steel all
its advantages. The high strength of steel is decreased and its ability to elongate upon
loading is lost. Also the bond is lost between steel bars and the surrounding concrete
which will force the structure to perform as plain concrete, leading to sudden failure at
further degrees of corrosion.
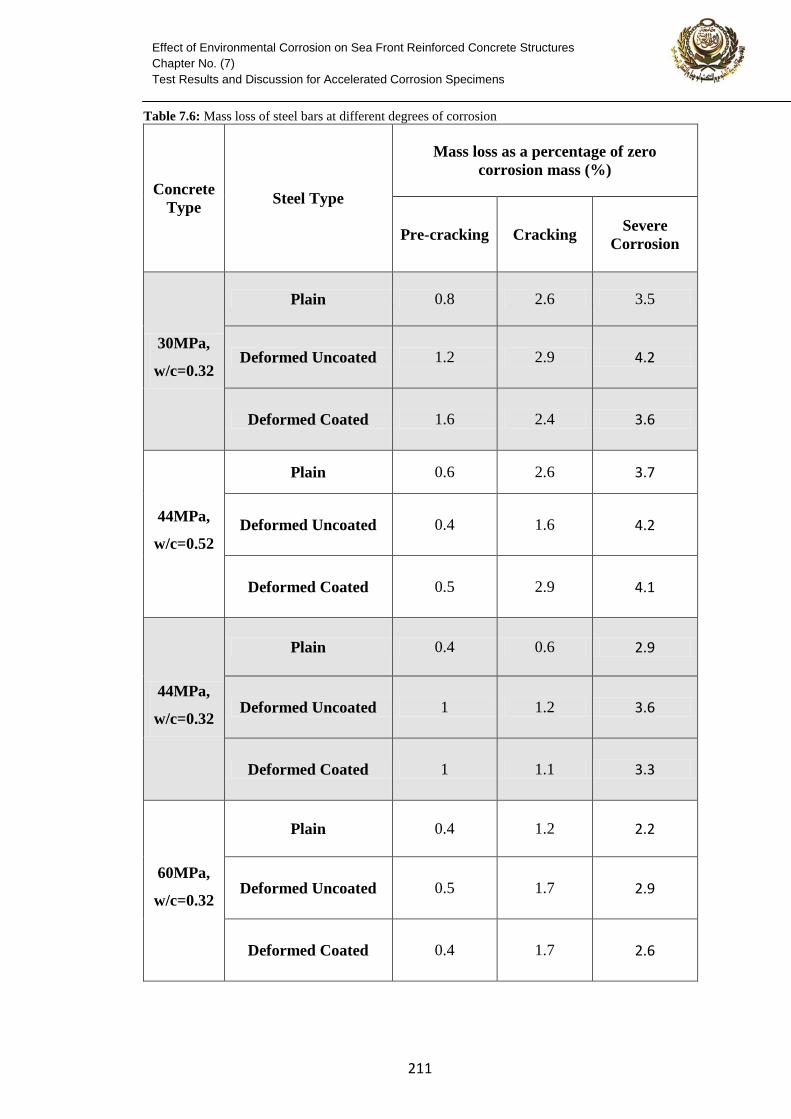
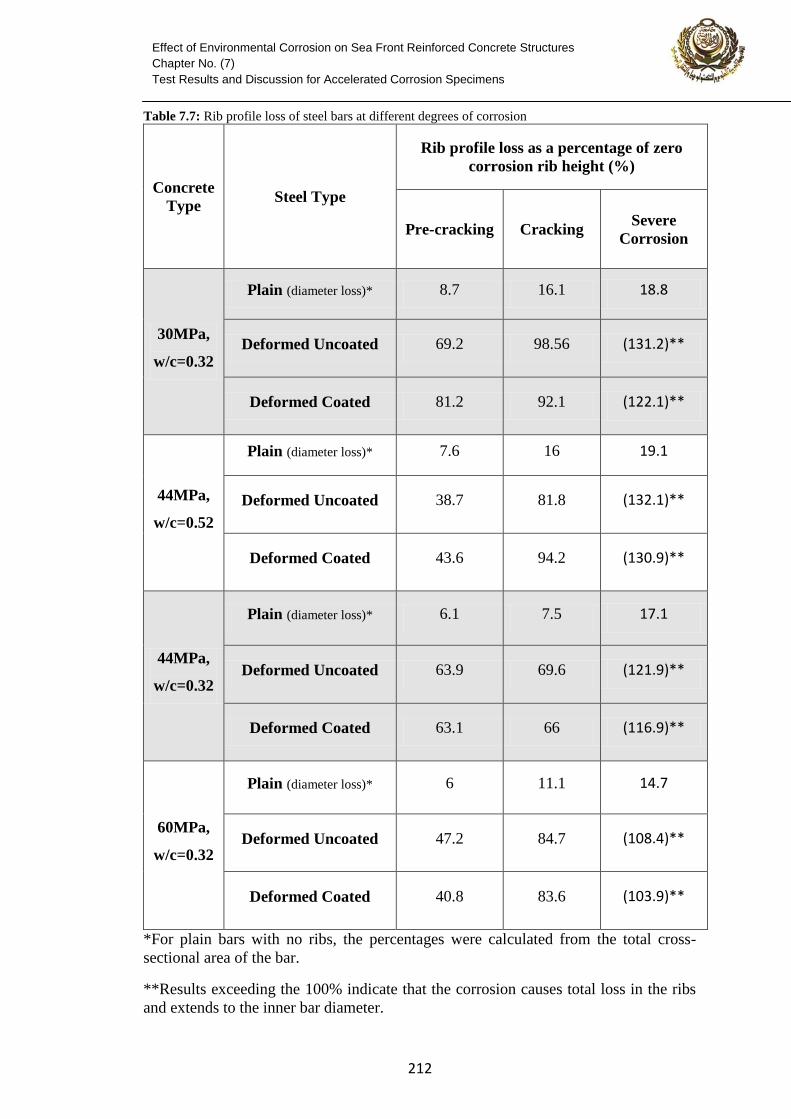
7.5 Effect of Corrosion on Concrete Reinforcement Physical Properties
The effect of corrosion on steel bars physical properties was studied including
the mass and rib loss for each type of steel at different degrees of corrosion. The mass
loss was obtained as the difference between the mass of the corroded bar, after
removal of the loose corrosion products, and its mass before corrosion. The ribs
height were measured after the corrosion took place, and the rib profile loss was
obtained as the difference between the rib height of the corroded bar and its height
161
Effect of Environmental Corrosion on Sea Front Reinforced Concrete Structures
Chapter No. (7)
Test Results and Discussion for Accelerated Corrosion Specimens
before corrosion. Tables 7.6 and 7.7 show the mass and rib profile loss of steel bars at
different corrosion stages respectively.
From Table 7.6 it can be observed that the mass loss is greater in case of the
[30MPa] and [44MPa, 0.52 w/c] mixes. The 60MPa mix showed the least mass loss
percentage. This can be attributed to its high resistivity to corrosion, and when
corrosion initiated it cracked suddenly at a low percentage of corrosion products.
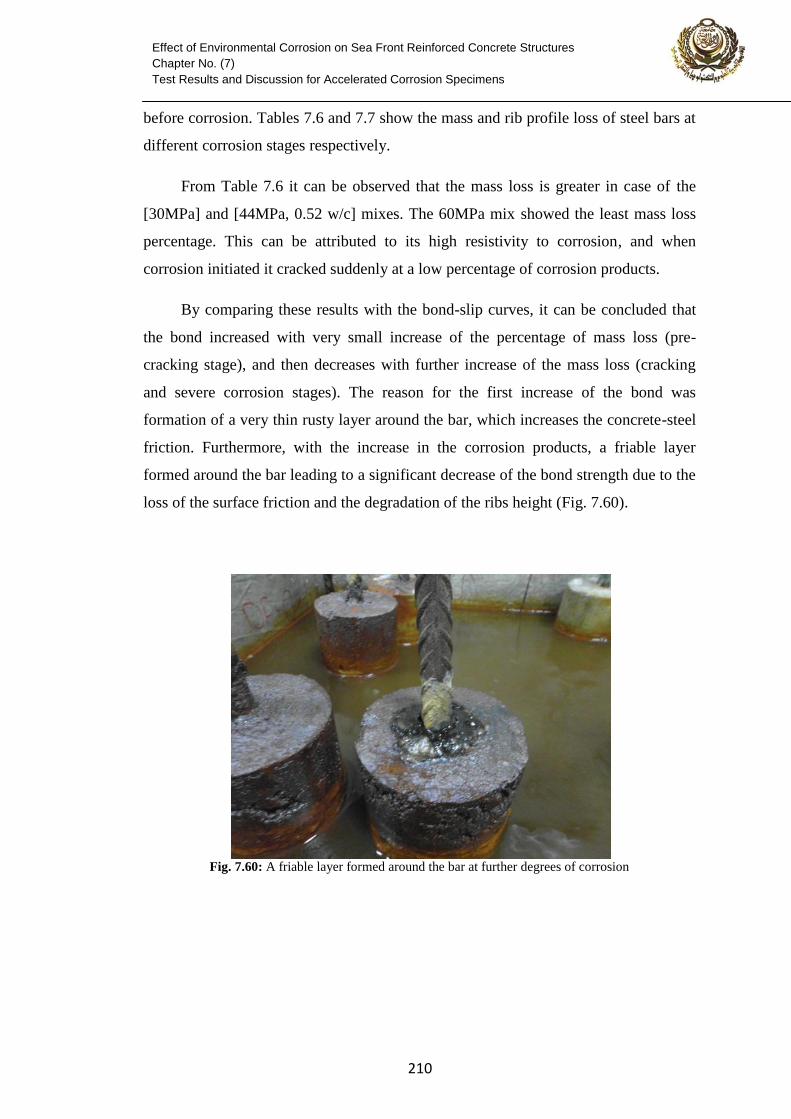
By comparing these results with the bond-slip curves, it can be concluded that
the bond increased with very small increase of the percentage of mass loss (pre-
cracking stage), and then decreases with further increase of the mass loss (cracking
and severe corrosion stages). The reason for the first increase of the bond was
formation of a very thin rusty layer around the bar, which increases the concrete-steel
friction. Furthermore, with the increase in the corrosion products, a friable layer
formed around the bar leading to a significant decrease of the bond strength due to the
loss of the surface friction and the degradation of the ribs height (Fig. 7.60).
Fig. 7.60: A friable layer formed around the bar at further degrees of corrosion
166
Effect of Environmental Corrosion on Sea Front Reinforced Concrete Structures
Chapter No. (7)
Test Results and Discussion for Accelerated Corrosion Specimens
Table 7.6: Mass loss of steel bars at different degrees of corrosion
Concrete
Type Steel Type
Mass loss as a percentage of zero
corrosion mass (%)
Pre-cracking Cracking Severe
Corrosion
30MPa,
w/c=0.32
Plain 0.8 2.6 3.5
Deformed Uncoated 1.2 2.9 4.2
Deformed Coated 1.6 2.4 3.6
44MPa,
w/c=0.52
Plain 0.6 2.6 3.7
Deformed Uncoated 0.4 1.6 4.2
Deformed Coated 0.5 2.9 4.1
44MPa,
w/c=0.32
Plain 0.4 0.6 2.9
Deformed Uncoated 1 1.2 3.6
Deformed Coated 1 1.1 3.3
60MPa,
w/c=0.32
Plain 0.4 1.2 2.2
Deformed Uncoated 0.5 1.7 2.9
Deformed Coated 0.4 1.7 2.6
161
Effect of Environmental Corrosion on Sea Front Reinforced Concrete Structures
Chapter No. (7)
Test Results and Discussion for Accelerated Corrosion Specimens
Table 7.7: Rib profile loss of steel bars at different degrees of corrosion
Concrete
Type Steel Type
Rib profile loss as a percentage of zero
corrosion rib height (%)
Pre-cracking Cracking Severe
Corrosion
30MPa,
w/c=0.32
Plain (diameter loss)* 8.7 16.1 18.8
Deformed Uncoated 69.2 98.56 (131.2)**
Deformed Coated 81.2 92.1 (122.1)**
44MPa,
w/c=0.52
Plain (diameter loss)* 7.6 16 19.1
Deformed Uncoated 38.7 81.8 (132.1)**
Deformed Coated 43.6 94.2 (130.9)**
44MPa,
w/c=0.32
Plain (diameter loss)* 6.1 7.5 17.1
Deformed Uncoated 63.9 69.6 (121.9)**
Deformed Coated 63.1 66 (116.9)**
60MPa,
w/c=0.32
Plain (diameter loss)* 6 11.1 14.7
Deformed Uncoated 47.2 84.7 (108.4)**
Deformed Coated 40.8 83.6 (103.9)**
*For plain bars with no ribs, the percentages were calculated from the total cross-
sectional area of the bar.
**Results exceeding the 100% indicate that the corrosion causes total loss in the ribs
and extends to the inner bar diameter.
312
Effect of Environmental Corrosion on Sea Front Reinforced Concrete Structures
Chapter No. (8)
A Numerical Model for Steel-Concrete Bond
A Numerical Model for Steel-Concrete Bond
8.1 Background
The bond between the concrete and reinforcing steel in RC structures allows
longitudinal forces to be transferred from the reinforcement to the surrounding
concrete. When studying cracked reinforced concrete, characterization of the bond
behavior is one of the most important issues. Once a crack develops, the concrete
stress near the crack is relieved, but the tension in steel can increase considerably. The
high level of steel stress at the crack is transferred to the surrounding concrete through
the interfacial bond (Won 1991).
This chapter describes an attempt to model the bond-slip relationship between
concrete and rebar using the finite element software package ABAQUS.
ABAQUS, a suite of software application for finite element analysis and
computer aided engineering, originally released in 1978. It is based on the finite
element method that can solve problems ranging from relatively simple linear analysis
to the most challenging nonlinear simulations (ABAQUS 6.9-1). Abaqus provides a
variety of interactions methods for connecting two parts together.
8.2 Objective
The primary objectives of this chapter are to develop a finite element model
which could correctly simulate the bond-slip relationship in a reinforced concrete
member, to accurately predict the level of stress transferred by the bond, and to show
how to introduce the effect of corrosion of steel reinforcement on the bond strength of
RC members. This model will be based on the results obtained from the physical
model of the pull-out samples. Other objectives are comparing previous RC models
312
Effect of Environmental Corrosion on Sea Front Reinforced Concrete Structures
Chapter No. (8)
A Numerical Model for Steel-Concrete Bond
that included bond behavior, and to select the best modeling techniques available to
accurately reflect the bond behavior.
8.3 Literature Review
The action of the steel/concrete bond is a complex force transfer phenomenon
occurring between the reinforcing steel and the surrounding concrete in RC members.
The existence of the bond is essential for these two materials to behave as a kind of
composite material. Without bond, the rebar would not be able to resist external loads,
and the RC member would behave exactly like a plain concrete member does.
The connection between the reinforcing bars and the concrete is also responsible
for controlling of the crack opening behavior in an RC member (Filho et al 2004).
Between significant cracks, the concrete still works and will absorb part of the tensile
load from the rebar because the bond allows the load transfer between these two
materials. Consequently, the strains resulting in the rebar are smaller than those that
would be experienced under the same load in a single bar that is not embedded in
concrete. This mechanism, attributed to the bond, reduces the width of the cracks that
develop and increases the stiffness of the structure (Xin Li 2007).
Because of its importance, many researches have been conducted to characterize
the constitutive bond-slip relationship. In the finite element analysis field, many
different methods were also employed to represent the nature of the interaction
between the concrete and reinforcement.
For better use of the bond mechanism in practical design and analysis, the bond
slip relationship has been simplified to a linear or bilinear curve by many researchers.
Several bilinear models were developed, such as the three segments model (Nilson
1972), the five segments model (Guo & Shi 2003), and the six segments model
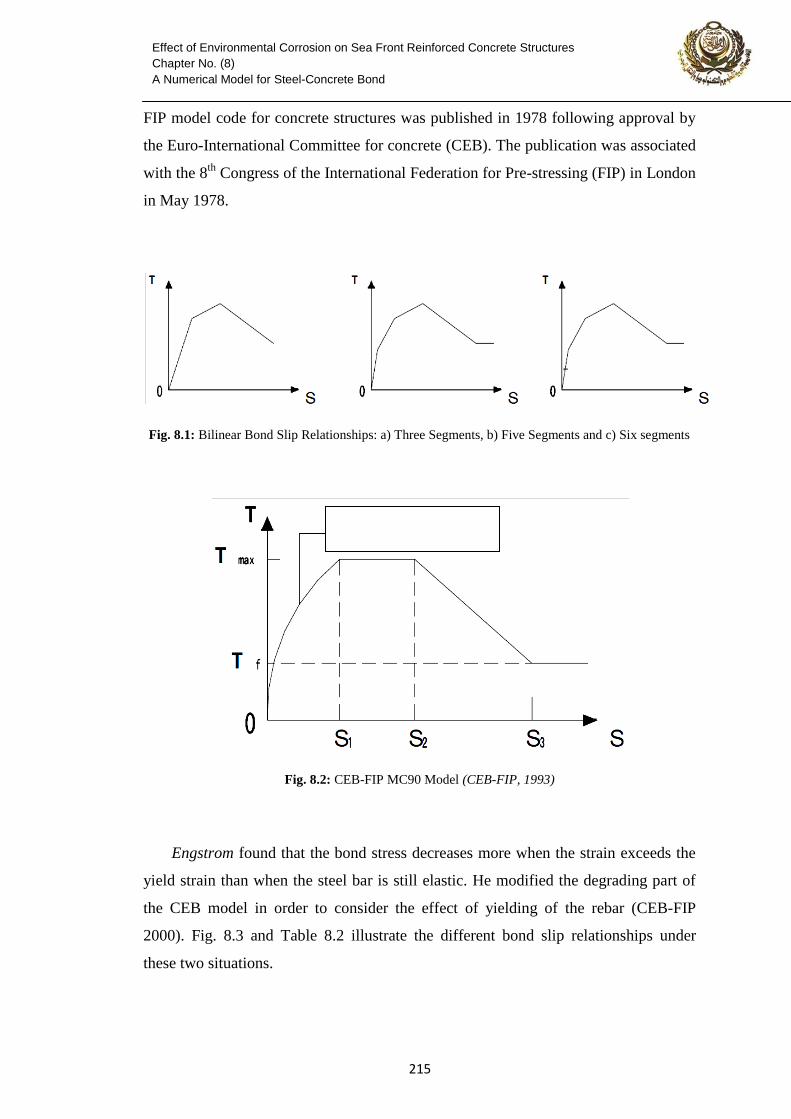
(Tassios 1982); Fig. 8.1 illustrates these three models. In Fig. 8.1, τ represents the
bond stress, while S represents the magnitude of bond slip. The CEB-FIP MC90
suggested a four segments model, as shown in Fig. 8.2; Table 8.1 shows the
characteristic values for the different parameters specified in this model. The CEB-
312
Effect of Environmental Corrosion on Sea Front Reinforced Concrete Structures
Chapter No. (8)
A Numerical Model for Steel-Concrete Bond
FIP model code for concrete structures was published in 1978 following approval by
the Euro-International Committee for concrete (CEB). The publication was associated
with the 8th
Congress of the International Federation for Pre-stressing (FIP) in London
in May 1978.
Fig. 8.1: Bilinear Bond Slip Relationships: a) Three Segments, b) Five Segments and c) Six segments
Fig. 8.2: CEB-FIP MC90 Model (CEB-FIP, 1993)
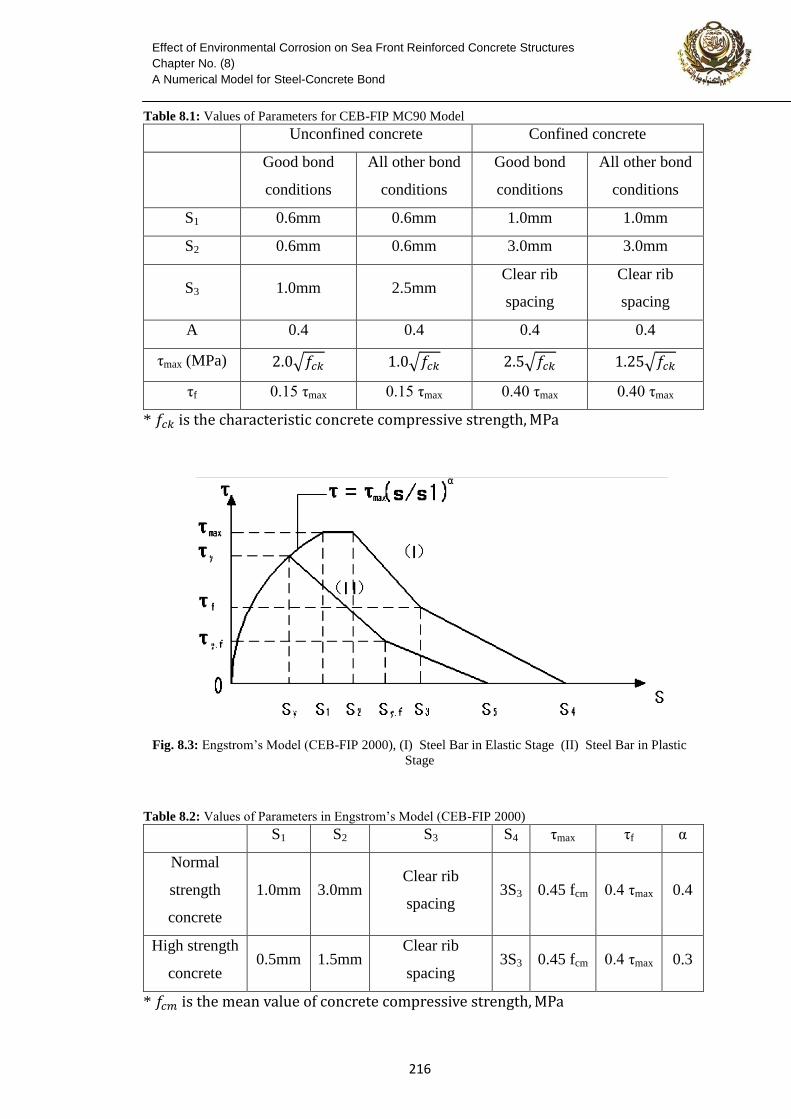
Engstrom found that the bond stress decreases more when the strain exceeds the
yield strain than when the steel bar is still elastic. He modified the degrading part of
the CEB model in order to consider the effect of yielding of the rebar (CEB-FIP
2000). Fig. 8.3 and Table 8.2 illustrate the different bond slip relationships under
these two situations.
312
Effect of Environmental Corrosion on Sea Front Reinforced Concrete Structures
Chapter No. (8)
A Numerical Model for Steel-Concrete Bond
Table 8.1: Values of Parameters for CEB-FIP MC90 Model
Unconfined concrete Confined concrete
Good bond
conditions
All other bond
conditions
Good bond
conditions
All other bond
conditions
S1 0.6mm 0.6mm 1.0mm 1.0mm
S2 0.6mm 0.6mm 3.0mm 3.0mm
S3 1.0mm 2.5mm Clear rib
spacing
Clear rib
spacing
A 0.4 0.4 0.4 0.4
τmax (MPa)
τf 0.15 τmax 0.15 τmax 0.40 τmax 0.40 τmax
*
Fig. 8.3: Engstrom’s Model (CEB-FIP 2000), (I) Steel Bar in Elastic Stage (II) Steel Bar in Plastic
Stage
Table 8.2: Values of Parameters in Engstrom’s Model (CEB-FIP 2000)
S1 S2 S3 S4 τmax τf α
Normal
strength
concrete
1.0mm 3.0mm Clear rib
spacing 3S3 0.45 fcm 0.4 τmax 0.4
High strength
concrete 0.5mm 1.5mm
Clear rib
spacing 3S3 0.45 fcm 0.4 τmax 0.3
*
312
Effect of Environmental Corrosion on Sea Front Reinforced Concrete Structures
Chapter No. (8)
A Numerical Model for Steel-Concrete Bond
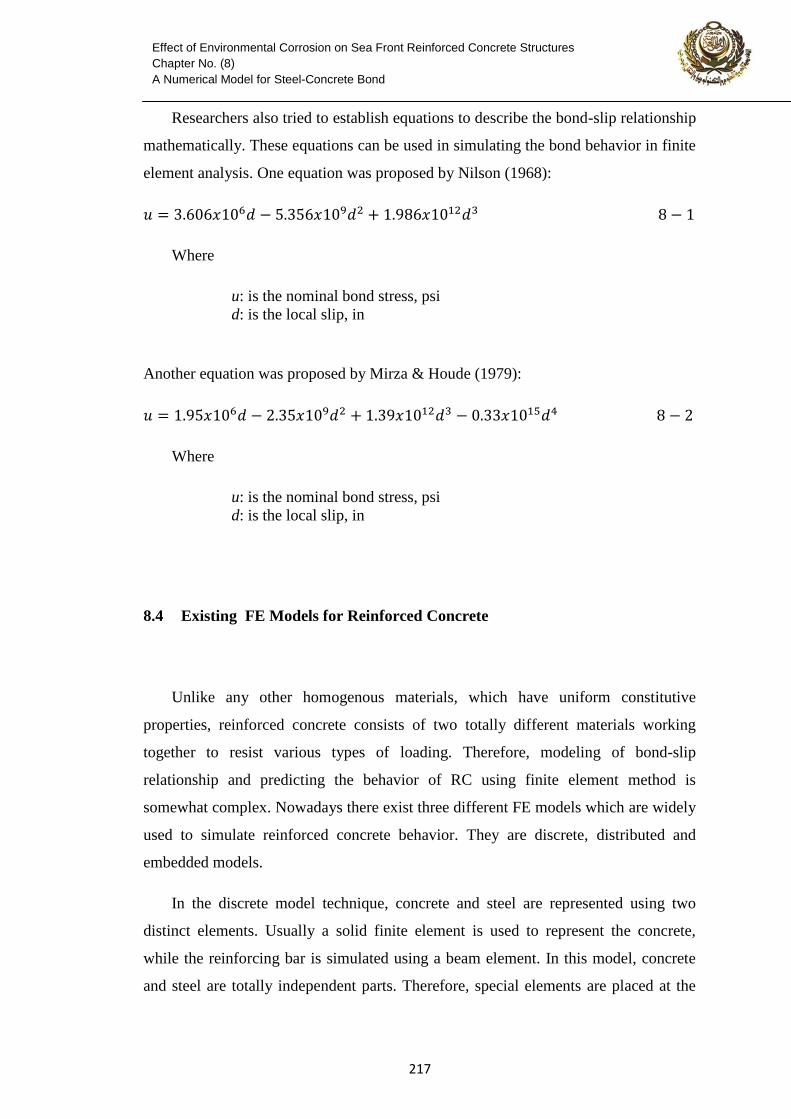
Researchers also tried to establish equations to describe the bond-slip relationship
mathematically. These equations can be used in simulating the bond behavior in finite
element analysis. One equation was proposed by Nilson (1968):
Where
u: is the nominal bond stress, psi
d: is the local slip, in
Another equation was proposed by Mirza & Houde (1979):
Where
u: is the nominal bond stress, psi
d: is the local slip, in
8.4 Existing FE Models for Reinforced Concrete
Unlike any other homogenous materials, which have uniform constitutive
properties, reinforced concrete consists of two totally different materials working
together to resist various types of loading. Therefore, modeling of bond-slip
relationship and predicting the behavior of RC using finite element method is
somewhat complex. Nowadays there exist three different FE models which are widely
used to simulate reinforced concrete behavior. They are discrete, distributed and
embedded models.
In the discrete model technique, concrete and steel are represented using two
distinct elements. Usually a solid finite element is used to represent the concrete,
while the reinforcing bar is simulated using a beam element. In this model, concrete
and steel are totally independent parts. Therefore, special elements are placed at the
312
Effect of Environmental Corrosion on Sea Front Reinforced Concrete Structures
Chapter No. (8)
A Numerical Model for Steel-Concrete Bond
interface between the concrete and steel to represent the bond mechanism between the
two materials (Xin Li 2007).
When using the embedded modeling technique, the rebar is considered as an axial
member that is built into the concrete element. Therefore, the rebar will have the same
displacement as concrete. For this reason, it is said that this technique considered the
bond between the concrete and the rebar to be perfect. In other words, the two
materials are assumed to work together completely as one unit (ASCE 1982).
In the distributed modeling technique, the reinforcement is assumed to be
smeared into every element of the concrete. The rebar is transferred to an equivalent
amount of concrete and the reinforced concrete is considered as homogenous material
in this model. Perfect bond is again assumed in this technique (Xin Li 2007).
Due to its simplicity of implementation, the distributed model is frequently used
in practical structural design and analysis. However, the internal forces of the
reinforcement bar can’t be quantified in this model since the steel has been smeared.
The discrete model is the only model of the three which can consider the bond slip
mechanism directly because the concrete and steel are two separate entities, so it is
very useful in more accurate RC simulations, despite the fact that the modeling
process for this technique is the most complex. The embedded modeling technique
falls between the distributed and discrete model in terms of complexity and ease of
implementation.
Currently, most finite elements software packages such as ABAQUS, ADINA,
ANSYS, and MSC/NASTRAN have their own concrete constitutive models and
corresponding concrete and rebar elements. The issue is how to develop the three
previous models using the combination of these elements and how to represent the
bond, fracture and cracking behaviors..
312
Effect of Environmental Corrosion on Sea Front Reinforced Concrete Structures
Chapter No. (8)
A Numerical Model for Steel-Concrete Bond
8.5 Finite Element Modeling of Bond
In order to overcome the problem of considering the bond between concrete and
steel rebar as if it is perfect, some dedicated elements have been developed to simulate
the contact between concrete and rebar and presently they are widely used in the
commercial finite element software.
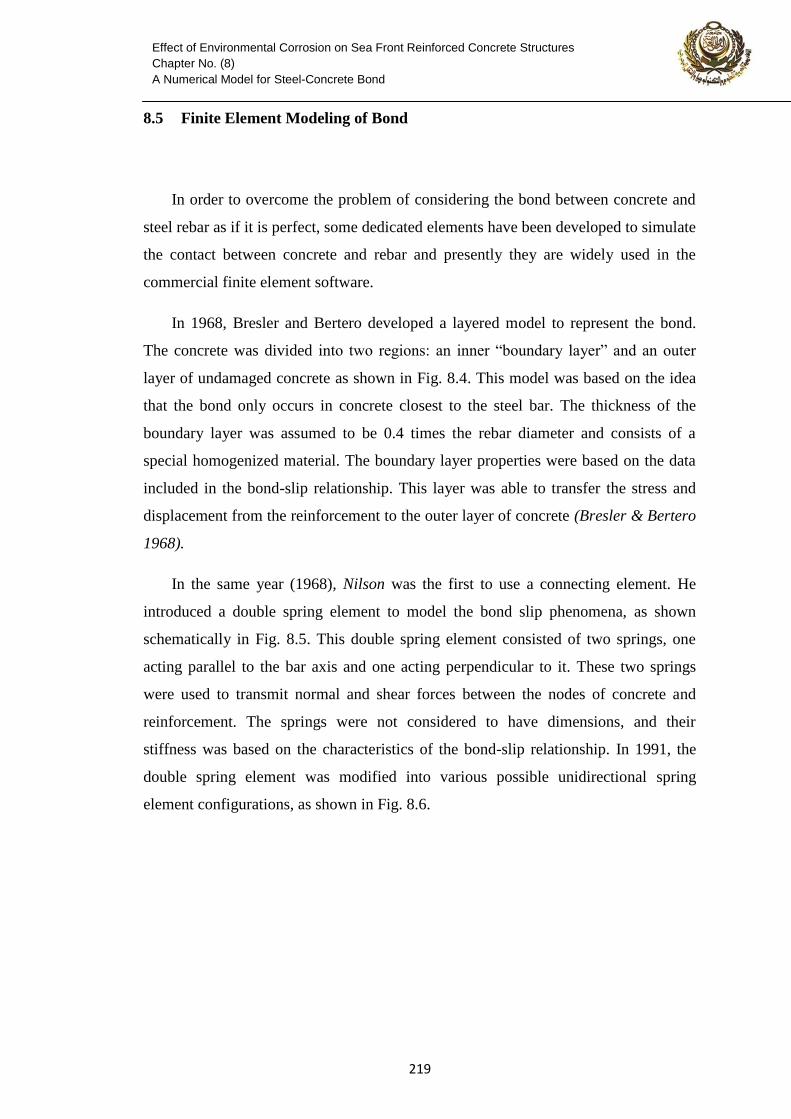
In 1968, Bresler and Bertero developed a layered model to represent the bond.
The concrete was divided into two regions: an inner “boundary layer” and an outer
layer of undamaged concrete as shown in Fig. 8.4. This model was based on the idea
that the bond only occurs in concrete closest to the steel bar. The thickness of the
boundary layer was assumed to be 0.4 times the rebar diameter and consists of a
special homogenized material. The boundary layer properties were based on the data
included in the bond-slip relationship. This layer was able to transfer the stress and
displacement from the reinforcement to the outer layer of concrete (Bresler & Bertero
1968).
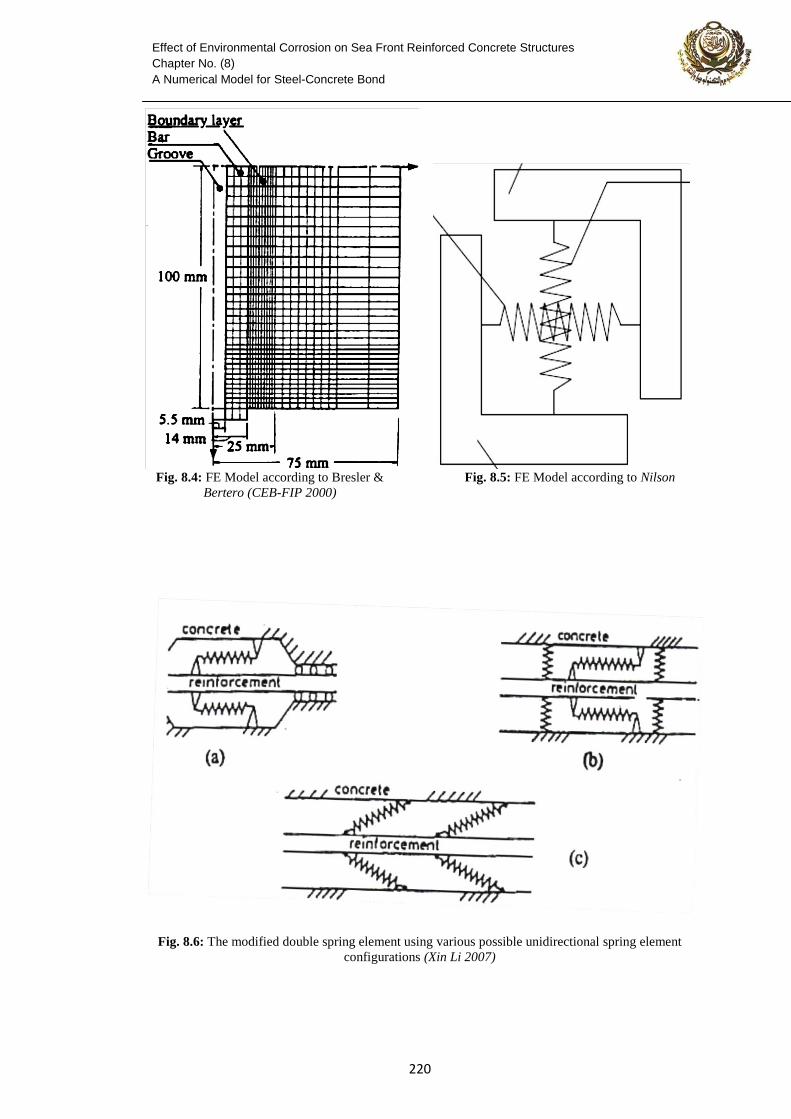
In the same year (1968), Nilson was the first to use a connecting element. He
introduced a double spring element to model the bond slip phenomena, as shown
schematically in Fig. 8.5. This double spring element consisted of two springs, one
acting parallel to the bar axis and one acting perpendicular to it. These two springs
were used to transmit normal and shear forces between the nodes of concrete and
reinforcement. The springs were not considered to have dimensions, and their
stiffness was based on the characteristics of the bond-slip relationship. In 1991, the
double spring element was modified into various possible unidirectional spring
element configurations, as shown in Fig. 8.6.
332
Effect of Environmental Corrosion on Sea Front Reinforced Concrete Structures
Chapter No. (8)
A Numerical Model for Steel-Concrete Bond
Fig. 8.4: FE Model according to Bresler &
Bertero (CEB-FIP 2000)
Fig. 8.5: FE Model according to Nilson
Fig. 8.6: The modified double spring element using various possible unidirectional spring element
configurations (Xin Li 2007)
331
Effect of Environmental Corrosion on Sea Front Reinforced Concrete Structures
Chapter No. (8)
A Numerical Model for Steel-Concrete Bond
8.6 Proposed Model
Fracture and crack propagation in concrete depends to a large extent on the
material properties in tension and the post-cracking behavior. Experimental studies
(Welch and Haisman 1969; Bedard and Kotsovos 1986) indicate that the behavior of
concrete after cracking is not completely brittle and that cracked region exhibits some
ductility. As the applied loads are increased the tensile stress in the critical cross
section of the member reaches the tensile strength (ft).
The proposed FE model in this study consists of three contact parts: the steel bar,
the concrete cylinder and an intermediate part that acts as the interface between the
concrete and the reinforcement bar. The model shows the effect of reinforcement
corrosion on the stresses in concrete. In this study, the bond between steel and
concrete is simulated using intermediate elements and the corrosion effect is
introduced as thermal expansion in the steel bar which causes internal stresses in the
concrete leading to tensile cracks.
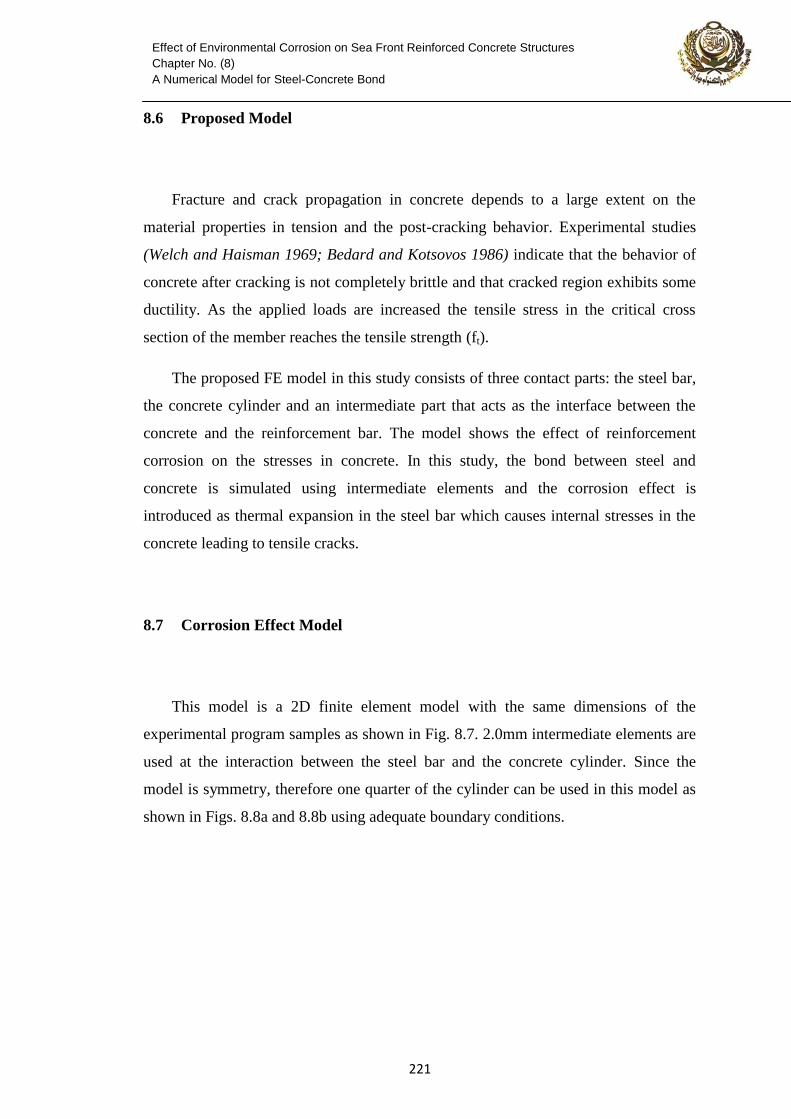
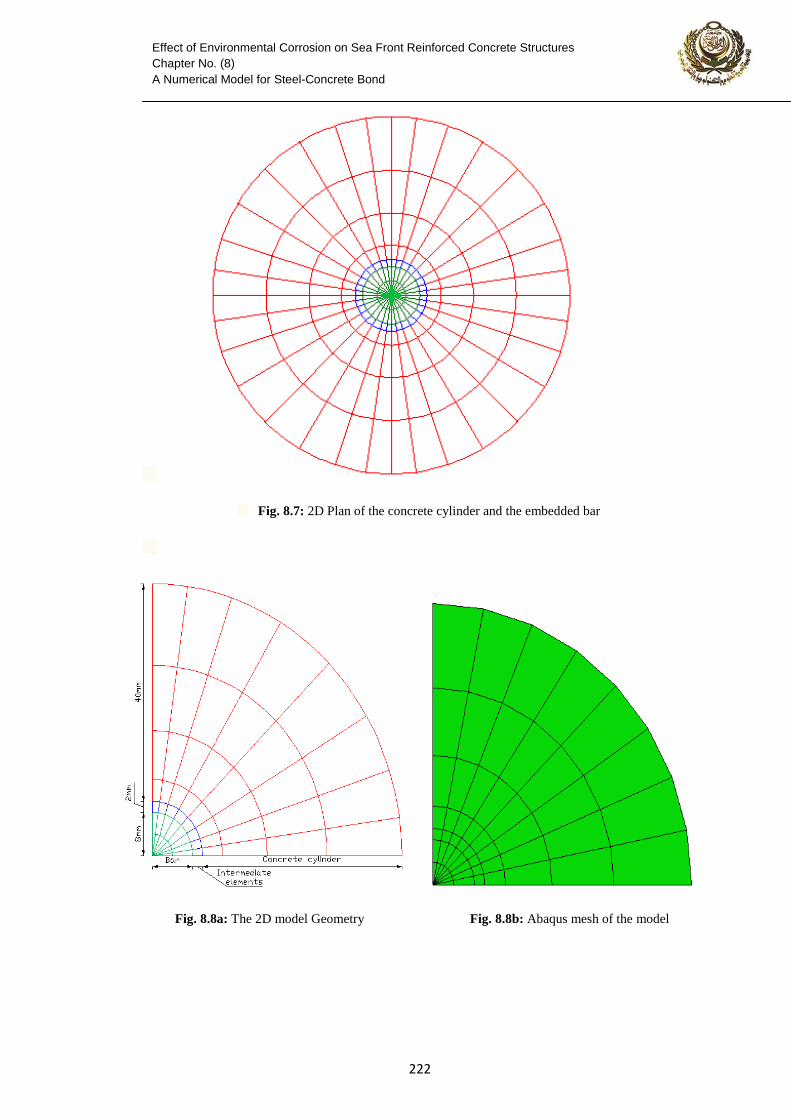
8.7 Corrosion Effect Model
This model is a 2D finite element model with the same dimensions of the
experimental program samples as shown in Fig. 8.7. 2.0mm intermediate elements are
used at the interaction between the steel bar and the concrete cylinder. Since the
model is symmetry, therefore one quarter of the cylinder can be used in this model as
shown in Figs. 8.8a and 8.8b using adequate boundary conditions.
333
Effect of Environmental Corrosion on Sea Front Reinforced Concrete Structures
Chapter No. (8)
A Numerical Model for Steel-Concrete Bond
Fig. 8.7: 2D Plan of the concrete cylinder and the embedded bar
Fig. 8.8a: The 2D model Geometry Fig. 8.8b: Abaqus mesh of the model
332
Effect of Environmental Corrosion on Sea Front Reinforced Concrete Structures
Chapter No. (8)
A Numerical Model for Steel-Concrete Bond
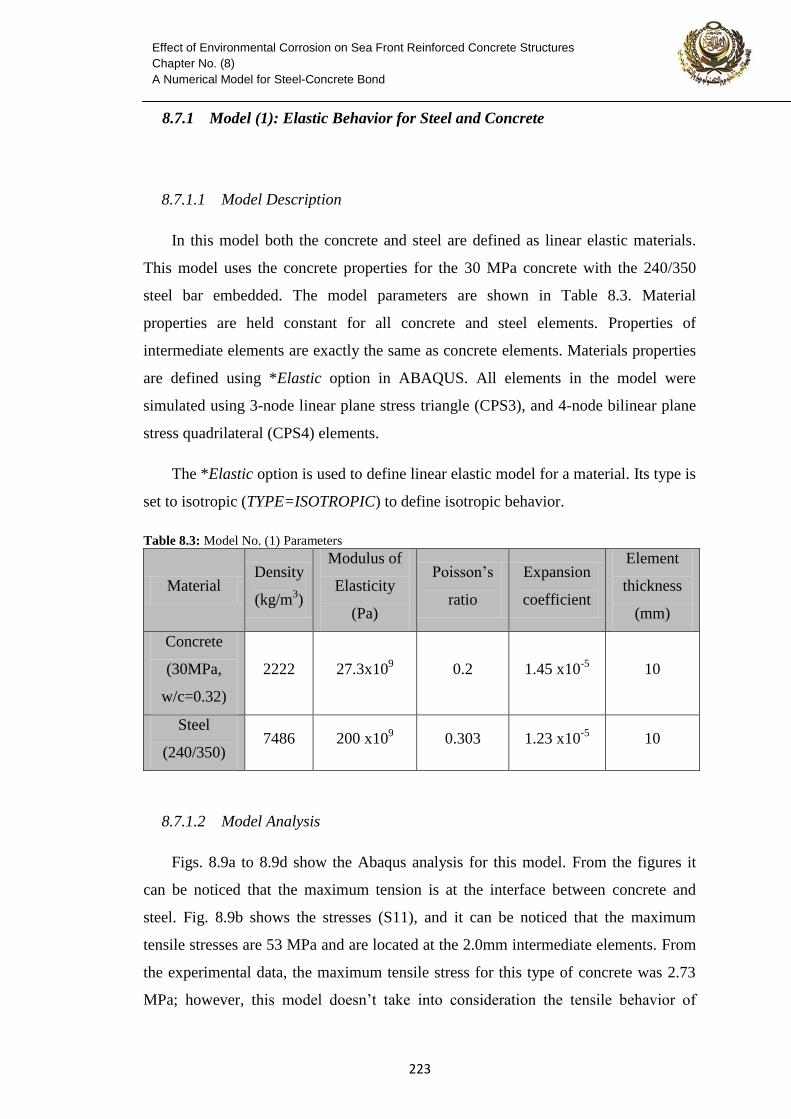
8.7.1 Model (1): Elastic Behavior for Steel and Concrete
8.7.1.1 Model Description
In this model both the concrete and steel are defined as linear elastic materials.
This model uses the concrete properties for the 30 MPa concrete with the 240/350
steel bar embedded. The model parameters are shown in Table 8.3. Material
properties are held constant for all concrete and steel elements. Properties of
intermediate elements are exactly the same as concrete elements. Materials properties
are defined using *Elastic option in ABAQUS. All elements in the model were
simulated using 3-node linear plane stress triangle (CPS3), and 4-node bilinear plane
stress quadrilateral (CPS4) elements.
The *Elastic option is used to define linear elastic model for a material. Its type is
set to isotropic (TYPE=ISOTROPIC) to define isotropic behavior.
Table 8.3: Model No. (1) Parameters
Material Density
(kg/m3)
Modulus of
Elasticity
(Pa)
Poisson’s
ratio
Expansion
coefficient
Element
thickness
(mm)
Concrete
(30MPa,
w/c=0.32)
2222 27.3x10⁹ 0.2 1.45 x10
-5 10
Steel
(240/350) 7486 200 x10
9 0.303 1.23 x10
-5 10
8.7.1.2 Model Analysis
Figs. 8.9a to 8.9d show the Abaqus analysis for this model. From the figures it
can be noticed that the maximum tension is at the interface between concrete and
steel. Fig. 8.9b shows the stresses (S11), and it can be noticed that the maximum
tensile stresses are 53 MPa and are located at the 2.0mm intermediate elements. From
the experimental data, the maximum tensile stress for this type of concrete was 2.73
MPa; however, this model doesn’t take into consideration the tensile behavior of
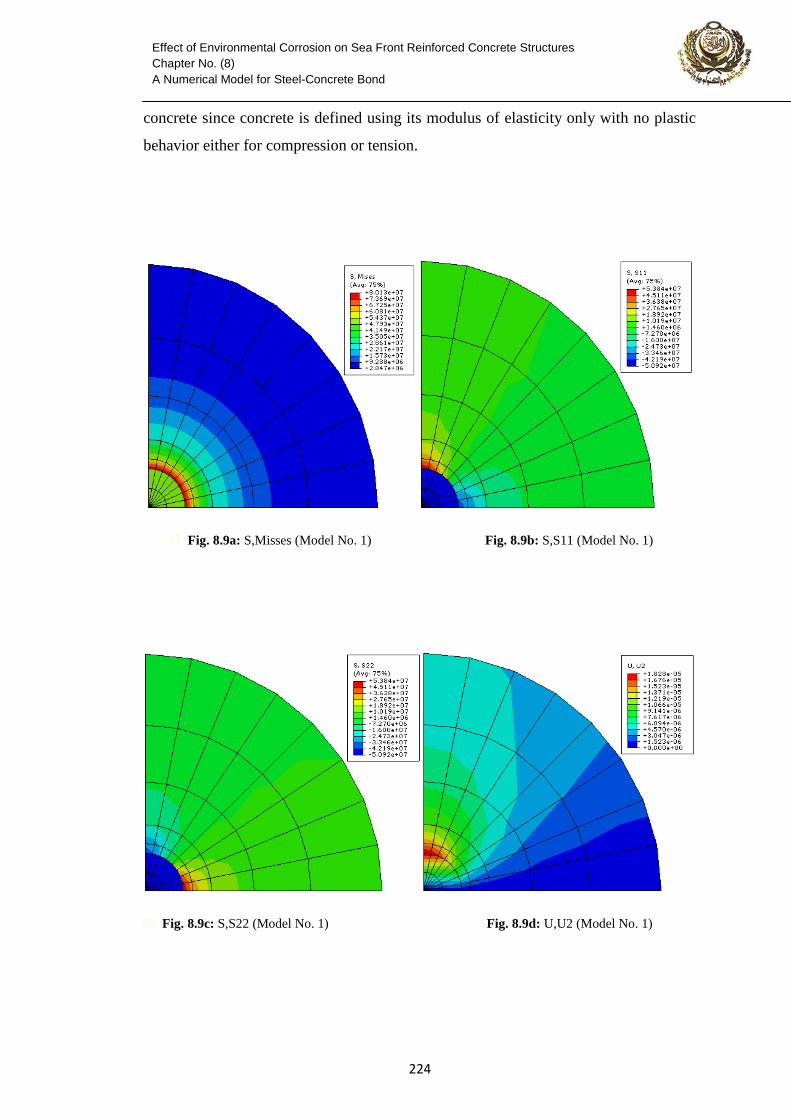
332
Effect of Environmental Corrosion on Sea Front Reinforced Concrete Structures
Chapter No. (8)
A Numerical Model for Steel-Concrete Bond
concrete since concrete is defined using its modulus of elasticity only with no plastic
behavior either for compression or tension.
Fig. 8.9a: S,Misses (Model No. 1) Fig. 8.9b: S,S11 (Model No. 1)
Fig. 8.9c: S,S22 (Model No. 1) Fig. 8.9d: U,U2 (Model No. 1)
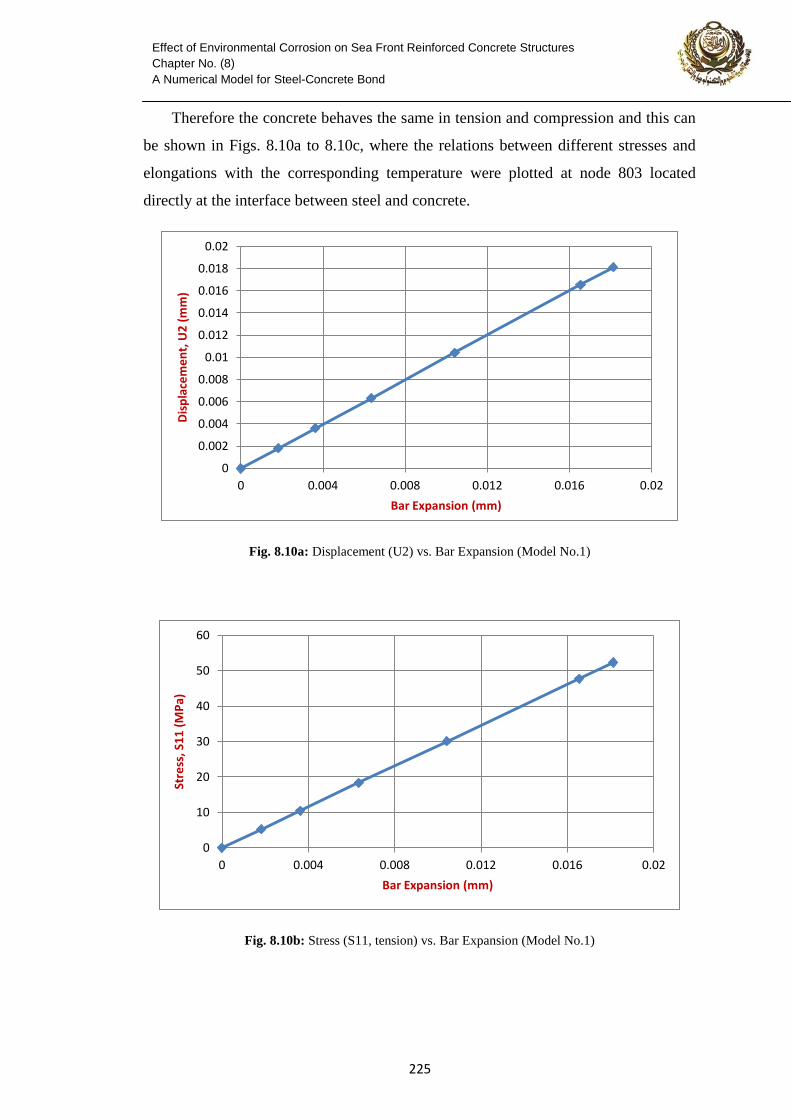
332
Effect of Environmental Corrosion on Sea Front Reinforced Concrete Structures
Chapter No. (8)
A Numerical Model for Steel-Concrete Bond
Therefore the concrete behaves the same in tension and compression and this can
be shown in Figs. 8.10a to 8.10c, where the relations between different stresses and
elongations with the corresponding temperature were plotted at node 803 located
directly at the interface between steel and concrete.
Fig. 8.10a: Displacement (U2) vs. Bar Expansion (Model No.1)
Fig. 8.10b: Stress (S11, tension) vs. Bar Expansion (Model No.1)
0
0.002
0.004
0.006
0.008
0.01
0.012
0.014
0.016
0.018
0.02
0 0.004 0.008 0.012 0.016 0.02
Dis
pla
cem
en
t, U
2 (
mm
)
Bar Expansion (mm)
0
10
20
30
40
50
60
0 0.004 0.008 0.012 0.016 0.02
Stre
ss, S
11
(M
Pa)
Bar Expansion (mm)
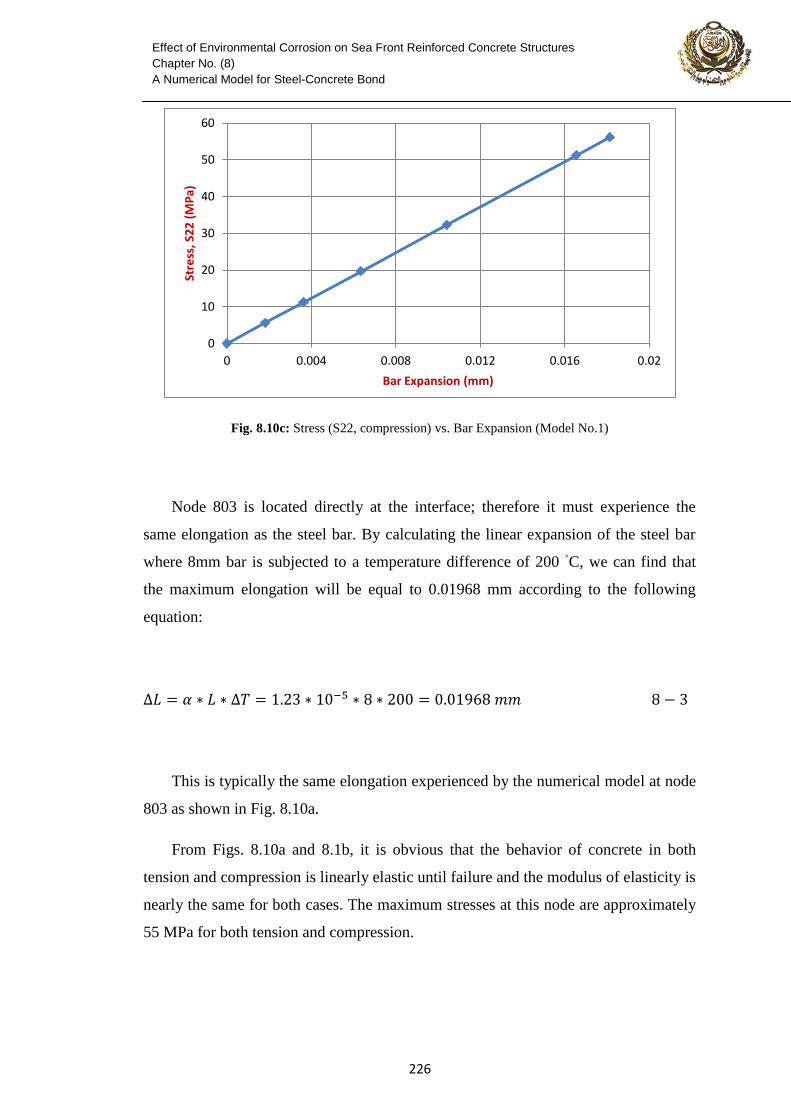
332
Effect of Environmental Corrosion on Sea Front Reinforced Concrete Structures
Chapter No. (8)
A Numerical Model for Steel-Concrete Bond
Fig. 8.10c: Stress (S22, compression) vs. Bar Expansion (Model No.1)
Node 803 is located directly at the interface; therefore it must experience the
same elongation as the steel bar. By calculating the linear expansion of the steel bar
where 8mm bar is subjected to a temperature difference of 200 ◦C, we can find that
the maximum elongation will be equal to 0.01968 mm according to the following
equation:
This is typically the same elongation experienced by the numerical model at node
803 as shown in Fig. 8.10a.
From Figs. 8.10a and 8.1b, it is obvious that the behavior of concrete in both
tension and compression is linearly elastic until failure and the modulus of elasticity is
nearly the same for both cases. The maximum stresses at this node are approximately
55 MPa for both tension and compression.
0
10
20
30
40
50
60
0 0.004 0.008 0.012 0.016 0.02
Stre
ss, S
22
(M
Pa)
Bar Expansion (mm)
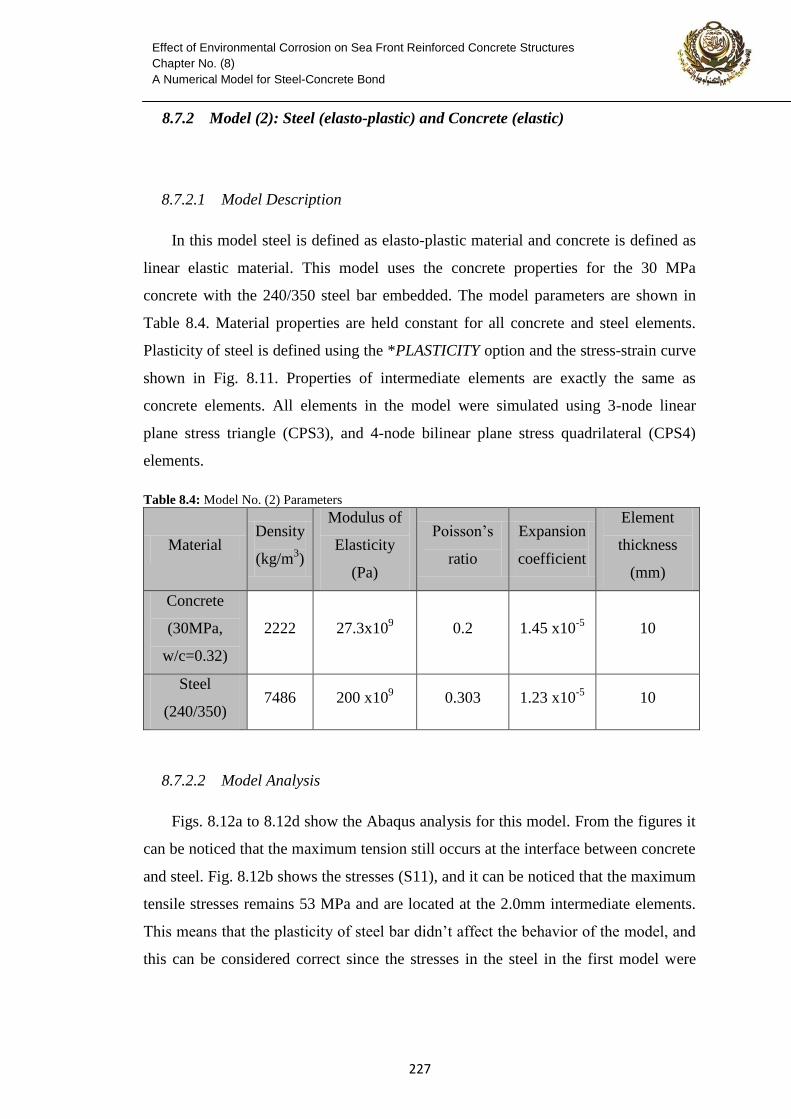
332
Effect of Environmental Corrosion on Sea Front Reinforced Concrete Structures
Chapter No. (8)
A Numerical Model for Steel-Concrete Bond
8.7.2 Model (2): Steel (elasto-plastic) and Concrete (elastic)
8.7.2.1 Model Description
In this model steel is defined as elasto-plastic material and concrete is defined as
linear elastic material. This model uses the concrete properties for the 30 MPa
concrete with the 240/350 steel bar embedded. The model parameters are shown in
Table 8.4. Material properties are held constant for all concrete and steel elements.
Plasticity of steel is defined using the *PLASTICITY option and the stress-strain curve
shown in Fig. 8.11. Properties of intermediate elements are exactly the same as
concrete elements. All elements in the model were simulated using 3-node linear
plane stress triangle (CPS3), and 4-node bilinear plane stress quadrilateral (CPS4)
elements.
Table 8.4: Model No. (2) Parameters
Material Density
(kg/m3)
Modulus of
Elasticity
(Pa)
Poisson’s
ratio
Expansion
coefficient
Element
thickness
(mm)
Concrete
(30MPa,
w/c=0.32)
2222 27.3x10⁹ 0.2 1.45 x10
-5 10
Steel
(240/350) 7486 200 x10
9 0.303 1.23 x10
-5 10
8.7.2.2 Model Analysis
Figs. 8.12a to 8.12d show the Abaqus analysis for this model. From the figures it
can be noticed that the maximum tension still occurs at the interface between concrete
and steel. Fig. 8.12b shows the stresses (S11), and it can be noticed that the maximum
tensile stresses remains 53 MPa and are located at the 2.0mm intermediate elements.
This means that the plasticity of steel bar didn’t affect the behavior of the model, and
this can be considered correct since the stresses in the steel in the first model were
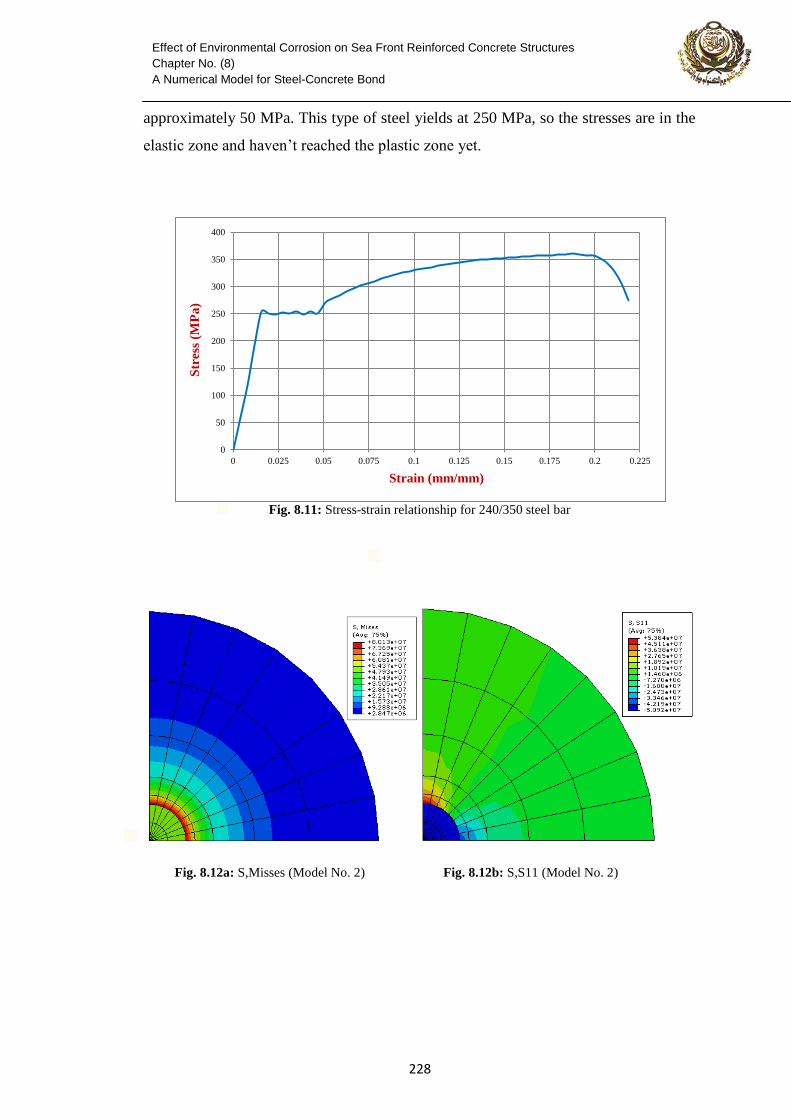
332
Effect of Environmental Corrosion on Sea Front Reinforced Concrete Structures
Chapter No. (8)
A Numerical Model for Steel-Concrete Bond
approximately 50 MPa. This type of steel yields at 250 MPa, so the stresses are in the
elastic zone and haven’t reached the plastic zone yet.
Fig. 8.11: Stress-strain relationship for 240/350 steel bar
Fig. 8.12a: S,Misses (Model No. 2) Fig. 8.12b: S,S11 (Model No. 2)
0
50
100
150
200
250
300
350
400
0 0.025 0.05 0.075 0.1 0.125 0.15 0.175 0.2 0.225
Str
ess
(MP
a)
Strain (mm/mm)
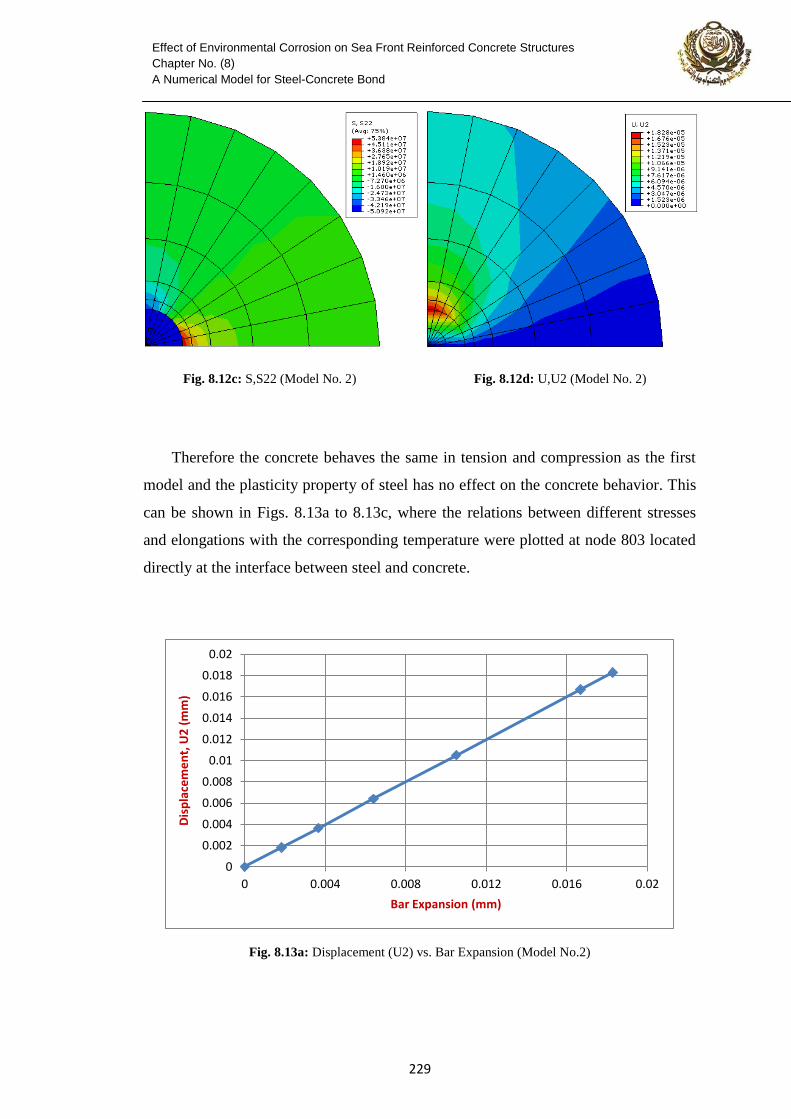
332
Effect of Environmental Corrosion on Sea Front Reinforced Concrete Structures
Chapter No. (8)
A Numerical Model for Steel-Concrete Bond
Fig. 8.12c: S,S22 (Model No. 2) Fig. 8.12d: U,U2 (Model No. 2)
Therefore the concrete behaves the same in tension and compression as the first
model and the plasticity property of steel has no effect on the concrete behavior. This
can be shown in Figs. 8.13a to 8.13c, where the relations between different stresses
and elongations with the corresponding temperature were plotted at node 803 located
directly at the interface between steel and concrete.
Fig. 8.13a: Displacement (U2) vs. Bar Expansion (Model No.2)
0
0.002
0.004
0.006
0.008
0.01
0.012
0.014
0.016
0.018
0.02
0 0.004 0.008 0.012 0.016 0.02
Dis
pla
cem
en
t, U
2 (
mm
)
Bar Expansion (mm)
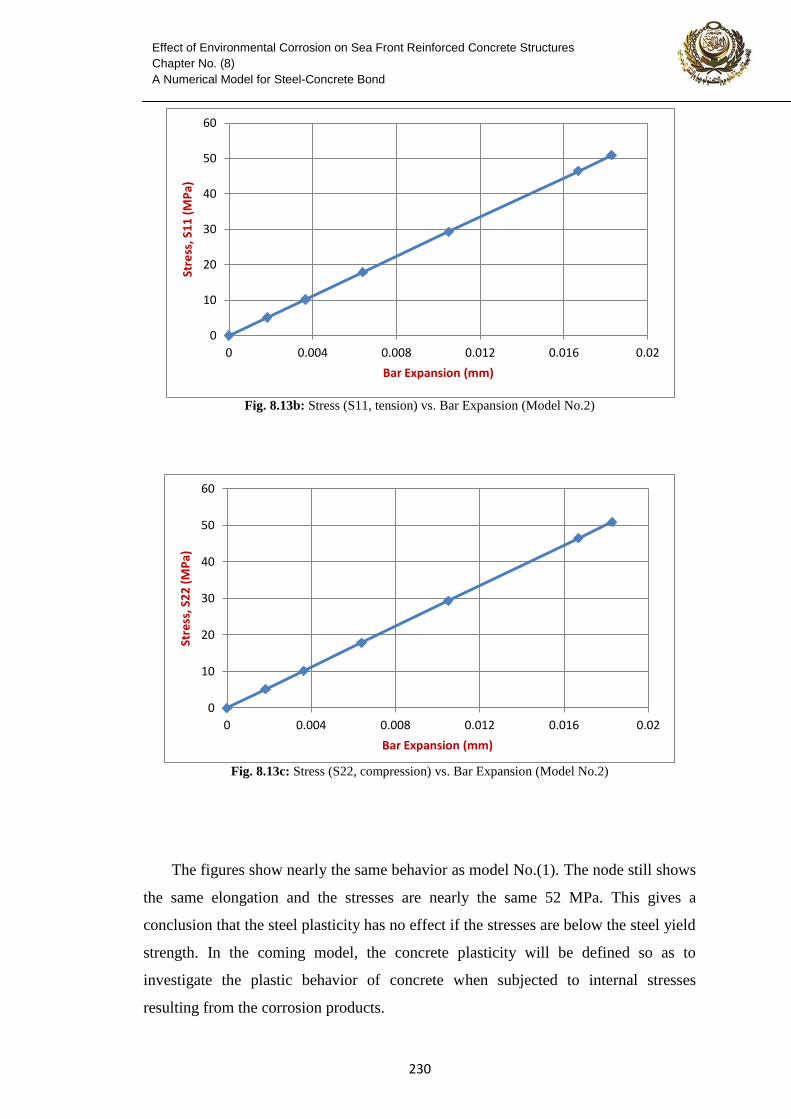
322
Effect of Environmental Corrosion on Sea Front Reinforced Concrete Structures
Chapter No. (8)
A Numerical Model for Steel-Concrete Bond
Fig. 8.13b: Stress (S11, tension) vs. Bar Expansion (Model No.2)
Fig. 8.13c: Stress (S22, compression) vs. Bar Expansion (Model No.2)
The figures show nearly the same behavior as model No.(1). The node still shows
the same elongation and the stresses are nearly the same 52 MPa. This gives a
conclusion that the steel plasticity has no effect if the stresses are below the steel yield
strength. In the coming model, the concrete plasticity will be defined so as to
investigate the plastic behavior of concrete when subjected to internal stresses
resulting from the corrosion products.
0
10
20
30
40
50
60
0 0.004 0.008 0.012 0.016 0.02
Stre
ss, S
11
(M
Pa)
Bar Expansion (mm)
0
10
20
30
40
50
60
0 0.004 0.008 0.012 0.016 0.02
Stre
ss, S
22
(M
Pa)
Bar Expansion (mm)
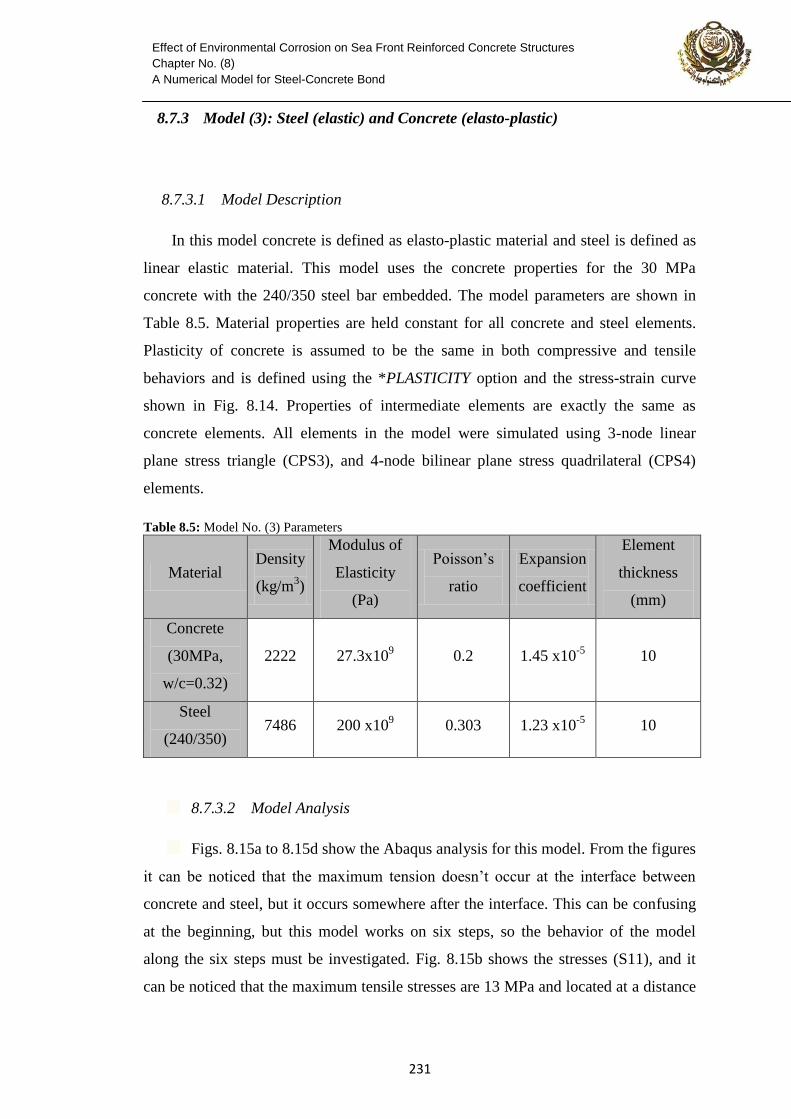
321
Effect of Environmental Corrosion on Sea Front Reinforced Concrete Structures
Chapter No. (8)
A Numerical Model for Steel-Concrete Bond
8.7.3 Model (3): Steel (elastic) and Concrete (elasto-plastic)
8.7.3.1 Model Description
In this model concrete is defined as elasto-plastic material and steel is defined as
linear elastic material. This model uses the concrete properties for the 30 MPa
concrete with the 240/350 steel bar embedded. The model parameters are shown in
Table 8.5. Material properties are held constant for all concrete and steel elements.
Plasticity of concrete is assumed to be the same in both compressive and tensile
behaviors and is defined using the *PLASTICITY option and the stress-strain curve
shown in Fig. 8.14. Properties of intermediate elements are exactly the same as
concrete elements. All elements in the model were simulated using 3-node linear
plane stress triangle (CPS3), and 4-node bilinear plane stress quadrilateral (CPS4)
elements.
Table 8.5: Model No. (3) Parameters
Material Density
(kg/m3)
Modulus of
Elasticity
(Pa)
Poisson’s
ratio
Expansion
coefficient
Element
thickness
(mm)
Concrete
(30MPa,
w/c=0.32)
2222 27.3x10⁹ 0.2 1.45 x10
-5 10
Steel
(240/350) 7486 200 x10
9 0.303 1.23 x10
-5 10
8.7.3.2 Model Analysis
Figs. 8.15a to 8.15d show the Abaqus analysis for this model. From the figures
it can be noticed that the maximum tension doesn’t occur at the interface between
concrete and steel, but it occurs somewhere after the interface. This can be confusing
at the beginning, but this model works on six steps, so the behavior of the model
along the six steps must be investigated. Fig. 8.15b shows the stresses (S11), and it
can be noticed that the maximum tensile stresses are 13 MPa and located at a distance
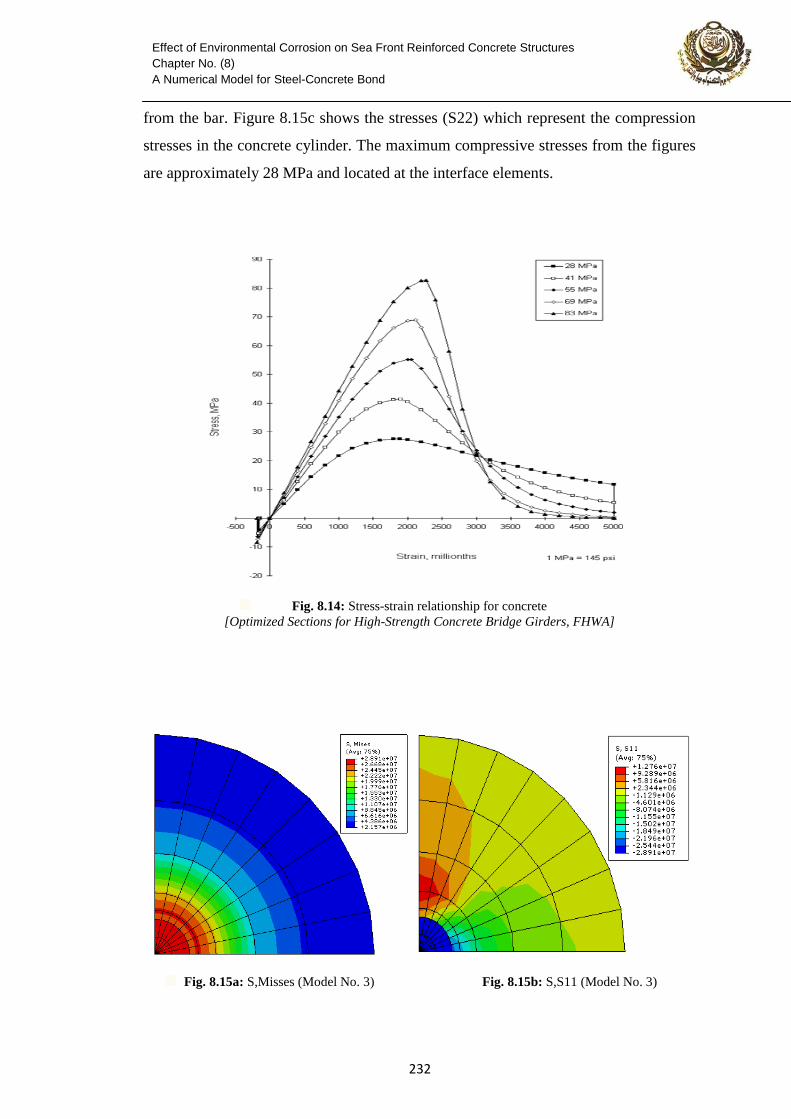
323
Effect of Environmental Corrosion on Sea Front Reinforced Concrete Structures
Chapter No. (8)
A Numerical Model for Steel-Concrete Bond
from the bar. Figure 8.15c shows the stresses (S22) which represent the compression
stresses in the concrete cylinder. The maximum compressive stresses from the figures
are approximately 28 MPa and located at the interface elements.
Fig. 8.14: Stress-strain relationship for concrete
[Optimized Sections for High-Strength Concrete Bridge Girders, FHWA]
Fig. 8.15a: S,Misses (Model No. 3) Fig. 8.15b: S,S11 (Model No. 3)
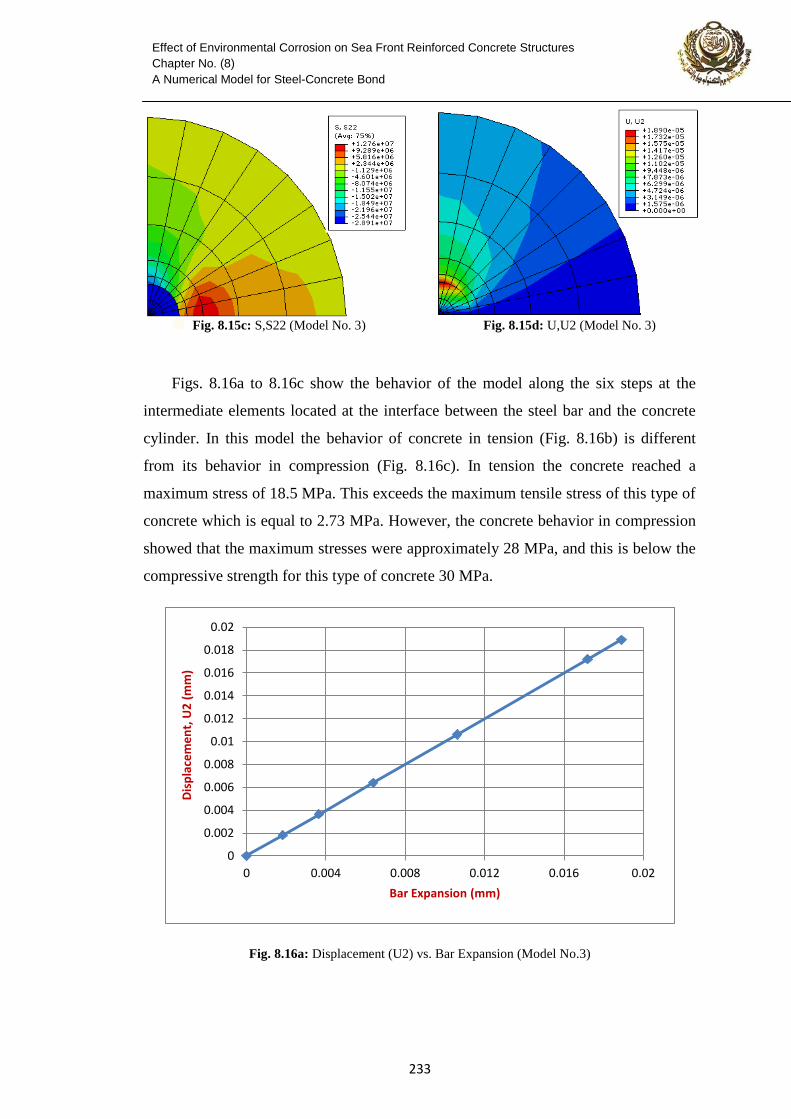
322
Effect of Environmental Corrosion on Sea Front Reinforced Concrete Structures
Chapter No. (8)
A Numerical Model for Steel-Concrete Bond
Fig. 8.15c: S,S22 (Model No. 3) Fig. 8.15d: U,U2 (Model No. 3)
Figs. 8.16a to 8.16c show the behavior of the model along the six steps at the
intermediate elements located at the interface between the steel bar and the concrete
cylinder. In this model the behavior of concrete in tension (Fig. 8.16b) is different
from its behavior in compression (Fig. 8.16c). In tension the concrete reached a
maximum stress of 18.5 MPa. This exceeds the maximum tensile stress of this type of
concrete which is equal to 2.73 MPa. However, the concrete behavior in compression
showed that the maximum stresses were approximately 28 MPa, and this is below the
compressive strength for this type of concrete 30 MPa.
Fig. 8.16a: Displacement (U2) vs. Bar Expansion (Model No.3)
0
0.002
0.004
0.006
0.008
0.01
0.012
0.014
0.016
0.018
0.02
0 0.004 0.008 0.012 0.016 0.02
Dis
pla
cem
en
t, U
2 (
mm
)
Bar Expansion (mm)
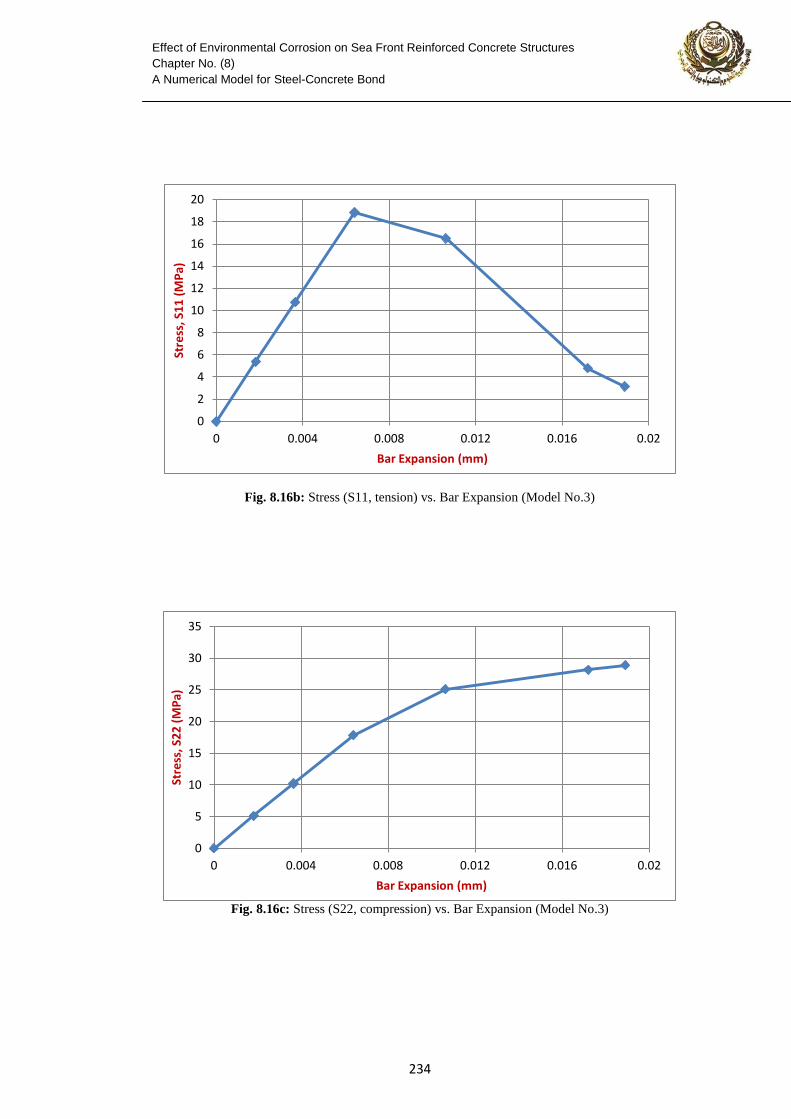
322
Effect of Environmental Corrosion on Sea Front Reinforced Concrete Structures
Chapter No. (8)
A Numerical Model for Steel-Concrete Bond
Fig. 8.16b: Stress (S11, tension) vs. Bar Expansion (Model No.3)
Fig. 8.16c: Stress (S22, compression) vs. Bar Expansion (Model No.3)
0
2
4
6
8
10
12
14
16
18
20
0 0.004 0.008 0.012 0.016 0.02
Stre
ss, S
11
(M
Pa)
Bar Expansion (mm)
0
5
10
15
20
25
30
35
0 0.004 0.008 0.012 0.016 0.02
Stre
ss, S
22
(M
Pa)
Bar Expansion (mm)
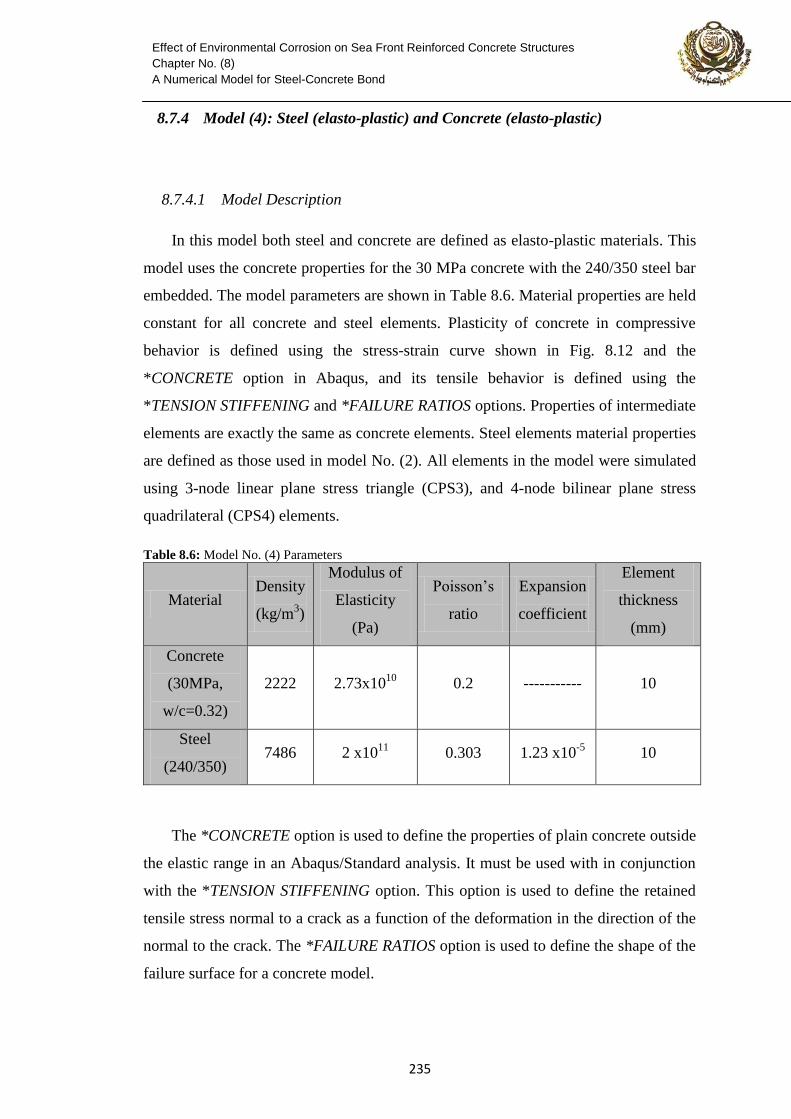
322
Effect of Environmental Corrosion on Sea Front Reinforced Concrete Structures
Chapter No. (8)
A Numerical Model for Steel-Concrete Bond
8.7.4 Model (4): Steel (elasto-plastic) and Concrete (elasto-plastic)
8.7.4.1 Model Description
In this model both steel and concrete are defined as elasto-plastic materials. This
model uses the concrete properties for the 30 MPa concrete with the 240/350 steel bar
embedded. The model parameters are shown in Table 8.6. Material properties are held
constant for all concrete and steel elements. Plasticity of concrete in compressive
behavior is defined using the stress-strain curve shown in Fig. 8.12 and the
*CONCRETE option in Abaqus, and its tensile behavior is defined using the
*TENSION STIFFENING and *FAILURE RATIOS options. Properties of intermediate
elements are exactly the same as concrete elements. Steel elements material properties
are defined as those used in model No. (2). All elements in the model were simulated
using 3-node linear plane stress triangle (CPS3), and 4-node bilinear plane stress
quadrilateral (CPS4) elements.
Table 8.6: Model No. (4) Parameters
Material Density
(kg/m3)
Modulus of
Elasticity
(Pa)
Poisson’s
ratio
Expansion
coefficient
Element
thickness
(mm)
Concrete
(30MPa,
w/c=0.32)
2222 2.73x10¹⁰
0.2 ----------- 10
Steel
(240/350) 7486 2 x10
11 0.303 1.23 x10
-5 10
The *CONCRETE option is used to define the properties of plain concrete outside
the elastic range in an Abaqus/Standard analysis. It must be used with in conjunction
with the *TENSION STIFFENING option. This option is used to define the retained
tensile stress normal to a crack as a function of the deformation in the direction of the
normal to the crack. The *FAILURE RATIOS option is used to define the shape of the
failure surface for a concrete model.
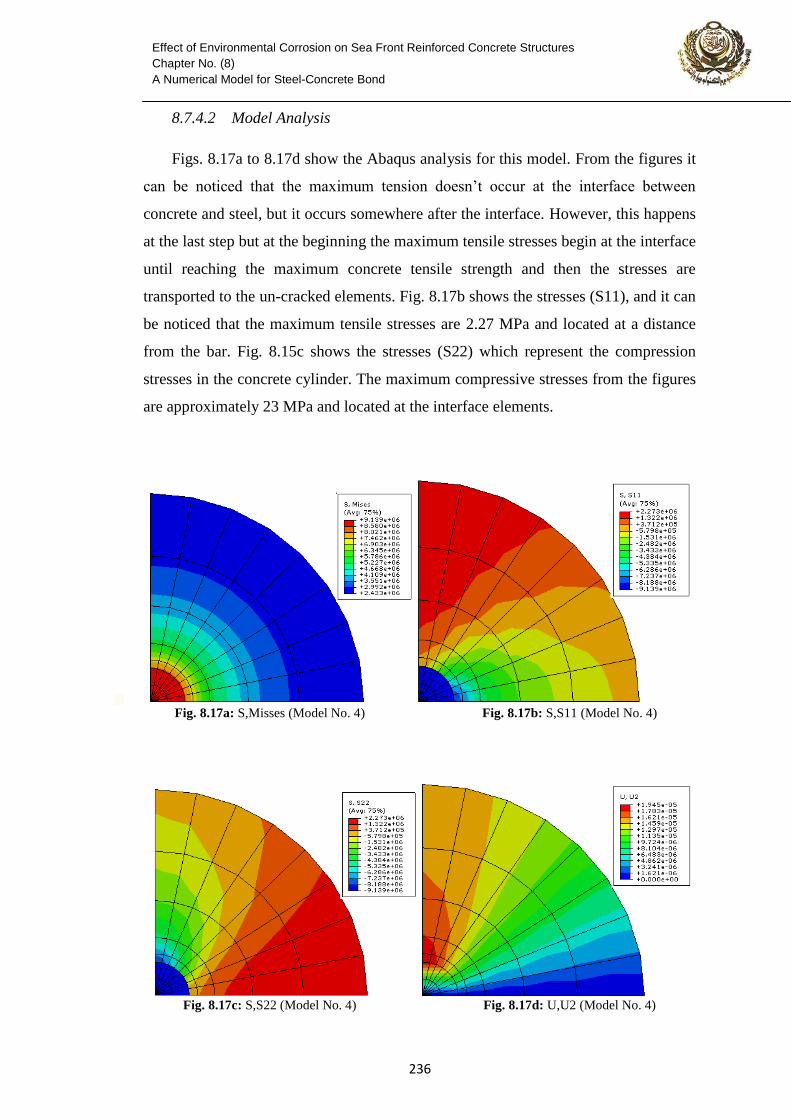
322
Effect of Environmental Corrosion on Sea Front Reinforced Concrete Structures
Chapter No. (8)
A Numerical Model for Steel-Concrete Bond
8.7.4.2 Model Analysis
Figs. 8.17a to 8.17d show the Abaqus analysis for this model. From the figures it
can be noticed that the maximum tension doesn’t occur at the interface between
concrete and steel, but it occurs somewhere after the interface. However, this happens
at the last step but at the beginning the maximum tensile stresses begin at the interface
until reaching the maximum concrete tensile strength and then the stresses are
transported to the un-cracked elements. Fig. 8.17b shows the stresses (S11), and it can
be noticed that the maximum tensile stresses are 2.27 MPa and located at a distance
from the bar. Fig. 8.15c shows the stresses (S22) which represent the compression
stresses in the concrete cylinder. The maximum compressive stresses from the figures
are approximately 23 MPa and located at the interface elements.
Fig. 8.17a: S,Misses (Model No. 4) Fig. 8.17b: S,S11 (Model No. 4)
Fig. 8.17c: S,S22 (Model No. 4) Fig. 8.17d: U,U2 (Model No. 4)
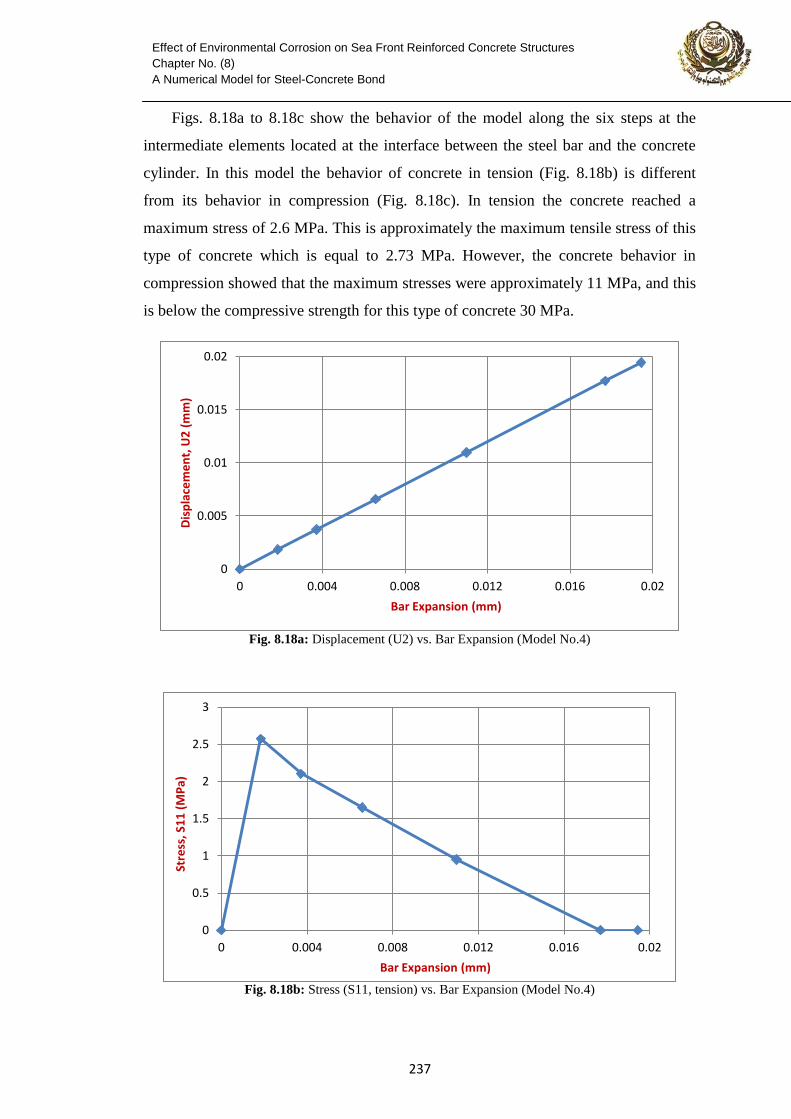
322
Effect of Environmental Corrosion on Sea Front Reinforced Concrete Structures
Chapter No. (8)
A Numerical Model for Steel-Concrete Bond
Figs. 8.18a to 8.18c show the behavior of the model along the six steps at the
intermediate elements located at the interface between the steel bar and the concrete
cylinder. In this model the behavior of concrete in tension (Fig. 8.18b) is different
from its behavior in compression (Fig. 8.18c). In tension the concrete reached a
maximum stress of 2.6 MPa. This is approximately the maximum tensile stress of this
type of concrete which is equal to 2.73 MPa. However, the concrete behavior in
compression showed that the maximum stresses were approximately 11 MPa, and this
is below the compressive strength for this type of concrete 30 MPa.
Fig. 8.18a: Displacement (U2) vs. Bar Expansion (Model No.4)
Fig. 8.18b: Stress (S11, tension) vs. Bar Expansion (Model No.4)
0
0.005
0.01
0.015
0.02
0 0.004 0.008 0.012 0.016 0.02
Dis
pla
cem
en
t, U
2 (
mm
)
Bar Expansion (mm)
0
0.5
1
1.5
2
2.5
3
0 0.004 0.008 0.012 0.016 0.02
Stre
ss, S
11
(M
Pa)
Bar Expansion (mm)
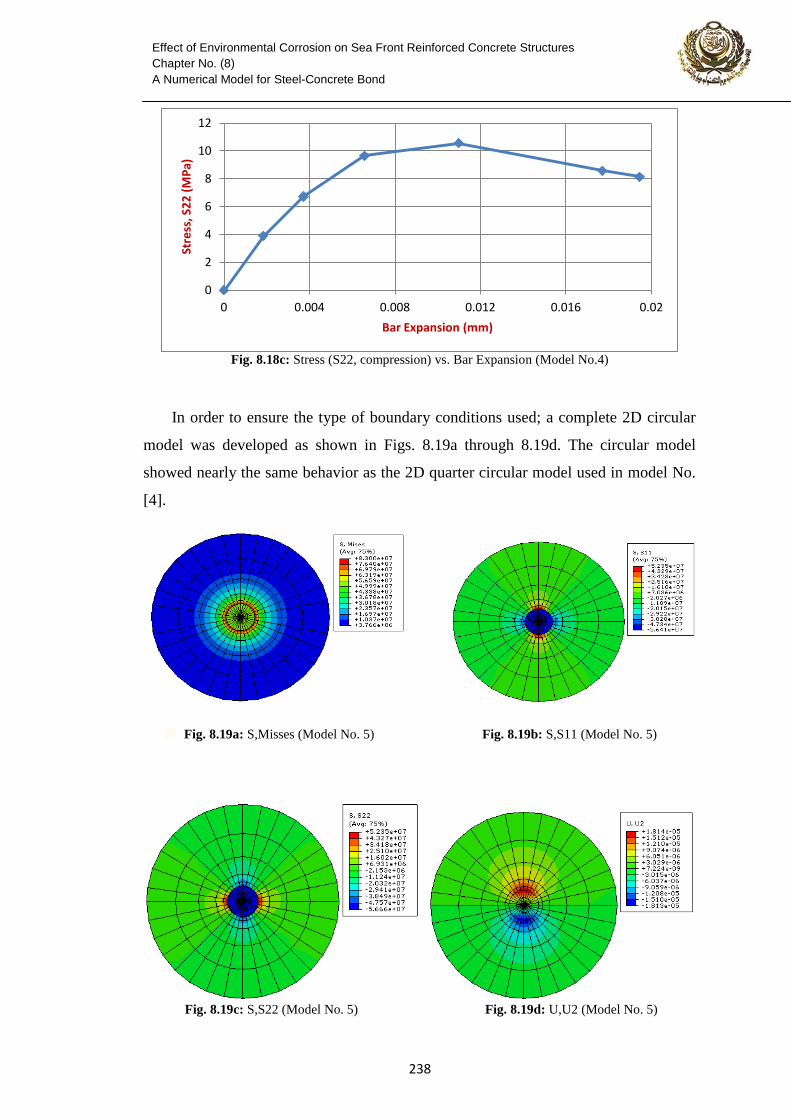
322
Effect of Environmental Corrosion on Sea Front Reinforced Concrete Structures
Chapter No. (8)
A Numerical Model for Steel-Concrete Bond
Fig. 8.18c: Stress (S22, compression) vs. Bar Expansion (Model No.4)
In order to ensure the type of boundary conditions used; a complete 2D circular
model was developed as shown in Figs. 8.19a through 8.19d. The circular model
showed nearly the same behavior as the 2D quarter circular model used in model No.
[4].
Fig. 8.19a: S,Misses (Model No. 5)
Fig. 8.19b: S,S11 (Model No. 5)
Fig. 8.19c: S,S22 (Model No. 5) Fig. 8.19d: U,U2 (Model No. 5)
0
2
4
6
8
10
12
0 0.004 0.008 0.012 0.016 0.02
Stre
ss, S
22
(M
Pa)
Bar Expansion (mm)
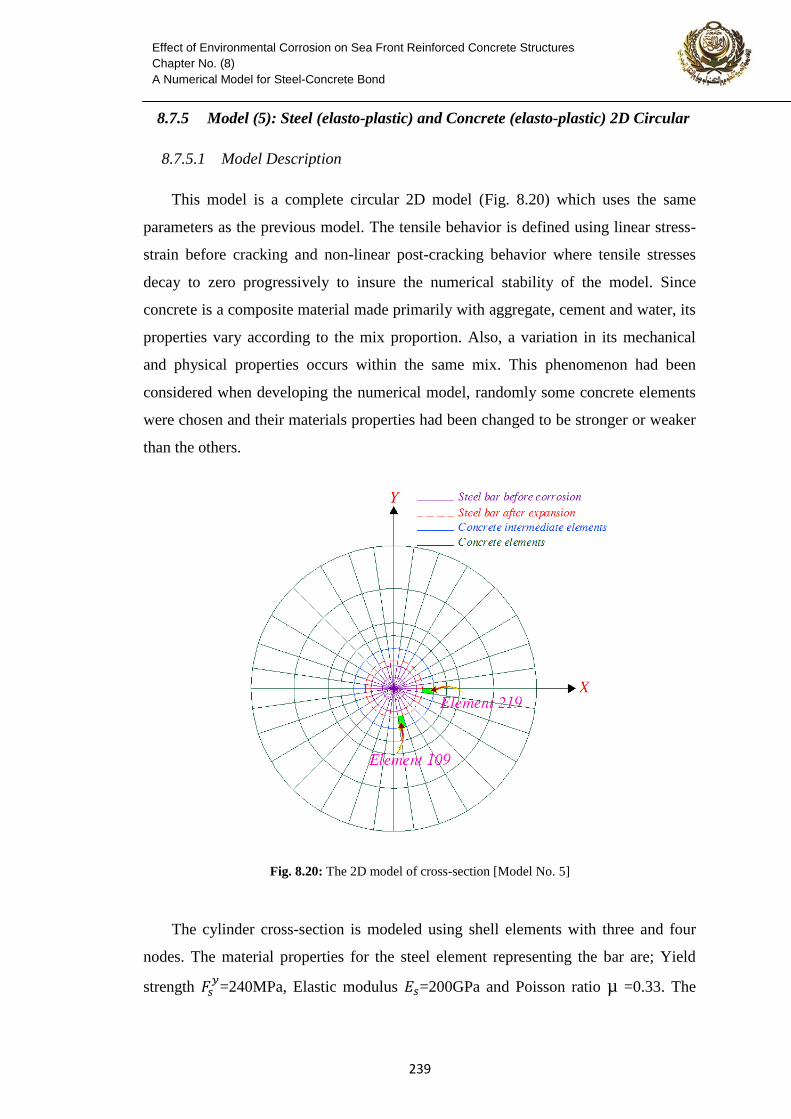
322
Effect of Environmental Corrosion on Sea Front Reinforced Concrete Structures
Chapter No. (8)
A Numerical Model for Steel-Concrete Bond
8.7.5 Model (5): Steel (elasto-plastic) and Concrete (elasto-plastic) 2D Circular
8.7.5.1 Model Description
This model is a complete circular 2D model (Fig. 8.20) which uses the same
parameters as the previous model. The tensile behavior is defined using linear stress-
strain before cracking and non-linear post-cracking behavior where tensile stresses
decay to zero progressively to insure the numerical stability of the model. Since
concrete is a composite material made primarily with aggregate, cement and water, its
properties vary according to the mix proportion. Also, a variation in its mechanical
and physical properties occurs within the same mix. This phenomenon had been
considered when developing the numerical model, randomly some concrete elements
were chosen and their materials properties had been changed to be stronger or weaker
than the others.
Fig. 8.20: The 2D model of cross-section [Model No. 5]
The cylinder cross-section is modeled using shell elements with three and four
nodes. The material properties for the steel element representing the bar are; Yield
strength
=240MPa, Elastic modulus =200GPa and Poisson ratio µ =0.33. The
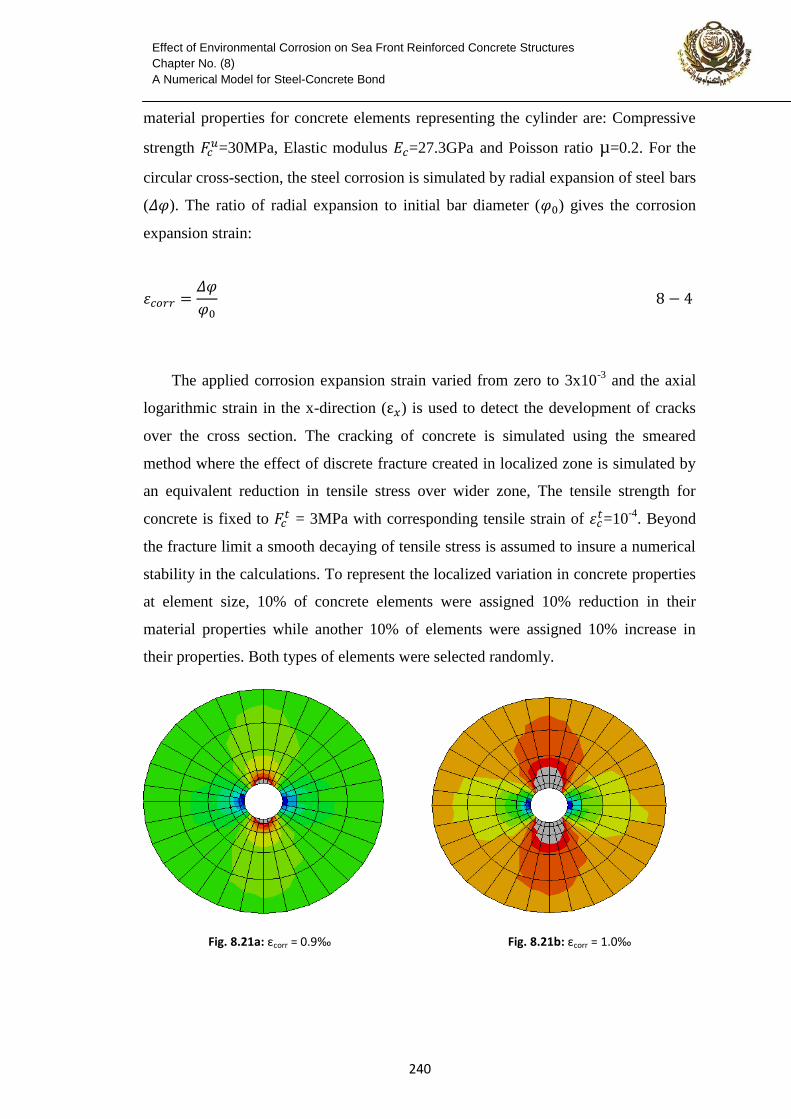
322
Effect of Environmental Corrosion on Sea Front Reinforced Concrete Structures
Chapter No. (8)
A Numerical Model for Steel-Concrete Bond
material properties for concrete elements representing the cylinder are: Compressive
strength =30MPa, Elastic modulus =27.3GPa and Poisson ratio µ=0.2. For the
circular cross-section, the steel corrosion is simulated by radial expansion of steel bars
( ). The ratio of radial expansion to initial bar diameter ( ) gives the corrosion
expansion strain:
The applied corrosion expansion strain varied from zero to 3x10⁻³
and the axial
logarithmic strain in the x-direction ( ) is used to detect the development of cracks
over the cross section. The cracking of concrete is simulated using the smeared
method where the effect of discrete fracture created in localized zone is simulated by
an equivalent reduction in tensile stress over wider zone, The tensile strength for
concrete is fixed to = 3MPa with corresponding tensile strain of
=10-4
. Beyond
the fracture limit a smooth decaying of tensile stress is assumed to insure a numerical
stability in the calculations. To represent the localized variation in concrete properties
at element size, 10% of concrete elements were assigned 10% reduction in their
material properties while another 10% of elements were assigned 10% increase in
their properties. Both types of elements were selected randomly.
Fig. 8.21a: εcorr = 2.2‰ Fig. 8.21b: εcorr = 1.2‰


![ASPHALT CONCRETE [Types] - KSU Facultyfac.ksu.edu.sa/sites/default/files/AC-1-LabTYPESDISTRESS.pdf · ASPHALT CONCRETE [Types] Introduction ... Sand Asphalt Mix Sand asphalt mixes](https://img.pdfslide.us/doc/110x75/5b72d5437f8b9a674d8d5d0c/asphalt-concrete-types-ksu-asphalt-concrete-types-introduction-sand.jpg)