Embed Size (px)
Citation preview
BONDING EFFICIENCY OF ROLLER COMPACTED CONCRETE WITH DIFFERENT BEDDING MIXES
A THESIS SUBMITTED TO THE GRADUATE SCHOOL OF NATURAL AND APPLIED SCIENCES
OF MIDDLE EAST TECHNICAL UNIVERSITY
BY
SİNAN ÖZCAN
IN PARTIAL FULFILLMENT OF THE REQUIREMENTS FOR
THE DEGREE OF MASTER OF SCIENCE IN
CIVIL ENGINEERING
DECEMBER 2008
Approval of the thesis:
BONDING EFFICIENCY OF ROLLER COMPACTED CONCRETE WITH DIFFERENT BEDDING MIXES
submitted by SİNAN ÖZCAN in partial fulfillment of the requirements for the degree of Master of Science in Civil Engineering Department, Middle East Technical University by, Prof. Dr. Canan Özgen _____________________ Dean, Graduate School of Natural and Applied Sciences Prof. Dr. Güney Özcebe _____________________ Head of Department, Civil Engineering Assoc. Prof. Dr. İ. Özgür Yaman Supervisor, Civil Engineering Dept., METU _____________________ Examining Committee Members: Prof. Dr. Mustafa Tokyay _____________________ Civil Engineering Dept., METU Assoc. Prof. Dr. İ. Özgür Yaman _____________________ Civil Engineering Dept., METU Dr. Sinan Turhan Erdoğan _____________________ Civil Engineering Dept., METU Ferruh Anık _____________________ Technical Adviser, TEMELSU A.Ş. Fatih Kocabeyler _____________________ Vice Chairman, DSİ TAKK
Date: 04.12.2008

iii
I hereby declare that all information in this document has been obtained and presented in accordance with academic rules and ethical conduct. I also declare that, as required by these rules and conduct, I have fully cited and referenced all material and results that are not original to this work.
Name, Last name : SİNAN, ÖZCAN Signature :
iv
ABSTRACT
BONDING EFFICIENCY OF ROLLER COMPACTED CONCRETE WITH DIFFERENT BEDDING MIXES
Özcan, Sinan
M.Sc., Department of Civil Engineering
Supervisor: Assoc. Prof. Dr. İ. Özgür Yaman
December 2008, 96 pages
Roller Compacted Concrete (RCC) has rapidly evolved from a concept to a material
and a process which is used throughout the world for faster and more economical
construction of dams. Currently, there are more than 250 RCC dams, completed or
under construction, in the world. On the other hand, currently, there are only two
RCC dams completed (Suçatı and Cindere Dams) and two under construction
(Beydağ and Çine Dam) in Turkey.
RCC dams are constructed in a series of compacted layers usually 30 cm in
thickness. Therefore, appropriate bonding of successive layers is important and as a
result, in between successive layers a bedding mix is often used to fill the surface
voids in both the compacted layer below and the covering layer above, as well as to
bond the two successive layers together.
This study presents an experimental investigation on the bonding efficiency of RCC
with different bedding mixes. The Beydağ Dam RCC mixture was taken as the
model for the preparation of laboratory-made RCC specimens. In the experimental
v
study, 15 cm cubic specimens were prepared in two layers. Each layer was
compacted using an electro pneumatic demolition hammer for 30 seconds. Four
different time intervals between placement and compaction of two successive layers
and two different bedding mix types were the selected cases for investigation. While
preparing the specimens, the second layer was placed and compacted 0, 4, 8, 12
and 16 hours after the first layer was compacted. In between the two layers, two
types of bedding mixes are placed in between previously compacted and freshly
placed layer for joint treatment. One of the bedding mixes, having 200 kg/m3 cement
content is termed poor while other one is termed rich having 400 kg/m3 cement
content.
RCC specimens are then subjected to compressive strength, splitting tensile
strength and permeability tests. As a result of the experimental program, it was
found that; a rich bedding mix was a more effective bonding agent between
compacted RCC layers than the poor bedding mix for all time intervals between
layers. Furthermore, it was concluded that bonding efficiency of RCC is not too
dependent on time interval between layer compactions up to 16 hours. Finally,
splitting tensile strength and sorptivity tests are shown to be applicable test methods
for determination of bonding efficiency of RCC specimens if there is a definite
bedding layer in between freshly placed and formerly compacted RCC.
Keywords: Roller Compacted Concrete, Bedding Mix, Bonding Efficiency
vi
ÖZ
SİLİNDİRLE SIKIŞTIRILMIŞ BETONUN FARKLI YASTIK KARIŞIMLARI İLE YAPIŞMA VERİMLİLİĞİ
Özcan, Sinan
Yüksek Lisans, İnşaat Mühendisliği Bölümü
Tez Yöneticisi: Doç. Dr. İ. Özgür Yaman
Aralık 2008, 96 sayfa
Silindirle Sıkıştırılmış Beton (SSB), kavramdan malzemeye, barajların daha hızlı ve
ekonomik yapımı için dünyanın her yerinde kullanılan bir yönteme hızlı bir gelişim
göstermiştir. Şu anda, dünyada 250’den fazla SSB baraj tamamlanmış veya yapım
aşamasındadır. Öte yandan, şu anda, Türkiye’de sadece iki tane SSB baraj (Suçatı
ve Cindere barajları) tamamlanmış ve iki tanesi (Beydağ ve Çine barajları) ise yapım
aşamasındadır.
SSB barajlar genellikle 30 cm kalınlığında bir dizi sıkıştırılmış tabaka halinde inşa
edilmektedir. Dolayısıyla, ardışık tabakaların uygun bir şekilde yapışması önemlidir
ve bunun sonucu olarak, müteakip iki tabaka arasında alttaki sıkıştırılmış tabaka ile
üstteki örten tabakanın yüzey boşluklarını doldurmak, hatta müteakip iki tabakayı
birbirine yapıştırmak için bir yastık karışımı sıklıkla kullanılmaktadır.
Bu çalışma, SSB’nin farklı yastık karışımları ile yapışma verimliliğiyle ilgili deneysel
bir araştırmayı sunmaktadır. Laboratuvarda üretilen SSB numunelerinin
hazırlanmasında Beydağ barajı SSB karışımı model alınmıştır. Deneysel çalışmada
vii
15 cm’lik küp numuneler iki müteakip tabaka halinde hazırlanmıştır. Her tabaka bir
elektropnömatik kırıcı tabanca kullanılarak 30 saniye sıkıştırılmıştır. İki tabakanın
yerleştirilip sıkıştırılması arasındaki farklı dört zaman aralığı ile farklı iki yastık
karışımı tipi araştırma için seçilen parametrelerdir. Numuneleri hazırlarken, ikinci
tabaka, ilk tabaka sıkıştırıldıktan 0, 4, 8, 12 ve 16 saat sonra yerleştirilip
sıkıştırılmıştır. Birleşim bölgesi iyileştirmesi için, iki tip yastık karışımı önceden
sıkıştırılmış ve yeni yerleştirilen iki tabaka arasına dökülmüştür. Bu yastık
karışımlardan biri zayıf olarak adlandırılıp, 200 kg/m3 çimento içermekte iken diğeri
kuvvetli olarak adlandırılıp 400 kg/m3 çimento içermektedir.
SSB numuneler sonrasında basınç dayanımı, yarmada çekme dayanımı ve
geçirimlilik deneylerine tabi tutulmuştur. Deneysel programın sonucunda, zengin
yastık karışımının zayıf yastık karışımına göre tabakalar arasındaki bütün zaman
aralıklarında daha etkili bir yapıştırma malzemesi olduğu bulunmuştur. Bundan
başka, SSB yapışma verimliliğinin 16 saate kadar sıkışmış tabakalar arasındaki
süreye çok bağlı olmadığı sonucuna varılmıştır. Son olarak, SSB numunelerin
yapışma verimliliğini elde etmede, yarmada çekme dayanımı ve kılcal geçirimlilik
deneylerinin, yeni yerleştirilen SSB tabaka ile önceden sıkıştırılan SSB tabaka
arasında belirgin bir yastık tabakası varsa, uygulanabilir test metodları olduğu
gösterilmiştir.
Anahtar Kelimeler: Silindirle Sıkıştırılmış Beton, Yastık Karışımı, Yapışma
Verimliliği

viii
To My Parents

ix
ACKNOWLEDGEMENTS
I would like to express my sincere gratitude to my supervisor Assoc. Prof. Dr. İ.
Özgür Yaman for his academic guidance, discussions, support and constructive
criticism to complete the master’s thesis.
I would like to thank Dr. Fikret Gürdil from Temelsu International Engineering
Services Inc. for suggesting this research topic.
Thanks are extended to the personnel of the Materials of Construction Laboratory of
Middle East Technical University for their assistance in carrying out the experiments.
Sincere thanks are also extended to my firm, Temelsu International Engineering
Services Inc. and especially to Mr. Ferruh Anık and Mr. Hasan Mert, for their
continuous academic guidance and support.
Bülent Çağırgan and Uğur Sefa Horzum from Özaltın Inc. are also acknowledged for
their hospitality & supply of materials from the Beydağ Dam Construction Site.
Dr. Önder Kırca is also acknowledged for his help in the chemical analysis of the
Portland cement and fly ash used.
Finally, I offer deepest thanks to my parents Yıldız and Mustafa Özcan and my
brothers Ümit Can and Kemal Özcan for being existent in all my life with their
unshakable faith in me.
x
TABLE OF CONTENTS
PLAGIARISM ............................................................................................................ iii
ABSTRACT ............................................................................................................... iv
ÖZ ............................................................................................................................. vi
DEDICATION ........................................................................................................... viii
ACKNOWLEDGEMENTS.......................................................................................... ix
TABLE OF CONTENTS ............................................................................................. x
LIST OF TABLES ..................................................................................................... xii
LIST OF FIGURES ................................................................................................... xiii
LIST OF ABBREVIATIONS ...................................................................................... xv
CHAPTER
1 INTRODUCTION .................................................................................................... 1
1.1 General ......................................................................................................... 1
1.2 Objective ....................................................................................................... 2
1.3 Scope ........................................................................................................... 2
2 LITTERATURE SURVEY ON ROLLER COMPACTED CONCRETE ................... 4
2.1 Historical Development of Roller Compacted Concrete Around the World .. 7
2.2 Properties of Roller Compacted Concrete .................................................... 9
2.2.1 Workability ........................................................................................... 10
2.2.2 Unit Weight .......................................................................................... 12
2.2.3 Compressive Strength ......................................................................... 13
2.2.4 Tensile Strength................................................................................... 16
2.2.5 Permeability ......................................................................................... 17
2.2.6 Durability .............................................................................................. 18
2.2.7 Heat Generation .................................................................................. 19
2.3 Materials ..................................................................................................... 20
2.3.1 Cements .............................................................................................. 21
2.3.2 Pozzolans ............................................................................................ 22
2.3.3 Aggregates .......................................................................................... 24
2.3.3.1 Fine Aggregates ........................................................................... 26
2.3.3.2 Coarse Aggregates ....................................................................... 26
xi
2.3.3.3 Fines ............................................................................................. 28
2.4 Mix Design Methods ................................................................................... 29
2.4.1 Soils Approach..................................................................................... 30
2.4.1.1 Lean RCC Method ........................................................................ 30
2.4.1.2 Simplified Soils Method ................................................................ 31
2.4.2 Concrete Approach .............................................................................. 32
2.4.2.1 High Paste Method ....................................................................... 32
2.4.2.2 Japanese RCD Method ................................................................ 34
2.4.2.3 Corps of Engineers Method .......................................................... 35
2.5 Advantages and Disadvantages of RCC over Conventional Mass Concrete
.................................................................................................................... 38
2.6 Bedding Mix ................................................................................................ 39
2.6.1 Properties of Bedding Mix .................................................................... 39
2.6.2 Materials .............................................................................................. 43
2.7 Beydağ Dam RCC Studies ......................................................................... 44
2.8 Previous Research at M.E.T.U. .................................................................. 50
3 EXPERIMENTAL STUDY .................................................................................... 52
3.1 Materials Utilized within the Experimental Program ................................... 52
3.1.1 Cement ................................................................................................ 53
3.1.2 Fly Ash ................................................................................................. 54
3.1.3 Aggregate for RCC .............................................................................. 55
3.1.4 Aggregate for Bedding Mixes .............................................................. 57
3.2 Experimental Program ................................................................................ 58
3.3 Experimental Procedures and Data ............................................................ 65
3.4.1 Compressive Strength ......................................................................... 65
3.4.2 Splitting Tensile Strength ..................................................................... 69
3.4.3 Permeability ......................................................................................... 72
4 DISCUSSION OF RESULTS ............................................................................... 81
4.1 Compressive Strength ................................................................................ 81
4.2 Splitting Tensile Strength ............................................................................ 83
4.3 Permeability ................................................................................................ 86
5 SUMMARY AND CONCLUSIONS ....................................................................... 88
6 RECOMMENDATIONS FOR FUTURE STUDIES ............................................... 90
REFERENCES ......................................................................................................... 92
xii
LIST OF TABLES
TABLES Table 2.1 Compressive strength of some RCC dams [3] ......................................... 14 Table 2.2 Combined aggregate grading for RCC from various projects in U.S. [3] .. 26 Table 2.3 Beydağ Dam trial mixes [30]..................................................................... 49 Table 3.1 Chemical analysis of Portland Cement..................................................... 53 Table 3.2 Physical properties of Portland Cement ................................................... 54 Table 3.3 Chemical analysis of fly ash ..................................................................... 54 Table 3.4 Physical properties of fly ash .................................................................... 55 Table 3.5 Physical properties of aggregate used for RCC ....................................... 56 Table 3.6 Physical properties of aggregate used for bedding mixes ........................ 57 Table 3.7 Specimen notation used in the experiments............................................. 59 Table 3.8 28-day compressive strength test results of RCC .................................... 67 Table 3.9 90-day compressive strength test results of RCC .................................... 67 Table 3.10 28-day compressive strength test results of bedding mixes ................... 68 Table 3.11 90-day compressive strength test results of bedding mixes ................... 68 Table 3.12 28-day splitting tensile strength test results of RCC ............................... 70 Table 3.13 90-day splitting tensile strength test results of RCC ............................... 70 Table 3.14 28-day splitting tensile strength test results of bedding mixes ............... 71 Table 3.15 90-day splitting tensile strength test results of bedding mixes ............... 71 Table 3.16 90-day sorptivity index (S0) and cumulative absorption values for
combinations of RCC and bedding mixes ....................................................... 79 Table 3.17 90-day sorptivity index (S0) and cumulative absorption values for bedding
mixes ............................................................................................................... 80
xiii
LIST OF FIGURES
FIGURES Figure 2.1 A view of transportation and dumping of concrete .................................... 5
Figure 2.2 A view of spreading of RCC layers............................................................ 5
Figure 2.3 A view of compaction of concrete using vibrating roller ............................ 6
Figure 2.4 Schematic description of Vebe test apparatus [3] ................................... 11
Figure 2.5 Relationship between total in-situ permeability (including at joints) and
cementitious content for concretes from RCC structures [2] ........................... 18
Figure 2.6 Relationship between compressive strength and w/cm [3] ..................... 36
Figure 2.7 Relationship between equivalent cement content and compressive
strength [3] ...................................................................................................... 37
Figure 2.8 General view of Beydağ Dam.................................................................. 45
Figure 3.1 A view of aggregates brought from Küçük Menderes River .................... 55
Figure 3.2 Combined gradation curve of aggregate used in RCC ............................ 56
Figure 3.3 Gradation curve of aggregate used for bedding mixes ........................... 57
Figure 3.4 A view of the compaction equipment ....................................................... 60
Figure 3.5 A view of the electrical mixer ................................................................... 62
Figure 3.6 A view of the filling of moulds with RCC .................................................. 62
Figure 3.7 A view of the apparatus used for compaction of cubic specimens .......... 63
Figure 3.8 Typical view of the compaction process .................................................. 63
Figure 3.9 A view of the RCC specimens waiting for the application of the bedding
mix and the second RCC layer ....................................................................... 64
Figure 3.10 A view of the application of bedding mix ............................................... 65
Figure 3.11 Typical view of specimens used in compressive strength testing ......... 66
Figure 3.12 Typical view of specimens used in splitting tensile strength testing ...... 69
Figure 3.13 Specimens for permeability testing at DSİ TAKK .................................. 72
Figure 3.14 Schematic description of sorptivity test ................................................. 73
Figure 3.15 Permeability of RCC specimens with 0 hour time interval between layers
........................................................................................................................ 74
xiv
Figure 3.16 Permeability of RCC specimens with 4 hrs time interval between layers
........................................................................................................................ 75
Figure 3.17 Permeability of RCC specimens with 8 hrs time interval between layers
........................................................................................................................ 76
Figure 3.18 Permeability of RCC specimens with 12 hrs time interval between layers
........................................................................................................................ 77
Figure 3.19 Permeability of RCC specimens with 16 hrs time interval between layers
........................................................................................................................ 78
Figure 3.20 Permeability results of poor bedding mix (B-1) specimens ................... 80
Figure 3.21 Permeability results of rich bedding mix (B-2) specimens ..................... 80
Figure 4.1 Compressive strength vs. time interval between layers .......................... 82
Figure 4.2 Splitting tensile strength vs. time interval between layers ....................... 84
Figure 4.3 90-day cumulative absorption values vs. time interval between layers ... 87
Figure 4.4 90-day sorptivity index (S0) vs. time interval between layers .................. 87

xv
LIST OF ABBREVIATIONS
ACI American Concrete Institute
ASCE American Society of Civil Engineers
ASTM American Society for Testing and Materials
CM Cementitious Materials
CMC Conventional Mass Concrete
CVC Conventionally Vibrated Concrete
HEPP Hydroelectric Power Plant
ICOLD International Commission of Large Dams
INC Incorporated
NMSA Nominal Maximum Size of Aggregate
PAC Preplaced Aggregate Concrete
PCA Portland Cement Association
RCC Roller Compacted Concrete
RCD Roller Compacted Dam
SSD Saturated Surface Dry
USACE United States Army Corps of Engineers
1
CHAPTER 1
INTRODUCTION
1.1 General
Roller Compacted Concrete (RCC) emerged as a new type of construction material
during the 1960s. ACI 207.5R-89 defines RCC as concrete compacted by roller
therefore, the concrete mixture in its unhardened state must support a roller while
being compacted [1].
RCC technique has superseded traditional methods of dam construction. By the end
of the year 2008, there are more than 250 RCC dams, completed or under
construction, in the world. In Turkey, currently, there are only two RCC dams (Suçatı
and Cindere Dams) completed and only two under construction (Beydağ and Çine
Dams).
Like conventional concrete, RCC consists of different combinations of cements and
pozzolans, aggregate and sufficient water. Moreover, compared to conventional
concrete, its cement content is quite low. However less water is used in RCC, less
cement is required to produce an equivalent water/cement ratio of conventional
concrete. Portland cement is normally the primary cementing material in RCC,
although fly ash or natural pozzolans are often used as a major portion of the
cementitious materials.
RCC dams are constructed in a series of compacted layers usually 30 cm in
thickness. Therefore, the bonding of successive layers is important both for strength
and permeation purposes. A bedding mix is often designed to fill the surface voids in
both the compacted layer below and the covering layer above as well as to “glue”
the two RCC layers together. The bedding mix is generally 10 mm to maximum 0.5
2
inch thick. However, subjects such as; the time interval for usage of bedding mix
between RCC layers and the behavior of two materials together as time passes
have not been investigated in detail in the history of RCC.
1.2 Objective
There are two major objectives of the study. The first objective is to investigate the
effects of different bedding mixes on the hardened properties of RCC as a bonding
agent between layers. Moreover, the effects of different time intervals for the
application of bedding mixes is investigated as a second objective. Therefore,
related to the above objectives, two types of bedding mixes with the application of
four time intervals between RCC layers are selected. For comparison, unbedded
specimens are also produced. Finally, the suitability of experimental methods to be
used for RCC specimens are evaluated for the given cases.
1.3 Scope
This thesis consists of six chapters. Chapter 1 presents a brief introduction and
states the objectives of this experimental study. Typical properties of RCC and the
bedding mix, a brief history of RCC, the design methods used in RCC, Beydağ Dam
RCC studies and previous research at M.E.T.U. are given in Chapter 2 through a
literature survey.
Chapter 3, basically presents the experimental program. The properties of the
materials used in RCC production, the properties of the compaction equipment, the
test procedures (compressive strength, splitting tensile strength and sorptivity)
utilized and the results of the tests are all presented in this chapter.
Based on the experimental data presented previously, the discussion of results are
given in Chapter 4. Results such as compressive and splitting tensile strength test
together with sorptivity tests are discussed.

3
Furthermore, the summary and conclusions part of the thesis is presented in
Chapter 5 which summarizes the findings of discussion of the results section clause
by clause.
Finally, recommendations for future studies and possible further research that will
complement this thesis are provided in Chapter 6 together with the problems faced
throughout the study.
4
CHAPTER 2
LITTERATURE SURVEY ON ROLLER COMPACTED CONCRETE
In general the development of Roller Compacted Concrete (RCC) caused a major
shift in the construction practice of mass concrete dams. The traditional method of
placing, compacting, and consolidating mass concrete is a slow process. However,
today, improvements in equipment made the construction of RCC dams faster and,
therefore, more cost-effective.
In the RCC history, materials that have been called rollcrete, large-aggregate soil-
cement, rolled concrete, or cement-treated base are all considered to be RCC which
describes the use of RCC for the construction of new dams and for the rehabilitation
of existing dams.
ACI 207.5R-89 defines RCC as “concrete compacted by roller compaction. The
concrete mixture in its unhardened state must support a roller while being
compacted [1]”. ICOLD Bulletin 126 defines RCC as “concrete with a no-slump
consistency in its unhardened state that is transported, placed, and compacted
using fill-dam construction equipment [2]”.
RCC is a zero-slump concrete whose properties are strongly dependent on the
mixture proportions and on the quality of compaction. RCC is usually mixed using
high-capacity continuous mixing or batching equipment, delivered with trucks or
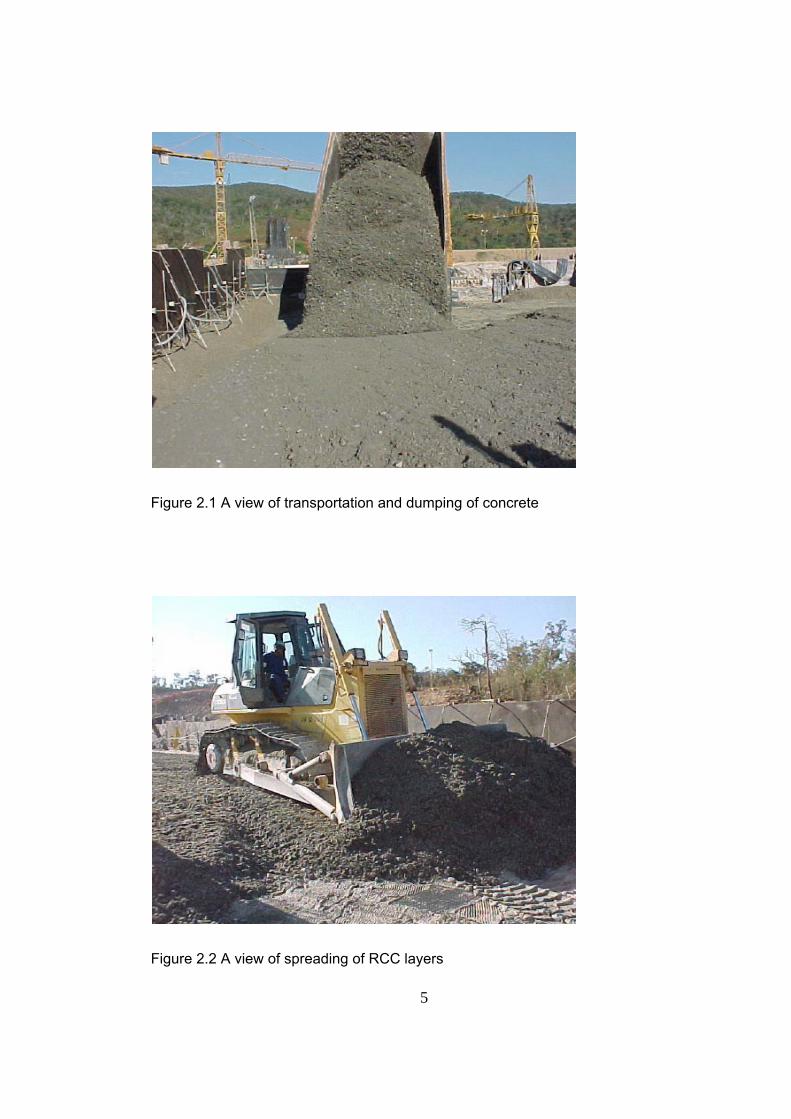
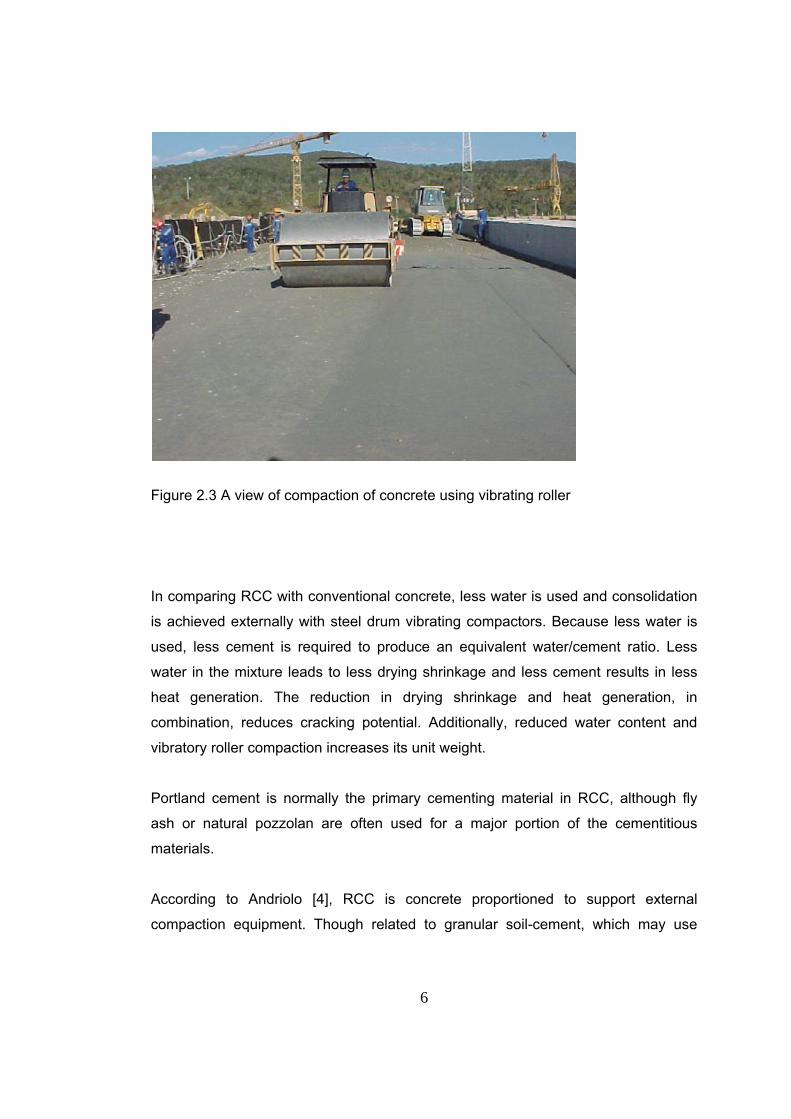
conveyors, and spread with one or more bulldozers in layers prior to compaction [3].
Figure 2.1-2.3 shows typical placement techniques of RCC respectively. In the past,
RCC was delivered mostly by dump trucks, but nowadays conveyors are also often
utilized.
5
Figure 2.1 A view of transportation and dumping of concrete
Figure 2.2 A view of spreading of RCC layers
6
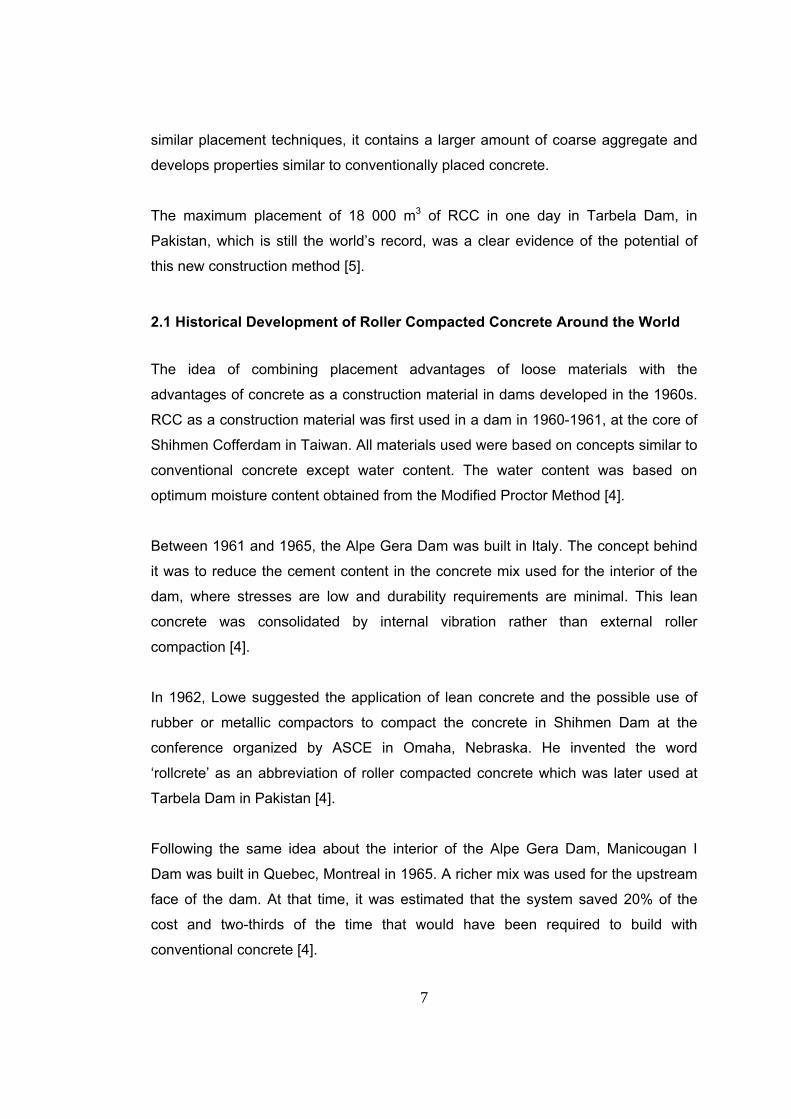
Figure 2.3 A view of compaction of concrete using vibrating roller
In comparing RCC with conventional concrete, less water is used and consolidation
is achieved externally with steel drum vibrating compactors. Because less water is
used, less cement is required to produce an equivalent water/cement ratio. Less
water in the mixture leads to less drying shrinkage and less cement results in less
heat generation. The reduction in drying shrinkage and heat generation, in
combination, reduces cracking potential. Additionally, reduced water content and
vibratory roller compaction increases its unit weight.
Portland cement is normally the primary cementing material in RCC, although fly
ash or natural pozzolan are often used for a major portion of the cementitious
materials.
According to Andriolo [4], RCC is concrete proportioned to support external
compaction equipment. Though related to granular soil-cement, which may use
7
similar placement techniques, it contains a larger amount of coarse aggregate and
develops properties similar to conventionally placed concrete.
The maximum placement of 18 000 m3 of RCC in one day in Tarbela Dam, in
Pakistan, which is still the world’s record, was a clear evidence of the potential of
this new construction method [5].
2.1 Historical Development of Roller Compacted Concrete Around the World
The idea of combining placement advantages of loose materials with the
advantages of concrete as a construction material in dams developed in the 1960s.
RCC as a construction material was first used in a dam in 1960-1961, at the core of
Shihmen Cofferdam in Taiwan. All materials used were based on concepts similar to
conventional concrete except water content. The water content was based on
optimum moisture content obtained from the Modified Proctor Method [4].
Between 1961 and 1965, the Alpe Gera Dam was built in Italy. The concept behind
it was to reduce the cement content in the concrete mix used for the interior of the
dam, where stresses are low and durability requirements are minimal. This lean
concrete was consolidated by internal vibration rather than external roller
compaction [4].
In 1962, Lowe suggested the application of lean concrete and the possible use of
rubber or metallic compactors to compact the concrete in Shihmen Dam at the
conference organized by ASCE in Omaha, Nebraska. He invented the word
‘rollcrete’ as an abbreviation of roller compacted concrete which was later used at
Tarbela Dam in Pakistan [4].
Following the same idea about the interior of the Alpe Gera Dam, Manicougan I
Dam was built in Quebec, Montreal in 1965. A richer mix was used for the upstream
face of the dam. At that time, it was estimated that the system saved 20% of the
cost and two-thirds of the time that would have been required to build with
conventional concrete [4].
8
In 1970, Raphael from University of California at Berkeley presented a seminar
paper about RCC development at Asilomar Conference. His paper, “The Optimum
Gravity Dam” presented a number of ideas that were based on soil-cement theory.
He proposed the concept of placement and compaction of an embankment with
cement-enriched material using complex compaction equipment which was later
resulted in a significant reduction of the cross section of RCC dam compared with a
typical embankment dam [5]. Later Cannon took Raphael’s ideas a step further. He
proposed using a richer mix on the upstream and downstream faces instead of
using lean mix [5].
During the 1970s, a number of organizations were involved in various trials,
laboratory works and development of subjects concerning mass RCC. As a
consequence, RCC dam design evolved in three different directions. These were the
alternatives being developed by U.S. Army Corps of Engineers, British engineers
and a Japanese research team. U.S. Army Corps of Engineers developed a lean-
concrete alternative based on soils technology. British engineers focused on the
high-paste method and the Japanese research team set up a new concept called
RCD (Roller Compacted Dam) [5].
In 1974, U.S. Army Corps of Engineers completed the design and preliminary
laboratory tests for Zintel Canyon Dam in the U.S.A., but due to funding problems,
the dam was not actually constructed until 1992 [5].
In Japan, research on RCC started in 1974 and the early projects were done using
the technology called RCD which was based on possible lowest cement content
while satisfying strength requirements. Also some fly ash was used as an admixture.
In Brazil, RCC technology was first used in 1976 to build a concrete floor at a
storage building at Itapu Dam site.
In Great Britain, research on RCC was started during the construction of the
Winbleball Dam in 1979. The RCC designed during this experiments had a high
paste content [6].
9
In U.S. another Army Corps of Engineers dam project, Willow Creek Dam was built
in less than five months in 1982 and became the world’s first major dam to be built
entirely of RCC [5].
In Spain, RCC was first used at the Erizana Dam in 1985.
In Turkey, Çine Dam and HEPP (Hydroelectric Power Plant) which is located in
Çine/Aydın was the first RCC dam started in 1996 and its construction is still
underway. Suçatı Dam and HEPP which is located in Suçatı/Kahramanmaraş was
the second RCC dam whose construction started in June 1998 and finished in less
than 2 years. Cindere Dam and HEPP which is located in Güney/Denizli became the
third RCC dam and its construction was finished in 2008. Lastly, Beydağ Dam
whose construction started in Ödemiş/İzmir in 2005, became the fourth RCC dam
and its construction is stil underway.
Furthermore to understand the development of RCC construction technology, it is
important to note that at the end of 1980, there were only 2 completed RCC dams
and at the end of 1986, there were 15 completed RCC dams in the world. Currently,
there are more than 250 RCC dams, completed or under construction, in the world.
Essentially, in all but a few cases where there are a significant number of inserts in
the dam, RCC has effectively replaced traditional concrete for the construction of
dams [2].
2.2 Properties of Roller Compacted Concrete
Some RCC mixtures can have properties and behavior similar to conventional
concrete, but most of the time RCC has unique properties that can be very different
from the properties or behavior of traditional concrete. RCC is usually transported by
truck or conveyor belt and deposited in piles or windrows at the placement site. RCC
is then spread in layers with dozers and consolidated with vibratory rollers. Due to
the stiff no-slump consistency of the RCC, all or most of the formwork and
associated labor required for conventional mass concrete can thus be eliminated
[15].
10
The properties of hardened RCC are similar to those of mass concrete. However,
some differences between RCC and mass concrete exist, primarily due to the
differences in required strength, performance and voids content of the RCC
mixtures. Most RCC mixtures are not air-entrained and also may use aggregates not
meeting the quality or grading requirements of conventional mass concrete. RCC
mixtures may also use pozzolans, which affect the rate of strength gain and heat
generation of the mix. Because some RCC mixtures may use lower quality
aggregates and lower cementitious materials contents (than conventional
concretes), the range of hardened properties of RCC is wider than the range of
properties of conventional concrete [3].
2.2.1 Workability
The capacity of RCC to be placed and compacted successfully without harmful
segregation is called workability. Moreover, workability of RCC contains the
concepts of compactability and, to some degree, moldability and cohesiveness.
Workability of RCC is affected by the same factors that affect the conventional
concrete (i.e., cement content, water content, the presence of chemical and mineral
admixtures, and the grading, particle shape, and relative proportions of coarse and
fine aggregates). However, the effect of each factor will not be the same for RCC as
for conventional concrete [7].
The workability of RCC cannot be measured or judged in the same way that the
placeability of conventional concrete is indexed to the slump test. The slump test is
not meaningful for concrete intended for roller compaction since the correct mixture
has no slump [7]. When there is sufficient paste to fill aggregate voids, workability of
RCC mixtures is normally measured on a vibratory table with a Vebe apparatus in
accordance with ASTM C 1170 [3].
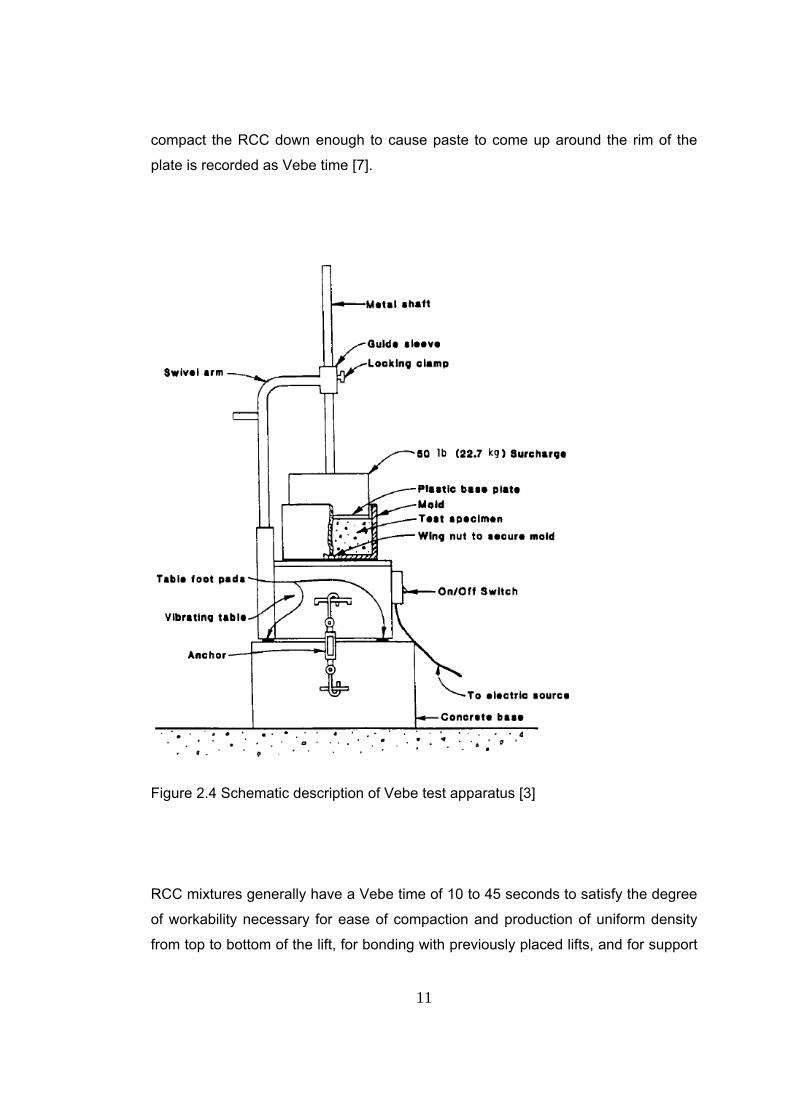
The ASTM modified Vebe device which is given in Figure 2.4, sets a 22.7 kg flat
surcharge plate over a fresh sample of the mix after the RCC has been placed into
the cylindrical Vebe container. The diameter of the plate is slightly smaller than the
inside diameter of the Vebe container. The length of time required for the weight to
11
compact the RCC down enough to cause paste to come up around the rim of the
plate is recorded as Vebe time [7].
Figure 2.4 Schematic description of Vebe test apparatus [3]
RCC mixtures generally have a Vebe time of 10 to 45 seconds to satisfy the degree
of workability necessary for ease of compaction and production of uniform density
from top to bottom of the lift, for bonding with previously placed lifts, and for support
12
of compaction equipment [3]. However, it was realised in literature that, RCC
mixtures have been proportioned with a wide range of workability levels other than
what is provided above. Some RCC mixtures have contained such low paste volume
that workability could not even be measured by the Vebe apparatus. This is
particularly true of those mixtures designed more as a cement stabilized fill.
Workability of these types of mixtures are judged by observations during placement
and compaction, together with compacted density and moisture content
measurements.
According to Schrader [6], dry consistency RCC mixtures which are at or near
optimum moisture have Vebe times between 30 to 60 seconds, whereas wet
consistency mixes have between 10 to 20 seconds. He concluded further that for
embankment materials and soils there is an “optimum” moisture where the greatest
density and mimimum voids occurs. The “optimum” moisture should be considered
as the absolute minimum water content for the mix, regardless of the cement
content. For RCC aggregates, the “optimum” water content is generally about 100
kg of water per cubic meter of compacted material.
Advantages of the drier consistency mixtures include somewhat greater economy
through more efficient use of cementing materials and less surface deterioration and
deformation during placement [7]. The water demand for a specific level of
workability will be influenced by the size, shape, texture and gradation of
aggregates, the volume and nature of cementitious and fine materials [3].
2.2.2 Unit Weight The unit weight of RCC depends primarily on the specific gravity of the aggregate
and the amount of voids in the RCC mass. The lack of entrained air and lower water
content of many RCC mixtures results in a slightly higher density when compared to
conventional air-entrained mass concrete made with the same aggregate. Fully
compacted RCC has a low air content (generally 0.5 to 2.0%) and a low water
content. More solids occupy a unit volume and the increased density is
13
approximately 1 to 3% more than conventional concrete and routinely exceeds 2400
kg/m3 [3].
2.2.3 Compressive Strength Compressive strength tests are performed in the design phase to determine mixture
proportion requirements, and also to optimize combinations of cementitious
materials and aggregates. For RCC, compressive strength is used to satisfy design
loading requirements and also as an indicator of other properties such as durability.
Tests of cores from test sections may be used to evaluate strength of RCC for
design purposes, and also to evaluate the effects of compaction methods. During
construction, compressive strength tests are used to confirm design properties as a
tool to evaluate mixture variability. Cores are also used to further evaluate long-term
performance [3]. Like conventional concrete, the compressive strength of RCC is
predominantly affected by the water content, cementitious material content,
properties of the cementitious materials, the aggregate grading, and the degree of
compaction. Use of pozzolans can delay the early strength development of RCC.
Higher pozzolan contents cause lower early strength. However, mixtures
proportioned for later age strengths, such as at 180 days or 1 year, can use
significant quantities of pozzolan [3].
Furthermore, RCC mixtures with low cementitious contents may not achieve
required strength levels if aggregate voids are not completely filled. For these
mixtures, it was shown that the addition of nonplastic fines or rock dust has been
beneficial in filling voids, thus increasing the density and strength. Use of plastic
(clay) fines in RCC mixtures has been shown to adversely affect strength and
workability and therefore is not recommended [3].
Moreover, significant differences in compaction will affect the strength of RCC in
both the laboratory and in core samples from in-place construction. For laboratory
specimens, the energy imparted to the fresh mixture must be sufficient to achieve
full compaction, or strength will not reach the required level due to uneliminated
voids. The compactive effort in the laboratory will be compared to cores during the
14
test section phase of construction, provided that the test section has sufficient
strength for cores to be taken. The compressive strength of concrete will also
decrease due to insufficient compaction, usually near the bottom of the lift. Not only
does this affect compressive strength, but also bond strength and joint seepage.
Compressive strength will also decrease due to delays in completing compaction [3].
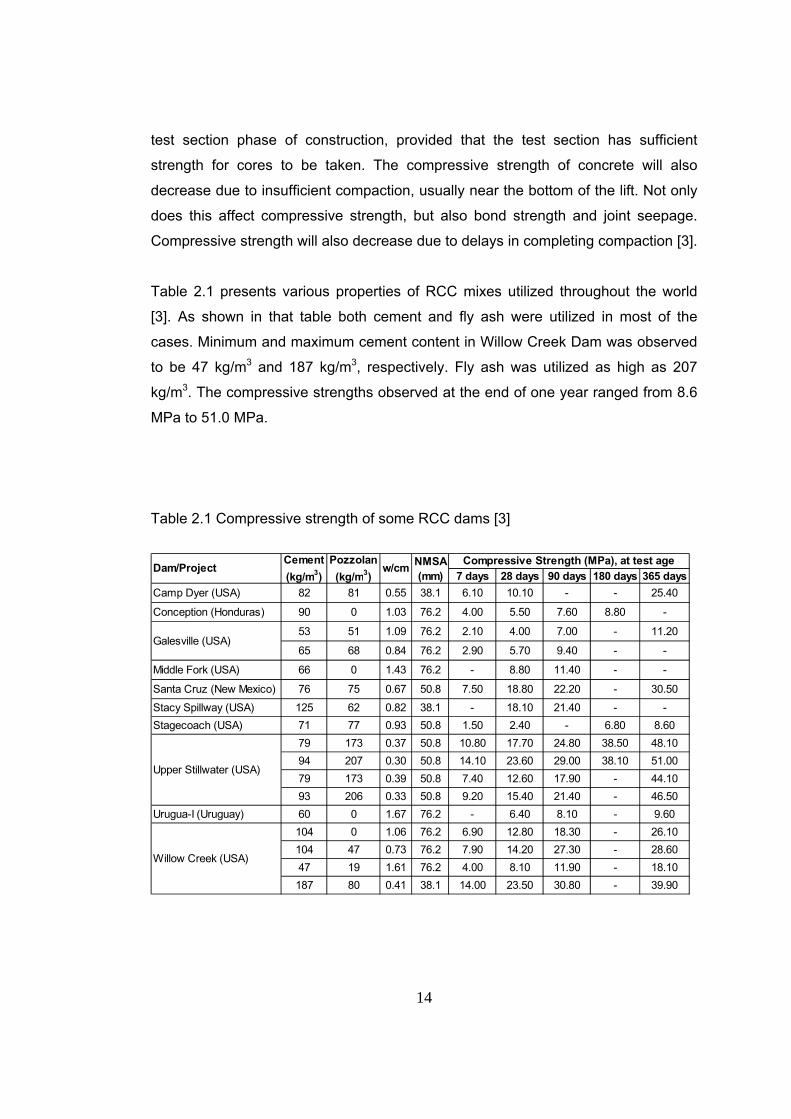
Table 2.1 presents various properties of RCC mixes utilized throughout the world
[3]. As shown in that table both cement and fly ash were utilized in most of the
cases. Minimum and maximum cement content in Willow Creek Dam was observed
to be 47 kg/m3 and 187 kg/m3, respectively. Fly ash was utilized as high as 207
kg/m3. The compressive strengths observed at the end of one year ranged from 8.6
MPa to 51.0 MPa.
Table 2.1 Compressive strength of some RCC dams [3]
7 days 28 days 90 days 180 days 365 daysCamp Dyer (USA) 82 81 0.55 38.1 6.10 10.10 - - 25.40
Conception (Honduras) 90 0 1.03 76.2 4.00 5.50 7.60 8.80 -
53 51 1.09 76.2 2.10 4.00 7.00 - 11.20
65 68 0.84 76.2 2.90 5.70 9.40 - -
Middle Fork (USA) 66 0 1.43 76.2 - 8.80 11.40 - -
Santa Cruz (New Mexico) 76 75 0.67 50.8 7.50 18.80 22.20 - 30.50
Stacy Spillway (USA) 125 62 0.82 38.1 - 18.10 21.40 - -Stagecoach (USA) 71 77 0.93 50.8 1.50 2.40 - 6.80 8.60
79 173 0.37 50.8 10.80 17.70 24.80 38.50 48.1094 207 0.30 50.8 14.10 23.60 29.00 38.10 51.0079 173 0.39 50.8 7.40 12.60 17.90 - 44.1093 206 0.33 50.8 9.20 15.40 21.40 - 46.50
Urugua-I (Uruguay) 60 0 1.67 76.2 - 6.40 8.10 - 9.60104 0 1.06 76.2 6.90 12.80 18.30 - 26.10104 47 0.73 76.2 7.90 14.20 27.30 - 28.6047 19 1.61 76.2 4.00 8.10 11.90 - 18.10187 80 0.41 38.1 14.00 23.50 30.80 - 39.90
Compressive Strength (MPa), at test age
Galesville (USA)
Upper Stillwater (USA)
Willow Creek (USA)
Dam/ProjectCement (kg/m3)
Pozzolan (kg/m3)
w/cm NMSA (mm)
15
Compressive strength from cores of RCC follows the standard relationship of core
strength to cylinder strength from conventional concrete, but may vary more widely
depending on mixture workability, compaction effectiveness, cylinder preparation
methods, and other factors. Core and cylinder (l / d = 2) testing on a number of RCC
dams is reported to provide an overall average of core compressive strength equal
to about 75% of the equivalent age cylinder compressive strength [7].
In some projects where low workability RCC mixtures were used, the cylinder
strengths have been lower than the core compressive strengths due to difficulty in
adequately compacting test cylinders (ASTM C1435-99 [8]). Coefficient of variations
(COV) of RCC compressive strength specimens cast during construction have
varied widely, depending primarily on the mixture workability. COV is generally used
more frequently than standard deviation, due to the commonly low-strength mixtures
used on dams. Like conventional mass concrete, COV of RCC tends to decrease
with later ages of testing [7].
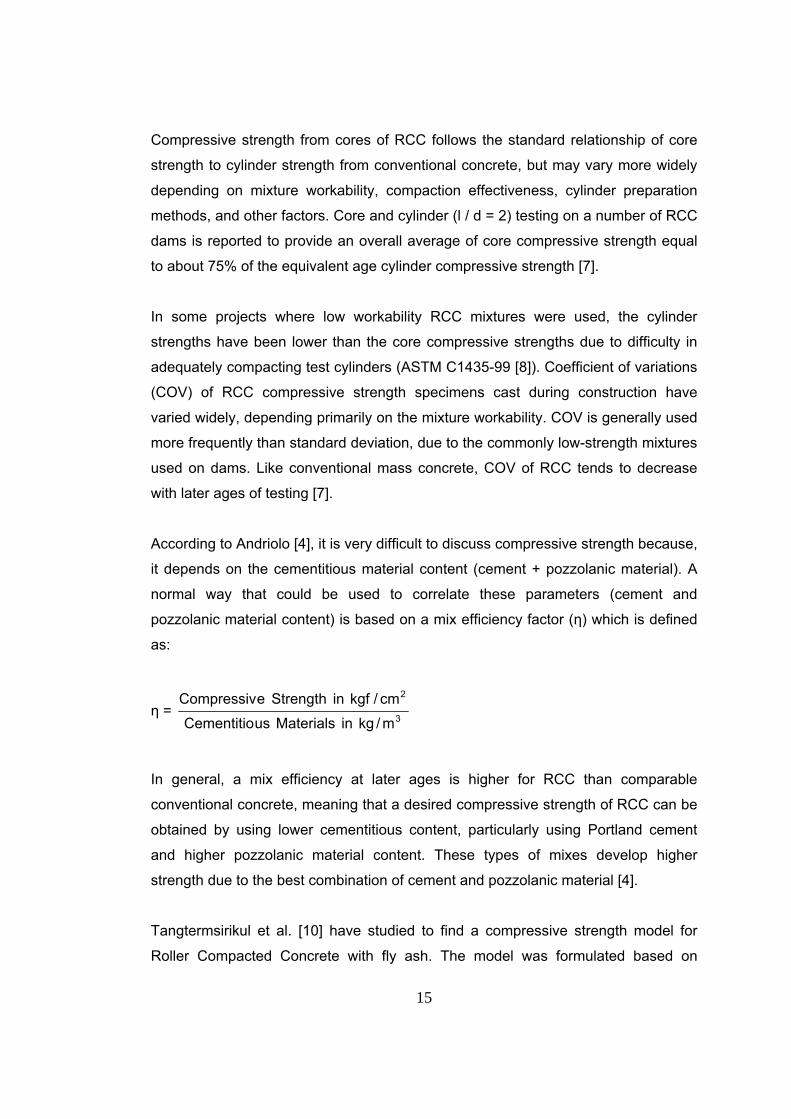
According to Andriolo [4], it is very difficult to discuss compressive strength because,
it depends on the cementitious material content (cement + pozzolanic material). A
normal way that could be used to correlate these parameters (cement and
pozzolanic material content) is based on a mix efficiency factor (η) which is defined
as:
η = 3
2
m/kginMaterialsusCementitio
cm/kgfinStrengtheCompressiv
In general, a mix efficiency at later ages is higher for RCC than comparable
conventional concrete, meaning that a desired compressive strength of RCC can be
obtained by using lower cementitious content, particularly using Portland cement
and higher pozzolanic material content. These types of mixes develop higher
strength due to the best combination of cement and pozzolanic material [4].
Tangtermsirikul et al. [10] have studied to find a compressive strength model for
Roller Compacted Concrete with fly ash. The model was formulated based on
16
quantities of concrete ingredients, chemical compositions and physical properties of
cement and fly ash. They reported that at room temperature of 28 ± 3°C the
proposed model could be used to predict compressive strength of the tested
mixtures of RCC with fly ash designed for dams and road pavements at the ages
between 3 and 91 days with satisfactory accuracy.
2.2.4 Tensile Strength Tensile strength of RCC is required for design purposes, including dynamic and
thermal analysis. The ratios of tensile-to-compressive strength for parent (unjointed)
RCC mixtures have typically ranged from approximately 5 to 15%, depending on
aggregate quality, strength, age, and test method. Mixtures with low cementitious
materials content, or those with lower-quality or coated aggregates, or both, will
have corresponding lower direct tensile strengths. The ratio of direct tensile strength
to compressive strength of both RCC and conventional mass concrete will usually
decrease with increasing age and compressive strength [3].
The direct tensile strength of RCC is less than the splitting tensile strength of
unjointed RCC. The direct tensile strength of RCC lift joints (the horizontal line in
between compacted RCC layers) is not only dependent on the strength of the
mixture, but also on the speed of construction, the lift-joint surface preparation,
degree of compaction and segregation at the lift interface, and the use of a bonding
mixture on the lift surface. Inadequate lift-surface cleanup, poor consolidation, or
both, can drastically reduce the direct tensile strength across lift lines. With
adequate attention to lift surface preparation, the direct tensile strength of RCC lift-
joints average has been assumed to about 5% of the compressive strength. The
splitting tensile strength of the parent (unjointed) RCC has been assumed to be
approximately 10 percent of the compressive strength [3].
Lift joints are the weakest locations in RCC, as in conventional mass concrete,
structures. Hence, the tensile strength at the lift joints is the critical tensile property
for RCC. Direct tensile strength is the pertinent tensile test for lift joint tensile
strength. Splitting tensile testing of horizontal cores has been used to establish joint
17
strength; however, identification and location of the joint in the central portion of the
core, for correct performance of the test, is reported to be very difficult [7].
2.2.5 Permeability
The permeability of RCC is largely dependent upon voids in the compacted mass,
together with porosity of the mortar matrix, and therefore is almost totally controlled
by mixture proportioning, placement method, and degree of compaction. RCC will
be relatively impervious when the mixture contains sufficient paste and mortar with
an adequate fine-particle distribution that minimizes the air void system. In general,
an unjointed mass of RCC proportioned with sufficient paste will have permeability
values similar to conventional mass concrete. Test values typically range from 0.15
to 15 x 10-11 m/s. High cementitious mixtures tend to have lower permeability than
low cementitious mixtures [3].
If seepage occurs in RCC dams, it usually occurs mainly along the horizontal lift
joints rather than through the compacted and unjointed mass. If seepage occurs
along horizontal lift joints, it also indicates a reduction in shear and tensile strength
at this location [3]. For example at Willow Creek (USA), water is reported to appear
on the downstream face of the dam 12 hours after impounding [2].
According to Andriolo, the permeability coefficient of tested construction joints
ranged from 1x10⁻⁹ m/s to 1x10-11 m/s, which is comparable to that of conventional
concrete. As with the permeability apparatus at Capanda Laboratory it was shown
that RCC permeability coefficients ranges from 10-6 m/s to 10-12 m/s with
cementitious content from 60 kg/m3 to 250 kg/m3, as compared to 10-9 m/s to 10-12
m/s for CVC, with similar cementitious content [4].
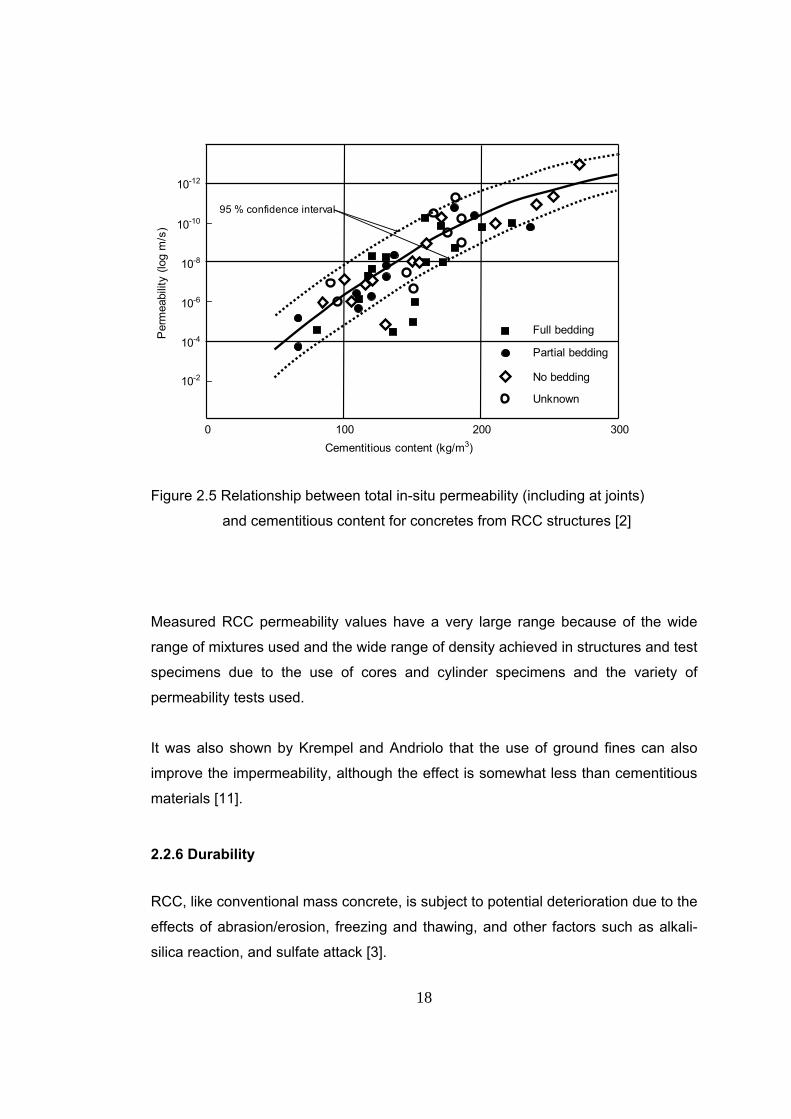
Figure 2.5 shows the results of in-situ permeability testing on 49 different water-
retaining RCC structures from 18 different countries taken from ICOLD Bulletin 126
[2]. Total in-situ permeability (including that at joints) ranging from 10–4 to 10–13 m/s
has been found and there is a consistent relationship between the permeability and
the cementitious content [2].
18
Per
mea
bilit
y (lo
g m
/s)
Full bedding
Partial bedding
No bedding
Unknown
10-12
10-10
10-8
10-6
10-4
10-2
0 100 200 300Cementitious content (kg/m3)
95 % confidence interval
Figure 2.5 Relationship between total in-situ permeability (including at joints)
and cementitious content for concretes from RCC structures [2]
Measured RCC permeability values have a very large range because of the wide
range of mixtures used and the wide range of density achieved in structures and test
specimens due to the use of cores and cylinder specimens and the variety of
permeability tests used.
It was also shown by Krempel and Andriolo that the use of ground fines can also
improve the impermeability, although the effect is somewhat less than cementitious
materials [11].
2.2.6 Durability RCC, like conventional mass concrete, is subject to potential deterioration due to the
effects of abrasion/erosion, freezing and thawing, and other factors such as alkali-
silica reaction, and sulfate attack [3].
19
Abrasion/erosion resistance of RCC is primarily governed by its compressive
strength and the quality of the aggregate it contains. RCC pavements at heavy-duty
facilities such as log storage yards and coal storage areas have shown little wear
from traffic and industrial abrasion under severe conditions [3]. The North Fork
Toutle River Debris Dam spillway showed only surface wear after being subjected to
extraordinary flows of highly abrasive grit, timber and boulders. This structure was
constructed with RCC containing good quality small-size aggregate and a higher
cement content than normally used in mass RCC construction (300 kg/m3).
Additional abrasion/erosion damaged the top lift of the RCC spillway [3].
ASTM C 1138 has been used to evaluate the erosion resistance of both
conventional concrete and RCC [12]. This procedure results in values of concrete
volume (or average depth) loss at 12 hours increments up to conclusion of the test
at 72 hours. Abrasion-erosion percent loss after 72 hours can be expected to range
from about 3 to 15% (higher values for lower strength mixtures) for workable RCC
mixtures with good to excellent quality aggregates [7].
RCC mixtures do not normally have entrained air, and consequently will not have a
high freeze-thaw resistance in a critically saturated moisture condition. Many
examples of good field performance is reported to exist. However, RCC without air-
entrained admixture subjected to ASTM C 666, Procedure A, is reported to perform
very poorly [13].
Gao et al. have studied frost resistance of RCC with fly ash. They have found a
relationship between the air void spacing factor and the frost resistance of RCC.
When the spacing factor is below 0.4 mm, high frost resistance RCC with fly ash is
obtained and it is unnecessary to prescribe an air void of spacing factor less than
0.25 mm for RCC [14].
2.2.7 Heat Generation RCC mixture proportioning for massive structures must consider the heat generation
of the cementitious materials. To minimize the heat of hydration, care should be
20
taken in the selection and combination of cementing materials used. In cases where
pozzolan is used, it may be worthwhile to conduct heat of hydration testing on
various percentages of cement and pozzolan to identify the combination that
generates the minimum heat of hydration, while providing satisfactory strength, prior
to proportioning the mixture. The amount of cementitious material used in the
mixture should be no more than necessary to achieve the necessary level of
strength. Proportioning should incorporate those measures which normally minimize
the required content of cementitious material, such as appropriate NMSA (nominal
maximum size aggregate) and well-graded aggregates [3].
Studies of the heat generation and temperature rise of massive RCC placements
indicate that the sequential and rapid placement of thin layers can have a beneficial
effect on crack reduction due to the more consistent temperature distribution
throughout the mass when compared to more traditional ways of placing large
volumes of concrete [7].
2.3 Materials RCC differs from traditional concrete principally in that it has a consistency that will
support a vibratory roller and an aggregate grading and paste content suitable for
compaction by such a roller. The objective of the selection of the materials for, and
design of the mixture proportions of, an RCC is to provide a stable concrete that
meets all the in-situ strength, durability, and permeability requirements of the
structure [2].
A wide range of materials can be used in the production of RCC. However, because
some material constraints may not be necessary for RCC, the application is less
demanding, more material options and subsequent performance characteristics are
possible [3].
Materials used for RCC include cementitious materials (Portland cement and
pozzolans such as fly ash), aggregates, water, and admixtures. This section will
summarize the properties of ingredients that are used in RCC production.
21
2.3.1 Cements RCC can be made with any of the basic types of Portland cement. For mass
applications, cements with a lower heat generation than ASTM C 150 [16], Type I
are beneficial. They include ASTM C 150, Type II (moderate heat of hydration) and
Type V (sulfate-resistant) and blended cements as described in ASTM C 595 [17],
Type IP (Portland-pozzolan cement) and Type IS (Portland-blast furnace slag
cement). Strength development for these cements is usually slower than for Type I
at early ages, but higher strengths than RCC produced with Type I cement are
ultimately produced [3].
Heat generation due to hydration of the cement is typically controlled by use of lower
heat of hydration cements, use of less cement, and replacement of a portion of the
cement with pozzolan or a combination of these. On the other hand, reduction of
peak concrete temperature may be achieved by other methods, such as reduced
placement temperatures. The selection of cement type is considered regarding the
economics of cement procurement. For small and medium sized projects, it may not
be cost effective to specify a special lower heat cement which is not locally
available. Due to the high production capability of RCC, special attention may be
required to ensure a continuous supply of cement to the project [3].
Cementitious contents used in RCC dams have ranged from 60 kg/m3 of cement
used for the Urugai Dam in Argentina to 248 kg/m3 for the predominant mix at Upper
Stillwater Dam in U.S.A. [5].
The proportion of the various types of cement that have been used in RCC dams
are shown below. The data were based on the 157 RCC dams that had been
completed by the end of 1996. The majority of the dams for which the type of
cement is not known are relatively small and it is probable that the cement used was
Ordinary Portland cement [2].
Ordinary Portland cement (ASTM Type I) (29.3%)
Moderate-heat cement (ASTM Type II) (28.7%)
22
Portland pozzolan cement (fly ash) (3.8%)
Portland pozzolan cement (natural pozzolan) (7.0%)
Portland blast-furnace slag cement (1.3%)
Sulphate-resisting cement (ASTM Type V) (1.9%)
None (4.5%)
Unknown (23.6%)
Shouxian et al. [18] have studied the properties of low Portland cement clinker
content RCC and found that RCC mixtures using low heat of hydration cement in
which fly ash was used to provide 67% of the cementitious content had a
compressive strength of 18 MPa at age of 90 days. Moreover, RCC containing 26
kg/m3 Portland cement clinker had low heat of hydration, therefore temperature
control measures could simplify to speed up the construction.
2.3.2 Pozzolans At first, the selection of a pozzolan suitable for RCC should be based on its
conformance with ASTM C 618 [19]. Pozzolans meeting the specifications of ASTM
C 618 for Class C, Class F, and Class N have been successfully used in RCC
mixtures. Class F and Class N pozzolans are usually preferred, since they normally
contribute less heat of hydration than Class C and have greater sulfate resistance.
For Class C pozzolans, more attention may be needed with regard to setting time,
sulfate resistance, and free lime content. The use of pozzolan will depend on
required material performance as well as on its cost and availability at each project
site [3].
Use of a pozzolan in RCC mixtures may serve one or more of the following
purposes:
As a partial replacement for cement to reduce heat generation as well as
cost
As an additive to provide supplemental fines for mixture workability and
paste volume
23
As a partial replacement for cement to increase durability
The rate of cement replacement may vary from 0 to 80 percent, by mass. RCC
mixtures with a higher content of cementitious material often use larger amounts of
pozzolan to replace Portland cement in order to reduce the internal temperature rise
that would otherwise be generated and consequently reduce thermal stresses [3].
In RCC mixtures that have a low cement content, pozzolans have been used to
ensure an adequate amount of paste for filling aggregate voids and coating
aggregate particles. Pozzolan may have limited effectiveness in low-cementitious
content mixtures with aggregates containing deleterious amounts of clay and friable
particles. While the pozzolan enhances the paste volume of these mixtures, it may
not enhance the long-term strength development because of insufficient availability
of calcium hydroxide released from the Portland cement for a pozzolanic reaction
[3].
Class F pozzolans, especially at cool temperatures, generally delay the initial set of
RCC mixtures, contributing to low early strength, but extending the working life of
the freshly compacted RCC layer. In high pozzolan-content RCC mixtures, the heat
rise may continue for up to 60 to 90 days after placing [3].
Kunhe et al. [20] studied the late age properties of RCC with low cement content
and high class F fly ash content. It was found that the hydration of class F fly ash
would proceed with increasing age and the pore structure of RCC was improved
continuously.
Moreover, in another study it was found that when the content of fly ash increased
from 0 to 30% and 50%, the compressive strength of RCC decreased at early ages
of 7 and 28 days, but with 50% fly ash strengths are higher than with 30% fly ash or
without fly ash at 90 days [21].
24
2.3.3 Aggregates The selection of aggregates and the control of aggregate properties and grading are
important factors influencing the quality and uniformity of RCC production.
Aggregates similar to those used in conventional concrete have been used in RCC.
However, aggregates that do not meet the normal standards or requirements for
conventional concrete have also been successfully used in RCC dam construction
[3].
Marginal aggregates are those aggregates that do not meet traditional standards,
such as ASTM C 33, regardless of the method of construction [22]. Limits on
physical requirements and on deleterious materials for aggregates to be used in
RCC for a specific application should be established prior to construction, based on
required concrete performance and demonstrated field and laboratory evaluations.
The majority of RCC projects have been constructed with aggregates meeting all of
the ASTM C 33 requirements, with the exception of an increased amount of fines
passing the No. 200 (0.075 mm) sieve [3].
Aggregates of marginal quality have been used in RCC on some projects because
they were close to the site and thereby the most economical source available. The
design of the structure must accommodate any change in performance that may
result. On some projects, the use of aggregates of lower physical strength has
produced RCC with satisfactory creep rates, modulus of elasticity, and tensile strain
capacity. These properties are desirable for mass-concrete applications where lower
concrete strength can be tolerated. If practical, lower-quality aggregates are best
used in the interior of dams where they can be encapsulated by higher-quality
concrete, especially in freeze thaw areas [3].
In conventional concrete, the presence of a significant quantity of flat and elongated
particles is usually undesirable. However, RCC mixtures appear to be affected less
by flat and elongated particles than conventional concrete mixtures. This peculiarity
is because vibratory compaction equipment provides more energy than traditional
consolidation methods, and because the higher mortar content in RCC mixtures
25
tends to separate coarse aggregate particles. The U.S. Army Corps of Engineers
currently has a limit of 25% on the allowable content of flat and elongated particles
in any size group. The use of manufactured aggregate (crushed stone) has been
found to reduce the tendency for segregation, as compared to rounded gravels [3].
A basic objective in proportioning any concrete is to incorporate the maximum
amount of aggregate and minimum amount of water into the mixture, thereby
reducing the cementitious material quantity, and reducing consequent volume
change of the concrete. This objective is accomplished by using a well-graded
aggregate with the largest maximum size which is practical for placement. The
proper combination of materials should result in a mixture that achieves the desired
properties with adequate paste and a minimum cementitious content. However, in
RCC mixtures, the potential for segregation and the means of compaction must also
be primary considerations in selecting the maximum size of aggregate. Early
projects in the U.S. used a 75 mm NMSA; however, a 50 mm NMSA is less prone to
segregation and is becoming more widely used [3].
The combined aggregate gradation is often selected to minimize segregation. The
key to controlling segregation and providing a good compactable mixture is having a
grading that is consistent and contains more material passing the No. 4 (4.75 mm)
sieve than typical in conventional concrete of similar nominal maximum size
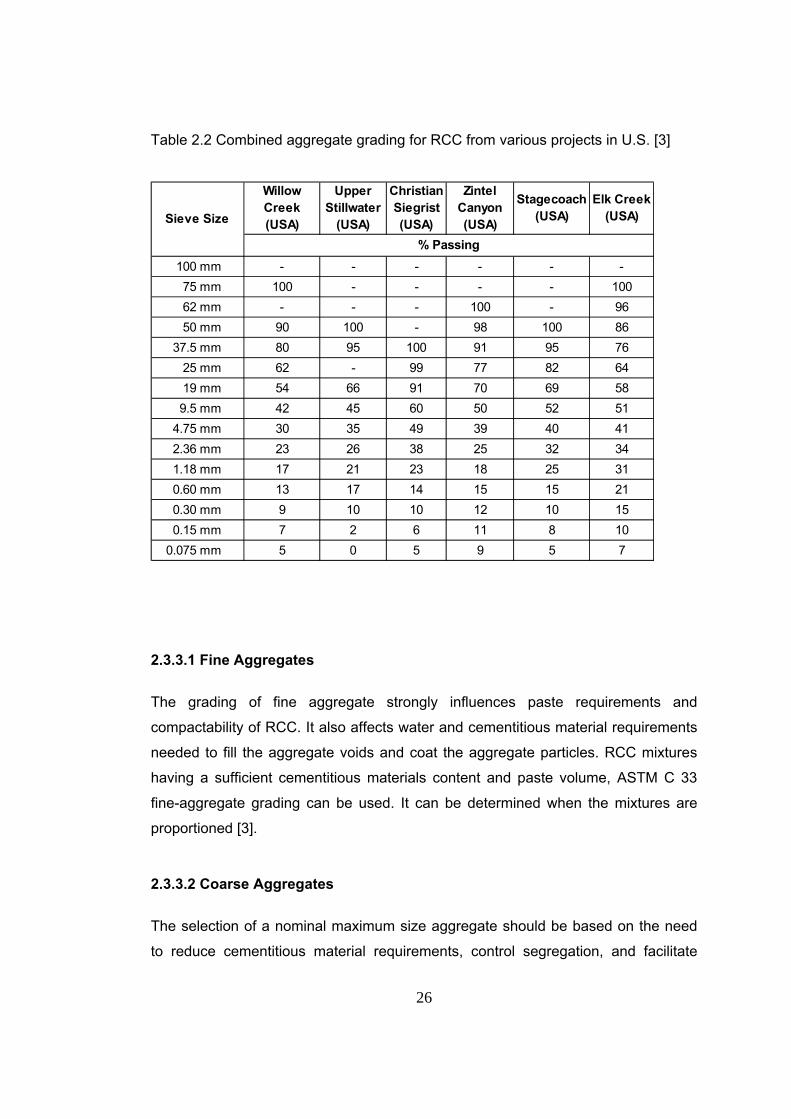
aggregate. Table 2.2 provides typical combined aggregate grading for various
projects taken from ACI 207.5R-99 [3].
26
Table 2.2 Combined aggregate grading for RCC from various projects in U.S. [3]
100 mm - - - - - -75 mm 100 - - - - 10062 mm - - - 100 - 9650 mm 90 100 - 98 100 86
37.5 mm 80 95 100 91 95 7625 mm 62 - 99 77 82 6419 mm 54 66 91 70 69 589.5 mm 42 45 60 50 52 51
4.75 mm 30 35 49 39 40 412.36 mm 23 26 38 25 32 341.18 mm 17 21 23 18 25 310.60 mm 13 17 14 15 15 210.30 mm 9 10 10 12 10 150.15 mm 7 2 6 11 8 10
0.075 mm 5 0 5 9 5 7
% Passing
Sieve SizeElk Creek
(USA)
Willow Creek (USA)
Upper Stillwater
(USA)
Christian Siegrist (USA)
Zintel Canyon (USA)
Stagecoach (USA)
2.3.3.1 Fine Aggregates The grading of fine aggregate strongly influences paste requirements and
compactability of RCC. It also affects water and cementitious material requirements
needed to fill the aggregate voids and coat the aggregate particles. RCC mixtures
having a sufficient cementitious materials content and paste volume, ASTM C 33
fine-aggregate grading can be used. It can be determined when the mixtures are
proportioned [3].
2.3.3.2 Coarse Aggregates The selection of a nominal maximum size aggregate should be based on the need
to reduce cementitious material requirements, control segregation, and facilitate
27
compaction. Most RCC projects have used a NMSA of 37.5 mm to 75 mm. There
has typically not been enough material cost savings from using aggregate sizes
larger than 75 mm to offset the added batching cost and cost of controlling the
increased segregation problems associated with the larger aggregates. NMSA has
little effect on compaction when the thickness of the placement layers is more than 3
times the NMSA, segregation is adequately controlled, and large vibratory rollers are
used for compaction [3].
Grading of coarse aggregate usually follows ASTM C 33 size designations. Cost
savings can be realized by combining two or more size ranges such as ASTM C 33
size designations 357 or 467 for 50 mm to No. 4 (4.75 mm) and 37.5 mm to No. 4
(4.75 mm), respectively. However, as the size range increases, it becomes
increasing difficult to avoid segregation of the larger particles during stockpiling and
handling of this aggregate. Aggregate for RCC have used a single stockpile or been
separated into as many as five aggregate sizes. Some projects simply use a coarse
and a fine aggregate stockpile [3].
The design engineer must weigh the potential cost savings in a reduction in number
of stockpiles and separate handling and weighing facilities against the potential for
increased variation in aggregate grading and its impact on uniformity of consistency,
strength, on bonding, and on permeability of the resulting RCC [3].
According to data, based on 128 of the 157 RCC dams which had been completed
at the end of 1996 which is taken from ICOLD Bulletin 126, the maximum sizes of
aggregates are proportioned as follows;
125-150 mm 6.3%
100-124 mm 0.8%
80-99 mm 36.7%
60-79 mm 29.7%
45-59 mm 14.1%
30-44 mm 10.9%
< 29 mm 1.5%
28
All the 100 mm+ aggregates have been used in RCD dams. The most popular
maximum size is in the 75- to 80-mm size, although there seems to be a trend
towards smaller sizes because of the problem of segregation. The maximum size is
tending towards 50 to 60 mm for crushed aggregate and about 40 to 50 mm for
natural gravel. The maximum size of aggregate is not related to layer thickness nor
compaction machinery. Compactability is governed primarily by the workability of the
concrete. It should also be noted that less-workable mixes tend to segregate more
than more-workable mixes, with a modified Vebe time less than 20 seconds. Modern
vibratory rollers can compact rock-fill in layers of more than one meter to a high
density with a maximum particle size of 400 mm and more [2], therefore compaction
of 50 - 60 mm will not be a problem.
2.3.3.3 Fines In low-cementitious materials content mixtures, supplemental fines, material passing
the No. 200 (0.075 mm) sieve, are usually required to fill all the aggregate void
spaces. Depending on the volume of cementitious material and the NMSA, the
required total minus No. 200 (0.075 mm) fines may be as much as 10% of the total
aggregate volume, with most mixtures using approximately 3 to 8%. Characteristics
of the fines and fines content will affect the relative compactability of the RCC
mixture and can influence the number of passes of a vibratory roller required for full
compaction of a given layer thickness. Regardless of whether it is accomplished by
adding aggregate fines, cement, pozzolan, or combination of these, most
compactable RCC mixtures contain approximately 8 to 12% total solids finer than
the No. 200 (0.075 mm) sieve by volume, or 12 to 16% by mass. The fines fill
aggregate void space, provide a compactable consistency, help control segregation,
and decrease permeability. Including aggregate fines in low-cementitious paste
mixtures allows reductions in the cementitious materials content. Excessive
additions of aggregate fines after the aggregate voids are filled typically are harmful
to the RCC mixture because of decreases in workability, and increased water
demand and subsequent strength loss [3].
29
When adding aggregate fines to a mixture, another consideration is the nature of the
fines. Crusher fines and silty material are usually acceptable. However, clay fines,
termed plastic fines, can cause an increase in water demand and a loss of strength,
and produce a sticky mixture that is difficult to mix and compact [3].
In Japan, Suzuki et al. have showed that by mixing the filler of 7.5% quantity, the
vibrating compacting value (obtained from vibrating hammer test in seconds used
for granular soils) of RCD was dropped a quantity, and compacting become easy
and the compressive strength was increased [23].
There are exceptions where the fines have not been beneficial, or where there is a
very clear optimum content or clear maximum that should not be exceeded. For
example, the Tongue River tests showed that it would have been appropriate to limit
the maximum amount of fines to 7% rather than 8%. Another example is the Agos
project. Tests with those materials showed that added fines which were
manufactured from the primarily greywacke gravels, had a very slight negative effect
on strength [6].
2.4 Mix Design Methods There are a number of methods that can be used for the selection of the mixture
proportions of RCC. Most of these fall under two general headings; the “concrete”
approach in which the water/cementitious ratio is considered, and the “soils”
approach in which the mixture is designed using a moisture/density relationship.
Both approaches are intended to produce quality concrete suitable for roller
compaction.
RCC mixture proportions follow the convention used in traditional concrete that is,
identifying the mass of each ingredient contained in a compacted unit volume of the
mixture based on saturated surface dry (SSD) aggregate condition. A practical
reason for use of this standard convention is that most RCC mixing plants require
that mixture constituents be so identified for inputs in the batching-control system.
30
During the design of the early RCC dams, both of these approaches were being
used. However in recent years there has been a swing towards the concrete
approach in a similar way to the swing towards RCC containing higher cementitious
contents. Nevertheless the “soils” approach is still being used by some designers
[2].
The two mix design methods that fall within the soils approach will be called the lean
RCC method and the simplified soils methods. They both start with a desired
grading for the aggregates and involve the preparation of cylinders with varying
cementitious contents to determine strength or other properties. Differences
between two methods center on how the moisture or water content for the mix is
determined and the method for preparation of laboratory test specimens [5].
High paste method, Japanese RCD method and the Corps of Engineers’ method
constitute the concrete approach methods. Because all of the methods are based on
a Vebe time, the basic premise of these methods is that the volume of paste must
exceed the voids in the aggregate. Therefore, there is a greater need to closely
control the aggregate grading to minimize voids and the amount of paste required.
All involve proportioning mixes using absolute volume concepts in which the weights
and specific gravities of all materials are used to calculate a unit volume of concrete.
Concrete approach mix design methods usually involve fixing all but one of the basic
materials (cementitious materials, water, or aggregate content) and then varying that
component until the desired consistency or required properties are achieved. Each
variable can be adjusted this way to optimize mix components [2].
2.4.1 Soils Approach
2.4.1.1 Lean RCC Method
This method is advocated by Schrader [6] and has been used for most lean RCC
dams. It starts with a fixed aggregate grading, varies cementitious contents, and
compares results, primarily compressive strength, with RCC requirements.
31
After selecting the NMSA for the most economical usable gradation, amount of
water used for laboratory trial mixes is determined by observing the consistency of
mixes of varying water contents and by relying on past experience. The water
content is set somewhere between the point on the dry side where voids are no
longer visible on the side of laboratory cylinders, and, on the wet side, before the
mix has a rubbery appearance. After fixing the aggregate and water content,
laboratory cylinders are prepared with varying cementitious contents.
The mix design program prepared by the lean RCC method thus provides a family of
curves that indicate the effects of various cementitious contents on compressive
strength at various ages. The cement content can be selected to meet requirements
with consideration of factor of safety and coefficient of variation. Once a cement
content is selected, additional tests may also be performed with varying aggregate
types or gradings, especially the percentage of fines passing No. 200 (0.075 mm)
sieve [5].
2.4.1.2 Simplified Soils Method This method is explained as Maximum Density Method in ACI 207.5R-99. The
method is quite similar to the lean RCC Method in that it starts with a fixed
aggregate grading and involves a test program of varying cementitious contents and
comparing results once a water content is determined. Instead of determining the
water content by Vebe time or visual performance, the desired water content is
determined by moisture-density relationship of compacted specimens, using ASTM
D 1557, Method D [24]. Variations of this method can also be used depending on the mixture composition
and nominal maximum size of aggregate. Compaction equipment may be a
standard drop hammer, some variation of this equipment better suited for larger-
aggregate mixtures, or an alternate tamping/vibration method that simulates field
compaction equipment and obtains similar densities [3].
32
In this method, a series of mixtures for each cementitious materials content is
prepared and batched using a range of water contents. Each prepared mixture is
compacted with a standard effort. The maximum density and optimum water content
are determined from a plot of density versus water content for the compacted
specimens at each cementitious materials content. The actual water content used is
usually slightly higher (an additional approximately 1%) than the optimum value
determined in the laboratory, to compensate for moisture loss during transporting,
placing, and spreading. RCC specimens are then made at the optimum or the
designated water content for strength testing at each cementitious materials content
[3].
2.4.2 Concrete Approach
2.4.2.1 High Paste Method The method was developed by Dunstan and modified by U.S. Bureau of
Reclamation for the design of the Upper Stillwater Dam in the U.S. The resulting
mixtures from that testing program generally contained high proportions of
cementitious materials, high pozzolan contents, clean and normally graded
aggregates, and high-workability. The purpose of the Upper Stillwater Dam mixtures
was to provide excellent joint bond strength and low joint permeability by providing
sufficient cementitious paste in the mixture to enhance performance at the lift joints
[3].
The high paste method involves determining w/cm and fly ash cement ratios for the
desired strength level and strength gain. The optimum water, fine aggregate, and
coarse aggregate ratios are determined by trial batches, evaluating the Vebe
consistency for a range of 10 to 30 sec. The required volumes and mass of
aggregate, cement, pozzolan, water, and air are then calculated [3].
In designing a mix for a high paste content RCC dam, two conflicting requirements
must be resolved. Sufficient cementitious material is needed to achieve a low
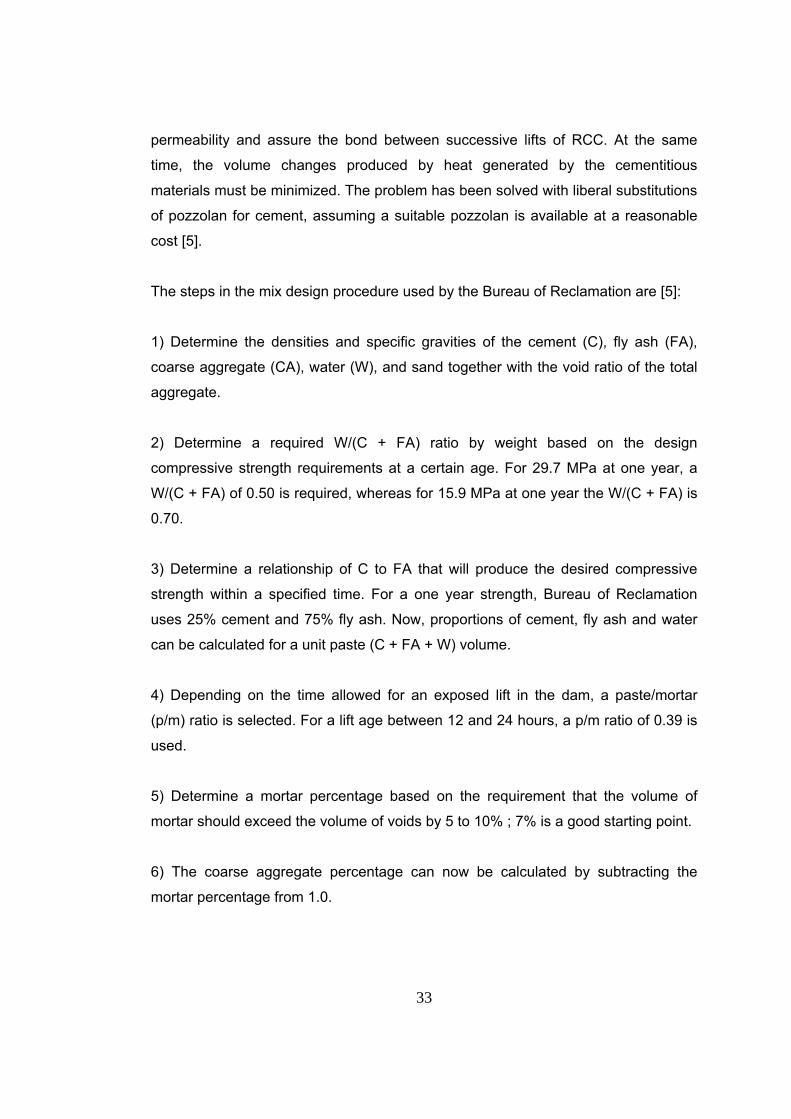
33
permeability and assure the bond between successive lifts of RCC. At the same
time, the volume changes produced by heat generated by the cementitious
materials must be minimized. The problem has been solved with liberal substitutions
of pozzolan for cement, assuming a suitable pozzolan is available at a reasonable
cost [5].
The steps in the mix design procedure used by the Bureau of Reclamation are [5]:
1) Determine the densities and specific gravities of the cement (C), fly ash (FA),
coarse aggregate (CA), water (W), and sand together with the void ratio of the total
aggregate.
2) Determine a required W/(C + FA) ratio by weight based on the design
compressive strength requirements at a certain age. For 29.7 MPa at one year, a
W/(C + FA) of 0.50 is required, whereas for 15.9 MPa at one year the W/(C + FA) is
0.70.
3) Determine a relationship of C to FA that will produce the desired compressive
strength within a specified time. For a one year strength, Bureau of Reclamation
uses 25% cement and 75% fly ash. Now, proportions of cement, fly ash and water
can be calculated for a unit paste (C + FA + W) volume.
4) Depending on the time allowed for an exposed lift in the dam, a paste/mortar
(p/m) ratio is selected. For a lift age between 12 and 24 hours, a p/m ratio of 0.39 is
used.
5) Determine a mortar percentage based on the requirement that the volume of
mortar should exceed the volume of voids by 5 to 10% ; 7% is a good starting point.
6) The coarse aggregate percentage can now be calculated by subtracting the
mortar percentage from 1.0.
34
7) Assuming an entrapped air volume of 1.5%, all the necessary have been
determined to calculate batch weights for 1 m3 of RCC based on saturated surface
dry condition of the aggregates.
8) A trial mix is proportioned in the laboratory and a Vebe time is measured. If the
Vebe time is not in the desired range, adjustments are made in the mix, mainly in
water content. A water content change initiates revisions in other material
proportions, and the mix is adjusted until all basic requirements, including
consistency, are satisfied.
9) The mix can be further refined by more testing. In order to study various
combinations of components such as FA/C, W/(C + FA), (C + FA)/sand, or various
sand gradations, Bureau of Reclamation laboratory uses 51 mm square mortar
cubes while changing one variable and keeping others constant.
2.4.2.2 Japanese RCD Method
The Japanese roller compacted dam (RCD) method was developed by Japanese
engineers and is used primarily in Japan. Criteria for mixes designed for RCD
method include [5]:
1) Cement content should be as low as possible while being consistent with strength
requirements. Some fly ash should be used as an mineral additive to reduce heat of
hydration and mixing water requirements.
2) A sand/aggregate ratio higher than for conventional mass concrete should be
used to reduce segregation and to facilitate compaction by a vibratory roller.
The method incorporates the use of a consistency meter. The consistency meter is
similar to the Vebe apparatus in that RCC mixture is placed in a container and
vibrated until mortar is observed on the surface. The device is sufficiently large to
allow the full mixture, often 150 mm NMSA, to be evaluated rather than having to
screen out the oversize particles. Because of the consistency test equipment
35
requirements and differences in the nature of RCD design and construction, this
method is not widely used in proportioning RCC mixtures outside of Japan [3].
2.4.2.3 Corps of Engineers Method This method is based on experience with mix designs for seven RCC projects and is
described in engineering manual 1110-2-2006 [7]. It basically follows ACI Standard
211.3R, “Standard Practice for Selecting Proportions for No-Slump Concrete” [25].
Both methods calculate mixture quantities from solid volume determinations, as
used in proportioning most conventional concrete. The w/cm and equivalent cement
content are established from figures based on the strength criteria using Fig. 2.6 and
Fig. 2.7 [3].
The approximate water demand is based on nominal maximum size aggregate and
desired modified Vebe time. A recommended fine aggregate content as a
percentage of the total aggregate volume is based on the nominal maximum size
and nature of the coarse aggregate. Once the volume of each ingredient is
calculated, a comparison of the mortar content to recommended values can be
made to check the proportions. This method also provides several unique aspects,
including ideal combined coarse aggregate gradings and fine aggregate gradings
limits incorporating a higher percentage of fine sizes than permitted by ASTM C 33.
Because design strength for many RCC dams is based on 1 year, a target 90- or
180-days strength may be estimated using Fig. 2.6 and Fig. 2.7 [3].
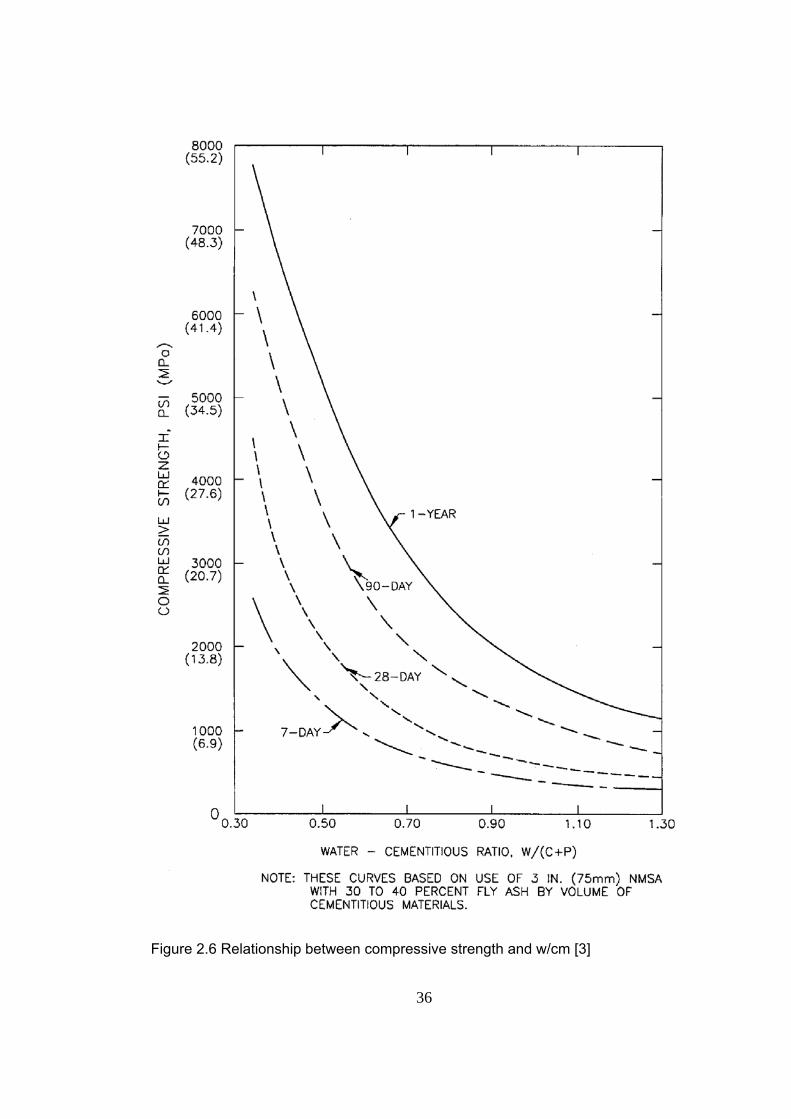
36
Figure 2.6 Relationship between compressive strength and w/cm [3]
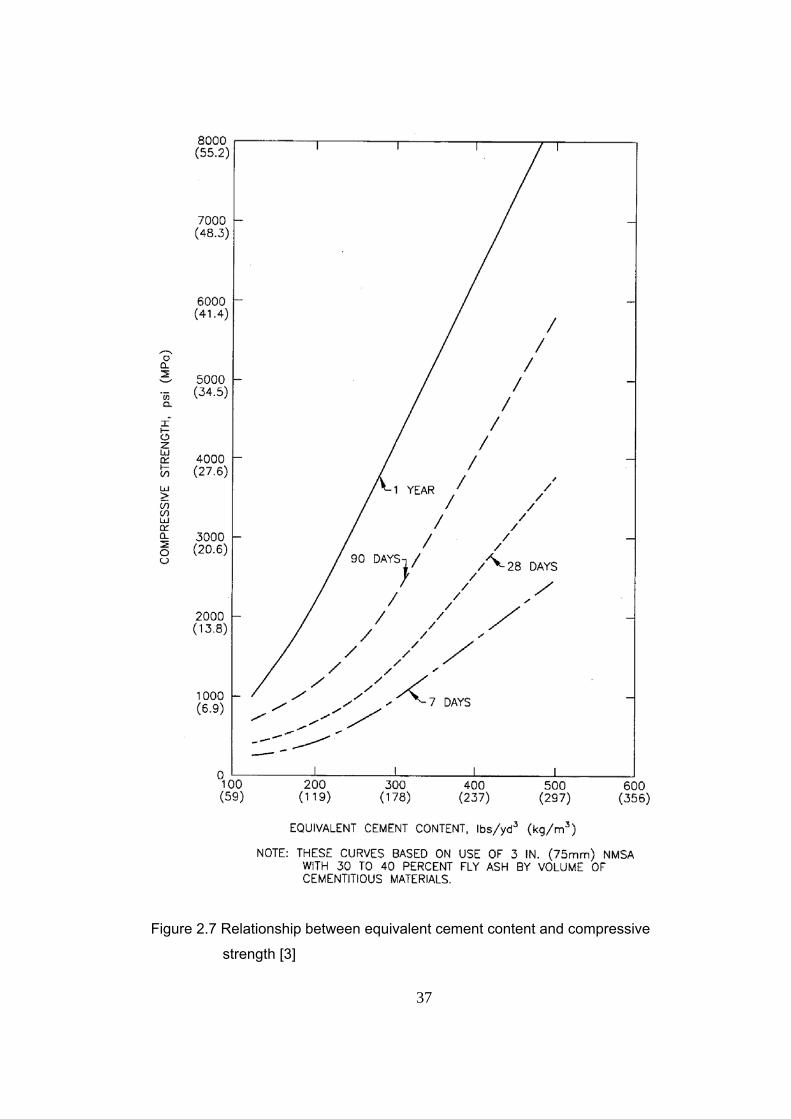
37
Figure 2.7 Relationship between equivalent cement content and compressive
strength [3]
38
2.5 Advantages and Disadvantages of RCC over Conventional Mass Concrete RCC is designed to meet the material strength and durability requirements
established by the structural engineer. The factors that affect the properties of
conventional mass concrete such as water-cement ratio, quality of mixing
ingredients, and degree of consolidation and curing, also affect the material
properties of RCC. The principal difference in the two is the mixture consistency and
the method of consolidation. Internal consolidation using immersion type vibrators is
used for conventional concrete, while external consolidation with spreading
equipment and vibratory rollers is used for RCC. The controls placed on mixture
ingredient selection for conventional mass concrete will apply to RCC. RCC mixture
proportioning procedures are similar to conventional concrete; however, RCC
mixtures will normally contain less water and paste and more sand to limit
segregation [15].
The advantages of RCC in dam construction can be summarized as:
More rapid construction (2.5 to 3 m vertical progress per week can be
achieved in large dams, greater rates have been achieved in smaller dams);
Effective use of conventional equipment (trucks, dozers, vibratory rollers);
A reduced cost of construction as a consequence of the above;
Thinner layers which lead to increased safety during construction by
reducing the differences in levels between placement
Enhanced safety by the reduced dependence on formwork;
Although well designed RCC dams are frequently the lowest cost solution when
compared to other types of dams, there are conditions that can make RCC dams
more expensive. Situations where RCC may not be appropriate includes when
39
aggregate material is not readily available and construction during heavy rains or hot
weather.
2.6 Bedding Mix As RCC dams are constructed in a series of compacted lifts, bonding of the
successive lifts are important. A mortar bedding mix is designed to fill the surface
voids in both the compacted lift below and the covering layer above as well as to
“glue” the two RCC layers together.
There are two forms of bedding mix; mortar and bedding concrete (with a maximum
size of aggregate greater than 5 mm). Those dams that had used a bedding mix,
approximately 77% have used mortar and 23% bedding concrete according to 97
RCC dams that were completed or under construction at the end of 1996 [2].
Bedding mortar was first used in an RCC dam at Shimajigawa Dam and all RCD
dams since that time have used bedding mortars.
2.6.1 Properties of Bedding Mix A bedding mortar or bedding concrete over the upstream zone of each lift joint is
recommended for providing watertightness for any dam that will impound water for
extended periods. The application of bedding mortar over the full lift surface may be
necessary for dams where appreciable bond strength between lifts is necessary
(such as those built in earthquake zones where more tensile and shear strength
across the lift joints is required than is available without bedding mortar). Tests show
that the use of a bedding mortar for low cementitious materials content mixtures can
significantly increase the tensile strength and cohesion value at the joints when
compared with lift joints using no bedding mortar. The need for a bedding mortar or
bedding concrete for other structures such as massive foundations, dam facings,
sills, and cofferdams should be based on the need for a specific level of bond or
watertightness, or both [7].
40
The applied bedding mortar is generally 10 to maximum 0.5 inch thick. The
thickness of the bedding concrete varies considerably up to 75 mm thick bedding
concretes have also been applied. If the thickness of a bedding mix is too high,
there can be difficulty with the compaction of the overlying RCC due to sideways of
the more workable concrete. Moreover, it is difficult to balance the need for a
minimum thickness for the maximum size of aggregate and the requirement for
minimizing the thickness for cost and heat of hydration considerations. When using
a bedding concrete (and to a lesser extent mortar), the implications of the cost and
potential heat generation could be carefully considered. The cost of applying a
bedding mix of whatever form, can be significant [2].
For small RCC dam projects, the mortar is usually mixed in transit mixed concrete
trucks, allowed to flow onto the RCC surface and then spread by brooms, rakes or
lutes.
Generally, soils approach designers specify joint treatment and the use of bedding
mixes on the basis of a “Maturity Factor”; in the USA this is in “deg.F-hr” but in the
rest of the world “deg.C-hr” is used (generally using ambient temperatures as the
temperature factor). It is the product of the surface temperature and time of
exposure until the next lift is placed. Unfortunately, there is no direct correlation.
There seems to be no consensus of opinion regarding the limits for the Maturity
Factor. This is probably because the conditions are so site-specific and each dam
has to be considered as a unique set of conditions. The limits for Maturity Factor, if
used, will be dependent upon many factors such as: the mixture (water content,
quantity of paste, type of cementitious material, retardation, etc.), the workability, the
potential for segregation, the compaction methods and equipment, the effectiveness
of the curing, etc [2].
In order to be effective as a bonding agent between successive lifts, the mortar
bedding needs to be stronger than the RCC itself. In simple terms, the "glue" needs
to be stronger than the materials being glued or bonded together [26].
41
According to ICOLD; designers have found it prudent to define three classes of joint
treatments [2]:
- A fresh (or “hot”) joint: This is a joint that occurs when the RCC layers are
being placed in rapid succession and the RCC is still workable when the next
layer is placed,
- An intermediate (or “warm” or “prepared”) joint: This is the condition that
occurs between a fresh joint and a true “cold” joint,
- A cold joint: At this stage the surface of the previously placed layer is judged
to be such that little or no penetration of the aggregate from the new layer
will be possible into the previously compacted layer.
ICOLD recommends nothing for fresh joint, bedding mix treatment for intermediate
joint if it is lean RCC and likewise bedding mix treatment for cold joint if it is lean,
medium or high paste RCC.
Bedding mortar should be placed in a zone approximately 10 to 20 m wide in front of
the area where the RCC is being spread. Application of the bedding mortar should
precede placement of the RCC, usually by 10 to 15 min. The interval between
spreading of the bedding mortar and placement of the RCC should be shortened
during hot weather and may be extended during cold weather [7].
The results of Capanda (in Angola) and Jordao (in Brazil) Dams have showed that;
use of a layer of bedding mix immediately before placing the new RCC layer
improved the bond of joint in about 40%, to almost that of RCC itself, regardless of
the time interval between layers.
Pacelli et al. discussed the treatment of joints in conventional concrete and RCC
dams. They found that mortar bedding improved lift joint bond strength [27].
42
Hess concluded the following after evaluating the past and USACE studies [28]:
Lift bedding generally increases lift joint strength for RCC, but as the mortar
content of RCC increases, the benefit of the lift bedding decreases;
Lift bedding may increase cohesion and likely has no effect on friction angle;
Xiaobin researched the effect of some bedding materials on RCC lift joint strength
and found the following [29]:
There are two weak bonding faces in the RCC lift joint treated by bedding
materials, and they are entirely different;
Bedding the RCC lift joints with ordinary cement mortar can enhance their
bonding strength, but can not improve their impermeability;
When the exposure time of RCC lift joint surface is relatively short, such as
7.5 hours, the weakest bonding face of the joint bedded by ordinary cement
mortar lies between the mortar and the coarse aggregates of upper layer
RCC embedded into it. In the construction field, if coarse aggregate
segregation occurs on the lift joint surface and/or the w/c ratio of the bedding
mortar is not controlled well, a low bonding strength is likely to be developed.
Thus, bedding the RCC lift joints with ordinary cement mortar may be a good
treatment, but still needs to be improved;
Bedding the lift joints with silica fume cement mortar can enhance not only
their bonding strength, but also their impermeability. The silica fume cement
mortar can bond tightly with the lower layer RCC, and moreover, it can also
improve the bonding strength with the coarse aggregates of upper layer RCC
embedded into it due to the strong interface effect of silica fume. Silica fume
cement mortar is much better than ordinary cement mortar as a bedding
material;
43
Bedding the RCC lift joint surface with expanding mortar may not be a good
treatment.
2.6.2 Materials According to PCA design manual for small RCC dams, a bedding mortar, consisting
of portland cement, sand water, and usually a retarding admixture, should generally
be proportioned to meet the following guidelines [26]:
Slump 150 to 230 mm
Maximum size of aggregate 6 to 9.5 mm
Minimum Cement Content 296 kg/m3
Minus #200 sieve material 3% maximum
Admixture; ASTM C 494, retard initial set to greater than 3 hrs
Type D water reducing at 35°C
& retarding
Design strength minimum 13.8 MPa at 7 days or
minimum 17.2 MPa at 28 days
For bedding concrete, US Army Corps of Engineers recommends mixture having up
to 19.0 mm NMSA proportioned to have a slump of 130 to 180 mm. Bedding
concrete is spread, usually by manual labor, to a thickness of 25 to 50 mm in a zone
along the upstream face of the dam. The width of application ranges from several
feet to approximately one-third of the width of the dam [7].
Testing of various bedding materials has shown that the use of bedding concrete
incorporating coarse aggregate provides slightly better shear performance on lift
joints than on similar joints bonded using a bedding mortar with no coarse aggregate
[29].
44
2.7 Beydağ Dam RCC Studies
Beydağ Dam RCC mixture was taken as model for the preparation of laboratory-
made RCC specimens. Therefore, Beydağ Dam RCC studies are given below in
detail.
Beydağ Dam (located in Beydağ district of İzmir) is a RCC Dam with a large free
flow spillway over the dam body, as can be seen in Figure 2.8 and Figure 2.9. The
aim of the project is irrigation of an area of 22 000 hectares in Ödemiş Plain. The
basic design was developed by Temelsu Inc. and also the construction designs are
being done by Temelsu Inc., which designed Cindere RCC Dam. The contractor of
the Beydağ Project is Özaltın Inc.
The Beydağ Project was given a start in April 2005, by performing the excavation of
the alluvium zone between the two cofferdams, to reach the foundation. A
construction period of 30 months for the RCC dam is being adopted, preliminarily,
accordingly with the construction plan.
Characteristics of the project are summarized below:
Employer: DSİ
Designer: Temelsu Inc.
Contractor: Özaltın Inc.
Location: İzmir
River: Küçük Menderes
Dam Type: Roller Compacted Concrete
Aim of the Project: Irrigation
Dam Body Volume: 2 700 000 m3 (RCC)
Reservoir Volume: 300 hm3
Height above Foundation: 100 m
Height above Thalweg: 60 m
Crest Length: 785 m
Spillway Design Flow: 1275 m3/s

45
a) Downstream
b) Upstream
Figure 2.8 General view of Beydağ Dam
46
In order to determine the mixture proportions of RCC, 156 different RCC mixes were
prepared and tested with various cementitious materials and different amounts [30].
The required compressive strength was specified as 7.5 MPa for 180 days in
structural analysis. But the target compressive strength for laboratory studies was
selected to be 15% higher to be on the safe side due to prospective construction
differences.
Therefore the target compressive strength of the RCC mix was determined as:
7.5 MPa x 1.15 = 8.6 MPa at 180 days
The mix design calculation of RCC is made by the same concept of conventional
concretes. But the amount of cement, fly ash and water in the mix are selected by
previous design experiences. Determination of mix design is based on mix efficiency
method.
Because of the suitability of the aggregate grading obtained from site all-in
aggregates were used in RCC batching and the specific gravity of the all-in
aggregates are calculated regarding to specific gravity of the coarse and fine
aggregate including the total aggregate and the ratios of the both aggregate sizes.
The concept of the calculation is given as;
100finefinecoarsecoarse
ag
YGYGG
×+×=
Gag : Aggregate specific gravity
Gcoarse : Coarse aggregate specific gravity
Gfine : Fine aggregate specific gravity
Ycoarse : The ratio of coarse aggregate (42%)
Yfine : The ratio of fine aggregate (58%)
47
The evaluations of the required cementitious material content were selected based
on Cindere Dam mix design studies which show similar properties with Beydağ
Dam. In Cindere Dam, target strength was achieved with 50 kg/m3 cement and 20
kg/m3 fly ash after the trial studies, the fly ash ratio being 30% of the total
cementitious material. In Beydağ aggregates, the content passing the No. 200 sieve
is lower than Cindere Dam aggregates therefore in Beydağ trials, the fly ash content
is increased approximately 15%.
The target compressive strength of RCC is mentioned around 7.5 MPa for 180 days
in previous structural studies. But the trial mixes were designed up to 15 MPa
compressive strength for one year. The required cementitious material contents are
determined according to Cindere Dam trial studies. Cementitious material range is;
7 (MPa) / 0.113 (*) (MPa / (kg/m3)) = 62 kg/m3 and
15 (MPa) / 0.113 (*) (MPa / (kg/m3)) = 132 kg/m3
(*) Mix efficiency value of Cindere Dam mixes with 50% percent fly ash content
Finally, the cementitious content of the mixes was determined between 60 kg and
150 kg per cubic meter of RCC. The fly ash ratio is fixed between 30% and 50%.
The Yatağan fly ash has been used for trial mixes which is the closest source to the
job site.
The Beydağ mixes were designed with minimum water content to show target
compaction value. In general, concept behind RCC Vebe time is the criteria of
workability but, like Beydağ Dam, low cementitious content mixes can not be
evaluated with Vebe time. Therefore the Vebe time was kept above 50 seconds for
Beydağ mixes and maximum compaction ratios observed by trials. Finally the water
content was kept between 115 lt/m3 and 130 lt/m3. The objective of the reduction of
water content was to achieve maximum strength with minimum cement content.
Then, 156 different mixes were tried to achieve required compressive strength.
Firstly, the water content of the aggregate was determined and regarding the
absorption, water corrections were made. 100 lt mix was prepared in laboratory
48
mixer. Gradation, water content and compacted unit weight tests were performed on
the samples. The mix, placed in Ø 15 x 30 cm cylinder moulds with compressed air
gun in three layers. Each layer was compacted for up to 15 seconds in order to
reach minimum 98% compaction.
During the trial mix study 63 mixes and 888 cylinders were prepared with separated
aggregate fractions and 93 mixes and 1293 cylinders were prepared with continuous
0-50 mm aggregate. In total, 156 mixes and 2181 cylinders were prepared. 24 hours
later, the samples were taken from moulds and put in 23 ± 2 °C water tank up to
testing date.
In preliminary studies, two kinds of aggregate have been tried and the effect of
aggregate properties on strength have been investigated. Eventually, 0-50 mm
continuous aggregate type was selected and the mixes were prepared with that type
of aggregate afterwards. After selection of aggregate type, different cement and fly
ash sources were also tried in trial mixes.
At first, an electric kango hammer was used for compaction of the cylinders.
However, required compaction could not be achieved therefore low compressive
strength results were obtained. After evaluation of those results, the equipment was
changed with compressed air gun for compaction of the cylinders.
As a result of all studies expressed above, 7 mixes which show strength values
close to the design strength at 180 days are given in Table 2.3.
If the assumed results are evaluated, it can be seen that all selected mixes achieved
the required target compressive strength except BB-2 and BB-5.
The water contents of the mixes changed between 110 lt and 125 lt and the water
content directly affects the compressive strengths. Anyhow the mixes BBK-1A and
BBK-3A achieved required strength with 110 lt/m3 of water but BB-2 and BB-5 mixes
could not achieve required target compressive strength with same cementitious
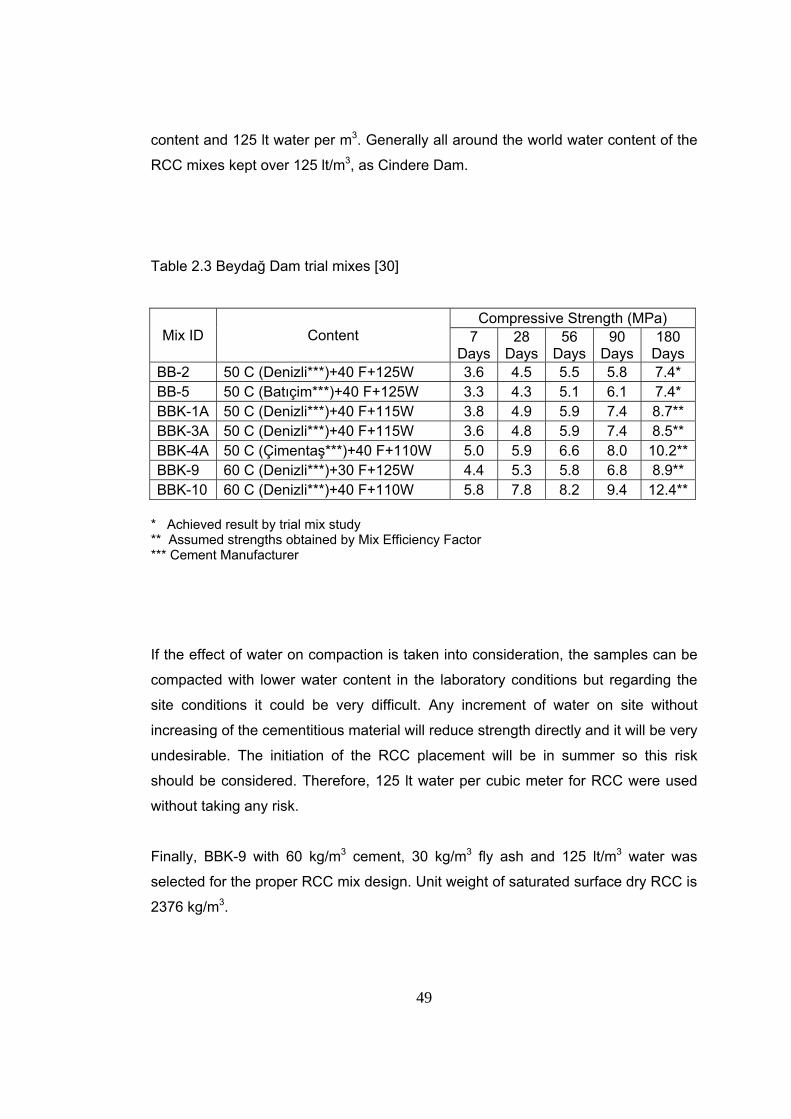
49
content and 125 lt water per m3. Generally all around the world water content of the
RCC mixes kept over 125 lt/m3, as Cindere Dam.
Table 2.3 Beydağ Dam trial mixes [30]
Mix ID Content Compressive Strength (MPa)
7 Days
28 Days
56 Days
90 Days
180 Days
BB-2 50 C (Denizli***)+40 F+125W 3.6 4.5 5.5 5.8 7.4* BB-5 50 C (Batıçim***)+40 F+125W 3.3 4.3 5.1 6.1 7.4* BBK-1A 50 C (Denizli***)+40 F+115W 3.8 4.9 5.9 7.4 8.7** BBK-3A 50 C (Denizli***)+40 F+115W 3.6 4.8 5.9 7.4 8.5** BBK-4A 50 C (Çimentaş***)+40 F+110W 5.0 5.9 6.6 8.0 10.2**BBK-9 60 C (Denizli***)+30 F+125W 4.4 5.3 5.8 6.8 8.9** BBK-10 60 C (Denizli***)+40 F+110W 5.8 7.8 8.2 9.4 12.4**
* Achieved result by trial mix study ** Assumed strengths obtained by Mix Efficiency Factor *** Cement Manufacturer
If the effect of water on compaction is taken into consideration, the samples can be
compacted with lower water content in the laboratory conditions but regarding the
site conditions it could be very difficult. Any increment of water on site without
increasing of the cementitious material will reduce strength directly and it will be very
undesirable. The initiation of the RCC placement will be in summer so this risk
should be considered. Therefore, 125 lt water per cubic meter for RCC were used
without taking any risk.
Finally, BBK-9 with 60 kg/m3 cement, 30 kg/m3 fly ash and 125 lt/m3 water was
selected for the proper RCC mix design. Unit weight of saturated surface dry RCC is
2376 kg/m3.
50
For the RCC joint treatment, bedding mortar is suggested between old and freshly
placed RCC layer if the time interval between layers exceeds 24 hours. The proper
bedding mix should be stronger than RCC. For this reason, in the mix 350 kg/m3
cement and 350 lt/m3 water were used. As aggregate 7 mm NMSA was used. In the
mix admixture were not used. The prepared mix shows strength value of about 10-
11 MPa at 180 days which is almost 25% more than that of RCC.
2.8 Previous Research at M.E.T.U. As a first study, in his M.S. Thesis, Eyüp Sabri Koçak investigated the most
economical and suitable materials to be used in Suçatı Dam in Kahramanmaraş. In
that study, two types of ordinary portland cement, one type of fly ash, one type of
ground granulated blast furnace slag, various portland cement-fly ash and portland
cement-slag combinations, and aggregates taken from six different sources in the
region were used in producing the RCC mixtures. As a result of the experimental
study, it was found that using slag in RCC as cementitious material was more
economical than using fly ash. Moreover, the optimum cementitious material content
for RCC was determined to be 125-150 kg/m3, 100-125 kg/m3 of which was ground
granulated blast furnace slag reducing the cement content by an amount of 90%
[31].
In another study, as a M.S. Thesis, Özlem Aslan studied the long term strength
prediction of RCC containing natural pozzolan by steam curing. The aim of the
project was to obtain the optimum RCC mixture to generate compressive strength of
7 MPa in the long term at project site, Akköy-I Dam and hydroelectric power plant
construction. In this thesis, two types of cement, two types of natural pozzolan,
aggregates with varying gradations, and a type of water reducing chemical
admixture were used. Additionally, steam curing was applied to the test specimens
in order to get long term compressive strength at early ages. Differences between
steam cured specimens and normal cured specimens were discussed. It was
observed that application of steam curing in CEM I type cement used RCC mixtures
generated expected results. However, in CEM IV type cement used RCC mixtures
compressive strength results did not behave in the same manner. Also, it was
51
shown that usage of water reducing chemical admixture improved compressive
strength of RCC [32].
Moreover, Salah Eddin Sabri investigated the bond strength testing between two
different materials which was a Ph.D. Thesis made at M.E.T.U. Materials of
Construction Laboratory. He investigated the theoretical and experimental bond
between two materials. In the study, it was found that splitting tensile test, which
was originally used to measure the splitting tensile strength of stones and concrete,
can be applicable to measure the bond strength between two materials
experimentally. The results of that study proposes a formula which was derived
using finite element method, that gives accurate bond strength values. Moreover, for
most of the material combinations this method was shown to be reproducible with a
coefficient of variation less than 13%. Mode of failure is found to be always at the
interface [33].
Lastly, Raci Bayer in his M.S. Thesis, studied the use of preplaced aggregate
concrete (PAC) for mass concrete applications. In that research, a new method for
making PAC was investigated. The new method was based on increasing the fluidity
of the grout by new generation superplasticizers to such an extent that, it filled all
the voids in the preplaced coarse aggregate mass when it was simply poured over
the aggregate mass, without requiring any injection. As a result of the experimental
study it was found that, the PAC specimens prepared by injection method performed
better in terms of thermal properties, but was worse in mechanical properties than
conventional concrete. On the other hand, the PAC specimens prepared by the new
method performed beter when compared to PAC and concrete [34].
52
CHAPTER 3
EXPERIMENTAL STUDY
In the experimental study, RCC used in Beydağ Dam whose construction is still
underway, was taken as model and the studies were prosecuted. Beydağ Dam RCC
was evaluated to be lean RCC with 90 kg/m3 cementitious content (60 kg/m3 cement
+ 30 kg/m3 fly ash).
As previously explained in Section 2.6, bedding mix is often used for RCC in
between freshly placed and previously compacted layer. However, there is not
enough research about the timing of bedding mix application. Consequently, the aim
of the study was to investigate the properties of RCC with and without bedding mix
as a bonding agent between successive layers.
However, around the world there are no clear experimental standards for some
properties (permeability, coefficient of internal friction) of RCC, so CVC standards
are used instead.
Good compaction is vital for RCC. In the experiments, a Spit 490 electro pneumatic
demolition hammer was used for compaction whose detailed properties are given in
the following sections.
Moreover, in the continuing sections constituents for RCC and bedding mix, the
preparation of specimens, the specimen notation used in the thesis and the curing
procedure were provided.
3.1 Materials Utilized within the Experimental Program The materials to be used in the study constitute aggregates from Küçük Menderes
water course, CEM I 42.5 R Portland Cement from Set Çimento, fly ash from
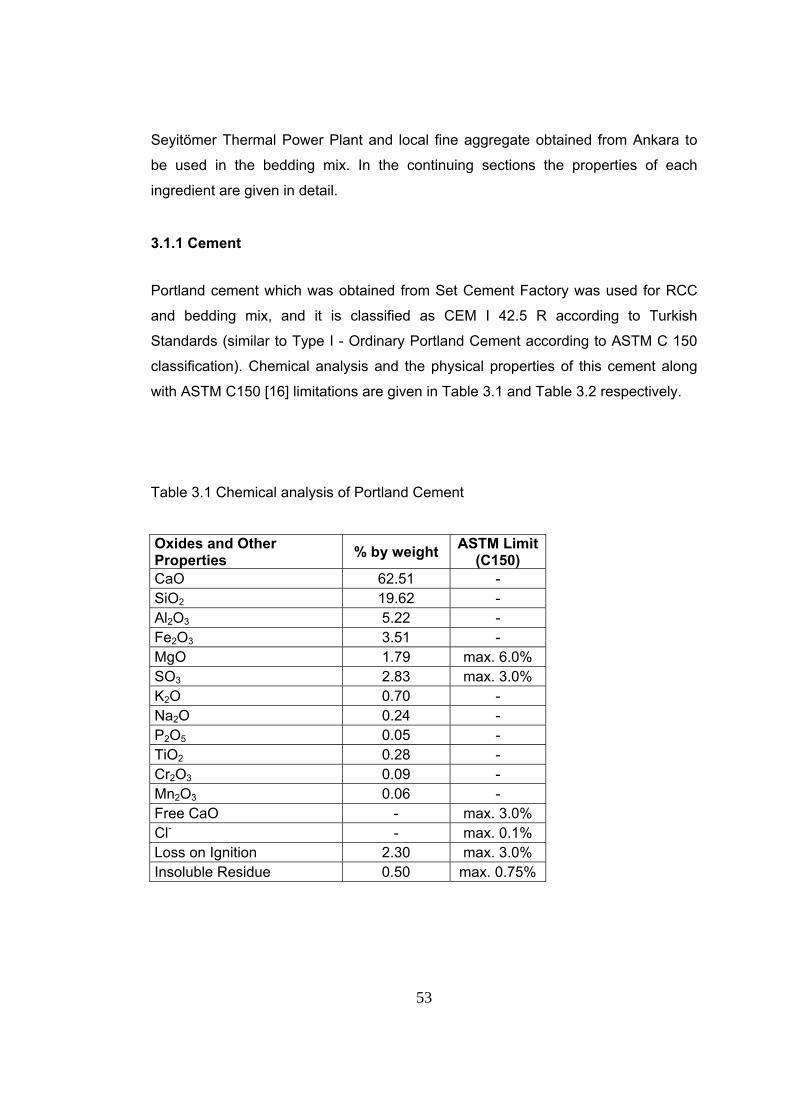
53
Seyitömer Thermal Power Plant and local fine aggregate obtained from Ankara to
be used in the bedding mix. In the continuing sections the properties of each
ingredient are given in detail.
3.1.1 Cement
Portland cement which was obtained from Set Cement Factory was used for RCC
and bedding mix, and it is classified as CEM I 42.5 R according to Turkish
Standards (similar to Type I - Ordinary Portland Cement according to ASTM C 150
classification). Chemical analysis and the physical properties of this cement along
with ASTM C150 [16] limitations are given in Table 3.1 and Table 3.2 respectively.
Table 3.1 Chemical analysis of Portland Cement
Oxides and Other Properties % by weight ASTM Limit
(C150) CaO 62.51 - SiO2 19.62 - Al2O3 5.22 - Fe2O3 3.51 - MgO 1.79 max. 6.0% SO3 2.83 max. 3.0% K2O 0.70 - Na2O 0.24 - P2O5 0.05 - TiO2 0.28 - Cr2O3 0.09 - Mn2O3 0.06 - Free CaO - max. 3.0% Cl- - max. 0.1% Loss on Ignition 2.30 max. 3.0% Insoluble Residue 0.50 max. 0.75%
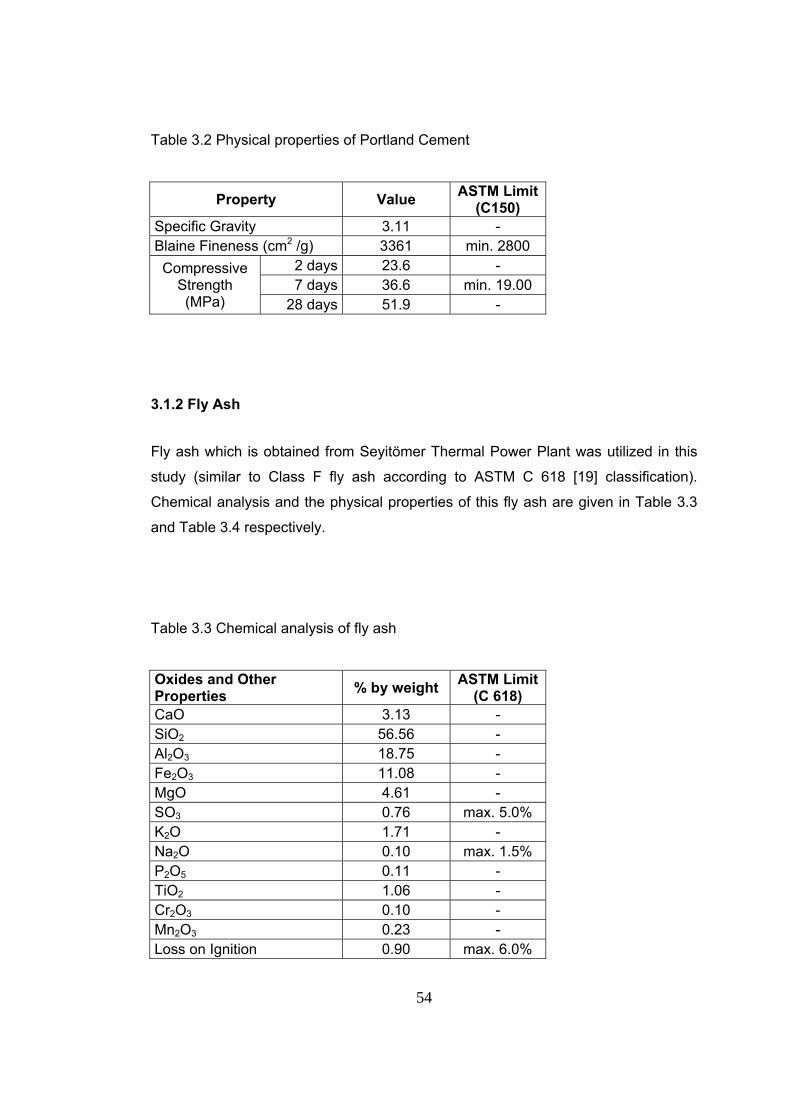
54
Table 3.2 Physical properties of Portland Cement
Property Value ASTM Limit (C150)
Specific Gravity 3.11 - Blaine Fineness (cm2 /g) 3361 min. 2800 Compressive
Strength (MPa)
2 days 23.6 - 7 days 36.6 min. 19.00
28 days 51.9 -
3.1.2 Fly Ash Fly ash which is obtained from Seyitömer Thermal Power Plant was utilized in this
study (similar to Class F fly ash according to ASTM C 618 [19] classification).
Chemical analysis and the physical properties of this fly ash are given in Table 3.3
and Table 3.4 respectively.
Table 3.3 Chemical analysis of fly ash
Oxides and Other Properties % by weight ASTM Limit
(C 618) CaO 3.13 - SiO2 56.56 - Al2O3 18.75 - Fe2O3 11.08 - MgO 4.61 - SO3 0.76 max. 5.0% K2O 1.71 - Na2O 0.10 max. 1.5% P2O5 0.11 - TiO2 1.06 - Cr2O3 0.10 - Mn2O3 0.23 - Loss on Ignition 0.90 max. 6.0%
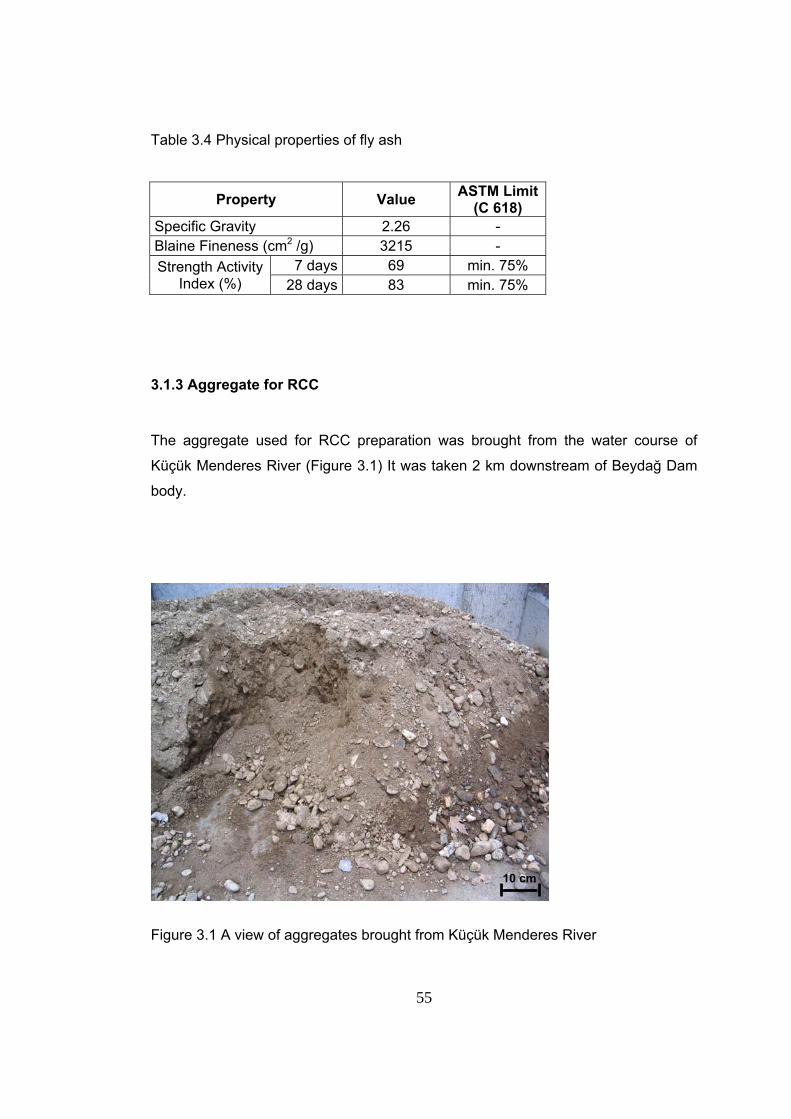
55
Table 3.4 Physical properties of fly ash
Property Value ASTM Limit (C 618)
Specific Gravity 2.26 - Blaine Fineness (cm2 /g) 3215 - Strength Activity
Index (%) 7 days 69 min. 75%
28 days 83 min. 75%
3.1.3 Aggregate for RCC
The aggregate used for RCC preparation was brought from the water course of
Küçük Menderes River (Figure 3.1) It was taken 2 km downstream of Beydağ Dam
body.
Figure 3.1 A view of aggregates brought from Küçük Menderes River
10 cm
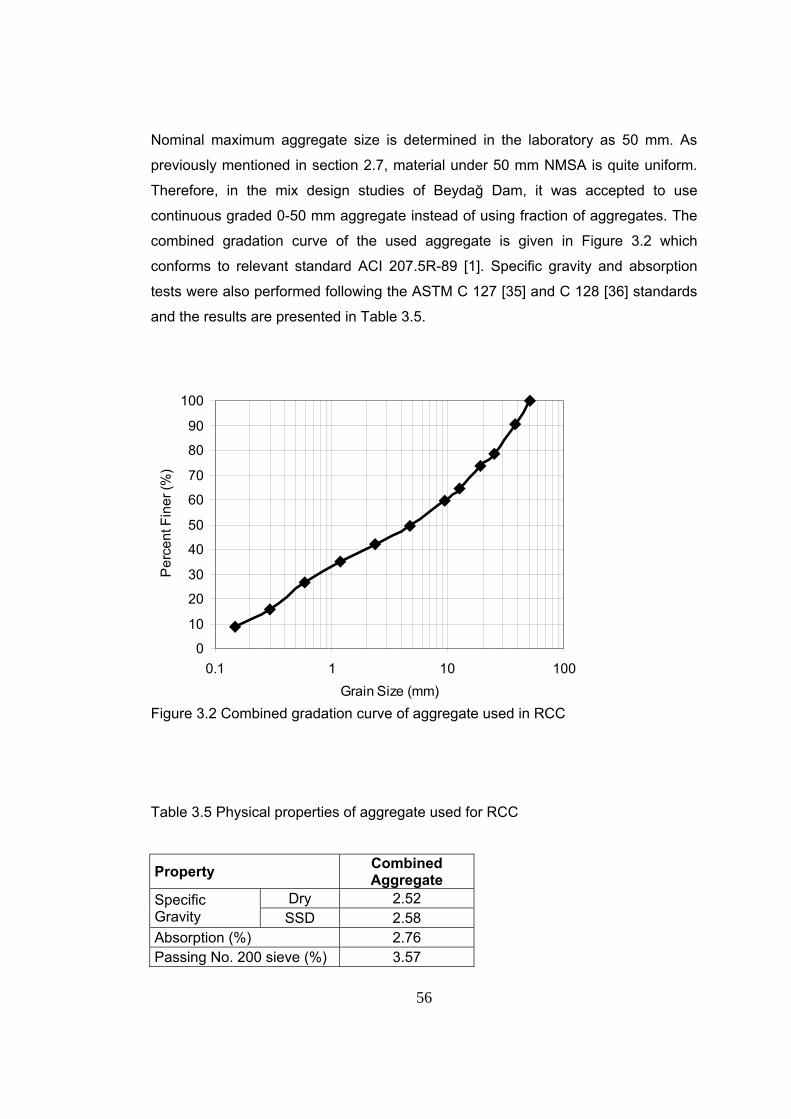
56
0
10
20
30
40
50
60
70
80
90
100
0.1 1 10 100Grain Size (mm)
Per
cent
Fin
er (%
)
Nominal maximum aggregate size is determined in the laboratory as 50 mm. As
previously mentioned in section 2.7, material under 50 mm NMSA is quite uniform.
Therefore, in the mix design studies of Beydağ Dam, it was accepted to use
continuous graded 0-50 mm aggregate instead of using fraction of aggregates. The
combined gradation curve of the used aggregate is given in Figure 3.2 which
conforms to relevant standard ACI 207.5R-89 [1]. Specific gravity and absorption
tests were also performed following the ASTM C 127 [35] and C 128 [36] standards
and the results are presented in Table 3.5.
Figure 3.2 Combined gradation curve of aggregate used in RCC
Table 3.5 Physical properties of aggregate used for RCC
Property Combined Aggregate
Specific Gravity
Dry 2.52 SSD 2.58
Absorption (%) 2.76 Passing No. 200 sieve (%) 3.57
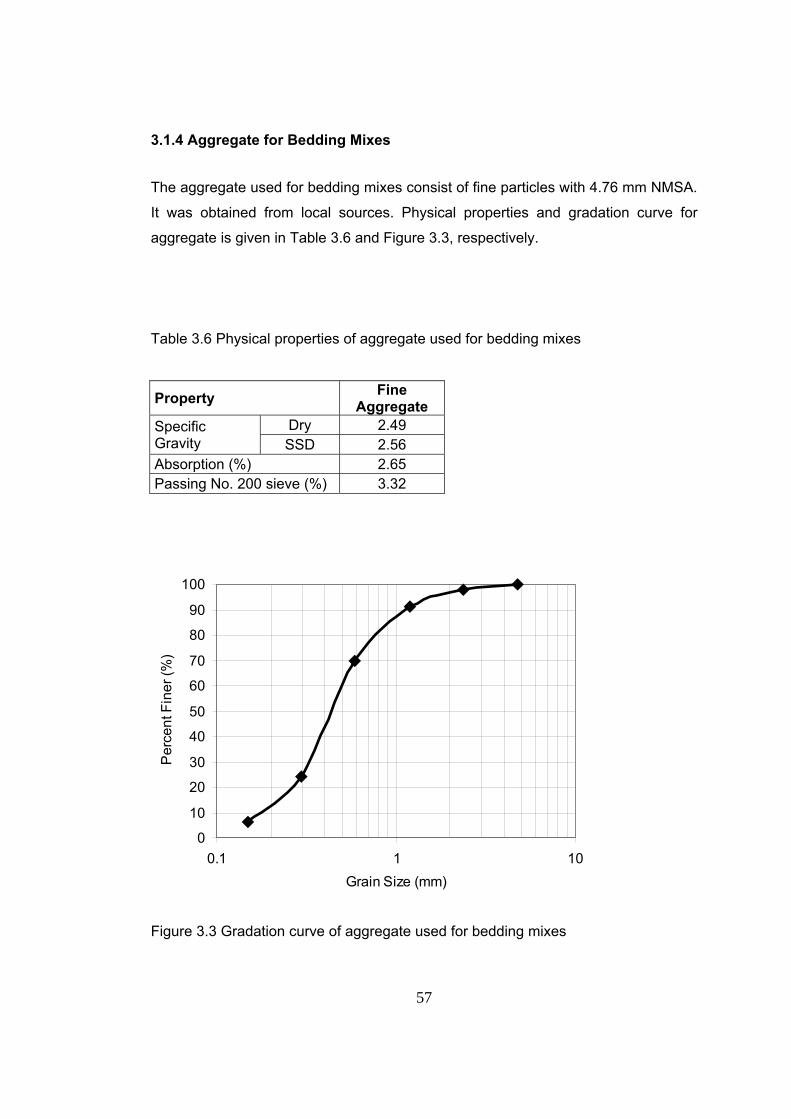
57
3.1.4 Aggregate for Bedding Mixes The aggregate used for bedding mixes consist of fine particles with 4.76 mm NMSA.
It was obtained from local sources. Physical properties and gradation curve for
aggregate is given in Table 3.6 and Figure 3.3, respectively.
Table 3.6 Physical properties of aggregate used for bedding mixes
Property Fine Aggregate
Specific Gravity
Dry 2.49 SSD 2.56
Absorption (%) 2.65 Passing No. 200 sieve (%) 3.32
Figure 3.3 Gradation curve of aggregate used for bedding mixes
0
10
20
30
40
50
60
70
80
90
100
0.1 1 10Grain Size (mm)
Per
cent
Fin
er (%
)
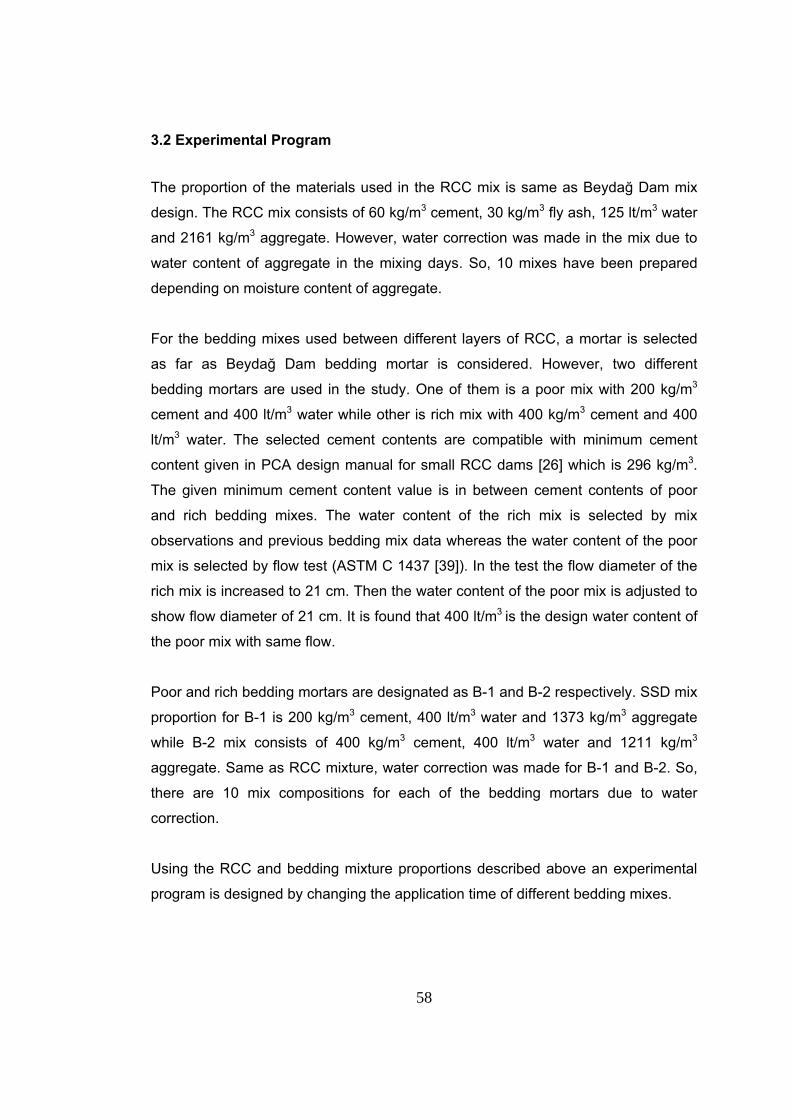
58
3.2 Experimental Program The proportion of the materials used in the RCC mix is same as Beydağ Dam mix
design. The RCC mix consists of 60 kg/m3 cement, 30 kg/m3 fly ash, 125 lt/m3 water
and 2161 kg/m3 aggregate. However, water correction was made in the mix due to
water content of aggregate in the mixing days. So, 10 mixes have been prepared
depending on moisture content of aggregate.
For the bedding mixes used between different layers of RCC, a mortar is selected
as far as Beydağ Dam bedding mortar is considered. However, two different
bedding mortars are used in the study. One of them is a poor mix with 200 kg/m3
cement and 400 lt/m3 water while other is rich mix with 400 kg/m3 cement and 400
lt/m3 water. The selected cement contents are compatible with minimum cement
content given in PCA design manual for small RCC dams [26] which is 296 kg/m3.
The given minimum cement content value is in between cement contents of poor
and rich bedding mixes. The water content of the rich mix is selected by mix
observations and previous bedding mix data whereas the water content of the poor
mix is selected by flow test (ASTM C 1437 [39]). In the test the flow diameter of the
rich mix is increased to 21 cm. Then the water content of the poor mix is adjusted to
show flow diameter of 21 cm. It is found that 400 lt/m3 is the design water content of
the poor mix with same flow.
Poor and rich bedding mortars are designated as B-1 and B-2 respectively. SSD mix
proportion for B-1 is 200 kg/m3 cement, 400 lt/m3 water and 1373 kg/m3 aggregate
while B-2 mix consists of 400 kg/m3 cement, 400 lt/m3 water and 1211 kg/m3
aggregate. Same as RCC mixture, water correction was made for B-1 and B-2. So,
there are 10 mix compositions for each of the bedding mortars due to water
correction.
Using the RCC and bedding mixture proportions described above an experimental
program is designed by changing the application time of different bedding mixes.
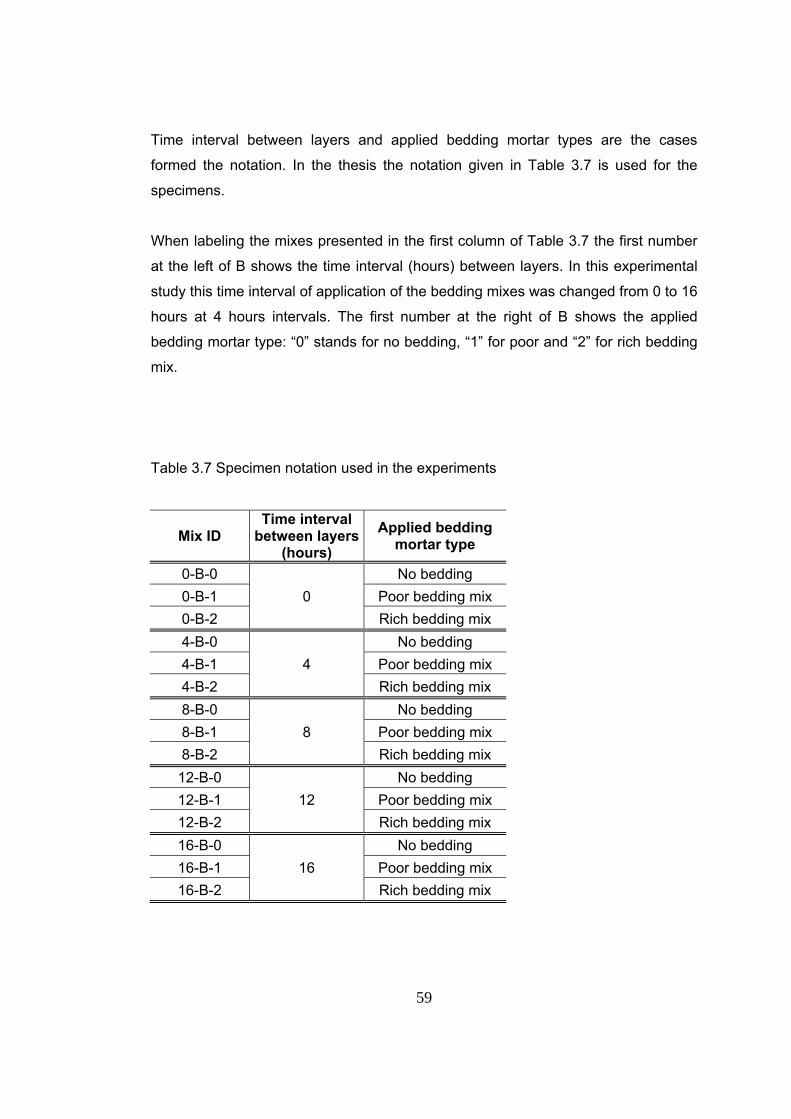
59
Time interval between layers and applied bedding mortar types are the cases
formed the notation. In the thesis the notation given in Table 3.7 is used for the
specimens.
When labeling the mixes presented in the first column of Table 3.7 the first number
at the left of B shows the time interval (hours) between layers. In this experimental
study this time interval of application of the bedding mixes was changed from 0 to 16
hours at 4 hours intervals. The first number at the right of B shows the applied
bedding mortar type: “0” stands for no bedding, “1” for poor and “2” for rich bedding
mix.
Table 3.7 Specimen notation used in the experiments
Mix ID Time interval
between layers (hours)
Applied bedding mortar type
0-B-0 0
No bedding 0-B-1 Poor bedding mix 0-B-2 Rich bedding mix 4-B-0
4 No bedding
4-B-1 Poor bedding mix 4-B-2 Rich bedding mix 8-B-0
8 No bedding
8-B-1 Poor bedding mix 8-B-2 Rich bedding mix
12-B-0 12
No bedding 12-B-1 Poor bedding mix 12-B-2 Rich bedding mix 16-B-0
16 No bedding
16-B-1 Poor bedding mix 16-B-2 Rich bedding mix
60
Each specimen that was prepared was also labeled by a number following the mix
ID, taking any value between 1 to 16. Each specimen was used for a different test. 1
to 3 and 9 to 11 show 28-days and 90-days compressive strengths, respectively.
Whereas, 4 to 6 and 12 to 14 show 28-days and 90-days splitting tensile strengths.
Finally, 7-8 and 15-16 show 28-days and 90-days permeability test specimens,
respectively.
Compaction
During the construction of RCC mixtures in the laboratory, one of the most important
parameters is compaction. All of the RCC properties depends on compaction. As a
result of proper compaction, fully compacted RCC specimens will be formed. In the
study, an electro pneumatic demolition hammer type (Spit 490) is preferred for
compaction equipment (Figure 3.4) because of conformance of impact rate, impact
force, weight and minimum power input with ASTM C 1435 [8] standard. It is an
electro pneumatic demolition hammer with adjustable impact force through 6 levels.
Figure 3.4 A view of the compaction equipment
61
The properties of the electro pneumatic demolition hammer is given below:
Weight : 10.1 kg
Power input : 1500 W
Power output : 1000 W
Impact rate : 950-2090 blows per minute
Impact force : (Max) 6-25 Joule
Tool holder : SDS Max
Chisel positions : 12
Noise : Below 108 decibel
Vibration : Weighted acceleration below 13 m/s2
Specimen Preparation
Before mixing, the water content of the aggregate is determined and regarding this
water corrections were made. Then, materials to be added to the mix is weighed
separately. After weighing all the materials, they were placed inside the electrical
mixer (Figure 3.5). Until all the water is absorbed by the materials, the materials are
mixed in the mixer. Later, the moulds are filled with the help of a shovel as shown in
Figure 3.6. The moulds are filled with RCC in two layers. Each layer has a height of
7.5 cm when bedding mortar is not applied and 7 cm when applied for the
specimens. The RCC filled moulds are compacted with electro pneumatic demolition
hammer by the help of apparatus fixed to the end of chisel (Figure 3.7). Each layer
is compacted 30 seconds with the demolition hammer, which has approximately
2090 blows per minute vibration rate and 25 Joule impact force (Figure 3.8).
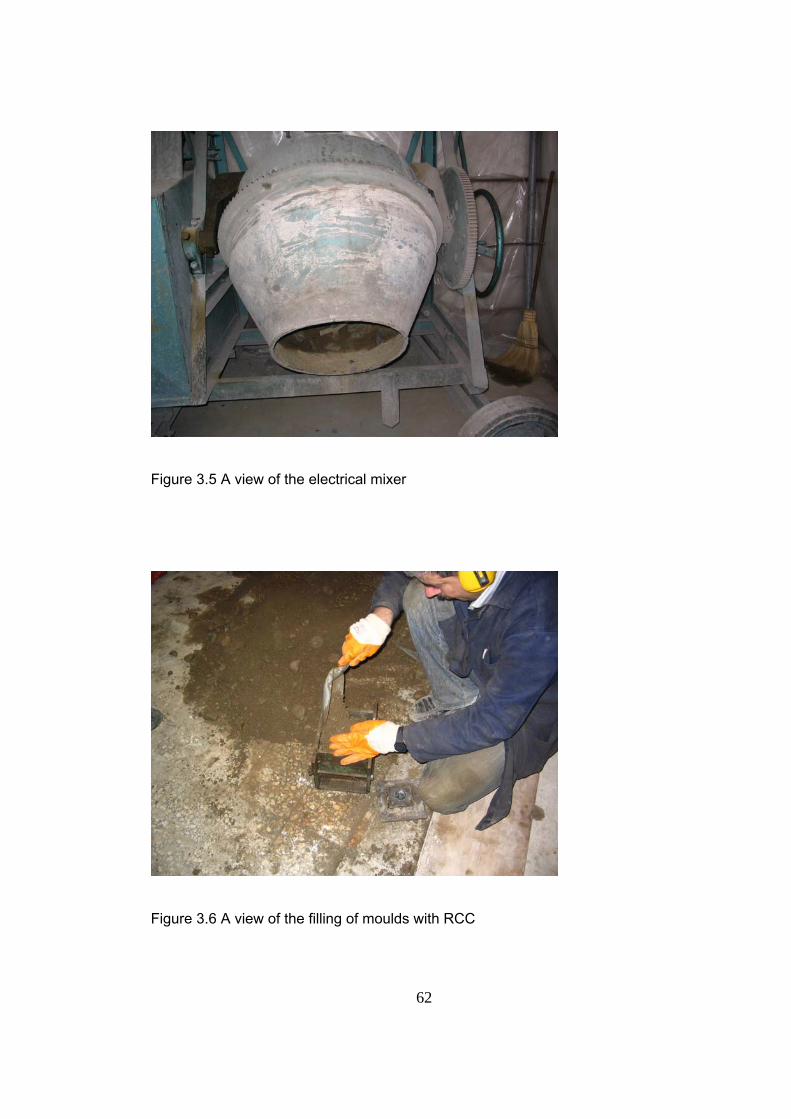
62
Figure 3.5 A view of the electrical mixer
Figure 3.6 A view of the filling of moulds with RCC
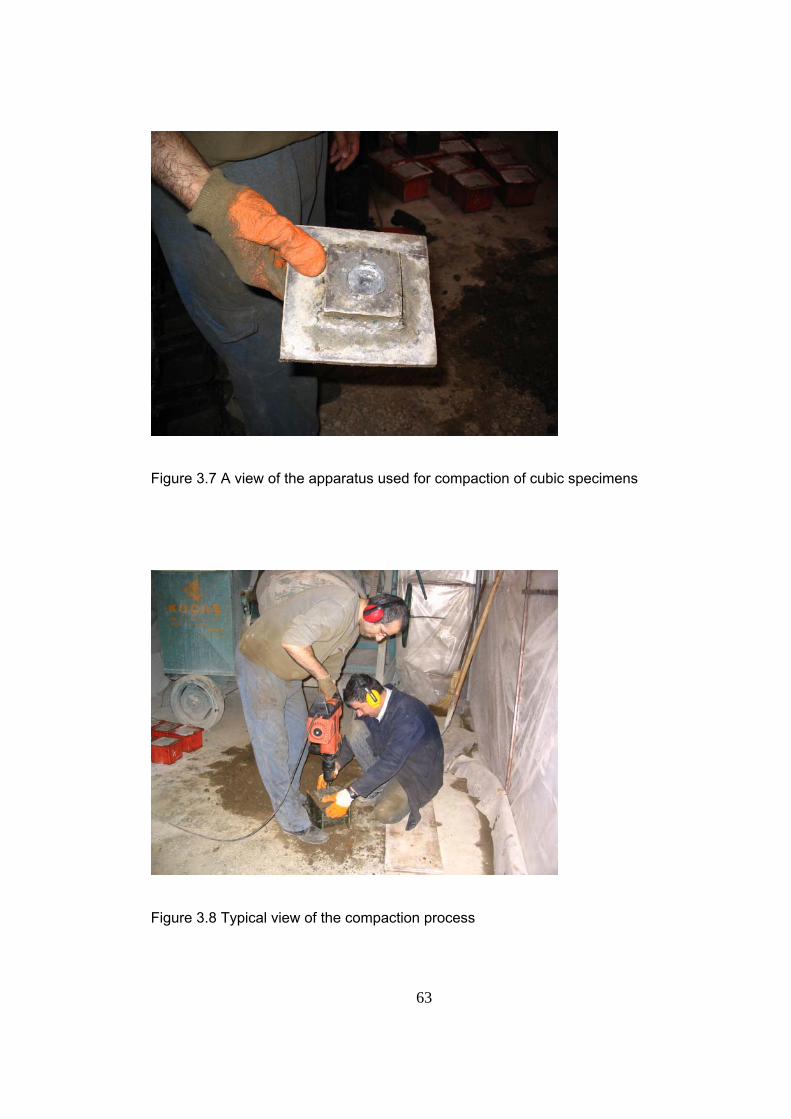
63
Figure 3.7 A view of the apparatus used for compaction of cubic specimens
Figure 3.8 Typical view of the compaction process
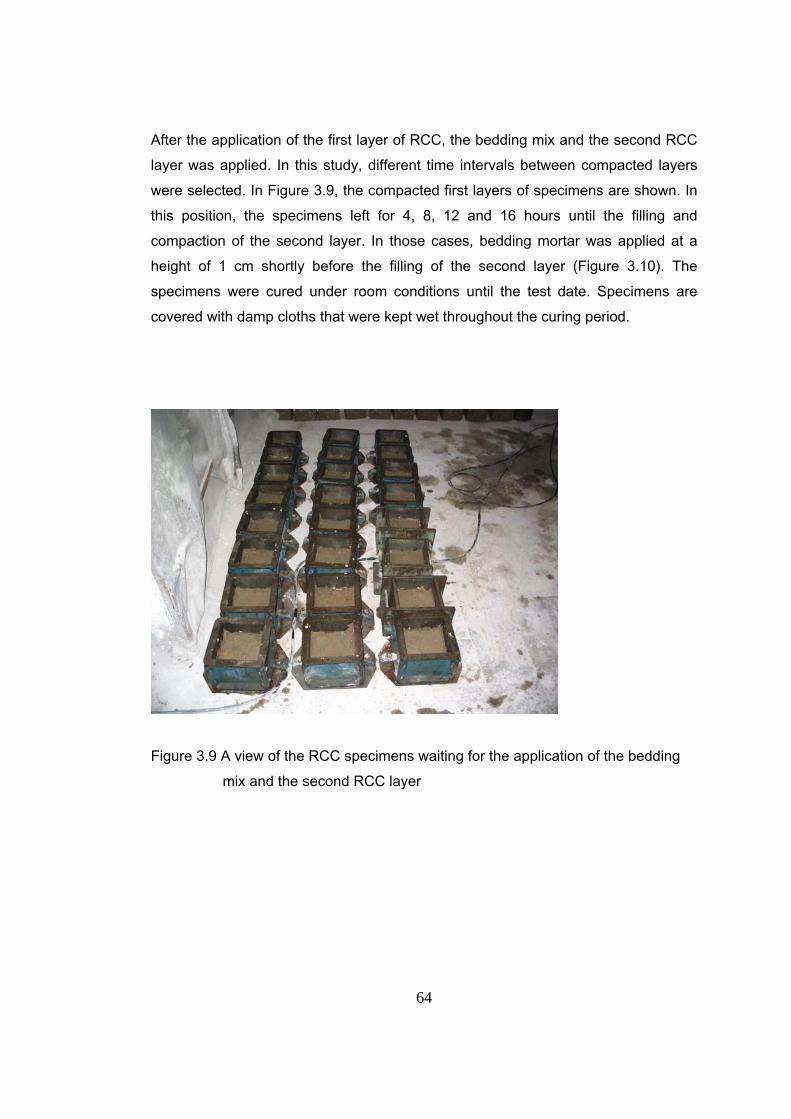
64
After the application of the first layer of RCC, the bedding mix and the second RCC
layer was applied. In this study, different time intervals between compacted layers
were selected. In Figure 3.9, the compacted first layers of specimens are shown. In
this position, the specimens left for 4, 8, 12 and 16 hours until the filling and
compaction of the second layer. In those cases, bedding mortar was applied at a
height of 1 cm shortly before the filling of the second layer (Figure 3.10). The
specimens were cured under room conditions until the test date. Specimens are
covered with damp cloths that were kept wet throughout the curing period.
Figure 3.9 A view of the RCC specimens waiting for the application of the bedding
mix and the second RCC layer
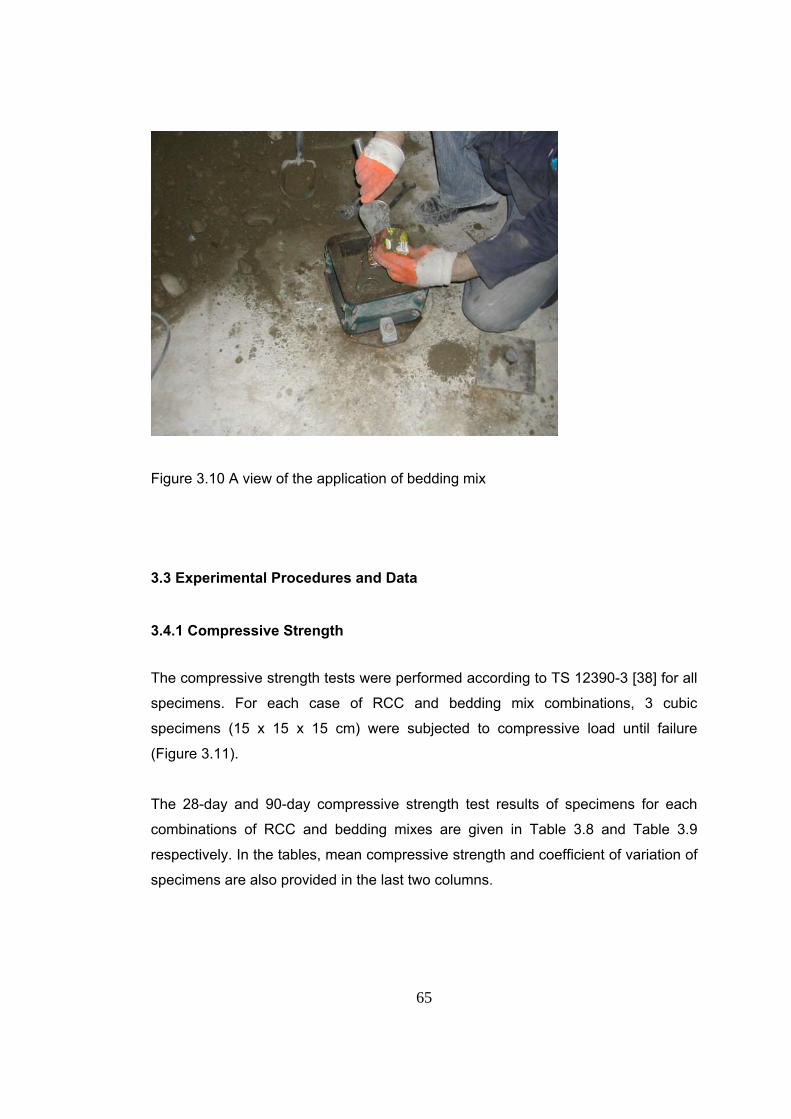
65
Figure 3.10 A view of the application of bedding mix
3.3 Experimental Procedures and Data
3.4.1 Compressive Strength
The compressive strength tests were performed according to TS 12390-3 [38] for all
specimens. For each case of RCC and bedding mix combinations, 3 cubic
specimens (15 x 15 x 15 cm) were subjected to compressive load until failure
(Figure 3.11).
The 28-day and 90-day compressive strength test results of specimens for each
combinations of RCC and bedding mixes are given in Table 3.8 and Table 3.9
respectively. In the tables, mean compressive strength and coefficient of variation of
specimens are also provided in the last two columns.
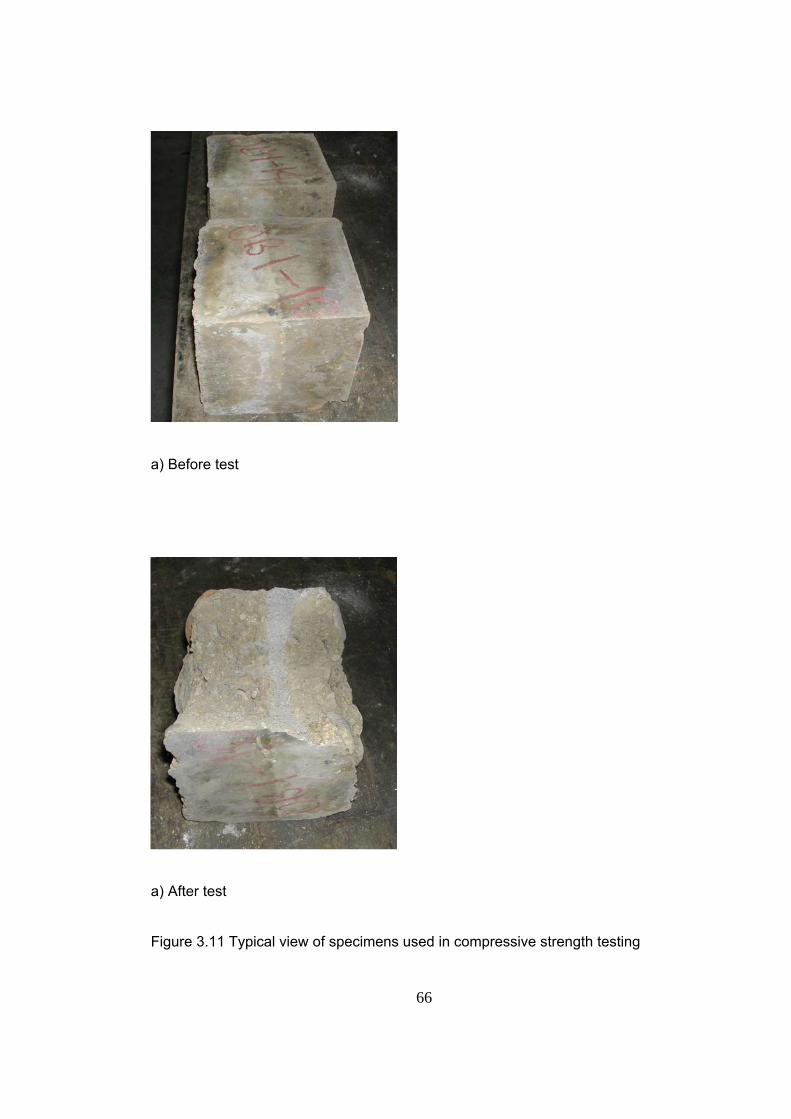
66
a) Before test
a) After test
Figure 3.11 Typical view of specimens used in compressive strength testing
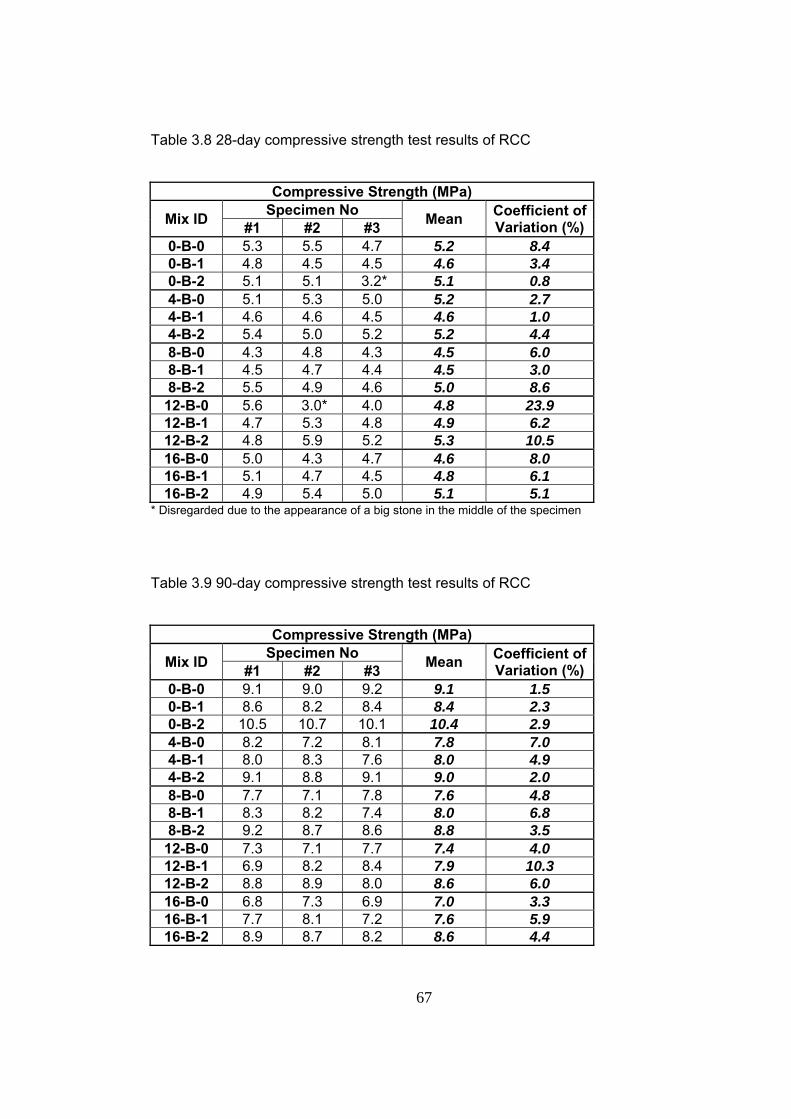
67
Table 3.8 28-day compressive strength test results of RCC
Compressive Strength (MPa)
Mix ID Specimen No Mean Coefficient of Variation (%) #1 #2 #3
0-B-0 5.3 5.5 4.7 5.2 8.4 0-B-1 4.8 4.5 4.5 4.6 3.4 0-B-2 5.1 5.1 3.2* 5.1 0.8 4-B-0 5.1 5.3 5.0 5.2 2.7 4-B-1 4.6 4.6 4.5 4.6 1.0 4-B-2 5.4 5.0 5.2 5.2 4.4 8-B-0 4.3 4.8 4.3 4.5 6.0 8-B-1 4.5 4.7 4.4 4.5 3.0 8-B-2 5.5 4.9 4.6 5.0 8.6
12-B-0 5.6 3.0* 4.0 4.8 23.9 12-B-1 4.7 5.3 4.8 4.9 6.2 12-B-2 4.8 5.9 5.2 5.3 10.5 16-B-0 5.0 4.3 4.7 4.6 8.0 16-B-1 5.1 4.7 4.5 4.8 6.1 16-B-2 4.9 5.4 5.0 5.1 5.1
* Disregarded due to the appearance of a big stone in the middle of the specimen
Table 3.9 90-day compressive strength test results of RCC
Compressive Strength (MPa)
Mix ID Specimen No Mean Coefficient of Variation (%) #1 #2 #3
0-B-0 9.1 9.0 9.2 9.1 1.5 0-B-1 8.6 8.2 8.4 8.4 2.3 0-B-2 10.5 10.7 10.1 10.4 2.9 4-B-0 8.2 7.2 8.1 7.8 7.0 4-B-1 8.0 8.3 7.6 8.0 4.9 4-B-2 9.1 8.8 9.1 9.0 2.0 8-B-0 7.7 7.1 7.8 7.6 4.8 8-B-1 8.3 8.2 7.4 8.0 6.8 8-B-2 9.2 8.7 8.6 8.8 3.5
12-B-0 7.3 7.1 7.7 7.4 4.0 12-B-1 6.9 8.2 8.4 7.9 10.3 12-B-2 8.8 8.9 8.0 8.6 6.0 16-B-0 6.8 7.3 6.9 7.0 3.3 16-B-1 7.7 8.1 7.2 7.6 5.9 16-B-2 8.9 8.7 8.2 8.6 4.4
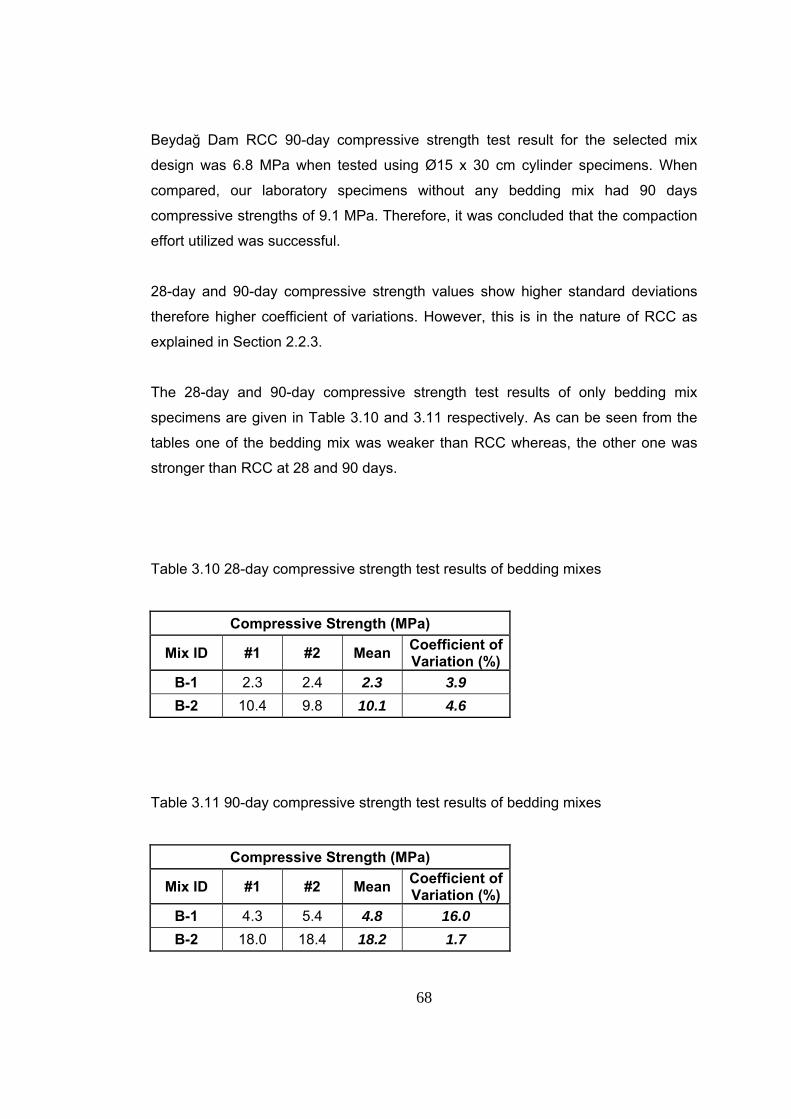
68
Beydağ Dam RCC 90-day compressive strength test result for the selected mix
design was 6.8 MPa when tested using Ø15 x 30 cm cylinder specimens. When
compared, our laboratory specimens without any bedding mix had 90 days
compressive strengths of 9.1 MPa. Therefore, it was concluded that the compaction
effort utilized was successful.
28-day and 90-day compressive strength values show higher standard deviations
therefore higher coefficient of variations. However, this is in the nature of RCC as
explained in Section 2.2.3.
The 28-day and 90-day compressive strength test results of only bedding mix
specimens are given in Table 3.10 and 3.11 respectively. As can be seen from the
tables one of the bedding mix was weaker than RCC whereas, the other one was
stronger than RCC at 28 and 90 days.
Table 3.10 28-day compressive strength test results of bedding mixes
Compressive Strength (MPa)
Mix ID #1 #2 Mean Coefficient of Variation (%)
B-1 2.3 2.4 2.3 3.9 B-2 10.4 9.8 10.1 4.6
Table 3.11 90-day compressive strength test results of bedding mixes
Compressive Strength (MPa)
Mix ID #1 #2 Mean Coefficient of Variation (%)
B-1 4.3 5.4 4.8 16.0 B-2 18.0 18.4 18.2 1.7
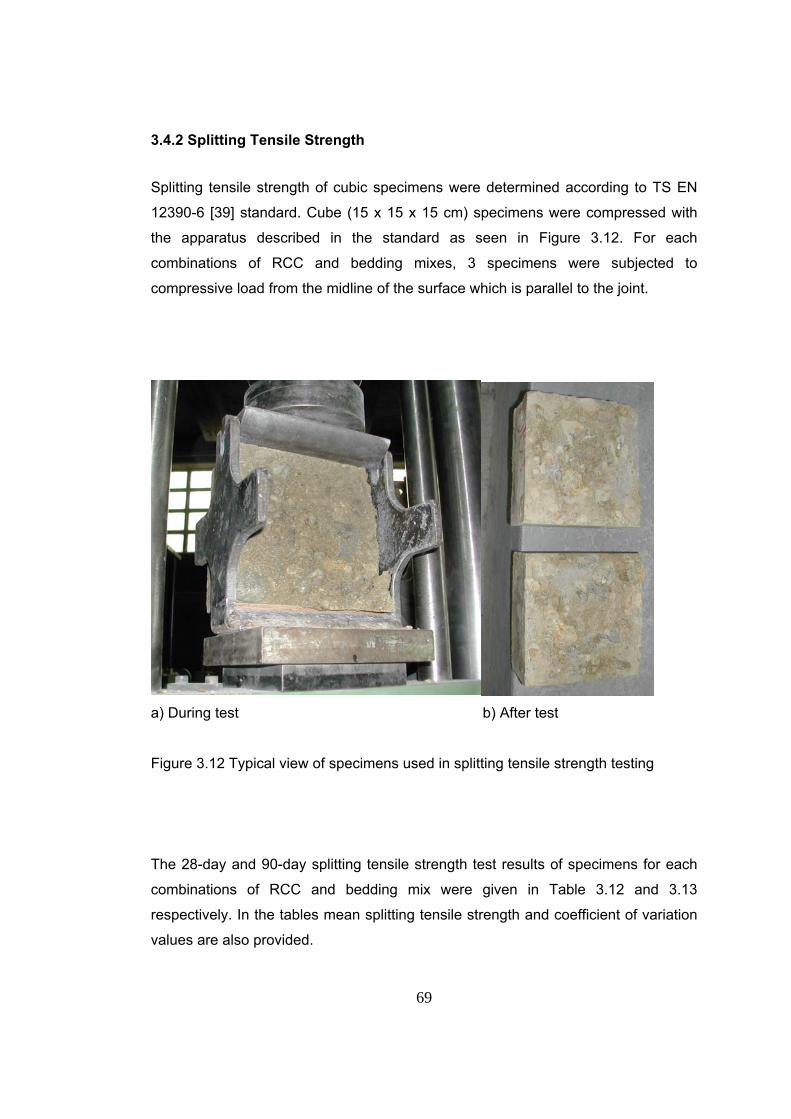
69
3.4.2 Splitting Tensile Strength
Splitting tensile strength of cubic specimens were determined according to TS EN
12390-6 [39] standard. Cube (15 x 15 x 15 cm) specimens were compressed with
the apparatus described in the standard as seen in Figure 3.12. For each
combinations of RCC and bedding mixes, 3 specimens were subjected to
compressive load from the midline of the surface which is parallel to the joint.
a) During test b) After test
Figure 3.12 Typical view of specimens used in splitting tensile strength testing
The 28-day and 90-day splitting tensile strength test results of specimens for each
combinations of RCC and bedding mix were given in Table 3.12 and 3.13
respectively. In the tables mean splitting tensile strength and coefficient of variation
values are also provided.
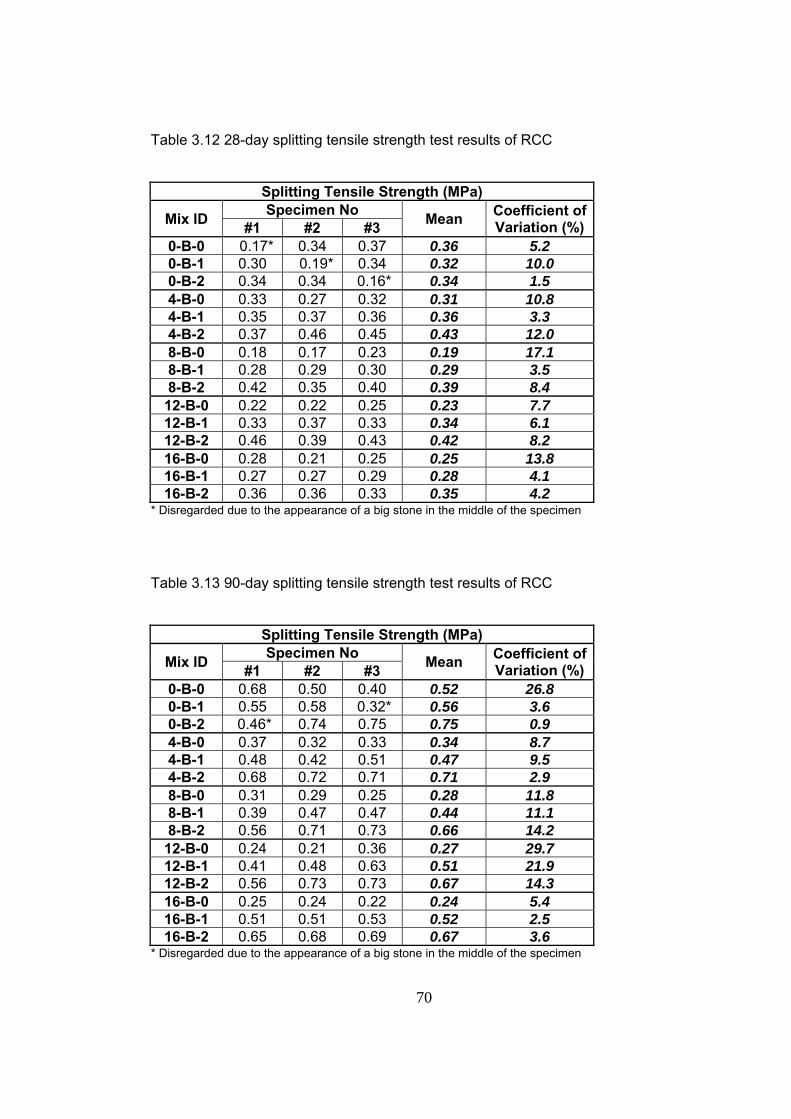
70
Table 3.12 28-day splitting tensile strength test results of RCC
Splitting Tensile Strength (MPa)
Mix ID Specimen No Mean Coefficient of Variation (%) #1 #2 #3
0-B-0 0.17* 0.34 0.37 0.36 5.2 0-B-1 0.30 0.19* 0.34 0.32 10.0 0-B-2 0.34 0.34 0.16* 0.34 1.5 4-B-0 0.33 0.27 0.32 0.31 10.8 4-B-1 0.35 0.37 0.36 0.36 3.3 4-B-2 0.37 0.46 0.45 0.43 12.0 8-B-0 0.18 0.17 0.23 0.19 17.1 8-B-1 0.28 0.29 0.30 0.29 3.5 8-B-2 0.42 0.35 0.40 0.39 8.4
12-B-0 0.22 0.22 0.25 0.23 7.7 12-B-1 0.33 0.37 0.33 0.34 6.1 12-B-2 0.46 0.39 0.43 0.42 8.2 16-B-0 0.28 0.21 0.25 0.25 13.8 16-B-1 0.27 0.27 0.29 0.28 4.1 16-B-2 0.36 0.36 0.33 0.35 4.2
* Disregarded due to the appearance of a big stone in the middle of the specimen
Table 3.13 90-day splitting tensile strength test results of RCC
Splitting Tensile Strength (MPa)
Mix ID Specimen No Mean Coefficient of Variation (%) #1 #2 #3
0-B-0 0.68 0.50 0.40 0.52 26.8 0-B-1 0.55 0.58 0.32* 0.56 3.6 0-B-2 0.46* 0.74 0.75 0.75 0.9 4-B-0 0.37 0.32 0.33 0.34 8.7 4-B-1 0.48 0.42 0.51 0.47 9.5 4-B-2 0.68 0.72 0.71 0.71 2.9 8-B-0 0.31 0.29 0.25 0.28 11.8 8-B-1 0.39 0.47 0.47 0.44 11.1 8-B-2 0.56 0.71 0.73 0.66 14.2
12-B-0 0.24 0.21 0.36 0.27 29.7 12-B-1 0.41 0.48 0.63 0.51 21.9 12-B-2 0.56 0.73 0.73 0.67 14.3 16-B-0 0.25 0.24 0.22 0.24 5.4 16-B-1 0.51 0.51 0.53 0.52 2.5 16-B-2 0.65 0.68 0.69 0.67 3.6
* Disregarded due to the appearance of a big stone in the middle of the specimen
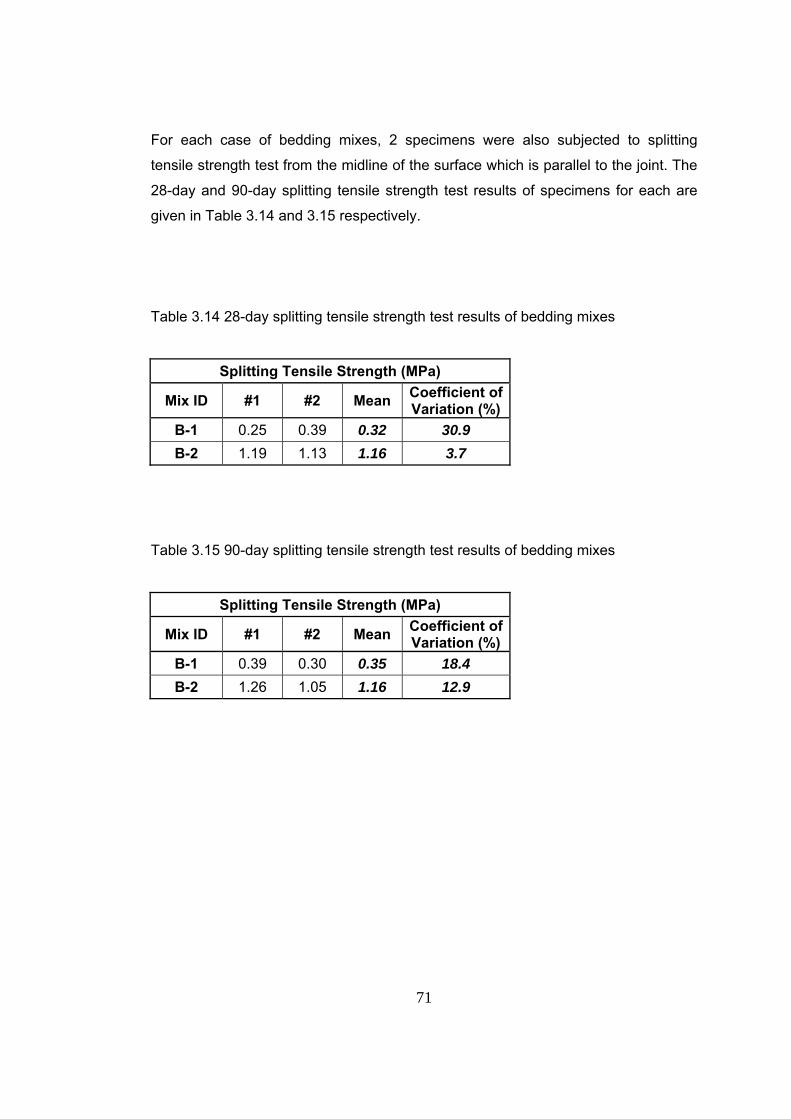
71
For each case of bedding mixes, 2 specimens were also subjected to splitting
tensile strength test from the midline of the surface which is parallel to the joint. The
28-day and 90-day splitting tensile strength test results of specimens for each are
given in Table 3.14 and 3.15 respectively.
Table 3.14 28-day splitting tensile strength test results of bedding mixes
Splitting Tensile Strength (MPa)
Mix ID #1 #2 Mean Coefficient of Variation (%)
B-1 0.25 0.39 0.32 30.9 B-2 1.19 1.13 1.16 3.7
Table 3.15 90-day splitting tensile strength test results of bedding mixes
Splitting Tensile Strength (MPa)
Mix ID #1 #2 Mean Coefficient of Variation (%)
B-1 0.39 0.30 0.35 18.4 B-2 1.26 1.05 1.16 12.9
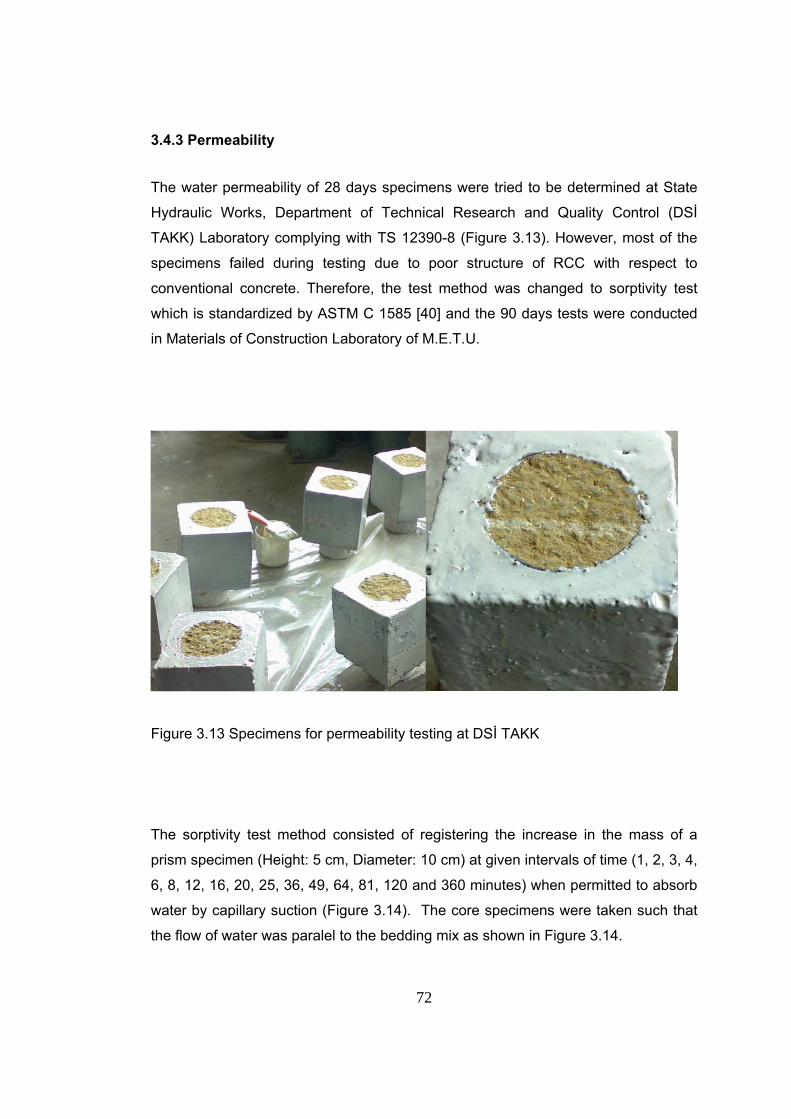
72
3.4.3 Permeability
The water permeability of 28 days specimens were tried to be determined at State
Hydraulic Works, Department of Technical Research and Quality Control (DSİ
TAKK) Laboratory complying with TS 12390-8 (Figure 3.13). However, most of the
specimens failed during testing due to poor structure of RCC with respect to
conventional concrete. Therefore, the test method was changed to sorptivity test
which is standardized by ASTM C 1585 [40] and the 90 days tests were conducted
in Materials of Construction Laboratory of M.E.T.U.
Figure 3.13 Specimens for permeability testing at DSİ TAKK
The sorptivity test method consisted of registering the increase in the mass of a
prism specimen (Height: 5 cm, Diameter: 10 cm) at given intervals of time (1, 2, 3, 4,
6, 8, 12, 16, 20, 25, 36, 49, 64, 81, 120 and 360 minutes) when permitted to absorb
water by capillary suction (Figure 3.14). The core specimens were taken such that
the flow of water was paralel to the bedding mix as shown in Figure 3.14.
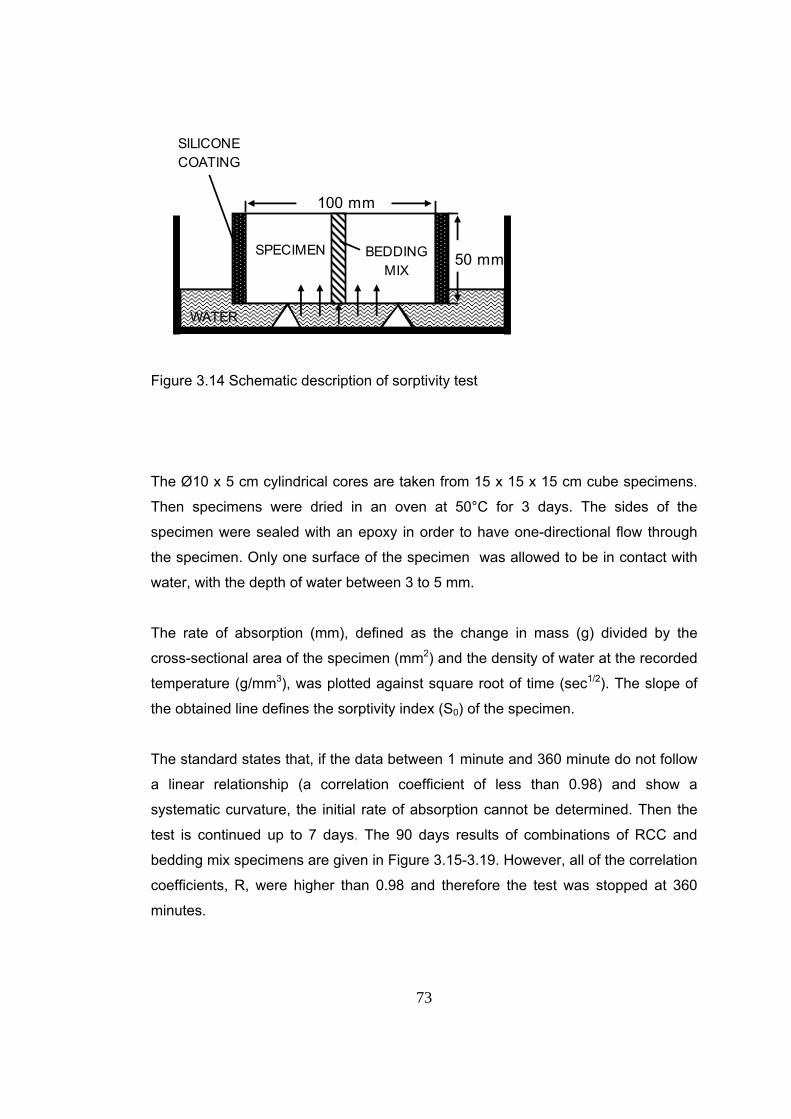
73
WATER
50 mm
100 mm
SPECIMEN
SILICONECOATING
BEDDING MIX
Figure 3.14 Schematic description of sorptivity test
The Ø10 x 5 cm cylindrical cores are taken from 15 x 15 x 15 cm cube specimens.
Then specimens were dried in an oven at 50°C for 3 days. The sides of the
specimen were sealed with an epoxy in order to have one-directional flow through
the specimen. Only one surface of the specimen was allowed to be in contact with
water, with the depth of water between 3 to 5 mm.
The rate of absorption (mm), defined as the change in mass (g) divided by the
cross-sectional area of the specimen (mm2) and the density of water at the recorded
temperature (g/mm3), was plotted against square root of time (sec1/2). The slope of
the obtained line defines the sorptivity index (S0) of the specimen.
The standard states that, if the data between 1 minute and 360 minute do not follow
a linear relationship (a correlation coefficient of less than 0.98) and show a
systematic curvature, the initial rate of absorption cannot be determined. Then the
test is continued up to 7 days. The 90 days results of combinations of RCC and
bedding mix specimens are given in Figure 3.15-3.19. However, all of the correlation
coefficients, R, were higher than 0.98 and therefore the test was stopped at 360
minutes.
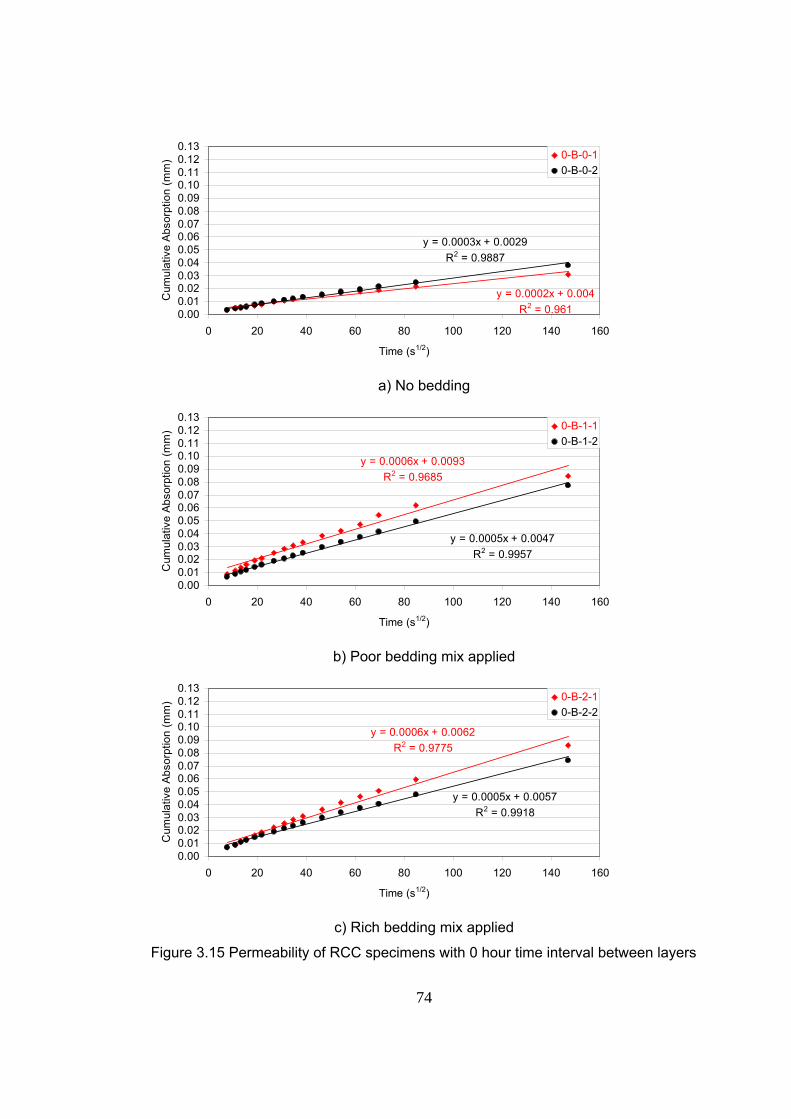
74
y = 0.0002x + 0.004R2 = 0.961
y = 0.0003x + 0.0029R2 = 0.9887
0.000.010.020.030.040.050.060.070.080.090.100.110.120.13
0 20 40 60 80 100 120 140 160
Time (s1/2)
Cum
ulat
ive
Abso
rptio
n (m
m) 0-B-0-1
0-B-0-2
a) No bedding
y = 0.0006x + 0.0093R2 = 0.9685
y = 0.0005x + 0.0047R2 = 0.9957
0.000.010.020.030.040.050.060.070.080.090.100.110.120.13
0 20 40 60 80 100 120 140 160
Time (s1/2)
Cum
ulat
ive
Abso
rptio
n (m
m) 0-B-1-1
0-B-1-2
b) Poor bedding mix applied
y = 0.0006x + 0.0062R2 = 0.9775
y = 0.0005x + 0.0057R2 = 0.9918
0.000.010.020.030.040.050.060.070.080.090.100.110.120.13
0 20 40 60 80 100 120 140 160
Time (s1/2)
Cum
ulat
ive
Abso
rptio
n (m
m) 0-B-2-1
0-B-2-2
c) Rich bedding mix applied
Figure 3.15 Permeability of RCC specimens with 0 hour time interval between layers
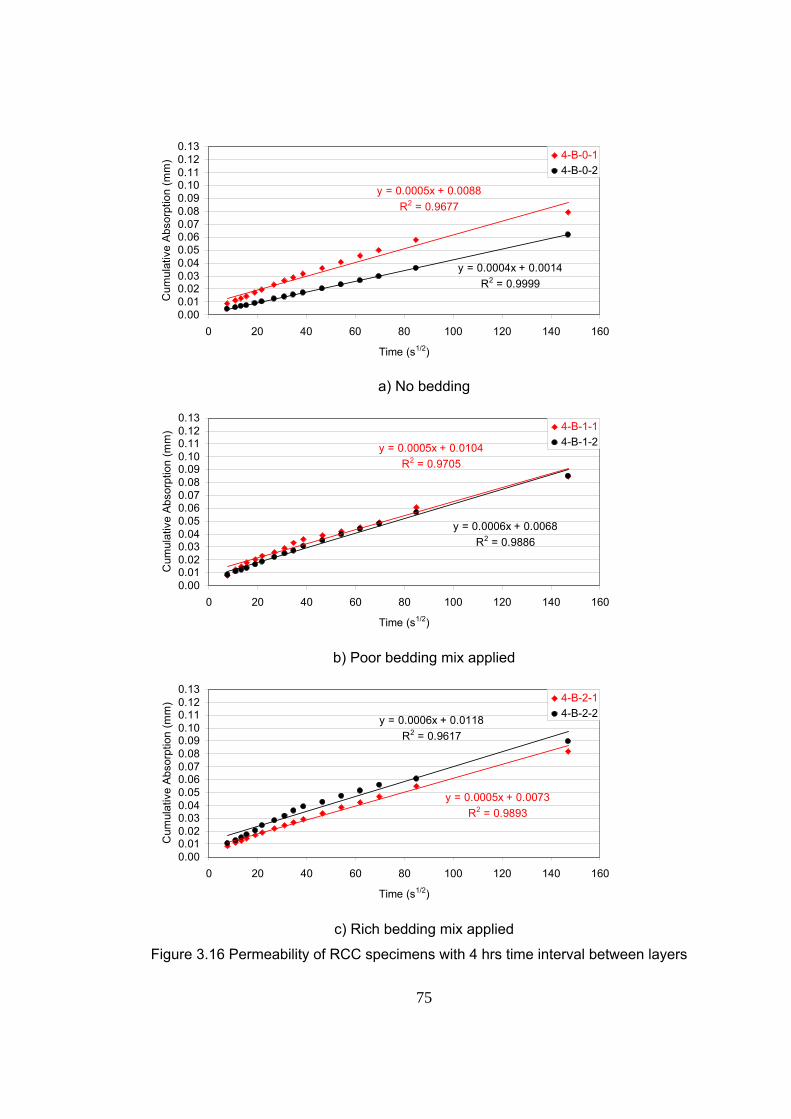
75
y = 0.0005x + 0.0088R2 = 0.9677
y = 0.0004x + 0.0014R2 = 0.9999
0.000.010.020.030.040.050.060.070.080.090.100.110.120.13
0 20 40 60 80 100 120 140 160
Time (s1/2)
Cum
ulat
ive
Abs
orpt
ion
(mm
) 4-B-0-14-B-0-2
a) No bedding
y = 0.0005x + 0.0104R2 = 0.9705
y = 0.0006x + 0.0068R2 = 0.9886
0.000.010.020.030.040.050.060.070.080.090.100.110.120.13
0 20 40 60 80 100 120 140 160
Time (s1/2)
Cum
ulat
ive
Abs
orpt
ion
(mm
) 4-B-1-14-B-1-2
b) Poor bedding mix applied
y = 0.0005x + 0.0073R2 = 0.9893
y = 0.0006x + 0.0118R2 = 0.9617
0.000.010.020.030.040.050.060.070.080.090.100.110.120.13
0 20 40 60 80 100 120 140 160
Time (s1/2)
Cum
ulat
ive
Abs
orpt
ion
(mm
) 4-B-2-14-B-2-2
c) Rich bedding mix applied
Figure 3.16 Permeability of RCC specimens with 4 hrs time interval between layers
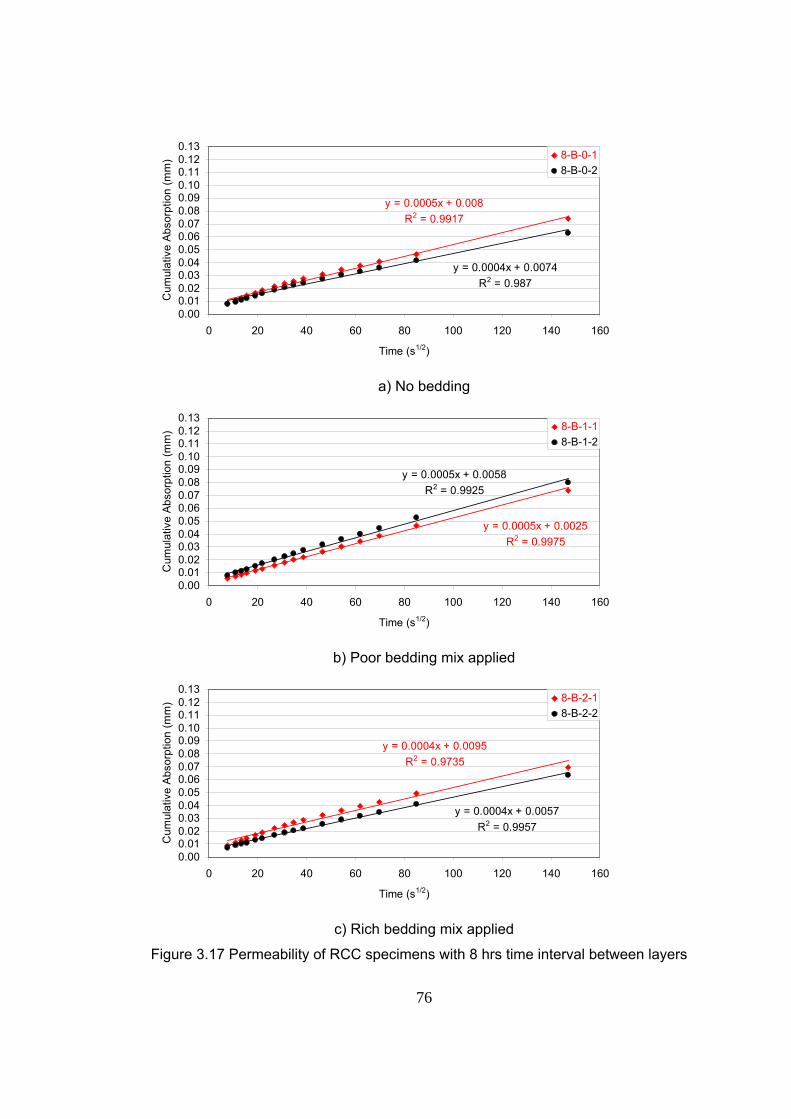
76
y = 0.0005x + 0.008R2 = 0.9917
y = 0.0004x + 0.0074R2 = 0.987
0.000.010.020.030.040.050.060.070.080.090.100.110.120.13
0 20 40 60 80 100 120 140 160
Time (s1/2)
Cum
ulat
ive
Abs
orpt
ion
(mm
) 8-B-0-18-B-0-2
a) No bedding
y = 0.0005x + 0.0025R2 = 0.9975
y = 0.0005x + 0.0058R2 = 0.9925
0.000.010.020.030.040.050.060.070.080.090.100.110.120.13
0 20 40 60 80 100 120 140 160
Time (s1/2)
Cum
ulat
ive
Abs
orpt
ion
(mm
) 8-B-1-18-B-1-2
b) Poor bedding mix applied
y = 0.0004x + 0.0095R2 = 0.9735
y = 0.0004x + 0.0057R2 = 0.9957
0.000.010.020.030.040.050.060.070.080.090.100.110.120.13
0 20 40 60 80 100 120 140 160
Time (s1/2)
Cum
ulat
ive
Abs
orpt
ion
(mm
) 8-B-2-18-B-2-2
c) Rich bedding mix applied
Figure 3.17 Permeability of RCC specimens with 8 hrs time interval between layers
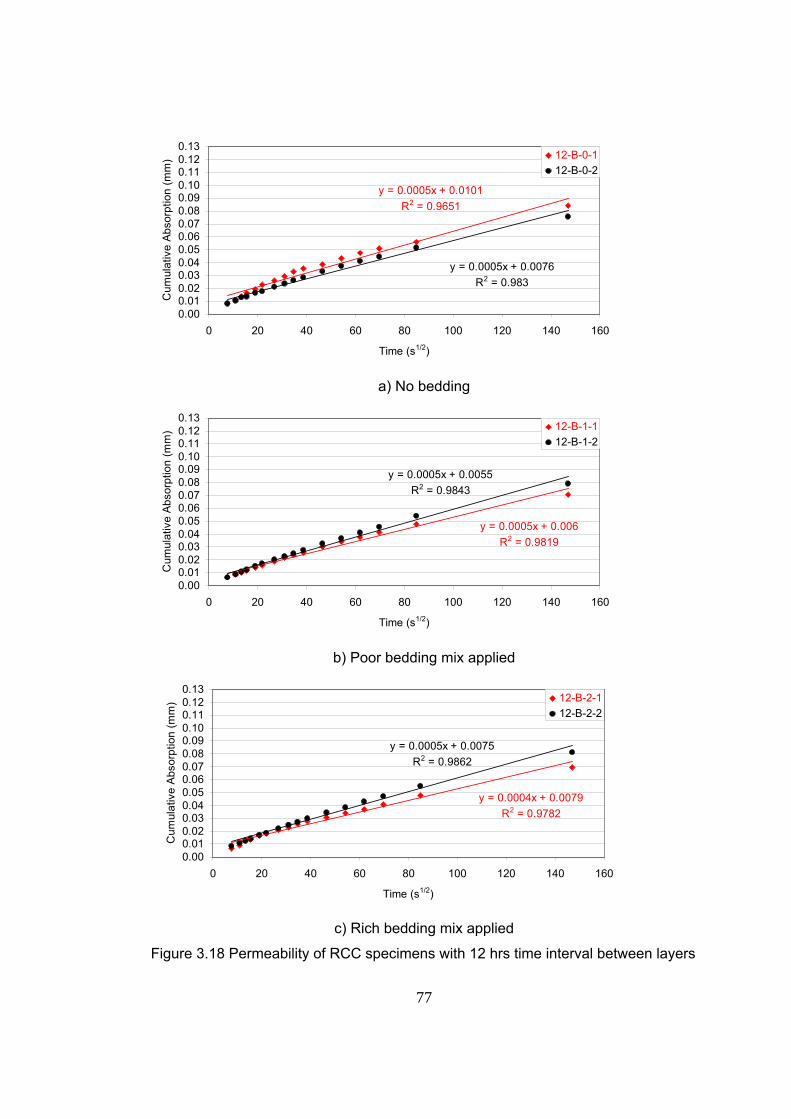
77
y = 0.0005x + 0.0101R2 = 0.9651
y = 0.0005x + 0.0076R2 = 0.983
0.000.010.020.030.040.050.060.070.080.090.100.110.120.13
0 20 40 60 80 100 120 140 160
Time (s1/2)
Cum
ulat
ive
Abs
orpt
ion
(mm
) 12-B-0-112-B-0-2
a) No bedding
y = 0.0005x + 0.006R2 = 0.9819
y = 0.0005x + 0.0055R2 = 0.9843
0.000.010.020.030.040.050.060.070.080.090.100.110.120.13
0 20 40 60 80 100 120 140 160
Time (s1/2)
Cum
ulat
ive
Abs
orpt
ion
(mm
) 12-B-1-112-B-1-2
b) Poor bedding mix applied
y = 0.0004x + 0.0079R2 = 0.9782
y = 0.0005x + 0.0075R2 = 0.9862
0.000.010.020.030.040.050.060.070.080.090.100.110.120.13
0 20 40 60 80 100 120 140 160
Time (s1/2)
Cum
ulat
ive
Abs
orpt
ion
(mm
) 12-B-2-112-B-2-2
c) Rich bedding mix applied
Figure 3.18 Permeability of RCC specimens with 12 hrs time interval between layers
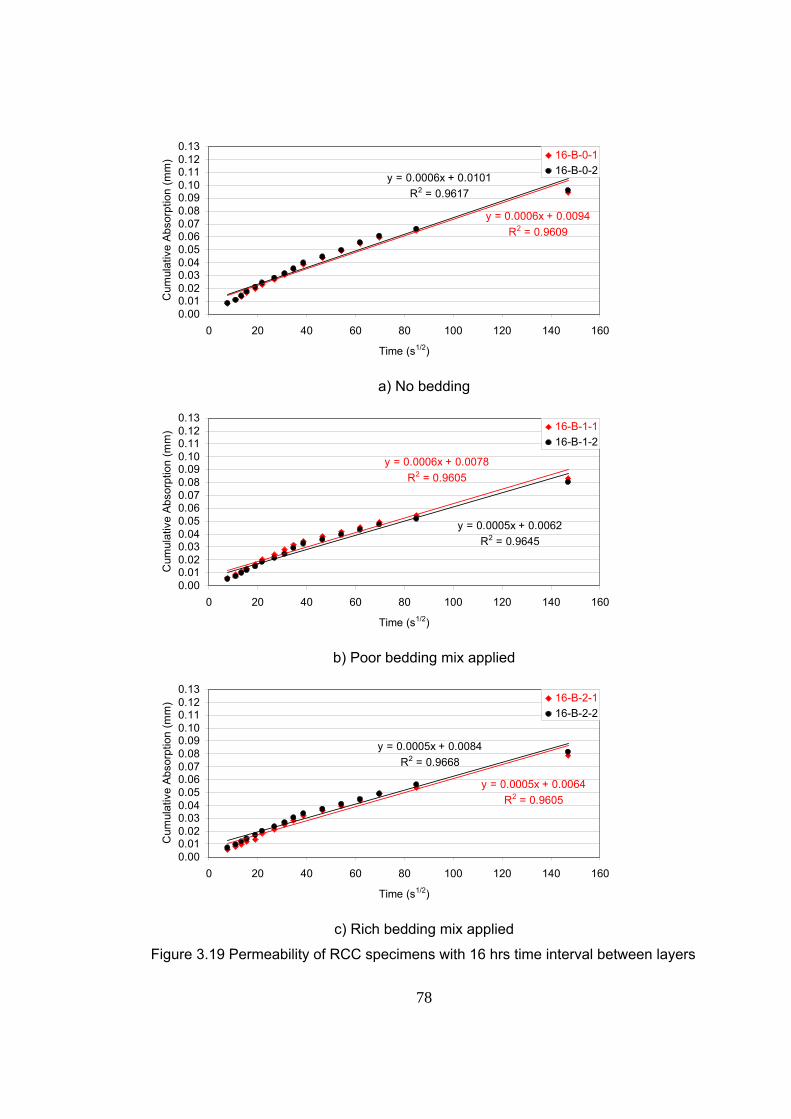
78
y = 0.0006x + 0.0094R2 = 0.9609
y = 0.0006x + 0.0101R2 = 0.9617
0.000.010.020.030.040.050.060.070.080.090.100.110.120.13
0 20 40 60 80 100 120 140 160
Time (s1/2)
Cum
ulat
ive
Abs
orpt
ion
(mm
) 16-B-0-116-B-0-2
a) No bedding
y = 0.0006x + 0.0078R2 = 0.9605
y = 0.0005x + 0.0062R2 = 0.9645
0.000.010.020.030.040.050.060.070.080.090.100.110.120.13
0 20 40 60 80 100 120 140 160
Time (s1/2)
Cum
ulat
ive
Abs
orpt
ion
(mm
) 16-B-1-116-B-1-2
b) Poor bedding mix applied
y = 0.0005x + 0.0064R2 = 0.9605
y = 0.0005x + 0.0084R2 = 0.9668
0.000.010.020.030.040.050.060.070.080.090.100.110.120.13
0 20 40 60 80 100 120 140 160
Time (s1/2)
Cum
ulat
ive
Abs
orpt
ion
(mm
) 16-B-2-116-B-2-2
c) Rich bedding mix applied
Figure 3.19 Permeability of RCC specimens with 16 hrs time interval between layers
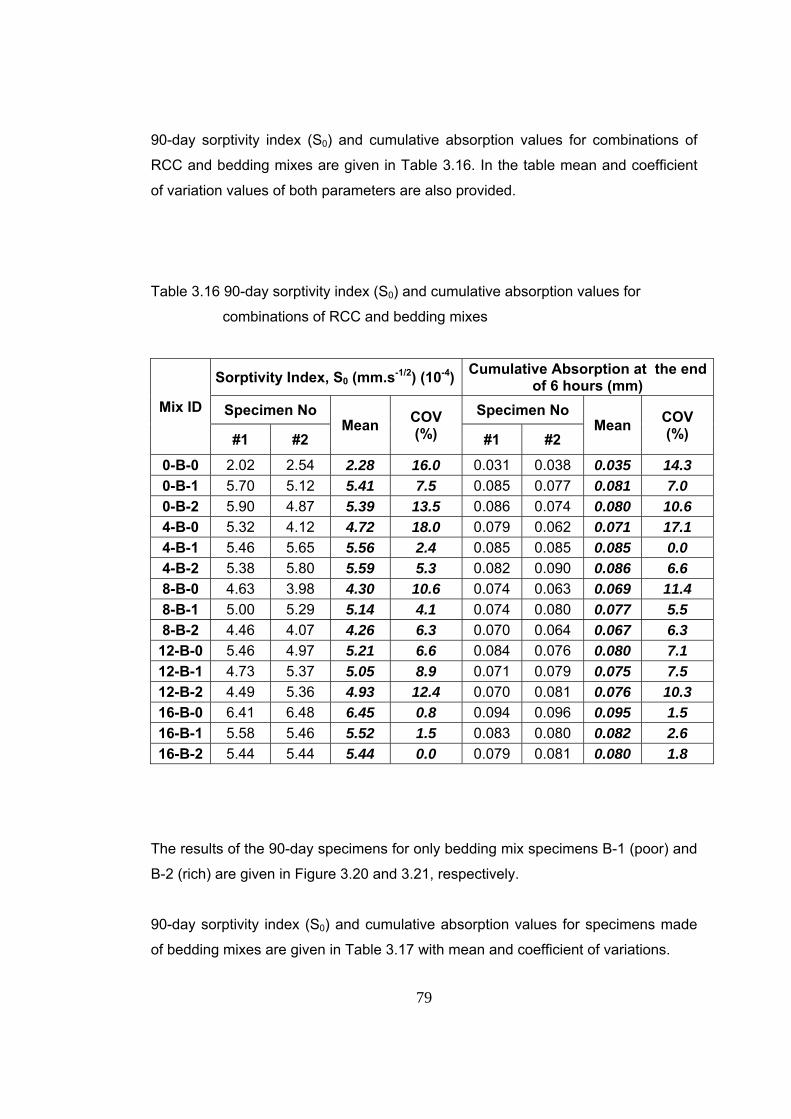
79
90-day sorptivity index (S0) and cumulative absorption values for combinations of
RCC and bedding mixes are given in Table 3.16. In the table mean and coefficient
of variation values of both parameters are also provided.
Table 3.16 90-day sorptivity index (S0) and cumulative absorption values for
combinations of RCC and bedding mixes
Mix ID
Sorptivity Index, S0 (mm.s-1/2) (10-4) Cumulative Absorption at the end of 6 hours (mm)
Specimen No Mean COV
(%) Specimen No
Mean COV (%) #1 #2 #1 #2
0-B-0 2.02 2.54 2.28 16.0 0.031 0.038 0.035 14.3 0-B-1 5.70 5.12 5.41 7.5 0.085 0.077 0.081 7.0 0-B-2 5.90 4.87 5.39 13.5 0.086 0.074 0.080 10.6 4-B-0 5.32 4.12 4.72 18.0 0.079 0.062 0.071 17.1 4-B-1 5.46 5.65 5.56 2.4 0.085 0.085 0.085 0.0 4-B-2 5.38 5.80 5.59 5.3 0.082 0.090 0.086 6.6 8-B-0 4.63 3.98 4.30 10.6 0.074 0.063 0.069 11.4 8-B-1 5.00 5.29 5.14 4.1 0.074 0.080 0.077 5.5 8-B-2 4.46 4.07 4.26 6.3 0.070 0.064 0.067 6.3
12-B-0 5.46 4.97 5.21 6.6 0.084 0.076 0.080 7.1 12-B-1 4.73 5.37 5.05 8.9 0.071 0.079 0.075 7.5 12-B-2 4.49 5.36 4.93 12.4 0.070 0.081 0.076 10.3 16-B-0 6.41 6.48 6.45 0.8 0.094 0.096 0.095 1.5 16-B-1 5.58 5.46 5.52 1.5 0.083 0.080 0.082 2.6 16-B-2 5.44 5.44 5.44 0.0 0.079 0.081 0.080 1.8
The results of the 90-day specimens for only bedding mix specimens B-1 (poor) and
B-2 (rich) are given in Figure 3.20 and 3.21, respectively.
90-day sorptivity index (S0) and cumulative absorption values for specimens made
of bedding mixes are given in Table 3.17 with mean and coefficient of variations.
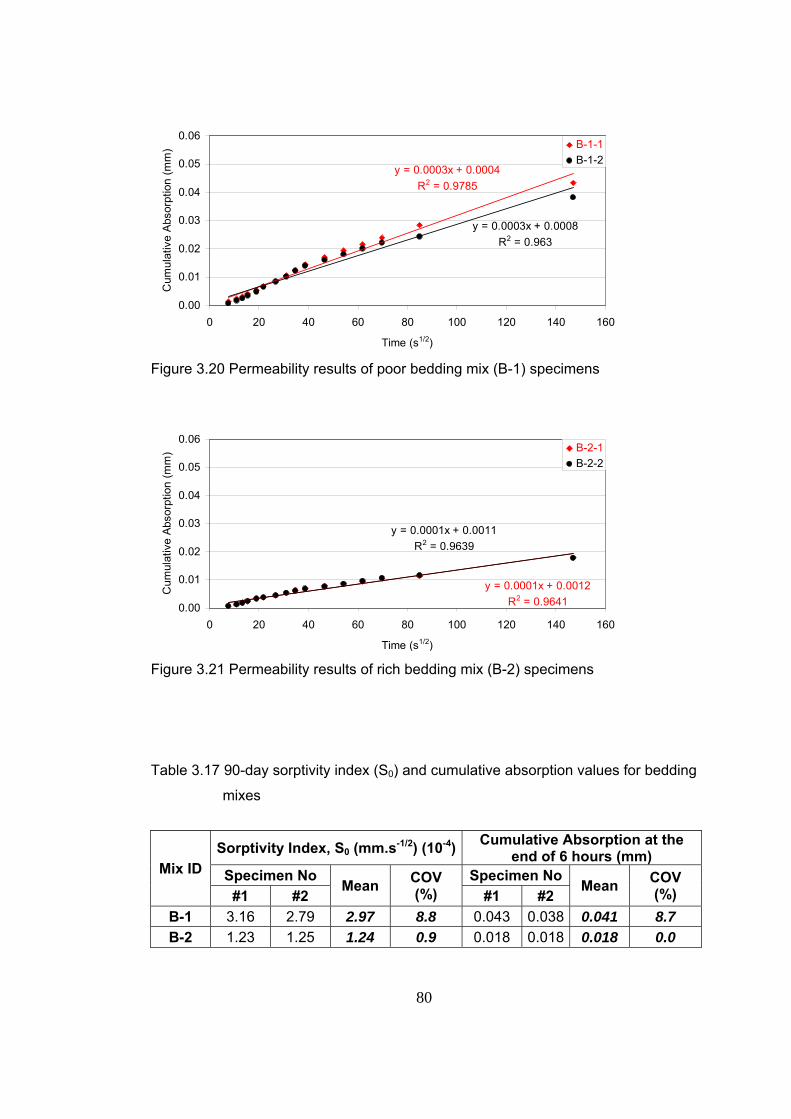
80
y = 0.0003x + 0.0004R2 = 0.9785
y = 0.0003x + 0.0008R2 = 0.963
0.00
0.01
0.02
0.03
0.04
0.05
0.06
0 20 40 60 80 100 120 140 160
Time (s1/2)
Cum
ulat
ive
Abs
orpt
ion
(mm
) B-1-1B-1-2
Figure 3.20 Permeability results of poor bedding mix (B-1) specimens
y = 0.0001x + 0.0012R2 = 0.9641
y = 0.0001x + 0.0011R2 = 0.9639
0.00
0.01
0.02
0.03
0.04
0.05
0.06
0 20 40 60 80 100 120 140 160
Time (s1/2)
Cum
ulat
ive
Abs
orpt
ion
(mm
) B-2-1B-2-2
Figure 3.21 Permeability results of rich bedding mix (B-2) specimens
Table 3.17 90-day sorptivity index (S0) and cumulative absorption values for bedding
mixes
Mix ID Sorptivity Index, S0 (mm.s-1/2) (10-4) Cumulative Absorption at the
end of 6 hours (mm) Specimen No
Mean COV (%)
Specimen No Mean COV
(%) #1 #2 #1 #2 B-1 3.16 2.79 2.97 8.8 0.043 0.038 0.041 8.7 B-2 1.23 1.25 1.24 0.9 0.018 0.018 0.018 0.0
81
CHAPTER 4
DISCUSSION OF RESULTS
The RCC mix utilized in this study was obtained from Beydağ Project RCC studies.
Therefore, only hardened properties (compressive strength, splitting tensile strength
and permeability) were determined in the laboratory which is in line with the
objectives of the study.
4.1 Compressive Strength In Figure 4.1, 28-day and 90-day compressive strength test results vs. time intervals
between compaction of successive layers of RCC are given schematically for
different bedding mortar applications and unbedded specimens. As seen from the
figure, there are differences between the compressive strength results obtained for
bedded and unbedded specimens as well as the time interval the bedding mix was
applied. When the 28-day and 90-day compressive strength values are compared,
the 90-day compressive strength values are almost two times of 28-day
compressive strength values. In addition, when compared to the RCC mix studies
performed in the Beydağ Project, at the end of 90 days, all RCC specimens provide
the design strength of 6.8 MPa (cylinder specimen) as given in Section 2.7.
Therefore, it is concluded that the proper compaction equipment and method has
been used in the experimental work.
Moreover, as can be seen in Figure 4.1a, 28-day compressive strength regression
lines of poor (B-1) and rich (B-2) bedding mixes applied specimens show a small
increasing trend whereas unbedded (B-0) specimens show relatively higher
decreasing trend when the time interval between two successive layers increases.
For this reason, it is concluded that the 28-day compressive strength of bedding mix
applied specimens is not much related to the time interval between compaction of
successive layers of RCC.
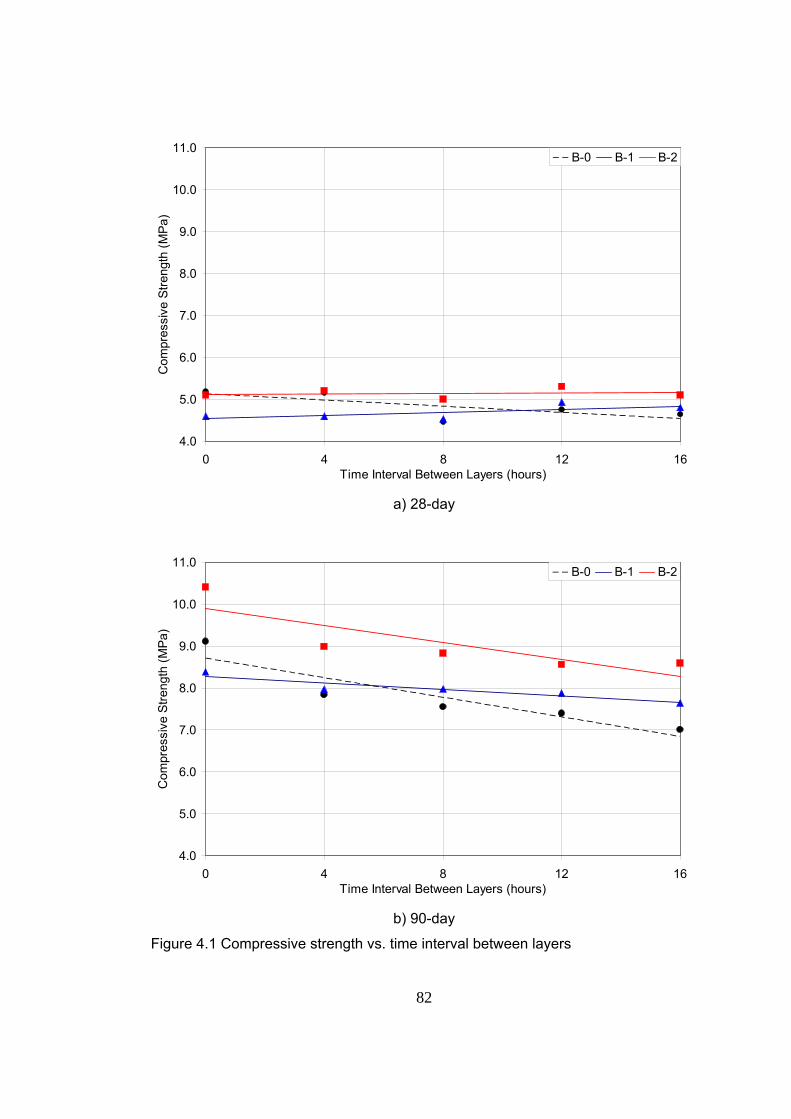
82
4.0
5.0
6.0
7.0
8.0
9.0
10.0
11.0
0 4 8 12 16Time Interval Between Layers (hours)
Com
pres
sive
Stre
ngth
(MPa
)B-0 B-1 B-2
a) 28-day
4.0
5.0
6.0
7.0
8.0
9.0
10.0
11.0
0 4 8 12 16Time Interval Between Layers (hours)
Com
pres
sive
Stre
ngth
(MPa
)
B-0 B-1 B-2
b) 90-day
Figure 4.1 Compressive strength vs. time interval between layers
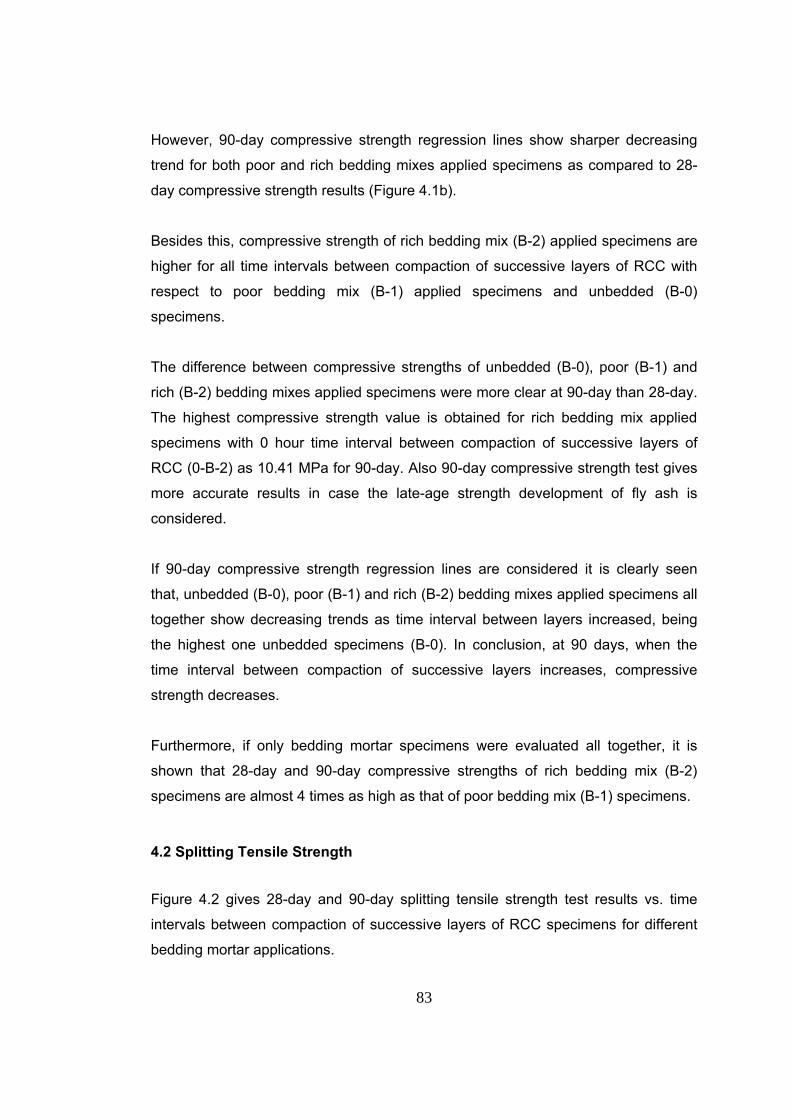
83
However, 90-day compressive strength regression lines show sharper decreasing
trend for both poor and rich bedding mixes applied specimens as compared to 28-
day compressive strength results (Figure 4.1b).
Besides this, compressive strength of rich bedding mix (B-2) applied specimens are
higher for all time intervals between compaction of successive layers of RCC with
respect to poor bedding mix (B-1) applied specimens and unbedded (B-0)
specimens.
The difference between compressive strengths of unbedded (B-0), poor (B-1) and
rich (B-2) bedding mixes applied specimens were more clear at 90-day than 28-day.
The highest compressive strength value is obtained for rich bedding mix applied
specimens with 0 hour time interval between compaction of successive layers of
RCC (0-B-2) as 10.41 MPa for 90-day. Also 90-day compressive strength test gives
more accurate results in case the late-age strength development of fly ash is
considered.
If 90-day compressive strength regression lines are considered it is clearly seen
that, unbedded (B-0), poor (B-1) and rich (B-2) bedding mixes applied specimens all
together show decreasing trends as time interval between layers increased, being
the highest one unbedded specimens (B-0). In conclusion, at 90 days, when the
time interval between compaction of successive layers increases, compressive
strength decreases.
Furthermore, if only bedding mortar specimens were evaluated all together, it is
shown that 28-day and 90-day compressive strengths of rich bedding mix (B-2)
specimens are almost 4 times as high as that of poor bedding mix (B-1) specimens.
4.2 Splitting Tensile Strength Figure 4.2 gives 28-day and 90-day splitting tensile strength test results vs. time
intervals between compaction of successive layers of RCC specimens for different
bedding mortar applications.
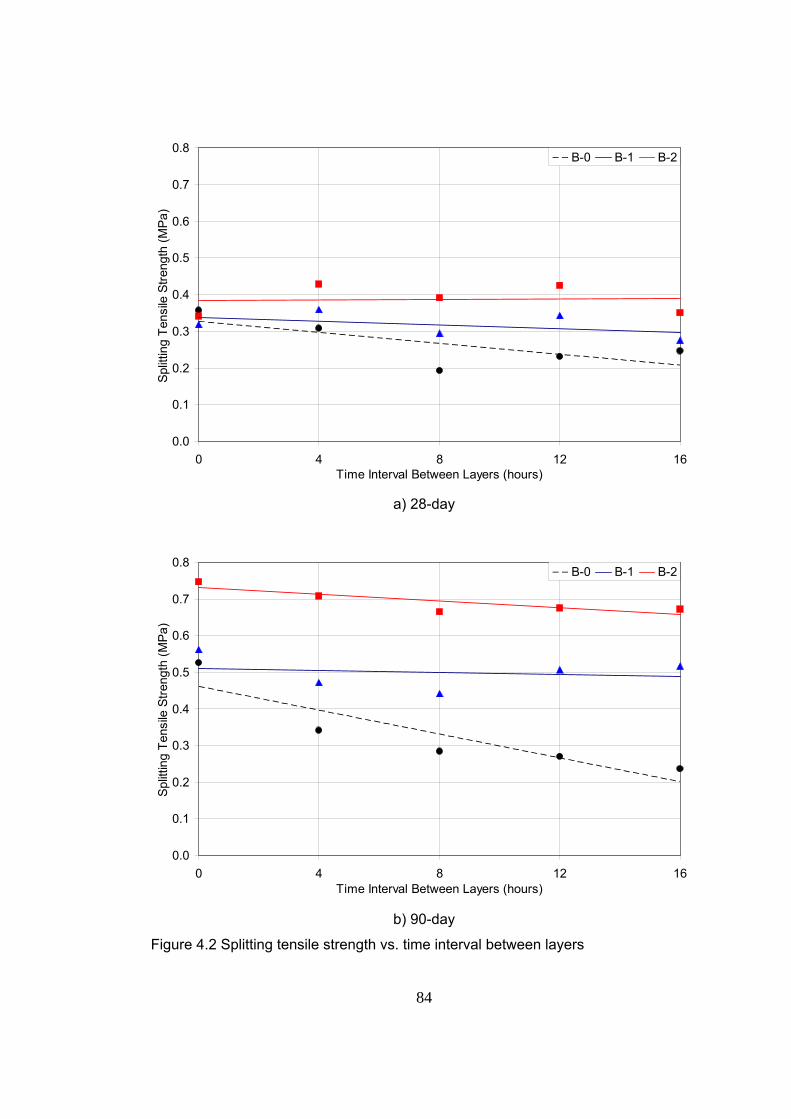
84
0.0
0.1
0.2
0.3
0.4
0.5
0.6
0.7
0.8
0 4 8 12 16Time Interval Between Layers (hours)
Split
ting
Tens
ile S
treng
th (M
Pa)
B-0 B-1 B-2
a) 28-day
0.0
0.1
0.2
0.3
0.4
0.5
0.6
0.7
0.8
0 4 8 12 16Time Interval Between Layers (hours)
Split
ting
Tens
ile S
treng
th (M
Pa)
B-0 B-1 B-2
b) 90-day
Figure 4.2 Splitting tensile strength vs. time interval between layers
85
As seen from the figure, there are differences between the splitting tensile strength
results obtained for bedded and unbedded specimens as well as the time interval
the bedding mix was applied. Moreover, the 90-day splitting tensile strengths are
almost 1.5 times of 28-day splitting tensile strength values.
Moreover, as it is shown in Figure 4.2a, 28-day splitting tensile strength regression
lines of rich (B-2) and poor (B-1) bedding mixes applied specimens show small
increasing and decreasing trends respectively, whereas unbedded (B-0) specimens
show sharper decreasing trend. However, 90-day splitting tensile strength
regression lines show small decreasing trend for rich (B-2) and poor (B-1) bedding
mixes applied specimens as compared to unbedded (B-0) specimens which show
sharp decreasing trend (Figure 4.2b). For this reason, it is concluded that 28-day
and 90-day splitting tensile strength of bedding mix applied specimens are not much
related to the time interval between compaction of successive layers of RCC.
Furthermore, splitting tensile strength of rich bedding mix (B-2) applied specimens
are higher for all time intervals between compaction of successive layers of RCC
with respect to poor bedding mix (B-1) applied specimens and unbedded (B-0)
specimens.
The difference between splitting tensile strengths of unbedded (B-0), poor (B-1) and
rich (B-2) bedding mixes applied specimens were more clear at 90 days than 28
days. The highest splitting tensile strength value is obtained for rich bedding mix
applied specimens with 0 hour time interval between compaction of successive
layers of RCC (0-B-2) as 0.75 MPa for 90 days.
In addition, if only bedding mortar specimens were evaluated all together, it is shown
that 28-day and 90-day splitting tensile strengths of rich (B-2) and poor (B-1)
bedding mix specimens are almost same.
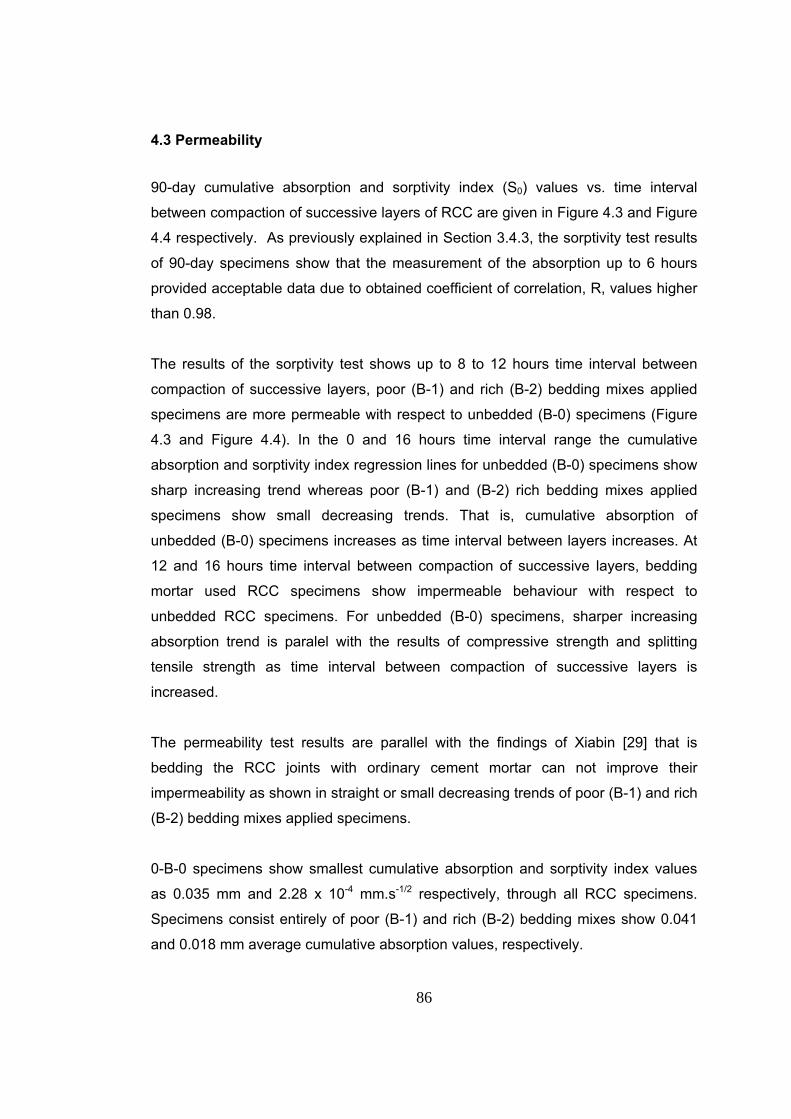
86
4.3 Permeability
90-day cumulative absorption and sorptivity index (S0) values vs. time interval
between compaction of successive layers of RCC are given in Figure 4.3 and Figure
4.4 respectively. As previously explained in Section 3.4.3, the sorptivity test results
of 90-day specimens show that the measurement of the absorption up to 6 hours
provided acceptable data due to obtained coefficient of correlation, R, values higher
than 0.98.
The results of the sorptivity test shows up to 8 to 12 hours time interval between
compaction of successive layers, poor (B-1) and rich (B-2) bedding mixes applied
specimens are more permeable with respect to unbedded (B-0) specimens (Figure
4.3 and Figure 4.4). In the 0 and 16 hours time interval range the cumulative
absorption and sorptivity index regression lines for unbedded (B-0) specimens show
sharp increasing trend whereas poor (B-1) and (B-2) rich bedding mixes applied
specimens show small decreasing trends. That is, cumulative absorption of
unbedded (B-0) specimens increases as time interval between layers increases. At
12 and 16 hours time interval between compaction of successive layers, bedding
mortar used RCC specimens show impermeable behaviour with respect to
unbedded RCC specimens. For unbedded (B-0) specimens, sharper increasing
absorption trend is paralel with the results of compressive strength and splitting
tensile strength as time interval between compaction of successive layers is
increased.
The permeability test results are parallel with the findings of Xiabin [29] that is
bedding the RCC joints with ordinary cement mortar can not improve their
impermeability as shown in straight or small decreasing trends of poor (B-1) and rich
(B-2) bedding mixes applied specimens.
0-B-0 specimens show smallest cumulative absorption and sorptivity index values
as 0.035 mm and 2.28 x 10⁻⁴ mm.s-1/2 respectively, through all RCC specimens.
Specimens consist entirely of poor (B-1) and rich (B-2) bedding mixes show 0.041
and 0.018 mm average cumulative absorption values, respectively.
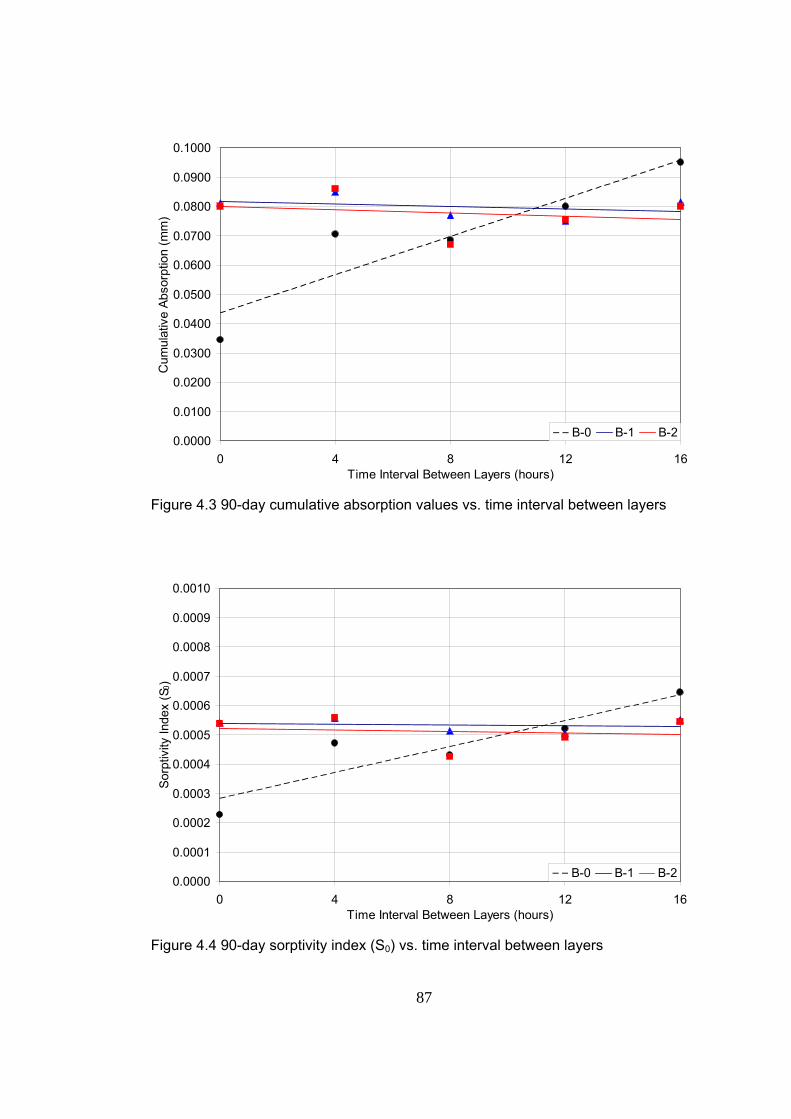
87
0.0000
0.0100
0.0200
0.0300
0.0400
0.0500
0.0600
0.0700
0.0800
0.0900
0.1000
0 4 8 12 16Time Interval Between Layers (hours)
Cum
ulat
ive
Abso
rptio
n (m
m)
B-0 B-1 B-2
Figure 4.3 90-day cumulative absorption values vs. time interval between layers
0.0000
0.0001
0.0002
0.0003
0.0004
0.0005
0.0006
0.0007
0.0008
0.0009
0.0010
0 4 8 12 16Time Interval Between Layers (hours)
Sorp
tivity
Inde
x (S
0)
B-0 B-1 B-2
Figure 4.4 90-day sorptivity index (S0) vs. time interval between layers
88
CHAPTER 5
SUMMARY AND CONCLUSIONS
This thesis discusses an experimental program carried out at the Materials of
Construction Laboratory of M.E.T.U. Civil Engineering Department to investigate the
bonding efficiency of roller compacted concrete (RCC) with different bedding mixes.
One of the bedding mix is termed a poor mix having 200 kg/m3 cement content (B-
1), while the other one is termed rich having 400 kg/m3 cement content (B-2). Four
different time intervals are used in between compaction of freshly placed RCC layer
and formerly compacted RCC layer. As a result of the experimental study, following
conclusions could be made:
• Compaction is the most important property of RCC. In the construction site
compaction is made with vibrating rollers. However, it is very difficult to
realize proper compaction in the laboratory. In the study, it is shown that, an
electro pneumatic demolition hammer standardized by ASTM C 1435 can be
used for compaction of RCC specimens for laboratory studies.
• Splitting tensile strength and sorptivity tests are shown to be a proper test
method for determination of bonding efficiency of RCC specimens if there is
a definite bedding layer in between freshly placed and formerly compacted
RCC.
• Furthermore, it was also concluded that bonding efficiency of RCC is not too
dependent on time interval between compaction of successive layers up to
16 hours.
For the unbedded specimens the compressive and splitting tensile strengths
decrease as the time interval between compaction of successive layers
increases. For both of the bedding mixes utilized specimens this reduction in

89
strength is not clearly observed indicating the effectiveness of the bedding
mix. Similar results are also obtained on permeability through sorptivity test.
Therefore, it can be concluded that the bedding mix when applied properly
not only improves the strength but also the permeability properties of RCC
up to 16 hours.
Moreover, 90-day compressive strength values are almost two times of 28-
day compressive strength values. This result can be explained as
contribution of fly ash to the strength development at later ages.
• The rich bedding mix is more effective bonding agent between RCC layers
than the poor bedding mix as time interval between layers is increased up to
16 hours and age of specimen is increased.
90
CHAPTER 6
RECOMMENDATIONS FOR FUTURE STUDIES
As a result of this experimental study, the following recommendations for future
studies could be made for other researchers:
• For measurement of splitting tensile strength of RCC specimens there is a
definite test method in ASTM C 1245 called the Point Load Test. However,
point load test is applicable to cylinder specimens. Therefore, point load test
can be applied to cylinder specimens to compare the splitting tensile strength
test results of cubic specimens and the results of point load tests.
• More thorough permeability test could be developed and performed in order
to determine the hydraulic conductivity of RCC specimens with or without
bedding mixes.
• Use of supplementary cementitious materials in the production of bedding
mixes could be investigated to reduce the cost of bedding mix.
• Tests can be conducted at later ages than 90 days to make the findings of
the experimental study definite.
• Tests can be conducted on larger cylinder and cube specimens for
comparison of the findings of the experimental study.
• A comparison between splitting tensile strength test and direct one can be
made, if possible.
• A comprehensive study can be made to investigate the effects of surface
conditions of RCC layers on the splitting tensile strength and permeability.
91
For understanding RCC and bedding mix subjects clearly, the problems faced
throughout the experimental work are expressed as:
• The fresh properties of RCC mixtures such as workability, setting time and
heat generation could be monitored all together to investigate the cold joint
formation in between compacted successive RCC layers.
• The same experimental procedures and data could be utilized for more than
16 hours time interval between compaction of successive RCC layers to see
the behaviour.
• A test procedure and method could be developed to determine the failure
envelope and to understand the shear behaviour of bedded and unbedded
RCC specimens under different compressive loads which can be used in
RCC structural design.
92
REFERENCES
1. ACI Committee 207.5R-89, “Roller-Compacted Mass Concrete”, 1988.
2. ICOLD Bulletin 126, “Roller Compacted Concrete Dams”, 2003.
3. ACI Committee 207.5R-99, “ Roller-Compacted Mass Concrete, ”, 1999.
4. Andriolo F.R., “The Use of RCC”, Oficina de Textos, Brazil, 1998.
5. Hansen, K.D., Reinhardt W.G., “Roller Compacted Concrete Dams”, McGraw Hill,
1991.
6. Schrader E.K., “Roller Compacted Concrete for RCC Dams- A General Overview
with Comments Pertinent to High vs Low Cementitious Content and the Cine Dam”,
2001.
7. EM 1110-2-2006, “Roller-Compacted Concrete”, US Army Corps of Engineers
Department of The Army, 2000.
8. ASTM C 1435-99, “Standard Practice for Molding Roller-Compacted Concrete in
Cylinder Molds Using a Vibrating Hammer”, Annual Book of ASTM Standards.
9. ASTM C 1170-91, “Standard Test Methods for Determining Consistency and
Density of Roller-Compacted Concrete Using a Vibrating Table”, Annual Book of
ASTM Standards.
10. Tangtermsirikul S., Kaewkhluab T., Jitvutikrai P., “A Compressive Strength
Model for Roller Compacted Concrete with Fly Ash”, Magazine of Concrete
Research, 2004, 56, No. 1, February, 35–44.
93
11. Krempel A.F., Andriolo F.R., “The Use of Basaltic Crushed Powder Filler in The
RCC”, Proceedings of International Symposium on Roller Compacted Concrete
Dams, Santander, Spain, October 1995, 1, 51-64.
12. ASTM C 1138-97, “Standard Test Method for Abrasion Resistance of Concrete
(Underwater Method)”, Annual Book of ASTM Standards.
13. ASTM C 666-97, “Standard Test Method for Resistance of Concrete to Rapid
Freezing and Thawing”, Annual Book of ASTM Standards.
14. Gao P., Wu S., Lin P., Wu Z., Tang M., “The Characteristics of Air Void and
Frost Resistance of RCC with Fly Ash and Expansive Agent”, Construction and
Building Materials, 2006, 20, 586-590.
15. ETL 1110-2-343, “Structural Design Using the Roller Compacted Concrete
(RCC) Construction Process-Distribution Restriction Statement”, US Army Corps of
Engineers Department of The Army, 1993.
16. ASTM C 150-99a, “Standard Specification for Portland Cement”, Annual Book of
ASTM Standards.
17. ASTM C 595-00, “Standard Specification for Blended Hydraulic Cements”,
Annual Book of ASTM Standards.
18. Shouxian Z., Huaquan Y., Yali K., “Properties of Low Portland Cement Clinker
Content RCC”, International Symposium on Roller Compacted Concrete Dam, 1995,
1, 127-134.
19. ASTM C 618-03, “Standard Specification for Coal Fly Ash and Raw or Calcined
Natural Pozzolan for Use in Concrete”, Annual Book of ASTM Standards.
94
20. Kunhe F., Yan R., Li Z., “Late Age Properties of RCC with Low Cement Content
and High Fly Ash Content”, Proceedings of International Symposium on Roller
Compacted Concrete Dams, Chengdu, China, April 1999, 1, 181-187.
21. Gao P.W., Wu S.X., Lin P.H., Wu Z.R., Tang M.S., “Effect of Fly Ash on
Deformation of Roller Compacted Concrete”, ACI Material Journal, September 2006.
22. ASTM C 33-03, “Standard Specification for Concrete Aggregates”, Annual Book
of ASTM Standards.
23. Suzuki N., Lisaka T., Umehara H., Shiramura S., Wu W., “On The
Characteristics of RCD Concrete by Mixing Filler”, Proceedings of International
Symposium on Roller Compacted Concrete Dams, Chengdu, China, April 1999, 1,
135-140.
24. ASTM D 1557, “Standard Test Methods for Laboratory Compaction
Characteristics of Soil Using Modified Effort”, Annual Book of ASTM Standards.
25. ACI Committee 211.3R-97, “Guide for Selecting Proportions for No-Slump
Concrete”, 1997.
26. Schnabel Engineering Associates, Inc. “Design Manual for Small RCC Dams”,
Portland Cement Association, 2003.
27. Pacelli, W.A., Andriolo, F.R., Sarkaria G.S., “Treatment and Performance of
Construction Joints in Concrete Dams”, Water Power and Dam Construction,
November, 1993, 26-31.
28. Hess J.R., “RCC Lift Joint Strength”, Concrete International, January, 2002, 50-
56.
95
29. Xiaobin L., “Research on the Effect of Some Beding Materials on RCC Lift Joint”,
Proceedings of International Symposium on Roller Compacted Concrete Dams,
Chengdu, China, April 1999, 1, 383-389.
30. Andriolo F.R., Polat F., Polat Ö., “Beydağ Dam RCC Mix Design Studies
Evaluation Report”, June 2006.
31. Koçak E.S, “A Suitable Roller Compacted Concrete for Kahramanmaraş Suçatı
Dam”, M.S. Thesis, METU, Ankara, January 1998.
32. Aslan Ö., “Predicting Long Term Strength of RCC Containing Natural Pozzolan
by Steam Curing”, M.S. Thesis, METU, Ankara, September, 2006.
33. Sabri S.E., “Theoretical and Experimental Investigation on the Bond between
Two Materials”, Ph.D. Thesis, METU, Ankara, September 1997.
34. Bayer R., “Use of Preplaced Aggregate Concrete for Mass Concrete
Applications”, M.S. Thesis, METU, Ankara, June, 2004.
35. ASTM C 127-01, “Standard Test Method for Density, Relative Density (Specific
Gravity), and Absorption of Coarse Aggregate”, Annual Book of ASTM Standards.
36. ASTM C 128-01, “Standard Test Method for Density, Relative Density (Specific
Gravity), and Absorption of Fine Aggregate”, Annual Book of ASTM Standards.
37. ASTM C 1437-99, “Standard Test Method for Flow of Hydraulic Cement Mortar”,
Annual Book of ASTM Standards.
38. TS EN 12390-3, “Testing Hardened Concrete - Part 3: Compressive Strength of
Test Specimens”, TSE.
39. TS EN 12390-6, “Testing Hardened Concrete - Part 6: Tensile Splitting Strength
for Test Specimens”, TSE.

96
40. ASTM C 1585-04, “Standard Test Method for Measurement of Rate of
Absorption of Water by Hydraulic-Cement Concretes”, Annual Book of ASTM
Standards.