Embed Size (px)
Citation preview
CofaCe Cee Top 500 2012
The Flagships in Eastern Europe

ImprInt:
publisher: Coface SA niederlassung Austria, Stubenring 24, 1010 Vienna
Contact: www.coface.at, [email protected]
Layout: Alex Bauer Communication Consulting
We have prepared the Coface CEE top 500 with the greatest of care.
However, typesetting and printing errors cannot be excluded.
Contents
4 Coface Austria & Coface Central Europe
5 Methodology of the Study
6 CEE Top 500 Executive Summary
8 Business at its Best: the Top 3
10 CEE Top 500 The Ranking
18 CEE Top 500 Country comparison: Places 4 to 13
26 Coface Contacts

this is the fourth time that we have been able to give you an
overview of the 500 biggest companies in Central and
Eastern Europe with this brochure. In doing so, we hope to
offer you interesting insights into the economic situation and
further development of the CEE region – which is far from
being as homogeneous as it might appear when viewed
from the outside.
Central and Eastern Europe is not the only place where it is
important to be able to correctly estimate a market’s risks.
But for that you need someone who knows these markets
well and keeps a constant eye on them. that is precisely
that task of the dense international network of Coface,
which is at home around the world with some 120 branch
offices in 66 countries as well as partners in an additional
31 countries.
Our experts analyse all industries and 157 countries of the
world in order to evaluate the credit risks of each company as
accurately as possible. this enables us to offer you tailored
credit insurance with which you can minimise the risks to your
bottom line.
Forty-five percent of the 500 biggest companies in the world
take advantage of this opportunity. Because certainty in eco-
nomically uncertain times is especially valuable.
Katarzyna Kompowska
Executive manager
Central Europe
Security needs an overview.
Welcome!

4
Coface Austria & Coface Central Europe
Trend-setting for risk and opportunity management. More than 130,000 companies of all sizes in all branches rely on our services. We would be pleased to accompany you on your road to success.
the cornerstone for the success of Coface Austria was
laid in 1954. Our core expertise over these many decades
has remained the insurance of default risk for both domes-
tic and expert receivables. With november 2012 all in-
dependent corporations throughout the group were trans-
formed to branches of the parent company. As one of the
first insurance companies Coface already took all neces-
sary steps to be prepared in the best possible way to
fulfil the requirements of the EU Framework Directive for
Insurers „Solvency II“ as soon as they entry into force.
this is an important aspect in terms of the new capital
requirements and another milestone for the positioning of
Coface as one of the leading global credit insurers.
rising export activity, above all to Central and Eastern
Europe, has increased the importance of credit insurance,
information and collection services. this development led
to the founding of Coface Central Europe Holding AG in
Vienna during 1990 which offers business information and
debt collection services in this region.
Coface wants to accompany you as a reliable partner and
help you to reach a very special goal: your own.
the economic environment is a focal point of continuous
transformation. As the geographical market leader in 12
Central and Eastern Europe countries and Austria, we are
in a position to identify changes on the market at an early
5
methodologyof the Study
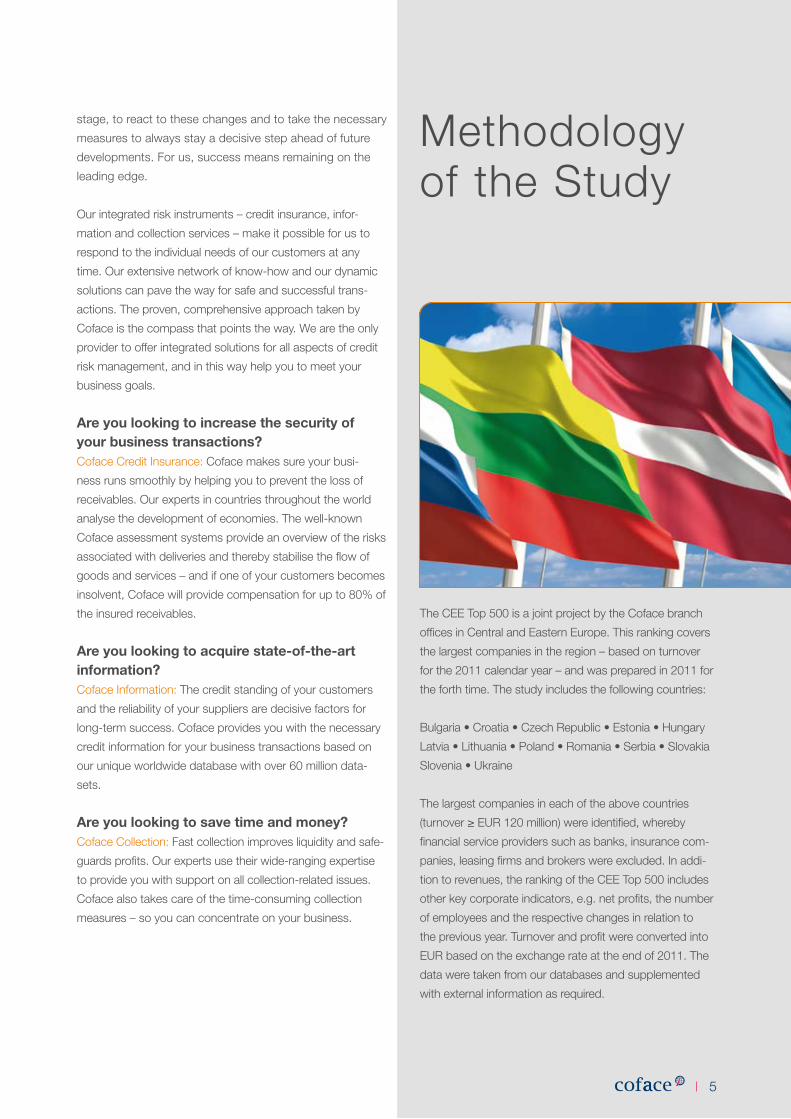
the CEE top 500 is a joint project by the Coface branch
offices in Central and Eastern Europe. this ranking covers
the largest companies in the region – based on turnover
for the 2011 calendar year – and was prepared in 2011 for
the forth time. the study includes the following countries:
Bulgaria • Croatia • Czech Republic • Estonia • Hungary
Latvia • Lithuania • Poland • Romania • Serbia • Slovakia
Slovenia • Ukraine
the largest companies in each of the above countries
(turnover ≥ EUr 120 million) were identified, whereby
financial service providers such as banks, insurance com-
panies, leasing firms and brokers were excluded. In addi-
tion to revenues, the ranking of the CEE top 500 includes
other key corporate indicators, e.g. net profits, the number
of employees and the respective changes in relation to
the previous year. turnover and profit were converted into
EUr based on the exchange rate at the end of 2011. the
data were taken from our databases and supplemented
with external information as required.
5
stage, to react to these changes and to take the necessary
measures to always stay a decisive step ahead of future
developments. For us, success means remaining on the
leading edge.
Our integrated risk instruments – credit insurance, infor-
mation and collection services – make it possible for us to
respond to the individual needs of our customers at any
time. Our extensive network of know-how and our dynamic
solutions can pave the way for safe and successful trans-
actions. the proven, comprehensive approach taken by
Coface is the compass that points the way. We are the only
provider to offer integrated solutions for all aspects of credit
risk management, and in this way help you to meet your
business goals.
Are you looking to increase the security of your business transactions?Coface Credit Insurance: Coface makes sure your busi-
ness runs smoothly by helping you to prevent the loss of
receivables. Our experts in countries throughout the world
analyse the development of economies. the well-known
Coface assessment systems provide an overview of the risks
associated with deliveries and thereby stabilise the flow of
goods and services – and if one of your customers becomes
insolvent, Coface will provide compensation for up to 80% of
the insured receivables.
Are you looking to acquire state-of-the-art information?Coface Information: the credit standing of your customers
and the reliability of your suppliers are decisive factors for
long-term success. Coface provides you with the necessary
credit information for your business transactions based on
our unique worldwide database with over 60 million data-
sets.
Are you looking to save time and money?Coface Collection: Fast collection improves liquidity and safe-
guards profits. Our experts use their wide-ranging expertise
to provide you with support on all collection-related issues.
Coface also takes care of the time-consuming collection
measures – so you can concentrate on your business.
6
CEE top 500 Executive Summary
The flagships of Central and Eastern Europe grew again in 2011, with profits rising by almost 50%.
17% of the top positions are new.
the CEE top 500 accepted 87 newcomers in 2011. 147 com-
panies improved their position, while 260 moved down the
list. Only six businesses, including the four leading companies,
held onto their ranking.
More turnover, more profit.
After the top players in Central and Eastern Europe posted
increases in turnover in 2010, turnover at the 500 biggest
companies in the region rose by 16.0% last year to reach
EUr 612.5 billion. net profits also improved sharply in 2011,
rising by 45.5% to EUr 30.0 billion. Following the slump of
recent years, the automotive sector recorded a sharp increase
in turnover. Strong growth was also noted at service station
operators, in the production sector, mining and the metallur-
gical industry. Only the telecommunications sector had to ac-
cept falls. the oil and gas sector again accounted for most of
the firms in the CEE top 500, with 69 companies. the metal-
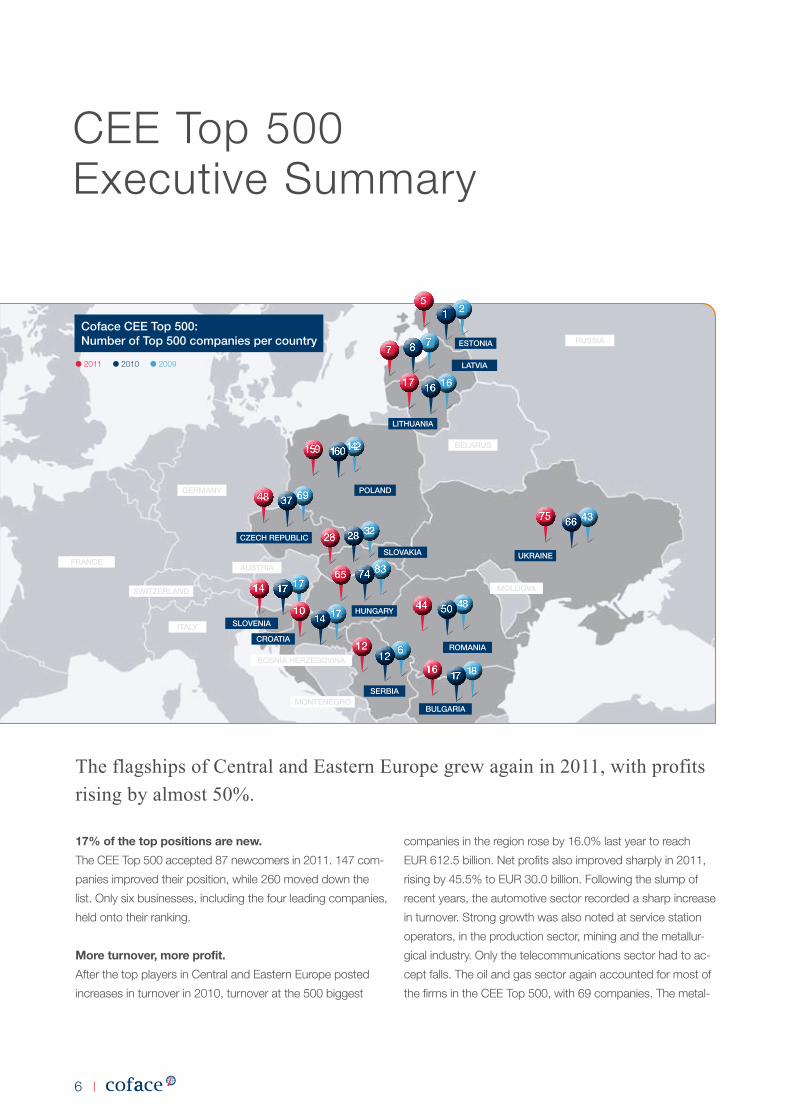
● 2011 ● 2010 ● 2009
Coface Cee Top 500:Number of Top 500 companies per country
polaNd
CzeCh RepubliC
bulgaRia
SeRbia
CRoaTia
SloveNia
huNgaRy
Slovakia
liThuaNia
laTvia
eSToNia RuSSia
belaRuS
geRmaNy
auSTRia
boSNia heRzegoviNa
moNTeNegRo
SwiTzeRlaNd
iTaly
moldova
fRaNCeukRaiNe
RomaNia
142160
1817
4366
21
78
1616
4850
32 28
612
1717
693748
159
75
28
6514
10
12
16
17
7
5
44
8374
1714
7
lurgical industry grew strongly, with the number of companies
represented rising from 29 to 41. However, the food sector,
pharmaceutical industry, wholesale trade and construction
sector were represented more weakly than in 2010.
Economic growth is back.
All 13 countries in the CEE top 500 recorded growth in GDp
in 2011. this lay between 0.0% in Croatia and a strong 8.3%
in Estonia. the other Baltic states (Lithuania 5.9% and Latvia
5.5%) and Ukraine (5.2%) also enjoyed strong growth in
GDp. poland recorded a positive development even in the
crisis year of 2009 and continued this in 2011 with an
increase of 4.3%.
Pole position for Poland.
With 159 companies (2010: 160), poland once again had
the most companies in the CEE top 500 in 2011. In second
place, with 75 leading companies, is Ukraine, which pushed
Hungary (65) into third place for the first time.
this continues the negative trend in Hungary. notable is the
good performance by leading companies in the Czech
republic, where 48 firms (2010: 37) made it into the top
listing this time, with the country taking fourth place in the
country comparison. the little Baltic state of Estonia conti-
nues to lag behind – despite a considerable increase from
one to five companies.
More employees.
there is also a very pleasing result in the number of people
in employment, which grew by 12.2% in 2011. the almost
continuous drop in unemployment rates is also noticeable
amongst the CEE top 500. A total of 2.8 million people
worked in the companies of the CEE top 500 in 2011, up
from 2.5 million people in 2010. the top players therefore
remain an important stabilising factor for the labour market in
the region.
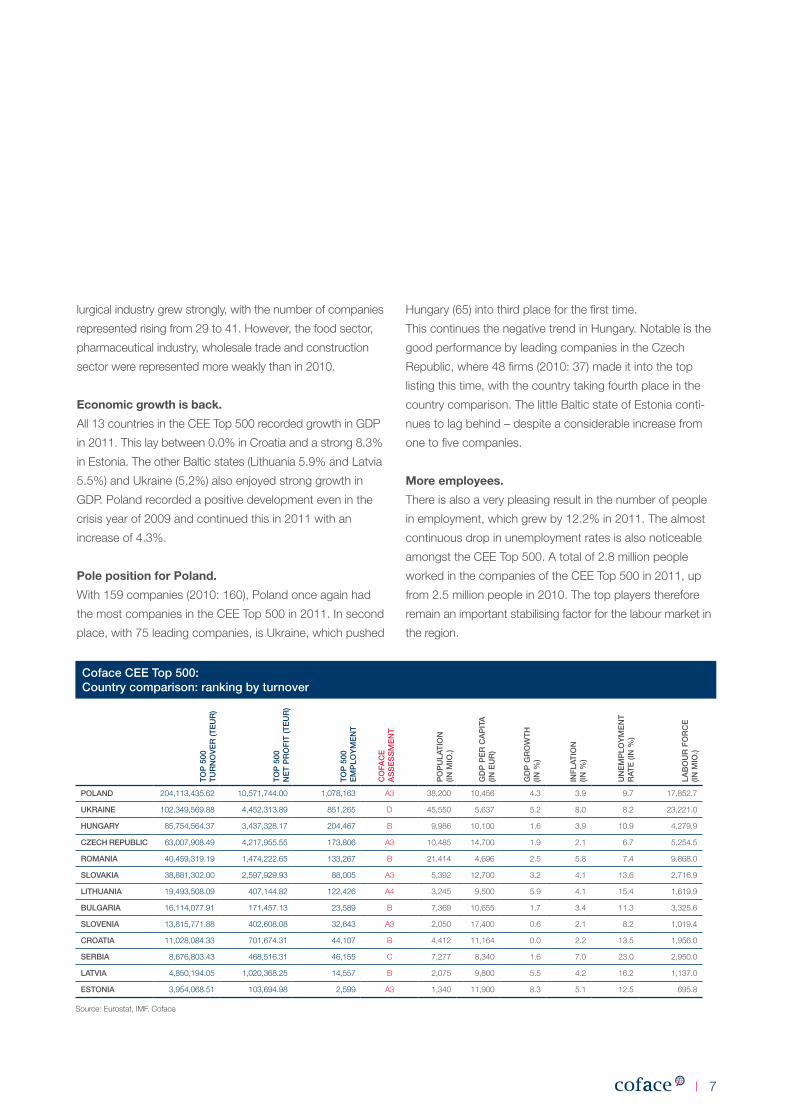
Coface Cee Top 500:Country comparison: ranking by turnover
polaNd 204,113,435.62 10,571,744.00 1,078,163 A3 38,200 10,456 4.3 3.9 9.7 17,852.7
ukRaiNe 102,349,569.88 4,452,313.89 851,265 D 45,550 5,637 5.2 8.0 8.2 23,221.0
huNgaRy 85,754,564.37 3,437,328.17 204,467 B 9,986 10,100 1.6 3.9 10.9 4,279.9
CzeCh RepubliC 63,007,908.49 4,217,955.55 173,806 A3 10,485 14,700 1.9 2.1 6.7 5,254.5
RomaNia 40,459,319.19 1,474,222.65 133,267 B 21,414 4,696 2.5 5.8 7.4 9,868.0
Slovakia 38,881,302.00 2,597,929.93 88,005 A3 5,392 12,700 3.2 4.1 13.6 2,716.9
liThuaNia 19,493,508.09 407,144.82 122,426 A4 3,245 9,500 5.9 4.1 15.4 1,619.9
bulgaRia 16,114,077.91 171,457.13 23,589 B 7,369 10,655 1.7 3.4 11.3 3,325.6
SloveNia 13,815,771.88 402,608.08 32,643 A3 2,050 17,400 0.6 2.1 8.2 1,019.4
CRoaTia 11,028,084.33 701,674.31 44,107 B 4,412 11,164 0.0 2.2 13.5 1,956.0
SeRbia 8,676,803.43 468,516.31 46,155 C 7,277 8,340 1.6 7.0 23.0 2,950.0
laTvia 4,850,194.05 1,020,368.25 14,557 B 2,075 9,800 5.5 4.2 16.2 1,137.0
eSToNia 3,954,068.51 103,694.98 2,599 A3 1,340 11,900 8.3 5.1 12.5 695.8
To
p 5
00T
uR
No
ve
R (T
eu
R)
To
p 5
00
Ne
T p
Ro
fiT
(Te
uR
)
To
p 5
00e
mp
loy
me
NT
Co
faC
ea
SS
eS
Sm
eN
T
po
pu
laT
ioN
(iN m
io.)
gd
p p
eR
Ca
piT
a(iN
eu
R)
gd
p g
Ro
wT
h(iN
%)
iNf
laT
ioN
(iN
%)
uN
em
plo
ym
eN
TR
aTe
(iN
%)
lab
ou
R f
oR
Ce
(iN m
io.)
Source: Eurostat, ImF, Coface
8
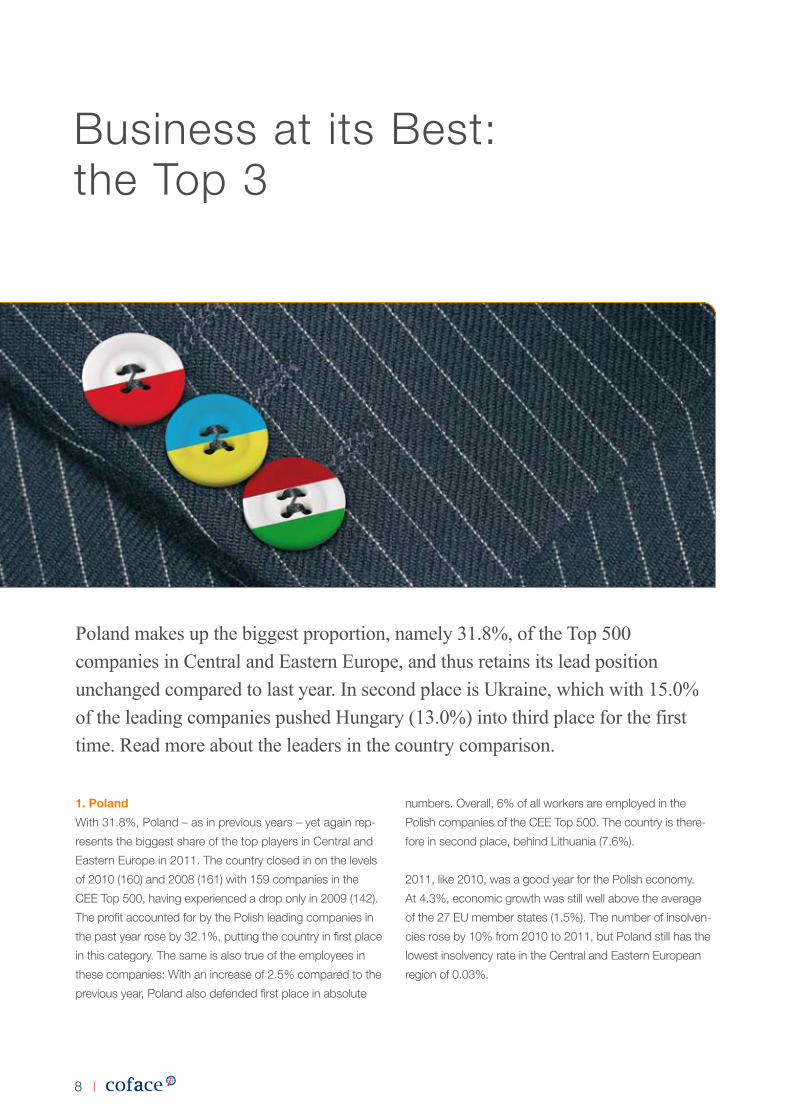
Poland makes up the biggest proportion, namely 31.8%, of the Top 500 companies in Central and Eastern Europe, and thus retains its lead position unchanged compared to last year. In second place is Ukraine, which with 15.0% of the leading companies pushed Hungary (13.0%) into third place for the first time. Read more about the leaders in the country comparison.
1. Poland
With 31.8%, poland – as in previous years – yet again rep-
resents the biggest share of the top players in Central and
Eastern Europe in 2011. the country closed in on the levels
of 2010 (160) and 2008 (161) with 159 companies in the
CEE top 500, having experienced a drop only in 2009 (142).
the profit accounted for by the polish leading companies in
the past year rose by 32.1%, putting the country in first place
in this category. the same is also true of the employees in
these companies: With an increase of 2.5% compared to the
previous year, poland also defended first place in absolute
numbers. Overall, 6% of all workers are employed in the
polish companies of the CEE top 500. the country is there-
fore in second place, behind Lithuania (7.6%).
2011, like 2010, was a good year for the polish economy.
At 4.3%, economic growth was still well above the average
of the 27 EU member states (1.5%). the number of insolven-
cies rose by 10% from 2010 to 2011, but poland still has the
lowest insolvency rate in the Central and Eastern European
region of 0.03%.
Business at its Best: the top 3
9
However, the poor underlying economic conditions made
themselves felt in poland in 2012: GDp growth remained
behind expectations while economic indicators gave cause
for concern, as growth drivers are currently missing, unlike in
2010 and 2011. Wage adjustments remain below the rate of
inflation, the zloty is strengthening against the euro, reducing
exports to Germany – poland’s most important export mar-
ket. Unlike in the crisis year of 2009, the government has not
provided any growth incentives.
2. Ukraine
Ukraine, which first made it into the top three Central and
Eastern European countries in 2010, moved up another place
in 2011 to secure second place in the assessment. In 2010,
66 Ukrainian companies were represented in the region’s
top 500; the number has grown sharply to 75 companies
in 2011 (+13.6%). Unlike in recent years, the profit accoun-
ted for by the top players has grown out of all proportion
(+1,136.8%). Ukraine now occupies second place in the
assessment by profit, moving up seven places (2010: ninth
place). Ukraine also occupies second place with regard to
the total number of employees in these companies, which
employ 3.7% of all workers in the country.
the Ukrainian economy grew by 5.2% in 2011, the number of
business insolvencies rose only slightly by 3%, the insolvency
rate is 0.1% and is therefore in second place after poland –
ex aequo with Bulgaria. Gains in mechanical engineering
(including through the renovation of ageing railway fleets in the
CIS states) and in the chemical industry (such as through the
global increase in fertiliser prices) are to be noted, although
the increases were offset by falls in the areas of food process-
ing (e.g. due to import restrictions on Ukrainian cheese in
russia) and in crude oil processing – because only one in six
Ukrainian refineries is still operating.
In 2012, private consumption, stimulated by looser fiscal
policy, was one of the main drivers of economic growth in
Ukraine. Growth is forecast to reach 3.9%.
3. Hungary
the negative trend in Hungary is continuing: the country may
still occupy a leading position in the CEE comparison, but
was pushed into third place by Ukraine. Compared to 2010,
12.2% fewer Hungarian companies were represented in the
CEE top 500 in 2011. Hungary has also moved down when
ranked by profit to fourth place (2010: third place). Going by
the number of employees in these companies in relation to
the total workforce, Hungary is also in third place with 4.8%
– as in 2010.
Hungary’s economy grew slightly more again in 2011 (1.6%)
than in 2010 (1.0%). nevertheless, the country is hovering on
the edge of recession – a fact that is also reflected by the
top 500 ranking. Of the Hungarian companies assessed,
63.5% are lower down the list compared to 2010. Another
feature is that the only companies to move up the ranking
were those that generated most of their earnings from ex-
ports. the economic situation in Hungary has been heavily
influenced in the past year by the prevailing macroeconomic
conditions. Consumers and investors alike were extremely
cautious in their decisions. net exports have been the only
growth driver in Hungary in the past three years.
As far as company insolvencies are concerned, Hungary is
amongst the worst performers, as in 2010: the absolute
number rose again by 17%, the insolvency rate of 3.4% is
slightly better than in 2010 (3.6%), but still third from bottom
in the region after Serbia and romania. Economic growth in
Hungary will be much lower in 2012 or tend towards zero:
Domestic demand is being hampered not least by restrictive
credit terms and an uncertain economic environment. the
country is expected to fall into recession in 2013.
10
Coface will soon have been repre-
sented in Central and Eastern
Europe for a quarter of a century.
the region’s individual markets are
subject to continual cross-border
analysis by our experts.
the CEE top 500 are a result of
this cross-border cooperation. Due to the dynamic devel-
opment in this diverse region, it is particularly important
to view the individual markets with the greatest precision
and distinction possible. the CEE top 500 makes a contri-
bution to this.
All 13 of the countries it covers posted growth in econom-
ic output or remained the same in 2011 – from 0.0% in
Croatia through to 8.3% in Estonia. Other countries such
as Lithuania and Latvia (5.9% and 5.5% respectively) or
Ukraine (5.2%) also enjoyed strong growth in GDp. the
leader of the pack, poland, which recorded growth even in
the crisis year of 2009, managed to continue this positive
trend in 2011 with a rise of 4.3%. these and many other
data can be found in this country comparison.
Katarzyna Kompowska
Executive manager
Central Europe
Posi
tion
2011
Chan
ge in
Posi
tion
Posi
tion
2010
Coun
try
Com
pany
Na
me
Mai
n Se
ctor
Turn
over
inTE
UR 2
011
Turn
over
inTE
UR 2
010
Chan
geTu
rnov
er
Net P
rofit
inTE
UR 2
011
Net P
rofit
inTE
UR 2
010
Chan
geNe
t Pro
fit
Empl
oym
ent
2011
Empl
oym
ent
2010
Chan
geEm
ploy
men
t
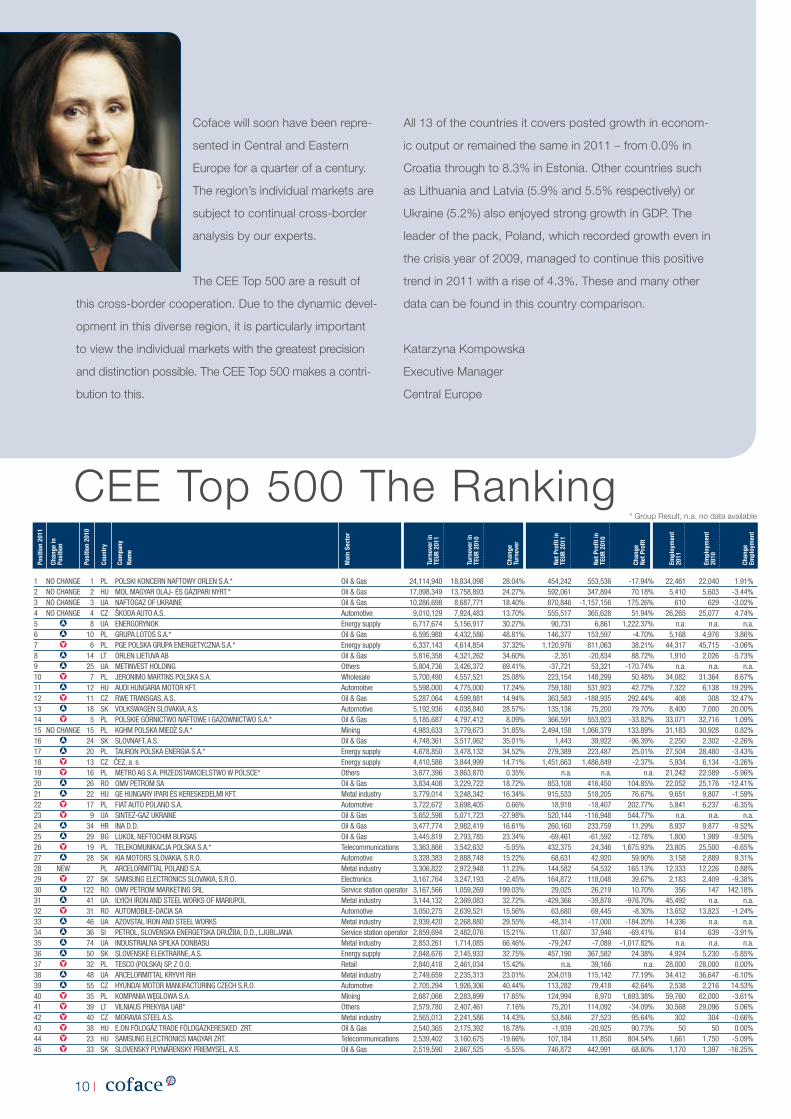
1 NO CHANGE 1 PL POLSKI KONCERN NAFTOWY ORLEN S.A.* Oil & Gas 24,114,940 18,834,098 28.04% 454,242 553,536 -17.94% 22,461 22,040 1.91%2 NO CHANGE 2 HU MOL MAGYAR OLAJ- ÉS GÁZIPARI NYRT.* Oil & Gas 17,098,349 13,758,893 24.27% 592,061 347,894 70.18% 5,410 5,603 -3.44%3 NO CHANGE 3 UA NAFTOGAZ OF UKRAINE Oil & Gas 10,286,698 8,687,771 18.40% 870,846 -1,157,156 175.26% 610 629 -3.02%4 NO CHANGE 4 CZ ŠKODA AUTO A.S. Automotive 9,010,129 7,924,483 13.70% 555,517 365,628 51.94% 26,265 25,077 4.74%5 8 UA ENERGORYNOK Energy supply 6,717,674 5,156,917 30.27% 90,731 6,861 1,222.37% n.a. n.a. n.a.6 10 PL GRUPA LOTOS S.A.* Oil & Gas 6,595,988 4,432,586 48.81% 146,377 153,597 -4.70% 5,168 4,976 3.86%7 6 PL PGE POLSKA GRUPA ENERGETYCZNA S.A.* Energy supply 6,337,143 4,614,854 37.32% 1,120,976 811,063 38.21% 44,317 45,715 -3.06%8 14 LT ORLEN LIETUVA AB Oil & Gas 5,816,358 4,321,262 34.60% -2,351 -20,834 88.72% 1,910 2,026 -5.73%9 25 UA METINVEST HOLDING Others 5,804,736 3,426,372 69.41% -37,721 53,321 -170.74% n.a. n.a. n.a.10 7 PL JERONIMO MARTINS POLSKA S.A. Wholesale 5,700,490 4,557,521 25.08% 223,154 148,299 50.48% 34,082 31,364 8.67%11 12 HU AUDI HUNGARIA MOTOR KFT. Automotive 5,598,000 4,775,000 17.24% 759,180 531,923 42.72% 7,322 6,138 19.29%12 11 CZ RWE TRANSGAS, A.S. Oil & Gas 5,287,064 4,599,881 14.94% 363,583 -188,935 292.44% 408 308 32.47%13 18 SK VOLKSWAGEN SLOVAKIA, A.S. Automotive 5,192,936 4,038,840 28.57% 135,136 75,200 79.70% 8,400 7,000 20.00%14 5 PL POLSKIE GÓRNICTWO NAFTOWE I GAZOWNICTWO S.A.* Oil & Gas 5,185,687 4,797,412 8.09% 366,591 553,923 -33.82% 33,071 32,716 1.09%15 NO CHANGE 15 PL KGHM POLSKA MIEDZ S.A.* Mining 4,983,633 3,779,673 31.85% 2,494,158 1,066,379 133.89% 31,183 30,928 0.82%16 24 SK SLOVNAFT, A.S. Oil & Gas 4,748,361 3,517,062 35.01% 1,443 39,922 -96.39% 2,250 2,302 -2.26%17 20 PL TAURON POLSKA ENERGIA S.A.* Energy supply 4,678,850 3,478,132 34.52% 279,389 223,487 25.01% 27,504 28,480 -3.43%18 13 CZ CEZ, a. s. Energy supply 4,410,586 3,844,999 14.71% 1,451,663 1,486,849 -2.37% 5,934 6,134 -3.26%19 16 PL METRO AG S.A. PRZEDSTAWICIELSTWO W POLSCE* Others 3,877,396 3,863,870 0.35% n.a. n.a. n.a. 21,242 22,589 -5.96%20 26 RO OMV PETROM SA Oil & Gas 3,834,408 3,229,722 18.72% 853,108 416,450 104.85% 22,052 25,176 -12.41%21 22 HU GE HUNGARY IPARI ÉS KERESKEDELMI KFT. Metal industry 3,779,014 3,248,342 16.34% 915,533 518,205 76.67% 9,651 9,807 -1.59%22 17 PL FIAT AUTO POLAND S.A. Automotive 3,722,672 3,698,405 0.66% 18,918 -18,407 202.77% 5,841 6,237 -6.35%23 9 UA SINTEZ-GAZ UKRAINE Oil & Gas 3,652,598 5,071,723 -27.98% 520,144 -116,948 544.77% n.a. n.a. n.a.24 34 HR INA D.D. Oil & Gas 3,477,774 2,982,419 16.61% 260,160 233,759 11.29% 8,937 9,877 -9.52%25 29 BG LUKOIL NEFTOCHIM BURGAS Oil & Gas 3,445,819 2,793,785 23.34% -69,461 -61,592 -12.78% 1,800 1,989 -9.50%26 19 PL TELEKOMUNIKACJA POLSKA S.A.* Telecommunications 3,363,866 3,542,632 -5.05% 432,375 24,346 1,675.93% 23,805 25,500 -6.65%27 28 SK KIA MOTORS SLOVAKIA, S.R.O. Automotive 3,328,383 2,888,748 15.22% 68,631 42,920 59.90% 3,158 2,889 9.31%28 NEW PL ARCELORMITTAL POLAND S.A. Metal industry 3,306,822 2,972,948 11.23% 144,582 54,532 165.13% 12,333 12,226 0.88%29 27 SK SAMSUNG ELECTRONICS SLOVAKIA, S.R.O. Electronics 3,167,764 3,247,193 -2.45% 164,872 118,048 39.67% 2,183 2,409 -9.38%30 122 RO OMV PETROM MARKETING SRL Service station operator 3,167,566 1,059,269 199.03% 29,025 26,219 10.70% 356 147 142.18%31 41 UA ILYICH IRON AND STEEL WORKS OF MARIUPOL Metal industry 3,144,132 2,369,083 32.72% -429,366 -39,878 -976.70% 45,492 n.a. n.a.32 31 RO AUTOMOBILE-DACIA SA Automotive 3,050,275 2,639,521 15.56% 63,680 69,445 -8.30% 13,652 13,823 -1.24%33 46 UA AZOVSTAL IRON AND STEEL WORKS Metal industry 2,939,420 2,268,880 29.55% -48,314 -17,000 -184.20% 14,336 n.a. n.a.34 36 SI PETROL, SLOVENSKA ENERGETSKA DRUŽBA, D.D., LJUBLJANA Service station operator 2,859,694 2,482,076 15.21% 11,607 37,946 -69.41% 614 639 -3.91%35 74 UA INDUSTRIALNA SPILKA DONBASU Metal industry 2,853,261 1,714,085 66.46% -79,247 -7,089 -1,017.82% n.a. n.a. n.a.36 50 SK SLOVENSKÉ ELEKTRÁRNE, A.S. Energy supply 2,848,676 2,145,933 32.75% 457,190 367,582 24.38% 4,924 5,230 -5.85%37 32 PL TESCO (POLSKA) SP. Z O.O. Retail 2,840,418 2,461,034 15.42% n.a. 39,166 n.a. 28,000 28,000 0.00%38 48 UA ARCELORMITTAL KRYVYI RIH Metal industry 2,749,659 2,235,313 23.01% 204,019 115,142 77.19% 34,412 36,647 -6.10%39 55 CZ HYUNDAI MOTOR MANUFACTURING CZECH S.R.O. Automotive 2,705,294 1,926,306 40.44% 113,282 79,418 42.64% 2,538 2,216 14.53%40 35 PL KOMPANIA WEGLOWA S.A. Mining 2,687,066 2,283,899 17.65% 124,994 6,970 1,693.38% 59,760 62,000 -3.61%41 39 LT VILNIAUS PREKYBA UAB* Others 2,579,780 2,407,461 7.16% 75,201 114,092 -34.09% 30,568 29,096 5.06%42 40 CZ MORAVIA STEEL A.S. Metal industry 2,565,013 2,241,586 14.43% 53,846 27,523 95.64% 302 304 -0.66%43 38 HU E.ON FÖLDGÁZ TRADE FÖLDGÁZKERESKEDŐ ZRT. Oil & Gas 2,540,365 2,175,392 16.78% -1,939 -20,925 90.73% 50 50 0.00%44 23 HU SAMSUNG ELECTRONICS MAGYAR ZRT. Telecommunications 2,539,402 3,160,675 -19.66% 107,184 11,850 804.54% 1,661 1,750 -5.09%45 33 SK SLOVENSKÝ PLYNÁRENSKÝ PRIEMYSEL, A.S. Oil & Gas 2,519,590 2,667,525 -5.55% 746,872 442,991 68.60% 1,170 1,397 -16.25%
CEE top 500 the ranking* Group result, n.a. no data available
11
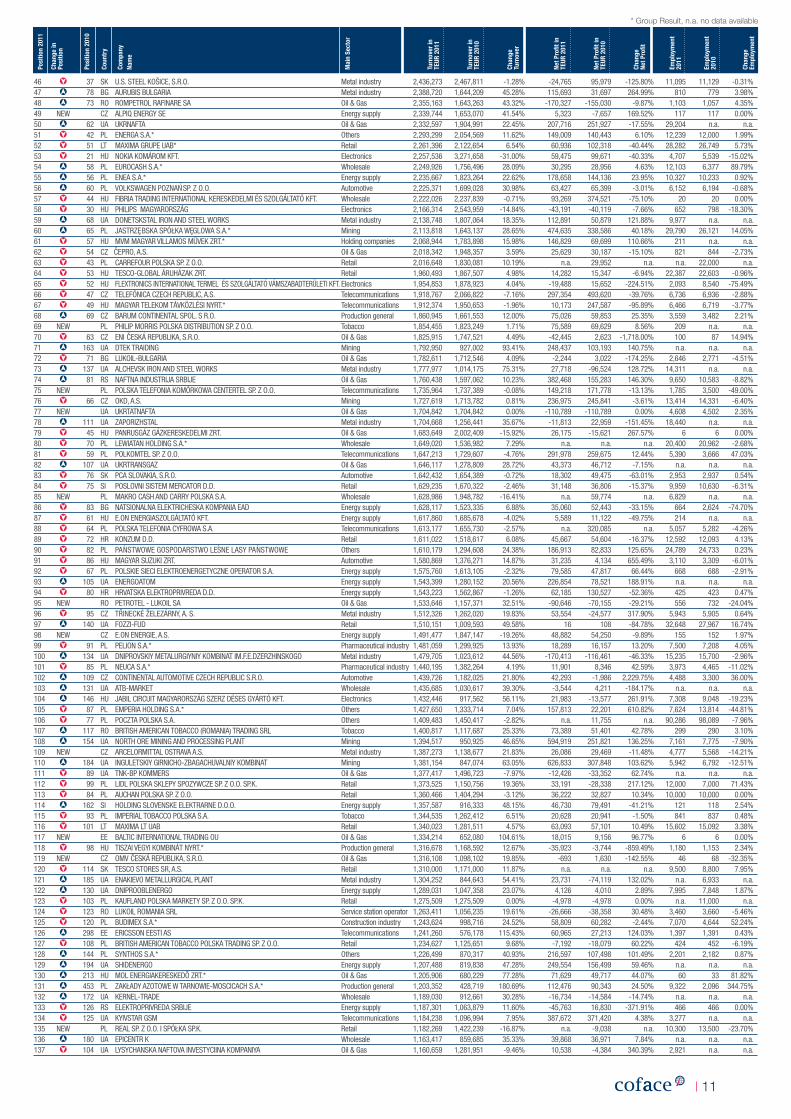
46 37 SK U.S. STEEL KOŠICE, S.R.O. Metal industry 2,436,273 2,467,811 -1.28% -24,765 95,979 -125.80% 11,095 11,129 -0.31%47 78 BG AURUBIS BULGARIA Metal industry 2,388,720 1,644,209 45.28% 115,693 31,697 264.99% 810 779 3.98%48 73 RO ROMPETROL RAFINARE SA Oil & Gas 2,355,163 1,643,263 43.32% -170,327 -155,030 -9.87% 1,103 1,057 4.35%49 NEW CZ ALPIQ ENERGY SE Energy supply 2,339,744 1,653,070 41.54% 5,323 -7,657 169.52% 117 117 0.00%50 62 UA UKRNAFTA Oil & Gas 2,332,597 1,904,991 22.45% 207,716 251,927 -17.55% 29,204 n.a. n.a.51 42 PL ENERGA S.A.* Others 2,293,299 2,054,569 11.62% 149,009 140,443 6.10% 12,239 12,000 1.99%52 51 LT MAXIMA GRUPE UAB* Retail 2,261,396 2,122,654 6.54% 60,936 102,318 -40.44% 28,282 26,749 5.73%53 21 HU NOKIA KOMÁROM KFT. Electronics 2,257,536 3,271,658 -31.00% 59,475 99,671 -40.33% 4,707 5,539 -15.02%54 58 PL EUROCASH S.A.* Wholesale 2,249,926 1,756,496 28.09% 30,295 28,956 4.63% 12,103 6,377 89.79%55 56 PL ENEA S.A.* Energy supply 2,235,667 1,823,264 22.62% 178,658 144,136 23.95% 10,327 10,233 0.92%56 60 PL VOLKSWAGEN POZNAN SP. Z O.O. Automotive 2,225,371 1,699,028 30.98% 63,427 65,399 -3.01% 6,152 6,194 -0.68%57 44 HU FIBRIA TRADING INTERNATIONAL KERESKEDELMI ÉS SZOLGÁLTATÓ KFT. Wholesale 2,222,026 2,237,839 -0.71% 93,269 374,521 -75.10% 20 20 0.00%58 30 HU PHILIPS MAGYARORSZÁG Electronics 2,166,314 2,543,959 -14.84% -43,191 -40,119 -7.66% 652 798 -18.30%59 68 UA DONETSKSTAL IRON AND STEEL WORKS Metal industry 2,138,748 1,807,064 18.35% 112,891 50,879 121.88% 9,977 n.a. n.a.60 65 PL JASTRZE BSKA SPÓŁKA WEGLOWA S.A.* Mining 2,113,818 1,643,137 28.65% 474,635 338,586 40.18% 29,790 26,121 14.05%61 57 HU MVM MAGYAR VILLAMOS MÜVEK ZRT.* Holding companies 2,068,944 1,783,898 15.98% 146,829 69,699 110.66% 211 n.a. n.a.62 54 CZ CEPRO, A.S. Oil & Gas 2,018,342 1,948,357 3.59% 25,629 30,187 -15.10% 821 844 -2.73%63 43 PL CARREFOUR POLSKA SP. Z O.O. Retail 2,016,648 1,830,081 10.19% n.a. 29,952 n.a. n.a. 22,000 n.a.64 53 HU TESCO-GLOBAL ÁRUHÁZAK ZRT. Retail 1,960,493 1,867,507 4.98% 14,282 15,347 -6.94% 22,387 22,603 -0.96%65 52 HU FLEXTRONICS INTERNATIONAL TERMELŐ ÉS SZOLGÁLTATÓ VÁMSZABADTERÜLETI KFT. Electronics 1,954,853 1,878,923 4.04% -19,488 15,652 -224.51% 2,093 8,540 -75.49%66 47 CZ TELEFÓNICA CZECH REPUBLIC, A.S. Telecommunications 1,918,767 2,066,822 -7.16% 297,354 493,620 -39.76% 6,736 6,936 -2.88%67 49 HU MAGYAR TELEKOM TÁVKÖZLÉSI NYRT.* Telecommunications 1,912,374 1,950,653 -1.96% 10,173 247,587 -95.89% 6,466 6,719 -3.77%68 69 CZ BARUM CONTINENTAL SPOL. S R.O. Production general 1,860,945 1,661,553 12.00% 75,026 59,853 25.35% 3,559 3,482 2.21%69 NEW PL PHILIP MORRIS POLSKA DISTRIBUTION SP. Z O.O. Tobacco 1,854,455 1,823,249 1.71% 75,589 69,629 8.56% 209 n.a. n.a.70 63 CZ ENI CESKÁ REPUBLIKA, S.R.O. Oil & Gas 1,825,915 1,747,521 4.49% -42,445 2,623 -1,718.00% 100 87 14.94%71 163 UA DTEK TRAIDING Mining 1,792,950 927,002 93.41% 248,437 103,193 140.75% n.a. n.a. n.a.72 71 BG LUKOIL-BULGARIA Oil & Gas 1,782,611 1,712,546 4.09% -2,244 3,022 -174.25% 2,646 2,771 -4.51%73 137 UA ALCHEVSK IRON AND STEEL WORKS Metal industry 1,777,977 1,014,175 75.31% 27,718 -96,524 128.72% 14,311 n.a. n.a.74 81 RS NAFTNA INDUSTRIJA SRBIJE Oil & Gas 1,760,438 1,597,062 10.23% 382,468 155,283 146.30% 9,650 10,583 -8.82%75 NEW PL POLSKA TELEFONIA KOMÓRKOWA CENTERTEL SP. Z O.O. Telecommunications 1,735,964 1,737,389 -0.08% 149,218 171,778 -13.13% 1,785 3,500 -49.00%76 66 CZ OKD, A.S. Mining 1,727,619 1,713,782 0.81% 236,975 245,841 -3.61% 13,414 14,331 -6.40%77 NEW UA UKRTATNAFTA Oil & Gas 1,704,842 1,704,842 0.00% -110,789 -110,789 0.00% 4,608 4,502 2.35%78 111 UA ZAPORIZHSTAL Metal industry 1,704,668 1,256,441 35.67% -11,813 22,959 -151.45% 18,440 n.a. n.a.79 45 HU PANRUSGÁZ GÁZKERESKEDELMI ZRT. Oil & Gas 1,683,649 2,002,409 -15.92% 26,175 -15,621 267.57% 6 6 0.00%80 70 PL LEWIATAN HOLDING S.A.* Wholesale 1,649,020 1,536,982 7.29% n.a. n.a. n.a. 20,400 20,962 -2.68%81 59 PL POLKOMTEL SP. Z O.O. Telecommunications 1,647,213 1,729,607 -4.76% 291,978 259,675 12.44% 5,390 3,666 47.03%82 107 UA UKRTRANSGAZ Oil & Gas 1,646,117 1,278,809 28.72% 43,373 46,712 -7.15% n.a. n.a. n.a.83 76 SK PCA SLOVAKIA, S.R.O. Automotive 1,642,432 1,654,389 -0.72% 18,302 49,475 -63.01% 2,953 2,937 0.54%84 75 SI POSLOVNI SISTEM MERCATOR D.D. Retail 1,629,235 1,670,322 -2.46% 31,148 36,806 -15.37% 9,959 10,630 -6.31%85 NEW PL MAKRO CASH AND CARRY POLSKA S.A. Wholesale 1,628,986 1,948,782 -16.41% n.a. 59,774 n.a. 6,829 n.a. n.a.86 83 BG NATSIONALNA ELEKTRICHESKA KOMPANIA EAD Energy supply 1,628,117 1,523,335 6.88% 35,060 52,443 -33.15% 664 2,624 -74.70%87 61 HU E.ON ENERGIASZOLGÁLTATÓ KFT. Energy supply 1,617,860 1,685,678 -4.02% 5,589 11,122 -49.75% 214 n.a. n.a.88 64 PL POLSKA TELEFONIA CYFROWA S.A. Telecommunications 1,613,177 1,655,730 -2.57% n.a. 320,085 n.a. 5,057 5,282 -4.26%89 72 HR KONZUM D.D. Retail 1,611,022 1,518,617 6.08% 45,667 54,604 -16.37% 12,592 12,093 4.13%90 82 PL PANSTWOWE GOSPODARSTWO LESNE LASY PANSTWOWE Others 1,610,179 1,294,608 24.38% 186,913 82,833 125.65% 24,789 24,733 0.23%91 86 HU MAGYAR SUZUKI ZRT. Automotive 1,580,869 1,376,271 14.87% 31,235 4,134 655.49% 3,110 3,309 -6.01%92 67 PL POLSKIE SIECI ELEKTROENERGETYCZNE OPERATOR S.A. Energy supply 1,575,760 1,613,105 -2.32% 79,585 47,817 66.44% 668 688 -2.91%93 105 UA ENERGOATOM Energy supply 1,543,399 1,280,152 20.56% 226,854 78,521 188.91% n.a. n.a. n.a.94 80 HR HRVATSKA ELEKTROPRIVREDA D.D. Energy supply 1,543,223 1,562,867 -1.26% 62,185 130,527 -52.36% 425 423 0.47%95 NEW RO PETROTEL - LUKOIL SA Oil & Gas 1,533,646 1,157,371 32.51% -90,646 -70,155 -29.21% 556 732 -24.04%96 95 CZ TR INECKÉ ŽELEZÁRNY, A. S. Metal industry 1,512,326 1,262,020 19.83% 53,554 -24,577 317.90% 5,943 5,905 0.64%97 140 UA FOZZI-FUD Retail 1,510,151 1,009,593 49.58% 16 108 -84.78% 32,648 27,967 16.74%98 NEW CZ E.ON ENERGIE, A.S. Energy supply 1,491,477 1,847,147 -19.26% 48,882 54,250 -9.89% 155 152 1.97%99 91 PL PELION S.A.* Pharmaceutical industry 1,481,059 1,299,925 13.93% 18,289 16,157 13.20% 7,500 7,208 4.05%100 134 UA DNIPROVSKIY METALURGIYNIY KOMBINAT IM.F.E.DZERZHINSKOGO Metal industry 1,479,705 1,023,612 44.56% -170,413 -116,461 -46.33% 15,235 15,700 -2.96%101 85 PL NEUCA S.A.* Pharmaceutical industry 1,440,195 1,382,264 4.19% 11,901 8,346 42.59% 3,973 4,465 -11.02%102 109 CZ CONTINENTAL AUTOMOTIVE CZECH REPUBLIC S.R.O. Automotive 1,439,726 1,182,025 21.80% 42,293 -1,986 2,229.75% 4,488 3,300 36.00%103 131 UA ATB-MARKET Wholesale 1,435,685 1,030,617 39.30% -3,544 4,211 -184.17% n.a. n.a. n.a.104 146 HU JABIL CIRCUIT MAGYARORSZÁG SZERZŐDÉSES GYÁRTÓ KFT. Electronics 1,432,446 917,562 56.11% 21,983 -13,577 261.91% 7,308 9,048 -19.23%105 87 PL EMPERIA HOLDING S.A.* Others 1,427,650 1,333,714 7.04% 157,813 22,201 610.82% 7,624 13,814 -44.81%106 77 PL POCZTA POLSKA S.A. Others 1,409,483 1,450,417 -2.82% n.a. 11,755 n.a. 90,286 98,089 -7.96%107 117 RO BRITISH AMERICAN TOBACCO (ROMANIA) TRADING SRL Tobacco 1,400,817 1,117,687 25.33% 73,389 51,401 42.78% 299 290 3.10%108 154 UA NORTH ORE MINING AND PROCESSING PLANT Mining 1,394,517 950,925 46.65% 594,919 251,821 136.25% 7,161 7,775 -7.90%109 NEW CZ ARCELORMITTAL OSTRAVA A.S. Metal industry 1,387,273 1,138,677 21.83% 26,086 29,469 -11.48% 4,777 5,568 -14.21%110 184 UA INGULETSKIY GIRNICHO-ZBAGACHUVALNIY KOMBINAT Mining 1,381,154 847,074 63.05% 626,833 307,848 103.62% 5,942 6,792 -12.51%111 89 UA TNK-BP KOMMERS Oil & Gas 1,377,417 1,496,723 -7.97% -12,426 -33,352 62.74% n.a. n.a. n.a.112 99 PL LIDL POLSKA SKLEPY SPOZYWCZE SP. Z O.O. SP.K. Retail 1,373,525 1,150,756 19.36% 33,191 -28,338 217.12% 12,000 7,000 71.43%113 84 PL AUCHAN POLSKA SP. Z O.O. Retail 1,360,466 1,404,294 -3.12% 36,222 32,827 10.34% 10,000 10,000 0.00%114 162 SI HOLDING SLOVENSKE ELEKTRARNE D.O.O. Energy supply 1,357,587 916,333 48.15% 46,730 79,491 -41.21% 121 118 2.54%115 93 PL IMPERIAL TOBACCO POLSKA S.A. Tobacco 1,344,535 1,262,412 6.51% 20,628 20,941 -1.50% 841 837 0.48%116 101 LT MAXIMA LT UAB Retail 1,340,023 1,281,511 4.57% 63,093 57,101 10.49% 15,602 15,092 3.38%117 NEW EE BALTIC INTERNATIONAL TRADING OU Oil & Gas 1,334,214 652,080 104.61% 18,015 9,156 96.77% 6 6 0.00%118 98 HU TISZAI VEGYI KOMBINÁT NYRT.* Production general 1,316,678 1,168,592 12.67% -35,923 -3,744 -859.49% 1,180 1,153 2.34%119 NEW CZ OMV CESKÁ REPUBLIKA, S.R.O. Oil & Gas 1,316,108 1,098,102 19.85% -693 1,630 -142.55% 46 68 -32.35%120 114 SK TESCO STORES SR, A.S. Retail 1,310,000 1,171,000 11.87% n.a. n.a. n.a. 9,500 8,800 7.95%121 185 UA ENAKIEVO METALLURGICAL PLANT Metal industry 1,304,252 844,643 54.41% 23,731 -74,119 132.02% n.a. 6,933 n.a.122 130 UA DNIPROOBLENERGO Energy supply 1,289,031 1,047,358 23.07% 4,126 4,010 2.89% 7,995 7,848 1.87%123 103 PL KAUFLAND POLSKA MARKETY SP. Z O.O. SP.K. Retail 1,275,509 1,275,509 0.00% -4,978 -4,978 0.00% n.a. 11,000 n.a.124 123 RO LUKOIL ROMANIA SRL Service station operator 1,263,411 1,056,235 19.61% -26,666 -38,358 30.48% 3,460 3,660 -5.46%125 120 PL BUDIMEX S.A.* Construction industry 1,243,624 998,716 24.52% 58,809 60,282 -2.44% 7,070 4,644 52.24%126 298 EE ERICSSON EESTI AS Telecommunications 1,241,260 576,178 115.43% 60,965 27,213 124.03% 1,397 1,391 0.43%127 108 PL BRITISH AMERICAN TOBACCO POLSKA TRADING SP. Z O.O. Retail 1,234,627 1,125,651 9.68% -7,192 -18,079 60.22% 424 452 -6.19%128 144 PL SYNTHOS S.A.* Others 1,226,499 870,317 40.93% 216,597 107,498 101.49% 2,201 2,182 0.87%129 194 UA SHIDENERGO Energy supply 1,207,488 819,838 47.28% 249,554 156,499 59.46% n.a. n.a. n.a.130 213 HU MOL ENERGIAKERESKEDõ ZRT.* Oil & Gas 1,205,906 680,229 77.28% 71,629 49,717 44.07% 60 33 81.82%131 453 PL ZAKŁADY AZOTOWE W TARNOWIE-MOSCICACH S.A.* Production general 1,203,352 428,719 180.69% 112,476 90,343 24.50% 9,322 2,096 344.75%132 172 UA KERNEL-TRADE Wholesale 1,189,030 912,661 30.28% -16,734 -14,584 -14.74% n.a. n.a. n.a.133 126 RS ELEKTROPRIVREDA SRBIJE Energy supply 1,187,301 1,063,879 11.60% -45,763 16,830 -371.91% 466 466 0.00%134 125 UA KYIVSTAR GSM Telecommunications 1,184,238 1,096,994 7.95% 387,672 371,420 4.38% 3,277 n.a. n.a.135 NEW PL REAL SP. Z O.O. I SPÓŁKA SP.K. Retail 1,182,269 1,422,239 -16.87% n.a. -9,038 n.a. 10,300 13,500 -23.70%136 180 UA EPICENTR K Wholesale 1,163,417 859,685 35.33% 39,868 36,971 7.84% n.a. n.a. n.a.137 104 UA LYSYCHANSKA NAFTOVA INVESTYCIINA KOMPANIYA Oil & Gas 1,160,659 1,281,951 -9.46% 10,538 -4,384 340.39% 2,921 n.a. n.a.
* Group result, n.a. no data available
Posi
tion
2011
Chan
ge in
Posi
tion
Posi
tion
2010
Coun
try
Com
pany
Na
me
Mai
n Se
ctor
Turn
over
inTE
UR 2
011
Turn
over
inTE
UR 2
010
Chan
geTu
rnov
er
Net P
rofit
inTE
UR 2
011
Net P
rofit
inTE
UR 2
010
Chan
geNe
t Pro
fit
Empl
oym
ent
2011
Empl
oym
ent
2010
Chan
geEm
ploy
men
t
12
138 119 PL STATOIL POLAND SP. Z O.O. Oil & Gas 1,158,502 1,004,542 15.33% n.a. 13,821 n.a. 2,977 2,998 -0.70%139 100 PL FARMACOL S.A.* Pharmaceutical industry 1,153,020 1,150,035 0.26% 13,490 16,049 -15.95% 3,996 2,798 42.82%140 106 RO METRO CASH & CARRY ROMANIA SRL Wholesale 1,148,789 1,221,638 -5.96% 22,038 32,291 -31.75% 6,003 6,132 -2.10%141 116 PL PKP CARGO S.A. Transport 1,141,610 1,045,178 9.23% 89,854 13,958 543.75% 25,097 26,750 -6.18%142 97 SI REVOZ PODJETJE ZA PROIZVODNJO IN KOMERCIALIZACIJO AVTOMOBILOV D.D. Automotive 1,135,509 1,331,060 -14.69% 13,911 18,642 -25.38% 2,300 2,504 -8.15%143 232 HU PCE PARAGON SOLUTIONS KFT. Electronics 1,133,439 622,958 81.94% 9,841 11,424 -13.86% 752 745 0.94%144 132 PL STRABAG SP. Z O.O. Construction industry 1,133,207 906,078 25.07% 29,547 43,825 -32.58% 4,312 4,001 7.77%145 118 HU CHINOIN GYÓGYSZER- ÉS VEGYÉSZETI TERMÉKEK GYÁRA ZRT.* Pharmaceutical industry 1,132,445 1,027,200 10.25% 72,784 108,240 -32.76% 1,776 1,863 -4.67%146 191 PL ASSECO POLAND S.A.* Others 1,118,133 729,875 53.20% 146,575 126,060 16.27% 14,496 13,400 8.18%147 NEW PL MICHELIN POLSKA S.A. Production general 1,114,347 840,809 32.53% 23,405 52,571 -55.48% 4,516 4,000 12.90%148 110 PL CASTORAMA POLSKA SP. Z O.O. Wholesale 1,113,768 1,108,521 0.47% 106,800 n.a. n.a. 10,300 10,000 3.00%149 102 PL GLAXOSMITHKLINE PHARMACEUTICALS S.A.* Pharmaceutical industry 1,111,168 1,140,653 -2.58% n.a. n.a. n.a. 1,609 1,750 -8.06%150 NEW CZ PANASONIC AVC NETWORKS CZECH, S.R.O. Telecommunications 1,108,391 1,656,250 -33.08% -195,528 -155,897 -25.42% 1,900 1,900 0.00%151 246 UA AVDIIVKA COKERY PLANT Oil & Gas 1,107,850 670,276 65.28% -24,585 -2,050 -1,099.37% 4,254 4,399 -3.30%152 NEW CZ SLOVNAFT CESKÁ REPUBLIKA, SPOL. S R.O. Oil & Gas 1,100,612 839,463 31.11% n.a. 4,290 n.a. 47 53 -11.32%153 128 PL POLIMEX-MOSTOSTAL S.A.* Construction industry 1,088,104 937,992 16.00% 23,194 26,894 -13.76% 14,290 14,252 0.27%154 129 PL SHELL POLSKA SP. Z O.O. Oil & Gas 1,083,427 941,697 15.05% -28,294 5,803 -587.58% 1,795 1,651 8.72%155 142 RO ARCELORMITTAL GALATI SA Metal industry 1,079,421 959,496 12.50% -143,542 -79,228 -81.18% 8,755 9,255 -5.40%156 112 HU SPAR MAGYARORSZÁG KERESKEDELMI KFT. Retail 1,071,632 1,077,914 -0.58% -108,842 -83,024 -31.10% 13,120 14,307 -8.30%157 152 PL FIAT POWERTRAIN TECHNOLOGIES POLAND SP. Z O.O. Car distribution business 1,070,264 25,087 4,166.24% 3,008 -14,253 121.11% 1,148 897 27.98%158 200 UA KYIVENERGO Energy supply 1,051,342 804,072 30.75% -130,926 14,978 -974.11% 12,882 13,111 -1.75%159 92 SK FOXCONN SLOVAKIA, SPOL. S R.O. Wholesale 1,042,270 1,426,743 -26.95% 2,630 3,848 -31.65% n.a. 2,000 n.a.160 145 PL SAMSUNG ELECTRONICS POLSKA SP. Z O.O. Wholesale 1,033,685 869,269 18.91% 11,410 9,665 18.06% 1,169 820 42.56%161 253 LV URALCHEM TRADING SIA Wholesale 1,027,812 651,657 57.72% 18,496 13,043 41.81% 24 22 9.09%162 88 PL LG ELECTRONICS MŁAWA SP. Z O.O. Telecommunications 1,025,815 1,331,033 -22.93% 7,615 15,152 -49.74% 2,497 1,600 56.06%163 113 CZ T-MOBILE CZECH REPUBLIC A.S. Telecommunications 1,022,311 1,114,379 -8.26% 284,252 331,763 -14.32% 2,944 2,904 1.38%164 159 PL SKANSKA S.A. Construction industry 1,019,422 827,709 23.16% 73,294 54,142 35.37% 6,038 5,431 11.18%165 124 PL VOLKSWAGEN MOTOR POLSKA SP. Z O.O. Automotive 1,006,866 846,267 18.98% 24,032 26,491 -9.28% 1,137 1,137 0.00%166 160 LV LATVENERGO AS Energy supply 1,000,611 935,417 6.97% 940,060 63,616 1,377.71% 1,340 1,324 1.21%167 147 SI KRKA, TOVARNA ZDRAVIL, D.D., NOVO MESTO Pharmaceutical industry 994,860 960,628 3.56% 150,391 165,920 -9.36% 4,164 4,330 -3.83%168 295 SI GEN-I, TRGOVANJE IN PRODAJA ELEKTRI CNE ENERGIJE, D.O.O. Energy supply 989,357 580,424 70.45% 8,127 10,890 -25.37% 99 77 28.57%169 225 HR HRVATSKI TELEKOM D.D. Telecommunications 988,949 1,059,348 -6.65% 239,863 246,574 -2.72% 5,822 5,967 -2.43%170 287 RO E.ON ENERGIE ROMANIA SA Oil & Gas 986,304 571,215 72.67% -44,377 -22,091 -100.89% 559 394 41.88%171 143 HU RICHTER GEDEON VEGYÉSZETI GYÁR NYRT.* Pharmaceutical industry 985,178 880,998 11.83% 158,566 206,848 -23.34% 5,035 5,024 0.22%172 202 UA UKRZALIZNYCHPOSTACH Transport 980,347 796,136 23.14% 50 50 0.57% n.a. n.a. n.a.173 NEW UA AZOVZAGALMASH Metal industry 978,397 514,768 90.07% 66,875 -24,805 369.61% 12,884 6,582 95.75%174 201 PL BORYSZEW S.A.* Production general 976,591 706,676 38.19% 43,542 8,484 413.21% 7,822 5,657 38.27%175 148 SK ZÁPADOSLOVENSKÁ ENERGETIKA, A.S.* Energy supply 975,986 949,488 2.79% 139,731 136,019 2.73% 1,808 1,808 0.00%176 179 RO SOCIETATEA NATIONALA DE GAZE NATURALE ROMGAZ SA Oil & Gas 974,755 827,324 17.82% 238,819 150,735 58.44% 5,779 5,812 -0.57%177 94 PL LG ELECTRONICS WROCŁAW SP. Z O.O. Electronics 965,705 1,238,666 -22.04% 10,619 -516 2,157.78% 1,770 1,851 -4.38%178 244 UA GAZPROMZBUT UKRAINA Oil & Gas 963,107 676,307 42.41% 1,922 1,975 -2.69% n.a. n.a. n.a.179 161 HU ISD DUNAFERR DUNAI VASM U ZRT.* Metal industry 961,990 825,926 16.47% -65,136 -27,114 -140.23% 5,363 5,483 -2.19%180 211 HU BOSCH CSOPORT Electronics 953,835 682,270 39.80% 15,256 11,711 30.28% 3,169 2,863 10.69%181 133 PL PHILIPS LIGHTING POLAND S.A. Production general 953,603 907,484 5.08% 24,179 78,337 -69.13% 5,018 5,825 -13.85%182 NEW PL SHARP MANUFACTURING POLAND SP. Z O.O. Electronics 951,698 665,789 42.94% 5,523 5,912 -6.58% 1,600 1,600 0.00%183 139 PL KATOWICKI HOLDING WEGLOWY S.A.* Mining 951,217 889,586 6.93% 40,085 8,702 360.61% 19,200 19,242 -0.22%184 79 RO NOKIA ROMANIA SRL Telecommunications 949,863 1,565,330 -39.32% -2,030 41,936 -104.84% 1,866 1,552 20.23%185 206 UA MYRONIVSKYY HLIBOPRODUCT Food industry 948,620 788,535 20.30% 192,663 169 114,173.01% 24,779 22,766 8.84%186 173 RO GDF SUEZ ENERGY ROMANIA SA Oil & Gas 946,913 871,237 8.69% 48,506 46,164 5.07% 740 843 -12.22%187 136 PL CIECH S.A.* Wholesale 941,054 892,774 5.41% 338 5,035 -93.28% 1,501 6,705 -77.61%188 170 UA METRO CASH & CARRY UKRAINE Wholesale 940,791 913,727 2.96% 14,962 41,948 -64.33% n.a. n.a. n.a.189 186 BG OMV BULGARIA Oil & Gas 936,193 829,313 12.89% 2,254 17,129 -86.84% 73 75 -2.67%190 157 RO CARREFOUR ROMANIA SA Retail 933,117 907,091 2.87% 30,971 32,580 -4.94% 6,951 7,123 -2.41%191 155 PL TELE-FONIKA KABLE SP. Z O.O. S.K.A.* Telecommunications 932,844 835,722 11.62% 25,266 20,911 20.83% 3,500 3,395 3.09%192 168 PL CAN-PACK S.A.* Metal industry 932,466 809,234 15.23% 88,255 70,031 26.02% 3,801 3,542 7.31%193 151 PL PKP POLSKIE LINIE KOLEJOWE S.A. Transport 925,588 847,978 9.15% -134,857 -100,063 -34.77% 39,642 39,822 -0.45%194 141 RO ORANGE ROMANIA SA Telecommunications 921,704 963,192 -4.31% 186,481 216,183 -13.74% 2,707 2,732 -0.92%195 NEW PL GRUPA SAINT-GOBAIN POLSKA* Production general 918,402 845,363 8.64% n.a. n.a. n.a. 7,000 n.a. n.a.196 297 RO RENAULT INDUSTRIE ROUMANIE SRL Car distribution business 913,048 562,336 62.37% 243 179 35.53% 1 1 0.00%197 NEW HR PRIRODNI PLIN D.O.O. Oil & Gas 901,393 760,959 18.45% 43 -45,607 100.09% 30 32 -6.25%198 169 PL PPHU SPECJAŁ SP. Z O.O.* Wholesale 899,698 808,853 11.23% 464 761 -39.04% 3,365 3,323 1.26%199 214 HU FIRST CHEMICAL HOLDING VAGYONKEZELŐ KFT.* Holding companies 899,038 684,548 31.33% -118,783 -118,508 -0.23% n.a. n.a. n.a.200 166 PL SWEDWOOD POLAND SP. Z O.O. Production general 896,606 760,949 17.83% 44,969 43,014 4.55% 9,056 8,000 13.20%201 219 UA SOUTH-WESTERN RAILWAY Transport 892,575 745,425 19.74% 12,277 8,341 47.20% 64,561 64,609 -0.07%202 127 HU TIGÁZ TISZÁNTÚLI GÁZSZOLGÁLTATÓ ZRT.* Oil & Gas 879,715 954,387 -7.82% -8,022 22,704 -135.33% 582 1,800 -67.67%203 284 UA POLTAVSKYY ORE MINING AND PROCESSING PLANT Mining 876,365 604,919 44.87% 213,021 67,582 215.20% 8,031 7,984 0.59%204 197 SK STREDOSLOVENSKÁ ENERGETIKA, A.S.* Energy supply 873,570 798,339 9.42% 123,082 73,248 68.03% 1,776 1,089 63.09%205 196 UA MTS UKRAINA Telecommunications 868,564 814,941 6.58% 100,229 29,388 241.05% 2,979 n.a. n.a.206 328 LT KONCERNAS ACHEMOS GRUPE UAB* Others 867,863 538,944 61.03% 56,136 10,622 428.51% 5,500 5,485 0.27%207 243 SK SLOVAK TELEKOM, A.S. Telecommunications 867,742 669,468 29.62% 113,933 286,114 -60.18% 3,871 4,650 -16.75%208 228 UA PRIDNIPROVSKA RAILWAY Transport 854,839 721,627 18.46% 7,951 12,008 -33.79% 61,023 61,122 -0.16%209 171 HU OMV HUNGÁRIA ÁSVÁNYOLAJ KFT. Oil & Gas 852,019 804,113 5.96% -19,387 -18,706 -3.64% 59 84 -29.76%210 NEW HU CONTINENTAL CSOPORT Automotive 851,720 734,623 15.94% -20,748 44,523 -146.60% n.a. n.a. n.a.211 NEW PL ELEKTROWNIA RYBNIK S.A.* Energy supply 844,504 822,409 2.69% 76,876 75,179 2.26% 777 842 -7.72%
1st p
LAC
E „The subsequent stages of the economic crisis are generating more and more difficulties in the macroeconomic surrounding.
pkN oRleN has nonetheless managed to maintain its leading position in the Top 500 ranking which it has occupied since the
ranking’s first edition. The result of this classification confirms the correctness of the directions for activity and the develop-
ment strategies designed in 2008. our consistent efforts aimed at strengthening the company have allowed us to regain a posi-
tive outlook for our long-term financial rating. it is thanks to the measures taken in the recent years that we can be sure that –
in spite of the exacerbating situation on the global markets – pkN oRleN will continue to strengthen its competitive position
and will remain a stable and reliable leader in Central and eastern europe.“
Jacek krawiec, President of PkN OrLeN
Posi
tion
2011
Chan
ge in
Posi
tion
Posi
tion
2010
Coun
try
Com
pany
Na
me
Mai
n Se
ctor
Turn
over
inTE
UR 2
011
Turn
over
inTE
UR 2
010
Chan
geTu
rnov
er
Net P
rofit
inTE
UR 2
011
Net P
rofit
inTE
UR 2
010
Chan
geNe
t Pro
fit
Empl
oym
ent
2011
Empl
oym
ent
2010
Chan
geEm
ploy
men
t

13
212 226 UA DONETSK RAILWAY Transport 844,215 722,639 16.82% 9,579 9,578 0.01% 62,087 62,392 -0.49%213 250 BG BULGARGAZ Oil & Gas 837,109 647,282 29.33% -37,427 -19,118 -95.76% 42 41 2.44%214 174 CZ METROSTAV A.S. Construction industry 835,570 825,838 1.18% 27,389 27,768 -1.37% 3,106 3,071 1.14%215 190 PL KOLPORTER SP. Z O.O. S.K.A. Retail 821,877 731,127 12.41% 7,430 6,798 9.29% 1,158 1,221 -5.16%216 291 UA DNIPROENERGO Energy supply 820,844 592,893 38.45% 27,217 18,010 51.12% 8,671 n.a. n.a.217 248 UA ODESKA RAILWAY Transport 820,449 664,412 23.48% 16,097 11,319 42.21% 49,866 50,652 -1.55%218 158 PL GRUPA ZYWIEC S.A. Food industry 819,396 831,392 -1.44% 66,863 83,721 -20.14% 5,441 5,593 -2.72%219 192 RS TELEKOM SRBIJA Telecommunications 817,458 808,393 1.12% 209,823 148,736 41.07% 9,354 9,472 -1.25%220 167 PL BSH SPRZE T GOSPODARSTWA DOMOWEGO SP. Z O.O. Production general 815,445 809,274 0.76% 48,359 89,074 -45.71% 1,679 1,428 17.58%221 182 PL ROSSMANN SUPERMARKETY DROGERYJNE POLSKA SP. Z O.O. Retail 813,579 748,405 8.71% 96,360 87,865 9.67% 8,837 7,700 14.77%222 175 HU HUNGAROPHARMA GYÓGYSZERKERESKEDELMI ZRT.* Pharmaceutical industry 810,138 795,235 1.87% -18,192 -4,872 -273.37% 946 1,052 -10.08%223 204 HU TEVA MAGYARORSZÁG GYÓGYSZERFORGALMAZÓ ZRT.* Pharmaceutical industry 807,110 699,949 15.31% 158,752 149,517 6.18% 519 433 19.86%224 269 HU WIZZ AIR HUNGARY LÉGIKÖZLEKEDÉSI KFT. Transport 803,164 556,648 44.29% 53,189 898 5,822.05% 1,185 246 381.71%225 221 PL AB S.A.* Wholesale 803,017 649,714 23.60% 11,882 7,926 49.91% 704 630 11.75%226 187 SK EUSTREAM, A.S. Oil & Gas 802,386 826,472 -2.91% 187,059 188,285 -0.65% 969 920 5.33%227 153 HU SHELL HUNGARY KERESKEDELMI ZRT. Service station operator 800,166 838,266 -4.55% -18,930 -23,499 19.45% 206 226 -8.85%228 302 UA UKRGAZVIDOBUVANNYA Oil & Gas 798,697 583,950 36.77% 403,587 60,403 568.16% n.a. n.a. n.a.229 NEW CZ CESKÁ POŠTA, S.P. Others 798,129 788,098 1.27% 13,141 8,320 57.94% 33,202 34,374 -3.41%230 NEW PL ANIMEX SP. Z O.O.* Wholesale 786,956 778,198 1.13% 16,986 23,202 -26.79% 7,484 n.a. n.a.231 188 RO VODAFONE ROMANIA SA Telecommunications 786,906 802,713 -1.97% 98,487 112,720 -12.63% 2,951 2,964 -0.44%232 199 HU FÖVÁROSI GÁZMÜVEK ZRT.* Oil & Gas 785,978 709,373 10.80% 26,099 28,902 -9.70% 664 600 10.67%233 156 PL RUCH S.A. Others 784,945 812,426 -3.38% 48,633 -18,408 364.19% 2,766 3,329 -16.91%234 NEW PL TOSHIBA TELEVISION CENTRAL EUROPE SP. Z O.O. Telecommunications 784,924 593,989 32.14% 11,818 18,419 -35.84% 725 600 20.83%235 NEW PL KOKSOWNIA PRZYJAZN SP. Z O.O.* Oil & Gas 778,532 659,768 18.00% 19,515 75,054 -74.00% 1,720 n.a. n.a.236 266 CZ SYNTHOS KRALUPY A.S. Production general 777,309 580,518 33.90% n.a. 71,632 n.a. 685 695 -1.44%237 306 UA SERVIS-INVEST Energy supply 775,828 577,684 34.30% 19,292 4,653 314.58% n.a. n.a. n.a.238 NEW LT VISAGINO ATOMINE ELEKTRINE UAB* Energy supply 773,902 858,799 -9.89% -31,546 -11,263 -180.08% 5,413 5,654 -4.26%239 330 UA INTERPIPE UKRAINE Wholesale 773,880 546,691 41.56% 26,444 15,566 69.88% n.a. n.a. n.a.240 217 PL UNILEVER POLSKA* Others 771,761 757,387 1.90% 21,130 35,387 -40.29% 3,468 3,444 0.70%241 251 PL MOSTOSTAL WARSZAWA S.A.* Metal industry 765,636 579,438 32.13% -28,924 14,855 -294.70% 5,091 5,340 -4.66%242 165 HU BUDAPESTI ELEKTROMOS MÜVEK NYRT.* Energy supply 765,466 813,174 -5.87% 58,835 68,432 -14.02% 378 380 -0.53%243 198 PL SELGROS SP. Z O.O. Wholesale 764,938 711,855 7.46% 22,207 25,671 -13.49% 4,045 3,800 6.45%244 NEW PL MEDIA SATURN HOLDING POLSKA SP. Z O.O.* Others 761,826 824,806 -7.64% 14,616 26,636 -45.13% 4,955 n.a. n.a.245 193 HU AUCHAN MAGYARORSZÁG KERESKEDELMI ÉS SZOLGÁLTATÓ KFT. Retail 760,829 727,693 4.55% -24,538 -27,043 9.27% 5,265 5,622 -6.35%246 NEW PL DALKIA POLSKA S.A.* Energy supply 759,074 509,463 48.99% 112,177 25,178 345.53% 6,054 n.a. n.a.247 177 PL EVEREN SP. Z O.O. Energy supply 747,679 783,834 -4.61% n.a. 2,919 n.a. 46 45 2.22%248 195 CZ PRAŽSKÁ ENERGETIKA, A.S. Energy supply 740,172 755,399 -2.02% 82,637 59,086 39.86% 620 615 0.81%249 236 PL ABC DATA S.A.* Wholesale 737,524 615,485 19.83% 11,403 8,873 28.52% 512 304 68.42%250 257 PL ANWIL S.A.* Production general 737,184 569,211 29.51% -75,650 10,370 -829.52% 3,180 3,241 -1.88%251 374 UA ZAKHIDENERGO Energy supply 735,432 476,207 54.44% 7,640 -17,778 142.98% n.a. 9,205 n.a.252 189 HU PHOENIX PHARMA GYÓGYSZERKERESKEDELMI ZRT. Pharmaceutical industry 735,176 732,545 0.36% 8,480 14,026 -39.54% 633 657 -3.65%253 314 UA ALCHEVSK COKERY PLANT Oil & Gas 732,267 564,934 29.62% -636 -3,259 80.50% 3,118 3,114 0.13%254 273 UA LVIVSKA RAILWAY Transport 731,576 617,507 18.47% 11,661 12,205 -4.46% 55,349 n.a. n.a.255 275 UA ROSHEN Food industry 731,287 612,363 19.42% 75,866 90,831 -16.48% n.a. n.a. n.a.256 394 SI TELEKOM SLOVENIJE, D.D. Telecommunications 730,830 441,468 65.55% 21,333 n.a. n.a. 2,668 1,796 48.55%257 210 SK ORANGE SLOVENSKO, A.S. Telecommunications 728,566 764,135 -4.65% 167,208 186,202 -10.20% 1,257 1,333 -5.70%258 220 PL GRUPA EMPIK MEDIA & FASHION S.A.* Holding companies 726,897 655,599 10.88% 9,529 18,483 -48.44% 6,239 7,150 -12.74%259 256 RO MOL ROMANIA PETROLEUM PRODUCTS SRL Service station operator 726,122 619,319 17.25% -3,101 18,984 -116.34% 176 179 -1.68%260 183 PL KULCZYK TRADEX SP. Z O.O. Car distribution business 725,809 746,248 -2.74% 37,526 55,108 -31.91% 320 320 0.00%261 274 RO COMPANIA NATIONALA DE TRANSPORT AL ENERGIEI ELECTRICE TRANSELECTRICA SA Energy supply 720,599 589,259 22.29% 21,044 2,212 851.23% 2,197 2,185 0.55%262 280 RO OMV PETROM GAS SRL Oil & Gas 719,899 578,469 24.45% 31,898 24,115 32.27% 45 50 -10.00%263 149 UA VUGILLYA UKRAINI Mining 717,467 964,046 -25.58% 603 1,654 -63.52% n.a. n.a. n.a.264 215 PL POLSKIE LINIE LOTNICZE LOT S.A.* Transport 711,633 667,948 6.54% -32,842 -11,739 -179.78% 2,328 2,328 0.00%265 331 UA BADM Pharmaceutical industry 711,079 544,354 30.63% 385 9,688 -96.02% n.a. n.a. n.a.266 NEW CZ ELECTRABEL, ORGANIZACNí SLOŽKA Energy supply 708,426 371,114 90.89% 211 509 -58.63% 0 0 0.00%267 233 PL ELECTROLUX POLAND SP. Z O.O. Electronics 701,821 633,469 10.79% 19,229 11,503 67.16% 4,078 3,500 16.51%268 229 RS JAVNO PREDUZE CE SRBIJAGAS NOVI SAD Transport 697,121 698,835 -0.25% 11,793 8,300 42.08% 1,123 1,096 2.46%269 242 SI GORENJE GOSPODINJSKI APARATI, D.D. Electronics 696,745 677,190 2.89% 7,288 2,925 149.17% 4,423 4,648 -4.84%270 203 RO REAL, HYPERMARKET ROMANIA SRL Retail 696,462 759,233 -8.27% -27,952 -21,027 -32.94% 5,771 7,530 -23.36%271 178 PL POLSKI KOKS S.A. Oil & Gas 695,162 769,459 -9.66% 5,617 5,774 -2.71% 46 46 0.00%272 313 SI OMV SLOVENIJA, TRGOVINA Z NAFTO IN NAFTNIMI DERIVATI, D.O.O. Service station operator 692,862 556,488 24.51% 16,258 16,077 1.13% 77 80 -3.75%273 209 RS U. S. STEEL SERBIA DOO SMEDEREVO Metal industry 691,423 760,054 -9.03% -147,319 -141,405 -4.18% 5,429 5,400 0.54%274 293 LT LUKOIL BALTIJA UAB Service station operator 688,128 580,546 18.53% 2,806 3,133 -10.46% 120 203 -40.89%275 317 PL SLOVNAFT-POLSKA S.A. Oil & Gas 687,874 495,328 38.87% 1,801 996 80.88% 34 34 0.00%276 316 BG NAFTEX PETROL Oil & Gas 686,398 554,104 23.88% -19,109 11,717 -263.09% 295 270 9.26%277 334 UA CENTRENERGO Energy supply 683,524 539,532 26.69% 3,354 915 266.37% 8,694 n.a. n.a.278 309 UA SOUTH RAILWAY Transport 681,961 573,352 18.94% 14,976 13,121 14.14% 46,981 47,219 -0.50%279 368 PL FLEXTRONICS INTERNATIONAL POLAND SP. Z O.O. Electronics 678,071 421,645 60.82% 14,451 6,729 114.75% 2,904 2,700 7.56%280 138 HU GDF SUEZ ENERGIA MAGYARORSZÁG ZRT. Oil & Gas 674,568 892,317 -24.40% -18,184 15,865 -214.62% 326 407 -19.90%281 240 PL TOTALIZATOR SPORTOWY SP. Z O.O.* Others 674,355 608,511 10.82% 43,525 35,696 21.93% 867 887 -2.25%282 415 RO CARGILL AGRICULTURA SRL Wholesale 670,723 408,031 64.38% 7,311 -14,704 149.72% 249 199 25.13%283 227 CZ BOSCH DIESEL S.R.O. Automotive 669,464 665,195 0.64% 7,988 27,163 -70.59% 4,803 4,718 1.80%284 218 PL PKP ENERGETYKA S.A. Energy supply 666,584 655,704 1.66% 16,000 29,671 -46.07% 7,856 8,400 -6.48%285 344 PL CMC ZAWIERCIE S.A. Metal industry 662,945 459,240 44.36% 20,655 -25,141 182.16% 2,007 1,852 8.37%
2nd p
LAC
E
“mol group keeps people moving ahead by
discovering new ways of serving their energy needs
better and creating value for generations to come.“
ZsOLt HerNádi, chairman and ceO MOL Group
* Group result, n.a. no data available
Posi
tion
2011
Chan
ge in
Posi
tion
Posi
tion
2010
Coun
try
Com
pany
Na
me
Mai
n Se
ctor
Turn
over
inTE
UR 2
011
Turn
over
inTE
UR 2
010
Chan
geTu
rnov
er
Net P
rofit
inTE
UR 2
011
Net P
rofit
inTE
UR 2
010
Chan
geNe
t Pro
fit
Empl
oym
ent
2011
Empl
oym
ent
2010
Chan
geEm
ploy
men
t

14
Central and Eastern Europe is not a
homogeneous region, but instead a
diverse economic region with differ-
ent markets that present different
risks. this fact is also highlighted
not least by this country compari-
son, which reveals a few common
features as well as numerous dif-
ferences. thus, for example, the
insolvency rates in the region last year ranged between
0.03% (poland) and 13.86% (Serbia).
One country was represented in the CEE top 500 with
159 companies in 2011, another was home to only five
of the 500 biggest companies in the region. there are
numerous countries whose Coface risk assessment has
an excellent assessment of A3 (e.g. Czech republic), and
those with an assessment of C (Serbia) or D (Ukraine).
precisely because Central and Eastern Europe is such a
diverse region, a risk assessment of the markets there
requires local experts to have lots of know-how and
years of experience. this is exactly what Coface has,
thanks to a unique, more than 20 year-old network of
branch offices in all countries of the CEE region. this
network is also responsible for this brochure.
Gabriele Düker
regional risk Underwriting Director
Central Europe
286 290 RS TERMOELEKTRANE NIKOLA TESLA D.O.O.OBRENOVAC Energy supply 661,110 581,084 13.77% 57,666 3,823 1,408.53% 2,526 2,556 -1.17%287 245 CZ INVENTEC (CZECH), S.R.O. Others 660,960 654,516 0.98% n.a. 903 n.a. 406 400 1.50%288 323 CZ AGROFERT HOLDING, A.S. Wholesale 660,344 535,095 23.41% 151,162 100,485 50.43% 192 194 -1.03%289 241 SI ENGROTUŠ PODJETJE ZA TRGOVINO, D.D. Retail 658,179 677,979 -2.92% 6,318 7,885 -19.87% 3,358 3,216 4.42%290 276 PL JTI POLSKA SP. Z O.O. Tobacco 656,737 538,395 21.98% 876 -28,262 103.10% 800 720 11.11%291 NEW PL EURO NET SP. Z O.O. Retail 655,942 666,819 -1.63% 4,285 4,446 -3.62% 4,300 3,000 43.33%292 264 HU SANOFI-AVENTIS MAGYARORSZÁG KERESKEDELMI ÉS SZOLGÁLTATÓ ZRT. Pharmaceutical industry 650,697 558,878 16.43% 11,857 12,573 -5.69% 284 337 -15.73%293 NEW LT LESTO AB* Energy supply 650,090 703,500 -7.59% -17,770 -18,058 1.59% 3,564 3,691 -3.44%294 230 PL INDESIT COMPANY POLSKA SP. Z O.O. Electronics 649,903 627,603 3.55% -12,144 9,650 -225.85% 3,057 2,907 5.16%295 249 HU ELECTROLUX LEHEL HÜTÖGÉPGYÁR KFT. Electronics 645,466 583,923 10.54% 17,152 17,648 -2.81% 3,592 3,685 -2.52%296 300 SI LEK PHARMACEUTICALS D.D. FIRMA V FRANC.J: SOCIETE PHARMACEUTIQUE LEK D.D. Pharmaceutical industry 645,328 575,865 12.06% 73,860 47,909 54.17% 2,530 2,408 5.07%297 222 RS DELHAIZE SERBIA DOO Retail 645,275 719,800 -10.35% -13,020 18 -73,491.04% 6,081 5,814 4.59%298 260 UA UKRTELECOM Telecommunications 644,263 642,534 0.27% -13,004 -24,635 47.21% 75,726 n.a. n.a.299 176 UA NIKOPOL FERROALLOY PLANT Metal industry 637,200 892,849 -28.63% -267,589 -141,985 -88.46% 6,768 6,731 0.55%300 338 PL ZAKŁADY AZOTOWE PUŁAWY S.A. Production general 636,319 463,462 37.30% 53,288 8,011 565.21% 3,300 3,321 -0.63%301 NEW PL BASF POLSKA SP. Z O.O. Production general 636,178 476,632 33.47% n.a. n.a. n.a. 280 260 7.69%302 278 BG CHEZ ELEKTRO BULGARIA Energy supply 635,758 598,201 6.28% 1,228 1,560 -21.30% 74 80 -7.50%303 NEW PL CELSA HUTA OSTROWIEC SP. Z O.O. Metal industry 634,586 488,059 30.02% -316 -34,971 99.10% 1,389 1,358 2.28%304 440 RO INTERAGRO SA Others 634,484 389,064 63.08% 37,682 20,479 84.00% 257 262 -1.91%305 282 LT PALINK UAB* Retail 633,406 591,275 7.13% 5,059 7,548 -32.97% 9,200 8,648 6.38%306 271 PL IMPEXMETAL S.A.* Metal industry 632,583 544,996 16.07% 23,577 16,077 46.65% 1,977 1,910 3.51%307 333 PL ACTION S.A.* Wholesale 632,279 474,733 33.19% 9,560 5,812 64.48% 465 490 -5.10%308 NEW LT ACHEMA AB Production general 627,612 319,589 96.38% 27,881 11,222 148.45% 1,175 1,100 6.82%309 235 HU MAGYAR POSTA ZRT.* Others 627,260 618,433 1.43% 6,656 10,335 -35.60% 36,206 36,408 -0.55%310 NEW CZ DOPRAVNí PODNIK HL.M. PRAHY ,AKCIOVÁ SPOLEŐNOST Transport 626,099 634,741 -1.36% 38,505 52,654 -26.87% 10,748 10,728 0.19%311 224 PL TRW POLSKA SP. Z O.O. Automotive 625,348 644,089 -2.91% 25,903 56,045 -53.78% 4,498 4,600 -2.22%312 315 RO MEDIPLUS EXIM SRL Pharmaceutical industry 625,092 539,377 15.89% 13,016 8,519 52.78% 900 932 -3.43%313 304 PL MONDI SWIECIE S.A Production general 625,039 510,521 22.43% 89,216 56,396 58.20% 1,006 1,009 -0.30%314 239 PL RWE POLSKA S.A. Energy supply 624,325 611,495 2.10% 25,328 38,184 -33.67% 610 602 1.33%315 272 PL INTER CARS S.A.* Car distribution business 623,204 543,964 14.57% 23,529 14,356 63.90% 2,268 2,105 7.74%316 348 PL ZAKŁADY CHEMICZNE POLICE S.A. Production general 620,758 454,968 36.44% 72,421 7,872 819.97% 2,493 2,761 -9.71%
3rd p
LAC
E
„Naftogaz of ukraine is the leading enterprise of the fuel-energy complex in ukraine. The strategic directions of the
company’s further development are the increase of our own oil and gas production, the efficient hydrocarbon trans-
portation by pipeline systems and the ensuring of a stable functioning of domestic oil and gas sector. The successful
realization of the company’s strategy will significantly strengthen the ukrainian energy independence and contribute
to the state’s prestige on the international scene. “
evGeN BakULiN, chairman of the National Joint stock company Naftogaz of Ukraine
Posi
tion
2011
Chan
ge in
Posi
tion
Posi
tion
2010
Coun
try
Com
pany
Na
me
Mai
n Se
ctor
Turn
over
inTE
UR 2
011
Turn
over
inTE
UR 2
010
Chan
geTu
rnov
er
Net P
rofit
inTE
UR 2
011
Net P
rofit
inTE
UR 2
010
Chan
geNe
t Pro
fit
Empl
oym
ent
2011
Empl
oym
ent
2010
Chan
geEm
ploy
men
t
15
317 263 PL SPÓŁDZIELNIA MLECZARSKA MLEKPOL W GRAJEWIE Food industry 619,040 558,264 10.89% 6,339 4,490 41.18% 2,249 2,500 -10.04%318 NEW CZ EUROVIA CS, A.S. Construction industry 618,219 726,793 -14.94% 37,686 26,947 39.85% 2,073 2,655 -21.92%319 357 BG OVERGAS INC Oil & Gas 618,132 486,945 26.94% 8,222 7,062 16.41% 198 247 -19.84%320 NEW PL GRUPA MAGNETI-MARELLI POLSKA* Automotive 618,075 597,208 3.49% n.a. n.a. n.a. 3,237 3,564 -9.18%321 426 HU PORSCHE HUNGARIA KERESKEDELMI KFT. Car distribution business 615,197 367,888 67.22% 8,276 5,567 48.66% 260 285 -8.77%322 NEW CZ JIHOMORAVSKÁ PLYNÁRENSKÁ, A.S. Oil & Gas 612,470 686,581 -10.79% 53,639 73,470 -26.99% 750 750 0.00%323 421 UA CENTRAL ORE MINING AND PROCESSING PLANT Mining 611,645 422,077 44.91% 246,840 122,791 101.02% 5,915 6,609 -10.50%324 343 UA CARGILL Wholesale 610,824 523,402 16.70% 38,932 30,172 29.04% n.a. n.a. n.a.325 419 HR OMV HRVATSKA D.O.O. Oil & Gas 607,445 486,924 24.75% 3,327 6,705 -50.38% 65 66 -1.52%326 NEW PL P4 SP. Z O.O. Telecommunications 604,455 451,638 33.84% -52,601 1,863 -2,923.55% 2,238 1,054 112.33%327 247 PL NESTLE POLSKA S.A. Food industry 603,036 588,204 2.52% 35,402 50,431 -29.80% 3,058 3,082 -0.78%328 396 UA INTERPIPE NYZHNODNIPROVSKY TUBE-ROLLING PLANT Metal industry 599,933 445,659 34.62% -2,528 -24,663 89.75% 6,669 6,377 4.58%329 301 UA LUKOIL UKRAINE Service station operator 598,106 584,610 2.31% -21,303 -1,353 -1,475.08% n.a. n.a. n.a.330 258 PL GRUPA E.LECLERC* Wholesale 597,037 567,407 5.22% n.a. n.a. n.a. 6,200 6,200 0.00%331 262 HU LIDL MAGYARORSZÁG KERESKEDELMI BETÉTI TÁRSASÁG Retail 596,800 562,547 6.09% -11,709 -30,579 61.71% 3,173 3,373 -5.93%332 181 CZ SKANSKA A.S. Construction industry 596,108 785,370 -24.10% 599 29,694 -97.98% 3,635 3,907 -6.96%333 NEW PL GRUPA MASPEX* Food industry 596,107 567,712 5.00% n.a. n.a. n.a. 4,883 4,920 -0.75%334 NEW SK CONTINENTAL MATADOR RUBBER, S.R.O. Production general 595,971 356,694 67.08% 39,085 1,952 1,902.31% 2,175 1,962 10.86%335 319 LV RIMI LATVIA SIA Retail 595,532 559,370 6.46% 8,755 7,956 10.04% 4,827 3,094 56.01%336 NEW UA KHARTSYZK PIPE PLANT Metal industry 592,151 253,396 133.69% 75,019 16,304 360.12% 3,334 n.a. n.a.337 NEW PL AMREST Holding companies 591,567 453,441 30.46% 12,724 9,152 39.03% 20,519 17,464 17.49%338 259 CZ CEPS, A.S. Energy supply 590,436 593,170 -0.46% 89,417 66,162 35.15% 495 481 2.91%339 320 LV MAXIMA LATVIJA SIA Retail 589,891 557,405 5.83% 2,669 15,604 -82.89% 6,899 6,431 7.28%340 427 UA KRUKIVSKY CARRIAGE WORKS Production general 588,128 415,925 41.40% 64,757 28,429 127.79% 8,030 7,128 12.65%341 NEW CZ CCS CESKÁ SPOLE CNOST PRO PLATEBNí KARTY S.R.O. Electronics 585,844 592,896 -1.19% 9,674 9,438 2.50% 150 150 0.00%342 268 HU SZERENCSEJÁTÉK ZRT.* Others 585,781 547,425 7.01% 22,791 17,657 29.08% 1,359 1,378 -1.38%343 470 UA AZOT Production general 579,087 385,818 50.09% -18,336 -18,192 -0.79% 4,417 4,372 1.03%344 NEW UA SEVERODONETSK AZOT ASSOCIATION Production general 577,308 316,947 82.15% -69,993 -32,864 -112.98% 8,716 n.a. n.a.345 305 PL POLOMARKET SP. Z O.O. Wholesale 574,672 508,263 13.07% 3,735 3,819 -2.19% 330 300 10.00%346 281 PL CARGILL (POLSKA) SP. Z O.O. Food industry 574,568 531,009 8.20% 5,768 31,170 -81.50% 890 800 11.25%347 349 SI IMPOL, INDUSTRIJA METALNIH POLIZDELKOV, D.O.O. Metal industry 569,817 507,788 12.22% 5,117 2,232 129.22% 21 32 -34.38%348 299 PL ARCTIC PAPER S.A.* Others 569,704 515,723 10.47% 2,617 6,496 -59.71% 1,600 1,600 0.00%349 312 PL PHU ENERGOKRAK SP. Z O.O. Oil & Gas 569,133 502,036 13.36% 655 480 36.67% 60 70 -14.29%350 405 HU KITE MEZÖGAZDASÁGI SZOLGÁLTATÓ ÉS KERESKEDELMI ZRT.* Wholesale 568,252 383,386 48.22% 11,107 6,986 58.98% 842 781 7.81%351 318 CZ FERONA, A.S. Metal industry 566,472 518,903 9.17% 6,143 7,817 -21.42% 1,070 1,070 0.00%352 NEW LV ORLEN LATVIJA SIA Oil & Gas 566,187 292,038 93.87% 2,691 1,488 80.82% 8 9 -11.11%353 NO CHANGE 353 LV ELKO GRUPA AS Wholesale 565,744 506,088 11.79% 8,903 1,267 602.49% 175 175 0.00%354 NEW PL ESPPOL S.A.* Oil & Gas 562,989 423,892 32.81% -560 1,362 -141.10% n.a. n.a. n.a.355 335 PL LPP S.A.* Production general 561,887 468,750 19.87% 60,674 30,977 95.87% 2,000 n.a. n.a.356 261 HU PHILIP MORRIS MAGYARORSZÁG CIGARETTA KERESKEDELMI KFT. Tobacco 561,212 562,956 -0.31% 3,268 512 537.80% 510 513 -0.58%357 NEW CZ RWE ENERGIE, A.S. Oil & Gas 560,060 779,787 -28.18% 78,108 117,731 -33.66% 26 29 -10.34%358 311 PL SOKOŁÓW S.A.* Food industry 555,114 503,143 10.33% 16,756 21,413 -21.75% 6,175 6,035 2.32%359 369 SK OMV SLOVENSKO, S.R.O. Oil & Gas 554,966 470,801 17.88% 5,294 11,446 -53.75% 168 155 8.39%360 NEW SK CONTINENTAL MATADOR TRUCK TIRES S.R.O. Production general 554,142 378,744 46.31% 56,149 17,320 224.19% 1,142 n.a. n.a.361 384 HU MÁV MAGYAR ÁLLAMVASUTAK ZRT.* Transport 554,106 545,370 1.60% 41,274 -114,650 136.00% 19,075 19,196 -0.63%362 303 HU BRITISH AMERICAN TOBACCO MAGYARORSZÁG DOHÁNY KERESKEDELMI KFT. Tobacco 552,893 511,145 8.17% 3,033 2,425 25.06% 294 294 0.00%363 360 HU MICHELIN HUNGÁRIA ABRONCSGYÁRTÓ KFT. Production general 552,816 434,403 27.26% 47,888 20,422 134.49% 1,699 1,720 -1.22%364 296 CZ PHARMOS, A.S. Pharmaceutical industry 552,695 548,934 0.69% 630 562 12.08% 604 640 -5.63%365 354 CZ PEGATRON CZECH S.R.O. Electronics 552,657 630,350 -12.33% 1,931 4,129 -53.24% 1,200 1,200 0.00%366 336 PL MERCEDES-BENZ POLSKA SP. Z O.O. Car distribution business 552,150 468,345 17.89% 4,123 10,365 -60.22% 210 215 -2.33%367 347 PL DELPHI POLAND S.A. Automotive 552,078 455,414 21.23% 44,208 17,423 153.73% 4,526 4,500 0.58%368 212 PL WE GLOKOKS S.A.* Oil & Gas 551,342 681,438 -19.09% 132,919 42,992 209.17% 133 134 -0.75%369 378 RO J.T. INTERNATIONAL (ROMANIA) SRL Tobacco 549,932 450,995 21.94% 1,396 -13,978 109.99% 577 551 4.72%370 NEW CZ PRVNí ENERGETICKÁ A.S. Energy supply 548,337 428,270 28.04% 1,275 2,797 -54.42% 10 9 11.11%371 361 RO PHILIP MORRIS TRADING SRL Tobacco 546,836 468,601 16.70% 3,464 6,752 -48.69% 270 269 0.37%372 402 UA PAVLOGRADVUGILLYA Mining 546,041 439,489 24.24% -84,917 -32,402 -162.07% 25,515 25,026 1.95%373 NEW PL PHP POLSKI TYTON S.A. Tobacco 545,974 487,056 12.10% n.a. n.a. n.a. 621 650 -4.46%374 NEW RO CELESTICA ( ROMANIA ) SRL Electronics 545,805 291,943 86.96% 2,898 -13,429 121.58% 1,163 930 25.05%375 379 HU LEAR CORPORATION HUNGARY AUTÓIPARI GYÁRTÓ KFT. Automotive 545,663 415,414 31.35% 4,495 -741 706.77% 3,763 4,473 -15.87%376 339 SK VÝCHODOSLOVENSKÁ ENERGETIKA, A.S.* Energy supply 544,445 517,282 5.25% 96,129 82,244 16.88% 1,569 1,575 -0.38%377 NEW CZ J.P. MORGAN ENERGY EUROPE S.R.O. Energy supply 544,320 993,090 -45.19% n.a. 4,852 n.a. 0 n.a. n.a.378 NEW UA DNIPROSPETSSTAL Metal industry 540,487 382,167 41.43% 609 5,460 -88.85% 6,973 6,505 7.19%379 337 PL NETTO SP. Z O.O. Retail 536,205 418,173 28.23% n.a. n.a. n.a. 3,424 2,300 48.87%380 322 PL INTERNATIONAL PAPER-KWIDZYN SP. Z O.O. Production general 535,220 490,585 9.10% 90,757 97,362 -6.78% 1,304 1,317 -0.99%381 NEW CZ REPOWER TRADING CESKÁ REPUBLIKA S.R.O. Energy supply 534,496 294,788 81.32% 3,953 199 1,889.73% 22 25 -12.00%382 325 HR HEP- PROIZVODNJA D.O.O. Energy supply 533,524 520,610 2.48% -1,091 56,716 -101.92% 2,288 2,320 -1.38%383 476 PL CYFROWY POLSAT S.A.* Others 533,350 334,192 59.59% 36,112 58,267 -38.02% 1,267 864 46.64%384 351 LT LIETUVOS DUJOS AB* Oil & Gas 532,702 505,704 5.34% 27,724 46,175 -39.96% 1,719 1,750 -1.77%385 NEW PL BUMAR SP. Z O.O Wholesale 532,030 554,175 -4.00% 2,609 4,027 35.20% 320 302 5.96%386 NEW UA AEROSVIT Transport 531,567 300,162 77.09% -138,613 -42,120 -229.09% n.a. n.a. n.a.387 392 PL ANWIM S.A. Oil & Gas 531,046 400,353 32.64% -602 1,353 -144.49% 153 130 17.69%388 252 HU METRO KERESKEDELMI KFT. Wholesale 530,293 576,583 -8.03% -29,339 -4,008 -632.08% 2,681 2,942 -8.87%389 288 PL SPÓŁDZIELNIA MLECZARSKA MLEKOVITA Food industry 527,143 525,591 0.30% 9,881 7,159 38.02% 1,000 870 14.94%390 307 BG MOBILTEL Telecommunications 526,817 570,383 -7.64% 39,060 112,611 -65.31% 2,437 2,391 1.92%
4th p
LAC
E”Škoda auTo is a successful car producer. we are a strong company, also in terms of financial figures as sales and
operating results for many years now. The actual success of Škoda is a result of our ongoing growth Strategy. all people
at Škoda are continuously working to enhance the efficiency of our company. we are permanently investing in our
products, sites, and the expansion of our development and production capacities, especially in the Cee region.
Nevertheless we are feeling the weakness of the overall market in europe. but we are still growing there, winning market
shares. because Škoda is well positioned with its model offering, we are a value-for-money and a valuable brand. in times
of scarce money, people look for quality, durability and value. That is what Škoda stands for.“
wiNfried vaHLaNd, chairman of the Board ŠkOda aUtO
* Group result, n.a. no data available
Posi
tion
2011
Chan
ge in
Posi
tion
Posi
tion
2010
Coun
try
Com
pany
Na
me
Mai
n Se
ctor
Turn
over
inTE
UR 2
011
Turn
over
inTE
UR 2
010
Chan
geTu
rnov
er
Net P
rofit
inTE
UR 2
011
Net P
rofit
inTE
UR 2
010
Chan
geNe
t Pro
fit
Empl
oym
ent
2011
Empl
oym
ent
2010
Chan
geEm
ploy
men
t
16
391 362 PL ZAKŁADY TŁUSZCZOWE KRUSZWICA S.A. Food industry 525,684 429,548 22.38% 6,756 9,035 -25.22% 1,200 1,247 -3.77%392 364 PL FIRMA OPONIARSKA D EBICA S.A. Production general 523,355 425,592 22.97% 20,468 18,463 10.86% 3,027 2,931 3.28%393 500 LT SANITEX UAB* Transport 521,117 415,943 25.29% 2,391 -6,221 138.43% 2,108 1,835 14.88%394 441 RO OSCAR DOWNSTREAM SRL Oil & Gas 520,879 387,804 34.32% 6,198 8,571 -27.69% 240 150 60.00%395 283 HU TELENOR MAGYARORSZÁG ZRT. Telecommunications 520,464 530,397 -1.87% 80,730 91,290 -11.57% 1,269 1,125 12.80%396 342 PL AVON OPERATIONS POLSKA SP. Z O.O. Production general 520,315 461,982 12.63% 45,983 n.a. n.a. 2,247 2,280 -1.45%397 289 CZ METALIMEX A. S. Metal industry 519,197 548,681 -5.37% 5,291 6,085 -13.05% 65 65 0.00%398 403 RO ALRO SA Metal industry 518,815 419,467 23.68% 52,847 36,985 42.89% 2,513 2,502 0.44%399 135 UA KONTINENT NAFTO TREYD Oil & Gas 518,567 1,019,375 -49.13% 4,274 43,114 -90.09% n.a. n.a. n.a.400 329 PL ELEKTROWNIA POŁANIEC S.A. GRUPA GDF SUEZ ENERGIA POLSKA Energy supply 513,833 482,641 6.46% 49,978 71,271 -29.88% 499 499 0.00%401 NEW UA DONETSK ELECTROMETALLURGICAL PLANT Metal industry 513,476 295,939 73.51% -15,813 -7,637 -107.05% 3,002 n.a. n.a.402 376 HU ALCOA-KÖFÉM SZÉKESFEHÉRVÁRI KÖNNYÜFÉMMÜ KFT. Metal industry 512,902 418,938 22.43% 40,240 41,517 -3.08% 1,687 1,705 -1.06%403 466 PL THYSSENKRUPP ENERGOSTAL S.A. Metal industry 509,910 341,130 49.48% 12,670 11,276 12.36% 780 695 12.23%404 451 LT INDORAMA POLYMERS EUROPE UAB* Wholesale 508,111 390,267 30.20% 27,843 17,070 63.11% 149 132 12.88%405 494 SK JOHNSON CONTROLS INTERNATIONAL, S.R.O. Automotive 507,881 358,436 41.69% -2,391 96,656 -102.47% 2,784 1,592 74.87%406 372 RO SOCIETATEA NATIONALA DE TRANSPORT FEROVIAR DE CALATORI - CFR - CALATORI SA Transport 506,862 455,808 11.20% 352 -20,021 101.76% 13,924 15,179 -8.27%407 381 RO ELECTROCENTRALE BUCURESTI SA Energy supply 504,697 448,076 12.64% 24,734 38,649 -36.00% 3,100 3,237 -4.23%408 355 LV LATVIJAS GAZE AS Oil & Gas 504,419 504,428 0.00% 38,795 37,783 2.68% 1,284 1,279 0.39%409 NEW UA CONCERN STIROL Production general 503,612 203,948 146.93% -33,289 -62,599 46.82% 2,915 2,246 29.79%410 286 PL TOYOTA MOTOR MANUFACTURING POLAND SP. Z O.O. Automotive 502,751 527,089 -4.62% n.a. n.a. n.a. 1,727 2,073 -16.69%411 373 SK MONDI SCP, A.S.* Production general 502,614 468,306 7.33% 55,483 63,170 -12.17% 1,466 1,455 0.76%412 397 PL ZAK S.A.* Production general 501,799 403,880 24.24% 44,579 7,312 509.68% 1,583 1,640 -3.48%413 308 PL FERRERO POLSKA SP. Z O.O. Food industry 501,492 504,832 -0.66% 25,420 30,369 -16.30% 1,123 1,600 -29.81%414 356 UA PHILIP MORRIS UKRAINE Tobacco 501,218 506,022 -0.95% 106,745 103,072 3.56% 1,308 n.a. n.a.415 NEW PL PETRODOM-EKO DOMANSKI SP.J. Oil & Gas 498,321 243,082 105.00% n.a. n.a. n.a. 101 97 4.12%416 479 RO MICHELIN ROMANIA SA Production general 496,916 362,234 37.18% 10,399 13,423 -22.53% 2,657 2,860 -7.10%417 326 SK PHOENIX ZDRAVOTNíCKE ZÁSOBOVANIE, A.S. Pharmaceutical industry 496,814 541,092 -8.18% 1,400 -28,228 104.96% 433 457 -5.25%418 NEW EE TALLINK GRUPP AS Transport 496,348 347,800 42.71% -28,163 -58,079 51.51% n.a. n.a. n.a.419 363 PL VALEO AUTOSYSTEMY SP. Z O.O. Automotive 489,262 422,368 15.84% 47,646 42,881 11.11% 3,000 2,775 8.11%420 391 RS MERCATOR-S DOO, NOVI SAD Retail 486,900 444,471 9.55% 20,378 6,867 196.75% 4,093 3,967 3.18%421 NEW PL TRAKCJA-TILTRA S.A.* Construction industry 483,229 110,723 336.43% 14,195 7,350 93.13% 3,997 1,038 285.07%422 401 SK ŽELEZNICE SLOVENSKEJ REPUBLIKY Transport 480,785 432,512 11.16% -31,784 -101,465 68.67% 15,820 16,955 -6.69%423 279 PL KOPEX S.A.* Oil & Gas 479,212 481,107 -0.39% 35,409 6,815 419.60% 5,606 6,759 -17.06%424 491 BG STOMANA-INDUSTRY S.A Metal industry 479,123 362,990 31.99% -2,444 1,414 -272.88% 734 715 2.66%425 NEW PL ISD TRADE SP. Z O.O. SP.K. Metal industry 475,429 427,620 11.18% -32,779 -2,174 -1,408.06% 36 38 -5.26%426 NEW CZ CONTINENTAL AUTOMOTIVE SYSTEMS CZECH REPUBLIC S.R.O. Automotive 474,625 401,843 18.11% 77,927 59,875 30.15% 2,100 2,100 0.00%427 430 HR TISAK D.D. Retail 473,923 437,180 8.40% 3,171 -2,339 235.54% 3,690 3,310 11.48%428 341 HR HEP-OPERATOR DISTRIBUCIJSKOG SUSTAVA D.O.O. Energy supply 473,923 451,561 4.95% 36,840 11,261 227.15% 9,296 9,450 -1.63%429 416 RO RCS & RDS SA Telecommunications 469,623 407,486 15.25% -2,903 -16,262 82.15% 6,910 5,853 18.06%430 NEW CZ TANK ONO, S.R.O. Service station operator 468,839 381,160 23.00% 1,028 965 6.50% 333 308 8.12%431 482 RO DEDEMAN SRL Retail 466,731 359,633 29.78% 47,607 35,457 34.27% 4,646 3,752 23.83%432 NEW EE ORLEN EESTI OU Oil & Gas 463,749 231,617 100.22% 2,298 798 188.06% n.a. n.a. n.a.433 413 HU LUK SAVARIA KUPLUNGGYÁRTÓ KFT. Automotive 461,394 376,653 22.50% 45,487 41,827 8.75% 1,704 1,467 16.16%434 429 LT LIETUVOS GELEZINKELIAI AB* Transport 460,852 406,542 13.36% 43,445 19,944 117.84% 12,117 11,632 4.17%435 NEW SK DUSLO, A.S. Production general 459,774 321,473 43.02% 33,997 20,530 65.60% 2,233 1,893 17.96%436 377 PL KRONOPOL SP. Z O.O. Production general 459,598 415,348 10.65% 45,878 22,803 101.19% 1,061 1,061 0.00%437 383 HU OPEL SOUTHEAST EUROPE AUTÓFORGALMAZÓ KFT. Car distribution business 458,287 406,259 12.81% -1,009 3,024 -133.36% 78 108 -27.78%438 408 RO JT INTERNATIONAL MANUFACTURING SA Tobacco 458,180 413,314 10.86% -2,928 1,184 -347.37% 318 200 59.00%439 310 BG BULGARIAN TELECOMMUNICATIONS COMPANY Others 458,060 458,313 -0.06% 4,728 58,122 -91.86% 3,253 3,141 3.57%440 367 CZ PARAMO, A.S. Oil & Gas 457,347 441,943 3.49% -27,164 -7,264 -273.95% 654 676 -3.25%441 468 RS IDEA DOO BEOGRAD Wholesale 455,128 378,385 20.28% -17,613 -22,149 20.48% 4,254 3,579 18.86%442 NEW UA DONETSKOBLENERGO Energy supply 454,865 362,320 25.54% 6 3 103.45% 9,722 9,885 -1.65%443 370 HU PENNY-MARKET KERESKEDELMI KFT. Retail 454,351 421,865 7.70% 1,486 2,248 -33.88% 3,041 2,998 1.43%444 462 BG AEC KOZLODUI EAD Energy supply 452,261 413,422 9.39% 61,250 30,901 98.21% 4,224 4,101 3.00%445 386 HU SE-CEE SCHNEIDER ELECTRIC KÖZÉP-KELET EURÓPAI KFT. Others 451,881 405,016 11.57% 62,457 47,642 31.10% 162 162 0.00%446 456 PL STALPRODUKT S.A.* Metal industry 451,513 390,506 15.62% 26,328 32,829 -19.80% 2,838 2,764 2.68%447 NEW PL PKP INTERCITY S.A. Transport 450,342 437,098 3.03% -5,573 -30,708 81.85% 7,772 n.a. n.a.448 NEW RO COSMOTE ROMANIAN MOBILE TELECOMMUNICATIONS SA Telecommunications 450,146 412,460 9.14% -7,130 -32,849 78.29% 1,234 1,254 -1.59%449 NEW UA DNIPROPETROVSK IRON AND STEEL WORKS PETROVSKY Metal industry 447,097 349,809 27.81% -77,062 -59,980 -28.48% 6,115 5,364 14.00%450 NEW PL BARTER S.A. Oil & Gas 445,658 341,679 30.43% 1,250 7,633 -83.62% 500 497 0.60%451 NEW PL MGL METRO GROUP LOGISTICS POLSKA SP. Z O.O. I SPÓŁKA SP.K. Transport 445,019 340,491 30.70% 37,522 38,681 -2.99% n.a. n.a. n.a.452 432 CZ IVECO CZECH REPUBLIC, A. S. Automotive 443,586 378,614 17.16% 30,920 29,073 6.35% 2,100 2,100 0.00%453 NEW PL POLSKA ZEGLUGA MORSKA PRZEDSIEBIORSTWO PANSTWOWE* Transport 443,202 485,348 -8.68% 29,541 110,593 -73.29% 2,825 n.a. n.a.454 460 RO AUTOLIV ROMANIA SRL Automotive 442,483 374,393 18.19% 37,257 34,095 9.27% 3,101 2,798 10.83%455 418 PL TVN S.A.* Others 441,807 433,982 1.80% -71,544 10,338 -792.02% 3,241 3,218 0.71%456 NEW SI ACRONI, PODJETJE ZA PROIZVODNJO JEKLA IN JEKLENIH IZDELKOV D.O.O. Metal industry 439,490 385,796 13.92% 6,853 1,474 365.03% 1,370 1,462 -6.29%457 382 RO ENEL ENERGIE SA Energy supply 439,134 444,195 -1.14% -9,985 -7,495 -33.22% 412 460 -10.43%458 350 UA NIBULON Food industry 436,493 515,802 -15.38% 6,028 1,878 220.96% n.a. n.a. n.a.459 366 RS YUGOROSGAZ AD BEOGRAD Transport 434,882 468,621 -7.20% 14,448 18,745 -22.92% 27 34 -20.59%460 NEW PL POJAZDY SZYNOWE PESA BYDGOSZCZ S.A.* Production general 434,129 246,353 76.22% 54,885 13,616 303.09% 2,694 2,492 8.11%461 NEW CZ CESKÉ DRÁHY, A.S. Transport 432,800 500,362 -13.50% 6,271 363 1,625.86% 18,000 27,500 -34.55%462 439 SK UNIPHARMA, 1. SLOVENSKÁ LEKÁRNICKÁ AKCIOVÁ SPOLOCNOST Pharmaceutical industry 431,776 401,174 7.63% 1,645 3,176 -48.21% 572 561 1.96%463 NEW UA YASYNIVKA COKERY PLANT Oil & Gas 429,981 334,956 28.37% 11,426 6,574 73.80% 3,412 3,060 11.50%464 469 RO ALFRED C. TOEPFER INTERNATIONAL (ROMANIA) SRL Wholesale 427,921 369,971 15.66% -4,042 -6,952 41.87% 138 136 1.47%
5th p
LAC
E “State-owned enterprise energorynok is the unique company that has ensured effective operation of the ukrainian whole-
sale electricity market for 12 years. The company has manufacturing capabilities, intellectual potential of employees, ex-
tensive experience and its own development strategy on a short term. high level of corporate culture and positive image
acquired by the company creates the conditions for successful cooperation of energorynok with business partners – over
600 domestic market members and foreign energy companies. Therefore, the employees of energorynok are ready to fully
implement the new functions relevant to the new model of electricity market, on each stage of market reformation under
the correspondent changes of company’s duties and the establishment of new market structures.“
serGiy BediN, director of state-owned enterprise energorynok
Posi
tion
2011
Chan
ge in
Posi
tion
Posi
tion
2010
Coun
try
Com
pany
Na
me
Mai
n Se
ctor
Turn
over
inTE
UR 2
011
Turn
over
inTE
UR 2
010
Chan
geTu
rnov
er
Net P
rofit
inTE
UR 2
011
Net P
rofit
inTE
UR 2
010
Chan
geNe
t Pro
fit
Empl
oym
ent
2011
Empl
oym
ent
2010
Chan
geEm
ploy
men
t
17
transparency is one of the most important pillars for a
functioning economy – and the CEE top 500 makes a
contribution to this. Figures tend not to lie; instead they
ruthlessly show whether a company took the right deci-
sions in the past – and what effects these had on turnover,
profit or the number of employees.
this country comparison reveals how the leading com-
panies in the region made it through 2011. It reveals how
incredibly well they performed, despite the difficult envi-
ronment, and that signs of recovery are in sight. Overall,
the CEE top 500 generated 16.0%
more turnover and 45.5% more
profit in 2011 than the year before. Of
course, “overall” does not mean “all”
– which is why a closer look is well
worthwhile.
Christian Berger
regional Finance Director
Central Europe
465 424 PL ABB SP. Z O.O. Production general 427,577 369,430 15.74% 26,633 41,823 -36.32% 2,470 2,263 9.15%466 450 HU CARGILL MAGYARORSZÁG KERESKEDELMI ZRT. Wholesale 427,056 351,810 21.39% -7,801 21,046 -137.06% 301 293 2.73%467 398 RO ENEL ENERGIE MUNTENIA SA Energy supply 426,429 424,638 0.42% -300 602 -149.88% 257 282 -8.87%468 497 SK SLOVENSKÁ ELEKTRIZACNÁ PRENOSOVÁ SÚSTAVA, A.S. Energy supply 425,123 356,399 19.28% 41,599 31,216 33.26% 496 517 -4.06%469 447 RS ELEKTROVOJVODINA DOO NOVI SAD Energy supply 424,743 390,788 8.69% 4,967 -11,312 143.91% 2,487 2,526 -1.54%470 442 PL FAURECIA WAŁBRZYCH S.A. Automotive 422,924 356,904 18.50% -3,354 6,192 -154.17% 2,232 1,900 17.47%471 411 SK BILLA, S.R.O. Retail 422,884 421,441 0.34% n.a. n.a. n.a. 3,428 3,390 1.12%472 486 RO FARMEXPERT D.C.I. SA Pharmaceutical industry 421,592 353,550 19.25% 19,992 12,399 61.24% 623 615 1.30%473 495 BG KAUFLAND BULGARIA EOOD Retail 420,000 354,927 18.33% n.a. n.a. n.a. 4,200 3,500 20.00%474 412 CZ ABB S.R.O. Production general 419,970 364,784 15.13% 27,425 33,111 -17.17% 2,800 2,800 0.00%475 NEW SK SAS AUTOMOTIVE, S.R.O. Automotive 419,192 291,109 44.00% n.a. 3,227 n.a. 405 n.a. n.a.476 371 HU FGSZ FÖLDGÁZSZÁLLíTÓ ZRT. Transport 418,928 421,488 -0.61% 74,243 81,008 -8.35% 806 788 2.28%477 NEW EE EESTI ENERGIA NARVA ELEKTRIJAAMAD AS Energy supply 418,498 309,763 35.10% 50,580 26,179 93.21% 1,196 1,353 -11.60%478 365 HR VIPNET D.O.O. Telecommunications 416,908 455,990 -8.57% 51,510 77,626 -33.64% 962 1,028 -6.42%479 404 HU BAT PÉCSI DOHÁNYGYÁR KFT. Tobacco 416,902 384,864 8.32% -9,825 -6,122 -60.49% 602 548 9.85%480 472 RO PORSCHE ROMANIA SRL Car distribution business 416,326 367,325 13.34% 26,555 20,128 31.93% 150 155 -3.23%481 NEW SI CIMOS D.D. AVTOMOBILSKA INDUSTRIJA Automotive 416,278 365,009 14.05% 3,666 2,392 53.23% 939 1,000 -6.10%482 395 HU MAVIR MAGYAR VILLAMOSENERGIA-IPARI ÁTVITELI RENDSZERIRÁNYíTÓ ZRT. Energy supply 416,122 394,406 5.51% 16,394 19,037 -13.88% 592 617 -4.05%483 NEW LT LIFOSA AB Production general 415,507 314,287 32.21% 62,414 69,660 -10.40% 950 985 -3.55%484 498 RS LUKOIL-BEOPETROL A.D. BEOGRAD Service station operator 415,023 353,985 17.24% -9,311 -32,741 71.56% 665 962 -30.87%485 NEW LT LIETUVOS ENERGIJA AB* Energy supply 413,857 365,019 13.38% 442 23,340 -98.11% 1,179 946 24.63%486 409 HU EGIS GYÓGYSZERGYÁR NYRT.* Pharmaceutical industry 412,605 380,528 8.43% 43,472 53,706 -19.05% 2,720 2,719 0.04%487 410 BG COSMO BULGARIA MOBILE EAD Telecommunications 412,526 423,299 -2.54% 28,404 47,172 -39.79% 2,069 2,360 -12.33%488 NEW PL CNH POLSKA SP. Z O.O. Production general 411,731 297,698 38.31% 38,194 2,385 1,501.42% 1,195 1,200 -0.42%489 NEW HU NI HUNGARY SOFTWARE ÉS HARDWARE GYÁRTÓ KFT. Electronics 410,064 352,434 16.35% 33,421 20,672 61.68% 1,125 1,139 -1.23%490 270 PL ALSTOM POWER SP. Z O.O. Production general 406,938 484,679 -16.04% -29,841 14,317 -308.44% 2,000 2,103 -4.90%491 474 BG E.ON BULGARIA SALES Energy supply 406,433 373,656 8.77% 6,243 -112 5,650.45% 70 70 0.00%492 NEW RO ELECTRICA FURNIZARE SA Energy supply 405,414 n.a. n.a. 19,566 n.a. n.a. 1,156 n.a. n.a.493 NEW CZ SEVEROCESKÉ DOLY A.S. Mining 405,316 407,854 -0.62% 97,569 87,892 11.01% 3,463 3,490 -0.77%494 459 RO REWE (ROMANIA) SRL Retail 405,112 374,627 8.14% 1,191 7,140 -83.32% 2,493 2,075 20.14%495 389 HU DENSO GYÁRTÓ MAGYARORSZÁG KFT. Automotive 404,763 401,564 0.80% 9,557 21,466 -55.48% 3,428 3,445 -0.49%496 422 PL TORUNSKIE ZAKŁADY MATERIAŁÓW OPATRUNKOWYCH S.A. Pharmaceutical industry 404,153 371,162 8.89% 26,269 26,003 1.02% 1,100 1,400 -21.43%497 340 HU EDF DÉMÁSZ ZRT.* Energy supply 403,318 463,312 -12.95% 6,490 28,560 -77.28% 669 690 -3.04%498 285 PL ZABKA POLSKA SP. Z O.O. Others 403,120 527,380 -23.56% -30,115 9,010 -434.24% 450 449 0.22%499 480 LT KONCERNAS MG BALTIC UAB* Holding companies 402,805 370,974 8.58% 3,442 11,775 -70.77% 2,870 2,823 1.66%500 294 HU MAGYAR ÁRAMSZOLGÁLTATÓ KFT. Energy supply 400,406 520,457 -23.07% 10,142 33,396 -69.63% 59 19 210.53%
6th p
LAC
E
„grupa loToS S.a. developed the pattern of fast, sustainable growth. we successfully finished a
huge investment operation, the programme 10+, one of the biggest of this kind in the polish econo-
my. Superb state-of-art refining technology is giving us a market advantage, competitive edge and
highest quality of our products. we are environmentally friendly and socially responsible. upstream
advances will provide an extra impulse for future development. grupa loToS S.a. is definitely a
company to watch – and we are proud of it.“
PaweL OLecHNOwicZ, ceO, Grupa LOtOs s.a., chairman of the Board of directors, ceeP adsL
* Group result, n.a. no data available
Posi
tion
2011
Chan
ge in
Posi
tion
Posi
tion
2010
Coun
try
Com
pany
Na
me
Mai
n Se
ctor
Turn
over
inTE
UR 2
011
Turn
over
inTE
UR 2
010
Chan
geTu
rnov
er
Net P
rofit
inTE
UR 2
011
Net P
rofit
inTE
UR 2
010
Chan
geNe
t Pro
fit
Empl
oym
ent
2011
Empl
oym
ent
2010
Chan
geEm
ploy
men
t
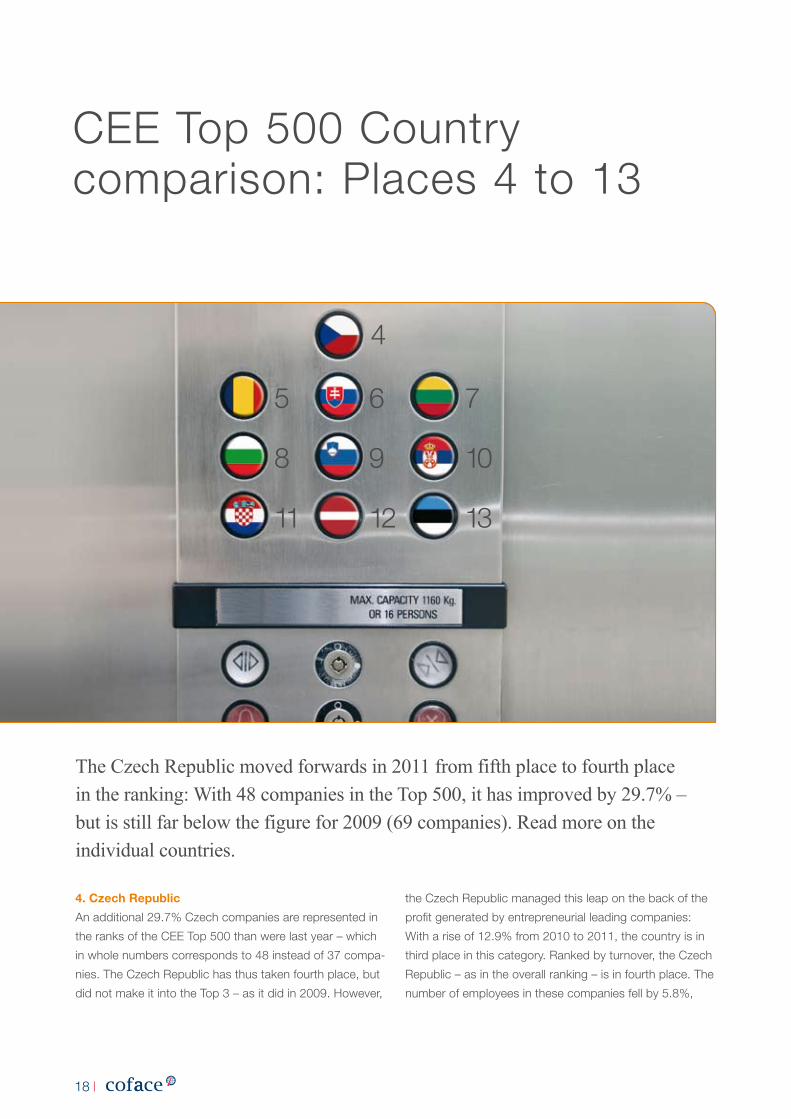
18
4. Czech Republic
An additional 29.7% Czech companies are represented in
the ranks of the CEE top 500 than were last year – which
in whole numbers corresponds to 48 instead of 37 compa-
nies. the Czech republic has thus taken fourth place, but
did not make it into the top 3 – as it did in 2009. However,
the Czech republic managed this leap on the back of the
profit generated by entrepreneurial leading companies:
With a rise of 12.9% from 2010 to 2011, the country is in
third place in this category. ranked by turnover, the Czech
republic – as in the overall ranking – is in fourth place. the
number of employees in these companies fell by 5.8%,
The Czech Republic moved forwards in 2011 from fifth place to fourth place in the ranking: With 48 companies in the Top 500, it has improved by 29.7% – but is still far below the figure for 2009 (69 companies). Read more on the individual countries.
CEE top 500 Country comparison: places 4 to 13
4
5
8
11
6
9
12
7
10
13
19
which in turn means fifth place in the CEE top 500 in rela-
tion to the total workforce. A total of 3.3% of all workers
are employed here.
Economic growth in the Czech republic was 1.9% in 2011
and thus just below the level of 2010. the weaker growth
in the countries of the euro zone, which are the republic’s
main trading partners, is influencing economic develop-
ments. the number of insolvencies fell by 2.0% and the
insolvency rate of 0.4% is much better than in 2010, but
increasing numbers of sole traders are confronted with the
fact that every second bankruptcy in 2011 affected a sole
trader, and the trend is rising.
One advantage of the Czech republic is its location in
Central Europe, with good connections to up-and-coming
Eastern European countries as well as Western European
states. the country offers services at competitive prices,
complemented by good language skills, cultural closeness
to Western Europe and a modern telecoms infrastructure.
negative growth is expected for 2012 due to the sharp
drop in overseas demand as well as a weakening of do-
mestic demand, to be followed by a slow recovery in 2013.
5. Romania
romania is represented in the CEE top 500 ranking with
44 companies and was therefore unable to retain the
fourth place achieved in the previous year – romania had
50 companies in the assessment in 2010. Compared to
2009 (14 companies), that is still a high level. the profit
accounted for by the leading companies grew strongly: by
51.3% compared to 2010. that equates to sixth place in
the country ranking. the proportion of employees in the
leading companies in relation to the overall workforce is
relatively low in romania (1.4%) and the country is thus in
tenth place in this area.
the romanian economy recovered slightly in 2011 follow-
ing the heavy effects of the crisis and two years of recession
and grew by 2.5%. the country continues to have the
second-highest insolvency rate in the region (after Serbia) of
3.5%, which even rose slightly from 2010 to 2011 (2010:
3.3%). the number of company bankruptcies rose by 4.0%,
which was not as sharp as in the previous year, and a
further improvement is expected for 2012.
In general, stagnating exports combined with sluggish
domestic demand are causing the economy to grow below
its potential. Hope is given by the third-highest growth in
the area of industrial production amongst the EU27 since
2005, the relatively large domestic market, the country’s
foreign currency reserves and public debt below EU aver-
age.
6. Slovakia
the number of placed companies remained constant at
28, after doubling from 2008 to 2009 and falling slightly
in 2010. the country remains in sixth place. the profit
of the assessed top companies rose sharply again by
12.6% compared to the previous year – putting Slovakia
in fifth place. With regard to the number of employees in
Slovakia’s top companies (which rose by 1.9% compared to
last year) and in relation to the total workforce, the country
is also in sixth place. A total of 3.2% of all workers are
employed by these companies.
the total number of insolvencies in Slovakia increased by
around 6.0% from 2010 to 2011, having grown by only a
relatively moderate +21.0% in the previous year. the coun-
try is in the top 4 of the CEE comparison, with an insol-
vency rate of just 0.15%. the worst affected sectors were
the wholesale and retail trade as well as the producing and
construction industries. Economic growth was 3.2% in
2011 and therefore still good compared to 2010 (+4.2%).
20
Unemployment remains high at 13.6%, the third-highest
rate in the region.
Due to relatively low taxes, low wage costs and its stra-
tegically favourable position in Europe, together with the
current stable political environment and demand from
overseas (especially for cars), Slovakia will remain one of
the fastest-growing markets in the EU.
7. Lithuania
Lithuania moved up two places year-on-year and is now
in seventh place in the ranking by number of companies
in the CEE top 500. In absolute numbers, however, the
country has only one more company in the top players
than last year (17 instead of 16). the profit of the country’s
biggest companies fell by 7% compared to the previous
year. Lithuania is therefore only in tenth place in this category
(2010: eighth place). It is worth noting that Lithuania is in
first place with a 7.6% ratio of employees to the country’s
workforce in the 17 ranked companies.
Following a 99% jump in insolvencies from 2008 to 2009
and a fall in 2010, the situation has eased again: Lithuania
recorded 24.0% fewer insolvencies in 2011 compared to
2010 and therefore also has a much better insolvency
rate of 0.7% (2010: 1.1%). Economic growth in 2011 was
5.0%, the second-highest figure in the region after Esto-
nia (8.9%). Unemployment fell slowly compared to 2010
(18.0%), but is still high at 15.4% in 2011, making it the
second-highest in the region. private consumer behaviour
remains highly volatile, and depends on the confidence and
expectations regarding the economic situation.
positive stimuli are provided by the strategically good
geographical location at the hub between the CIS states,
Western Europe and Scandinavia, world-leading infrastruc-
ture for information and communication technology, which
makes the country a service hub for northern Europe, as
well as financial incentives that support investment and
business start-ups in the country.
8. Bulgaria
With 16 companies in the CEE top 500, Bulgaria occupies
eighth place in the country comparison in 2011, losing
one place compared to the previous year. the assessed
companies had the sharpest fall in profit anywhere in the
region of -41.7%. the country is therefore only in twelfth
place in this category (2010: eighth place). the number
of employees in these companies fell by 6.2%, Bulgaria is
also in penultimate twelfth place in the country comparison
with a relation of employees in the top companies to the
total workforce of 0.7%
the number of insolvencies fell by 15.0% from 2010 to
2011, making the insolvency rate of 0.12% the second-
lowest in the region, ex aequo with Ukraine. Bulgaria did
not achieve the forecast economic growth of 2.6% and
grew by only 1.7%.
Slight economic growth should be possible again in the
next few years due to stabilising domestic demand, but the
growth of consumption and investment will still not reach
pre-crisis levels. the producing industry – the most impor-
tant in Bulgaria because it is the biggest – grew again. Es-
pecially strong growth rates are evident in the area of wood
and wood products. Bulgaria’s potential lies in its extremely
competitive business costs which, like the tax burden, are
extremely low by European standards.
9. Slovenia
Slovenia, in seventh place in the previous year ex aequo
with Bulgaria, fell two places and is now represented with
14 companies in the top 500. the profit accounted for by
these companies corresponds to eleventh place amongst
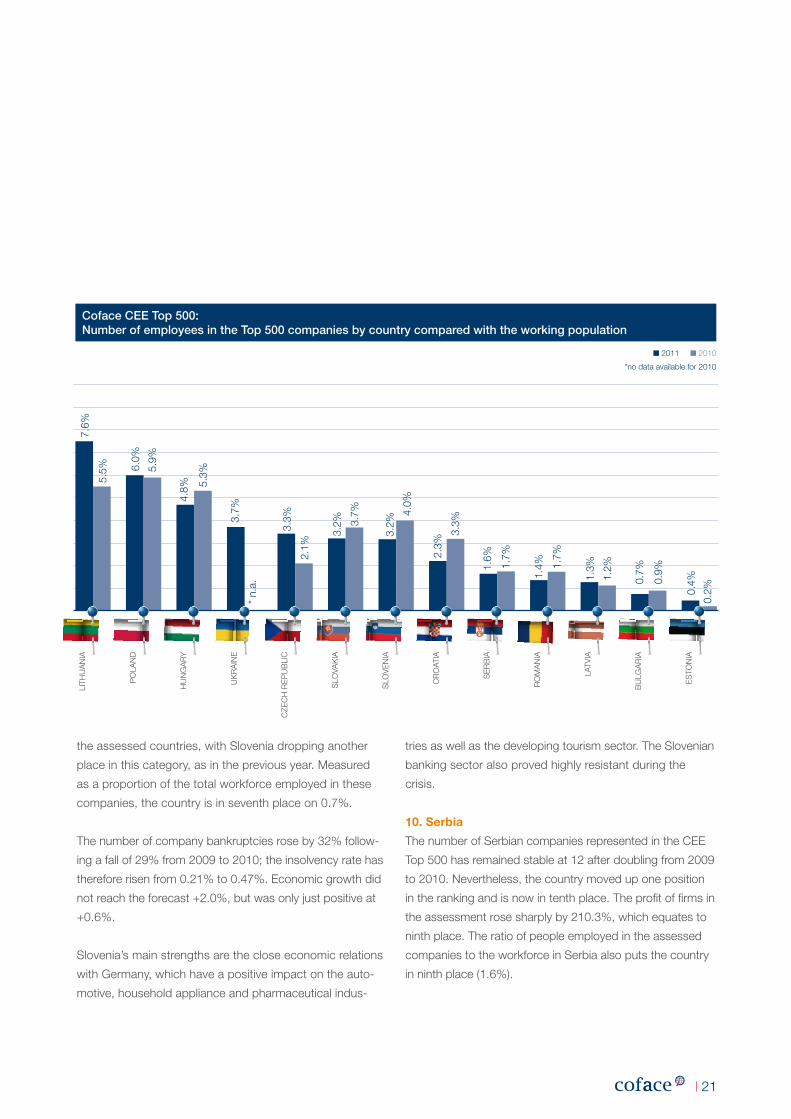
21
the assessed countries, with Slovenia dropping another
place in this category, as in the previous year. measured
as a proportion of the total workforce employed in these
companies, the country is in seventh place on 0.7%.
the number of company bankruptcies rose by 32% follow-
ing a fall of 29% from 2009 to 2010; the insolvency rate has
therefore risen from 0.21% to 0.47%. Economic growth did
not reach the forecast +2.0%, but was only just positive at
+0.6%.
Slovenia’s main strengths are the close economic relations
with Germany, which have a positive impact on the auto-
motive, household appliance and pharmaceutical indus-
tries as well as the developing tourism sector. the Slovenian
banking sector also proved highly resistant during the
crisis.
10. Serbia
the number of Serbian companies represented in the CEE
top 500 has remained stable at 12 after doubling from 2009
to 2010. nevertheless, the country moved up one position
in the ranking and is now in tenth place. the profit of firms in
the assessment rose sharply by 210.3%, which equates to
ninth place. the ratio of people employed in the assessed
companies to the workforce in Serbia also puts the country
in ninth place (1.6%).
■ 2011 ■ 2010
*no data available for 2010
Coface Cee Top 500:Number of employees in the Top 500 companies by country compared with the working population
7.6%
5.5% 6.
0%
5.9%
5.3%
4.8%
3.7%
* n.
a.
3.3%
3.2%
3.2%
4.0
%
2.3%
3.3%
1.7%
1.6%
1.7%
1.3%
1.2%
0.9%
0.7%
0.4%
LItH
UA
nIA
pO
LAn
D
HU
nG
Ar
y
UK
rA
InE
CZE
CH
rE
pU
BLI
C
SLO
VAK
IA
SLO
VE
nIA
Cr
OAt
IA
SE
rB
IA
rO
mA
nIA
LAtV
IA
BU
LGA
rIA
ES
tOn
IA
1.4%
3.7%
2.1%
0.2%
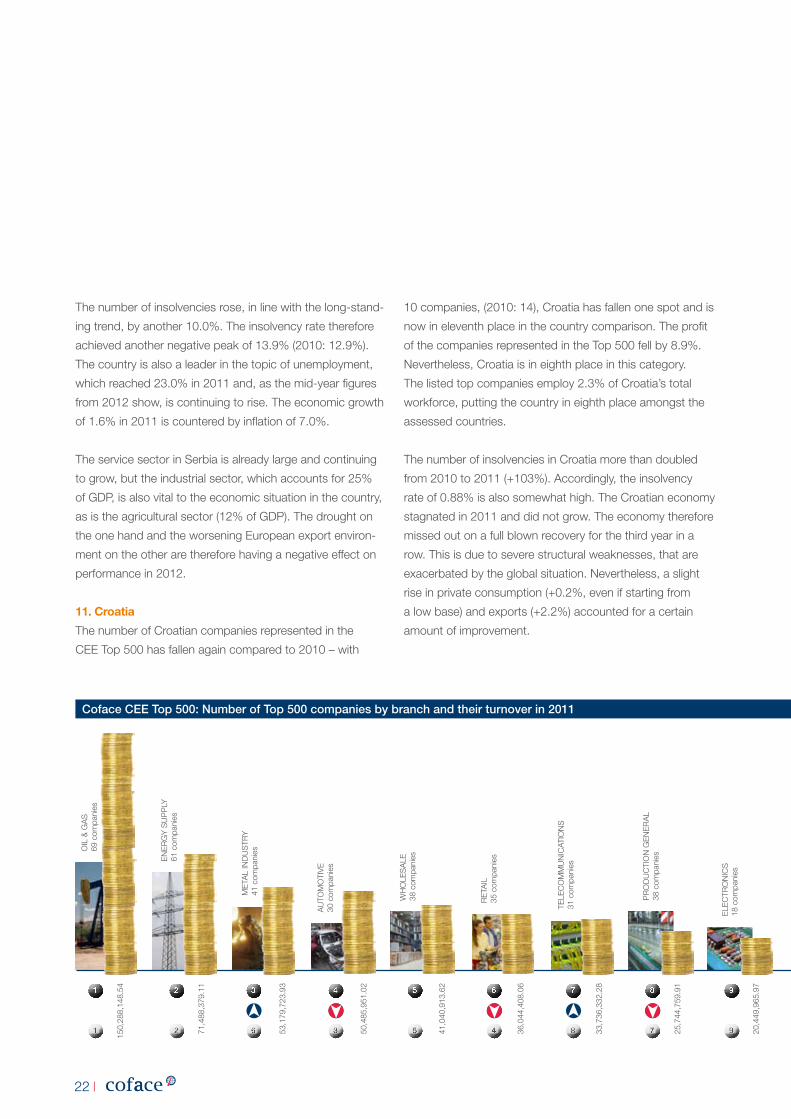
22
the number of insolvencies rose, in line with the long-stand-
ing trend, by another 10.0%. the insolvency rate therefore
achieved another negative peak of 13.9% (2010: 12.9%).
the country is also a leader in the topic of unemployment,
which reached 23.0% in 2011 and, as the mid-year figures
from 2012 show, is continuing to rise. the economic growth
of 1.6% in 2011 is countered by inflation of 7.0%.
the service sector in Serbia is already large and continuing
to grow, but the industrial sector, which accounts for 25%
of GDp, is also vital to the economic situation in the country,
as is the agricultural sector (12% of GDp). the drought on
the one hand and the worsening European export environ-
ment on the other are therefore having a negative effect on
performance in 2012.
11. Croatia
the number of Croatian companies represented in the
CEE top 500 has fallen again compared to 2010 – with
10 companies, (2010: 14), Croatia has fallen one spot and is
now in eleventh place in the country comparison. the profit
of the companies represented in the top 500 fell by 8.9%.
nevertheless, Croatia is in eighth place in this category.
the listed top companies employ 2.3% of Croatia’s total
workforce, putting the country in eighth place amongst the
assessed countries.
the number of insolvencies in Croatia more than doubled
from 2010 to 2011 (+103%). Accordingly, the insolvency
rate of 0.88% is also somewhat high. the Croatian economy
stagnated in 2011 and did not grow. the economy therefore
missed out on a full blown recovery for the third year in a
row. this is due to severe structural weaknesses, that are
exacerbated by the global situation. nevertheless, a slight
rise in private consumption (+0.2%, even if starting from
a low base) and exports (+2.2%) accounted for a certain
amount of improvement.
Coface Cee Top 500: Number of Top 500 companies by branch and their turnover in 2011
150,
288,
148.
54
71,4
88,3
79.1
1
53,1
79,7
23.9
3
50,4
85,9
51.0
2
41,0
40,9
13.6
2
36,0
44,4
08.0
6
33,7
36,3
32.2
8
25,7
44,7
59.9
1
20,4
49,9
65.9
7
20,1
88,8
08.7
8
16,8
87,9
85.1
5
16,0
02,1
79.1
0
11,6
79,9
16.4
4
9,38
9,69
2.27
7,43
7,98
1.69
7,01
7,48
3.25
5,37
4,28
4.81
36,0
61,6
93.8
2
OIL
& G
AS
69
com
pani
es
En
Er
Gy
SU
pp
Ly
61 c
ompa
nies
mE
tAL
InD
US
try
41
com
pani
es
AU
tOm
OtI
VE
30
com
pani
es
WH
OLE
SA
LE
38 c
ompa
nies
tELE
CO
mm
Un
ICAt
IOn
S31
com
pani
es
ELE
Ctr
On
ICS
18
com
pani
es
pr
OD
UC
tIO
n G
En
Er
AL
38 c
ompa
nies
rE
tAIL
35
com
pani
es
6
3
3
4
5
5
4
6
8
7
7
8
9
9
2
2
1
1
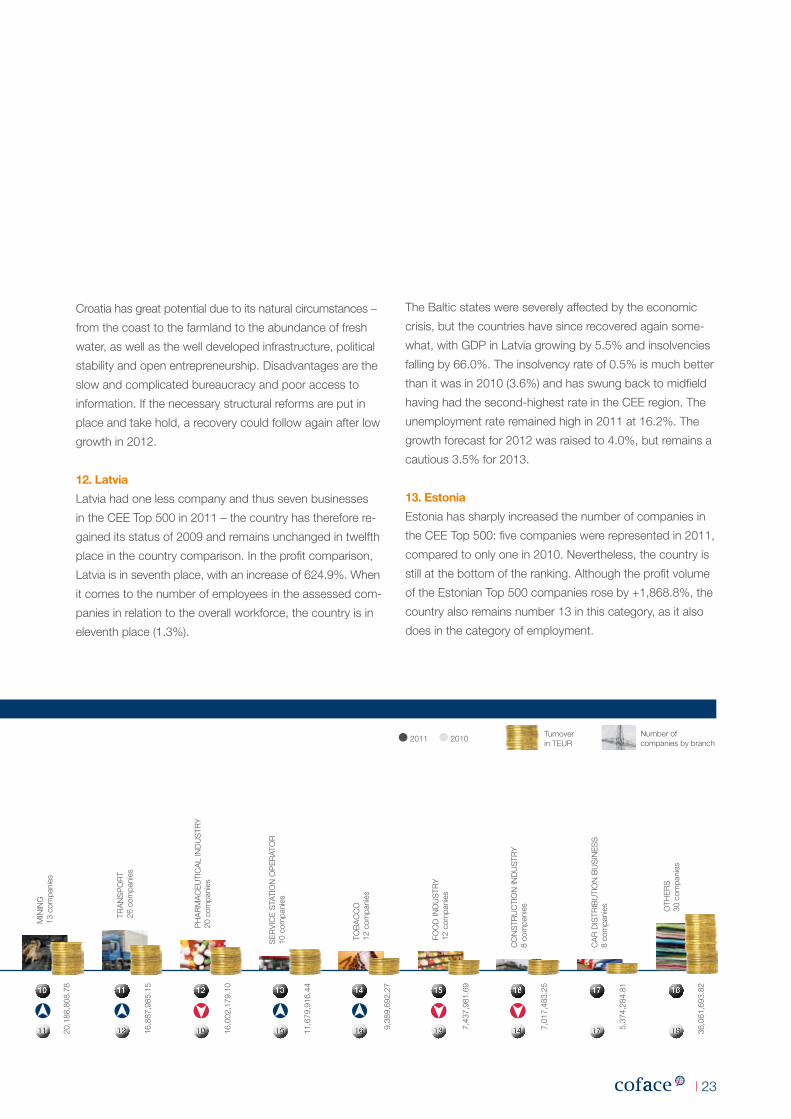
23
Croatia has great potential due to its natural circumstances –
from the coast to the farmland to the abundance of fresh
water, as well as the well developed infrastructure, political
stability and open entrepreneurship. Disadvantages are the
slow and complicated bureaucracy and poor access to
information. If the necessary structural reforms are put in
place and take hold, a recovery could follow again after low
growth in 2012.
12. Latvia
Latvia had one less company and thus seven businesses
in the CEE top 500 in 2011 – the country has therefore re-
gained its status of 2009 and remains unchanged in twelfth
place in the country comparison. In the profit comparison,
Latvia is in seventh place, with an increase of 624.9%. When
it comes to the number of employees in the assessed com-
panies in relation to the overall workforce, the country is in
eleventh place (1.3%).
the Baltic states were severely affected by the economic
crisis, but the countries have since recovered again some-
what, with GDp in Latvia growing by 5.5% and insolvencies
falling by 66.0%. the insolvency rate of 0.5% is much better
than it was in 2010 (3.6%) and has swung back to midfield
having had the second-highest rate in the CEE region. the
unemployment rate remained high in 2011 at 16.2%. the
growth forecast for 2012 was raised to 4.0%, but remains a
cautious 3.5% for 2013.
13. Estonia
Estonia has sharply increased the number of companies in
the CEE top 500: five companies were represented in 2011,
compared to only one in 2010. nevertheless, the country is
still at the bottom of the ranking. Although the profit volume
of the Estonian top 500 companies rose by +1,868.8%, the
country also remains number 13 in this category, as it also
does in the category of employment.
Coface Cee Top 500: Number of Top 500 companies by branch and their turnover in 2011
turnover in tEUr
number of companies by branch
150,
288,
148.
54
71,4
88,3
79.1
1
53,1
79,7
23.9
3
50,4
85,9
51.0
2
41,0
40,9
13.6
2
36,0
44,4
08.0
6
33,7
36,3
32.2
8
25,7
44,7
59.9
1
20,4
49,9
65.9
7
20,1
88,8
08.7
8
16,8
87,9
85.1
5
16,0
02,1
79.1
0
11,6
79,9
16.4
4
9,38
9,69
2.27
7,43
7,98
1.69
7,01
7,48
3.25
5,37
4,28
4.81
36,0
61,6
93.8
2
mIn
InG
13 c
ompa
nies
trA
nS
pO
rt
26 c
ompa
nies
pH
Ar
mA
CE
UtI
CA
L In
DU
Str
y20
com
pani
es
SE
rV
ICE
StA
tIO
n O
pE
rAt
Or
10
com
pani
es
tOB
AC
CO
12 c
ompa
nies
CA
r D
IStr
IBU
tIO
n B
US
InE
SS
8
com
pani
es
FOO
D In
DU
Str
y12
com
pani
es
OtH
Er
S
30 c
ompa
nies
CO
nS
trU
CtI
On
InD
US
try
8
com
pani
es
● 2011 ● 2010
11
10
12
11
10
12
15
13
16
14
13
15
14
16
17
17
18
18
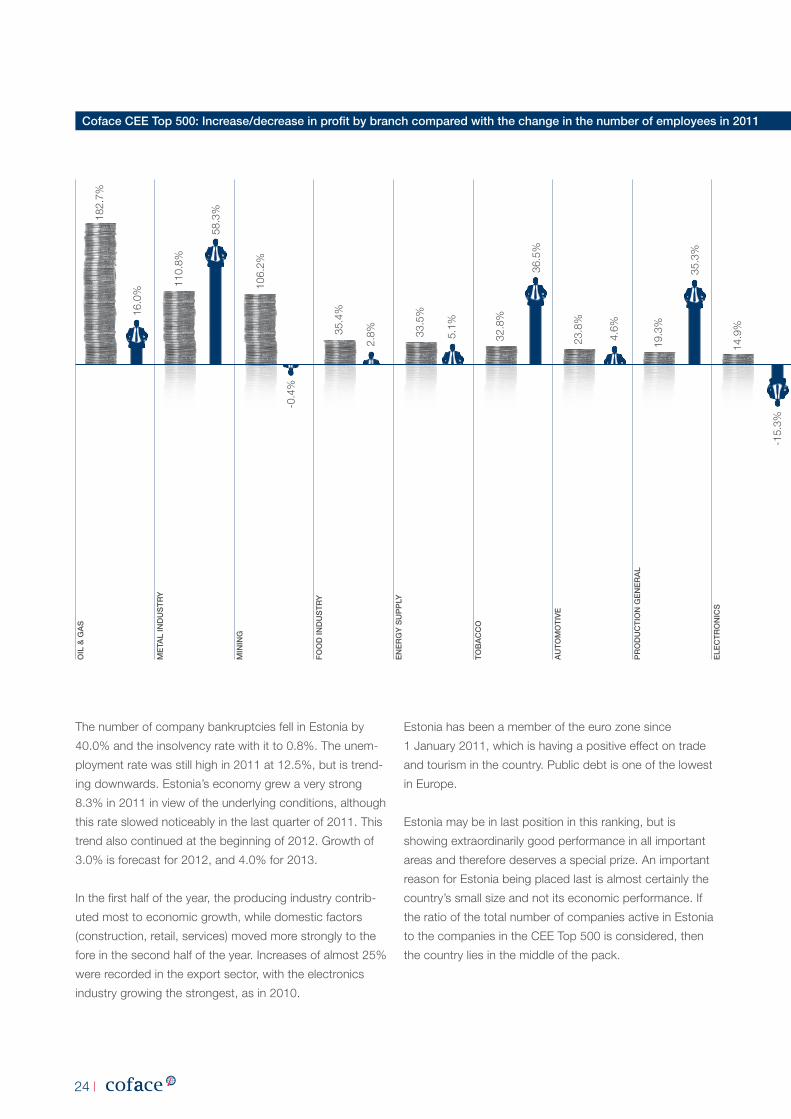
24
Coface Cee Top 500: increase/decrease in profit by branch compared with the change in the number of employees in 2011
the number of company bankruptcies fell in Estonia by
40.0% and the insolvency rate with it to 0.8%. the unem-
ployment rate was still high in 2011 at 12.5%, but is trend-
ing downwards. Estonia’s economy grew a very strong
8.3% in 2011 in view of the underlying conditions, although
this rate slowed noticeably in the last quarter of 2011. this
trend also continued at the beginning of 2012. Growth of
3.0% is forecast for 2012, and 4.0% for 2013.
In the first half of the year, the producing industry contrib-
uted most to economic growth, while domestic factors
(construction, retail, services) moved more strongly to the
fore in the second half of the year. Increases of almost 25%
were recorded in the export sector, with the electronics
industry growing the strongest, as in 2010.
Estonia has been a member of the euro zone since
1 January 2011, which is having a positive effect on trade
and tourism in the country. public debt is one of the lowest
in Europe.
Estonia may be in last position in this ranking, but is
showing extraordinarily good performance in all important
areas and therefore deserves a special prize. An important
reason for Estonia being placed last is almost certainly the
country’s small size and not its economic performance. If
the ratio of the total number of companies active in Estonia
to the companies in the CEE top 500 is considered, then
the country lies in the middle of the pack.
oil
& g
aS
me
Tal
iNd
uS
TR
y
miN
iNg
fo
od
iNd
uS
TR
y
eN
eR
gy
Su
pp
ly
To
ba
CC
o
au
To
mo
Tiv
e
pR
od
uC
Tio
N g
eN
eR
al
ele
CT
Ro
NiC
S
Ca
R d
iST
Rib
uT
ioN
bu
SiN
eS
S
Co
NS
TR
uC
Tio
N iN
du
ST
Ry
ph
aR
ma
Ce
uT
iCa
l iN
du
ST
Ry
wh
ole
Sa
le
Re
Tail
Te
leC
om
mu
NiC
aTio
NS
TR
aN
Sp
oR
T
Se
Rv
iCe
STa
Tio
N o
pe
RaT
oR
oT
he
RS
36.5
%
4.6%
5.1%
2.8%
-0.4
%
110.
8%
182.
7%
16.0
%
58.3
%
106.
2%
23.8
%
19.3
%
35.4
%
33.5
%
32.8
%
35.3
%
14.9
%
-15.
3%
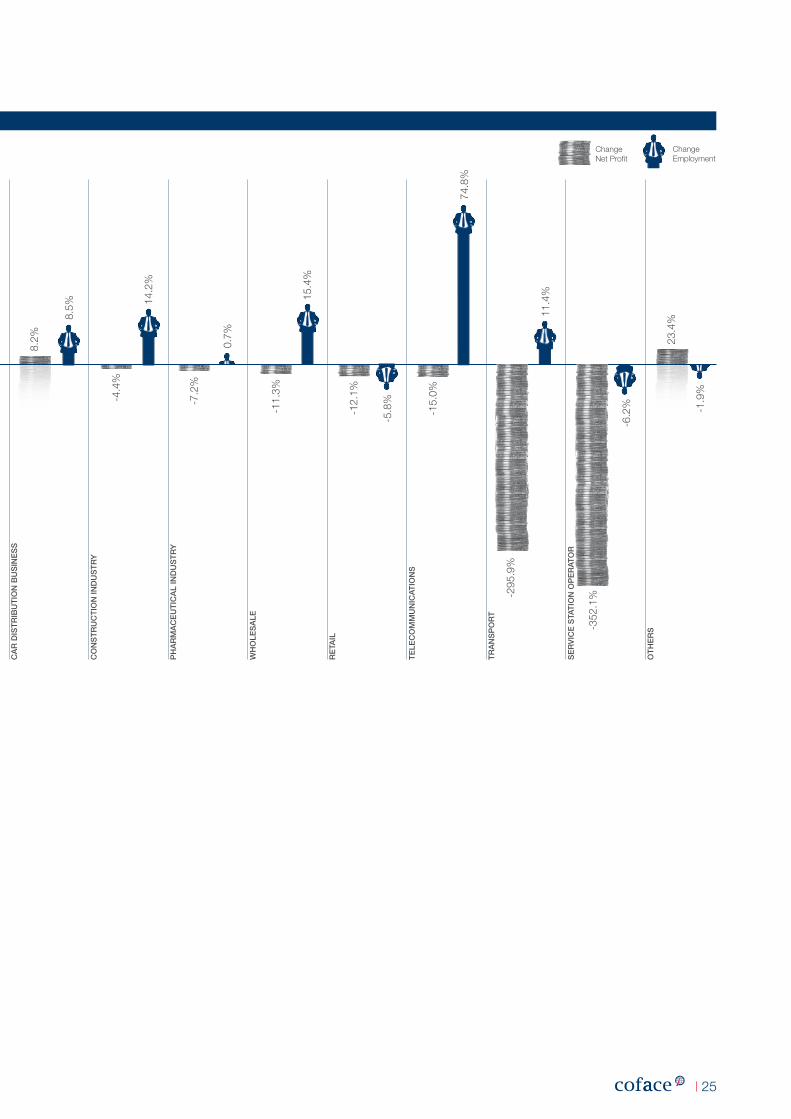
25
Coface Cee Top 500: increase/decrease in profit by branch compared with the change in the number of employees in 2011
Change net profit
Change Employment
oil
& g
aS
me
Tal
iNd
uS
TR
y
miN
iNg
fo
od
iNd
uS
TR
y
eN
eR
gy
Su
pp
ly
To
ba
CC
o
au
To
mo
Tiv
e
pR
od
uC
Tio
N g
eN
eR
al
ele
CT
Ro
NiC
S
Ca
R d
iST
Rib
uT
ioN
bu
SiN
eS
S
Co
NS
TR
uC
Tio
N iN
du
ST
Ry
ph
aR
ma
Ce
uT
iCa
l iN
du
ST
Ry
wh
ole
Sa
le
Re
Tail
Te
leC
om
mu
NiC
aTio
NS
TR
aN
Sp
oR
T
Se
Rv
iCe
STa
Tio
N o
pe
RaT
oR
oT
he
RS
-6.2
%
11.4
%
74.8
%
23.4
%8.5% 14
.2%
0.7%
15.4
%
8.2%
-5.8
%
-1.9
%
-15.
0%
-12.
1%-4.4
%
-7.2
%
-11.
3%
-295
.9%
-352
.1%
26
Coface Austria & Coface Central Europe Stubenring 24, 1010 Vienna t. +43 (1) 515 54-0, F. +43 (1) 512 44 15 www.coface.at
Coface Albania Avenija Dubrovnik 46/III, 10000 Zagrebis serviced by Coface Croatia t. +385 (1) 469 75 00, F. +385 (1) 469 75 35 www.coface.hr
Coface Belarus 1st tverskaya-yamskaya str., 23, bld. 1, 125047 moscowis serviced by Coface russia t +7 (495) 785 57 10, F +7 (495) 785 76 24 www.coface.ru
Coface Bosnia & Herzegovina Avenija Dubrovnik 46/III, 10000 Zagrebis serviced by Coface Croatia t. +385 (1) 469 75 00, F. +385 (1) 469 75 35 www.coface.hr
Coface Bulgaria 85/87, todor Aleksandrov boul.,1303 Sofia t. +359 (2) 920 71 25, F. +359 (2) 920 71 50 www.coface.bg
Coface Croatia Avenija Dubrovnik 46/III, 10000 Zagreb t. +385 (1) 469 75 00, F. +385 (1) 469 75 35 www.coface.hr
Coface Czech I.p. pavlova 5, 120 00 prague t. +420 (2) 460 85 411, F. +420 (2) 460 85 429 www.coface.cz
Coface Estonia Berzaunes iela 11 a, 1039 riga is serviced by Coface Latvia t. +371 (6) 732 34 60, F. +371 (6) 782 03 80 www.coface.lv
Coface Hungary tüzoltó utca 57, 1094 Budapest t. +36 (1) 299 20 70, F. +36 (1) 887 03 25 www.coface.hu
Coface Latvia Berzaunes iela 11 a, 1039 riga t. +371 (6) 732 34 60, F. +371 (6) 782 03 80 www.coface.lv
Coface Contacts
27
Coface Lithuania Vilniaus str. 23, 01119 Vilnius t. +370 (5) 279 17 27, F. +370 (5) 279 17 54 www.coface.lt
Coface macedonia Avenija Dubrovnik 46/III, 10000 Zagrebis serviced by Coface Croatia t. +385 (1) 469 75 00, F. +385 (1) 469 75 35 www.coface.hr
Coface moldavia Calea Floreasca 39, Et. 2-4, Sector 1, 014453 Bucharestis serviced by Coface romania t. +40 (21) 231 60 20, F. +40 (21) 231 60 22 www.coface.ro
Coface montenegro Bulevar Oslobodjenja 111, 11000 Belgradeis serviced by Coface Serbia t. +381 (11) 397 60 51, F. +381 (11) 397 09 75 www.coface.rs Coface poland Al. Jerozolimskie 136, 02305 Warsaw t. +48 (22) 465 00 00, F. +48 (22) 465 00 55 www.coface.pl
Coface romania Calea Floreasca 39, Et. 2-4, Sector 1, 014453 Bucharest t. +40 (21) 231 60 20, F. +40 (21) 231 60 22 www.coface.ro
Coface Serbia Bulevar Oslobodjenja 111, 11000 Belgrade t. +381 (11) 397 60 51, F. +381 (11) 397 09 75 www.coface.rs
Coface Slovakia Soltésovej 14, 81108 Bratislava t. +421 (2) 67 20 16 16, F. +421 (2) 62 41 03 59 www.coface.sk
Coface Slovenia Cankarjeva 3, 1000 Ljubljana t. +386 (1) 425 90 65, F. +386 (1) 425 91 30 www.coface.si
Coface Ukraine Chernovola str. 20, of 106, 01135 Kiev t. +380 (44) 585 31 60, F. +380 (44) 585 31 60 www.coface.ua

your trade risks, under control.
Coface austria & Coface Central europe www.coface.at www.cofacecentraleurope.com