Embed Size (px)
Citation preview
COFACE ECONOMIC PUBLICATIONS
SEPTEMBER 2017
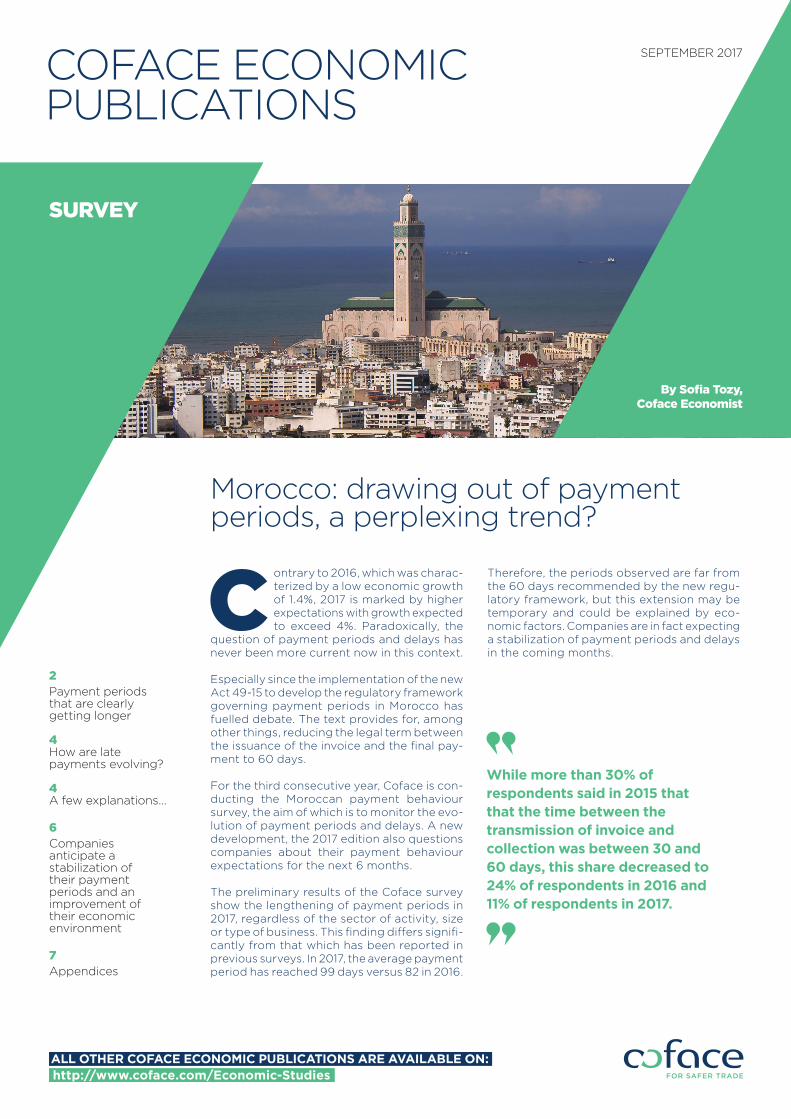
Morocco: drawing out of payment periods, a perplexing trend?
2Payment periods that are clearly getting longer
4 How are late payments evolving?
4 A few explanations...
6Companies anticipate a stabilization of their payment periods and an improvement of their economic environment
7Appendices
By Sofia Tozy, Coface Economist
C ontrary to 2016, which was charac-terized by a low economic growth of 1.4%, 2017 is marked by higher expectations with growth expected to exceed 4%. Paradoxically, the
question of payment periods and delays has never been more current now in this context.
Especially since the implementation of the new Act 49-15 to develop the regulatory framework governing payment periods in Morocco has fuelled debate. The text provides for, among other things, reducing the legal term between the issuance of the invoice and the final pay-ment to 60 days.
For the third consecutive year, Coface is con-ducting the Moroccan payment behaviour survey, the aim of which is to monitor the evo-lution of payment periods and delays. A new development, the 2017 edition also questions companies about their payment behaviour expectations for the next 6 months.
The preliminary results of the Coface survey show the lengthening of payment periods in 2017, regardless of the sector of activity, size or type of business. This finding differs signifi-cantly from that which has been reported in previous surveys. In 2017, the average payment period has reached 99 days versus 82 in 2016.
Therefore, the periods observed are far from the 60 days recommended by the new regu-latory framework, but this extension may be temporary and could be explained by eco-nomic factors. Companies are in fact expecting a stabilization of payment periods and delays in the coming months.
http://www.coface.com/Economic-Studies
SURVEY
While more than 30% ofrespondents said in 2015 thatthat the time between the transmission of invoice and collection was between 30 and 60 days, this share decreased to 24% of respondents in 2016 and11% of respondents in 2017.
ALL OTHER COFACE ECONOMIC PUBLICATIONS ARE AVAILABLE ON:
2 COFACE ECONOMIC PUBLICATIONS MOROCCO PAYMENT PERIODS SEPTEMBER 2017
SURVEY
In the first section, we questioned compa-nies about the average payment period they face with respect to their business. While more than 30% of the respondents in 2015 stated that it took between 30
and 60 days between the issuance of the invoice and the collection of payment, we note that this percentage decreased to 24% of the respondents in 2016 and 11% of the respondents in 2017. Companies that reported payment periods of more than 120 days have increased significantly, while the proportion of companies with customer delays between 90 and 120 days remained stable. On average, payment periods were 66 days in 2015, 82 days in 2016 and 99 days in 2017.
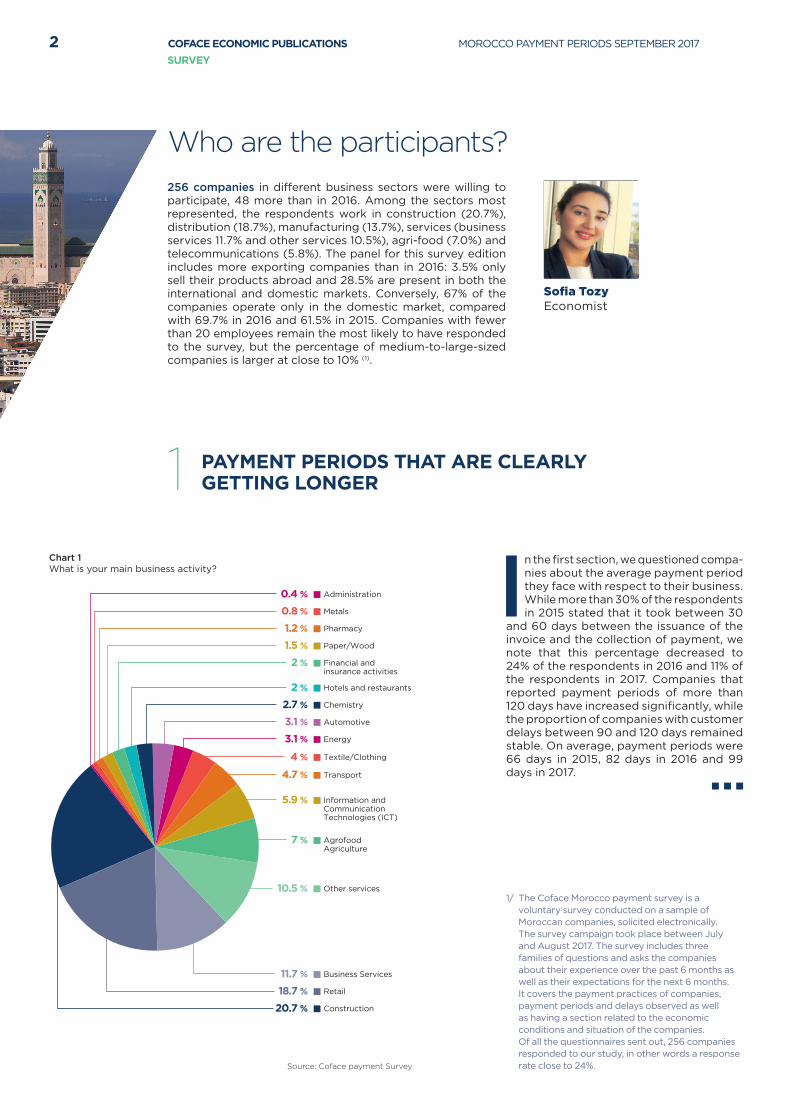
256 companies in different business sectors were willing to participate, 48 more than in 2016. Among the sectors most represented, the respondents work in construction (20.7%), distribution (18.7%), manufacturing (13.7%), services (business services 11.7% and other services 10.5%), agri-food (7.0%) and telecommunications (5.8%). The panel for this survey edition includes more exporting companies than in 2016: 3.5% only sell their products abroad and 28.5% are present in both the international and domestic markets. Conversely, 67% of the companies operate only in the domestic market, compared with 69.7% in 2016 and 61.5% in 2015. Companies with fewer than 20 employees remain the most likely to have responded to the survey, but the percentage of medium-to-large-sized companies is larger at close to 10% (1).
PAYMENT PERIODS THAT ARE CLEARLY GETTING LONGER1
Who are the participants?
1/ The Coface Morocco payment survey is a voluntary survey conducted on a sample of Moroccan companies, solicited electronically. The survey campaign took place between July and August 2017. The survey includes three families of questions and asks the companies about their experience over the past 6 months as well as their expectations for the next 6 months. It covers the payment practices of companies, payment periods and delays observed as well as having a section related to the economic conditions and situation of the companies. Of all the questionnaires sent out, 256 companies responded to our study, in other words a response rate close to 24%.
Sofia TozyEconomist
Chart 1What is your main business activity?
Source: Coface payment Survey
Administration 0.4 %Metals0.8 %Pharmacy1.2 %Paper/Wood 1.5 %Financial and insurance activities
2 %
Hotels and restaurants2 %Chemistry2.7 %Automotive3.1 %Energy3.1 %
Textile/Clothing4 %Transport4.7 %
AgrofoodAgriculture
7 %
Information and Communication Technologies (ICT)
5.9 %
Other services10.5 %
Business Services11.7 %Retail18.7 %Construction20.7 %
3COFACE ECONOMIC PUBLICATIONS MOROCCO PAYMENT PERIODS SEPTEMBER 2017
SURVEY
2/ The different surveys conducted by Coface in Morocco as well as in other countries (Asia, Poland, Germany and UAE) revealed that some business sectors, due to constraints specific to the nature of the sector or type of product, generally observe longer payment periods (construction) whereas others observe relatively short payment periods (services).
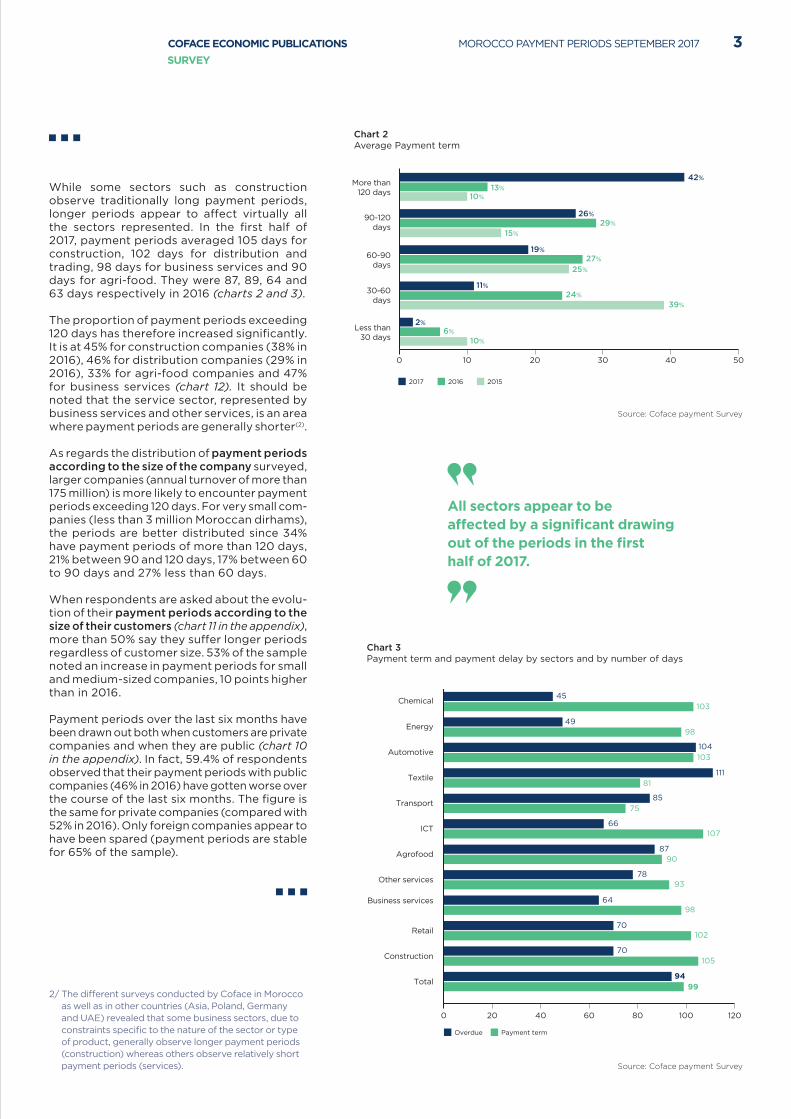
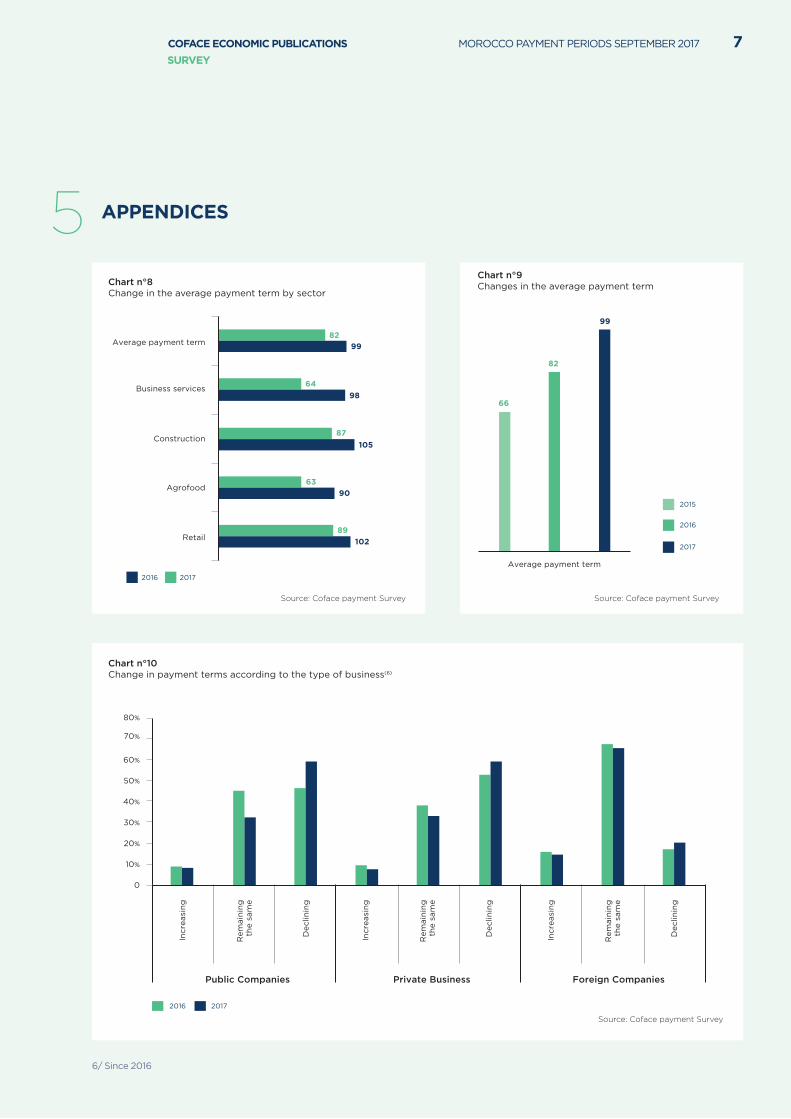
While some sectors such as construction observe traditionally long payment periods, longer periods appear to affect virtually all the sectors represented. In the first half of 2017, payment periods averaged 105 days for construction, 102 days for distribution and trading, 98 days for business services and 90 days for agri-food. They were 87, 89, 64 and 63 days respectively in 2016 (charts 2 and 3).
The proportion of payment periods exceeding 120 days has therefore increased significantly. It is at 45% for construction companies (38% in 2016), 46% for distribution companies (29% in 2016), 33% for agri-food companies and 47% for business services (chart 12). It should be noted that the service sector, represented by business services and other services, is an area where payment periods are generally shorter(2).
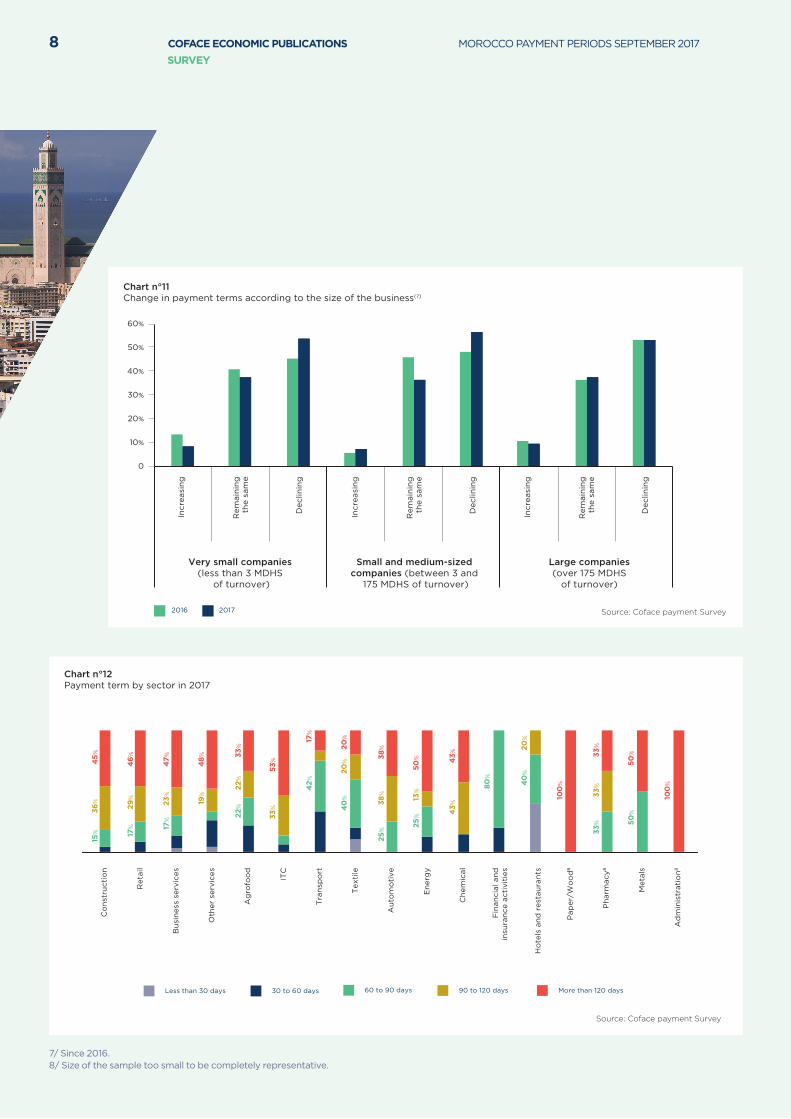
As regards the distribution of payment periods according to the size of the company surveyed, larger companies (annual turnover of more than 175 million) is more likely to encounter payment periods exceeding 120 days. For very small com-panies (less than 3 million Moroccan dirhams), the periods are better distributed since 34% have payment periods of more than 120 days, 21% between 90 and 120 days, 17% between 60 to 90 days and 27% less than 60 days.
When respondents are asked about the evolu-tion of their payment periods according to the size of their customers (chart 11 in the appendix), more than 50% say they suffer longer periods regardless of customer size. 53% of the sample noted an increase in payment periods for small and medium-sized companies, 10 points higher than in 2016.
Payment periods over the last six months have been drawn out both when customers are private companies and when they are public (chart 10 in the appendix). In fact, 59.4% of respondents observed that their payment periods with public companies (46% in 2016) have gotten worse over the course of the last six months. The figure is the same for private companies (compared with 52% in 2016). Only foreign companies appear to have been spared (payment periods are stable for 65% of the sample).
Chart 2Average Payment term
Chart 3Payment term and payment delay by sectors and by number of days
Source: Coface payment Survey
13%
29%
27%
24%
6%
10%
15%
25%
39%
10%
42%
26%
19%
11%
2%
More than120 days
90-120days
60-90days
30-60days
Less than30 days
2017 2016 2015
0 10 20 30 40 50
Chemical
Energy
Automotive
Textile
Transport
ICT
Agrofood
Other services
Business services
Retail
Construction
Total
103
98
103
81
75
107
90
93
98
102
105
99
45
49
104
111
85
66
87
78
64
70
70
94
Overdue Payment term
0 20 40 60 80 100 120
Source: Coface payment Survey
All sectors appear to be affected by a significant drawing out of the periods in the first half of 2017.
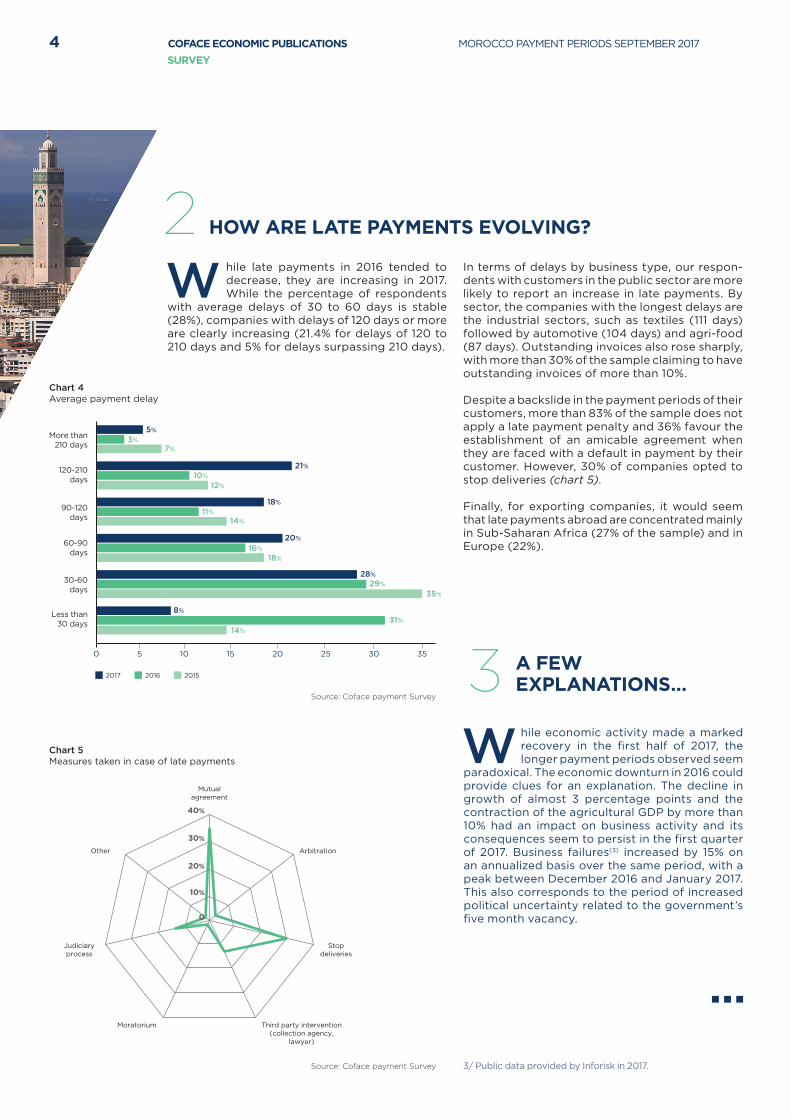
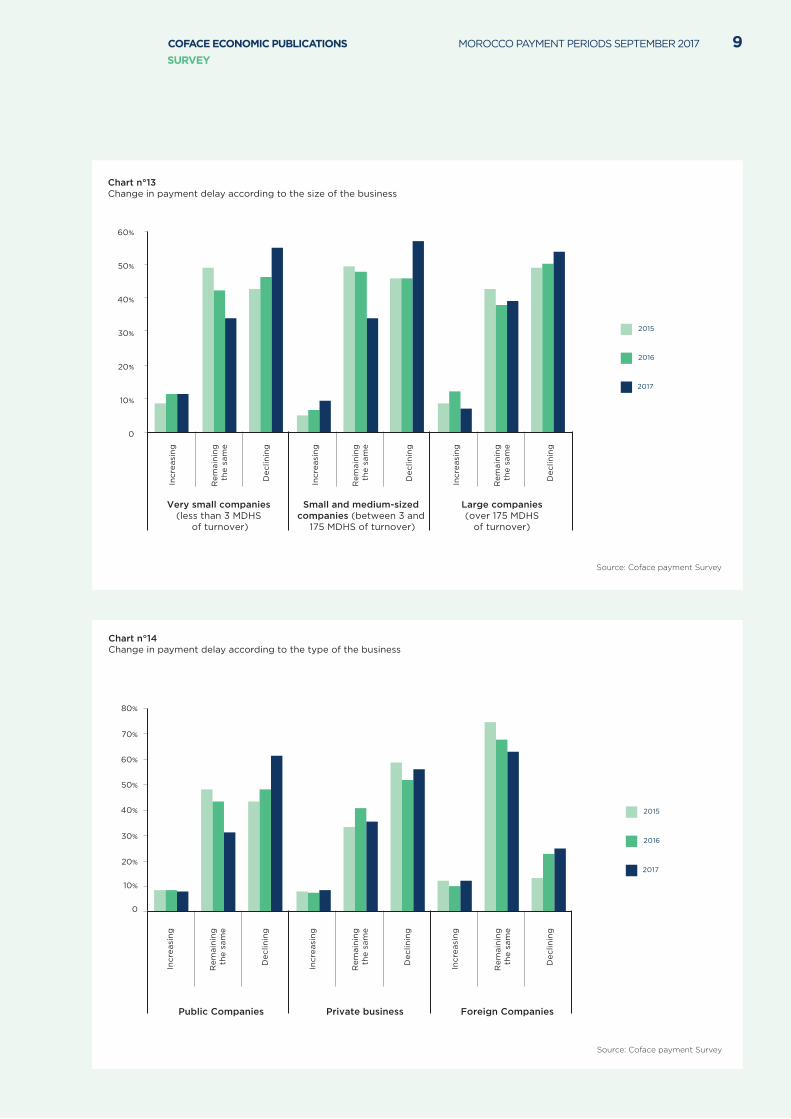
W hile late payments in 2016 tended to decrease, they are increasing in 2017. While the percentage of respondents
with average delays of 30 to 60 days is stable (28%), companies with delays of 120 days or more are clearly increasing (21.4% for delays of 120 to 210 days and 5% for delays surpassing 210 days).
W hile economic activity made a marked recovery in the first half of 2017, the longer payment periods observed seem
paradoxical. The economic downturn in 2016 could provide clues for an explanation. The decline in growth of almost 3 percentage points and the contraction of the agricultural GDP by more than 10% had an impact on business activity and its consequences seem to persist in the first quarter of 2017. Business failures(3) increased by 15% on an annualized basis over the same period, with a peak between December 2016 and January 2017. This also corresponds to the period of increased political uncertainty related to the government’s five month vacancy.
HOW ARE LATE PAYMENTS EVOLVING? 2
A FEW EXPLANATIONS…3
3/ Public data provided by Inforisk in 2017.
In terms of delays by business type, our respon-dents with customers in the public sector are more likely to report an increase in late payments. By sector, the companies with the longest delays are the industrial sectors, such as textiles (111 days) followed by automotive (104 days) and agri-food (87 days). Outstanding invoices also rose sharply, with more than 30% of the sample claiming to have outstanding invoices of more than 10%.
Despite a backslide in the payment periods of their customers, more than 83% of the sample does not apply a late payment penalty and 36% favour the establishment of an amicable agreement when they are faced with a default in payment by their customer. However, 30% of companies opted to stop deliveries (chart 5).
Finally, for exporting companies, it would seem that late payments abroad are concentrated mainly in Sub-Saharan Africa (27% of the sample) and in Europe (22%).
4 COFACE ECONOMIC PUBLICATIONS MOROCCO PAYMENT PERIODS SEPTEMBER 2017
SURVEY
Chart 4Average payment delay
Chart 5Measures taken in case of late payments
Source: Coface payment Survey
Source: Coface payment Survey
3%7%
10%12%
11%14%
16%18%
29%35%
31%
14%
5%
21%
18%
20%
28%
8%
More than210 days
120-210days
90-120days
60-90days
30-60days
Less than30 days
2017 2016 2015
0 355 10 15 20 25 30
Mutualagreement
ArbitrationOther
Stop deliveries
Third party intervention (collection agency,
lawyer)
Moratorium
Judiciaryprocess
0
10%
20%
30%
40%
5
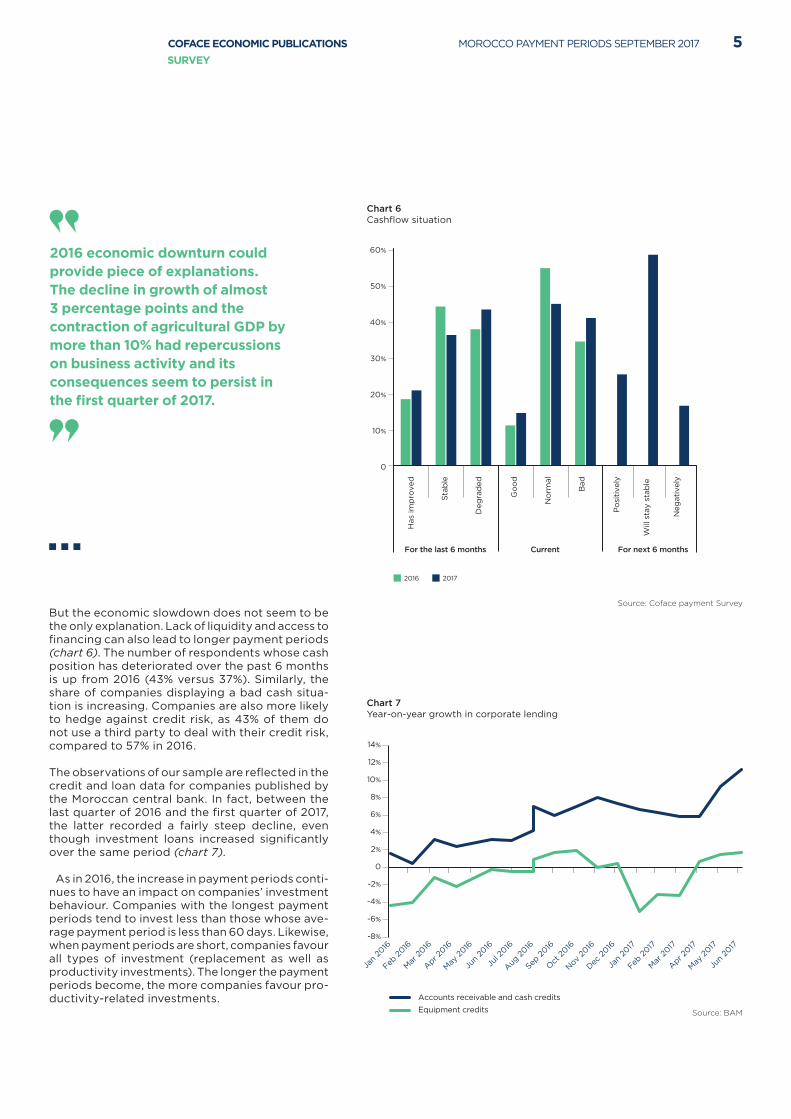
But the economic slowdown does not seem to be the only explanation. Lack of liquidity and access to financing can also lead to longer payment periods (chart 6). The number of respondents whose cash position has deteriorated over the past 6 months is up from 2016 (43% versus 37%). Similarly, the share of companies displaying a bad cash situa-tion is increasing. Companies are also more likely to hedge against credit risk, as 43% of them do not use a third party to deal with their credit risk, compared to 57% in 2016.
The observations of our sample are reflected in the credit and loan data for companies published by the Moroccan central bank. In fact, between the last quarter of 2016 and the first quarter of 2017, the latter recorded a fairly steep decline, even though investment loans increased significantly over the same period (chart 7).
As in 2016, the increase in payment periods conti-nues to have an impact on companies’ investment behaviour. Companies with the longest payment periods tend to invest less than those whose ave-rage payment period is less than 60 days. Likewise, when payment periods are short, companies favour all types of investment (replacement as well as productivity investments). The longer the payment periods become, the more companies favour pro-ductivity-related investments.
COFACE ECONOMIC PUBLICATIONS MOROCCO PAYMENT PERIODS SEPTEMBER 2017
SURVEY
Chart 6Cashflow situation
Chart 7Year-on-year growth in corporate lending
Has
imp
rove
d
Sta
ble
Deg
rad
ed
For the last 6 months Current For next 6 months
Go
od
No
rmal
Bad
Po
siti
vely
Will
sta
y st
able
Neg
ativ
ely
2016 2017
0
10%
20%
30%
40%
50%
60%
14%
12%
10%
8%
6%
4%
2%
0
-2%
-4%
-6%
-8%
Jan
2016
Feb 2
016
Mar 2
016
Apr 2016
May 2
016
Jun
2016
Jul 2
016
Aug 2
016
Sep 2
016
Oct 2
016
Nov 20
16
Dec 2
016
Jan
2017
Feb 2
017
Mar 2
017
Apr 2017
May 2
017
Jun
2017
Equipment credits
Accounts receivable and cash credits
Source: Coface payment Survey
Source: BAM
2016 economic downturn could provide piece of explanations. The decline in growth of almost 3 percentage points and the contraction of agricultural GDP by more than 10% had repercussions on business activity and its consequences seem to persist in the first quarter of 2017.
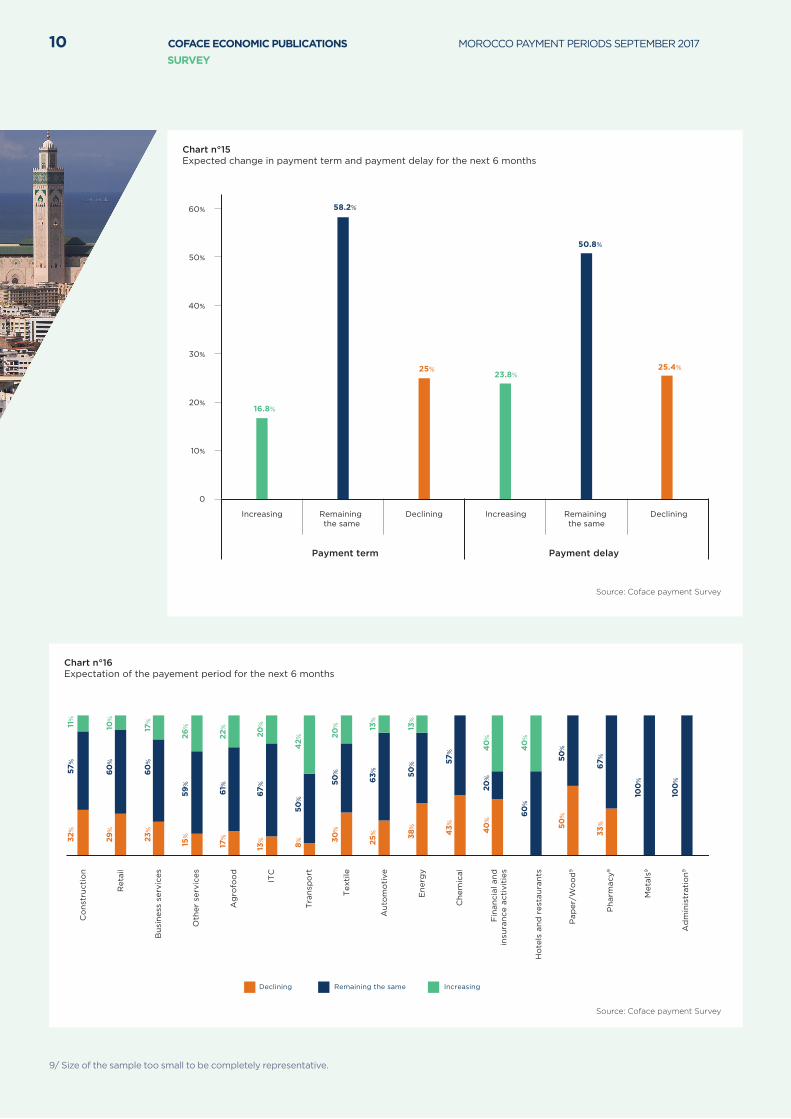
In the 2017 edition, we introduced new ques-tions concerning the companies’ expectations related to payment behaviour(4). The latter shows that despite the longer payment peri-ods over the past 6 months, companies do not expect a further backslide.
In fact, more than 50% of our respondents expect the stabilization of payment behaviour and only a quarter anticipate a deterioration over the same period. Only 23.8% expected improvement in delays and 16% expected to improve payment periods (chart 15 in the Appendix). The most optimistic companies, those that anticipate an improvement in payment periods, are those in the chemical and energy sectors. The same can be said for construc-tion and distribution (chart 16 in the Appendix).
Even if they were to stabilize, the average payment periods observed in both 2016 and 2017 remain far from the limits that should be applied in the frame-work of Act 49-15(5) to establish payment practices and the implementation of which is expected by the end of 2017.
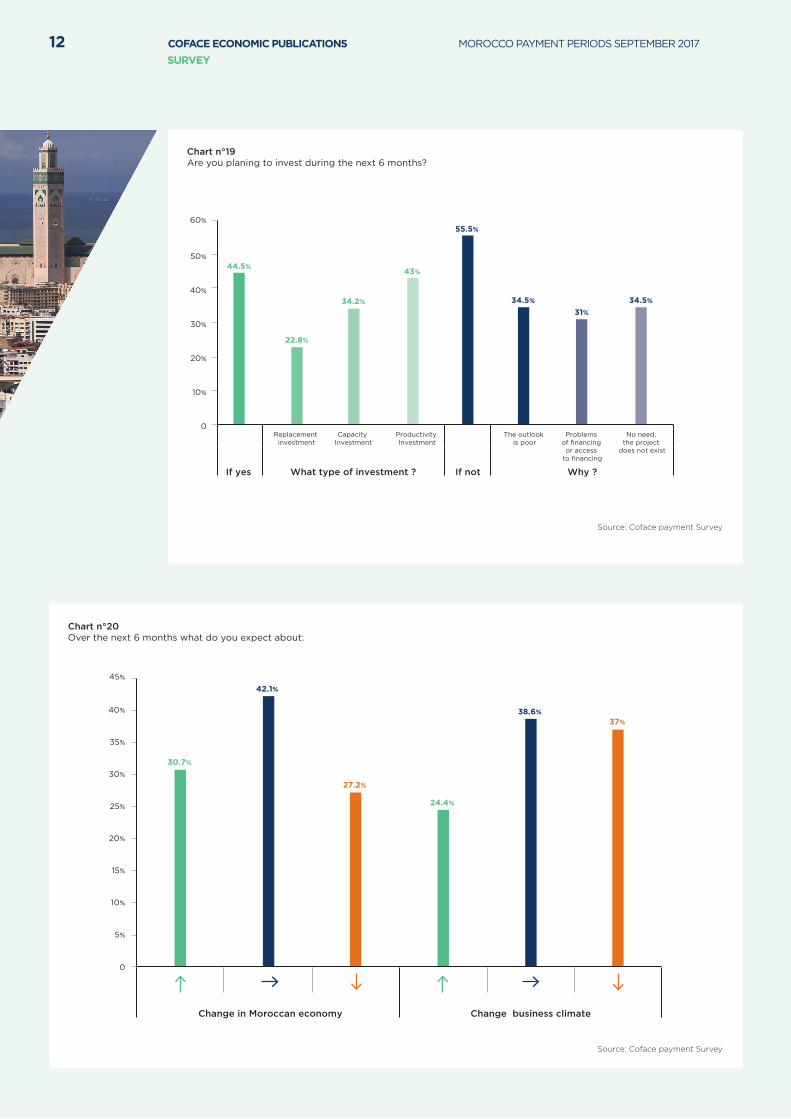
In terms of activity, the results are more encour-aging. While 35% observed a rise or a stagnation of their sales over the last six months, almost 47% anticipate an increase in their total sales volume over the next six months. 56% expect their sales prices to stabilize.
COMPANIES ANTICIPATE A STABILIZATION OF THEIR PAYMENT PERIODS AND AN IMPROVEMENT OF THEIR ECONOMIC ENVIRONMENT
4
4/ In addition to those concerning their economic expectations. 5/ It replaces the original 2011 text (Act 32-10) and is expected to finalize the regulatory framework for the settlement of
transactions. Articles 78-1 and 78-2 of the Commercial Codelarify the conditions governing the settlement of commercial transactions. When the payment period is not defined by both contracting parties, the statutory period is 60 days.
55% do not expect investment to increase for the next six months, 44.5% plan to invest, and more than 40% of investors are considering productivity investment. Regarding the number of employees, more than half of the respondents are considering stagnating their payroll, and despite the longer payment periods, 53% said that their workforce remained constant over the six last months.
Finally, while they remain pessimistic about the changing business climate, despite the introduc-tion of a new regulatory framework concerning payment practices, they are relatively positive with respect to the economic conditions in the coming months. In fact, 30% expect an improvement in the economic situation and 42% anticipate the situation to remain the same without change.
6 COFACE ECONOMIC PUBLICATIONS MOROCCO PAYMENT PERIODS SEPTEMBER 2017
SURVEY
Even if they were to stabilize, the average payment periods observed in both 2016 and 2017 remain far from the limits that should be applied in the frame work of Act 49-15.
6/ Since 2016
7
APPENDICES5
82
64
87
63
89
99
98
105
90
102
2016 2017
Average payment term
Business services
Construction
Agrofood
Retail
6666
82
99
Average payment term
2015
2016
2017
Chart n°8 Change in the average payment term by sector
Chart n°9 Changes in the average payment term
Source: Coface payment Survey Source: Coface payment Survey
0
10%
20%
30%
40%
50%
60%
70%
80%
Incr
easi
ng
Rem
ain
ing
the
sam
e
Dec
linin
g
Incr
easi
ng
Rem
ain
ing
the
sam
e
Dec
linin
g
Incr
easi
ng
Rem
ain
ing
the
sam
e
Dec
linin
g
Public Companies Private Business Foreign Companies
2016 2017
Chart n°10 Change in payment terms according to the type of business(6)
Source: Coface payment Survey
COFACE ECONOMIC PUBLICATIONS MOROCCO PAYMENT PERIODS SEPTEMBER 2017
SURVEY
8
Incr
easi
ng
Rem
ain
ing
the
sam
e
Dec
linin
g
Incr
easi
ng
Rem
ain
ing
the
sam
e
Dec
linin
g
Incr
easi
ng
Rem
ain
ing
the
sam
e
Dec
linin
g
Very small companies (less than 3 MDHS
of turnover)
Small and medium-sized companies (between 3 and
175 MDHS of turnover)
Large companies(over 175 MDHS
of turnover)
0
10%
20%
30%
40%
50%
60%
2016 2017
Chart n°11 Change in payment terms according to the size of the business(7)
Co
nst
ruct
ion
Ret
ail
Bu
sin
ess
serv
ices
Oth
er s
ervi
ces
Ag
rofo
od
ITC
Tra
nsp
ort
Tex
tile
Au
tom
oti
ve
En
erg
y
Ch
emic
al
Fin
anci
al a
nd
insu
ran
ce a
ctiv
itie
s
Ho
tels
an
d r
esta
ura
nts
Pap
er/W
oo
d8
Ph
arm
acy8
Met
als
Ad
min
istr
atio
n8
Less than 30 days 30 to 60 days 60 to 90 days 90 to 120 days More than 120 days
15% 17
%
36%
29%
45%
46%
17%
23%
47%
22%
22%
33%
40
%20
%20
%
25%
38%
38%
25%
80%
13%
40
%20
%
33%
33%
33%
50%
50%
50%
43%
43%
100
%
100
%42%
17%
33%
53%
19%
48%
Chart n°12 Payment term by sector in 2017
7/ Since 2016.8/ Size of the sample too small to be completely representative.
Source: Coface payment Survey
Source: Coface payment Survey
COFACE ECONOMIC PUBLICATIONS MOROCCO PAYMENT PERIODS SEPTEMBER 2017
SURVEY
9
Chart n°13 Change in payment delay according to the size of the business
Incr
easi
ng
Rem
ain
ing
the
sam
e
Rem
ain
ing
the
sam
e
Rem
ain
ing
the
sam
e
Dec
linin
g
Incr
easi
ng
Dec
linin
g
Incr
easi
ng
Dec
linin
g
2016
2015
2017
0
10%
20%
30%
40%
50%
60%
Very small companies (less than 3 MDHS
of turnover)
Small and medium-sized companies (between 3 and
175 MDHS of turnover)
Large companies (over 175 MDHS
of turnover)
Incr
easi
ng
Rem
ain
ing
the
sam
e
Dec
linin
g
Incr
easi
ng
Rem
ain
ing
the
sam
e
Dec
linin
g
Incr
easi
ng
Rem
ain
ing
the
sam
e
Dec
linin
g
2016
2015
2017
0
10%
20%
30%
40%
50%
60%
70%
80%
Public Companies Private business Foreign Companies
Chart n°14 Change in payment delay according to the type of the business
Source: Coface payment Survey
Source: Coface payment Survey
COFACE ECONOMIC PUBLICATIONS MOROCCO PAYMENT PERIODS SEPTEMBER 2017
SURVEY
10
Payment term Payment delay
0
10%
20%
30%
40%
50%
60%
Increasing Remaining the same
Declining Remaining the same
DecliningIncreasing
16.8%
58.2%
25% 25.4%23.8%
50.8%
Chart n°15 Expected change in payment term and payment delay for the next 6 months
Co
nst
ruct
ion
Ret
ail
Bu
sin
ess
serv
ices
Oth
er s
ervi
ces
Ag
rofo
od
ITC
Tra
nsp
ort
Tex
tile
Au
tom
oti
ve
En
erg
y
Ch
emic
al
Fin
anci
al a
nd
insu
ran
ce a
ctiv
itie
s
Ho
tels
an
d r
esta
ura
nts
Pap
er/W
oo
d9
Ph
arm
acy9
Met
als9
Ad
min
istr
atio
n9
32%
29%
23%
15%
17%
13%
61%
67%
22%
20%
8%50
%4
2%
30%
50%
20%
25%
63%
13%
38%
50%
13%
40
%20
%
50%
50%
33%
67%
100
%
100
%
40
%
60%
40
%
43%
57%
57%
60%
60%
59%
11%
10%
17%
26%
IncreasingRemaining the sameDeclining
Chart n°16 Expectation of the payement period for the next 6 months
9/ Size of the sample too small to be completely representative.
Source: Coface payment Survey
Source: Coface payment Survey
COFACE ECONOMIC PUBLICATIONS MOROCCO PAYMENT PERIODS SEPTEMBER 2017
SURVEY
11
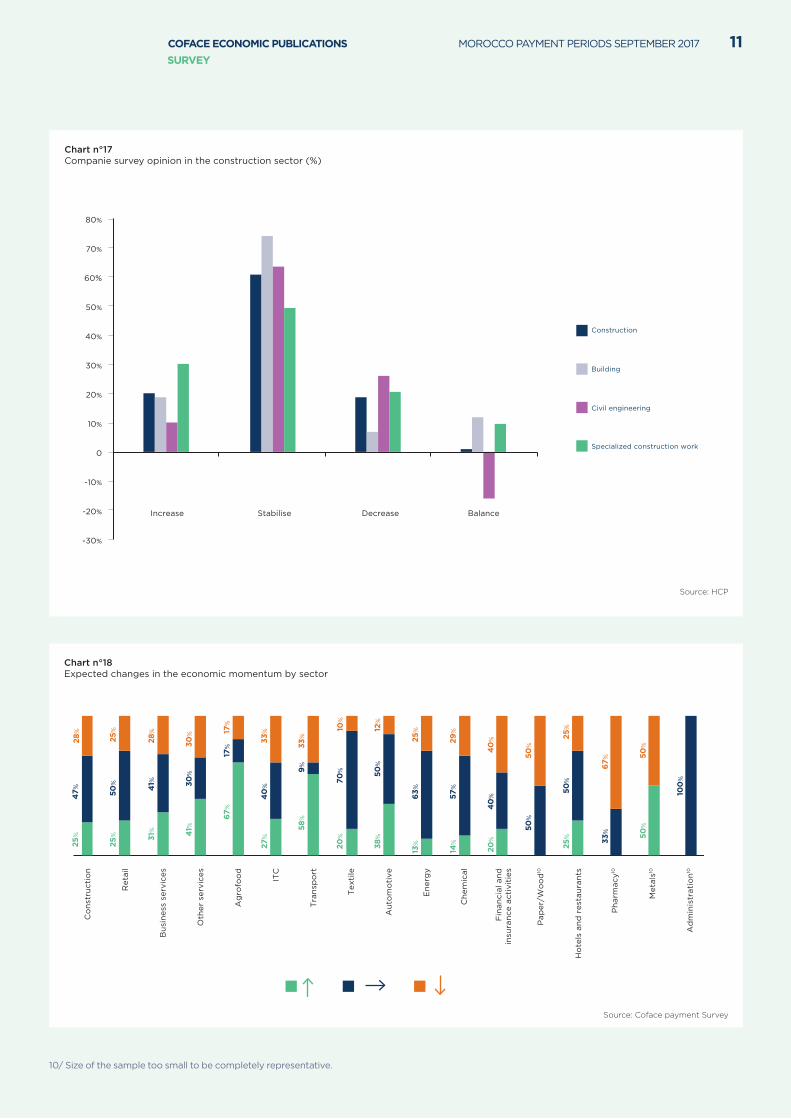
Chart n°17Companie survey opinion in the construction sector (%)
Increase Stabilise Decrease Balance
-30%
-20%
-10%
0
10%
20%
30%
40%
50%
60%
70%
80%
Construction
Building
Civil engineering
Specialized construction work
Co
nst
ruct
ion
Ret
ail
Bu
sin
ess
serv
ices
Oth
er s
ervi
ces
Ag
rofo
od
ITC
Tra
nsp
ort
Tex
tile
Au
tom
oti
ve
En
erg
y
Ch
emic
al
Fin
anci
al a
nd
insu
ran
ce a
ctiv
itie
s
Ho
tels
an
d r
esta
ura
nts
Pap
er/W
oo
d10
Ph
arm
acy10
Met
als10
Ad
min
istr
atio
n10
25%
47%
28%
25%
50%
28%
41%
30%
30%
17%
10%
12%
17%
33%
40
%
9%
25% 31
% 41%
67%
27%
50%
38%
25%
63%
13%
29%
57%
14%
40
%4
0%
20%
50%
50%
67%
33%
100
%
25%
50%
25%
50%
50%
70%
20%
33%
58%
Chart n°18Expected changes in the economic momentum by sector
10/ Size of the sample too small to be completely representative.
Source: Coface payment Survey
Source: HCP
COFACE ECONOMIC PUBLICATIONS MOROCCO PAYMENT PERIODS SEPTEMBER 2017
SURVEY
12
If yes If notWhat type of investment ? Why ?
Replacement investment
The outlook is poor
No need, the project
does not exist
Problems of financing
or access to financing
Capacity Investment
Productivity Investment
44.5%
22.8%
34.2%
43%
55.5%
34.5%
31%
34.5%
0
10%
20%
30%
40%
50%
60%
Chart n°19 Are you planing to invest during the next 6 months?
Change in Moroccan economy Change business climate
30.7%
42.1%
27.2%
24.4%
38.6%37%
0
5%
10%
15%
20%
25%
30%
35%
40%
45%
Chart n°20Over the next 6 months what do you expect about:
Source: Coface payment Survey
Source: Coface payment Survey
COFACE ECONOMIC PUBLICATIONS MOROCCO PAYMENT PERIODS SEPTEMBER 2017
SURVEY
13
Chart n°21Change in your workforce
For the last 6 months For the next 6 months
Change in your workforce
32.2%
53.7%
14.1%
30%
54.5%
15.4%
0
10%
20%
30%
40%
50%
60%
Source: Coface payment Survey
COFACE ECONOMIC PUBLICATIONS MOROCCO PAYMENT PERIODS SEPTEMBER 2017
SURVEY
COFACE SA1, place Costes et Bellonte92270 Bois-ColombesFrance
www.coface.com
RESERVATIONThis document is a summary reflecting the opinions and views of participants as interpreted and
noted by Coface on the date it was written and based on available information. It may be modified
at any time. The information, analyses and opinions contained in the document have been compiled
on the basis of our understanding and interpretation of the discussions. However Coface does not,
under any circumstances, guarantee the accuracy, completeness or reality of the data contained in
it. The information, analyses and opinions are provided for information purposes and are only a
supplement to information the reader may find elsewhere. Coface has no results-based obligation,
but an obligation of means and assumes no responsibility for any losses incurred by the reader
arising from use of the information, analyses and opinions contained in the document. This
document and the analyses and opinions expressed in it are the sole property of Coface. The reader
is permitted to view or reproduce them for internal use only, subject to clearly stating Coface’s name
and not altering or modifying the data. Any use, extraction, reproduction for public or commercial
use is prohibited without Coface’s prior agreement. Please refer to the legal notice on Coface’s site.
Sep
tem
ber
20
17 ©
Des
ign
and
pro
du
ctio
n: É
dit
ion
s S
trat
égiq
ues
- P
ho
to: F
oto
lia