Embed Size (px)
Citation preview
The Federal Budget Outlook, Chapter 11
Alan J. Auerbach and William G. Gale
September 15, 2010
Alan J. Auerbach: Robert D. Burch Professor of Economics and Law, Department of Economics, University of California, Berkeley, CA, USA, Director, Robert D. Burch Center for Tax Policy and Public Finance, Department of Economics and the School of Law, University of California, Berkeley, CA, USA, and Research Associate, National Bureau of Economic Research, Cambridge, MA, USA ([email protected]) William G. Gale: Arjay and Frances Fearing Miller Chair in Federal Economic Policy, Brookings Institution, Washington, DC, USA, and Co-Director, Tax Policy Center, Urban Institute-Brookings Institution, Washington, DC, USA. ([email protected]) The authors thank Ben Harris for his varied contributions to the project and Ilana Fischer for research assistance. All opinions and any mistakes are those of the authors and should not be attributed to the staff, officers, or trustees of any of the institutions with which they are affiliated.
ABSTRACT
We present new estimates of the budget outlook, based on the latest projections from the
Congressional Budget Office and the Medicare and Social Security Trustee reports. The
medium-term budget outlook has not changed appreciably since earlier this year. Under
reasonable assumptions, the federal government is likely to face deficits in excess of 6 percent of
GDP by late in the decade, with the debt-GDP ratio reaching 90 percent by or before 2020 and
passing its previous all-time high of 109 percent by around 2022. The long-term budget outlook
is sensitive to assumptions about how health care spending will respond to recent legislation.
However, even under the most optimistic assumptions regarding health care spending, the most
likely estimate suggests a long-term fiscal gap of between 6 and 7 percent of GDP. Policy
makers and the public will eventually be forced to address these issues, but addressing them
sooner rather than waiting until a full-blown crisis hits would allow for more reasonable and
gradual adjustments.
I. INTRODUCTION
The United States faces the prospect of large federal fiscal deficits in the immediate
future, the next 10 years, and the longer term. The short-term deficits � the result of the tax cuts
and spending increases of the last decade, the �Great Recession,� and economic policy
adjustments in the past year � are generally thought to be helping the economic recovery. In
contrast, the medium-term deficits projected for the next 10 years and the long-term deficits
projected beyond 2020 are a source of concern. Even if they do not lead immediately to a crisis,
they will nevertheless create growing and serious burdens on the economy.
The unsustainability of federal fiscal policy has been discussed at least since the 1980s.
But the problem has increased in importance and urgency in recent years, for several reasons.
First, the medium-term projections have deteriorated significantly. Second, the issues driving the
long-term projections � in particular, the retirement of the baby boomers and the aging of the
population and the resulting pressure on Medicare and to some extent Social Security � which
were several decades away in the 1980s � are now imminent. Third, there are increasing
questions about the rest of the world's appetite for U.S. debt, as the United States has changed
from a net creditor country in 1980 to a vast net borrower currently. Fourth, many countries
around the world and many of the 50 states also face daunting fiscal prospects currently.
In light of these issues, this paper provides new projections of the federal budget over the
medium and long terms.1 This paper provides new projections of federal budget outcomes, using
the August 2010 Congressional Budget Office (CBO 2010d) projections, recent reports by the
Social Security and Medicare trustees (Medicare Trustees 2010), an analysis by Medicare
actuaries (Medicare Actuary 2010). It updates the analysis in Auerbach and Gale (2010), which
1 This paper builds on analysis and conventions we have developed in numerous previous papers including Auerbach and Gale (1999, 2000, 2001, 2009, 2010), Auerbach et al. (2003), and Auerbach, Furman and Gale (2007, 2008).
2
was written before these reports were published. We highlight both the main results and the
changes from the earlier analysis below.
The analysis begins with the Congressional Budget Office (CBO) baseline budget
projections. CBO (2010d) projects the 2010 deficit to be $1.34 trillion, about 9 percent of GDP.
Other than 2009, this represents the largest deficit as a share of the economy since World War II.
For 2011�2020, the CBO baseline projects a cumulative deficit of $6.2 trillion, with deficits
declining sharply to 2.5 percent of GDP by 2014 and remaining at or below 3.0 percent of GDP
through 2020. This would be a reassuring outcome, except that the CBO baseline is not intended
to represent likely or probable outcomes. Rather, it essentially reports the implications of the
assumption that Congress does nothing over the next 10 years. All tax provisions currently
scheduled to expire are assumed to do so as scheduled, for example.
A more plausible way to project future outcomes may be to assume that future
Congresses will act more or less like previous Congresses, for example in granting continuances
to expiring tax provisions. To generate a better measure of where fiscal policy is headed, we alter
the CBO baseline assumptions in ways that we believe are more representative of the
continuation of current policies. Under this extended policy scenario, we estimate a 10-year
deficit of $11.5 trillion, or 6.0 percent of GDP. As in CBO�s baseline, deficits decline in the near
term, but only to 4.7 percent of GDP by 2014, and unlike in CBO�s baseline, deficits then rise
substantially, to 6.6 percent of GDP by 2020.
A third way to project future outcomes is to examine the Administration's budget
proposals. These figures are not quite as pessimistic as those under extended policy, but are
troubling nonetheless. The 10-year deficit under Obama policy is projected to be $9.7 trillion.
The deficit declines to 3.9 percent of GDP by 2014. By 2020, although the economy is projected
3
to have been at full employment for several years, the deficit rises to 5.2 percent of GDP.
Spending rises to 23.7 percent of GDP (the highest since World War II, except for the current
downturn), the debt-to-GDP ratio rises to 90 percent (the highest since 1947), and net interest
payments rise to 4.1 percent of GDP (the highest share ever and larger than defense or non-
defense discretionary spending).
All of these figures are poised to rise further after 2020, implying that the situation is
unsustainable. The debt-to-GDP ratio will pass its 1946 high of 108.6 percent by 2033 under the
CBO baseline, but much sooner � in 2022� under extended policy. Under both scenarios,
however, the debt-to-GDP ratio would then continue to rise rapidly, contrary to its sharp decline
in the years immediately after 1946.
All of the estimates above, for the 10-year horizon and the debt-GDP ratio headed into
the next decade, are very close to those provided in Auerbach and Gale (2010). That is, little has
changed to alter the medium-term (10-year) budget outlook in the period since March, except for
health care legislation, which our earlier work incorporated.
The health reform package's impact on the long-term budget outlook is more
controversial. To examine long-term issues more formally, we estimate a long-term fiscal gap
� the immediate and permanent increase in taxes or reduction in spending that would keep the
long-term debt-to-GDP ratio at its current level. Using current-law assumptions for Medicare
spending, as put forth by the Medicare trustees (2010), and depending on the time frame
employed, the fiscal gap is estimated to be about 4�5 percent of GDP under the assumptions in
the CBO baseline, about 5-6 percent of GDP under the assumptions under Obama policy, and
about 6-7 percent of GDP in the extended policy scenario. However, the fiscal gap rises by 2-3
percent of GDP under all of these scenarios when substituting the Medicare outlay estimates put
4
forth by the Medicare actuaries (Medicare Trustees 2010) and rises by an additional 1-2 percent
when using assumptions employed by CBO (2010d). As a result, the gap is estimated to be as
high as 12 percent of GDP under our worst-case scenario. These estimates show both that health
care reform is an important part of the long-term budget outlook, but that even very substantial
and sustained reform of health care will leave a significant fiscal gap. As a result, the budget
outlook will create difficult trade-offs for policy makers and the American public.
II. THE 10-YEAR OUTLOOK
A. Three Scenarios
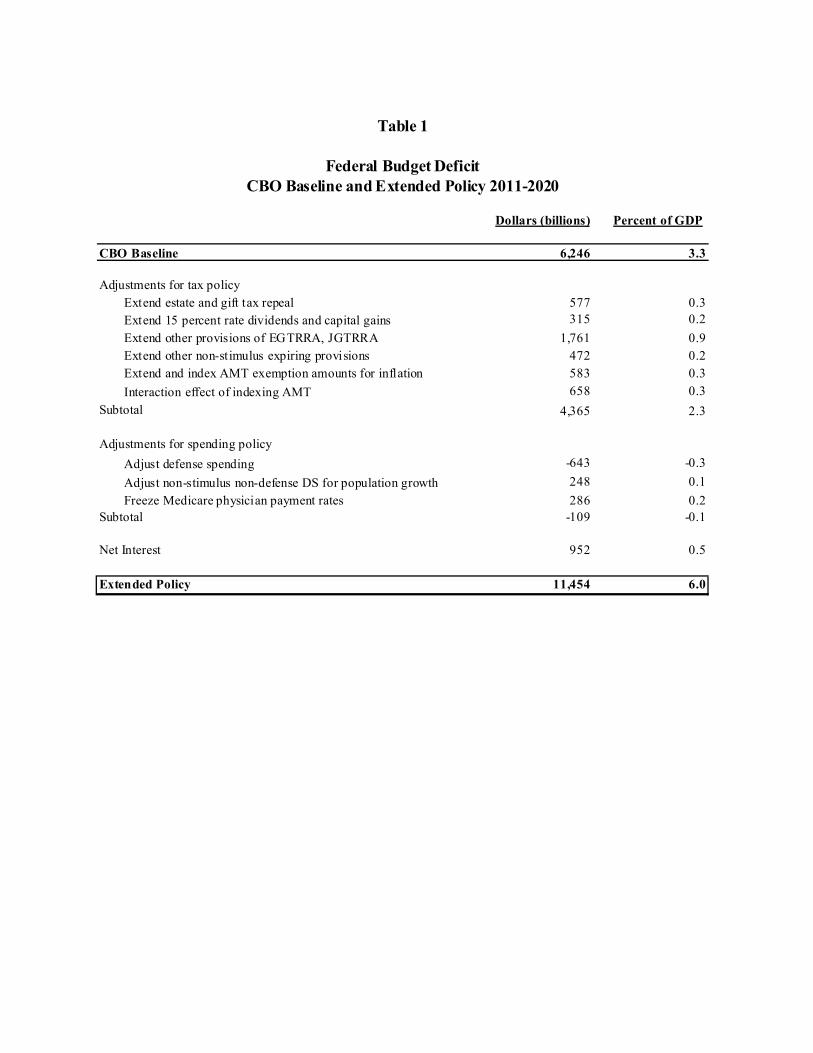
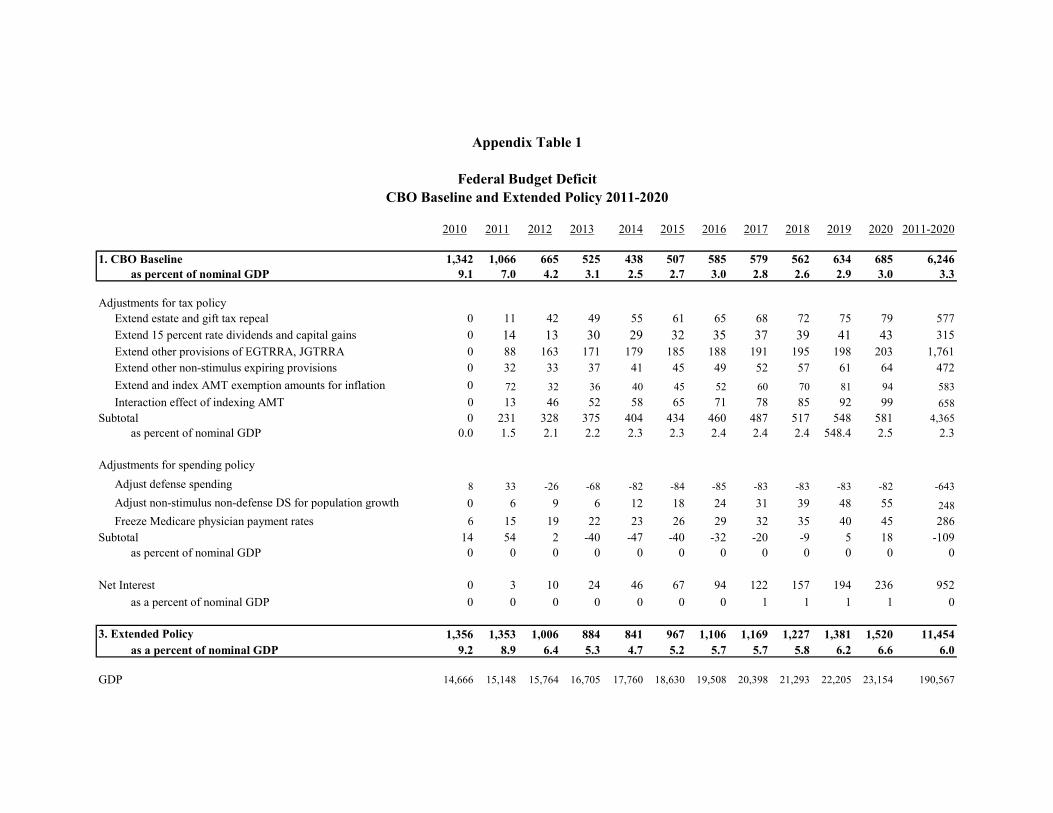
This section presents three estimates of the 10-year budget outlook. The first estimate is
simply the CBO August 2010 baseline (CBO 2010d). The second approach, which we call
extended policy, examines the implications of continuing the tax and spending policies that are in
place currently. Table 1 displays these adjustments relative to the CBO baseline (with annual
details in Table A1). First, CBO assumes that all temporary tax provisions (other than excise taxes
dedicated to trust funds) expire as scheduled. The large majority of the tax cuts enacted since 2001
expire by the beginning of 2011. A variety of other tax provisions that have statutory expiration
dates are routinely extended for a few years at a time as their expiration date approaches. We
assume that all of these provisions will be extended.2 We do not, however, assume the extension
of tax provisions introduced or substantially expanded by the stimulus package.3
Second, the alternative minimum tax (AMT) will grow to affect more than 41 million
households by 2020 under current law (Tax Policy Center 2010). Congress has repeatedly
2 CBO (2010a) reports that the baseline includes $950 billion in outlays, not including debt service costs, for mandatory spending programs that are assumed to be extended beyond their expiration dates. 3 Since the stimulus package expanded some existing tax provisions, judgment is required to make the distinction between stimulus and non-stimulus expiring provisions. Our calculations are similar to those made by Ruffing and Horney (2010).
5
endorsed tax policies that limit the growth in households affected by the AMT. Our estimates
reflect the continuation of this choice in two ways. We assume that AMT provisions that expired
at the end of 2009 � including higher AMT exemption levels that had been in place since the
2001 tax cuts and the use of personal nonrefundable credits against the AMT, which had been in
place for an even longer period � are granted a continuance. We index the AMT exemption
amount for inflation starting in 2010.
Third, under current law, payments to physicians under Medicare will decline by about 21
percent in 2010, by 6 percent in 2011, and by about 2 per year through 2020. In the past, however,
the Administration and Congress stepped in to postpone such reductions. We assume similar
actions will prevail in the future, so we include the costs of freezing physician payment rates under
Medicare at their 2009 levels.
The fourth issue involves discretionary spending. Unlike taxes and entitlement spending,
which are governed by current law, discretionary spending typically requires new appropriations
by Congress each year. The CBO baseline assumes that discretionary spending will remain
constant in real dollars at the level prevailing in the first year of the budget period. We divide
discretionary spending into four categories and make different assumptions with respect to each.
First, as in the CBO baseline, we assume that discretionary spending in the stimulus package is
allowed to expire as scheduled.
Second, we also assume that supplemental appropriations are temporary. In contrast, the
CBO baseline classifies supplemental appropriations as part of regular spending. As a result,
the baseline includes the $46 billion in current supplemental appropriations and projects such
spending to add approximately $460 billion to baseline outlays over the next 10 years. We
include only the $46 billion in already-authorized supplemental appropriations as spending in the
6
extended policy scenario. We exclude the remaining amounts, which results in a more than $400
billion decrease in extended policy spending relative to baseline spending.
Third, we assume that defense spending will closely follow the policy outlined in the
President�s 2011 budget. Such a policy calls for steep decreases in war-related defense funding
after 2011 and results in a $339 billion decrease in defense spending relative to the CBO's
defense baseline, where the defense baseline figure has been adjusted to exclude the extrapolated
supplemental spending noted above.
Fourth, for non-stimulus, non-supplemental, non-defense discretionary spending, we note
that maintaining current services often would require increases for both inflation and population
growth, rather than just inflation.4 Accordingly, we adjust baseline expenditures to allow for
population growth.
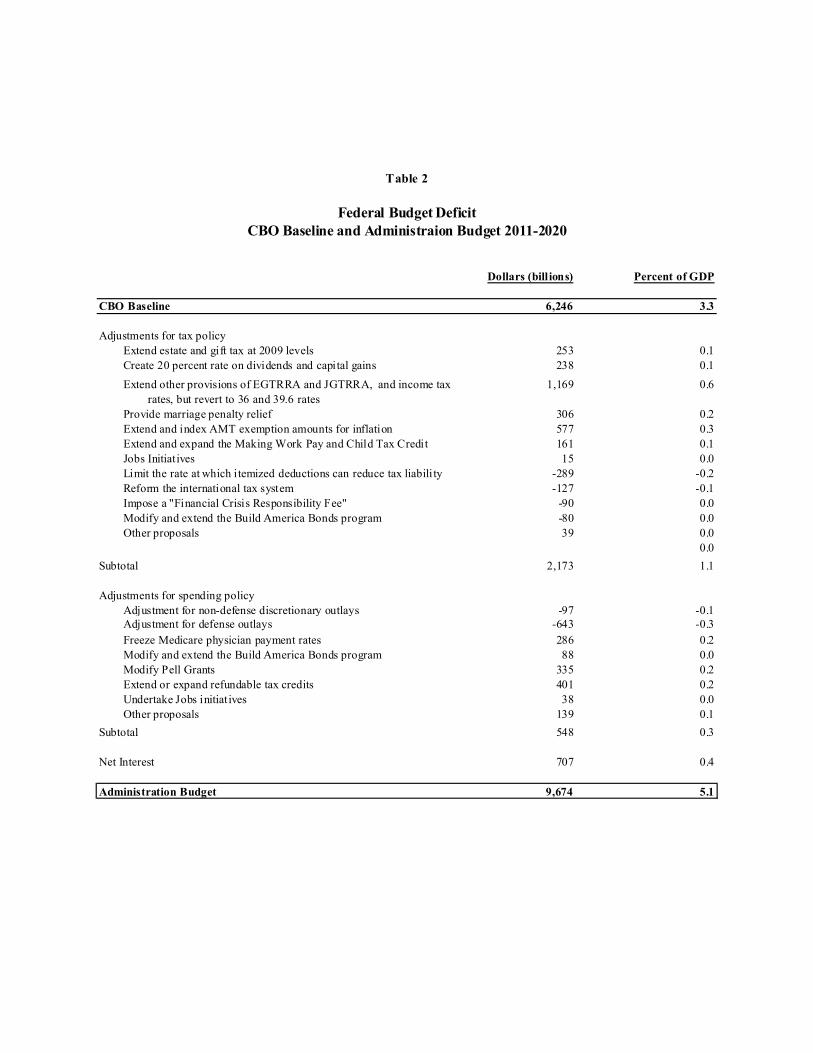
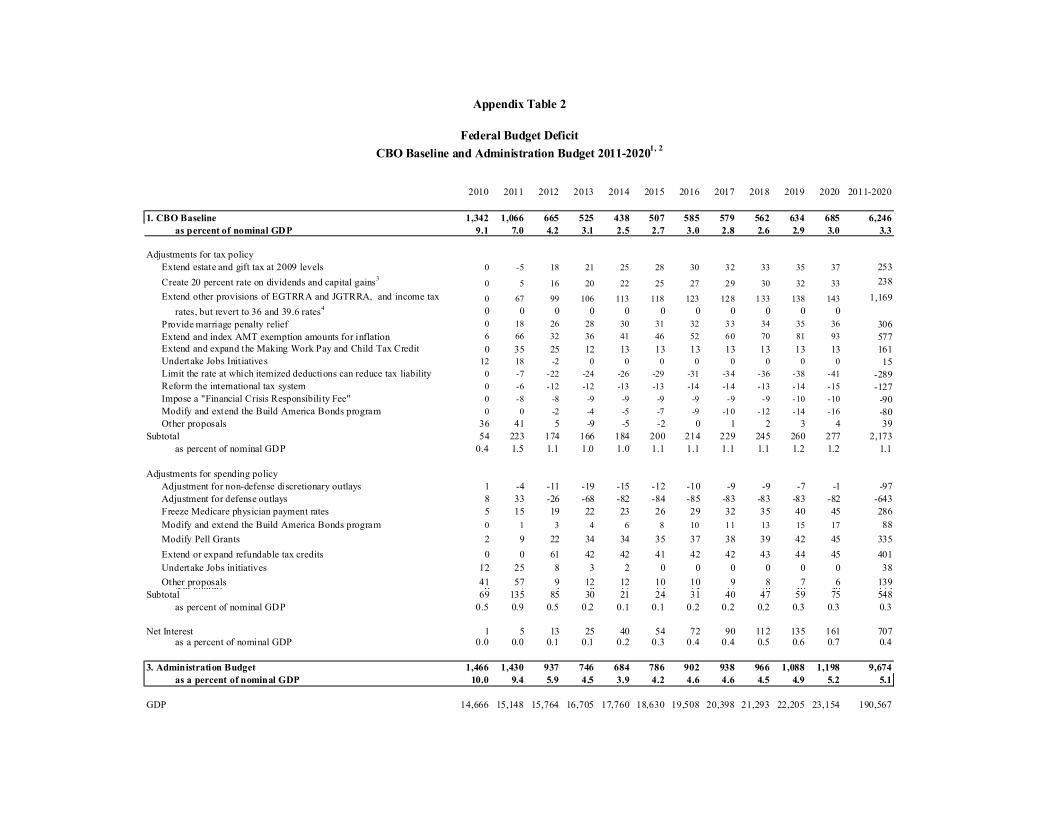
Our last estimate of the budget outlook is derived from CBO's March 2010 estimate of the
Administration's budget (CBO 2010b).5 As can be seen in Table 2 (with annual details in Table
A2), relative to current law (the CBO baseline), the Administration proposes a raft of tax cuts and
significant new spending on education, health, and other programs. Although not shown in Table
4 In some cases, like veterans� health benefits, even larger increases might be needed to maintain current services (because the number of veterans may rise faster than the population and because health costs may rise faster than the overall price level). 5 Since CBO�s analysis of the President�s budget in March, several of the President�s policies were implemented by the health care bill and the HIRE Act. These policies are now incorporated in CBO�s August baseline. In order to avoid redundancies, we adjust the President�s budget proposals to include only the costs of proposals that are not now part of current law. Prior to the recent health care legislation, the President's budget proposed to (1) convert the Pell Grant program to an exclusively mandatory program; (2) expand the Pell Grant program by $197 billion over the next 10 years, and (3) replace the existing guaranteed loan program with direct loans by the Department of Education. The recent health care legislation implemented the third policy and increased Pell Grant funding by $40 billion over the next 10 years. The effects of the implemented changes are therefore included in our "CBO baseline adjusted for health care legislation" scenario. In order to avoid double-counting these changes, our representation of Obama policy after the health care legislation assumes the third policy is implemented and that Pell Grant funding rises by $157 billion ($197 billion less $40 billion) over 10 years. In addition, the HIRE Act included $13.0 billion in funding for incentives for businesses to hire new workers; we subtract this amount from the President�s proposed $40 billion in funding for tax incentives to spur employment.
7
2, President Obama�s policies can be also described and characterized relative to the extended
policy scenario.6 Specifically, relative to extended policy, the Administration�s budget proposals
include significant increases in taxes on high-income households (including the estate tax, the top
income tax rates, capital gains and dividend taxes, and reimposition of the phase-outs of itemized
deductions and personal exemptions), tax cuts for lower-income households, closing of corporate
income tax loopholes, expansion of the Pell Grant and Build America Bonds programs, tax
subsidies and spending designed to spur employment, and increases in non-defense, non-education
discretionary spending.
B. Results
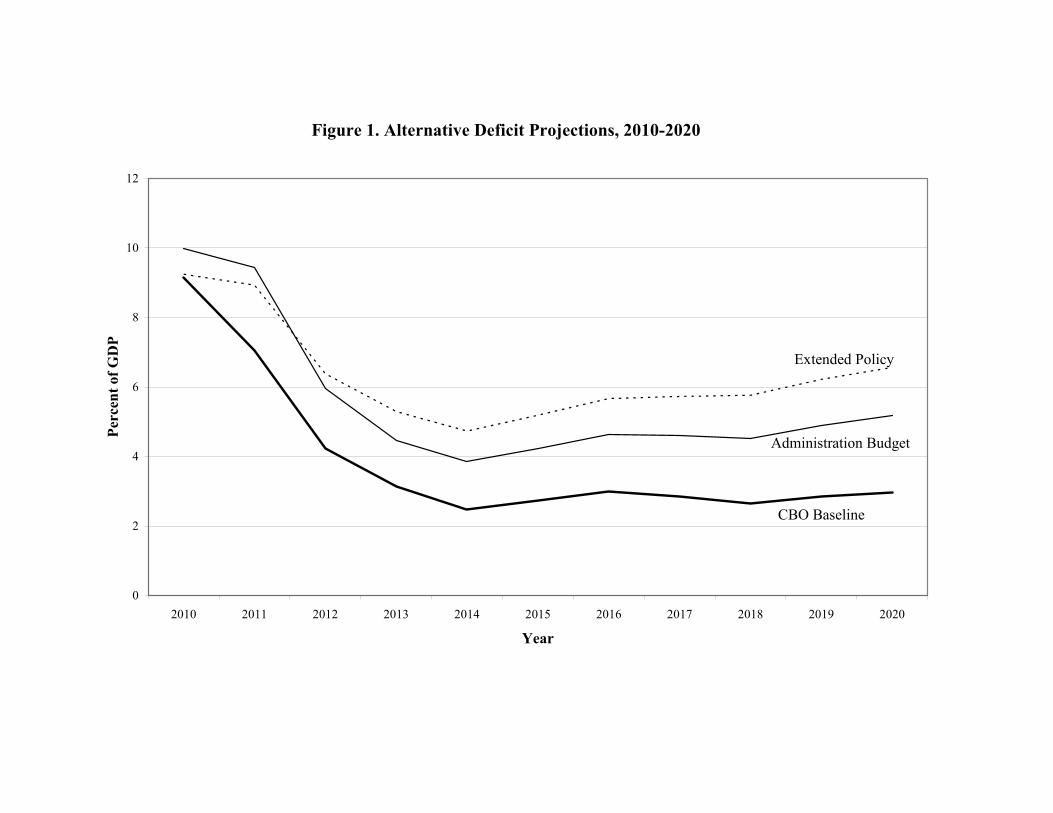
The three approaches to the 10-year budget outlook display several important differences.
The time paths of deficits differ under the alternative scenarios (Figure 1 and Tables A1 and A2).
All the measures show deficits shrinking sharply relative to GDP through the recovery, but
CBO�s baseline shows a steeper drop through 2014 and a slower increase in the deficit as a share
of GDP after 2014, while the extended policy baseline and Obama policy show more rapid
increases in the deficit as a share of GDP over the last six years of the projection. Note also that
because the economy is expected to reach full employment by around 2015, all of the deficit
figures for subsequent years represent �full employment� deficits.
More specifically, the CBO baseline shows deficits declining by nearly 7 percent of GDP
from 2010 to 2014 and then remaining roughly constant thereafter at approximately 3 percent of
GDP. The sharp decline through 2014 is the result of a recovering economy, but also of the
assumptions that scheduled expirations in the stimulus package, AMT extensions, financial
6 The Administration also develops a �current policy� baseline (showing the effects of continuation of current policies) that is close to our extended policy. The policy differences between the Administration�s current policy baseline and our extended policy center on differing assumptions regarding the estate tax, Pell Grant funding, non-stimulus discretionary spending, and funding for domestic disasters.
8
interventions, and the 2001 and 2003 tax cuts are allowed to take place. Our extended policy
baseline also shows deficits declining sharply, but only to 4.7 percent of GDP in 2014, since the
extended policy baseline extends the tax cuts and the AMT provisions. After 2014, however, the
deficit in the extended policy baseline starts rising, ending up at 6.6 percent of GDP by 2020.
Obama policy represents an intermediate outcome: deficits fall to 3.9 percent of GDP in
2014, and then gradually rise to 5.2 percent of GDP by 2020. The Administration also created a
fiscal commission given the charge of formulating proposals to reduce the primary deficit to zero
by 2015, which is roughly equivalent to reducing the unified deficit to 3 percent of GDP by 2015
(White House Office of the Press Secretary, 2010). Our projections do not make any adjustment
for the possible effects of the commission.
These differences in time paths turn into substantial annual differences by the end of the
decade. By 2020, the CBO baseline deficit is $685 billion; the deficit reaches $1.5 trillion under
extended policy, and $1.2 trillion under Obama policy. As a result of these differences, the
overall fiscal shortfalls vary substantially. The CBO baseline projects a 10-year deficit of $6.2
trillion. In contrast, extended policy shows a 10-year deficit of $11.5 trillion and the Obama
policy shows a decade-long deficit of $9.7 trillion.
What is perhaps most notable is how problematic the 2020 outcomes are under Obama
policy, despite being preceded by several years of full employment. Spending in 2020 would be
24.9 percent of GDP, the highest level since World War II (other than the 2009-2011 spike), and
would be rising over time. The deficit would stand at 5.2 percent of GDP and also would be
rising over time. Other than the deep recession year of 1983 and the current downturn (2009�
2012), this would be the highest deficit share of GDP in more than 60 years and, as noted above,
would represent a full-employment deficit. The debt�to-GDP ratio would be 90 percent � the
9
highest level since 1947 � and rising.
The rise in spending would occur in mandatory programs, which in 2020 would be at
their highest share of GDP ever, except during the current downturn (in which the financial
interventions have been recorded as mandatory programs). In contrast, defense spending would
fall dramatically and non-defense discretionary spending � in part due to the recharacterization
of Pell Grant outlays � would drop to its lowest share of GDP in the past 50 years. These
reductions would require significant political discipline. Finally, net interest payments would rise
to 4.1 percent of GDP by 2020, the largest figure ever, and larger than total non-defense
discretionary spending or defense spending in that year.
In summary, while it is clear that the current deficits are expected to represent a
temporary surge in government borrowing, the 10-year outlook suggests that the surge may well
not subside as much as would be desired. In addition, borrowing will rise again later in the
decade in a manner that appears to be unsustainable in the long term. Of course, as shown in
Figure 1, as bad as outcomes are under Obama policy, outcomes would be even worse under a
mechanical extension of current policies.
III. THE LONG-TERM OUTLOOK
The fiscal gap is an accounting measure that is intended to reflect the long-term
budgetary status of the government.7 As developed by Auerbach (1994) and implemented in
many subsequent analyses, the fiscal gap measures the size of the immediate and permanent
increase in taxes and/or reductions in non-interest expenditures that would be required to set the
present value of all future primary surpluses equal to the current value of the national debt,
7 Auerbach et al. (2003) discuss the relationship between the fiscal gap, generational accounting, accrual accounting and other ways of accounting for government.
10
where the primary surplus is the difference between revenues and non-interest expenditures.8
Equivalently, it would establish the same debt-to-GDP ratio in the long run as holds currently.
The gap may be expressed as a share of GDP or in dollar terms.
A. Initial Assumptions
There are a variety of assumptions necessary to compute the fiscal gap. It is helpful to
break these assumptions down into those regarding the 10-year budget period and those
regarding the years thereafter, for which no official CBO projections are available. We start with
perhaps the simplest approach for the 10-year budget period, following the August 2010 CBO
baseline through 2020. We assume that, after 2020, most categories of spending and revenues
remain constant as a share of GDP. These long-run assumptions, however, would be seriously
misleading for the major entitlement programs and their associated sources of funding, for which
recent long-term projections are available. For the Medicare and OASDI programs, projections
for all elements of spending and dedicated revenues (payroll taxes, income taxes on benefits,
premiums and contributions from states) are available or can be calculated from figures
presented for the intermediate projections in the 2010 Trustees reports.9 We use the Trustees�
projections of the ratios of taxes and spending to GDP for the period 2020�2085 for OASDI and
2020�2080 for Medicare, assuming that these ratios are constant at their terminal values
thereafter. For Medicaid, CHIP and exchange subsidies we follow CBO�s most recent long-term
projections (CBO 2010c) through 2084 and assume that spending as a share of GDP is constant
8 Over an infinite planning horizon, this requirement is equivalent to assuming that the debt-to-GDP ratio does not explode (Auerbach 1994, 1997). 9 Details of these computations are available from the authors upon request. The 2010 Medicare Trustees Report is at http://www.cms.gov/ReportsTrustFunds/downloads/tr2010.pdf. The 2010 OASDI Trustees Report is at http://www.ssa.gov/OACT/TR/2010/tr10.pdf.
11
thereafter.10
It is important to understand how to interpret these assumptions. They do not represent a
pure projection of current law but instead assume that policymakers will make a number of
future policy changes, including a continual series of tax cuts, discretionary spending increases,
and adjustments to keep health spending from growing too quickly. For example, if current tax
parameters were extended forward, income taxes would rise as a share of GDP. Our forecast
implicitly assumes policymakers will cut taxes in response. Conversely, our forecast assumes
that a richer society will want to spend more on discretionary spending, going beyond the current
services provided by government.
For Medicare spending, the intermediate projections of the Trustees have for many years
incorporated the assumption that Medicare growth will eventually slow in the future. This year,
however, the Trustees� official medical projections have assumed a much stronger slowdown, as
a consequence of provisions in the recently passed health care bill. These assumptions, though
they may be consistent with the impact of the bill�s provisions should they remain in force over
the long term, are controversial, for the sustainability of such spending reductions is not clear.
Reflecting this controversy, the Medicare Actuary took the unusual step of releasing a separate
set of projections (CMS Office of the Actuary 2010) showing less optimistic (although still
positive) reductions in spending relative to the 2009 Trustees Report. Reflecting the
considerable uncertainty about the path of Medicare, we provide long-term calculations for each
of these projected paths. To these, we add one more, the even more pessimistic projections
10 CBO projects two scenarios for spending and revenues, which it refers to as its �Extended-Baseline� and �Alternative� scenarios. For federal spending on Medicaid, CHIP and exchange subsidies, these two scenarios are very similar, differing by only about 0.1 percent of GDP in 2084. We use the higher of these two sets of projections, the Alternative scenario, to be consistent with our use of the Medicare projections from this scenario as one of the cases we will consider below.
12
under CBO�s Alternative long-term scenario.11
B. Estimates
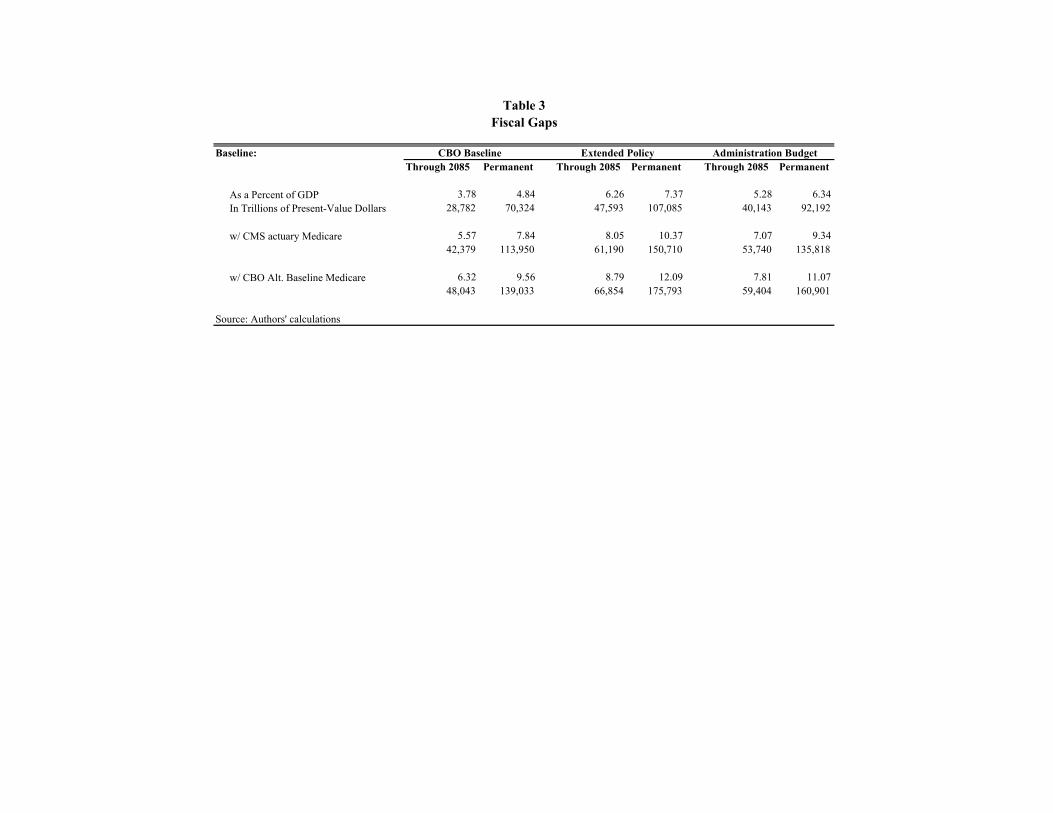
Table 3 displays calculations of the long-term fiscal gap for our three 10-year baselines �
CBO, Extended, and Administration. For each of these policy baselines, we show three variants
according to the source of post-2020 Medicare projections � the Medicare Trustees, the Medicare
Actuary, and CBO�s Alternative scenario. We begin by discussing the various baselines that rely
on the most optimistic Medicare projections, those in the official Trustees report, shown in the
top panel of the table.
Under the CBO baseline assumptions, we estimate that the fiscal gap through 2085 is
now 3.78 percent of GDP (Table 3).12 This implies that an immediate and permanent increase in
taxes or cut in spending of 3.78 percent of GDP � about $550 billion per year in current terms
� would be needed to maintain fiscal balance through 2085. In present-value dollars, rather than
as a share of GDP, the fiscal gap through 2085 under these assumptions amounts to $28.8
trillion. The fiscal gap is even larger if the time horizon is extended, since the budget is projected
to be running substantial deficits in years approaching and after 2085. If the horizon is extended
indefinitely, for example, the fiscal gap rises to 4.84 percent of GDP under the CBO baseline, or
$70.3 trillion.
Moving across the top panel of Table 3, we see that the fiscal gap is substantially larger
under the extended policy scenario. This scenario�s assumptions lead to a lower level of revenue
and a higher level of spending than the CBO baseline. Under extended policy, the fiscal gap
through 2085 amounts to 6.26 percent of GDP, or 2.48 percent of GDP more than under the CBO
11 The Medicare projections under CBO�s more optimistic Extended-Baseline scenario yield estimates of the long-term gap that are similar to those based on the CMS Actuary�s projections. 12 The discount rate in these calculations is based upon the intermediate assumptions of the Social Security trustees, which assume a nominal interest rate of 5.7 percent.
13
baseline. In present-value dollars, the fiscal gap under this scenario amounts to $47.6 trillion
through 2085. Over the infinite horizon, the fiscal gap under the extended policy baseline is 7.37
percent of GDP, or $107.1 trillion. The results based on the third 10-year scenario, which starts
with CBO�s estimate of Obama policy, are somewhat less dire than those of the adjusted
baseline, with fiscal gaps through 2085 and over the infinite horizon of 5.28 percent and 6.34
percent, respectively.
For all three of these 10-year scenarios, the long-term gaps are smaller than those
reported in our most recent previous set of calculations (Auerbach and Gale 2010); the
improvement varies somewhat across the scenarios, but is roughly 1 percent of GDP through
2085 and over 1.5 percent of GDP over the infinite horizon. These improvements are essentially
all attributable to changes in health care projections; using our previous projections for Medicare
and other health spending, but current projections for all other components of revenue and
spending as well as updated economic projections, yields long-term gap estimates that are very
close to those we previously reported. But the improved outlook holds only for the official
Trustees projections.
Moving to the second panel of the table, we see the impact of using the projections
offered separately by the Medicare Actuary. Doing so raises the fiscal gap to 5.57 percent of
GDP through 2085 and 7.84 percent of GDP over an infinite horizon under the scenario based on
the CBO baseline. Though even these Medicare projections are slightly more favorable than
those in last year�s Trustees Report, our overall fiscal gap estimates are worse than those we
previously reported. For example, while our previously reported infinite-horizon gap was 8.18
percent of GDP under Administration policy, it is now 9.34 percent, given this set of Medicare
projections. This worsening is due to the higher projections of Medicaid and other health
14
spending in CBO (2010d) relative to CBO (2009), on which our most recent estimates were
based.13
The third set of projections for Medicare spending, from CBO�s Alternative scenario, are
the most pessimistic that we consider, and using them pushes the estimated long-term gap close
to 10 percent of GDP even under the CBO 10-year baseline, and to around 11 and 12 percent of
GDP under the Administration and Extended 10-year baselines, respectively. In summary, even
under the most optimistic assumptions available for health spending over the long term, health
care reform has eliminated only a small portion of the fiscal gap; other health care projections
paint an even bleaker picture than those from last year.
Figure 2 shows the implied debt-to-GDP ratios under the most optimistic (CBO 10-year
baseline; Medicare Trustees projections) and most pessimistic (Extended baseline; CBO
Alternative scenario for Medicare) sets of projections. Under the first set, the economy would
pass its highest-ever debt-to-GDP ratio (108.6 percent, in 1946) by 2033. This benchmark would
be passed much sooner � in 2024 � under the more pessimistic scenario. In both cases, the
following years would see very rapid further growth of the debt-to-GDP ratio. Indeed, the
projected debt-to-GDP ratios rise to astronomical levels later in the century no matter how
optimistic the assumptions.
Figure 3 shows projected revenues and non-interest expenditures through 2085 under
these two �bracketing� scenarios, CBO 10-year baseline/Medicare Trustees and extended
policy/CBO Alternative Medicare. Under the most optimistic scenario, non-interest outlays will
keep rising, but will have reached �only� 27 percent of GDP by 2085 � higher than the 21
percent of revenue projected for that year under the scenario. Under the most pessimistic 13 We infer that this increase in projected spending reflects the effects of the 2010 health care expansion, in particular the added costs of CHIP and exchange subsidies, although CBO does not report the individual components separately.
15
projections, revenue will be lower � at 19 percent of GDP much closer to its historical share �
and non-interest outlays will be on a rapidly exploding trajectory, hitting 35 percent of GDP by
the end of the period shown. Thus, even using the most optimistic projections for both the short
term and the long term, there is much that must still be done to close the gap between spending
and revenues. Yet these optimistic projections essentially assume that much work already will
have been done; tax cuts will have expired, medical spending growth will have come under much
better control, and so forth. Under either set of assumptions, therefore, and by implication for
those that lie somewhere in between, sizable adjustments to revenues and spending will be
required beyond those that have been contemplated in the formulation of any set of projections.
IV. CONCLUSIONS
The current U.S. fiscal deficit is enormous, but its enormity is temporary � or at least is
expected to be. The real concerns lie in the 10-year projection and long-term outlook. The
medium-term and long-term budget shortfalls will create growing burdens on the economy.
These burdens can happen gradually or suddenly. In the gradual scenario, budget shortfalls will
reduce national saving. In the absence of increased capital inflows, the reduction in national
saving will raise interest rates, reduce investment and reduce future national output. Increased
capital inflows from abroad can mitigate or eliminate the increase in interest rates and/or the
decline in investment. This in turn will offset some of the decline in future national income, but
of course the inflows create increasing claims on the domestic capital stock and hence still
reduce future national income. In either case, under the gradual scenario, sustained large deficits
will reduce future national income and living standards. In the sudden scenario, long-term budget
shortfalls could trigger a political or market reaction that leads to a sudden change in interest
rates, exchange rates, capital outflows, etc. Avoiding these outcomes will require significant and
16
sustained changes to spending and revenue policies, much larger changes than have received
serious consideration in the policy process to date.
17
REFERENCES
Auerbach, Alan J., 1994. �The U.S. Fiscal Problem: Where We Are, How We Got Here, and Where We�re Going.� In Fischer, Stanley, and Julio Rotemberg (eds.), National Bureau of Economic Research Macroeconomics Annual, 141�175. National Bureau of Economic Research, Cambridge, MA. Auerbach, Alan J., 1997. �Quantifying the Current U.S. Fiscal Imbalance.� National Tax Journal 50 (3), 387�398. Auerbach, Alan J., Jason Furman, and William G. Gale, 2007. �Still Crazy After All These Years: Understanding the Budget Outlook.� Tax Notes 155 (8), 765�778. Auerbach, Alan J., Jason Furman, and William G. Gale, 2008. �Facing the Music: The Fiscal Outlook as the Bush Years End.� Tax Notes 119 (9), 981�992. Auerbach, Alan J. and William G. Gale, 1999. �Does the Budget Surplus Justify a Large-Scale Tax Cut?� Tax Notes 82 (12), 1827�1850. Auerbach, Alan J. and William G. Gale, 2000. �Perspectives on the Budget Surplus.� National Tax Journal 53 (3), 459�473. Auerbach, Alan J. and William G. Gale, 2001. �Tax Cuts and the Budget.� Tax Notes 90 (13), 1869-1882. Auerbach, Alan J. and William G. Gale, 2009. �The Economic Crisis and the Fiscal Crisis 2009 and Beyond: An Update.� Tax Notes 125 (1), 101�130. Auerbach, Alan J. and William G. Gale, 2010. �Déjà Vu All Over Again: On the Dismal Prospects for the Federal Budget.� National Tax Journal, 63(3), 543-560. Auerbach, Alan J., William G. Gale, Peter R. Orszag, and Samara Potter, 2003. �Budget Blues: The Fiscal Outlook and Options for Reform.� In Aaron, Henry J., James Lindsay, and Pietro Nivola (eds.), Agenda for the Nation, 109�143. Brookings Institution, Washington, DC. Board of Trustees, Federal Hospital Insurance and Federal Supplemental Medical Insurance Trust Funds, 2010. The 2010 Annual Report of the Board of Trustees of the Federal Hospital Insurance and Federal Supplementary Medical Insurance Trust Funds. Federal Hospital Insurance and Federal Supplemental Medical Insurance Trust Funds, Washington, DC. Board of Trustees, Federal Old-Age and Survivors Insurance and Disability Insurance Trust Funds, 2010. The 2010 Annual Report of the Board of Trustees of the Federal Old-Age and Survivors Insurance and Federal Disability Insurance Trust Funds. Federal Old-Age and Survivors Insurance and Disability Insurance Trust Funds ,Washington, DC.
18
CMS Office of the Actuary, 2010. Projected Medicare Expenditures under an Illustrative Scenario with Alternative Payment Updates to Medicare Providers. Centers for Medicare and Medicaid Services, Baltimore, MD. Congressional Budget Office, 2009. The Long-Term Budget Outlook. Congressional Budget Office, Washington, DC. Congressional Budget Office, 2010a. The Budget and Economic Outlook: Fiscal Years 2010 to 2020. Congressional Budget Office, Washington, DC. Congressional Budget Office, 2010b. An Analysis of the President's Budgetary Proposals for Fiscal Year 2011. Congressional Budget Office, Washington, DC. Congressional Budget Office, 2010c, The Long-Term Budget Outlook. Congressional Budget Office, Washington, DC. Congressional Budget Office, 2010d. The Budget and Economic Outlook, An Update. Congressional Budget Office, Washington, DC. Ruffing, Kathy, and James R. Horney, 2010. Obama Budget Reduces Deficit by $1.3 Trillion over Next Decade Compared to Current Policies. Center on Budget and Policy Priorities, Washington, DC. Tax Policy Center, 2010. �Table T10-0106 Aggregate AMT Projections, 2009-2020.� Tax Policy Center, Washington, DC, http://www.taxpolicycenter.org/numbers/displayatab.cfm?Docid=2702&DocTypeID=7. White House Office of the Press Secretary, 2010. �President Obama Establishes Bipartisan National Commission on Fiscal Responsibility and Reform.� The White House, Washington, DC, http://www.whitehouse.gov/the-press-office/president-obama-establishes-bipartisan-national-commission-fiscal-responsibility-an.
Dollars (billions) Percent of GDP
CBO Baseline 6,246 3.3
Extend estate and gift tax repeal 577 0.3Extend 15 percent rate dividends and capital gains 315 0.2Extend other provisions of EGTRRA, JGTRRA 1,761 0.9Extend other non-stimulus expiring provisions 472 0.2Extend and index AMT exemption amounts for inflation 583 0.3Interaction effect of indexing AMT 658 0.3
Subtotal 4,365 2.3
Adjustments for spending policyAdjust defense spending -643 -0.3Adjust non-stimulus non-defense DS for population growth 248 0.1Freeze Medicare physician payment rates 286 0.2
Subtotal -109 -0.1
Net Interest 952 0.5
11,454 6.0Extended Policy
Table 1
Federal Budget DeficitCBO Baseline and Extended Policy 2011-2020
Adjustments for tax policy
Dollars (billions) Percent of GDP
CBO Baseline 6,246 3.3
Extend estate and gift tax at 2009 levels 253 0.1238 0.1
1,169 0.6rates, but revert to 36 and 39.6 rates
Provide marriage penalty relief 306 0.2Extend and index AMT exemption amounts for inflation 577 0.3Extend and expand the Making Work Pay and Child Tax Credit 161 0.1Jobs Initiatives 15 0.0Limit the rate at which itemized deductions can reduce tax liabili ty -289 -0.2Reform the international tax system -127 -0.1Impose a "Financial Crisis Responsibility Fee" -90 0.0Modify and extend the Build America Bonds program -80 0.0Other proposals 39 0.0
0.0Subtotal 2,173 1.1
Adjustments for spending policyAdjustment for non-defense discretionary outlays -97 -0.1Adjustment for defense outlays -643 -0.3Freeze Medicare physician payment rates 286 0.2Modify and extend the Build America Bonds program 88 0.0Modify Pell Grants 335 0.2Extend or expand refundable tax credits 401 0.2Undertake Jobs initiat ives 38 0.0Other proposals 139 0.1
Subtotal 548 0.3
Net Interest 707 0.4
9,674 5.1
Adjustments for tax policy
Administration Budget
Table 2
Federal Budget DeficitCBO Baseline and Administraion Budget 2011-2020
Create 20 percent rate on dividends and capital gainsExtend other provisions of EGTRRA and JGTRRA, and income tax
Baseline: Through 2085 Permanent Through 2085 Permanent Through 2085 Permanent
As a Percent of GDP 3.78 4.84 6.26 7.37 5.28 6.34In Trillions of Present-Value Dollars 28,782 70,324 47,593 107,085 40,143 92,192
w/ CMS actuary Medicare 5.57 7.84 8.05 10.37 7.07 9.3442,379 113,950 61,190 150,710 53,740 135,818
w/ CBO Alt. Baseline Medicare 6.32 9.56 8.79 12.09 7.81 11.0748,043 139,033 66,854 175,793 59,404 160,901
Source: Authors' calculations
CBO Baseline Administration Budget
Table 3Fiscal Gaps
Extended Policy
0
2
4
6
8
10
12
2010 2011 2012 2013 2014 2015 2016 2017 2018 2019 2020
Year
Perc
ent o
f GD
P
CBO Baseline
Extended Policy
Administration Budget
Figure 1. Alternative Deficit Projections, 2010-2020
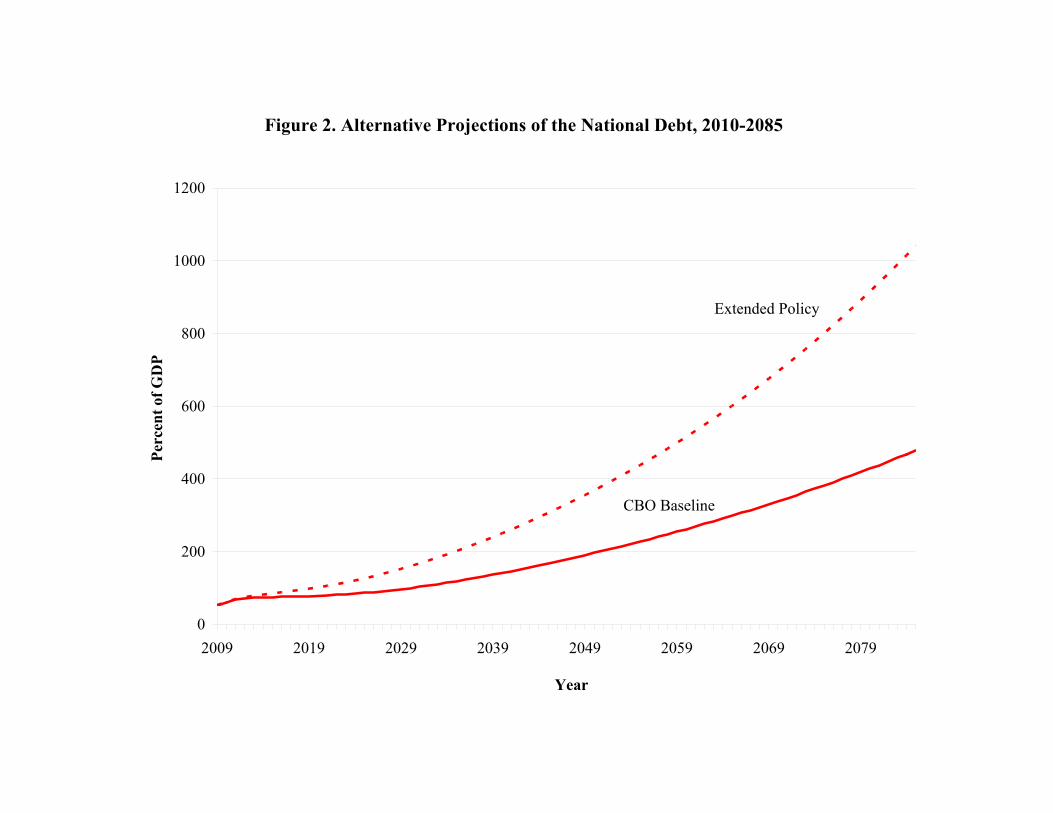
Figure 2. Alternative Projections of the National Debt, 2010-2085
0
200
400
600
800
1000
1200
2009 2019 2029 2039 2049 2059 2069 2079
Year
Perc
ent o
f GD
P
CBO Baseline
Extended Policy
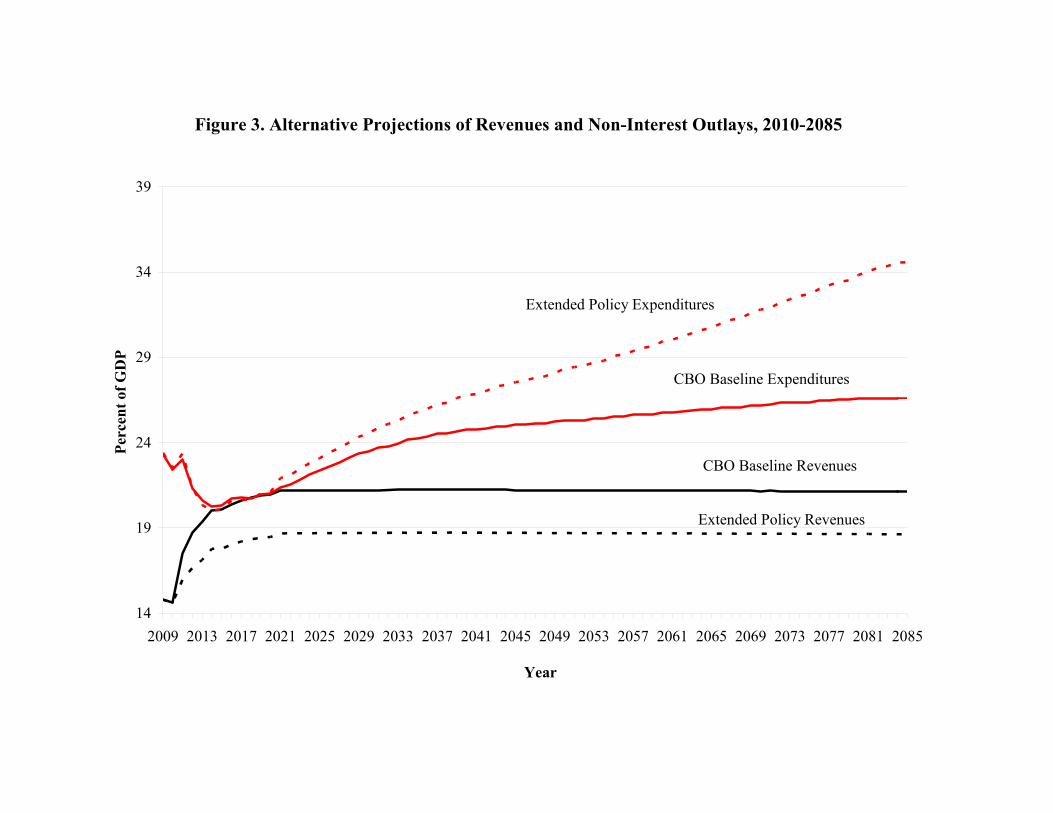
Figure 3. Alternative Projections of Revenues and Non-Interest Outlays, 2010-2085
14
19
24
29
34
39
2009 2013 2017 2021 2025 2029 2033 2037 2041 2045 2049 2053 2057 2061 2065 2069 2073 2077 2081 2085
Year
Perc
ent o
f GD
P
CBO Baseline Revenues
CBO Baseline Expenditures
Extended Policy Revenues
Extended Policy Expenditures
2010 2011 2012 2013 2014 2015 2016 2017 2018 2019 2020 2011-2020
1. CBO Baseline 1,342 1,066 665 525 438 507 585 579 562 634 685 6,246as percent of nominal GDP 9.1 7.0 4.2 3.1 2.5 2.7 3.0 2.8 2.6 2.9 3.0 3.3
Extend estate and gift tax repeal 0 11 42 49 55 61 65 68 72 75 79 577Extend 15 percent rate dividends and capital gains 0 14 13 30 29 32 35 37 39 41 43 315Extend other provisions of EGTRRA, JGTRRA 0 88 163 171 179 185 188 191 195 198 203 1,761Extend other non-stimulus expiring provisions 0 32 33 37 41 45 49 52 57 61 64 472Extend and index AMT exemption amounts for inflation 0 72 32 36 40 45 52 60 70 81 94 583Interaction effect of indexing AMT 0 13 46 52 58 65 71 78 85 92 99 658
Subtotal 0 231 328 375 404 434 460 487 517 548 581 4,365as percent of nominal GDP 0.0 1.5 2.1 2.2 2.3 2.3 2.4 2.4 2.4 548.4 2.5 2.3
Adjustments for spending policyAdjust defense spending 8 33 -26 -68 -82 -84 -85 -83 -83 -83 -82 -643
0 6 9 6 12 18 24 31 39 48 55 248Freeze Medicare physician payment rates 6 15 19 22 23 26 29 32 35 40 45 286
Subtotal 14 54 2 -40 -47 -40 -32 -20 -9 5 18 -109as percent of nominal GDP 0 0 0 0 0 0 0 0 0 0 0 0
Net Interest 0 3 10 24 46 67 94 122 157 194 236 952as a percent of nominal GDP 0 0 0 0 0 0 0 1 1 1 1 0
1,356 1,353 1,006 884 841 967 1,106 1,169 1,227 1,381 1,520 11,454as a percent of nominal GDP 9.2 8.9 6.4 5.3 4.7 5.2 5.7 5.7 5.8 6.2 6.6 6.0
GDP 14,666 15,148 15,764 16,705 17,760 18,630 19,508 20,398 21,293 22,205 23,154 190,567
Adjustments for tax policy
Adjust non-stimulus non-defense DS for population growth
Appendix Table 1
Federal Budget DeficitCBO Baseline and Extended Policy 2011-2020
3. Extended Policy
2010 2011 2012 2013 2014 2015 2016 2017 2018 2019 2020 2011-2020
1. CBO Baseline 1,342 1,066 665 525 438 507 585 579 562 634 685 6,246as percent of nominal GDP 9.1 7.0 4.2 3.1 2.5 2.7 3.0 2.8 2.6 2.9 3.0 3.3
Extend estate and gift tax at 2009 levels 0 -5 18 21 25 28 30 32 33 35 37 253
0 5 16 20 22 25 27 29 30 32 33 238
0 67 99 106 113 118 123 128 133 138 143 1,169rates, but revert to 36 and 39.6 rates4 0 0 0 0 0 0 0 0 0 0 0
Provide marriage penalty relief 0 18 26 28 30 31 32 33 34 35 36 306Extend and index AMT exemption amounts for inflation 6 66 32 36 41 46 52 60 70 81 93 577Extend and expand the Making Work Pay and Child Tax Credit 0 35 25 12 13 13 13 13 13 13 13 161Undertake Jobs Initiatives 12 18 -2 0 0 0 0 0 0 0 0 15Limit the rate at which itemized deductions can reduce tax liability 0 -7 -22 -24 -26 -29 -31 -34 -36 -38 -41 -289Reform the international tax system 0 -6 -12 -12 -13 -13 -14 -14 -13 -14 -15 -127Impose a "Financial Crisis Responsibili ty Fee" 0 -8 -8 -9 -9 -9 -9 -9 -9 -10 -10 -90Modify and extend the Build America Bonds program 0 0 -2 -4 -5 -7 -9 -10 -12 -14 -16 -80Other proposals 36 41 5 -9 -5 -2 0 1 2 3 4 39
Subtotal 54 223 174 166 184 200 214 229 245 260 277 2,173as percent of nominal GDP 0.4 1.5 1.1 1.0 1.0 1.1 1.1 1.1 1.1 1.2 1.2 1.1
Adjustments for spending policyAdjustment for non-defense discretionary outlays 1 -4 -11 -19 -15 -12 -10 -9 -9 -7 -1 -97Adjustment for defense outlays 8 33 -26 -68 -82 -84 -85 -83 -83 -83 -82 -643Freeze Medicare physician payment rates 5 15 19 22 23 26 29 32 35 40 45 286Modify and extend the Build America Bonds program 0 1 3 4 6 8 10 11 13 15 17 88Modify Pell Grants 2 9 22 34 34 35 37 38 39 42 45 335Extend or expand refundable tax credits 0 0 61 42 42 41 42 42 43 44 45 401Undertake Jobs initiatives 12 25 8 3 2 0 0 0 0 0 0 38Other proposals 41 57 9 12 12 10 10 9 8 7 6 139Net Interest 0 2 5 9 12 15 18 22 26 30 36 175Subtotal 69 135 85 30 21 24 31 40 47 59 75 548
as percent of nominal GDP 0.5 0.9 0.5 0.2 0.1 0.1 0.2 0.2 0.2 0.3 0.3 0.3
Net Interest 1 5 13 25 40 54 72 90 112 135 161 707as a percent of nominal GDP 0.0 0.0 0.1 0.1 0.2 0.3 0.4 0.4 0.5 0.6 0.7 0.4
1,466 1,430 937 746 684 786 902 938 966 1,088 1,198 9,674as a percent of nominal GDP 10.0 9.4 5.9 4.5 3.9 4.2 4.6 4.6 4.5 4.9 5.2 5.1
GDP 14,666 15,148 15,764 16,705 17,760 18,630 19,508 20,398 21,293 22,205 23,154 190,567
Appendix Table 2
Federal Budget DeficitCBO Baseline and Administration Budget 2011-20201, 2
Adjustments for tax policy
3. Administration Budget
Create 20 percent rate on dividends and capital gains3
Extend other provisions of EGTRRA and JGTRRA, and income tax