Embed Size (px)
Citation preview
Budget Strategy and Outlook 2013-14
Budget Paper No. 2

Budget Strategy and Outlook1
ContentsPart 1 Fiscal Outlook Report: 2013-14 Budget 3
Under Treasurer’s Certification 5
1 Overview 7
2 Fiscal Strategy Statement 11
3 Updated Fiscal Outlook 21
4 Risks to the Updated Financial Projections 39
5 Uniform Presentation Framework 49
Part 2 Key Budget Components 69
6 Expenses and Capital Investment 71
7 Intergovernmental Revenue 89
8 Territory Taxes and Royalties 105
Appendices 123
A. Classification of Entities in the Northern Territory 125
B. Contingency Reserve 126
C. Glossary 128
In this book, the term ‘state’ or ‘states’ includes the Australian Capital Territory and the Northern Territory, unless the context indicates otherwise.


Part 1
Fiscal Outlook Report: 2013-14
Budget

Budget Strategy and Outlook5
This part of Budget Paper No. 2 satisfies the requirements under the Fiscal Integrity and Transparency Act (FITA) in relation to the budget-time fiscal outlook report.
Section 14 of FITA states that the purpose of such a fiscal outlook report is to ‘…provide updated information to allow the assessment of the Government’s fiscal performance against the fiscal strategy set out in its current fiscal strategy statement.’
Consistent with previous years, the financial statements for all sectors are presented in accordance with accounting standard AASB 1049 – Whole of Government and General Government Sector Financial Reporting.
References to ‘…the budget year and the following three financial years’ as required under section 10(1) of FITA throughout this fiscal outlook report encompass 2013-14 as the budget year and the years 2014-15, 2015-16 and 2016-17 as the following three financial years.
Under section 21(1) of FITA, the Under Treasurer is responsible for the accuracy, completeness and reliability of all financial projections and associated information contained in the statements and reports required to be published under the Fiscal Integrity and Transparency Framework.
As required under section 21(3) of FITA, the following signed certification statement is provided by the Under Treasurer:
Under Treasurer’s CertificationIn accordance with provisions of the Fiscal Integrity and Transparency Act, I certify that, to the fullest extent possible, the financial projections and associated information contained in this fiscal outlook report:
• reflect the best professional judgment of officers of the Department of Treasury and Finance;
• take into account all relevant information currently available to me; and
• incorporate the fiscal implications of all relevant Government decisions and circumstances that are currently known or have been disclosed to me.
Alan Tregilgas
Under Treasurer
9 May 2013
Budget Strategy and Outlook7Overview
Chapter 1Fiscal Outlook
OverviewThe constrained revenues and higher spending levels evident in recent years have put significant pressure on the Territory’s fiscal position, with debt levels on the rise.
The Territory’s deteriorating debt position in recent times has been due in part to the increased reliance on borrowings by the Power and Water Corporation (PWC). Rather than being self supporting as is normally the case for a commercially focused entity, PWC for some time has been heavily reliant on taxpayer support.
For the time being, therefore, the Government’s finances must be assessed by reference to the non financial public sector, which includes both general government agencies and public non financial corporations like PWC. The focus can return to the general government sector once PWC becomes commercially sustainable.
The Territory has moved from a position of low and reducing debt levels just four years ago to a path of increasing indebtedness. Based on the Department of Treasury and Finance’s (Treasury) projections as at August 2012, continuation of existing policy would have seen the net debt to revenue ratio of the Territory’s non financial public sector reach 98 per cent by 2015-16, more than three times the 29 per cent recorded in 2009-10.
To reverse this fiscal deterioration, the Government that was elected in August 2012 adopted as its immediate fiscal objective, the stabilising of the Territory’s debt burden by targeting elimination of the overall fiscal deficit (‘fiscal imbalance’) by the year 2015-16.
At the time of the Mini Budget in December 2012, a pathway to returning to surplus had been established with a modest deficit of $53 million projected in 2015-16. This was to be achieved through a number of significant fiscal repair measures that continue in this budget, including savings measures across all government agencies, a range of increases in own-source revenues, including agency fees and charges, and addressing the commercial sustainability of PWC.
However, since the Mini Budget, additional annual revenue reductions in excess of $100 million from 2013-14 are now projected. This reflects continuing lower growth in goods and services tax (GST) collections compounded by reductions in the Territory’s share of GST revenue from 5.7 per cent in 2012-13 to 5.4 per cent in 2013-14, following the Commonwealth Grants Commission’s February 2013 Update.
In addition, the Government has opted to ease the impact of the necessary budgetary adjustment on Territory households and businesses by phasing in the announced PWC price increases over three years.
The combined effect of the developments has been the deferring of the achievement of fiscal balance by two years to 2017-18.
In the absence of any further revenue increase in untied revenues, moderate budget improvement measures will be required to achieve this target by 2017-18. A budget monitoring framework and mid-year review process

2013-14 Budget8Overview
Table 1.1: Non Financial Public Sector – Key Fiscal Indicators
Economic Outlook
have been implemented to ensure the Government’s fiscal objectives are achieved.
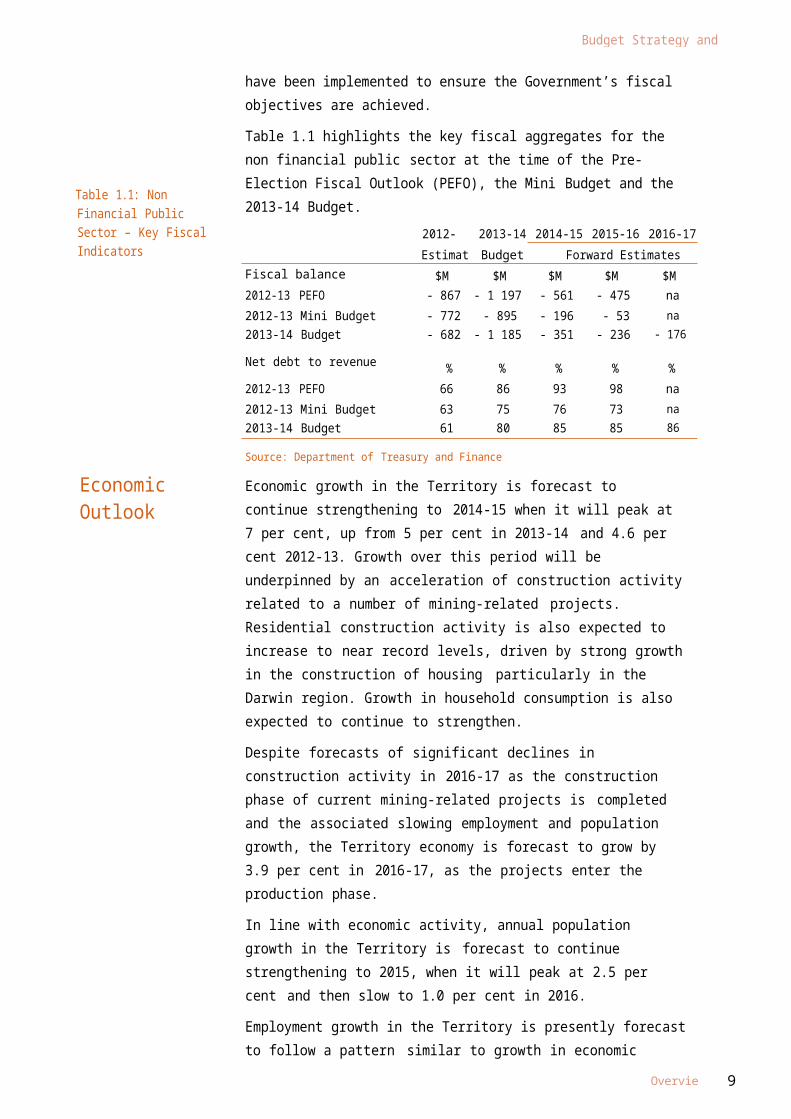
Table 1.1 highlights the key fiscal aggregates for the non financial public sector at the time of the Pre-Election Fiscal Outlook (PEFO), the Mini Budget and the 2013-14 Budget.
2012-13 2013-14 2014-15 2015-16 2016-17
Estimate Budget Forward Estimates
Fiscal balance $M $M $M $M $M2012-13 PEFO - 867 - 1 197 - 561 - 475 na
2012-13 Mini Budget - 772 - 895 - 196 - 53 na
2013-14 Budget - 682 - 1 185 - 351 - 236 - 176
Net debt to revenue % % % % %
2012-13 PEFO 66 86 93 98 na
2012-13 Mini Budget 63 75 76 73 na
2013-14 Budget 61 80 85 85 86
Source: Department of Treasury and Finance
Economic growth in the Territory is forecast to continue strengthening to 2014-15 when it will peak at 7 per cent, up from 5 per cent in 2013-14 and 4.6 per cent 2012-13. Growth over this period will be underpinned by an acceleration of construction activity related to a number of mining-related projects. Residential construction activity is also expected to increase to near record levels, driven by strong growth in the construction of housing particularly in the Darwin region. Growth in household consumption is also expected to continue to strengthen.
Despite forecasts of significant declines in construction activity in 2016-17 as the construction phase of current mining-related projects is completed and the associated slowing employment and population growth, the Territory economy is forecast to grow by 3.9 per cent in 2016-17, as the projects enter the production phase.
In line with economic activity, annual population growth in the Territory is forecast to continue strengthening to 2015, when it will peak at 2.5 per cent and then slow to 1.0 per cent in 2016.
Employment growth in the Territory is presently forecast to follow a pattern similar to growth in economic activity and population.
The forecast for the Darwin consumer price index (CPI) in 2013 has been revised downward from the 4.3 per cent reported in the 2012-13 Mini Budget, reflecting the decision to phase in utility price increases over three years. Thereafter, growth in the Darwin CPI is forecast to slow.
Budget Strategy and Outlook9Overview
Table 1.2: Key Economic
Indicators
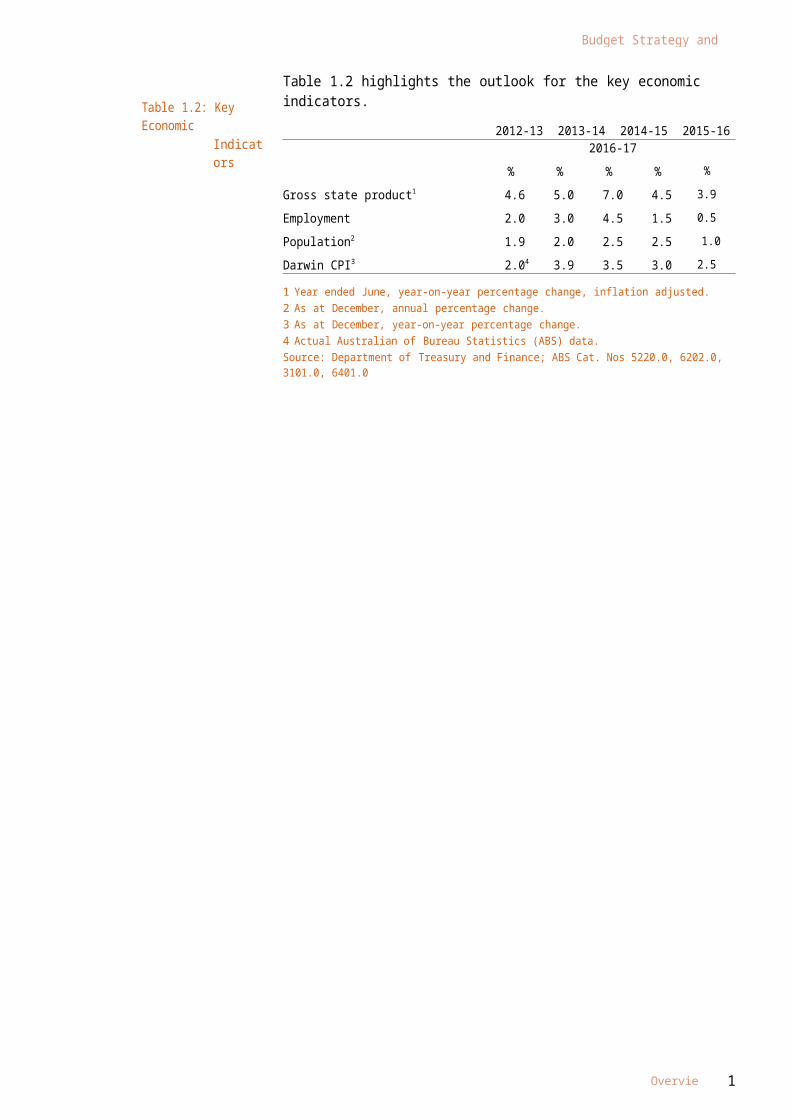
Table 1.2 highlights the outlook for the key economic indicators.
2012-13 2013-14 2014-15 2015-16 2016-17
% % % % %
Gross state product1 4.6 5.0 7.0 4.5 3.9
Employment 2.0 3.0 4.5 1.5 0.5
Population2 1.9 2.0 2.5 2.5 1.0
Darwin CPI3 2.04 3.9 3.5 3.0 2.5
1 Year ended June, year-on-year percentage change, inflation adjusted.2 As at December, annual percentage change.3 As at December, year-on-year percentage change.4 Actual Australian of Bureau Statistics (ABS) data.Source: Department of Treasury and Finance; ABS Cat. Nos 5220.0, 6202.0, 3101.0, 6401.0
102013-14 Budget
Chapter 2Overview
Fiscal Strategy StatementFollowing the change of government in August 2012 and in accordance with the requirements of the Fiscal Integrity and Transparency Act (FITA), the new Government set out its fiscal strategy statement in the Mini Budget brought down on 4 December 2012.
The Government’s fiscal strategy was developed against the background of a deteriorating fiscal position as evidenced by the emergence of operating deficits, increasing annual borrowing requirements and rapidly rising debt.
This fiscal deterioration was evident not only in the general government sector but also in the public non financial corporations sector. Together these two sectors make up the non financial public sector. Under normal circumstances, the public non financial corporations sector contains commercially focused and self-supporting trading entities. However this was not the case in the Territory, due to the significant capital investment program of the Power and Water Corporation (PWC), the Territory’s largest trading entity and only government owned corporation, and PWC’s over-reliance on government financial support.
In order to reverse this fiscal deterioration, the Government adopted, as its immediate fiscal objective on assuming office, the stabilising of the Territory’s debt burden by targeting elimination of the overall fiscal deficit (‘fiscal imbalance’). Once this goal is achieved, the Government will be in a position to set targets that keep net debt at prudent levels over the medium term.
The Government initially targeted elimination of the fiscal imbalance by the 2015-16 year. However, in February 2013, the Territory was hit by a reduced share of national goods and services tax (GST) collections following the Commonwealth Grants Commission’s (CGC) 2013 Update. In response, in March 2013 the Government opted to extend the target of reaching a fiscal balance by two years to 2017-18 so as not to place an excessive burden on Territory households and businesses that would arise if the 2015-16 target year was maintained in the face of the cutback in GST revenue. This also enabled the Government to phase in the utility tariff increases previously announced.
The rest of this chapter provides information on, and analysis of, the Government’s fiscal strategy, including information as required under FITA. This includes:
• an analysis of recent historical fiscal trends that have led to the Government’s fiscal strategy;
• an exposition of the strategy’s medium-term fiscal objectives and targets; and
• an assessment of the strategy against fiscal principles.
An assessment of the current fiscal outlook against the Government’s fiscal strategy is provided in Chapter 3.
12Fiscal Strategy Statement2013-14 Budget
Recent Fiscal Developments
This section addresses the requirement under section 9(1)(c) of FITA that the key fiscal indicators considered important, and against which fiscal policy will be set, be specified. It also analyses recent fiscal developments and the no-policy-change fiscal outlook in terms of these key fiscal indicators.
Key Fiscal IndicatorsThe key indicators against which fiscal policy can be set and assessed are:
• the general government sector’s net operating balance;
• the rate of return earned on capital employed by government owned corporations;
• the rate of growth in infrastructure assets implied by annual net infrastructure investment, in both the general government sector and for government owned corporations;
• the non financial public sector’s fiscal balance; and
• the non financial public sector’s net debt as a proportion of the sector’s total revenue.
The fiscal strategy described in the next section is a direct response to the deterioration in the Territory’s fiscal performance and outlook evident over recent years as measured in terms of each of these key indicators.
General Government Sector’s Net Operating BalanceThe net operating balance is measured by the general government sector’s total annual revenues less its total annual operating expenses (including annual depreciation). A net operating deficit indicates that total annual operating expenses exceed total annual revenues.
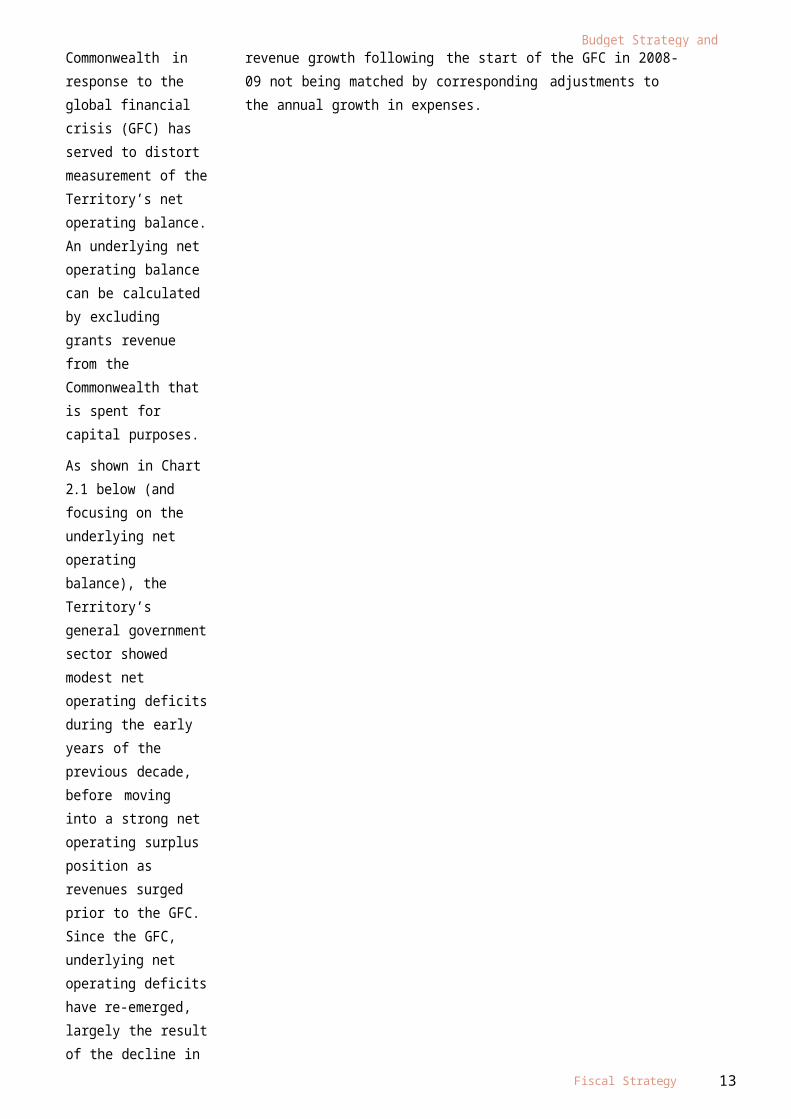
While total annual revenues used to calculate the net operating balance under the Uniform Presentation Framework (UPF) are inclusive of grants paid to the states and territories for capital purposes (notwithstanding the exclusion of asset sales revenue and other sources of capital funding), there is little doubt that the surge in capital grants from the Commonwealth in response to the global financial crisis (GFC) has served to distort measurement of the Territory’s net operating balance. An underlying net operating balance can be calculated by excluding grants revenue from the Commonwealth that is spent for capital purposes.
As shown in Chart 2.1 below (and focusing on the underlying net operating balance), the Territory’s general government sector showed modest net operating deficits during the early years of the previous decade, before moving into a strong net operating surplus position as revenues surged prior to the GFC. Since the GFC, underlying net operating deficits have re-emerged, largely the result of the decline in revenue growth following the start of the GFC in 2008-09 not being matched by corresponding adjustments to the annual growth in expenses.

Budget Strategy and Outlook13Fiscal Strategy Statement
Chart 2.1: Underlying Operating Balance1 – General Government
Sector as Projected in
August 2012
Chart 2.2: Revenue-RaisingEffort –
General Government Sector
1 The underlying net operating balance excludes grant revenue from the Commonwealth that is spent for capital purposes.
Source: Department of Treasury and Finance
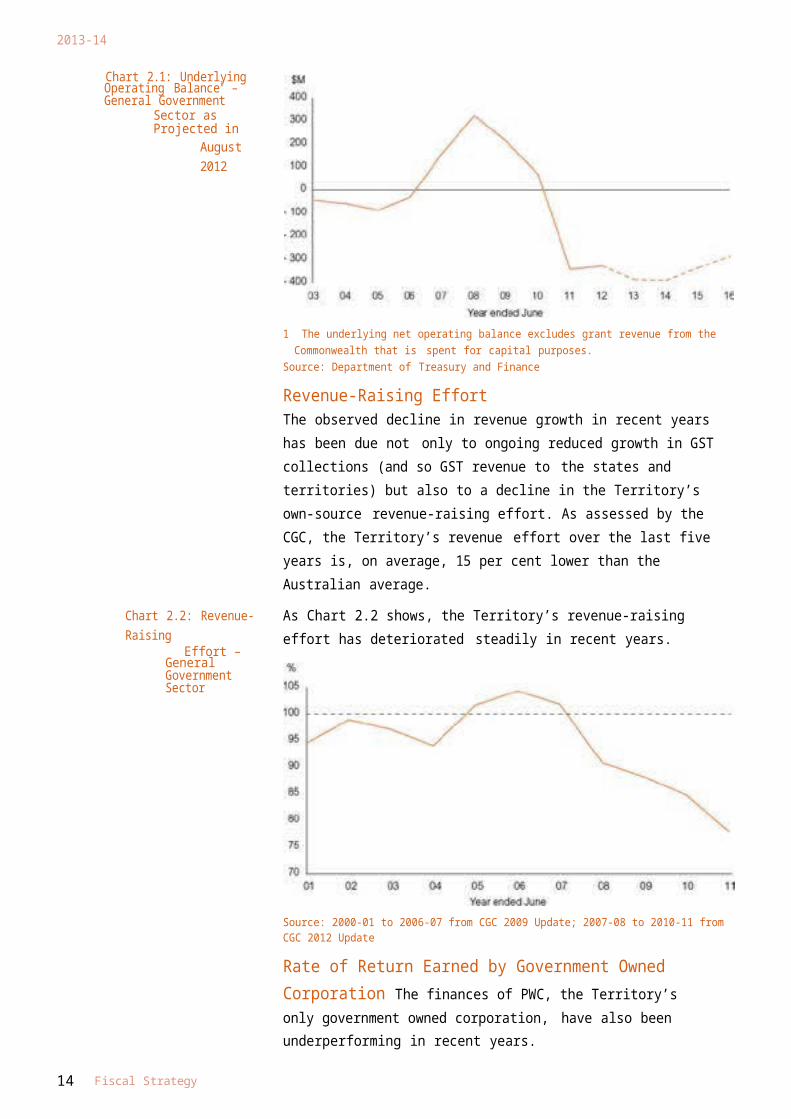
Revenue-Raising EffortThe observed decline in revenue growth in recent years has been due not only to ongoing reduced growth in GST collections (and so GST revenue to the states and territories) but also to a decline in the Territory’s own-source revenue-raising effort. As assessed by the CGC, the Territory’s revenue effort over the last five years is, on average, 15 per cent lower than the Australian average.
As Chart 2.2 shows, the Territory’s revenue-raising effort has deteriorated steadily in recent years.
Source: 2000-01 to 2006-07 from CGC 2009 Update; 2007-08 to 2010-11 from CGC 2012 Update
Rate of Return Earned by Government Owned Corporation The finances of PWC, the Territory’s only government owned corporation, have also been underperforming in recent years.
The (pre-tax) rate of return earned on capital employed is the standard indicator of a government owned corporation’s financial performance. This is measured by the corporation’s earnings before interest and taxes as a percentage of the current value of the total capital employed by that corporation.
Provided the capital employed figure to which the rate of return is applied is regularly revalued (as is the case for PWC), the pre-tax rate of return
2013-14 Budget14Fiscal Strategy Statement
Chart 2.3: Pre-Tax Annual Rate of Return:
Power and Water Corporation
as Projected in August 2012
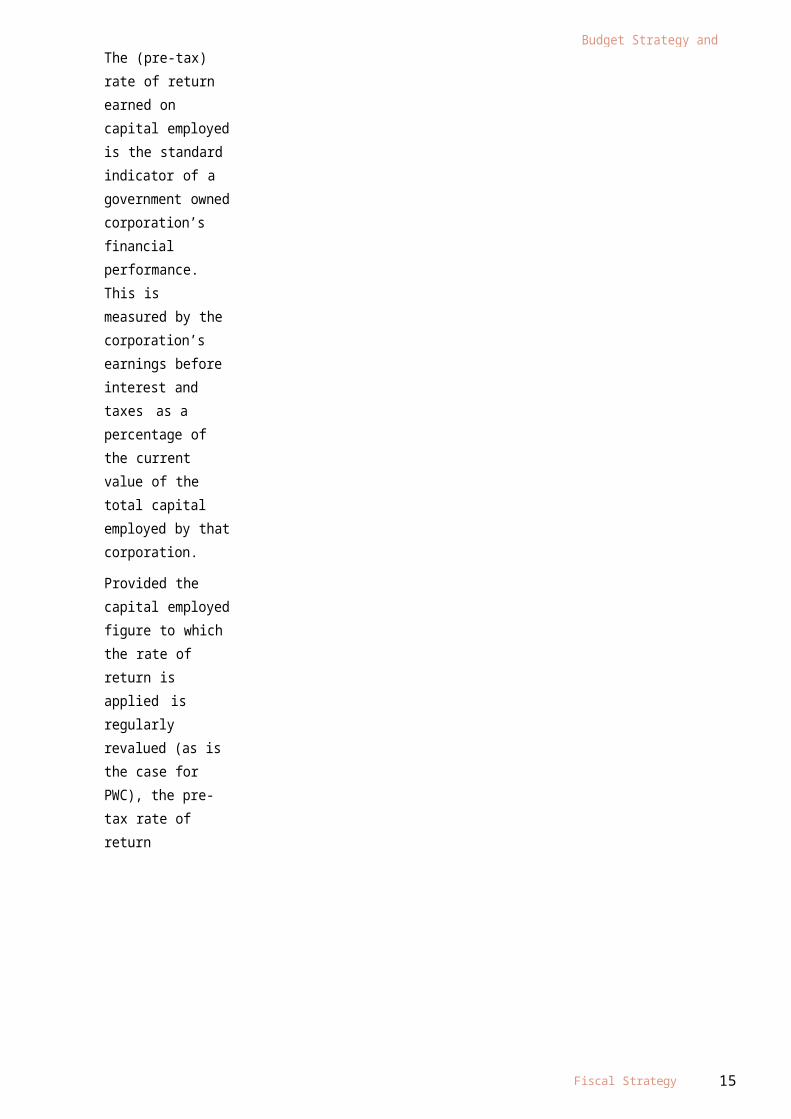
achieved can be benchmarked against the weighted average cost of capital measured in pre-tax inflation-adjusted (or real) terms. On this basis, the weighted average cost of capital to be targeted by PWC is in excess of 6 per cent.
As Chart 2.3 shows, PWC’s actual annual rates of return have fallen well short of commercial levels. Based on its 2012-13 Statement of Corporate Intent (and after adjusting asset values to a replacement cost methodology consistent with that used in the whole of government accounts), PWC’s annual financial performance was projected to remain well below commercial levels over the period to 2015-16 under no-policy-change conditions.
Source: Department of Treasury and Finance
Rate of Growth in Infrastructure AssetsInvestment in infrastructure is a key component in the delivery of the Territory’s social and economic requirements, thereby ensuring that current and future Territorians have access to public services that are at least maintained over time.
The ‘net acquisition of non financial assets’ aggregate reported under the UPF, in effect measures net annual infrastructure investment. This involves the annual investment over and above that required to maintain the service capacity of the existing infrastructure asset base. The associated annual rate of growth in infrastructure assets can be calculated by expressing the net annual infrastructure investment amount as a percentage of the depreciated value (or service capacity) of all such assets at the beginning of the year concerned.
Chart 2.4 shows the implied rate of growth in infrastructure assets, both recently and as projected in August 2012 on a no-policy-change basis, for both the general government sector and for PWC. Commonwealth-funded programs such as the Nation Building – Fiscal Stimulus Package, Remote Indigenous Housing and National Network Roads have been excluded.
Budget Strategy and Outlook15Fiscal Strategy Statement
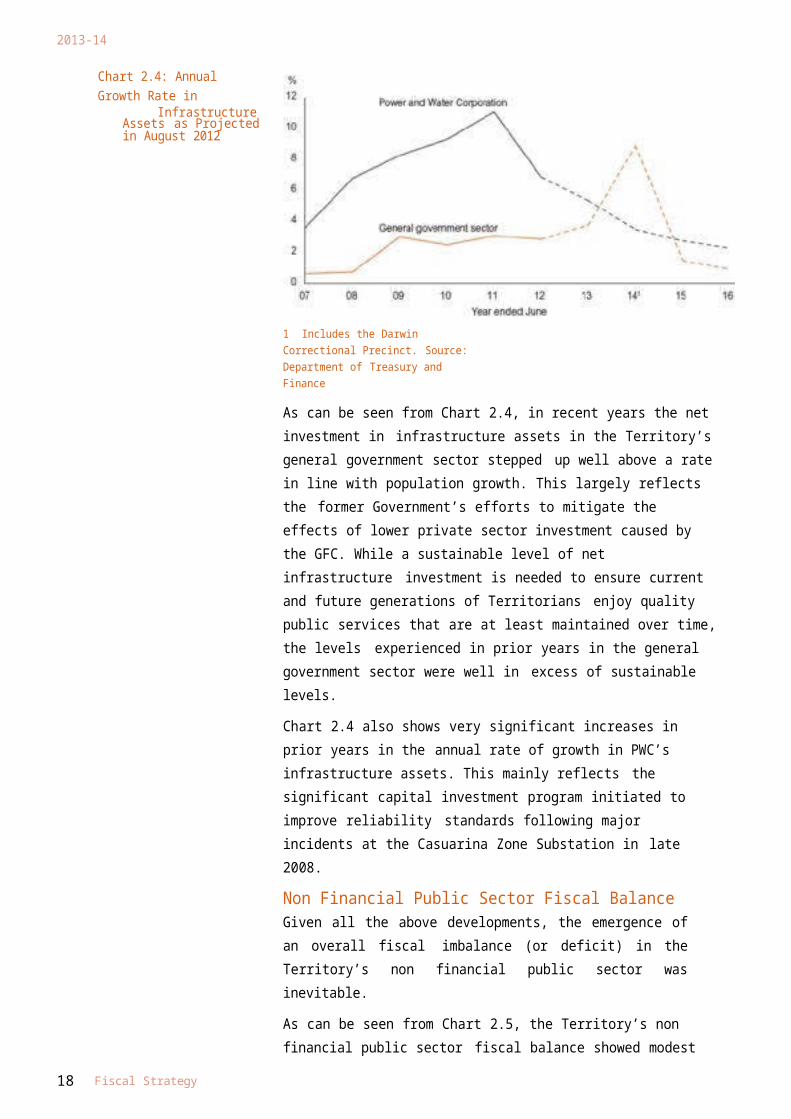
Chart 2.4: Annual Growth Rate in
Infrastructure Assets as Projected in August 2012
1 Includes the Darwin Correctional Precinct. Source: Department of Treasury and Finance
As can be seen from Chart 2.4, in recent years the net investment in infrastructure assets in the Territory’s general government sector stepped up well above a rate in line with population growth. This largely reflects the former Government’s efforts to mitigate the effects of lower private sector investment caused by the GFC. While a sustainable level of net infrastructure investment is needed to ensure current and future generations of Territorians enjoy quality public services that are at least maintained over time, the levels experienced in prior years in the general government sector were well in excess of sustainable levels.
Chart 2.4 also shows very significant increases in prior years in the annual rate of growth in PWC’s infrastructure assets. This mainly reflects the significant capital investment program initiated to improve reliability standards following major incidents at the Casuarina Zone Substation in late 2008.
Non Financial Public Sector Fiscal BalanceGiven all the above developments, the emergence of an overall fiscal imbalance (or deficit) in the Territory’s non financial public sector was inevitable.
As can be seen from Chart 2.5, the Territory’s non financial public sector fiscal balance showed modest deficits in the early part of the last decade before transitioning to a modest surplus position by the mid-2000s onthe back of surging tax-related revenues prior to the GFC. This situation worsened post 2008-09 and, based on the forward estimates as at August 2012, significant overall fiscal deficits were expected under no-policy-change conditions across all forward years.
2013-14 Budget16Fiscal Strategy Statement
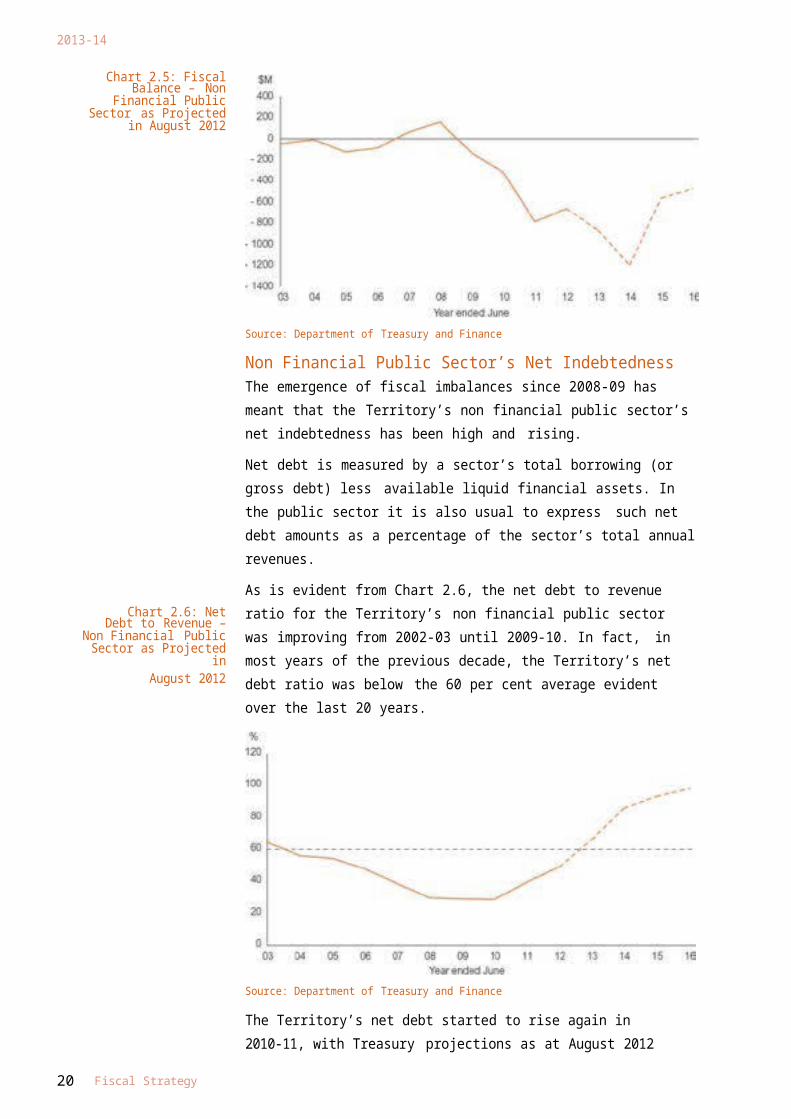
Chart 2.5: Fiscal Balance – Non Financial Public Sector as Projected in
August 2012
Chart 2.6: Net Debt to Revenue – Non
Financial Public Sector as Projected inAugust 2012
Source: Department of Treasury and Finance
Non Financial Public Sector’s Net IndebtednessThe emergence of fiscal imbalances since 2008-09 has meant that the Territory’s non financial public sector’s net indebtedness has been high and rising.
Net debt is measured by a sector’s total borrowing (or gross debt) less available liquid financial assets. In the public sector it is also usual to express such net debt amounts as a percentage of the sector’s total annual revenues.
As is evident from Chart 2.6, the net debt to revenue ratio for the Territory’s non financial public sector was improving from 2002-03 until 2009-10. In fact, in most years of the previous decade, the Territory’s net debt ratio was below the 60 per cent average evident over the last 20 years.
Source: Department of Treasury and Finance
The Territory’s net debt started to rise again in 2010-11, with Treasury projections as at August 2012 confirming that this rise was expected to continue over the forward estimates period on a no-policy-change basis. The prospects were for the Territory’s net debt to revenue ratio to reach 98 per cent, more than three times the 29 per cent recorded in 2009-10.
Budget Strategy and Outlook17Fiscal Strategy Statement
The Government’s Fiscal Strategy
Against the background of the fiscal deterioration described in the previous section, this section addresses the following requirements under section 9(1) of FITA, namely that a fiscal strategy statement is to specify:
• the Government’s medium-term fiscal objectives in the context of its broad strategic priorities; and
• for the budget year and the following three financial years:
– the Government’s fiscal objectives and targets; and
– the expected outcomes for the specified key fiscal indicators.
Medium-Term Fiscal ObjectivesThe Government’s overarching fiscal objective is to manage public assets, liabilities and budgetary risks in such a way as to ensure that it has the financial capacity to deliver its long-term service and infrastructure commitments without having to resort to undue reliance on debt or excessive levels of taxation and/or other revenue raising.
To ensure that the Government reaches a position where it has the uncommitted financial resources available to fund new policy initiatives, the general aim of the Government’s fiscal strategy is to build the fiscal space needed to:
• ensure maintenance of service provision and associated infrastructure;
• deal with fiscal risks; and
• keep the Territory’s finances on a path of sustainability.
In this way the Government seeks to put the Territory’s finances on to a fiscally responsible and sustainable course.
Short-Term Fiscal TargetsTo respond to the recent deterioration in the Territory’s fiscal performance and outlook described in the previous section, the Government initially opted to target elimination of the fiscal imbalance in the non financial public sector by 2015-16.
However, in March 2013, the Government announced that it had decided to extend the target date for the elimination of the fiscal imbalance by two years. As a result, certain associated fiscal outcomes have also been pushed out. The decision to defer the elimination of the overall fiscal deficit was taken in response to falling GST revenues and the potential impacts on Territory households and businesses of overzealous fiscal adjustment.
The Territory’s share of GST revenue is its largest revenue source. The lower growth in GST collections evident for some time has recently been compounded by reductions in the Territory’s relative share of GST revenue from 5.7 per cent in 2012-13 to 5.4 per cent in 2013-14, following the CGC February 2013 Update. This has resulted in projected revenue reductions in excess of $100 million from 2013-14.
Achieving this fiscal target will materially assist in returning the Territory’s net debt position to prudent levels.
2013-14 Budget18Fiscal Strategy Statement
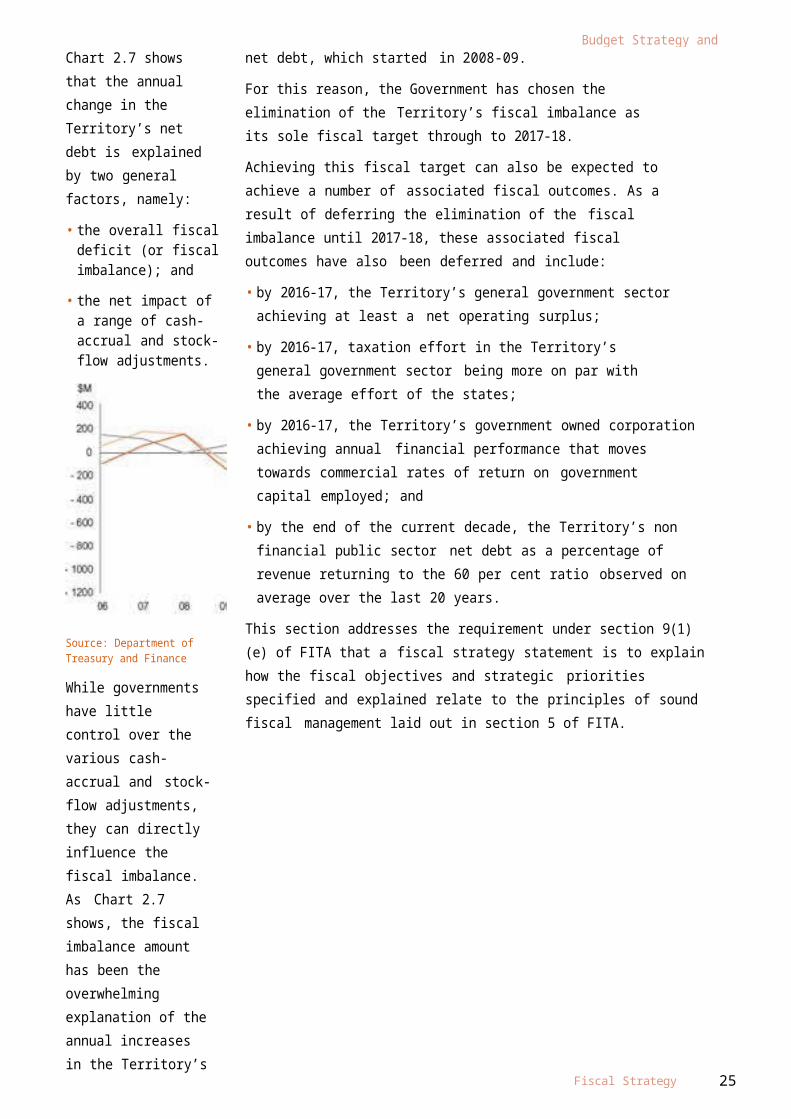
Chart 2.7: Contributors to the Annual Change in Net
Debt as Projected in August 2012
Assessment of Strategy Against
FITA’s Fiscal Principles
Chart 2.7 shows that the annual change in the Territory’s net debt is explained by two general factors, namely:
• the overall fiscal deficit (or fiscal imbalance); and
• the net impact of a range of cash-accrual and stock-flow adjustments.
Source: Department of Treasury and Finance
While governments have little control over the various cash-accrual and stock-flow adjustments, they can directly influence the fiscal imbalance. As Chart 2.7 shows, the fiscal imbalance amount has been the overwhelming explanation of the annual increases in the Territory’s net debt, which started in 2008-09.
For this reason, the Government has chosen the elimination of the Territory’s fiscal imbalance as its sole fiscal target through to 2017-18.
Achieving this fiscal target can also be expected to achieve a number of associated fiscal outcomes. As a result of deferring the elimination of the fiscal imbalance until 2017-18, these associated fiscal outcomes have also been deferred and include:
• by 2016-17, the Territory’s general government sector achieving at least a net operating surplus;
• by 2016-17, taxation effort in the Territory’s general government sector being more on par with the average effort of the states;
• by 2016-17, the Territory’s government owned corporation achieving annual financial performance that moves towards commercial rates of return on government capital employed; and
• by the end of the current decade, the Territory’s non financial public sector net debt as a percentage of revenue returning to the 60 per cent ratio observed on average over the last 20 years.
This section addresses the requirement under section 9(1)(e) of FITA that a fiscal strategy statement is to explain how the fiscal objectives and strategic priorities specified and explained relate to the principles of sound fiscal management laid out in section 5 of FITA.
Budget Strategy and Outlook
19Fiscal Strategy Statement
Effect on Employment and Economic Prosperity and DevelopmentThe first of the FITA’s current fiscal management principles is that spending and taxing policies are to be formulated and applied with consideration to the effect of these policies on employment and the economic prosperity and development of the Territory.
Fiscal consolidation can have a detrimental effect on employment and economic prosperity if undertaken in undue haste or when the economy is weak. The fiscal adjustment delivered by the Mini Budget was to take place at a time when the Territory economy is relatively strong, with relatively high rates of growth in gross state product, employment and population. Since the Mini Budget, the Government has decided to temper the pace of fiscal adjustment in the face of further declining GST revenues in order to minimise the impact on the Territory’s economic prosperity and development.
Fiscal adjustment nevertheless remains a key priority of the Government. Without such policy adjustment, investors in the Territory would be faced with inevitable and larger increases in government taxes and charges than those that have now been put in place, with a dampening effect on new investment in the Territory.
Effect on Stability and PredictabilityThe second of FITA’s current fiscal management principles is that spending and taxing policies are to be formulated and applied to give rise to a reasonable degree of stability and predictability.
Stability and predictability are only really attainable when the Territory’s finances are in balance and sustainable. When the Territory’s finances are such that net debt is high and rising, fiscal adjustment is inevitable. The longer such adjustment is delayed, the greater any eventual rebalancing of revenue and expenditure. The Government’s fiscal strategy is aimed directly at restoring budgetary conditions conducive to ongoing stability and predictability.
Extent to which Funding for Current Services is Provided by the Current GenerationThe third of FITA’s current fiscal management principles is that funding for current services is to be provided by the current generation.
While cyclical (as opposed to structural) deficits might have some role to play for their automatic stabiliser effects during an economic downturn and to ensure that tax smoothing occurs for taxpayers, structural operating deficits should be avoided at all times.
Persistent operating deficits indicate that operating revenue is insufficient to finance current operations. In effect, future generations are being asked to fund public goods and services consumed by the current generation. Operating deficits also provide no capacity for investment in infrastructure beyond depreciation levels which, in the case of the Territory, will be detrimental due to its high infrastructure needs.
2013-14 Budget
20 Fiscal Strategy Statement
Risk of Excessive Debt
Risks from the Ownership ofTrading Entities
Risk of Erosion of the Territory’s Revenue
Base
Risk Arising from the Management of Assets
andLiabilities
The adjustment delivered by the Government’s fiscal strategy aims in part to return to operating surpluses and for this reason targets current services funded by the current generation.
Effects on Financial Risks Faced by the TerritoryThe fourth of FITA’s current fiscal management principles is that the financial risks faced by the Territory are to be prudently managed (having regard to economic circumstances), including the maintenance of Territory debt at prudent levels.
These financial risks include risks from excessive debt, the ownership of trading entities, erosion of the Territory’s revenue base, and the management of assets and liabilities.
The risks associated with excessive debt are numerous. They not only restrict the fiscal capacity of governments to maintain an appropriate level of services to Territorians, due to increased borrowing costs, but also result in a legacy issue for future generations.
In addition, excessive debt will send negative signals to a wide range of investors in the Territory.
The Government’s fiscal strategy directly tackles the risk of excessive debt because its single focus is to return the budget to a balanced position, thereby ceasing ongoing increases in net debt. In addition, as the growth in net debt is substantially slowed over the forward estimates, previous requirements for new borrowings are being substantially reduced.
Commercial entities by their very nature are meant to be self-supporting and largely autonomous. Government, in setting its fiscal policy, needs to be aware of the risks in relation to its continuing ownership of trading entities and ensuring their commercial sustainability.
The Government’s fiscal strategy directly tackles the commercial risks of ownership of trading entities as it is focused on returning the Territory’s only government owned corporation to a commercially sustainable position. Achieving the fiscal strategy target will require PWC to contribute positively to the Government’s fiscal position, rather than being over-reliant on financial support from the general government sector as has been the case in recent years.
The Government’s fiscal strategy needs to be cognisant of, and reactive to, the effect of any significant changes in the Territory’s revenue base, irrespective of its short or longer-term source.
The fiscal strategy directly tackles the risk of erosion of the Territory’s revenue base by its initial focus on policy measures aimed at lifting the Territory’s revenue-raising effort towards a level consistent with the average of the states.
The Government’s fiscal strategy tackles the risk arising from the management of assets and liabilities primarily by re-asserting control over the level and growth of the Government’s assets and liabilities and associated increases in repairs and maintenance.
21Updated Fiscal Outlook
Budget Strategy and Outlook
Chapter 3Overview
Updated Economicand Other
Assumptions
Updated Fiscal OutlookThis chapter addresses the requirement under section 10(1)(a) of the Fiscal Integrity and Transparency Act (FITA) that each fiscal outlook report contains updated financial projections for the budget year and the following three financial years for the Territory general government sector and the Territory non financial public sector.
Although the full set of financial projections is provided in Chapter 5, this chapter provides:
• an overview of these financial projections;
• the key assumptions underlying them;
• a comparison with the estimates provided in the previous fiscal outlook report, the Mini Budget that was published in December 2012, as well as with those published in August 2012; and
• an assessment of the updated fiscal outlook against the fiscal strategy set out in Chapter 2.
This section addresses the requirements under section 10(1) of FITA that each fiscal outlook report is to contain an account of the economic and other assumptions on which the updated financial projections are based.
Assumptions Underlying the Revenue ProjectionsThe amount of revenue received from Territory taxes and royalties is driven by the performance of the Territory economy and other external factors. Hence tax and royalty forecasts involve making judgments and assumptions about the performance of the various economic factors and indicators that impact directly on Territory taxes and royalties. In addition, assumptions are made in the context of estimating or modelling the effects of changes in policy.
Most revenue forecasts are made in respect of the Budget year (that is 2013-14), with the forward estimates assuming a return to long-term growth rates associated with each revenue line.
The economic factors underpinning payroll tax forecasts are driven largely by forecasts of growth in wages, employment and average hours worked.
Forecasting conveyance stamp duty is linked to activity in the property market, which is notoriously difficult to predict. The extent and timing of market changes or changes in property prices or transaction levels have a significant impact on conveyance duty collections and lead to extreme volatility in this revenue source. In addition, the Territory has a relatively small conveyance duty base, which includes valuable commercial properties including pastoral properties and mining projects. These factors introduce significant variability in collections as a result of the impact of the duty collected from large commercial transactions.
Gambling revenue is generally forecast on the basis of long-term growth rates, subject to changes in market conditions.
Forecasts of mining royalty, most of which is collected under the Territory’s profit-based regime, rely largely on advice from mining companies of
2013-14 Budget
22 Updated Fiscal Outlook
their expected liability for the upcoming financial year. Forward estimates generally reflect the estimates for the Budget plus any policy changes.
Underpinning these various forecasts are general views about the outlook for the Territory’s economic growth, population growth and employment trends. An overview of these broader economic forecasts is set out below.
Gross State ProductThe Territory’s gross state product is estimated to increase by 4.6 per cent in 2012-13 due mainly to a rebound in household consumption expenditure and strong growth in private investment. Private investment expenditure in the Territory has been dominated by progress payments related to the development of the onshore components of the INPEX and Total joint venture Ichthys project, but also includes works related to the development of the Montara oilfields, the Darwin Correctional Precinct, and expansion activityat Xstrata’s McArthur River mine near Borroloola and Groote Eylandt Mining Company’s (GEMCO) manganese mine. Partly offsetting economic growth over the year will be higher international imports related to the importation of the Montara Venture oil platform in December 2012 to service the Montara oilfields and other machinery and equipment related to the development of major projects listed above. Declining public sector expenditure by all tiers of government is also expected to detract from growth in the year.
Economic growth in the Territory is forecast to strengthen to 5.0 per cent in 2013-14, driven by an acceleration of construction activity related to the Ichthys project, the Darwin Correctional Precinct and the Marine Supply Base, and strong growth in residential construction activity particularly for apartment buildings in the Darwin region. Growth will also be supported by higher international exports, reflecting a full year of production from the Montara oilfields and increased output from the GEMCO and Xstrata mines following completion of the expansion projects. Public investment expenditure is forecast to decline further in 2013-14 as the Territory’s capital works program and Commonwealth investment wind back as fiscal consolidation continues.
Despite record levels of international imports and continuing fiscal consolidation by governments, the Territory economy is forecast to grow by 7.0 per cent in 2014-15 mainly due to record levels of construction activity in the year in line with peak activity at the Ichthys project. The onshore Territory economy is forecast to slow substantially over 2015-16, reflecting steep declines in construction activity as the Ichthys project is completed and the bulk of the workforce departs the Territory. Despite the slowing onshore economy, economic growth in the Territory is still forecast to increase by 4.5 per cent in 2015-16, driven by strong growth in net exports. Despite forecasts of significant declines in construction activity and slowing employment and population growth, the Territory economy is forecast to grow by 3.9 per cent in 2016-17. This reflects the drivers of growth in the economy shifting from the construction phase to the production phase as liquefied natural gas (LNG) production from the newly built Ichthys LNG plant begins.
Budget Strategy and Outlook
23Updated Fiscal Outlook
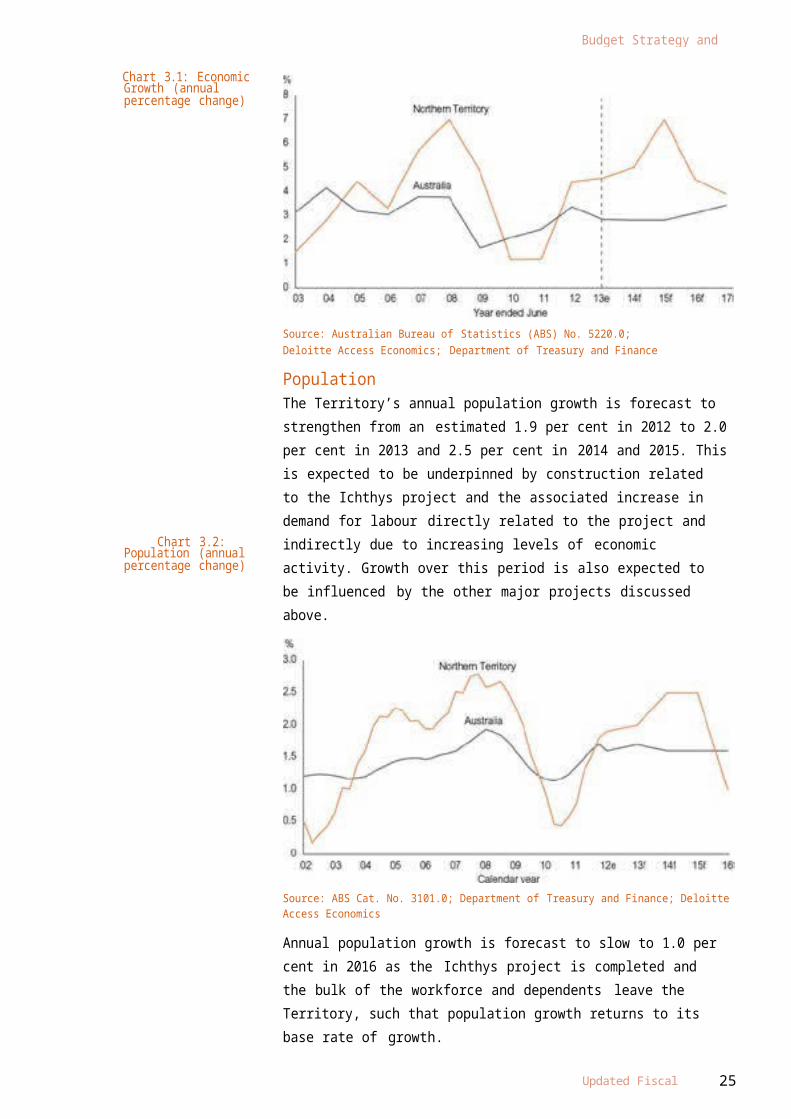
Chart 3.1: Economic Growth (annual percentage change)
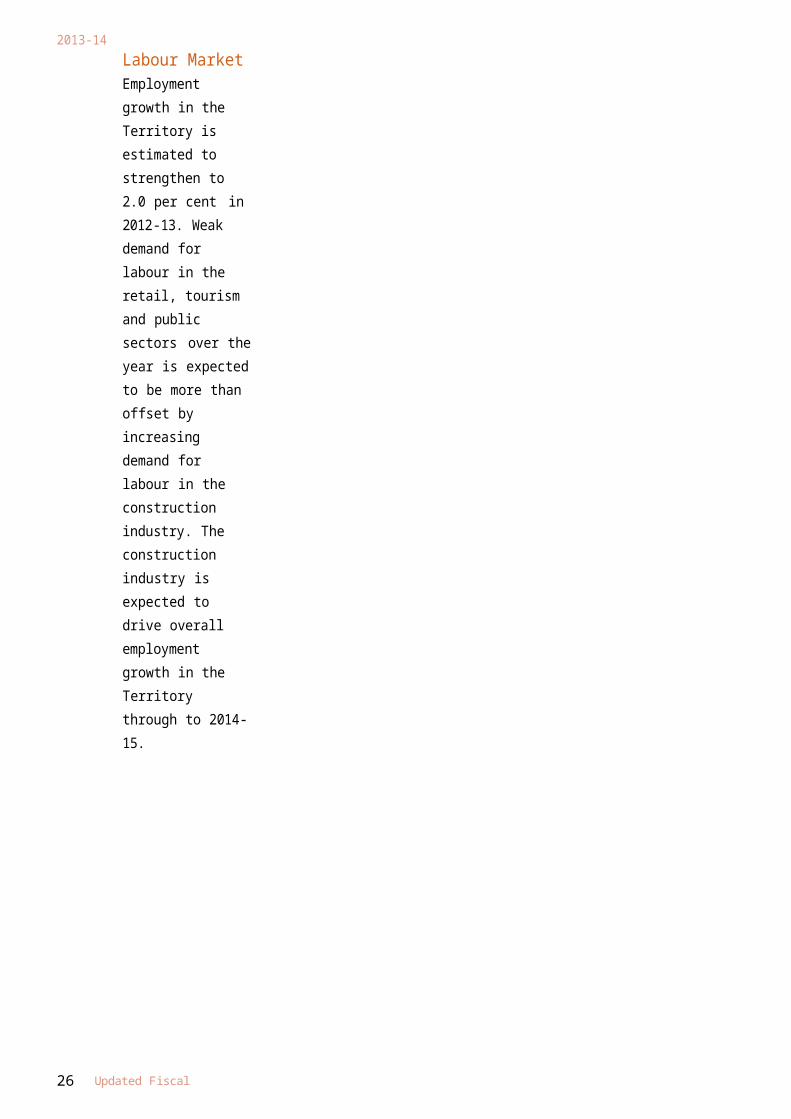
Chart 3.2: Population (annual percentage change)
Source: Australian Bureau of Statistics (ABS) No. 5220.0; Deloitte Access Economics; Department of Treasury and Finance
PopulationThe Territory’s annual population growth is forecast to strengthen from an estimated 1.9 per cent in 2012 to 2.0 per cent in 2013 and 2.5 per cent in 2014 and 2015. This is expected to be underpinned by construction related to the Ichthys project and the associated increase in demand for labour directly related to the project and indirectly due to increasing levels of economic activity. Growth over this period is also expected to be influenced by the other major projects discussed above.
Source: ABS Cat. No. 3101.0; Department of Treasury and Finance; Deloitte Access Economics
Annual population growth is forecast to slow to 1.0 per cent in 2016 as the Ichthys project is completed and the bulk of the workforce and dependents leave the Territory, such that population growth returns to its base rate of growth.
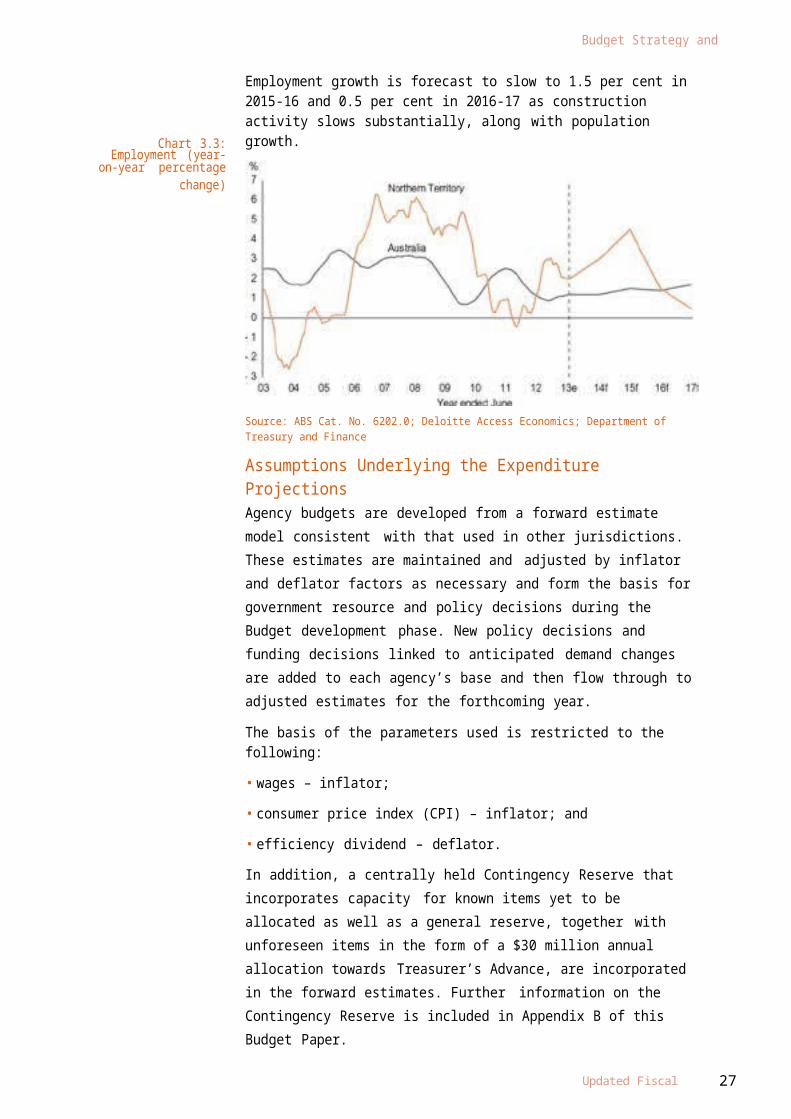
Labour MarketEmployment growth in the Territory is estimated to strengthen to 2.0 per cent in 2012-13. Weak demand for labour in the retail, tourism and public sectors over the year is expected to be more than offset by increasing demand for labour in the construction industry. The construction industry is expected to drive overall employment growth in the Territory through to 2014-15.
2013-14 Budget
24 Updated Fiscal Outlook
Chart 3.3: Employment (year-on-year
percentagechange)
Employment growth is forecast to slow to 1.5 per cent in 2015-16 and 0.5 per cent in 2016-17 as construction activity slows substantially, along with population growth.
Source: ABS Cat. No. 6202.0; Deloitte Access Economics; Department of Treasury and Finance
Assumptions Underlying the Expenditure ProjectionsAgency budgets are developed from a forward estimate model consistent with that used in other jurisdictions. These estimates are maintained and adjusted by inflator and deflator factors as necessary and form the basis for government resource and policy decisions during the Budget development phase. New policy decisions and funding decisions linked to anticipated demand changes are added to each agency’s base and then flow through to adjusted estimates for the forthcoming year.
The basis of the parameters used is restricted to the following:
• wages – inflator;
• consumer price index (CPI) – inflator; and
• efficiency dividend – deflator.
In addition, a centrally held Contingency Reserve that incorporates capacity for known items yet to be allocated as well as a general reserve, together with unforeseen items in the form of a $30 million annual allocation towards Treasurer’s Advance, are incorporated in the forward estimates. Further information on the Contingency Reserve is included in Appendix B of this Budget Paper.
Central to the expenditure projections is the outlook for annual rises in the Territory’s prices and cost. An overview of the CPI forecasts underlying the expenditure estimates is provided below.
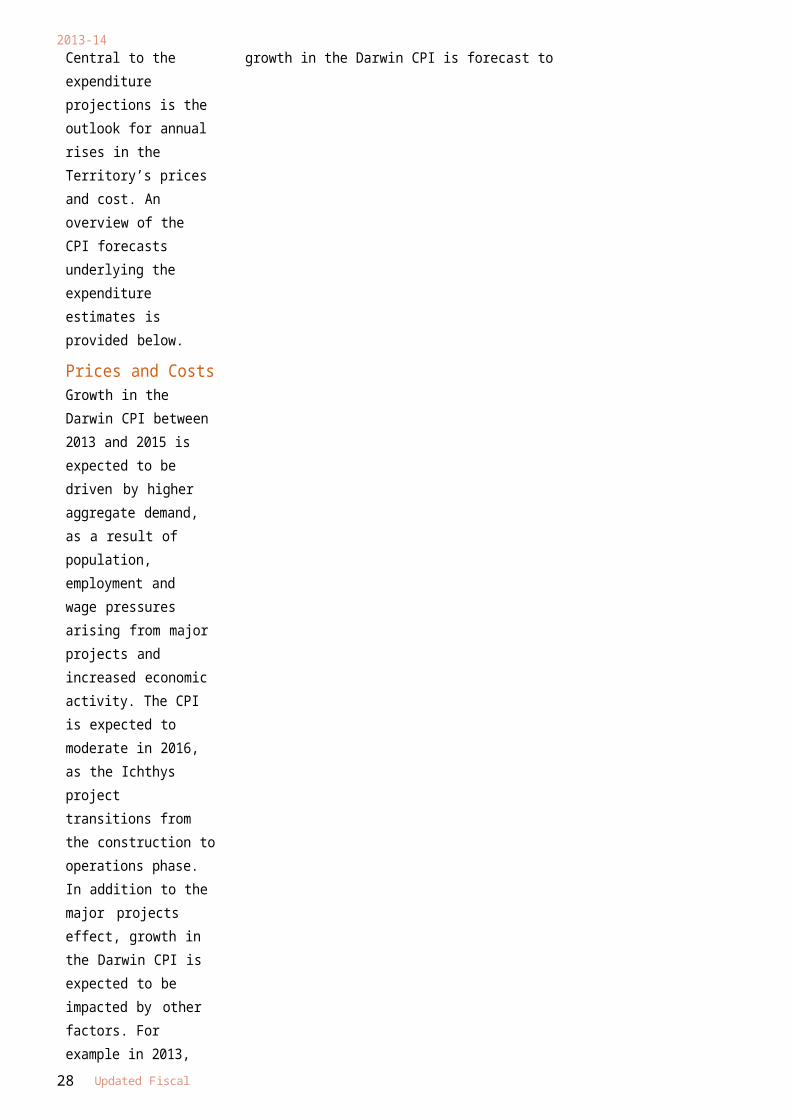
Prices and CostsGrowth in the Darwin CPI between 2013 and 2015 is expected to be driven by higher aggregate demand, as a result of population, employment and wage pressures arising from major projects and increased economic activity. The CPI is expected to moderate in 2016, as the Ichthys project transitions from the construction to operations phase. In addition to the major projects effect, growth in the Darwin CPI is expected to be impacted by other factors. For example in 2013, growth in the Darwin CPI is forecast to
Budget Strategy and Outlook
25Updated Fiscal Outlook
Chart 3.4: Consumer Price Index, Darwin and Eight
Capitals (year-on-year percentage
change)
Updated Fiscal Projections
Table 3.1: Key Fiscal Indicators
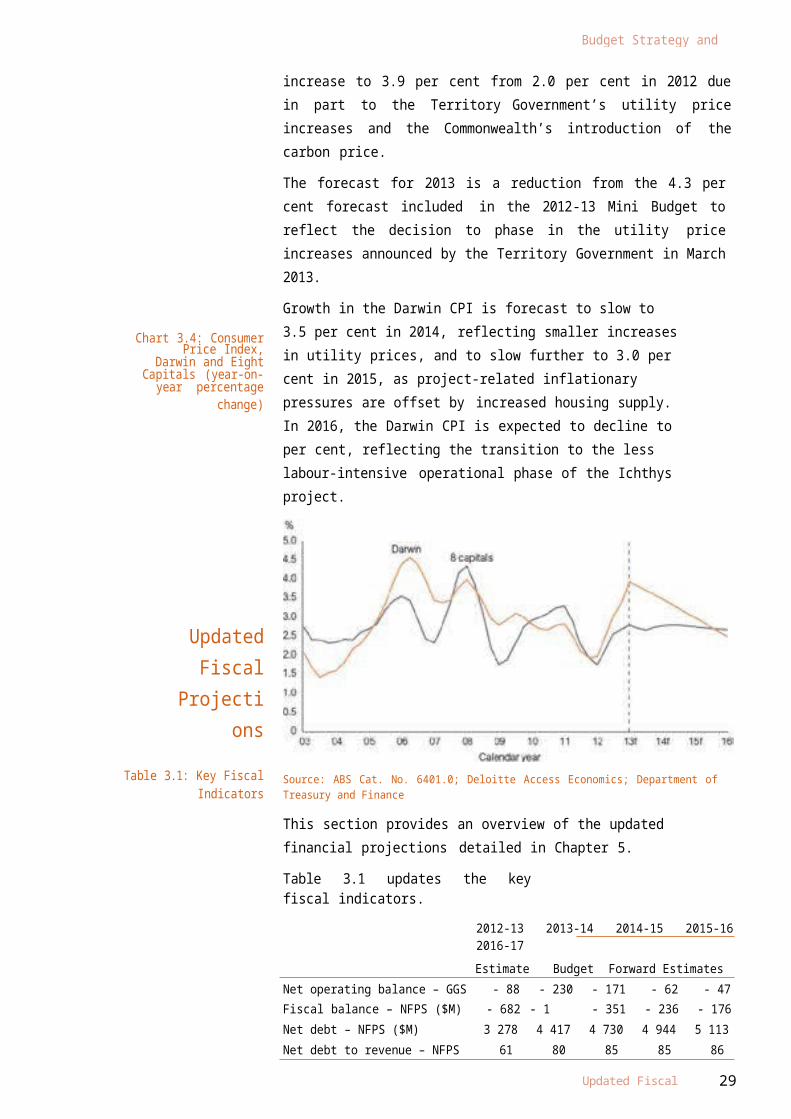
increase to 3.9 per cent from 2.0 per cent in 2012 due in part to the Territory Government’s utility price increases and the Commonwealth’s introduction of the carbon price.
The forecast for 2013 is a reduction from the 4.3 per cent forecast included in the 2012-13 Mini Budget to reflect the decision to phase in the utility price increases announced by the Territory Government in March 2013.
Growth in the Darwin CPI is forecast to slow to 3.5 per cent in 2014, reflecting smaller increases in utility prices, and to slow further to 3.0 per cent in 2015, as project-related inflationary pressures are offset by increased housing supply. In 2016, the Darwin CPI is expected to decline to per cent, reflecting the transition to the less labour-intensive operational phase of the Ichthys project.
Source: ABS Cat. No. 6401.0; Deloitte Access Economics; Department of Treasury and Finance
This section provides an overview of the updated financial projections detailed in Chapter 5.
Table 3.1 updates the key fiscal indicators.
2012-13 2013-14 2014-15 2015-16 2016-17
Estimate Budget Forward EstimatesNet operating balance – GGS ($M) - 88 - 230 - 171 - 62 - 47Fiscal balance – NFPS ($M) - 682 - 1 185 - 351 - 236 - 176
Net debt – NFPS ($M) 3 278 4 417 4 730 4 944 5 113
Net debt to revenue – NFPS (%) 61 80 85 85 86
GGS: general government sector; NFPS: non financial public sector Source: Department of Treasury and Finance
As shown in Table 3.1, the general government sector operating balance is trending to improvement in all years from 2013-14 but remains in a deficit position of $47 million at the end of 2016-17.
The fiscal balance estimates for the non financial public sector is also improving over the forward estimates, with a $176 million deficit position projected by the end of 2016-17.
The net debt level and net debt to revenue ratio for the non financial public sector are both projected to continue increasing over the forward estimates as a result of the projected fiscal balance deficits. By 2016-17, the net debt to revenue ratio is expected to level out at 86 per cent.
2013-14 Budget
26 Updated Fiscal Outlook
Budget Strategy and Outlook
27Updated Fiscal Outlook
Table 3.2: Non Financial Public
Sector – Revenue
Table 3.2 sets out the revised projections for revenue for 2012-13 and the forward years.
2012-13 2013-14 2014-15 2015-16 2016-17
Estimate Budget Forward Estimates
$M $M $M $M $MRevenue
Taxation revenue 457 476 495 514 533
GST revenue 2 821 2 805 2 972 3 149 3 289
Current grants 806 779 693 708 696
Capital grants 194 217 156 150 119
Sales of goods and services 816 915 968 995 1 016
Interest income 46 55 56 57 58Dividend and income tax equivalent 51 52 57 61 62
income
Mining royalties income 108 113 113 113 113
Other 84 91 76 78 79
Total revenue 5 382 5 504 5 587 5 825 5 965
Year-on-year percentage increase (%) 1 2 2 4 2
Source: Department of Treasury and Finance
Total operating revenue is projected to increase on average by 2.8 per cent per annum from the budget year over the forward estimates period.
Taxation revenue is projected to increase on average by 4 per cent over the forward estimates period, reflective of economic conditions in the Territory and the taxation effort in the Territory moving towards the average of the states.
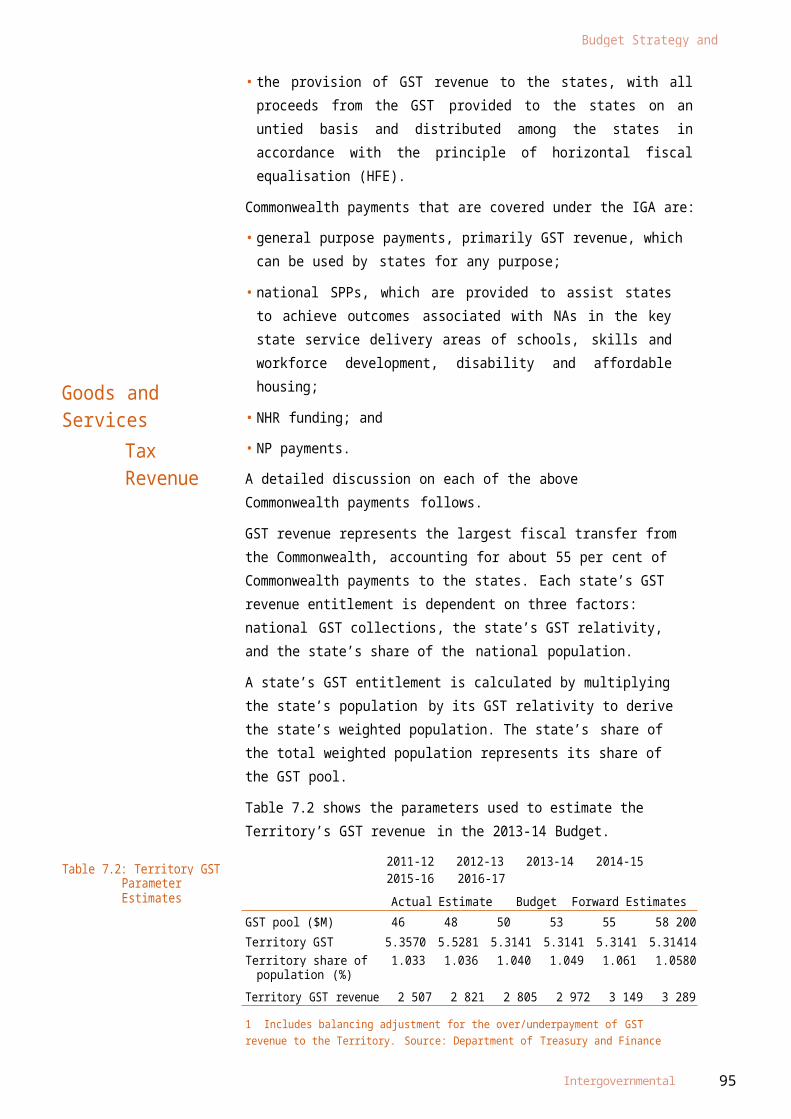
Despite goods and services tax (GST) revenues being revised down in excess of $100 million in all forward years since the Mini Budget, such revenues are estimated to rise to $3289 million in 2016-17, although from a lower base. This is in line with expected growth in the size of national collections and the Territory’s population estimates. Full discussion on GST revenue can be found later in this chapter and in Chapter 7.
Consistent with the Mini Budget, current and capital grants are decreasing over the forward years as a result of agreements with the Commonwealth being for fixed periods. Until these are renegotiated, they are not included in the forward estimates.
During each budget year there are significant changes in Commonwealth funding estimates as agreements are finalised. These adjustments tend not to affect the fiscal outcome as increases in revenue are generally matched by a corresponding increase in expenditure. However, timing differences in the receipt of tied revenue and associated expenditure introduce a degree of volatility affecting the budgeted and actual outcomes.
The growth from the budget year in sales of goods and services of 3.7 per cent over the forward estimates has been revised down from growth projections of 7.9 per cent reported in the Mini Budget. This has been driven largely by the wind back in March 2013 of utility tariff increases introduced

2013-14 Budget
28 Updated Fiscal Outlook
from 1 January 2013 in order to improve the financial sustainability of the Power and Water Corporation (PWC).
Budget Strategy and Outlook
29Updated Fiscal Outlook
Table 3.3: Non Financial Public
Sector – Expenditure
The remainder of own-source revenue is attributable mainly to mining royalties, which are projected to remain relatively flat over the forward years.
Table 3.3 sets out the revised projections for total expenditures for 2012-13 and the forward years.
2012-13 2013-141 2014-15 2015-16 2016-17Estimate Budget Forward Estimates
$M $M $M $M $MExpenses
Employee expenses 1 987 2 001 2 015 2 044 2 085
Superannuation expenses 325 333 343 360 358
Depreciation and amortisation 402 413 434 448 463
Other operating expenses 1 676 1 753 1 746 1 787 1 827
Interest expenses 263 292 368 385 400
Current grants 704 745 689 739 757
Capital grants 45 73 48 16 16
Subsidies and personal benefit payments
101 102 110 108 111
Total expenses 5 505 5 712 5 753 5 887 6 017
Year-on-year percentage increase (%) 4 4 1 2 2
Net capital 1 472 1 399 639 605 569
Total expenditure 6 977 7 111 6 392 6 493 6 586
Year-on-year percentage increase (%) 8 2 - 10 2 1
1 Net capital includes accounting for the total cost of the Darwin Correctional Precinct. Source: Department of Treasury and Finance
Total operating expenses are expected to grow from the budget year at an average of 1.8 per cent per annum over the forward estimates. This is also lower than the equivalent revenue growth of 2.8 per cent over the same period, consistent with eliminating the fiscal imbalance by 2017-18.
Over the forward estimates period, employee expenses are estimated to increase on average from the budget year by 1.4 per cent per annum.
Underlying growth from the budget year in other operating expenses is also estimated at 1.4 per cent per annum. The lower growth is due to the wages and CPI inflators in agency budgets being offset by efficiency and savings measures.
Interest expenses are increasing over the forward estimates as debt increases.
The fluctuation in current and capital grants expense across the forward estimates is in line with the timing of tied Commonwealth funding agreements, in particular, the Stronger Futures package.
Total expenditure including net capital payments is projected to decline from the budget year by 2.5 per cent per annum over the forward estimates period, predominantly as a result of further reductions in infrastructure investment, including by PWC, as private sector investment increases, together with the cessation of the former government’s HOMESTART EXTRA equity share scheme.
2013-14 Budget
30 Updated Fiscal Outlook
Reconciliation with Previous
Fiscal Projections
Table 3.4: Non Financial Public Sector – Fiscal
Balance
This section addresses the requirement under section 10(1)(f) of FITA that each fiscal outlook report is to contain an explanation of the factors and considerations that contributed to any material differences between the updated financial projections and the equivalent projections published in the previous fiscal outlook report.
Table 3.4 compares the updated fiscal balance projections with the projections published at the time of the 2012-13 Pre-Election Fiscal Outlook (PEFO) (August 2012) and the 2012-13 Mini Budget (December 2012).
2012-13 2013-14 2014-15 2015-16 2016-17Estimate Budget Forward Estimates
$M $M $M $M $MFiscal balance
2012-13 PEFO - 867 - 1 197 - 561 - 475 na
2012-13 Mini Budget - 772 - 895 - 196 - 53 na
2013-14 Budget - 682 - 1 185 - 351 - 236 - 176
Variation from 2012-13 PEFO 185 12 210 239 na
Variation from 2012-13 Mini Budget 90 - 290 - 155 - 183 na
Source: Department of Treasury and Finance
Changes Since Mini Budget ProjectionsThe most recent fiscal outlook report published under FITA formed part of the 2012-13 Mini Budget.
As shown in Table 3.4, the fiscal balance has deteriorated since the time of the Mini Budget. This deterioration is due primarily to the downward revisions to GST revenues from 2013-14. Lower than historic growth in GST collections has been compounded by reductions in the Territory’s shareof GST collections from 5.7 per cent in 2012-13 to 5.4 per cent in 2013-14, following the Commonwealth Grants Commission’s report on GST Revenue Sharing Relativities 2013 Update. This has resulted in projected revenue reductions of $117 million in 2013-14, rising to $147 million in 2016-17. Excluding the reduction in the GST, the projected $176 million deficit in 2016-17 would have been about $30 million.
While GST revenue is projected to rise to $3289 million in 2016-17, in line with expected growth in the size of the national pool and the Territory’s population estimates, the growth is from a much lower base. This represents a reduction of more than $500 million over the forward estimates period from that reported in the 2012-13 Mini Budget. Chart 3.5 highlights the growth in GST over the forward estimates and the cumulative effect of the revised GST relativities since PEFO.
Detailed explanations of the determinants of GST revenue can be found in Chapter 7 of this Budget Paper.
Budget Strategy and Outlook
31Updated Fiscal Outlook
Chart 3.5: GST Projections
Source: Department of Treasury and Finance
In addition to the GST decline that materialised after the Mini Budget, the 2012-13 and 2013-14 estimates have been affected by the timing ofexpenditure between years. This largely relates to Commonwealth-funded programs as well as the timing for the purchase of dwellings under the National Rental Affordability Scheme (NRAS). These timing changes, some of which relate to the 2011-12 outcome, have improved the 2012-13 outcome with a corresponding worsening in 2013-14 and the forward years.
Other key contributors to the change since the Mini Budget include:
• the Government’s decision in March 2013 to stage the increases in electricity, water and sewerage tariffs introduced at Mini Budget;
• funding for government priorities, including an additional $35 million ongoing from 2013-14 for mandatory rehabilitation initiatives; and
• supplementary funding in excess of $40 million ongoing across the budget cycle to place the Department of Health, including Health and Hospital Services, on a more sustainable footing over the forward estimates period.
Changes Since Pre-Election Fiscal OutlookTo provide a complete picture since the change of government, the updated fiscal projections need to be compared with those published in PEFO in August 2012. Further, the source of variations in the projections since PEFO of the Territory can be under two separate categories:
• non-policy changes since PEFO; and
• government policy decisions since PEFO.
Non-Policy Changes Since Pre-Election Fiscal OutlookTable 3.5 highlights the effect of non-policy changes on the non financial public sector’s fiscal balance since PEFO through to 2015-16, being the last forward year published at that point in time.
Estimate Budget Forward Estimates
$M $M $M $M
2013-14 Budget
32 Updated Fiscal Outlook
Table 3.5: Non-Policy Changes Since PEFO Affecting the
Fiscal Balance
2012-13 2013-14 2014-15 2015-16
Untied revenuesGST revenue 30 - 117 - 126 - 135
Taxation revenue 27 15 15 16
Mining royalties 5
Timing and other minor changes
Darwin Correctional Precinct
78 - 60
- 26
12 4
Total impact on fiscal balance 140 - 189 - 99 - 115
Source: Department of Treasury and Finance
In 2012-13, the Territory is expected to receive an additional $30 million in GST revenue compared with the estimate in PEFO. This upward revision in 2012-13 reflects higher than anticipated GST collections in 2011-12, with the increase paid to the states in 2012-13. Despite this small 2012-13 increase, the Territory’s GST revenue growth is projected to decrease by $117 million in 2013-14 due to the updated GST relativities, rising to $147 million by 2016-17 compared with PEFO estimates.
Taxation revenue is projected to increase by $26.7 million in 2012-13,$14.5 million in 2013-14 and by similar amounts ongoing. The increase is due to ongoing employment and wage growth and increased stamp duty onconveyances following a large one-off transaction in 2012-13 and an ongoing recovery in property market transaction volumes.
Timing and other minor changes relate largely to expenditure requirements associated with tied Commonwealth funding such as the Alice Springs Transformation Plan, remote housing, education programs, capital-related health projects as well as the timing of payments for affordable dwellings under NRAS.
As foreshadowed in the Mini Budget, the fair value of the Darwin Correctional Precinct and associated finance lease liability has been increased by$26 million to $521 million in 2013-14. This follows the reassessment of the fair value of the asset to incorporate certain costs incurred by the private consortium during the construction phase that meet the capitalisation criteria under accounting standards. This book entry adjustment to the construction component does not increase the quarterly service payment streams over the 30-year concession period that covers both the capital and ongoing maintenance costs of the facility.
Policy Changes Since Pre-Election Fiscal OutlookTable 3.6 highlights the effect of policy changes on the non financial public sector’s fiscal balance since PEFO through to 2015-16, being the last forward year published at that point in time.
Estimate Budget Forward Estimates
$M
Election commitments - 43
Legacy items - 90
Other decisions - 2
Subtotal - 135
$M
- 108
- 141
- 71
- 320
$M
- 113
- 122
- 49
- 284
$M- 117
- 107
- 87
- 311
Savings measures 73 204 264 300
Revenue measures 23 81 89 91
Power and Water Corporation 73 118 164 211
Removal of HOMESTART EXTRA 11 68 27 14
Subtotal 180 471 543 615
Reduction in contingency reserve 50 50 50
Total impact on fiscal balance 45 201 309 355
Source: Department of Treasury and Finance
Budget Strategy and Outlook
33Updated Fiscal Outlook
Table 3.6: Policy Changes Since PEFO Affecting the Fiscal Balance
2012-13 2013-14 2014-15 2015-16
The most significant policy changes to the Budget and forward estimates are the effects of savings and revenue measures, the review of PWC’s commercial operations and revisions to housing assistance packages. These measures are partially offset by additional funding for election commitments, legacy items and new initiatives. In total, the policy changes represent a net improvement of $355 million in 2015-16. Key policy changes are discussed in further detail below. The effect on individual agencies for 2012-13 and 2013-14 of new initiatives including election commitments and legacy and savings measures is included in more detail in Chapter 6 of this Budget Paper.
Election CommitmentsElection commitments remain largely unchanged from those incorporated in the Mini Budget, with the exception of increased funding of $35 million ongoing from 2013-14 for mandatory rehabilitation. Election commitments total $117 million ongoing from 2015-16.
Legacy ItemsLegacy items incorporated in the Mini Budget provided additional funding to agencies for individually assessed demand-driven services. These items total $107 million ongoing from 2015-16 with the main variation from the Mini Budget being the revised timing of $20 million for repairs and maintenance on government assets brought forward from 2015-16 to 2013-14.
Other DecisionsOther policy decisions primarily relate to new initiatives and additional funding provided for government priorities since PEFO. These decisions include:
• $6.2 million from 2013-14 for government and non-government schools to offset the increase in utility tariffs;
• $1.3 million rising to $5.5 million in 2015-16 for the Territory’s share of additional costs arising from Fair Work Australia’s equal remuneration
2013-14 Budget
34 Updated Fiscal Outlook
award for employees under the Social and Community Services Modern Award;
• additional funding of $8 million in 2013-14 to Tourism NT for international marketing to boost tourism in the Territory; and
• funding of $5.4 million in 2013-14 for the commissioning of the Darwin Correctional Precinct.
Further, additional funding of more than $40 million per annum across the budget cycle has been provided to the Department of Health, including Health and Hospital Services, reflecting the adoption of a more sustainable funding formula.
Savings MeasuresAgencies have identified annual savings of $73 million in 2012-13, rising to$300 million by 2015-16, within the context of ensuring that there is minimal effect on frontline government services. These savings measures largely offset the approved funding for election commitments, legacy items and new and other policy decisions. The minor variation to savings measures since the Mini Budget reflects the revised timing of implementation of the measures.
Savings measures are being achieved through a number of administrative efficiencies, program efficiencies and rationalisation, structural reforms, and whole of government savings.
Administration efficiencies relate to initiatives delivering savings through more efficient use of existing administrative resources, rationalisation of administration tasks to focus on core functions, and reduced expenditure on discretionary spending such as travel and consultants.
Program efficiencies and rationalisation relate to initiatives delivering savings through more efficient use of existing program resources and program rationalisation to focus on efficient delivery of priority programs and functions.
Structural reforms relate to initiatives that achieve savings through the realignment of functions and programs to better meet current needs. Over time, program focus or community needs can shift, rendering programs less relevant to community expectations. These initiatives will re-align programs to meet identified areas of need and provide savings where resources are surplus to requirements.
Whole of government savings relate to initiatives that derive savings across all government agencies such as vehicle procurement and communications functions.
In addition to operational savings, general government infrastructure spending has also been reduced by $150 million across the forward years through the prioritisation and realignment of the capital works program, resulting in a reduction in planned spending.
In order to close the remaining fiscal gap by the end of 2017-18, these savings measures will be supplemented by the implementation of initiatives to strengthen sound financial management and governance. These include

Budget Strategy and Outlook
35Updated Fiscal Outlook
the establishment of a Budget Monitoring Committee of Cabinet, enhanced budget monitoring and reporting at the agency level, an ongoing mid-year budget review process to ensure that the allocation and use of resources continues to align with government’s strategic direction, and enhanced shareholder monitoring and accountability of the PWC.
Revenue MeasuresThe revenue-related policy changes to the non financial public sector since the 2012 PEFO are:
• PWC tariff increases for electricity, water and sewerage from 1 January 2013 (see below);
• increasing mining royalties by $10 million per annum from 2013-14, reflecting policy changes to the Mineral Royalty Act to rationalise deductions available to royalty payers;
• increased vehicle registration fees towards the average of the states, for light vehicles from 1 January 2013;
• increases in other revenue, predominantly relating to increased own-source revenue across a range of functional areas including health and housing;
• cessation of the first home owner concession with assistance for first home owners targeted towards construction of new affordable homes and housing through increases in the First Home Owners Grant;
• doubling of the principal place of residence rebate from $3500 to $7000, which was retargeted to the purchase of new homes only; and
• a range of increases in fees and charges across government within the context of bringing these amounts up towards the average of the states.
In total these revenue measures will generate $23 million in 2012-13, rising to$91 million per annum by 2015-16.
Power and Water Corporation MeasuresIn response to PWC’s financial position declining in recent years and concerns over the financial sustainability of the corporation, the PWC Board has identified a range of operating and capital savings that could be achieved over the next five years and as such has included these savings in PWC’s 2013-14 Statement of Corporate Intent (SCI).
PWC has identified a range of operational efficiency measures including improved operating procedures in all business units, a reduction in corporate costs, improved procurement and inventory practices and improved business systems. Over the five-year SCI period, PWC has estimated the efficiency measures will achieve a reduction in operating expenses of about $180 million compared to the 2012 SCI.
In addition, following a review of its capital investment program, PWC has made some adjustments to better align its capital expenditure with growth requirements. Some capital projects have been brought forward and a number of projects have been deferred where consideration of current capacity and future demand has allowed.
2013-14 Budget
36 Updated Fiscal Outlook
PWC is employing appropriate risk mitigation and demand management strategies to ensure that service standards and reliability of supply are not compromised by these efficiency measures.
In addition, given that PWC’s revenues from regulated utilities tariffs had not been increasing in line with costs over time, tariffs for electricity, water and sewerage were increased by 30 per cent, 40 per cent and 25 per cent respectively, effective from 1 January 2013. The increases were subsequently revised down to 20 per cent, 30 per cent and 15 per cent, backdated to 1 January 2013, with customers to receive a credit on their utilities bills for any additional amounts paid. The remaining increases of July 2014.
The revised tariff structure, together with efficiencies identified by the PWC Board, have made a start on improving PWC’s financial position and reduced the reliance on government support. Together, they represent almost half of the improvements necessary to place PWC’s finances on a sustainable footing.
Consolidated Table of Changes Since August 2012Table 3.7 sets out changes in the fiscal balance for 2012-13 and 2013-14 for the non financial public sector since PEFO.
Table 3.7: Variations to the
2012-13
2013-14
Non Financial Public Sector’s
Fiscal Balance Since PEFO
Estima te Budget $M $M
2012-13 PEFO - 867.4 - 1 197.4
REVENUERevenue – policyPower and Water Corporation 32.0 58.4Motor vehicle registration fees 5.2 10.3Revised stamp duty home owner assistance 9.7 19.3Revenue measures 8.2 51.0Total revenue – policy 55.0 139.0
Revenue – non policyTaxation 26.7 14.5GST revenue 30.0 - 117.0New/expanded Commonwealth revenue 14.9 98.2Mining royalties 5.0Other revenue 2.2 10.3Total revenue – non policy 78.8 6.0
TOTAL REVENUE 133.8 145.0
OPERATING EXPENSESExpenses – policyElection commitments 42.3 105.2Legacy items 88.7 129.7Saving measures - 69.5 - 172.6Power and Water Corporation 17.5 - 17.6Other decisions 0.4 60.7Reduction in contingency reserve - 50.0Total expenses – policy 79.4 55.4
Expenses – non policyCommonwealth payments and transfers between years and
to capital- 44.2 38.5
Employee entitlements 2.2 2.9Depreciation 34.4 27.5Total expenses – non policy - 7.5 68.9
TOTAL OPERATING EXPENSES 71.9 124.3
Budget Strategy and OutlookNET CAPITAL PAYMENTSNet capital payments – policyPower and Water Corporation - 58.3 - 41.6Removal of HOMESTART EXTRA - 11.0 - 68.4Saving measures - 3.5 - 31.9Election commitments 0.5 2.7Legacy items 1.3 11.2Other decisions 1.2 35.4Total net capital payments – policy - 69.8 - 92.6
Net capital payments – non policyCommonwealth payments and transfers between years and
from operational- 19.4 102.1
Darwin Correctional Precinct adjustment 26.3Depreciation - 34.4 - 27.5Total net capital payments – non policy - 53.8 100.9
TOTAL NET CAPITAL PAYMENTS - 123.6 8.3
TOTAL EXPENSES - 51.7 132.6
TOTAL VARIATION 185.5 12.4
2013-14 BUDGET - 681.9 - 1 185.0
Source: Department of Treasury and FinanceUpdated Fiscal Outlook 35
2013-14 Budget
36 Updated Fiscal Outlook
Assessment of Updated Fiscal
Outlook Against Fiscal Strategy
Chart 3.6: Non Financial Public Sector – Fiscal
Balance
This section addresses the requirement under section 10(1)(g) of FITA that each fiscal outlook report is to contain an explanation of the factors and considerations that contribute to any material differences between the updated financial projections and the expected outcomes for the key fiscal indicators as specified in the Government’s fiscal strategy statement.
Key fiscal target: by 2017-18 the fiscal imbalance in the Territory’s non financial public sector is to be eliminated
By 2016-17, the final year of the forward estimates, the fiscal balance is now projected to be in deficit by $176 million. This is a $60 million improvement on the previous year.
Chart 3.6 highlights the improving position expected over the forward estimates period.
Source: Department of Treasury and Finance
The first projection of the 2017-18 fiscal imbalance will not be made until the May 2014 Budget.
Nevertheless, present indications are that eliminating the deficit by the end of 2017-18 as targeted will require an improved revenue outlook and/or additional efficiency measures.
Associated fiscal outcome: by 2016-17, the Territory’s general government sector is achieving a net operating surplus
The general government net operating balance is now projected to be in a slight deficit situation by 2016-17. The latest projection is a modest deficit of$47 million.
Chart 3.7 highlights the operating balance trending to improvement over the forward estimates period.
Budget Strategy and Outlook
Chart 3.7: General Government Sector – Operating Balance
Source: Department of Treasury and Finance
In the absence of any increases in untied revenues, additional budget improvement measures will be required in order to achieve this desired fiscal outcome.
Associated fiscal outcome: by 2016-17, taxation effort in the Territory’s general government sector is more on par with the average effort of the states
The policy changes of re-targeting home assistance stamp duty measures together with increases in motor vehicle registrations contained within the Mini Budget means the Territory’s taxation effort is once again moving towards being on par with the state average. In addition to these measures, changes to the Mineral Royalty Act to rationalise deductions availableto royalty payers are expected to result in increasing mining royalties by$10 million per annum from 2013-14.
Chart 3.8: Revenue-RaisingEffort –
General Government Sector
Source: 2002-03 to 2006-07 from CGC 2009 Update, 2007-08 from CGC 2012 Update, 2008-09 to 2011-12 from CGC 2013 Update
Associated fiscal outcome: by 2016-17, the Territory’s government owned corporation is moving towards commercial rates of return on capital employed
PWC’s improved position is shown in Chart 3.9, which compares PEFO estimates based on PWC’s 2012-13 SCI (with asset values adjusted to a replacement cost methodology) with those in the 2013-14 Budget. The
2013-14 Budget
38 Updated Fiscal Outlook
Updated Fiscal Outlook 37
2013-14 Budget
38 Updated Fiscal Outlook
Chart 3.9: Pre-Tax Annual Rate of Return – Power and Water
Corporation
Chart 3.10: Non Financial Public Sector – Net Debt to Revenue
improved position is primarily due to lower forecast electricity demand and the staged implementation of the tariff increase announced in March 2013.
Source: Department of Treasury and Finance
Achieving a fully commercial rate of return (estimated to be in the vicinity of a 6 per cent annual rate of return on capital employed), and sustaining that level, depends first on successful implementation of the operationaland capital saving initiatives, which form the basis of PWC’s 2013-14 SCI. In addition, further financial improvement measures need to be developed by the PWC Board to achieve commercial rates of return on capital employed.
Associated fiscal outcome: by 2020, the Territory’s non financial public sector net debt as a percentage of revenue is returning towards 60 per cent
The net debt to revenue ratio for the non financial public sector is now projected to be 86 per cent by the end of 2016-17.
As Chart 3.10 shows, this represents a levelling out over the forward estimates period of the recent rise in the Territory’s net debt ratio.
Source: Department of Treasury and Finance
The effect of losing more than $500 million in GST revenues over the forward estimates, together with pulling back on the pace of fiscal adjustment, has made achieving the 60 per cent target more challenging. An improved revenue outlook and/or balance sheet adjustments may be necessary in time to achieve this target.
Budget Strategy and Outlook
39Risks to the Updated Financial Projections
Chapter 4
Revenue
Risks to the Updated Financial ProjectionsAs required under section 10(1)(e) of the Fiscal Integrity and Transparency Act (FITA) each fiscal outlook report is required to contain ‘a statement of the risks, quantified as far as practicable, that could materially affect the updated financial projections, including any contingent liabilities and any Government negotiations that have yet to be finalised’.
This chapter outlines the potential effect of risks to the Budget due to changes in revenue and expense estimates and the likelihood of contingent liabilities becoming actual liabilities. Any changes in risks or liabilities that are apparent since the 2012-13 Mini Budget are also identified.
Goods and Services Tax RevenueVolatility in goods and services tax (GST) revenue represents the largest revenue risk for the Territory. GST revenue on average accounts for about 50 per cent of the Territory’s total revenue, and therefore changes in GST estimates have a significant impact on the Territory’s funding capacity and budget outcome.
The Territory’s GST entitlement is dependent on three parameters: national GST collections, the Territory’s share of the national population, and GST relativities as recommended by the Commonwealth Grants Commission (CGC). There are many variables that influence each of these parameters, adding to the complexity of forecasting GST revenue to the Territory over the budget and forward estimates period. Further detail on GST revenue can be found in Chapter 7 of this Budget Paper.
National GST CollectionsEstimates of national GST collections are informed by the Commonwealth’s most recent published advice and national economic indicators. Compared with the 2012-13 Mini Budget, estimates of national GST collections over the budget and forward estimates period have remained unchanged.
The Territory’s GST revenue is directly impacted by variations in national GST collections. A ±1 percentage point change in the GST pool growth rate is estimated to have a ±$27 million impact on the Territory’s GST revenue in 2013-14. If variations of this size occurred in each of the budget and forward estimates years, the cumulative impact on Territory GST revenue is about ±$300 million.
Territory’s Share of National PopulationFollowing moderate growth in 2010-11 and 2011-12, the Territory’s population is expected to strengthen over the budget and forward estimates period. The Territory’s population growth is expected to be driven by increased construction activity related to the INPEX and Total joint venture Ichthys project, and the associated increase in demand for labour directly related to the project and indirectly due to increasing levels of economic activity. As a consequence, the Territory’s share of the national population is expected to increase over the forward estimates period, with forecasts of population growth in the Territory above the forecast national
2013-14 Budget
40 Updated Fiscal Outlook
average increase. Since
40 Risks to the Updated Financial Projections
2013-14 Budget
the Mini Budget was published in December 2012, revised population estimates have resulted in a $6 million increase in GST revenue to the Territory.
Estimates of the Territory’s population growth relative to the national average influence the Territory’s share of the national population, and therefore impact on forecasts of the Territory’s GST revenue. The effect of a ±1 percentage point variation in the Territory’s forecast population growth is estimated at ±$26 million in 2013-14, all other things being equal. The cumulative impact of a ±1 percentage point variation in the estimate of the Territory’s population growth rate over the budget and forward estimates period is about ±$290 million.
GST RelativitiesThe CGC is responsible for determining GST relativities. The CGC updates GST relativities each year but it does not forecast relativities for forward years. The CGC has recommended the relativities that will be used to distribute GST revenue between the states in 2013-14. Due to the complexity and the large number of variables that are used to determine GST relativities, the Territory’s budget forecasts hold relativities constant over the forward estimates period. As such, there remains a risk that any future change in relativities will result in an adverse impact on the Territory Budget for all forward years.
Compared to the 2012-13 Mini Budget, the estimate of the Territory’s GST revenue in 2013-14 is $117 million lower in the 2013-14 Budget. Of this reduction, $107 million is directly attributed to the Territory’s revised GST relativity.
The approximate impact of a 1 per cent variation in the Territory’s GST relativity is ±$26 million, with a cumulative impact over the forward estimates period of ±$115 million.
The above analysis examines the impact of variations in estimates of each parameter in isolation. However, these parameters often interact to impact on GST revenue estimates. As a result, variation in each parameter could have a compounding or offsetting impact on GST revenue estimates.
Other Commonwealth Grants and SubsidiesCommonwealth funding is provided under either the Intergovernmental Agreement on Federal Financial Relations (IGA) through Specific Purpose Payments (SPPs), National Health Reform (NHR) payments and National Partnership (NP) payments, or through Commonwealth Own Purpose Expenses (COPE) provided directly to agencies. The IGA affords flexibility of expenditure across the relevant sector for the SPPs (which in 2013-14 are provided for the education, skills and workforce, disability and housing sectors) without input controls, matching and maintenance of effort requirements. These payments are not time limited and are indexed on a sector-specific basis. These arrangements provide a degree of certainty for the Territory’s budgeting, although adequacy of indexation in terms of capturing cost growth remains an ongoing risk.
In 2012-13 NHR payments replaced the National Healthcare SPP. NHR payments in 2013-14 and 2014-15 will be equivalent to the amount that
41Risks to the Updated Financial Projections
Budget Strategy and Outlookwould
2013-14 Budget
42 Risks to the Updated Financial Projections
have been paid under the previous Healthcare SPP. From 2014-15, NHR payments will predominantly be based on hospital activity, or ‘block funding’ for smaller hospitals in recognition of their circumstances. Until the Territory fully transitions to the new arrangements in 2014-15, there remains a risk that the Territory’s circumstances will not be adequately recognised in the funding arrangements, therefore potentially impacting on the adequacy of Commonwealth funding.
While an improvement on previous funding agreements, and although less prescriptive than COPE funding agreements, NP agreements continue to contain many risks to states including co-investment, input controls, application of national costs, burdensome reporting and administrative arrangements, and potential withdrawal of seed funding. Expiry of NP agreements (which by nature are time limited) also potentially pose a risk to the Territory’s Budget, particularly where funding has raised the service delivery expectations of the public. In addition, timing of Commonwealth decisions regarding treatment of expiring NPs and their funding is also critical to ensure continuity in delivery or to allow for alternative approaches to be considered should funding not be available.
With the potential budget issues prevailing at the Commonwealth level, there is a further risk to all state and territory tied and untied funding of reduced funding levels if these funds are used to work towards achieving revised priorities of the Commonwealth.
While the risks related to SPPs, NHR payments, NPs and COPEs cannot be quantified, they remain unchanged from the time of the 2012-13 Mini Budget.
National Education Reform AgreementIn April 2013, the Commonwealth released details of the proposed funding arrangements between the Commonwealth and the states under the National Education Reform Agreement (NERA). Under the proposed education reforms, government and non-government school funding would be based on a per student methodology, with loadings to recognise the additional resources required to provide high quality and equitable education to disadvantaged students. It is currently unclear whether the proposed model will adequately capture the Territory’s demographic and fiscal circumstances, potentially impacting the adequacy of any Commonwealth contribution and posing onerous co-investment and strategic risks.
The Commonwealth has set a 30 June 2013 deadline for states to sign up to the NERA.
Own-Source RevenueThe amount of revenue received from Territory taxes and royalties is dependent on the performance of the Territory economy and other external factors. Forecasting such revenue involves judgments and assumptions being made about the performance of the various economic factors and indicators that impact directly on Territory taxes and royalties, such as growth in wages, employment, average hours worked, prices, market activity and exchange rates.
It is difficult to accurately predict revenue collections into the future,
Budget Strategy and Outlook
43Risks to the Updated Financial Projections
particularly for the later years of the forward estimates. The most difficult
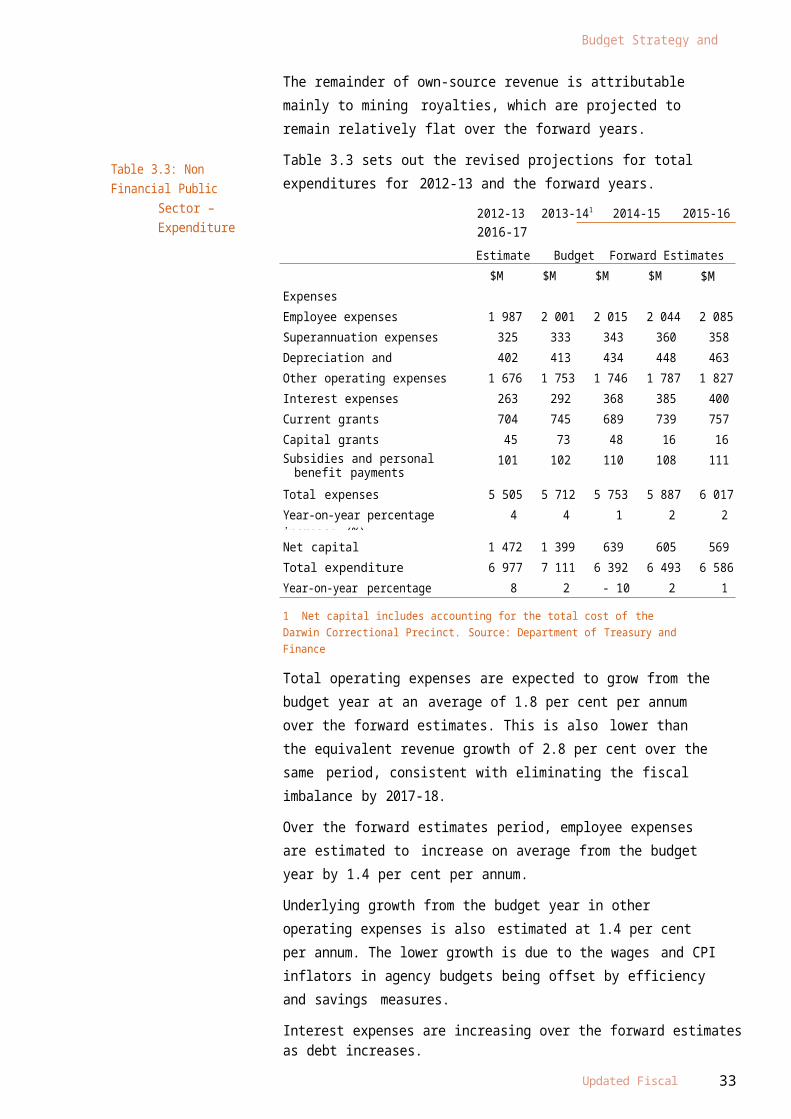
2013-14 Budget44Risks to the Updated Financial Projections
Expenses andPayments
source of revenue to forecast is mining royalty revenue because it is influenced by a number of factors, but predominantly mineral price, production levels and exchange rate conditions.
Mining revenue forecasts rely mainly on advice from mining companies of their expected liability for the financial year. Unpredicted market changes in mineral prices, production or exchange rates will have a material impact on this forecast.
Forecasting conveyance stamp duty is also difficult because it is linked to activity in the property market. For example, there was strong growth in residential property market activity prior to 2010-11, followed by a slowing in transaction volumes in 2011, with significant recovery of transaction volumes in 2012. In 2013, the recovery in activity includes an increase in average transaction values. The extent and timing of any market changes or growth or decline in property prices or transaction levels is difficult to predict and can have a significant impact on conveyance duty collections. In addition, the Territory has a relatively small conveyance duty base, which includes valuable commercial properties including pastoral properties and mining projects. These factors introduce significant variability in collections as a result of the impact of the duty collected from large commercial transactions.
In total, a variation of ±1 per cent to the parameters used to forecast Territory taxes and royalties would affect revenue by about $6 million for 2013-14.
A range of agency revenue measures including increases in fees and charges across government has also been factored in the 2013-14 Budget and forward estimates. The risk to the budget outcome will be influenced to the extent these measures are not realised.
The forward estimates for expenses are based on known policy decisions, with adjustments for non-policy changes.
The parameter for wages growth in all forward years is 3 per cent, which has remained unchanged, with a revised consumer price index of 2 per cent for 2013-14 and 2.5 per cent for all forward years. The efficiency dividend remains unchanged in 2013-14 and all forward years at 1 per cent.
The most significant risk to these estimates on the expense side is increasing budget pressure due to increased cost and demand influences. Furthermore, a range of agency savings initiatives has been factored in the 2013-14 Budget and forward estimates. The risk to the budget outcome will be influenced to the extent that the outcomes from these measures are not achieved.
In addition, future enterprise bargaining agreements represent a risk to the Budget to the extent that the outcome of negotiations is over and above amounts currently factored into the forward estimates.
A further risk relates to the previous Government’s decision to pursue long-term leases for existing and new government infrastructure built on Aboriginal land. A commercial rate of return is expected for each leasethat is executed. As not all leases have been executed, the extent to which these lease payments will affect agency budgets in 2013-14 and the
Budget Strategy and Outlook45Risks to the Updated Financial Projections
Power and Water
Corporation
Contingent Liabilities
Quantifiable Contingent Liabilities
forward estimates is not fully quantifiable and is likely to increase budgetary pressures.
There are also risks of increasing costs associated with the capital projects factored into the forward estimates. These need to be considered based on recent construction industry indications that project costs could increase by around 10 per cent in line with expected increases in industry wages. In accordance with the FITA, the 2013-14 Budget includes forward estimates up to 2016-17. There is the potential for fiscal aggregates beyond the forward estimates period to be affected by existing commitments. These could either take the form of recurrent costs that are not expected to crystallise until later in the forward estimates period, recurrent initiatives that roll out over time and have therefore not yet reached their peak of funding, or capital infrastructure for which the associated recurrent costs are not fully incorporated into forward years as their completion falls either close to or outside of the forward estimates period.
Increases in electricity, water and sewerage tariffs combined with reduced operating and capital costs of Power and Water Corporation (PWC), which form the basis of PWC’s 2013-14 Statement of Corporate Intent, have been factored into the 2013-14 Budget and forward estimates. The extent to which PWC is unable to successfully implement these improvement measures represents an ongoing risk to the budget.
A contingent liability is a liability that the Government may be called on to meet at some future date if a specified event should occur. Contingent liabilities of the Territory may arise out of a range of circumstances, the most common being indemnities and guarantees contained in agreements executed by the Territory. Contingent liabilities may also arise as a result of undertakings made by the Territory or as a result of legislation containing a guarantee or indemnity.
Contingent liabilities have the potential to materially affect the Budget due to the likelihood of an actual liability arising. As such, where possible, the potential extent of the actual liability should be quantified.
Material contingent liabilities of the Territory are defined as guarantees and indemnities with potential exposure greater than $5 million and are disclosed in annual financial statements of the Territory in accordance with Australian Accounting Standards requirements. Quantifiable and unquantifiable material contingent liabilities of the Territory are outlined below and remain relatively unchanged since the Mini Budget.
As at the date of this report, no transaction or event of a material nature has occurred that would crystallise the contingent liabilities reported in this section.
Details of estimated amounts of material contingent liabilities as at 30 June 2012, resulting from guarantees or indemnities granted by the Territory, as published in the 2011-12 Treasurer’s Annual Financial Report are presented as follows:
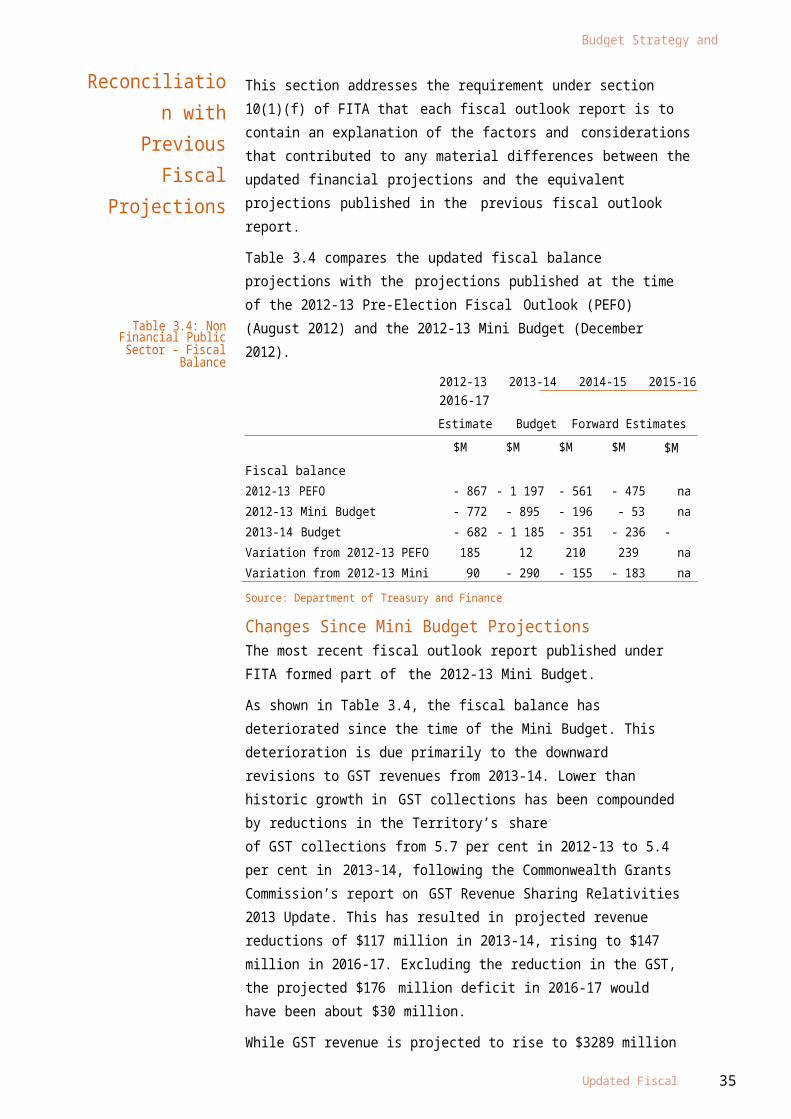
2013-14 Budget46Risks to the Updated Financial Projections
Table 4.1: Material Quantifiable
Contingent Liabilities
Unquantifiable Contingent Liabilities
Estimated Quantifiable Contingent Liability as at
30 June 2012
$M NPV
Pine Creek/McArthur River electricity purchase agreements 311
Public Trustee Common Fund 22
NPV: Net present value1 Future values discounted at a nominal 3.1 per cent discount rate. Source: Department of Treasury and Finance
Electricity, Gas and Water SupplyThese contingent liabilities result from arrangements for the purchase and transportation of gas, and the purchase and sale of electricity by and for PWC. Material contingent liabilities relating to these arrangements are reported below.
Electricity and Gas Supply to Pine Creek and McArthur RiverPWC has entered into agreements for the provision of gas and wholesale supply of electricity for the Pine Creek region and the McArthur River mine. The agreement for the supply of gas contains three indemnities relating to the PWC supplying non-conforming gas.
Although the corporation’s total contingent liability is unquantifiable, a major portion of the value of the contingent liability is quantifiable, being the cost of overhauling turbine machinery, owned by the electricity producers, damaged by the provision of non-conforming gas. The Territory’s maximum exposure is equivalent to the net present value of lease and operating charges under the purchase agreements.
Under the PWC’s current operating practices, the contingent events relating to each of the above indemnities are within the corporation’s control and are expected to be avoidable.
Public TrusteeThe Public Trustee Common Fund is reported to total $22 million as at 30 June 2012 and is government guaranteed.
Statutory Contingent LiabilitiesUnder section 97 of the Public Trustee Act, the Treasurer indemnifies the Common Fund against any deficiencies in money available to meet claims on it. The Common Fund is a repository for all moneys received by the Public Trustee on behalf of estates, trusts or persons, and earns interest. Money to the credit of the Common Fund is invested according to the directions issued by an Investment Board.
Although a material statutory contingent liability exists, the prospect of this contingent liability being called upon is considered low.
Unquantifiable contingent liabilities exist, which could pose a risk to the Government’s financial projections.
TransportThe Territory has contingent liabilities in this category that relate to indemnities and guarantees that have been provided in support of the Adelaide to Darwin railway project.
Budget Strategy and Outlook
47Risks to the Updated Financial Projections
The AustralAsia Railway Corporation (AARC) and the Territory and South Australian governments have entered into a concession arrangement for the Adelaide to Darwin railway on a build, own, operate and transfer-back basis.
Unquantifiable contingent liabilities of the Territory in relation to the Adelaide to Darwin railway project relate to the following:
• joint guarantee of the obligations of AARC; and
• indemnities granted in relation to title over the railway corridor (title is secure but the indemnity continues).
The Darwin Port Corporation (DPC) has leased facilities at the Darwin Port to the concession holder, interfacing the port and the railway. There are contingent liabilities that arise out of any loss or claim incurred or suffered as a result of the corporation’s failure to comply with its environmental obligation contained in the lease. The lease contains similar indemnities given by the lessee with respect to contamination caused by the lessee and a failure to comply with its environmental obligations.
AARC and the governments have comprehensive risk management procedures in place for all events that would give rise to liabilities.
The Territory Government has entered into agreements for the relocation of fuel terminals from near the Darwin central business district to the East Arm industrial estate. The agreements provide for certain unquantifiable contingent liabilities to be provided to the developer of the new fuel terminal and an oil company. Government has put in place comprehensive risk management processes to address potential exposure.
DPC has entered into an agreement that indemnifies the other party against any claim, loss, damage, liability, cost and expense that may be incurred or sustained by Shell arising out of any breach of DPC’s obligation under the agreement, or in connection with any failure or defect in the integrity of the bunker lines.
The Territory has provided an indemnity to DPC in relation to certain remedial works at East Arm Port. The indemnity covers third-party claims that may be made against DPC, as well as rectification of damage to the wharf or other DPC property caused by the carrying out of the remedial works. Comprehensive risk management procedures are in place to minimise risk exposure to the Territory.
Health and Community ServicesThe Territory has granted a series of health-related indemnities for various purposes including indemnities to specialist medical practitioners employed or undertaking work in public hospitals, indemnities provided to medical professionals requested to give expert advice on inquiries before the Medical Board and indemnities to midwives.
Although the risks associated with health indemnities are potentially high, the beneficiaries of the indemnities are highly trained and qualified professionals. The indemnities generally cannot be called upon where there is wilful or gross misconduct on the part of the beneficiary.
There are no reportable contingent liabilities in this category.
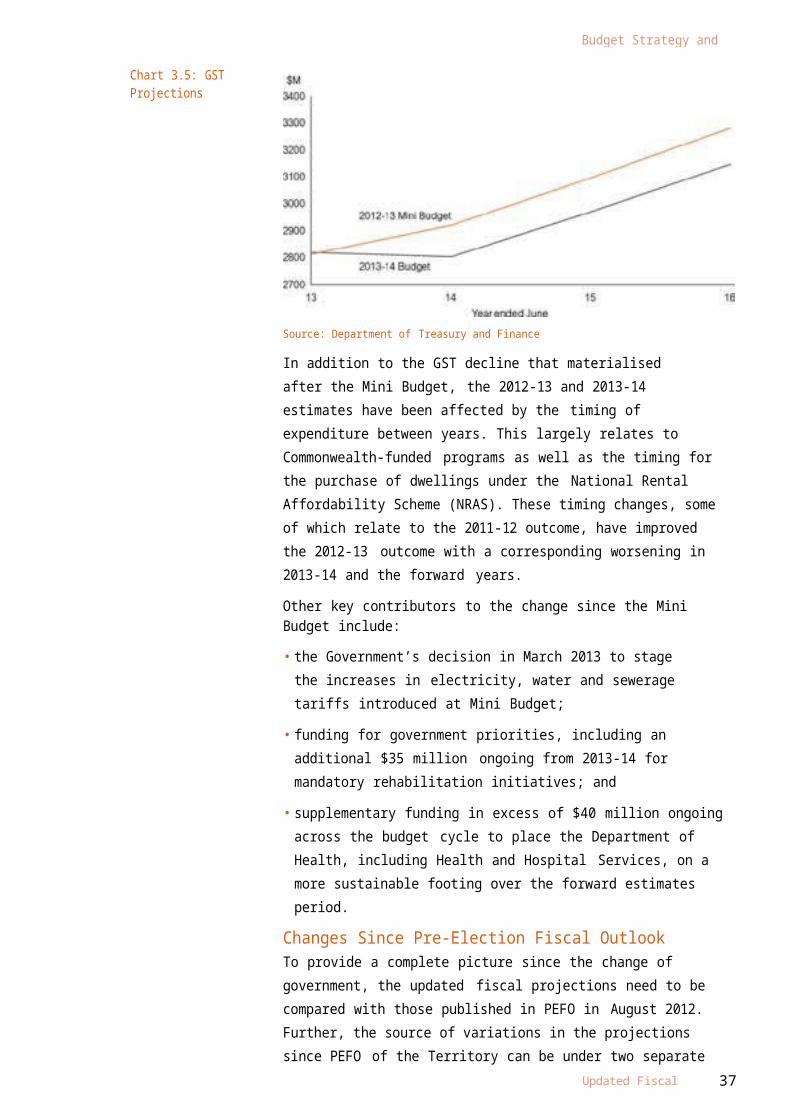
2013-14 Budget
48 Risks to the Updated Financial Projections
Government AdministrationWhere the Territory has invited the participation of private sector persons and government officers on boards of government owned or funded companies, the Territory may grant indemnities to the board members to cover them for any losses that may result from good faith actions.
These indemnities are generally consistent with cover available through Directors and Officers Insurance and the policy of issuing an indemnity rather than purchasing commercial insurance is in line with the Government’s self-insurance arrangements.
In relation to corporations established in accordance with the Government Owned Corporation Act, an indemnity given by the Territory to board members is limited to actions arising from compliance with a direction issued by the shareholding minister or the portfolio minister pursuant to the Government Owned Corporation Act.
The resulting contingent liabilities are considered low risk as board members are professionals selected based on their expertise and knowledge. Further, the indemnities are restricted to good faith actions only. These contingent liabilities are unquantifiable.
Indemnities are also granted to the Commonwealth and other entities involved in funding or sponsoring activities and programs initiated or undertaken by the Territory. Under the indemnities, the Territory generally accepts liability for damage or losses occurring as a result of the activities or programs and acknowledges that, while the Commonwealth or another party has contributed financially or provided in-kind support, the Territory is ultimately liable for the consequences of the activity or program.
Although the resulting contingent liability may, depending on the activity undertaken, not always be low risk, the Territory’s financial exposure is no greater than would have been the case without funding or sponsorship assistance. These contingent liabilities are unquantifiable.
Where the Territory is engaged in legal proceedings and disputes, due to the wide variety and nature of these cases and the uncertainty of any potential liability, no value can be attributed to these cases. In addition, the attribution of value to those cases also has the potential to prejudice the outcome of the proceedings and disputes.
The Government has indemnified private sector insurers who provide workers compensation insurance in the Territory. The indemnity covers insurers for losses that arise as a result of acts of terrorism.
Except for the terrorism indemnity, which is unquantifiable, there are no reportable contingent liabilities in this category.
Secure FacilitiesThe Territory has contingent liabilities in this category that relate to indemnities and guarantees that have been provided in support of the new secure facilities project that will be conducted under a Public Private Partnership agreement.
Budget Strategy and Outlook
49Risks to the Updated Financial Projections
The Territory has indemnified the proponent for losses arising from uninsurable risks. Except for this indemnity, which is unquantifiable, there are no other reportable contingent liabilities in this category.
FinanceThe Territory’s financial management framework is underpinned by centralised banking arrangements. The sole provider of banking-related services has been granted indemnities under the whole of government banking contract. These indemnities are considered not to involve significant risk.
There are no reportable contingent liabilities in this category.
Property and Business ServicesAgreements for leases or licences of property, plant or equipment generally contain standard indemnity provisions, similar to those commonly found in commercial leases, covering the lessor or licensor for any losses suffered as a result of the lease or licence arrangement. The contingent liabilities resulting from the indemnities are unquantifiable.
The granting of a concession to Darwin Cove Convention Centre Pty Ltd, gives rise to contingent liabilities associated with:
• discriminatory changes in law;
• environmental clean-up costs;
• incentive payments to the operator if performance targets established for the centre are exceeded; and
• negotiated payments to the operator in the early years of the centre’s operation.
For the categories listed above, neither the probability nor the amount that the Territory might be called upon to pay at some future date can be determined reliably. As a result, these items are regarded as contingent liabilities, where the existence of an actual liability in the future will beconfirmed only by the occurrence of uncertain future events that lie outside the control of the Territory.
A contingent asset also arises as a consequence of the concession arrangement. The Territory Availability Payment (TAP) is recognised as a liability on the general government sector and whole of government Balance Sheets. However, the Territory has the right to recover up to 75 per cent of that liability if the operator should not achieve certain performance criteria. Because neither the probability of such a recovery nor the amount that might be recovered can be determined reliably, the part of the TAP that might be subject to abatement is classified as a contingent asset.
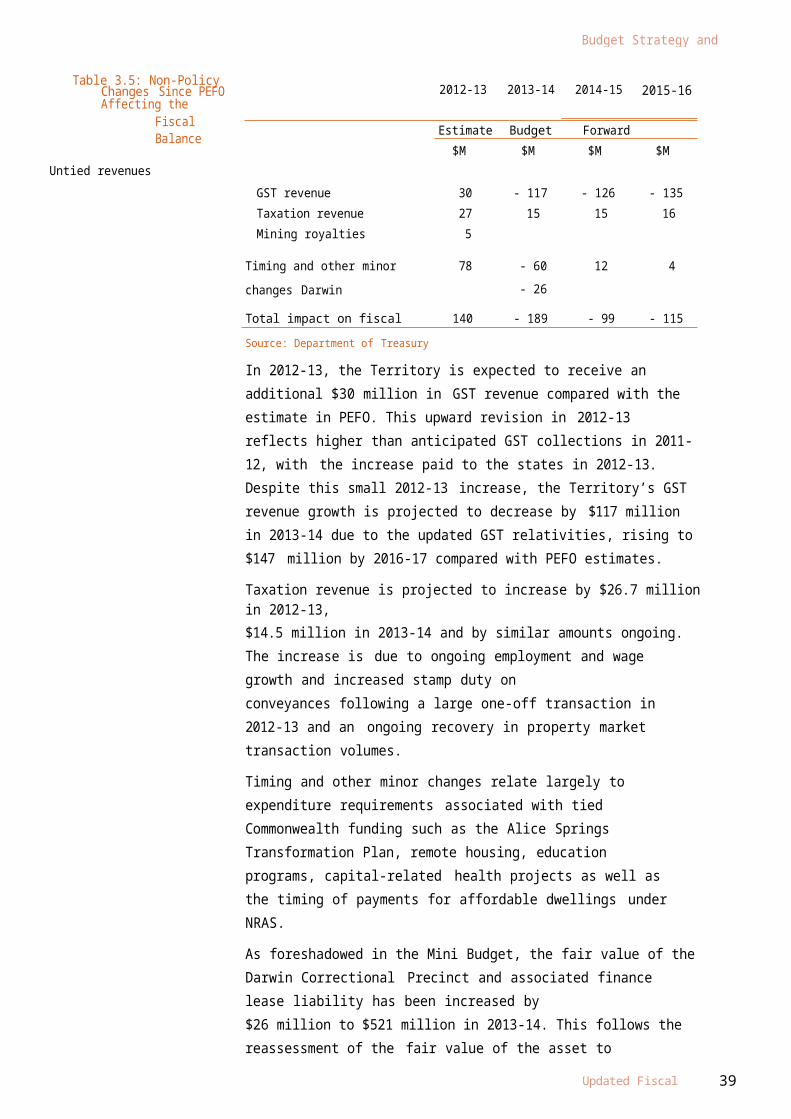
50
2013-14 Budget
Chapter 5 Uniform Presentation FrameworkUnder the Uniform Presentation Framework (UPF), the Commonwealth, state and territory governments have agreed to publish information in a standard format in their budget papers. The UPF is based on accounting standard AASB 1049 Whole of Government and General Government Sector Financial Reporting, which harmonises Government Finance Statistics and generally accepted accounting principles with the objective of improving the clarity and transparency of government financial statements.
The harmonised standard means that government financial reports are now presented on the same basis by all jurisdictions, resulting in greater transparency and consistency.
The Fiscal Integrity and Transparency Act requires that fiscal outlook reports be prepared in accordance with external reporting standards, including the Australian Accounting Standards or the UPF.
The tables in this chapter meet the Territory’s reporting obligations under both the Fiscal Integrity and Transparency Act and the UPF. They include, for each sector of government, a:
• Comprehensive Operating Statement;
• Balance Sheet; and
• Cash Flow Statement.
Also included are supplementary tables for the general government sector presenting:
• taxes;
• grant revenue and expenses;
• dividend and income tax equivalent income; and
• a revised 2013-14 Loan Council Allocation.
The financial statements for the general government, public non financial corporation and non financial public sectors include the revised 2012-13 Estimate, 2013-14 Budget and 2014-15 to 2016-17 Forward Estimates. The statements for the public financial corporation sector and total public sector present the 2012-13 Estimate only, with the remaining supplementary tables presenting both the 2012-13 Estimate and the 2013-14 Budget.
2013-14 Budget
Table 5.50
50 Uniform Presentation Framework
General Government Sector Comprehensive Operating Statement2012-13 2013-14 2014-15 2015-16 2016-17
Estimate Budget Forward Estimates
$000 $000 $000 $000 $000REVENUE
Taxation revenue 466 180 485 238 504 298 523 457 542 139
Current grants 3 625 953 3 582 240 3 664 494 3 856 524 3 984 877
Capital grants 187 185 201 752 155 881 149 022 118 575
Sales of goods and services 236 690 245 638 251 248 255 013 258 379
Interest income 45 683 54 529 55 747 56 702 57 856
Dividend and income tax equivalent income 51 001 66 884 98 414 111 517 109 071
Other 155 219 166 384 150 532 150 759 151 383
TOTAL REVENUE 4 767 911 4 802 665 4 880 614 5 102 994 5 222 280
less EXPENSES
Employee benefits expense 1 886 897 1 898 999 1 906 206 1 929 640 1 957 558
Superannuation expenses
Superannuation interest cost 109 727 106 400 120 811 142 638 164 022
Other superannuation expenses 204 112 215 556 210 180 204 552 181 162
Depreciation and amortisation 241 590 250 764 261 199 265 951 271 270
Other operating expenses 1 222 727 1 293 278 1 281 264 1 319 582 1 358 277
Interest expenses 183 682 205 192 276 894 289 536 300 559
Current grants 757 663 799 938 744 828 796 042 815 942
Capital grants 82 967 89 806 64 980 33 359 34 075
Subsidies and personal benefit payments 166 057 172 762 184 823 183 224 186 334
TOTAL EXPENSES 4 855 422 5 032 695 5 051 185 5 164 524 5 269 199
equals NET OPERATING BALANCE - 87 511 - 230 030 - 170 571 - 61 530 - 46 919
plus Other economic flows – included in operating result 68 658 20 912 27 199 22 721 23 690
equals OPERATING RESULT - 18 853 - 209 118 - 143 372 - 38 809 - 23 229plus Other economic flows – other non-owner changes 300 392 606 901 666 909 422 015 226 823
in equity
equals COMPREHENSIVE RESULT – total change in net worth before transactions with owners in their
281 539 397 783 523 537 383 206 203 594
capacity as owners
NET OPERATING BALANCE - 87 511 - 230 030 - 170 571 - 61 530 - 46 919
less Net acquisition of non financial assets
Purchases of non financial assets 712 490 675 202 503 065 465 977 432 590
Sales of non financial assets - 70 299 - 70 678 - 71 878 - 58 928 - 56 728
less Depreciation 241 590 250 764 261 199 265 951 271 270
plus Change in inventories
plus Other movements in non financial assets - 8 602 501 305 - 33 200
equals Total net acquisition of non financial assets 391 999 855 065 136 788 141 098 104 592
equals FISCAL BALANCE - 479 510 - 1 085 095 - 307 359 - 202 628 - 151 511
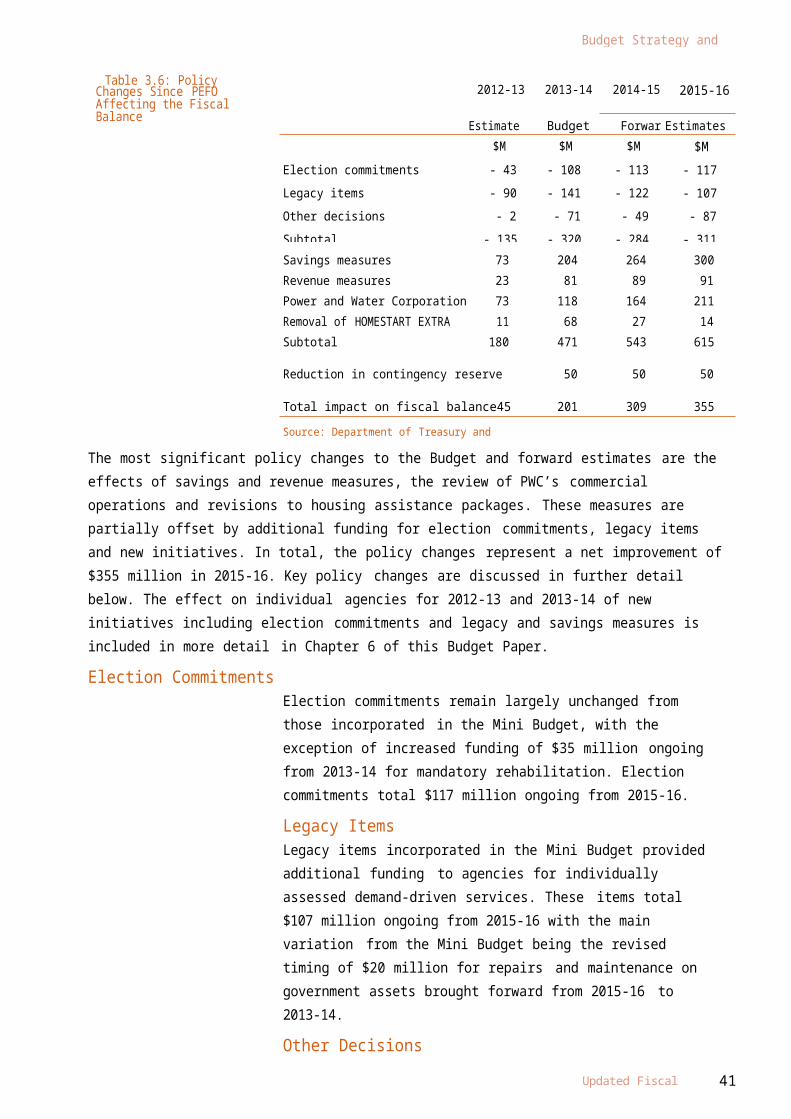
Budget Strategy and Outlook
Table 5.51
51Uniform Presentation Framework
General Government Sector Balance Sheet 2012-13 2013-14 2014-15 2015-16 2016-17
Estimate Budget Forward Estimates
ASSETS
Financial assets
Cash and deposits
$000
240 021
$000
123 377
$000
106 272
$000
89 338
$000
90 048Advances paid 238 262 234 262 227 262 220 262 213 262
Investments, loans and placements 749 075 789 611 829 942 872 074 915 867
Receivables
Equity
Investments in other public sector entities
170 968
2 813 383
183 155
3 116 574
199 978
3 316 312
205 734
3 534 575
207 185
3 757 446
Investments – other
Other financial assets Total financial assets
100
4 211 809
100
4 447 079
100
4 679 866
100
4 922 083
100
5 183 908
Non financial assets
Inventories 9 275 9 275 9 275 9 275 9 275
Property, plant and equipment 10 779 125 11 533 806 11 690 557 11 845 768 11 964 473
Investment property 99 700 95 493 91 386 87 979 84 822
Other non financial assets 65 826 65 270 65 257 65 244 65 231
Total non financial assets 10 953 926 11 703 844 11 856 475 12 008 266 12 123 801
TOTAL ASSETS 15 165 735 16 150 923 16 536 341 16 930 349 17 307 709
LIABILITIES
Deposits held 150 744 138 484 131 532 125 854 118 763
Advances received 378 272 369 456 360 096 345 148 334 565
Borrowing 2 669 465 3 647 314 3 920 206 4 115 616 4 285 168
Superannuation 3 830 861 3 454 287 3 032 553 2 857 577 2 868 434
Other employee benefits 552 566 562 418 570 418 576 418 582 418
Payables 147 145 147 199 161 634 161 628 161 859
Other liabilities 147 438 144 738 149 338 154 338 159 138
TOTAL LIABILITIES 7 876 491 8 463 896 8 325 777 8 336 579 8 510 345
NET ASSETS/(LIABILITIES)
Contributed equity
Accumulated surplus/(deficit)
7 289 244
593 590
7 687 027
793 072
8 210 564
1 103 700
8 593 770
1 264 691
8 797 364
1 241 462
Reserves 6 695 654 6 893 955 7 106 864 7 329 079 7 555 902
NET WORTH 7 289 244 7 687 027 8 210 564 8 593 770 8 797 364
NET FINANCIAL WORTH1 - 3 664 682 - 4 016 817 - 3 645 911 - 3 414 496 - 3 326 437NET FINANCIAL LIABILITIES2 6 478 065 7 133 391 6 962 223 6 949 071 7 083 883
NET DEBT3 1 971 123 3 008 004 3 248 358 3 404 944 3 519 319
1 Net financial worth equals total financial assets minus total liabilities.2 Net financial liabilities equals the sum of total liabilities less total financial assets excluding investments in other public sector entities.3 Net debt equals the sum of deposits held, advances received and borrowing, minus the sum of cash and deposits, advances paid and
investments, loans and placements.
2013-14 Budget
Table 5.52
52 Uniform Presentation Framework
General Government Sector Cash Flow Statement2012-13 2013-14 2014-15 2015-16 2016-17Estimate Budget Forward Estimates
$000 $000 $000 $000 $000Cash receipts from operating activitiesTaxes received 466 093 485 107 504 023 523 307 542 139Receipts from sales of goods and services 281 746 290 699 296 309 300 074 303 440Grants and subsidies received 3 813 138 3 783 992 3 820 375 4 005 546 4 103 452Interest receipts 45 652 54 501 55 729 56 694 57 856Dividends and income tax equivalents 43 680 54 856 81 884 105 919 107 620Other receipts 370 710 382 283 367 049 367 354 367 978Total operating receipts 5 021 019 5 051 438 5 125 369 5 358 894 5 482 485Cash payments for operating activitiesPayments for employees - 2 153 726 - 2 175 095 - 2 193 517 - 2 242 670 - 2 282 549Payment for goods and services - 1 489 282 - 1 554 226 - 1 540 181 - 1 579 535 - 1 618 330Grants and subsidies paid - 997 529 - 1 042 411 - 961 386 - 1 012 580 - 1 036 306Interest paid - 182 936 - 205 138 - 263 990 - 289 637 - 300 523Other paymentsTotal operating payments - 4 823 473 - 4 976 870 - 4 959 074 - 5 124 422 - 5 237 708NET CASH FLOWS FROM OPERATING ACTIVITIES 197 546 74 568 166 295 234 472 244 777Cash flows from investments in non financial assetsSales of non financial assets 67 099 63 878 71 878 58 928 56 728Purchases of non financial assets - 662 490 - 675 202 - 503 065 - 465 977 - 432 590Net cash flows from investments in non financial assets - 595 391 - 611 324 - 431 187 - 407 049 - 375 862NET CASH FROM OPERATING ACTIVITIES AND
INVESTMENTS IN NON FINANCIAL ASSETS- 397 845 - 536 756 - 264 892 - 172 577 - 131 085
Net cash flows from investments in financial assets - 69 546 14 450 20 171 10 952 10 952for policy purposes1
Net cash flows from investments in financial assets for 346 276 - 29 806 - 28 964 - 30 093 - 31 035liquidity purposes
NET CASH FLOWS FROM INVESTING ACTIVITIES - 318 661 - 626 680 - 439 980 - 426 190 - 395 945Net cash flows from financing activitiesAdvances received (net) 109 689 - 8 816 - 9 360 - 14 948 - 10 583Borrowing (net) 526 931 456 544 272 892 195 410 169 552Deposits received (net) - 653 435 - 12 260 - 6 952 - 5 678 - 7 091Other financing (net)NET CASH FLOWS FROM FINANCING ACTIVITIES - 16 815 435 468 256 580 174 784 151 878NET INCREASE/DECREASE IN CASH HELD - 137 930 - 116 644 - 17 105 - 16 934 710Net cash flows from operating activities 197 546 74 568 166 295 234 472 244 777Net cash flows from investments in non financial assets - 595 391 - 611 324 - 431 187 - 407 049 - 375 862CASH SURPLUS (+)/DEFICIT (-) - 397 845 - 536 756 - 264 892 - 172 577 - 131 085Future infrastructure and superannuation contributions/ - 11 263 - 20 147 - 21 358 - 22 640 - 23 997
earnings2
UNDERLYING SURPLUS (+)/DEFICIT (-) - 409 108 - 556 903 - 286 250 - 195 217 - 155 082Additional information to the Cash Flow StatementCASH SURPLUS (+)/DEFICIT (-) - 397 845 - 536 756 - 264 892 - 172 577 - 131 085Acquisitions under finance leases and similar - 521 305
arrangementsABS GFS SURPLUS (+)/DEFICIT (-) including finance - 397 845 -1 058 061 - 264 892 - 172 577 - 131 085
leases and similar arrangements
1 Includes equity acquisitions, disposals and privatisations (net).2 Contributions for future infrastructure and superannuation requirements.
Budget Strategy and Outlook
Table 5.53
53Uniform Presentation Framework
Public Non Financial Corporation Sector Comprehensive Operating Statement2012-13 2013-14 2014-15 2015-16 2016-17
Estimate Budget Forward Estimates
$000 $000 $000 $000 $000REVENUE
Current grants 137 979 144 599 146 611 149 327 152 596
Capital grants 44 519 32 140 17 452 18 974 18 069
Sales of goods and services 611 707 700 129 747 363 770 604 788 211
Interest income 5 048 2 892 2 761 2 580 2 600
Other 39 306 41 066 42 074 43 152 44 053
TOTAL REVENUE 838 559 920 826 956 261 984 637 1 005 529
less EXPENSES
Employee benefits expense 100 604 102 186 108 429 114 455 126 870
Superannuation expenses 13 443 13 755 14 583 15 115 15 572
Depreciation and amortisation 160 803 162 377 173 198 182 431 191 762
Other operating expenses 492 633 499 710 505 703 507 764 508 901
Interest expenses 84 157 89 255 93 713 98 474 102 464
Other property expenses 2 377 9 814 29 209 36 947 34 926
Current grants 560
Capital grants
Subsidies and personal benefit payments 18 522 17 154 14 790 16 681 18 690
TOTAL EXPENSES 873 099 894 251 939 625 971 867 999 185
equals NET OPERATING BALANCE - 34 540 26 575 16 636 12 770 6 344plus Other economic flows – included in operating - 1 549 - 2 011 - 1 432 - 1 515 - 1 570
result
equals OPERATING RESULT - 36 089 24 564 15 204 11 255 4 774plus Other economic flows – other non-owner changes 286 898 132 711 162 863 172 219 181 659
in equity
equals COMPREHENSIVE RESULT – total change in net worth before transactions with owners in their
250 809 157 275 178 067 183 474 186 433
capacity as owners
NET OPERATING BALANCE - 34 540 26 575 16 636 12 770 6 344
less Net acquisition of non financial assets
Purchases of non financial assets 309 151 273 510 208 057 198 538 193 036
Sales of non financial assets - 126 - 126 - 126 - 126 - 126
less Depreciation 160 803 162 377 173 198 182 431 191 762
plus Change in inventories 7 009 - 1 806 576 3 147 4 483
plus Other movements in non financial assets 12 000 12 300 12 608 12 923 13 246
equals Total net acquisition of non financial assets 167 231 121 501 47 917 32 051 18 877
equals FISCAL BALANCE - 201 771 - 94 926 - 31 281 - 19 281 - 12 533
2013-14 Budget
Table 5.54
54 Uniform Presentation Framework
Public Non Financial Corporation Sector Balance Sheet2012-13 2013-14 2014-15 2015-16 2016-17
Estimate Budget Forward Estimates
$000 $000 $000 $000 $000ASSETS
Financial assets
Cash and deposits 78 763 65 489 67 005 75 919 87 289
Advances paid
Investments, loans and placements
Receivables 101 212 102 753 108 516 112 303 114 418
Equity
Other financial assets
Total financial assets
3
179 978
3
168 245
3
175 524
3
188 225
3
201 710
Non financial assets
Inventories 103 908 102 102 102 678 105 825 110 308
Property, plant and equipment 3 623 514 3 986 893 4 191 418 4 390 062 4 583 736
Investment property 45 145 53 245 59 045 61 645 64 145
Other non financial assets 41 432 47 269 58 065 77 872 102 321
Total non financial assets 3 813 999 4 189 509 4 411 206 4 635 404 4 860 510
TOTAL ASSETS 3 993 977 4 357 754 4 586 730 4 823 629 5 062 220
LIABILITIES
Deposits held 333 333 333 333 333
Advances received
Borrowing 1 384 883 1 473 791 1 548 273 1 614 428 1 681 071
Superannuation
Other employee benefits 48 253 52 797 54 611 56 679 59 040
Payables 63 545 76 351 63 910 63 331 64 039
Other liabilities 39 006 39 359 51 806 55 506 54 222
TOTAL LIABILITIES 1 536 020 1 642 631 1 718 933 1 790 277 1 858 705
NET ASSETS/(LIABILITIES) 2 457 957 2 715 123 2 867 797 3 033 352 3 203 515
Contributed equity 563 942 668 832 655 661 651 709 647 757
Accumulated surplus/(deficit) 606 030 625 595 628 577 625 865 618 321
Reserves 1 287 985 1 420 696 1 583 559 1 755 778 1 937 437
TOTAL EQUITY 2 457 957 2 715 123 2 867 797 3 033 352 3 203 515
NET FINANCIAL WORTH1 - 1 356 042 - 1 474 386 - 1 543 409 - 1 602 052 - 1 656 995
NET DEBT2 1 306 453 1 408 635 1 481 601 1 538 842 1 594 115
1 Net financial worth equals total financial assets minus total liabilities.2 Net debt equals the sum of deposits held, advances received and borrowing, minus the sum of cash and deposits, advances paid and
investments, loans and placements.
NET CASH FLOWS FROM INVESTING ACTIVITIES - 309 025 - 273 384 - 207 931 - 198 412 - 192 910Net cash flows from financing activitiesAdvances received (net)Borrowing (net) 126 545 88 908 74 482 66 155 66 643Deposits received (net)Dividends paid - 4 045 - 620 - 4 999 - 12 223 - 13 966Other financing (net) - 10 450 - 13 171 - 3 952 - 3 952NET CASH FLOWS FROM FINANCING ACTIVITIES 122 500 77 838 56 312 49 980 48 725NET INCREASE/DECREASE IN CASH HELD - 148 805 - 13 274 1 516 8 914 11 370Net cash flows from operating activities 37 720 182 272 153 135 157 346 155 555Net cash flows from investments in non financial assets - 309 025 - 273 384 - 207 931 - 198 412 - 192 910Dividends paid - 4 045 - 620 - 4 999 - 12 223 - 13 966CASH SURPLUS (+)/DEFICIT (-) - 275 350 - 91 732 - 59 795 - 53 289 - 51 321Additional information to the Cash Flow StatementCASH SURPLUS (+)/DEFICIT (-) - 275 350 - 91 732 - 59 795 - 53 289 - 51 321Acquisitions under finance leases and similar
arrangementsABS GFS SURPLUS (+)/DEFICIT (-) including finance - 275 350 - 91 732 - 59 795 - 53 289 - 51 321
Budget Strategy and Outlook
Table 5.55
55Uniform Presentation Framework
Public Non Financial Corporation Sector Cash Flow Statement2012-13 2013-14 2014-15 2015-16 2016-17Estimate Budget Forward Estimates
$000 $000 $000 $000 $000Cash receipts from operating activitiesReceipts from sales of goods and services 604 156 692 403 744 377 770 529 790 420Grants and subsidies received 182 253 176 739 164 063 168 301 170 665Interest receipts 5 044 2 889 2 758 2 580 2 600Other receipts 28 391 23 033 24 045 24 195 24 551Total operating receipts 819 844 895 064 935 243 965 605 988 236Cash payments for operating activitiesIncome tax equivalents paid - 3 310 - 3 249 - 23 926 - 35 186 - 34 557Payments for employees - 121 999 - 120 058 - 129 993 - 136 449 - 149 228Payment for goods and services - 553 274 - 483 378 - 520 007 - 521 675 - 527 820Grants and subsidies paid - 19 082 - 17 154 - 14 790 - 16 681 - 18 690Interest paid - 84 459 - 88 953 - 93 392 - 98 268 - 102 386Other paymentsTotal operating payments - 782 124 - 712 792 - 782 108 - 808 259 - 832 681NET CASH FLOWS FROM OPERATING ACTIVITIES 37 720 182 272 153 135 157 346 155 555Cash flows from investments in non financial assetsSales of non financial assets 126 126 126 126 126Purchases of non financial assets - 309 151 - 273 510 - 208 057 - 198 538 - 193 036Net cash flows from investments in non financial assets - 309 025 - 273 384 - 207 931 - 198 412 - 192 910NET CASH FROM OPERATING ACTIVITIES AND
INVESTMENTS IN NON FINANCIAL ASSETS- 271 305 - 91 112 - 54 796 - 41 066 - 37 355
Net cash flows from investments in financial assets for policy purposes1
Net cash flows from investments in financial assets for liquidity purposes
leases and similar arrangements
1 Includes equity acquisitions, disposals and privatisations (net).
2013-14 Budget
Table 5.56
56 Uniform Presentation Framework
Non Financial Public Sector Comprehensive Operating Statement2012-13 2013-14 2014-15 2015-16 2016-17
Estimate Budget Forward Estimates
$000 $000 $000 $000 $000REVENUE
Taxation revenue 457 441 476 300 495 156 514 315 532 997
Current grants 3 626 797 3 584 243 3 665 259 3 856 669 3 984 877
Capital grants 193 956 217 113 156 135 150 368 118 575
Sales of goods and services 815 576 914 804 967 599 994 976 1 015 949
Interest income 45 743 54 529 55 747 56 702 57 856
Dividend and income tax equivalent income 51 004 52 071 56 983 60 603 61 827
Other 191 498 204 584 189 688 190 993 192 518
TOTAL REVENUE 5 382 015 5 503 644 5 586 567 5 824 626 5 964 599
less EXPENSES
Employee benefits expense 1 987 501 2 001 185 2 014 635 2 044 095 2 084 428
Superannuation expenses
Superannuation interest cost 109 727 106 400 120 811 142 638 164 022
Other superannuation expenses 215 021 226 725 222 125 217 029 194 096
Depreciation and amortisation 402 393 413 141 434 397 448 382 463 032
Other operating expenses 1 676 307 1 752 807 1 746 533 1 787 283 1 827 115
Interest expenses 262 851 291 555 367 846 385 430 400 423
Current grants 704 354 745 438 688 901 738 651 757 048
Capital grants 45 219 73 027 47 782 15 731 16 006
Subsidies and personal benefit payments 101 313 101 820 109 694 108 114 111 322
TOTAL EXPENSES 5 504 686 5 712 098 5 752 724 5 887 353 6 017 492
equals NET OPERATING BALANCE - 122 671 - 208 454 - 166 157 - 62 727 - 52 893plus Other economic flows – included in operating 67 109 18 901 25 767 21 206 22 120
result
equals OPERATING RESULT - 55 562 - 189 553 - 140 390 - 41 521 - 30 773plus Other economic flows – other non-owner changes 337 101 587 336 663 927 424 727 234 367
in equity
equals COMPREHENSIVE RESULT – total change in net worth before transactions with owners in their
281 539 397 783 523 537 383 206 203 594
capacity as owners
NET OPERATING BALANCE - 122 671 - 208 454 - 166 157 - 62 727 - 52 893
less Net acquisition of non financial assets
Purchases of non financial assets 1 021 641 948 712 711 122 664 515 625 626
Sales of non financial assets - 70 425 - 70 804 - 72 004 - 59 054 - 56 854
less Depreciation 402 393 413 141 434 397 448 382 463 032
plus Change in inventories 7 009 - 1 806 576 3 147 4 483
plus Other movements in non financial assets 3 398 513 605 - 20 592 12 923 13 246
equals Total net acquisition of non financial assets 559 230 976 566 184 705 173 149 123 469
equals FISCAL BALANCE - 681 901 - 1 185 020 - 350 862 - 235 876 - 176 362
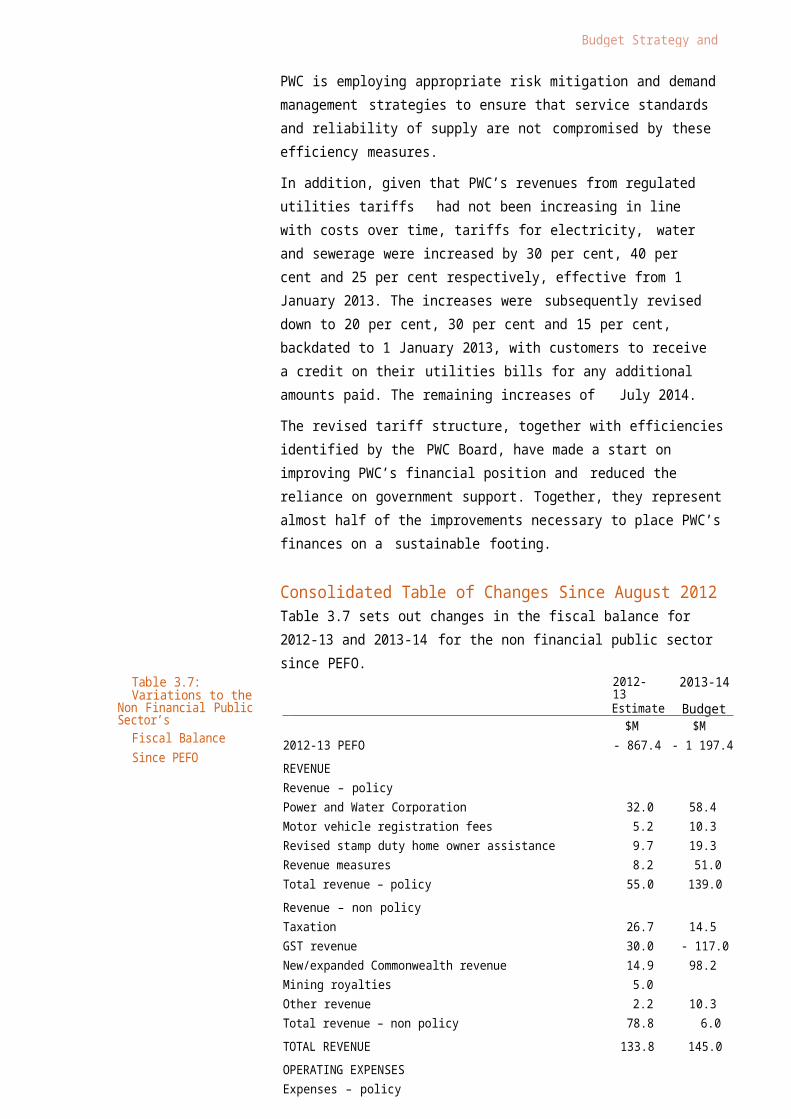
57Uniform Presentation Framework
Budget Strategy and Outlook
Table 5.57Non Financial Public Sector Balance Sheet
2012-13 2013-14 2014-15 2015-16 2016-17
Estimate Budget Forward Estimates
ASSETS
Financial assets
Cash and deposits
$000
240 050
$000
123 406
$000
106 301
$000
89 367
$000
90 077Advances paid 238 262 234 262 227 262 220 262 213 262
Investments, loans and placements 749 075 789 611 829 942 872 074 915 867
Receivables
Equity
Investments in other public sector entities
260 558
355 426
263 006
401 451
272 799
448 515
278 675
501 223
283 526
553 931
Investments – other
Other financial assets Total financial assets
103
1 843 474
103
1 811 839
103
1 884 922
103
1 961 704
103
2 056 766
Non financial assets
Inventories 113 183 111 377 111 953 115 100 119 583
Property, plant and equipment 14 402 639 15 520 699 15 881 975 16 235 830 16 548 209
Investment property 144 845 148 738 150 431 149 624 148 967
Other non financial assets 107 258 112 539 123 322 143 116 167 552
Total non financial assets 14 767 925 15 893 353 16 267 681 16 643 670 16 984 311
TOTAL ASSETS 16 611 399 17 705 192 18 152 603 18 605 374 19 041 077
LIABILITIES
Deposits held 72 343 73 357 64 889 50 297 31 836
Advances received 378 272 369 456 360 096 345 148 334 565
Borrowing 4 054 348 5 121 105 5 468 479 5 730 044 5 966 239
Superannuation 3 830 861 3 454 287 3 032 553 2 857 577 2 868 434
Other employee benefits 600 819 615 215 625 029 633 097 641 458
Payables 201 257 214 023 216 004 215 412 216 352
Other liabilities 184 255 170 722 174 989 180 029 184 829
TOTAL LIABILITIES 9 322 155 10 018 165 9 942 039 10 011 604 10 243 713
NET ASSETS/(LIABILITIES)
Contributed equity
Accumulated surplus/(deficit)
7 289 244
1 199 620
7 687 027
1 418 667
8 210 564
1 732 277
8 593 770
1 890 556
8 797 364
1 859 783
Reserves 6 089 624 6 268 360 6 478 287 6 703 214 6 937 581
NET WORTH 7 289 244 7 687 027 8 210 564 8 593 770 8 797 364
NET FINANCIAL WORTH1 - 7 478 681 - 8 206 326 - 8 057 117 - 8 049 900 - 8 186 947NET FINANCIAL LIABILITIES2 7 834 107 8 607 777 8 505 632 8 551 123 8 740 878
NET DEBT3 3 277 576 4 416 639 4 729 959 4 943 786 5 113 434
1 Net financial worth equals total financial assets minus total liabilities.2 Net financial liabilities equals the sum of total liabilities less total financial assets excluding investments in other public sector entities.3 Net debt equals the sum of deposits held, advances received and borrowing, minus the sum of cash and deposits, advances paid and
investments, loans and placements.
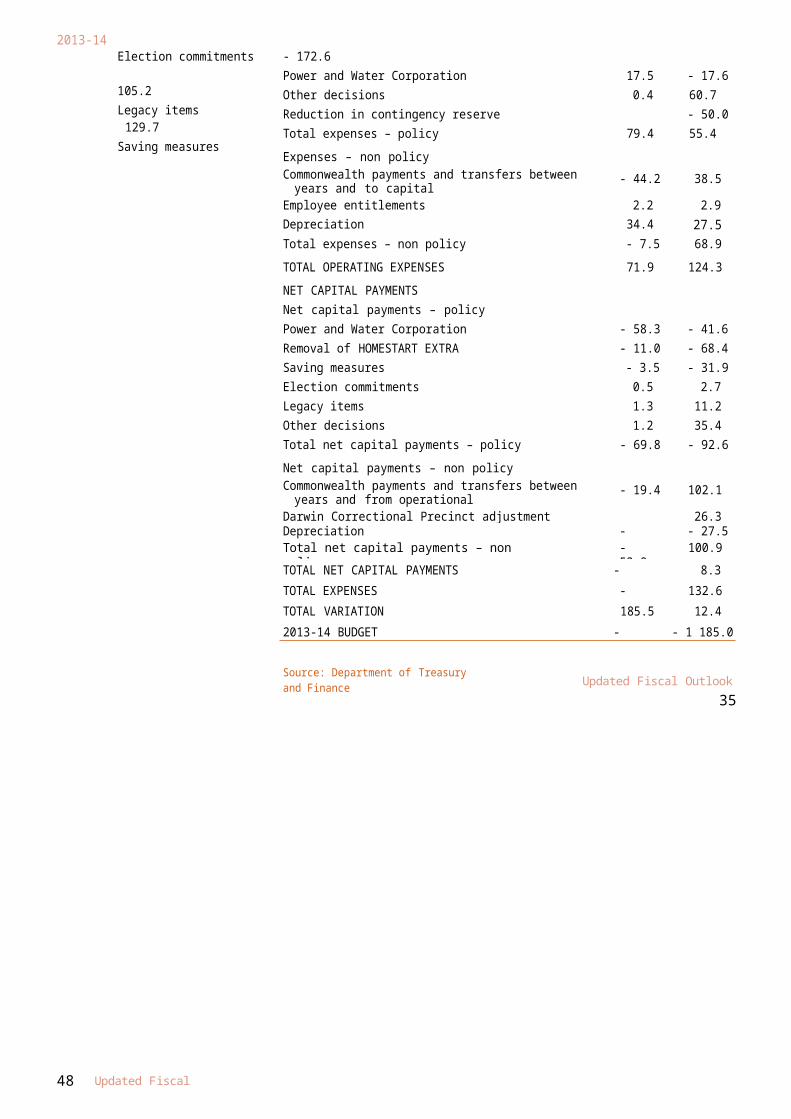
2013-14 Budget
Table 5.58
58 Uniform Presentation Framework
Non Financial Public Sector Cash Flow Statement2012-13 2013-14 2014-15 2015-16 2016-17Estimate Budget Forward Estimates
$000 $000 $000 $000 $000Cash receipts from operating activitiesTaxes received 457 444 476 300 495 156 514 315 532 997Receipts from sales of goods and services 853 081 952 139 1 009 674 1 039 962 1 063 219Grants and subsidies received 3 820 508 3 801 356 3 821 394 4 007 037 4 103 452Interest receipts 45 712 54 501 55 732 56 697 57 856Dividends and income tax equivalents 36 168 51 189 52 965 58 519 59 091Other receipts 398 608 405 036 390 814 391 269 392 249Total operating receipts 5 611 521 5 740 521 5 825 735 6 067 799 6 208 864Cash payments for operating activitiesPayments for employees - 2 266 979 - 2 286 457 - 2 314 642 - 2 370 132 - 2 422 630Payment for goods and services - 1 959 182 - 2 006 452 - 2 028 903 - 2 070 293 - 2 115 228Grants and subsidies paid - 841 728 - 900 190 - 813 132 - 862 451 - 884 331Interest paid - 262 411 - 291 202 - 354 627 - 385 328 - 400 309Other paymentsTotal operating payments - 5 330 300 - 5 484 301 - 5 511 304 - 5 688 204 - 5 822 498NET CASH FLOWS FROM OPERATING ACTIVITIES 281 221 256 220 314 431 379 595 386 366Cash flows from investments in non financial assetsSales of non financial assets 67 225 64 004 72 004 59 054 56 854Purchases of non financial assets - 1 021 641 - 948 712 - 711 122 - 664 515 - 625 626Net cash flows from investments in non financial assets - 954 416 - 884 708 - 639 118 - 605 461 - 568 772NET CASH FROM OPERATING ACTIVITIES AND
INVESTMENTS IN NON FINANCIAL ASSETS- 673 195 - 628 488 - 324 687 - 225 866 - 182 406
Net cash flows from investments in financial assets for - 69 546 4 000 7 000 7 000 7 000policy purposes1
Net cash flows from investments in financial assets 346 276 - 29 806 - 28 964 - 30 093 - 31 035for liquidity purposes
NET CASH FLOWS FROM INVESTING ACTIVITIES - 677 686 - 910 514 - 661 082 - 628 554 - 592 807Net cash flows from financing activitiesAdvances received (net) 109 689 - 8 816 - 9 360 - 14 948 - 10 583Borrowing (net) 653 476 545 452 347 374 261 565 236 195Deposits received (net) - 504 630 1 014 - 8 468 - 14 592 - 18 461Other financing (net)NET CASH FLOWS FROM FINANCING ACTIVITIES 258 535 537 650 329 546 232 025 207 151NET INCREASE/DECREASE IN CASH HELD - 137 930 - 116 644 - 17 105 - 16 934 710Net cash flows from operating activities 281 221 256 220 314 431 379 595 386 366Net cash flows from investments in non financial assets - 954 416 - 884 708 - 639 118 - 605 461 - 568 772CASH SURPLUS (+)/DEFICIT (-) - 673 195 - 628 488 - 324 687 - 225 866 - 182 406Future infrastructure and superannuation contributions/ - 11 263 - 20 147 - 21 358 - 22 640 - 23 997
earnings2
UNDERLYING SURPLUS (+)/DEFICIT (-) - 684 458 - 648 635 - 346 045 - 248 506 - 206 403Additional information to the Cash Flow StatementCASH SURPLUS (+)/DEFICIT (-) - 673 195 - 628 488 - 324 687 - 225 866 - 182 406Acquisitions under finance leases and similar - 521 305
arrangementsABS GFS SURPLUS (+)/DEFICIT (-) including finance - 673 195 - 1 149 793 - 324 687 - 225 866 - 182 406
leases and similar arrangements
1 Includes equity acquisitions, disposals and privatisations (net).2 Contributions for future infrastructure and superannuation requirements.
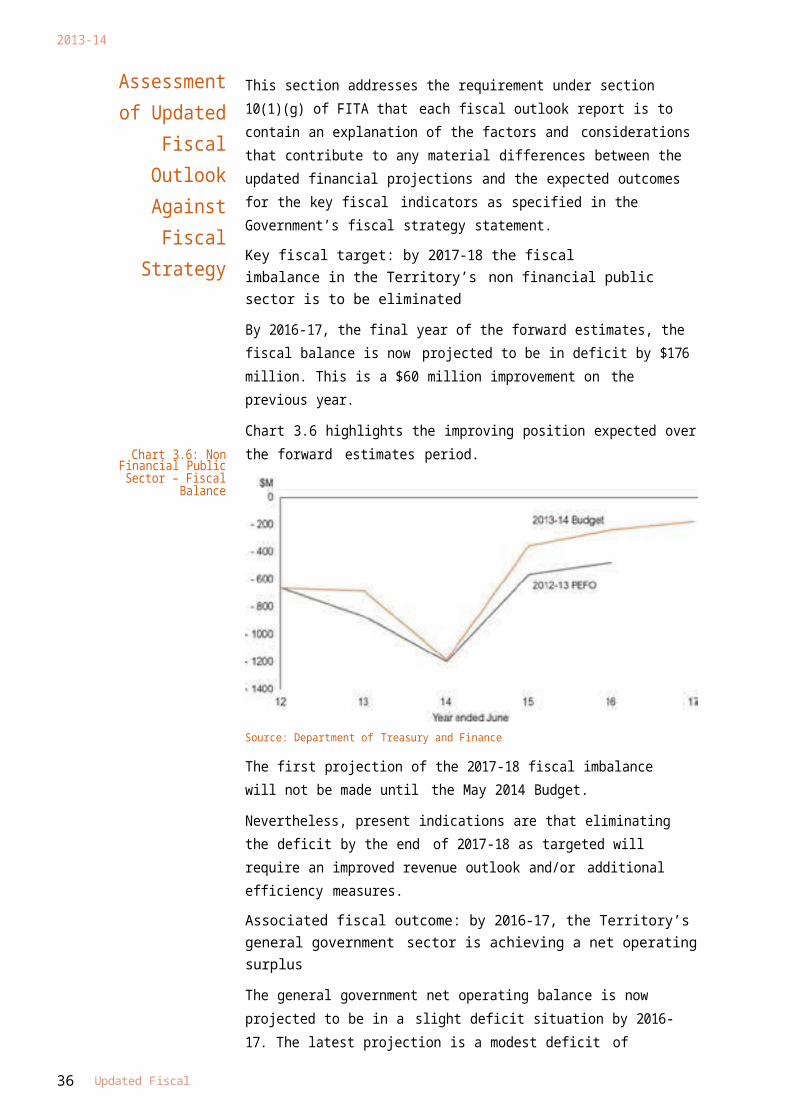
Budget Strategy and Outlook
Table 5.10
10 Uniform Presentation Framework
Public Financial Corporation Sector Comprehensive Operating Statement
REVENUE
Current grants
Capital grants
2012-13Estimate
$000
Sales of goods and services 231 987
Interest income 317 799
Other 1 995
TOTAL REVENUE 551 781
less EXPENSES
Employee benefits expense 32 906
Superannuation expenses 1 829
Depreciation and amortisation 3 300
Other operating expenses 191 831
Interest expenses 252 115
Other property expenses 20 285
Current grants 4 000
Capital grants
Subsidies and personal benefit payments
TOTAL EXPENSES 506 266
equals NET OPERATING BALANCE 45 515
plus Other economic flows – included in operating result 43 308
equals OPERATING RESULT 88 823
plus Other economic flows – other non-owner changes in equity - 16
equals COMPREHENSIVE RESULT – total change in net worth before transactions with owners in their capacity as owners 88 807
NET OPERATING BALANCE 45 515
less Net acquisition of non financial assets
Purchases of non financial assets 4 507
Sales of non financial assets - 803
less Depreciation 3 300
plus Change in inventories
plus Other movements in non financial assets
equals Total net acquisition of non financial assets 404
equals FISCAL BALANCE 45 111

2013-14 Budget
Table 5.11
11Uniform Presentation Framework
Public Financial Corporation Sector Balance Sheet2012-13Estimate
$000ASSETS
Financial assets
Cash and deposits 182 707
Advances paid 85 025
Investments, loans and placements 5 436 085
Receivables 144 999
Equity
Other financial assets
Total financial assets 5 848 816
Non financial assets
Inventories
Property, plant and equipment 45 657
Investment property
Other non financial assets 2 807
Total non financial assets 48 464
TOTAL ASSETS 5 897 280
LIABILITIES
Deposits held 516 945
Advances received 247 143
Borrowing 4 059 500
Superannuation
Other employee benefits 4 598
Payables 83 794
Other liabilities 629 874
TOTAL LIABILITIES 5 541 854
NET ASSETS/(LIABILITIES) 355 426
Contributed equity 58 054
Accumulated surplus/(deficit) 277 063
Other reserves 20 309
TOTAL EQUITY 355 426
NET FINANCIAL WORTH1 306 962
NET DEBT2 - 880 229
1 Net financial worth equals total financial assets minus total liabilities.2 Net debt equals the sum of deposits held, advances received and borrowing, minus the sum of cash and deposits, advances paid and
investments, loans and placements.
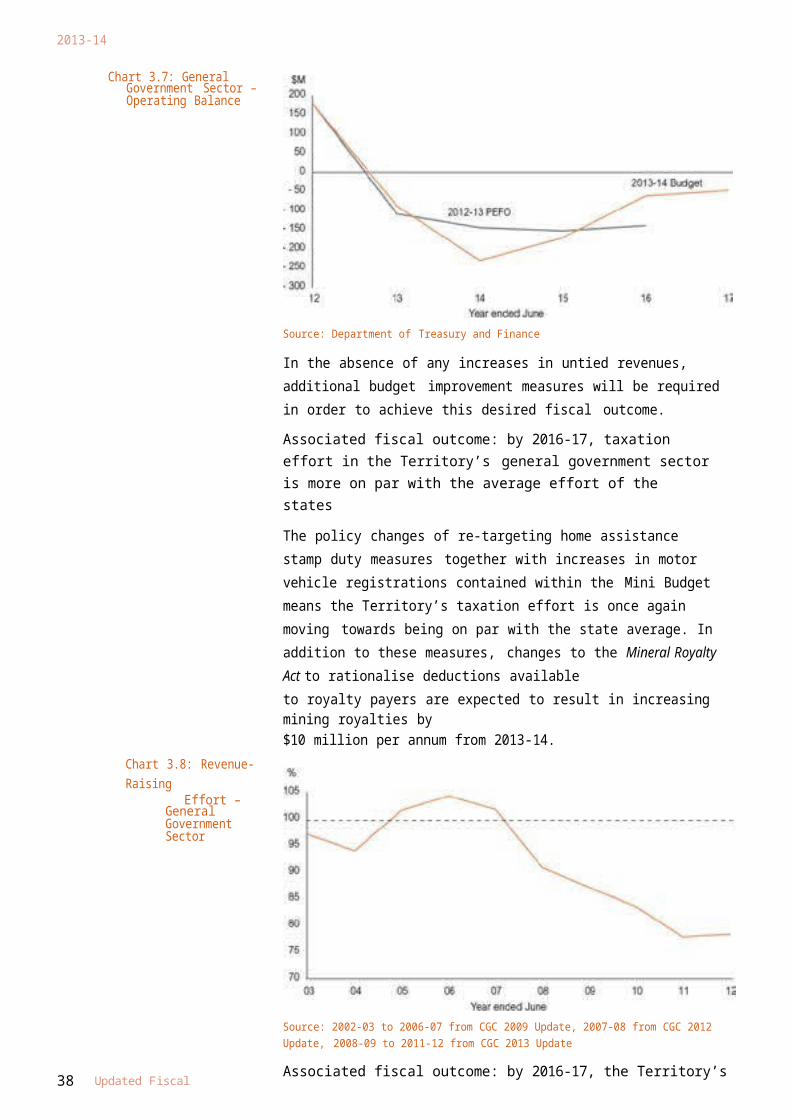
Budget Strategy and Outlook
Table 5.12
12 Uniform Presentation Framework
Public Financial Corporation Sector Cash Flow Statement2012-13Estimate
Cash receipts from operating activities
$000
Receipts from sales of goods and services Grants and subsidies received
Interest receipts
262 333
317 049
Other receipts 8 892
Total operating receipts
Cash payments for operating activities
Income tax equivalents paid
588 274
- 12 220
Payments for employees - 36 164
Payment for goods and services - 160 802
Grants and subsidies paid - 4 000
Interest paid - 247 930
Other payments - 2 357
Total operating payments - 463 473
NET CASH FLOWS FROM OPERATING ACTIVITIES
Cash flows from investments in non financial assets
Sales of non financial assets
124 801
803
Purchases of non financial assets - 4 507
Net cash flows from investments in non financial assets - 3 704
NET CASH FROM OPERATING ACTIVITIES AND INVESTMENTS IN NON FINANCIAL ASSETS 121 097
Net cash flows from investments in financial assets for policy purposes1
Net cash flows from investments in financial assets for liquidity purposes - 856 672NET CASH FLOWS FROM INVESTING ACTIVITIES
Net cash flows from financing activities
Advances received (net)
- 860 376
- 5 925
Borrowing (net) 264 087
Deposits received (net) 13 984
Dividends paid Other financing (net)
NET CASH FLOWS FROM FINANCING ACTIVITIES
- 23 948
248 198
NET INCREASE/DECREASE IN CASH HELD - 487 377
Net cash flows from operating activities 124 801
Net cash flows from investments in non financial assets - 3 704
Distributions paid - 23 948
CASH SURPLUS (+)/DEFICIT (-) 97 149
Additional information to the Cash Flow Statement
CASH SURPLUS (+)/DEFICIT (-) 97 149Acquisitions under finance leases and similar arrangements
ABS GFS SURPLUS (+)/DEFICIT (-) including finance leases and similar arrangements 97 149
1 Includes equity acquisitions, disposals and privatisations (net).

2013-14 Budget
Table 5.13
13Uniform Presentation Framework
Total Public Sector Comprehensive Operating Statement2012-13Estimate
$000REVENUE
Taxation revenue 456 405
Current grants 3 626 297
Capital grants 193 956
Sales of goods and services 1 043 375
Interest income 106 417
Dividend and income tax equivalent income
Other 190 854
TOTAL REVENUE 5 617 304
less EXPENSES
Employee benefits expense 2 020 407
Superannuation expenses
Superannuation interest cost 109 727
Other superannuation expenses 216 817
Depreciation and amortisation 405 693
Other operating expenses 1 860 308
Interest expenses 257 841
Other property expenses 2 357
Current grants 707 854
Capital grants 45 219
Subsidies and personal benefit payments 101 313
TOTAL EXPENSES 5 727 536
equals NET OPERATING BALANCE - 110 232
plus Other economic flows – included in operating result 110 417
equals OPERATING RESULT 185
plus Other economic flows – other non-owner changes in equity 281 354
equals COMPREHENSIVE RESULT – total change in net worth before transactions with owners in their capacity as owners
281 539
NET OPERATING BALANCE - 110 232
less Net acquisition of non financial assets
Purchases of non financial assets 1 026 148
Sales of non financial assets - 71 228
less Depreciation 405 693
plus Change in inventories 7 009
plus Other movements in non financial assets 3 398
equals Total net acquisition of non financial assets 559 634
equals FISCAL BALANCE - 669 866
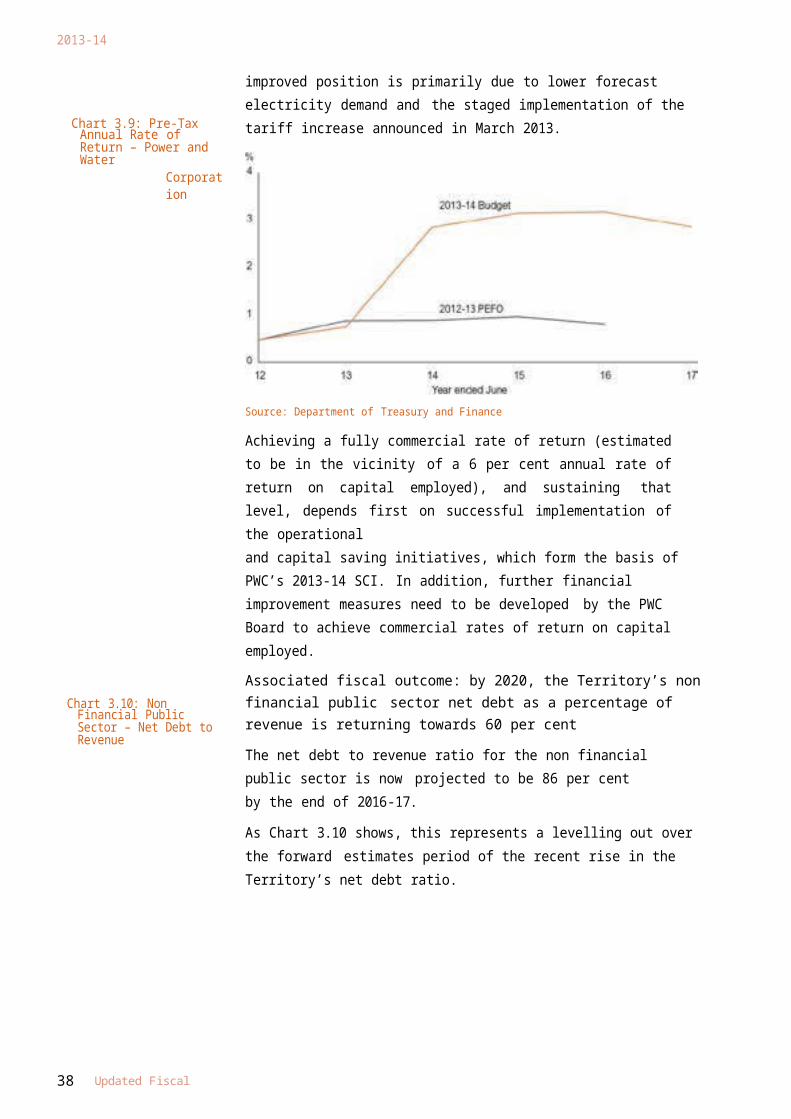
Budget Strategy and Outlook
Table 5.14
14 Uniform Presentation Framework
Total Public Sector Balance Sheet 2012-13
Estimate
ASSETS
Financial assets
Cash and deposits
$000
392 800Advances paid 233 868
Investments, loans and placements 1 947 221
Receivables Equity
Investments in other public sector entities
Investments – other
347 568
103
Other financial assets
Total financial assets 2 921 560
Non financial assets
Inventories 113 183
Property, plant and equipment 14 448 296
Investment property 144 845
Other non financial assets 110 065
Total non financial assets 14 816 389
TOTAL ASSETS 17 737 949
LIABILITIES
Deposits held 559 331
Advances received 242 749
Borrowing 4 169 156
Superannuation 3 830 861
Other employee benefits 605 417
Payables 273 288
Other liabilities 767 903
TOTAL LIABILITIES 10 448 705
NET ASSETS/(LIABILITIES)
Contributed equity
Accumulated surplus/(deficit)
7 289 244
1 476 683
Reserves 5 812 561
NET WORTH 7 289 244
NET FINANCIAL WORTH1 - 7 527 145
NET DEBT2 2 397 347
1 Net financial worth equals total financial assets minus total liabilities.2 Net debt equals the sum of deposits held, advances received and borrowing, minus the sum of cash and deposits, advances paid and
investments, loans and placements.
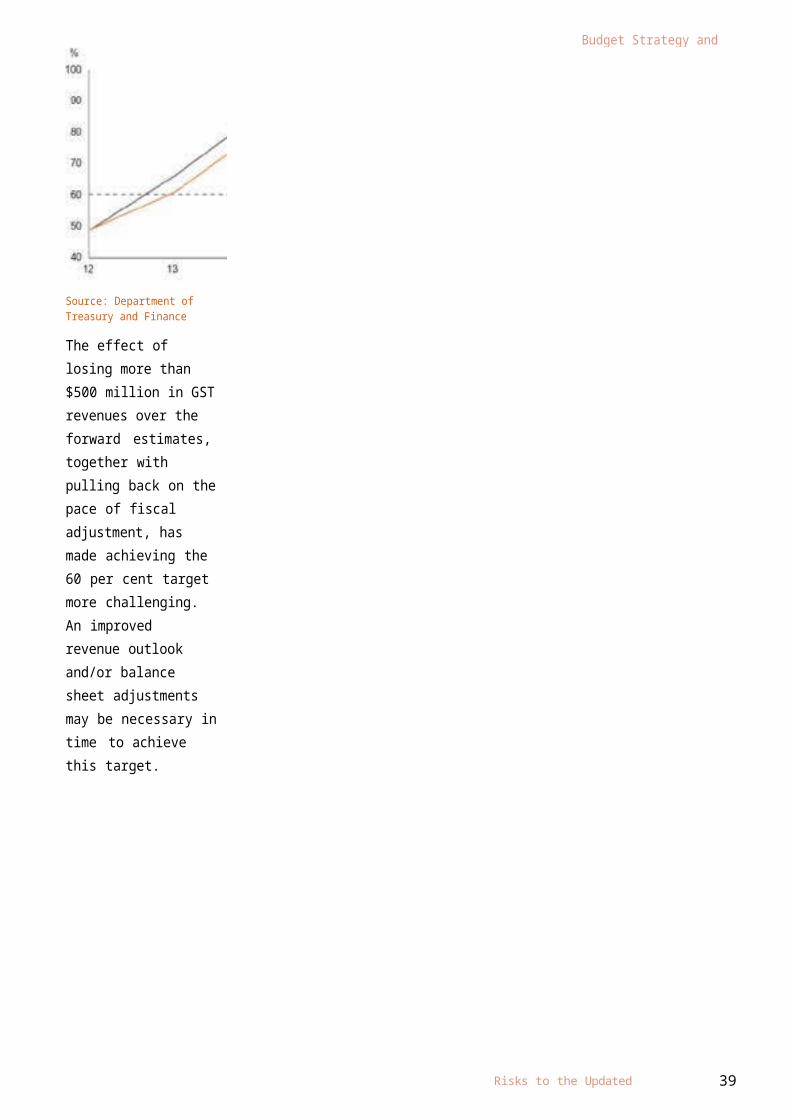
2013-14 Budget
Table 5.15
15Uniform Presentation Framework
Total Public Sector Cash Flow Statement2012-13Estimate
$000Cash receipts from operating activities
Taxes received 456 408
Receipts from sales of goods and services 1 111 226
Grants and subsidies received 3 820 008
Interest receipts 106 075
Other receipts 404 894
Total operating receipts 5 898 611
Cash payments for operating activities
Payments for employees - 2 302 107
Payment for goods and services - 2 113 190
Grants and subsidies paid - 845 228
Interest paid - 253 655
Other payments - 2 357
Total operating payments - 5 516 537
NET CASH FLOWS FROM OPERATING ACTIVITIES 382 074
Cash flows from investments in non financial assets
Sales of non financial assets 68 028
Purchases of non financial assets - 1 026 148
Net cash flows from investments in non financial assets - 958 120
NET CASH FROM OPERATING ACTIVITIES AND INVESTMENTS IN NON FINANCIAL ASSETS - 576 046
Net cash flows from investments in financial assets for policy purposes1 - 69 546Net cash flows from investments in financial assets for liquidity purposes 254 037
NET CASH FLOWS FROM INVESTING ACTIVITIES - 773 629
Net cash flows from financing activities
Advances received (net) - 5 925
Borrowing (net) 262 819
Deposits received (net) 8 469
Other financing (net)
NET CASH FLOWS FROM FINANCING ACTIVITIES 265 363
NET INCREASE/DECREASE IN CASH HELD - 126 192
Net cash flows from operating activities 382 074
Net cash flows from investments in non financial assets - 958 120
CASH SURPLUS (+)/DEFICIT (-) - 576 046
Future infrastructure and superannuation contributions/earnings2 - 11 263
UNDERLYING SURPLUS (+)/DEFICIT (-) - 587 309
Additional information to the Cash Flow StatementCASH SURPLUS (+)/DEFICIT (-) - 576 046
Acquisitions under finance leases and similar arrangements
ABS GFS SURPLUS (+)/DEFICIT (-) including finance leases and similar arrangements - 576 046
1 Includes equity acquisitions, disposals and privatisations (net).2 Contributions for future infrastructure and superannuation requirements.
Budget Strategy and Outlook
Table 5.16
16 Uniform Presentation Framework
General Government Sector Taxes 2012-13
Estimate2013-14Budget
$M $M
Taxes on employers’ payroll and labour force 191 200
Payroll taxes 191 200
Taxes on property 131 130
Stamp duties on financial and capital transactions 131 130
Taxes on the provision of goods and services 88 91
Taxes on gambling 52 53
Taxes on insurance 36 38
Taxes on the use of goods and performance of activities 57 64
Motor vehicle registration fees 57 64
TOTAL TAXES 466 485
Table 5.17
State and Territory General Government Sector Grant Revenue
2012-13Estimate
2013-14Budget
Current grant revenue
Current grants from the Commonwealth (including for on-passing)
$M $M
National partnership payments 246 266
Specific purpose payments 236 201
General purpose grants 3 144 3 115
Total current grant revenue 3 626 3 582
Capital grant revenue
Capital grants from the Commonwealth (including for on-passing)
National partnership payments 178 195
Specific purpose payments
General purpose grants 9 7
Total capital grant revenue 187 202
TOTAL GRANT REVENUE 3 813 3 784
Budget Strategy and Outlook
17Uniform Presentation Framework
Table 5.18
State and Territory General Government Sector Grant Expense 2012-13
Estimate2013-14Budget
Current grant expense including subsidies and personal benefit payments
$M $M
Local government 103 120
Private and not-for-profit sector (including for on-passing) 607 635
Grants to other sectors of government 53 55
Other 161 163
Total current grant expense including subsidies and personal benefit payments 924 973
Capital grant expense
Local government 14 10
Private and not-for-profit sector (including for on-passing) 20 41
Grants to other sectors of government 38 17
Other 10 21
Total capital grant expense 83 90
TOTAL GRANT EXPENSE 1 007 1 063
Table 5.19
General Government Sector Dividend and Income Tax Equivalent Income
2012-13Estimate
2013-14Budget
$M $M
Dividend and income tax equivalent income from public non financial corporation sector 15
Dividend and income tax equivalent income from public financial corporation sector 51 52
TOTAL DIVIDEND AND INCOME TAX EQUIVALENT INCOME 51 67
2013-14 Budget
18 Uniform Presentation Framework
Table 5.20
2013-14 Loan Council Allocation
Loan Council Budget-timeAllocation Estimate
$M $M
General government sector cash deficit (+)/surplus (-) 250 537
Public non financial corporations sector cash deficit (+)/surplus (-) 61 92
Non financial public sector cash deficit (+)/surplus (-) 311 629
less Acquisitions under finance leases and similar arrangements 521 521
equals ABS GFS cash deficit (+)/surplus (-) 832 1 150
less Net cash flows from investments in financial assets for policy purposes - 2 4
plus Memorandum items
2013-14 LOAN COUNCIL NOMINATION 834 1 146
Tolerance limit (2% of non financial public sector cash receipts from operating activities) 118
Change in loan council allocation 312
Note: This table sets out the Territory’s 2013-14 Loan Council Allocation (LCA) Budget update of $1146 million as compared to that nominated and endorsed with the Loan Council of $834 million. Nominations for 2013-14 were provided by all jurisdictions on the basis of policies commenced up to and included in their Mid-Year Budget updates. The budget-time estimate of $1146 million reflects fiscal deterioration, predominantly due to a reduced relative share in goods and services tax revenue affecting the Territory and the timing of expenditure between years. Jurisdictions must publicly announce to the Loan Council where it is likely to exceed the tolerance limit. The Territory’s 2013-14 LCA is outside the 2 per cent tolerance limit of non financial public sector operating cash receipts of $118 million that applies between the LCA and budget-time nomination.
Part 2
Key Budget Components

Budget Strategy and Outlook
71Expenses and Capital Investment
Chapter 6
Trends in Expenses
Table 6.1: General Government Sector – Total Expenses
Expenses and Capital InvestmentThis chapter presents estimates of expenditure by the general government sector, distinguishing between operating expenditure (‘expenses’) and capital expenditure.
The information is presented on an accrual accounting basis, and in a form consistent with the Uniform Presentation Framework tables provided in Chapter 5.
Expenses are outflows of economic value arising from operational transactions. They are recorded net of recoverable goods and services tax, and in the general government sector are comprised mainly of employee expenses, depreciation, grants and subsidies paid, property expenses and other administrative expenses. They include expenditure on repairs and maintenance.
Table 6.1 highlights the movement in total expenses of the general government over the forward estimates period from the Pre-Election Fiscal Outlook (PEFO) to the 2013-14 Budget.
2012-13 2013-14 2014-15 2015-16 2016-17Estimate Budget Forward Estimates
$M $M $M $M $M
2012-13 PEFO 4 766 4 869 4 959 5 100 na2012-13 Mini Budget 4 854 4 943 5 001 5 127 na2013-14 Budget 4 855 5 033 5 051 5 165 5 269Variation from 2012-13 PEFO 89 164 92 65 na
Source: Department of Treasury and Finance
For the period 2012-13 to 2015-16, total expenses are expected to grow at an average of 2.1 per cent per annum over the forward estimates, lower than revenue growth over the equivalent period consistent with the target of eliminating the fiscal imbalance by 2017-18. The changes in the projected operating expenses since PEFO are reflective of policy and non-policy changes as well as parameters and other variations since August 2012. The policy and non-policy changes through to 2015-16 are highlighted in more detail in Chapter 3 of this Budget Paper. These include:
• revised timing of expenditure across years, largely related to the timing of Commonwealth-tied revenues;
• election commitments and other policy decisions of the government;
• legacy items funded; offset by
• a range of savings measures across government.
The final section in this chapter provides an overview of new initiatives, legacy items and savings measures for the 2012-13 final estimate and2013-14 Budget year by agency. In aggregate, amounts incorporated into the agency tables vary from Tables 3.5 and 3.6 in Chapter 3 due to intrasector transactions that are eliminated as well as amounts previously set aside at a whole of government level.
2013-14 Budget
72 Expenses and Capital Investment
Expenses byFunction
Table 6.2 sets out general government total expenses by function in 2012-13 and 2013-14. The key functions of health, education and public order and safety comprise 57 per cent of total expenses, with housing and community amenities contributing 9 per cent of expenses.
Table 6.2: General Government
– Expenses by Function
2012-13Estimate
2013-14Budget Variation
$M $M $M
General public services 87 92 5
Public order and safety 599 637 38
Education 964 968 4
Health 1 214 1 271 57
Social security and welfare 330 345 15
Housing and community amenities 466 467 1
Recreation and culture 199 196 - 3
Agriculture, forestry, fishing and hunting 58 55 - 3
Fuel and energy 107 110 3
Mining, manufacturing and construction 19 23 4
Transport and communications 223 240 17
Other economic affairs 260 280 20Other purposes 329 348 19Total Expenses 4 855 5 033 178
Source: Department of Treasury and Finance
Significant variations between 2012-13 and 2013-14 include:
• public order and safety – additional funding provided from 2013-14 to increase police levels in the Top End and Alice Springs;
• health – additional $35 million ongoing from 2013-14 for mandatory rehabilitation programs and increased ongoing funding to meet demand pressures in hospitals;
• social security and welfare – increased assistance for the patient assistance travel scheme, additional child protection and out-of-home care funding;
• transport and communications – increased funding to improve public and school bus services and roads repairs and maintenance as well as one-off grant funding for the Lee Point Road duplication;
• other economic affairs – includes an additional $8 million in 2013-14 for international marketing to boost tourism in the Territory; and
• other purposes – includes an increase in interest expense consistent with increased government borrowings.
The Territory Government is spending $5033 million to deliver core government services across the Territory in 2013-14.
Budget Strategy and Outlook
73Expenses and Capital Investment
Chart 6.1: General Government Sector – Expenses by Function
Trends in Capital Expenditure
Chart 6.1 illustrates where government spending is directed, by function, for 2013-14.
Source: Department of Treasury and Finance
In 2013-14, the most significant component relates to health services ($1271 million), which accounts for around one quarter of total expenses. Also significant is the education function, which represents 19 per cent ($968 million) of total expenses. Public order and safety expenditure comprises 13 per cent ($637 million) of total general government expenses and reflects the costs associated with tackling alcohol-related crime and anti-social behaviour and rising prisoner numbers within the Territory.
Housing and community amenities, social security and welfare, and transport and communications together encompass 21 per cent of total expenses with the remaining 21 per cent spread across various other public service functions.
Capital expenditure is the amount spent on the acquisition of new, and replacement of existing, non-financial assets. This involves amounts spent on both construction and purchases.
In recent times a number of major private sector-sponsored projects have commenced, including the $34 billion INPEX and Total joint venture Ichthys project, as well as significant projects in partnership with the private sector including the new Darwin Correctional Facility and the Marine Supply Base. Accordingly, after recent high levels of capital expenditure by Government (following the global financial crisis (GFC)), it is appropriate that the Territory’s capital investment returns to more historic levels over the forward estimates.
For 2013-14, total capital expenditure by the general government sector is estimated to be $675 million. This level of investment will enable sufficient work to continue as major project expenditure financed by the private sector continues to step up.
Table 6.3 presents general government’s estimates for capital expenditure from 2012-13 to 2016-17. It shows capital investment to be declining over the forward estimates consistent with a counter-cyclical approach as private sector investment accelerates.

2013-14 Budget
74 Expenses and Capital Investment
Table 6.3: General Government Sector – Capital Expenditure
Capital Expenditureby Function
2012-13 2013-141 2014-15 2015-16 2016-17Estimate Budget Forward Estimates
$M $M $M $M $M2012-13 PEFO 781 641 530 430 na2012-13 Mini Budget 822 593 501 391 na2013-14 Budget 712 675 503 466 433Variation from 2012-13 PEFO - 69 34 - 27 36 na
1 Darwin Correctional Precinct is not included. Source: Department of Treasury and Finance
The year-on-year variation reflects the timing of Commonwealth funding for capital purposes predominantly related to remote Indigenous housing, Closing the Gap police complexes and remote health centres. Variances in Territory-funded projects relate to the timing between years for theMarine Supply Base and the purchase of affordable housing accommodation under the National Rental Affordability Scheme.
The key functions of health, housing and community amenities, and transport and communications together represents 68 per cent of general government capital expenditure.
Table 6.4 sets out total capital expenditure by function for 2012-13 and 2013-14.
Table 6.4: General Government Sector – Capital Expenditure
2012-13Estimate
2013-14Budget Variation
by Function $M $M $MGeneral public services 7 7
Public order and safety 60 65 5
Education 56 36 - 20
Health 75 100 25
Social security and welfare 4 4
Housing and community amenities 292 208 - 84
Recreation and culture 24 22 - 2
Fuel and energy 3 5 2
Agriculture, forestry, fishing and hunting 3 3
Mining, manufacturing and construction 48 66 18
Transport and communications 138 154 16
Other purposes 2 5 3Total capital expenditure 712 675 - 37
Source: Department of Treasury and Finance
Significant variations between 2012-13 and 2013-14 include:
• education capital expenditure declines from 2012-13 by $20 million due to the completion of a large number of projects in 2012-13 and the revised timing of Commonwealth-funded trade training and children and family centres from 2013-14;
• health capital expenditure increases by $25 million to $100 million in 2013-14 due to increased Commonwealth funding for remote health clinics and Territory-funded investment towards mandatory rehabilitation programs;
Year Staffing Year Staffing
2002 13 653 2008 15 7432003 13 880 2009 17 015
2004 14 423 2010 17 743
2005 15 048 2011 18 056
2006 15 114 2012 18 879
2007 15 419 2013 18 453
Budget Strategy and Outlook
75Expenses and Capital Investment
Northern Territory
Government StaffingLevels
Table 6.5: Total Budget Sector – Staffing Levels by FTE as
at theJune Quarter Average
• housing and community amenities has declined by $84 million from2012-13 due to accelerated works in 2012-13 relating to remote Indigenous housing offset by increased investment in headworks for Palmerston East;
• mining, manufacturing and construction includes the continuing delivery of the Marine Supply Base and works at Middle Arm; and
• transport and communications capital expenditure has increased by$16 million due predominantly to the larger Commonwealth roads program to be delivered.
The public sector is the Territory’s largest employer. The level of staffing to deliver core government services is a function of the Territory’s small and widely dispersed population, the unique composition of its population, and its relative isolation from Australia’s main population centres.
Staffing levels over time by full-time equivalent employees (FTE) for all Budget sector agencies are reported in Table 6.5 below. Budget Paper No. 3 provides further information regarding staffing levels for each individual government agency within the Budget sector.
Source: Office of the Commissioner for Public Employment
From 2008 to 2012, the increases in staffing numbers were predominantly driven by Commonwealth-funded programs, which include Closingthe Gap initiatives, stimulus packages introduced during the GFC, the National Partnership Agreement on Remote Indigenous Housing and other intervention-related programs.
Over the last decade, frontline service agencies, including the Department of Health, the Department of Education and Children’s Services, the Office of Children and Families, Northern Territory Police Fire and Emergency Services, and the Department of Correctional Services, account for nearly 85 per cent of the public sector FTE growth while representing 70 per cent of the overall workforce.
2013-14 Budget
76 Expenses and Capital Investment
New Initiatives and Savings by Agency
This final section summarises the Government’s new initiatives for expenditure and savings included in the 2013-14 Budget. Expenditure items have been grouped by ‘legacy items’ and ‘new initiatives’.
Legacy items primarily relate to demand-driven services that were individually assessed and provided with additional funding as part of the December 2012 Mini Budget.
New initiatives identify the funding allocated to implement election commitments and new policy decisions.
The 2012 Mini Budget included approved savings targets and revenue measures for all agencies. For the purpose of this document, the savings measures have been grouped under the following categories.
Administrative efficiencies relate to initiatives delivering savings through more efficient use of existing administrative resources, rationalisation of administration tasks to focus on core functions and reduced expenditure on discretionary spending such as travel.
Program efficiencies and rationalisation relate to initiatives delivering savings through more efficient use of existing program resources and program rationalisation to focus on efficient delivery of priority programs and functions.
Structural reforms relate to initiatives that achieve savings through the realignment of functions and programs to better meet current needs. Over time, program focus or community needs can shift, rendering programs less relevant to community expectations. These initiatives will realign programs to meet identified areas of need and provide savings where resources are surplus to requirements.
Whole of government savings relate to initiatives that derive savings across all government agencies. This is likely to relate to programs that support all government agencies such as vehicle procurement and communications functions.
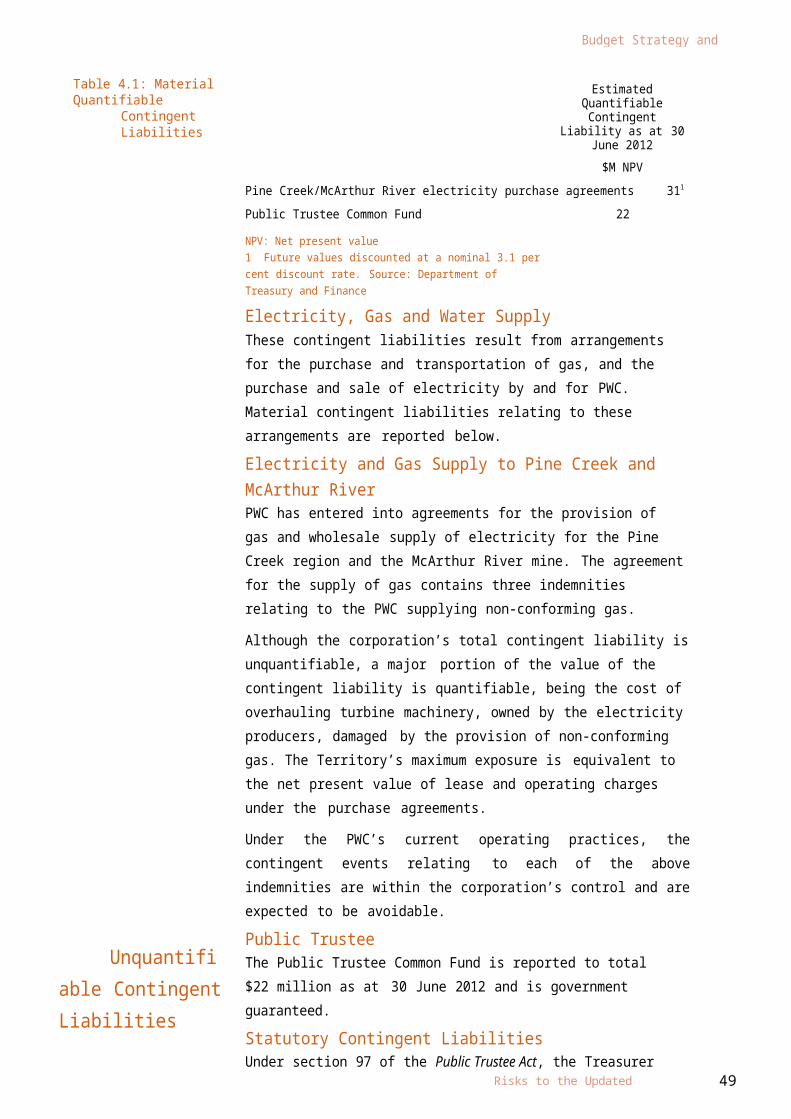
Budget Strategy and Outlook
2012-13Estimate
2013-14Budget
77Expenses and Capital Investment
Northern Territory Electoral Commission
$000 $000
New initiatives 1 850 0
Funding for the 2012 Legislative Assembly general election 1 850
Agency savings 0 - 9
Whole of government savings - 9
Total 1 850 - 9
Department of the Chief MinisterLegacy items 1 200 2 396
Funding for ministerial offices and protocol events to reflect historical expenditure 1 200 2 100
Increased repairs and maintenance funding 296
New initiatives 4 000 2 458
Establish an Economic Development Unit and expert panel 400
Support for the continued operation of food rescue services by Foodbank Northern Territory 400
Establishment of the Central Marketing Bureau 1 658
Costs associated with the change of government, including termination payments for former government ministerial staff 4 000
Agency savings - 700 - 1 677
Administrative efficiencies - 300 - 600
Program efficiencies and rationalisation - 400 - 900
Whole of government savings - 177
Total 4 500 3 177
Department of the Legislative AssemblyLegacy items 0 694Increased repairs and maintenance funding 694
New initiatives 0 600
Support for the Statehood Office 600
Agency savings - 636 - 856
Administrative efficiencies - 86 - 132
Program efficiencies and rationalisation - 550 - 600
Whole of government savings - 124
Total - 636 438
(continued)
2013-14 Budget
2012-13Estimate
2013-14Budget
78 Expenses and Capital Investment
Northern Territory Police, Fire and Emergency Services
$000 $000
Legacy items 15 784 17 611
Increased cost of police housing 5 700 5 700
Increased cost of police overtime 4 600 4 600
Funding for key information, communication and technology systems 3 884 3 847
Increased repairs and maintenance funding 1 600 3 464
New initiatives 6 700 25 340
Funding for the Alice Springs Youth Centre to upgrade and transition the centre to a Police and Citizens Youth Club
2 500
Additional police officers in the Top End and Alice Springs 2 500 22 500
Funding to conduct the Safe Streets Audit 300
Support for the Northern Territory Joint Emergency Services Communications Centre in 1 400 2 840Darwin, CCTV in Katherine and additional staff to operate a 24/7 front counter service at theAlice Springs Police Station
Agency savings - 5 643 - 11 977
Administrative efficiencies - 305 - 1 033
Program efficiencies and rationalisation - 5 338 - 10 806
Whole of government savings - 138
Total 16 841 30 974
Department of Corporate and Information ServicesLegacy items 0 100Increased repairs and maintenance funding 100
New initiatives 3 132 3 000
Enhance government’s payroll software 2 500
Funding to expand telecommunications in remote areas 2 882
Establishment and operation of an Across Government Contracts Unit 250 500
Agency savings - 185 - 981
Administrative efficiencies - 100 - 200
Program efficiencies and rationalisation - 30
Whole of government savings - 85 - 751
Total 2 947 2 119
(continued)
Budget Strategy and Outlook
2012-13Estimate
2013-14Budget
79Expenses and Capital Investment
Department of Transport
$000 $000
Legacy items 2 577 15 584
Third-party management, adjudication and processing of infringement notices from red light and speed cameras
1 500 1 500
Funding to meet increased service demand at motor vehicle registries 440 440
Increased on-road heavy vehicle enforcement demand 315 315
Funding for activity associated with introduction of the National Maritime Safety Regulator 322 322
Increased repairs and maintenance funding, including a regional roads program 13 007
New initiatives 859 8 875
Grant to the City of Darwin for the duplication of Lee Point Road (Tambling Terrace to 5 000
Vanderlin Drive)
Additional Motorcyclist Education Training and Licensing (METAL) program instructors and courses
150
Funding to enable the Motor Vehicle Registry at Parap to open on Saturdays 350 350
DriveSafe NT driver training courses 250
Funding to meet increased operational costs for bus services 430 430
New scheduled public bus services in Darwin and Alice Springs 1 037
Funding to provide a new special needs student transport bus in Alice Springs 79 158
Implementation of a new data and ticketing system on the Darwin bus network 1 000
DriveSafe NT Remote Indigenous driver education and licensing program 500
Agency savings - 20 - 299
Administrative efficiencies - 190
Program efficiencies and rationalisation - 20 - 41
Whole of government savings - 68
Total 3 416 24 160
Department of Treasury and FinanceNew initiatives 4 100 8 200Support for increased taxation compliance on large businesses 100 200
Increased First Home Owners Grant 4 000 8 000
Agency savings - 1 200 - 2 109
Administration efficiencies - 1 200 - 1 550
Structural reforms - 500
Whole of government savings - 59
Total 2 900 6 091
(continued)
2013-14 Budget
2012-13Estimate
2013-14Budget
80 Expenses and Capital Investment
Department of Business
$000 $000
Legacy items 1 524 1 342
Additional funding for business and industry grants 1 008 858
Support for the Office of Asian Engagement and major projects 516 291
Increased repairs and maintenance funding 193
New initiatives 673 990
Development of a business plan for the Alice Springs Golf Club 50
Additional funding to promote Asian engagement 500 500
Grants and additional frontline staff to support ecoBiz NT 123 490
Agency savings - 3 825 - 5 133
Administrative efficiencies - 2 045 - 2 653
Program efficiencies and rationalisation - 1 780 - 2 025
Whole of government savings - 455
Total - 1 628 - 2 801
Department of the Attorney-General and JusticeLegacy items 2 105 3 105
Additional support for the court support services 1 290 1 290
Office of the Director of Public Prosecutions 650 650
Domestic violence legal services 165 165
Increased repairs and maintenance funding 1 000
New initiatives 2 197 1 002
Extension to the Law Courts building at Alice Springs 1 020 771
Funding to the Legal Aid Commission for expensive criminal cases 1 177
Funding to meet the Territory’s commitment under the Social and Community Services Modern Award pay equity decision
231
Agency savings - 1 200 - 8 003
Administrative efficiencies - 2 438
Program efficiencies and rationalisation - 1 200 - 5 090
Whole of government savings - 475
Total 3 102 - 3 896
Office of the Commissioner for Public EmploymentAgency savings - 1 057 - 1 102
Program efficiencies and rationalisation - 1 057 - 1 086
Whole of government savings - 16
Total - 1 057 - 1 102
(continued)
Budget Strategy and Outlook
2012-13Estimate
2013-14Budget
81Expenses and Capital Investment
Department of Correctional Services
$000 $000
Legacy items 3 336 7 206
Additional funding to manage increased capacity at the Darwin and Alice Springs correctional centres
1 800 2 400
Funding for alternative work camp options 2 294
Administrative costs associated with the increase in sitting days of the Parole Board 409 342
Additional funding for the General Manager and Commissioning Team for the Darwin Correctional Precinct
457
Operational funding to support the Alice Springs Youth Detention Centre 670 670
Increased repairs and maintenance funding 1 500
New initiatives 1 448 12 475
Early intervention and residential camps (boot camps) for youth offenders 1 000 2 000
Extra work crews in the Alice Springs and Darwin correctional centres 448 500
Funding for Commissioning of Darwin Correctional Precinct, including funding to the Department of Health for the Secure Mental Health and Behavioural Management facility
5 389
Increase prison industries capacity to support the Sentenced to a Job policy for adult offenders 3 086
Establish a pre-release centre work camp 1 500
Agency savings - 1 250 - 3 104
Administrative efficiencies - 1 250 - 2 500
Whole of government savings - 604
Total 3 534 16 577
Department of HealthLegacy items 9 960 23 390
Funding for the operation of secure care facilities 1 600 3 864
Operational expenses of clients in 24-hour supported accommodation under Forensic Part IIA orders
503 503
Grant to BushMob for youth rehabilitation service 570 940
Implementation of the Youth Suicide Report recommendations 330 330
Operational expenses for the Medi-Hotel and Royal Darwin Hospital campus 2 000 5 500
Operational costs for the expanded Alice Springs Hospital Emergency Department 2 357 5 510
Increased repairs and maintenance funding 2 600 6 743
New initiatives 62 945 112 289
Operational funding to support Mandatory Rehabilitation 35 000
Review and outcomes of the review of the Patient Assistance Travel Scheme 2 000 7 500
Enhanced cardiac outreach services and cardiac rehabilitation services and the commencement of low risk angioplasty services
6 500 6 500
Increased utilities concessions to pensioners and seniors 3 900 7 900
Additional 400 elective surgeries per annum 4 460 4 460
Additional resources for health screening of detainees in watch houses 1 200
Commissioning of the Secure Mental Health and Behavioural Management facility for the Darwin Correctional Precinct
124
Funding to meet the Territory’s commitment under the Social and Community Services Modern Award pay equity decision
403 1 446
Additional funding to meet increased demand and cost pressures for health services 45 682 48 159

2013-14 Budget
2012-13Estimate
2013-14Budget
82 Expenses and Capital Investment
(continued)
Budget Strategy and Outlook
2012-13Estimate
2013-14Budget
83Expenses and Capital Investment
$000 $000
Agency savings - 10 907 - 42 856
Administrative efficiencies - 8 005 - 30 347
Program efficiencies and rationalisation - 2 902 - 10 716
Whole of government savings - 1 793
Total 61 998 92 823
Department of Education and Children’s ServicesLegacy items 5 800 9 496
Increased repairs and maintenance funding 5 800 9 496
New initiatives 6 275 12 195
School Voucher increases to $150 per student 3 300 3 300
Establishment of a toy and equipment grant program for long day-care services 150 150
Funding to school councils to offset increased utility costs in schools 2 825 6 213
Increased non-government schools per capita grant funding 2 532
Agency savings - 14 833 - 39 172
Administrative efficiencies - 14 045 - 13 802
Program efficiencies and rationalisation - 788 - 9 416
Structural reforms - 14 250
Whole of government savings - 1 704
Total - 2 758 - 17 481
Department of HousingNew initiatives 567 4 025
Real Housing for Growth plan and project team 520 3 840
Funding to meet the Territory’s commitment under the Social and Community Services Modern Award pay equity decision
47 185
Agency savings - 1 745 - 2 907
Administrative efficiencies - 1 745 - 1 787
Whole of government savings - 1 120
Total - 1 178 1 118
(continued)
2013-14 Budget
2012-13Estimate
2013-14Budget
84 Expenses and Capital Investment
Department of Lands, Planning and the Environment
$000 $000
Legacy items 190 581
Secondment of a Charles Darwin University demographer 190 190
Increased repairs and maintenance funding 391
New initiatives 4 805 2 585
Funding for the new Planning Commission for the Northern Territory 800 800
Investigative studies for Rapid Creek flood mitigation 750
Establishment of an independent board for the new Northern Territory Environment 500 500Protection Authority
Grant funding to the Keep Australia Beautiful Council of the Northern Territory 120 200
Funding for the Land Administration business unit 635 635
Establishment of a project team for the Land Release Program 450
Additional support for the Cash for Containers program 2 000
Agency savings - 2 496 - 6 235
Administrative efficiencies - 2 384 - 5 244
Program efficiencies and rationalisation - 112 - 890
Whole of government savings - 101
Total 2 499 - 3 069
Department of Primary Industry and FisheriesLegacy items 0 1 830
Increased repairs and maintenance funding 1 830
New initiatives 3 480 1 050
Establishment of an Ord Development Unit 400 400
Development of a comprehensive boat safety, awareness and education program 50 20
Funding to undertake a study of potential areas able to support new boat ramps 80
Funding to review and implement the Recreational Fishing Development Plan 220
Funding to establish and support a recreational fishing advisory committee 30 30
Establishment of a new Live Animal Export Market Development Unit to support the live cattle export trade 300
Commercial fishing licence buybacks 3 000
Agency savings - 391 - 1 546
Administrative efficiencies - 391 - 868
Whole of government savings - 678
Total 3 089 1 334
(continued)
Budget Strategy and Outlook
2012-13Estimate
2013-14Budget
85Expenses and Capital Investment
Department of Mines and Energy
$000 $000
Legacy items 1 710 1 966
Regulation of onshore energy activity 680 680
Environmental regulation of mining activity 450 450
International Investment Attraction Program 150 150
Pre-Competitive Geoscience Initiative 150 150
Additional funding for the Titles Division and management costs 280 280
Increased repairs and maintenance funding 256
New initiatives 0 7 400
Funding to establish a Mining Remediation Fund 2 000
Funding for a dedicated mining remediation team 1 000
Improvement of mining approval processes to address remediation outcomes, including 3 450environmental approvals
Establishment of the Energy Directorate to coordinate all government energy functions 950
Agency savings 0 - 297
Administrative efficiencies - 240
Whole of government savings - 57
Total 1 710 9 069
Department of Land Resource ManagementLegacy items 1 500 1 707
Wildfire suppression activities 1 000 1 000
Additional funding to support the Pastoral Land Board and for the rangeland monitoring program 500 500
Increased repairs and maintenance funding 207
New initiatives 0 480
Additional weeds management officers 480
Agency savings 0 - 2 047
Administrative efficiencies - 1 500
Whole of government savings - 547
Total 1 500 140
(continued)
2013-14 Budget
2012-13Estimate
2013-14Budget
86 Expenses and Capital Investment
Office of Children and Families
$000 $000
Legacy items 24 200 30 690
Additional funding for child protection staff and out-of-home care services 10 000 5 000
Re-direction of savings for child protection staff and out-of-home care services 14 200 25 100
Increased repairs and maintenance funding 590
New initiatives 2 250 1 583
Funding to expand the capacity of existing family support service providers at the Tennant Creek Family Support Centre
700
Expansion of the Somerville Community Centre in Palmerston 2 000
Funding to meet the Territory’s commitment under the Social and Community Services Modern Award pay equity decision
250 883
Agency savings - 15 200 - 27 437
Administrative efficiencies - 5 900 - 14 100
Program efficiencies and rationalisation - 9 300 - 13 000
Whole of government savings - 337
Total 11 250 4 836
Department of Regional Development and Women’s PolicyNew initiatives 2 112 2 450
Additional funding to improve housing properties in homelands and outstations 2 000 2 000
Establishment of an independent Office for Territory Women 112 450
Agency savings - 1 377 - 1 550
Administrative efficiencies - 1 177 - 1 124
Program efficiencies and rationalisation - 200 - 352
Whole of government savings - 74
Total 735 900
Department of Local GovernmentNew initiatives 1 250 7 350
Establishment of the Family Safe Environment Fund 250 250
Funding to support local government reform 1 000 2 100
Increase to the Northern Territory local government operational subsidy grants pool 5 000
Agency savings 0 - 37
Whole of government savings - 37
Total 1 250 7 313
Aboriginal Areas Protection AuthorityAgency savings - 117 - 142
Administrative efficiencies - 117 - 117
Whole of government savings - 25
Total - 117 - 142
(continued)
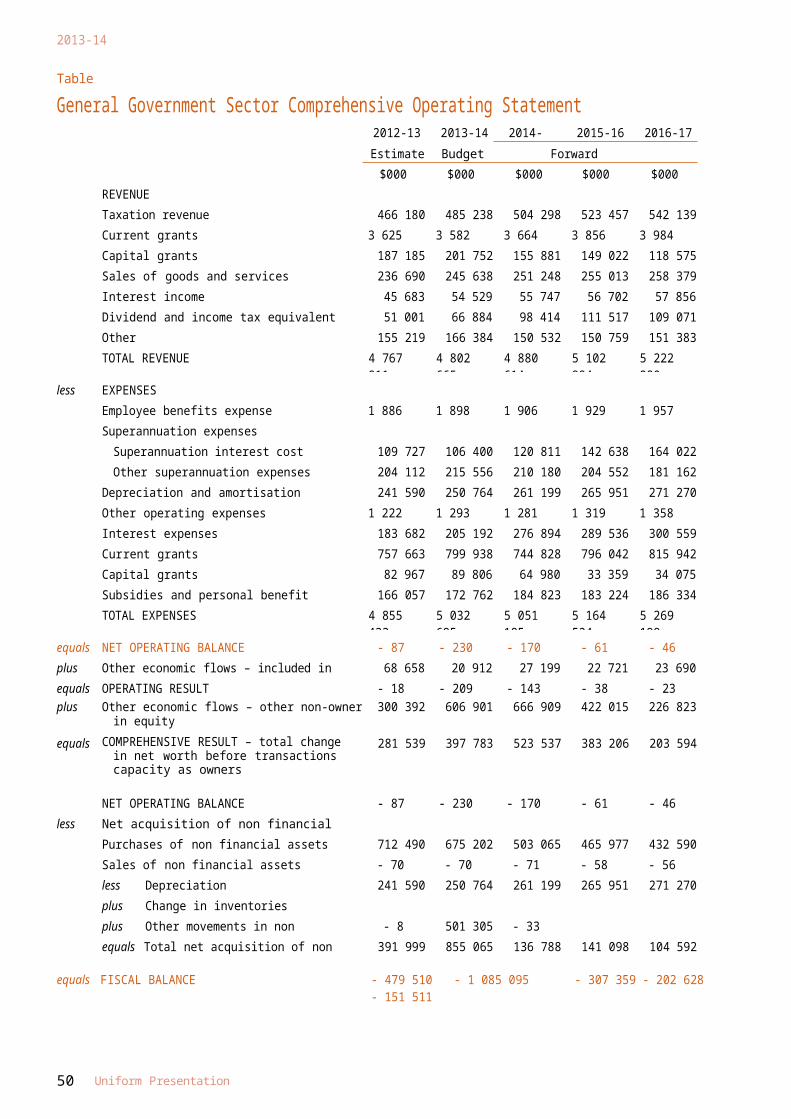
Budget Strategy and Outlook
2012-13Estimate
2013-14Budget
87Expenses and Capital Investment
Tourism NT
$000 $000
New initiatives 409 8 259
Establishment of the Tourism Commission Board 250
Additional funding to meet contractual commitments to support the V8 Supercars and Superbikes
159 259
Additional funding to market the Territory 8 000
Agency savings 0 - 16
Whole of government savings - 16
Total 409 8 243
Department of Sport and RecreationLegacy items 1 200 3 028
Operations of the Lake Leanyer Recreational Park 1 200 1 200
Increased repairs and maintenance funding 1 828
New initiatives 11 140 6 470
Funding to increase all peak sporting and recreational body funding 1 745 1 745
Establishment of a Sport Voucher Scheme 4 000 4 000
Grant to Alice Springs Town Council to upgrade ANZAC Oval 2 000
Funding to upgrade the Satellite City BMX facility 300
Alice Springs Golf Club repairs and upgrades 250
Funding to upgrade lighting at the Alice Springs Go Kart facility 45
Funding to upgrade the Jingili BMX facility 300
Support for the Darwin Greyhound Association 230
Funding for upgrades to the Alice Springs drag strip 495
Contribution towards construction of the Michael Long Learning and Leadership Centre 2 500
Agency savings - 3 810 - 1 148
Program efficiencies and rationalisation - 3 810 - 1 000
Whole of government savings - 148
Total 8 530 8 350
(continued)
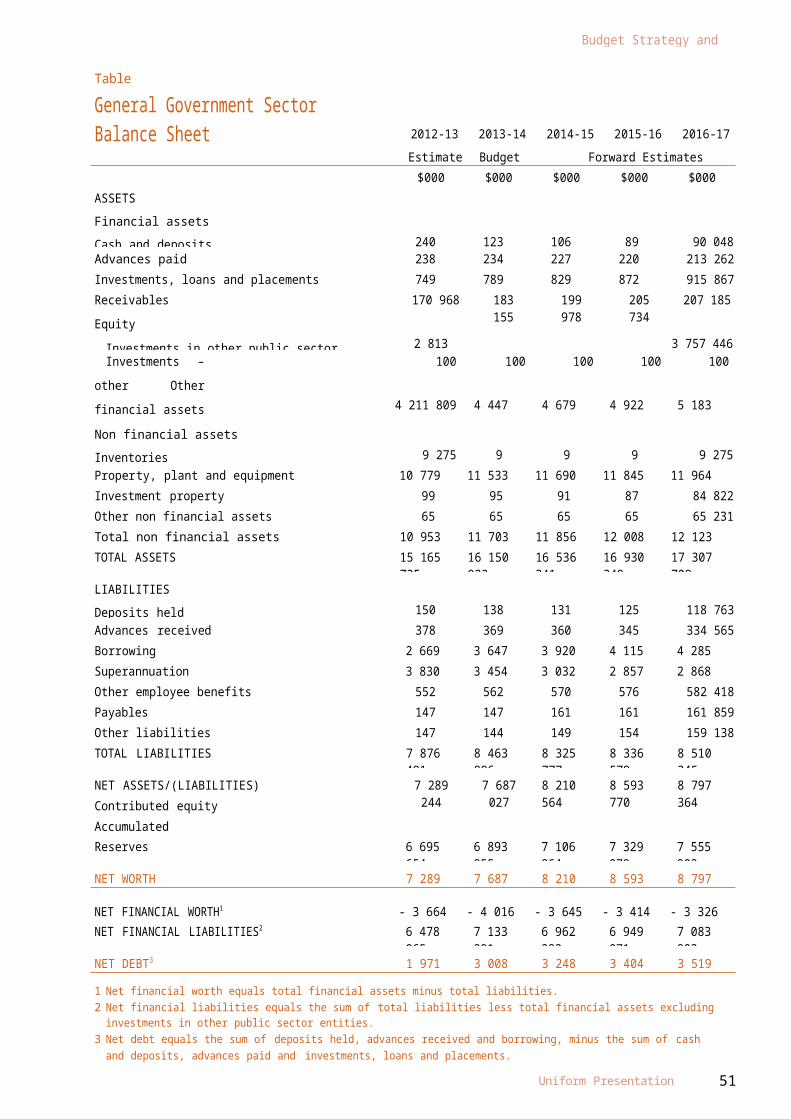
2013-14 Budget
2012-13Estimate
2013-14Budget
88 Expenses and Capital Investment
Parks and Wildlife Commission of the Northern Territory
$000 $000
Legacy items 2 800 2 266
Additional funding for staffing costs 2 600 1 850
Additional funding to remove visible asbestos in public areas 200 200
Increased repairs and maintenance funding 216
Agency savings - 380 - 1 578
Administrative efficiencies - 360
Program efficiencies and rationalisation - 380 - 710
Whole of government savings - 508
Total 2 420 688
Department of Arts and MuseumsLegacy items 700 2 422
Additional funding to support the Godinymayin Yijard Rivers Arts and Culture Centre in Katherine
500 500
Operation of the Defence of Darwin Experience 200 200
Increased repairs and maintenance funding 1 722
New initiatives 300 600
Funding to maintain the Defence of Darwin Experience building, exhibition material and content, interactive multimedia and digital displays
300 600
Agency savings 0 - 576
Administrative efficiencies - 286
Whole of government savings - 290
Total 1 000 2 446
Department of InfrastructureLegacy items 14 200 14 738
Recovery and ongoing operation of the Asset Management System 14 200 14 300
Increased repairs and maintenance funding 438
Agency savings - 835 - 3 213
Administration efficiencies - 835 - 2 497
Whole of government savings - 716
Total 13 365 11 525

Budget Strategy and Outlook
89Expenses and Capital Investment
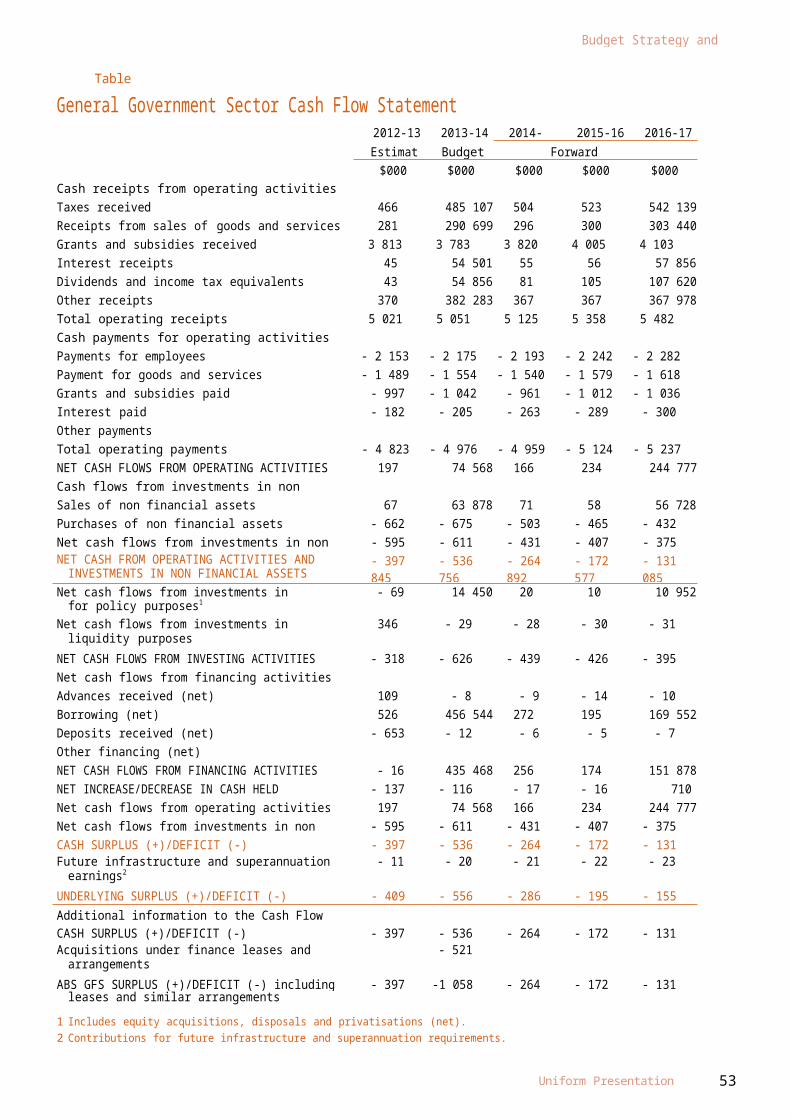
89Intergovernmental Revenue
Budget Strategy and Outlook
Chapter 7Overview
Federal Financial
Relations
Intergovernmental RevenueIn 2013-14, the Territory is estimated to receive $3801 million in Commonwealth payments. This amount equates to about 70 per cent of the Territory’s total revenue at the non financial public sector and comprisesof $2807 million in untied payments, largely goods and services tax (GST) revenue, and $994 million in tied payments.
GST revenue is the single largest source of revenue to the Territory, representing about 50 per cent of the Territory’s total revenue. In 2013-14, the Territory is expected to receive $2805 million in GST revenue, a $16 million decline from the estimate of $2821 million for 2012-13.
The decline in the Territory’s GST revenue is attributed to a decrease in the Territory’s GST relativity over this period. In its Report on GST Revenue Sharing Relativities 2013 Update, the Commonwealth Grants Commission (CGC) recommended a decrease in the Territory’s GST relativity from 5.52818 in 2012-13 to 5.31414 in 2013-14. As a result, the Territory’s share of the GST pool is expected to decline from 5.7 per cent in 2012-13 to 5.4 per cent in 2013-14.
The primary cause of the decrease in the Territory’s GST relativity in 2013-14 is the adoption of Indigenous population estimates based on the 2011 Census. Preliminary 2011 Census data show a decrease in the Territory’s share of the total Australian Indigenous population from12.4 per cent in 2006 to 10.3 per cent in 2011. The growth in the Indigenous population in some states appears to be largely due to increased self-identification in the 2011 Census.
The increase in self-identification in the 2011 Census, and the characteristics of the newly-identified Indigenous population, necessitates an alternative approach to how the CGC assesses the needs of Indigenous people in its methodology for determining states’ GST revenue shares.
Tied Commonwealth revenue contributes $994 million or 18 per cent of the Territory’s total revenue in 2013-14. While an overarching objective of the Intergovernmental Agreement on Federal Financial Relations (IGA) was less Commonwealth prescription on service delivery associated with tied Commonwealth funding, this is only partially being realised. The development of new funding agreements such as the National Health Reform Agreement and those foreshadowed for both school funding (National Education Reform Agreement (NERA)) and disability service (National Disability Insurance Scheme (NDIS)), as well as the proliferationof more prescriptive National Partnership (NP) agreements in recent years, represent a shift away from the IGA’s intent of greater flexibility in the use of tied funding by states.
Australia’s federal financial relations is characterised by a mismatch between the revenue-raising powers and service delivery responsibilities of the Commonwealth and states, referred to as vertical fiscal imbalance. Vertical fiscal imbalance exists in Australia because the amount of revenue the Commonwealth can raise far exceeds its expenditure obligations, while the
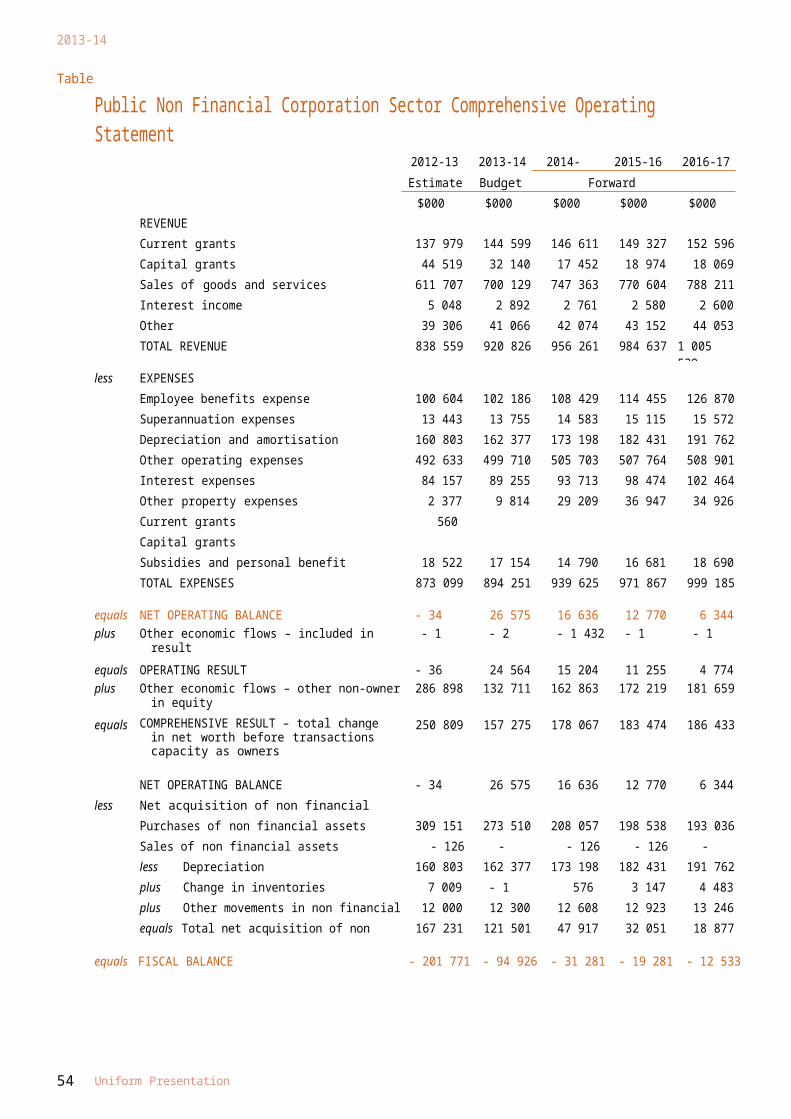
90 Intergovernmental Revenue
2013-14 Budgetreverse is true for the states.
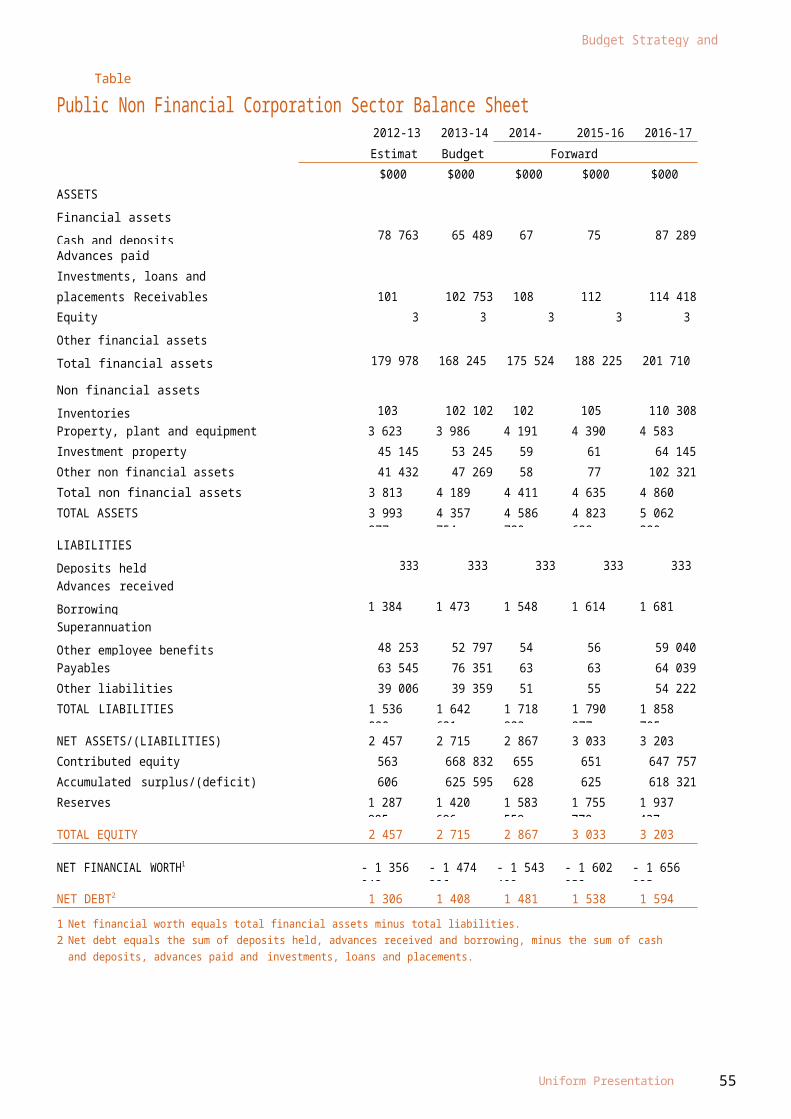
Budget Strategy and Outlook
91Intergovernmental Revenue
Chart 7.1: Commonwealth Share
of Revenues
Chart 7.1 shows that the Commonwealth raises about 75 per cent of total government revenues, while the states raise about 25 per cent. The consequence of the states’ low capacity to raise revenue relative to the Commonwealth is that financial transfers from the Commonwealth are a vital source of revenue for all states. Commonwealth funding represents about 45 per cent of total revenue for all states. The Territory is more reliant onCommonwealth transfers than other states, with historically about 75 per cent of the Territory’s total revenue sourced from Commonwealth payments.
Source: CGC 2013 Update; Department of Treasury and Finance
Table 7.1 shows that in 2013-14, the Commonwealth is expected to provide the Territory with $3801 million in payments. This amount largely comprises$2805 million in GST revenue, $462 million in NP payments, $332 million in other Commonwealth payments, which includes National Health Reform (NHR) funding, and $201 million in Specific Purpose Payments (SPPs).
Compared with 2012-13, revenue from the Commonwealth is expected to decrease by $19 million or less than 1 per cent in 2013-14. The decrease is largely due to the reduction in GST revenue receipts, which is discussed later in this chapter.
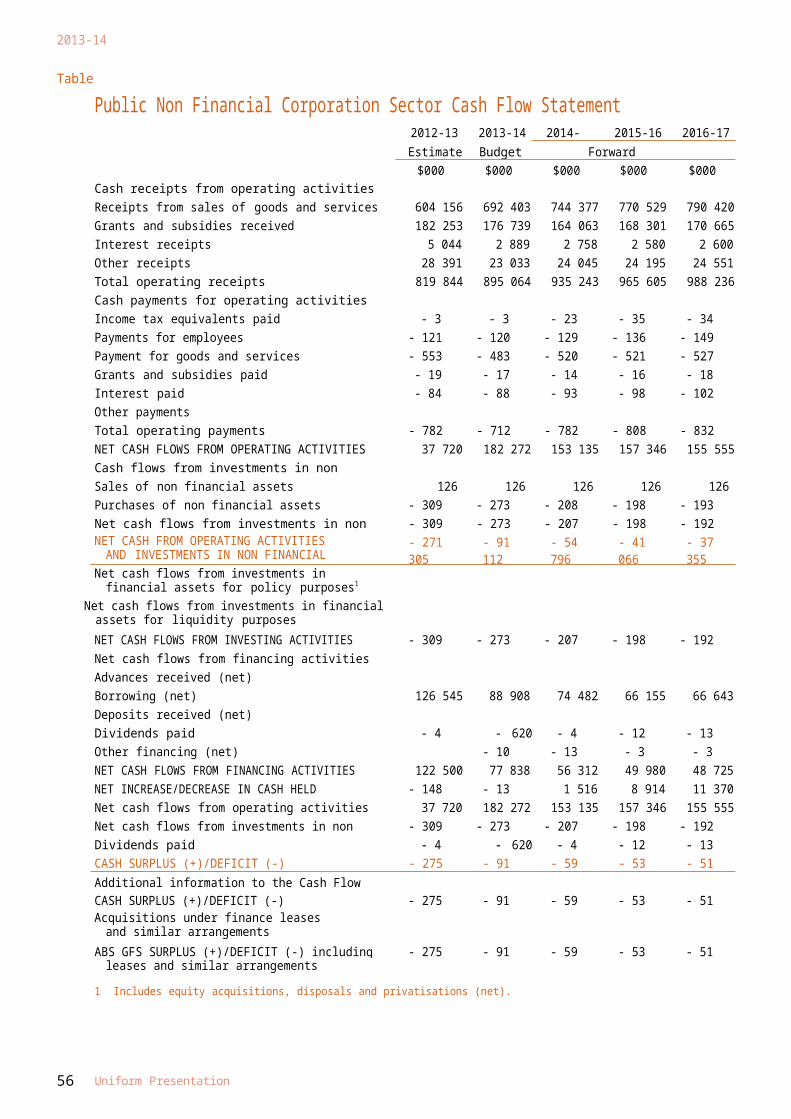
2013-14 Budget
92 Intergovernmental Revenue
Table 7.1: Components of Territory Revenue1
2011-12Actual
2012-13Estimate
2013-14Budget
General revenue assistance
$M $M $M
GST revenue2 2 507 2 821 2 805Grants in lieu of uranium royalties 5 4 2
Tied revenue
Intergovernmental Agreement on
Federal FinancialRelations
Specific Purpose Payments3,4 356 236 201
National Partnership payments 844 424 462
Other Commonwealth payments3,5 279 336 332Total Commonwealth revenue 3 990 3 821 3 801
Territory own-source revenue 1 445 1 561 1 702
Total revenue6 5 436 5 382 5 504
1 Includes non-financial public sector.2 Includes balancing adjustments for over/under payments of GST in the previous financial year.3 Includes the National Healthcare SPP in 2011-12. From 2012-13 the National Healthcare SPP
is replaced by NHR funding. 2012-13 includes some NHR payments.4 Includes payments ‘through’ the Territory for non-government schools.5 For consistency of reporting with the Commonwealth, funding under the Natural Disaster Relief
and Recovery Arrangements is reported as tied funding.6 Figures may not add due to rounding. Source: Department of Treasury and Finance
The IGA provides a framework for a collaborative working arrangement between the Commonwealth and states on policy development and service delivery, and to facilitate the implementation of nationally important economic and social reforms.
The aim of the IGA is to improve the effectiveness of government services through:
• fair and sustainable federal financial arrangements;
• clearly defined roles and responsibilities between the Commonwealth and states;
• enhanced public accountability through simpler, standardised and more transparent performance reporting;
• performance reporting that focuses on the achievement of outcomes and outputs;
• reduced administration and compliance overheads;
• elimination of financial and other input controls imposed on service delivery on states in Commonwealth funding agreements; and
• the equalisation of fiscal capacities between states.
These arrangements were formalised through:
• National Agreements (NAs) for significant state services (healthcare, school education, skills and workforce development, disability, affordable housing and Indigenous reform);
• NP agreements for nationally significant reforms and/or projects; and
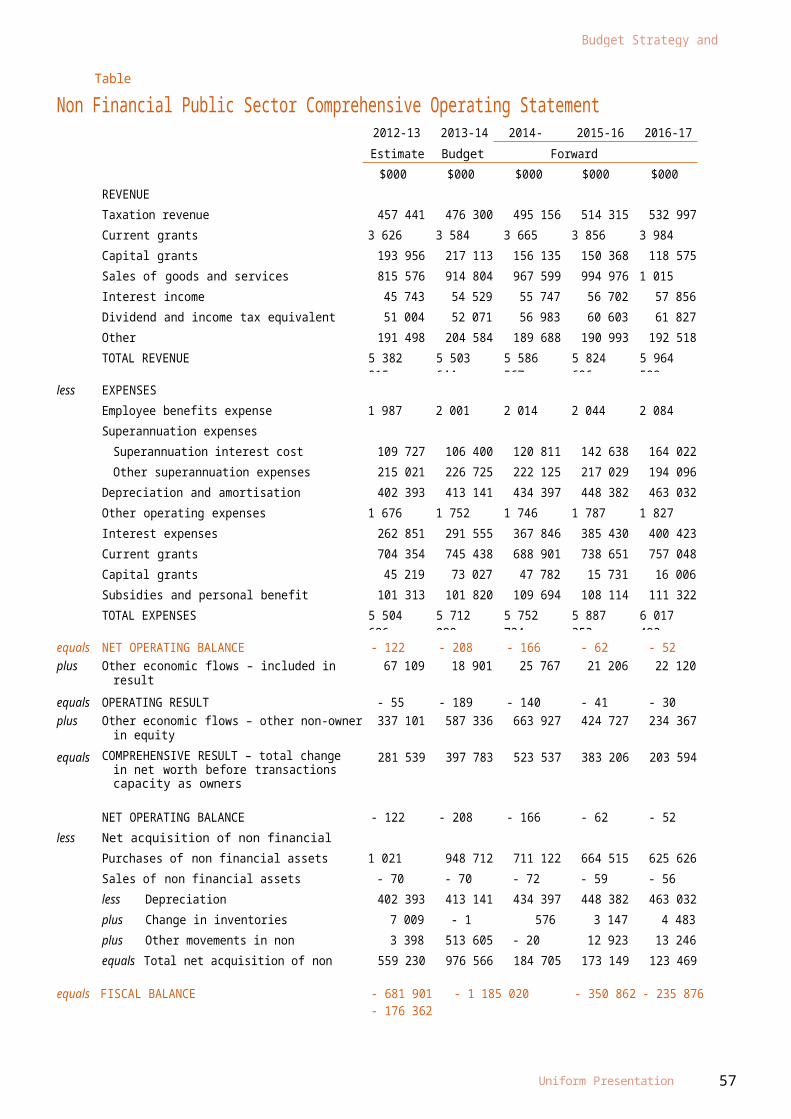
Table 7.2: Territory GST RevenueParameter Estimates
Budget Strategy and Outlook
93Intergovernmental Revenue
Goods and ServicesTax Revenue
• the provision of GST revenue to the states, with all proceeds from the GST provided to the states on an untied basis and distributed among the states in accordance with the principle of horizontal fiscal equalisation (HFE).
Commonwealth payments that are covered under the IGA are:
• general purpose payments, primarily GST revenue, which can be used by states for any purpose;
• national SPPs, which are provided to assist states to achieve outcomes associated with NAs in the key state service delivery areas of schools, skills and workforce development, disability and affordable housing;
• NHR funding; and
• NP payments.
A detailed discussion on each of the above Commonwealth payments follows.
GST revenue represents the largest fiscal transfer from the Commonwealth, accounting for about 55 per cent of Commonwealth payments to the states. Each state’s GST revenue entitlement is dependent on three factors: national GST collections, the state’s GST relativity, and the state’s share of the national population.
A state’s GST entitlement is calculated by multiplying the state’s population by its GST relativity to derive the state’s weighted population. The state’s share of the total weighted population represents its share of the GST pool.
Table 7.2 shows the parameters used to estimate the Territory’s GST revenue in the 2013-14 Budget.
2011-12 2012-13 2013-14 2014-15 2015-16 2016-17
Actual Estimate Budget Forward EstimatesGST pool ($M) 46 040 48 100 50 600 53 100 55 600 58 200Territory GST relativity 5.35708 5.52818 5.31414 5.31414 5.31414 5.31414Territory share of national 1.0336 1.0368 1.0402 1.0498 1.0616 1.0580
population (%)
Territory GST revenue ($M)1 2 507 2 821 2 805 2 972 3 149 3 289
1 Includes balancing adjustment for the over/underpayment of GST revenue to the Territory. Source: Department of Treasury and Finance
In 2012-13, the Territory is expected to receive $2821 million in GST revenue. This represents a 12.6 per cent increase from 2011-12. The annual increase in the Territory’s GST revenue in 2012-13 is due to a combination of growth in the GST pool, an increase in the Territory’s GST relativity and a balancing adjustment for the underpayment of GST revenue in 2011-12. The Territory’s GST revenue is estimated to decrease by 0.6 per cent to $2805 million in 2013-14.
Compared to the 2012-13 Mini Budget, the estimate of the Territory’s GST revenue in 2013-14 is $117 million lower in the 2013-14 Budget. This is primarily due to a downward revision to the Territory’s GST relativity and, to a lesser extent, updated population estimates as shown in Table 7.3.
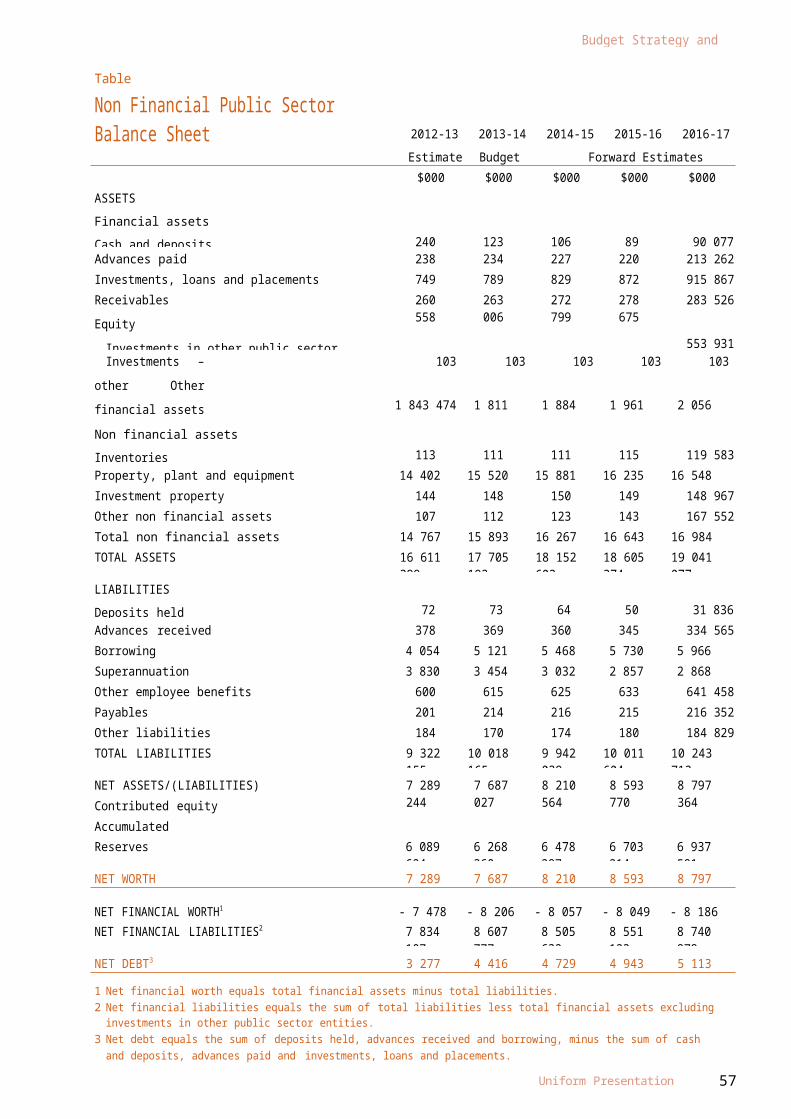
GST revenue $M $MAs at 2012-13 Mini Budget 2 815 2 922
As at 2013-14 Budget 2 821 2 805
Difference 6 - 117
Change caused by new:
National GST collections
Relativities1 - 107
Population 6 - 4
Interactions2 - 6
Total 6 - 117
2013-14 Budget
94 Intergovernmental Revenue
Table 7.3: Factors Contributing to the Revision in the Territory’s
GST Revenue Estimate
2012-13 2013-14
Chart 7.2 Annual Growth in National GST Collections
1 The estimated impact of the change in relativity as sourced from CGC 2013 Update.2 Impact of rounding and the interaction between the updated parameters in the calculation of
states’ GST shares.Source: Department of Treasury and Finance
National Goods and Services Tax CollectionsGrowth in the GST pool over the budget and forward estimates period is expected to remain below the growth rates recorded in years prior to the global financial crisis (GFC). Chart 7.2 shows that between 2000-01 and 2007-08, the GST pool grew on average by 8.2 per cent per annum. Between 2007-08 and 2011-12, the growth rate of the GST pool moderated to an average of 2.1 per cent. This was lower than the average consumer price index of 2.7 per cent over the same period, meaning the GST pool declined in real terms.
Source: Department of Treasury and Finance
Growth in national GST collections is expected to strengthen to 4.5 per cent in 2012-13 and 5.2 per cent in 2013-14 (see Chart 7.2). However, cautious consumer behaviour, which is characterised by higher levels of household savings and lower spending on discretionary goods and services, is expected to continue to constrain growth in the GST pool.
Chart 7.3 shows that private consumption as a proportion of gross domestic product (GDP) is expected to increase in 2012-13 and remain stable over the forward estimates period due to increased household spending, supported by relatively low interest rates. GST as a proportion of private consumption and GDP is not expected to recover to pre-GFC levels over the budget and

Budget Strategy and Outlook
95Intergovernmental Revenue
Chart 7.3 Index of GST and Private
Consumption as a Proportion of GDP
forward estimates period. As a result, estimates of the GST pool in 2012-13 onwards remain significantly lower than anticipated prior to the GFC.
Source: ABS; Deloitte Access Economics; Department of Treasury and Finance
GST RelativitiesThe relativities component in the calculation of the distribution of GST revenue between states meets the IGA ‘equalisation of fiscal capacities between states’ objective. The relative heterogeneity of states in terms of population characteristics, geographic size and remoteness, structure of economies and natural resource endowments result in differences between states in the costs of delivering an average level of services and the capacity to raise revenue. These differences are reflected in the relativities.
The CGC is responsible for recommending to the Commonwealth Treasurer the per capita relativities to be used to distribute GST revenue between the states. The CGC calculates per capita relativities in accordance with the principle of HFE, which is defined as:
State governments should receive funding from the pool of goods and services tax revenue such that, after allowing for material factors affecting revenues and expenditures, each would have the fiscal capacity to provide services and the associated infrastructure at the same standard, if each made the same effort to raise revenue from its own sources and operated at the same level of efficiency. (CGC 2013 Update)
The current form of equalisation supports the principle that all Australians should have access to comparable standards of services no matter where they live. The current form of equalisation is critical to the Territory because it recognises the Territory’s lower capacity to raise own-source revenue and, more importantly, the significantly higher costs of delivering the average level of services and infrastructure in the Territory compared with other states. The high costs of service delivery is a function of the Territory’s small and widely dispersed population, the unique composition of its population, its harsh physical environment and its relative isolation from Australia’s main population centres. Without equalisation, Territorians would not have reasonable access to the services afforded to other Australians.
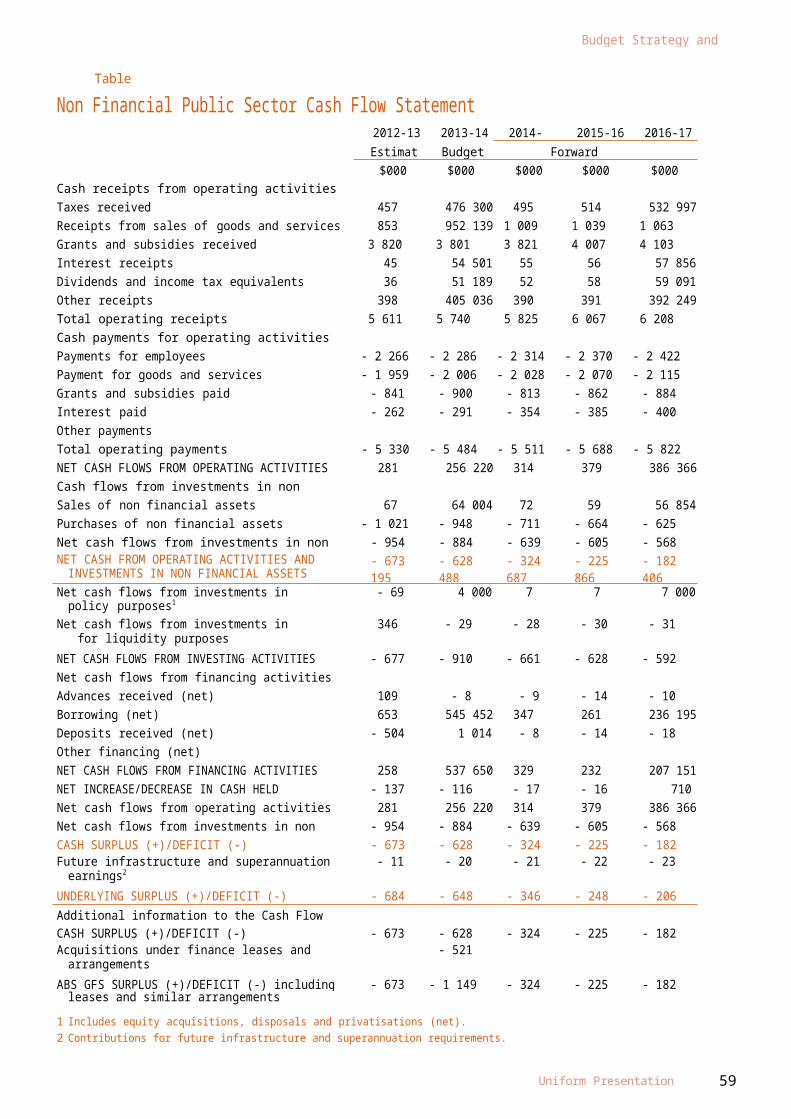
2013-14 Budget
96 Intergovernmental Revenue
Commonwealth Grants Commission Report on GST
Revenue Sharing Relativities2013 Update
Table 7.4: Comparisons of Relativities for 2012-13
and2013-14
In March 2013, the CGC released the Report on GST Revenue Sharing Relativities 2013 Update. In the 2013 Update, the Territory’s GST relativity decreased from 5.52818 in 2012-13 to 5.31414 in 2013-14 as shown in Table 7.4. The effect of the decrease in the Territory’s GST relativity is a reduction in the Territory’s share of the GST pool from 5.7 per cent in 2012-13 to 5.4 per cent in 2013-14.
The CGC estimates the financial impact of the change in relativities by applying the 2013 Update relativities to the GST pool and population estimates in 2012-13. This isolates the impact of change in relativities on GST revenues from changes in states’ populations and the GST pool. Based on this approach, the CGC estimates that the change in relativities results in $107 million in GST revenue redistributed away from the Territory. This equates to a $455 per capita decrease in GST revenue to the Territory. Table 7.4 shows that on a per capita basis, the Territory experienced the largest decline in GST revenue share from the 2013 Update with a per capita loss in GST revenue more than twice that of Western Australia, the next most affected jurisdiction.
NSW Vic Qld WA SA Tas ACT NT
Relativities
2012-13 0.95312 0.92106 0.98477 0.55105 1.28472 1.58088 1.19757 5.52818
2013-14 0.96576 0.90398 1.05624 0.44581 1.26167 1.61454 1.22083 5.31414
Impact
$ million 193 - 207 696 - 549 - 82 36 18 - 107
$ per capita 26 - 37 151 - 223 - 49 71 49 - 455
Source: CGC 2013 Update
The main contributor to the decrease in the Territory’s relativity in 2013-14 was the adoption of new Indigenous population estimates based on the 2011 Census in the 2013 Update. Preliminary 2011 Census data only reports on Indigenous populations at a point in time (as at 30 June 2011). As the CGC’s 2013 Update requires population estimates over a three-year period (2009-10 to 2011-12), the CGC undertook its own analysis to estimate each state’s Indigenous population over this period.
The proportion of Indigenous people in a given state is an important consideration in the CGC’s relativity calculations. In the 2013 Update, the CGC changed the basis for its estimates of the Indigenous population from the 2006 to the 2011 Census. This resulted in a decrease in the Territory’s share of the Indigenous population from 12.4 per cent in the 2006 Census to per cent in the 2011 Census . The CGC’s adoption of new Indigenous population estimates alone resulted in $121 million in GST revenue redistributed away from the Territory.
Preliminary 2011 Census data reported that Australia’s estimated Indigenous resident population had increased since the 2006 Census by more than generally anticipated. The proportion of Australia’s population identifying as Indigenous increased from 2.5 per cent to 3.0 per cent between the 2006 and 2011 censuses. Changes in Indigenous shares of populations varied between states. Every state, except for the Territory, experienced a moderate to large increase in the Indigenous share of the population. In the Territory,
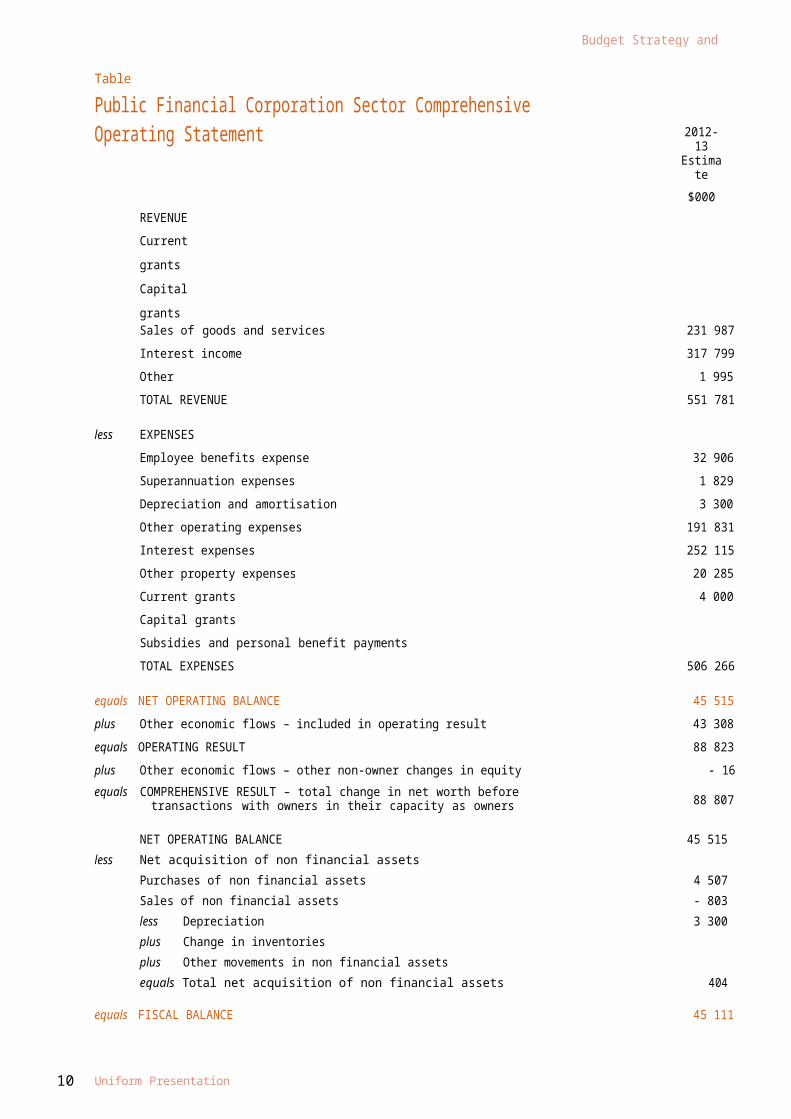
Budget Strategy and Outlook
97Intergovernmental Revenue
GST Distribution Review
the Indigenous share of the population decreased from 30.4 per cent in the 2006 Census to 29.8 per cent in the 2011 Census.
The large change in the Indigenous population appears to be mainly due to increased self-identification in the 2011 Census compared to previous censuses. The large increase in the Indigenous population and the causes of this change necessitates consideration by the CGC as to whether the 2011 Census Indigenous population estimates are fit for purpose for the CGC’s current methodology or whether a change in how the CGC assesses the needs of Indigenous people is required.
In March 2011, the Commonwealth commissioned a review into the GST distribution arrangements. The review was conducted by a GST Review Panel, which comprised the Hon Nick Greiner AC, the Hon John Brumby and Mr Bruce Carter.
The review focused on whether Australia’s current form of HFE is appropriate to ensure that Australia is best placed to respond to future challenges, including continued globalisation, population growth and demographic change, and addressing Indigenous disadvantage. The review considered alternative approaches to the current system of GST distribution that could achieve efficiency, equity, simplicity, and predictability and stability in determining states’ GST shares.
Importantly, the terms of reference for the review recognised that the practice of equalisation between states is a key feature in Australia’s federal system, GST will continue to be distributed to ensure states have equal capacity to provide services, and GST will continue to be provided on an untied basis.
In November 2011, the Commonwealth expanded the terms of reference for the review to include consideration of the impacts of equalisation on state revenue policies and the interactions between the Commonwealth’s mining taxes and state mining royalty regimes.
Following extensive public consultation over an 18-month period, the GST Distribution Review Final Report was released in November 2012. The final report did not propose major changes to the way GST is distributed between states. The recommendations in the final report were primarily designed to strengthen the governance, understanding and transparency of the HFE system in Australia and provide options to simplify the CGC’s assessment.
The key recommendations or findings from the report are as follows:
• the Territory should not be removed from the equalisation process as it is a sovereign entity within the Federation and it should not be treated differently to other states;
• there is no rationale for removing Indigeneity from the HFE system;
• the current HFE system is well established and internally consistent;
• there is no evidence to support the claim that states with higher expenditure needs (such as the Territory) are less efficient than states with lower expenditure needs. Therefore, the argument that HFE provides
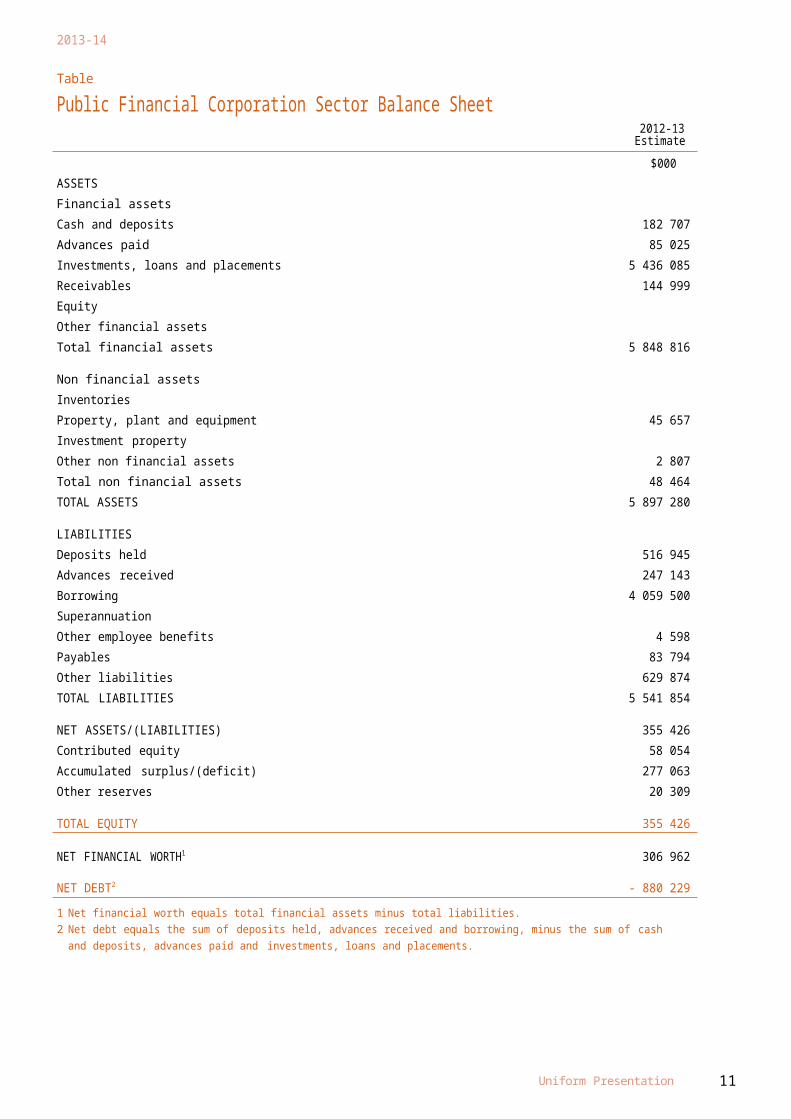
2013-14 Budget
98 Intergovernmental Revenue
Share of National Population
Specific PurposePayments
disincentives for states to pursue efficiencies in service delivery was not established;
• there should be a cooperative Commonwealth-state approach to resource charging. However, if this cannot be achieved, the Commonwealth should amend the design of its mining taxes to remove the open-ended crediting of all royalties imposed by the states; and
• there is no evidence that HFE acts as a material disincentive to state tax reform.
The final report also outlines the GST Review Panel’s longer term view of Commonwealth-state financial relations. These relate to long-standing and challenging issues of vertical fiscal imbalance between the Commonwealth and states, reform of state taxes, and public discussion on broadening the GST base and/or increasing the GST rate.
Importantly, the GST Review Panel’s longer term view of the HFE system recognised that any future changes to the GST arrangements must continue to acknowledge and accommodate the needs of the fiscally weaker states. This would ensure that the smaller states continue to have the capacity to provide the same levels of government services as those provided in the larger states.
The final report has been referred to the Standing Council on Federal Financial Relations (SCFFR) for consideration. The views put forward by states through SCFFR will inform the Commonwealth Treasurer’s response to the final report, which will be submitted to the Council of Australian Governments for consideration by the end of 2013.
Following moderate growth in 2010-11 and 2011-12, the Territory’s population is expected to strengthen over the budget and forward estimates period. The Territory’s population growth is expected to be driven by increased construction activity related to the INPEX and Total joint venture Ichthys project and the associated increase in demand for labour directly related to the project and indirectly due to increasing levels of economic activity. Construction activity related to the Darwin Correctional Precinct and the Marine Supply Base are also expected to contribute to the Territory’s population growth over this period.
The strengthening Territory economy is expected to result in the Territory’s population growing at a faster rate than nationally between 2012-13 and 2015-16. The Territory’s share of the national population is estimated to increase from 1.0368 per cent in 2012-13 to 1.0616 per cent in 2015-16.
SPPs are provided by the Commonwealth to support states to achieve the outputs and outcomes in the NAs that deal with major service areas agreed by the Council of Australian Governments (COAG). In 2013-14 it is currently anticipated that there will be four SPPs associated with an NA (schools, disability, affordable housing and skills and workforce development). Like the SPP for healthcare however, it is probable that the first two SPPs will evolve into different payment arrangements (potentially similar to NHR payments) under the proposed NERA and NDIS.
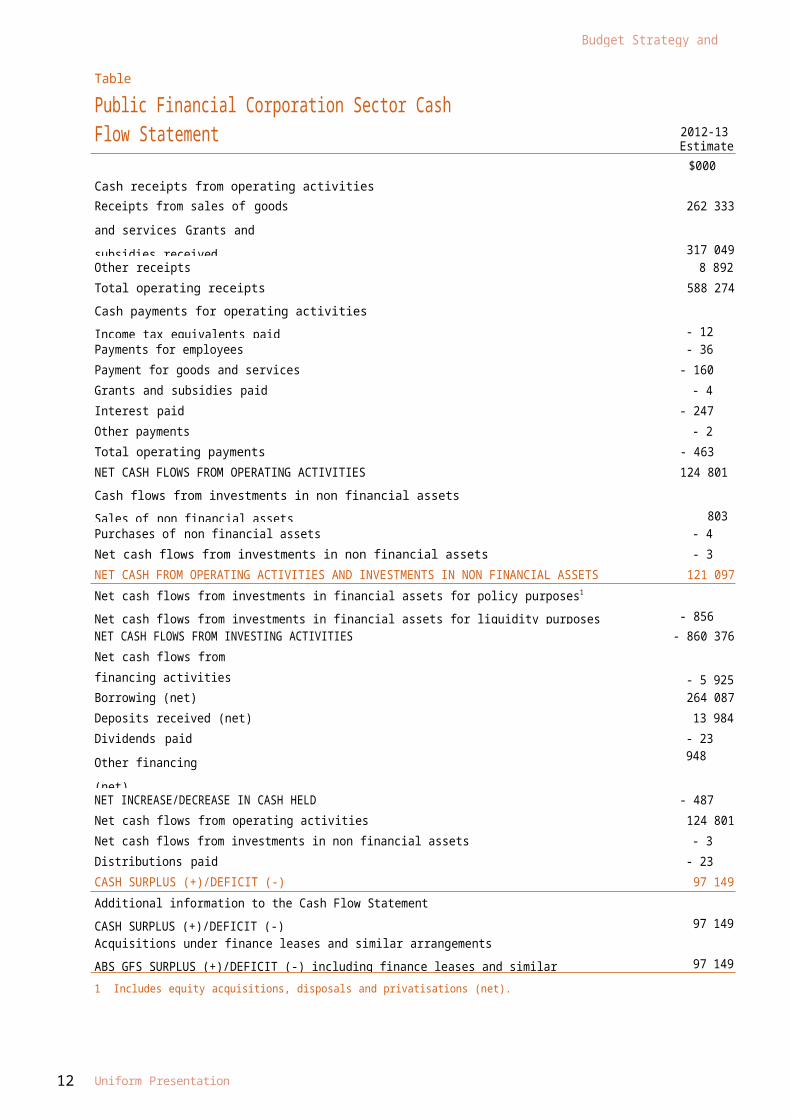
Budget Strategy and Outlook
99Intergovernmental Revenue
Under the IGA, SPP funding is ongoing and indexed annually. Funding is untied within the relevant sector and, following a transition period, will be distributed between states on a population share basis. The Disability SPP will be fully transitioned to population share in 2013-14, with the remaining SPPs being fully transitioned in 2014-15. Historically, the Territory received a higher than population share of some SPPs and therefore the transition results in the Territory receiving a reduced share of the SPP. This is exemplified by the reduction in the Territory’s National Affordable Housing SPP in 2013-14. However, it is anticipated this lower SPP funding will be offset by an increase in GST revenue.
In 2013-14, the Territory expects to receive $101.3 million in SPPs for government schools, skills and workforce development, affordable housing and disability. Table 7.5 provides estimates of SPPs to be received by the Territory in 2012-13 and 2013-14.
Table 7.5: Specific PurposePayments
2012-13Estimate
2013-14Budget
$M $M
National Schools – government schools 58.1 57.5
National Skills and Workforce Development 14.3 14.4
National Affordable Housing 25.4 19.4
National Disability 13.4 13.7
National Disability – budget neutral adjustment1 - 3.6 - 3.7
Total2 107.6 101.3
National PartnershipPayments
1 The adjustment to the Disability SPP is to ensure budget neutrality of the realigned Commonwealth and state responsibilities for aged care and disability services agreed under the NHR Agreement.
2 Excludes SPPs for non-government schools. Source: Department of Treasury and Finance
The IGA established NP agreements to implement projects of national importance and/or significant reforms. NP agreements have been agreed for initiatives in a broad range of state services. Some, but not all NP agreements, require implementation plans to outline state-specific arrangements.
NP payments are now the major source of tied Commonwealth funding, with the Territory estimated to receive NP revenue of $424.3 million in 2012-13 and $461.6 million in 2013-14. Table 7.6 provides estimates of NP revenue by the agency responsible for delivering the service in the Territory.
The Territory currently has about 70 NP agreements and Project Agreements agreed, with another 14 under negotiation including some that represent the continuation of previous funding. There are also around 60 implementation plans either agreed or under development.
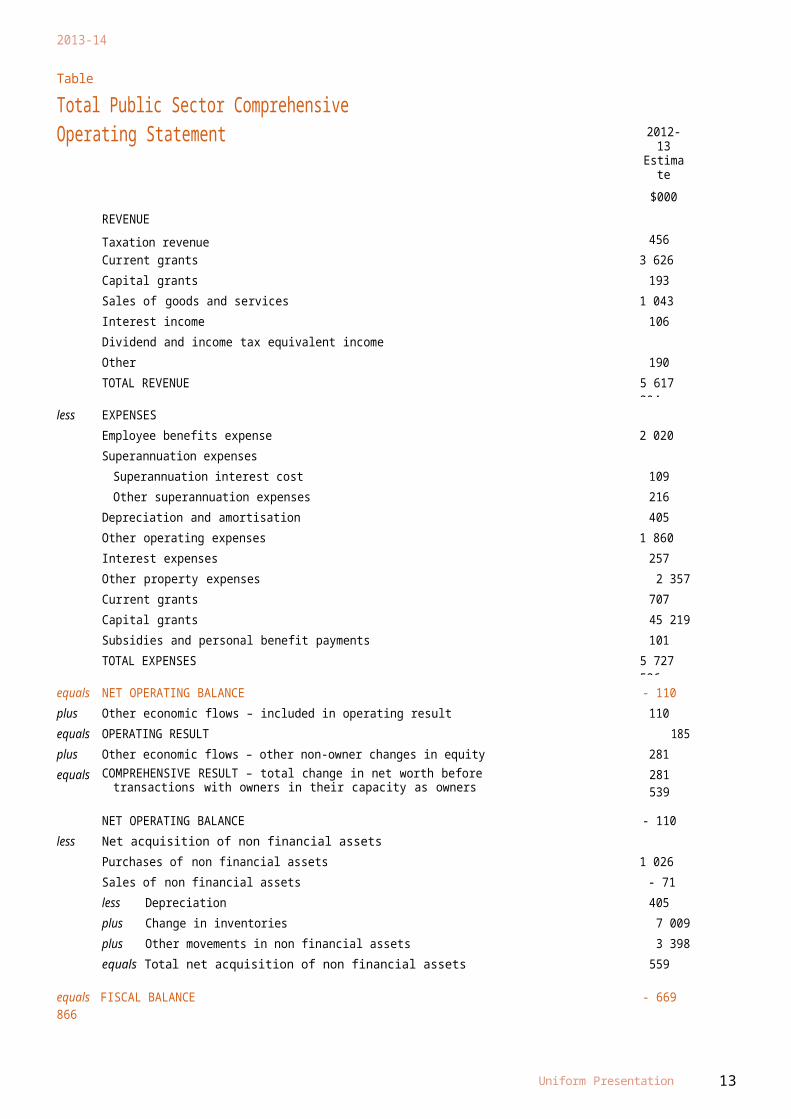
2013-14 Budget
100
Intergovernmental Revenue
Table 7.6: National PartnershipPayments Agency
2012-13Estimate
2013-14Budget
$M $M
Department of the Chief Minister 6.9
Northern Territory Police, Fire and Emergency Services 7.6 41.9
Department of Transport 74.2 72.4
Department of Business 5.6 2.9
Department of Correctional Services 0.3
Department of Health 66.1 77.5
Department of Education and Children’s Services 78.3 75.0
Department of Housing 169.1 141.7
Department of Mines and Energy 1.5Department of Land and Resource Management 4.1 0.6Office of Children and Families 8.1 18.0
Department of Regional Development and Women’s Policy 8.5 24.7
Department of Local Government 0.2
Department of Arts and Museums 0.7
Total 424.3 461.6
Stronger Futures in the Northern
Territory
Source: Department of Treasury and Finance
NP revenue included in the Territory’s Budget represents funding that has been agreed by the Territory and the Commonwealth. As additional agreements are finalised through the year, the Territory’s NP revenue for 2013-14 and the forward estimates will vary accordingly. Timing of revenue over the life of an agreement is dependent on the nature of the initiative and achievement of agreed milestones and/or performance benchmarks. It may not be uniform across the years.
The majority of the increase in NP revenue from 2012-13 to 2013-14 is attributed to the various Stronger Futures in the Northern Territory initiatives. This increase is partially offset by a decrease in NP revenue for the Remote Indigenous Housing NP from 2012-13 to 2013-14 of $35.8 million, as a result of bringing forward funding from outer years to 2012-13 to fast track new housing construction and other related works. Other decreases are predominantly due to the funding schedule for the Water for the Future, Caring for Our Country and Smarter Schools NPs and the expiry of some time-limited NP agreements.
The Stronger Futures in the Northern Territory NP Agreement was signed by the Commonwealth and Territory governments in August 2012. It aims to improve Indigenous outcomes through the program areas of health; schooling; community safety and justice; tackling alcohol abuse; child, youth, family and community wellbeing; housing; municipal and essential services; Alice Springs transformation; remote engagement and coordination; and jobs.
The Stronger Futures in the Northern Territory NP Agreement is a 10-year funding package commencing in 2012-13, totalling $3.49 billion. It is comprised of $1.429 billion in NP payments provided directly to the Territory Government, $1.956 billion as Commonwealth own purpose expense payments, which can be used by the Commonwealth to fund services and/or
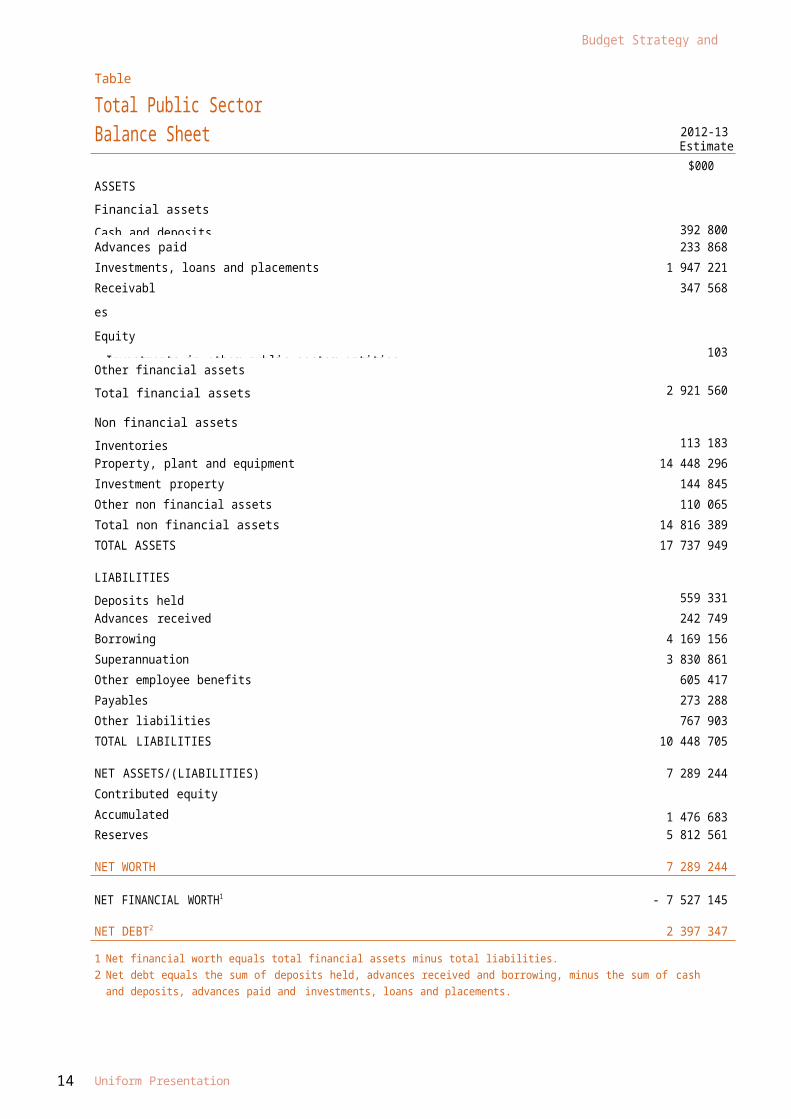
101Intergovernmental Revenue
Budget Strategy and Outlook
Expiring National Partnership Agreements
Reward Payments
for their own administration, and $64 million in payments to non-government schools.
While the expiry of NP agreements that focus on discrete initiatives (such as infrastructure) can be relatively easily managed by states, it is more problematic where the NP agreement creates expectations of ongoing service delivery or increases service activity, therefore requiring continued funding. On expiry of an NP agreement, funding may cease, be incorporated into an SPP or general revenue assistance, be renewed or allocated undera new NP agreement. If Commonwealth funding is ceased, then additional demands may be placed on state finances, which may or may not accord with state priorities.
Under the IGA, the Standing Council on Federal Financial Relations, comprising all state, territory and Commonwealth treasurers, may make recommendations as to the treatment of funding under expiring NP agreements. The final decision on available funding however remains a Commonwealth budgetary matter. The effect of expiring NP agreements on the Territory’s budget remains a risk and will continue to be closely monitored.
The Territory has 24 NP agreements expiring during 2012-13, for which total funding of $48.7 million is expected to be received in 2012-13. More than half (14) of these expiring NP agreements are either one-off capital or short-term programs, which have now been completed. The remaining agreements had a substantial service delivery component and seven of these are being renegotiated for continuation, with the three outstanding agreements being incorporated into new NP agreements in 2013-14. A further 16 NP agreements that are expected to receive total funding of $66.1 million during 2013-14 are due to expire by the end of 2013-14, with the majority of these having a high service delivery component. Seven of these expiring agreements are likely to be extended beyond 2014 but little is known about the continuation of the other nine NP agreements, which will be dependent on Commonwealth budget processes.
NP revenue may include reward payments made under reform-focused NP agreements upon achievement of performance benchmarks. Payments are released following an assessment by the COAG Reform Council (CRC) and subsequent determination by the relevant Commonwealth Minister on the basis of the CRC’s report.
In 2012-13, the CRC assessed jurisdictions’ performance under the NP Agreement on Essential Vaccines. The CRC is also expected to assess the NP Agreement on Teacher Quality, Improving Public Hospital Services – National Elective Surgery Target (NEST) and National Emergency Access Target (NEAT) and Seamless National Economy in 2012-13. The Territory anticipates receiving reward funding for the majority of these NPs. Details of reward payments expected and received in 2012-13 are provided in Budget Paper No. 3. In 2013-14, the Territory’s performance will be assessed by the CRC for reward payments under NEST and NEAT.
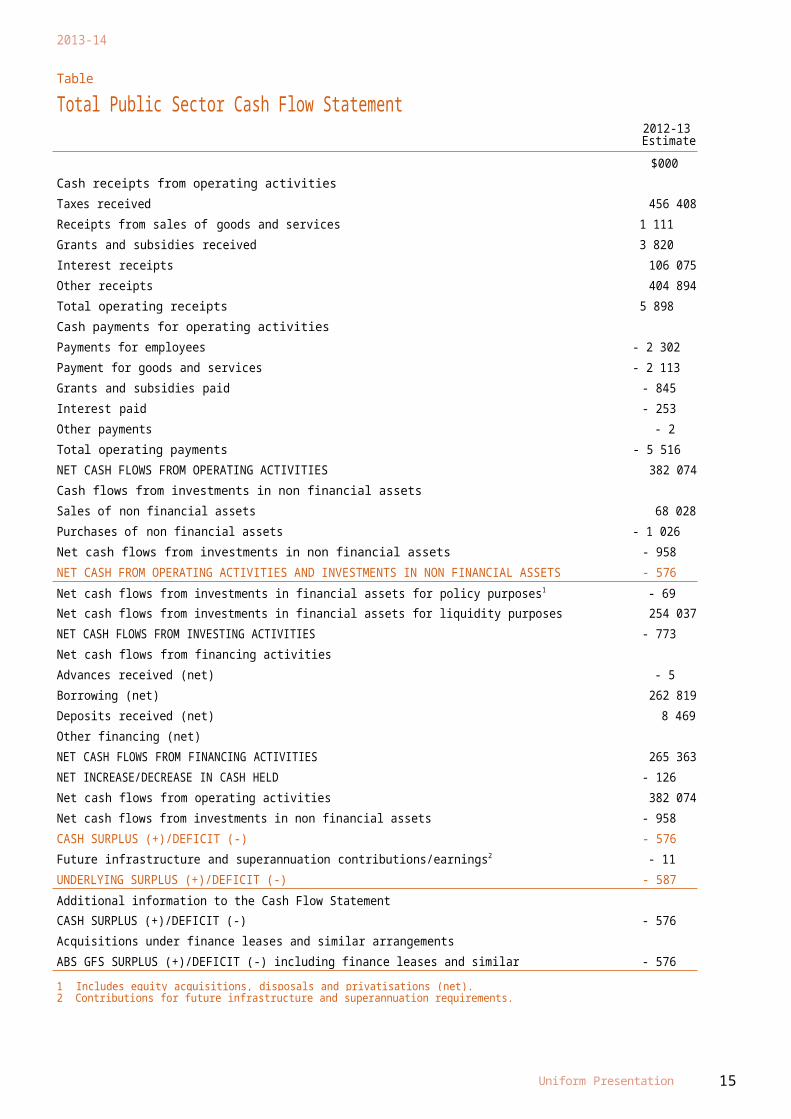
2013-14 Budget
100 Intergovernmental Revenue
National Health Reform Agreement
Performance ReportingA central tenet of the IGA is enhanced accountability through simpler, standardised and more transparent performance reporting to both governments and the public. Performance measures are required to be outcome and/or output focused in both NAs and NP agreements, and reported in a timely fashion. As well as considering the performance of jurisdictions for NP agreements with reward payments outlined above, the CRC annually assesses and publicly reports on the performance of states for each NA. Evidence of government performance regarding agreed NA performance measures and benchmarks, outputs and outcomes is initially examined for data quality and appropriateness by the Steering Committee for the Report on Government Service Provision.
Performance reports have been issued by the CRC for the baseline, first and second years of all NAs. Third year performance reports under the National Education Agreement and the National Agreement on Skills and Workforce Development were publicly released in December 2012. The remaining third year NA performance reports are expected to be released in June 2013.
The reports issued to date indicate an overall incremental improvement in Territory performance, reflecting the enhancement of service delivery arising from the significant investments made in recent years. The use of data sourced from national surveys, which do not fully sample the diversity of the Territory’s population and thus do not fully reflect the Territory’s circumstances, is a particular data quality concern of the Territory. This issue is generally acknowledged in relevant CRC publications.
Reviews of the performance frameworks of all NAs were completed in 2011-12 to ensure that progress is appropriately measured and reported. The reviews focused on the conceptual adequacy of the performance measures and data availability and quality. The CRC has acknowledged that while more work is needed to be done, the culmination of these reviews and the new NAs are a significant achievement under the continuous improvement principle.
On 2 August 2011, COAG signed the NHR Agreement, which provides a framework for reforms to the way public hospitals are funded and governed in Australia.
The reforms are intended to decentralise the delivery of hospital services. In the Territory context, they transform the Department of Health from a single organisation into three entities, comprising the Department of Health, Top End Health and Hospital Services, and Central Australian Health and Hospital Services.
The Department of Health’s focus will be predominantly on governance, policy development and regulatory functions, while Top End Health and Hospital Services and Central Australian Health and Hospital Services will provide integrated, regionally-based healthcare services under the operational management of boards. In combination with other policy initiatives, the decentralisation of decision making is intended to improve
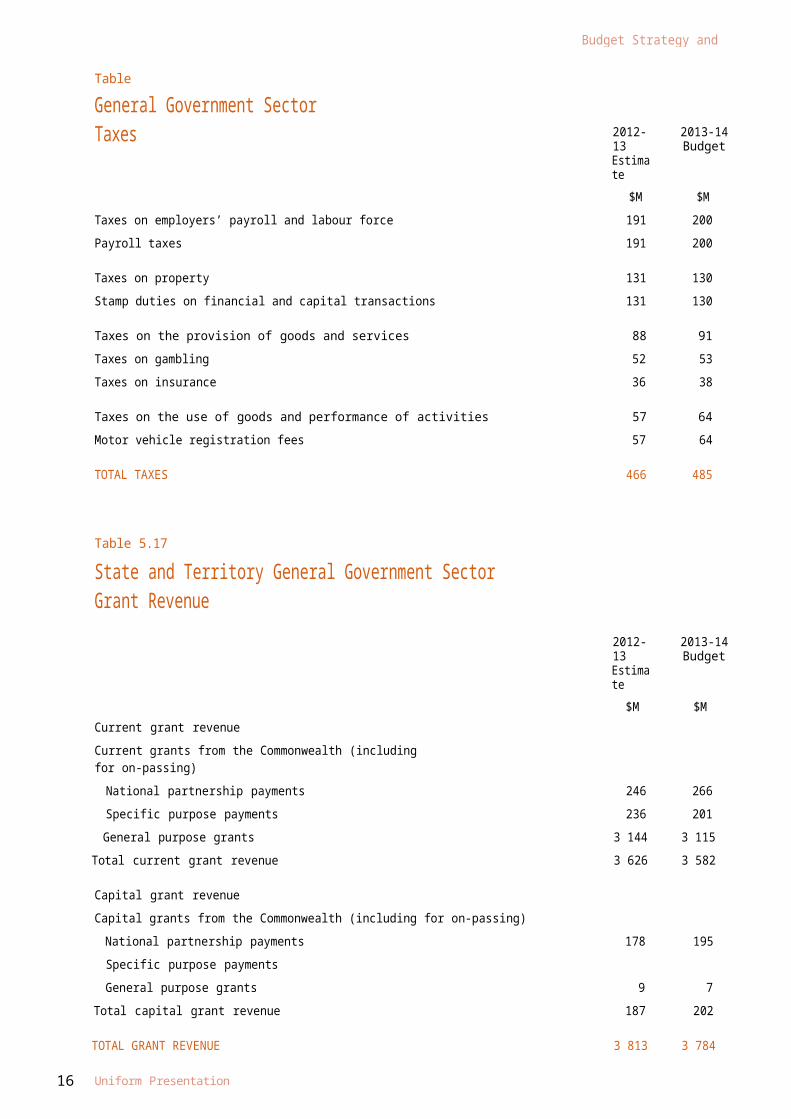
103Intergovernmental Revenue
Budget Strategy and Outlook
National Disability Insurance Scheme
National Education Reform Agreement
the flexibility, responsiveness and innovative capacity of the public hospital system.
The NHR Agreement also commits the Commonwealth, states and territories to implement new arrangements for the hospital system including moving to activity-based funding (ABF) arrangements. ABF aims to improve patient access to services and increase public hospital efficiencies by funding hospitals for agreed services rather than on a historical basis.
Pricing under the NHR Agreement is determined by the Independent Hospitals Pricing Authority (IHPA) however, the price agreed with the hospital systems may differ to the efficient price determined by the IHPA. The Territory’s contribution to ABF is determined as the difference between the agreed price and the Commonwealth’s contribution towards the efficient price.
Funding for those public patient services that are not conducive to or appropriately funded through the ABF framework will be provided on a block-funding basis.
The fiscal arrangements are incorporated in the 2013-14 Budget Papers. In 2013-14 the Territory anticipates receiving $132 million in NHR Agreement payments.
The NDIS was a key recommendation from the Productivity Commission’s report into a national long-term disability care and support scheme. The NDIS will reform the way the Commonwealth and states fund and deliver disability services in Australia.
The NDIS (now known as DisabilityCare Australia) is aimed at providing lifelong care and support for people with a significant disability, including greater choice and control over the supports received and a focus on early intervention.
In December 2012, COAG signed an Intergovernmental Agreement for the NDIS launch. The agreement sets out the objectives, roles and responsibilities of all parties during the first stage of the NDIS and provides a framework for progressing to a full scheme.
All but two states (Western Australian and Queensland) have agreed to participate in launch sites. These launch sites are designed to inform governments about how and when to proceed to a full scheme NDIS. The Territory has agreed in principal to a three-year launch in the Barkly region from July 2014.
In April 2013, the Commonwealth released details of the proposed funding arrangements between the Commonwealth and the states under the NERA. Under the proposed education reforms, all government and non-government schools would be funded on a per student basis with loadings to recognise the additional resources required to provide education services to disadvantaged students.
The Commonwealth has set a 30 June 2013 deadline for states to sign up to the NERA.
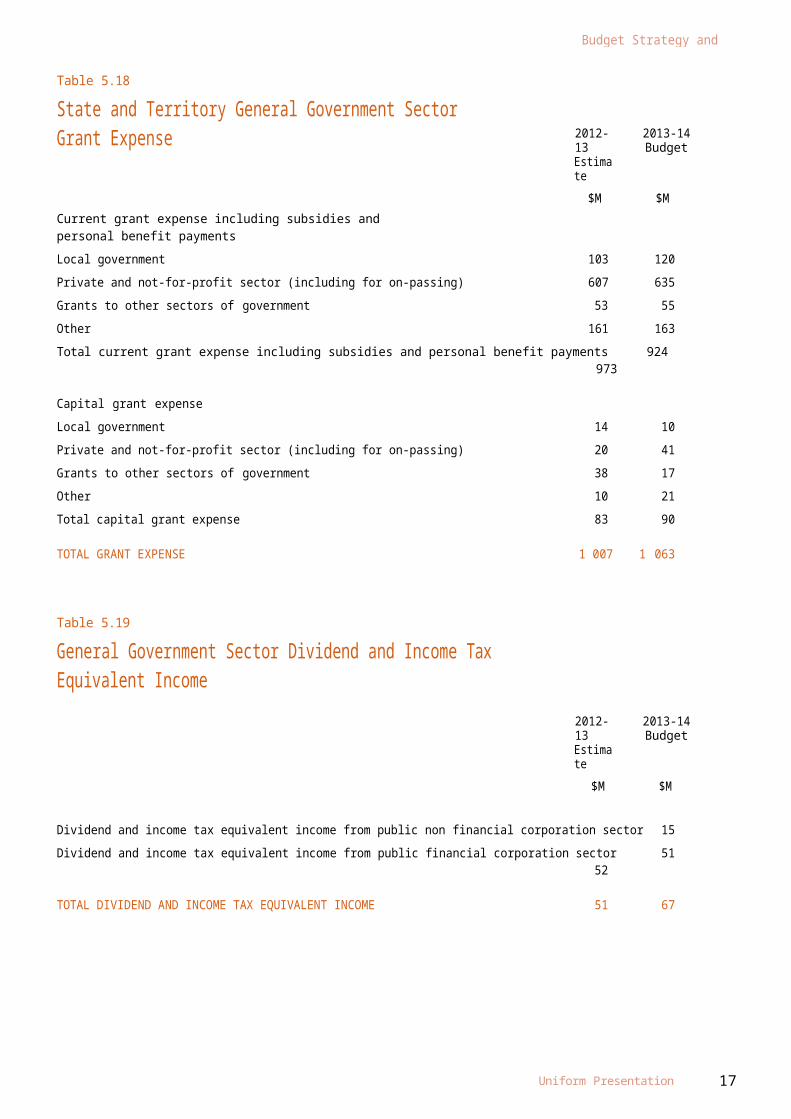
5.4% 3.2% 53.9%
5.5% 3.4% 55.9%
2013-14 Budget
102 Intergovernmental Revenue
Indigenous Expenditure Report
Table 7.7: Comparison of the Outcomes from the 2010 and 2012 Indigenous Expenditure
Reports
Table 7.8: Indigenous and Non-Indigenous per
capita Spending, 2010-11
The Indigenous Expenditure Report (IER) is a biennial publication produced by the Steering Committee for the Review of Government Service Provision under the auspices of the Council of Australian Governments.
The IER provides estimates of expenditure on services provided to Indigenous people by the Commonwealth and state governments. The reporting of the levels and patterns of government expenditure that can be attributed to the Indigenous population in the IER is intended to provide additional information to support the development of policies aimed at closing the gap in outcomes between the Indigenous and non-Indigenous populations.
The 2012 IER was released in September 2012 and pertains to general government expenditure on services related to Indigenous people in 2010-11.
Table 7.7 shows that in 2010-11, 55.9 per cent of total Territory Government spending in the general government sector was on services that can be attributed to the Indigenous population. In comparison, Indigenous people represent 30 per cent of the Territory’s population. The proportion of total Territory Government spending on services related to Indigenous people increased by 2.0 percentage points from 53.9 per cent in 2008-09 to 55. percentage points in Western Australia to 0.6 percentage points in New South Wales over the same period.
NSW Vic Qld WA SA Tas ACT NTEstimate of Indigenous share of total state expenditure 2008-09 5.2% 1.9% 8.5% 10.7% 5.7%
2010-11 5.8% 2.1% 8.5% 10.5% 5.7%
Ratio of Indigenous to non-Indigenous per capita spending2008-09 2.4 2.9 2.5 3.4 3.3 1.4 2.5 2.7
2010-11 2.5 3.1 2.5 3.4 3.2 1.4 2.6 2.9
Source: 2010 and 2012 Indigenous Expenditure Reports
In 2010-11, the per capita expenditure on services related to Indigenous people in the Territory was $35 852. This was the highest of all states and 19.2 per cent higher than Western Australia, the state with the second highest per capita spending on Indigenous people ($30 074 per capita), as shown in Table 7.8.
NSW Vic Qld WA SA Tas ACT NT
Indigenous 18 829 24 837 22 318 30 074 27 816 12 654 27 192 35 852
Non-Indigenous 7 404 8 070 8 954 8 957 8 747 9 190 10 576 12 258
Source: 2010 and 2012 Indigenous Expenditure Reports
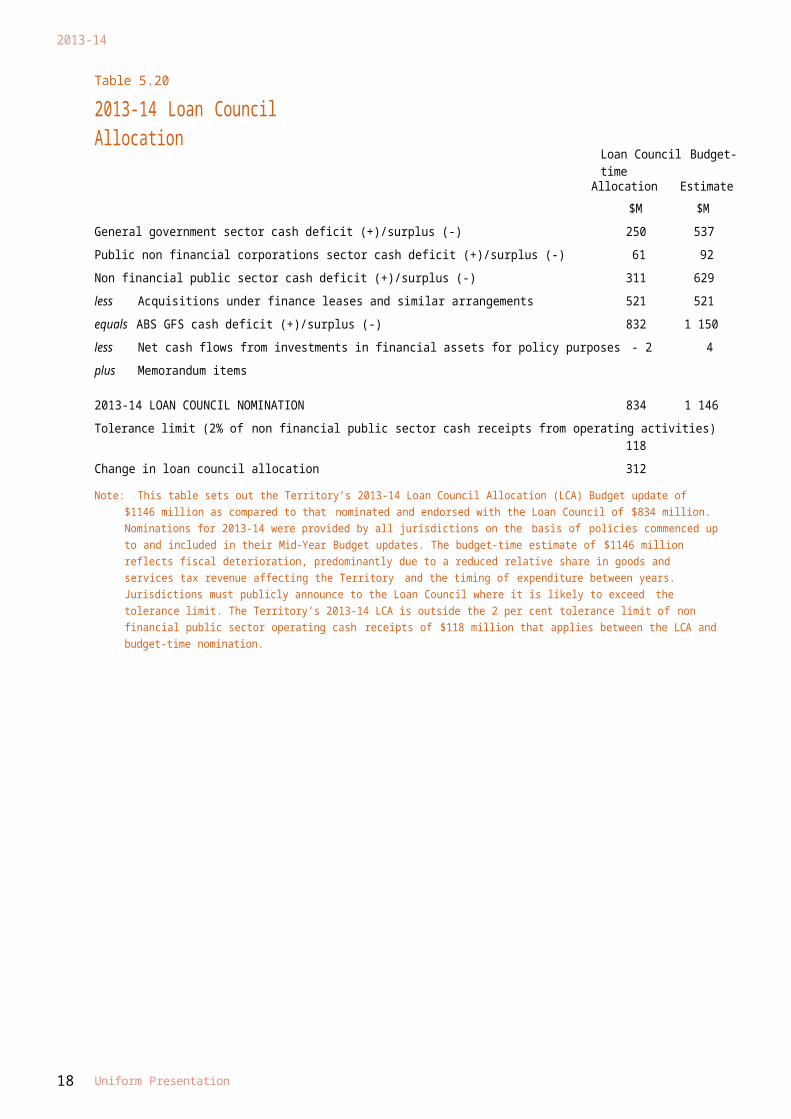
104
2013-14 Budget

Budget Strategy and Outlook
105Territory Taxes and Royalties
Chapter 8Overview
Analysis of Territory Taxes and
Royalties
Chart 8.1: Main Own-Source Revenue Categories,
2013-14
Territory Taxes and RoyaltiesNationally, own-source revenue represents around one-half of states’ total revenue, with the remaining revenue sourced from Commonwealth grants. Although the Territory is more reliant on Commonwealth grants than other jurisdictions, the Territory’s own-source revenue nonetheless forms an important component of total revenue. Own-source revenue provides states with the fiscal autonomy and flexibility to tailor infrastructure investment and services to meet the needs of their respective jurisdiction.
Territory own-source revenue predominantly comprises taxes and mining revenue but also includes fees and charges, rent and tenancy income, interest and dividend revenue, and profit and loss on disposal of assets.
This chapter provides details of the Territory’s own-source revenue categories of taxes and royalties, information on revenue collection forecasts and a comparison of the Territory’s taxes revenue with other jurisdictions. It also includes a statement of the Territory’s forecast tax expenditure as a result of concessions and exemptions for 2013-14 through to 2016-17, as required by the Fiscal Integrity and Transparency Act.
Full details of all the Territory’s own-source revenues are set out in Budget Paper No 3.
The projected revenue for 2013-14 from taxes and royalties for the general government sector totals $598.6 million and the main contributors are taxes on employers (payroll tax) at $200.1 million or 33.4 per cent, taxes on property (stamp duties on capital transactions) at $130.3 million or 21.8 per cent, and mining royalties at $113.3 million or 18.9 per cent.
Chart 8.1 shows the Territory’s estimated main own-source revenues in 2013-14 according to the classification used in the Uniform Presentation Framework adopted for the Territory’s reporting requirements.
Note: Excludes payroll tax from general government entities. Source: Department of Treasury and Finance
The estimated revenue in 2012-13 from taxes and royalties totals $573.9 million, compared to the forecast total of $527.0 million from the Pre-Election Fiscal Outlook (PEFO). The increase of $47.0 million from the original forecast is primarily due to higher revenue from property taxes and

106 Territory Taxes and Royalties
2012-13 2013-14
2012 PEFO Mini Budget Estimate Budget
$000 $000 $000 $000Mining royalties 102 732 102 732 107 732 113 332
Taxes on employers 182 727 190 746 190 746 200 093
Taxes on property 101 947 130 252 130 734 130 264
Taxes on gambling 51 746 51 746 51 746 53 202
Motor vehicle taxes 51 910 57 060 57 060 63 989
Taxes on insurance 35 894 35 894 35 894 37 688
Total 526 956 568 430 573 911 598 569
2013-14 Budget
payroll tax, offset somewhat by lower than forecast mining royalty revenues. Estimates for 2012-13 and 2013-14 are shown in Table 8.1 below.
Table 8.1: Main Own-Source Revenue Categories
Mining and Petroleum Revenue
Source: Department of Treasury and Finance
Mining revenue is obtained from royalties levied on the recovery of mineral commodities from mining tenements in the Territory. Similarly, petroleum revenue accrues from royalties imposed on the production of petroleum in the Territory. Mineral and petroleum royalties are a charge for resource usage, payable to the Territory as the owner of the site or the mineral or petroleum rights over the site.
The Territory’s mining royalty revenues are generally based on a profits-based regime specified under the Mineral Royalty Act. Unlike the Territory’s profit-based scheme, the other states predominantly use output-based royalty schemes that impose a royalty rate on the value of production (ad valorem) or on the tonnage extracted. By contrast, theTerritory’s profit-based regime uses the net value of a mine’s production to calculate royalty. This is the operating revenue derived from mining activities in excess of $50 000 after deducting allowable project costs, prior year carried forward losses, the cost of capital employed in the mine and the cost of capital and exploration expenditure on the mine site.
Mineral royalties are collected in the Territory from mining and quarrying for gold, silver, bauxite, manganese, lead, zinc, sand, gravel, laterite, vermiculite and lime. The Territory is unable to impose royalties in respect of uranium mined in the Territory as, unlike the states, the Commonwealth retains the ownership of this uranium. Nonetheless, the Territory receives a grant in lieu of uranium royalty from the Commonwealth. The only uranium mine in the Territory is the Ranger Project, which has an ad valorem royalty scheme settled by the Commonwealth. The Territory receives grant payments reflecting the royalty regime that applied at the time the Ranger Project arrangements were settled.
However, Commonwealth legislation provides that royalty on any future uranium mines in the Territory will be based on the Territory’s Mineral Royalty Act. The royalties will continue to be paid to the Territory as a grant in lieu of royalty.
A key feature of the Territory’s Mineral Royalty Act is that both prices and mining costs, including mine set-up costs carried forward to profitable years, are taken into account in royalty calculations. If commodity prices, production costs or the value of the Australian dollar rise or fall, royalty
Budget Strategy and Outlook
107Territory Taxes and Royalties
Capping Transfer Pricing
liabilities vary accordingly. This variability produces stronger growth in royalty revenues in times of high mineral prices than under ad valorem royalties.
In 2012-13, it is expected that the Territory will receive $107.7 million in mining revenue, $5 million more than forecast in the PEFO. Although an improvement from PEFO, this result is less than that forecast in the 2012 Budget as a result of lower than estimated receipts due to industry profitability moderating slightly, due largely to the combined effect of the strength of the Australian dollar and lower commodity prices in respect of the minerals mined by the Territory’s largest royalty payers.
Mining revenue forecasts are reliant on advice from mining companies of estimated liability and related company estimates of commodity price movements, production levels and the value of the Australian dollar. The forecast for royalty revenue in 2013-14 is $113.3 million and is based on advice from royalty payers that profitability will continue to be affected by the strength in the Australian dollar and lower relevant commodity prices, but also reflecting policy changes to the Mineral Royalty Act to rationalise deductions available to royalty payers.
Rationalisation of deductions under the Mineral Royalty ActThe Mineral Royalty Act imposes royalty on a proportional profit basis. Royalty is payable at a rate of 20 per cent based on the net value of a mine’s production (the net value of a saleable mineral commodity sold or removed without sale from a mine) over a $50 000 statutory threshold. It is payable on the operating revenue derived from mining activities after deducting allowable project costs, losses carried forward from prior years, the cost of capital employed in the mine and the cost of capital and exploration expenditure on the mine site.
Two amendments, commencing from 1 July 2013, will be made to the Mineral Royalty Act to streamline administration, reduce red tape and rationalise the deductions available to royalty payers to reduce their mineral royalty liability. They address risks that have arisen since the introduction of the Mineral Royalty Act, as there have been dramatic advances in communications and technology, which have led to a globalised mining industry. This has made the determination of allowable operating costs increasingly difficult and administratively complex due to an increasing number of royalty payers also having business interests outside the Territory.
Transfer pricing generally involves an initial sale of minerals between a miner and a related overseas-based trading entity. Following the initial sale, the minerals are usually on-sold by the trading entity to a third-party customer or to a related commodities refiner within the group. The price received by the miner is generally less than the final arm’s length price received by the trader from the third-party customers. Accordingly, a profit margin (or a transfer pricing factor) is earned by the trading entity.
Although it is reasonable for a profit margin to be earned by the trading entity in recognition of its specialisation in procuring sales, transfer pricing also provides a means to procure a special tax benefit through the after-the-fact
2013-14 Budget
108 Territory Taxes and Royalties
shifting of profits between jurisdictions to ensure the profit is located in the
Budget Strategy and Outlook
109Territory Taxes and Royalties
Limiting the Deductibility of Head Office,
Management Fees and Labour Costs
Table 8.2: Summary of RevenueMeasures
country with the most favourable tax system. Accounting for transfer pricing is also very administratively burdensome on the Territory and the miner.
Accordingly, the Mineral Royalty Act is to be amended to cap transfer pricing at 5.5 per cent of the value of the mineral unless the mine uses a transfer pricing methodology approved by the Australian Taxation Office (ATO).
This maximum will be underpinned by a guideline issued under the Act detailing the requirements to establish and substantiate an appropriate transfer pricing factor. Less onerous substantiation will be required for a transfer pricing factor of 3 per cent or less, but a factor between 3 per cent and 5.5 per cent will require greater substantiation.
Another measure will address the risk of accounting strategies that shift expenses to the Territory that were incurred by related entities based either elsewhere in Australia or internationally. The measure will address the emerging issue of external expenses being claimed under the royalty regime by the Territory mining operation under the badge of being a deductible operating cost.
An integral component of the Territory’s profits-based royalty regime is a royalty payer’s ability to claim a deduction for legitimate operating costs, which include labour costs, head office expenses and fees for management services. Currently, these types of operating costs are claimable if a royalty payer can substantiate that the costs are directly attributable to the operation of the individual mining project.
The Mineral Royalty Act is to be amended to limit the deduction of head office costs, management fees and labour costs to offices located, costs incurred or activities performed in the Territory.
The amendments are targeted at encouraging and rewarding those mining companies that genuinely maintain and operate a bulk of their operations in the Territory.
2013-14 2014-15 2015-16 2016-17
Budget Forward Estimates
$000 $000 $000 $000Limit the deductibility of head office
expenses, management fees and6 000 6 000 6 000 6 000
administrative labour costs to an office located or work performed in the Territory
Cap the amount a royalty payer can claim 4 600 4 600 4 600 4 600as a transfer pricing factor to 5.5%
Total 10 600 10 600 10 600 10 600
Source: Department of Treasury and Finance
Minor amendments are also being made to the Mineral Royalty Act to confirm that the Commonwealth minerals resource rent tax and ‘carbon tax’ are not allowable operating costs, which accords with the generally understood position but simply clarifies it in the legislation. Also, the Act is to be amended to allow the Mineral Royalty Secretary to share information with the Commonwealth on royalty matters related to uranium mining in the Territory.

2013-14 Budget
110 Territory Taxes and Royalties
Taxation Revenue
The Territory’s taxation revenue for 2012-13 is expected to total$466.2 million. In 2013-14, taxation revenue is expected to increase by4.1per cent to $485.3 million, largely as a result of higher payroll tax receipts.
The components of the Territory’s taxation revenue are payroll tax, stamp duty on conveyances, taxes on gambling, taxes on insurance, and motor vehicle fees and taxes. Table 8.3 shows the estimate of the Territory’s taxation revenue for 2012-13 and forecast for 2013-14.
Table 8.3: Northern Territory
Taxation Revenue
2012-13Estimate
2013-14Budget
Taxes on employers
$000 $000
Payroll tax1 190 746 200 093
Taxes on propertyConveyance duty 130 252 129 778
Other duty 482 487
Taxes on the provision of goods and servicesTaxes on gambling 51 746 53 202
Taxes on insurance 35 894 37 688
Taxes on use of goods and performance of activities
Motor vehicle taxes 57 060 63 989
Total 466 179 485 237
1 Excludes payroll tax from public financial corporations, public non financial corporations and the private sector.
Source: Department of Treasury and Finance
Payroll TaxPayroll tax is payable in the Territory when the total annual Australian wages of an employer (or group of employers) exceed the Territory’s annual threshold amount, which is $1.5 million. The threshold reduces proportionately if an employer pays wages in another state or territory. The threshold amount is a deduction from taxable wages, which operates so that businesses with total Australian wages of up to $1.5 million do not pay any payroll tax. The deduction reduces by $1 for every $4 in wages paid by an employer above the $1.5 million threshold. This means that an employer who pays wages of $7.5 million or more does not receive a deduction.
Payroll tax is calculated at the rate of 5.5 per cent based on taxable wages (less the deduction) paid by an employer for services rendered by employees in the Territory.
In 2012-13, payroll tax revenue is expected to be $190.7 million, an increase of $8.0 million from the estimate in the PEFO. This reflects employment and wages growth in the Territory during 2012-13, particularly among the larger employers making up the Territory’s payroll tax base.
In 2013-14, payroll tax receipts are expected to increase by 4.9 per cent to $200.1 million, reflecting a further increase in revenue from employment
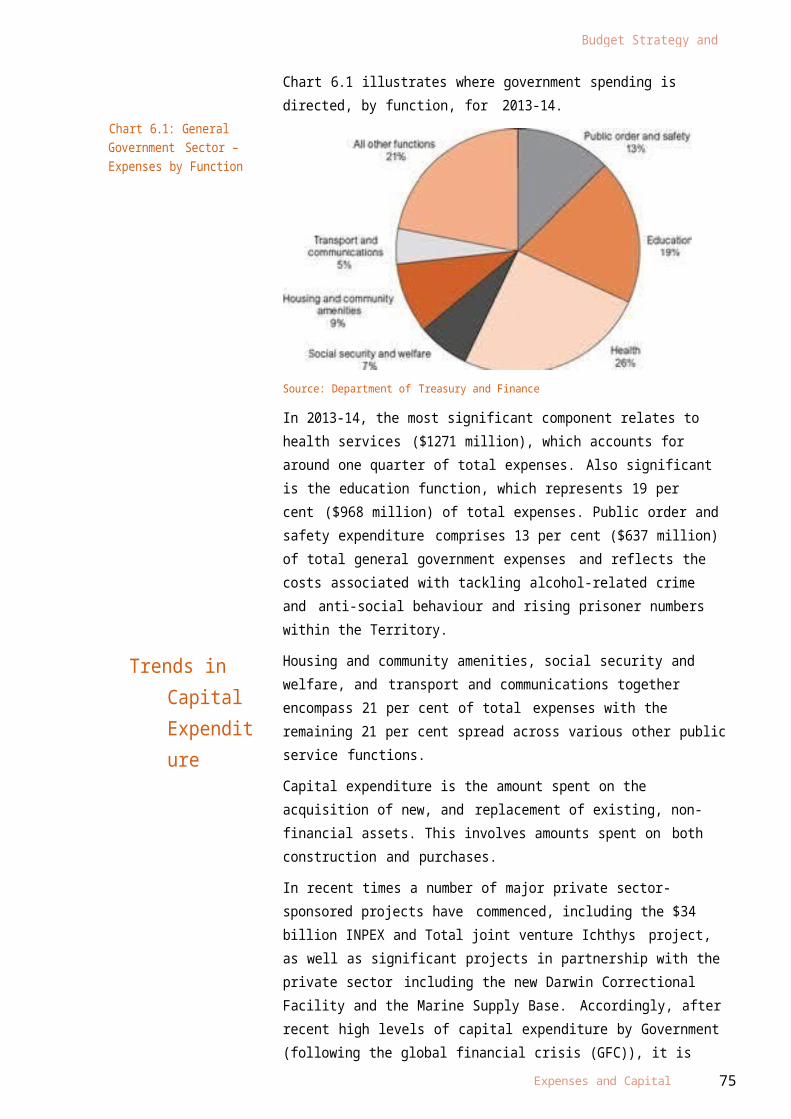
Budget Strategy and Outlook
111Territory Taxes and Royalties
growth and growth in average weekly earnings, particularly among the larger employers forming the Territory’s payroll tax base. Over the forward estimates period, payroll tax revenue is expected to increase by the long-term growth rate of 5 per cent.
2013-14 Budget
112 Territory Taxes and Royalties
Conveyance Duty
Stamp Duty on Insurance
Motor Vehicle Taxes
Minor amendments will be made to the Payroll Tax Act to ensure that the payroll tax formulae in the legislation reflects the intended practice and aligns with the processes undertaken in Territory Revenue Management electronic Return (TRMeR), the Territory’s online payroll tax returns system.
Stamp DutyThe Territory’s conveyance duty is derived from direct and indirect conveyances of dutiable property in the Territory. Such property comprises real estate and transfers of businesses.
Conveyance duty in the Territory is calculated by a formula that determines a rate applicable to the value of dutiable property conveyed. This is different to the other states, which levy stamp duty on the basis of marginal rates. A comparison of the Territory’s stamp duty regime with the other states is provided later in this chapter.
In 2012-13, the Territory is expected to collect $130.7 million in stamp duty on conveyances, compared with $101.9 million estimated in PEFO. The increase in conveyance duty collections is due mainly to a significant recovery in the number of residential and commercial transactions along with some increase in the average value of those transactions. It also reflects the removal of the stamp duty First Home Owner Concession as part of the 2012 Mini Budget (although this increase in stamp duty revenue is partially offset by an increase in expenditure on the First Home Owner Grant). It also includes a very large one-off commercial transaction from which the Territory receipted duty of $13 million.
In 2013-14, conveyance duty is estimated to decrease by $0.5 million to $130.2 million, reflecting expectations that residential and commercial property stamp duty revenue will continue to increase, but removing the effect of the large one-off transaction. Forward estimates for stamp duty are based on a growth rate of 2.5 per cent per annum.
Insurance duty is imposed on general and life insurance policies, with general insurance contributing to the majority of the revenue collected from this duty. Stamp duty on general insurance is calculated at a rate of 10 per cent of the premium paid on all general insurance products that relate to property or risk in the Territory. Where the policy also relates to a risk or property outside the Territory, the premium is apportioned. Stamp duty on life insurance is levied on life insurance policies for people residing in the Territory and is calculated at a rate of 10 cents per $100 or part thereof of the sum insured.
Revenue from insurance duty is forecast to be $35.9 million in 2012-13. Based on historical growth rates, insurance duty is forecast to grow by 5 per cent to $37.7 million in 2013-14.
Motor vehicle taxes comprise stamp duty on the transfer and initial registration of motor vehicles and motor vehicle registration fees.
Generally, stamp duty is levied on the purchase price of the vehicle at a rate of $3 per $100 or part thereof. Revenue from this source in 2012-13 is estimated to be $21.1 million. In 2013-14, it is expected to increase to
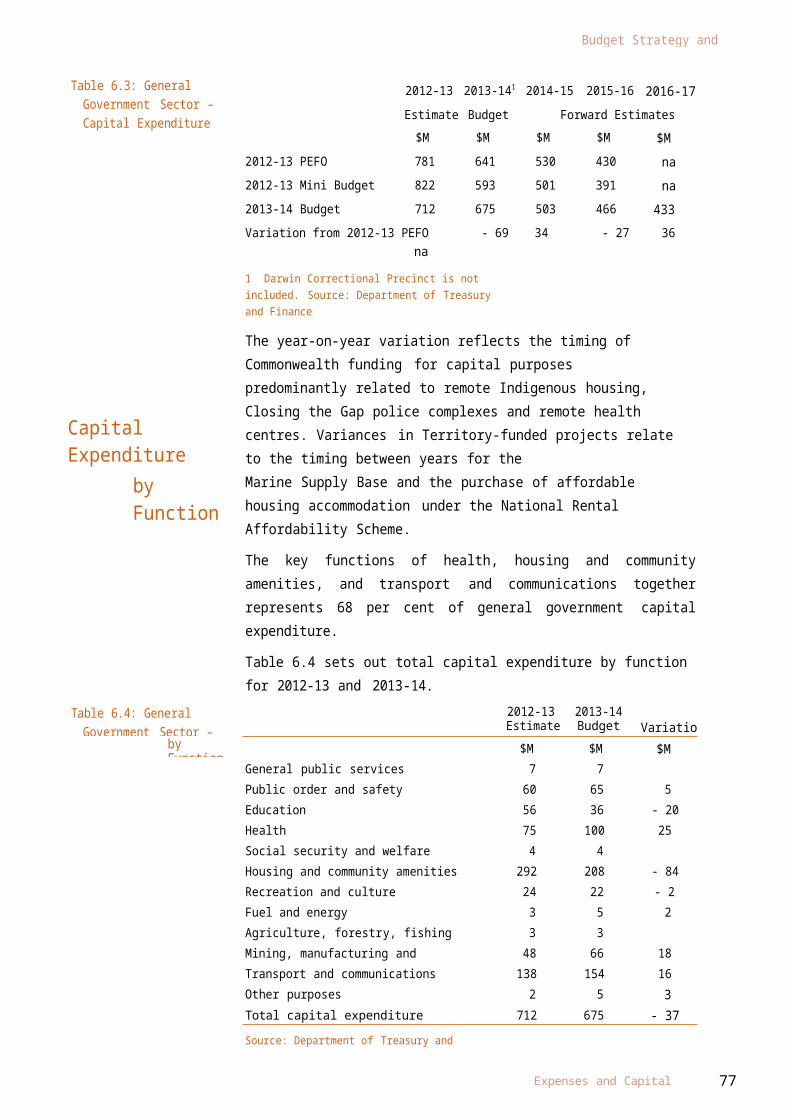
Budget Strategy and Outlook
113Territory Taxes and Royalties
$21.6 million, which includes the long-term growth rate that has been applied to the forward estimates of 2.5 per cent per annum.
Motor vehicle registrations comprise heavy vehicle and light vehicle registrations. Heavy vehicle registration fees are determined by the Standing Council on Transport and Infrastructure. Light vehicle registration fees are determined by each state. In the Territory, the light vehicle fee is calculated by reference to a differential rate scale based on the engine capacity of the vehicle. In 2012-13, the Territory is forecast to receive $36.0 million in motor vehicle registration fees, increasing to $42.4 million in 2013-14. The increase in 2013-14 revenue reflects the full-year effect of increases to light vehicle registration fees as part of the 2012 Mini Budget, long-term growth rates plus the expected consumer price index adjustments to light vehicle registration fees as these fees are expressed in revenue units that are indexed annually.
Gambling TaxesGambling taxes constitute a significant, although reducing, proportion of state revenues. In 2013-14, gambling tax revenue is forecast to be $53.2 million, or the fourth largest contributor to own-source revenue. The components of gambling taxes in the Territory are community gaming machine tax, lotteries tax, wagering tax, bookmaker turnover tax, casino/internet tax and the community benefit levy.
In 2012-13, the Territory is estimated to receive $51.7 million in gambling taxes, which is in line with the PEFO forecast.
Table 8.4 shows the estimated revenue from each of the Territory’s gambling taxes.
Table 8.4: Estimated Revenue from Gambling Taxes Tax/Duty
2012-13Estimate
2013-14Budget
$000 $000Wagering taxes 3 974 3 855
Casino/internet tax 10 919 11 192
Bookmakers – racing and sports betting 2 702 2 781
Community gaming machines 17 001 17 851
Lotteries 14 935 15 309
Community benefit levy 2 214 2 214
Total 51 746 53 202
Source: Department of Treasury and Finance; Department of the Attorney General and Justice
In 2013-14, bookmaker tax is expected to remain largely constant, increasing slightly to reflect the increase in the tax threshold from $262 500 to $267 500 as a result of the increase in the value of revenue units from 1 July 2013.
Lotteries tax for 2013-14 is expected to increase reflecting the growth rates of 2.5 per cent used in the forward estimates. Similarly, casino and community gaming machine taxes are expected to record moderate growth.
Wagering taxes are expected to moderate as consumers continue to switch from betting with totalisators to utilising fixed-odds betting services provided by TABs and corporate bookmakers.
2013-14 Budget
114 Territory Taxes and Royalties
Interstate Tax Comparison
Revenue Effort
Table 8.5: 2011-12 Revenue Effort
by Jurisdiction
Revenue Capacity
The composition of state taxes is broadly similar between the states, however there are differences in the application of particular taxes. These differences primarily relate to rates, exemptions and thresholds. The ability of states to modify their rates and tax base promotes competition between states and provides the autonomy and capacity to structure their tax system to accommodate their specific fiscal, economic and social circumstances.
Various approaches to measuring tax competitiveness can be adopted. Two common approaches are the Commonwealth Grants Commission (CGC) measures of taxation effort and capacity, and the representative taxpayer model.
Commonwealth Grants CommissionThe CGC assesses each state’s revenue-raising effort on an annual basis. Revenue effort is the ratio of the actual amount of revenue a state raises to the amount of tax revenue the CGC assesses could be raised if the state applied the average tax rates to its tax base.
Average revenue effort is assumed to be 100 per cent. A state with an above average revenue effort will score more than 100 per cent, while a below average effort scores less than 100 per cent.
Table 8.5 provides a comparison of CGC’s assessment of own-source revenue-raising effort in 2011-12 (the latest year that an assessment is available). The total own-source revenue figure includes taxation, mining revenue, contributions by trading enterprises and public safety user charges. The table shows that the Territory’s own-source revenue-raising effort is the second lowest of the states behind Tasmania and is significantly below the national average of 100 per cent, with the taxation effort of the Territory being the lowest of all the states.
NSW Vic Qld WA SA Tas ACT NT
% % % % % % % %Total taxation 106 102 87 94 114 90 106 78
Total own-source revenue 94 99 115 89 108 82 153 86
Source: Commonwealth Grants Commission 2013 Update
The Territory’s low total taxation and own-source revenue effort largely reflects the position adopted by the Territory not to impose a land tax.
States are constrained from growing their own-source revenues by either replacing current taxes with a new growth tax or by expanding existing tax bases. This is evident as nationally, state own-source revenue comprises only about 50 per cent of total state revenue. However, the Territory’s taxation and royalty own-source revenue is much lower, comprising about 13 per cent of total revenue.
The revenue limitations imposed on the states are the result of the Australian Constitution and Commonwealth-state financial relations. For instance, states are unable to raise excise and customs duties and the Commonwealth has long assumed the collection of income tax.
In addition, state taxation policy provides a balance between raising sufficient revenue to deliver government services, minimising the tax burden
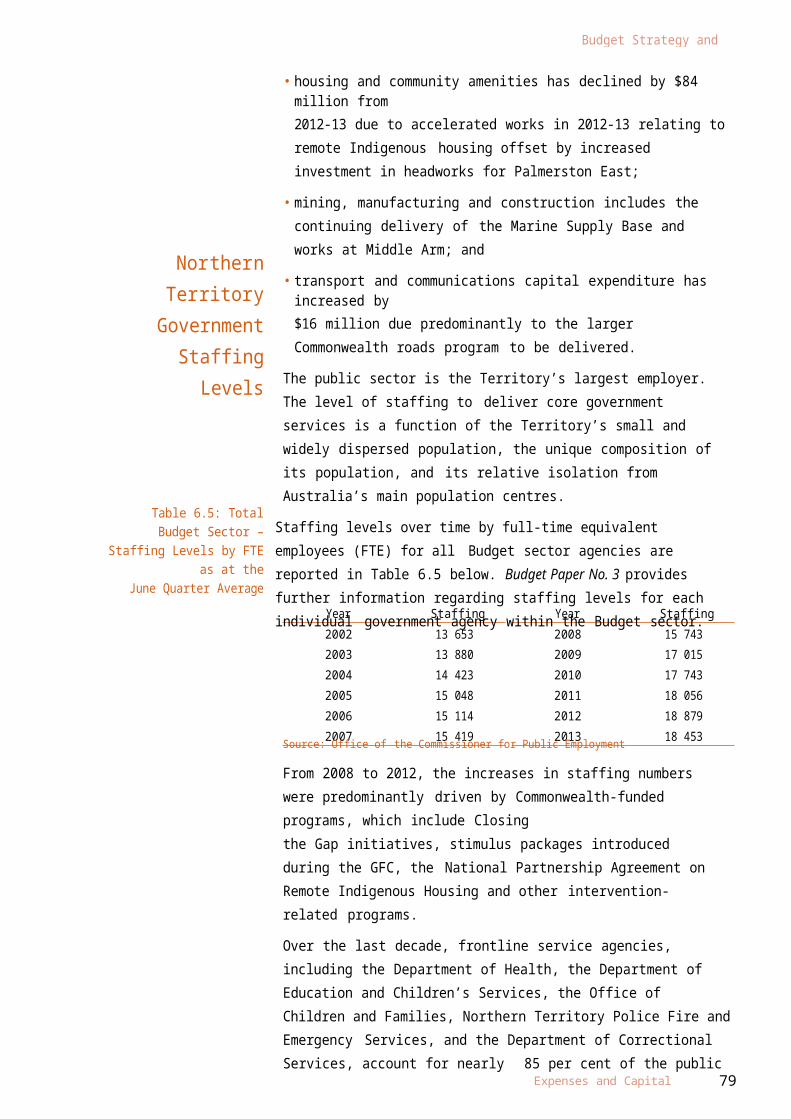
% % % % % % % %Payroll tax 102 97 95 138 75 65 101 84
Land tax 101 103 101 133 64 49 59 70
Conveyance duty 115 103 86 109 64 55 108 72
Insurance duty 108 97 95 96 107 78 83 85
Motor vehicle duty 88 103 104 125 99 102 85 92
Total taxation 102 100 96 121 81 73 95 84
Mining revenue 48 5 134 486 42 28 0 109
Budget Strategy and Outlook
115Territory Taxes and Royalties
Table 8.6: Assessed Revenue-
Raising Capacity,2011-12
on the community, fostering business development and creating a tax environment that is competitive with other jurisdictions.
Although all states face similar constraints in raising own-source revenue, the Territory’s capacity to raise revenue is further weakened by its relatively small revenue base. This is illustrated in Table 8.6, which shows the CGC’s assessed revenue-raising capacity for the major taxes and mining revenue. Revenue capacity is the ratio of the per capita amount a state could raise if it applied the national average policy to its tax base, compared to the per capita average revenue raised on the national tax base. This measure removes differences in state policies.
NSW Vic Qld WA SA Tas ACT NT
Source: Commonwealth Grants Commission 2013 Update
For all the major state taxes, the Territory is assessed as having a relatively low capacity to raise revenue, with all categories, especially land tax, conveyance duty and payroll tax, each significantly below the national average of 100 per cent. This reflects the Territory’s different circumstances such as:
• the Territory’s industry structure, which is characterised by a large proportion of small and medium-sized businesses that are generally exempt from payroll tax; and
• a relatively small number of very high value commercial and residential properties, although average land prices in the Territory are higher than the national average.
The Territory is compensated for its relatively small own-source revenue base by the CGC’s equalisation process through a higher share of goods and services tax (GST) revenue. The Territory’s low capacity to raise own-source revenue increases its reliance on funding from the Commonwealth.
Representative Taxpayer ModelComparisons can also be made of states’ tax schemes by comparing the amount of tax payable by a representative household or firm. This approach takes into account the different circumstances of each state by applying each state’s tax rate to a representative or average standard.

2013-14 Budget
116 Territory Taxes and Royalties
Payroll Tax
Table 8.7: State and Territory Payroll Tax
Rates and Annual Thresholds
Table 8.8: Effective State and Territory Payroll Tax Rates at Various Wages
Levels
Stamp Duty on Conveyance
s
Table 8.7 compares the payroll tax rates and thresholds for each jurisdiction. The table shows that the Territory’s payroll tax annual threshold is the second highest in Australia and its payroll tax rate is equal to the national average.
NSW Vic Qld1 WA SA Tas ACT NT2 Average
Threshold ($M) 0.69 0.55 1.10 0.75 0.60 1.01 1.75 1.50 0.99Rate (%) 5.45 4.90 4.75 5.50 4.95 6.10 6.85 5.50 5.50
1 Queensland’s threshold reduces as an employer’s wages increase, so that no exemption is provided for employers with wages over $5 million.
2 The Territory’s threshold reduces as an employer’s wages increase, so that no exemption is provided for employers with wages over $7.5 million.
Source: State legislation and information available at 30 March 2013
Table 8.8 provides the effective payroll tax rate at various wage levels for each jurisdiction after considering individual state thresholds and the payroll tax rates. For businesses with wages below $5 million, the Territory has a very competitive payroll tax scheme as it has an effective tax rate that is below the national average. For larger businesses with wage costs of $10 million or more, the Territory has a more favourable effective payroll tax rate than the Australian Capital Territory and is reasonably comparable to Western Australia and New South Wales.
NSW Vic Qld WA SA Tas ACT NT Average
$M % % % % % % % % %1 1.75 2.21 0.00 1.38 1.98 0.00 0.00 0.00 0.91
2 3.60 3.55 2.67 3.44 3.47 3.02 0.86 1.72 2.79
3 4.22 4.00 3.76 4.13 3.96 4.05 2.85 3.44 3.80
4 4.53 4.23 4.30 4.47 4.21 4.56 3.85 4.30 4.31
5 4.71 4.36 4.63 4.68 4.36 4.87 4.45 4.81 4.61
10 5.08 4.63 4.75 5.09 4.65 5.48 5.65 5.50 5.10
20 5.27 4.77 4.75 5.29 4.80 5.79 6.25 5.50 5.30
Source: State legislation and information available at 2 April 2013
Non-first homebuyers receive a rebate of $7000 on the purchase of a new home to be used as a principal place of residence, which is equivalent to a stamp duty concession on around the first $231 500 of the value of the residence.
In addition, seniors and Northern Territory Pensioner and Carer Concession cardholders receive a concession of $8500 on the purchase of a principal place of residence for property values up to $750 000. This is equivalent to a stamp duty concession on the first $252 970 of the value of the residence.
It is difficult to compare stamp duty on houses in each state, given the significant variation in median house prices. Chart 8.2 shows that Darwin has the second highest median house price behind Sydney.
Budget Strategy and Outlook
117Territory Taxes and Royalties
Chart 8.2: Median House Prices
Chart 8.3: Stamp Duty Payable on Purchase of Territory Median
Priced New House
Insurance Duty
Note: Median house prices as at December 2012. Source: Real Estate Institute of Australia
However, one method is to compare the stamp duty that would be payable in each state for similarly priced housing. Chart 8.3 provides an interjurisdictional comparison of the amount of stamp duty levied on new principal places of residences valued at the median house price in the Territory ($578 000). It indicates that stamp duty in the Territory on the reference property is slightly lower than the national average.
Note: Median house prices as at December 2012.Source: Real Estate Institute of Australia; state legislation and information available at 2 April 2012
As shown in Chart 8.4, the Territory is an average taxing jurisdiction for insurance. By comparison, the total tax load on insurance in New South Wales, Tasmania and Victoria is significantly above the national average when fire services levies are taken into account.
All states impose taxes on general insurance premiums at rates between7.5 per cent and 11 per cent, with New South Wales, Queensland and Tasmania having special rates on particular classes of general insurance business. All states apart from Western Australia also impose taxes on life insurance policies at different rates. In addition, New South Wales, Tasmania and Victoria collect a portion of their fire services levies through a charge on insurers, although Victoria will cease doing so from 1 July 2013. While Tasmania raises a levy on insurance, similar to Queensland, South Australia and Western Australia, a large proportion of the levy is sourced from a
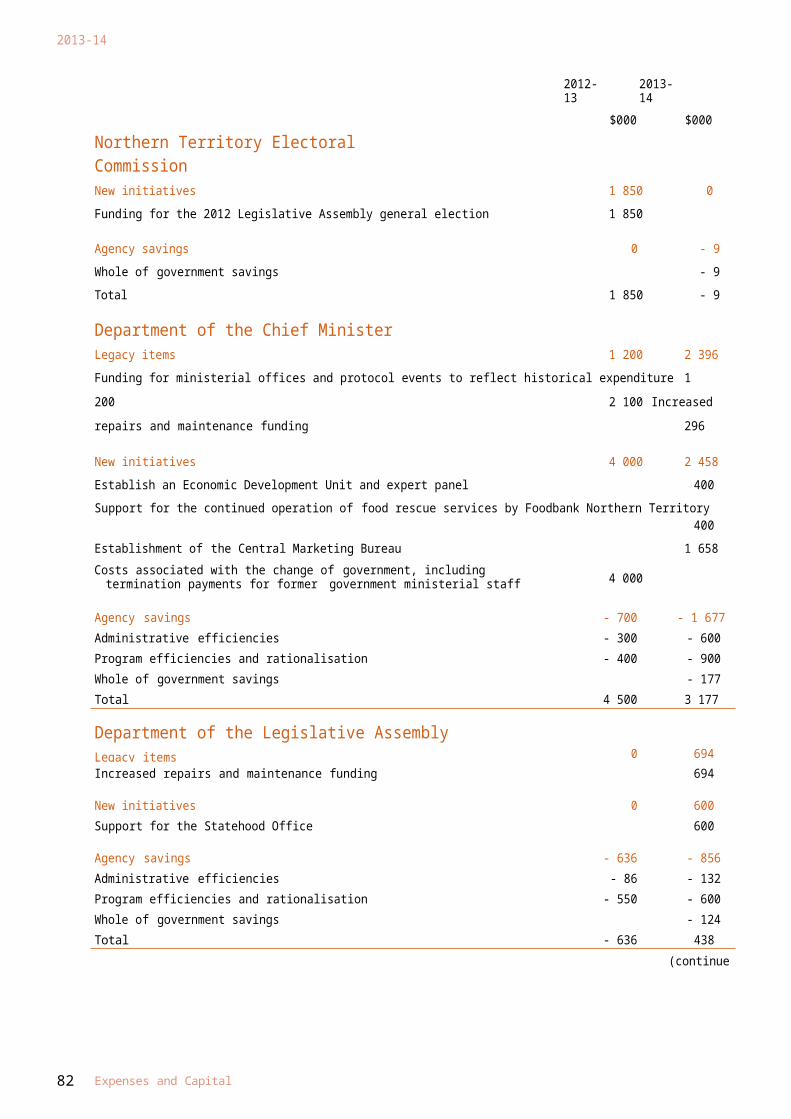
2013-14 Budget
118 Territory Taxes and Royalties
Chart 8.4: Average State Tax Rate on General Insurance
Premiums
Stamp Duty on MotorVehicles
Chart 8.5: Stamp Duty on Purchase of $39
990Motor Vehicle
Motor Vehicle Registration
charge on property owners through local councils. The Territory does not impose any emergency or fire services levies on the general public, although, like the states, it does charge for commercial fire alarm monitoring.
Source: State legislation and information available at 2 April 2013
Chart 8.5 compares the stamp duty applicable for a new motor vehicle valued at $39 990. The chart shows that the stamp duty payable in the Territory is below the national average and the equal second lowest in Australia.
Source: State legislation and information available at 2 April 2013
Motor vehicle registration fees comprise registration, compulsory third-party insurance and other fees and, as such, vary significantly between jurisdictions. Chart 8.6 compares the costs of registering a medium-sized passenger vehicle in each jurisdiction. At $680.40, the Territory has the third-lowest total registration cost in Australia.
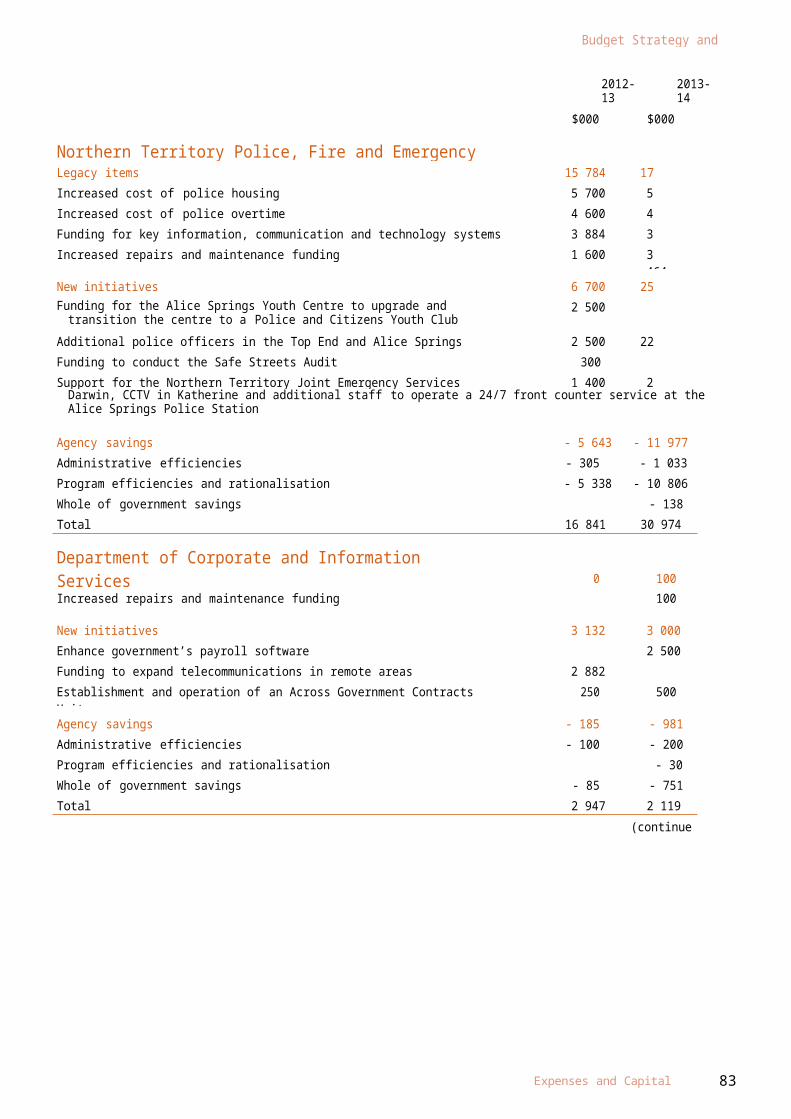
Budget Strategy and Outlook
119Territory Taxes and Royalties
Chart 8.6: Annual Registration Fees and Charges for a Medium-Sized Passenger
Vehicle
Land Revenue
Note: Based on six-cylinder, 2013 Holden Commodore Omega. Source: State legislation and information available at 2 April 2013
The slightly higher than average compulsory third-party premiums in the Territory reflect the inherently higher costs associated with third-party insurance due to the small size of the Territory and relatively high road accident casualties. Motor Accident Compensation scheme premiums aim to ensure that likely compensation claims for the upcoming year can be met and that the scheme maintains a prudent solvency margin.
However, total registration costs in the Territory are the third lowest in Australia and significantly below the national average due to the reasonably low registration fees and the fact that the Territory does not, unlike some jurisdictions, also add ancillary taxes and levies. These additional levies imposed in other jurisdictions include fire and emergency service levies, motor taxes, traffic improvement levies and road safety contributions.
This category includes taxes on the ownership of land, where the tax is based on the assessed unimproved value of the land. It also includes any metropolitan land planning, development and fire and emergency services levies that are included in the land tax base of some states.
Land tax is an important source of income for states, estimated to generate over $6.5 billion in revenue in 2013-14. Land tax is levied on the landowner’s total holdings of commercial land and investment residential property, although generally an exclusion is provided for land used for primary production. Land tax rates are generally progressive and most jurisdictions have tax-free thresholds.
The Territory does not impose a land tax. However, in its 2013 Update, the CGC assessed that the Territory could raise about $44.6 million if it adopted the average state policies on land tax.
Tax Expenditure StatementTax concessions are often provided to benefit a specified activity or class of taxpayer. They are expenditures in the sense that their impact on the budget is similar to direct outlays and can be used to achieve similar goals to grant programs.
Tax expenditure can be provided in a variety of ways, including by way of exemption, deduction, rebate or a concessionary tax rate.
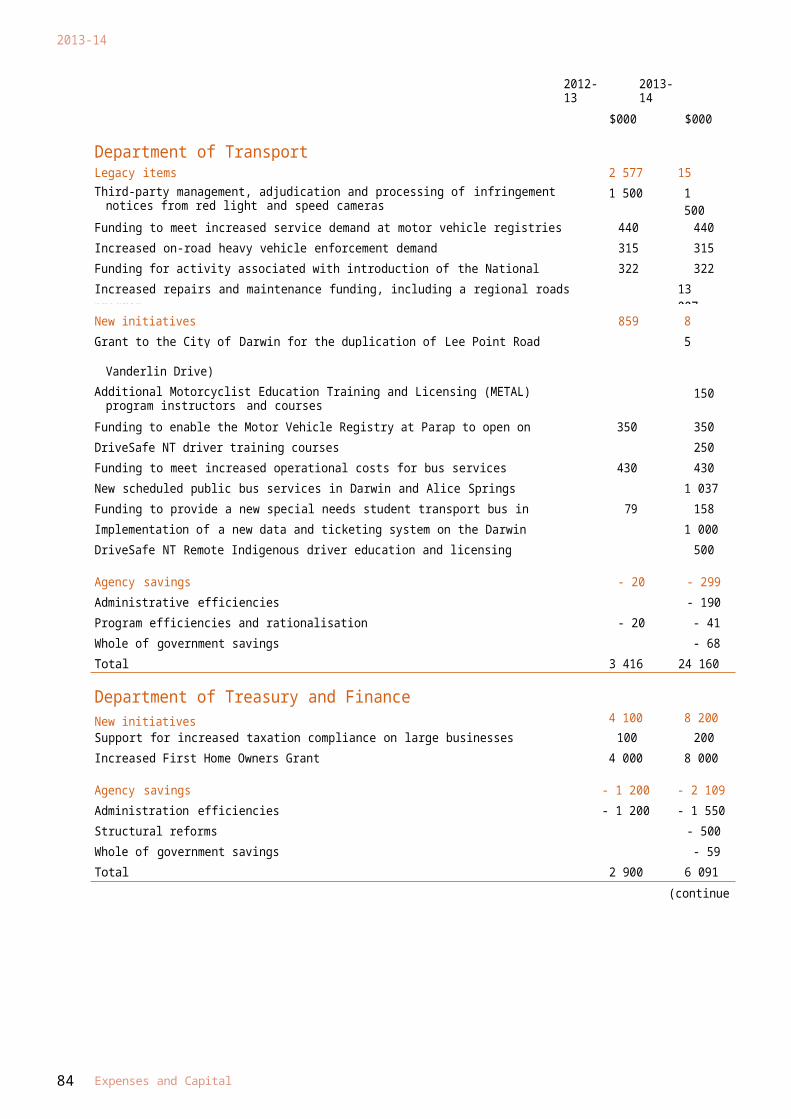
2013-14 Budget
120 Territory Taxes and Royalties
Methodology
Table 8.9: Payroll Tax Expenditure
The tax expenditure statement details revenue estimated to be forgone by the Government or financial benefits obtained by taxpayers as a result of tax exemptions or concessions provided by the Government. Identifying this expenditure assists in providing a more accurate picture of the Government’s contributions by way of taxation concessions to assist various groups or industries.
The tax expenditure identified in this statement relates to the more important and material concessions available in the Territory. In accordance with the Fiscal Integrity and Transparency Act, the tax expenditure statement provides an estimate of expenditure in 2012-13 and forecast information for 2013-14 and the following three financial years.
Tax expenditure has been estimated by applying the benchmark rate of taxation to the forecast volume of activities or assets exempted by a particular concession. Only future events that are certain or highly likely to impact on assumed tax bases or tax rates have been taken into consideration in estimating future tax expenditure. Otherwise, existing taxation arrangements have been assumed to apply for future years.
Measuring tax expenditure requires the identification of:
• a benchmark tax base;
• concessionary taxed components of the benchmark tax base, such as specific activity or class of taxpayer; and
• a benchmark tax rate to apply to the concessionary taxed components of the tax base.
The establishment of a benchmark tax base provides a basis against which each tax concession can be evaluated. The aim of the benchmark is to determine which concessions are tax expenditure rather than structural elements of the tax.
By definition, tax expenditure comprises those tax concessions not included as part of the benchmark tax base.
Payroll TaxThe benchmark tax base for payroll tax is assumed to be all wages (as defined under the payroll tax legislation) paid in the Territory. The benchmark tax rate is 5.5 per cent.
2012-13 2013-14 2014-15 2015-16 2016-17
Tax expenditure ($M) 145.3 153.8 163.3 173.2 184.6
Source: Department of Treasury and Finance
As data is not generally collected from employers that do not have a payroll tax liability, tax expenditure in relation to many payroll tax concessions is difficult to estimate. Accordingly, the reported estimated tax expenditure outlined in Table 8.9 has been derived by adding recorded tax concessions to a figure derived by comparing ATO data about wages paid by employers in the Territory to data reported by employers registered for payroll tax in the Territory. The difference provides a reasonable estimate of wages paid by non-registered employers that are not subject to Territory payroll tax because of the small business exclusion (detailed below).
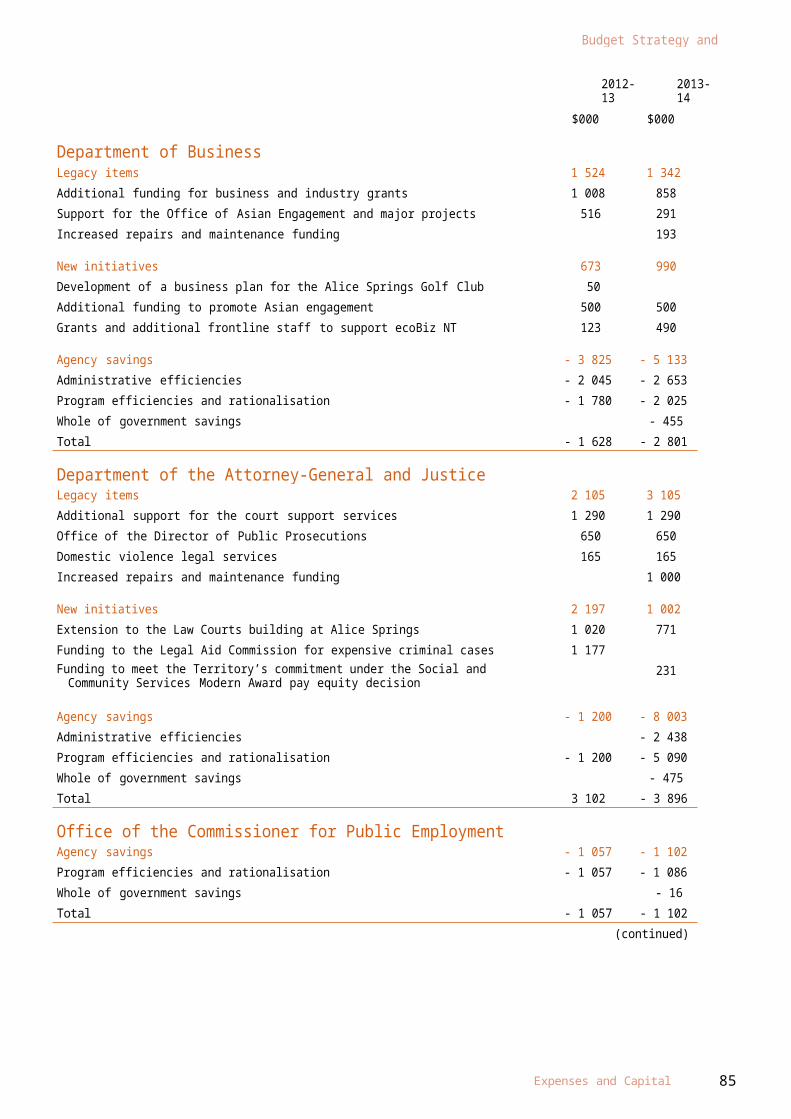
Budget Strategy and Outlook
121Territory Taxes and Royalties
Small Business Exclusion
Charities and Other Exempt Bodies
Apprentices, Graduatesand Others
Other Minor Exemptions
Table 8.10: Stamp Duty on Conveyances Expenditure
Corporate ReconstructionsExemption
First HomeownerConcession
The reported estimated tax expenditure in relation to payroll tax mainly comprises the following exemptions.
Employers with wages below $1.5 million are not required to pay tax, a saving of up to $82 500. Employers with payrolls exceeding $1.5 million receive a deduction of up to $1.5 million, which reduces by $1 for every $4 in wages paid by the employer where the wages paid by the employer exceeds $1.5 million. This means employers with wages of $7.5 million or more will not receive a deduction and will pay tax on the total wages paid by the employer.
Non-profit organisations having a sole or dominant purpose that is charitable, benevolent, philanthropic or patriotic, are exempt from payroll tax to the extent that wages are paid for an employee’s services that relate directly to the purpose for which the organisation was established. In addition, employment agencies providing temporary staff to exempt organisations are able to claim payroll tax exemption for these wages.
Businesses receive payroll tax exemptions for apprentices, graduates of approved tertiary institutions and employees receiving wages funded under the Community Development Employment Projects program.
From 1 July 2009, several new exemptions were introduced as part of national payroll tax harmonisation:
• wages paid to employees participating in voluntary work for bushfires and emergency relief; and
• wages paid as paternity, maternity and adoption leave for a maximum of 14 weeks.
Stamp Duty on ConveyancesThe benchmark tax base is assumed to be sales of all dutiable property, including chattels that are part of a transaction that conveys other dutiable property. The benchmark tax scale is the currently applicable stamp duty scale.
2012-13 2013-14 2014-15 2015-16 2016-17
Tax expenditure ($M) 26.1 14.0 14.7 15.1 17.2
Source: Department of Treasury and Finance
Tax expenditure estimates in Table 8.10 are based on a historical revenue base indexed by normal growth parameters and mainly comprise the following concessions.
Corporate groups formed by commonly owned corporations are able to reorganise the ownership of assets without incurring a stamp duty liability. The estimated tax expenditure is the actual stamp duty foregone for approved reconstruction exemptions.
First homebuyers were, until 4 December 2012, eligible for a stamp duty concession on the first $540 000 of the value of a home, a saving of up to $26 730. Tax expenditure in 2012-13 is calculated by actual collections in relation to the concession.
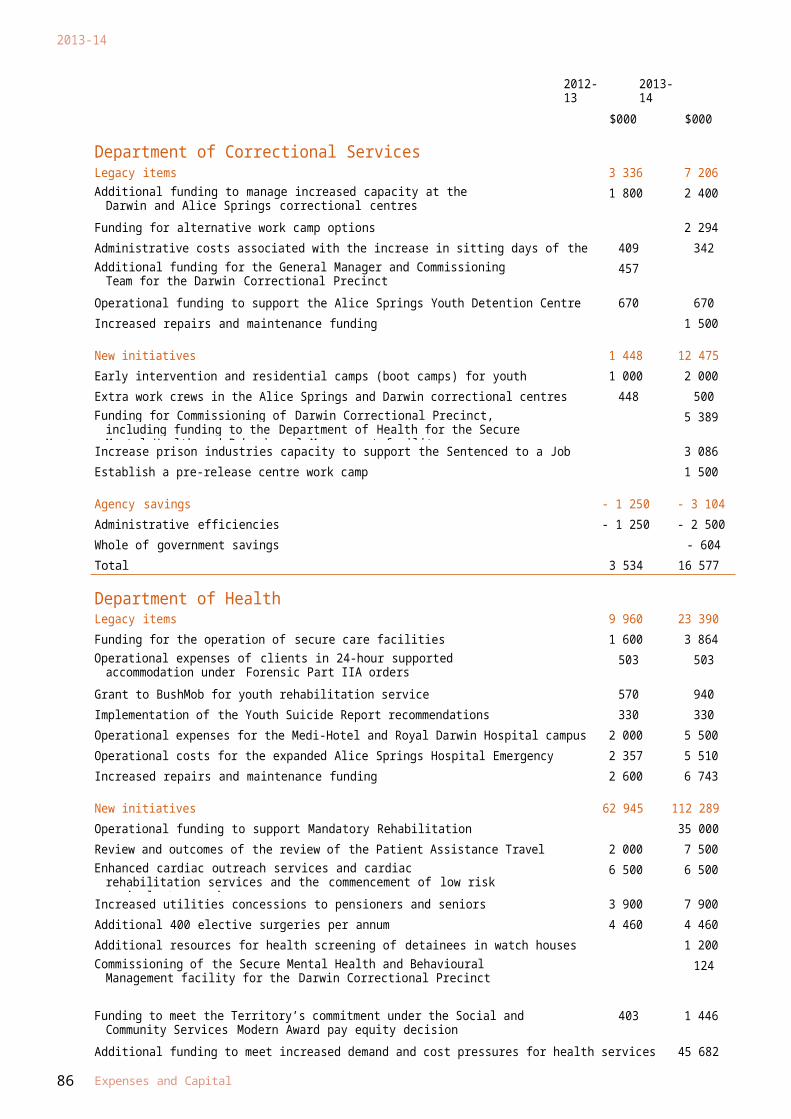
2013-14 Budget
122 Territory Taxes and Royalties
Principal Place of Residence Rebate
Seniors, Pensioner and Carers Concession
Other Conveyance Duty Exemptions
Table 8.11: Stamp Duty on General Insurance
Until 4 December 2012, other homebuyers were entitled to a rebate of $3500 when purchasing a principal place of residence. From 4 December 2012, that rebate was increased to $7000 but limited to the purchase of new homes only. Tax expenditure is estimated by actual collections in relation to the rebate.
A concession of $8500 is provided for seniors (aged 60 years and over) and Northern Territory Pensioner and Carers Concession cardholders when purchasing a principal place of residence up to the value of $750 000. Tax expenditure is estimated by actual collections in relation to the rebate.
Several other conveyance stamp duty exemptions are provided that together result in significant revenue being foregone by the Territory, the largest of these being exemptions for:
• property transferred to charitable organisations having a sole or dominant purpose that is charitable, benevolent, philanthropic or patriotic;
• the transfer of a company’s property, on its winding up, to a shareholder of the company entitled to the property on a distribution in-kind;
• an exemption under the Commonwealth Family Law Act for instruments made pursuant to a court order that alter the interests of the parties to a marriage or de facto partnership; and
• the conveyance of property between partners of a de facto relationship on the breakdown of the relationship.
The estimated tax expenditure for these concessions is based on actual historical data collected in relation to the various exemptions that have been granted and how these relate to overall conveyance stamp duty collections.
Stamp Duty on General Insurance PoliciesThe benchmark tax base is all classes of general insurance policies. This does not include life insurance policies, which are treated differently for stamp duty purposes. The benchmark tax rate is 10 per cent of the premium.
2012-13 2013-14 2014-15 2015-16 2016-17
Tax expenditure ($M) 20.6 21.4 22.2 23.1 23.7
Source: Department of Treasury and Finance
The Territory provides stamp duty concessions on certain insurance products to reduce the costs of such insurance, namely workers compensation insurance and private health insurance. Tax expenditure outlined in Table 8.11 has been estimated using total work health insurance policy premiums paid during past years compared to total payroll data of employers in the Territory and data on private health insurance premiums obtained from the Private Health Insurance Administration Council.

Budget Strategy and Outlook
123Territory Taxes and Royalties
Table 8.12: Motor Vehicle Registration Fees Expenditure
Table 8.13: Mineral Royalties
Expenditure
Motor Vehicle Registration FeesMotor vehicle registration concessions are available to Northern Territory Pensioner and Carer Concession or Northern Territory Seniors cardholders. Table 8.12 shows the motor vehicle registration fees expenditure. Actual registration fee data has been used to estimate this item of tax expenditure.
2012-13 2013-14 2014-15 2015-16 2016-17
Tax expenditure ($M) 2.2 2.2 2.2 2.2 2.2
Source: Department of Treasury and Finance
Mineral RoyaltiesThe benchmark tax base is assumed to be all profitable mining operations in the Territory and the benchmark tax rate is 20 per cent.
2011-12 2012-13 2013-14 2014-15 2015-16
Tax expenditure ($M) 0.9 0.9 0.9 0.9 0.9
Source: Department of Treasury and Finance
The first $50 000 of profit is not subject to royalty and royalty payers are able to reduce the amount of royalty they pay in the Territory for eligible exploration expenditure (EEE) incurred in their mining operations in the Territory. However, the amount by which royalty may be reduced through the use of EEE is limited to a maximum of 25 per cent of the amount that would otherwise be payable.
The estimated cost of this concession as outlined in Table 8.13 is based on projected future mineral royalty collections, assuming that royalty payers will seek to maximise their royalty deduction by using EEE.
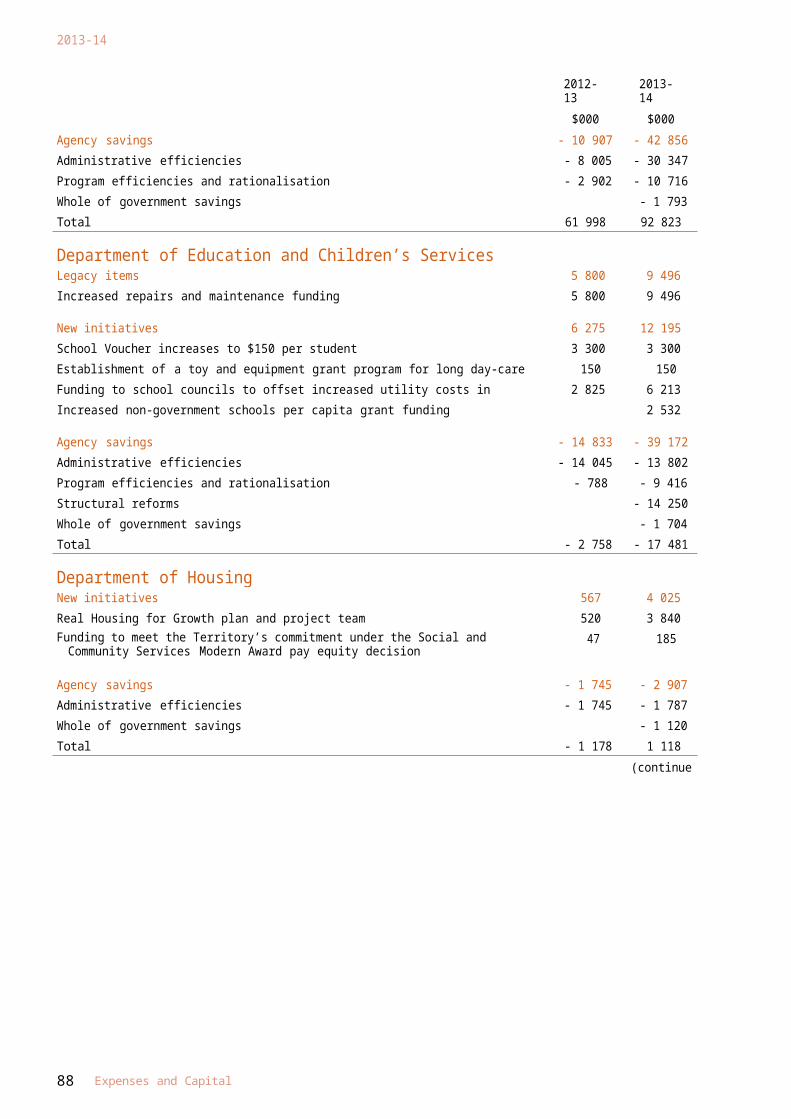
122
2013-14 Budget
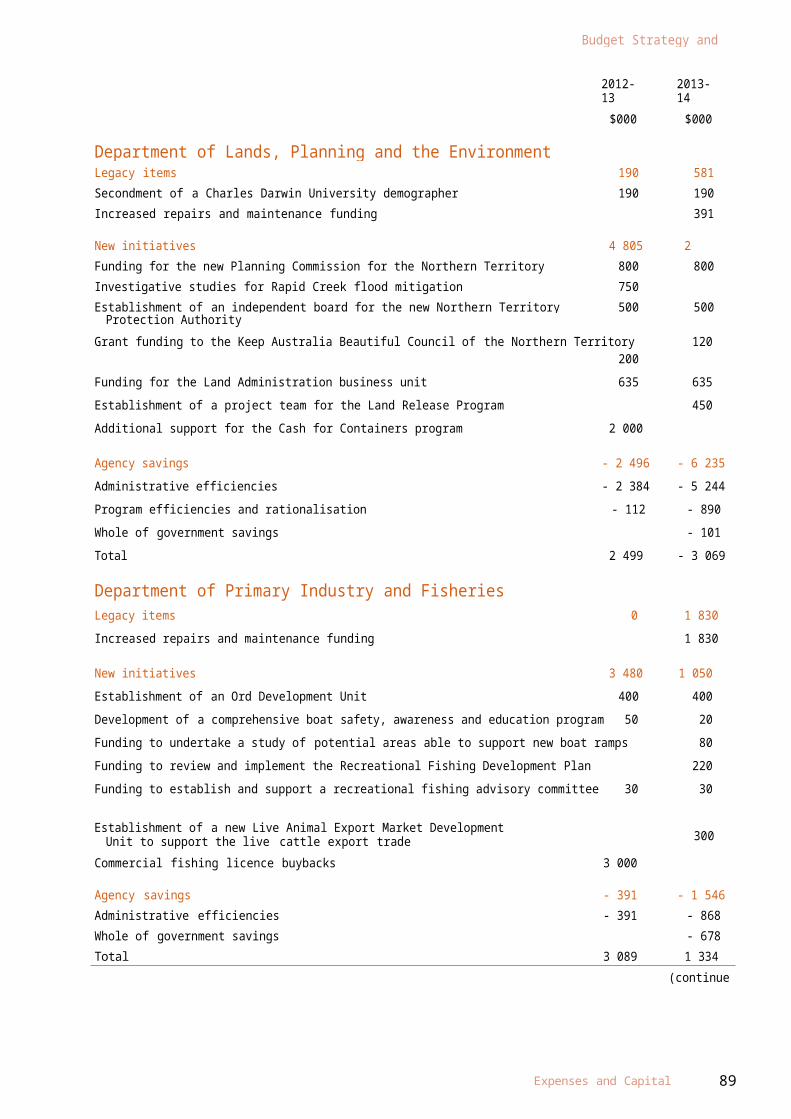
Appendices
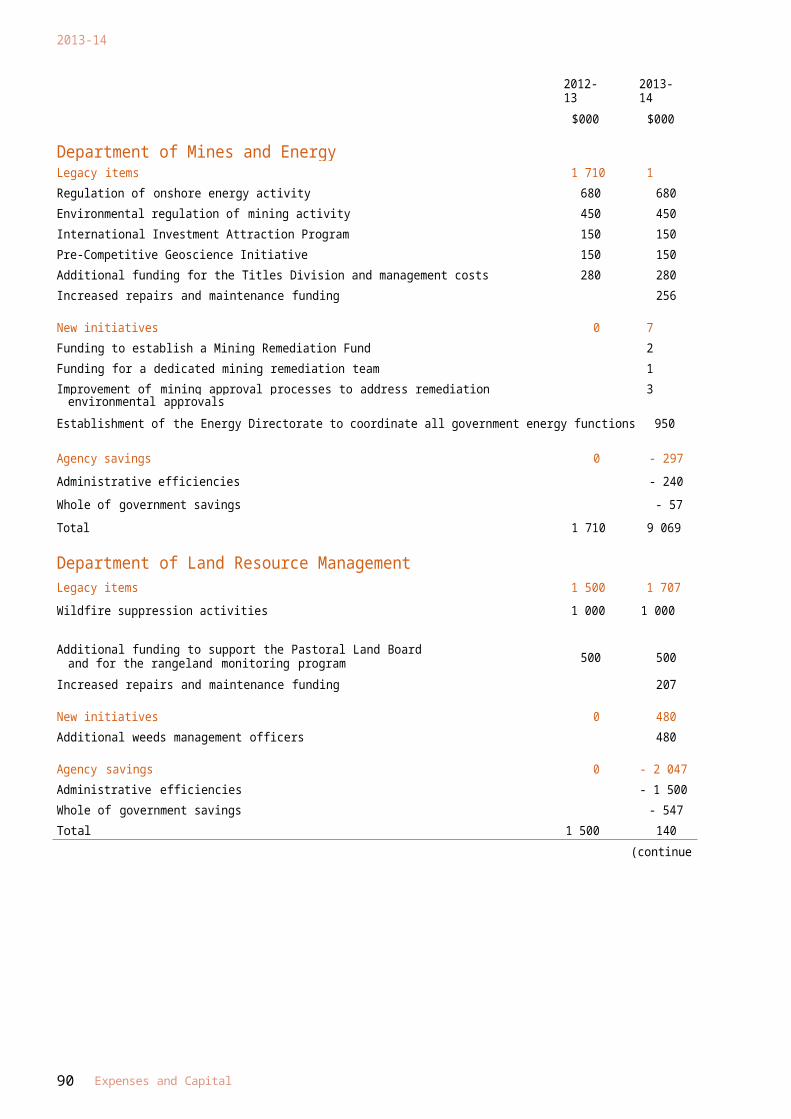
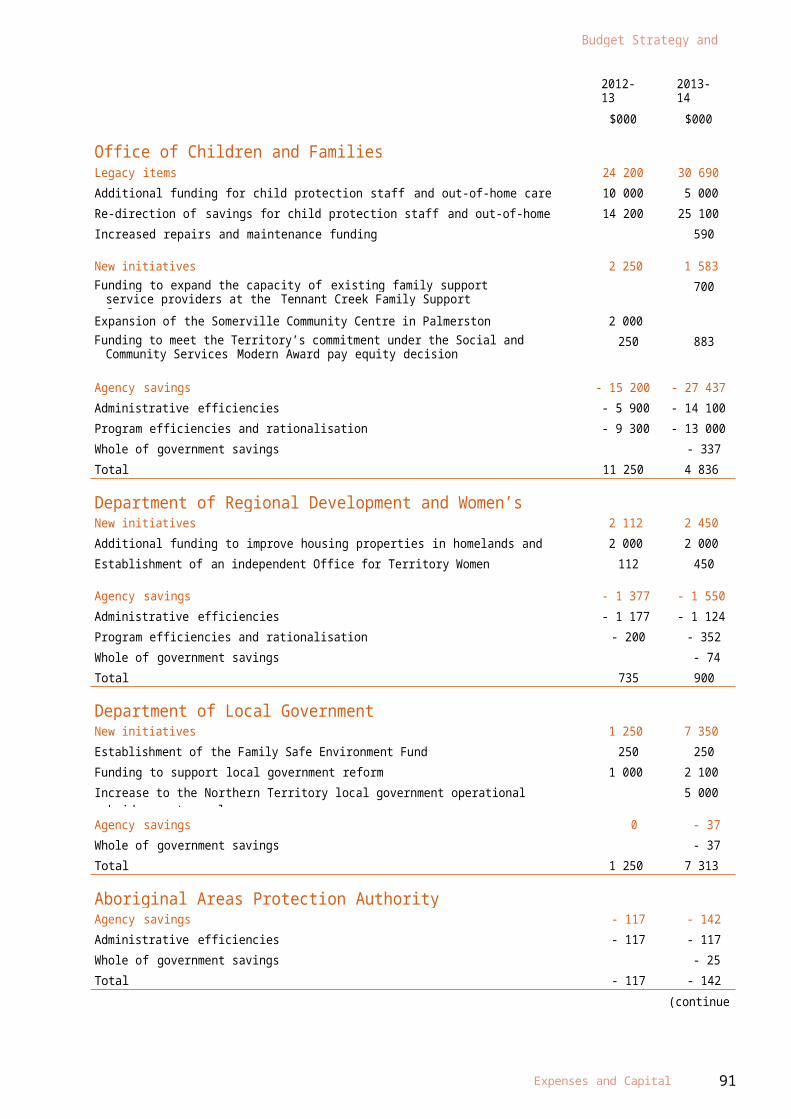
Budget Strategy and Outlook
Appendix A Classification of Entities in the Northern TerritoryTotal Public Sector
Non Financial Public SectorGeneral GovernmentAboriginal Areas Protection Authority Auditor-General’s OfficeAustralAsia Railway Corporation1
Batchelor Institute of Indigenous Tertiary Education1
Central Australian Health and Hospital Services Central Holding AuthorityConstruction Division2
Darwin Waterfront Corporation1
Data Centre Services2
Department of Arts and MuseumsDepartment of the Attorney-General and Justice Department of BusinessDepartment of the Chief MinisterDepartment of Corporate and Information Services Department of Correctional ServicesDepartment of Education and Children’s Services Department of HealthDepartment of Housing Department of InfrastructureDepartment of Land Resource Management Department of Lands, Planning and the Environment Department of the Legislative Assembly Department of Local GovernmentDepartment of Mines and Energy Department of Primary Industry and FisheriesDepartment of Regional Development and Women’s Policy Department of Sport and RecreationDepartment of Transport Department of Treasury and Finance Desert Knowledge Australia1
Government Printing Office2
Nominal Insurer’s Fund1
Northern Territory Electoral Commission Northern Territory Legal Aid Commission1
Northern Territory Major Events Company Pty Ltd1
Northern Territory Police, Fire and Emergency Services NT Build Statutory Corporation1
NT Fleet2
NT Home Ownership2
Office of Children and FamiliesOffice of the Commissioner for Public Employment Ombudsman’s OfficeParks and Wildlife Commission of the Northern Territory Territory Discoveries2
Territory Wildlife Parks2
Top End Health and Hospital ServicesTourism NTPublic Non Financial CorporationsDarwin Bus Service2
Darwin Port Corporation2
Indigenous Essential Services Pty Ltd1
Land Development Corporation2
Power and Water Corporation1,3
Public Financial Corporations Northern Territory Treasury Corporation2
Territory Insurance Office1
1 Non budget sector entity.2 Government business division.
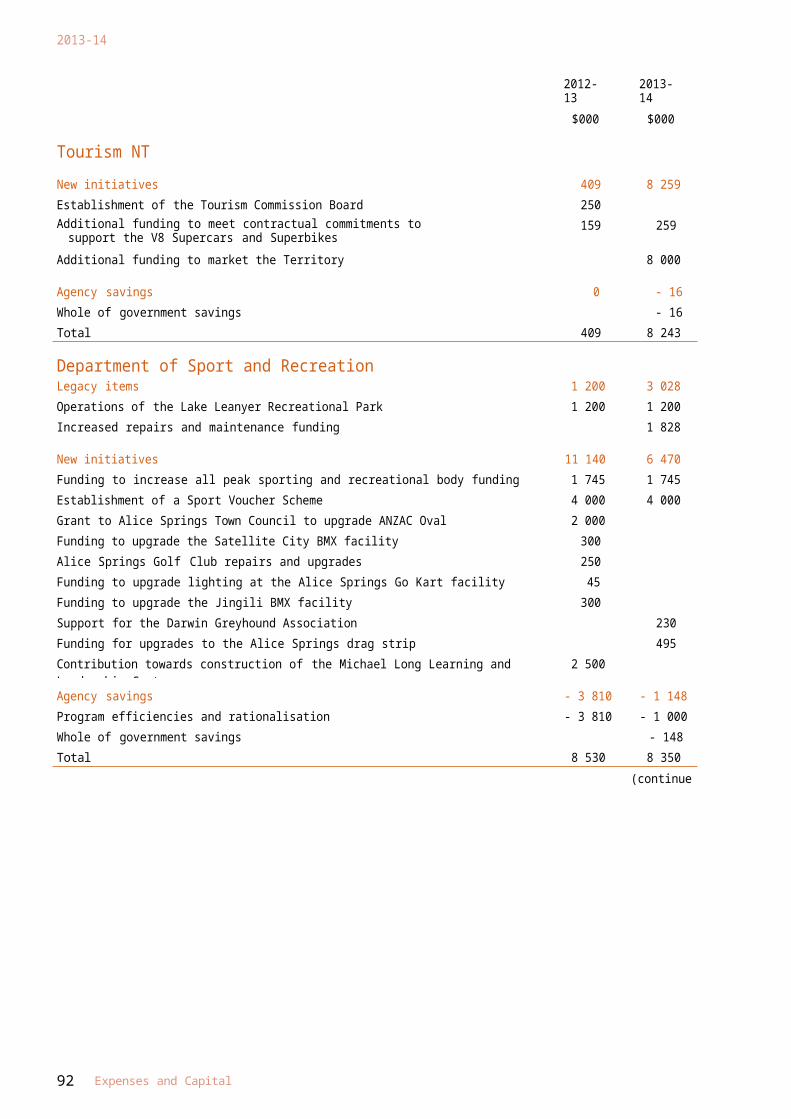
2013-14 Budget3 Government owned corporation.
Appendix A 125
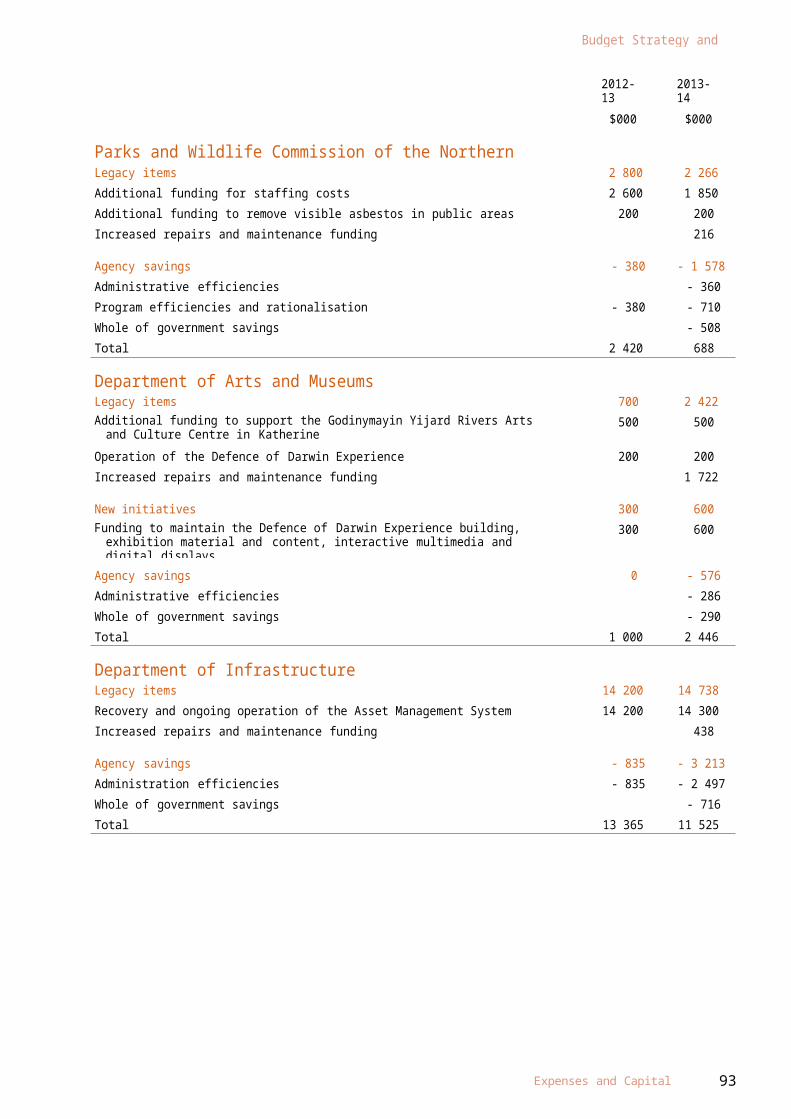
2013-14 Budget
126 Appendix B
Appendix B
Treasurer’s Advance
Known Events
Reserve
Contingency ReserveThe Contingency Reserve is an amount included in expenses (and in some instances revenues) in the forward estimates of the Central Holding Authority, for the sole purpose of ensuring that the forward estimates at the whole of government level are as close as possible to the outcomes expected by the Department of Treasury and Finance based on the continuation of existing policy.
The Contingency Reserve is made up of the following categories:
• Treasurer’s Advance – sets aside funding in each budget to meet operational contingencies that arise during the year;
• the Known Events Reserve – sets aside funding, associated with decisions taken by the Government, that is not yet allocated to agencies; and
• the General Reserve – provides a means by which ‘minor’ parameter (as opposed to policy) variations or rising expenses for existing government programs can be incorporated into the estimates for the avoidance of policy adjustment.
Amounts are removed from the reserve and transferred to specific agencies once their allocation is known or a parameter change or revision eventuates in a no-policy-change estimation.
The actual drawdown of amounts provisioned in the Contingency Reserve, consistent with long-standing practice, is undertaken each budget year at the time of the Budget.
This category of the Contingency Reserve allows for an appropriation purpose of that name, as specified in the Appropriation Act, which provides a pool of funds specifically set aside in each budget to meet one-off operational contingencies that arise during the year.
This category of the Contingency Reserve allows for any approved policy decisions for which the funding cannot yet (or appropriately) be assigned to individual agency programs to nevertheless impact on the aggregate estimates.
The circumstances where such provisions are justified include instances where:
• known decisions are made too late for inclusion in individual agency estimates;
• known decisions where it is decided that appropriation to agencies should not occur until closer to the time that the associated events arise;
• programs for which negotiations are yet to be finalised with the Commonwealth; and
• where prudent or commercial-in-confidence considerations dictate that it is not appropriate to disclose the item individually in agency budgets.

Budget Strategy and Outlook
127Appendix B
General Reserve
This category of the Contingency Reserve is a general provision for ‘minor’ parameter (as opposed to policy) changes and no-policy-change estimation pressures.
This provision is not a general policy reserve in the sense that it does not allow for future policy changes or ‘slippage’. All policy decisions of the Government are to be directly incorporated into agency estimates or (in appropriate circumstances only) included in the Known Events Reserve.
In the Department of Treasury and Finance’s experience, estimating agency expenses associated with continuation of existing policy shows a conservative bias (that is, there is a tendency to underestimate).
Consistent with all other Australian Treasuries, this conservative bias is offset by a provision in the form of the General Reserve, which is a nominated proportion of the aggregate of budget agencies’ total expenses. This reserve forms part of the Contingency Reserve held within the Central Holding Authority.
In the 2013-14 Budget, this provision, to be reset annually, is set at1.5per cent of general government sector operating expenses for the budget year and approximately 1 per cent cumulative for each of the forward estimates years.
128 Appendix C
2013-14 Budget
Appendix C GlossaryAdvances/Advances
PaidLoans acquired for policy rather than liquidity management purposes. Included are long-term and short-term loans, non-marketable debentures and long-term and short-term promissory agreements (bonds and bills) issued to public sector units for achieving government policy objectives.
Agency A unit of government administration, or office or statutory corporation, nominated in an Administrative Arrangements Order for the purposes of the Financial Management Act and including, where the case requires, a part or division (by whatever name called) of an agency.
Australian AccountingStandards
Statements of accounting standards that can be applied in the preparation and presentation of financial statements.
Capital Grants Transactions in which the ownership of an asset (other than cash and inventories) is transferred from one institutional unit to another, in which cash is transferred to enable the recipient to acquire another asset, or in which the funds realised by the disposal of another asset are transferred, for which no economic benefits of equal value are receivable or payable in return.
Cash Surplus/Deficit Reported in the Cash Flow Statement that measures the net impact of cash flows during the period. It equals net cash flows from operating activities plus net cash flows from acquisition and disposal of non financial assets, less distributions paid less value of assets acquired under finance leases and similar arrangements.
Commonwealth Own-Purpose Expenses
Payments by the Commonwealth for goods and services and associated transfer payments for the conduct of its general government activities.
Comprehensive Result The net result of all items of income and expense recognised for the period.It is the aggregate of the operating result and other movements in equity, other than transactions with owners as owners.
Consumer Price Index A general indicator of the prices paid by household consumers for a specific basket of goods and services.
Contingent Liability A potential financial obligation arising out of a condition, situation, guarantee or indemnity, the ultimate effect of which will be confirmed only on the occurrence or non-occurrence of one or more uncertain future events.
Current Grants Amounts payable or receivable for current purposes for which no economic benefits of equal value are receivable or payable in return.
Finance Lease Lease agreements that transfer substantially all the risks and benefits relating to ownership of an asset from the lessor (legal owner) to the lessee (party using the asset).
Budget Strategy and Outlook
129Appendix C
Financial Asset Any asset that is:
• cash;
• an equity instrument of another entity;
• a contractual right:
– to receive cash or another financial asset from another entity; or
– to exchange financial assets or financial liabilities with another entity under conditions that are potentially favourable to the entity; or
• a contract that will or may be settled in the entity’s own equity instruments and is:
– a non-derivative for which the entity is or may be obliged to receive a variable number of the entity’s own equity instruments; or
– a derivative that will or may be settled other than by the exchange of a fixed amount of cash or another financial asset for a fixed number of the entity’s own equity instruments.
For this purpose, the entity’s own equity instruments do not include instruments that are themselves contracts for the future receipt or delivery of the entity’s own equity instruments.
Fiscal Balance Fiscal balance, also referred to as net lending/borrowing, is an operating statement measure that differs from the net operating balance in that it includes spending on capital items but excludes depreciation. A net lending (or fiscal surplus) balance indicates that a government is saving more than enough to finance all its investment spending. A net borrowing (or fiscal deficit) position indicates that a government’s level of investment is greater than its level of savings.
Generally Accepted Accounting Principles
General GovernmentSector
Goods and ServicesTax Revenue
A term used to describe broadly the body of principles that governs the accounting for financial transactions underlying the preparation of a set of financial statements.
Defined in Government Finance Statistics as an entity or group of entities that are mainly engaged in the production of goods and/or services outside the normal market mechanism. Goods and services are provided free of charge or at nominal charges well below costs of production.
On 1 July 2000, the Commonwealth introduced the goods and services tax (GST). Payments from the Commonwealth return the GST revenue to the states and territories, replacing the previous general purpose grants.
Government BusinessDivision
A Territory-controlled trading entity that follows commercial practices and is required to comply with competitive neutrality principles.
2013-14 Budget
130 Appendix C
Government Finance Statistics (GFS)
Government OwnedCorporation
Government PurposeClassification
Refers to statistics that measure the financial transactions of governments and reflect the impact of those transactions on other sectors of the economy. Government Finance Statistics in Australia are developed by the Australian Bureau of Statistics in conjunction with all governments and are mainly based on international statistical standards, developed in consultation with member countries by the International Monetary Fund.
An entity whose objectives are to operate at least as efficiently as any corporate business and maximise sustainable return to government. The Government Owned Corporations Act adopts the shareholder model of corporate governance, and the Power and Water Corporation became the Territory’s first government owned corporation on 1 July 2002.
Classifies outlays or expenditure transactions by the purpose served, for example, health or education.
Grants Transactions in which one unit provides goods, services, assets (or extinguishes a liability) or labour to another unit without receiving approximately equal value in return. Grants can either be of a current or capital nature (see current grants and capital grants).
Grants can be paid as general purpose grants, which refer to grants that are not subject to conditions regarding their use. Alternatively, they may be paid as specific purpose grants, which are paid for a particular purposeand/or have conditions attached regarding their use.
Grants for On-Passing All grants paid to one institutional sector (for example, a state general government) to be passed on to another institutional sector (for example, local government or a non-profit institution).
Gross DomesticProduct
The total value of goods and services produced in Australia over the period for final consumption. Intermediate goods, or those used in the production of other goods, are excluded. Gross domestic product can be calculated by summing total output, total income or total expenditure.
Gross State Product Similar to gross domestic product, except that it measures the total value of goods and services produced in a jurisdiction. It is the sum of all income, namely wages, salaries and profits, plus indirect taxes less subsidies. It can also be calculated by measuring expenditure, where it is the sum of state final demand and international and interstate trade, changes in the level of stocks and a balancing item.
Guarantee An undertaking to answer for the debt or obligations of another person or entity.
Indemnity A written undertaking to compensate, protect or insure another person or entity against future financial loss, damage or liability.
Loan Council The Australian Loan Council coordinates borrowing by Australian and state governments. Current arrangements seek to emphasise transparency of public sector finances, through financial market scrutiny of proposed borrowing to restrict borrowing to prudent levels.
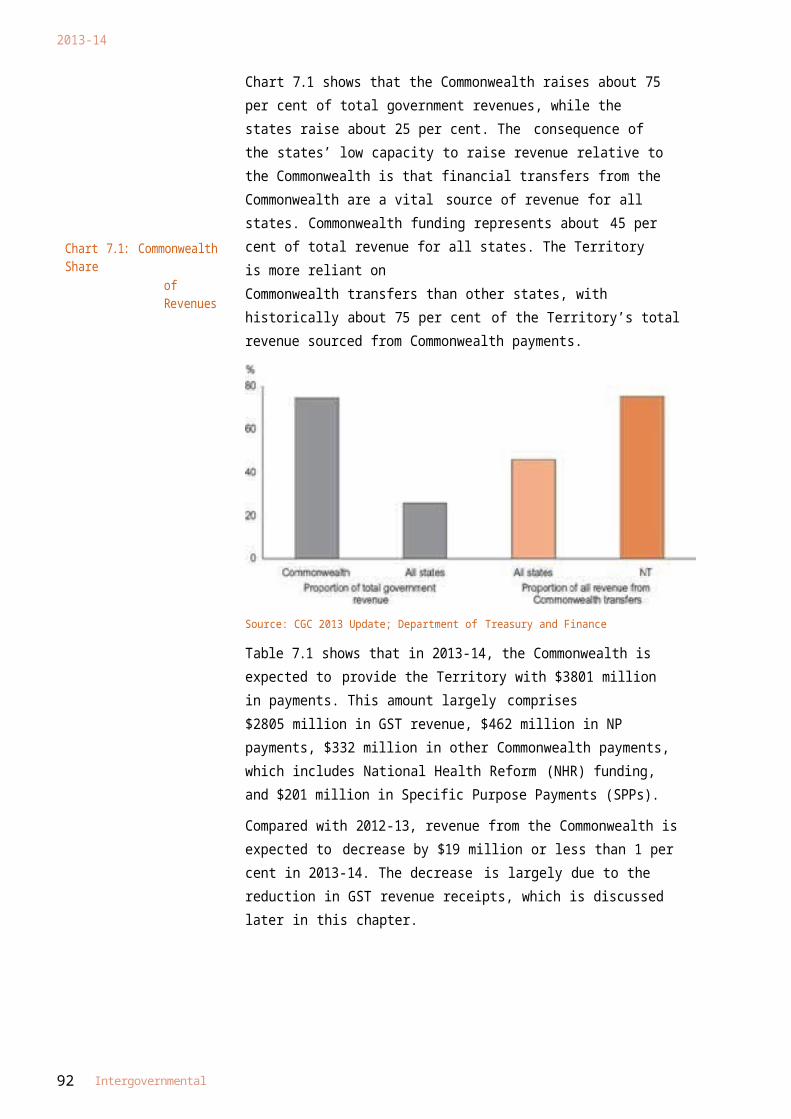
Budget Strategy and Outlook
131Appendix C
Loan Council Allocation The nomination to the Loan Council of the level of financing required.
Memorandum Items –
Loan Council
National PartnershipAgreement
Net Acquisition/ (Disposal) of
Non Financial Assets from Transactions
Memorandum items are used to adjust the cash surplus/deficit to include in the Loan Council Allocation certain transactions that may have the characteristics of public sector borrowings but do not constitute formal borrowings.
An agreement defining the objectives, outputs and performance benchmarks related to the delivery of specified projects, to facilitate reforms or to reward those jurisdictions that deliver on national reforms or achieve service delivery improvements.
Purchases (or acquisitions) of non financial assets less sales (or disposals) of non financial assets less depreciation plus changes in inventories and other movements in non financial assets.
Purchases and sales (or net acquisitions) of non financial assets generally include accrued expenses and payables for capital items. Purchases exclude non-produced assets and valuables that are included in other movements in non financial assets.
Net Actuarial Gains Includes actuarial gains and losses on defined benefit superannuation plans.
Net Cash Flows from Investments in
FinancialAssets (Liquidity
Management Purposes)
Net Cash Flows from Investments
in Financial Assets (Policy
Purposes)
Cash receipts from liquidation or repayment of investments in financial assets for liquidity management purposes less cash payments for such investments. Investment for liquidity management purposes means making funds available to others with no policy intent and with the aim of earning a commercial rate of return.
Cash receipts from the repayment and liquidation of investments in financial assets for policy purposes less cash payments for acquiring financial assets for policy purposes. Acquisition of financial assets for policy purposes is distinguished from investments in financial assets (liquidity management purposes) by the underlying government motivation for acquiring the assets. Acquisition of financial assets for policy purposes is motivated by government policies such as encouraging the development of certain industries or assisting citizens affected by natural disasters.
Net Debt Net debt measures a government’s net stock of selected gross financial liabilities less financial assets.
Net debt equals the sum of deposits held, advances received, government securities, loans and other borrowing less the sum of cash and deposits, advances paid and investments, loans and placements.
Net Financial Liabilities Total liabilities less financial assets, other than equity in public non financial corporations and public financial corporations. This measure is broader than net debt as it includes significant liabilities, other than borrowings (for example, accrued employee liabilities such as superannuation and long service leave entitlements). For the public non financial corporation and public financial corporation sectors, it is equal to negative net financial worth.
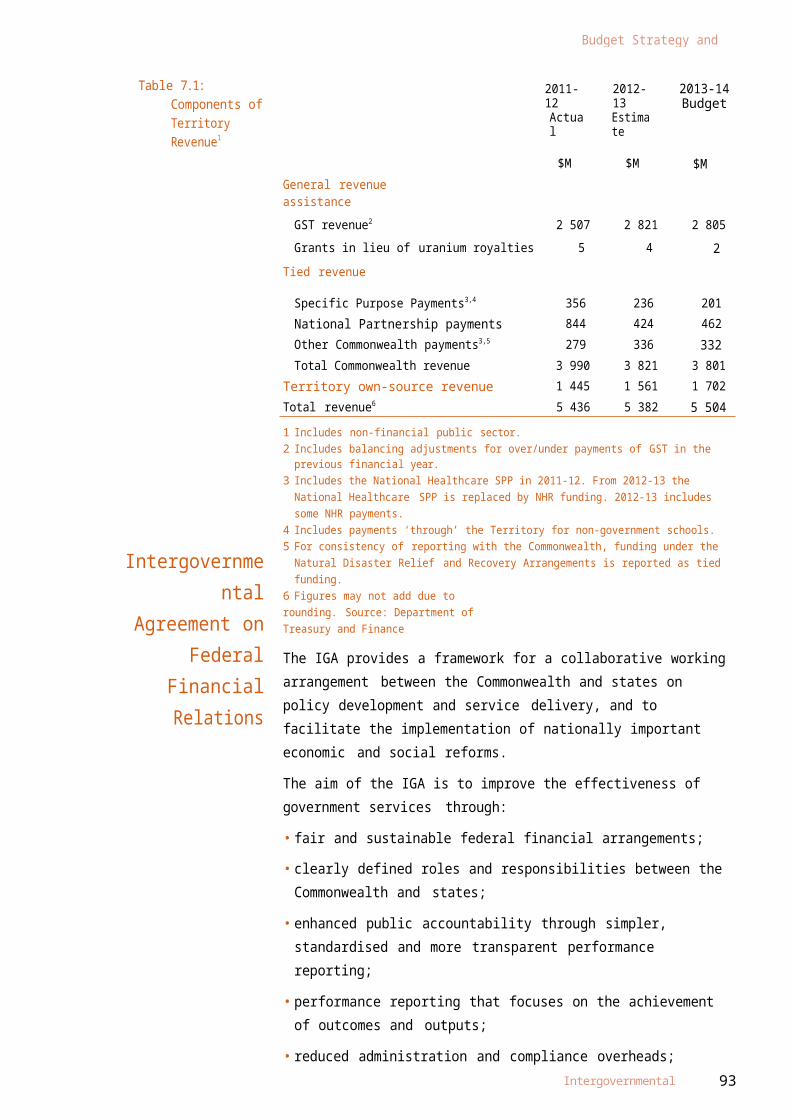
2013-14 Budget
132 Appendix C
Net Financial Worth A measure of a government’s net holdings of financial assets. It is calculated from the Uniform Presentation Framework Balance Sheet as financial assets minus liabilities. Net financial worth is a broader measure than net debt as it incorporates provisions (such as superannuation, but excludes depreciation and doubtful debts) as well as holdings of equity. Net financial worth includes all classes of financial assets and liabilities.
Net Operating Balance The revenue from transactions minus expenses from transactions. It is a summary measure of the ongoing sustainability of operations and excludes gains and losses resulting from changes in price levels and other changes in the volume of assets. It is the component of the change in net worth that is due to transactions and can be attributed directly to government policies.
Net Worth Provides a relatively comprehensive picture of a government’s overall financial position. It is calculated as total assets less total liabilities less shares and other contributed capital. It includes a government’s non financial assets such as land and other fixed assets, which may be sold and used to repay debt, as well as its financial assets and liabilities including debtors, creditors and superannuation liabilities. Net worth also shows asset acquisitions over time, giving an indication of the extent to which borrowings are used to finance asset purchases, rather than only current expenditure.
Non Financial Assets Assets that are not financial assets, predominantly land and other fixed assets.
Non Financial Public Sector
The sector formed through a consolidation of the general government and public non financial corporation subsectors.
Other Economic Flows Changes in the volume or value of an asset or liability that do not result from transactions (that is, revaluations and other changes in the volume of assets).
Other SuperannuationExpense
Includes all superannuation expenses from transactions except superannuation interest cost. It generally includes current service cost, which is the increase in entitlements associated with the employment services provided by employees in the current period. Superannuation actuarial gains/losses are excluded as they are considered other economic flows.
Payables Includes short-term and long-term trade debt and accounts payable, grants and interest payable.
Public Financial Corporations
Public Non FinancialCorporations
Government-controlled entities that perform central bank functions,and/or have the authority to incur liabilities and acquire financial assets in the market on their own account.
Public enterprises primarily engaged in the production of goods or services of a non financial nature, for sale in the market place at prices that aim to recover most of the costs involved.
Receivables Includes short-term and long-term trade credit and accounts receivable, grants, taxes and interest receivable.

Budget Strategy and Outlook
133Appendix C
Sale of Goods andServices
Specific PurposePayments
Revenue from the direct provision of goods and services and includes fees and charges for services rendered, sale of goods and services, fees from regulatory services and work done as an agent for private enterprises. It also includes rental income under operating leases and on produced assets such as buildings and entertainment, but excludes rental income from the use of non-produced assets such as land. User charges include sale of goods and services revenue.
A Commonwealth financial contribution to support state delivery of services in a particular sector. Payments are made from the Commonwealth Treasury to state treasuries and are appropriated to the relevant Northern Territory agency.
State Final Demand Final consumption expenditure plus gross fixed capital formation in each jurisdiction. It represents the total expenditure on consumption and investment in a jurisdiction.
Superannuation Interest Cost
The expense resulting from the increase in the liability due to the fact that, for all participants in the scheme, retirement (and death) is one year nearer, and so one fewer discount factors must be used to calculate the present value of the benefits for each future year. Interest cost is the increase during a period in the present value of a defined benefit obligation that arises because the benefits are one period closer to settlement, as per the relevant accounting standard. The cost is measured net of the actuarial return on plan assets of defined benefit schemes calculated using an actuarially determined long-term rate of return.
Tax Equivalents Regime The mechanism to ensure that government business divisions andgovernment owned corporations incur tax liabilities similar to privately owned organisations. Thus, greater parity exists between the cost structures of government-controlled trading entities and the private sector, aiding in the achievement of competitive neutrality.
Treasurer’s Advance An appropriation purpose of that name as specified in an Appropriation Act, which provides a pool of funds specifically set aside in each budget to meet operational contingencies that arise during the year.
Uniform Presentation
Framework
A uniform reporting framework (UPF) agreed by the Australian Loan Council in 2000, which is a revision of the agreement reached at the 1991 Premiers’ Conference. The UPF was further updated and reissued in April 2008 to incorporate accounting standard AASB 1049 Whole of Government and General Government Sector Financial Reporting. The UPF specifies that the Commonwealth, state and territory governments will present a minimum set of budget and financial outcome information on the Government Finance Statistics basis, according to an agreed format and specified Loan Council reporting arrangements.