Embed Size (px)
Citation preview

The FAPRI-Ireland Partnership
Developing the Outlook for Irish Agriculture
Trevor Donnellan
Thia HennessyRural Economy Research Centre
Teagasc HQ

Overview
What is FAPRI-Ireland
What do we do?
How do we do it?
Aggregate Level Analysis
Farm Level Analysis
Future Developments - Interaction with Advisors

Agriculture: A Time of Change ?
Dairy farmers should not be given the impression that the present system, with its intrinsic rigidities, can last forever.
The recent debate on long-term prospects has revealed factors of uncertainty; in particular the results of the next WTO Round could also affect the dairy sector.
(European Commission 1997)

FAPRI- Ireland Partnership: Who are we?
Founded in 1997 - initiated by John Bruton (when Taoiseach)
Partners
– Teagasc (Irish Ag. and Food Dev. Authority)
– Nat. University of Ireland at Cork, Dublin, Galway, Maynooth
and Trinity College
FAPRI (Missouri -USA)
Partner Project in Northern Ireland

Background
Now in Second Phase - Continuation from Previous Project
Previous Analyses
– Commission Agenda 2000 Proposals (December 1998)
– the Final Berlin Agenda 2000 Agreement (May 1999)
– the London Club Agenda 2000 Dairy Alternative (Sept 1999)
– the impact of Exchange Movements on Farm Income (March 2000)
– the impact of a reduction or elimination of Export Subsidies (April 2001)

We Can’t Ignore the Outside World
Irish Agriculture very export dependent
Our Domestic market of lesser importance
Must understand international scene
International Policy
International Supply and Demand
Exchange rates

Linking FAPRI-Ireland to the Outside World
FAPRIWorld Model
FAPRIEU Model
Ireland Macro Economic Models
Ireland Model
Ireland Farm Model

Types of Modelling Used
Commodity Level Modelling– Econometric Modelling– individual models for each commodity– commodity models linked to form overall model
Farm Level Modelling– Linear Programming– incorporating results of commodity models– representative farms selected and modelled
Commodity Models
Farm Models

Agricultural Output: Ireland 1999
0
200
400
600
800
1000
1200
1400
1600
Eu
ro (
000)
Cattle Pigs Sheep Milk Crops Other

Commodity Models
Trevor Donnellan

Cereals
Inputs
Poultry
PigsSheep
Beef
Dairy
Milk Output Values
Beef Output Values
Sheep Output Values
Poultry Output Values
Pig Output Values
Poultry Meal Prices
Poultry NumbersPoultry PricesDairy Cow
Numbers
Dairy Meal Price Cereal Prices, Production,
Value & Hectares
Cattle Feed Price
Cattle Numbers
Cattle FeedPrice
Pig Numbers
Pig Meal Price
Beef Cow Numbers
Dairy Cow Numbers
Dai
ry C
ow
Num
bers
Commodity Model Inter Linkages

What this work is NOT
Just remind ourselves this is NOT a forecast it is a projection
Who could have forecast– China Accession– EU Expansion– Weather– 11th September ?

Projecting the Future: How do we do it?
We don’t have a crystal ball !!!!!!
Assume future policy
Relationships between data analysed
Models solved = “The Meltdown”
Results go to Farm Models
Models solved
Consultations with Experts
Final Revisions

How We Do It
Macro EconomicProjections
- WEFA, Link, DRI
Policy Assumptions
ModelAnalysis
Expert Review
Final AnalysisOr
Baseline

Our Main Ability
Is NOT that we can predict the future
We can assess impact of new policies
First we make a baseline projection
Then we look at policy changes
Produce policy change projections
Look at the difference

Baseline Policy Assumptions
Policies Currently In Place, Remain In Place
International Agreements Hold
No New Policies
No N
ew Policy
Assum
ptions
A Scenario
Elimination of Export Subsidies

Scenario:Export Subsidy Elimination
Total abolition of export subsidies 2004-2009
Related assumptions are important
– Elimination of export subsidies could lead to a large build up of
intervention stocks
– Not a credible Commission approach
– Must reduce intervention prices - so market clears
– Intervention Butter price -20% and SMP -10%
– Assume quotas remain in place up to 2010

Dairy : Export Subsidy EliminationDairy : Export Subsidy Elimination
15
17
19
21
23
25
27
29
1995 1997 1999 2001 2003 2005 2007 2009
Eur
o pe
r 10
0kg
Baseline Elimination
0
200
400
600
800
1,000
1,200
1,400
2000 2002 2004 2006 2008 2010(£
000
) mill
ion
Value of Milk Sold Direct Compensation
Irish Farm Milk Price 3.7% fat Revenue of Irish Milk sector
Under export subsidy elimination the 2010 price down 20% on 2010 baseline
2010 Value Down 20% on 2000
2010 Revenue down 13% on 2000

Beef : Export Subsidy EliminationBeef : Export Subsidy Elimination
0200400600800
1,0001,2001,4001,6001,8002,000
2000 2002 2004 2006 2008 2010(£
000
) m
illio
n
Value of Cattle Sold Direct Compensation
Irish Cattle Price Revenue of Irish Cattle
20
40
60
80
100
120
1995 1997 1999 2001 2003 2005 2007 2009
IR£
Per 1
00kg
Baseline Elimination
Under export subsidy elimination down 20% on 2010 baseline
2010 Value down 34% on 2000
2010 Revenue Down 13% on 2000

Farm Models
Thia Hennessy

How we model farms
Representative farms
Apply price projections to farms
Impact on income
Project how farmers will react

Representative Farms
National Farm Survey - 1200 farms
Not all – ‘typical farm’
Cluster Analysis
Homogenous groups
Similar size, efficiency and demographics

Representative Dairy Farms
Descriptor 1996
Area Hectares
Quota Farmed Litres
Quota Change
1992-1996Static 10800 45 95 400 0
Developer 7900 41 103 700 55%
Large 1000 123 425 700 5%
Typical 13200 44 169 000 10%

Representative Cattle Farms
Descriptor 1996
Area Hectares
Family Farm
Income
Area Change
1992-1996
No Off- Farm Employment
Off- Farm Employment
Large 4700 74 £18 250 8%Moderate 28300 33 £5 071 2%
Hobby 15000 33 £1 900 -10%Efficient 8200 36 £7 250 9%

Modelling the Farms
Static analysis - no response
Dynamic analysis – response
Programming Models

Modelling Response
Profit Maximisation – Farm net margin
Max =ctxt+ct+1xt+1+….ct+nxt+n
subject to bt<aixi+ajxj+……anxn
Complexity of agricultural policy e.g:extensification, premia schemes, livestock unit measures

Results of Static Analysis
Gross Output remains static
Price – cost squeeze
Margins are falling
Combat with economies of scale or efficiency
Run faster to standstill

Results – Typical Dairy Farm
10000
15000
20000
25000
30000
35000
1998 2000 2002 2004 2006 2008 2010
IR£
No response margin Response margin Response cashflow

By 2010 farm margins are 35% higher than in
1998 (nominal terms)
Purchasing quota leased and extra
Increase in quota farmed by 25% (47,000)
Negative impact on GM - Cashflow
Results – Typical Dairy Farm

Results – Developer Dairy Farm
0
5000
10000
15000
20000
25000
1998 2000 2002 2004 2006 2008 2010
IR£
No response margin Response Margin Cashflow

Developer farm margins up 35% by 2010
Increase in quota farmed by 35%
Large farm margins up 15% higher in 2010 than in 1998
(real loss)
Leased quota purchased no extra
Results – Developer Dairy Farm

Results Small Dairy Farm
Small dairy farm to exit
Expansion uneconomical
Price cost squeeze
Lure of off farm incomes
Part-time beef system

Results - Cattle Farms
Key to Success Maximise Premia Payments
All Farms Margins volatile from 2000-04
Small margins 30% higher in 2010 than in 1998
Extensification and SCP claimed on heifers
Off farm job not an option

Results - Cattle Farms
Large full-time margins volatile in short term
but 15% higher in 2010
Benefits from SBP limit increase and rents
more land continues as full-time farm

Results - Cattle Farms
Part-time efficient farm will maintain 1998 margins in
2010 although volatile in the intervening period
Reduce stocking rate to qualify for 1.4
Hobby farm by 2010 margins 15% below 1998
Cost structure - continue in farming?

Future Developments
To develop PAT - policy analysis tool.
PAT is a user friendly policy impact
analysis decision support tool for use in
farm planning and decision making.

Rationale
Direct payments -large portion of income
More complex criteria
Many considerations
Back of envelope planning outdated
PAT can answers questions easily
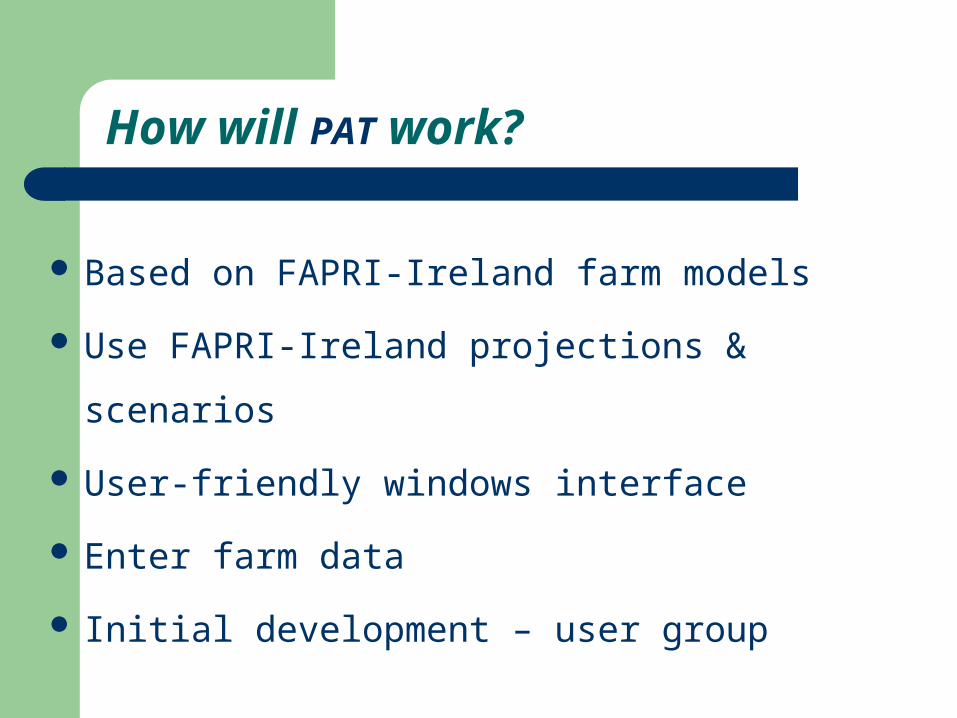
How will PAT work?
Based on FAPRI-Ireland farm models
Use FAPRI-Ireland projections & scenarios
User-friendly windows interface
Enter farm data
Initial development – user group

What answers will PATprovide?
What will my profit levels be in 5 years if I don’t change current plan?
What is my best strategy for the next 5 years?
How will a new policy scenario affect my profits?

Benefits
Of use to advisors
Information to farmers
Handle policy issues and maximise DPs
Better understanding of policy issues
Facilitates technology transfer Take policy analysis to a wider arena

So to Wrap Things Up
Some Conclusions

What Can Make This Work ‘ Wrong ‘ ?
Great uncertainty over Euro exchange rate
World Economy
Oil prices – will they or won’t they?
Weather
Different Policies pursued

Conclusions
Commodity models examine policy at aggregate level
Farm models take commodity model results and determine the effects on specific types of farms

Future Work
Reform of the CAP
More WTO Implications
Environment - Kyoto
European Models

Further Information
Further information on our work is available on our website at:
www.tnet.teagasc.ie/fapri