Embed Size (px)
Citation preview
Patrick Westhoff ([email protected]) FAPRI (www.fapri.missouri.edu)
University of Missouri
National Farm Business Management Conference, St. Louis, June 15, 2009
How we got here Why the boom and bust in commodity
prices? What has it meant to the farm sector?
Where we might be going Macroeconomy Agricultural markets
FAPRI’s role in the farm policy process
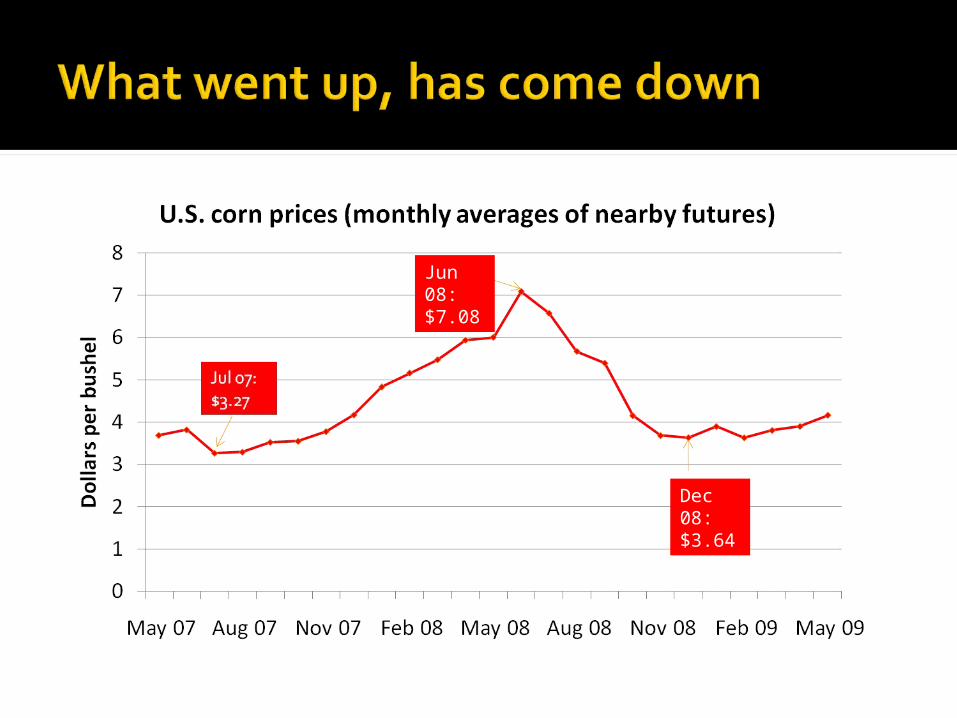
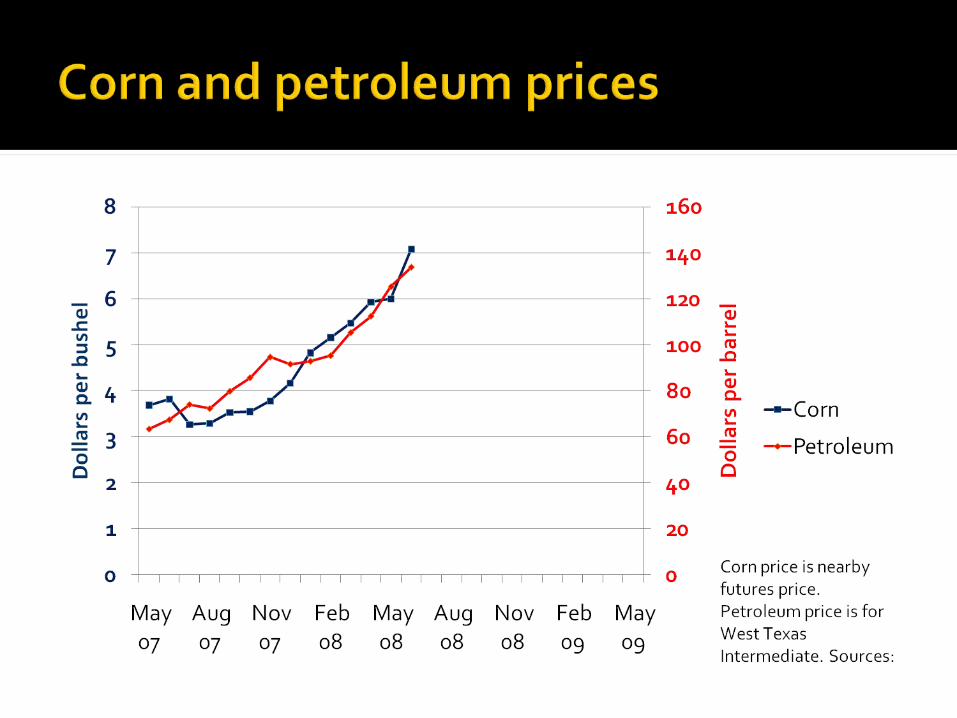
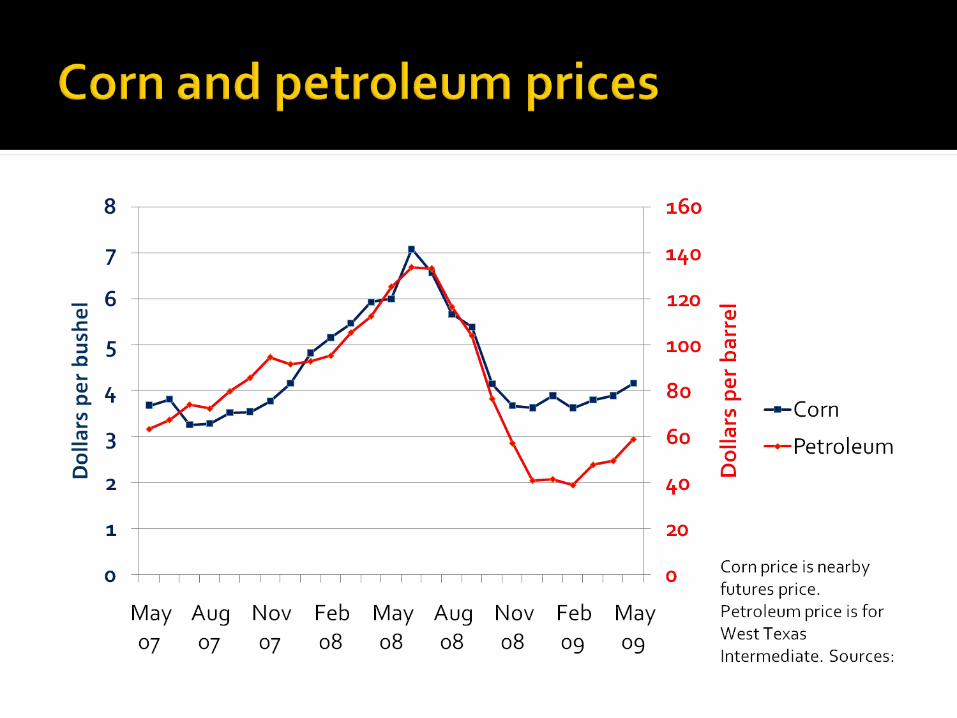
Jun 08: $7.08
Dec 08: $3.64
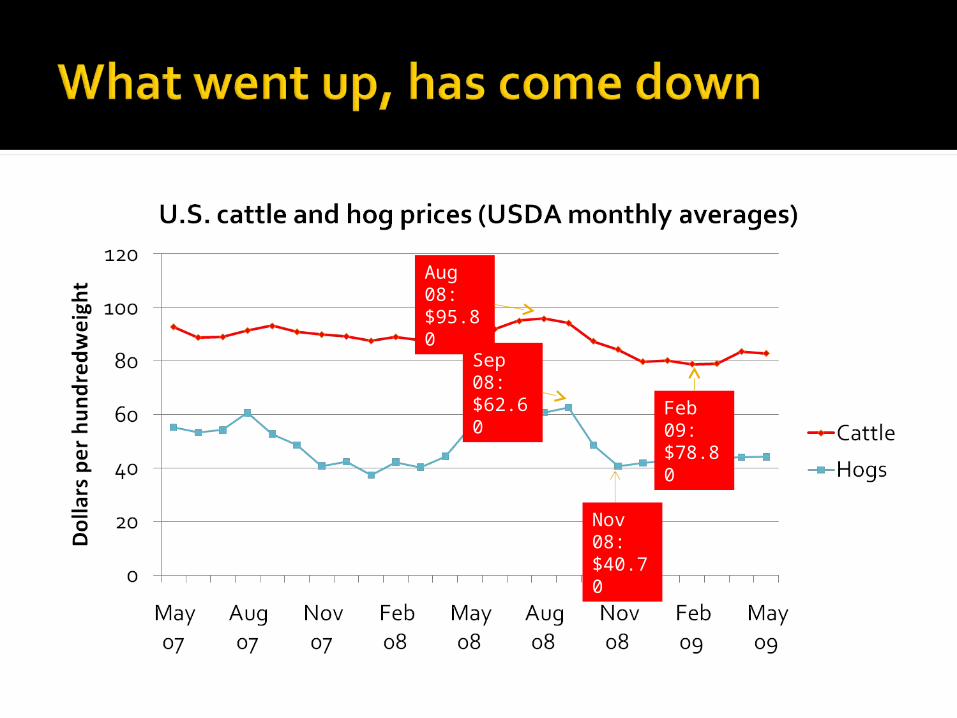
Aug 08: $95.80
Nov 08: $40.70
Sep 08: $62.60
Feb 09: $78.80
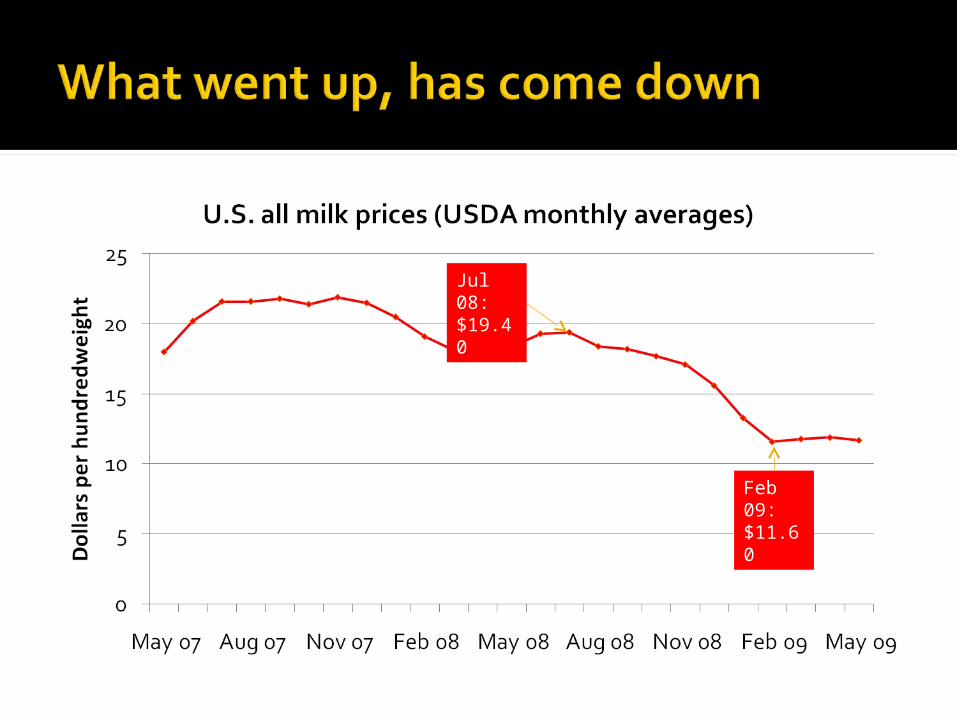
Jul 08: $19.40
Feb 09: $11.60
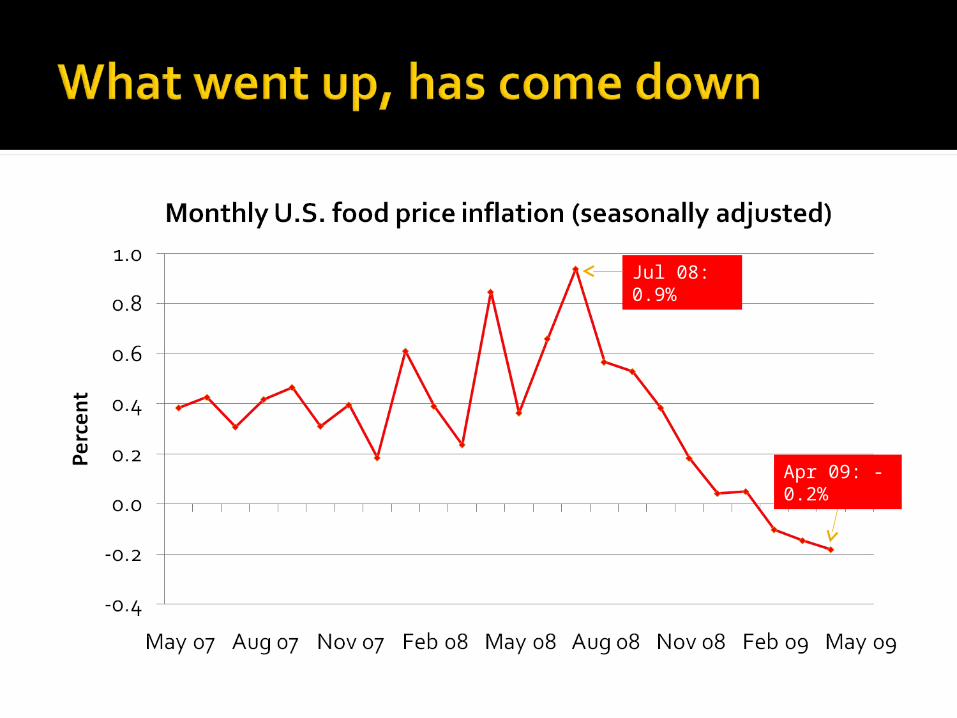
Jul 08: 0.9%
Apr 09: -0.2%
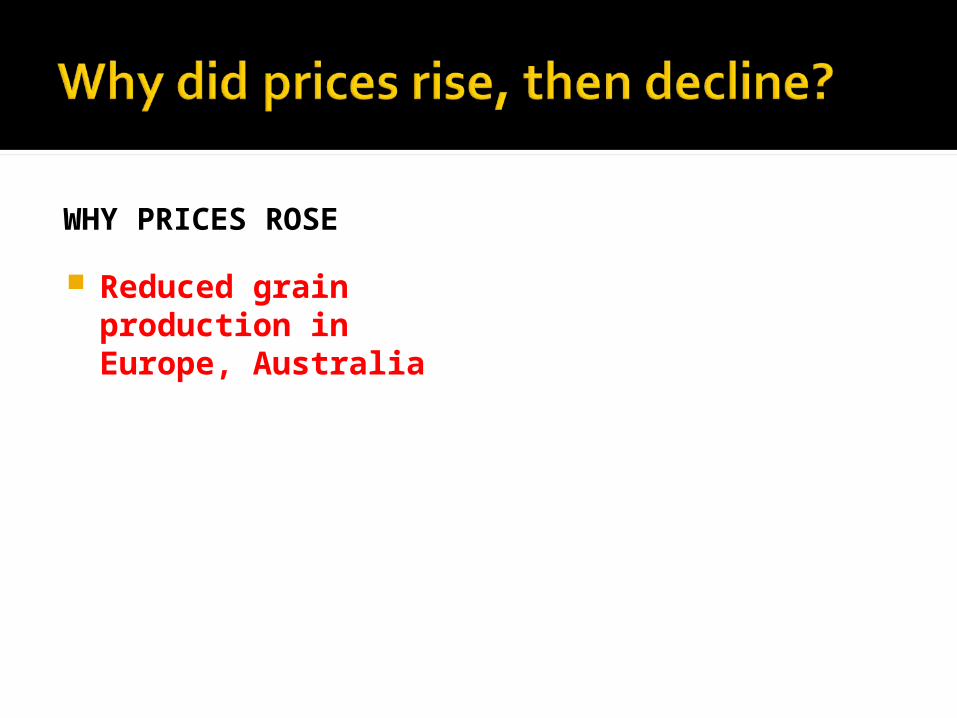
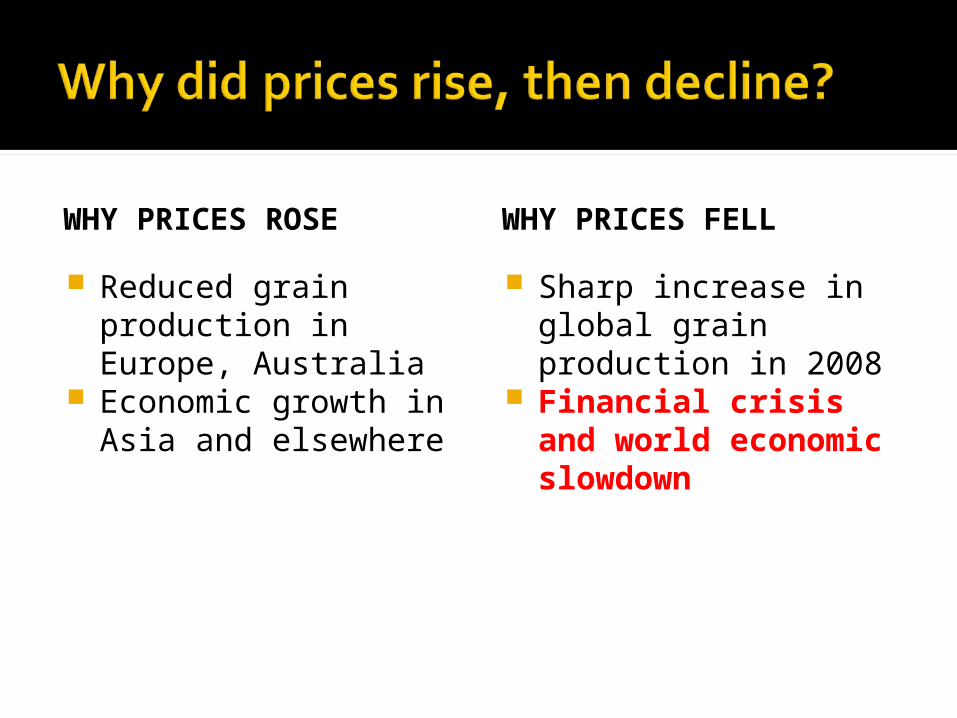
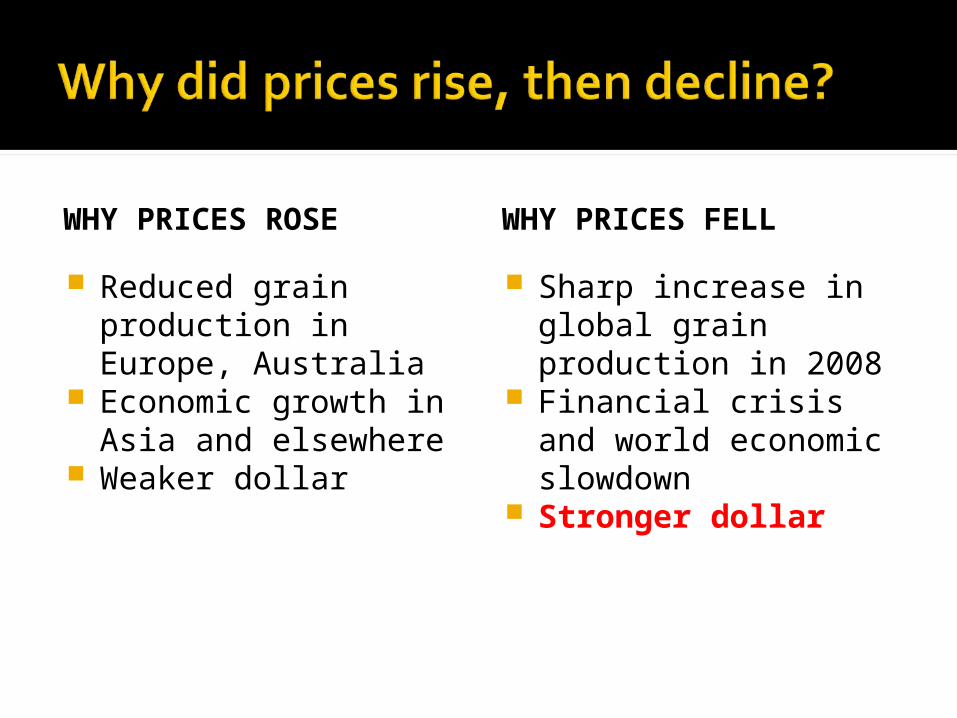
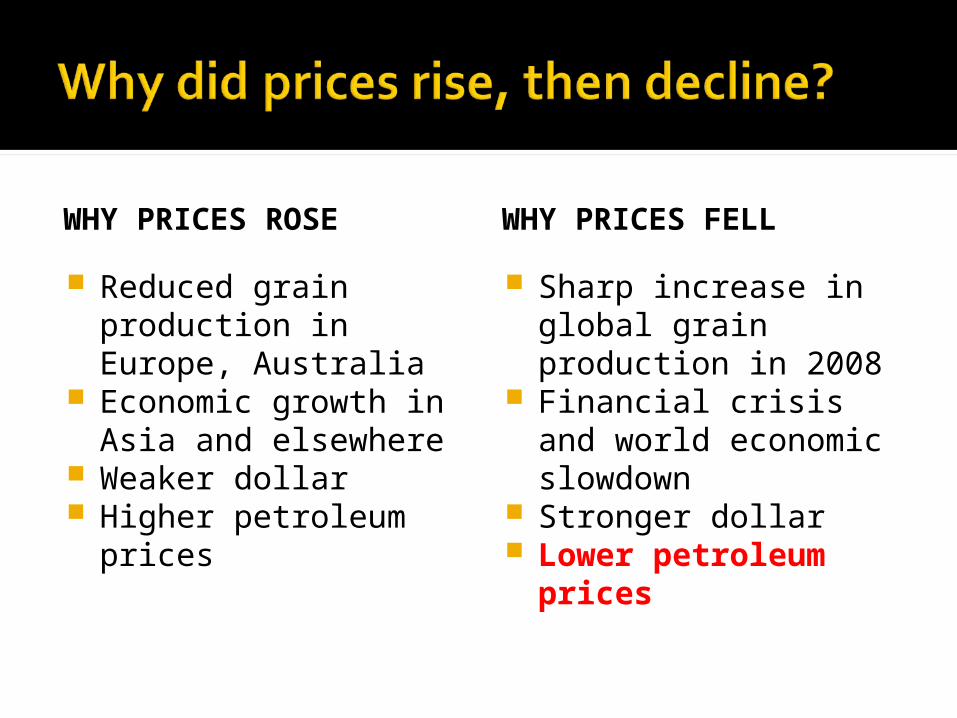
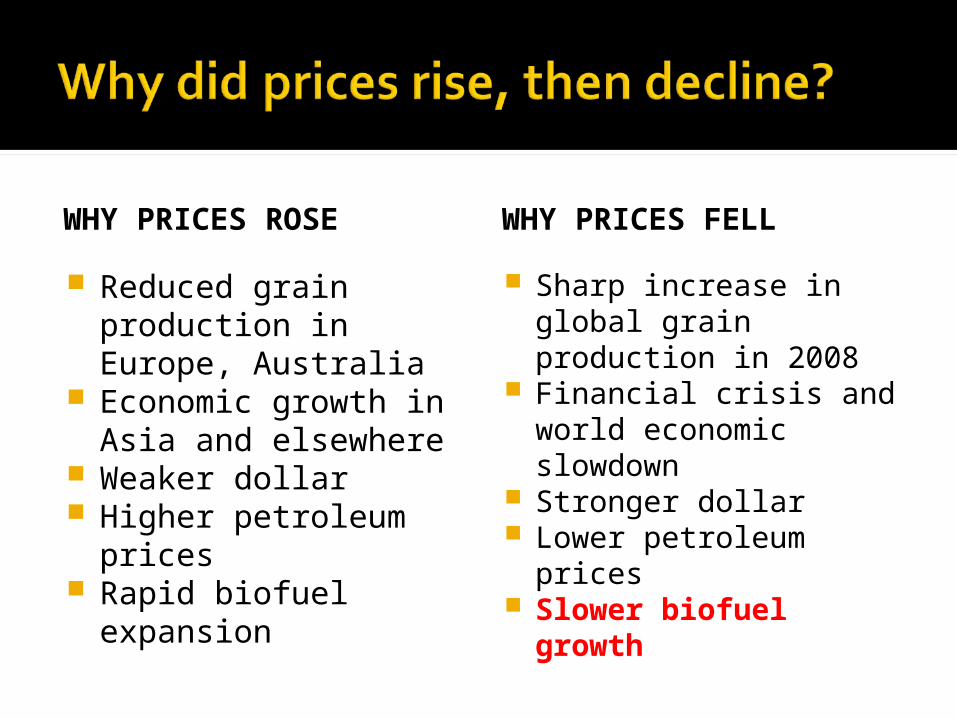
WHY PRICES ROSE
Reduced grain production in Europe, Australia
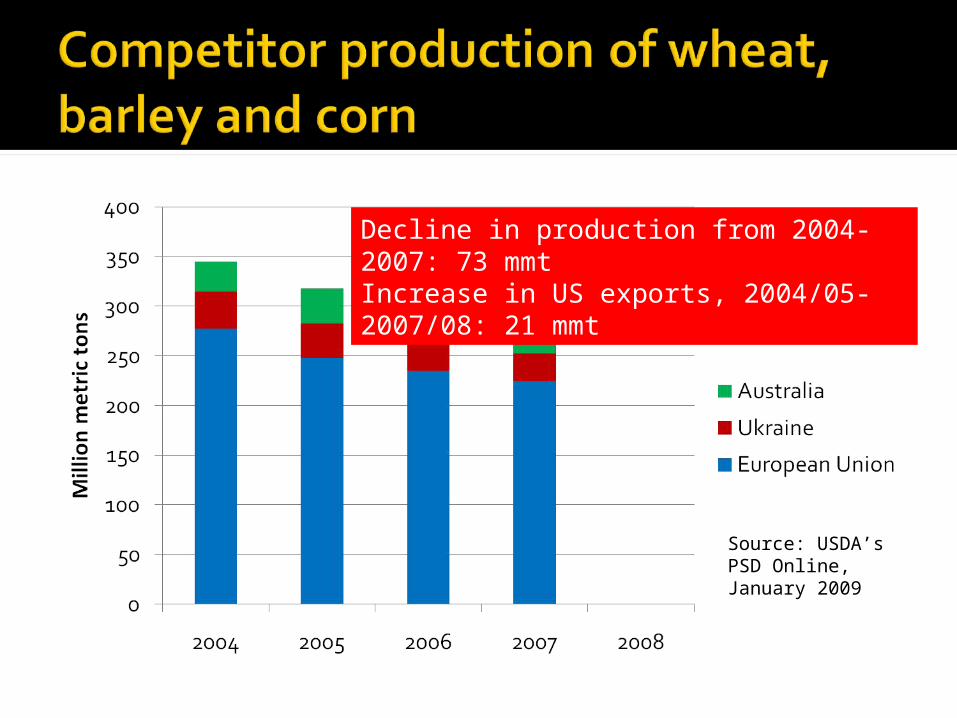
Source: USDA’s PSD Online, January 2009
Decline in production from 2004-2007: 73 mmtIncrease in US exports, 2004/05-2007/08: 21 mmt

WHY PRICES ROSE
Reduced grain production in Europe, Australia
WHY PRICES FELL
Sharp increase in global grain production in 2008
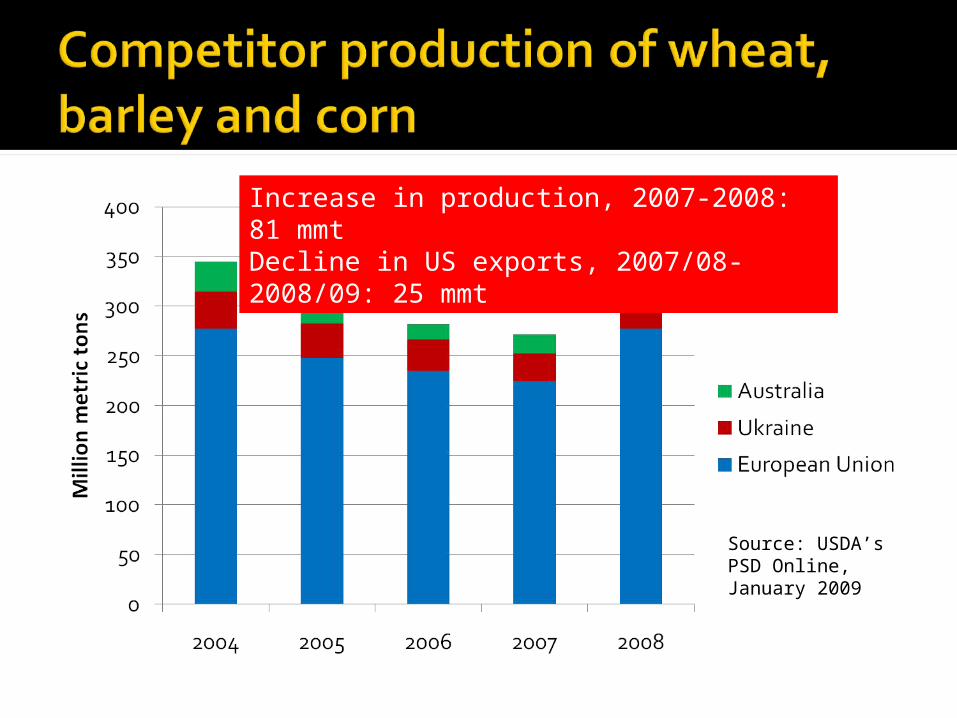
Source: USDA’s PSD Online, January 2009
Increase in production, 2007-2008: 81 mmtDecline in US exports, 2007/08-2008/09: 25 mmt
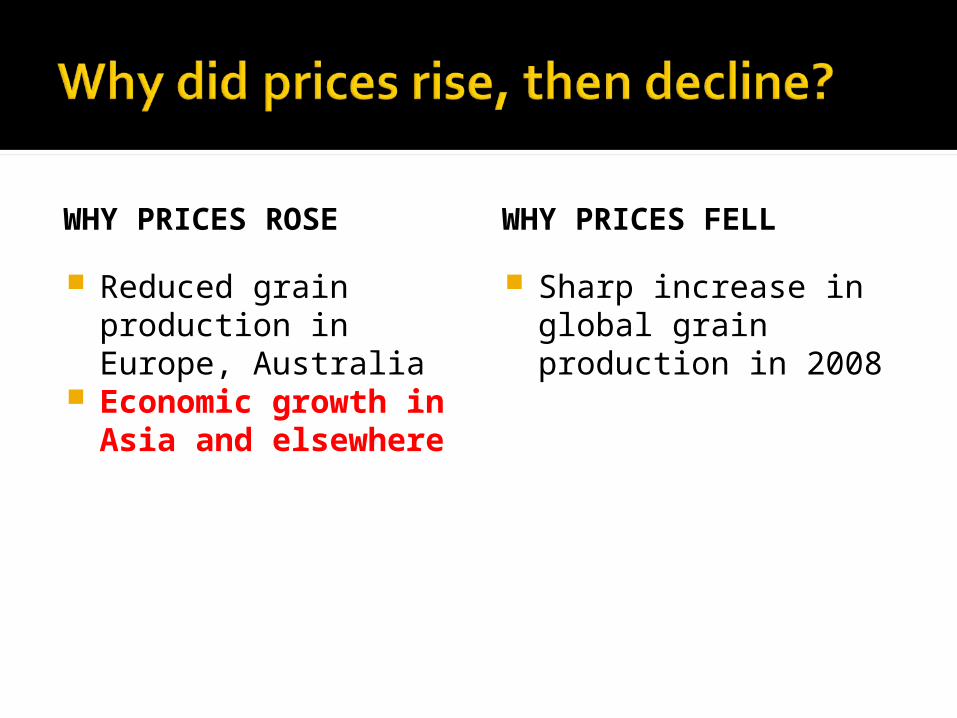
WHY PRICES ROSE
Reduced grain production in Europe, Australia
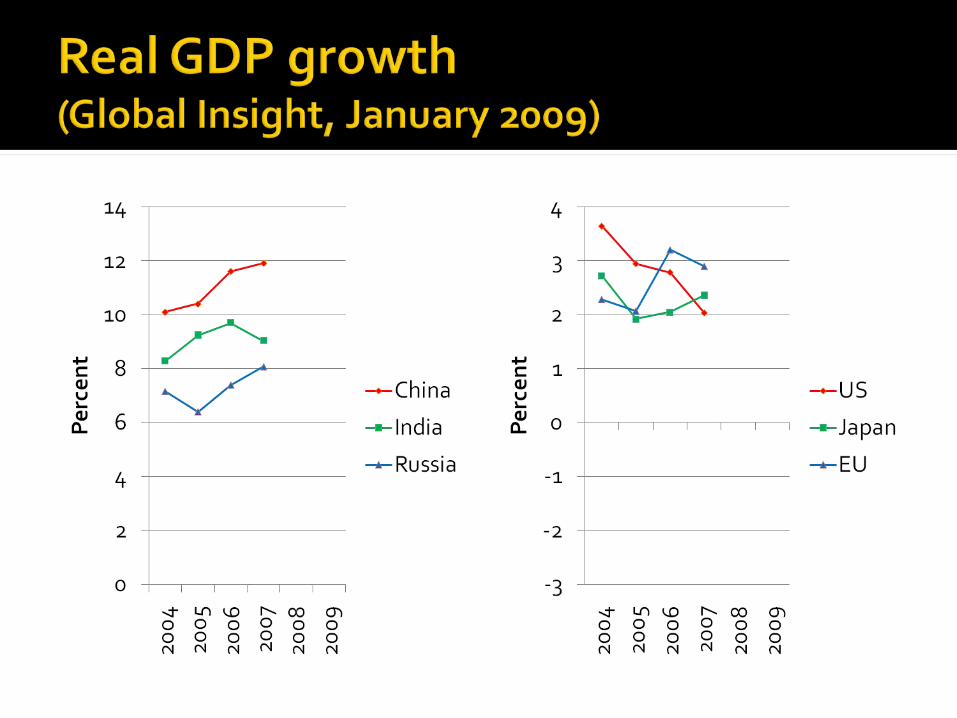
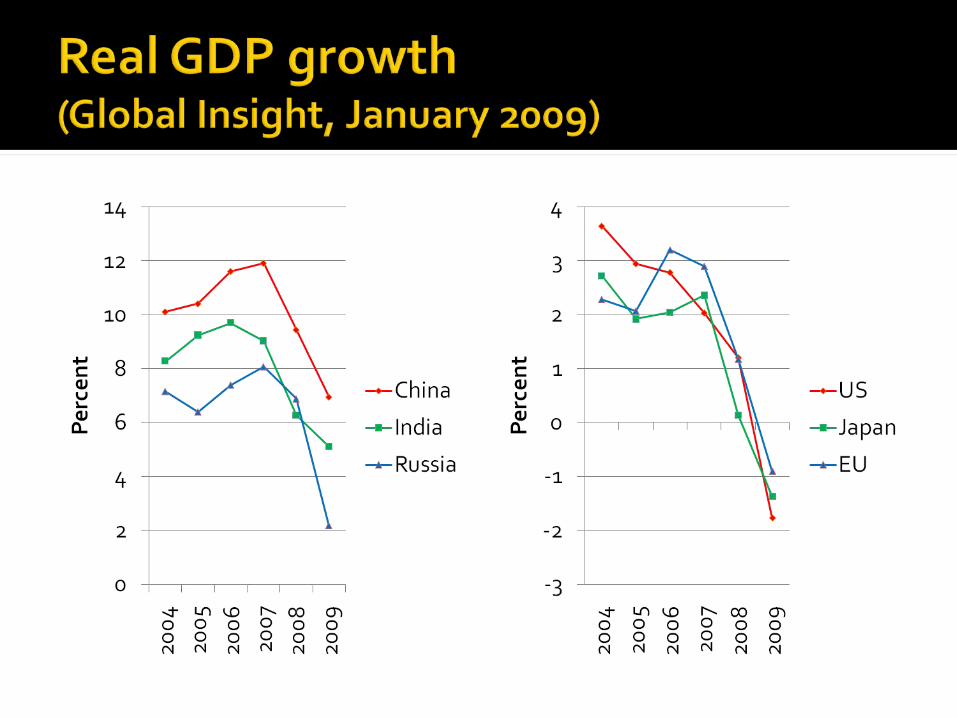
Economic growth in Asia and elsewhere
WHY PRICES FELL
Sharp increase in global grain production in 2008
WHY PRICES ROSE
Reduced grain production in Europe, Australia
Economic growth in Asia and elsewhere
WHY PRICES FELL
Sharp increase in global grain production in 2008
Financial crisis and world economic slowdown
WHY PRICES ROSE
Reduced grain production in Europe, Australia
Economic growth in Asia and elsewhere
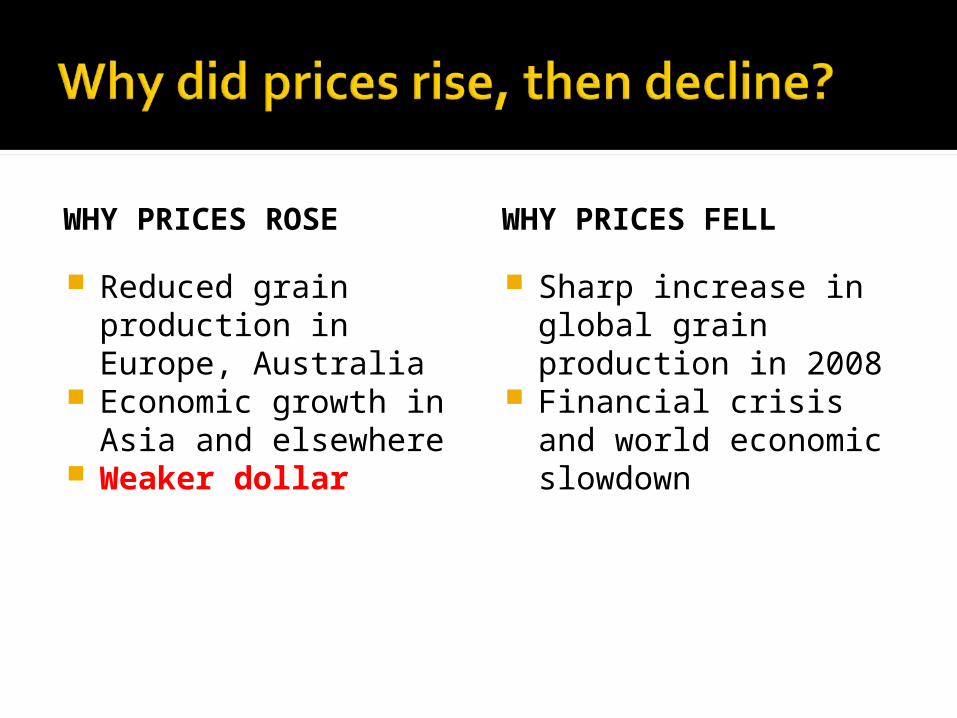
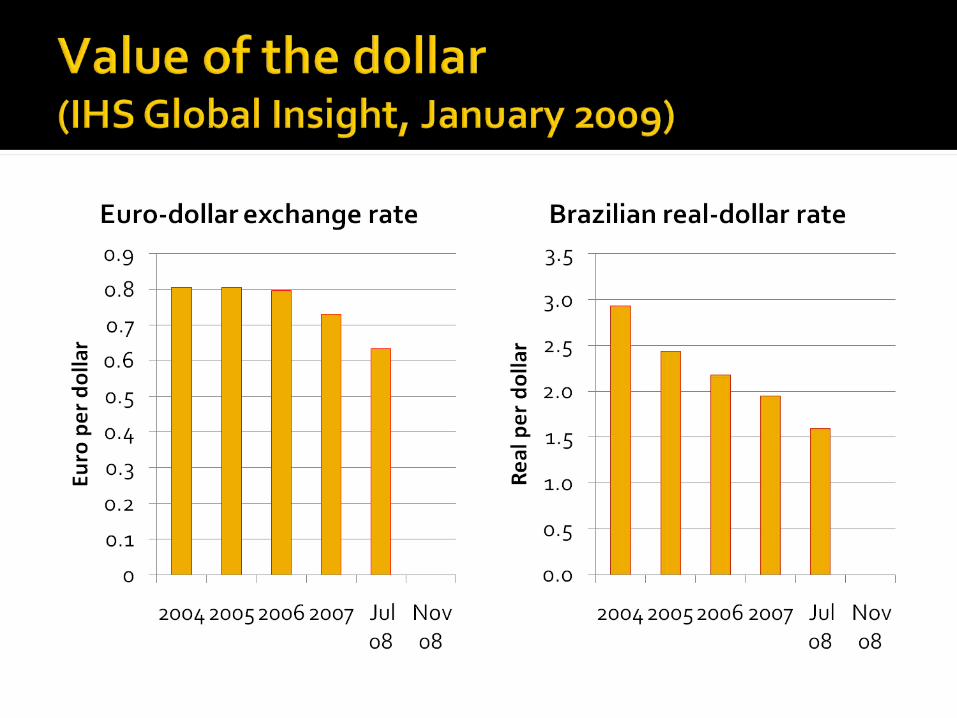
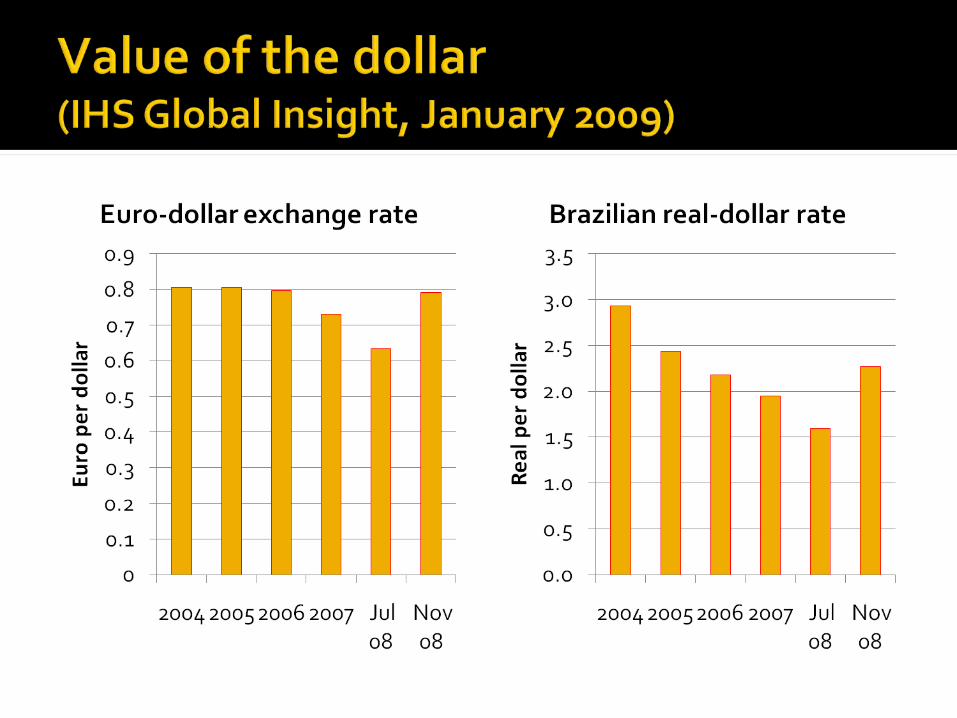
Weaker dollar
WHY PRICES FELL
Sharp increase in global grain production in 2008
Financial crisis and world economic slowdown
WHY PRICES ROSE
Reduced grain production in Europe, Australia
Economic growth in Asia and elsewhere
Weaker dollar
WHY PRICES FELL
Sharp increase in global grain production in 2008
Financial crisis and world economic slowdown
Stronger dollar
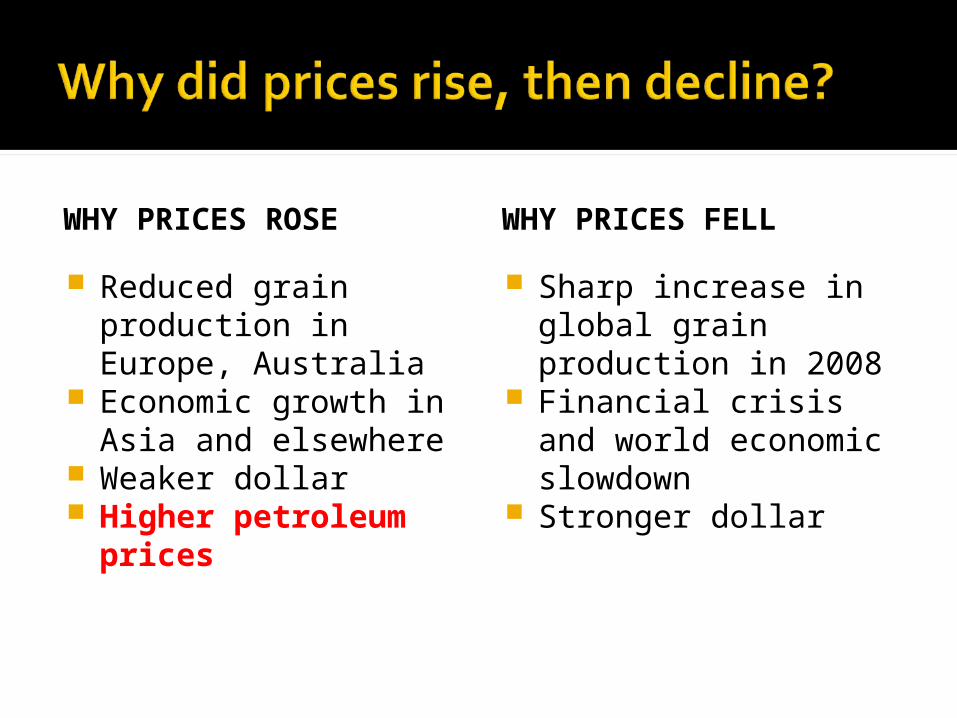
WHY PRICES ROSE
Reduced grain production in Europe, Australia
Economic growth in Asia and elsewhere
Weaker dollar Higher petroleum
prices
WHY PRICES FELL
Sharp increase in global grain production in 2008
Financial crisis and world economic slowdown
Stronger dollar
WHY PRICES ROSE
Reduced grain production in Europe, Australia
Economic growth in Asia and elsewhere
Weaker dollar Higher petroleum
prices
WHY PRICES FELL
Sharp increase in global grain production in 2008
Financial crisis and world economic slowdown
Stronger dollar Lower petroleum
prices
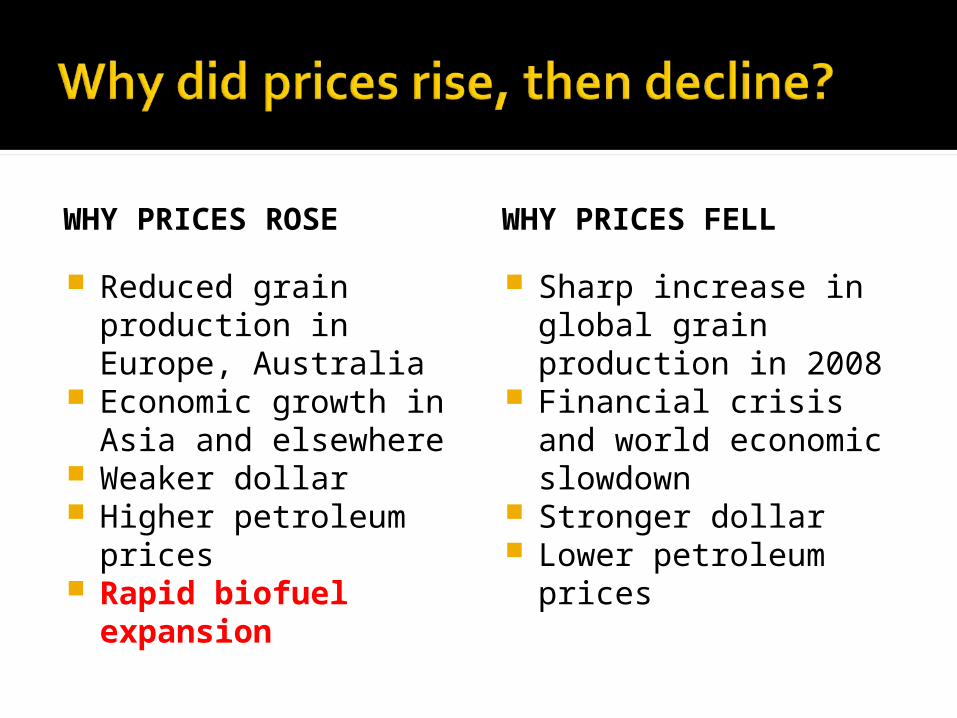
WHY PRICES ROSE
Reduced grain production in Europe, Australia
Economic growth in Asia and elsewhere
Weaker dollar Higher petroleum
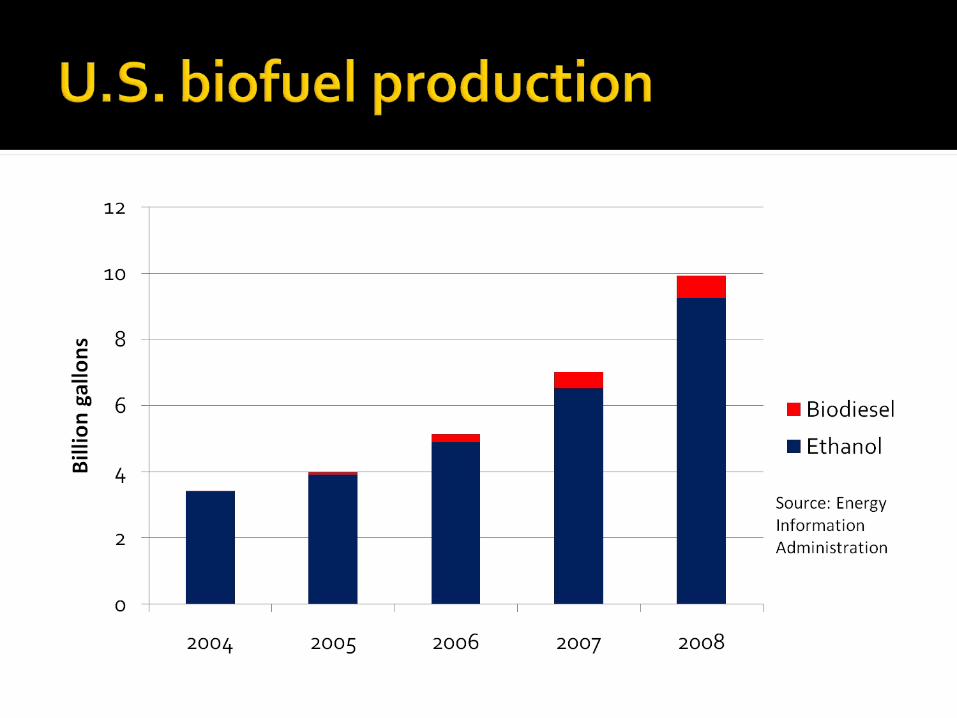
prices Rapid biofuel
expansion
WHY PRICES FELL
Sharp increase in global grain production in 2008
Financial crisis and world economic slowdown
Stronger dollar Lower petroleum
prices
WHY PRICES ROSE
Reduced grain production in Europe, Australia
Economic growth in Asia and elsewhere
Weaker dollar Higher petroleum
prices Rapid biofuel
expansion
WHY PRICES FELL
Sharp increase in global grain production in 2008
Financial crisis and world economic slowdown
Stronger dollar Lower petroleum
prices Slower biofuel
growth
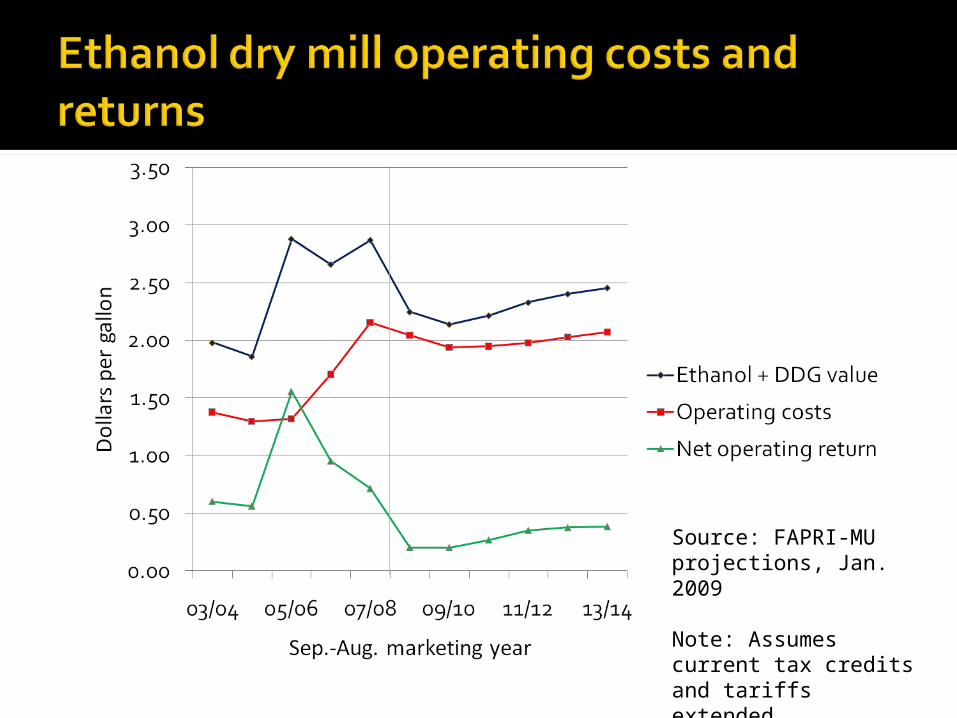
Source: FAPRI-MU projections, Jan. 2009
Note: Assumes current tax credits and tariffs extended
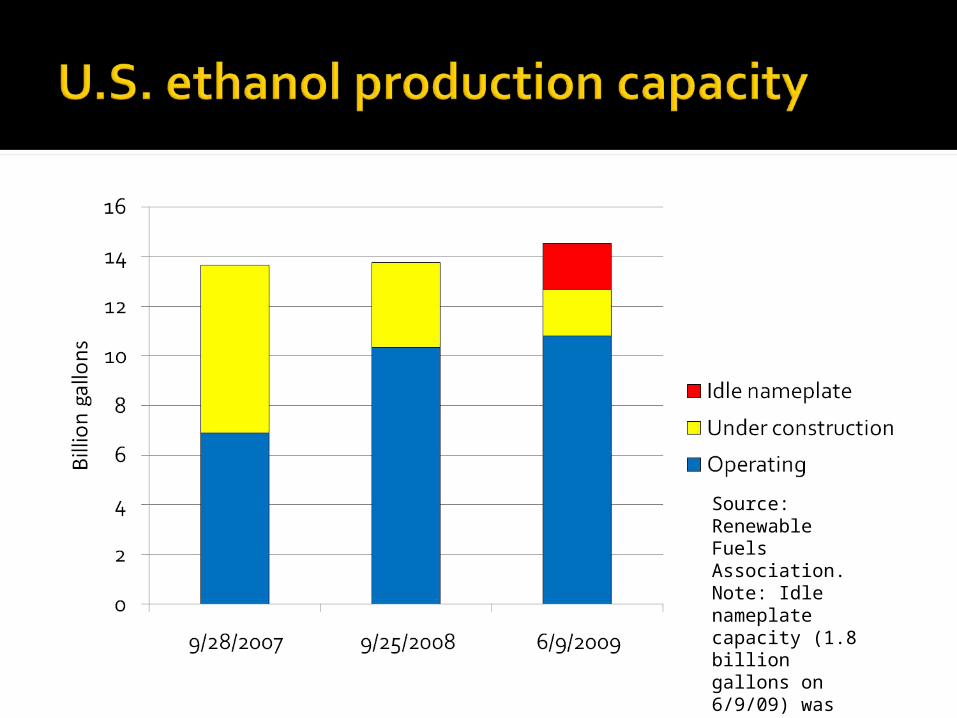
Source: Renewable Fuels Association. Note: Idle nameplate capacity (1.8 billion gallons on 6/9/09) was not reported in 2007 or 2008.
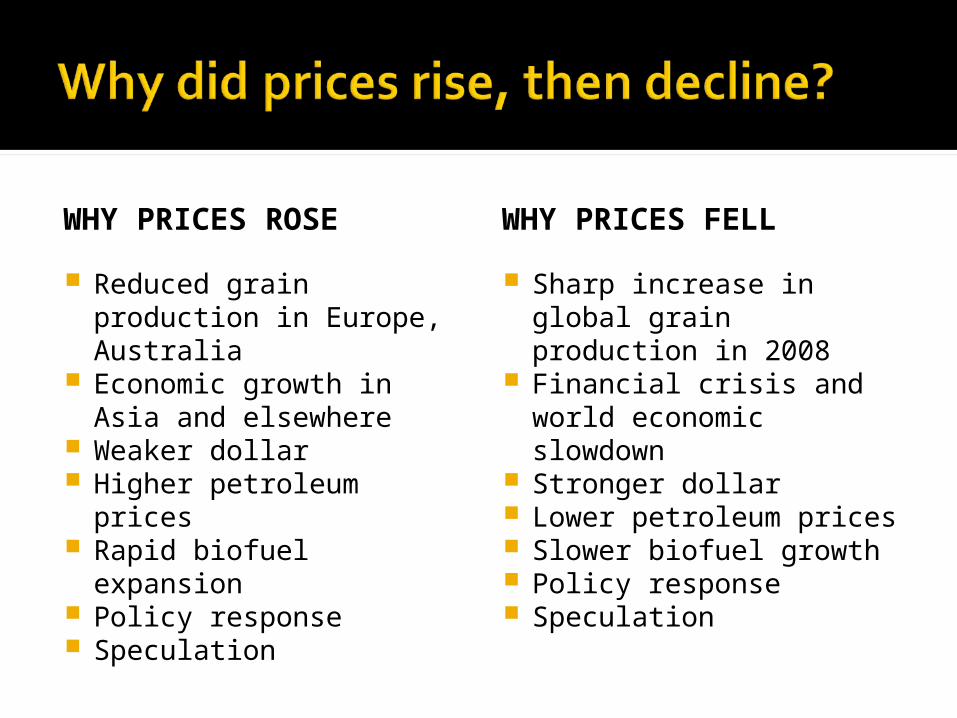
WHY PRICES ROSE
Reduced grain production in Europe, Australia
Economic growth in Asia and elsewhere
Weaker dollar Higher petroleum prices Rapid biofuel expansion Policy response Speculation
WHY PRICES FELL
Sharp increase in global grain production in 2008
Financial crisis and world economic slowdown
Stronger dollar Lower petroleum prices Slower biofuel growth Policy response Speculation
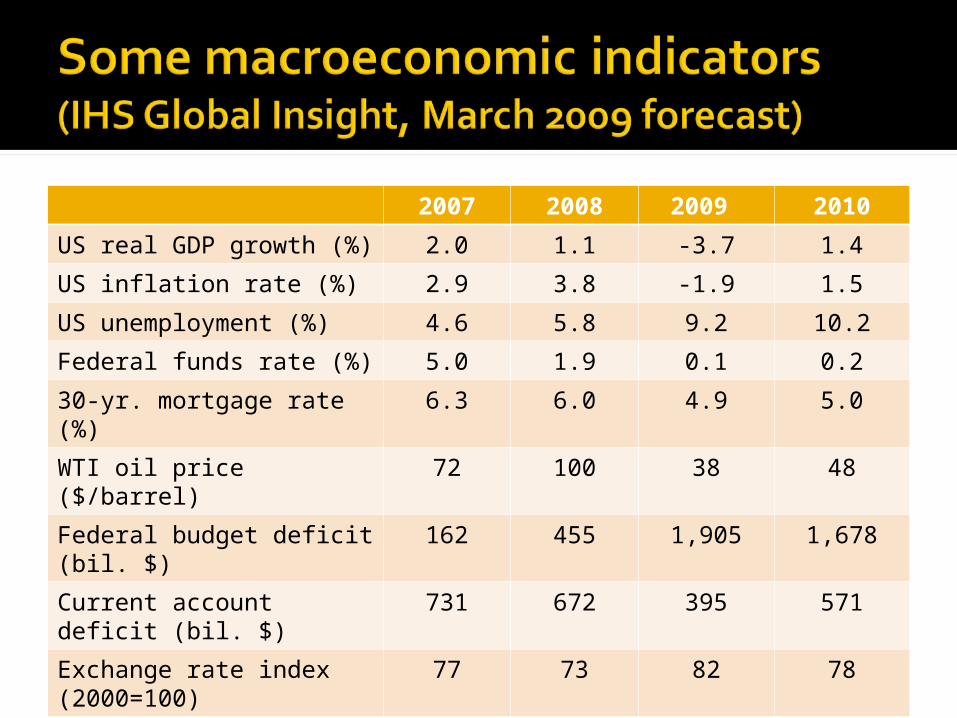
2007 2008 2009 2010
US real GDP growth (%) 2.0 1.1 -3.7 1.4
US inflation rate (%) 2.9 3.8 -1.9 1.5
US unemployment (%) 4.6 5.8 9.2 10.2
Federal funds rate (%) 5.0 1.9 0.1 0.2
30-yr. mortgage rate (%) 6.3 6.0 4.9 5.0
WTI oil price ($/barrel) 72 100 38 48
Federal budget deficit (bil. $)
162 455 1,905 1,678
Current account deficit (bil. $)
731 672 395 571
Exchange rate index (2000=100)
77 73 82 78
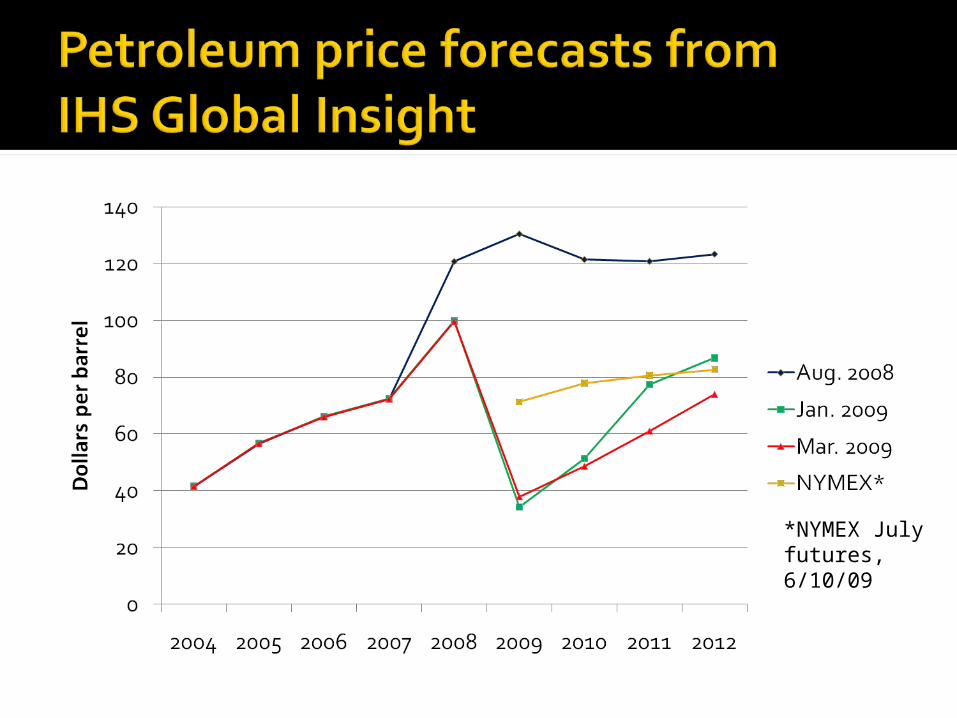
*NYMEX July futures, 6/10/09
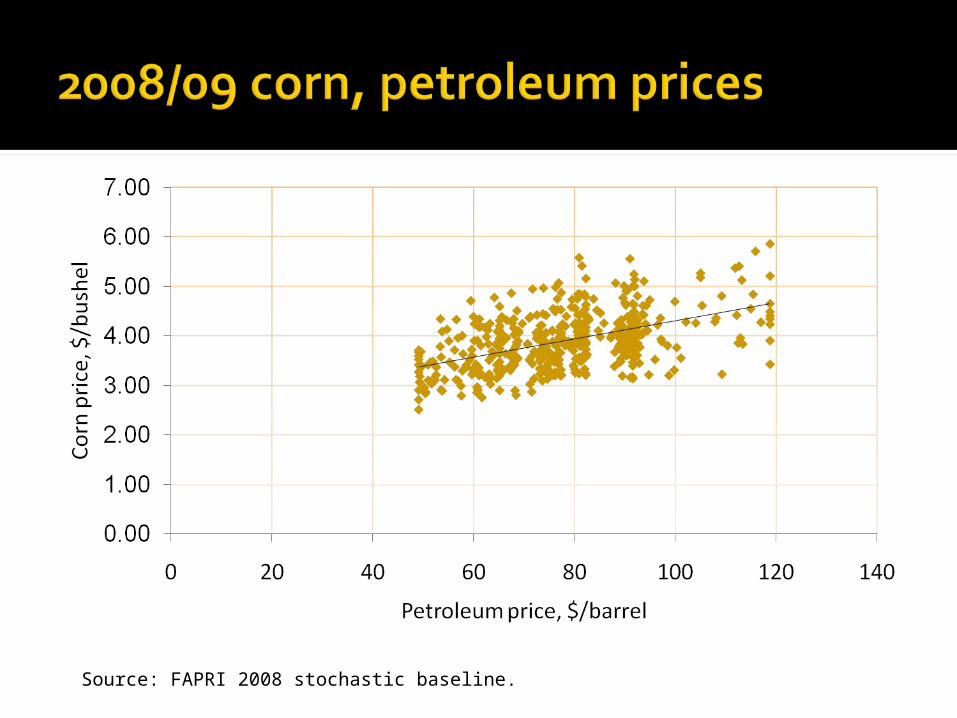
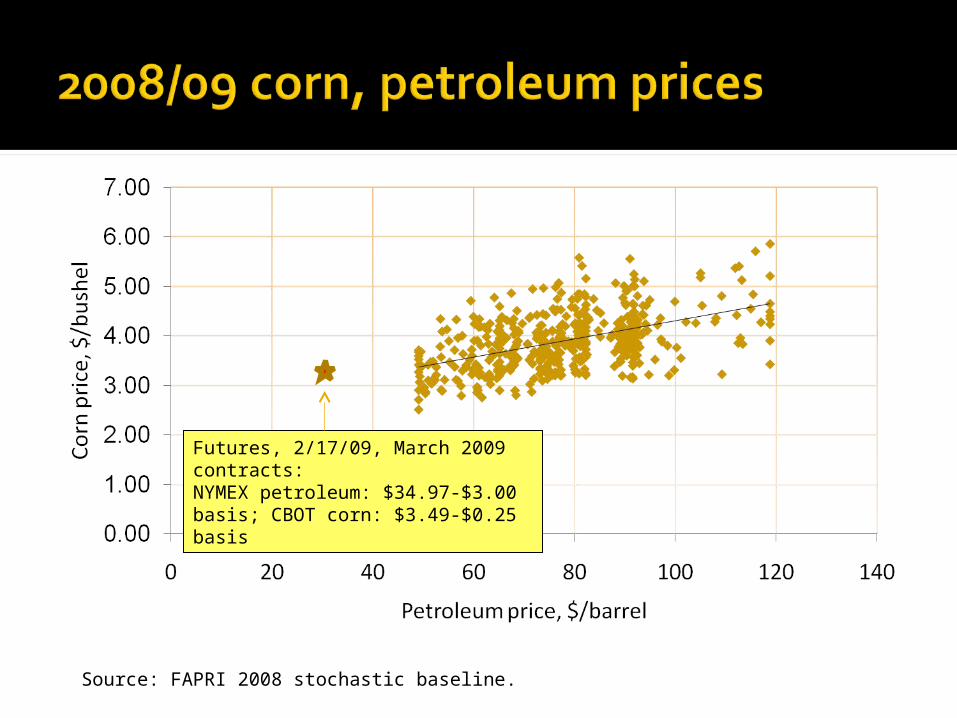
Source: FAPRI 2008 stochastic baseline.
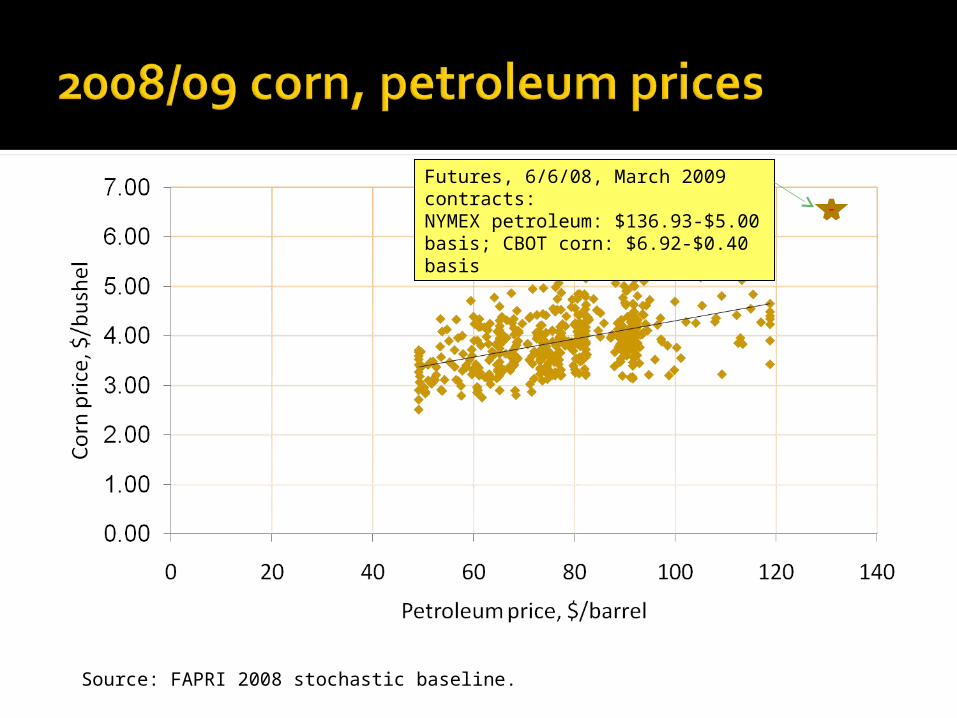
Source: FAPRI 2008 stochastic baseline.
Futures, 6/6/08, March 2009 contracts:NYMEX petroleum: $136.93-$5.00 basis; CBOT corn: $6.92-$0.40 basis
Source: FAPRI 2008 stochastic baseline.
Futures, 2/17/09, March 2009 contracts:NYMEX petroleum: $34.97-$3.00 basis; CBOT corn: $3.49-$0.25 basis
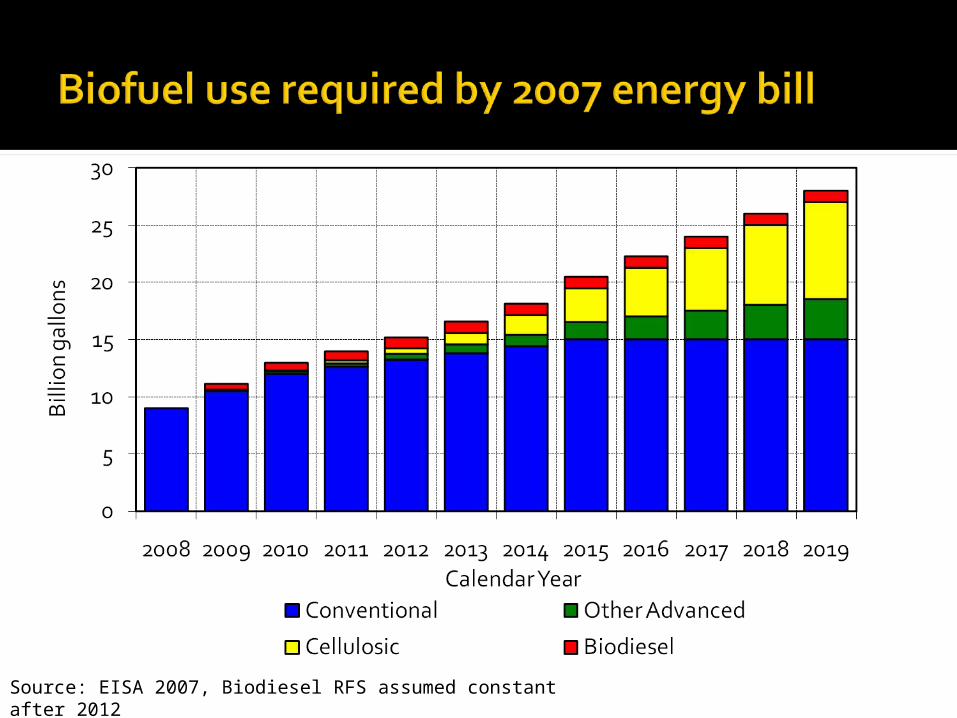
Source: EISA 2007, Biodiesel RFS assumed constant after 2012
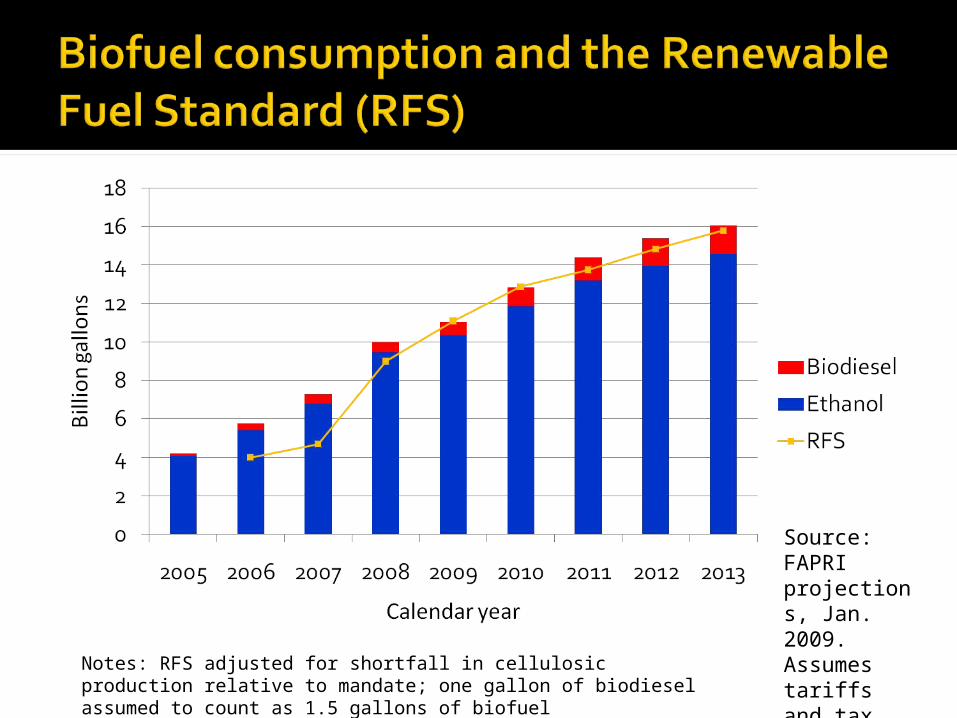
Source: FAPRI projections, Jan. 2009. Assumes tariffs and tax credits extendedNotes: RFS adjusted for shortfall in cellulosic production relative to mandate; one
gallon of biodiesel assumed to count as 1.5 gallons of biofuel
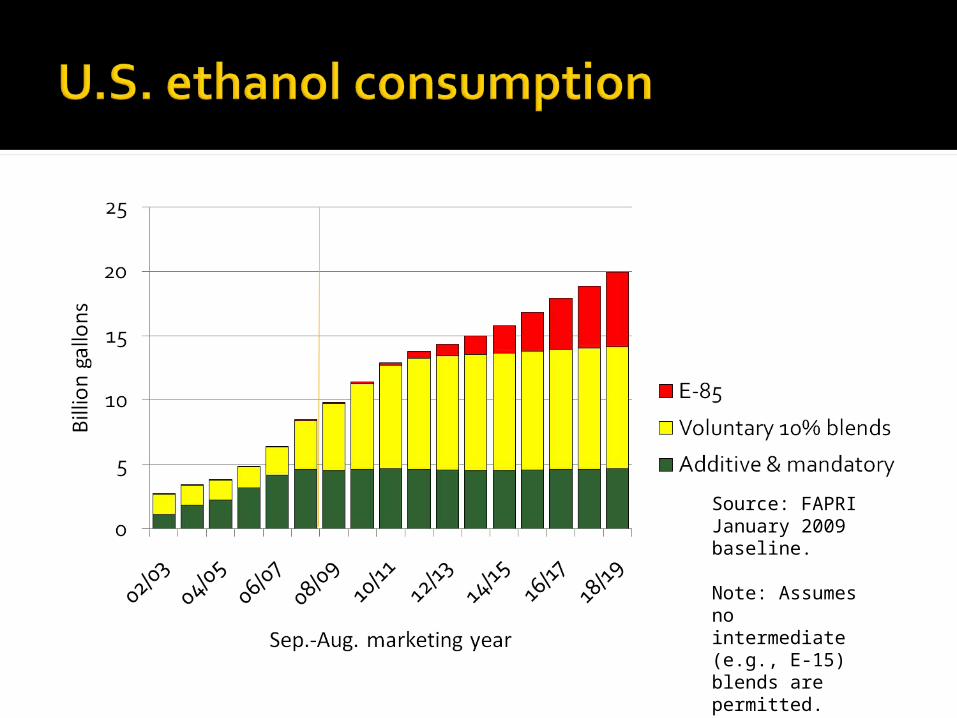
Source: FAPRI January 2009 baseline.
Note: Assumes no intermediate (e.g., E-15) blends are permitted.
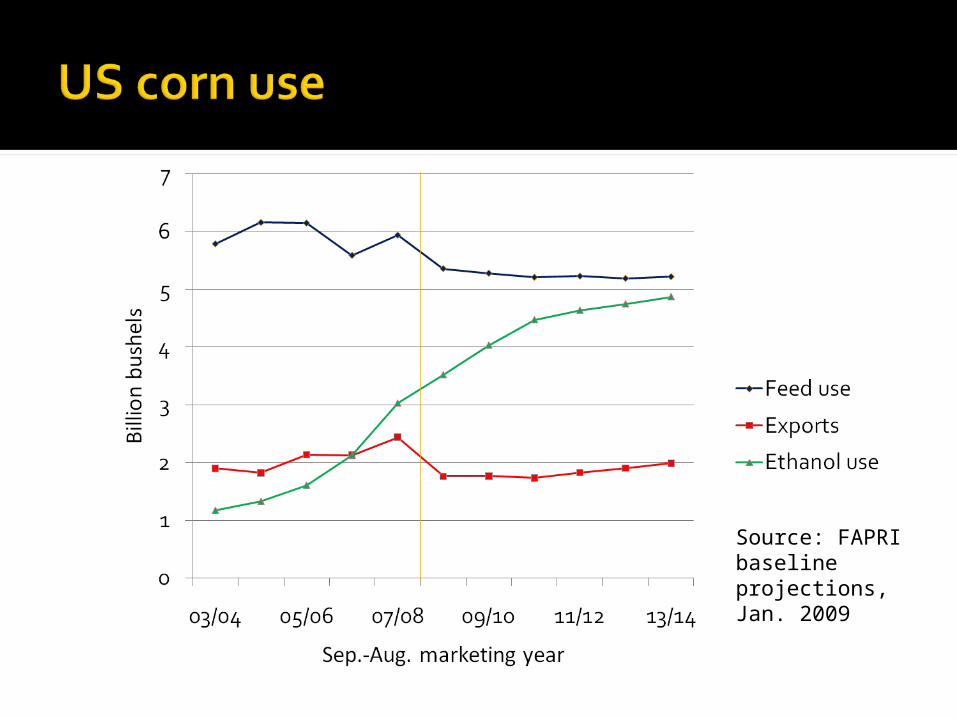
Source: FAPRI baseline projections, Jan. 2009
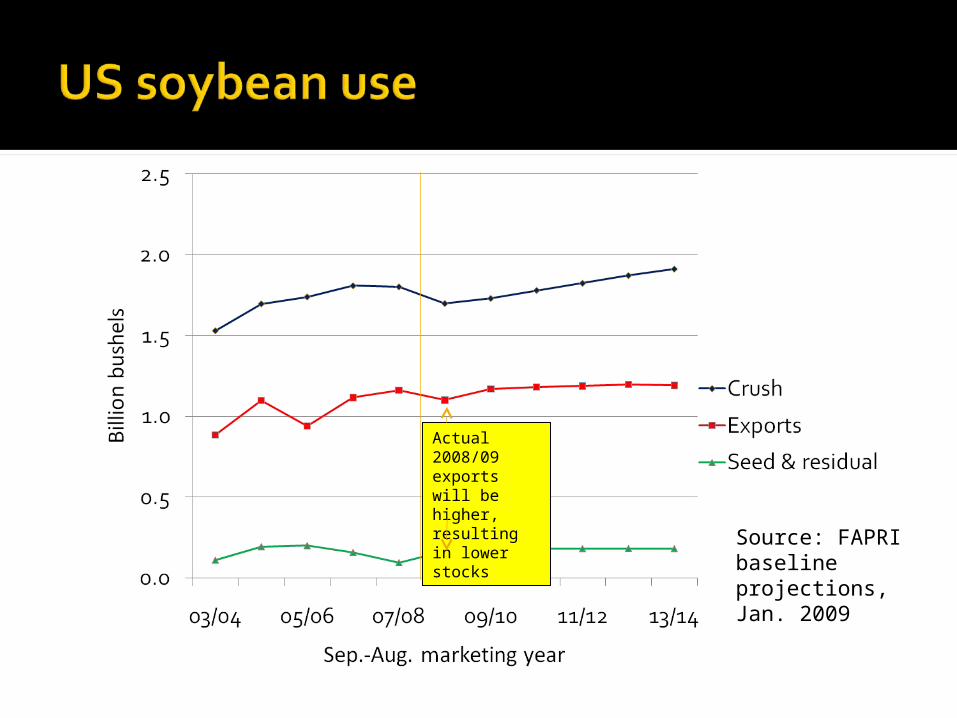
Source: FAPRI baseline projections, Jan. 2009
Actual 2008/09 exports will be higher, resulting in lower stocks
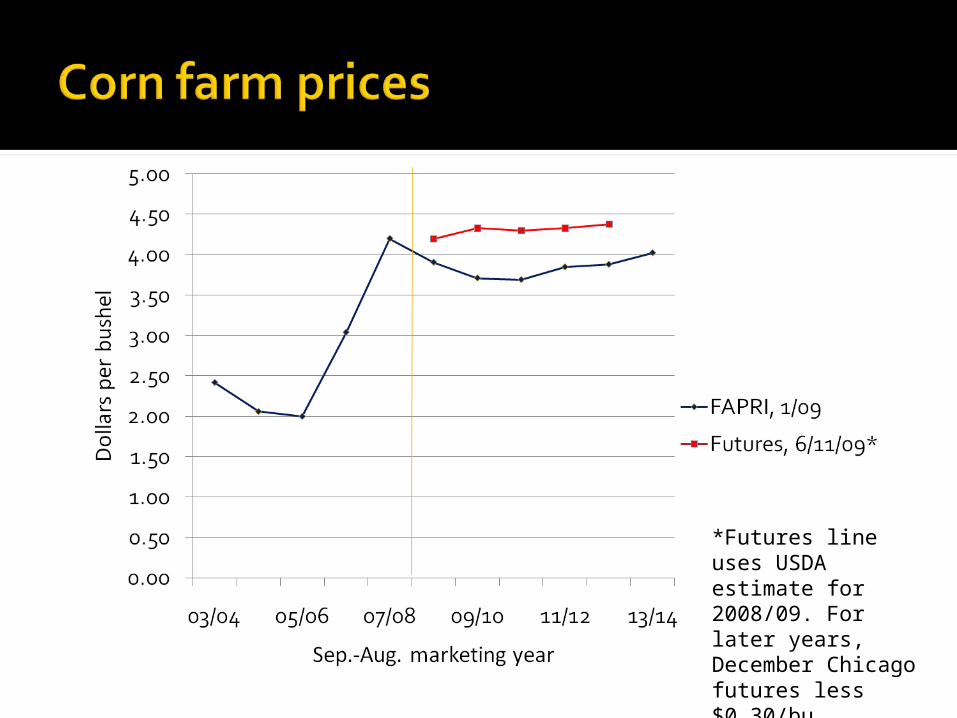
*Futures line uses USDA estimate for 2008/09. For later years, December Chicago futures less $0.30/bu. assumed basis.
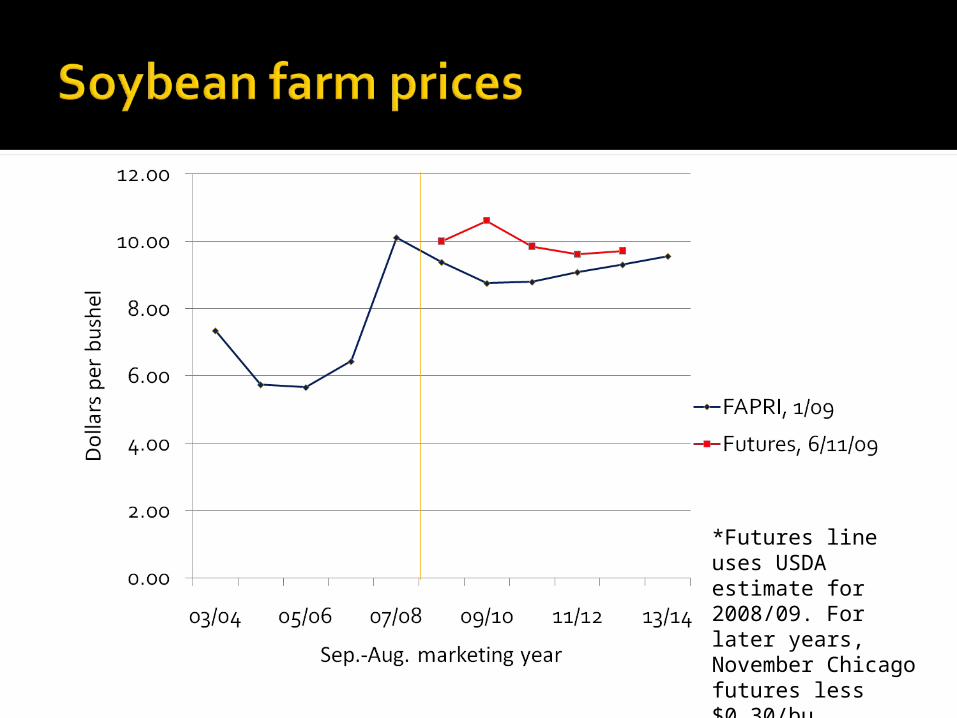
*Futures line uses USDA estimate for 2008/09. For later years, November Chicago futures less $0.30/bu. assumed basis.
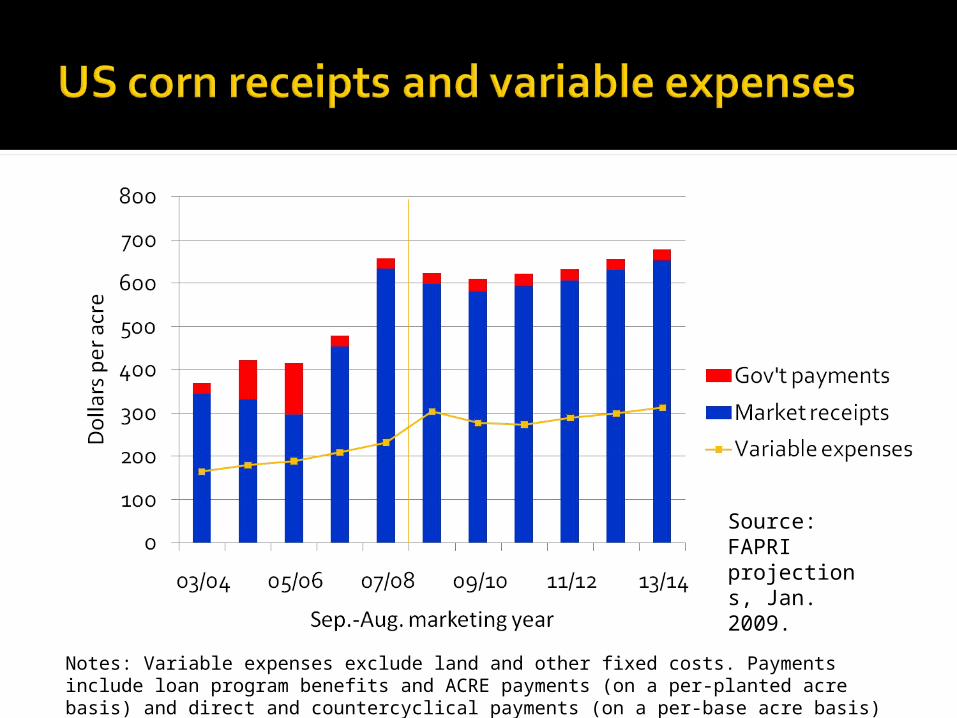
Source: FAPRI projections, Jan. 2009.
Notes: Variable expenses exclude land and other fixed costs. Payments include loan program benefits and ACRE payments (on a per-planted acre basis) and direct and countercyclical payments (on a per-base acre basis)
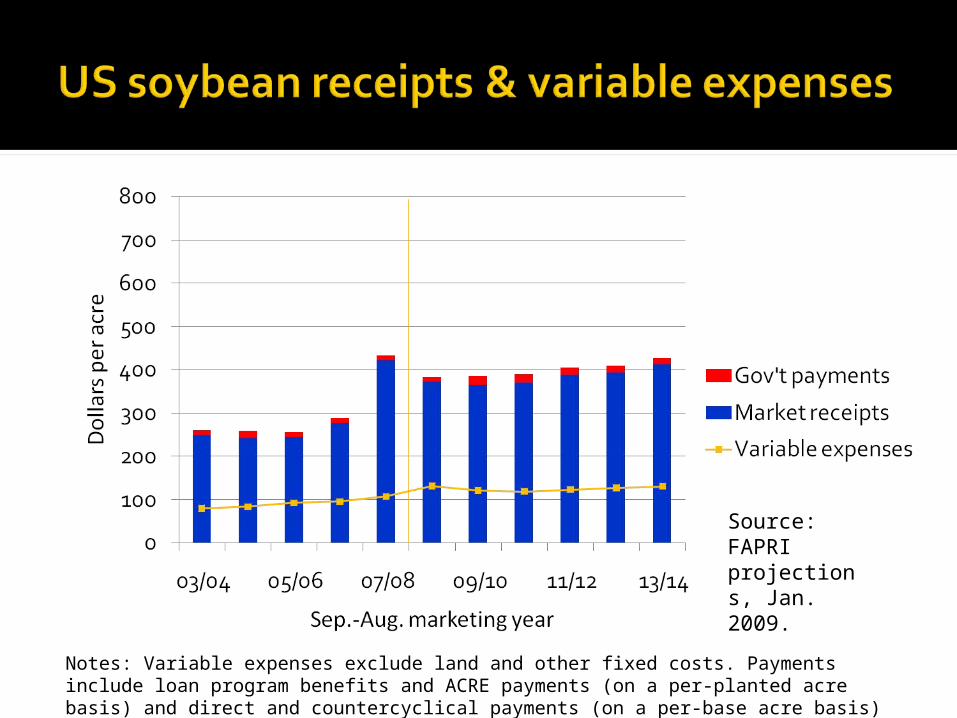
Source: FAPRI projections, Jan. 2009.
Notes: Variable expenses exclude land and other fixed costs. Payments include loan program benefits and ACRE payments (on a per-planted acre basis) and direct and countercyclical payments (on a per-base acre basis)
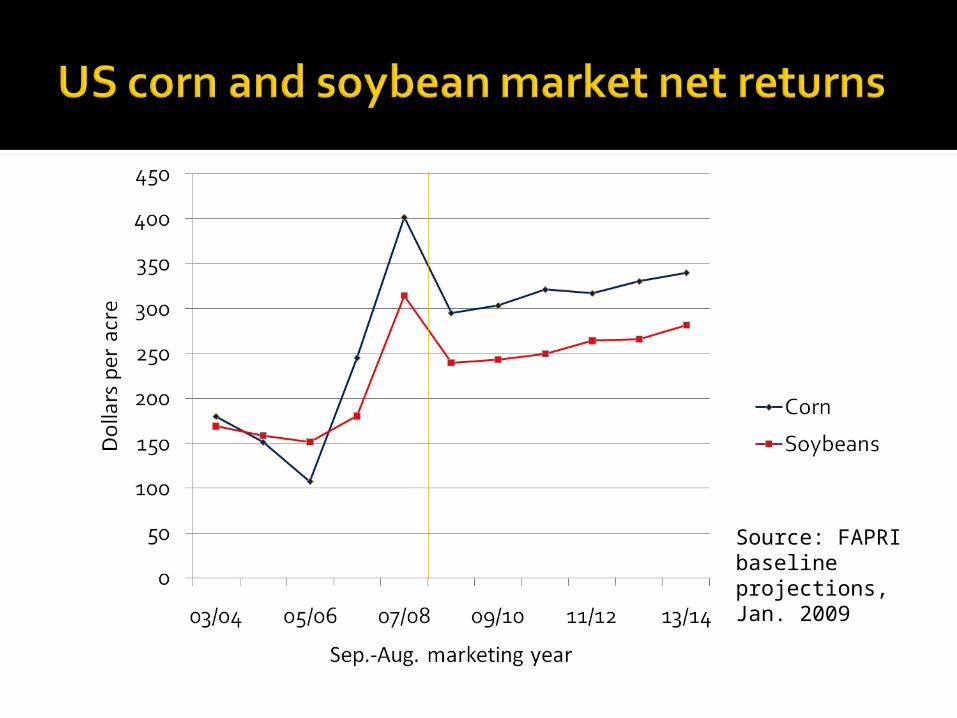
Source: FAPRI baseline projections, Jan. 2009
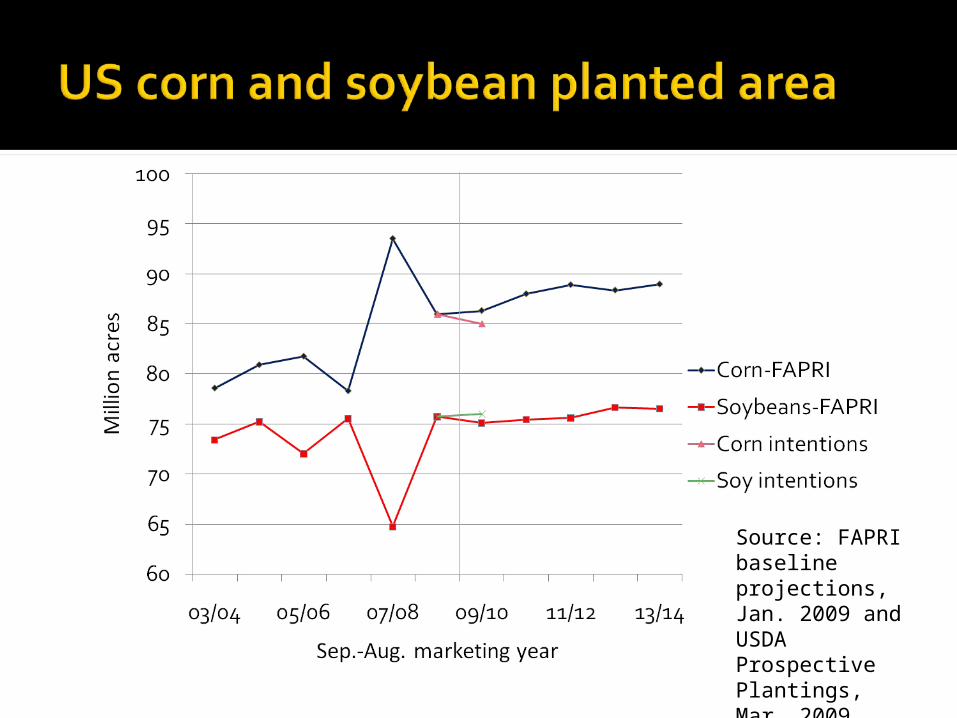
Source: FAPRI baseline projections, Jan. 2009 and USDA Prospective Plantings, Mar. 2009
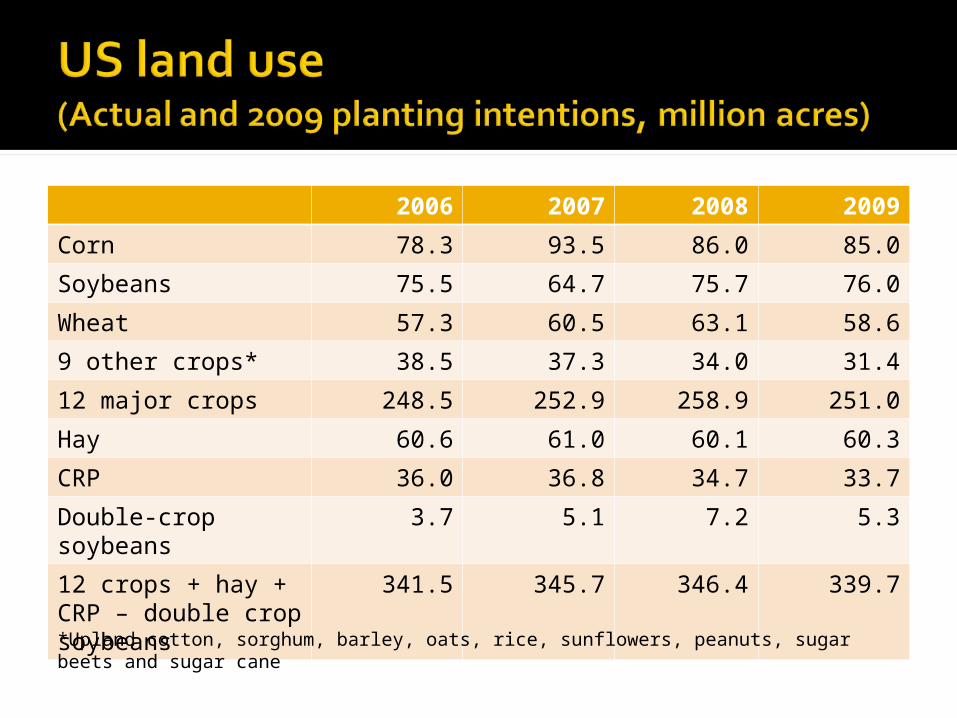
2006 2007 2008 2009
Corn 78.3 93.5 86.0 85.0
Soybeans 75.5 64.7 75.7 76.0
Wheat 57.3 60.5 63.1 58.6
9 other crops* 38.5 37.3 34.0 31.4
12 major crops 248.5 252.9 258.9 251.0
Hay 60.6 61.0 60.1 60.3
CRP 36.0 36.8 34.7 33.7
Double-crop soybeans
3.7 5.1 7.2 5.3
12 crops + hay + CRP – double crop soybeans
341.5 345.7 346.4 339.7
*Upland cotton, sorghum, barley, oats, rice, sunflowers, peanuts, sugar beets and sugar cane
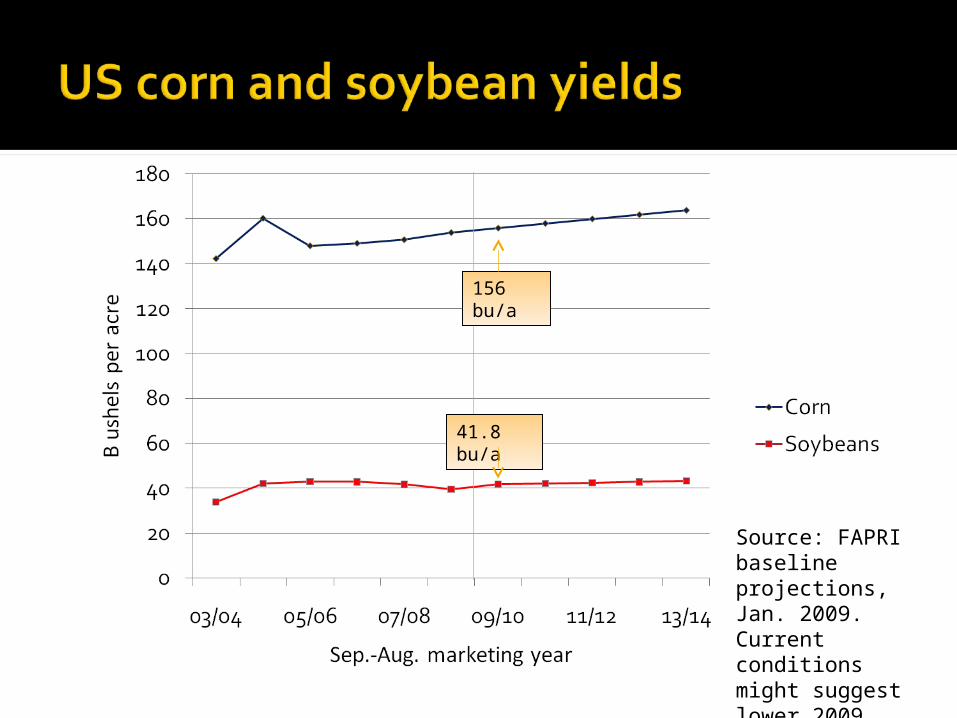
Source: FAPRI baseline projections, Jan. 2009. Current conditions might suggest lower 2009 corn yields are likely.
156 bu/a
41.8 bu/a
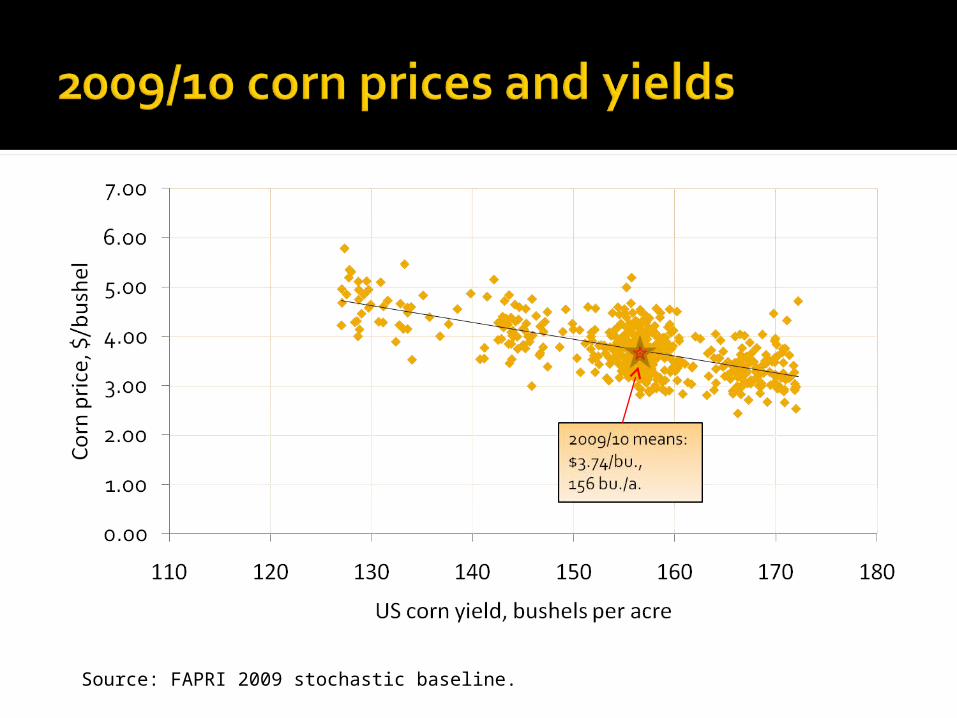
Source: FAPRI 2009 stochastic baseline.
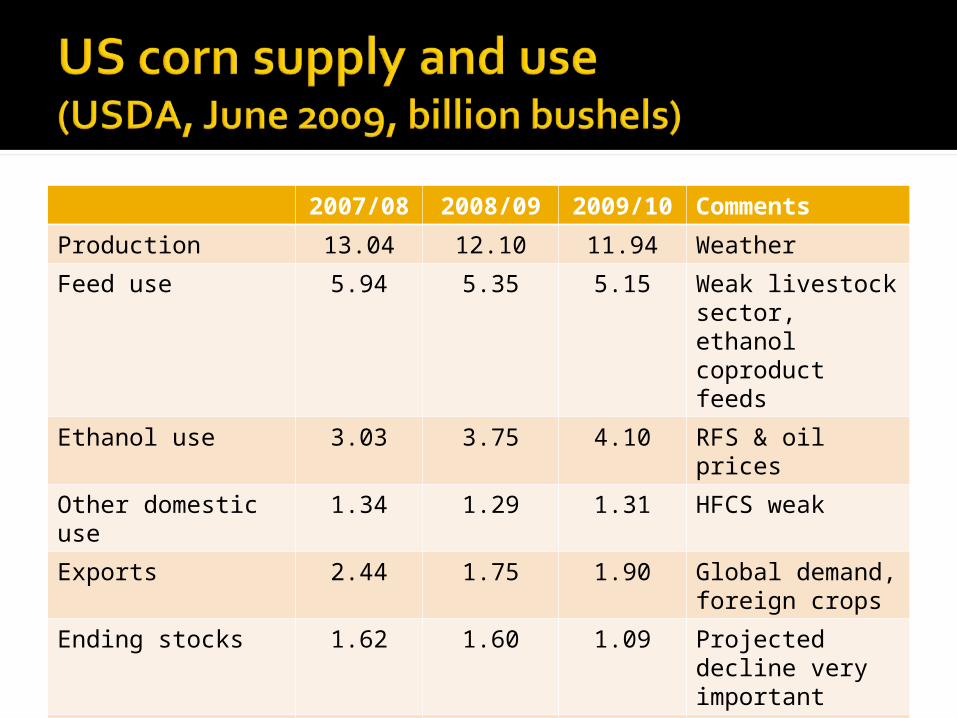
2007/08 2008/09 2009/10 Comments
Production 13.04 12.10 11.94 Weather
Feed use 5.94 5.35 5.15 Weak livestock sector, ethanol coproduct feeds
Ethanol use 3.03 3.75 4.10 RFS & oil prices
Other domestic use
1.34 1.29 1.31 HFCS weak
Exports 2.44 1.75 1.90 Global demand, foreign crops
Ending stocks 1.62 1.60 1.09 Projected decline very important
Farm price 4.20 4.10-4.30 3.90-4.70
Actual uncertainty even greater
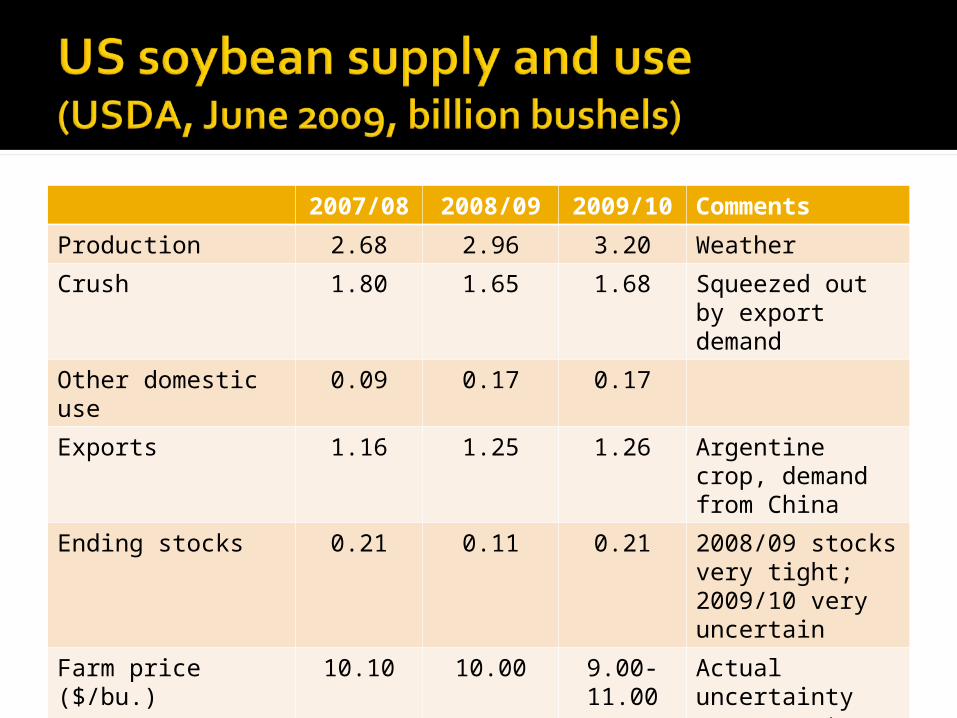
2007/08 2008/09 2009/10 Comments
Production 2.68 2.96 3.20 Weather
Crush 1.80 1.65 1.68 Squeezed out by export demand
Other domestic use
0.09 0.17 0.17
Exports 1.16 1.25 1.26 Argentine crop, demand from China
Ending stocks 0.21 0.11 0.21 2008/09 stocks very tight; 2009/10 very uncertain
Farm price ($/bu.) 10.10 10.00 9.00-11.00
Actual uncertainty even greater
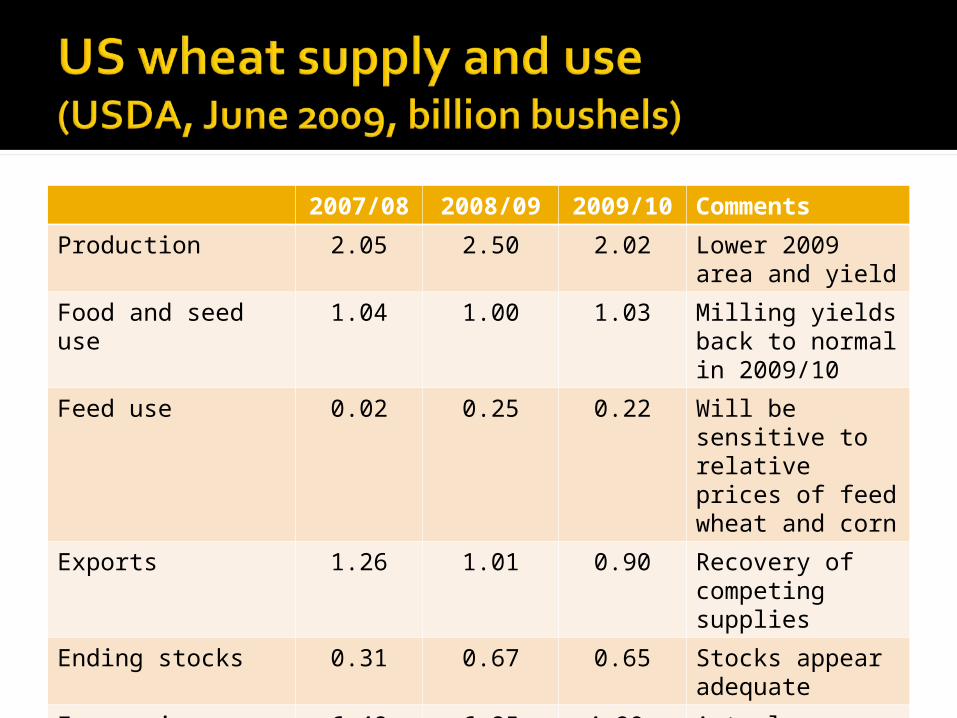
2007/08 2008/09 2009/10 Comments
Production 2.05 2.50 2.02 Lower 2009 area and yield
Food and seed use 1.04 1.00 1.03 Milling yields back to normal in 2009/10
Feed use 0.02 0.25 0.22 Will be sensitive to relative prices of feed wheat and corn
Exports 1.26 1.01 0.90 Recovery of competing supplies
Ending stocks 0.31 0.67 0.65 Stocks appear adequate
Farm price ($/bu.) 6.48 6.85 4.90-5.90
Actual uncertain even greater
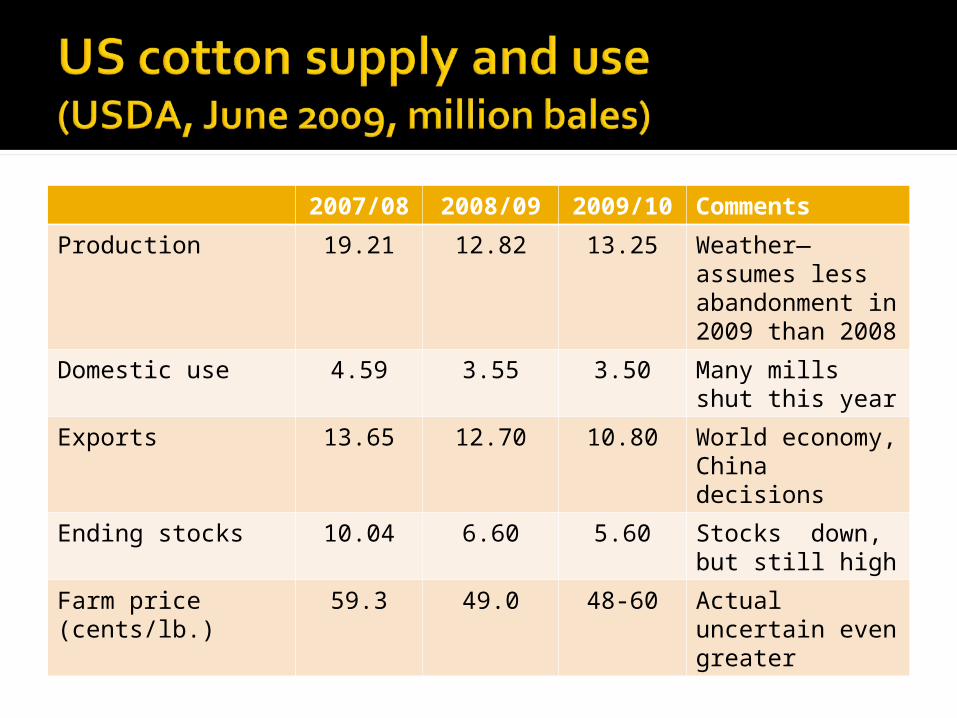
2007/08 2008/09 2009/10 Comments
Production 19.21 12.82 13.25 Weather—assumes less abandonment in 2009 than 2008
Domestic use 4.59 3.55 3.50 Many mills shut this year
Exports 13.65 12.70 10.80 World economy, China decisions
Ending stocks 10.04 6.60 5.60 Stocks down, but still high
Farm price (cents/lb.)
59.3 49.0 48-60 Actual uncertain even greater
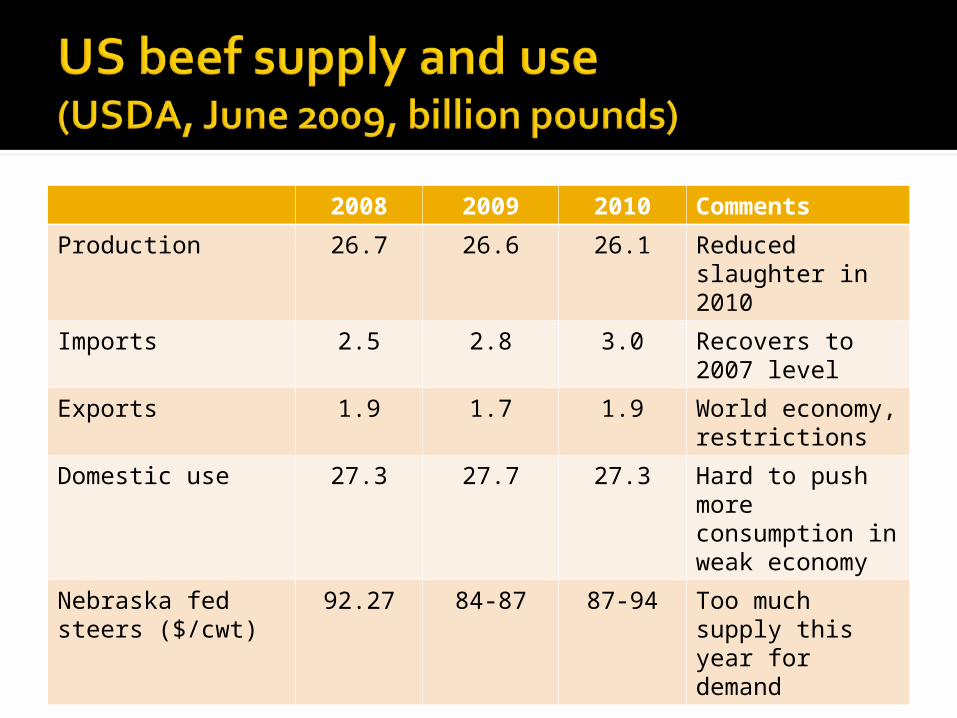
2008 2009 2010 Comments
Production 26.7 26.6 26.1 Reduced slaughter in 2010
Imports 2.5 2.8 3.0 Recovers to 2007 level
Exports 1.9 1.7 1.9 World economy, restrictions
Domestic use 27.3 27.7 27.3 Hard to push more consumption in weak economy
Nebraska fed steers ($/cwt)
92.27 84-87 87-94 Too much supply this year for demand
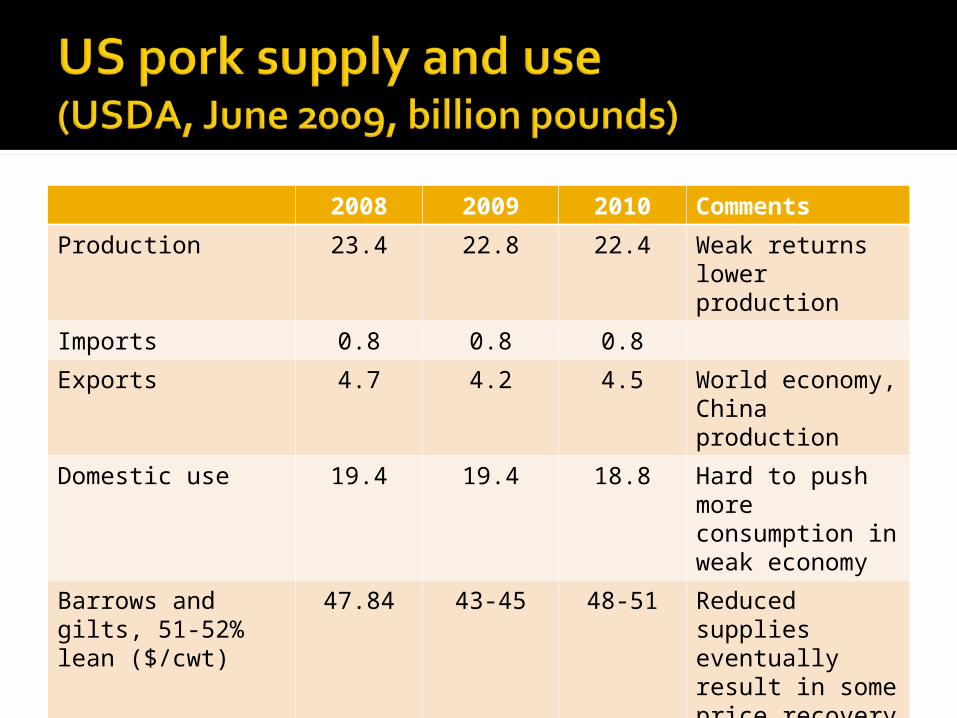
2008 2009 2010 Comments
Production 23.4 22.8 22.4 Weak returns lower production
Imports 0.8 0.8 0.8
Exports 4.7 4.2 4.5 World economy, China production
Domestic use 19.4 19.4 18.8 Hard to push more consumption in weak economy
Barrows and gilts, 51-52% lean ($/cwt)
47.84 43-45 48-51 Reduced supplies eventually result in some price recovery
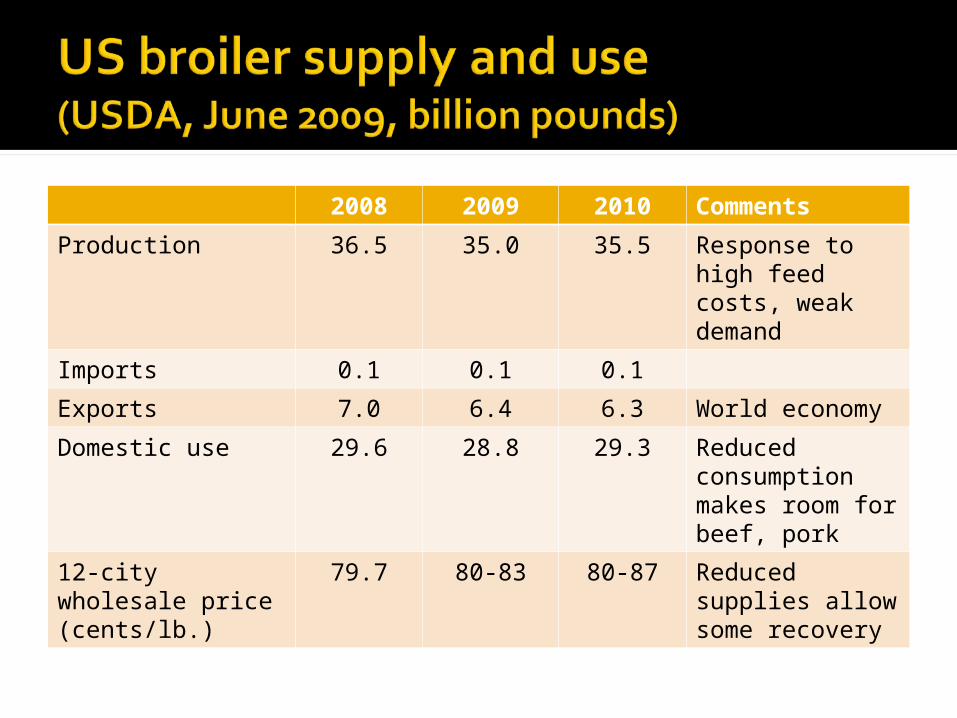
2008 2009 2010 Comments
Production 36.5 35.0 35.5 Response to high feed costs, weak demand
Imports 0.1 0.1 0.1
Exports 7.0 6.4 6.3 World economy
Domestic use 29.6 28.8 29.3 Reduced consumption makes room for beef, pork
12-city wholesale price (cents/lb.)
79.7 80-83 80-87 Reduced supplies allow some recovery
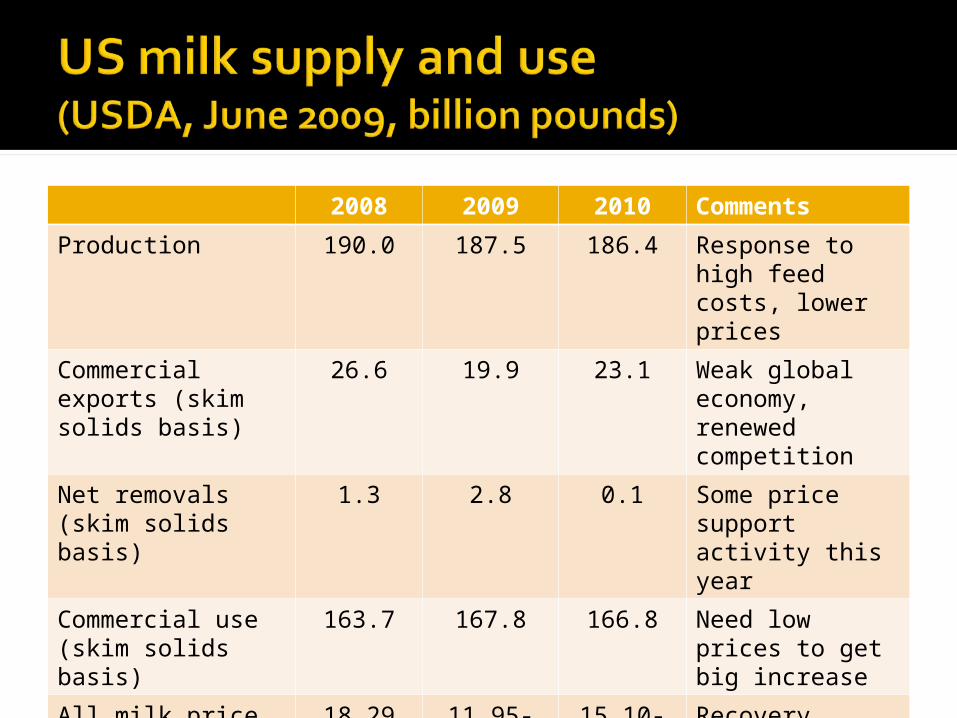
2008 2009 2010 Comments
Production 190.0 187.5 186.4 Response to high feed costs, lower prices
Commercial exports (skim solids basis)
26.6 19.9 23.1 Weak global economy, renewed competition
Net removals (skim solids basis)
1.3 2.8 0.1 Some price support activity this year
Commercial use (skim solids basis)
163.7 167.8 166.8 Need low prices to get big increase
All milk price 18.29 11.95-12.35
15.10-16.10
Recovery requires less production, stronger use
For 25 years, FAPRI has analyzed agricultural markets and policies for Congress and other decision makers
Our approach Provide objective analysis Don’t endorse or oppose policies Address the questions decision makers care
about Make analysis available when it’s needed
2008 Farm Bill work Changes in target prices, loan rates, etc. ACRE program
Biofuel policies (latest—May 2009)
International work WTO-related issues Policy issues in Europe, Korea, Mexico, S.
Africa
November: preliminary world baseline December: DC baseline review January: revised world baselineFebruary: stochastic baseline (500 futures)March: release baseline in DC, MissouriApril-October: policy analysis, model work July or August: baseline update if needed

In response to Congressional request First priority to Congressional Agriculture
Committees (e.g., farm bill work) Requests from other members and staffs
(e.g., recent ethanol policy analysis) As part of grant-funded projects
U.S. agencies (USDA, Dept. of Energy, EPA…) International agencies (OECD, FAO, agencies
in Ireland, UK, S. Africa, Mexico, and S. Korea) And a few on our own initiative
Be as objective and fair as possible We’ve worked with Democrats and Republicans,
House and Senate, aggies and urban members Avoid partisanship, endorsing or opposing
specific policies Know how to be useful
Pay attention to what’s happening on the Hill Deliver results when they’re needed Recognize some important work will never show
up in a public report—phone calls, e-mails matter
Farm markets remain very volatile, but most likely case is that crop prices remain above pre-2007 levels but below 2008 peaks
Future depends on economic recovery, oil markets, weather, and much more
Analysis of policy, market alternatives likely to be of continued interest