Embed Size (px)
Citation preview

Copyright is owned by the Author of the thesis. Permission is given for a copy to be downloaded by an individual for the purpose of research and private study only. The thesis may not be reproduced elsewhere without the permission of the Author.
THE EFFECTS OF WATER ACTIVITY,
PARTICLE SIZE DISTRIBUTION AND
FREE FAT CONTENT ON FLOWABILITY OF
GRATED AND DRIED P ARMESAN CHEESE
A THESIS PRESENTED IN PARTIAL FULFILMENT OF THE REQUIREMENTS FOR THE DEGREE OF MASTER OF TECHNOLOGY
IN FOOD TECHNOLOGY
AT MASSEY UNIVERSITY
PALMERSTON NORTH NEW ZEALAND
DAPHNE (XIN) GU
2000
ABSTRACT
A study was made of the effects of water activity, particle size distribution and free fat
content on flowability of Grated and Dried Parmesan cheese made by Greenwood
Valley Cheese Company (GVC) and by Kraft. The three parameters were modified to
span a wide range around the original level of each.
Water activity (Aw) was decreased / increased through water sorption. A range of
particle sizes for each of the samples was obtained by separating the samples into two
fractions and then combining them together to different levels. Samples were sieved
through a stack of sieves with different mesh sizes and particle size was expressed in
terms of median particle size. A range of free fat levels was obtained by spraying
samples with anhydrous milk fat (AMF). The response of flowability to changes m
these parameters was assessed. Flowability was measured by using a rotating drum.
The results in the preliminary study showed that flowability increased with increasing
moisture content from 18 to 22%, which is in contradiction to the normal expectation
from the literature. Therefore, the hypothesis: flowability increases with increasing
moisture content I Aw was proposed.
To test the validity of the hypothesis, several trials were conducted. The results in the
first trial showed that flowability increased with increasing Aw from 0.66 to 0.79 for
both GVC and Kraft products. The results also revealed a possible critical Aw between
0.79 to 0 .83 at which the products could have their optimum flowability .
In the next trial, additional values in the Aw range between 0.79 to 0.83 were included.
The results showed that flowability increased with increasing Aw from 0.67 to the
critical Aw value and dropped down above this value. The critical Aw values for GVC
products were determined at 0.80 ± 0.01. Kraft' s product did not show this increasing
trend or the critical Aw value.
11
A series of commercial samples with different Aw levels from two of each of GVC
products were chosen to test the hypothesis. Variation in water activity naturally
occurred during processing due to the slight changes in drying conditions. The results
obtained on these commercial samples showed flowability increased with increasing Aw
from 0.69 to 0.77. Therefore, the hypothesis has been proven.
The study on the effect of particle size shows flowability also increased with increasing
median particle size for both GVC and Kraft products. Of the methods chosen to plot
cumulative undersize versus sieve size, linear regression is suggested rather than simply
joining the points. This is because all the points are taken into account when linear
regression is used.
The study conducted on the effect of free fat shows that flowability decreased with
increasing free fat levels from 16.8 to 26.3%. The sieve analysis results on the samples
with different free fat levels show that median particle size increased from 721 to 1476
µm with increasing free fat levels from 16.8 to 26.3%. This was presumably caused by
particle aggregation. The results show that the positive effect of particle size on
flowability could not counteract the negative effect of free fat. Further study is required
to confirm the net effect of free fat and particle size.

lll
ACKNOWLEDGEMENTS
I gratefully acknowledge my chief supervisor, Mr Rod Bennett, for arrangement of this
project and the research collaboration with the New Zealand Dairy Research Institute. I
am in debt for his support and encouragement throughout my study. Also, I would like
to thank my supervisor Mr Rohan Wewala, from the New Zealand Dairy Research
Institute, for his invaluable ideas, guidance, and encouragement throughout the project.
It was my honour to work with them. Special thanks to both of them for their diligence,
persistence, professional suggestions in the finalisation of this thesis and their tolerance
and patience in editing the manuscript of the thesis.
My gratitude extends to Mr Stephen Gregory, for organising the financial issues in this
study. Special thanks to Dr. Stephen Dybing from New Zealand Milk Products (North
America) for his technical support and endless patience on editing of my thesis.
I wish to record my gratitude to the New Zealand Dairy Research Institute for allowing
my attendance at this M.Tech course and for providing the opportunity to work with the
experienced scientists. Special thanks are also extended to Mr. Allan Main (Cheese
Food Portfolio Manager), Dr Russell Wilson (Consumer Application Section Manager),
Dr. P. K. Sama!, Dr. Justin Bendall, Dr. Rob Crawford, Dr. Frank Visser, Allan Dodge,
Angela Veale, Ivan Simpson, Kathy Davidson, Peter Elston, and all other staff at New
Zealand Dairy Research Institute for their great support and friendship to complete this
project successfully.
Finally, many thanks to my parents and my brother, for encouragement and support
shown during the study.
TABLE OF CONTENTS
ABSTRACT
ACKNOW:LEDGEMENTS ---------------------------------------------------------------
TABLE OF CONTENTS ------------------------------------------------------------------
LIST OF FIGURES ------------------------------------------------------------------------
LIST OF TABLES --------------------------------------------------------------------------
CHAPTER 1 INTRODUCTION ----------------------------------------------------------
CHAPTER 2 LITERATURE REVIEW --------------------------------------------------
2.1 Mechanism of Flowability ---------------------------------------------------------
2.1.1 Cohesion/ cohesiveness and flowability ------------------------------------
2.1.2. Mechanism of flow ability -----------------------------------------------------
2.1.2.1 Formation of solid bridges -------------------------------------------------
2.1.2.2 Liquid bridges ---------------------------------------------------------------
2.1.2.3 Capillary liquid formed in completely or partly filled pores of the
iv
lll
IV
IX
XI
1
4
4
5
5
6
7
agglomerates ---------------------------------------------------------------- 7
2.1.2.4 Van der W aals' and electrostatic forces --------------------------------- 7
2.1.2.5 Mechanical interlocking --------------------------------------------------- 8
2.1.2.6 Functions of flow conditioners ------------------------------------------- 8
2.2 Factors Affecting Flowability ----------------------------------------------------- 8
2.2.1 Particle shape, particle size and particle size distribution ------------------ 8
2.2.1.1 Particle shape ---------------------------------------------------------------- 8
V
2.2.1.2 Particle size and particle size distribution ------------------------------- 9
2.2.2 Particle density, surface area and porosity ----------------------------------- 11
2.2.3 Bulk density and tapping ------------------------------------------------------- 13
2.2.4 Angle of repose and other handling angles ---------------------------------- 14
2.2.5 Moisture content, Aw and moisture sorption isotherm --------------------- 15
2.2.5.1 Basic definitions and fundamental properties --------------------------- 15
2.2.5.2 Aw and flowability ---------------------------------------------------------- 17
2. 2.5 .3 Free fat ----------------------------------------------------------------------- 18
2.2.5 .4 Protein ----------------------------------------------------------------------- 19
2.2.5 .5 Miscellaneous factors ------------------------------------------------------ 19
2.3 Evaluation of Flowability ---------------------------------------------------------- 20
2.3 .1 Sampling -------------------------------------------------------------------------- 20
2.3.2 Evaluation of flowability ------------------------------------------------------ 20
2.4 Properties Related to Flowability ------------------------------------------------- 21
2.4.1 Particle size distribution -------------------------------------------------------- 21
2.4.2 Angle of repose ------------------------------------------------------------------ 22
2.4.3 Evaluation related to failure properties --------------------------------------- 23
2.5 Conclusions -------------------------------------------------------------------------- 23
CHAPTER 3 MATERIALS AND METHODS ----------------------------------------- 25
3 .1 Materials ----------------------------------------------------------------------------- 25
3.1.1 Samples used to examine the suitability of the method to measure
flowability and particle size distribution ----------------------------------- 25
3.1.1.1 Samples used to examine the suitability of the method to measure
flow ability ------------------------------------------------------------------ 25
VI
3.1.1.2 Samples used to examine the suitability of the method to measure
particle size distribution --------------------------------------------------- 25
3.1.2 Preliminary study on the effect of moisture content on flowability ------ 25
3.1.3 Samples used for confirming the effects of Aw, particle size distribution
and free fat on flowabi Ii ty ----------------------------------------------------- 26
3.1.4 Commercial samples with different Aws that were used for further
confirmation of the effect on flowability ------------------------------------ 27
3 .2 Methods ------------------------------------------------------------------------------- 27
3.2.1 Characterisation of selected physical properties ---------------------------- 27
3.2.1.1 Examining the suitability of the method to measure flowability by a
rotating drum ---------------------------------------------------------------- 27
3.2.1.2 Examining the suitability of the test method to measure particle size
di stri buti on ------------------------------------------------------------------- 3 3
3 .2.1.3 Measurement of free fat content ------------------------------------------ 37
3.2.1.4 Measurement of Aw --------------------------------------------------------- 37
3.2.2 Manipulation of physical and compositional parameters ------------------ 38
3.2.2.1 Water activity manipulation ----------------------------------------------- 38
3.2.2.2 Particle size distribution manipulation ----------------------------------- 40
3 .2 .2. 3 Free fat manipulation ------------------------------------------------------- 41
3 .3 Data Analysis ------------------------------------------------------------------------- 4 2
CHAPTER 4 THE EFFECT OF Aw ON FLOW ABILITY ---------------------------- 43
4.1 Preliminary Study on the Relationship between Flowability and Moisture
Content ------------------------------------------------------------------------------- 43
4.2 Hypothesis Development of the Effect of Aw on Flowability ----------------- 46
4.2.1 Use of Aw instead of moisture content ---------------------------------------- 46
Vll
4.2.2 The relationship between Aw and moisture content ------------------------- 46
4.2.3 Hypothesis development of the effect of Aw of flowability --------------- 47
4.3 Testing the Hypothesis of Increasing Flowability by increasing Aw ---------- 47
4.4 Confirmation of the Critical Aw ---------------------------------------------------- 50
4.5 Further Testing the Hypothesis of
Increasing Flowability by Increasing Aw ----------------------------------------- 52
4. 6 Disc us s ion --------------------------------------------------------------------------- 5 5
CHAPTER 5 THE EFFECT OF PARTICLE SIZE ON FLOW ABILITY ---------- 59
5.1 The Effect of Particle Size on Flowability of 50017HM ----------------------- 59
5.2 The Effect of Particle Size Distribution on Flowability of 50017, 69430 and
Kraft ----------------------------------------------------------------------------------- 66
5. 3 Discussion --------------------------------------------------------------------------- 71
5.3.1 The effect of particle size on flowability ------------------------------------- 71
5.3.2 Methods chosen to plot the cumulative undersize versus sieve size ------ 73
CHAPTER 6 THE EFFECT OF FREE FAT ON FLOW ABILITY ------------------ 77
6.1 The Effect of Free Fat --------------------------------------------------------------- 77
6.2 Free Fat and Particle Aggregation ------------------------------------------------- 80
6.3 Discussion --------------------------------------------------------------------------- 82
6.3.1 The effect of free fat on flowability ------------------------------------------ 82
6.3.2 The effect of free fat on particle aggregation ------------------------------- 83
6.3.3 Is there a net effect of free fat and particle size on flowability ---------- 83
viii
CHAPTER 7 CONCLUSIONS ---------------------------------------------------------- 86
FURTHER WORK -------------------------------------------------------------------------- 88
REFERENCES ------------------------------------------------------------------------------- 89
APPENDICES ------------------------------------------------------------------------------- 96
lX
LIST OF FIGURES
Figure 2.1 Mechanisms of adhesion between solid particles and a solid plate
in a gaseous environment ------------------------------------------------ 6
Figure 2.2 Two different size distribution with the same arithmetic mean ---- 10
Figure 2.3 General sorption isotherm ----------------------------------------------- 16
Figure 2.4 Schematic representation of the effect of temperature on Aw and
moisture content ----------------------------------------------------------- 17
Figure 3.1 A photo of the motorised rotating drum used for measuring
flow abi Ii ty ----------------------------------------------------------------- 2 8
Figure 3.2 Flow chart of the procedure of determining particle size
distribution by sieving ---------------------------------------------------- 34
Figure 3.3 Schematic diagram of the apparatus used to manipulate Aw -------- 39
Figure 4.1 Flowability of nine GVC Grated and Dried Parmesan samples that
were used in the preliminary study on the effect of moisture
content on flowability ---------------------------------------------------- 44
Figure 4.2 The relationship between Aw and flowability for GVC: 22 NA, 21
NA, 18 NA & Kraft samples--------------------------------------------- 48
Figure 4.3 Flowability versus Aw of 50017HM, 50017, 69430 and Kraft ----- 51
Figure 4.4 The effect of Aw on flowability for the commercial Grated and
Dried Parmesan cheese samples: GVC 50017 and 50064 ----------- 54
Figure 4.5 Cohesion of powders at different water activities -------------------- 57
Figure 5.1 Cumulative undersize (%) versus sieve size of 50017HM ---------- 62
Figure 5.2 Flowability versus median particle size of 500117HM -------------- 65
Figure 5.3 Flowability versus median particle size
of 50017, 69430 and Kraft ----------------------------------------------- 70
Figure 5.4 Flowability versus median particle size obtained by using
Sigmaplot linear regression of various products ---------------------- 72
X
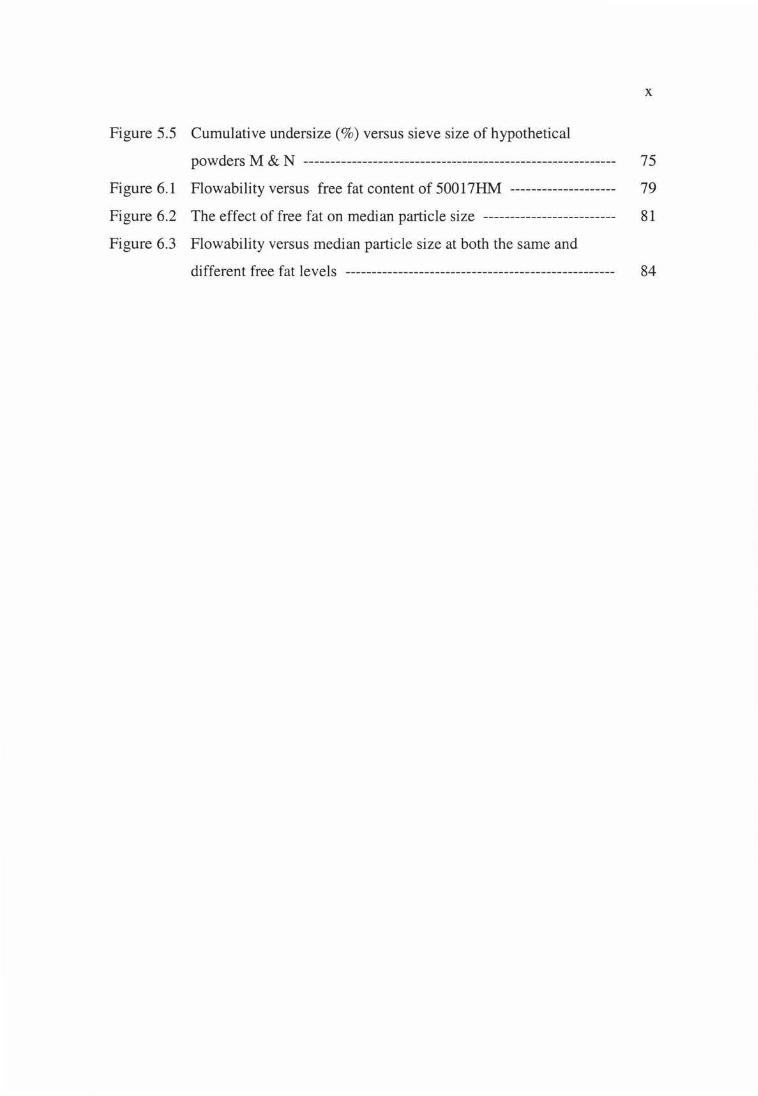
Figure 5.5 Cumulative undersize (%) versus sieve size of hypothetical
powders M & N ----------------------------------------------------------- 7 5
Figure 6.1 Flowability versus free fat content of 50017HM -------------------- 79
Figure 6.2 The effect of free fat on median particle size ------------------------- 81
Figure 6.3 Flowability versus median particle size at both the same and
different free fat levels --------------------------------------------------- 84
XI
LIST OF TABLES
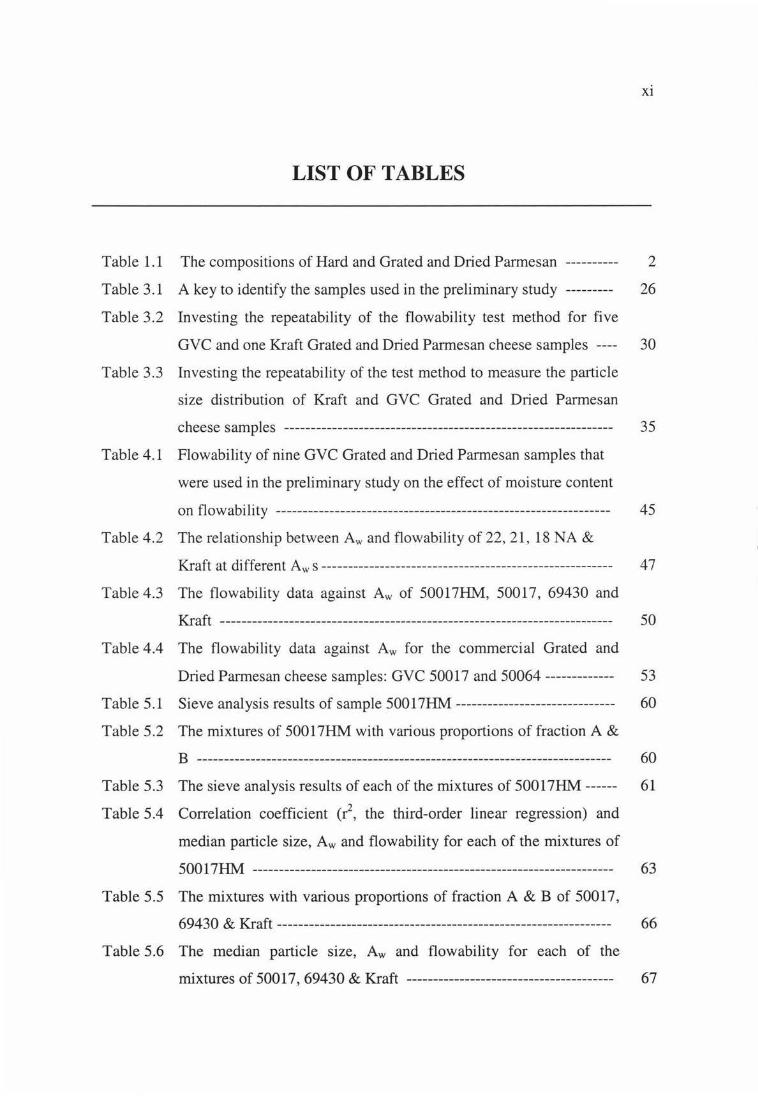
Table 1.1 The compositions of Hard and Grated and Dried Parmesan ---------- 2
Table 3 .1 A key to identify the samples used in the preliminary study --------- 26
Table 3.2 Investing the repeatability of the flowability test method for five
GVC and one Kraft Grated and Dried Parmesan cheese samples ---- 30
Table 3.3 Investing the repeatability of the test method to measure the particle
size distribution of Kraft and GVC Grated and Dried Parmesan
cheese samples -------------------------------------------------------------- 35
Table 4.1 Flowability of nine GVC Grated and Dried Parmesan samples that
were used in the preliminary study on the effect of moisture content
on fl owabi Ii ty --------------------------------------------------------------- 4 5
Table 4.2 The relationship between Aw and flowability of 22, 21, 18 NA &
Kraft at different Aw s ------------------------------------------------------- 4 7
Table 4.3 The flowability data against Aw of 50017HM, 50017, 69430 and
Kraft -------------------------------------------------------------------------- 50
Table 4.4 The flowability data against Aw for the commercial Grated and
Dried Parmesan cheese samples: GVC 50017 and 50064 ------------- 53
Table 5 .1 Sieve analysis results of sample 50017HM ------------------------------ 60
Table 5.2 The mixtures of 50017HM with various proportions of fraction A &
B ------------------------------------------------------------------------------ 60
Table 5.3 The sieve analysis results of each of the mixtures of 50017HM ------ 61
Table 5.4 Correlation coefficient (r2, the third-order linear regression) and
median particle size, Aw and flowability for each of the mixtures of
50017HM -------------------------------------------------------------------- 63
Table 5.5 The mixtures with various proportions of fraction A & B of 50017,
69430 & Kraft --------------------------------------------------------------- 66
Table 5.6 The median particle size, Aw and flowability for each of the
mixtures of 50017, 69430 & Kraft --------------------------------------- 67
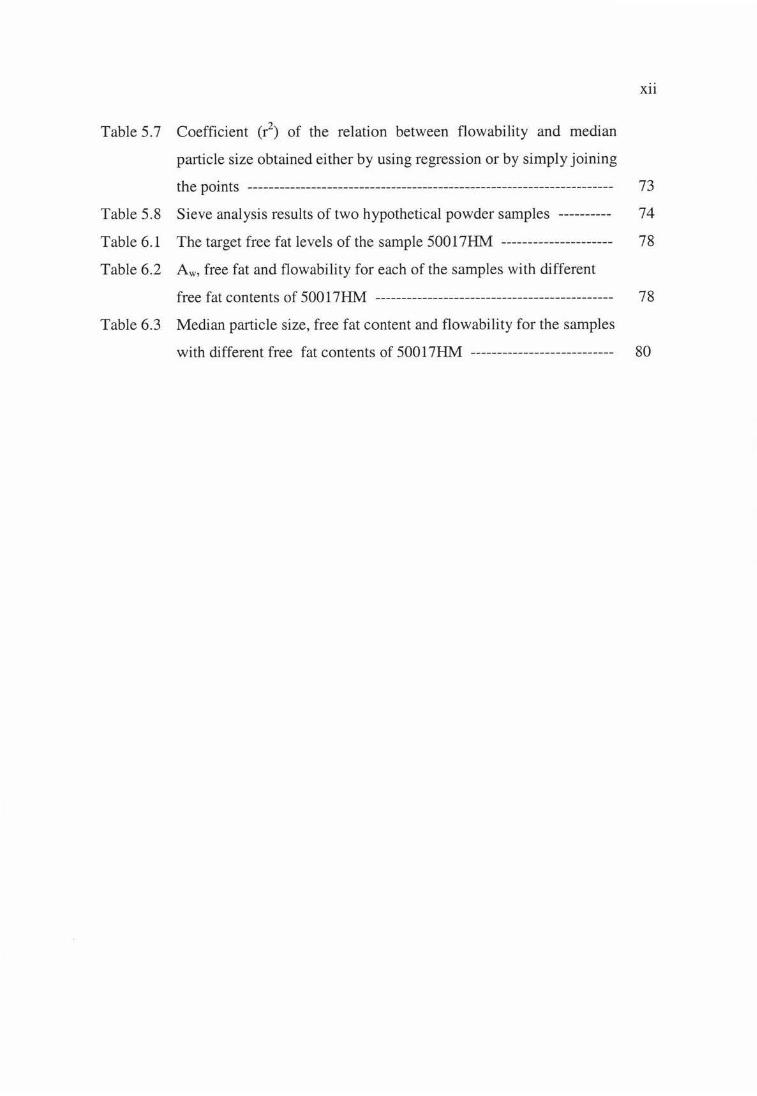
Table 5.7 Coefficient (r2) of the relation between flowability and median
particle size obtained either by using regression or by simply joining
xii
the points --------------------------------------------------------------------- 73
Table 5.8 Sieve analysis results of two hypothetical powder samples ---------- 74
Table 6.1 The target free fat levels of the sample 50017HM --------------------- 78
Table 6.2 Aw, free fat and flowability for each of the samples with different
free fat contents of 50017HM --------------------------------------------- 78
Table 6.3 Median particle size, free fat content and flowability for the samples
with different free fat contents of 50017HM --------------------------- 80
Chapter I Introduction 1
CHAPTER!
INTRODUCTION
Parmesan is the name commonly used to describe a group of very hard cheese varieties
that originated in the Po River valley of Italy. Locally, these cheese varieties are
generally called Grana, or specially named after the city of manufacture (i.e. Parmesan
comes from Parma, Reggino from Reggio, etc.). These cheeses are characterized by a
granular texture, sharp flavour, hard body, very small eyes, long shelf life and excellent
shipping properties (Sanders, 1953).
The traditional Italian manufacturing methods have been gradually and continuingly
modified for commercial production as follows (Anonymous a, 1973):
• The cheese is manufactured by some producers on a continuous basis using
pasteurised or heat treated and standardised milk.
• The cheese is produced by using various starters in addition to whey starters.
• The size of the cheeses generally ranges from 10 to 12.7 kg rather than the
traditional 27 kg on average.
• Ripening is controlled by mechanical refrigeration.
• The cheese is coated with wax rather than oil or grease.
• The cheese is cured for 10 to 14 months rather than 16 to 24 months in the
traditional method and a shorter curing method with only 6 months is being trialed
(Anonymous b, 1999).
Chapter I Introduction 2
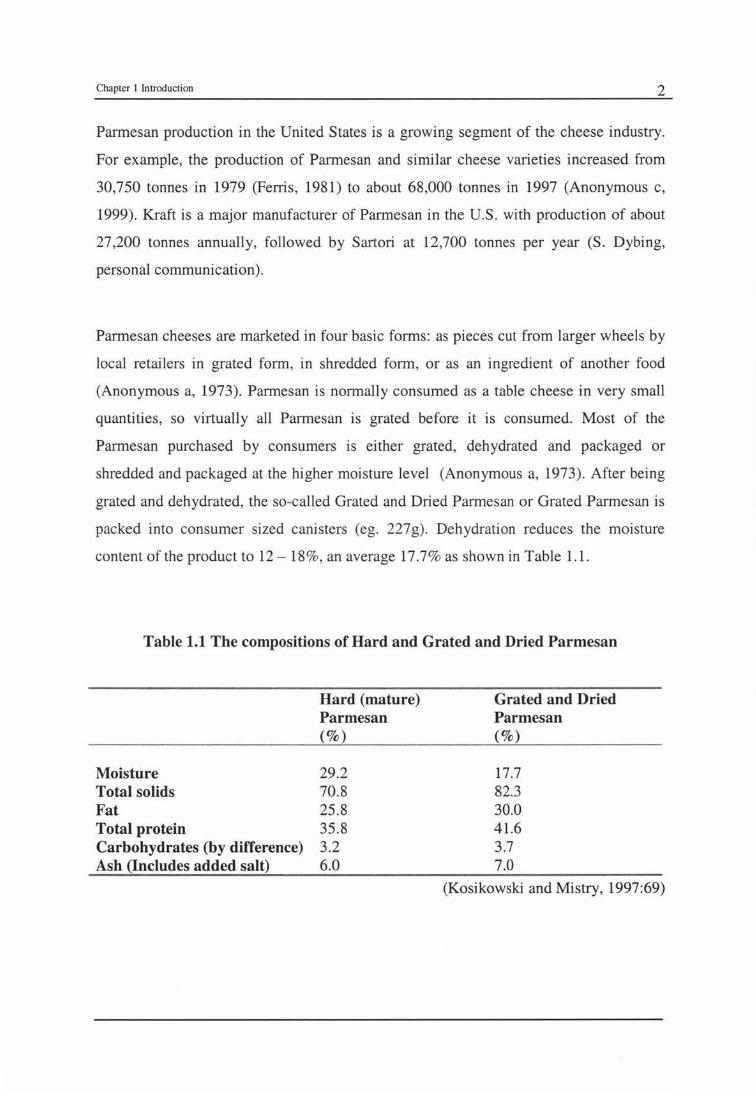
Parmesan production in the United States is a growing segment of the cheese industry.
For example, the production of Parmesan and similar cheese varieties increased from
30,750 tonnes in 1979 (Ferris, 1981) to about 68,000 tonnes in 1997 (Anonymous c,
1999). Kraft is a major manufacturer of Parmesan in the U.S. with production of about
27,200 tonnes annually, followed by Sartori at 12,700 tonnes per year (S. Dybing,
personal communication).
Parmesan cheeses are marketed in four basic forms: as pieces cut from larger wheels by
local retailers in grated form, in shredded form, or as an ingredient of another food
(Anonymous a, 1973). Parmesan is normally consumed as a table cheese in very small
quantities, so virtually all Parmesan is grated before it is consumed. Most of the
Parmesan purchased by consumers is either grated, dehydrated and packaged or
shredded and packaged at the higher moisture level (Anonymous a, 1973). After being
grated and dehydrated, the so-called Grated and Dried Parmesan or Grated Parmesan is
packed into consumer sized canisters (eg. 227g). Dehydration reduces the moisture
content of the product to 12 - 18%, an average 17.7% as shown in Table 1.1.
Table 1.1 The compositions of Hard and Grated and Dried Parmesan
Moisture Total solids Fat Total protein Carbohydrates (by difference) Ash (Includes added salt)
Hard (mature) Parmesan (%)
29.2 70.8 25.8 35.8 3.2 6.0
Grated and Dried Parmesan (%)
17.7 82.3 30.0 41.6 3.7 7.0
(Kosikowski and Mistry, 1997:69)
Chapter I Introduction 3
Drying to these moisture contents greatly enhances the shelf life, allowing Grated
Parmesan to be widely marketed in canisters (e.g. 227g) for use on soups, salads, pizza
and pasta. At 12 to 18% moisture there is a problem of clumping or agglomeration of
the grated cheese product, which hinders consumers' acceptability. Clumping is easily
observed in the canister and constitutes a serious defect. Aggregates range from small
clumps to large lumps. The small clumps may be disrupted and eliminated when
shaking the canister. However, some lumps aggregate into hard pieces that cannot be
broken apart with acute shaking. These lumps hinder the flowability of product out of
the canister during shaking. Therefore, flowability is an indirect measure of clumping.
Also, flowability is a major criterion by which consumers determine product quality.
Hence, flowability constitutes a vital product characteristic, which is even more
important than clumping.
The overall objective of this study is to determine the fundamental factors affecting
flowability in Grated and Dried Parmesan cheese. The production of Grated Parmesan
cheese creates a food powder. Therefore, the theories presented in the literature review
should describe the factors that control flowability in this powder product. Three major
factors known to significantly affect flowability in food powders include the water
activity (Aw) of the particles, the particle size distribution and the amount of free fat
present on the particle surface. This is a fundamental study on the flowability of Grated
and Dried Parmesan cheese. The study was divided into three sections to specifically
focus upon the following factors :
• Determining the effect of Aw on flowability
• Investigating the effect of particle size distribution on flowability
• Illustrating the influence of free fat on flowability
Other properties such as porosity of powders and storage conditions are not included in
this study.
![PARTICLE SIZE, PARTICLE SIZE DISTRIBUTION & COMPACTION AND COMPRESSION [PREFORMULATION STUDY] (1-32)](https://img.pdfslide.us/doc/110x75/56649e855503460f94b87eac/particle-size-particle-size-distribution-compaction-and-compression-preformulation.jpg)