Embed Size (px)
Citation preview
Graduate Theses, Dissertations, and Problem Reports
2010
Emissions Characterization and Particle Size Distribution from a Emissions Characterization and Particle Size Distribution from a
DPF-Equipped Diesel Truck Fueled with Biodiesel Blends DPF-Equipped Diesel Truck Fueled with Biodiesel Blends
Idowu O. Olatunji West Virginia University
Follow this and additional works at: https://researchrepository.wvu.edu/etd
Recommended Citation Recommended Citation Olatunji, Idowu O., "Emissions Characterization and Particle Size Distribution from a DPF-Equipped Diesel Truck Fueled with Biodiesel Blends" (2010). Graduate Theses, Dissertations, and Problem Reports. 2177. https://researchrepository.wvu.edu/etd/2177
This Thesis is protected by copyright and/or related rights. It has been brought to you by the The Research Repository @ WVU with permission from the rights-holder(s). You are free to use this Thesis in any way that is permitted by the copyright and related rights legislation that applies to your use. For other uses you must obtain permission from the rights-holder(s) directly, unless additional rights are indicated by a Creative Commons license in the record and/ or on the work itself. This Thesis has been accepted for inclusion in WVU Graduate Theses, Dissertations, and Problem Reports collection by an authorized administrator of The Research Repository @ WVU. For more information, please contact [email protected].
Emissions Characterization and Particle Size Distribution from a DPF-Equipped Diesel Truck Fueled with Biodiesel Blends.
Idowu O. Olatunji
Thesis submitted to the College of Engineering and Mineral Resources
at West Virginia University in partial fulfillment of the requirements
for the degree of
Master of Science
in Mechanical Engineering
Nigel N. Clark, Ph.D., Chair Gregory Thompson, Ph.D. John Nuszkowski, Ph.D.
Department of Mechanical and Aerospace Engineering
Morgantown, West Virginia 2010
Keywords: Biodiesel, Emissions, Exhaust Particles, Particle Size Copyright 2010 Idowu Olatunji
Abstract
Emissions Characterization and Particle Size Distribution from a DPF-Equipped Diesel Truck Fueled with Biodiesel Blends.
Idowu O. Olatunji
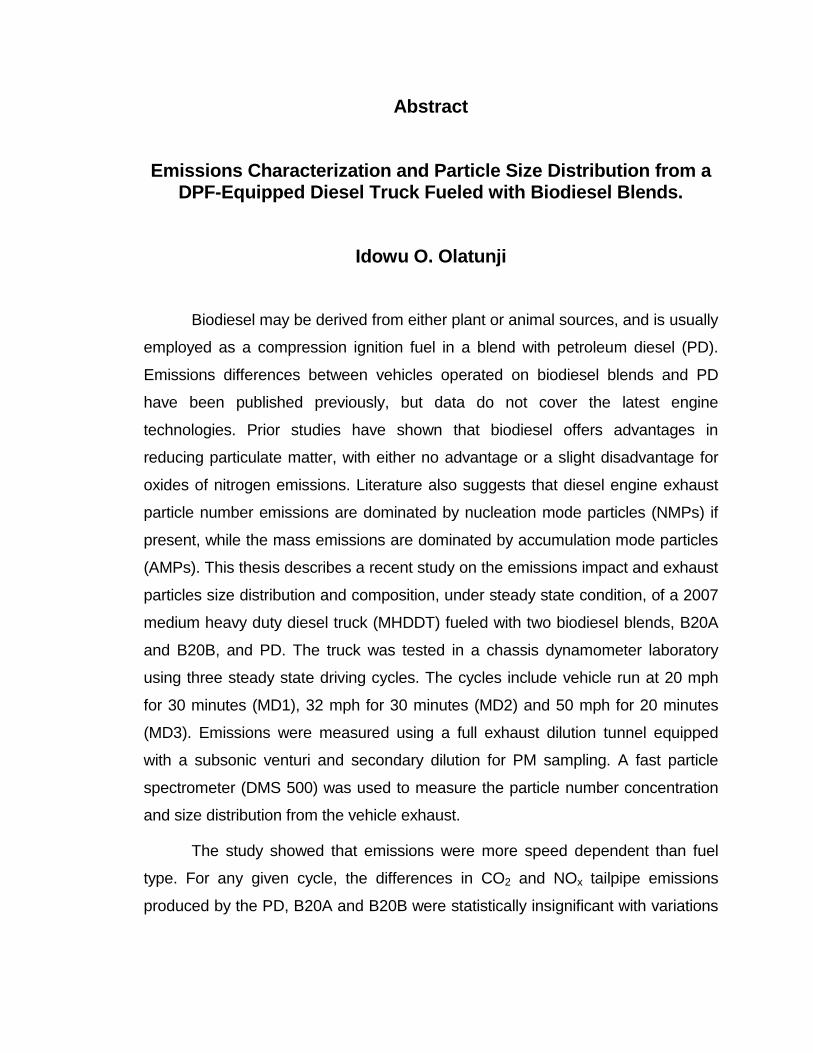
Biodiesel may be derived from either plant or animal sources, and is usually
employed as a compression ignition fuel in a blend with petroleum diesel (PD).
Emissions differences between vehicles operated on biodiesel blends and PD
have been published previously, but data do not cover the latest engine
technologies. Prior studies have shown that biodiesel offers advantages in
reducing particulate matter, with either no advantage or a slight disadvantage for
oxides of nitrogen emissions. Literature also suggests that diesel engine exhaust
particle number emissions are dominated by nucleation mode particles (NMPs) if
present, while the mass emissions are dominated by accumulation mode particles
(AMPs). This thesis describes a recent study on the emissions impact and exhaust
particles size distribution and composition, under steady state condition, of a 2007
medium heavy duty diesel truck (MHDDT) fueled with two biodiesel blends, B20A
and B20B, and PD. The truck was tested in a chassis dynamometer laboratory
using three steady state driving cycles. The cycles include vehicle run at 20 mph
for 30 minutes (MD1), 32 mph for 30 minutes (MD2) and 50 mph for 20 minutes
(MD3). Emissions were measured using a full exhaust dilution tunnel equipped
with a subsonic venturi and secondary dilution for PM sampling. A fast particle
spectrometer (DMS 500) was used to measure the particle number concentration
and size distribution from the vehicle exhaust.
The study showed that emissions were more speed dependent than fuel
type. For any given cycle, the differences in CO2 and NOx tailpipe emissions
produced by the PD, B20A and B20B were statistically insignificant with variations
of between 0.5-1.4%, and 0.5-3.4%, respectively at 95% confidence level. The
results further showed that, for MD2, CO2 emissions produced were lowest with
corresponding highest fuel economy (miles per gallon (mpg) of fuel consumed).
The NOx emissions produced for B20A and B20B were slightly higher than those
of PD, except for MD2. Generally, low particulate matter (PM) emissions were
produced from the test results due to the truck diesel particulate filter (DPF). The
carbon monoxide (CO) and hydrocarbon (HC) emissions were also low, with HC
being difficult to quantify as a result of oxidation in the DPF.
Analysis of the exhaust particle data showed that, for all of the driving
modes, the exhaust particles existed in two distinct modes with the particle number
concentration dominated by the NMPs for all three test fuels. The particle mass
concentration, dominated by the AMPs, substantially correlated with the pattern
observed in the gravimetric PM mass emissions measurement. It was observed
that factors such as DPF loading, dilution conditions (temperature, humidity) that
are not fuel related strongly affected particle size formation especially in the NMP
range. It was also observed that the total exhaust particle number concentration
and the geometric mean diameter (GMD) increased with propulsion power.
However, the GMD values were typically in the range of 25-40 nm for all driving
modes and fuel type combinations. This is further confirmation that exhaust
particles were dominated by nanoparticles that have been reported to cause
respiratory diseases and other health effects in humans.

iv
Acknowledgments
I am sincerely grateful to my advisor, Dr. Nigel Clark, for giving me the
opportunity to realize my dream of pursuing a Master’s Degree at WVU. Without
your support, I am not sure if I would be able to get to this stage in life. Thank you
for all the advice and motivation you have given to me. Thank you for trusting in
me and also making me believe in myself. Dr. Gregory Thompson, you have made
an enormous impact in my life. I thank you for all your advice and appreciate all
what you have done for me. I am also thankful of the advice and support from Dr.
John Nuszkowski for the time we have spent together.
I will also like to thank all of my colleagues and the staff of CAFEE for their
support in completing this study. Special thanks go to Petr Sindler and Jason
England for your help and expertise in collecting the data for this study.
To my parents and my siblings, I say thank you for believing in me, for all
your prayers and for your words of encouragement. To my beloved wife,
Oluwatosin, I thank you for all the love you have shown to me. Your support,
understanding, endurance and motivation are most appreciated. I promise that I
will always and forever love you.
Lastly, I give my utmost thanks to Almighty God, for His divine protection
over my life up to this day and for making my dream come true.
v
Table of Contents
Abstract ........................................................................................................... ii Acknowledgments ........................................................................................ iv Table of Contents .......................................................................................... v List of Figures .............................................................................................. vii List of Tables ............................................................................................... viii Nomenclature and Abbreviations ............................................................... ix 1. Introduction ............................................................................................... 1 2. Literature Review ...................................................................................... 4
2.1. Biodiesel Production ...................................................................................... 4 2.2. Biodiesel Emissions and Engine Performance Characteristics .................... 6 2.3. Particulate Emissions from Diesel and Biodiesel Fuels .............................. 12
2.3.1. Particulates ........................................................................................... 12 2.3.2. Particle Size Distribution ....................................................................... 14 2.3.3. Biodiesel Particle Emissions versus PD Particle Emissions ................ 18
3. Experimental Set-Up and Procedures ................................................. 22 3.1. Test Fuels .................................................................................................... 22 3.2. Test Vehicle ................................................................................................. 23 3.3. Test Vehicle Parameters ............................................................................. 25 3.4. Drive Cycles ................................................................................................. 26 3.5. Chassis Dynamometer ................................................................................ 26 3.6. CAFEE Mobile Laboratory ........................................................................... 28 3.7. Vehicle Testing Sequence/Method .............................................................. 30 3.8. Emissions Sampling System Method .......................................................... 30 3.9. Gaseous Emissions Measurement .............................................................. 31 3.10. Secondary Dilution Tunnel and PM Sampling System ............................... 33 3.11. Cambustion DMS 500 Fast Particle Spectrometer ..................................... 34 3.12. Engine Control Unit (ECU) Data Collection ................................................. 35
4. Results and Discussions ....................................................................... 37 4.1. Statistical Analysis ....................................................................................... 37 4.2. Emissions Measurement Results ................................................................ 38
4.2.1. Vehicle Operating Parameters ............................................................. 41 4.2.2. CO2 Emissions and Fuel Economy ...................................................... 43 4.2.3. CO Emissions. ...................................................................................... 46 4.2.4. HC Emissions ....................................................................................... 48 4.2.5. NOx Emissions ...................................................................................... 48 4.2.6. PM Emissions ....................................................................................... 51
4.3. Particle Emissions Results .......................................................................... 52 4.3.1. Lognormal Distribution of Exhaust Particles ......................................... 53 4.3.2. Comparison of Particle Number Concentration for the Test Fuels ...... 58 4.3.3. Comparison of GMD for the Three Test Fuels ..................................... 60 4.3.4. Comparison of Particle Mass Concentration for the Test Fuels ........... 61

vi
4.3.5. Particle Mass Composition for the Test Fuels ...................................... 62 5. Conclusions and Recommendations ................................................... 65
5.1. Conclusions ................................................................................................. 65 5.2. Recommendations ....................................................................................... 66
References .................................................................................................... 68 Appendix ....................................................................................................... 77
vii
List of Figures
Figure 1: Chart showing the process involved in biodiesel production . ................. 6 Figure 2: Biodiesel emissions impact for heavy-duty highway engines . ................ 8 Figure 3: Constituents of a typical diesel engine exhaust particles . .................... 14 Figure 4:“Typical engine exhaust mass and number weighted size distributions
shown with alveolar disposition fraction” ............................................... 17 Figure 5: MHDDT used for this study. ................................................................... 25 Figure 6: Time-speed traces for MD1, MD2 and MD3. ......................................... 26 Figure 7: Laboratory dynamometer bed. ............................................................... 27 Figure 8: Layout of the chassis dynamometer . .................................................... 28 Figure 9: Photographic view of the laboratory container....................................... 29 Figure 10: Three dimensional (3-D) representation of the laboratory container . . 29 Figure 11: “Schematic of emissions sampling system” . ....................................... 32 Figure 12: MEXA 7200D motor exhaust gas analyzer systems. .......................... 33 Figure 13: System for PM sampling. ..................................................................... 34 Figure 14: DMS 500 fast particle spectrometer. ................................................... 35 Figure 15: Instantaneous CO2 emissions for three repeat runs. ........................... 39 Figure 16: Instantaneous NOx emissions for three repeat runs. ........................... 39 Figure 17: Variations in ambient air temperature during repeat runs. .................. 40 Figure 18: Plots of engine torque vs. time for the driving modes. ......................... 43 Figure 19: CO2 emissions comparison for the test fuels. ...................................... 45 Figure 20: Fuel economy comparison for the test fuels. ....................................... 46 Figure 21: CO emissions using three driving cycles and test fuels. ..................... 47 Figure 22: HC emissions comparison for the test fuels. ....................................... 48 Figure 23: NOx emissions comparison for the test fuels. ...................................... 49 Figure 24: NOx emissions comparison between this study and EMFAC for PD. . 50 Figure 25: PM emissions comparison for the test fuels. ....................................... 52 Figure 26: Particle size and number comparison for PD for all drive cycles. ....... 54 Figure 27: Particle size and number comparison for the test fuels for MD1. ........ 55 Figure 28: Particle size and number comparison for the test fuels for MD2. ........ 57 Figure 29: Particle size and number comparison for the test fuels for MD3. ........ 58 Figure 30: Particle number concentration comparison for the test fuels. ............. 59 Figure 31: Percentage particle number composition for the test fuels. ................ 60 Figure 32: GMD of exhaust particles for the test fuels. ......................................... 61 Figure 33: PM mass emissions measurement comparison for the test fuels. ...... 62 Figure 34: Particle mass composition for the test fuels. ....................................... 63 Figure 35: Particle mass concentration for the test fuels. ..................................... 64 Figure 36: Vehicle speed versus time (coast down data). .................................... 79 Figure 37: Particle emissions versus time for MD1. .............................................. 80 Figure 38: Particle emissions versus time for MD2. .............................................. 80 Figure 39: Particle emissions versus time for MD3. .............................................. 81 Figure 40: NOx speed correction factor for EMFAC . ............................................ 81
viii
List of Tables
Table 1: EPA diesel engine emissions regulations for NOx and PM since 1988 . .. 2Table 2: Selected properties of the fuels employed in this study. ......................... 24Table 3: Vehicle and engine details. ..................................................................... 24Table 4: Test vehicle parameters. ......................................................................... 25Table 5: CO2 and NOx emissions data for repeat test runs .................................. 40Table 6: Variability of continuous emissions data for B20B. ................................. 42Table 7: Average engine torque and power consumption for the drive cycles. .... 43Table 8: Laboratory analysis report for B20A ....................................................... 77Table 9: Laboratory analysis report for B20B ....................................................... 78

ix
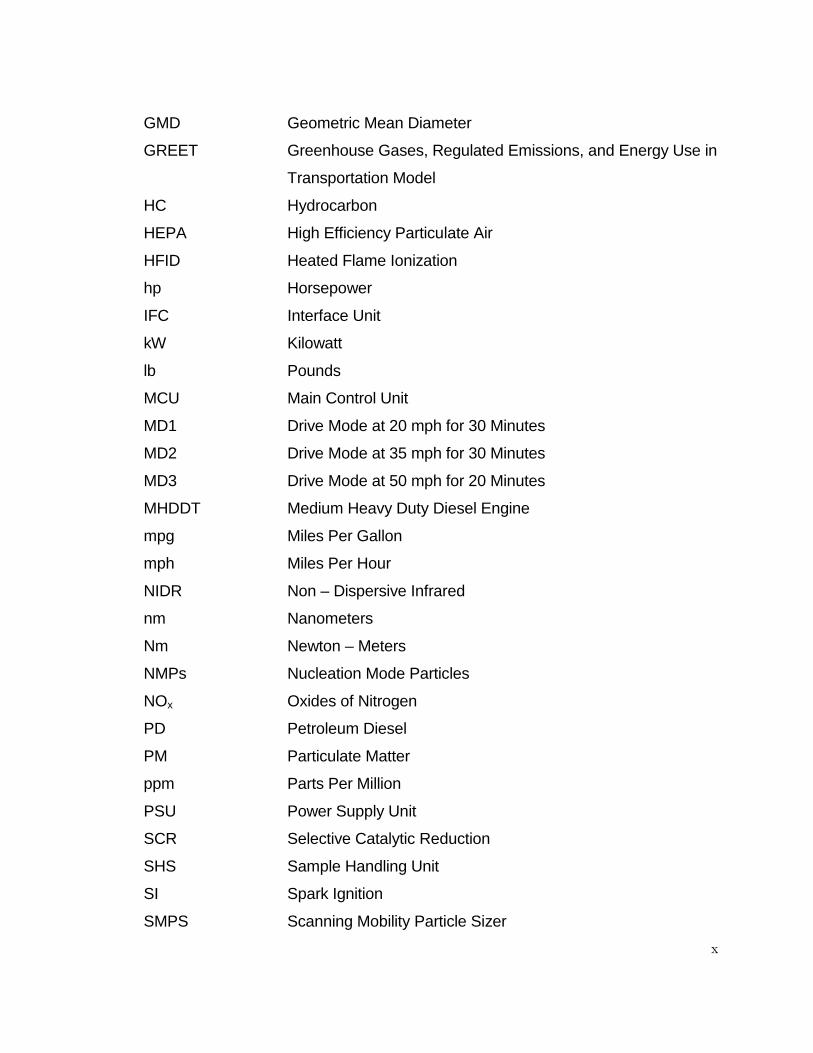
Nomenclature and Abbreviations
AMPs Accumulation Mode Particles
ANR Analyzer Rack
BER Base Emissions Rate
BXX Biodiesel Blend with XX% of Biodiesel
B20A Biodiesel Blend with 20% of Animal Fat Biodiesel
B20B Biodiesel Blend with 20% of Soybean Biodiesel
CAFEE Center for Fuels, Engines and Emissions
CARB California Air Resources Board
CLD Chemiluminesecent Detection
CMPs Coarse Mode Particles
CO Carbon Monoxide
CO2 Carbon Dioxide
COV Coefficient of Variation
CVS Constant Volume Sampler
DAQ Data Acquisition
DMS 500 Fast Particle Spectrometer
DOC Diesel Oxidation Catalyst
DOE Department of Energy
DPF Diesel Particulate Filter
EEPS Engine Exhaust Particle Sizer
EGR Exhaust Gas Recirculation
EMFAC Emissions Factors
EPA Environmental Protection Agency
FFA Free Fatty Acid
ft-lbf Foot – Pound Force
g/bhp-hr Grams Per Brake Horsepower-Hour
g/mile Grams Per Mile
g/sec Grams Per Second
x
GMD Geometric Mean Diameter
GREET Greenhouse Gases, Regulated Emissions, and Energy Use in
Transportation Model
HC Hydrocarbon
HEPA High Efficiency Particulate Air
HFID Heated Flame Ionization
hp Horsepower
IFC Interface Unit
kW Kilowatt
lb Pounds
MCU Main Control Unit
MD1 Drive Mode at 20 mph for 30 Minutes
MD2 Drive Mode at 35 mph for 30 Minutes
MD3 Drive Mode at 50 mph for 20 Minutes
MHDDT Medium Heavy Duty Diesel Engine
mpg Miles Per Gallon
mph Miles Per Hour
NIDR Non – Dispersive Infrared
nm Nanometers
Nm Newton – Meters
NMPs Nucleation Mode Particles
NOx Oxides of Nitrogen
PD Petroleum Diesel
PM Particulate Matter
ppm Parts Per Million
PSU Power Supply Unit
SCR Selective Catalytic Reduction
SHS Sample Handling Unit
SI Spark Ignition
SMPS Scanning Mobility Particle Sizer
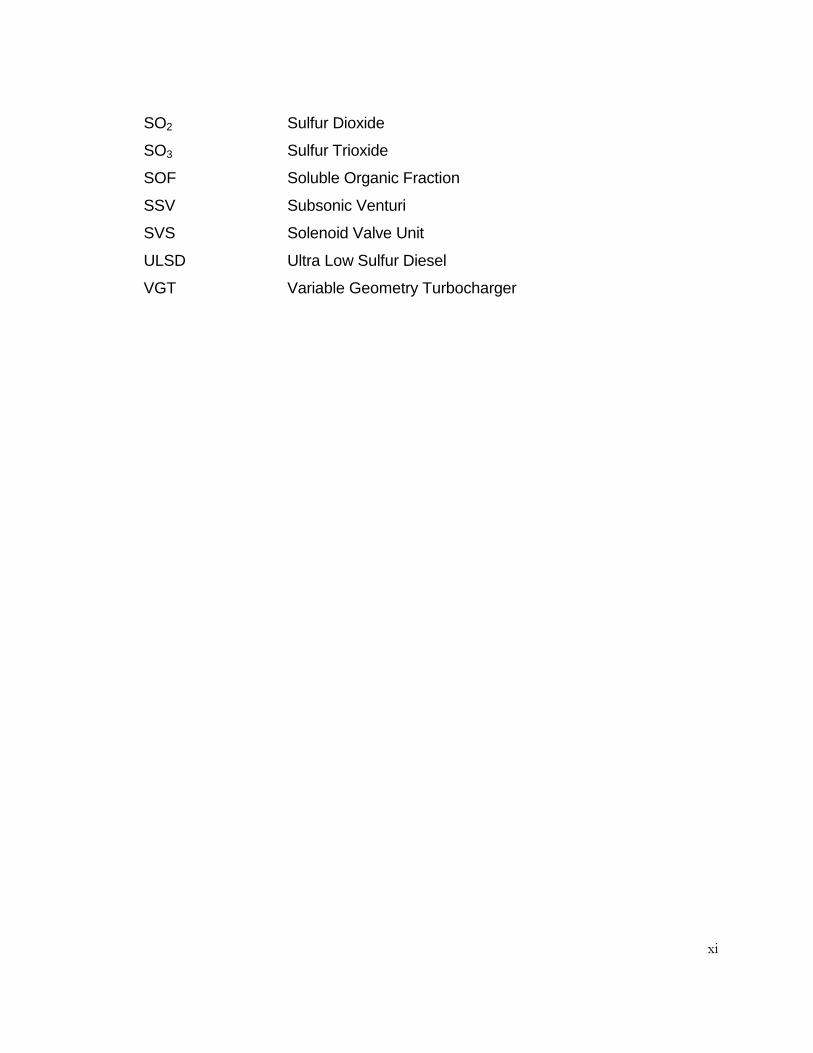
xi
SO2 Sulfur Dioxide
SO3 Sulfur Trioxide
SOF Soluble Organic Fraction
SSV Subsonic Venturi
SVS Solenoid Valve Unit
ULSD Ultra Low Sulfur Diesel
VGT Variable Geometry Turbocharger
1
1. Introduction
Reports of adverse health effects from the use of diesel engines [1 – 4]
have generated concerns for regulators and decision makers around the world,
despite the diesel engine's advantages of durability, better fuel consumption and
efficiency than gasoline engines. In response, diesel engine emission regulations
are becoming more stringent, particularly for particulate matter (PM) and oxides of
nitrogen (NOx) emissions. In the USA, the Environmental Protection Agency's
(EPA) 2007 heavy-duty engine emissions standard represents an order of
magnitude reduction in brake specific PM emissions from 0.1 g/bhp-hr to 0.01
g/bhp-hr (0.134 g/kW-hr to 0.0134 g/kW-hr) over the 2004 engine emissions
standard. NOx emissions were also reduced by 90% from 2 g/bhp-hr to 0.2 g/bhp-
hr (2.68g/kW-hr to 0.268 g/kW-hr) in the 2007 EPA emissions standard over the
2004 emissions standard. The NOx emissions reductions were in phases over a
period of 2007 to 2010. This required 50% of heavy-duty vehicles sold in the USA
between 2007 and 2009 to meet the 0.2 g/bhp-hr while full compliance was
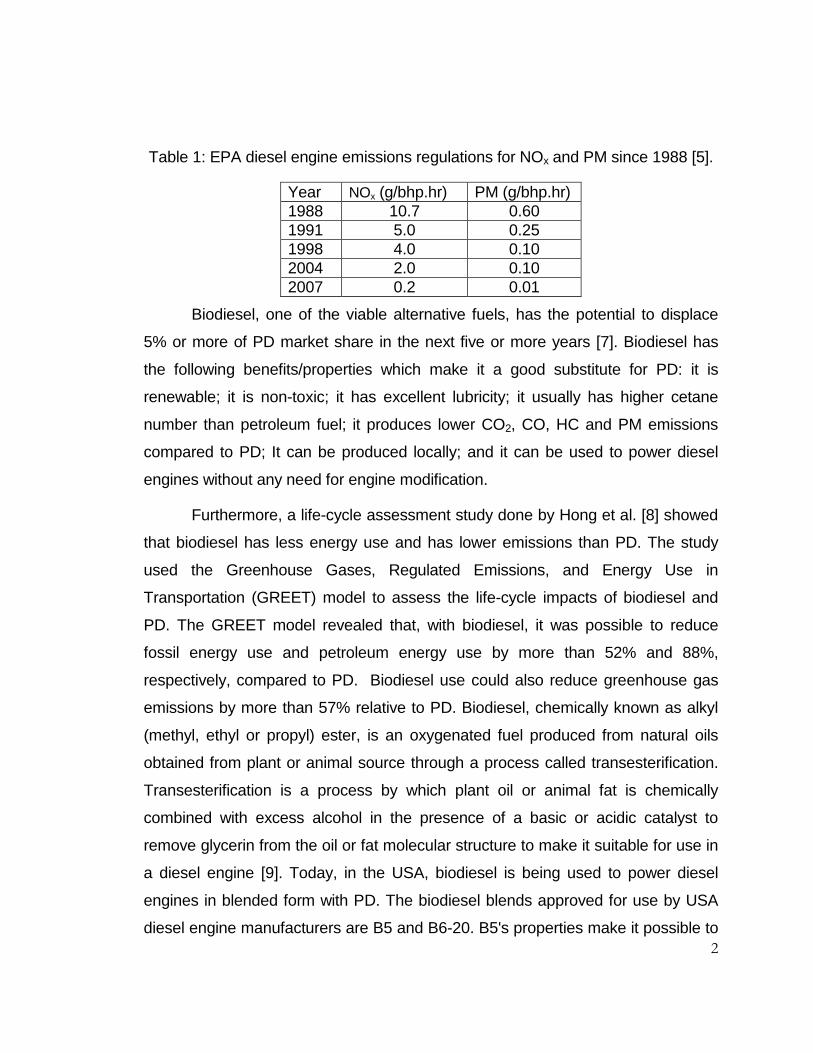
enforced in 2010. Table 1 shows the EPA diesel engine emissions regulations for
NOx and PM emissions since 1988 [5]. This could even become stricter in the near
future. In addition to health issues, increased extraction and consumption of fossil
fuels have caused declines in underground non-renewable petroleum-based
resources [6]. This suggests that the world will be short of transportation fuel
supply unless something is done to augment the ever-increasing world energy
demand. Consequently, attention has focused on research in alternative fuel
sources that can substitute for the depleting fossil fuel sources and that can
possibly reduce the adverse health effects of diesel engine emissions.
2
Table 1: EPA diesel engine emissions regulations for NOx and PM since 1988 [5].
Year NOx (g/bhp.hr) PM (g/bhp.hr) 1988 10.7 0.60 1991 5.0 0.25 1998 4.0 0.10 2004 2.0 0.10 2007 0.2 0.01
Biodiesel, one of the viable alternative fuels, has the potential to displace
5% or more of PD market share in the next five or more years [7]. Biodiesel has
the following benefits/properties which make it a good substitute for PD: it is
renewable; it is non-toxic; it has excellent lubricity; it usually has higher cetane
number than petroleum fuel; it produces lower CO2, CO, HC and PM emissions
compared to PD; It can be produced locally; and it can be used to power diesel
engines without any need for engine modification.
Furthermore, a life-cycle assessment study done by Hong et al. [8] showed
that biodiesel has less energy use and has lower emissions than PD. The study
used the Greenhouse Gases, Regulated Emissions, and Energy Use in
Transportation (GREET) model to assess the life-cycle impacts of biodiesel and
PD. The GREET model revealed that, with biodiesel, it was possible to reduce
fossil energy use and petroleum energy use by more than 52% and 88%,
respectively, compared to PD. Biodiesel use could also reduce greenhouse gas
emissions by more than 57% relative to PD. Biodiesel, chemically known as alkyl
(methyl, ethyl or propyl) ester, is an oxygenated fuel produced from natural oils
obtained from plant or animal source through a process called transesterification.
Transesterification is a process by which plant oil or animal fat is chemically
combined with excess alcohol in the presence of a basic or acidic catalyst to
remove glycerin from the oil or fat molecular structure to make it suitable for use in
a diesel engine [9]. Today, in the USA, biodiesel is being used to power diesel
engines in blended form with PD. The biodiesel blends approved for use by USA
diesel engine manufacturers are B5 and B6-20. B5's properties make it possible to
3
be used as a PD substitute without giving any performance-related problems [10].
B20 is the most commonly used biodiesel blend for two main reasons. First, it
balances performance, emission levels, cost and availability. Second, B20 is the
minimum blend level that qualifies as an alternative fuel in the USA, in line with the
Energy Policy Act of 1992. Feedstocks for biodiesel production are obtained from
edible and non-edible oil sources. Edible oils are obtained from species such as
soybean, rapeseed, sunflower, and cotton, while non-edible oil sources include
jatropha, honge, sea mango, and algae. However, more than 95% of biodiesel
feedstocks come from edible oil sources because the properties of biodiesel
produced from them are more suitable to be used as biodiesel [11]. Presently,
biodiesel is mainly produced from soybean oil in the USA, canola or rapeseed and
sunflower oils in Europe and palm and coconut oils in Asia [6]. This increases
competition in the edible oil market and leads to high cost of edible oils and
biodiesel [12]. As a result, researchers are focusing attention on biodiesel
production from non-edible oils. A recent trend is biodiesel production from
microalgae [13].
This thesis discusses a recent study on 2007 MHDDT using a chassis
dynamometer testing laboratory. Tailpipe emissions, exhaust particle
concentration and size distribution were characterized using two biodiesel blends,
B20A and B20B, and PD. Comparisons were made among the three fuels to
document, fuel or other effects on regulated and CO2 emissions, exhaust particles
size distribution and vehicle performance (in terms of fuel economy) of the MHDDT
with an engine equipped with exhaust gas recirculation (EGR), diesel particulate
filter (DPF) and variable geometry turbocharger (VGT).
4
2. Literature Review
In the USA and in Europe, diesel engine technology has evolved rapidly
over the last two decades. In the early 90's, mechanically injected engines were
replaced in the fleet with electronically managed engines. These engines had
higher injection pressures, superior air management, and better in-cylinder charge
motion than the previous models. However, these engines still relied largely on
managing the start of injection for emissions control. Electronically managed waste
gates for turbochargers were introduced, allowing for more control flexibility. To
meet 2004 emissions standards, most manufacturers were obliged to employ EGR
and advanced injection techniques for reduction of NOx emissions. Engine
management became substantially more complex as both EGR control and VGT
control were needed. To meet 2007 PM emissions standards, engines were fitted
with DPFs, and the regeneration of these units required further control
sophistication. Also in 2007, the average NOx emissions standard was further
reduced [5], increasing the role of EGR in the combustion behavior. Little or no
data exist for these late diesel engines in terms of performance and emissions
using alternative fuel sources. Thus there is need for more testing to add to the
available emissions and performance data inventory from alternative fuel sources,
such as biodiesel, to help facilitate policy decision making. This chapter reviews
the processes involved in the production of biodiesel from feedstocks and biodiesel
use effects on engine emissions and performance. The chapter also reviews
biodiesel and biodiesel blends effects on particle size distribution.
2.1. Biodiesel Production
Direct use of raw plant oils or animal fats in diesel engines has been shown
to cause poor combustion, carbon build-up, choking, oil contamination that may
result in engine failure in the long-term [14]. Hence the raw oils or fats need to be
refined or processed to ensure engine durability. There are four different methods
that can be used to produce biodiesel. These primary methods include micro-

5
emulsions, direct use and blending, thermal cracking (pyrolysis) and
transesterification [15]. The transesterification process is the most widely used
method because of its benefits over the others. The main purpose of
transesterification is to reduce the viscosity of the plant oils or animal fats to a level
that is comparable to PD so that the combustion properties of the oils or fats can
be improved. The process involves a reaction between plant oils or animal fats
(esters of saturated and unsaturated monocarboxylic acids with the trihydric
alcohol glyceride) and alcohol in the presence of a basic, acidic or enzymic
catalyst to improve the reaction rate [14,15]. The basic chemical reaction equation
is shown in equation 1 below [15]:
R1, R2 and R3 are long chain hydrocarbons called fatty acid chains.
Methanol and ethanol are the most widely used alcohol for the transesterification
reaction. However, methanol is preferred to ethanol because of its lower cost and
its physical and chemical advantages. Sodium hydroxide and potassium hydroxide
are the most commonly used catalysts in commercial transesterification process.
The use of these basic catalysts is preferred because of their low cost and higher
reaction rates compared to acidic and enzymic catalysts. The composition of the
feedstock to be used for biodiesel production plays a role in the quality and yield of
the biodiesel. Most biodiesel raw materials (feedstocks) usually contain
triglycerides (esters), free fatty acids (FFA), water and other contaminants in
various proportions [15]. A pretreatment is required for biodiesel feedstocks
containing more than 2.5% of FFA by weight before transesterification process so
that the biodiesel yield can be improved upon [16]. Methods of reducing or
Equation 1
CH2-O-CO-R3
CH-OH
CH-OH
CH2-O-CO-R1
CH2-O-CO-R2 + 3ROH CH-OH R-O-CO-R2
(Triglyceride) (Alcohol) (Glycerol) (Fatty acid esters)
R-O-CO-R1
R-O-CO-R3
6
removing FFA, water and other contaminants from biodiesel raw materials for high
yield are detailed in reference [15]. It is also important to separate the fatty acid
esters (biodiesel) from glycerol (by-product) after the transesterification reaction
before purification and quality control processes. Refined glycerol may be used for
manufacture of different industrial products such as medicines, soaps,
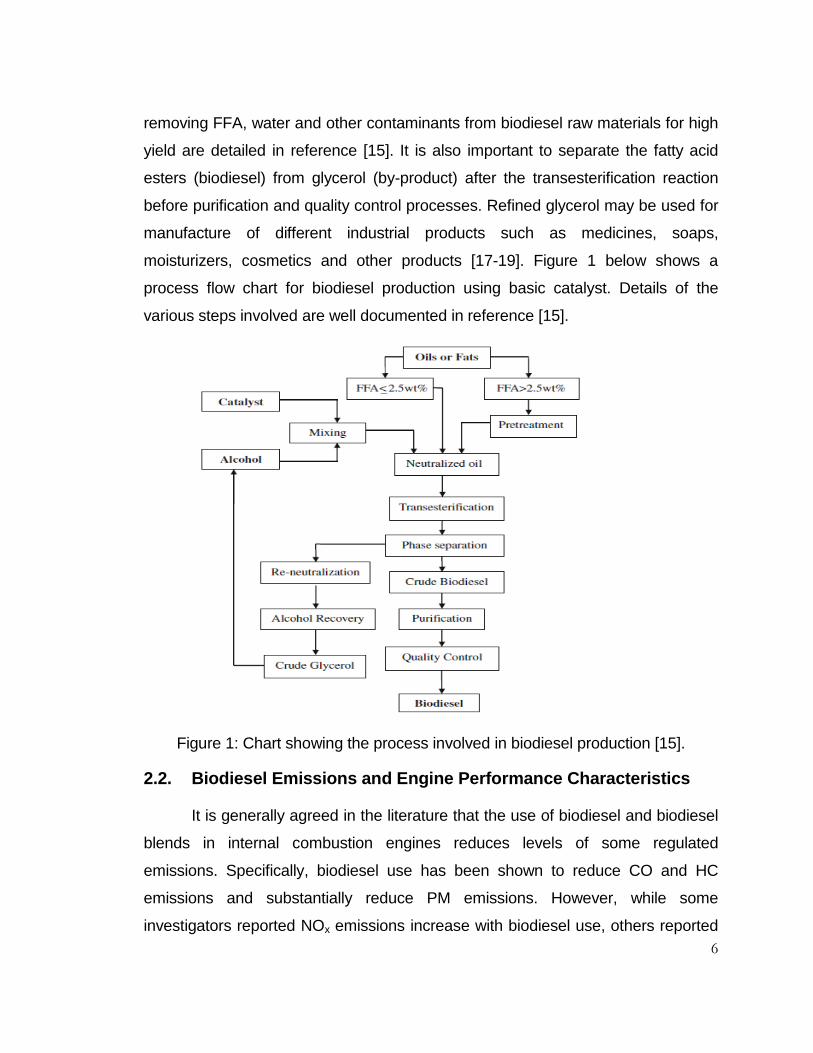
moisturizers, cosmetics and other products [17-19]. Figure 1 below shows a
process flow chart for biodiesel production using basic catalyst. Details of the
various steps involved are well documented in reference [15].
Figure 1: Chart showing the process involved in biodiesel production [15].
2.2. Biodiesel Emissions and Engine Performance Characteristics
It is generally agreed in the literature that the use of biodiesel and biodiesel
blends in internal combustion engines reduces levels of some regulated
emissions. Specifically, biodiesel use has been shown to reduce CO and HC
emissions and substantially reduce PM emissions. However, while some
investigators reported NOx emissions increase with biodiesel use, others reported
7
NOx emissions reduction when compared to that of PD. Engine model year, brand
and technology have a big influence on the variability of NOx emissions reported in
the literature. The impact of biodiesel use on performance in diesel engines (i.e.
fuel consumption and combustion characteristics such as injection timing, ignition
delay, ignition temperature and pressure, heat release and combustion efficiency)
has also been documented in the literature. Biodiesel is an oxygenated fuel,
typically containing between 11% – 12% of oxygen by weight [20]. This and other
physical and chemical properties of biodiesel such as viscosity, compressibility,
cetane number, degree of unsaturation, density, etc, have been attributed for the
unique behavior of biodiesel fuel. Following is a brief review of biodiesel use
impact on engine emissions and performance.
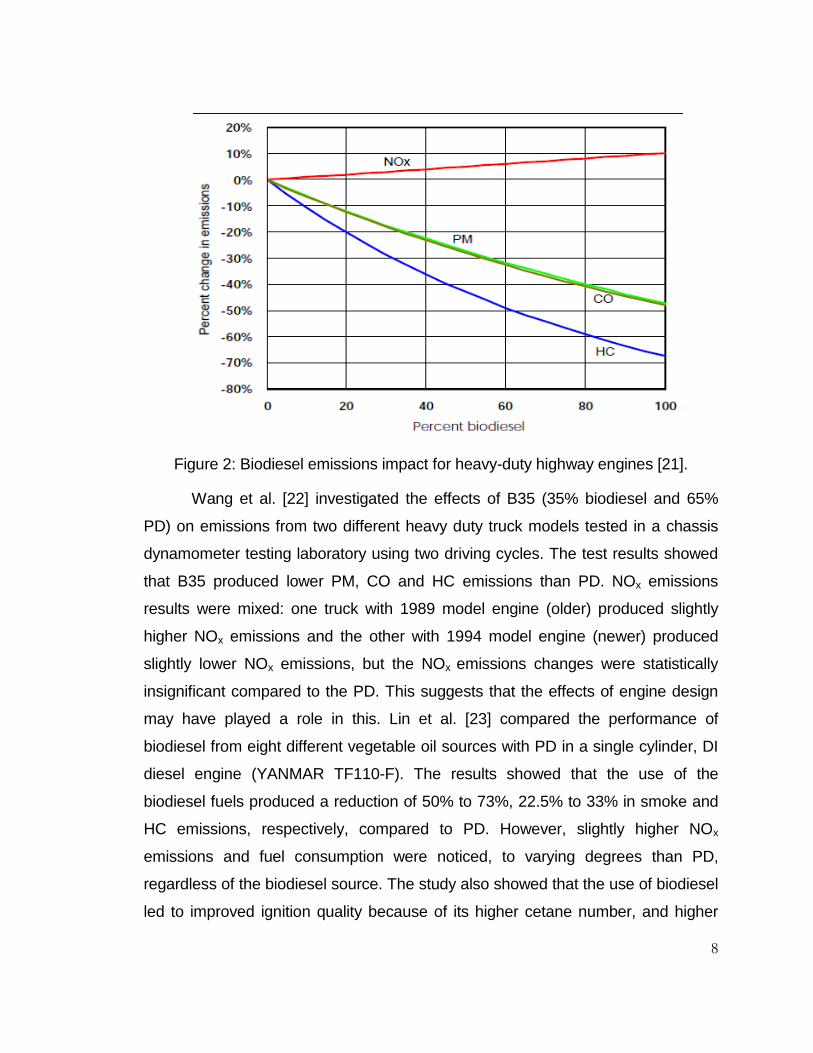
In 2002, EPA produced a technical report that reviewed and published
available biodiesel emissions data for heavy-duty engines. The summary of the
report for regulated emissions is shown in Figure 2 below [21]. The report indicated
that B20 use led to a reduction in PM, CO and HC emissions compared to PD. The
report further showed that higher levels of reduction were possible with higher
biodiesel blend percentage in the fuel. However, an overall average of 2%
increase in NOx emissions, which varied with biodiesel blend proportion, was also
reported.
8
Figure 2: Biodiesel emissions impact for heavy-duty highway engines [21].
Wang et al. [22] investigated the effects of B35 (35% biodiesel and 65%
PD) on emissions from two different heavy duty truck models tested in a chassis
dynamometer testing laboratory using two driving cycles. The test results showed
that B35 produced lower PM, CO and HC emissions than PD. NOx emissions
results were mixed: one truck with 1989 model engine (older) produced slightly
higher NOx emissions and the other with 1994 model engine (newer) produced
slightly lower NOx emissions, but the NOx emissions changes were statistically
insignificant compared to the PD. This suggests that the effects of engine design
may have played a role in this. Lin et al. [23] compared the performance of
biodiesel from eight different vegetable oil sources with PD in a single cylinder, DI
diesel engine (YANMAR TF110-F). The results showed that the use of the
biodiesel fuels produced a reduction of 50% to 73%, 22.5% to 33% in smoke and
HC emissions, respectively, compared to PD. However, slightly higher NOx
emissions and fuel consumption were noticed, to varying degrees than PD,
regardless of the biodiesel source. The study also showed that the use of biodiesel
led to improved ignition quality because of its higher cetane number, and higher
9
combustion efficiency fuel due to its oxygen content, higher bulk modulus and
better fuel atomization. Nabi and co-workers [24] conducted performance
evaluation tests on a single cylinder, DI diesel engine using cotton seed oil
biodiesel blends (B10, B20 and B30) and PD. The results showed lower PM
emissions (24% reduction) were produced with B10 and 24% reduction in CO
emissions with B30 compared to PD. Higher NOx emissions and slightly lower
thermal efficiency were noticed, which varied with the biodiesel blend proportion.
The results of engine emissions tests performed by Mazumdar et al. [25] using
biodiesel blends from waste cooking oil in a IDI diesel engine and Raheman et al.
[26] using biodiesel from karanja (Pongamia Pinnata) oil in a DI diesel engine were
largely in agreement except for NOx emissions. Mazumdar et al. and Raheman et
al. agreed and reported that biodiesel produced lower smoke, CO and HC
emissions than PD. However, Mazumdar et al. showed that used cooking oil
biodiesel blends produced higher NOx emissions, while Raheman et al. reported
that NOx emissions decreased with karanja oil biodiesel. McCormick et al. [27]
conducted tests in an engine laboratory on two direct injection engines inter-cooled
with cooled high-pressure EGR, a 2002 Cummins ISB and a 2003 DDC Series 60,
using PD and B20 as fuels. The B20 was obtained from four different feedstocks
namely soybean oil, canola oil, yellow grease and beef tallow. The test results
showed that, compared to PD, NOx emissions increased slightly (by 3%) from the
two engines with biodiesel blends, while PM emissions were significantly reduced
by about 25%. Nine et al. [28] also conducted engine dynamometer testing on
diesel–fueled marine engine (1972 Westerbeke 40) using blends of soybean
biodiesel and PD. The “dry” (without water contact in the exhaust stream)
emissions results revealed that pure biodiesel was able to reduce PM and CO
emissions by 45% compared to PD. B50 and B100 resulted in 7% and 17%
increase in NOx emissions, respectively, compared to PD. The results of
investigation of biodiesel impact on engine emissions done by McCormick et al.
[29] and Nuszkowski et al. [30] were all consistent with the conclusions of most
investigators above. Their results showed 10% – 35% reduction in PM emissions,
10
14% – 18% decrease in CO and HC emissions and a 2% – 4.3% increase in NOx
emissions in biodiesel blend (B20) emissions, as compared to PD. The
investigation done by Thompson et al. [31] on biodiesel blends (B10 and B20) and
PD fuel showed that variation in NOx emissions were partially due to PD fuel
properties relative to the biodiesel fuels properties. The result showed that NOx
increased with the biodiesel blends when their cetane numbers were significantly
higher than that of PD. NOx emissions reduction was also noticed when the PD
fuel cetane number was closely matched with the neat biodiesel's cetane number.
The studies cited above clearly show that investigators agreed that the use
of biodiesel produced low HC, CO and PM emissions. Moreover, the renewable
nature of biodiesel has the potential to reduce dependency on PD as
transportation fuel by at least 5% by 2015 [7] and reduce life cycle CO2 emissions
[32]. These benefits make biodiesel a viable substitute for PD. However, it is
noticed that majority of the above reviews suggest that biodiesel use also
produces slightly higher NOx emissions than PD. This could limit the market
penetration of biodiesel especially in the non-attainment areas, such as California
and Texas, where strict NOx emissions regulations are in effect. In view of this,
research is now being focused on mitigating the NOx emissions increase which
results from the use of biodiesel. It is known that high temperature and oxygen
promote formation of NOx (thermal NOx) in the combustion chamber by “Zeldovich
mechanism” [33]. The properties of biodiesel, contribute to high temperature and
pressure combustion in the combustion chamber through advanced combustion
which promote NOx formation. It is believed that some other mechanisms/effects
could also affect biodiesel NOx emissions. For instance, some biodiesel NOx
emissions reducing strategies, such as fuel additive for cetane improvement and
injection timing retard, have been investigated for 2004 and older trucks. These
strategies may not be effective for 2007 and newer trucks, and more research
needs to be done. These NOx reduction mechanisms/effects have not been fully
understood and they are still been investigated so that an effective mitigating
11
mechanism can be put forward. The works of Mueller et al. [34], Thompson et al.
[31] and Lapuerta et al. [35] provide a valuable insight to this line of research.
Two of the methods used to control engine NOx emissions are the use of
EGR and selective catalytic reduction (SCR). EGR involves recycling a portion of
the exhaust gases into the combustion chamber. The recycled gases reduce the
amount of oxygen and also serve as heat absorbers in the combustion chamber.
The overall effect is to reduce in-cylinder temperature, which leads to reduction in
thermal NOx emissions. SCR uses hydrolysis-reduction principle to reduce NOx
emissions using urea which is stored as a separate fluid on the vehicle. EGR is
commonly used in United States as a NOx emissions mitigant while SCR is more
popular in Europe. The effects of these devices on engine emissions are well
documented in literature. For instance, Miller et al. [36] showed that NOx engine-
out emissions were reduced by over 70%, HC emissions by 100% reduction, PM
by over 20% reduction with the use of urea-SCR after-treatment system. However,
there was slight increase in CO emissions with the use of the urea-SCR system.
Although numerous studies showed that while EGR is effective in
substantially reducing NOx emissions, it also leads to increase in PM, CO and HC
and CO2 (measure of fuel consumption) emissions. The results of investigation
done by Tsolakis et al. [37] using canola oil biodiesel blends in naturally aspirated
diesel engine equipped with EGR showed that NOx emissions decreased with
increasing EGR rates. However, other engine emissions such as CO, HC and
smoke (usually used as a measure of PM emissions) increased with increasing
EGR rates. The results also indicated that the use of EGR led to increase in fuel
consumption. The performance evaluation test conducted by Rajan et al. [38]
revealed that HC and CO emissions increased with the use of EGR but with
corresponding decrease in NOx emissions especially at high loads. Because of the
trade-off between NOx and PM emissions with EGR use, it is usually used together
with a DPF so that the increase caused by the use of EGR on PM, CO and HC can
be mitigated. The combined use of EGR and DPF as an after-treatment system in

12
diesel-powered vehicles has been shown to be very effective in reducing all
regulated emissions from diesel engines to below or at United States 2007 and
Euro IV emissions regulation limits. Verbeek et al. [39] conducted performance
evaluation tests on a DAF Euro IV heavy duty diesel engine equipped with both
EGR and DPF. The results showed that the after-treatment system was an
effective way to meet the emissions regulation applicable to the engine model
year. Hohl et al. [40] tested Euro III and older engines retrofitted with EGR and
DPF. The results showed that it was possible to reduce NOx emissions by 50%
while the filtration efficiency of the DPF for PM emissions reduction was greater
than 99%. Chatterjee et al. [41] retrofitted the EGR-DPF system on 2000 and 2001
diesel-powered vehicles, which were tested on a chassis dynamometer. The
results revealed that the system was able to reduce NOx emissions by 50% - 60%
and greater than 90% reduction in PM, CO and HC emissions. With 2007 NOx
emissions regulation fully enforced in 2010 in the United States, many engine
manufacturers were obliged to improve their after-treatment solutions starting from
their 2010 model engines to achieve the NOx emissions target. One possible
option is the use of an advanced EGR solution (EGR + DPF) system which is
being used by Navistar International [42]. Other manufacturers are considering the
use of urea + SCR with the existing system. Although the use of DPF technology
has the tendency to reduce PM emissions by over 90%, questions still remain
about the constituents of the PM emitted. The constituents are reported to be
predominantly made up of particles of less than 50 nm in diameter that could pass
through the filters of the DPF as a result of the DPF surface affinity.
2.3. Particulate Emissions from Diesel and Biodiesel Fuels
2.3.1. Particulates
In their report, Khair et al. [43] defines particulates, also known as PM, as
particles present in combustion engine exhaust of an internal combustion engine
that can be trapped on a sampling filter medium at 125oF (25oC) or less. While
13
particulates are emitted from both spark-ignition (SI) and diesel engines, a study
by Johnson et al. [44] clearly showed that, on a one to one basis, particle mass
and number engine-out emissions from diesel engines contribute significantly to
atmospheric aerosols compared to SI engines. Hence PM emissions regulations
have mostly targeted particulate emissions from diesel-powered engines.
However, particle engine-out emissions from SI engines may have equal or even
more significant effects on atmospheric aerosol because of the large number of SI
vehicles on the road. Diesel exhaust particles are mostly composed of highly
agglomerated carbonaceous and adsorbed materials, ash volatile and semi-
volatile organic and sulfur compounds [45]. Typically, during combustion, locally
rich regions promote the formation of solid carbon, much of which is subsequently
oxidized and the remainder is exhausted as agglomerates [45]. In addition, a small
proportion of atomized and evaporated lubrication oil escape oxidation and form
the volatile or semi volatile organic compounds generally called soluble organic
fraction (SOF) in the exhaust. In fact, Andersson et al. [46] showed in their study
that sulfur and phosphorous contents of lubrication oil that enter the chamber
during combustion contribute to the engine exhaust particles formation.
The SOF, formed from the fuel or/and lubrication oil, primarily contains
polycyclic aromatic compounds having oxygen, nitrogen and sulfur atoms or
molecules [47]. The sulfur content of the fuel/lubricant present in the combustion
chamber is usually oxidized to sulfur dioxide (SO2) while a small fraction is
oxidized to sulfur trioxide (SO3) [45]. It is the SO3 that leads to the sulfuric
compounds in the exhaust particle. Also the metallic compounds in the fuel and
the oil are oxidized to form small amounts of organic ash that are usually present
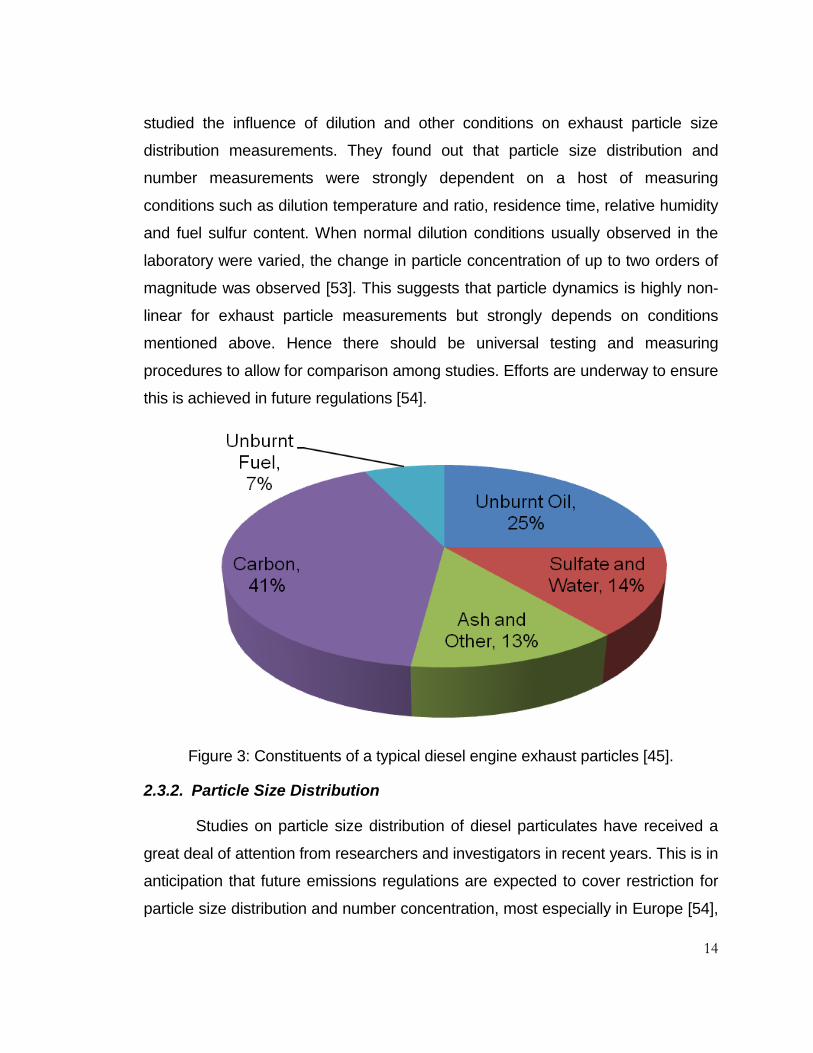
in the exhaust particle [45]. Figure 3 shows a typical particulate composition for a
heavy-duty diesel engine tested under transient condition [45].The amount of each
component present in a typical diesel engine exhaust is strongly affected by many
processes including dilution conditions, cooling, adsorption, coagulation, collision,
agglomeration, etc [48-53]. These processes determine the mass, number and
size distributions of exhaust particles. For example, Abdul-Khalek et al. [53]
14
studied the influence of dilution and other conditions on exhaust particle size
distribution measurements. They found out that particle size distribution and
number measurements were strongly dependent on a host of measuring
conditions such as dilution temperature and ratio, residence time, relative humidity
and fuel sulfur content. When normal dilution conditions usually observed in the
laboratory were varied, the change in particle concentration of up to two orders of
magnitude was observed [53]. This suggests that particle dynamics is highly non-
linear for exhaust particle measurements but strongly depends on conditions
mentioned above. Hence there should be universal testing and measuring
procedures to allow for comparison among studies. Efforts are underway to ensure
this is achieved in future regulations [54].
Figure 3: Constituents of a typical diesel engine exhaust particles [45].
2.3.2. Particle Size Distribution
Studies on particle size distribution of diesel particulates have received a
great deal of attention from researchers and investigators in recent years. This is in
anticipation that future emissions regulations are expected to cover restriction for
particle size distribution and number concentration, most especially in Europe [54],
15
because current emissions regulations do not. The main reason for this is that
various studies have shown that small exhaust particles cause adverse health
effects and visibility problems [55]. It has also been shown that particle size
distribution could not be inferred from mere measurement of particulate mass
emissions [55]. It is generally agreed in literature that the current aftertreatment
systems such as DOC-DPF and DPF only systems are very effective in reducing
particulate mass emissions with filtration efficiency greater than 90%. More in-
depth studies on aftertreatment systems revealed an increase in very small particle
emissions from low-mass emission engines equipped the aftertreatment systems
[56-60]. For instance, Kittelson and co-workers [56] performed on-road evaluation
on two diesel exhaust aftertreatment (DPF). They found out that, although the
DPFs were effective in reducing PM mass emissions, the DPF use led or could
lead to production of large quantities of NMPs. The investigation conducted by Lee
et al. [57] on a DPF equipped diesel engine revealed that most of the particles not
trapped by the aftertreatment device were mainly ultrafine particles that are less
than 100 nm in diameter. Abdul-Khalek et al. [58] showed that nearly all the
number particle emissions produced downstream of a diesel engine equipped with
ceramic filter are NMPs. The particle emissions were, however, strongly influenced
by residence time. Meyer et al. [59] also studied the influence of different
particulate traps on exhaust particle emissions. The result obtained was in
agreement with [56] that large concentration of ultrafine particles were produced
downstream of the particulate traps. However, a study by Baumgard et al. [61]
showed that the increase in NMPs may not solely depend on aftertreatment
systems’ effect but also on the complexity of engine design. They tested a 1988
and a 1991 diesel engines using both ceramic particle trap and oxidation catalyst
converter as aftertreatment system. The 1991 engine was designed for lower
particulate mass emissions than the 1988 engine. The results obtained highlighted
the differences between the 1988 and 1991 engines’ exhaust particle size
distributions. They concluded that the trap-equipped 1991 engine produced more
NMPs and less AMPS than the trap-equipped 1988 engine when tested with the
16
same fuel. These very small diameter particles (nanoparticles) have been reported
to have higher toxicity level because toxicity increases as particle size decreases
[62]. In addition, nanoparticles have the higher tendency of inhalation and
deposition in the respiratory system because of their very small size in the
atmosphere. Hence, nanoparticles are likely to cause inflammation, respiratory
disorder and other diseases [1-4, 62]. It is expected that better DPF technology will
be developed in the near future that will be effective in reducing or suppressing PM
mass emissions as well as particle number emissions.
Particle diameter is a commonly used metric to categorize size distributions
of exhaust particles. Particle diameter can be expressed as Stokes diameter or
aerodynamic diameter [63]. The diameter used would depend on the range of
particle diameter of interest and the measuring instrument. Stokes diameter is
usually used in size distributions based on light scattering and electrical mobility
principles and it is independent of particle density. Hence it is appropriate for size
distribution of small diameter particles in the range 1 nm to about 500 nm [63].
Aerodynamic diameter is density dependent and is mainly used to describe size
distribution of particles with a diameter range greater than 500 nm. For example,
aerodynamic diameter is used to describe size distributions resulting from the use
of cascade impactors as the analyzer. In prior studies reviewed in the present
study, majority of the size distributions were reported in Stokes diameter because
of the particle diameter range involved with the exception of few that were reported
in aerodynamic diameter.
Particle number emissions from diesel engine typically exist in tri-modal
lognormal distribution form [45, 64-66]. These include the NMPs, AMPs and the
coarse mode particles (CMPs) as shown in Figure 4. The NMPs (mostly described
as nanoparticles) have diameter of less than 50 nm. The diameter of the AMPs
typical ranges from 50 nm to 1000 nm and the CMPs have diameter greater that
1000 nm. The NMPs are primarily composed of semivolatile organic and sulfur
compounds, elemental carbon, metallic compounds and other species. They could
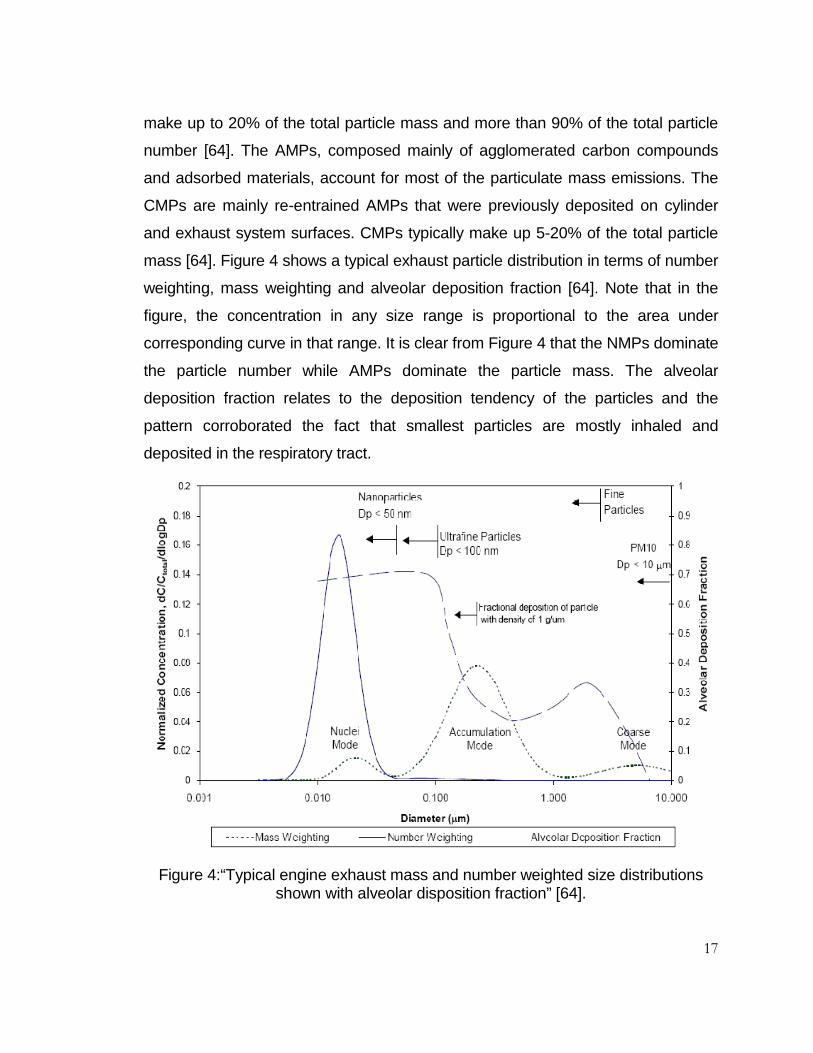
17
make up to 20% of the total particle mass and more than 90% of the total particle
number [64]. The AMPs, composed mainly of agglomerated carbon compounds
and adsorbed materials, account for most of the particulate mass emissions. The
CMPs are mainly re-entrained AMPs that were previously deposited on cylinder
and exhaust system surfaces. CMPs typically make up 5-20% of the total particle
mass [64]. Figure 4 shows a typical exhaust particle distribution in terms of number
weighting, mass weighting and alveolar deposition fraction [64]. Note that in the
figure, the concentration in any size range is proportional to the area under
corresponding curve in that range. It is clear from Figure 4 that the NMPs dominate
the particle number while AMPs dominate the particle mass. The alveolar
deposition fraction relates to the deposition tendency of the particles and the
pattern corroborated the fact that smallest particles are mostly inhaled and
deposited in the respiratory tract.
Figure 4:“Typical engine exhaust mass and number weighted size distributions shown with alveolar disposition fraction” [64].

18
2.3.3. Biodiesel Particle Emissions versus PD Particle Emissions
From the review of literature, it may be difficult to compare and conclude on
which of the two fuel types (diesel and biodiesel or biodiesel blends) would
produce less or more exhaust particles in one mode or the other when used in a
diesel engine. This is because, as noted above, particle number and size
distribution measurements are strongly dependent on the dilution and other
conditions during measurement. This alone may introduce discrepancies and bias
when comparing reports of different investigators and researchers. Various
physical and chemical properties of biodiesel have been used by researchers to
explain or justify both increases and decreases in the number of small exhaust
particles emitted over that of PD. For instance, on one hand, the very low or no
sulfur content of biodiesel may contribute to reduce the smallest particles since it is
known that fuel sulfur content is associated and promotes the formation of the
NMPs. On the other hand, higher viscosity and higher compressibility of biodiesel
may lead to higher injection pressure, advanced injection process, reduce injection
timing and advance combustion process all of which have been associated to an
increase in the number of small particles in literature.
Nevertheless, the majority of researchers and investigators have reported
increases in the number of small exhaust particles with biodiesel when compared
to PD. Krahl and co-workers [67] conducted emissions comparison test on a
DaimlerChrysler turbocharged diesel engine using pure canola oil biodiesel, PD
and ultra low sulfur PD. The results obtained clearly showed an increased number
of particles in the 10-40 nm diameter range, but a reduced number of particles
above 40 nm range, when biodiesel was compared with PD. However, they also
found a larger number of exhaust particles over the whole diameter range with
ultra low PD when compared with biodiesel. Tan et al. [68] investigated exhaust
particle emissions from turbocharged, Euro III diesel engine fuelled with PD and
Jatropha biodiesel blends (B10, B20, B50 and B100). The exhaust particle number
and size distribution were obtained using the Engine Exhaust Particle Sizer

19
(EEPS). The results revealed that the number of NMPs increases and the number
of AMPs decreases with biodiesel when compared to the PD. The results further
showed that the number of exhaust particles in each mode increases as the
biodiesel blend ratio increases. Sinha et al. [69] conducted tests on a single
cylinder, direct injection diesel engine equipped with EGR and fuelled with PD and
biodiesel blends (B20, B40, B60, B100). The particle size distribution was
measured by Scanning Mobility Particle Sizer (SMPS) at different injection
pressures and a dilution ratio of 35:1. The results showed that all the biodiesel
blends produced a higher number of NMPs and less AMPs when compared with
PD at an injection pressure of 1200 bars. Jung et al. [70] examined particle
emissions from a 1996 John Deere off-highway diesel engine using pure soy
biodiesel and PD. They found that, with biodiesel, the particle number
concentration of AMPs reduced by 38% resulting in a decrease in geometric
number mean diameter in the same mode from 80 nm to 62 nm when compared to
PD. Simultaneously, they found an increase in NMPs in terms of number
concentration. The results of investigation conducted by Tsolakis [55] corroborated
the conclusions of other investigators mentioned above. Tsolakis [55] found that,
compared to PD, biodiesel produced lower particle mass emissions but higher
number concentration of particles with low aerodynamic diameters when
compared to the PD. Kim et al. [71] conducted emission performance evaluation of
biodiesel using a common rail direct injection diesel engine equipped with
aftertreatment device. The results showed that the particulate mass emissions
were reduced with biodiesel blend compared to PD. However, the biodiesel blends
produced higher particle number concentration for particles lower than 50 nm in
diameter than the PD. Tinsdale et al. [72] carried out emissions tests on Euro IV
diesel engine vehicle using biodiesel blends (B5, B10, B30) and PD over two drive
cycle. The results obtained for engine exhaust particles indicated that biodiesel
blends produced lower particulate mass emissions as a result of lower number of
AMPs and higher number of NMPs produced compared to PD. The results further
revealed that much more NMPs and much less AMPs were produced as biodiesel

20
blend proportion increased. Park et al. [73] analyzed exhaust emissions from a
diesel engine fuelled with biodiesel blend (B20) and PD. They concluded that,
compared to PD, the B20 produced a higher number of exhaust particles in the
diameter range less than 50 nm (nanoparticles) and lower number of ultrafine and
fine particles. Tan et al. [74] performed emissions tests on a direct injection, high
pressure common rail diesel engine for passenger cars with jatropha biodiesel
blends and PD. The analysis of the exhaust particle using Engine Exhaust Particle
Sizer (EEPS) showed that the biodiesel blends produced higher number of NMPs
but lower number of AMPs when compared with PD.
A number of investigators and authors agreed that biodiesel use produced
less particulate mass but found no or insignificant increase in the number of small
exhaust particles when compared to PD. For instance, Lapuerta et al. [75]
measured particulate emissions from two different used cooking oil biodiesel fuels
and PD. They obtained results that showed a decrease in the particle GMD with
respect to that obtained from the PD. They contended that the decrease was due
to a sharp reduction in the emission of AMPs rather than by an increase in the
emissions of NMPs. The work of Bagley et al. [76] agreed with the conclusions of
Lapuerta [75]. Bagley et al. [76] found a similar decrease in exhaust particle
volume (mass) emissions with the use of soybean-oil biodiesel compared to PD.
They concluded that particulate mass emissions were caused by up to 65%
reduction of particles in the AMPs rather than by increase in the other particle
modes. Some authors even found no significant effect of biodiesel use across the
whole particle size diameter range although they agreed that biodiesel use
produced less particulate mass compared to PD. Chen et al. [77] conducted tests
on a single-cylinder engine under steady states conditions using soybean biodiesel
and PD. They found that there was no significant difference in the GMD of the
particle size distribution between biodiesel and PD fuels, although there were
reductions both in mass and number of emitted particles with biodiesel use.
Lapuerta et al. [78] examined particulate emissions from a diesel engine fuelled

21
with biofuels derived from vegetable oils and PD. They observed a sharp reduction
in the number of particles emitted but not in their size distribution.
A few other reports suggested that biodiesel use actually produced a
reduction in the number of smallest exhaust particles (NMPs). For instance, Aakko
et al. [79] performed emissions evaluation on a bus diesel engine fuelled by canola
oil biodiesel blends and PD. The results obtained showed that there was a
decrease in the number of particles in the nucleation mode range with the
biodiesel blends by using three different particle size distribution measuring
instruments.
Finally, the review of literature showed that the use of biodiesel and its
blends in compression ignition engines offer potential benefits over PD especially
in terms of vehicle emissions (CO2, CO, HC and PM), renewability and
environmental impact. Particle number emissions advantage of biodiesel over PD
is still unclear as this depends on many conditions, in addition to fuel effects,
during measurement. Available literature data on biodiesel fuel performance
mostly cover diesel engines and trucks of model year 2006 and earlier. Little or no
biodiesel fuel use data exists for 2007 and later models of engines and trucks. The
objective of this study is to add to the available data inventories on biodiesel use
through the testing of a 2007 MHDDT in a chassis dynamometer laboratory. This
could aid policy and decision makers to make informed decisions.
22
3. Experimental Set-Up and Procedures
The testing for the present study was conducted at one of the research
laboratories of Center for Alternative Fuel Engines and Emissions (CAFEE) of
West Virginia University located in Morgantown, WV. Specifically, chassis
dynamometer testing for the MHDDT was done using the center’s Heavy Duty
Chassis Dynamometer Emissions Testing Laboratory located in the Industrial Park
of Morgantown. This laboratory has fully transportable chassis dynamometers and
a mobile container that were designed to meet EPA 2004 and 2007 and beyond
emissions measurement specifications. The testing for the present study took
place in November 2009. The procedure involved setting up a 2007 MHDDT,
fuelled with biodiesel blends and PD, on a chassis dynamometer and measuring
the regulated emissions (NOx, CO and HC) and CO2 emissions through the use of
gaseous analyzers housed in the container. PM mass emissions were measured
gravimetrically by collecting samples on filter that were later taken to an
environmentally controlled mass measurement room. In addition to emissions
characterization, exhaust particles were also measured in terms of number
concentrations and size distribution in the range 5-1000 nm with the use of a
Cambustion Fast Particulate Spectrometer (DMS 500).
3.1. Test Fuels
Three different fuels, namely PD, B20A, and B20B, were employed in this
study. The PD was an ultra low sulfur diesel (ULSD) containing less than 15 ppm
(parts per million) sulfur content. It was the recommended fuel for diesel engine
use by EPA throughout the United States to help achieve the goal of meeting EPA
2007 PM emissions regulations. The PD used was obtained from part of the stock
supplied by a local fuel delivery service (Guttman) to the laboratory at the time.
Some of the physical and chemical properties of the PD are shown in Table 2
below. B20A was a biodiesel blend prepared by blending 20% by volume of
biodiesel feedstock obtained from chicken fat with 80% (by volume) of the PD. The

23
biodiesel feedstock was 100% pure and was sold by Export Fuel Company
(Export, Pennsylvania) and the certification sheet containing the property of the
biodiesel provided by the seller. Similarly, B20B was prepared by blending 20% by
volume of the biodiesel feedstock obtained from soybeans oil with 80% (by
volume) of the same PD used in blending B20A. The soybeans feedstock was
99.9% pure with 0.1% PD. It was sold by Guttman Oil Company (Elkins, West
Virginia) and the specification sheet provided by the company. The fuel blending
was done gravimetrically at the CAFEE engine research laboratory. The process
involved calculation of mass of each of the biodiesel feedstocks and the PD to
make the required volumetric ratio using the specific gravities of the respective
fuels and mixing them thoroughly. The specific gravity of each fuel was measured
in the laboratory and was temperature corrected before being used in the blending
calculation. The 0.1% PD in the soybeans feedstock was assumed to have the
same properties as that of the PD used in blending. Samples of the biodiesel
blends were sent for fuel properties analysis using ASTM D7467-09A test
procedure. Some of the test analysis results are shown in Table 2. The complete
fuel analysis report can be seen in the Appendix. It is noted that B20B does not
meet the oxidation stability specification of 6 hours minimum. This, normally,
should not affect the test results in any way as this specification only relates to
storage capability for a certain period (6 months) before degradation sets in. The
B20B was used a few days after being blended.
3.2. Test Vehicle
The test vehicle was a 2007 MHDDT manufactured by International Vehicle
and Engine Corporation. The vehicle had a 2007 heavy duty diesel engine
manufactured by the same manufacturer and meets EPA 2007 emissions
regulation. The truck’s engine was equipped with VGT and EGR. The engine was
also equipped with DPF as an aftertreatment device. The test vehicle and engine
details are shown in Table 3. Figure 5 also shows the MHDDT on the chassis
dynamometer during testing.
24
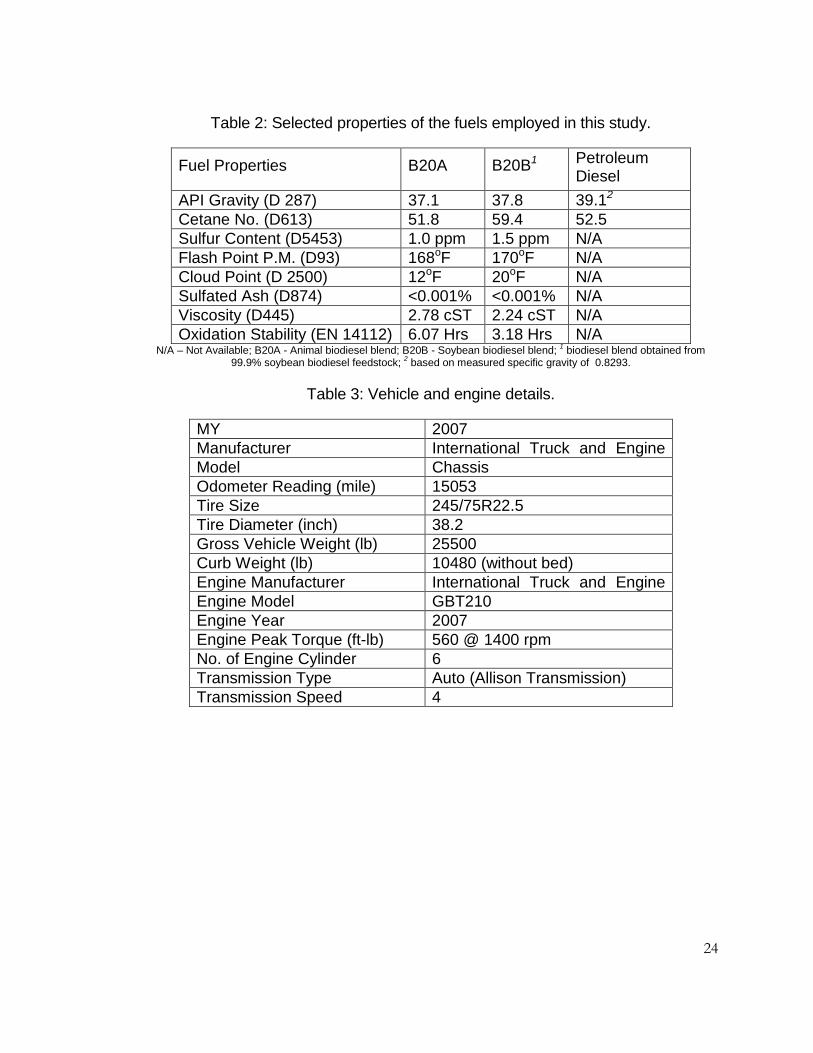
Table 2: Selected properties of the fuels employed in this study.
Fuel Properties B20A B20B1 Petroleum Diesel
API Gravity (D 287) 37.1 37.8 39.12 Cetane No. (D613) 51.8 59.4 52.5 Sulfur Content (D5453) 1.0 ppm 1.5 ppm N/A Flash Point P.M. (D93) 168oF 170oF N/A Cloud Point (D 2500) 12oF 20oF N/A Sulfated Ash (D874) <0.001% <0.001% N/A Viscosity (D445) 2.78 cST 2.24 cST N/A Oxidation Stability (EN 14112) 6.07 Hrs 3.18 Hrs N/A
N/A – Not Available; B20A - Animal biodiesel blend; B20B - Soybean biodiesel blend; 1 biodiesel blend obtained from 99.9% soybean biodiesel feedstock; 2 based on measured specific gravity of 0.8293.
Table 3: Vehicle and engine details.
MY 2007 Manufacturer International Truck and Engine
Model Chassis Odometer Reading (mile) 15053 Tire Size 245/75R22.5 Tire Diameter (inch) 38.2 Gross Vehicle Weight (lb) 25500 Curb Weight (lb) 10480 (without bed) Engine Manufacturer International Truck and Engine
Engine Model GBT210 Engine Year 2007 Engine Peak Torque (ft-lb) 560 @ 1400 rpm No. of Engine Cylinder 6 Transmission Type Auto (Allison Transmission) Transmission Speed 4

25
Figure 5: MHDDT used for this study.
3.3. Test Vehicle Parameters
Normally, before any vehicle testing is done on a chassis dynamometer,
coast down procedures are usually performed with some known vehicle
parameters. This is done to ensure that real life driving conditions are accurately
simulated in the laboratory before the actual testing begins. In the coast down
procedure, the actual road load of the vehicle is replicated on the dynamometer by
using the pre-defined vehicle parameters. For the present study, the vehicle
parameters used, which gave satisfactory results from the coast down procedure,
are shown in Table 4. The vehicle speed was plotted against time for the actual
coast down data. Figure 36 of the appendix shows some of the plotted data.
Table 4: Test vehicle parameters.
Test Vehicle Weight (lb) 23050 Drag Coefficient 0.665 Coefficient of Rolling Friction (µ) 0.00930 Frontal Area (sq. ft) 71

26
3.4. Drive Cycles
The vehicle was tested under steady state condition at the laboratory. Thus
the vehicle was tested using three different steady speed schedules representing
three different vehicle road loads. The steady speed drive cycles used were MD1,
MD2 and MD3. The speed-time traces of the drive cycles are shown in Figure 6
below. It is important to say that each of the vehicle tests started after an initial
warm up and after the desired vehicle speed was reached.
Figure 6: Time-speed traces for MD1, MD2 and MD3.
3.5. Chassis Dynamometer
Tailpipe vehicle emissions measurement requires the use of a chassis
dynamometer alongside with other systems in order to quantify the emissions.
Specifically, the test vehicle is usually set on a chassis dynamometer in order to
obtain instantaneous mass emissions while the vehicle is being tested under
realistic driving situations. Currently, CAFEE has dynamometers that are capable
of simulating vehicle weight from 40,000lbs to 70,000lbs [80] and can be
transported to clients’ testing sites for use. One of these dynamometers was used
27
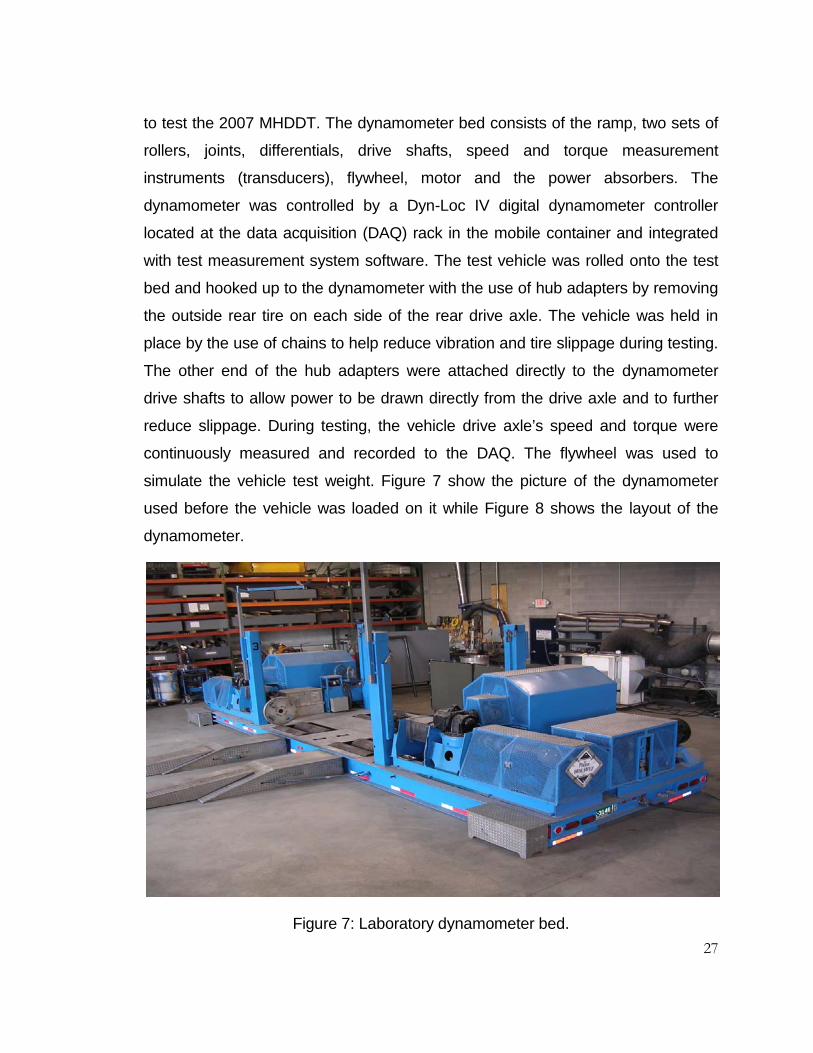
to test the 2007 MHDDT. The dynamometer bed consists of the ramp, two sets of
rollers, joints, differentials, drive shafts, speed and torque measurement
instruments (transducers), flywheel, motor and the power absorbers. The
dynamometer was controlled by a Dyn-Loc IV digital dynamometer controller
located at the data acquisition (DAQ) rack in the mobile container and integrated
with test measurement system software. The test vehicle was rolled onto the test
bed and hooked up to the dynamometer with the use of hub adapters by removing
the outside rear tire on each side of the rear drive axle. The vehicle was held in
place by the use of chains to help reduce vibration and tire slippage during testing.
The other end of the hub adapters were attached directly to the dynamometer
drive shafts to allow power to be drawn directly from the drive axle and to further
reduce slippage. During testing, the vehicle drive axle’s speed and torque were
continuously measured and recorded to the DAQ. The flywheel was used to
simulate the vehicle test weight. Figure 7 show the picture of the dynamometer
used before the vehicle was loaded on it while Figure 8 shows the layout of the
dynamometer.
Figure 7: Laboratory dynamometer bed.
28
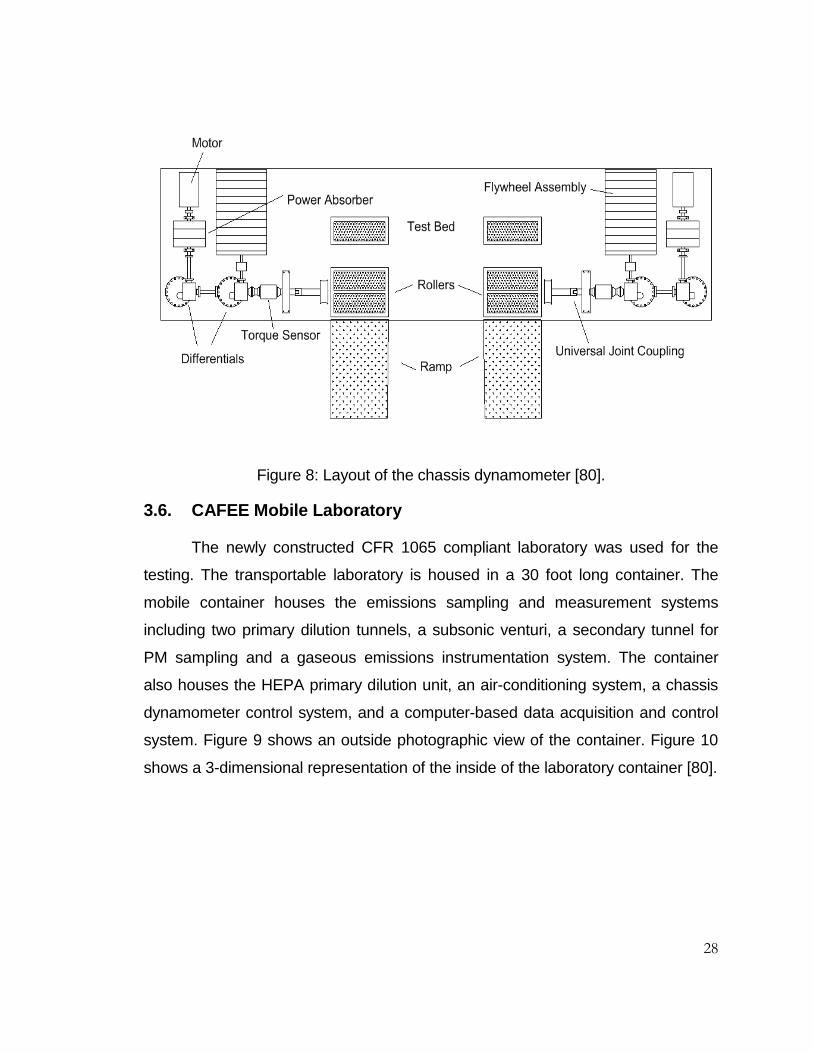
Figure 8: Layout of the chassis dynamometer [80].
3.6. CAFEE Mobile Laboratory
The newly constructed CFR 1065 compliant laboratory was used for the
testing. The transportable laboratory is housed in a 30 foot long container. The
mobile container houses the emissions sampling and measurement systems
including two primary dilution tunnels, a subsonic venturi, a secondary tunnel for
PM sampling and a gaseous emissions instrumentation system. The container
also houses the HEPA primary dilution unit, an air-conditioning system, a chassis
dynamometer control system, and a computer-based data acquisition and control
system. Figure 9 shows an outside photographic view of the container. Figure 10
shows a 3-dimensional representation of the inside of the laboratory container [80].
29
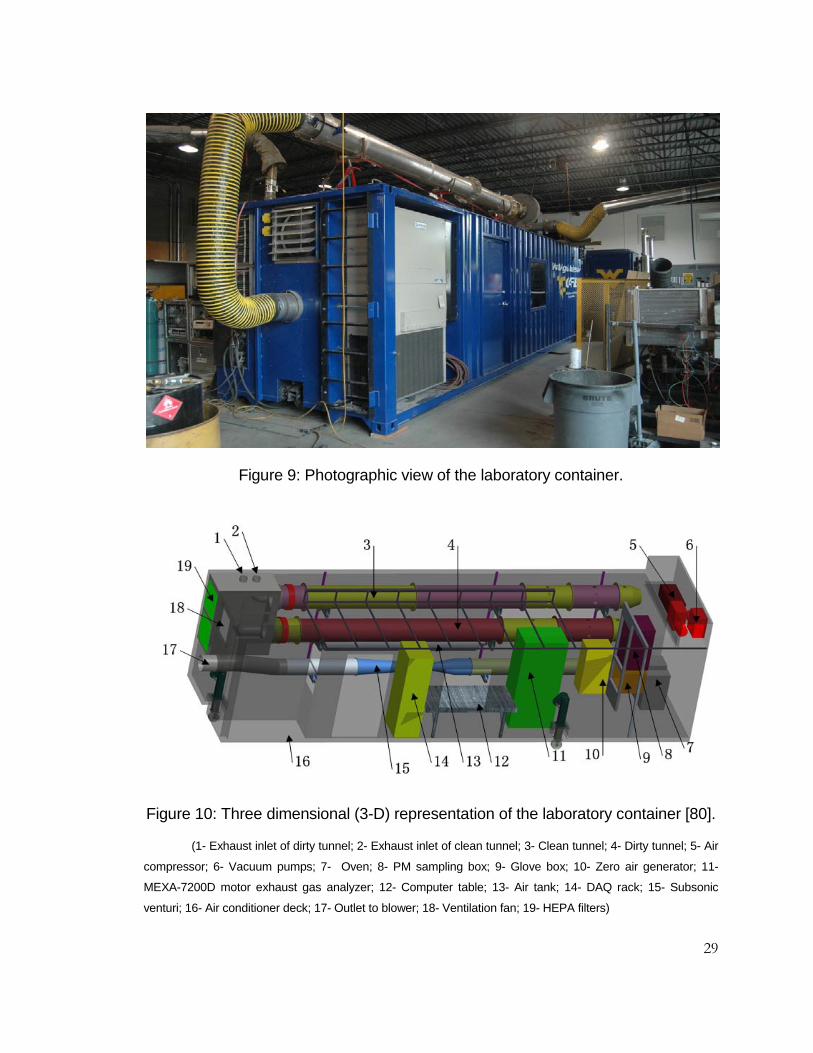
Figure 9: Photographic view of the laboratory container.
Figure 10: Three dimensional (3-D) representation of the laboratory container [80].
(1- Exhaust inlet of dirty tunnel; 2- Exhaust inlet of clean tunnel; 3- Clean tunnel; 4- Dirty tunnel; 5- Air
compressor; 6- Vacuum pumps; 7- Oven; 8- PM sampling box; 9- Glove box; 10- Zero air generator; 11-
MEXA-7200D motor exhaust gas analyzer; 12- Computer table; 13- Air tank; 14- DAQ rack; 15- Subsonic
venturi; 16- Air conditioner deck; 17- Outlet to blower; 18- Ventilation fan; 19- HEPA filters)

30
As seen in Figure 10 above, the laboratory contains two primary dilution
tunnels. Each dilution tunnel is of 18 inches ID and 20 feet long and was made of
316 stainless steel material. The primary dilution tunnels facilitate the
measurement capability for both low emissions vehicles as well as traditional
diesel-fueled vehicles. The upper tunnel referred to as the “clean tunnel” is used
whenever low emissions vehicles are being tested. The “dirty tunnel” (lower tunnel)
is usually used for the traditional diesel-fueled vehicles with high PM levels [80].
This arrangement helps to reduce tunnel history effects between test programs
having different exhaust emission compositions. For the present study, the upper
dilution tunnel was used since the vehicle was equipped with the DPF.
3.7. Vehicle Testing Sequence/Method
MD1, MD2 and MD3 were used as drive cycles for the vehicle testing using
the three test fuels mentioned above. The test for MD2 using PD was repeated
three times to demonstrate test repeatability and data capture consistency while all
other tests were performed only once. The vehicle cruise control system was
employed during testing to ensure steady speed operations except for the MD1
drive cycle. This was because the vehicle speed for MD1 was too low for the
cruise control system operation. Hence the vehicle could not be held steady with
the cruise control system at this speed.
3.8. Emissions Sampling System Method
The emissions sampling system principle of the laboratory is based on the
subsonic venturi - constant volume sampler (SSV-CVS). The first step involved in
emissions sampling was that raw exhaust from the vehicle was ducted towards the
inlet of the primary tunnel through the use of transfer pipe. The raw exhaust was
diluted with high efficiency particulate air (HEPA) filtered air just before the
upstream of a mixing orifice with the mixture flow rate being controlled by the SSV
– blower system situated at the end of the dilution tunnel. The streams were further
mixed in the mixing region downstream of the 10-inch orifice plate [80]. The diluted

31
gaseous exhaust samples were collected by sample probes inserted at sampling
plane located at approximately 10 times the tunnel diameter downstream of the
mixing orifice, including samples for the PM analysis. The gaseous samples were
then delivered to a Horiba MEXA 7200D motor exhaust gas analyzers and DMS
500 for quantification of the concentrations of CO2, CO, HC and NOx emissions
and exhaust particles analysis, respectively. The PM sample was further drawn
into the secondary tunnel, where it was diluted with more HEPA-filtered air, and
passed through a cyclone separator. This was to separate particles that were
greater than certain size in diameter (usually 10 µm). Figure 11 shows the
schematic of the emissions sampling system [80].
3.9. Gaseous Emissions Measurement
As noted above, gaseous emissions samples were delivered to a Horiba
MEXA 7200D motor exhaust gas analyzer system housed inside the laboratory
container. The system is capable of measuring regulated emissions including NOx,
CO, THC and CO2 emissions on a continuous basis. The MEXA system primarily
consists of basic units namely the gas divider, the main control unit (MCU), the
interface unit (IFC), the analyzer rack (ANR), the power supply unit (PSU), the
solenoid valve unit (SVS), the sample handling unit (SHS) and the OVN-700
module [81]. The MCU is a computer system that houses the software that
monitors and controls all other units of the system via the IFC which is the
network/communication device. The ANR provides housing for the analyzer
modules and can accommodate up to five analyzer modules. The SVS controls the
flow of the operational and calibration gases to the analyzer modules while the
SHS filters conditions and pumps the exhaust sample gas to the analyzer
modules. Presently, three analyzers are fitted to the ANR. These include the AIA-
721A CO analyzer, the AIA-722 CO/CO2 analyzer and the CLA-720 “cold” NOx
analyzer. The OVN-700 module separately houses the FIA-725A THC and the
CLA-720MA NOx analyzers that need heated gaseous samples for proper
operations. The AIA-721A CO and the AIA-722 CO/ CO2 analyzers measure CO

32
and CO2 emissions by using the non-dispersive infrared detection (NDIR) principle.
The CO analyzer is capable of measuring between 50-5000 ppm range while the
CO/CO2 analyzer measures CO levels over 0.5-12 volume percent (vol%) and
CO2 levels over 3-20 vol%. The NOx analyzer uses the principle of
chemiluminesecent detection (CLD) to measure NOx emissions. It is capable of
measuring NOx emissions over 10-10000 ppm range. The THC analyzer can
measure emissions over 10-5000 ppm range and uses the heated flame ionization
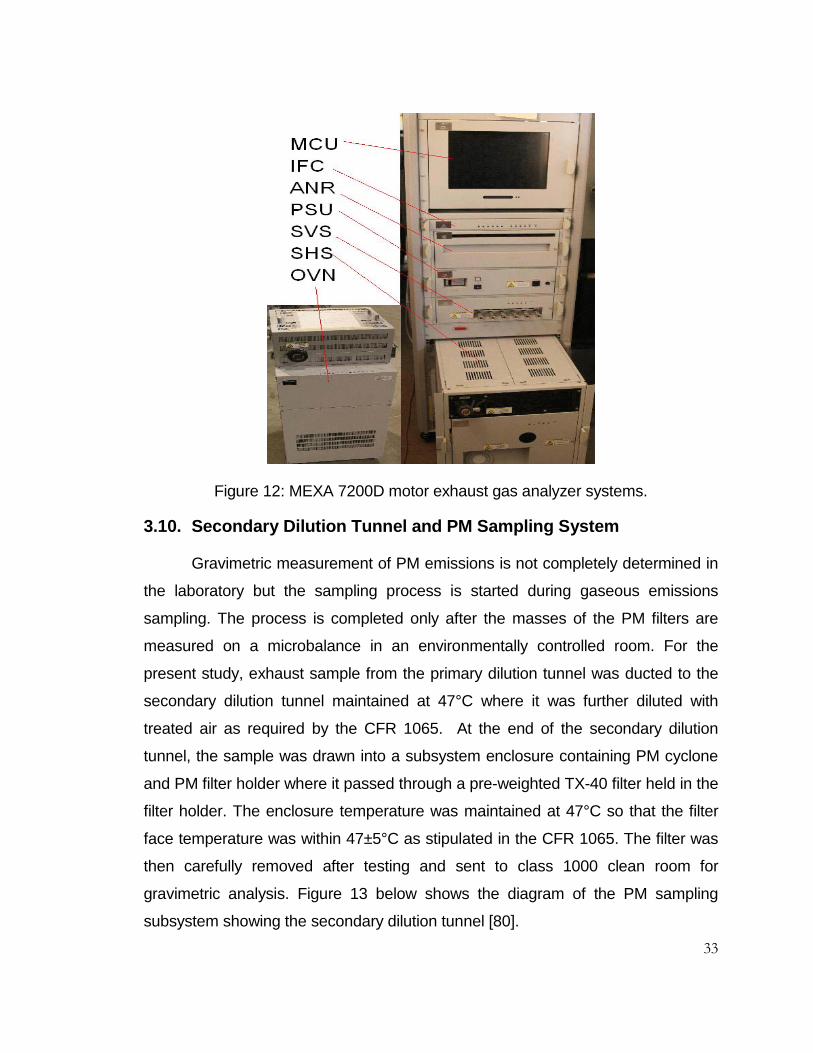
detection (HFID) principle. Figure 12 below shows the photo of the MEXA 7200D
system
Figure 11: “Schematic of emissions sampling system” [80].
33
Figure 12: MEXA 7200D motor exhaust gas analyzer systems.
3.10. Secondary Dilution Tunnel and PM Sampling System
Gravimetric measurement of PM emissions is not completely determined in
the laboratory but the sampling process is started during gaseous emissions
sampling. The process is completed only after the masses of the PM filters are
measured on a microbalance in an environmentally controlled room. For the
present study, exhaust sample from the primary dilution tunnel was ducted to the
secondary dilution tunnel maintained at 47°C where it was further diluted with
treated air as required by the CFR 1065. At the end of the secondary dilution
tunnel, the sample was drawn into a subsystem enclosure containing PM cyclone
and PM filter holder where it passed through a pre-weighted TX-40 filter held in the
filter holder. The enclosure temperature was maintained at 47°C so that the filter
face temperature was within 47±5°C as stipulated in the CFR 1065. The filter was
then carefully removed after testing and sent to class 1000 clean room for
gravimetric analysis. Figure 13 below shows the diagram of the PM sampling
subsystem showing the secondary dilution tunnel [80].

34
Figure 13: System for PM sampling [80].
3.11. Cambustion DMS 500 Fast Particle Spectrometer
DMS 500 was used to collect exhaust particles data during testing. This
purpose was to quantify exhaust particle number concentration and size
distribution so that comparisons could be made between PD and biodiesel blends’
exhaust particles. In addition, the DMS 500 data analysis in terms of mass could
also be used to validate the gravimetric PM emissions measurement. To achieve
this, an assumption about the particle shape and density needs to be made.
Some studies had assumed spherical particles with unit density for particle mass
estimation [82]. Other studies developed empirical relationships to estimate mass
of particles using the electrical mobility diameter of the particles [83]. In this report,
the second approach was used for particle mass estimation. Electrical mobility
property of particles is what is employed in the DMS 500 measuring principle.
Electrical mobility is a measure of the ease of electric field deflection of charged
particle and it is a function of charge on the particle as well as its aerodynamic
drag. The DMS 500 instrument is capable of counting particles between 5 nm and
1000 nm electrical mobility diameter. The instrument operates by charging the
particles that enter the instrument using a diffusion charging process. The charged
particles then flow into a strong electric field contained in a classification column.

35
The electric field inside the column deflects the particles towards 22 electrometer
detectors according to each particle’s electrical mobility [84]. When the deflected
particles impinge on the detectors, it results to changes in electrical current which
can be measured and processed into spectral equivalent diameter and other
desired particle data [84]. Figure 14 shows the picture of the DMS 500 with the
data acquisition computer used to collect exhaust particle data during testing.
Figure 14: DMS 500 fast particle spectrometer.
3.12. Engine Control Unit (ECU) Data Collection
For each of the test runs, the vehicle engine performance data were
collected. These include the ambient air temperature, current torque to maximum
available torque, engine speed, coolant temperature and oil temperature. The
performance data were collected via SAE 1587 communication protocol. SAE
1587 protocol is one of the heavy duty vehicle serial data communication
standards that specify information sharing via datalink. Datalink is the process by
which various subsystems of the vehicle communicate and share data among
36
themselves. The process involves conversion of information, in parallel form, from
one subsystem to serial form for transport to other subsystems where the
information is converted back to the parallel form [85].
Although engine performance data were collected, the actual engine torque
and power demand could not be obtained from the data. The absolute torque data
were not available because the lug curve required to do this could not be obtained
from the engine manufacturer. However, the torque and power demand were
estimated using the power available at the wheels to approximate the engine
power with the assumption of 85% overall powertrain efficiency.
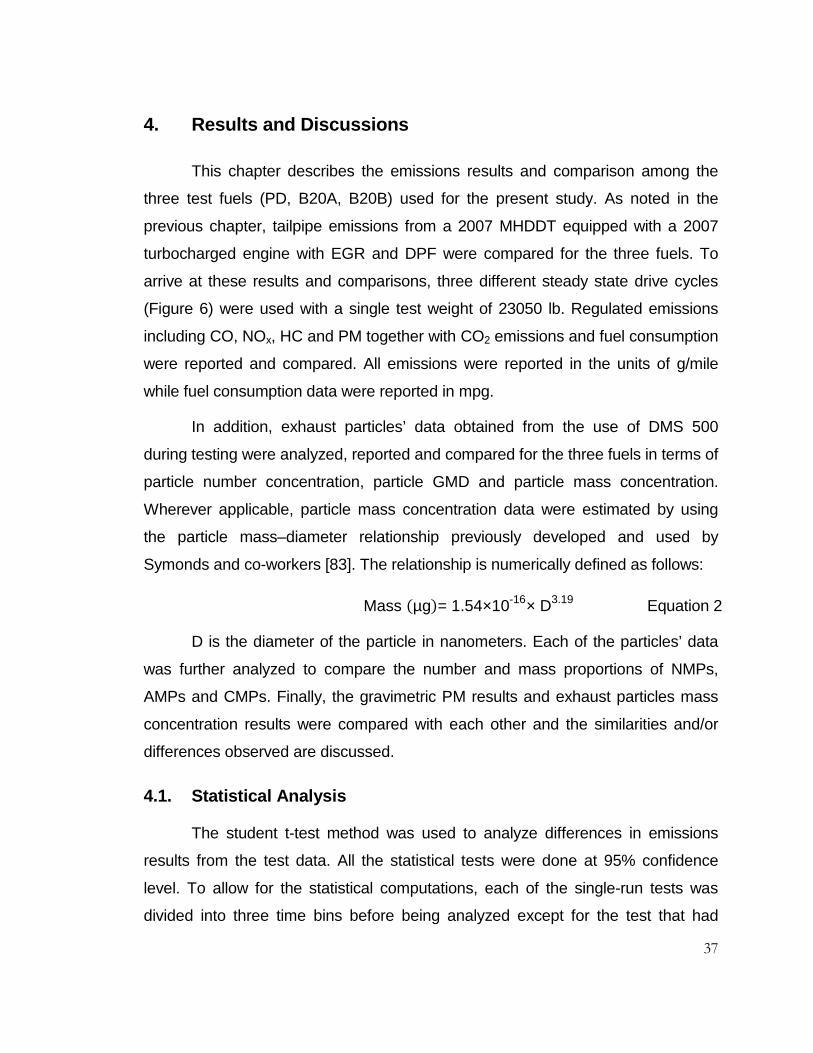
37
4. Results and Discussions
This chapter describes the emissions results and comparison among the
three test fuels (PD, B20A, B20B) used for the present study. As noted in the
previous chapter, tailpipe emissions from a 2007 MHDDT equipped with a 2007
turbocharged engine with EGR and DPF were compared for the three fuels. To
arrive at these results and comparisons, three different steady state drive cycles
(Figure 6) were used with a single test weight of 23050 lb. Regulated emissions
including CO, NOx, HC and PM together with CO2 emissions and fuel consumption
were reported and compared. All emissions were reported in the units of g/mile
while fuel consumption data were reported in mpg.
In addition, exhaust particles’ data obtained from the use of DMS 500
during testing were analyzed, reported and compared for the three fuels in terms of
particle number concentration, particle GMD and particle mass concentration.
Wherever applicable, particle mass concentration data were estimated by using
the particle mass–diameter relationship previously developed and used by
Symonds and co-workers [83]. The relationship is numerically defined as follows:
Mass (µg)= 1.54×10⁻¹⁶× D3.19 Equation 2
D is the diameter of the particle in nanometers. Each of the particles’ data
was further analyzed to compare the number and mass proportions of NMPs,
AMPs and CMPs. Finally, the gravimetric PM results and exhaust particles mass
concentration results were compared with each other and the similarities and/or
differences observed are discussed.
4.1. Statistical Analysis
The student t-test method was used to analyze differences in emissions
results from the test data. All the statistical tests were done at 95% confidence
level. To allow for the statistical computations, each of the single-run tests was
divided into three time bins before being analyzed except for the test that had
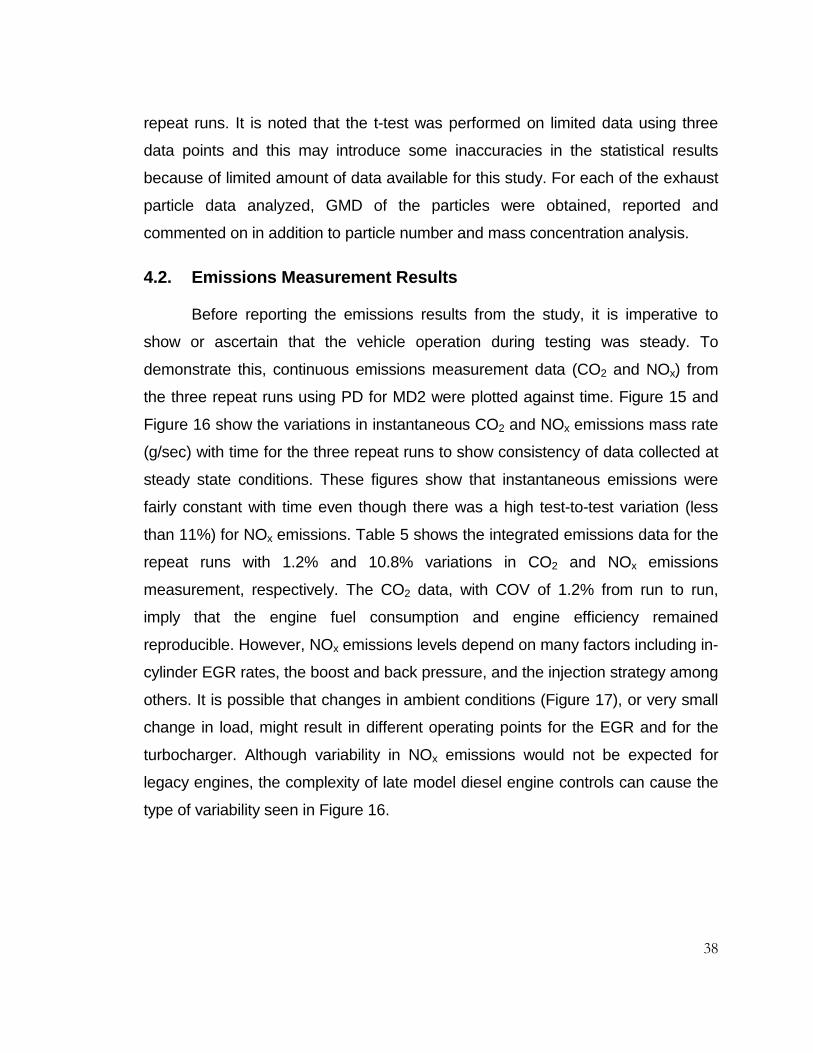
38
repeat runs. It is noted that the t-test was performed on limited data using three
data points and this may introduce some inaccuracies in the statistical results
because of limited amount of data available for this study. For each of the exhaust
particle data analyzed, GMD of the particles were obtained, reported and
commented on in addition to particle number and mass concentration analysis.
4.2. Emissions Measurement Results
Before reporting the emissions results from the study, it is imperative to
show or ascertain that the vehicle operation during testing was steady. To
demonstrate this, continuous emissions measurement data (CO2 and NOx) from
the three repeat runs using PD for MD2 were plotted against time. Figure 15 and
Figure 16 show the variations in instantaneous CO2 and NOx emissions mass rate
(g/sec) with time for the three repeat runs to show consistency of data collected at
steady state conditions. These figures show that instantaneous emissions were
fairly constant with time even though there was a high test-to-test variation (less
than 11%) for NOx emissions. Table 5 shows the integrated emissions data for the
repeat runs with 1.2% and 10.8% variations in CO2 and NOx emissions
measurement, respectively. The CO2 data, with COV of 1.2% from run to run,
imply that the engine fuel consumption and engine efficiency remained
reproducible. However, NOx emissions levels depend on many factors including in-
cylinder EGR rates, the boost and back pressure, and the injection strategy among
others. It is possible that changes in ambient conditions (Figure 17), or very small
change in load, might result in different operating points for the EGR and for the
turbocharger. Although variability in NOx emissions would not be expected for
legacy engines, the complexity of late model diesel engine controls can cause the
type of variability seen in Figure 16.
39
Figure 15: Instantaneous CO2 emissions for three repeat runs.
Figure 16: Instantaneous NOx emissions for three repeat runs.
.

40
Figure 17: Variations in ambient air temperature during repeat runs.
Table 5: CO2 and NOx emissions data for repeat test runs
CO2 (g/mile) NOx (g/mile) Run1 660.4 2.420 Run2 658.4 2.490 Run3 646.3 2.026 Mean 655.0 2.312 Std. dev 7.63 0.250 COV (%) 1.2 10.8
41
It is noted that the CO and HC emissions data were not analyzed for data
consistency. This was because CO and HC emissions data showed a very high
run to run variability because these emissions were of very low concentration for
the trap equipped vehicle and consequently, very difficult to measure and quantify.
The measurement accuracy for these emissions are further complicated by the
combined effects of the vehicle EGR and DPF, fluctuations in engine load and
measuring equipment resolution. It should also be noted that the effect of the
engine fan operation may introduce some inaccuracies and uncertainty into the
measurement of emissions.
For the single-run tests, each continuous data set was analyzed to
ascertain any systemic change with time. Each of the data set was divided into
three time bins and COV calculated for each bin. The purpose was to compare
COV values of the three bins for a given data set with one another for each of the
emissions species to determine the extent of data variation over time. Table 6
shows some data analysis for B20B representative of the extent of data variation in
the other time bins for each of the emissions species based on the COV values.
For instance, in the table, analysis from bin1 was shown for HC but represents the
level of variation of HC emissions data in the other two time bins. Bin2 and bin3
data analysis were also shown for CO2, NOx and CO, which are also
representative of data variation in the other two time bins for each of the emissions
species. Similar data analysis trends (not shown) were observed for PD and B20A.
Hence, it can be inferred that continuous data collected were steady with time
basically for CO2 and NOx (with COV less than 10%) while the same could not be
said of CO and HC. CO and HC continuous data showed very high variability with
high COV as high as 206% and 620% respectively.
4.2.1. Vehicle Operating Parameters
The vehicle ECU data broadcast (engine speed), was used to infer the
engine torque using the road load power requirement with 85% powertrain
efficiency assumption. These estimations indicated that the vehicle operated at an
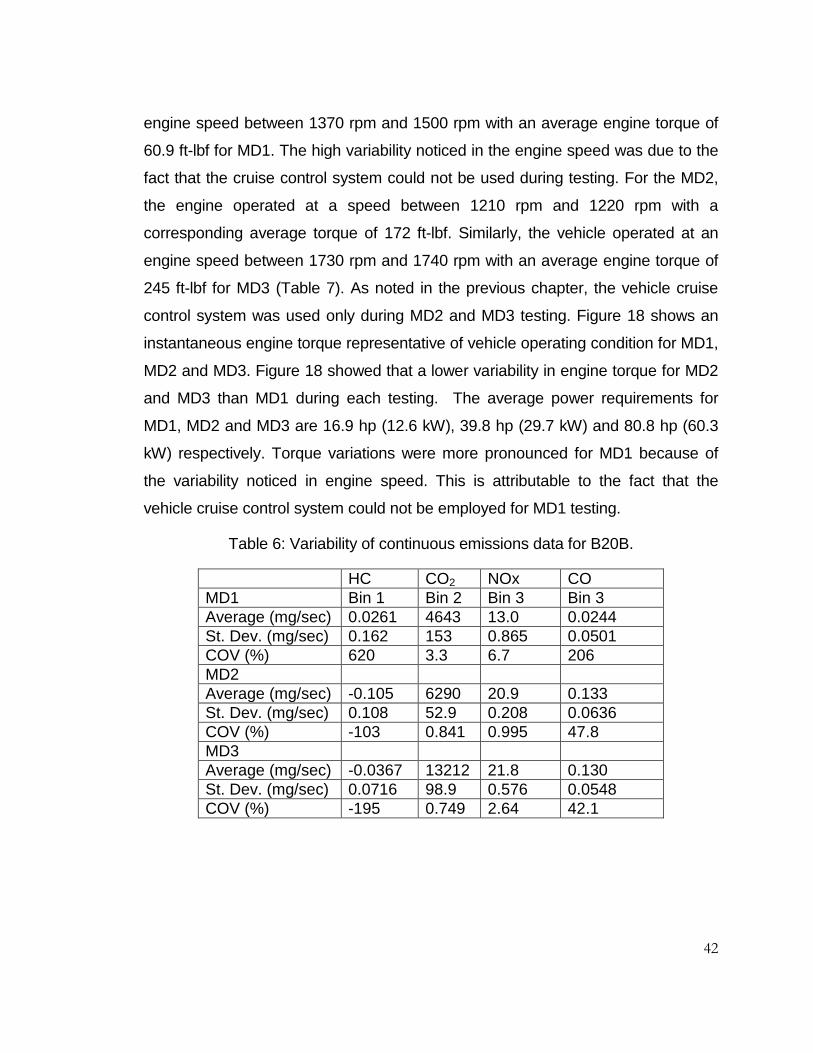
42
engine speed between 1370 rpm and 1500 rpm with an average engine torque of
60.9 ft-lbf for MD1. The high variability noticed in the engine speed was due to the
fact that the cruise control system could not be used during testing. For the MD2,
the engine operated at a speed between 1210 rpm and 1220 rpm with a
corresponding average torque of 172 ft-lbf. Similarly, the vehicle operated at an
engine speed between 1730 rpm and 1740 rpm with an average engine torque of
245 ft-lbf for MD3 (Table 7). As noted in the previous chapter, the vehicle cruise
control system was used only during MD2 and MD3 testing. Figure 18 shows an
instantaneous engine torque representative of vehicle operating condition for MD1,
MD2 and MD3. Figure 18 showed that a lower variability in engine torque for MD2
and MD3 than MD1 during each testing. The average power requirements for
MD1, MD2 and MD3 are 16.9 hp (12.6 kW), 39.8 hp (29.7 kW) and 80.8 hp (60.3
kW) respectively. Torque variations were more pronounced for MD1 because of
the variability noticed in engine speed. This is attributable to the fact that the
vehicle cruise control system could not be employed for MD1 testing.
Table 6: Variability of continuous emissions data for B20B.
HC CO2 NOx CO MD1 Bin 1 Bin 2 Bin 3 Bin 3 Average (mg/sec) 0.0261 4643 13.0 0.0244 St. Dev. (mg/sec) 0.162 153 0.865 0.0501 COV (%) 620 3.3 6.7 206 MD2 Average (mg/sec) -0.105 6290 20.9 0.133 St. Dev. (mg/sec) 0.108 52.9 0.208 0.0636 COV (%) -103 0.841 0.995 47.8 MD3 Average (mg/sec) -0.0367 13212 21.8 0.130 St. Dev. (mg/sec) 0.0716 98.9 0.576 0.0548 COV (%) -195 0.749 2.64 42.1
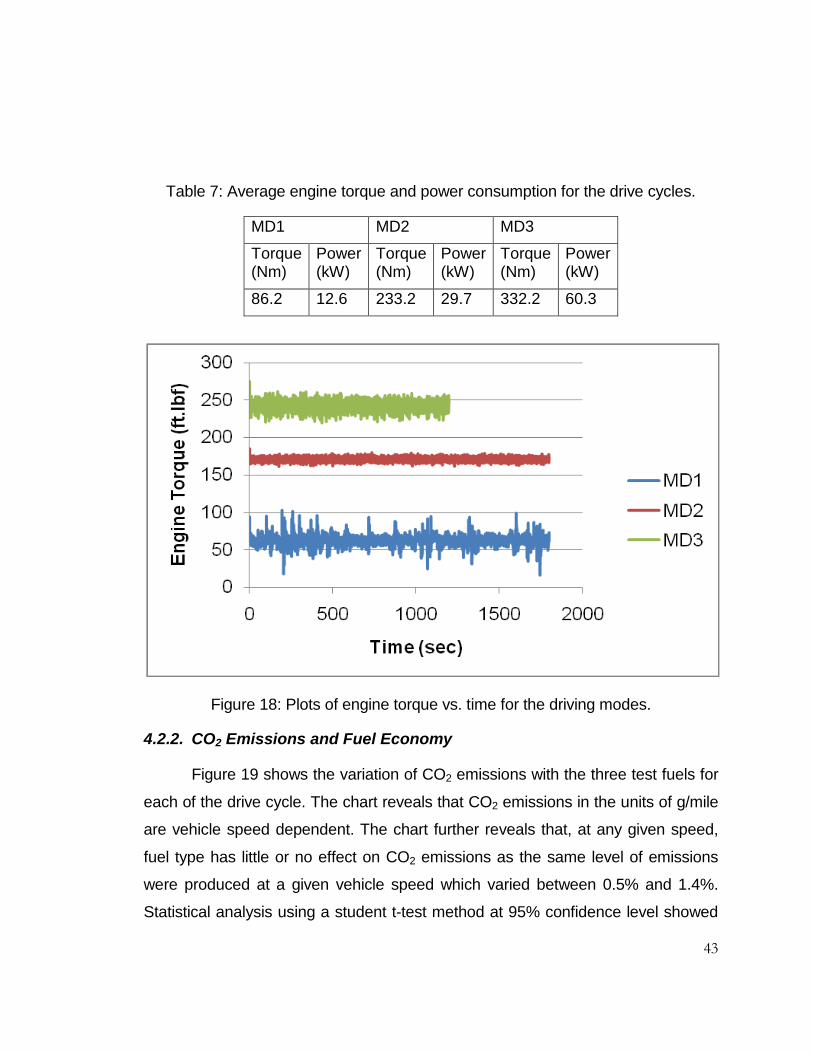
43
Table 7: Average engine torque and power consumption for the drive cycles.
MD1 MD2 MD3
Torque (Nm)
Power (kW)
Torque (Nm)
Power (kW)
Torque (Nm)
Power (kW)
86.2 12.6 233.2 29.7 332.2 60.3
Figure 18: Plots of engine torque vs. time for the driving modes.
4.2.2. CO2 Emissions and Fuel Economy
Figure 19 shows the variation of CO2 emissions with the three test fuels for
each of the drive cycle. The chart reveals that CO2 emissions in the units of g/mile
are vehicle speed dependent. The chart further reveals that, at any given speed,
fuel type has little or no effect on CO2 emissions as the same level of emissions
were produced at a given vehicle speed which varied between 0.5% and 1.4%.
Statistical analysis using a student t-test method at 95% confidence level showed

44
that the variations in emissions are insignificant, especially for MD1 and MD2.
MD3 data analysis tended to show that statistically significant differences in
emissions was evident among the three test fuels, but were still within the
emissions variations mentioned above. This suggests that it could be possible to
have marked differences in CO2 emissions among the fuels at very high vehicle
speed where more fuel is consumed. In general, all statistical analysis and error
bars on the various charts were made possible by dividing the single-run
continuous emissions data into 3 time bins. Fuel consumption, a metric for vehicle
performance measurement, is related to the carbon content of the fuel. Therefore,
it is noted in Figure 20 that at a given vehicle speed; the use of B20A and B20B
produced lower fuel economy compared to PD. This is expected since PD typically
contains high carbon content and no oxygen and thus higher heating value than
biodiesel or biodiesel blends. This is consistent with the conclusions of many
authors [23, 25] that less fuel is consumed with the use of PD compared to
biodiesel blends because of the lower carbon content in biodiesel. Figure 20
represents fuel economy results from the test data. The fuel economy for PD was
approximately 6% higher than the biodiesel blends for all the drive cycles. The
carbon compositions of the fuels were estimated to be 87%, 84.7% and 84.8% by
mass for PD, B20A and B20B respectively. The estimated carbon content of the
biodiesel blends suggests that B20B may have the same or slightly higher fuel
economy than B20A. This is evident in Figure 20 especially for MD2 and MD3.
MD1 may not truly represent the differences in fuel economy among the fuel of the
driver variability since cruise control was not employed for MD1 testing. It is also
clear that the vehicle has better fuel economy at MD2 than at MD1 and MD3. This
is expected because at light load (20 mph), engine is less efficient. In addition, any
small changes in engine load with time detract from low vehicle speed efficiency.
Inherent losses associated with low speed operations result in high fuel
consumption. High fuel consumption also results at very high speeds (50 mph)
when aerodynamic drag dominates the power requirement for propulsion. Thus, it
can be concluded that the test truck would consume least amount of fuel at an
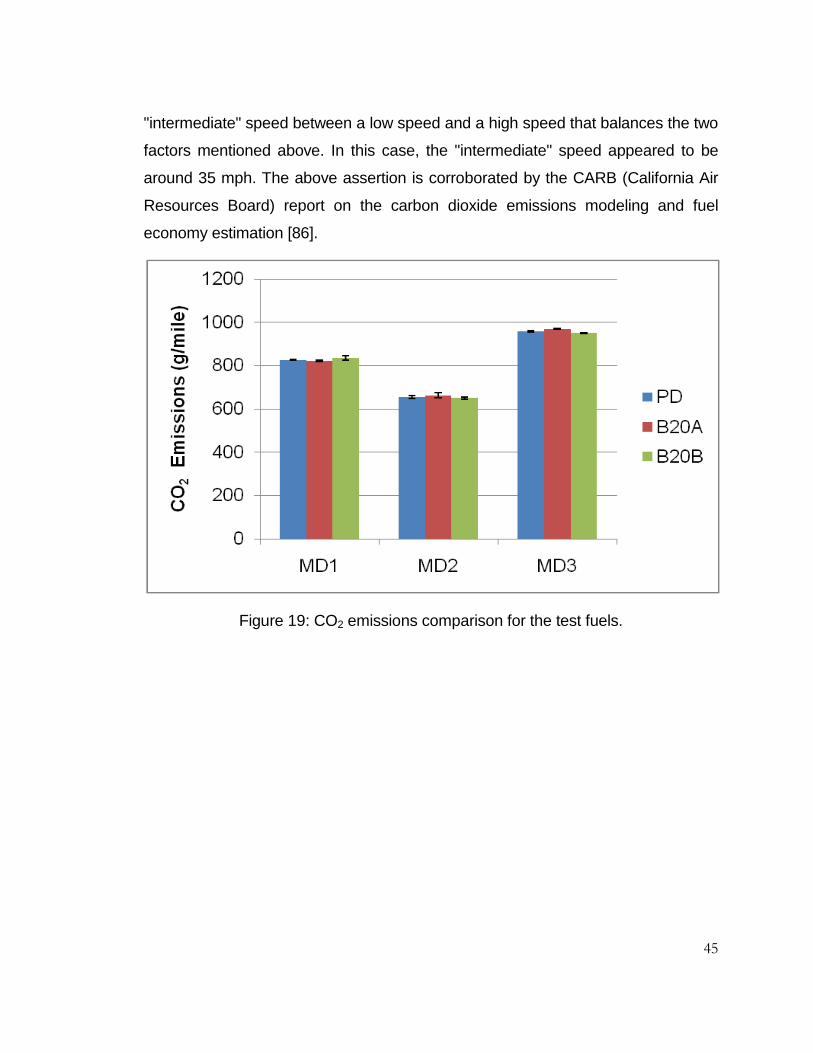
45
"intermediate" speed between a low speed and a high speed that balances the two
factors mentioned above. In this case, the "intermediate" speed appeared to be
around 35 mph. The above assertion is corroborated by the CARB (California Air
Resources Board) report on the carbon dioxide emissions modeling and fuel
economy estimation [86].
Figure 19: CO2 emissions comparison for the test fuels.

46
Figure 20: Fuel economy comparison for the test fuels.
4.2.3. CO Emissions.
The CO emissions obtained from the test data are displayed in Figure 21. It
can be observed that PD produced lower CO emissions than the biodiesel blends,
while B20A produced relatively higher CO emissions than B20B for all tests. It has
to be noted that the level of CO emissions concentrations from the tests were
approximately at the same level as the background CO concentration. The low CO
emissions concentrations are attributable to the oxidation action of the DPF during
testing. The low concentration, as a result of the DPF action, makes it difficult to
accurately quantify the CO emissions and the measurement accuracy is further
complicated by the slight fluctuations in engine load. A comparison can be made
between the levels of CO emissions of this study with CO emissions from older
trucks to see the effects of the DPF. Specifically, this can be compared with CO
emissions from 2001 medium heavy duty diesel truck manufactured by Navistar
International Truck Company. The 2001 truck emissions data were obtained from
CRC Report No. E55/59 (page 304 of the Appendix to the report) by Clark et al.
[87]. The report shows that the 2001 non-DPF truck emitted 0.97g/mile of CO

47
emissions, compared to between 0.015 g/mile to 0.02 g/mile for the 2007 truck
equipped with both EGR and DPF. One reason for the reduction and the
emissions pattern is the oxidation effect of the truck's DPF. The high variability in
the instantaneous emissions pattern for CO suggests that factors other than the
fuels may have contributed to the emissions pattern noticed in Figure 21. Although
factors such as EGR action and multiple injections may marginally affect CO
emissions, the effect of the DPF is far more dominant. The operation of the DPF is
usually influenced by the exhaust temperature and DPF's loading. With the loading
of the DPF changing with time, it would be difficult to maintain repeatability from
run to run with DPF-equipped vehicles especially for emissions types such as CO
and HC that are oxidized in the DPF. Another factor that could contribute to the
high variability in CO emissions is ambient conditions. Consequently, the
emissions pattern of Figure 21 was probably due to the DPF action and not the
fuels.
Figure 21: CO emissions using three driving cycles and test fuels.
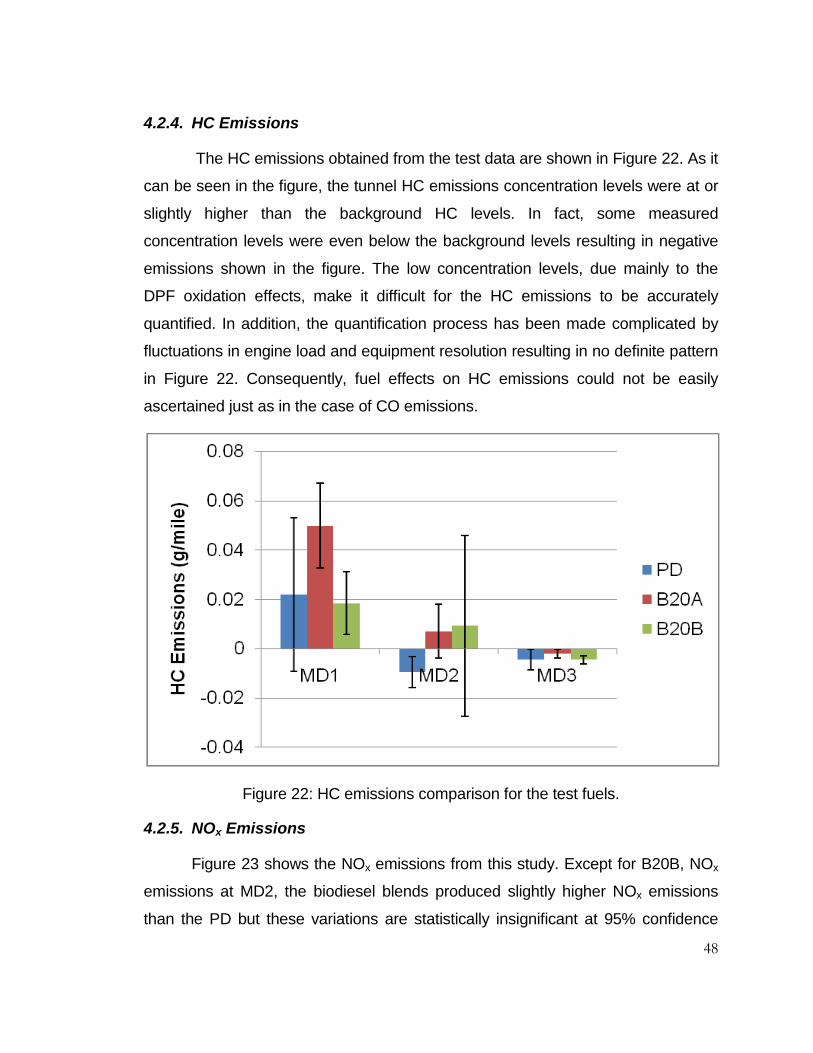
48
4.2.4. HC Emissions
The HC emissions obtained from the test data are shown in Figure 22. As it
can be seen in the figure, the tunnel HC emissions concentration levels were at or
slightly higher than the background HC levels. In fact, some measured
concentration levels were even below the background levels resulting in negative
emissions shown in the figure. The low concentration levels, due mainly to the
DPF oxidation effects, make it difficult for the HC emissions to be accurately
quantified. In addition, the quantification process has been made complicated by
fluctuations in engine load and equipment resolution resulting in no definite pattern
in Figure 22. Consequently, fuel effects on HC emissions could not be easily
ascertained just as in the case of CO emissions.
Figure 22: HC emissions comparison for the test fuels.
4.2.5. NOx Emissions
Figure 23 shows the NOx emissions from this study. Except for B20B, NOx
emissions at MD2, the biodiesel blends produced slightly higher NOx emissions
than the PD but these variations are statistically insignificant at 95% confidence

49
level for MD1 and MD2. MD3 data analysis showed that statistically significant
differences in emissions started to manifest between the PD and the biodiesel
blends. These results are consistent with the findings of many investigators that
biodiesel produces slightly higher NOx emissions than PD. Engine NOx emissions
relationship with vehicle power depends on the units in which they are reported.
For instance, brake specific NOx emissions in g/bhp-hr increase with power while
distance specific NOx emissions reported in g/mile may decrease with vehicle
power. This explains the observation in Figure 23, where NOx emissions (in g/mile)
for MD1 and MD2 are much higher than that of MD3. This is in agreement with the
findings of Durbin et al. [88] for a 2005 heavy duty truck where distance specific
NOx emissions reported in g/mile were lower at 70 mph compared to 65 mph on I-
5 Freeway using cruise control.
Figure 23: NOx emissions comparison for the test fuels.
Moreover, NOx emissions from this study were compared to NOx emissions
obtained from emission factor (EMFAC, 2007 version) modeling tool developed by
CARB [89-91]. Base Emission Rates (BER) were estimated from EMFAC tool for
the Los Angeles district for this comparison. The NOx speed correction factor was
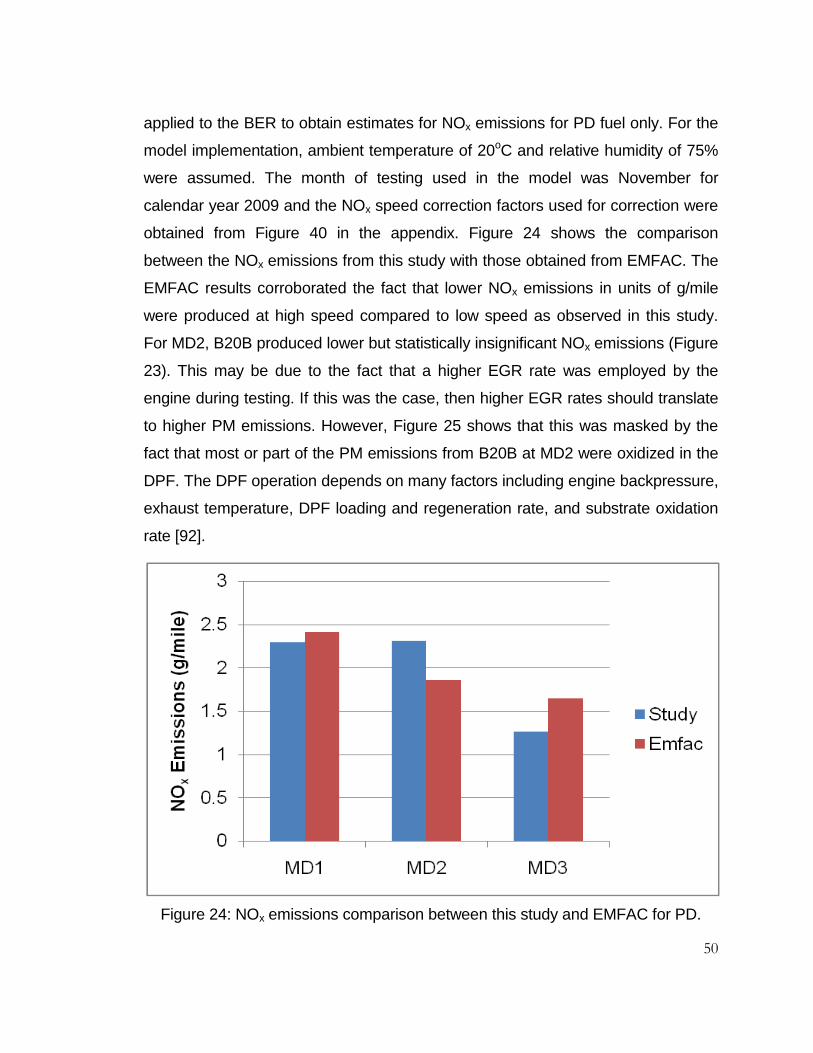
50
applied to the BER to obtain estimates for NOx emissions for PD fuel only. For the
model implementation, ambient temperature of 20oC and relative humidity of 75%
were assumed. The month of testing used in the model was November for
calendar year 2009 and the NOx speed correction factors used for correction were
obtained from Figure 40 in the appendix. Figure 24 shows the comparison
between the NOx emissions from this study with those obtained from EMFAC. The
EMFAC results corroborated the fact that lower NOx emissions in units of g/mile
were produced at high speed compared to low speed as observed in this study.
For MD2, B20B produced lower but statistically insignificant NOx emissions (Figure
23). This may be due to the fact that a higher EGR rate was employed by the
engine during testing. If this was the case, then higher EGR rates should translate
to higher PM emissions. However, Figure 25 shows that this was masked by the
fact that most or part of the PM emissions from B20B at MD2 were oxidized in the
DPF. The DPF operation depends on many factors including engine backpressure,
exhaust temperature, DPF loading and regeneration rate, and substrate oxidation
rate [92].
Figure 24: NOx emissions comparison between this study and EMFAC for PD.

51
4.2.6. PM Emissions
Figure 25 shows the gravimetric PM emissions obtained from the tests. The
figure also shows that there is no distinct pattern for the PM emissions. The error
bar on PD plot (three repeat runs) shows the level of variability that could be seen
in quantifying low PM mass emissions from DPF equipped vehicles. The lack of
definite pattern observed in the figure is due mainly to the operating states of the
DPF during each of the test runs which depend on the control strategy of the
emissions control system. The emissions from the 2007 truck are generally lower
when compared to older trucks. For instance, PM emissions for MD2 from this
study are much lower than those obtained in the E-55/59 report for medium heavy
duty diesel truck using the MHDDT cruise mode driving schedule. While the
emissions for the 2007 truck is of the order of 0.003 g/mile for PD, the E-55/59
reported PM emissions between 0.4 g/mile to 0.8 g/mile for 1999-2002 model year
truck (Figure 41 of the E-55/59 final report). This is obviously due to soot oxidation
in the DPF, which may mask the effects of other factors such as the fuel.
Consequently, it may be difficult to infer the fuel effects on PM emissions without a
high count of repeat tests or very long tests to provide high DPF loading.
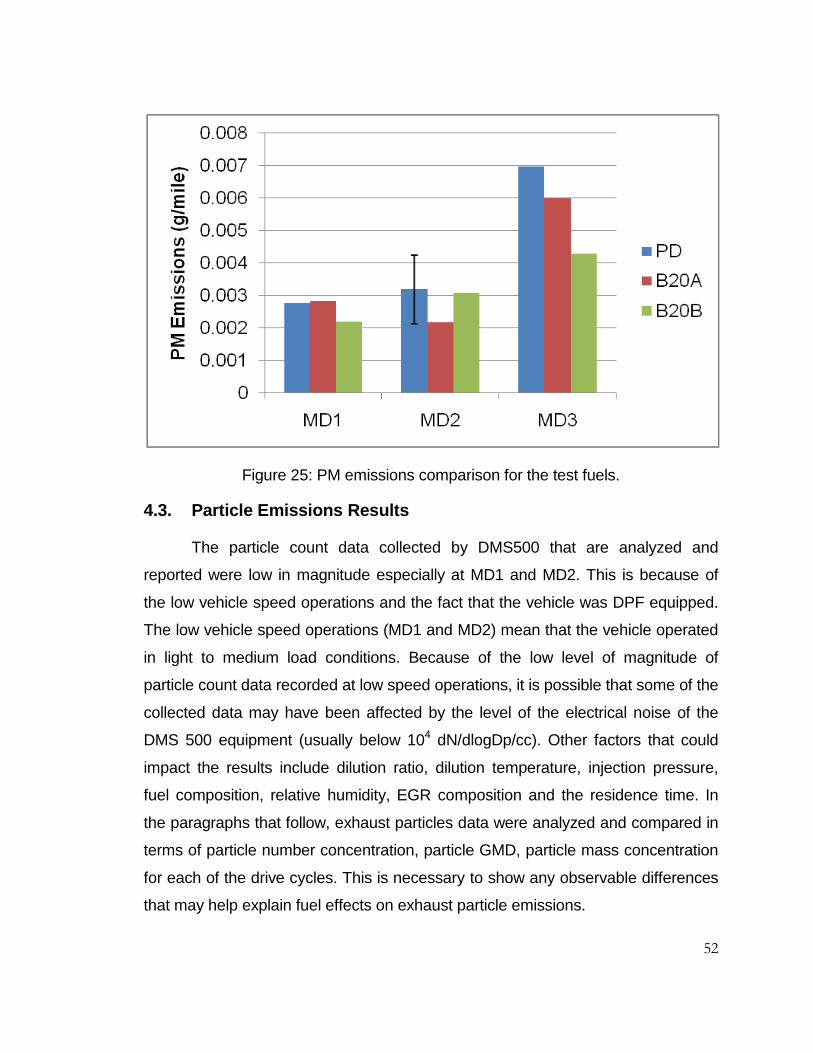
52
Figure 25: PM emissions comparison for the test fuels.
4.3. Particle Emissions Results
The particle count data collected by DMS500 that are analyzed and
reported were low in magnitude especially at MD1 and MD2. This is because of
the low vehicle speed operations and the fact that the vehicle was DPF equipped.
The low vehicle speed operations (MD1 and MD2) mean that the vehicle operated
in light to medium load conditions. Because of the low level of magnitude of
particle count data recorded at low speed operations, it is possible that some of the
collected data may have been affected by the level of the electrical noise of the
DMS 500 equipment (usually below 104 dN/dlogDp/cc). Other factors that could
impact the results include dilution ratio, dilution temperature, injection pressure,
fuel composition, relative humidity, EGR composition and the residence time. In
the paragraphs that follow, exhaust particles data were analyzed and compared in
terms of particle number concentration, particle GMD, particle mass concentration
for each of the drive cycles. This is necessary to show any observable differences
that may help explain fuel effects on exhaust particle emissions.
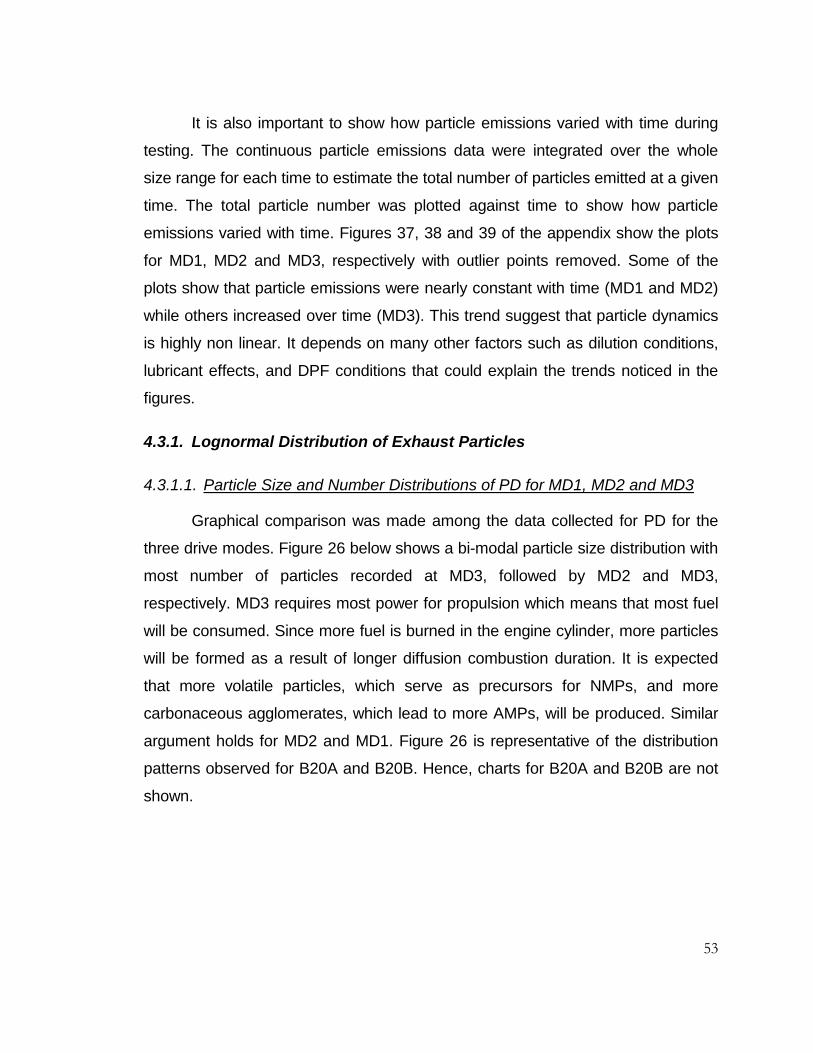
53
It is also important to show how particle emissions varied with time during
testing. The continuous particle emissions data were integrated over the whole
size range for each time to estimate the total number of particles emitted at a given
time. The total particle number was plotted against time to show how particle
emissions varied with time. Figures 37, 38 and 39 of the appendix show the plots
for MD1, MD2 and MD3, respectively with outlier points removed. Some of the
plots show that particle emissions were nearly constant with time (MD1 and MD2)
while others increased over time (MD3). This trend suggest that particle dynamics
is highly non linear. It depends on many other factors such as dilution conditions,
lubricant effects, and DPF conditions that could explain the trends noticed in the
figures.
4.3.1. Lognormal Distribution of Exhaust Particles
4.3.1.1. Particle Size and Number Distributions of PD for MD1, MD2 and MD3
Graphical comparison was made among the data collected for PD for the
three drive modes. Figure 26 below shows a bi-modal particle size distribution with
most number of particles recorded at MD3, followed by MD2 and MD3,
respectively. MD3 requires most power for propulsion which means that most fuel
will be consumed. Since more fuel is burned in the engine cylinder, more particles
will be formed as a result of longer diffusion combustion duration. It is expected
that more volatile particles, which serve as precursors for NMPs, and more
carbonaceous agglomerates, which lead to more AMPs, will be produced. Similar
argument holds for MD2 and MD1. Figure 26 is representative of the distribution
patterns observed for B20A and B20B. Hence, charts for B20A and B20B are not
shown.
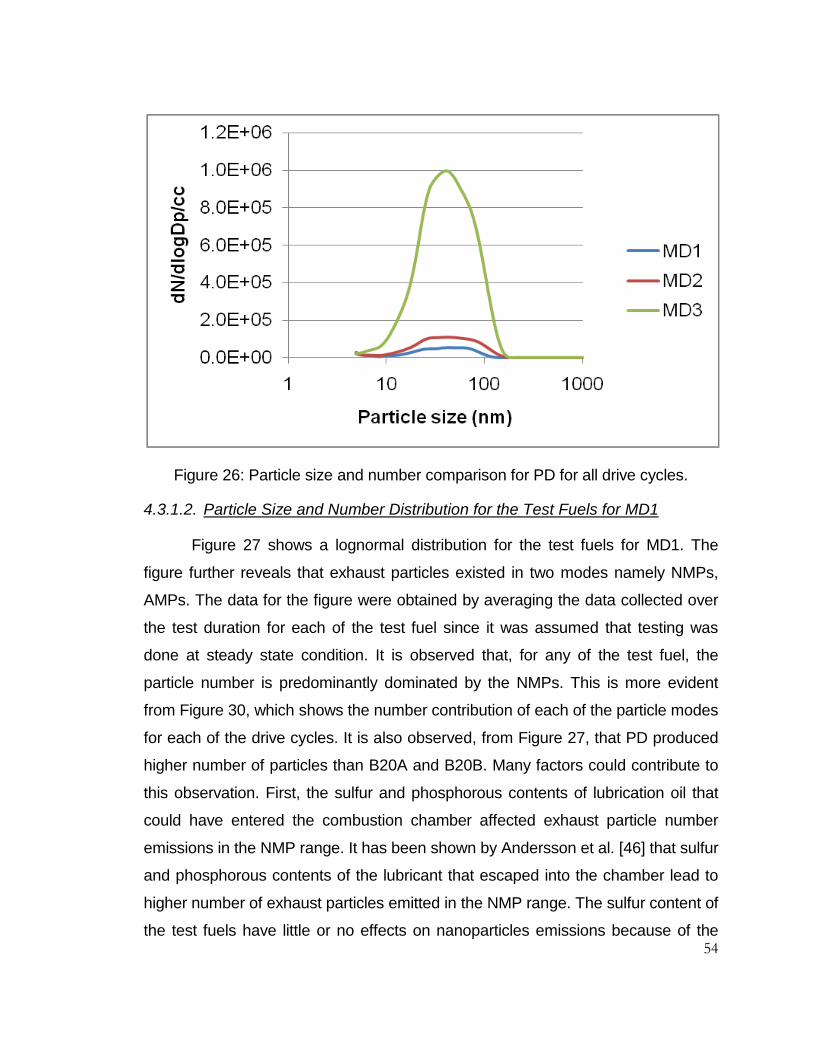
54
Figure 26: Particle size and number comparison for PD for all drive cycles.
4.3.1.2. Particle Size and Number Distribution for the Test Fuels for MD1
Figure 27 shows a lognormal distribution for the test fuels for MD1. The
figure further reveals that exhaust particles existed in two modes namely NMPs,
AMPs. The data for the figure were obtained by averaging the data collected over
the test duration for each of the test fuel since it was assumed that testing was
done at steady state condition. It is observed that, for any of the test fuel, the
particle number is predominantly dominated by the NMPs. This is more evident
from Figure 30, which shows the number contribution of each of the particle modes
for each of the drive cycles. It is also observed, from Figure 27, that PD produced
higher number of particles than B20A and B20B. Many factors could contribute to
this observation. First, the sulfur and phosphorous contents of lubrication oil that
could have entered the combustion chamber affected exhaust particle number
emissions in the NMP range. It has been shown by Andersson et al. [46] that sulfur
and phosphorous contents of the lubricant that escaped into the chamber lead to
higher number of exhaust particles emitted in the NMP range. The sulfur content of
the test fuels have little or no effects on nanoparticles emissions because of the

55
very low sulfur concentrations (between 1-2 ppm concentrations) of the fuels.
During dilution and cooling of hot exhaust, heterogeneous nucleation of sulfuric
acid and water takes place. This promotes the growth, by deposition, of initial
nucleated particle of about 1 nm during condensation and thus leading to their
detection by the particle measuring instrument [53]. Second, the fuel injection
pressure may have affected the number of particles produced especially for the
AMPs. Biodiesel fuels possess physical properties that make them to have higher
injection pressure than PD. It does seem that the higher injection pressure
contributed in reducing the NMPs and AMPs produced compared to PD. This
observation is in agreement with the conclusions of the Sinha et al. [69] that higher
injection pressures lead to lower particle emissions especially for AMPs.
Furthermore, the oxygen content of biodiesel fuels also contribute to advanced
combustion and better fuel atomization and oxidation in locally rich fuel zones. This
helps to further reduce particle emissions especially particle mass concentrations.
Figure 27: Particle size and number comparison for the test fuels for MD1.
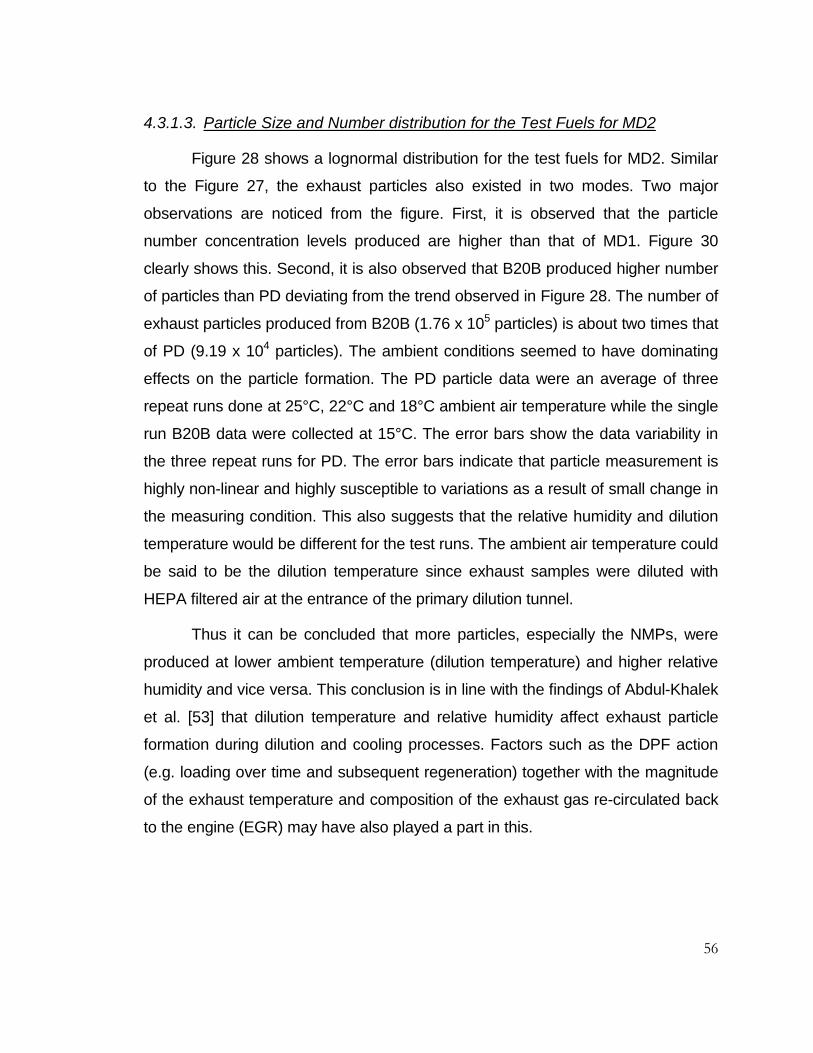
56
4.3.1.3. Particle Size and Number distribution for the Test Fuels for MD2
Figure 28 shows a lognormal distribution for the test fuels for MD2. Similar
to the Figure 27, the exhaust particles also existed in two modes. Two major
observations are noticed from the figure. First, it is observed that the particle
number concentration levels produced are higher than that of MD1. Figure 30
clearly shows this. Second, it is also observed that B20B produced higher number
of particles than PD deviating from the trend observed in Figure 28. The number of
exhaust particles produced from B20B (1.76 x 10⁵ particles) is about two times that
of PD (9.19 x 10⁴ particles). The ambient conditions seemed to have dominating
effects on the particle formation. The PD particle data were an average of three
repeat runs done at 25°C, 22°C and 18°C ambient air temperature while the single
run B20B data were collected at 15°C. The error bars show the data variability in
the three repeat runs for PD. The error bars indicate that particle measurement is
highly non-linear and highly susceptible to variations as a result of small change in
the measuring condition. This also suggests that the relative humidity and dilution
temperature would be different for the test runs. The ambient air temperature could
be said to be the dilution temperature since exhaust samples were diluted with
HEPA filtered air at the entrance of the primary dilution tunnel.
Thus it can be concluded that more particles, especially the NMPs, were
produced at lower ambient temperature (dilution temperature) and higher relative
humidity and vice versa. This conclusion is in line with the findings of Abdul-Khalek
et al. [53] that dilution temperature and relative humidity affect exhaust particle
formation during dilution and cooling processes. Factors such as the DPF action
(e.g. loading over time and subsequent regeneration) together with the magnitude
of the exhaust temperature and composition of the exhaust gas re-circulated back
to the engine (EGR) may have also played a part in this.
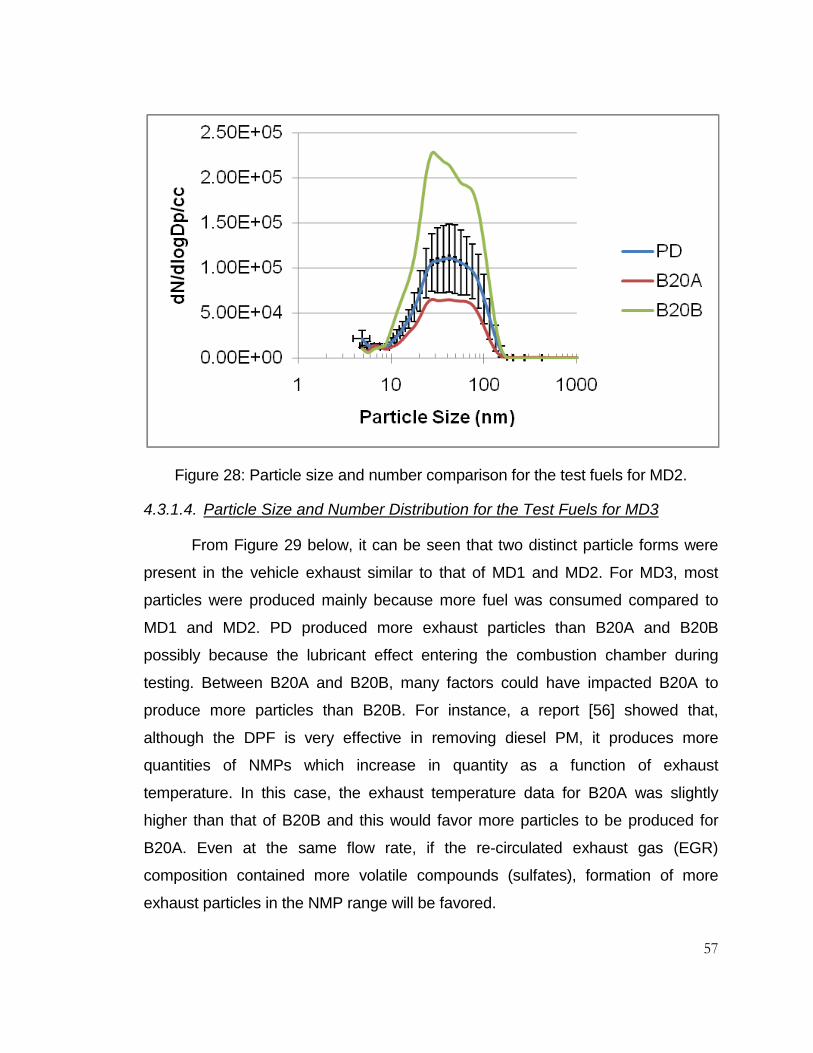
57
Figure 28: Particle size and number comparison for the test fuels for MD2.
4.3.1.4. Particle Size and Number Distribution for the Test Fuels for MD3
From Figure 29 below, it can be seen that two distinct particle forms were
present in the vehicle exhaust similar to that of MD1 and MD2. For MD3, most
particles were produced mainly because more fuel was consumed compared to
MD1 and MD2. PD produced more exhaust particles than B20A and B20B
possibly because the lubricant effect entering the combustion chamber during
testing. Between B20A and B20B, many factors could have impacted B20A to
produce more particles than B20B. For instance, a report [56] showed that,
although the DPF is very effective in removing diesel PM, it produces more
quantities of NMPs which increase in quantity as a function of exhaust
temperature. In this case, the exhaust temperature data for B20A was slightly
higher than that of B20B and this would favor more particles to be produced for
B20A. Even at the same flow rate, if the re-circulated exhaust gas (EGR)
composition contained more volatile compounds (sulfates), formation of more
exhaust particles in the NMP range will be favored.
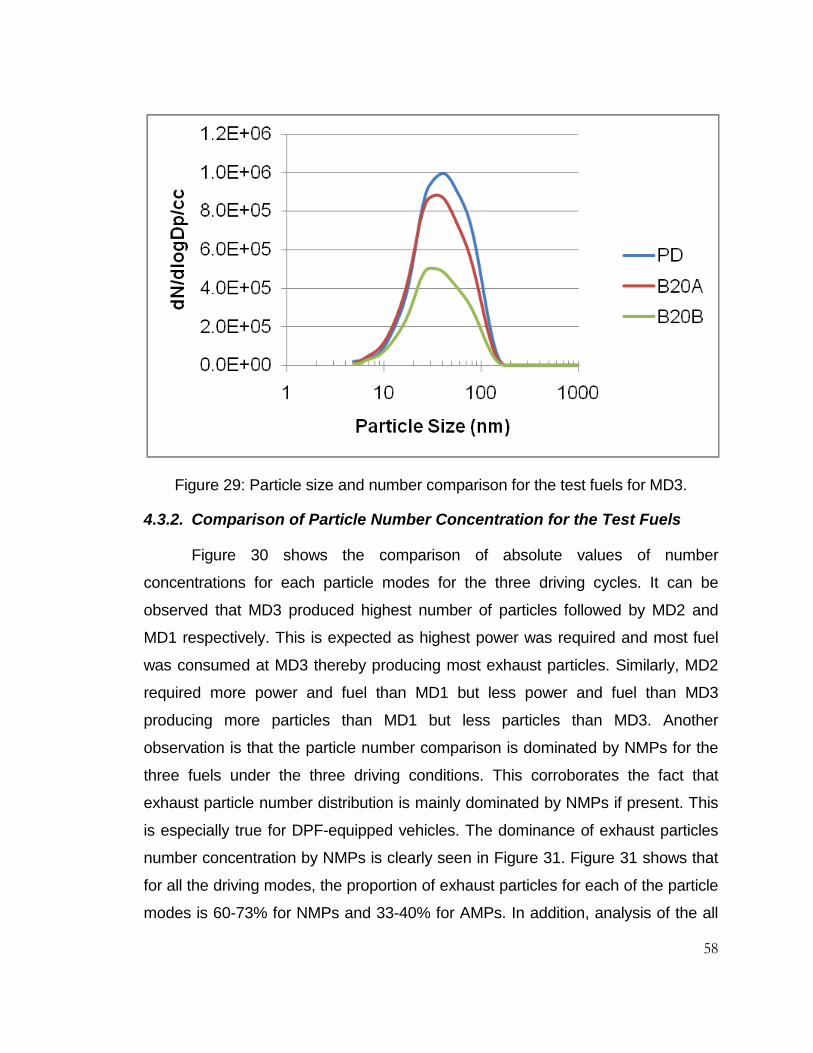
58
Figure 29: Particle size and number comparison for the test fuels for MD3.
4.3.2. Comparison of Particle Number Concentration for the Test Fuels
Figure 30 shows the comparison of absolute values of number
concentrations for each particle modes for the three driving cycles. It can be
observed that MD3 produced highest number of particles followed by MD2 and
MD1 respectively. This is expected as highest power was required and most fuel
was consumed at MD3 thereby producing most exhaust particles. Similarly, MD2
required more power and fuel than MD1 but less power and fuel than MD3
producing more particles than MD1 but less particles than MD3. Another
observation is that the particle number comparison is dominated by NMPs for the
three fuels under the three driving conditions. This corroborates the fact that
exhaust particle number distribution is mainly dominated by NMPs if present. This
is especially true for DPF-equipped vehicles. The dominance of exhaust particles
number concentration by NMPs is clearly seen in Figure 31. Figure 31 shows that
for all the driving modes, the proportion of exhaust particles for each of the particle
modes is 60-73% for NMPs and 33-40% for AMPs. In addition, analysis of the all

59
exhaust particles data for GMD, based on bin widths, reveals the following: For
MD1, the GMD for the three fuels ranges between 17.8-22.8 nm for NMPs and 71-
73.8 nm for AMPs. For MD2, the GMD for the three fuels ranges between 23.8-26
nm for NMPs and 74.7-76.3 nm for AMPs. Also, for MD3, the GMD for the three
fuels ranges between 25.8-27.3 nm for NMPs and 73.1-74.2 nm for AMPs. Thus, it
can be inferred that not only does the increase in vehicle power leads to increase
in the number of particles emitted for the three fuels; it also increases the size of
the particle modes except for AMPs for MD3.
Figure 30: Particle number concentration comparison for the test fuels.
60
Figure 31: Percentage particle number composition for the test fuels.
4.3.3. Comparison of GMD for the Three Test Fuels
In addition to estimating the GMD for each exhaust particle mode for each
of the test runs, the overall GMD combining all the GMD for each of the particle
modes was also obtained. Figure 32 displays the overall GMD for each of the test
runs with geometric standard deviation of diameter used for the error bars. The
figure shows that, for each of the driving mode, the GMD for PD is greater than
that of B20A and B20B except for B20B at MD2. It is possible to obtain the GMD
value at B20B for MD2 considering the fact that other factors such as ambient
conditions (temperature and humidity), EGR fraction components, DPF action that
are not fuel related strongly affect exhaust particle formation. The GMD trend
observed for PD over the biodiesel blends is expected considering the fact that
biodiesel normally has higher oxygen and lower carbon content than PD. Biodiesel
physical properties create a higher fuel injection pressure than PD. These
biodiesel fuel characteristics lead to advanced and more complete combustion and
better fuel oxidation thus producing lower carbon soot than PD. In addition, the
sulfur and phosphorous contents of the lubrication oil could have promoted higher
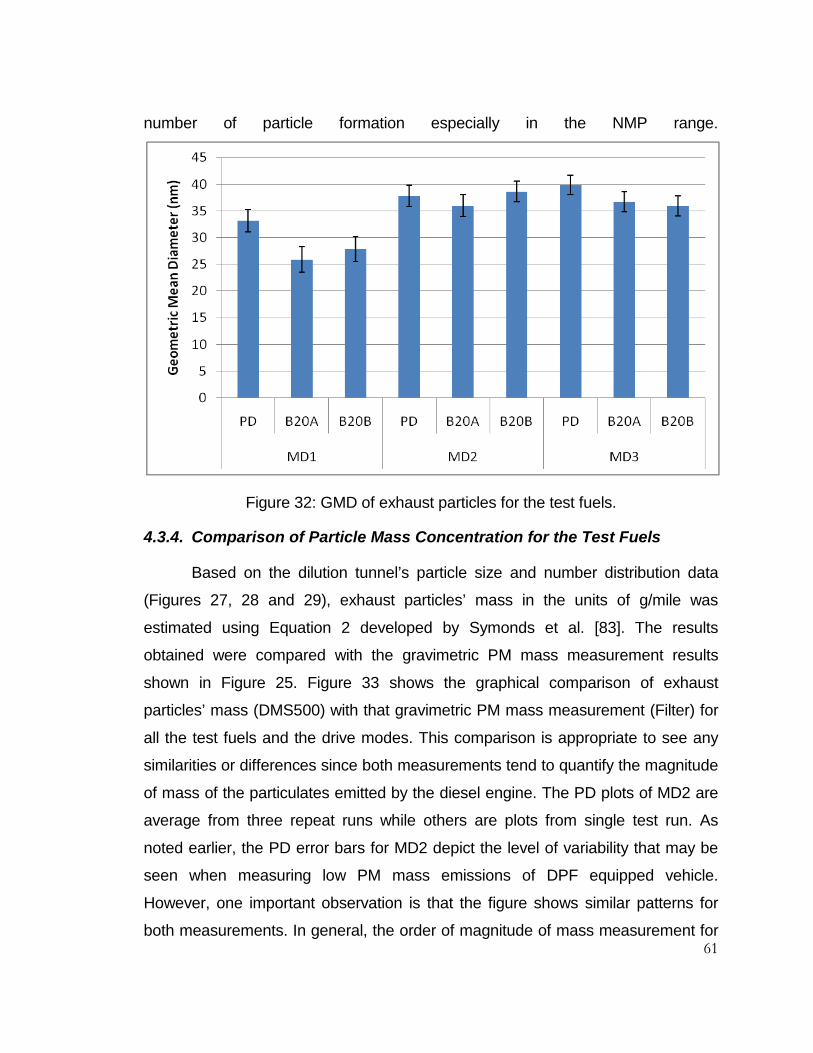
61
number of particle formation especially in the NMP range.
Figure 32: GMD of exhaust particles for the test fuels.
4.3.4. Comparison of Particle Mass Concentration for the Test Fuels
Based on the dilution tunnel’s particle size and number distribution data
(Figures 27, 28 and 29), exhaust particles’ mass in the units of g/mile was
estimated using Equation 2 developed by Symonds et al. [83]. The results
obtained were compared with the gravimetric PM mass measurement results
shown in Figure 25. Figure 33 shows the graphical comparison of exhaust
particles’ mass (DMS500) with that gravimetric PM mass measurement (Filter) for
all the test fuels and the drive modes. This comparison is appropriate to see any
similarities or differences since both measurements tend to quantify the magnitude
of mass of the particulates emitted by the diesel engine. The PD plots of MD2 are
average from three repeat runs while others are plots from single test run. As
noted earlier, the PD error bars for MD2 depict the level of variability that may be
seen when measuring low PM mass emissions of DPF equipped vehicle.
However, one important observation is that the figure shows similar patterns for
both measurements. In general, the order of magnitude of mass measurement for
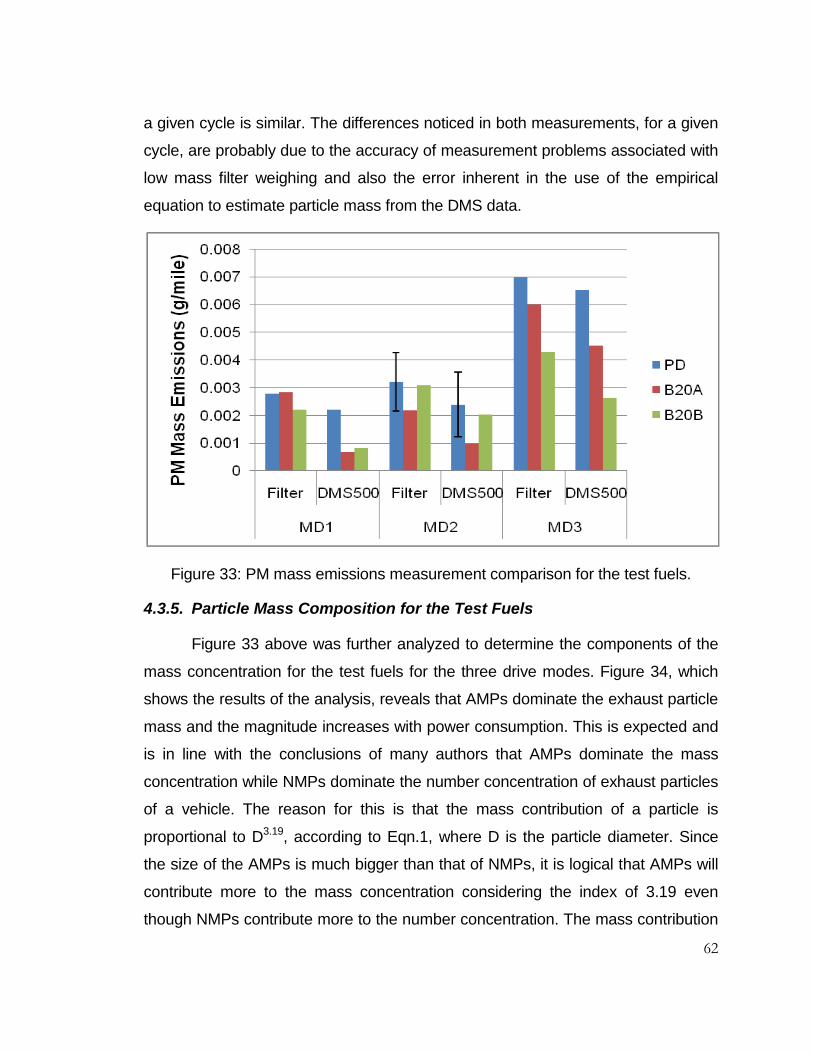
62
a given cycle is similar. The differences noticed in both measurements, for a given
cycle, are probably due to the accuracy of measurement problems associated with
low mass filter weighing and also the error inherent in the use of the empirical
equation to estimate particle mass from the DMS data.
Figure 33: PM mass emissions measurement comparison for the test fuels.
4.3.5. Particle Mass Composition for the Test Fuels
Figure 33 above was further analyzed to determine the components of the
mass concentration for the test fuels for the three drive modes. Figure 34, which
shows the results of the analysis, reveals that AMPs dominate the exhaust particle
mass and the magnitude increases with power consumption. This is expected and
is in line with the conclusions of many authors that AMPs dominate the mass
concentration while NMPs dominate the number concentration of exhaust particles
of a vehicle. The reason for this is that the mass contribution of a particle is
proportional to D3.19, according to Eqn.1, where D is the particle diameter. Since
the size of the AMPs is much bigger than that of NMPs, it is logical that AMPs will
contribute more to the mass concentration considering the index of 3.19 even
though NMPs contribute more to the number concentration. The mass contribution

63
of each of the particle modes is more clearly shown in Figure 35. For all the driving
modes, the NMPs contribute about 2-8% while the AMPs contribute as high as
98% to the mass concentration. To obtain Figures 34 and 35, the particle size
ranges were categorized such that the NMPs range between 5-50 nm while the
AMPs range from 50-1000 nm.
Figure 34: Particle mass composition for the test fuels.

64
Figure 35: Particle mass concentration for the test fuels.
65
5. Conclusions and Recommendations
5.1. Conclusions
Two biodiesel blend fuels (B20A and B20B) and PD fuel were tested on a
2007 heavy duty diesel truck equipped with EGR, VTG and DPF under steady
state conditions using three drive cycles. Distance-specific regulated emissions,
CO2 emissions, and fuel consumption were quantified. In addition, exhaust particle
emissions were also characterized and compared in terms of number, mass and
size distributions. The following gives the conclusions drawn from this study.
Test results for the 20 mph, 35 mph and 50 mph vehicle speeds showed that
CO2 emissions variations among the test fuels are statistically insignificant at
95% confidence level. In addition, the vehicle performance in terms of fuel
economy showed that PD had a better fuel economy compared to the biodiesel
blends. This is because of higher carbon content in the PD which translates to
higher heating value for the fuel.
The effects of the fuels on CO, HC and PM emissions were difficult to quantify.
This is because the other non-fuel effects such as the EGR, the VGT and the
DPF effects introduced more complexity into the in-cylinder combustion
processes and the formation mechanism.
The high variability observed in the emissions patterns of CO, HC and PM was
dominantly affected by the DPF. Factors which confounded emissions
measurement include:
a) Effects of the DPF loading that changed from time to time.
b) Effects of changes in EGR and VGT settings as a result of small changes
in load or operating conditions.
c) Effects of changes in ambient conditions during measurement.
The fuels' effects on NOx emissions showed that there was an insignificant
increases in the biodiesel emissions compared to PD except at the vehicle
speed of 35 mph where B20B had lower emissions than the other fuels. This
66
suggests that the EGR effect also played a significant role on the NOx
emissions pattern observed.
It is the conclusion of this study that at 0.2 g/bhp-hr NOx emissions standard,
small variations in NOx emissions due to fuel composition will probably play a
small role in the NOx emissions inventory while older trucks with 2.5 g/bhp-hr
and 4 g/bhp-hr emissions standards still continue to operate.
This study showed that the pattern of exhaust particle emissions observed
could not be alluded to fuel effects alone. Other non-fuel factors such as
temperature, humidity, EGR fraction composition, DPF loading also played a
significant role in exhaust particle composition and emissions.
The exhaust particle mass concentration distribution chart substantially
corroborated the pattern observed from the results of gravimetric PM mass
emissions measurement.
For all tests performed, exhaust particle number emissions are dominated by
nanoparticles (NMPs) while the particle mass emissions are dominated by
AMPs.
As the vehicle propulsion power increases, the total particle number and mass
emissions increase. This study also shows that the GMD of exhaust particles
also increase with vehicle propulsion power.
5.2. Recommendations
Based on the results obtained from this study, it is recommended that future
research should be conducted with the following focus areas:
This study only investigated steady state condition up to the vehicle speed of
50 mph. It is therefore suggested that more tests on 2007 model year engines
be conducted using different biodiesel blend proportions under the same
steady state condition but at vehicle speeds greater that 50 mph. This is to
determine the emissions effects of the fuels at very high speeds as it is
m,jh nk nn possible, as noted in this study, that marked differences in CO2 and
NOx emissions may be observed among the fuels.
67
It is recommended that more testing on 2007 model year engines and trucks is
required to produce more test data which can be used to study the combined
effects of EGR, VGT and DPF on engine emissions. Moreover, since transient
EGR and VGT management may differ from steady-state engine management
strategies, more data are required for transient dynamometer test cycles.
It is also recommended that the impact of non-fuel effects such as dilution
conditions, and ambient conditions be studied on 2007 or later model year
truck both on the dynamometer in the laboratory and on the road.
68
References
1. Mills, N. L., Tornqvist, H., Robinson, S. D., Gonzalez, M., Darnley, K., MacNee, W., Boon, N. A., Donaldson, K., Blomberg, A., Sandstrom, T., and Newby, D, E., “Diesel Exhaust Inhalation Causes Vascular Dysfunction and Impaired Endogenous Fibrinolysis,” Circulation, 112:3930-3936, 2005.
2. Peretz, A., Sullivan, J. H., Leotta, D. F., Trenga. C. A., Sands, F. N., Allen, J., Carlsten, C., Wilkinson, C. W., Gill, E. A., and Kaufman, J. D., “Diesel Exhaust Inhalation Elicits Acute Vasoconstriction in Vivo,” Environ. Health Perspect., 116:937-942, 2008.
3. Tornqvist, H., Mills, N. L., Gonzalez, M., Miller, M. R., Robinson, S. D., Megson, I. L., Macnee, W., Donaldson, K., Soderberg, S., Newby, D. E., Sandstrom, T., and Blomberg, A., “Persistent Endothelial Dysfunction in Humans after Diesel Exhaust Inhalation,” Am. J. Respir. Crit. Care Med., 176:395-400, 2007.
4. Pope, C., “Air Pollution and Health-Good News and Bad,” The New England Journal of Medicine, 351:1132–1134, 2004.
5. United States Environmental Protection Agency Fact Sheet: Diesel Exhaust in the United States. EPA 420-F-02-022, June 2003. Available online at http://www.epa.gov/otaq/retrofit/documents/420f03022.pdf.
6. Agarwal, A. K., “Biofuels (Alcohols and Biodiesel) Applications as Fuels for Internal Combustion Engines,” Progress in Energy and Combustion Science, 33:233-271, 2007.
7. Tyson, K. S., Bozell, J., Wallace, R., Petersen, E., and Moens, L., “Biomass Oil Analysis: Research Needs and Recommendations,” Technical Report by National Renewable Energy Laboratory, Golden, Colorado. NREL/TP-510-34796, June 2004.
8. Hong, H., Wang, M., Bloyd, C., and Putsche, V., “Life-Cycle assessment of Energy Use and Greenhouse Gas Emissions of Soybean-Derived Biodiesel and Renewable Fuels,” Environ. Sci. Technol., 43:750-756, 2009.
9. National Biodiesel Board, “Biodiesel Production,” http://www.biodiesel.org/pdf_files/fuelfactsheets/Production.PDF, March, 2010.
10. Engine Manufacturers Association: Technical Statement on the Use of Biodiesel in Compression Ignition Engines. EMADOCS 27902.14, October 2009. Available online at http://www.enginemanufacturers.org/file.asp?F=EMADOCS%2D%2327902%2Dv14%2D2009%5FTechnical%5FStatement%5Fon%5Fthe%5FUse%5Fof%
69
5FBiodiesel%5FFuel%5Fin%5FCompression%5FIgnition%5FEngines%2Epdf&N=EMADOCS%2D%2327902%2Dv14%2D2009%5FTechnical%5FStatement%5Fon%5Fthe%5FUse%5Fof%5FBiodiesel%5FFuel%5Fin%5FCompression%5FIgnition%5FEngines%2Epdf&C=documents. Accessed on July 29, 2010.
11. Gui, M. M., Lee, K. T., and Bhatia, S., “Feasibility of Edible Oil vs. Non-edible Oil vs. Waste Edible Oil as Biodiesel Feedstock,” Energy, 33:1646-1653, 2008.
12. Kansedo J., Lee K. T., and Bhatia S., “Cerbera Odollam (Sea Mango) Oil as a Promising Non-edible Feedstock for Biodiesel Production,” Fuel, 88:1148-1150, 2009.
13. Yusuf, C., “Biodiesel from Microalgea,” Biotechnology Advances, 25:294-306, 2007.
14. Basha, S. A., Gopal, K. R., and Jebaraj, S., “A Review on Biodiesel Production, Combustion, Emissions and Performance,” Renewable and Sustainable Energy Reviews, 13:1628-1634, 2009.
15. Leung, D. Y. C., Wu, X., and Leung, M. K. H., “A Review on Biodiesel Production Using Catalyzed Transesterification,” Applied Energy, 87:1083-1095, 2010.
16. Illinois Sustainable Technology Center (ISCT): Feasibility Report-Small Scale Biodiesel Production, Waste Management and Research Center, 2006. Available online at http://www.istc.illinois.edu/tech/small-scale-biodiesel.pdf.
17. Wen, G. D., Xu, Y. P., Ma, H. J., Xu, Z. S., and Tian, Z. J., “Production of Hydrogen by Aqueous-phase Reforming of Glycerol,” Int. J. Hydrogen Energy, 33:6657-6666, 2008.
18. Da Silva, G. P., Mack, M., and Contiero, J., “Glycerol:A Promising and Abundant Carbon Source for Industrial Microbiology,” Biotechnology Advances, 27:30-39, 2009.
19. Wang, Z., Zhuge, J., Fang, H., and Prior, B. A., “Glycerol Production by Microbial Fermentation: A Review,” Biotechnology Advances, 19:201-223, 2001.
20. Graboski, M. S., McCormick, R.L., Alleman, T. L., and Herring, A. M., “The Effect of Biodiesel Composition on Engine Emissions from a DDC Series 60 Diesel Engine,” National Renewable Energy Laboratory, Final Report #2, NREL/SR-510-31461, February, 2003. Available online at http://www.biodiesel.org/resources/reportsdatabase/reports/gen/20030201_gen-361.pdf.
21. United States Environmental Protection Agency: A Comprehensive Analysis of Biodiesel Impacts on Exhaust Emissions, Draft Technical Report, EPA420-P-02-001, 2002.

70
22. Wang, W. G., Lyons, D. W., Clark, N. N., and Gautam, M., “Emissions from Nine Heavy Trucks Fueled by Diesel and Biodiesel Blend without Engine Modification,” Environ. Sci. Technol., 34:933 – 939, 2000.
23. Lin, B., Haung, J., and Haung, D., “Experimental Study of the Effects of Vegetable Oil Methyl Ester on Diesel Engine Performance Characteristics and Pollutant Emissions,” Fuel, 88:1779 – 1785, 2009.
24. Nabi, N., Rahman, M., and Akhter, S., “Biodiesel from Cotton Seed Oil and its Effects on Performance and Exhaust Emissions,” Applied Thermal Engineering, 29:2265 – 2270, 2009.
25. Muzumdar, B. and Agarwal, A. K., “Performance, Emissions and Combustion Characteristics of Biodiesel (Waste Cooking Oil Methyl Ester) Fueled IDI Diesel Engine,” SAE Technical Paper 2008-01-1384, 2008.
26. Raheman, H. and Phadatare, A. G., “Diesel Engine Emissions and Performance from Karanja Methyl Ester and Diesel,” Biomass and Bioenergy, 27:393 - 397, 2004.
27. McCormick, R. L., Tennant, C. J., Hayes, R. R., Black, S., Ireland, J., McDaniel, T., Williams, A., and Frailey, M., “ Regulated Emissions from Biodiesel Tested in Heavy – Duty Engines Meeting 2004 Emission Standards,” SAE Technical Paper 2005-01-2200, 2005.
28. Nine, R. D., Clark, N. N., Mace, B. E., Morrison, R. W., Lowe, P. C., Remcho, V. T., and Mclaughlin, L.W., “Use of Soy–Derived Fuel for Environmental Impact Reduction in Marine Engine Applications,” American Society of Agricultural Engineers, 43(6): 1383 – 1391, 2000.
29. McCormick, R.L., Ross, J. D., and Graboski, M. S., “Effect of Several Oxygenates on Regulated Emissions from Heavy-Duty Diesel Engines,” Environ. Sci.Technol., 31(4):1144 - 1150, 1997.
30. Nuszkowski, J., Thompson G. J., Tincher, R., and Clark, N. N., “Heat Release and Emissions Characteristics of B20 Biodiesel Fuels during Steady State and Transient Operation,” SAE Technical Paper 2008-01-1377, 2008.
31. Thompson, G. J. and Nuszkowski, J., “Neat Fuel Influence on Biodiesel Blend Emissions,” Engine Research, 11(1): 61 – 77, 2009. DOI: 10.1243/14680874JER04909.
32. Sheehan, J., Camobreco, V., Duffield, J., Graboski, M., and Shapouri, H., “An Overview of Biodiesel and Petroleum Diesel Life Cycles,” National Renewable Energy Laboratory, NREL/TP-580-24772, May 1998.
33. United States Environmental Protection Agency: Alternative Control Techniques Document-NOx Emissions from Stationary Gas Turbines. EPA-453/R-93-007, January 1993. Available online at http://www.epa.gov/ttncatc1/dir1/gasturb.pdf.
71
34. Mueller, C. J., Boehman, A. L., and Martin, G. C., “An Experimental Investigation of the Origin of Increased NOx Emissions When Fueling a Heavy – Duty Compression – Ignition Engine with Soy Biodiesel,” SAE Technical Paper 2009-01-1792, 2009.
35. Lapuerta, M., Armas, O., and Rodriguez–Fernandez, J., “Effects of Degree of Unsaturation of Biodiesel Fuels on NOx and Particulate Emissions,” SAE Technical Paper 2008-01-1676, 2008.
36. Miller, W. R., Klein, J. T., Mueller, R., Doelling, W., and Zuerbig, J., “The Development of Urea-SCR Technology for US Heavy Duty Trucks,” SAE Technical Paper 2000-01-0190, 2000.
37. Tsolakis, A., Megaritis, A., Wyszynski, M. L., and Theinnoi, K., “Engine Performance and Emissions of a Diesel Engine Operating on Diesel-RME (Rapaseed Methly Ester) Blends with EGR (Exhaust Gas Recirculation),” Energy, 32:2072-2080, 2007.
38. Rajan, K. and Senthil Kumar, K. R., “The Effect of Exhaust Gas Recirculation (EGR) on the Performance and Emission Characteristics of Diesel Engines with Sunflower Oil Methyl Esther,” Chemical Engineering Research, 1(1): 31 – 39, 2009.
39. Verbeek, R., Aken, M., and Verkiel, M., “DAF Euro-4 Heavy Duty Diesel Engine with TNO EGR System and CRT Particulates Filter,” SAE Technical Paper 2001-01-1947, 2001.
40. Hohl, Y. Amstutz, A., Onder, C., and Guzzella, L., “Retrofit Kit to Reduce NOx and PM Emissions from Diesel Engines Using a Low-Pressure EGR and a DPF System with FBC and Throttling for Active Regeneration Without Production of Secondary Emissions,” SAE Technical Paper 2008-01-0330, 2008.
41. Chatterjee, S., Conway, R., Viswanathan, S., Blomquist, M., Klusener, B., and Andersson, S., “NOx and PM Control from Heavy Duty Diesel Engines Using a Combination of Low Pressure EGR and Continuously Regenerating Diesel Particulate Filter,” SAE Technical Paper 2003-01-0048, 2003.
42. Ballam, E., “2010 Emissions Standards Limit Apparatus Engine Choices,” http://www.firerescue1.com/fire-products/apparatus-accessories/articles/468238-2010-Emissions-Standards-Limit-Apparatus-Engine-Choices/. March 2009.
43. Khair, M.K., and Jääskeläinen, H. “Emission Formation in Diesel Engines,” <http://dieselnet.com/tech/diesel_emiform.html#pm>.
44. Johnson, J. P., Kittelson, D. B., and Watts, W. F., “Source Apportionment of Diesel and Spark Ignition Exhaust Aerosol Using On-Road Data from the Minneapolis Metropolitan Area,” Atmospheric Environment, 39:2111-2121, 2005.
72
45. Kittlelson, D. B., “Engines and Nanoparticles: A Review,” Aerosol Sci., 29(5/6):575-588, 1998.
46. Andersson, J., Preston H., Warrens C., and Brett, P., “Fuel and Lubricant Effects on Nucleation Mode Particle Emissions From a Euro III Light Duty Diesel Vehicle,” SAE Technical Paper 2004-01-1989, 2004.
47. Farrar-Khan, J. R., Andrews, G. E., Williams, P. T., and Bartle, K. D., “The Influence of Nozzle Sac Volume on the Composition of Diesel Particulate Fuel Derived SOF,” SAE Technical Paper 921649, 1992.
48. Dec, J. E., “A Conceptual Model of DI Diesel Combustion Based on Laser-Sheet Imaging,” SAE Technical Paper 970873, 1997.
49. Ahlvik, P., Ntziachristos, L., Keskinen, J., and Virtanen A., “Realtime Measurements of Diesel Particle Size Distribution with an Electrical Low-Pressure Impactor,” SAE Technical Paper 980410, 1998
50. Heywood, J. B., “Internal Combustion Engine Fundamentals, “McGraw-Hill, New York, ISBN 0-07-100499-8, 1988.
51. Abdul-Khalek, I. S. and Kittleson, D. B., “Real Time Measurement of Volatile and Solid Exhaust Particles Using a Catalytic Stripper,” SAE Technical Paper 950236, 1995.
52. Abdul-Khalek, I. S., Kittleson D. B., Grakow, B. R., Wei, Q., and Brear, F., “Diesel Exhaust Particle Size: Measurement Issues and Trends,” SAE Technical Paper 98P-353, 1998.
53. Abdul-Khalek, I. and Kittleson, D., “The Influence of Dilution Conditions on Diesel Exhaust Particle Size Distribution Measurements,” SAE Technical Paper 1999-01-1142, 1999.
54. GRPE-48-11 (Informal document No.), “Conclusions on Improving Particulate Mass Measurement Procedures and New Particle Number Measurement Procedures Relative to the Requirements of the 05 Series of Amendments to Regulation No.83, Transmitted by the Chairman of the Particle Measurement Programme Group in Conjunction with the Experts from Germany, Sweden, Switzerland and the UK (2004)”.
55. Tsolakis A., “Effects of Particle Size Distribution from the Diesel Engine Operating on RME-Biodiesel with EGR,” Energy & Fuels, 20:1418-1424, 2005.
56. Kittleson, D. B., Watts, W. F., Johnson, J. P., Rowntree, C., Payne, M., Goodier, S., Warrens, C., Preston, H., Zink, U., Ortiz, M., Goersmann, C., Twigg, M. V., Walker, A. P., and Caldow, R., “On-Road Evaluation of Two Diesel Exhaust Aftertreatment Devices,” Aerosol Sci., 37:1140-1151, 2006.
57. Lee, J., Goto, Y., and Odaka, M., “Measurement of the Diesel Exhaust Particle Reduction Effect and Particle size Distribution in a Transient Cycle
73
Mode with an Installed Diesel Particulate Filter (DPF),” SAE Technical Paper 2002-01-1005, 2002.
58. Abdul-Khalek, I. S., Kittleson, D. B., and Brear, F., “Diesel Trap Performance: Particle Size Measurements and Trends,” SAE Technical Paper 982599, 1998.
59. Mayer, A., Egli, H., Burtscher, H., Czerwinski, J., and Gehrig, H., “Particle Size Distribution Downstream Traps of Different Design,” SAE Technical Paper 950373, 1995.
60. Bagley, S. T., Baumgard, K. J., Gratz, L. D., Johnson, J. J., and Leddy, D.G., “Characterization of Fuel and After-Treatment Device Effects on Diesel Emissions,” Health Effects Institute, Cambridge, MA, Report 76, 1996. http://healtheffects.org/Pubs/st76.htm.
61. Baumgard, K. J. and Johnson, J. H., “The Effect of Fuel and Engine Design on Diesel Exhaust Particle Size Distributions,” SAE Technical Paper 960131, 1996.
62. Donaldson, K., Li, X. Y., and MacNee, W., “Ultrafine (Nanometre) Particle Mediated Lung Injury,” Aerosol Sci., 29:553-560, 1998.
63. United States Environmental Protection Agency: Air Quality Criteria for Particulate Matters. Volume I of II, EPA/600/P-99/002aF, October 2004.
64. Kittleson, D., Johnson, J., Watts, W., Wei, Q., Drayton, M., Paulsen, D., and Bukowiecki, N., “Diesel Aerosol Sampling in the Atmosphere,” SAE Technical Paper 2000-01-2212, 2000.
65. Lakkireddy, V. R., Mohammed, H., and Johnson, J. H., “The Effects of a Diesel Oxidation Catalyst and a Catalyzed Particulate Filter on Particle Size Distribution from a Heavy Duty Diesel Engine,” SAE Technical Paper 2006-01-0877, 2006.
66. Kittelson, D.B., Watts, W. F., Johnson, J., “Diesel Aerosol Sampling Methodology – CRC E-43: Final Report.” University of Minnesota, Report for the Coordinating Research Council, 19 August 2002. http://www.crcao.com/reports/recentstudies00-02/UMN%20Final%20E-43%20Report.pdf.
67. Krahl, J., Munack, A., Schroder, O., Stein, H., and Bunger, J., “Influence of Biodiesel and Different Designed Fuels on the Exhaust Gas Emissions and Health Effects,” SAE Technical Paper 2003-01-3199, 2003.
68. Tan, P., Lou, D., and Hu, Z., “Nucleation Mode Particle Emissions from a Diesel Engine with Biodiesel and Petroleum Diesel Fuels,” SAE Technical Paper 2010-01-0787, 2010.
74
69. Sinha, A., Chandrasekharan, J., Nargunde, J., Bryzik, W., Henein, N., and Acharya, K., “Effects of Biodiesel and its Blends on Particulate Emissions from HSDI Diesel Engine,” SAE Technical Paper 2010-01-0798, 2010.
70. Jung, H., Kittelson, D. B., and Zachariah M. R., “Characteristics of SME Biodiesel-Fueled Diesel Particle Emissions and the Kinetics of Oxidation,” Environ. Sci. Technol., 40:4949-4955, 2006.
71. Kim, H. and Byungchul, C., “The Effect of Biodiesel and Bioethanol blended Diesel Fuel on Nanoparticles and Exhaust Emissions from CRDI Diesel Engine,” Renewable Energy, 35:157-163, 2010.
72. Tindale, M., Price, P., and Chen, R., “The Impact of Biodiesel on Particle Number, Size and Mass Emissions from a Euro 4 Diesel Vehicles,” SAE Technical Paper 2010-01-0796, 2010.
73. Park, S., Kim, H., and Choi, B., “Emissions Characteristics of Exhaust Gases and Nanoparticles from a Diesel Engine with Biodiesel-Diesel Fuel (B20),” Mechanical Science and Technology, 23:2555-2564, 2009.
74. Tan, P., Hu, Z., Lou, D., and Li, B., “Particle Number and Size Distribution from a Diesel Engine with Jatropha Biodiesel Fuel,” SAE Technical Paper 2009-01-2726, 2009.
75. Lapuerta, M., Rodrı´guez-Ferna´ndez, J., Agudelo, J. R., “Diesel Particulate Emissions from Used Cooking Oil Biodiesel,” Bioresource Technol., 99(4):731-740, 2008.
76. Bagley, S. T., Gratz, L. D., Johnson, J. H., and McDonald, J. F., “Effects of an Oxidation Catalytic Converter and a Biodiesel Fuel on the Chemical, Mutagenic, and Particle Size Characteristics of Emissions from a Diesel Engine. Environ. Sci. Technol., 32:1183–1191, 1998.
77. Chen, Y. C., and Wu, C. H., “Emissions of Submicron Particles from a Direct Injection Diesel Engine by Using Biodiesel,” Environ. Sci. Health, A37 (5):829–843, 2002.
78. Lapuerta, M., Armas, O., and Ballesteros, R., “Diesel Particulate Emissions from Biofuels Derived from Spanish Vegetable Oils,” SAE Technical Paper 2002-01-1657, 2002.
79. Aakko, P., Nylund, N. O., Westerholm, M., Marjamaki, M., Moisio, M., and Hillamo, R., “Emissions from Heavy-Duty Engine with and without Aftertreatment Using Selected Biofuels,” FISITA World Automotive Congress Proceedings, F02E195, 2002.
80. Wu, Y., Carder, D., Shade, B., Atkinson, R., Clark, N., and Gautam, M., “A CFR 1065 – Compliant Transportable/On Road Low Emissions Measurement Laboratory with Dual Primary Full–Flow Dilution Tunnels,” Proceedings of ASME Internal Combustion Engine Division 2009 Spring Technical Conference, ICES2009 – 76090, 2009.

75
81. “Automotive Emission Analyzer System MEXA-7200 Manual,” Horiba, Japan, April, 2007
82. Khalek, I. A., “2007 Diesel Particulate Measurement Research, ”CRC Final Report Project E-66-Phase 3,” Southwest Research Institute, San Antonio, Texas, 2007.
83. Symunds, J. P. R., Reavell, K. S. J., Olfert, J. S., Campbell, B. W., and Swift, S. J., “Diesel Soot Mass Calculation in Real-Time with a Differential Mobility Spectrometer,” Aerosol Science, 38:52-68, 2007.
84. “DMS 500 Fast Particulate Spectrometer User Manual, Version 3.1,” Cambustion, United Kingdom, 2010.
85. Stepper, M. R., “Data Link Overview for Heavy Duty Vehicle Applications,” SAE Technical Paper 902215, 1990.
86. California Air Resources Board, “Proposed Methodology to Model Carbon Dioxide Emissions and Estimate Fuel Economy,” Available online at http://www.arb.ca.gov/msei/onroad/downloads/pubs/co2final.pdf. Accessed October 2010.
87. Clark, N. N., Gautam, M., Wayne, S. W., Lyons, D. W., and Thompson, G., “Heavy-Duty Vehicle Chassis Dynamometer Testing for Emissions Inventory, Air Quality Modeling, Source Apportionment and Air Toxics Emissions Inventory,” CRC Report No. E55/59, August 2007.
88. Durbin, T. D., Johnson, K., Miller, J. W., Maldonado, H., and Chernich, D., “Emissions from Heavy-duty Vehicles Under On-road Driving Conditions,” Atmospheric Environment, 42:4812-4821, 2008.
89. California Air Resources Board, “EMFAC 2007, Version 2.30 Users Guide,” Available online at http://www.arb.ca.gov/msei/onroad/downloads/docs/user_guide_emfac2007.pdf
90. Hancock, B., “On-Road Emissions Inventory Fuel Correction Factors,” Technical Memo from California Air Resources Board, July 2005. Available online at http://www.arb.ca.gov/msei/onroad/techmemo/onroad_emissions_invntry_fuel_corr_factors.pdf
91. Zhou, L., “Revision of Heavy Duty Truck Emission factor and Speed correlation Factors,” Technical Memo on EMFAC Modeling, October, 2006. Available online at http://www.arb.ca.gov/msei/onroad/techmemo/modification_hhddt_speed_and_speed_corr_factors.pdf
92. Min, J., Lee, C., Kim, H., Jung, H., and Kim, Y., “Development and Performance of Catalytic Diesel Particulate Filter Systems for Heavy-Duty Diesel Vehicles,” SAE Technical Paper 2005-01-0664, 2005.

76
93. Bernemyr, H. and Angstrom, H., “Number Measurements of Diesel Exhaust Particles – Influence of Dilution and Fuel Sulphur Content,” SAE Technical Paper 2007-01-0064, 2007.
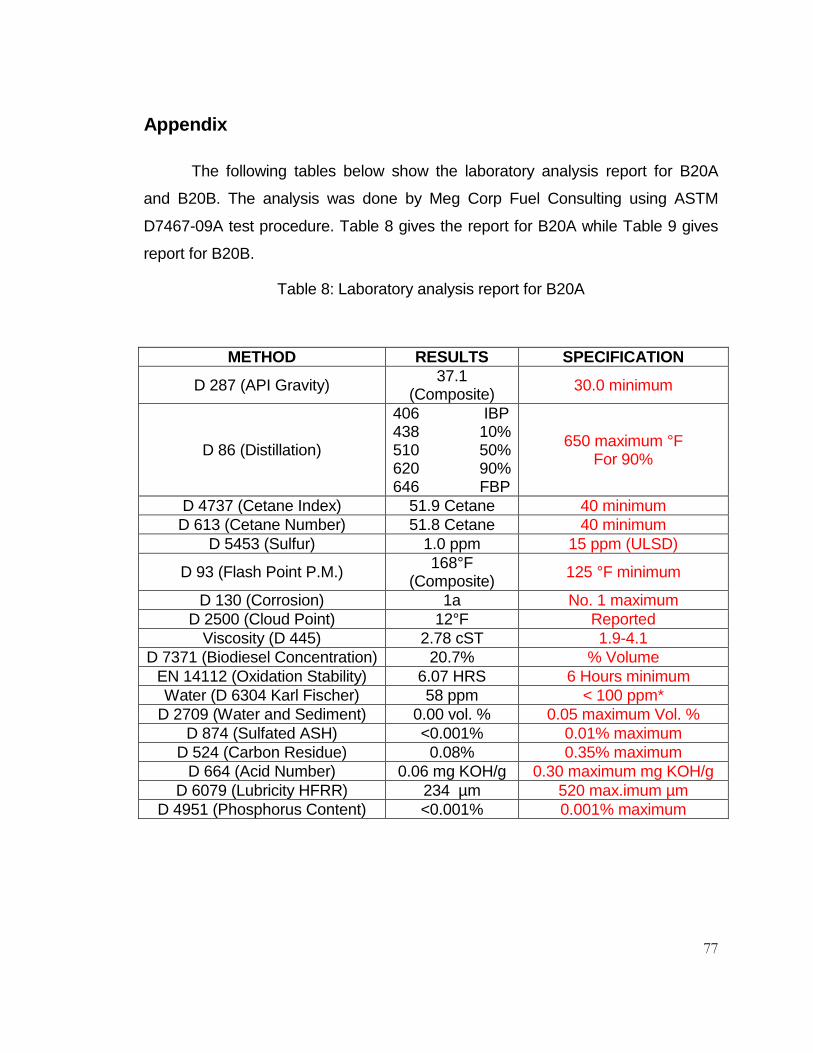
77
Appendix
The following tables below show the laboratory analysis report for B20A
and B20B. The analysis was done by Meg Corp Fuel Consulting using ASTM
D7467-09A test procedure. Table 8 gives the report for B20A while Table 9 gives
report for B20B.
Table 8: Laboratory analysis report for B20A
METHOD RESULTS SPECIFICATION
D 287 (API Gravity) 37.1 (Composite) 30.0 minimum
D 86 (Distillation)
406 IBP 438 10% 510 50% 620 90% 646 FBP
650 maximum °F For 90%
D 4737 (Cetane Index) 51.9 Cetane 40 minimum D 613 (Cetane Number) 51.8 Cetane 40 minimum
D 5453 (Sulfur) 1.0 ppm 15 ppm (ULSD)
D 93 (Flash Point P.M.) 168°F (Composite) 125 °F minimum
D 130 (Corrosion) 1a No. 1 maximum D 2500 (Cloud Point) 12°F Reported
Viscosity (D 445) 2.78 cST 1.9-4.1 D 7371 (Biodiesel Concentration) 20.7% % Volume
EN 14112 (Oxidation Stability) 6.07 HRS 6 Hours minimum Water (D 6304 Karl Fischer) 58 ppm < 100 ppm*
D 2709 (Water and Sediment) 0.00 vol. % 0.05 maximum Vol. % D 874 (Sulfated ASH) <0.001% 0.01% maximum
D 524 (Carbon Residue) 0.08% 0.35% maximum D 664 (Acid Number) 0.06 mg KOH/g 0.30 maximum mg KOH/g
D 6079 (Lubricity HFRR) 234 µm 520 max.imum µm D 4951 (Phosphorus Content) <0.001% 0.001% maximum

78
Table 9: Laboratory analysis report for B20B
*Does not meet specification.
METHOD RESULTS SPECIFICATION D 287 (API Gravity) 37.8 (Composite) 30.0 minimum
D 86 (Distillation)
408 IBP 444 10% 510 50% 620 90% 650 FBP
650 maximum. °F For 90%
D 4737 (Cetane Index) 53.7 Cetane 40 minimum D 613 (Cetane Number) 59.4 Cetane 40 minimum
D 5453 (Sulfur) 1.5 ppm 15 ppm (ULSD)
D 93 (Flash Point P.M.) 170°F (Composite) 125 °F minimum
D 130 (Corrosion) 1a No. 1 maximum D 2500 (Cloud Point) 20°F Reported
Viscosity (D 445) 2.24 cST 1.9-4.1 D 7371 (Biodiesel Concentration) 21.3% % Volume EN 14112 (Oxidation Stability)* 3.18 HRS 6 Hours minimum
Water (D 6304 Karl Fischer) 70 ppm < 100 ppm* D 2709 (Water and Sediment) 0.00 vol. % 0.05 maximum Vol. %
D 874 (Sulfated ASH) <0.001% 0.01% maximum D 524 (Carbon Residue) 0.05% 0.35% maximum
D 664 (Acid Number) 0.12 mg KOH/g 0.30 maximum mg KOH/g D 6079 (Lubricity HFRR) 249 µm 520 maximum µm
D 4951 (Phosphorus Content) <0.001% 0.001% maximum

79
Figure 36: Vehicle speed versus time (coast down data).
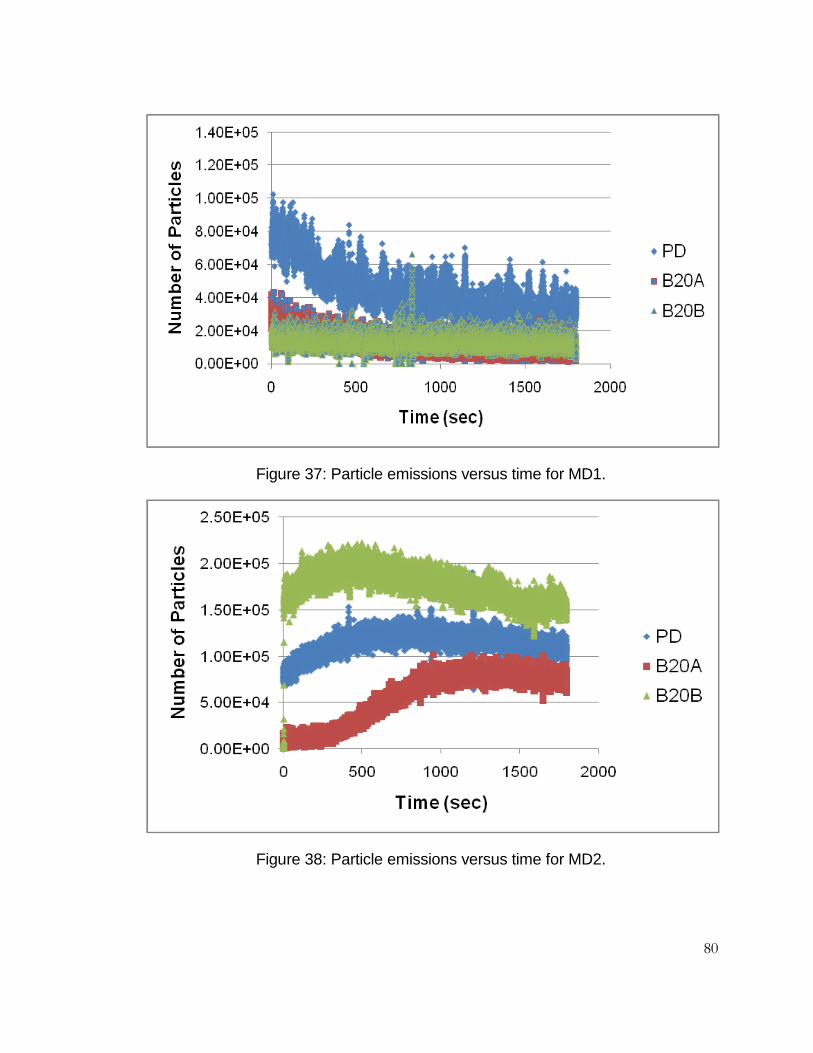
80
Figure 37: Particle emissions versus time for MD1.
Figure 38: Particle emissions versus time for MD2.

81
Figure 39: Particle emissions versus time for MD3.
Figure 40: NOx speed correction factor for EMFAC [90].