Embed Size (px)
Citation preview

The Effects of Soil Moisture, Soil Temperature and Air Temperature on Picea rubens Distribution: MaxEnt
Modeling in a Small Forested Catchment
Adrienne NottinghamAssistant Forest Soil Scientist Monongahela National Forest

Red Spruce Story
• Historically larger extent- 200,000 ha red spruce forest in WV (Clarkson, 1964; Lewis, 1998; Adams et al., 2001)
• Extensive logging around 1880 decimated population (Clarkson, 1964; Lewis, 1998)
• Today: 24, 000 ha in WV (Adams et al., 2001) • One of the most endangered forest types in the Central
Appalachians (Christensen et al., 1966; Noss et al., 1995)
Cabin Mountain, WV (Clarkson, 1964)

Red Spruce Restoration• Interest in restoring red
spruce forests • Ecosystem services
• But finite resources…• Where are the best sites
to focus restoration money and efforts?
• Use models to help answer this question

MaxEnt• Species distribution model (Fleishman et al., 2001;
Phillips et al., 2004; Elith et al., 2006; Pearson, 2010)
• Inputs:• Presence-only data (Pearson, 2010)• Environmental variables (Pearson, 2010) • Covariates must be a surface (raster)
• Looking for places on the landscape that are similar to conditions at presence locations
Occurrence points Environmental Variables
+
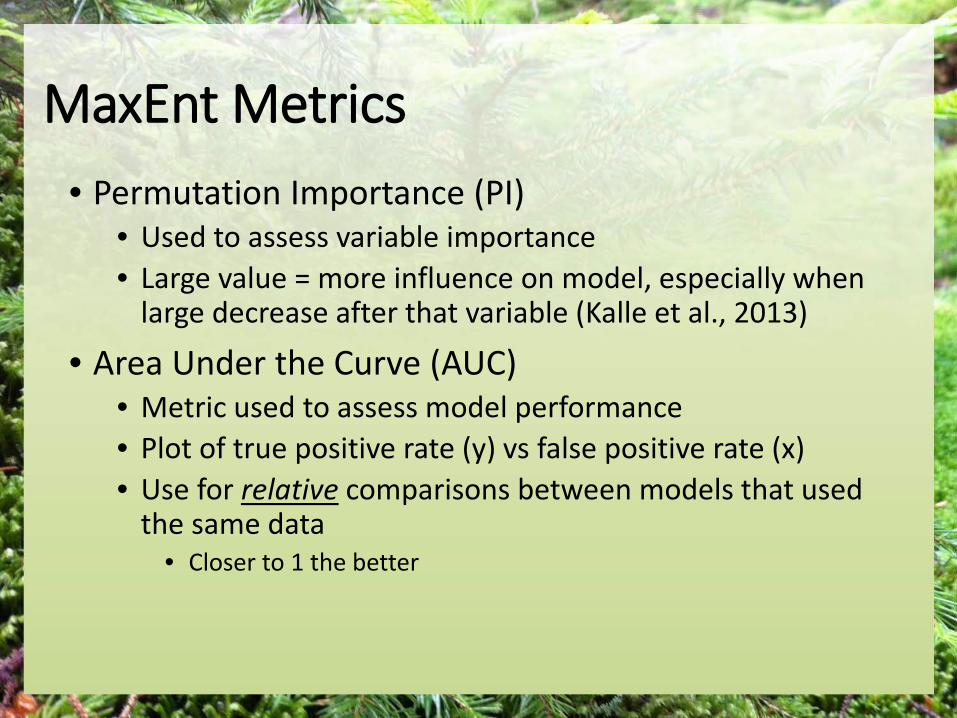
MaxEnt Metrics• Permutation Importance (PI)
• Used to assess variable importance • Large value = more influence on model, especially when
large decrease after that variable (Kalle et al., 2013)
• Area Under the Curve (AUC)• Metric used to assess model performance• Plot of true positive rate (y) vs false positive rate (x)• Use for relative comparisons between models that used
the same data• Closer to 1 the better

• Numerous modeling efforts (Iverson et al., 2008; Beane et al., 2013; Madron, 2013; Nauman et al., 2015)
• Most do not use microclimatic variables • If microclimatic variables used, they are coarse (Iverson
et al., 2008; Beane et al., 2013; Madron, 2013) • Using coarse climatic data does not capture
relationships between red spruce and microclimate• Not much literature on specific microclimatic req’s
How is this study different from previous red spruce modeling efforts?

Objectives of Study1) Determine which microclimatic variables (if any)
are most important to red spruce presence 2) Compare model results generated using only
topographic variables to model results generated using both topographic and microclimatic variables

Study AreaSnorting Lick Run Watershed
• Size: 5.4 km2
• Elevation: 780-1425 m
• Geology: Hampshire and Chemung Formations
• Vegetation• Mostly deciduous • Some hardwood-
conifer and conifer

Site Selection within SLR Watershed• Microclimatic data collection at 20 sites
for almost 1 year• 20 random, spatially-distributed sites
• Air temperature, soil temperature, soil moisture
• 18 sites had red spruce (presence-only sites)

Microclimate Variable Creation • Created 107 microclimatic variables (based on limited
literature)• Focused on extremes, such as hottest/coldest/driest instantaneous
values or values over periods of time• hottest August daily mean air temperature for each plot - any date• warmest December daily mean soil temperature for each plot - any date• driest July daily mean soil moisture for each plot - any date
• Need raster datasets: converted point data to raster with kriging/cokriging

Topographic Variables
• 10 DEM derived variables • Aspect• Proximity to stream channels• Slope and slope position• Plan and profile curvature • Convergence• Wetness index

MaxEnt Inputs• 18 presence-only data
points• 10 topographic variables • 107 microclimatic
variables• 20 air temperature • 54 soil temperature• 33 soil moisture

Preliminary Model Runs• First ran 4 preliminary runs using only:
• Topographic variables• Air temperature variables• Soil temperature variables• Soil moisture variables
Model AUC Value
Topographic variables only 0.800Air temperature variables only 0.794Soil temperature variables only 0.781Soil moisture variables only 0.690
Best model performance

Preliminary Permutation ImportanceTopographic Variables
Variable PI (%)Altitude above channel network
70
Topographic wetness index 7
Air Temperature VariablesVariable PI (%)August absolute maximum temperature any day
30
August daily minimum temperature any day
20
Soil Temperature VariablesVariable PI (%)August absolute maximum at 0 cm any day
26
August daily minimum at 25 cm any day
14
Soil Moisture VariablesVariable PI (%)July daily maximum at 50 cm any day
26
Driest 24 hour period at 0 cm 23August daily maximum at 50 cm any day
12

Final RunAUC = 0.82, only slightly higher than topographic only (AUC = 0.80)
Variable Type PI (%)
Altitude above channel network Topographic 37
August absolute maximum any day Air Temperature 24
August absolute maximum at 0 cm any day
Soil Temperature 18
Driest 24 hour period at 0 cm Soil Moisture 12
July daily maximum any day at 50 cm Soil Moisture 9

Agreement/Disagreement Analysis• Needed to compare model outputs using the
topographic only and final model which used the 5 most important variables
• Note that altitude above channel network used in both
• Used median values for each model to separate high and low relative occurrence rates for the agreement/disagreement analysis
• > median classified as high • =/< median classified as low

Agreement/Disagreement ResultsAgreement/Disagreement: Meaning Percentage
Agreement: Both models predict high ROR 41Agreement: Both models predict low ROR 41Disagreement: Topographic only model predicts high ROR, topographic and microclimatic model predicts low ROR
9
Disagreement: Topographic only model predicts low ROR, topographic and microclimatic model predicts high ROR
9
• 82% agreement• 18% disagreement

Agreement/Disagreement Results• Green- both low ROR• Pink- Both high ROR• Yellow- Topographic only
model predicts high ROR, Final model predicts low ROR
• Blue- Topographic only model predicts low ROR, Final model predicts high ROR
• Agreement that• Higher ROR occurs at lower elevations of watershed• Lower ROR occurs at high elevations of watershed

Summary- Obj 1: Which Variables Important?
• Most important microclimatic variable: August absolute maximum air temperature
• Least important: soil microclimatic variables al• The process of trying to convert point data into
surface data necessary but not extremely effective• Microclimatic conditions are highly variable over
short distance- may have needed a more dense sampling network
• Air temperature performed well and is easier to measure- consider for future research efforts

• AACN most important topographic variable, and more important than microclimate variables used
• Both the topographic only and final model predict the highest ROR at the lowest elevations of the watershed (as low as 2500 ft)
• Focus restoration at the highest elevations of landscape first, then target landscape positions that promote cooler air and soil temperature and soil moisture that may act as microrefugia and connectivity for red spruce under projected climatic conditions
Summary- Obj 2: Compare Topo Only vs. Topo + Micro

Study 2: Topographic Variables
Topographic Variablesaspect linear aspect calculated using geomorphometry and gradient
metrix toolbox (Evans et al., accessed 2017)
aacn altitude above local stream channel
baselevel elevation of nearest channel point to each pixel in its given watershed
converg overall measure of concavity
lsfactor slope-length factor from USLEas calculated in SAGA GIS
plancurv curvature perpendicular to slope direction
profcurv curvature parallel to slope direction
slope slope gradient (rise/run) in fraction unitsslpos
index from 0 (valley floor) to 100 (ridgetop) of slope position (Hatfield, 1996)
twi topographic wetness index

Study 2: Air Temperature variable Variable DescriptionAir Temperaturejulavgdaytime average July daytime air temperature for each plotaugavgdaytime average August daytime air temperature for each plotjanabsminanyday coldest January 30-min air temperature for each plot - any datefebabsminanyday coldest February 30-min air temperature for each plot - any datejulabsminanyday coolest July 30-min air temperature for each plot - any dateaugabsminanyday coolest August 30-min air temperature for each plot - any datenovabsminanyday coldest November 30-min air temperature for each plot - any datedecabsminanyday coldest December 30-min air temperature for each plot - any datejulabsmaxanyday hottest July 30-min air temperature for each plot - any dateaugabsmaxanyday hottest August 30-min air temperature for each plot - any datejandailyminanyday coldest January daily mean air temperature for each plot - any datefebdailyminanyday coldest February daily mean air temperature for each plot - any datejuldailyminanyday coolest July daily mean air temperature for each plot - any dateaugdailyminanyday coolest August daily mean air temperature for each plot - any datejuldailymaxanyday hottest July daily mean air temperature for each plot - any dateaugdailymaxanyday hottest August daily mean air temperature for each plot - any dateabsmaxanyday hottest 30-min air temperature for each plot- any dateabsminanyday coldest daily mean air temperature for each plot- any dateanntempalldata annual mean from monthly means of all 30-min readingsanntempbioclim annual mean from monthly means as average of monthly maximum
and minimum

Study 2: Soil Temperature VariablesSoil Temperaturefebabsminanyday0cm coldest February 1-hr soil temperature for each plot - any datefebabsminanyday25cm coldest February 1-hr soil temperature for each plot - any datefebabsminanyday50cm coldest February 1-hr soil temperature for each plot - any datefebdailyminanyday0cm coldest February daily mean soil temperature for each plot - any datefebdailyminanyday25cm coldest February daily mean soil temperature for each plot - any datefebdailyminanyday50cm coldest February daily mean soil temperature for each plot - any datedecabsminanyday0cm coldest December 1-hr soil temperature for each plot - any datedecabsminanyday25cm coldest December 1-hr soil temperature for each plot - any datedecabsminanyday50cm coldest December 1-hr soil temperature for each plot - any datedecabsmaxanyday0cm warmest December 1-hr soil temperature for each plot - any datedecabsmaxanyday25cm warmest December 1-hr soil temperature for each plot - any datedecabsmaxanyday50cm warmest December 1-hr soil temperature for each plot - any datedecdailyminanyday0cm coldest December daily mean soil temperature for each plot - any datedecdailyminanyday25cm coldest December daily mean soil temperature for each plot - any datedecdailyminanyday50cm coldest December daily mean soil temperature for each plot - any datedecdailymaxanyday0cm warmest December daily mean soil temperature for each plot - any datedecdailymaxanyday25cm warmest December daily mean soil temperature for each plot - any datedecdailymaxanyday50cm warmest December daily mean soil temperature for each plot - any datejanabsminanyday0cm coldest January 1-hr soil temperature for each plot - any datejanabsminanyday25cm coldest January 1-hr soil temperature for each plot - any datejanabsminanyday50cm coldest January 1-hr soil temperature for each plot - any datejanabsmaxanyday0cm warmest January 1-hr soil temperature for each plot - any datejanabsmaxanyday25cm warmest January 1-hr soil temperature for each plot - any datejanabsmaxanyday50cm warmest January 1-hr soil temperature for each plot - any date

Study 2: Soil Temp Variables (con’t)jandailyminanyday0cm coldest January daily mean soil temperature for each plot - any datejandailyminanyday25cm coldest January daily mean soil temperature for each plot - any datejandailyminanyday50cm coldest January daily mean soil temperature for each plot - any datejandailymaxanyday0cm warmest January daily mean soil temperature for each plot - any datejandailymaxanyday25cm warmest January daily mean soil temperature for each plot - any datejandailymaxanyday50cm warmest January daily mean soil temperature for each plot - any datejulabsminanyday0cm coolest July 1-hr soil temperature for each plot - any datejulabsminanyday25cm coolest July 1-hr soil temperature for each plot - any datejulabsminanyday50cm coolest July 1-hr soil temperature for each plot - any datejulabsmaxanyday0cm warmest July 1-hr soil temperature for each plot - any datejulabsmaxanyday25cm warmest July 1-hr soil temperature for each plot - any datejulabsmaxanyday50cm warmest July 1-hr soil temperature for each plot - any datejuldailyminanyday0cm coolest July daily mean soil temperature for each plot - any datejuldailyminanyday25cm coolest July daily mean soil temperature for each plot - any datejuldailyminanyday50cm coolest July daily mean soil temperature for each plot - any datejuldailymaxanyday0cm warmest July daily mean soil temperature for each plot - any datejuldailymaxanyday25cm warmest July daily mean soil temperature for each plot - any datejuldailymaxanyday50cm warmest July daily mean soil temperature for each plot - any dateaugabsminanyday0cm coolest August 1-hr soil temperature for each plot - any dateaugabsminanyday25cm coolest August 1-hr soil temperature for each plot - any dateaugabsminanyday50cm coolest August 1-hr soil temperature for each plot - any dateaugabsmaxanyday0cm warmest August 1-hr soil temperature for each plot - any dateaugabsmaxanyday25cm warmest August 1-hr soil temperature for each plot - any dateaugabsmaxanyday50cm warmest August 1-hr soil temperature for each plot - any dateaugdailyminanyday0cm coolest August daily mean soil temperature for each plot - any dateaugdailyminanyday25cm coolest August daily mean soil temperature for each plot - any dateaugdailyminanyday50cm coolest August daily mean soil temperature for each plot - any dateaugdailymaxanyday0cm warmest August daily mean soil temperature for each plot - any dateaugdailymaxanyday25cm warmest August daily mean soil temperature for each plot - any dateaugdailymaxanyday50cm warmest August daily mean soil temperature for each plot - any date

Study 2: Soil Moisture Variables dry24hr0cm driest 24-hr mean soil moisture for each plot in May-Sept 2016dry24hr25cm driest 24-hr mean soil moisture for each plot in May-Sept 2016dry24hr50cm driest 24-hr mean soil moisture for each plot in May-Sept 2016dry7day0cm driest 7-day mean soil moisture for each plot in May-Sept 2016dry7day25cm driest 7-day mean soil moisture for each plot in May-Sept 2016dry7day50cm driest 7-day mean soil moisture for each plot in May-Sept 2016dry30day0cm driest 30-day mean soil moisture for each plot in May-Sept 2016dry30day25cm driest 30-day mean soil moisture for each plot in May-Sept 2016dry30day50cm driest 30-day mean soil moisture for each plot in May-Sept 2016julabsminanyday0cm driest July 1-hr soil moisture for each plot - any datejulabsminanyday25cm driest July 1-hr soil moisture for each plot - any datejulabsminanyday50cm driest July 1-hr soil moisture for each plot - any datejulabsmaxanyday0cm wettest July 1-hr soil moisture for each plot - any datejulabsmaxanyday25cm wettest July 1-hr soil moisture for each plot - any datejulabsmaxanyday50cm wettest July 1-hr soil moisture for each plot - any datejuldailyminanyday0cm driest July daily mean soil moisture for each plot - any datejuldailyminanyday25cm driest July daily mean soil moisture for each plot - any datejuldailyminanyday50cm driest July daily mean soil moisture for each plot - any datejuldailymaxanyday0cm wettest July daily mean soil moisture for each plot - any datejuldailymaxanyday25cm wettest July daily mean soil moisture for each plot - any datejuldailymaxanyday50cm wettest July daily mean soil moisture for each plot - any dateaugabsminanyday0cm driest August 1-hr soil moisture for each plot - any dateaugabsminanyday25cm driest August 1-hr soil moisture for each plot - any dateaugabsminanyday50cm driest August 1-hr soil moisture for each plot - any dateaugabsmaxanyday0cm wettest August 1-hr soil moisture for each plot - any dateaugabsmaxanyday25cm wettest August 1-hr soil moisture for each plot - any dateaugabsmaxanyday50cm wettest August 1-hr soil moisture for each plot - any dateaugdailyminanyday0cm driest August daily mean soil moisture for each plot - any dateaugdailyminanyday25cm driest August daily mean soil moisture for each plot - any dateaugdailyminanyday50cm driest August daily mean soil moisture for each plot - any dateaugdailymaxanyday0cm wettest August daily mean soil moisture for each plot - any dateaugdailymaxanyday25cm wettest August daily mean soil moisture for each plot - any dateaugdailymaxanyday50cm wettest August daily mean soil moisture for each plot - any date