Embed Size (px)
Citation preview
The Effects of Social and PsychologicalVariables on the Academic Achievementof Children in a Southwest Community
Item Type text; Electronic Dissertation
Authors Angeles Diaz, Gustavo Eduardo
Publisher The University of Arizona.
Rights Copyright © is held by the author. Digital access to this materialis made possible by the University Libraries, University of Arizona.Further transmission, reproduction or presentation (such aspublic display or performance) of protected items is prohibitedexcept with permission of the author.
Download date 01/06/2018 04:36:17
Link to Item http://hdl.handle.net/10150/556432
THE EFFECTS OF SOCIAL AND PSYCHOLOGICAL VARIABLES ON THE ACADEMIC ACHIEVEMENT OF CHILDREN IN A SOUTHWEST COMMUNITY
by
Gustavo Angeles Diaz
__________________________ Copyright © Gustavo Angeles Diaz 2015
A Dissertation Submitted to the Faculty of the
DEPARTMENT OF TEACHING, LEARNING, AND SOCIOCULTURAL STUDIES
In Partial Fulfillment of the Requirements
For the Degree of
DOCTOR OF PHILOSOPHY
WITH A MAJOR IN LANGUAGE, READING, AND CULTURE
In the Graduate College
THE UNIVERSITY OF ARIZONA
2015
2
THE UNIVERSITY OF ARIZONA
GRADUATE COLLEGE
As members of the Dissertation Committee, we certify that we have read the dissertation prepared by Gustavo Angeles Diaz, titled The Effects Of Social And Psychological Variables On The Academic Achievement Of Children In A Southwest Community and recommend that it be accepted as fulfilling the dissertation requirement for the Degree of Doctor of Philosophy. _______________________________________________________________________ Date: 12-‐15-‐2014 Luis Moll _______________________________________________________________________ Date: 12-‐15-‐2014 Norma González _______________________________________________________________________ Date: 12-‐15-‐2014 Julio Cammarota _______________________________________________________________________ Date: 12-‐15-‐2014 Cecilia Rios-‐Aguilar Final approval and acceptance of this dissertation is contingent upon the candidate’s submission of the final copies of the dissertation to the Graduate College. I hereby certify that I have read this dissertation prepared under my direction and recommend that it be accepted as fulfilling the dissertation requirement. ________________________________________________ Date: 12-‐15-‐2014 Dissertation Director: Luis Moll
3
STATEMENT BY AUTHOR
This dissertation has been submitted in partial fulfillment of the requirements for an advanced degree at the University of Arizona and is deposited in the University Library to be made available to borrowers under rules of the Library.
Brief quotations from this dissertation are allowable without special permission, provided that an accurate acknowledgement of the source is made. Requests for permission for extended quotation from or reproduction of this manuscript in whole or in part may be granted by the copyright holder.
SIGNED: Gustavo Angeles Diaz
4
ACKNOWLEDGEMENT This dissertation would not be possible with out help and support from several people. Through these lines I would like to thank and recognize those who make this a reality: my family and friends, who gave me a hand to finish this work. First, my family, parents and my wife Lara, for their endless motivation and love, and for encouraging me to finish. To my friends, especially Lydia Bell, who offered me the possibility to go to her house to finish writing my dissertation; without that I would not been able to finish. To the dissertation committee, for letting me have the privilege to work with you. Especially to Cecilia Rios-‐Aguilar for the support and advice during the data cleaning and analysis. To Luis Moll, for permanent support through the Master's and Ph.D. program as my advisor and dissertation chair. Your guidance showed me how to navigate in a different society and education field. Also It is important to recognize the administrative staff in LRC, or as I consider them, my LRC family, who were always there to make things possible, especially when I was not physically present in Tucson. Finally, I would like to thank the participants in this research study for giving me their time and information without getting anything in exchange.
5
TABLE OF CONTENTS
LIST OF TABLES ........................................................................................................................... 6
LIST OF FIGURES .......................................................................................................................... 6 ABSTRACT ..................................................................................................................................... 7
CHAPTER 1: INTRODUCTION ................................................................................................... 8 1.1 Purpose .......................................................................................................................................... 12 1.2 Research Questions .................................................................................................................... 12 1.3 Methodology ................................................................................................................................. 13 1.4 Implications of research ........................................................................................................... 14
CHAPTER 2: LITERATURE REVIEW AND CONCEPTUAL FRAMEWORK ................... 15 2.1 Literature Review ....................................................................................................................... 15 2.2 Conceptual Framework ............................................................................................................. 31 2.3 Brief history of Mexican and Mexican Americans in the southwest and description of the town were the survey was administered. .............................................. 38 2.4 Data collection and school description ............................................................................... 41
CHAPTER 3: METHODS ........................................................................................................... 43 3.1 Research questions .................................................................................................................... 43 3.2 Data .................................................................................................................................................. 44 3.3 Regression analysis. ................................................................................................................... 46 3.4 Variables ........................................................................................................................................ 47 3.5 Variables created for this study ............................................................................................. 52 3.5.1 Bilingual Fluency. .................................................................................................................................. 54 3.5.2 Bilingual Home School. ....................................................................................................................... 57
3.6 Data analysis ................................................................................................................................. 59 3.7 Missing Data. ................................................................................................................................. 60 3.8 Descriptive characteristics of the samples. ....................................................................... 61 3.9 Limitations .................................................................................................................................... 66
CHAPTER 4: FINDINGS ............................................................................................................ 67 4.1 Descriptive Statistics of Study Variables: ........................................................................... 67 4.2 Regression Analysis ................................................................................................................... 73 4.2.1 Model I: Regression with control variables ............................................................................... 74 4.2.2 Model II. Regression related to language .................................................................................... 77 4.2.3 Model III. Regression related to language. ................................................................................. 79 4.2.4 Model IV. Regression with psychosocial variables ................................................................. 81 4.2.5 Model V. Regression with psychosocial variables ................................................................... 83
CHAPTER 5: DISCUSSION & CONCLUSION ........................................................................ 88 5.1 Findings .......................................................................................................................................... 88 5.1.1 Bilingualism and Academic Outcomes ......................................................................................... 88 5.1.2 Psychosocial Factors and Academic Outcomes ........................................................................ 92 5.1.3 Assimilation Models and the Acculturation of the Southwest Sample ........................... 95
5.2 Implications for theory .......................................................................................................... 100 5.3 Implications for policy and practice .................................................................................. 102 5.4 Implications for future research ........................................................................................ 106 5.5 Concluding thoughts ............................................................................................................... 110
APPENDIX A: SURVEY INSTRUMENT ................................................................................ 112 REFERENCES ............................................................................................................................ 127
6
LIST OF TABLES Table 1. Percentage of students by race/ethnicity. ...................................................................... 42 Table 2 Factor analysis for bilingual fluency variable. ............................................................... 56 Table 3. Factor analysis for the bilingual home school variable. ........................................... 59 Table 4. Descriptive characteristics of the three data samples. ............................................. 62 Table 5. Parents' descriptive data ....................................................................................................... 65 Table 6. Descriptive statistics for the variables used in the regressions. ........................... 68 Table 7. Regressions model I controls variables. .......................................................................... 76 Table 8. Regressions for model II ........................................................................................................ 79 Table 9. Regressions for model III ....................................................................................................... 81 Table 10. Regressions for model IV. ................................................................................................... 82 Table 11. Regressions for model V. ..................................................................................................... 85 Table 12. Summary of findings. ............................................................................................................ 89 Table 13. Individual Characteristics expressed in percentage by generation. ................. 95
LIST OF FIGURES Figure 1. Paths of Mobility across generations. ............................................................................. 18 Figure 2. Academic achievement a conceptual model ................................................................ 22 Figure 3. Experience and consequence of different types of discrimination. ................... 26
7
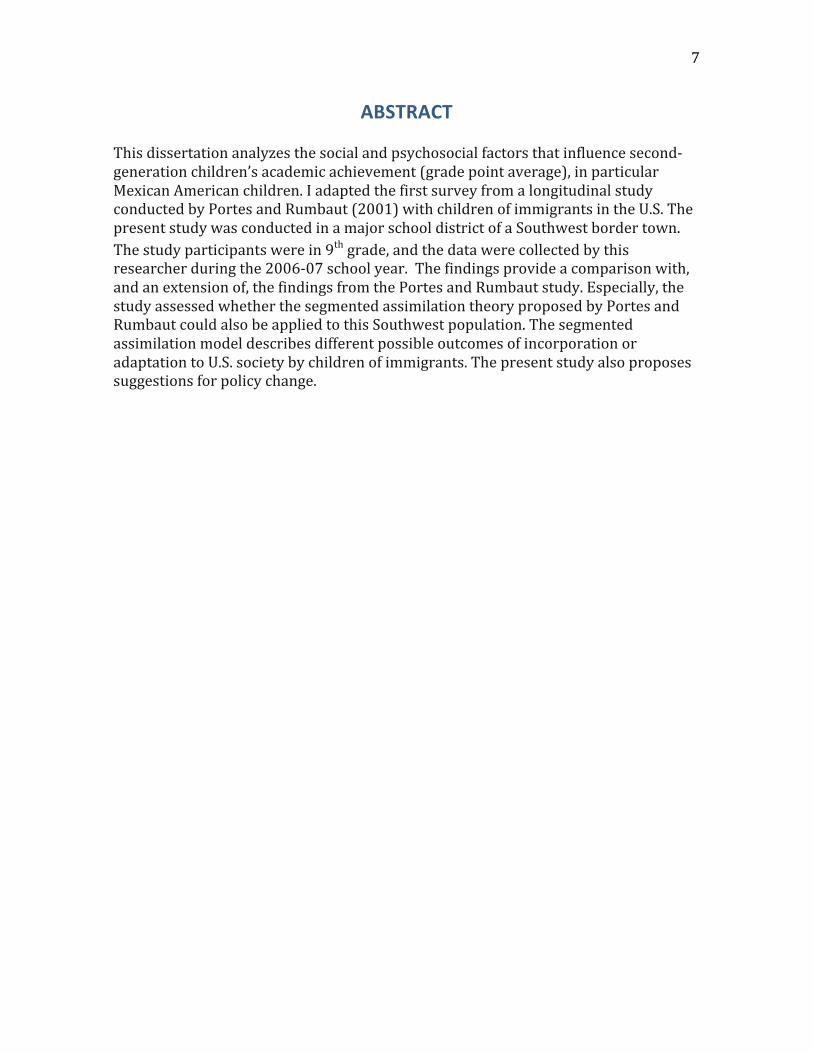
ABSTRACT
This dissertation analyzes the social and psychosocial factors that influence second-‐generation children’s academic achievement (grade point average), in particular Mexican American children. I adapted the first survey from a longitudinal study conducted by Portes and Rumbaut (2001) with children of immigrants in the U.S. The present study was conducted in a major school district of a Southwest border town. The study participants were in 9th grade, and the data were collected by this researcher during the 2006-‐07 school year. The findings provide a comparison with, and an extension of, the findings from the Portes and Rumbaut study. Especially, the study assessed whether the segmented assimilation theory proposed by Portes and Rumbaut could also be applied to this Southwest population. The segmented assimilation model describes different possible outcomes of incorporation or adaptation to U.S. society by children of immigrants. The present study also proposes suggestions for policy change.
8
CHAPTER 1: INTRODUCTION
A desire to explore the experience of immigrant children and their education in
the United States started while I was taking classes as a graduate student. I am
myself an immigrant who, even though I did not attend high school here, became part
of the immigrant educational pathway statistics when I decided to continue with my
education in this country. Envisioning myself and my future generations living here
and engaging in this nation’s public education system also cultivated my interest in
this topic.
I am not Mexican, but as a Peruvian, I am considered Latino by the majority of
US citizens, if they do not phenotypically confuse me with Middle Eastern. Reading
about and witnessing the perceptions and stereotypes that some non-‐Latinos have
about Mexicans and Mexican Americans, who comprise the majority of the Latino
population in this nation, furthered my interest in studying this topic. These
stereotypes, reinforced by media representations of unintelligent Latino/as incapable
of learning the language, social, cultural and political expectations (Bender, 2003),
convey a negative image of Latinos. Also, considering that my child might be
identified as Latino by most of the population, especially in the school setting, compels
me to be more cognizant of what he could experience and which tools he will need to
counteract any of these misrepresentations.
Since one of the spaces where children spend most of their social time is in
school, this environment plays an important role in shaping their lives. For children
the “school setting is a central place where identities are created among young people
and the racial/ethnic and social class distinctions and divisions in society are candidly
9
reproduced” (Bejarano, 2005, p.4). In other words, schools are a microcosm where
youth are implicitly and explicitly educated on how to behave and navigate in a
particular society.
The negative perceptions that others have of Latinos can become
discriminatory and damaging. For children at school, this has been shown to translate
into negative attitudes about school and lower academic performance (Stone & Han,
2005). Witnessing this process that many immigrant youth go through, I believe that
it is important to continue to contribute to the broader field by engaging in research
on the intersections of immigration and education, and am particularly interested in
understanding how such experiences are shaped by cultural context, generational
status, and economic forces from one decade to the next.
The purpose of this study is to investigate whether the segmented assimilation
model proposed by Portes and Rumbaut (2001) is applicable with a Southwest
sample of students. The segmented assimilation model describes different possible
outcomes of incorporation or adaptation to U.S. society by the children of immigrants,
and will be described in detail below. I will also explain my point of view on the terms
‘assimilation’ as well as ‘acculturation’. In particular I will analyze language
preference, self-‐esteem, and psychosocial factors that are related to school
achievement with ninth grade students.
I will compare two datasets containing samples collected in three U.S. cities.
Two samples come from the Children of Immigrants Longitudinal Study (CILS),
conducted with second-‐generation students by Portes and Rumbaut in Miami/ FT.
Lauderdale, Florida and in San Diego, California, during 1992-‐1993. For the purposes
of this study, one of these samples is called CILS, which contains the whole CILS
10
sample. The other is called San Diego, which contains the participants that identify as
Mexican and Mexican American. The third sample is from a city in the southwest, and
was collected by this researcher in the school year 2006-‐2007 with ninth grade
students attending two schools where nearly all students were underrepresented
minorities. This sample is referred to as Southwest.
Portes and Rumbaut’s longitudinal study described the adaptation processes of
second-‐generation immigrants. The first survey they distributed gathered baseline
information on immigrant families, and their children’s demographic characteristics,
language preference, self-‐esteem, identity, and academic achievement. The present
study sought to replicate the survey portion of the Portes and Rumbaut (2001) study
by using the first survey from the CILS study (Portes and Rumbaut, 2001). The data
obtained from conducting this survey with the Southwest sample were compared to
the results from the Portes and Rumbaut datasets. In addition to comparing these
three samples, I tested how the model of segmented assimilation performs with a
different population (Mexican Americans in the Southwest) 14 years after the original
survey administration. I also investigated how other factors that are part of the
segmented assimilation model, such as how the “welcome factor” of the receiving
society played a role in immigrant acculturation when the U.S. economy was at a
relative high in 2006/07 (GDP 2006= 102.658 and 2007= 104.622) (U.S. Department
of Commerce website. BEA.gov), and at a time of lower productivity, in 1992/93 (GDP
1992= 65.595 and 1993=67.466)1. The ‘welcome factor’ is a proxy for the ‘context of
reception’ that Portes and Rumbaut consider one of the important factors
1 These numbers are not adjusted for inflation.
11
determining what kinds of assimilation and/or acculturation immigrants will
experience.
One key difference between the CILS samples and the Southwest sample is
that by adding some questions to the original survey instrument, I was able to identify
third-‐generation immigrants in the Southwest sample. The original intent behind this
addition was to focus on third-‐generation immigrants, because of the lack of research
available on this population, and because of the advantageous (and less studied)
supportive environment that a border town provides, with a settled and strong
Mexican American community with deep historical roots. However, while collecting
data, it became apparent that a significant number of participants knew little about
one side of their family (usually the paternal side), and were therefore unable to
specify information about their length of residency in the United States.
As a result, my study contains fewer identifiable third-‐generation immigrant
participants than expected. There are also several cases in which it is not possible to
determine if the participants should be considered part of the second or later
generation. These limitations generated a change in the design of the study,
bifurcating the analysis to first and second-‐and-‐later generations instead of focusing
exclusively on third generation, and examining how immigrant children or children of
immigrants (2nd, 3rd generation, and later generations) are faring in schools in this
southwest city.
As a Peruvian living and working in the U.S., I am considered Latino by most
Americans, and seen as a part of a larger pan-‐ethnic Spanish-‐speaking linguistic
community. When I addressed the students participating in this study and their
school personnel, I was seen as a researcher. With the students, in particular, while I
12
was administering surveys, in addition to acting as a researcher, I was also acting as
the Principal Investigator of this study, addressing questions and making decisions.
Even though I had been living in the study location for more than 10 years, I did not
identify as being part of the community, in particular the subsection of the city where
the school district is located. I know the community well, having conducted research
studies there previously, but I belonged more to the University community than to the
working-‐class residential areas encompassed by this study.
I maintained a privileged position in relation to the participants in this study,
because of my level of education, and because of having been able to migrate to this
country and continue my university studies here. Despite this social distance and the
power dynamics it entails, I have, during research in the schools and interactions with
the students, observed them participating in their daily routines as students in a
public school. This long-‐term contact has partially compensated for my lack of
experience as a secondary student in this country.
1.1 Purpose
The purpose of this study is to replicate a portion of a study focusing on the
academic outcomes (specifically GPA) of second-‐generation immigrant youth with a
new population to see what are the changes, if any, in the ways these children’s
language, culture, immigrant generational status, and social context impact such
outcomes when separated by geographic differences and fourteen years. The specific
research questions to be addressed by this study are outlined below.
1.2 Research Questions
The following questions will guide the analysis:
13
• What is the influence of foreign language maintenance and bilingualism on
academic achievement?
• Which psycho-‐social and other factors affect the academic achievement of
students in the southwest sample?
• Do the assimilation models (dissonant, consonant, or segmented
assimilation) proposed by Portes and Rumbaut (2001) hold for the
children of immigrants in the Southwest sample as well as they do in the
CILS sample?
1. What are the similarities and differences?
2. What aspects of the model hold for the Southwest sample?
1.3 Methodology
This research study is based on the Portes and Rumbaut longitudinal study, in
the sense that it will utilize the survey from their first study to collect data, especially
in addressing the role of bilingualism and school achievement. However, there are
two obvious differences with the Portes and Rumbaut study. One is that the
Southwest data were collected more than a decade after the initial study, and the
Southwestern location varies from the Portes and Rumbaut primary data collection
sites (San Diego and Miami), providing a different social context of immigrant
reception.
The majority of this study is based on survey data, making this a quantitative
research project. This does not mean that the study solely reports numbers obtained
from the survey. The findings within are explained or challenged by the results of an
analysis of the pertinent literature. When possible, I have illuminated the study
findings with a comparison to relevant qualitative research literature.
14
1.4 Implications of research
Exploring these questions I intend to provide a better understanding of how
bilingualism and other psychosocial variables are related to GPA for immigrant youth
and the children of immigrants. The differences and similarities between the three
samples gathered at two different points in time and in multiple locations will provide
varying contexts from which I will explore these factors. Additionally, I will assess
whether the theoretical underpinnings from the Portes and Rumbaut (2001) study
still hold for a specific group of immigrant youth in a more contemporary context.
15
CHAPTER 2: LITERATURE REVIEW AND CONCEPTUAL FRAMEWORK
2.1 Literature Review
Before examining the theory behind this study and in order to better
understand the model employed, we may wish to examine some of the characteristics
of the original longitudinal study. Among the most ambitious assimilation studies are
those conducted by Portes and Rumbaut (2001, 2006), and Portes, Fernandez-‐Kelly
and Haller (2009) (all of these scholars were exploring the same longitudinal data).
These authors used a longitudinal design to study second-‐generation immigrants and
their families in Miami and San Diego, two major receiving communities. The earliest
data were collected in 1992-‐93, when the children were in 9th grade; subsequent data
were collected in 1995-‐96 when the students were graduating from high school, and
the last sample was collected in 2003-‐2004 when the respondents averaged 24 years
old (from http://cmd.princeton.edu/data%20CILS.shtml)
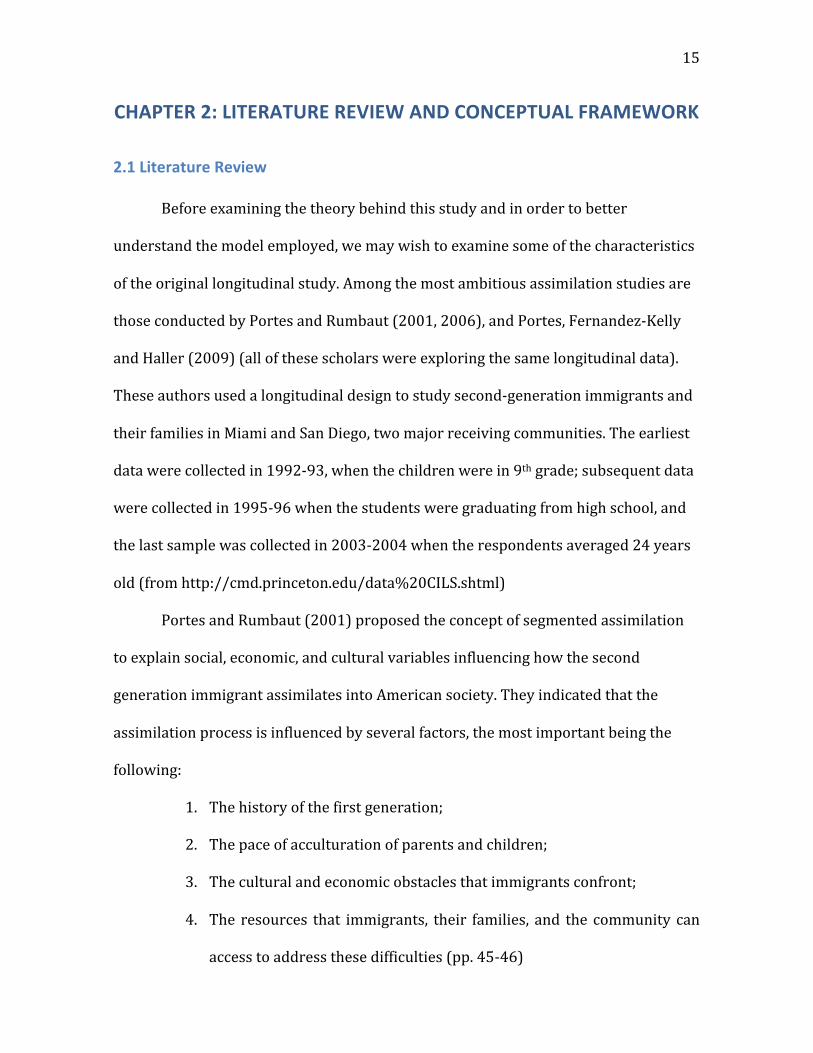
Portes and Rumbaut (2001) proposed the concept of segmented assimilation
to explain social, economic, and cultural variables influencing how the second
generation immigrant assimilates into American society. They indicated that the
assimilation process is influenced by several factors, the most important being the
following:
1. The history of the first generation;
2. The pace of acculturation of parents and children;
3. The cultural and economic obstacles that immigrants confront;
4. The resources that immigrants, their families, and the community can
access to address these difficulties (pp. 45-‐46)
16
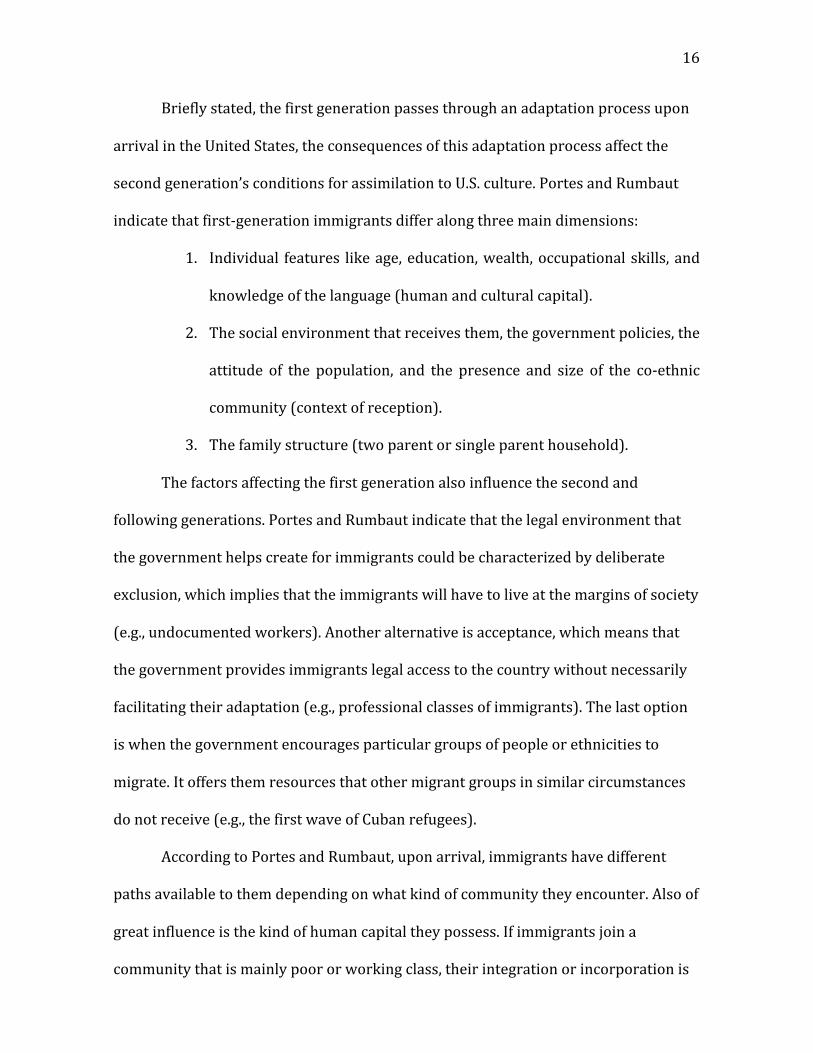
Briefly stated, the first generation passes through an adaptation process upon
arrival in the United States, the consequences of this adaptation process affect the
second generation’s conditions for assimilation to U.S. culture. Portes and Rumbaut
indicate that first-‐generation immigrants differ along three main dimensions:
1. Individual features like age, education, wealth, occupational skills, and
knowledge of the language (human and cultural capital).
2. The social environment that receives them, the government policies, the
attitude of the population, and the presence and size of the co-‐ethnic
community (context of reception).
3. The family structure (two parent or single parent household).
The factors affecting the first generation also influence the second and
following generations. Portes and Rumbaut indicate that the legal environment that
the government helps create for immigrants could be characterized by deliberate
exclusion, which implies that the immigrants will have to live at the margins of society
(e.g., undocumented workers). Another alternative is acceptance, which means that
the government provides immigrants legal access to the country without necessarily
facilitating their adaptation (e.g., professional classes of immigrants). The last option
is when the government encourages particular groups of people or ethnicities to
migrate. It offers them resources that other migrant groups in similar circumstances
do not receive (e.g., the first wave of Cuban refugees).
According to Portes and Rumbaut, upon arrival, immigrants have different
paths available to them depending on what kind of community they encounter. Also of
great influence is the kind of human capital they possess. If immigrants join a
community that is mainly poor or working class, their integration or incorporation is
17
different than if the community let them translate their high education and
occupational skills into economic returns, as with upper class immigrants.
Portes and Rumbaut (2001) proposed three different kinds of assimilation for
the second-‐generation, based on the influence of the factors listed above. One is
dissonant acculturation, which occurs when “children’s learning of the English
language and American ways and simultaneous loss of the immigrant culture outstrip
their parents’” (p. 53). This is the case when parents use their children as helpers with
the language or cultural brokers of the lifestyle of a new society because the children
are more acculturated than their parents. This type of acculturation leads to several
outcomes, including the rupture of the family and children’s partial or complete loss of
bilingualism.
Consonant acculturation occurs when the linguistic and cultural learning
processes happen at the same pace across generations. The parents' human capital
lets them keep up with their children's acculturation. The outcomes include a rapid
shift to English monolingualism in children and a search for integration into
mainstream American culture.
Finally, selective acculturation takes place when both generations’ processes of
adaptation to a different culture happen in a co-‐ethnic community. This type of
community allows children to maintain the customs and language of the mother
country and absorb new lifestyles and languages. The last option does not produce an
intergenerational conflict, as is possible with dissonant acculturation, and
socialization among co-‐ethnics helps children preserve the customs of the mother
country. The outcomes are fluent bilingualism among children and a preservation of
parental authority as well as minimal intergenerational conflict.
18
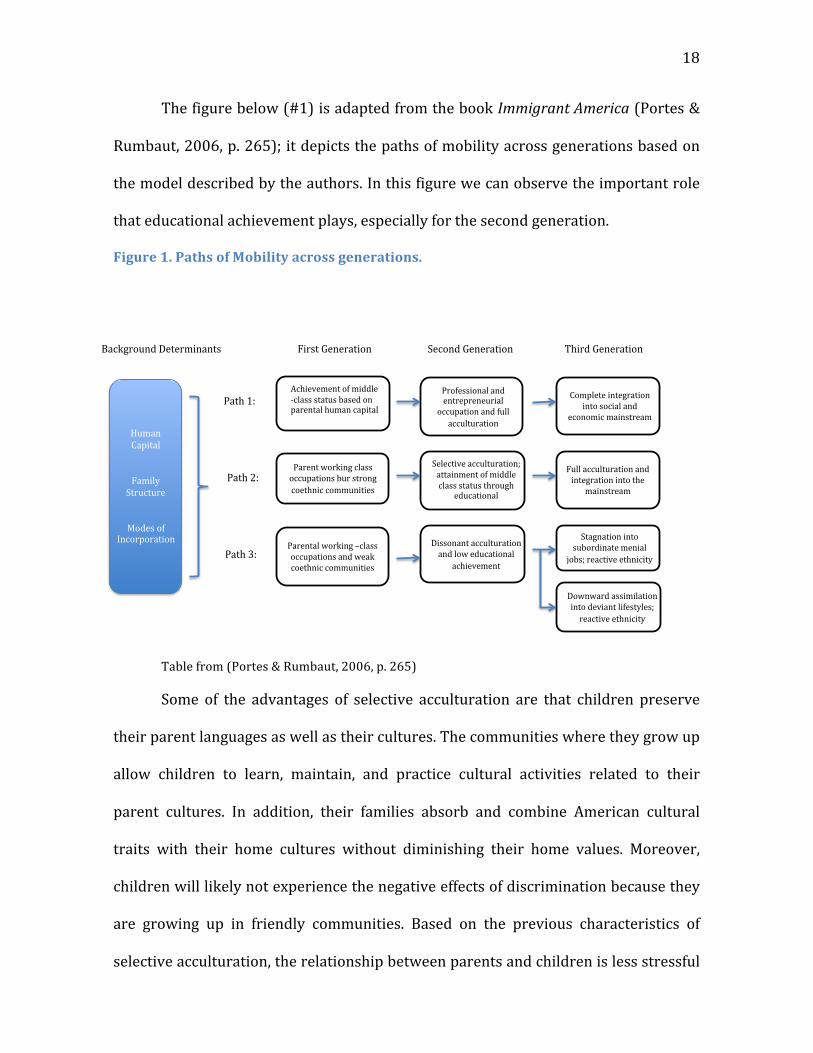
The figure below (#1) is adapted from the book Immigrant America (Portes &
Rumbaut, 2006, p. 265); it depicts the paths of mobility across generations based on
the model described by the authors. In this figure we can observe the important role
that educational achievement plays, especially for the second generation.
Figure 1. Paths of Mobility across generations.
Table from (Portes & Rumbaut, 2006, p. 265)
Some of the advantages of selective acculturation are that children preserve
their parent languages as well as their cultures. The communities where they grow up
allow children to learn, maintain, and practice cultural activities related to their
parent cultures. In addition, their families absorb and combine American cultural
traits with their home cultures without diminishing their home values. Moreover,
children will likely not experience the negative effects of discrimination because they
are growing up in friendly communities. Based on the previous characteristics of
selective acculturation, the relationship between parents and children is less stressful
!!!!!Background!Determinants!!! ! ! !!First!Generation! ! !!!Second!Generation!! !!!!!!!Third!Generation!!
!!
Path!1:!!!!!!Path!2:!
!!!!!Path!3:!
Achievement!of!middle!@class!status!based!on!parental!human!capital!
!
Professional!and!entrepreneurial!
occupation!and!full!acculturation!
Complete!integration!into!social!and!
economic!mainstream!
Human!Capital!!
!!
Family!Structure!
!!
Modes!of!Incorporation!
Parent!working!class!occupations!bur!strong!coethnic!communities!
Selective!acculturation;!attainment!of!middle!class!status!through!
educational!achievement!!
Full!acculturation!and!integration!into!the!
mainstream!
Parental!working!–class!occupations!and!weak!coethnic!communities!
Dissonant!acculturation!and!low!educational!
achievement!!
Stagnation!into!subordinate!menial!
jobs;!reactive!ethnicity!
Downward!assimilation!into!deviant!lifestyles;!reactive!ethnicity!
19
due to this mutual accommodation. In addition, Portes and Rumbaut (2001, p. 54,
239) report that selective acculturation, which often includes bilingualism, leads to
higher school achievement.
In later a publication, Portes and Rumbaut (2006) show the result of the third
wave of interviews (2002-‐2003) done in their study. At that time the subjects were
24 years old on average. Their findings indicate that there are significant differences
among nationalities in education. The percentage of people having high school level or
less ranged from 5.7 percent for Chinese, at the lowest end of the spectrum, to 45.9
percent for a Cambodian/Laotian, being the highest. The Mexican sample showed 38
percent, being the second below the Cambodian/Laotian sample. Another interesting
example is the percentage of participants from the original sample who went on to
have children by the time they were 24: this ranged from zero percent for the Chinese
to 41.5 percent for the Mexican sample. The same results for the incarcerated rate
range from zero percent for the Chinese sample to 10.8 percent for the Mexican
sample (Portes & Rumbaut 2006, p. 275). These results reaffirm Portes and
Rumbaut’s contention that there is a difference in the assimilation process of each
group which is based on, among other things, the social environment at the moment
of arrival for the first generation, and in the case of the second generation, as seen
above, the cultural and economic obstacles that immigrants confront. This leads one
to the question, how will the third generation fare? As we can see, at the conclusion of
data collection, some of participants in the Portes and Rumbaut study had children of
their own, who were part of the third generation.
Similar to the Portes and Rumbaut study there are other studies conducted on
first-‐ or and second-‐generation immigrants that examined educational outcomes.
20
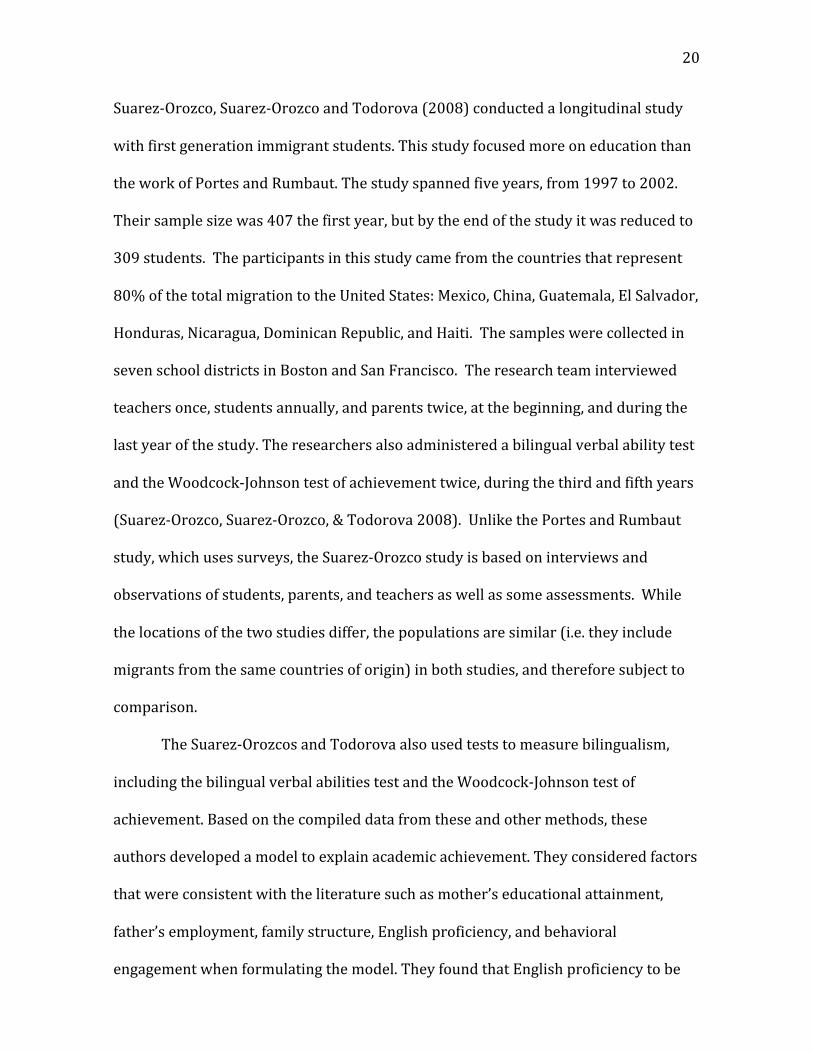
Suarez-‐Orozco, Suarez-‐Orozco and Todorova (2008) conducted a longitudinal study
with first generation immigrant students. This study focused more on education than
the work of Portes and Rumbaut. The study spanned five years, from 1997 to 2002.
Their sample size was 407 the first year, but by the end of the study it was reduced to
309 students. The participants in this study came from the countries that represent
80% of the total migration to the United States: Mexico, China, Guatemala, El Salvador,
Honduras, Nicaragua, Dominican Republic, and Haiti. The samples were collected in
seven school districts in Boston and San Francisco. The research team interviewed
teachers once, students annually, and parents twice, at the beginning, and during the
last year of the study. The researchers also administered a bilingual verbal ability test
and the Woodcock-‐Johnson test of achievement twice, during the third and fifth years
(Suarez-‐Orozco, Suarez-‐Orozco, & Todorova 2008). Unlike the Portes and Rumbaut
study, which uses surveys, the Suarez-‐Orozco study is based on interviews and
observations of students, parents, and teachers as well as some assessments. While
the locations of the two studies differ, the populations are similar (i.e. they include
migrants from the same countries of origin) in both studies, and therefore subject to
comparison.
The Suarez-‐Orozcos and Todorova also used tests to measure bilingualism,
including the bilingual verbal abilities test and the Woodcock-‐Johnson test of
achievement. Based on the compiled data from these and other methods, these
authors developed a model to explain academic achievement. They considered factors
that were consistent with the literature such as mother’s educational attainment,
father’s employment, family structure, English proficiency, and behavioral
engagement when formulating the model. They found that English proficiency to be
21
the best predictor of academic achievement, which is a similar finding to the Portes
and Rumbaut (2001) study, where English language fluency turned up as a key
predictor for positive academic outcomes. It is important to notice how the Suarez-‐
Orozcos and Todorova model used to explain education achievement includes
different factors for fathers than for mothers, like having a working father versus the
mother’s level of education.
Another important factor that eases the cultural transition for arriving
immigrants is the presence of mentors at school or in the community. These people
facilitate the process of acculturation for immigrant children (Suarez-‐Orozco, Suarez-‐
Orozco, and Todorova 2008, p. 84).
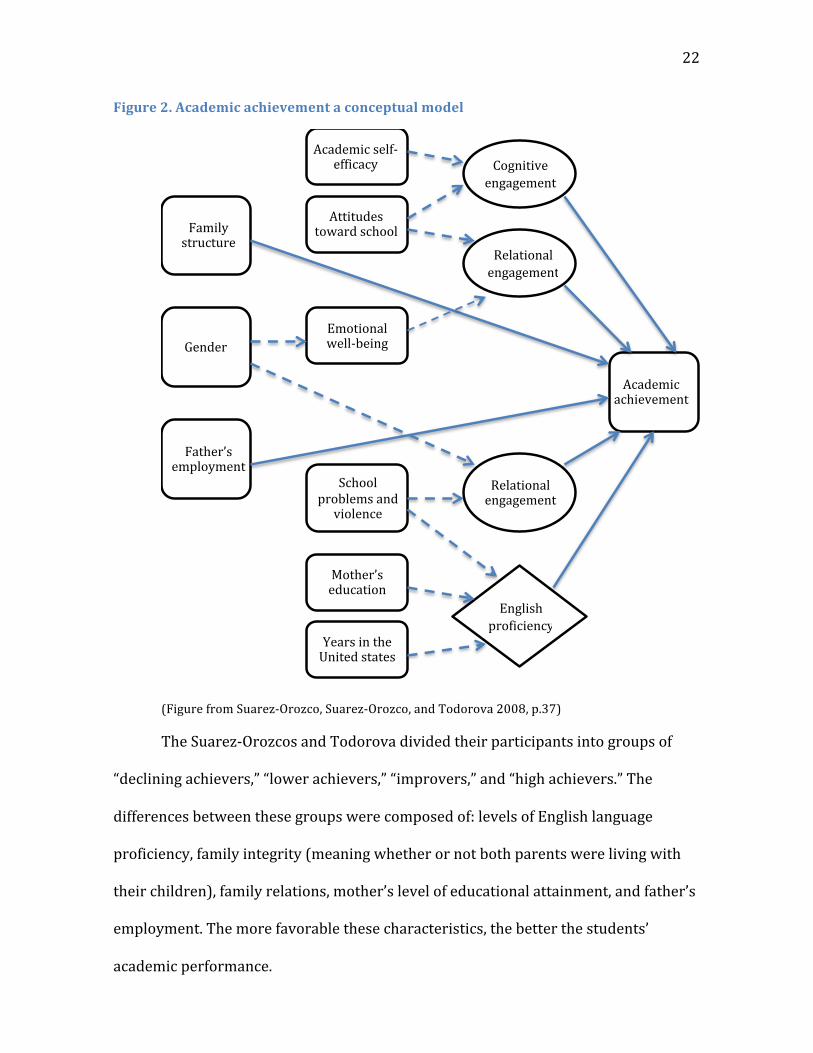
In the following figure we can appreciate the comprehensiveness of the
academic achievement model proposed (Figure 2) by Suarez-‐Orozco and Suarez-‐
Orozco and Todorova (2008, p. 37). As shown, there are some factors affecting
academic achievement that have not occurred inside the school but still exert an
influence on children’s education, such us the family structure, father employment,
and the gender (females) of the children. When doing a study of children of migrants,
it is necessary to consider externals factor that influence children’s lives, otherwise
the study will be overly limited.
22
Figure 2. Academic achievement a conceptual model
(Figure from Suarez-‐Orozco, Suarez-‐Orozco, and Todorova 2008, p.37)
The Suarez-‐Orozcos and Todorova divided their participants into groups of
“declining achievers,” “lower achievers,” “improvers,” and “high achievers.” The
differences between these groups were composed of: levels of English language
proficiency, family integrity (meaning whether or not both parents were living with
their children), family relations, mother’s level of educational attainment, and father’s
employment. The more favorable these characteristics, the better the students’
academic performance.
!
Family!structure!
1
Father’s!employment!
Gender!
Academic!self7efficacy!
Attitudes!toward!school!
Emotional!!well7being!
Mother’s!education!
School!problems!and!violence!
Years!in!the!United!states!
Cognitive!engagement!
Relational!engagement!
Relational!engagement!
Academic!achievement!!
English!proficiency!
2
23
The study by Kasinitz, Mollenkopf, Waters, and Holdaway (2008) complements
other large scale studies mainly because the sample was collected in a different
location (New York), and, together with studies from other regions, it completes the
national picture of how immigrants fare in the most populous cities. These are some
characteristics of the Kasinitz et al. study (whose data collection included telephone
surveys, face to face interviews, and ethnographic observations), which took place
during the years 1998 to 2002 in New York. Their study examines first generation
immigrants, the “1.5 generation” (immigrants younger than 12 years old), and some
native born, white, African American and Latino New Yorkers, who served as a control
group to compare with new immigrants (these native born study subjects were at
least third generation). Their sample did not include Mexicans. The authors claimed
that Mexican immigration was relatively new and, consequently, the numbers of
second-‐generation immigrants were not high enough (Kasinitz, Mollenkopf, Waters, &
Holdaway, 2008).
The Kasinitz et al. study invites comparisons with Portes and Rumbaut, who
collected their samples in Miami and San Diego, as well as with Suarez-‐Orozco et al.,
who collected their samples in San Francisco and in Boston. Three important
differences emerge between Kasinitz et al. and the other two studies. First, the
Kasinitz and colleagues sample is from New York, where neither of the other two
studies collected data; second, the study includes a control population, which allowed
for analyses of how native-‐born minorities are performing as compared to immigrant
generations; and third, it employed ethnographic data collection and analysis, in
addition to other methodologies.
24
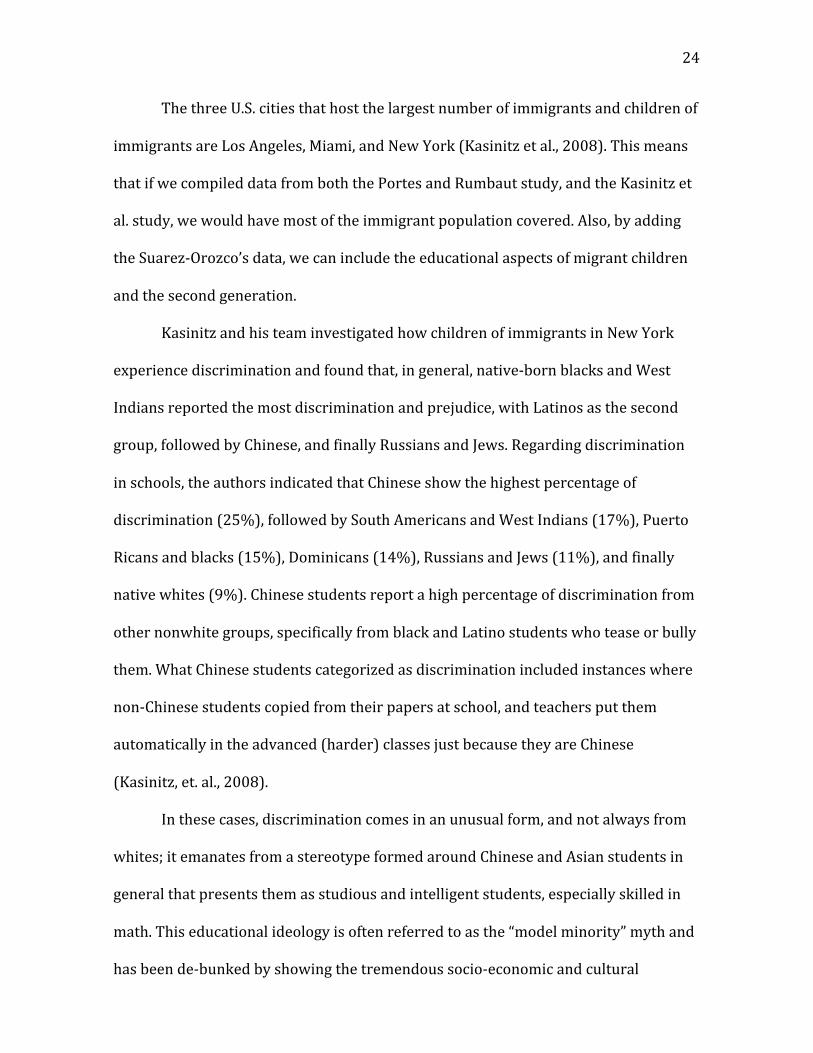
The three U.S. cities that host the largest number of immigrants and children of
immigrants are Los Angeles, Miami, and New York (Kasinitz et al., 2008). This means
that if we compiled data from both the Portes and Rumbaut study, and the Kasinitz et
al. study, we would have most of the immigrant population covered. Also, by adding
the Suarez-‐Orozco’s data, we can include the educational aspects of migrant children
and the second generation.
Kasinitz and his team investigated how children of immigrants in New York
experience discrimination and found that, in general, native-‐born blacks and West
Indians reported the most discrimination and prejudice, with Latinos as the second
group, followed by Chinese, and finally Russians and Jews. Regarding discrimination
in schools, the authors indicated that Chinese show the highest percentage of
discrimination (25%), followed by South Americans and West Indians (17%), Puerto
Ricans and blacks (15%), Dominicans (14%), Russians and Jews (11%), and finally
native whites (9%). Chinese students report a high percentage of discrimination from
other nonwhite groups, specifically from black and Latino students who tease or bully
them. What Chinese students categorized as discrimination included instances where
non-‐Chinese students copied from their papers at school, and teachers put them
automatically in the advanced (harder) classes just because they are Chinese
(Kasinitz, et. al., 2008).
In these cases, discrimination comes in an unusual form, and not always from
whites; it emanates from a stereotype formed around Chinese and Asian students in
general that presents them as studious and intelligent students, especially skilled in
math. This educational ideology is often referred to as the “model minority” myth and
has been de-‐bunked by showing the tremendous socio-‐economic and cultural
25
diversity among Asians, and accordingly, their widely different experiences with
formal schooling in the U.S. (Chou & Feagin, 2008).
On the other hand, Hispanics and blacks reported discrimination from white
teachers and administrators, who treated them as if they lack intelligence,
demonstrate low levels of expectation for scholastic achievement, and place these
students in non-‐college track classes. The authors report that Dominicans, West
Indians and Puerto Ricans tried to distinguish themselves from African Americans to
avoid discrimination. Some of their distinguishing social practices include dressing
distinctively from their African American peers and avoiding white neighborhoods so
they would not be racially discriminated (Kasinitz et al., 2008).
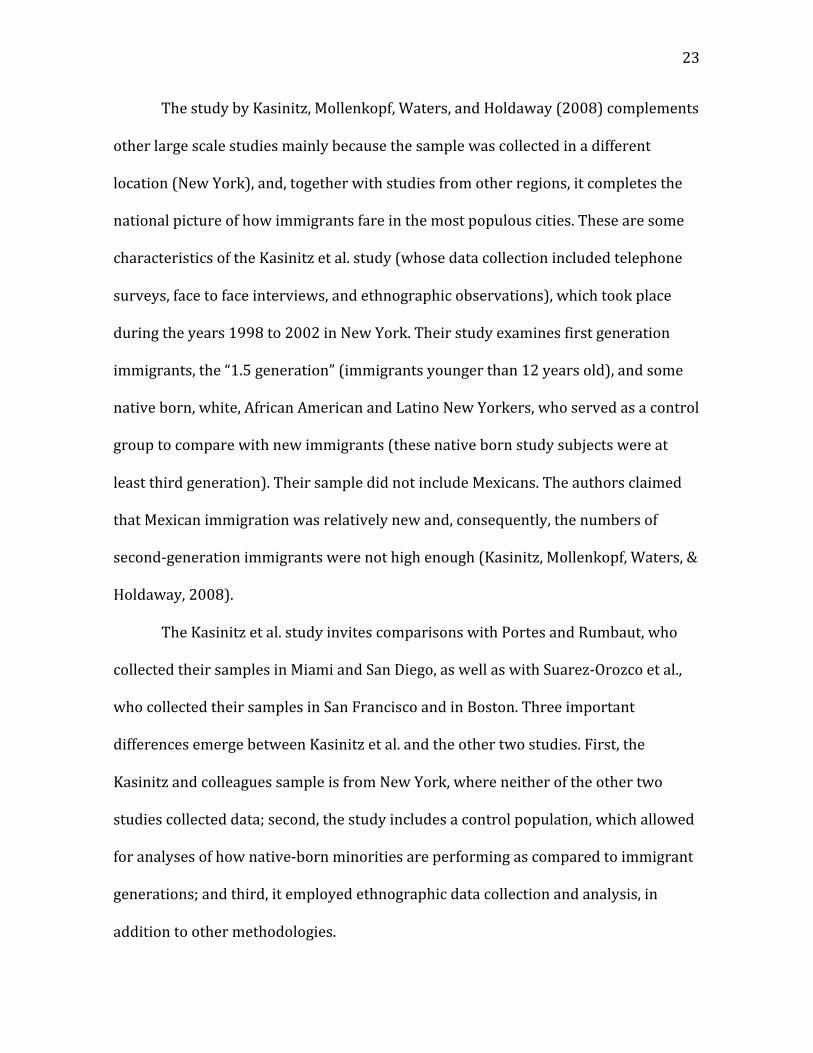
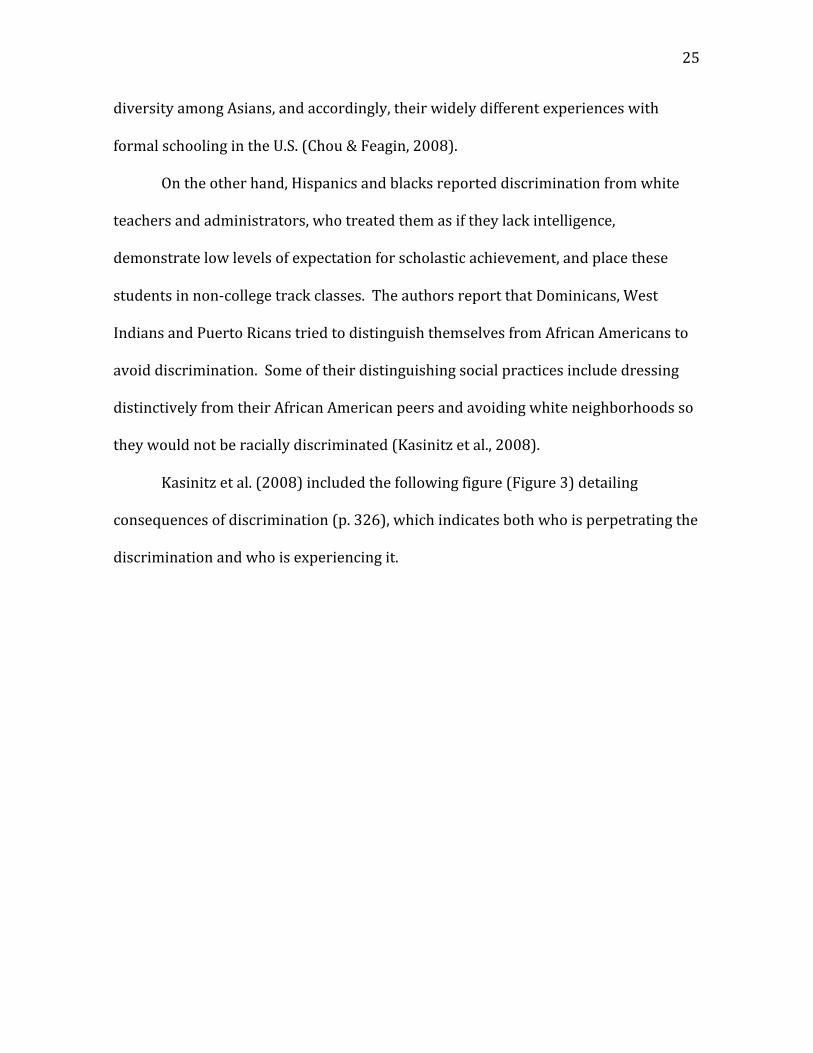
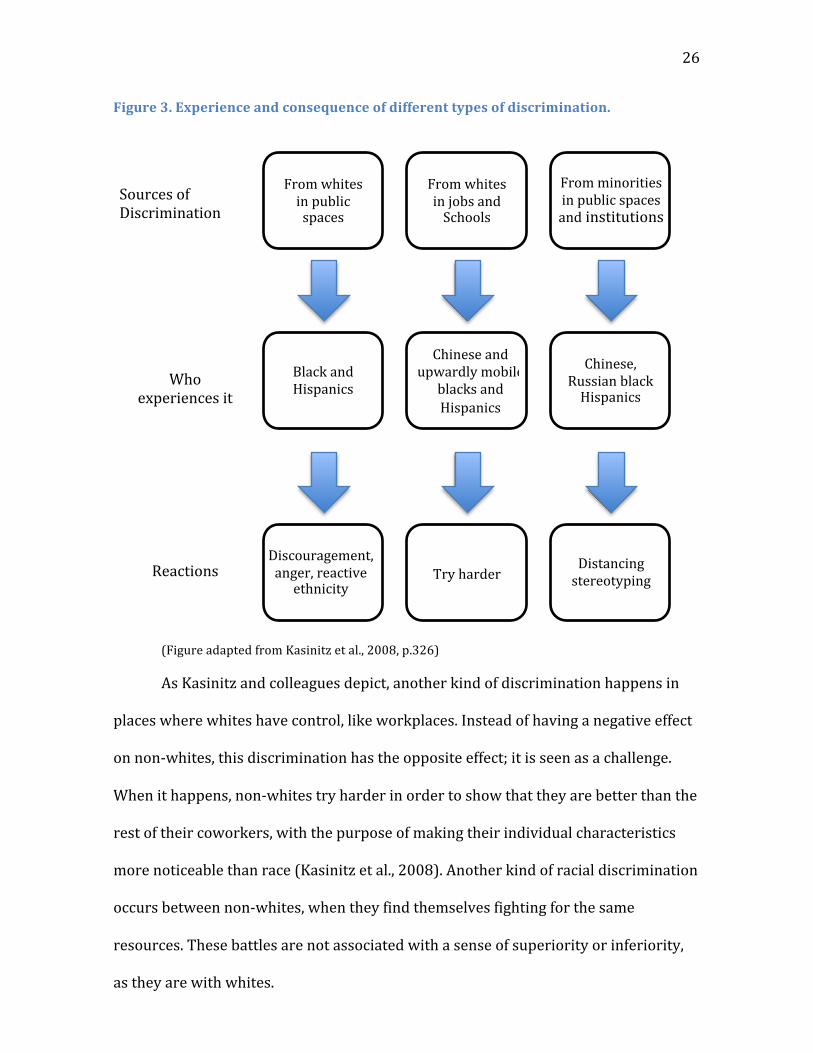
Kasinitz et al. (2008) included the following figure (Figure 3) detailing
consequences of discrimination (p. 326), which indicates both who is perpetrating the
discrimination and who is experiencing it.
26
Figure 3. Experience and consequence of different types of discrimination.
(Figure adapted from Kasinitz et al., 2008, p.326)
As Kasinitz and colleagues depict, another kind of discrimination happens in
places where whites have control, like workplaces. Instead of having a negative effect
on non-‐whites, this discrimination has the opposite effect; it is seen as a challenge.
When it happens, non-‐whites try harder in order to show that they are better than the
rest of their coworkers, with the purpose of making their individual characteristics
more noticeable than race (Kasinitz et al., 2008). Another kind of racial discrimination
occurs between non-‐whites, when they find themselves fighting for the same
resources. These battles are not associated with a sense of superiority or inferiority,
as they are with whites.
!!!Sources!of!Discrimination!!!!!!!!
Who!!experiences!it!
!!!!!!!!
Reactions!
From!whites!in!public!spaces!
From!minorities!in!public!spaces!and!institutions!
From!whites!in!jobs!and!Schools!
Chinese,!Russian!black!Hispanics!
Chinese!and!upwardly!mobile!
blacks!and!Hispanics!
Black!and!Hispanics!
Distancing!!stereotyping!Try!harder!
Discouragement,!anger,!reactive!ethnicity!!
27
One more detail to add to this list of when and how racial discrimination
manifests itself is that for non-‐whites who live in segregated communities, the
pernicious effects of segregation are sometimes mitigated by their lack of exposure to
white people. Non-‐whites in these residential situations will suffer from
discrimination when, as Kasinitz et al. describe, they move up socially so that they
reach the university or a job where they have regular contact with other groups
(Kasinitz et al. 2008). Another kind of discrimination, suffered especially by dark-‐
skinned educated people (African Americans, West Indians, some Dominicans and
some Puerto Ricans), happens when a store worker or police officer, who does not
know anything about the subject except his or her phenotype, treats the subject
poorly, leading to what Portes and Rumbaut call “reactive ethnicity” (Kasinitz et al.,
2008, p. 330). “Reactive ethnicity is the product of confrontation with an adverse
native mainstream and the rise of defensive identities and solidarities to counter it”
(Portes & Rumbaut, 2001, p. 284).
Portes and Rumbaut claim that at the group level, the reactive formation of a
group identity is often advantageous because it helps groups to defend their interests.
On the other hand, at the individual level, this kind of resistant identity could cause
adversarial opposition against public institutions; in the case of youth or children this
adversarial positioning takes place in schools. Looking at the same situation with a
different lens (from anthropology), what Portes and Rumbaut call reactive ethnicity
could be considered “agency,” which means “the socioculturally mediated capacity to
act” (Ahearn, 2001, p. 112). Let us consider an example:
They (youth) perceive the school’s ideology of promoting ‘well-‐mannered’
behavior as the ticket to success contradicting the rogue qualities of their
28
tough, working class backgrounds. Their agency in their face of such
institutional grooming focuses on resistance by engaging in a counter-‐school
culture of buffoonery and disruption in the classroom. (Cammarota, 2008, p. 4)
There are several similarities between the two concepts, from different points
of view, but with the same result in both cases.
As we can see from this and other previously presented examples,
discrimination will happen sooner or later for non-‐whites; if they live in a segregated
community, it will happen for those who move up socially when they reach higher
education or the workforce. For non-‐whites who live in a mixed community, it will
occur earlier in schools or in their neighborhoods.
Discrimination in schools where they were forcibly integrated with whites is
mostly suffered by middle class black and Hispanic students; other non-‐white groups
live in segregated areas where schools, workplaces and neighborhoods function
almost entirely without contact with whites (Kasinitz et al., 2008). On the other hand,
affirmative action programs create opportunities for non-‐whites; certain scholarships
and schools diversity programs seek to attract and serve non-‐white students (Kasinitz
et al. 2008).
Several researchers have published studies using the CILS database; the
following section comprises a brief, select review. Among those studies to be
reviewed are a few whose approach influenced the creation of variables to analyze the
Southwest sample.
The Rumbaut (1994) article, called “The crucible within: Ethnic identity, self-‐
esteem, and segmented assimilation among the children of immigrants” uses only the
first survey from the CILS database. In this paper, Rumbaut focused on the
29
psychosocial adaptation of children of immigrants; he concluded that there are
different ways to adapt to U.S. culture, not only one “assimilation path.” Regarding
children’s ethnicities, Rumbaut identified different patterns of self-‐identification.
Some participants identified by national origin (27%), while others, 40%, chose a
hyphenated American identity, still others, 11%, self-‐identified as unhyphenated
American, and 21% chose a racial or pan-‐ethnic option (Rumbaut 1994).
Another important finding from Rumbaut is that children who have been
discriminated against are less likely to identify as American. Children in schools with
high percentages of ethnic or racial minorities were most likely to identify with those
identities, like Chicano or Black, instead of a national origin term, like Mexican or
Jamaican (Rumbaut 1994). This paper included a table with a description of the
survey items used to create some of the variables and scales in the study. I used this
table as a guide to replicate certain variables further outlined in Chapter 3. Rumbaut’s
paper used logistic regressions, and least squares multiple regressions to conduct his
analysis.
Pedro Portes (1999) also used the CILS dataset in a paper titled “Social and
psychological factors in the academic achievement of children of immigrants: A
cultural history puzzle.” The Portes paper employed several of the variables created
by the Rumbaut paper (1994) for its analysis; in it, Portes explores the interaction
between different predictors of school achievement with factors related to cultural
adaptation. Portes only drew from the first CILS survey for this publication. He
measured academic achievement using the average of math and reading standardized
scores. The author used factor analysis to create scales that were used in regressions.
Additionally, the various racial demographics in the sample were entered into the
30
model as a categorical variable. The analyses revealed that each ethnic category was
significantly related to the academic outcomes. However, when adding an additional
block of variables into the regression model, the influence of socioeconomic status
(SES), English language proficiency, and psychosocial factors masked the effect of
ethnicity in school achievement. The effect of private and inner-‐city school appears
relevant to success in school but the author indicates that it needs further research to
explain how. Children’s perceived discrimination has a negative association with
school success. The variables achievement motivation, familism, and time
management have a positive effect on academic achievement.
Another paper that used the CILS database is the one written by Portes and
Hao (1998). The authors found that the languages these families brought to the Unites
States had not been preserved by their children. There was a negative relationship
between retention of parents’ foreign language and length of U.S. residency. Factors
influencing bilingualism were found to be non-‐English language spoken at home,
parents who spoke that language, and friends of the same national origin. Bilingual
students in the sample had a strong advantage in academic achievement, in
comparison with monolingual students, after controlling for other predictors such us
sex, age, SES, both parents speaking the same language, co-‐resident kin, and co-‐ethnic
friends. There is an advantage for Latino students as compared to Asian students,
regarding foreign language maintenance. Since Latino students share the same
language (Spanish) and the Asian students do not, it is harder for Asian students to
maintain their foreign languages, and they are prone to abandon their parents’
languages. Also, the support of media such as TV channels, radio stations, and
newspapers in Spanish create a climate that helps preserve the language.
31
A paper by Portes and Macleod (1996) investigated self-‐identification of
children using the CILS database. They found that such self-‐identification is influenced
by how acculturated students are. By acculturation, they mean length of time living in
the U.S., if students are U.S. citizens, greater knowledge and use of English, and lesser
knowledge of a foreign language. Also, the more acculturated the students were, the
lower their identification with the term Hispanic. Children who identified as Hispanic
reported greater discrimination than those who identified as American (with or
without hyphenation). In addition, they reported lower college expectations and
lower self-‐esteem. Another finding of this paper was that boys were one and a half
times less likely to plan for a graduate degree. Perceptions of discrimination signal a
greater disadvantage in self-‐identity for the Hispanic-‐identified. The Hispanic identity
is not related with a profile that indicates a positive adaptation, but with one that has
several disadvantages, like lower aspirations and lower self-‐esteem.
I have summarized some of the theories about and studies that have been
conducted with immigrant children and children of immigrants and their various
pathways though adaptation to the U.S. culture. Let us now explore the conceptual
framework for the present study.
2.2 Conceptual Framework
To date, U.S. based researchers have not replicated the Portes and Rumbaut
(2001) study; although there are several analyses, critiques (Waters, Tran, Kasinitz, &
Mollenkopf, 2010) and secondary data analyses (Portes, 1999). None of these
scholars, however, have used Portes and Rumbaut’s survey to conduct a similar study,
save Portes himself, who conducted a similar study with school-‐aged children of
immigrants in Spain (Portes, Aparicio, Haller, & Vickstrom, 2010). The particularity
32
and uniqueness of the Southwest location adds an extra element of interest to the
present study. This border town, with a rich Mexican tradition and culture, provides
an ideal place to study how Mexican and Mexican American youth navigate public
schools.
The segmented assimilation model offers an alternative to the traditional and
linear assimilation models created by the Chicago school, exemplified by Gordon
(1964) in the 1940s. The assimilation model proposed by the Chicago school at the
beginning of the last century, and Gordon in the 1960s, considers assimilation a
process whereby immigrants incorporate into the U.S. Caucasian middle class.
Proponents of this model also believe that, while assimilating, new immigrants lose
their culture, and posit that the total assimilation process lasts three generations.
The segmented assimilation model offers three possible paths for immigrants
as they experience the assimilation process. These are: selective acculturation,
consonant acculturation, and dissonant acculturation. These assimilation processes
are differentiated by the amount of home language lost, the amount of second
language learned, the amount of home culture lost, and new culture acquired (for
further explanation of the segmented assimilation model see the theoretical
framework section). Although these three possible options offer more analytical
flexibility than the single one proposed by the classic assimilation model (with
Gordon as one of its representatives), there is still considerable room for revising the
models proposed to study the dynamics and changing phenomena of cultural
negotiation.
Some critiques of the segmented assimilation model have been put forth by
Hans Vermeulen (2010), Waldinger and Feliciano (2004), and Waters, Tran, Kasinitz,
33
and Mollenkopf (2010). Waldinger and Feliciano (2004), for instance, state that
Portes and Rumbaut claim that immigrants or children of immigrants who have
exposure to local native minorities (e.g., African Americans) will be affected by
learning “bad habits.” This is not possible to probe in the Portes and Rumbaut study
because their sample only includes first and second generation immigrants, not a non-‐
migrant local minority sample. As Waldinger and Feliciano indicate, not all scholars
agree with this assertion, which is reminiscent of Ogbu’s (1978) claim of differences
between immigrants versus caste-‐like minorities. Stepick and Stepick (2010), in their
article about segmented assimilation, indicate two drawbacks of this argument; first
that this is a reminiscent of Oscar Lewis’s concept of “culture of poverty,” which has
been discredited, and second, that this argument is a direct extension of Ogbu’s idea of
native minorities acquiring oppositional attitudes toward mainstream society that
specifically place a low value on school achievement.
Kasinitz, Mollenkoff, and Waters (2004), in Becoming New Yorkers, a study
conducted in New York with a sample self-‐identified as non-‐immigrant as well as first
and second generation immigrants, concluded that the three options offered by the
segmented assimilation model (dissonant, consonant and selective acculturation) do
not capture the diversity of experiences of second generation immigrants in that city.
This critique invites a response, using the data collected from the Southwest sample,
to determine whether this population performs similarly or differently.
Foner and Kasinitz (2007) mention, when referring to social mobility, that
even though second generation students are performing at lower levels than whites,
they are still doing better than their parents, not supporting the prediction of
downward mobility proposed by the dissonant acculturation model (at least in the
34
case of educational attainment, if not job level). Though Foner and Kasinitz did not
specifically address children of Mexican immigrants in their study, they claim the
pattern they found also holds for second generation Mexican American students, a
population which is often studied because of its large size (the largest immigrant
population in the U.S.) and low educational and occupational attainment.
The use of the terms acculturation and assimilation also requires some
explanation. Both of these terms, as found in the segmented assimilation model, refer
to culture and how people negotiate, integrate or react to the culture of the receiving
society. Creating a theory where culture is involved cannot be done easily on a large
scale. What works for one group of people might not work for another, or it might not
work for the same group of people in a different environment (e.g. in schools vs. at
home vs. at work), or across time and space. Culture is a term that is too broad and
too dynamic to be limited, in this case by Portes and Rumbaut’s segmented
assimilation model. Culture fluctuates and changes constantly. As Gonzalez and
colleagues explain: “Culture had expanded into realms that posited individuals not as
‘cultural dopes’ doomed to endlessly reproduce a static and unyielding culture, but as
manipulating and tinkering with cultural elements…” (Gonzalez , Moll & Amanti, 2005,
p.36).
The Southwest sample of the present study allows us to compare a partial
(only from the first survey) but similar sample to Portes and Rumbaut’s original
sample to see if immigrants and children of immigrants (especially Mexican
Americans) are performing in schools similarly to or differently from those in the
Portes study but in a new location. Another factor that is compared is how this more
recent cohort of children of immigrants and migrants are doing in schools, more than
35
10 years after the original sample. Also, since the Southwest sample used the same
questionnaire that Portes and Rumbaut used in their study, this congruence permitted
me to compare and test directly their models of assimilation, which has not been
tested directly in other cities with a similar sample or using the same instrument.
After comparing the different samples I propose possible explanations of why the
resulting data are similar or different. First, however, I will situate the town and
population historically.
There are also significant differences, in conceptions and representations of
immigrant youth acculturation and connections with academic achievement, between
sociological scholarship, like the CILS study, and post-‐2000 anthropological
scholarship. Investigating the nature of these differences can help us develop a better
perspective on the results of the present study, and to offer the possibility that other
models or approaches might to a better job of explaining the academic achievement of
immigrant children. For example, sociologists and anthropologists, broadly speaking,
often manifest differences in approach when exploring the concept of youth
resources. While the CILS presents a fixed menu of linguistic, familial, and other
resources (in the form of lists and scales related to parental occupation, familial
origin, linguistic skills, etc.), some anthropologists have studied use patterns of these
resources, with an eye to growing capacity among immigrant youth by helping them
name and recognize their own beneficial resource use patterns (Stanton-‐Salazar &
Spina, 2003).
In Stanton-‐Salazar and Spina’s study, analyzed data collected in 1991-‐1992,
the authors present an ecological context in which Latina/o youth are sometimes able
to act as their own advocates, agents, and mentors (2003, p.231) It is a dynamic
36
picture, where flux and change are assumed norms, and where academic achievement
in secondary school is not an endpoint, but a beginning (p. 236). The students in this
study speak about people and relationships that helped them feel they could “make
it,” and the authors provide evidence that these students encompass, in this vision,
emotional survival, development and growth of world-‐view, a sense of belonging and
purpose in school and in their neighborhoods, and the ability to make various
financial and supportive contributions to their families (p. 231). While the authors
collected some similar data elements to those mined in the CILS, such as achievement,
length of time in the U.S., and gender (p. 236), Stanton-‐Salazar & Spina employed a
critical ethnographic lens through which to analyze the results (p. 237).
Their recommendations involve finding ways to strengthen the resource
networks of Latino/a youth in the San Diego area, which places faith in the ability of
these relationships to achieve the kind of self-‐actualization and cultural fluency often
associated with acculturation. While the authors do not visually represent their
findings in the form of a model, they do argue persuasively for a more widely
distributed and dynamic picture of immigrant youth capabilities, which can translate
into increased academic achievement for the children of immigrants, as well as
improvements in a host of other life quality indicators.
More recently, scholars have begun to turn their focus to youth who challenge
inequities in their schooling, and in doing so embark on a journey of transformation,
often resulting in improved academic achievement, development of leadership skills,
and a sense of confidence that helps them negotiate their own multi-‐dimensional
cultural identities. These models may not explicitly name acculturation as either a
background or foreground element, but the goals of self-‐actualization and change in
37
the material conditions of students’ lives involve cultural identity at multiple times
and on multiple levels. The changes that these students undergo can be viewed as
acculturation, but that result would be viewed as a possible by-‐product of leadership
development and improved academic outcomes, rather than a necessary precursor to,
or companion of, those results.
For example, Cammarota & Romero’s (2006) model of “critically
compassionate intellectualism” which includes three pillars: “critical pedagogy,
authentic caring, and a social justice-‐centered curriculum” (p. 16). The authors
propose this model as an intervention in schools, to interrupt teaching that they
characterize as dangerous for Latina/o students, as well as for students in general. For
Cammarota & Romero, to improve the academic achievement of children, the quality
of curriculum and pedagogy must change significantly. In this model, students’
cultural identity is never entirely independent of considerations of power and social
placement (p 17). Indeed, as they ask, what is the use of emerging or advanced
bilingual skills, if students do not have the pedagogical space in which to express their
voices at all (p. 16)?
The educators using this model open new possibilities for academic
achievement by children of immigrants by challenging the academic engagement of
children of immigrants. In a bold and unusual move, the educators using this model
adopt a meta-‐educational stance, encouraging Latina/o and other students to
consider the school itself, and its educational superstructure, as the object of their
inquiries (Cabrera, et al., p. 1091, 2014). Statistical analysis reveals that there is a
“strong” relationship between participation in courses taught using Critically
Compassionate Intellectualism and student achievement (p. 1106).
38
This is a model in which naming and identification play a key role in student
learning, and in students’ powers to influence the present and future context of that
learning (Cammarota & Romero, 2006). Critically compassionate intellectualism, like
Stanton-‐Salazar & Spina’s youth mentoring approach, nests academic achievement of
immigrant children in a context of school and community relationships. In addition,
they both share an emphasis on the value and utility of Latino/a students’ own
resources, both as individuals and as members of communities.
This brief exploration of a wide and rich spectrum of models of and
approaches to immigrant youth academic achievement shows that there are multiple
ways that researchers and educators can enhance student achievement, if they are
willing to learn about the lived experiences of immigrant youth and their families. It
would be a mistake to say that one factor, or cluster of factors, explain academic
achievement better than all others. It would effectively narrow the field in favor of
one model, with the danger that policy leaders who are novices to educational
research, looking for generalizable results, might be tempted to be replicate such a
model in schools across the country. For a multitude of reasons, then, it is necessary
to recognize that place and context matter in the explanation of academic
achievement among immigrant children, and that even competing models have
important contributions to make to our collective understanding of student
achievement.
2.3 Brief history of Mexican and Mexican Americans in the southwest and description of the town were the survey was administered.
An important factor that has to be acknowledged and included in scholarly
discussions of Mexican migration and Mexican Americans in the U.S. is history. Let us
39
now trace how Southwestern historical features, in particular, the case of Mexicans
and Mexican Americans. The southwest, less than two hundred years ago, belonged to
Mexico, and the residents of this area at some point became U.S. citizens by
annexation. We might benefit from a look at the historical snapshot Carlos Velez-‐
Ibañez (1996) offers, wherein the process of colonization began with commerce, even
before the annexation of Mexican territory to the United States. In pre-‐annexation
Mexico, Americans were granted a similar political status to Mexican citizens, as long
as they paid taxes. Also, to participate in the colonization of California and Texas, the
Mexican government only required foreigners to be Catholic and pay residency and
land ownership taxes. Another factor that made this process easy for American
citizens was the intermarriage of Mexican landowner elites with American traders
and merchants.
After annexation, in contrast, U.S. government practices of mistreating and
degrading Mexicans (practices which had begun prior to territorial acquisition)
continued. These practices included paying lower wages to Mexican nationals for
similar jobs, and prohibition of Spanish at work, inspired by laws that disallow hiring
of mining and machinery operation workers who did not speak English (Velez-‐Ibañez
1996). Some of these inequitable labor practices continue today.
In order to get a better idea of the town where the Southwest sample was
collected, we can use U.S. Census data to illustrate how the population looks today.
According to U.S. census data, the estimated population in 2013 was a little more than
half a million, 526,116 (US. Census, Quick Facts, 2013). The median household income
in the same year was $ 35,720. The race distribution for the same year was 45%
white and 42.3% Hispanic, 4.9% African American, 3% Asian and 2% Native
40
American. Regarding educational attainment for those older than twenty-‐five years
old; 16.4% have no diploma, 23.7% have graduated from high school, 34.6% have an
associate’s degree or some college but not a degree, 15% have a bachelor’s degree,
and 10.2% have a graduate or professional degree.
To give us a better idea of what these numbers mean, we can compare them
with the numbers from the whole country. In 2013, there were 316,128, 839
habitants in the U. S. The racial distribution was 77.7% White, 17.1 % Hispanic or
Latino, 13.2 African American, 5.3 Asian, and .2% were Native American (U.S. census).
The town where the southwest sample was collected has a higher Hispanic or Latino
representation and a lower representation of African Americans and Whites.
The median household income for the whole country was $53,046, a third
more than the one from our sample. The educational attainment category shows that
11.8% have no diploma, 29.8% have graduated from high school, 30% have an
associate’s degree or some college but not a degree, 20% have a bachelor’s degree and
11.4% have a graduate or professional degree(U.S. census). The whole country has a
more educated population, especially a higher number of bachelor’s degrees and a
lower number of people with no diploma. The percentage of people with a graduate or
professional degree is comparable with the town where the Southwest sample was
collected.
In summary, the town where the Southwest sample was collected has a lower
median household income, higher Hispanic or Latino representation, lower White and
African American population, and lower levels of formal education.
41
2.4 Data collection and school description I collected data in the Cactus School District (pseudonym) in a Southwest city.
It was collected in the school year 2006/2007 with students participating in a
freshman class (first year English and Physical Education) in two high schools, since
these two courses were mandatory for freshman. The rationale behind this selection
strategy was to capture as many ninth graders as possible so as to mimic the study
population selected by Portes and Rumbaut (2001). The school district was chosen
for its high concentration of Mexican American students (88% among the high schools
sampled in this study). In order to obtain access to the students, I began by asking
permission from the school district.
With permission in hand, I proceeded to talk with the school principals, to
obtain their permission as well as to coordinate when would be the best time to
administer the survey. Finally the school principals put me in contact with one
teacher or school advisor to coordinate times and days to collect the consent forms
and administer the surveys. This process took close to one year. In one school the
conversations started in the middle of the fall semester and I was finally able to talk
with the students and administer the survey in April, after the school had already
given the state standardized test. Overall the experience of arranging the research
was instructive in terms of showing me how many levels of coordination and
permission (university, district, principal, teacher, student, and parent) were
necessary to launch such a data collection project.
In the following table, we can observe the population distribution by race and
gender at the two schools in the year that the survey was administered. It shows us
that the great majority of the students are Hispanic. Additionally, both high schools in

42
the sample were under pressure to raise academic standards as one had failed to meet
adequate yearly progress (AYP) for two consecutive years based on the Federal No
Child Left Behind Act standards and the other had not met AYP for the three years
prior to survey administration. Nowadays, the student percentages of race/ethnicity
are still similar to when the survey was administered.
Table 1. Percentage of students by race/ethnicity.
Male Female
American Indian/ Alaska native
Asian or Asian/Pacific islander
Hispanic students
African American White
School A 52% 48% 5% 1% 81% 3% 10% School B 74% 47% 3% 1% 92% 2% 3% Data Source: U.S. Department of Education, National Center for Education Statistics, Common Core of Data (CCD), "Public Elementary/Secondary School Universe Survey", 2006-‐07 v.1c, 2011-‐12 v.1a.
43
CHAPTER 3: METHODS
This chapter will detail the statistical procedures used in this study. First, I will
present again the research questions, which will guide the analysis, and frame the rest
of the chapter. Next, I will discuss the three databases that were used in this study.
Then I will detail the variables employed and created to answer the research
questions. Later I will describe the data analysis, how the data were cleaned, and
explain the operations I used to study the databases. Finally I will outline the
limitations that this study presents.
3.1 Research questions
The purpose of this dissertation was to investigate whether the segmented
assimilation model proposed by Portes and Rumbaut (2001) is applicable to another
sample of students. Specifically, I examined the relationship between language
preference, identity, self-‐esteem and psycho-‐social factors and school achievement in
ninth grade students by replicating the Portes and Rumbaut study with a new sample.
This study aims to understand the educational performance and aspirations of
Mexican and Mexican American youth as well as their perceived treatment by school
personnel, peers, and the community at large, and the effect that these perceptions
have on their academic achievement.
These research questions guided the study,
• What are the influences of non-‐English language maintenance and
bilingualism on academic achievement?
• Which psycho-‐social factors affect the academic achievement of students in
the Southwest sample?
44
• Do the assimilation models (dissonant, consonant, or segmented
assimilation) proposed by Portes and Rumbaut (2001) explain the
acculturation of children of immigrants in the Southwest sample as well as
they do in the CILS sample?
3.2 Data
I will compare two data sets containing samples collected in three U.S. cities.
Two samples come from the Children of Immigrants Longitudinal Study (CILS),
conducted with second-‐generation students by Portes and Rumbaut in San Diego,
California, and Miami/ Ft. Lauderdale, Florida, during 1992-‐1993. The first sample
comprises the entire CILS database. The second sample is a subset of the CILS
database; this subsample is composed of the students that identify themselves as
Mexican and Mexican American in the city of San Diego. The third sample, which is not
part of the CILS database, is from a city in the Southwest, and was collected by this
researcher in the school year 2006-‐2007. The participants were ninth grade students
attending high school in one of the highest minority population school districts in the
Southwest with more than 80% of minority students enrolled (U.S. Department of
Education 2006). The purpose of the second sample, referred to as San Diego for the
purpose of this manuscript, is to provide a group with similar characteristics to the
Southwest database for comparative analysis. It was believed that comparing the
Southwest and San Diego samples would test the Portes model better because the
samples are similar. Portes and Rumbaut’s longitudinal study described the
adaptation processes of second-‐generation immigrants. The study surveyed children
and parents on different occasions through the duration of the study. However, for the
purpose of this study, I only used the data from the first CILS survey administered to
45
the children. This initial survey gathered baseline information on immigrant families,
and their children’s demographic characteristics, language preference, self-‐esteem,
identity, academic achievement, and other psychosocial factors.
The first CILS survey, titled the Youth Adaptation and Growth Questionnaire,
contained 122 questions. Most of the questions require choosing between multiple-‐
choice responses, though some are write-‐in. The questions address diverse topics,
including family and children’s demographic information, parental level of education
and workplace, language knowledge and languages spoken at home and at school.
Identity, self-‐esteem and academic attainment are also considered, among
other factors. The CILS survey data instrument was obtained from the website of the
Children of Immigrants Longitudinal Study. It is free and available to download at
http://www.princeton.edu/cmd/data/cils-‐1/
Since the original CILS survey did not include questions that allow researchers
to determine which respondents, if any, were third-‐generation, I modified the survey
by adding questions related to the origin of the respondent’s grandparents. These
questions were:
Referring to the father:
1. In what country was your father’s father born?
a. United States. b. Other country. Name: ___ c. Don’t know
2. In what country was your father’s mother born?
a. United States. b. Other country. Name: ____ c. Don’t know
Referring to the mother:
1. In what country was your mother’s father born?
a. United States. b. Other country. Name: ___ c. Don’t know
46
2. In what country was your mother’s mother born?
a. United States. b. Other country. Name: ___ c. Don’t know
The revised survey was administered at two high schools in one school district.
The average time needed to complete the survey was between 40 and 50 minutes.
Most of the participants, 93%, were first year high school students.
3.3 Regression analysis.
To conduct the analysis of data, I used multiple linear regressions “a statistical
technique, for estimating the relationship between a continuous dependent variable
and two or more continuous or discrete independent variables” (Knoke, Bohrnstedt &
Mee, 2002, p. 235). This multivariate statistical technique allowed me to analyze the
relationship between a single dependent variable, in this case G.P.A., and multiple
independent variables. Regression analyses also allowed me to identify the strength
of the relationship between the independent and dependent variables, in addition to
the direction of the relationship between the dependent variable and each of the
independent variables (negative or positive). Finally, it helped me to examine the
unique contribution of each variable to each model (Allison, 1999).
Portes and Rumbaut also used regression for their analyses, and because I am
comparing their data with the Southwest data, regression analyses allows me to
compare the relationship of the independent variables to the dependent variables
both within and across samples.
The variables chosen for use in the different regression models, and the order
in which they were added, were intentionally selected due to their relationship with
academic outcomes as identified by previous research in the field discussed in
Chapter Two. Regarding the inputting of the variables into the regression model,
47
there is a logic and order that the variables were entered into the regression. They
were entered in this way so that I could better understand how adding these variables
contributed to explaining the variation in students’ academic outcomes (as measured
by their G.P.A.).
3.4 Variables
In order to have a better understanding of the variables used in this study, the
following section contains a description of the variables employed in the regression
analyses. The variables used and created in other studies include:
GPA. The dependent variable is Grade Point Average (GPA). The information
for this variable was obtained from the school district, with informed consent forms
from both the participant and his /her guardian.
For the CILS and the San Diego sample, the GPA ranges from 0 to 5, so in order
to have a similar GPA between databases, I modified the GPA in the Southwest
database to match the 5.0 scale from the CILS and the San Diego databases. I used the
following formula:
Adjusted_GPA= (GPA X 5) / 4.25
Male. The variable “male” is a dummy variable created from the survey item
that asked for the sex of the participant. I coded male as 1 and female as 0.
Educational Expectations. The variable ‘educational expectation’ captures
the higher level of education participants anticipate obtaining in their future, and is an
ordinal variable that ascends from ‘less than high school,’ with a value of 1, ‘finish high
school’ with 2, ‘finish some college’ with 3, ‘finish college’ with 4 and ‘finished a
graduate degree,’ with a value of 5. The survey item is: And realistically speaking,
what is the highest level of education that you think you will get?

48
Length of residency in the U.S. The variable ‘length of residency in the U.S.’
goes from less than five years, with a value of 1, to ‘all their lives,’ with a value of 4.
This item was reverse coded; they were in descending order from 1, ‘all my life,’ 2, ‘ten
years or more,’ 3, ‘five to nine years,’ and 4, ‘less than five years.’ I reversed the value
of the original code to stay consistent with all the rest of the variables whose answers
go in ascending order, from less to more.
Household guardians parents. The variable ‘household guardians parents’ is
a dummy variable that indicates children who live with both their biological or
adoptive father and mother. It was taken from a multiple answer question. The
question was “which of the following best describes your present situation?” There
were eight possible answers:
1 I live with my (biological or adoptive) father and mother
2 I live with my father and stepmother (or other female adult)
3 I live with my mother and stepfather (or other male adult)
4 I live with my father alone
5 I live with my mother alone
6 I alternate living with my father and mother who are divorced or separated
7 I live with another adult guardian
8 Other, please explain
Only responses of #1 living with both father and mother were coded as 1, all
other responses were coded as 0. This was coding was done to capture what Portes
and Rumbaut call “intact families” (2001); such families are distinct from the other
combinations because as Portes mentions intact families have “access to greater
economic and greater adult attention and guidance” (Portes 2001, p.64)
49
Parental level of education. The variable ‘parental level of education’ is a
composed variable of two ordinal variables: father’s highest level of education, and
mother’s highest level of education. The options to answer these questions are
identical. They are:
1Elementary school or less, 2 Middle school graduate or less, 3 Some high
school, 4 High school graduate, 5 Some college or university, 6 College graduate or
more, and 7 Other. To create the variable parental level of education I added the two
variables and divided by two. I did not receive any answers in the category Other (7)
so I did not have to remove it from the calculation. The score of the new variable
ranged from one to six. A higher score on the variable parental level of education
indicated a higher parental educational level.
Since the databases have some cases where the children had been raised by
one parent only, I also consider and accepted those cases were the child had only one
parent and not both by taking the score of that parent instead of not using that case.
Parent-‐child conflict. For the variable called ‘parent-‐child conflict,’ the
original question was “How often do you get in trouble because your way of doing
things is different from that of your parents?” The answers are on a scale: ‘all the
time,’ with a score of 1, ‘most of the time,’ 2, ‘sometimes,’ 3, and ‘never,’ with a score of
4. To maintain consistency with the rest of the variables that go from less to more, I
reverse coded the answers on this question to make the scale start with “never” (1)
and finish with “all the time” (4).
Self-‐Esteem. The variable ‘Self-‐Esteem’ is being created using the following 10
questions from the survey:
I feel that I am a person of worth, at least on an equal basis with others. I feel that I have a number of good qualities.
50
All in all, I am inclined to feel that I am a failure. I am able to do things as well as most other people. I feel I do not have much to be proud of. I take a positive attitude toward myself.
On the whole, I am satisfied with myself. I certainly feel useless at times. At times I think I am no good at all.
The answers for these questions were: Agree a lot (1), agree a little (2),
disagree a little (3), disagree a lot (4). To create the self-‐esteem variable I added all
these previously mentioned 10 questions and divided by 10. The answers to the
question 1, 2, 4, 6, and 7 were reversed in order to have all the answers in the same
order going from negative to positive or from less to more. The answer “disagree a
lot” was coded as 1 and the answer “agree a lot” was coded as 4. The coefficient on
this variable should be understood as higher the more self-‐esteem that the child has.
This variable was created using the validated Rosenberg Self-‐Esteem Scale 1965, 1979
(Rosenberg 1979, Rumbaut 1994).
Depression. The variable ‘depression’ is another compound variable that was
created using the following 4 questions:
I feel sad. I could not get “going”.
I did not feel like eating; my appetite was poor. I feel depressed.
The possible answers for these questions were: Rarely, some of the time,
occasionally, and most of the time. Similarly to the situation in the previous questions,
the answers were from 1 to 4. This time it was also necessary to change the order of
all of the answers. The score from the depression variable should be read as, the
higher the number, the happier the student is. I added all the answers and divided by
four. This variable was created with a four item validated subscale from the Center for
Epidemiological Studies –Depression (Rumbaut 1994)
51
Time management. The variable ‘time management’ is a variable composed of
two variables, hours spent daily on homework, divided by hours spent watching
television (Portes 1999). The higher the score the more time that children spend
doing homework.
Familism scale. The ‘familism scale’ variable consists of 3
questions/statements that students have to indicate their agreement:
If someone has the chance to help a person get a job, it is always better to choose a relative rather than a friend. When someone has a serious problem, only relatives can help. When looking for a job a person should find a job near his/her parents even if it means losing a better job somewhere else.
The answer where Agree a lot (4), Agree a little (3), disagree a little (2),
disagree a lot (1). I added the answer and divided by 3 to get a score that means: the
higher the score, the more inclined the children are to choose their family. Low scores
reflect the participant’s preference for individualistic values.
Perceive discrimination. The variable ‘perceive discrimination’ was created
using the following four questions:
There is racial discrimination in economic opportunities in the U.S. There is much conflict between different racial and ethnic groups in the U.S. Non-‐whites have as many opportunities to get ahead economically as whites in the U.S. Americans generally feel superior to foreigners.
The possible answers for these questions are: Agree a lot (4), Agree a little (3),
disagree a little (2), and disagree a lot (1). As in the previous questions, I added all
these questions and divided by four in order to get one score. A high result should be
understood as perceived discrimination, whereas a low score should be understood
as no perceived discrimination at all or almost nothing.
52
Educational aspiration. The variable ‘educational aspiration’ is derived from
a single item. The original question from the survey was: what is the highest level of
education that you would like to achieve. The answer goes in ascending order from
‘less than high school,’ with a value of 1, ‘finish high school’ with 2, ‘finish some
college’ with 3, ‘finish college’ with 4 and ‘finished a graduate degree,’ with a value of
5. This variable might sound similar to the variable called educational expectations.
The difference is that aspirations are looking at students’ desired level of future
performance, while expectations are what children believe most likely to realistically
happen. Expectations form the pillars in which upcoming behavioral options are made
(Portes and Rumbaut 2001).
3.5 Variables created for this study
In addition to replicating the bilingual variable constructed by Portes and
Rumbaut in their study, I included more of the questions related to language from the
survey. I also sought to develop a better and more inclusive bilingual variable. After
reviewing the literature written by Portes and Rumbaut, I was unable to determine all
the components used to calculate their “bilingual” variable in the original study; that
is, all the parts of the variable that they call bilingual in their database. The bilingual
variable was categorical and included the following stages of bilingualism: fluent
bilingual (1), English dominant (2), foreign language dominant (3), and limited
bilingual (4). Of these categories the only one I was able to replicate was “fluent
bilingual”. The description of the rest of the categories, and the explanation of how
they were created, was not specific, and left too much room to make mistakes in
interpreting the definitions.
53
To illustrate, I will offer an example of how many possibilities emerge for
interpreting what ‘English dominant’ means. There are eight questions involved in the
creation of this bilingual variable. Four are for English and four are for second
language or foreign language. The questions are similar for the two languages. The
questions ask ‘how well do you speak, understand, read, and write the language’. The
answers are on a scale that goes from not at all or very little (1), not well (2), to well
(3) and very well (4). Using the questions mentioned before, Portes and Rumbaut
also created an English knowledge index and a foreign language index. They created
these indices by adding and dividing by four the sum of the four questions on English
or the second language, respectively. So they ended up with a score between one and
four for both English plus second language.
Portes and Rumbaut defined “English dominant” as, “children have fluency in
English but a much weaker knowledge of a foreign language” (2001 p. 131). There is
no more detailed explanation of how they created the variable. We worked step by
step to replicate this variable construction.
These are some of the issues and questions that I encountered in trying to
recreate the variable. First, it would be necessary to make a determination of what
“fluency in English” means for the English language knowledge scale that Portes and
Rumbaut created with the four questions regarding English knowledge. Would it be
more than 3.0 on the scale? Remember that the scale goes from one to four. On the
other hand, would “weaker knowledge of foreign language” be less than 2.0 on the
foreign language scale. The act of guessing what is on the scale makes it difficult to
decipher because there is no explanation. The other option would be to use the
variables and assume that if by “fluency in English”, the authors determined that the
54
answers to the four questions regarding the English language had to be answered by
at least a number 3, which means only the participants that answered well (3) or very
well (4). On the foreign language part of the answer “a much weaker knowledge”
might mean an answer of “not well” (2) to all the questions, or perhaps an answer of
“very little” (1). There is a considerable difference between choosing one of the two
possible answers. From this example, one can note that to determine or replicate the
variable that Portes and Rumbaut created for their database, this lack of explanation
leaves too much room for interpretation, and therefore is impossible to replicate.
As a result of this problem, I decided to create a simple ascending scale from
one to four (discussed below), where the more bilingual the person is, the closer to
four the answer would be.
3.5.1 Bilingual Fluency.
The variable called ‘bilingual Fluency’ uses the same questions that Portes and
Rumbaut used to create the variable ‘bilingual.’ The variable does not have four
options, as does the one created by Portes and Rumbaut; rather it is a scale that runs
from one to four. The following are the questions that were used to create this
variable:
1. How well do you speak that language?
2. How well do you understand that language?
3. How well do you read that language?
4. How well do you write that language?
5. How well do you speak English?
6. How well do you understand English?
7. How well do you read English?
55
8. How well do you write English?
The response options for these questions are on a scale of four that goes from
very little (1) to very well (4). To create the bilingual fluency variable I added all these
previously mentioned 8 questions and divided by 8. The higher the number on the
results, the more bilingual the person is. The answer goes from 1.0 to 4.0.
The questions, mentioned before, were used to create the bilingual fluency
variable to make sure that there is a pattern within the data set with these questions.
I ran a factor analysis to confirm that this variables/ questions could be grouped.
In the Southwest database, for the Bilingual Fluency variable, I also ran a factor
analysis, with a Varimax rotation with Kaiser normalization. The results, as well as the
Cronbach’s Alpha for the clusters, can be seen in Table #1.
For the bilingual fluency variable, using the Southwest database in the factor
analysis, the KMO = .809 and all the KMO values for individual items were above .78.
The Bartlett’s test of sphericity x2 (28) = 1374.649, p < .001, indicates that correlation
between items was sufficiently large for a factor analysis. Also I ran an initial analysis
to obtain eigenvalues for each component of the data. Two components have
eigenvalues over Kaiser’s criterion of 1 and in combination explained 80.1 % of the
variance. The Cronbach’s Alpha for the bilingual fluency variable is .715.
For the bilingual fluency variable, using the CILS database, the result of the
Cronbach’s Alpha is .715; in the factor analysis the KMO =. 763 and all the KMO values
for the individual items were above .66 The Bartlett’s test of sphericity x2 (28) =
27700.888, p < .001 indicates that the correlation between items was sufficiently
large for a factor analysis. An initial analysis was run to obtain eigenvalues for each
component of the data. Two components have eigenvalues over Kaiser’s criterion of 1
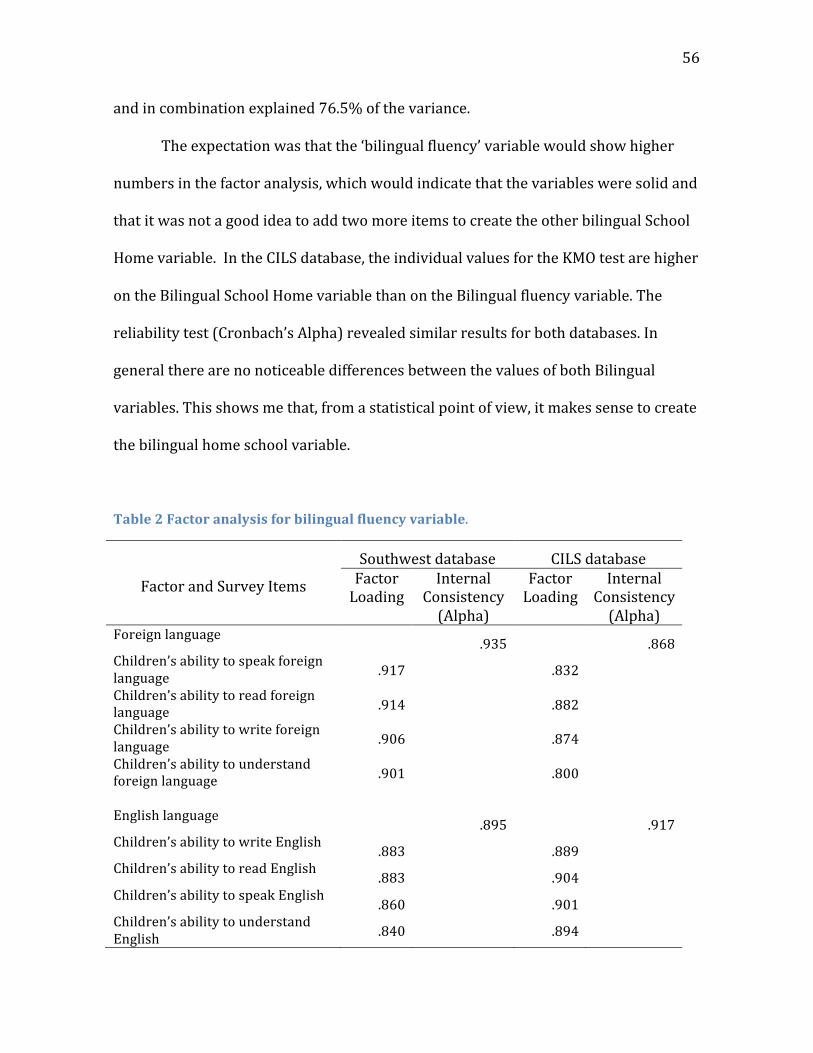
56
and in combination explained 76.5% of the variance.
The expectation was that the ‘bilingual fluency’ variable would show higher
numbers in the factor analysis, which would indicate that the variables were solid and
that it was not a good idea to add two more items to create the other bilingual School
Home variable. In the CILS database, the individual values for the KMO test are higher
on the Bilingual School Home variable than on the Bilingual fluency variable. The
reliability test (Cronbach’s Alpha) revealed similar results for both databases. In
general there are no noticeable differences between the values of both Bilingual
variables. This shows me that, from a statistical point of view, it makes sense to create
the bilingual home school variable.
Table 2 Factor analysis for bilingual fluency variable.
Southwest database CILS database
Factor and Survey Items Factor Loading
Internal Consistency (Alpha)
Factor Loading
Internal Consistency (Alpha)
Foreign language .935 .868 Children’s ability to speak foreign language .917 .832
Children’s ability to read foreign language .914 .882
Children’s ability to write foreign language .906 .874
Children’s ability to understand foreign language
.901 .800
English language .895 .917 Children’s ability to write English .883 .889 Children’s ability to read English .883 .904 Children’s ability to speak English .860 .901 Children’s ability to understand English .840 .894

57
3.5.2 Bilingual Home School.
As mentioned before, this variable uses the eight original questions from
Portes and Rumbaut, plus two more questions related to language, from the same
survey. The questions employed to create the ‘Bilingual School home’ variable are:
1. How well do you speak that language?
2. How well do you understand that language?
3. How well do you read that language?
4. How well do you write that language?
5. How often do you use this language when talking with your school
friends?
6. How often do the people who live in your home use this language when
they are talking to each other?
7. How well do you speak English?
8. How well do you understand English?
9. How well do you read English?
10. How well do you write English?
Even though the variables chosen to create the new Bilingual School Home
variable are related to language, to make sure that the variables correlate with each
other, from a statistical point of view, I ran a factor analysis with a Varimax rotation
and a Kaiser normalization. The Kaiser -‐ Meyer – Olkin (KMO) measure verified the
sampling adequacy for the analysis; KMO = .804, and all the KMO values for individual
items were above .76.
To form an idea of what these numbers mean, it is important to understand
that the acceptable limit for this measure are values above .50 (Ferguson and Cox
58
1997). The Bartlett’s test of sphericity x2 (45) = 1007.187, p < .001, indicates that
correlation between items were sufficiently large for a factor analysis. The results of
the factor analysis are presented bellow (see Table #2). The Cronbach’s Alpha for the
bilingual school home scale is .699 (in the Southwest database); the factor analysis
also showed that the variables were in a cluster, meaning that it would make sense to
group them. An initial analysis was run to obtain eigenvalues for each component of
the data. Two components have eigenvalues over Kaiser’s criterion of 1, and in
combination, they explained 67.5% of the variance. As we can see in Table #2, there
are two clusters generated by the factor analysis, one whose variables are related to
foreign language knowledge, and the other whose variables are related to English
language knowledge. The reliability analysis score of placing the variables related to
English language knowledge with the variables related to foreign language knowledge
together could be higher if the groups remain separate, as they appear in Table #1. To
create the bilingual variable I put together both groups.
For the CILS database the Cronbach’s Alpha score is .699. The factor analysis
(Table #1) shows that the foreign language cluster has two variables that have a
loading of less than .40; it is usually preferred to have values over .40 because they
are substantive values (Stevens 2002). The Kaiser -‐ Meyer – Olkin (KMO) measure
verified the sampling adequacy for the analysis; KMO = .765 and all the KMO values
for individual items were above .74. As mentioned before, the acceptable value for
this measure is over .50 (Ferguson and Cox 1997). The Bartlett’s test of sphericity x2
(45) = 13851.437, p< .001, indicates that correlation between items was sufficiently
large for a factor analysis. An initial analysis was run to obtain eigenvalues for each
component of the data. Two components have eigenvalues over Kaiser’s criterion of 1
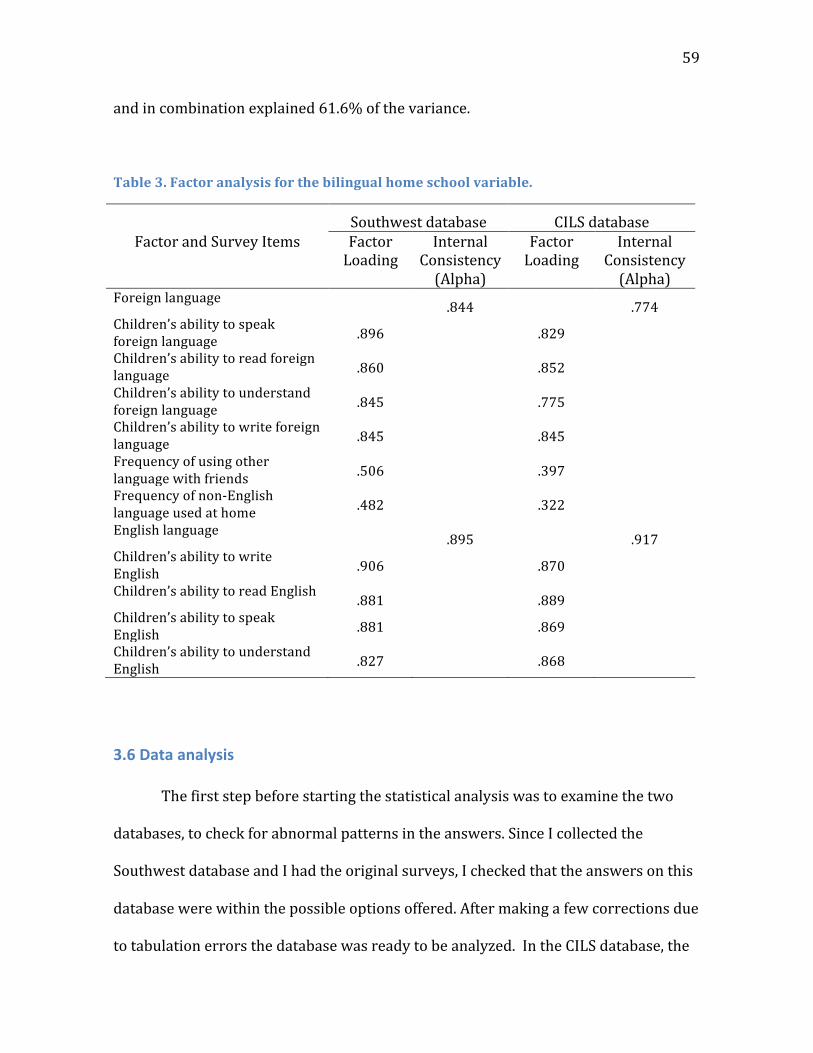
59
and in combination explained 61.6% of the variance.
Table 3. Factor analysis for the bilingual home school variable.
Southwest database CILS database Factor and Survey Items Factor
Loading Internal
Consistency (Alpha)
Factor Loading
Internal Consistency (Alpha)
Foreign language .844 .774 Children’s ability to speak foreign language .896 .829
Children’s ability to read foreign language .860 .852
Children’s ability to understand foreign language .845 .775
Children’s ability to write foreign language .845 .845
Frequency of using other language with friends .506 .397
Frequency of non-‐English language used at home .482 .322
English language .895 .917 Children’s ability to write English .906 .870
Children’s ability to read English .881 .889 Children’s ability to speak English .881 .869
Children’s ability to understand English .827 .868
3.6 Data analysis
The first step before starting the statistical analysis was to examine the two
databases, to check for abnormal patterns in the answers. Since I collected the
Southwest database and I had the original surveys, I checked that the answers on this
database were within the possible options offered. After making a few corrections due
to tabulation errors the database was ready to be analyzed. In the CILS database, the
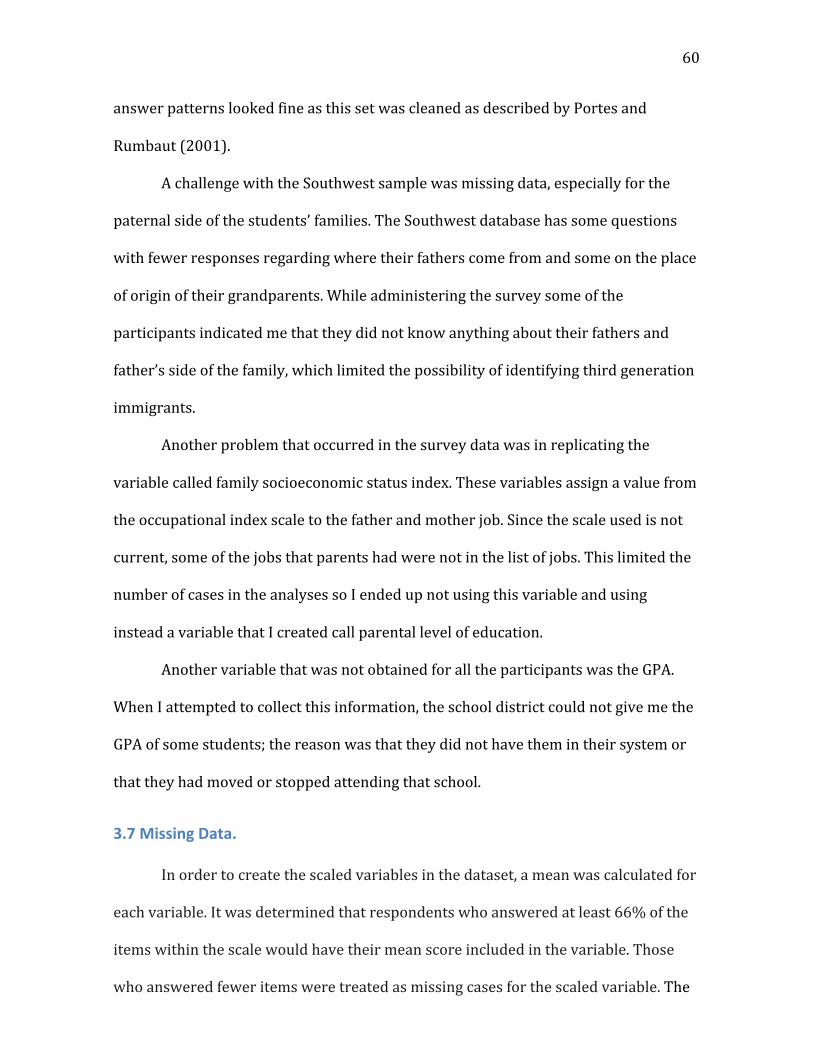
60
answer patterns looked fine as this set was cleaned as described by Portes and
Rumbaut (2001).
A challenge with the Southwest sample was missing data, especially for the
paternal side of the students’ families. The Southwest database has some questions
with fewer responses regarding where their fathers come from and some on the place
of origin of their grandparents. While administering the survey some of the
participants indicated me that they did not know anything about their fathers and
father’s side of the family, which limited the possibility of identifying third generation
immigrants.
Another problem that occurred in the survey data was in replicating the
variable called family socioeconomic status index. These variables assign a value from
the occupational index scale to the father and mother job. Since the scale used is not
current, some of the jobs that parents had were not in the list of jobs. This limited the
number of cases in the analyses so I ended up not using this variable and using
instead a variable that I created call parental level of education.
Another variable that was not obtained for all the participants was the GPA.
When I attempted to collect this information, the school district could not give me the
GPA of some students; the reason was that they did not have them in their system or
that they had moved or stopped attending that school.
3.7 Missing Data.
In order to create the scaled variables in the dataset, a mean was calculated for
each variable. It was determined that respondents who answered at least 66% of the
items within the scale would have their mean score included in the variable. Those
who answered fewer items were treated as missing cases for the scaled variable. The
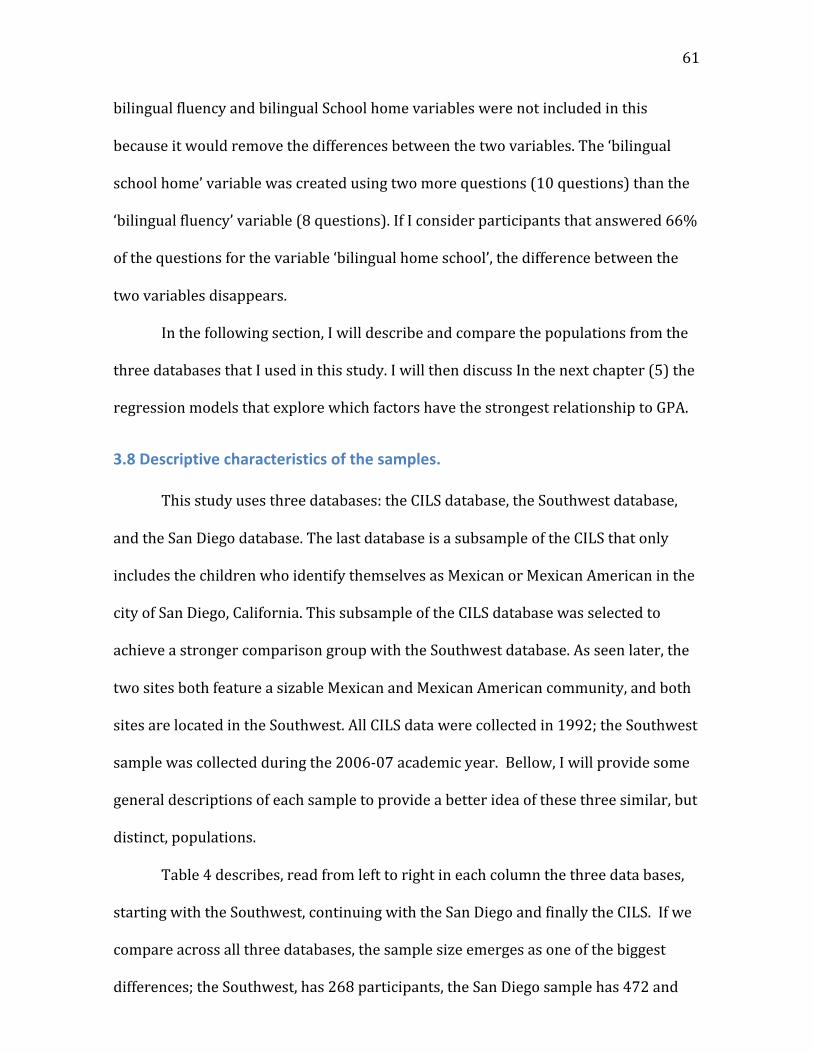
61
bilingual fluency and bilingual School home variables were not included in this
because it would remove the differences between the two variables. The ‘bilingual
school home’ variable was created using two more questions (10 questions) than the
‘bilingual fluency’ variable (8 questions). If I consider participants that answered 66%
of the questions for the variable ‘bilingual home school’, the difference between the
two variables disappears.
In the following section, I will describe and compare the populations from the
three databases that I used in this study. I will then discuss In the next chapter (5) the
regression models that explore which factors have the strongest relationship to GPA.
3.8 Descriptive characteristics of the samples.
This study uses three databases: the CILS database, the Southwest database,
and the San Diego database. The last database is a subsample of the CILS that only
includes the children who identify themselves as Mexican or Mexican American in the
city of San Diego, California. This subsample of the CILS database was selected to
achieve a stronger comparison group with the Southwest database. As seen later, the
two sites both feature a sizable Mexican and Mexican American community, and both
sites are located in the Southwest. All CILS data were collected in 1992; the Southwest
sample was collected during the 2006-‐07 academic year. Bellow, I will provide some
general descriptions of each sample to provide a better idea of these three similar, but
distinct, populations.
Table 4 describes, read from left to right in each column the three data bases,
starting with the Southwest, continuing with the San Diego and finally the CILS. If we
compare across all three databases, the sample size emerges as one of the biggest
differences; the Southwest, has 268 participants, the San Diego sample has 472 and
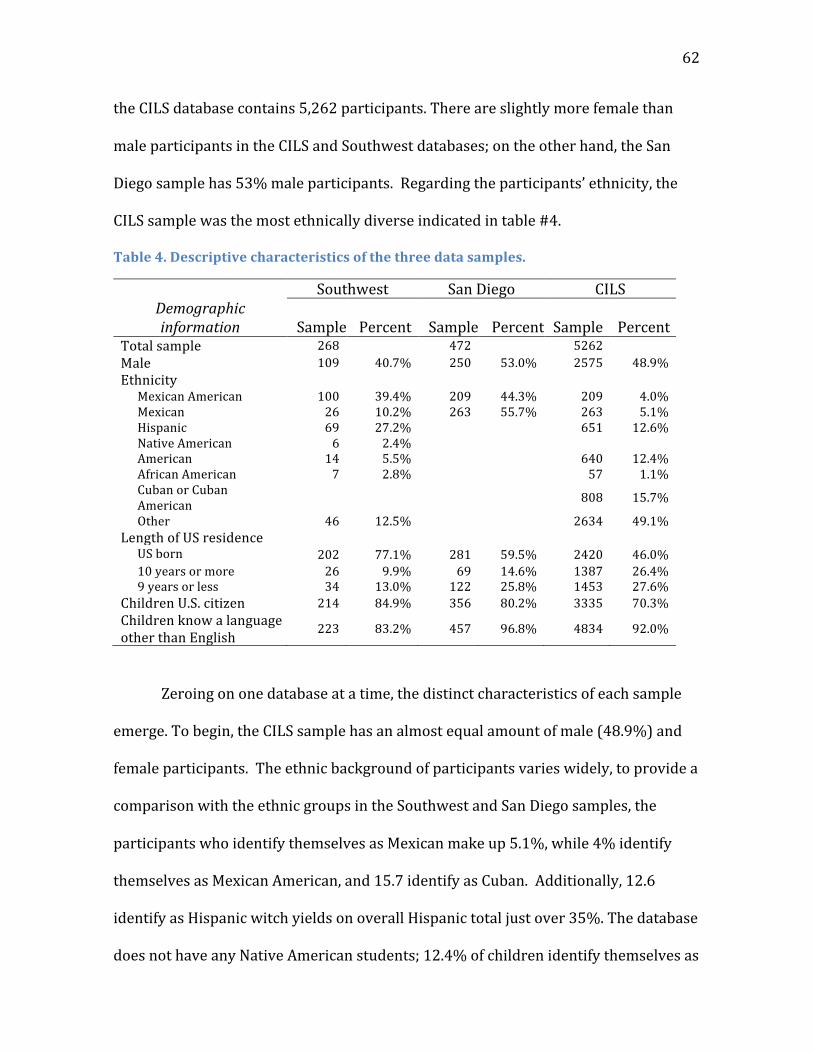
62
the CILS database contains 5,262 participants. There are slightly more female than
male participants in the CILS and Southwest databases; on the other hand, the San
Diego sample has 53% male participants. Regarding the participants’ ethnicity, the
CILS sample was the most ethnically diverse indicated in table #4.
Table 4. Descriptive characteristics of the three data samples.
Southwest San Diego CILS Demographic information Sample Percent Sample Percent Sample Percent
Total sample 268 472 5262 Male 109 40.7% 250 53.0% 2575 48.9% Ethnicity Mexican American 100 39.4% 209 44.3% 209 4.0% Mexican 26 10.2% 263 55.7% 263 5.1% Hispanic 69 27.2% 651 12.6% Native American 6 2.4% American 14 5.5% 640 12.4% African American 7 2.8% 57 1.1% Cuban or Cuban American 808 15.7%
Other 46 12.5% 2634 49.1% Length of US residence US born 202 77.1% 281 59.5% 2420 46.0% 10 years or more 26 9.9% 69 14.6% 1387 26.4% 9 years or less 34 13.0% 122 25.8% 1453 27.6%
Children U.S. citizen 214 84.9% 356 80.2% 3335 70.3% Children know a language other than English 223 83.2% 457 96.8% 4834 92.0%
Zeroing on one database at a time, the distinct characteristics of each sample
emerge. To begin, the CILS sample has an almost equal amount of male (48.9%) and
female participants. The ethnic background of participants varies widely, to provide a
comparison with the ethnic groups in the Southwest and San Diego samples, the
participants who identify themselves as Mexican make up 5.1%, while 4% identify
themselves as Mexican American, and 15.7 identify as Cuban. Additionally, 12.6
identify as Hispanic witch yields on overall Hispanic total just over 35%. The database
does not have any Native American students; 12.4% of children identify themselves as
63
American. 46% are born in the U.S., and 70% are U.S. citizens. Finally, 92% of the
children know a language other than English.
Moving on from the CILS sample, we notice that the Southwest database is the
smallest one of the three. It has more female than male participants; the sample
ethnicity is heavily identified as Mexican American, Mexican, or Latino. Most of the
sample (77.1%) was born in the U.S. and they are, according to the survey, U.S.
citizens (84.9%). Finally, 83.2% know a language other than English.
To provide a strong comparison with this sample the San Diego sample was
extracted from the larger CILS sample. With 472 cases, this database was specifically
selected due to its location (San Diego is in the Southwest) and only extracted the
participants who identified as Mexican or Mexican American. Interestingly these
parameters extracted all Mexican and Mexican Americans from the greater CILS
sample. Within this sample, 59.5 percent are U.S.-‐born and most of the sample is
comprised of U.S. citizens (80.2%). The percentage of children that know a language
other than English is 96.8%
In summary, the Southwest sample has the highest percentage of U.S.-‐born
children, and is quite different from the other two databases in that regard.
Meanwhile, the percent that identifies as U.S. citizens does not differ widely between
the databases, but still, the Southwest has the highest percentage. The majority across
all the samples knows a language other than English. Finally, the Southwest sample is
mostly, if not all, Latino/ Hispanic.
In Table #5, shown below, we compare some information about parents,
language preference at home, and head of household. This information will provide a
better picture of the children’s families.
64
For the Southwest sample, regarding fathers’ education, the highest percentage
is for the ‘less than high school’ category, with 39.6%. On the mothers’ side, the data
look something similar, with 42.3% selecting the ‘less than high school’ category.
Within the households, 52.9 % have both the biological parents present in their home.
The language spoken at home is Spanish, and is spoken by almost all family members
(94.9%). Finally, 65.4% of the families own their home; this is the highest percentage
from the three databases. Such high rates of homeownership as compared to the
other samples can be explained by the timing on the study. At the time the survey was
administered (2006-‐07), the economic situation in the U.S. was favorable for
homeownership, loans were easy to obtain, little cash was needed for a down
payment, and an unprecedented number of families were buying houses.
Within the San Diego sample, the fathers’ education is similar to the two other
samples; the ‘less than high school’ category has the highest percentage, 57%,
compared to the other options for education level. Indeed, it is the highest from the
other two samples by far. This dataset saw the largest difference in level of parent
education attainment between mothers and fathers with 69.1 % of mothers not
having at least high school diploma and more generally reported the lowest levels of
educational attainment overall. Regarding the household, again it is similar to the
other databases, where a majority of homes have both biological parents present
(60.6%). The ‘Spanish speaking at home’ quantity is almost 100 percent (99.1%). Only
33.2% own a house, which is the lowest level of home ownership among all the
samples.
Regarding the CILS data, the parents’ level of education is the highest among
the three samples. 28.5 % of the CILS fathers have completed less than high school,
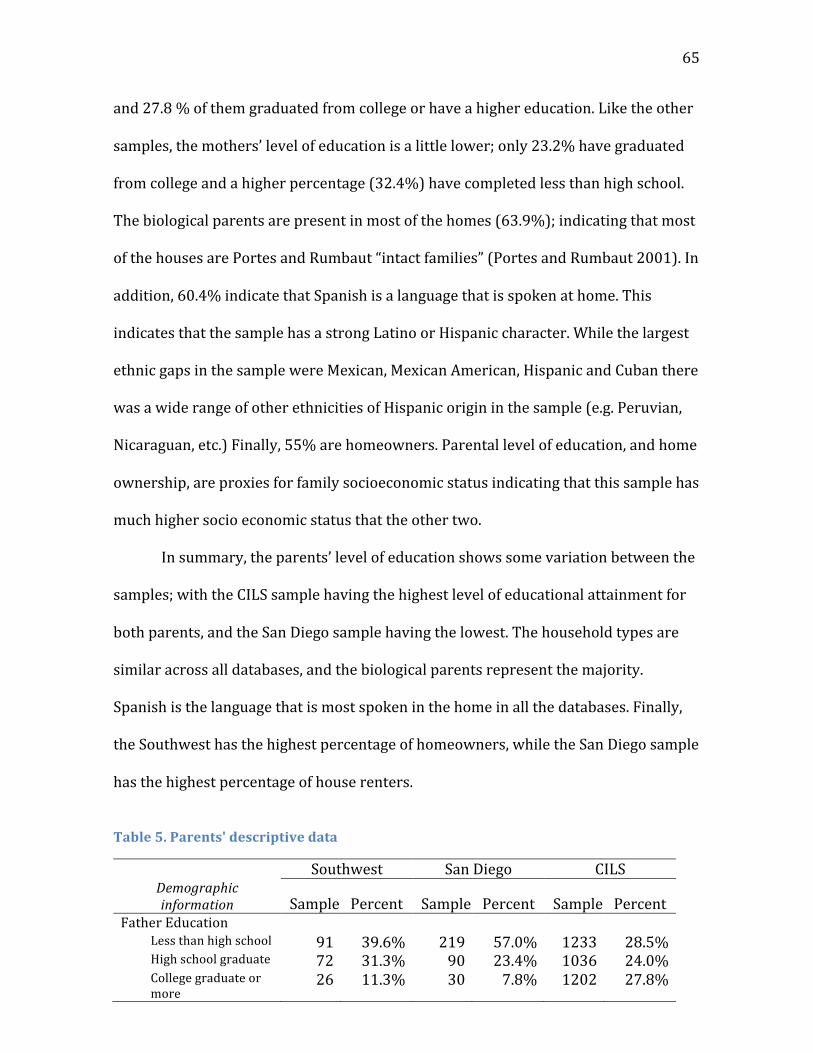
65
and 27.8 % of them graduated from college or have a higher education. Like the other
samples, the mothers’ level of education is a little lower; only 23.2% have graduated
from college and a higher percentage (32.4%) have completed less than high school.
The biological parents are present in most of the homes (63.9%); indicating that most
of the houses are Portes and Rumbaut “intact families” (Portes and Rumbaut 2001). In
addition, 60.4% indicate that Spanish is a language that is spoken at home. This
indicates that the sample has a strong Latino or Hispanic character. While the largest
ethnic gaps in the sample were Mexican, Mexican American, Hispanic and Cuban there
was a wide range of other ethnicities of Hispanic origin in the sample (e.g. Peruvian,
Nicaraguan, etc.) Finally, 55% are homeowners. Parental level of education, and home
ownership, are proxies for family socioeconomic status indicating that this sample has
much higher socio economic status that the other two.
In summary, the parents’ level of education shows some variation between the
samples; with the CILS sample having the highest level of educational attainment for
both parents, and the San Diego sample having the lowest. The household types are
similar across all databases, and the biological parents represent the majority.
Spanish is the language that is most spoken in the home in all the databases. Finally,
the Southwest has the highest percentage of homeowners, while the San Diego sample
has the highest percentage of house renters.
Table 5. Parents' descriptive data
Southwest San Diego CILS Demographic information Sample Percent Sample Percent Sample Percent
Father Education Less than high school 91 39.6% 219 57.0% 1233 28.5% High school graduate 72 31.3% 90 23.4% 1036 24.0% College graduate or more
26 11.3% 30 7.8% 1202 27.8%
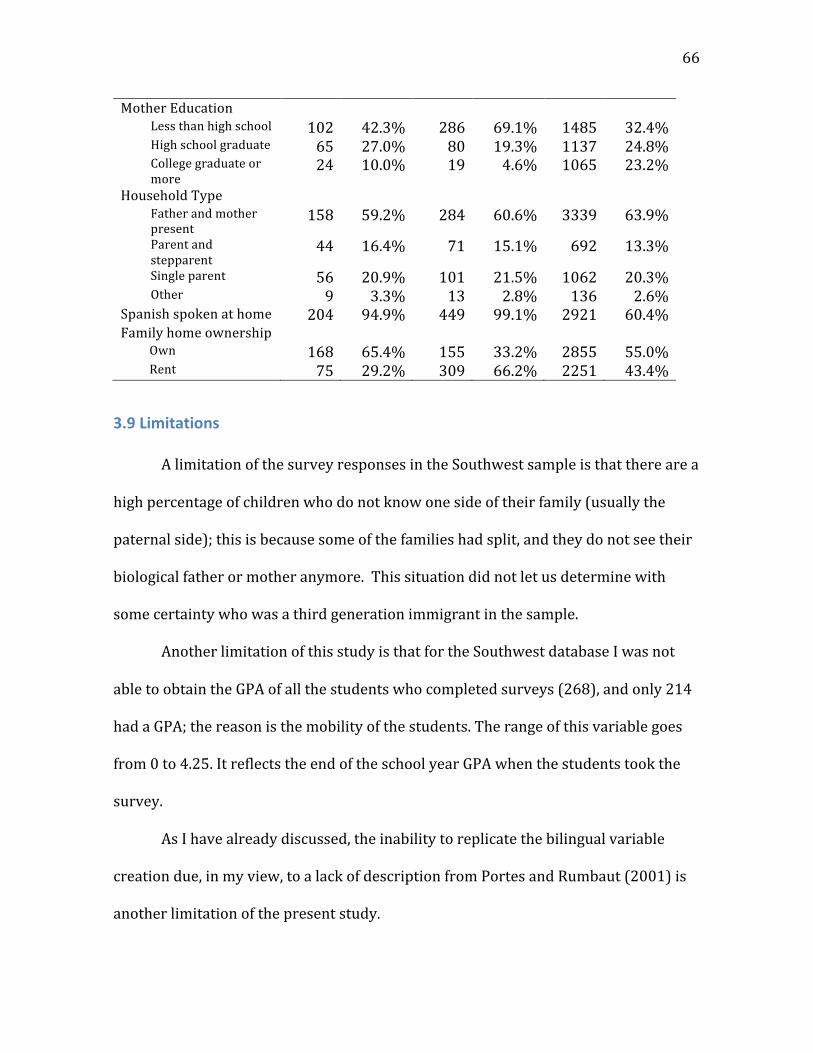
66
Mother Education Less than high school 102 42.3% 286 69.1% 1485 32.4% High school graduate 65 27.0% 80 19.3% 1137 24.8% College graduate or more
24 10.0% 19 4.6% 1065 23.2%
Household Type Father and mother present
158 59.2% 284 60.6% 3339 63.9%
Parent and stepparent
44 16.4% 71 15.1% 692 13.3%
Single parent 56 20.9% 101 21.5% 1062 20.3% Other 9 3.3% 13 2.8% 136 2.6%
Spanish spoken at home 204 94.9% 449 99.1% 2921 60.4% Family home ownership
Own 168 65.4% 155 33.2% 2855 55.0% Rent 75 29.2% 309 66.2% 2251 43.4%
3.9 Limitations
A limitation of the survey responses in the Southwest sample is that there are a
high percentage of children who do not know one side of their family (usually the
paternal side); this is because some of the families had split, and they do not see their
biological father or mother anymore. This situation did not let us determine with
some certainty who was a third generation immigrant in the sample.
Another limitation of this study is that for the Southwest database I was not
able to obtain the GPA of all the students who completed surveys (268), and only 214
had a GPA; the reason is the mobility of the students. The range of this variable goes
from 0 to 4.25. It reflects the end of the school year GPA when the students took the
survey.
As I have already discussed, the inability to replicate the bilingual variable
creation due, in my view, to a lack of description from Portes and Rumbaut (2001) is
another limitation of the present study.
67
CHAPTER 4: FINDINGS
4.1 Descriptive Statistics of Study Variables:
The following section includes the descriptive statistics of the dependent and
independent variables used in this study. Table 6 has the descriptive statistics for the
variables that will be used in the regressions. The table also contains the results from
the three databases, Southwest, San Diego, and CILS.
The dependent variable, Grade Point Average (GPA) mean, is slightly higher
(2.52) (S.D. .911) in the CILS database than in the other two databases. The San Diego
sample has the lowest GPA mean, 2.192 (S.D. 855). This means that the average GPA
scores are low across all three samples. There no great differences in the GPA mean
between databases; all the means are within less than half a point difference.
While the gender distribution is nearly even between men and women in the
CILS and San Diego samples (50% male in CILS, and 53% male in San Diego), nearly
sixty percent of the Southwest sample (59%) is female. This is not indicative of the
school population (see Table 3 in Chapter 3), but is reflective of the population who
returned the parental consent forms to participate in the study.
Educational expectation.
The CILS database has the highest mean for the variable ‘educational
expectation’ with a 4.10 (S.D. .973) out of a possible 5.0 . The Southwest database
follows it, with a 3.83 (S.D. 1.048), and finally the San Diego sample has a 3.63 (S.D.
1.086) mean.
Length of residency.
For the variable “length of residency in the USA“ the mean in all three
databases exceeds 3 points, indicating that the majority of the children have been in
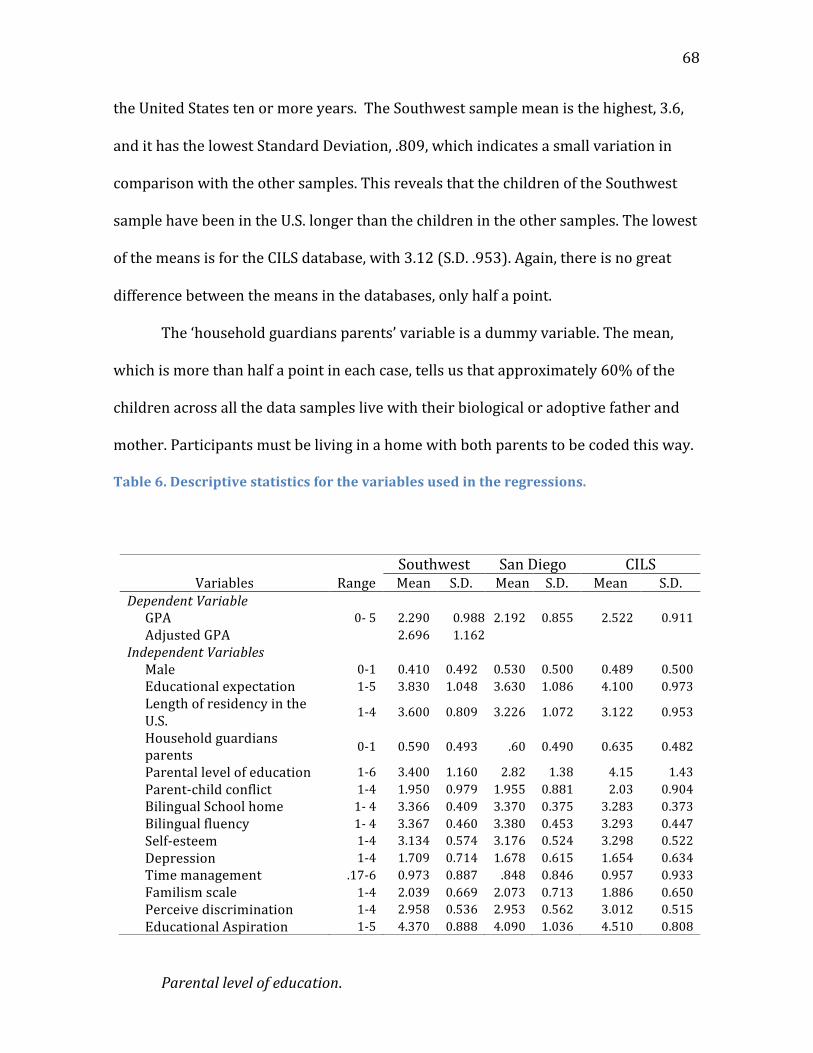
68
the United States ten or more years. The Southwest sample mean is the highest, 3.6,
and it has the lowest Standard Deviation, .809, which indicates a small variation in
comparison with the other samples. This reveals that the children of the Southwest
sample have been in the U.S. longer than the children in the other samples. The lowest
of the means is for the CILS database, with 3.12 (S.D. .953). Again, there is no great
difference between the means in the databases, only half a point.
The ‘household guardians parents’ variable is a dummy variable. The mean,
which is more than half a point in each case, tells us that approximately 60% of the
children across all the data samples live with their biological or adoptive father and
mother. Participants must be living in a home with both parents to be coded this way.
Table 6. Descriptive statistics for the variables used in the regressions.
Parental level of education.
Southwest San Diego CILS Variables Range Mean S.D. Mean S.D. Mean S.D.
Dependent Variable GPA 0-‐ 5 2.290 0.988 2.192 0.855 2.522 0.911 Adjusted GPA 2.696 1.162
Independent Variables Male 0-‐1 0.410 0.492 0.530 0.500 0.489 0.500 Educational expectation 1-‐5 3.830 1.048 3.630 1.086 4.100 0.973 Length of residency in the U.S. 1-‐4 3.600 0.809 3.226 1.072 3.122 0.953
Household guardians parents 0-‐1 0.590 0.493 .60 0.490 0.635 0.482
Parental level of education 1-‐6 3.400 1.160 2.82 1.38 4.15 1.43 Parent-‐child conflict 1-‐4 1.950 0.979 1.955 0.881 2.03 0.904 Bilingual School home 1-‐ 4 3.366 0.409 3.370 0.375 3.283 0.373 Bilingual fluency 1-‐ 4 3.367 0.460 3.380 0.453 3.293 0.447 Self-‐esteem 1-‐4 3.134 0.574 3.176 0.524 3.298 0.522 Depression 1-‐4 1.709 0.714 1.678 0.615 1.654 0.634 Time management .17-‐6 0.973 0.887 .848 0.846 0.957 0.933 Familism scale 1-‐4 2.039 0.669 2.073 0.713 1.886 0.650 Perceive discrimination 1-‐4 2.958 0.536 2.953 0.562 3.012 0.515 Educational Aspiration 1-‐5 4.370 0.888 4.090 1.036 4.510 0.808
69
The variable Parental Level of Education indicates the amount of formal
education of the parents. The higher the number, the more education parents have
received. The CILS database has a mean of 4.15; thus indicating a higher level of
educational attainment than the other two samples. The San Diego database has a
mean of 2.82, and as we saw in (Table 5 Parent’s Descriptive table) a significant
majority of parents had obtained less than a high school diploma (65% of fathers,
74% of mothers). As a means of comparison, just over a third of fathers and 40% of
mothers in the CILS sample were in this less than high school education category,
while 35% of fathers and 28% of mothers had earned their college degree the highest
in the sample.
Parent-‐child conflict.
For the variable Parent-‐Child conflict the means were quite similar across
databases, as were the standard deviations. The parent-‐child conflict variable ranged
from 1 to 4, with the lower the score indicating less conflict between parents and
child. As the means ranged from 1.95 to 2.03 across samples, this demonstrates that
the children experienced relatively low levels of conflict with their parents.
Bilingual school home.
The Bilingual School Home variable is a composed variable created with ten
variables regarding language knowledge and usage. The higher the score, the more
bilingual the child. There is little difference in the mean scores for all the databases;
the range is from 3.28 to 3.37, which means that the groups are highly bilingual,
considering that the highest score possible is four.
Bilingual Fluency.
70
The Bilingual fluency variable is another composed variable. This variable was
created using the same variables that Portes and Rumbaut used in their analysis to
create the categories known as “fully bilingual”, “English dominant” “foreign language
dominant” and “limited bilingual”. Since it was not possible to replicate the creation of
this variable, I created a scale, similar to that in the Bilingual School Home variable,
where the higher the score the more bilingual the participant. Again, the mean scores
are fairly consistent across samples (3.29 to 3.38) indicating that this variable
captures a level of bilingualism quite similar to that of the 10-‐item bilingualism scale.
A first view of the two bilingual variables shows little difference, if we look
only at the mean scores. However, the minimum and maximum scores for both
variables across tables shed more light on the variation between the two variables.
We can notice that the minimum is lower on all the databases on the Bilingual fluency
variable, while the maximum stays the same at 4, in all the cases except in the San
Diego sample, where the maximum score for Bilingual School and home was 3.9. The
standard deviation is higher for the Bilingual fluency variable in all the samples,
which indicates more variability.
Self esteem.
The variable ‘self –esteem’ is a compound variable that indicates the level of
self esteem that children have; it is based on the Rosenberg self-‐esteem scale (Portes
and Rumbaut 2001). The Southwest sample has the lowest mean, 3.134 (S.D. .573),
and the CILS has the highest one, 3.298 (S.D. .522). The scale ranges from 1 to 4,
meaning the higher the score the more self esteem the students have.
Depression.
71
The variable ‘depression’ is also a scale, similar to the self-‐esteem scale. This
variable is a scale that goes from 1 to 4, where one indicates that students had
experienced feelings of depression (sadness, loss of appetite, lack of motivation, et.)
five to seven days a week in the past week, and 4 indicates few to no depressive
feelings during the past week. The Southwest sample has the highest mean 1.709 (S.D.
.714) and the CILS has the lowest one with 1.654 (S.D. .634). In this case, the lower the
number on the scale, the more the respondent reports experiencing depressive
symptoms within the past week.
Time management.
As reported previously, the variable ‘time management’ divides the hours a
participant reports doing homework by the hours he or she watches television. In the
two items used to calculate this variable the range goes from less than one (1) to five
or more (6) hours per week. Thus, the range of this computed variable is from .17 (a
score of 1 for homework and 6 for television) to 6 (a score of 6 for homework and 1
for television). The higher the score, the more time that student spends doing
homework instead of watching TV. The Southwest has the highest mean, .973, and the
San Diego has the lowest, .848, indicating that a large number of students in the
sample spend more or at least the same amount of time each week watching
television as they devoted to their homework.
Familism.
The variable ‘familism,’ is a scale that has a possible range from 1-‐4. The San
Diego database has the highest mean, 2.073 (S.D. .713), and the CILS database has the
lowest mean, 1.886 (S.D. .650). The higher the score, the more inclined the children
72
are to turn to family for a range of personal or professional problems. Low scores
reflect participants’ preference for individualistic values.
Perceived discrimination.
Perceived discrimination is another scale ranging from 1-‐4, where higher
scores mean that the participants’ perceive having encountered more racial
discrimination and xenophobia within the United States. The means are close among
the databases; there is a only difference of .06 between them (2.95 to 3.01). The
scores indicate a high degree of perceived discrimination by the children across the
three samples.
Educational aspirations.
For the variable educational aspirations, it is important to note that the
educational aspirations of all three samples are generally high, at least 75% of those
in each sample want to complete college or a graduate program. The San Diego
database is the one with the lowest mean (4.09) and the biggest standard deviation
(1.04), indicating that the answers are more widely spread. Yet 75% of the sample
aspires to attain a college diploma or more, and 46% hope to obtain a graduate
degree. A 4.5 mean for the CILS database reflects the highest levels of educational
aspiration across the samples, with 90% wanting to earn a college or graduate degree,
and 66% aspiring to eventually complete graduate degrees. The Southwest sample
(mean of 4.37) falls between the other two samples with 85% aspiring to complete a
college degree or more, and 59% wanting a graduate degree.
In summary, from examining the means of these variables, I can deduce that
the three samples are quite similar. There is little variation in the means for each
variable. They are, in almost all cases, within a half a point difference.
73
4.2 Regression Analysis
This section presents the results of the regressions conducted to address the
research questions of this study. Several multiple linear regressions were run to
determine what variables had the strongest relationship with GPA. Each regression
was run for all three samples. In this section I will identify and explain the results of
these regressions. I will describe the regressions in the order they were run, starting
with model I. The order of the regressions is based on the research questions that
needed to be answered. I will start with the first question, what is the influence of
foreign language maintenance and bilingualism on academic achievement?
The results of multiple linear regressions are shown in the following tables;
they were run independently with three databases: the Southwest, the San Diego
database, and the CILS. The results for each database are shown in the tables in
distinct columns. Not all the models are significant. Results from these regressions
represent the change in the GPA of students based on each variable. The amount of
variance in GPA explained by each model is listed as the adjusted R2.
Five multiple regressions were run in three databases. The first group of
regressions (model I) used the control variables. The second regression, called model
II, included the variable ‘bilingual school home’ in addition to the control variables.
The third regression, called model III, included the control variables and the ‘bilingual
fluency’ variable. Model lV adds the psychosocial variables (self-‐esteem and the
depression scales, time management, familism scale, perceived discrimination and
educational aspiration) to those included in Model II, while model V uses these
variables in combination with those in Model III. The models alternate between two
74
variables, the bilingual school home variable and the bilingual fluency variable to
better answer the research question.
In the following sections of this chapter I will discuss the regression findings,
and these sections will be divided by model. I will describe the variables according to
the degree of importance to the model. The higher the β score, regardless of the sign
(negative or positive), the more important it is as a predictor in the model (Field
2009). I will start the each description with the highest score.
4.2.1 Model I: Regression with control variables
The first regression, run solely with the control variables, was used as a
baseline to help understand how the rest of the variables will interact with or
influence GPA without the bilingual variable.
The independent variables used in Model I are children’s sex (male),
educational expectation (meaning the level of education children expects to attain),
length of time residing in the U.S., household guardians parents (meaning biological
parents, or what Portes and Rumbaut call ‘intact families’), parental level of education,
and parent-‐child conflict. The results are expressed in points of change in GPA. Model
I is significant at the p < .001 level for the CILS and the San Diego databases, and for
the Southwest sample it is significant at the p< .05 level.
The regression (model I), run with the Southwest database, explained only
4.3% of the variance in GPA. The variable with the strongest influence on GPA is
‘educational expectation,’ and the variable that affects it least is ‘household guardians
parents’.
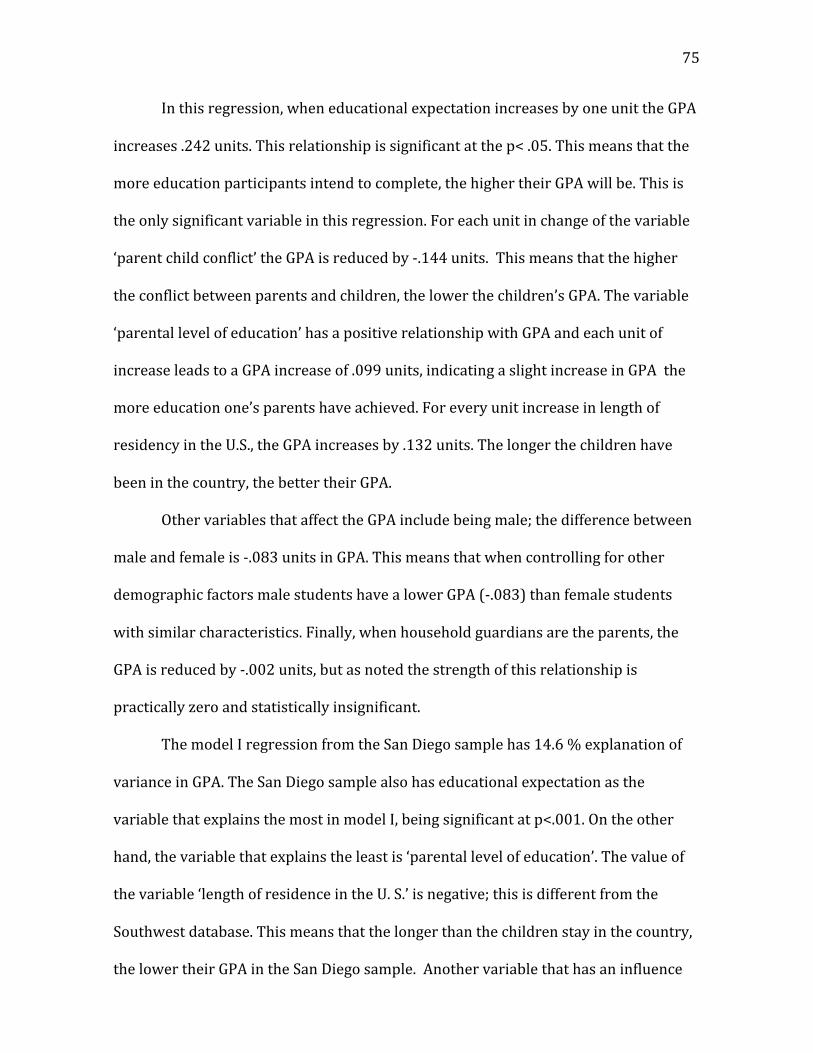
75
In this regression, when educational expectation increases by one unit the GPA
increases .242 units. This relationship is significant at the p< .05. This means that the
more education participants intend to complete, the higher their GPA will be. This is
the only significant variable in this regression. For each unit in change of the variable
‘parent child conflict’ the GPA is reduced by -‐.144 units. This means that the higher
the conflict between parents and children, the lower the children’s GPA. The variable
‘parental level of education’ has a positive relationship with GPA and each unit of
increase leads to a GPA increase of .099 units, indicating a slight increase in GPA the
more education one’s parents have achieved. For every unit increase in length of
residency in the U.S., the GPA increases by .132 units. The longer the children have
been in the country, the better their GPA.
Other variables that affect the GPA include being male; the difference between
male and female is -‐.083 units in GPA. This means that when controlling for other
demographic factors male students have a lower GPA (-‐.083) than female students
with similar characteristics. Finally, when household guardians are the parents, the
GPA is reduced by -‐.002 units, but as noted the strength of this relationship is
practically zero and statistically insignificant.
The model I regression from the San Diego sample has 14.6 % explanation of
variance in GPA. The San Diego sample also has educational expectation as the
variable that explains the most in model I, being significant at p<.001. On the other
hand, the variable that explains the least is ‘parental level of education’. The value of
the variable ‘length of residence in the U. S.’ is negative; this is different from the
Southwest database. This means that the longer than the children stay in the country,
the lower their GPA in the San Diego sample. Another variable that has an influence
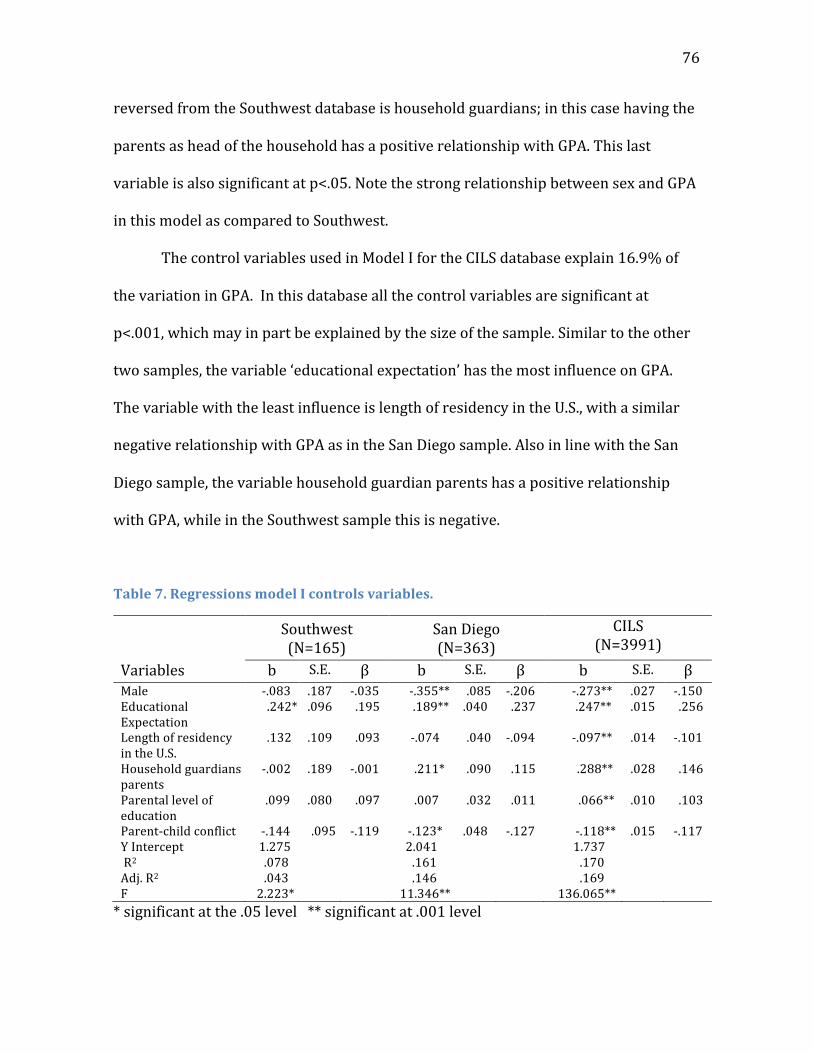
76
reversed from the Southwest database is household guardians; in this case having the
parents as head of the household has a positive relationship with GPA. This last
variable is also significant at p<.05. Note the strong relationship between sex and GPA
in this model as compared to Southwest.
The control variables used in Model I for the CILS database explain 16.9% of
the variation in GPA. In this database all the control variables are significant at
p<.001, which may in part be explained by the size of the sample. Similar to the other
two samples, the variable ‘educational expectation’ has the most influence on GPA.
The variable with the least influence is length of residency in the U.S., with a similar
negative relationship with GPA as in the San Diego sample. Also in line with the San
Diego sample, the variable household guardian parents has a positive relationship
with GPA, while in the Southwest sample this is negative.
Table 7. Regressions model I controls variables.
Southwest (N=165)
San Diego (N=363)
CILS (N=3991)
Variables b S.E. β b S.E. β b S.E. β Male -‐.083 .187 -‐.035 -‐.355** .085 -‐.206 -‐.273** .027 -‐.150 Educational Expectation
.242* .096 .195 .189** .040 .237 .247** .015 .256
Length of residency in the U.S.
.132
.109 .093 -‐.074 .040 -‐.094 -‐.097** .014 -‐.101
Household guardians parents
-‐.002 .189 -‐.001 .211* .090 .115 .288** .028 .146
Parental level of education
.099 .080 .097 .007 .032 .011 .066** .010 .103
Parent-‐child conflict -‐.144 .095 -‐.119 -‐.123* .048 -‐.127 -‐.118** .015 -‐.117 Y Intercept 1.275 2.041 1.737 R2 .078 .161 .170 Adj. R2 .043 .146 .169 F 2.223* 11.346** 136.065** * significant at the .05 level ** significant at .001 level
77
The second set of regressions (models II and III) introduces one additional
variable into the regression, a measure of bilingualism, in order to answer the first
research question. As discussed previously, two bilingual variables were used in this
study, one which was replicated from the items used in the Portes and Rumbaut
(2001) bilingual variable—here termed ‘bilingual fluency,’ and a second that is an
expanded bilingual measure (‘bilingual school home’), which includes additional
items from the survey instrument in its creation. Each of these variables was added
into Model I. Model II incorporates the ‘bilingual fluency’ variable and Model III used
the ‘bilingual school home’ variable in place of bilingual fluency. The ‘bilingual school
home’ variable was specifically designed to include survey items that captured
language usage with friends and family, outside of an academic setting, that were not
part of the bilingual fluency measure.
4.2.2 Model II. Regression related to language
The first model run to answer the research question regarding the influence of
non-‐English language maintenance and bilingualism on academic achievement added
the bilingual fluency variable into the model. This variable, as discussed in Chapter 4,
was created with the same variables used by Portes and Rumbaut (2001) in the
creation of their bilingual categories.
While the explanatory power of most independent variables increases in this
model, this model is slightly less predictive than Model I (adjusted R2 of 4.1% as
compared to 4.3% for Model I), which can be explained by the reduction in sample
size when adding this independent variable to the regression. The missing data in this
variable led to a 19% reduction in sample size. The model is not significant. The San
Diego sample, on the other hand, explains 15.5 % of the variability in GPA, an
78
improvement from model I. It is also significant at p<.001. The predictive power of
the model for the CILS sample remains nearly unchanged; this model only explains
16.7%, a difference of .02% less than model I.
For the Southwest sample, the variable that has the most influence on GPA is
educational expectation, with an increase of .211 units in GPA, and is significant at
p<.05; this outcome is also similar to model I. The variable with least influence on GPA
is bilingual fluency, with an increase in GPA of .026 units. However, this relationship is
positive, meaning that the more bilingual the child, the better the GPA. The variable
male has a negative relationship with GPA as it did in Model I.
For the San Diego sample, the variable ‘educational expectation’ has the
strongest relationship with GPA, with an increase of .181 units. It is significant at
p<.001. The variable with the least influence is parental level of education, with an
increase in GPA of .021 units. This is a similar to model I, regarding the most and least
influence. Like the Southwest database, this sample has a positive relationship with
the variable bilingual fluency. It is the only time that a variable in the San Diego
database does not have a similar relationship with GPA as the same variable in the
CILS database.
In this model, the CILS database is behaving as it did in Model I. Parental level
of education remains the variable with the most influence on GPA, with an increase in
GPA of .254 units. The variable with the least influence is the bilingual fluency
variable, with a reduction in GPA of -‐.131 units. All the variables are significant at
p<.001. The bilingual fluency variable has a negative relationship with GPA in this
model.
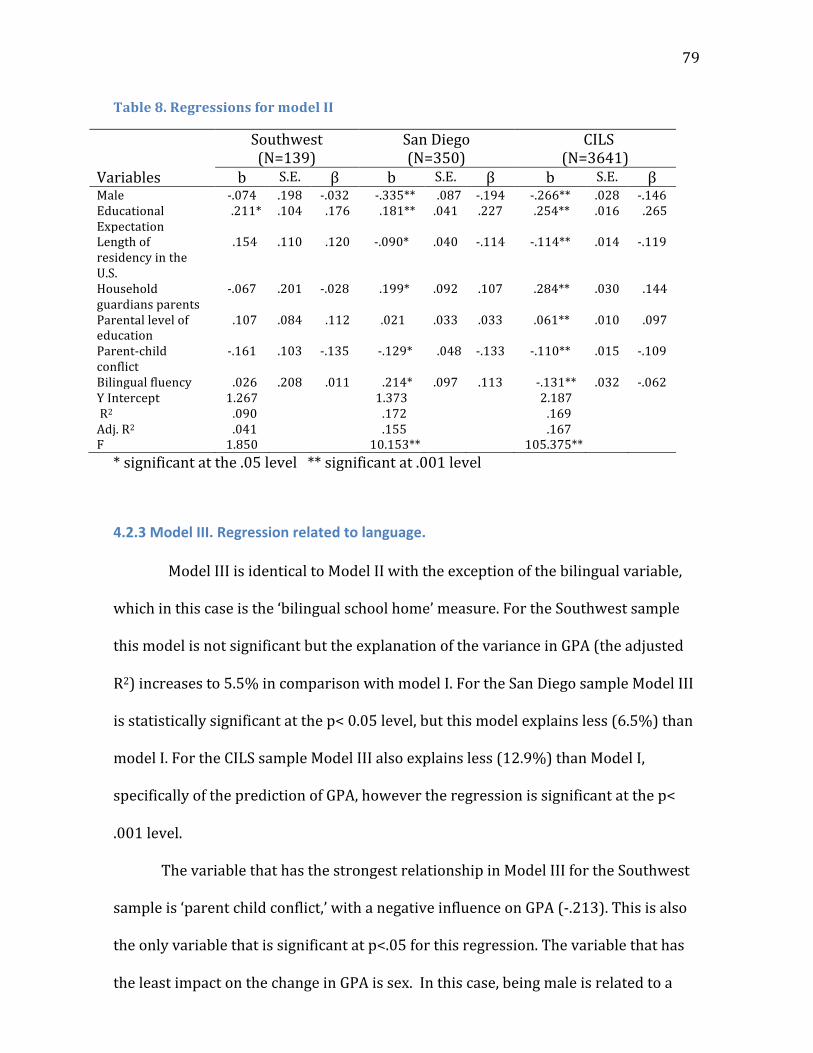
79
Table 8. Regressions for model II
Southwest (N=139)
San Diego (N=350)
CILS (N=3641)
Variables b S.E. β b S.E. β b S.E. β Male -‐.074 .198 -‐.032 -‐.335** .087 -‐.194 -‐.266** .028 -‐.146 Educational Expectation
.211* .104 .176 .181** .041 .227 .254** .016 .265
Length of residency in the U.S.
.154 .110 .120 -‐.090* .040 -‐.114 -‐.114** .014 -‐.119
Household guardians parents
-‐.067 .201 -‐.028 .199* .092 .107 .284** .030 .144
Parental level of education
.107 .084 .112 .021 .033 .033 .061** .010 .097
Parent-‐child conflict
-‐.161 .103 -‐.135 -‐.129* .048 -‐.133 -‐.110** .015 -‐.109
Bilingual fluency .026 .208 .011 .214* .097 .113 -‐.131** .032 -‐.062 Y Intercept 1.267 1.373 2.187 R2 .090 .172 .169 Adj. R2 .041 .155 .167 F 1.850 10.153** 105.375** * significant at the .05 level ** significant at .001 level
4.2.3 Model III. Regression related to language.
Model III is identical to Model II with the exception of the bilingual variable,
which in this case is the ‘bilingual school home’ measure. For the Southwest sample
this model is not significant but the explanation of the variance in GPA (the adjusted
R2) increases to 5.5% in comparison with model I. For the San Diego sample Model III
is statistically significant at the p< 0.05 level, but this model explains less (6.5%) than
model I. For the CILS sample Model III also explains less (12.9%) than Model I,
specifically of the prediction of GPA, however the regression is significant at the p<
.001 level.
The variable that has the strongest relationship in Model III for the Southwest
sample is ‘parent child conflict,’ with a negative influence on GPA (-‐.213). This is also
the only variable that is significant at p<.05 for this regression. The variable that has
the least impact on the change in GPA is sex. In this case, being male is related to a
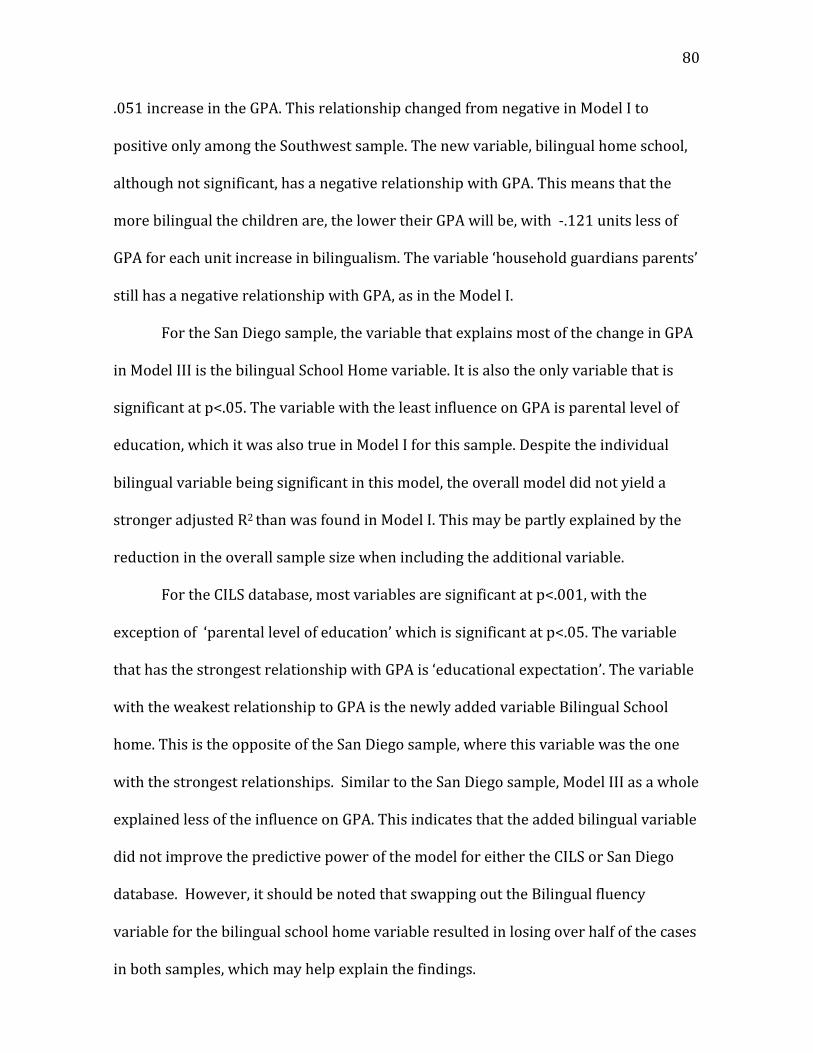
80
.051 increase in the GPA. This relationship changed from negative in Model I to
positive only among the Southwest sample. The new variable, bilingual home school,
although not significant, has a negative relationship with GPA. This means that the
more bilingual the children are, the lower their GPA will be, with -‐.121 units less of
GPA for each unit increase in bilingualism. The variable ‘household guardians parents’
still has a negative relationship with GPA, as in the Model I.
For the San Diego sample, the variable that explains most of the change in GPA
in Model III is the bilingual School Home variable. It is also the only variable that is
significant at p<.05. The variable with the least influence on GPA is parental level of
education, which it was also true in Model I for this sample. Despite the individual
bilingual variable being significant in this model, the overall model did not yield a
stronger adjusted R2 than was found in Model I. This may be partly explained by the
reduction in the overall sample size when including the additional variable.
For the CILS database, most variables are significant at p<.001, with the
exception of ‘parental level of education’ which is significant at p<.05. The variable
that has the strongest relationship with GPA is ‘educational expectation’. The variable
with the weakest relationship to GPA is the newly added variable Bilingual School
home. This is the opposite of the San Diego sample, where this variable was the one
with the strongest relationships. Similar to the San Diego sample, Model III as a whole
explained less of the influence on GPA. This indicates that the added bilingual variable
did not improve the predictive power of the model for either the CILS or San Diego
database. However, it should be noted that swapping out the Bilingual fluency
variable for the bilingual school home variable resulted in losing over half of the cases
in both samples, which may help explain the findings.
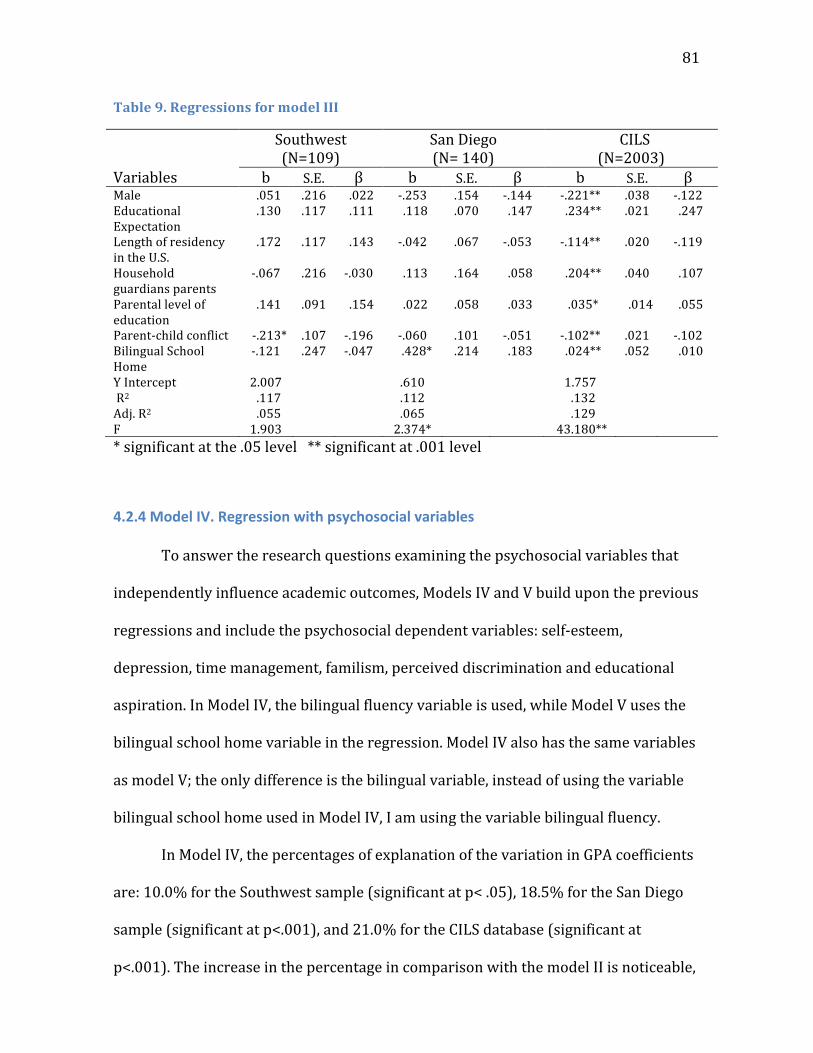
81
Table 9. Regressions for model III
Southwest (N=109)
San Diego (N= 140)
CILS (N=2003)
Variables b S.E. β b S.E. β b S.E. β Male .051 .216 .022 -‐.253 .154 -‐.144 -‐.221** .038 -‐.122 Educational Expectation
.130 .117 .111 .118 .070 .147 .234** .021 .247
Length of residency in the U.S.
.172 .117 .143 -‐.042 .067 -‐.053 -‐.114** .020 -‐.119
Household guardians parents
-‐.067 .216 -‐.030 .113 .164 .058 .204** .040 .107
Parental level of education
.141 .091 .154 .022 .058 .033 .035* .014
.055
Parent-‐child conflict -‐.213* .107 -‐.196 -‐.060 .101 -‐.051 -‐.102** .021 -‐.102 Bilingual School Home
-‐.121 .247 -‐.047 .428* .214 .183 .024** .052 .010
Y Intercept 2.007 .610 1.757 R2 .117 .112 .132 Adj. R2 .055 .065 .129 F 1.903 2.374* 43.180** * significant at the .05 level ** significant at .001 level
4.2.4 Model IV. Regression with psychosocial variables
To answer the research questions examining the psychosocial variables that
independently influence academic outcomes, Models IV and V build upon the previous
regressions and include the psychosocial dependent variables: self-‐esteem,
depression, time management, familism, perceived discrimination and educational
aspiration. In Model IV, the bilingual fluency variable is used, while Model V uses the
bilingual school home variable in the regression. Model IV also has the same variables
as model V; the only difference is the bilingual variable, instead of using the variable
bilingual school home used in Model IV, I am using the variable bilingual fluency.
In Model IV, the percentages of explanation of the variation in GPA coefficients
are: 10.0% for the Southwest sample (significant at p< .05), 18.5% for the San Diego
sample (significant at p<.001), and 21.0% for the CILS database (significant at
p<.001). The increase in the percentage in comparison with the model II is noticeable,
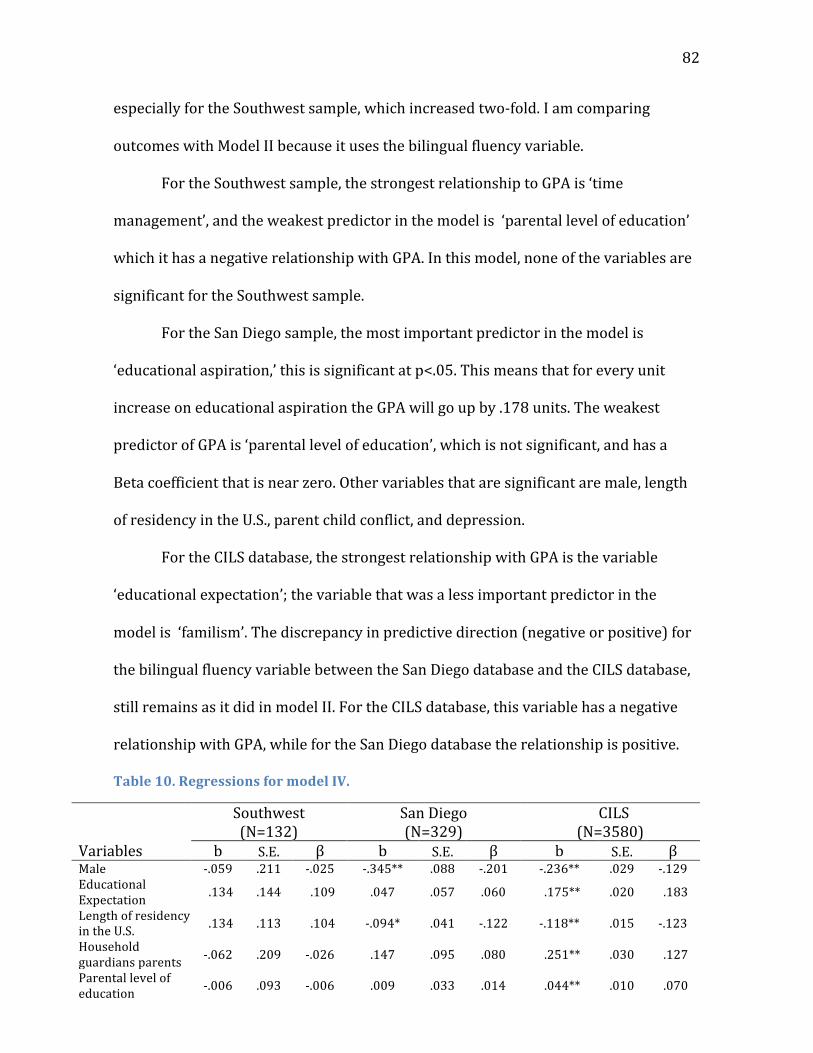
82
especially for the Southwest sample, which increased two-‐fold. I am comparing
outcomes with Model II because it uses the bilingual fluency variable.
For the Southwest sample, the strongest relationship to GPA is ‘time
management’, and the weakest predictor in the model is ‘parental level of education’
which it has a negative relationship with GPA. In this model, none of the variables are
significant for the Southwest sample.
For the San Diego sample, the most important predictor in the model is
‘educational aspiration,’ this is significant at p<.05. This means that for every unit
increase on educational aspiration the GPA will go up by .178 units. The weakest
predictor of GPA is ‘parental level of education’, which is not significant, and has a
Beta coefficient that is near zero. Other variables that are significant are male, length
of residency in the U.S., parent child conflict, and depression.
For the CILS database, the strongest relationship with GPA is the variable
‘educational expectation’; the variable that was a less important predictor in the
model is ‘familism’. The discrepancy in predictive direction (negative or positive) for
the bilingual fluency variable between the San Diego database and the CILS database,
still remains as it did in model II. For the CILS database, this variable has a negative
relationship with GPA, while for the San Diego database the relationship is positive.
Table 10. Regressions for model IV.
Southwest (N=132)
San Diego (N=329)
CILS (N=3580)
Variables b S.E. β b S.E. β b S.E. β Male -‐.059 .211 -‐.025 -‐.345** .088 -‐.201 -‐.236** .029 -‐.129 Educational Expectation .134 .144 .109 .047 .057 .060 .175** .020 .183
Length of residency in the U.S. .134 .113 .104 -‐.094* .041 -‐.122 -‐.118** .015 -‐.123
Household guardians parents -‐.062 .209 -‐.026 .147 .095 .080 .251** .030 .127
Parental level of education -‐.006 .093 -‐.006 .009 .033 .014 .044** .010 .070
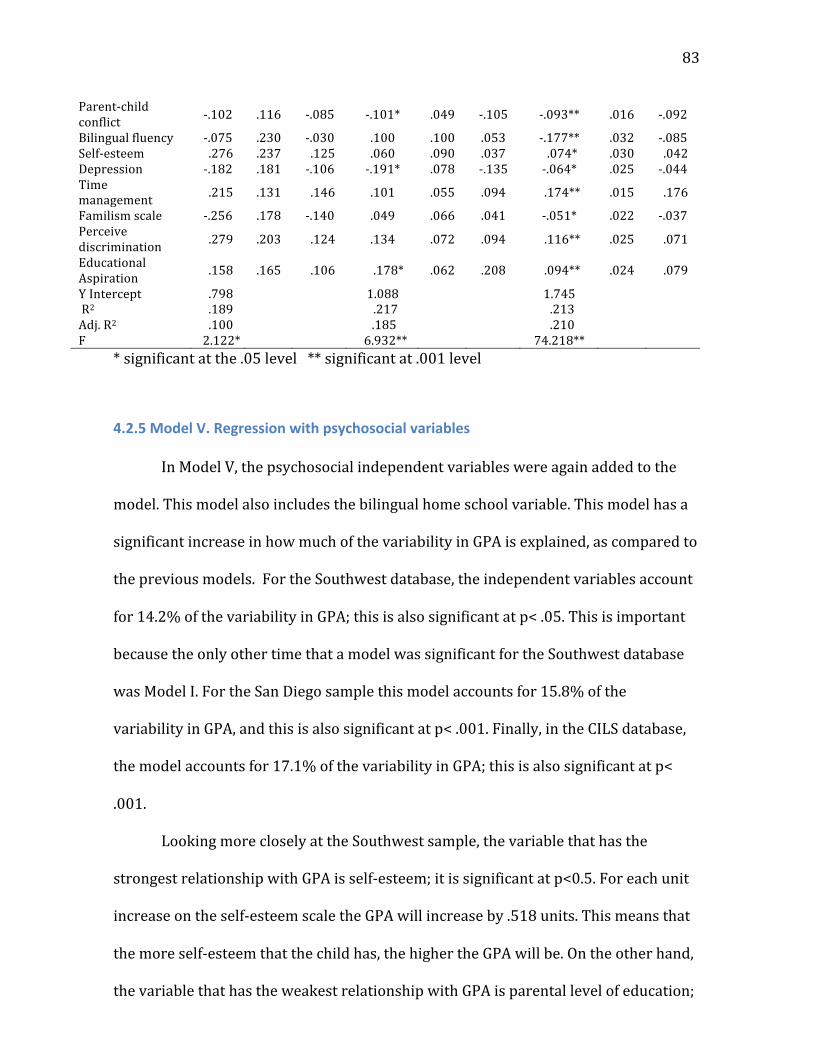
83
Parent-‐child conflict -‐.102 .116 -‐.085 -‐.101* .049 -‐.105 -‐.093** .016 -‐.092
Bilingual fluency -‐.075 .230 -‐.030 .100 .100 .053 -‐.177** .032 -‐.085 Self-‐esteem .276 .237 .125 .060 .090 .037 .074* .030 .042 Depression -‐.182 .181 -‐.106 -‐.191* .078 -‐.135 -‐.064* .025 -‐.044 Time management .215 .131 .146 .101 .055 .094 .174** .015 .176
Familism scale -‐.256 .178 -‐.140 .049 .066 .041 -‐.051* .022 -‐.037 Perceive discrimination .279 .203 .124 .134 .072 .094 .116** .025 .071
Educational Aspiration .158 .165 .106 .178* .062 .208 .094** .024 .079
Y Intercept .798 1.088 1.745 R2 .189 .217 .213 Adj. R2 .100 .185 .210 F 2.122* 6.932** 74.218**
* significant at the .05 level ** significant at .001 level
4.2.5 Model V. Regression with psychosocial variables
In Model V, the psychosocial independent variables were again added to the
model. This model also includes the bilingual home school variable. This model has a
significant increase in how much of the variability in GPA is explained, as compared to
the previous models. For the Southwest database, the independent variables account
for 14.2% of the variability in GPA; this is also significant at p< .05. This is important
because the only other time that a model was significant for the Southwest database
was Model I. For the San Diego sample this model accounts for 15.8% of the
variability in GPA, and this is also significant at p< .001. Finally, in the CILS database,
the model accounts for 17.1% of the variability in GPA; this is also significant at p<
.001.
Looking more closely at the Southwest sample, the variable that has the
strongest relationship with GPA is self-‐esteem; it is significant at p<0.5. For each unit
increase on the self-‐esteem scale the GPA will increase by .518 units. This means that
the more self-‐esteem that the child has, the higher the GPA will be. On the other hand,
the variable that has the weakest relationship with GPA is parental level of education;
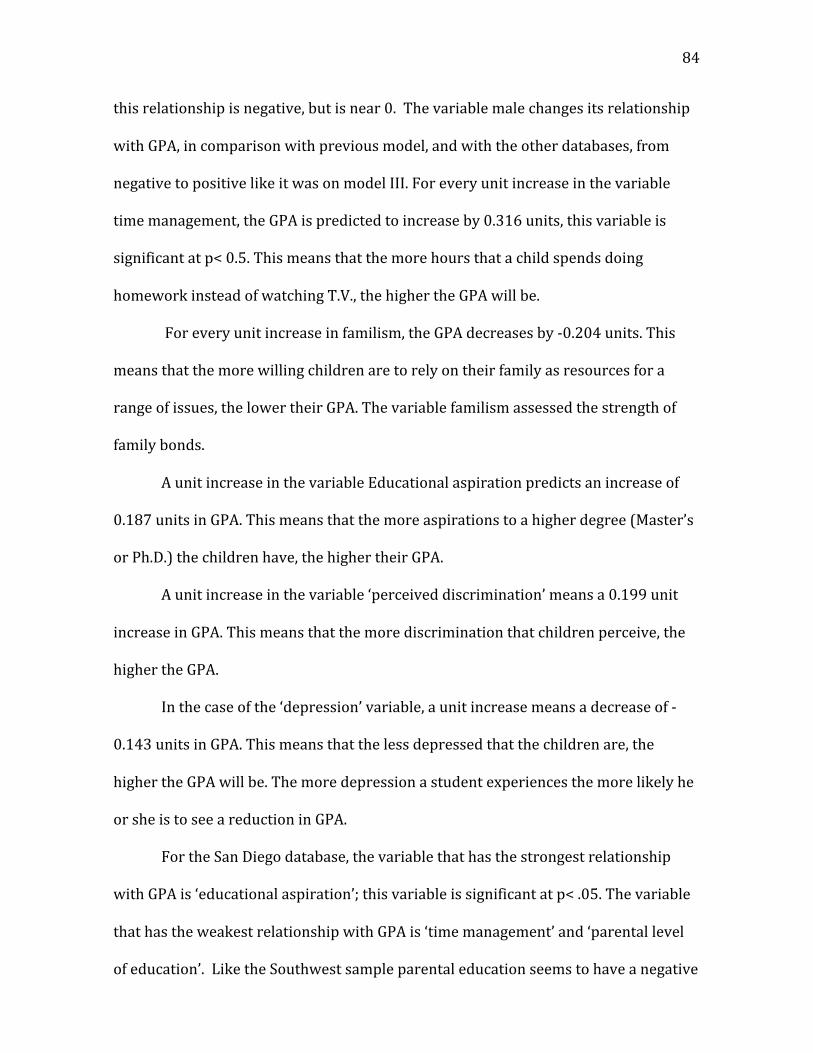
84
this relationship is negative, but is near 0. The variable male changes its relationship
with GPA, in comparison with previous model, and with the other databases, from
negative to positive like it was on model III. For every unit increase in the variable
time management, the GPA is predicted to increase by 0.316 units, this variable is
significant at p< 0.5. This means that the more hours that a child spends doing
homework instead of watching T.V., the higher the GPA will be.
For every unit increase in familism, the GPA decreases by -‐0.204 units. This
means that the more willing children are to rely on their family as resources for a
range of issues, the lower their GPA. The variable familism assessed the strength of
family bonds.
A unit increase in the variable Educational aspiration predicts an increase of
0.187 units in GPA. This means that the more aspirations to a higher degree (Master’s
or Ph.D.) the children have, the higher their GPA.
A unit increase in the variable ‘perceived discrimination’ means a 0.199 unit
increase in GPA. This means that the more discrimination that children perceive, the
higher the GPA.
In the case of the ‘depression’ variable, a unit increase means a decrease of -‐
0.143 units in GPA. This means that the less depressed that the children are, the
higher the GPA will be. The more depression a student experiences the more likely he
or she is to see a reduction in GPA.
For the San Diego database, the variable that has the strongest relationship
with GPA is ‘educational aspiration’; this variable is significant at p< .05. The variable
that has the weakest relationship with GPA is ‘time management’ and ‘parental level
of education’. Like the Southwest sample parental education seems to have a negative
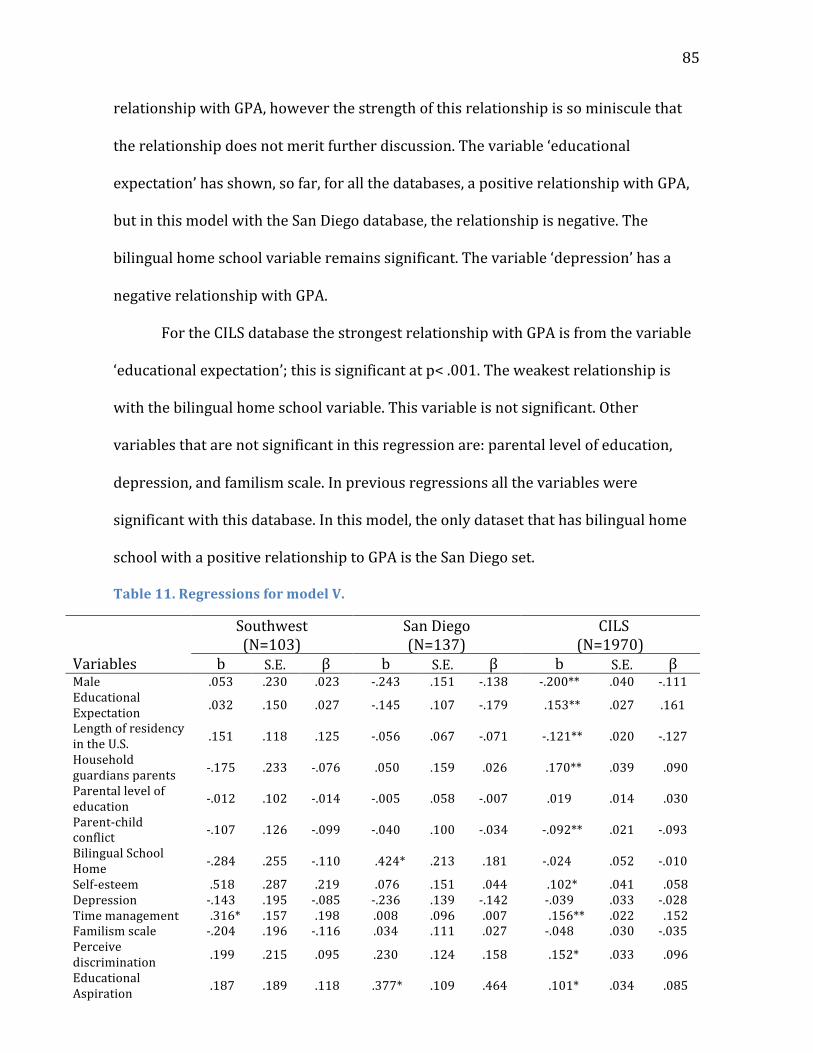
85
relationship with GPA, however the strength of this relationship is so miniscule that
the relationship does not merit further discussion. The variable ‘educational
expectation’ has shown, so far, for all the databases, a positive relationship with GPA,
but in this model with the San Diego database, the relationship is negative. The
bilingual home school variable remains significant. The variable ‘depression’ has a
negative relationship with GPA.
For the CILS database the strongest relationship with GPA is from the variable
‘educational expectation’; this is significant at p< .001. The weakest relationship is
with the bilingual home school variable. This variable is not significant. Other
variables that are not significant in this regression are: parental level of education,
depression, and familism scale. In previous regressions all the variables were
significant with this database. In this model, the only dataset that has bilingual home
school with a positive relationship to GPA is the San Diego set.
Table 11. Regressions for model V.
Southwest (N=103)
San Diego (N=137)
CILS (N=1970)
Variables b S.E. β b S.E. β b S.E. β Male .053 .230 .023 -‐.243 .151 -‐.138 -‐.200** .040 -‐.111 Educational Expectation .032 .150 .027 -‐.145 .107 -‐.179 .153** .027 .161
Length of residency in the U.S. .151 .118 .125 -‐.056 .067 -‐.071 -‐.121** .020 -‐.127
Household guardians parents -‐.175 .233 -‐.076 .050 .159 .026 .170** .039 .090
Parental level of education -‐.012 .102 -‐.014 -‐.005 .058 -‐.007 .019 .014 .030
Parent-‐child conflict -‐.107 .126 -‐.099 -‐.040 .100 -‐.034 -‐.092** .021 -‐.093
Bilingual School Home -‐.284 .255 -‐.110 .424* .213 .181 -‐.024 .052 -‐.010
Self-‐esteem .518 .287 .219 .076 .151 .044 .102* .041 .058 Depression -‐.143 .195 -‐.085 -‐.236 .139 -‐.142 -‐.039 .033 -‐.028 Time management .316* .157 .198 .008 .096 .007 .156** .022 .152 Familism scale -‐.204 .196 -‐.116 .034 .111 .027 -‐.048 .030 -‐.035 Perceive discrimination .199 .215 .095 .230 .124 .158 .152* .033 .096
Educational Aspiration .187 .189 .118 .377* .109 .464 .101* .034 .085
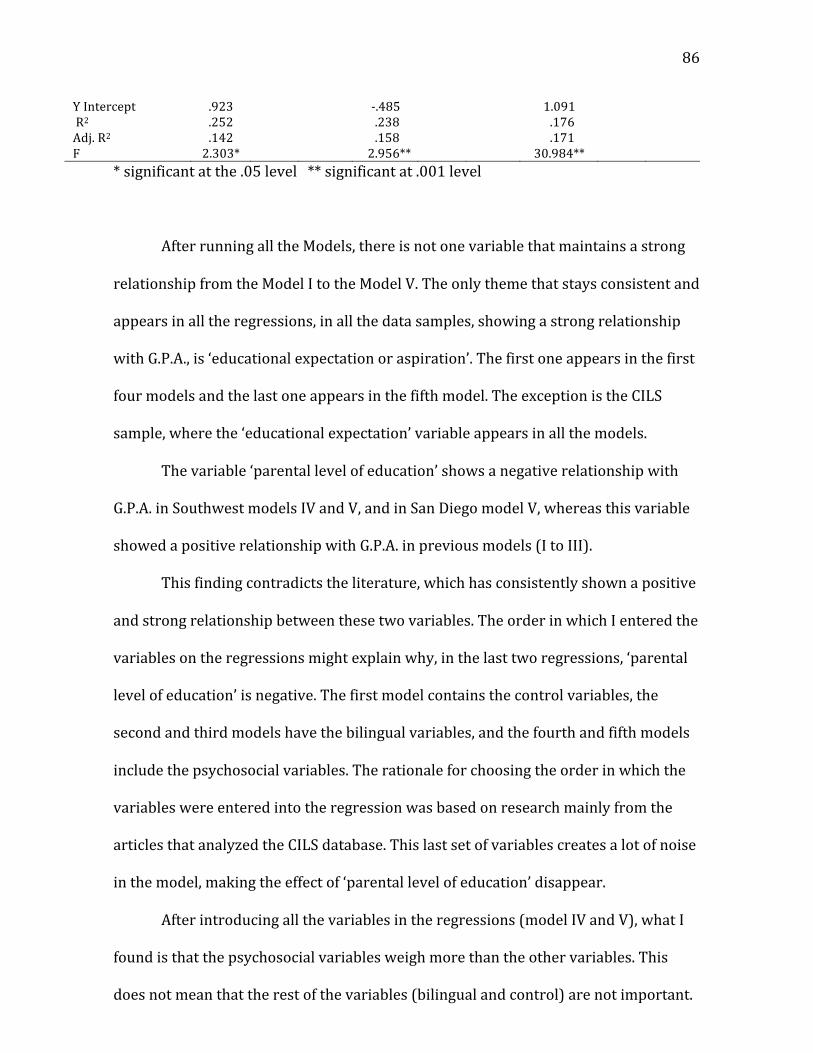
86
Y Intercept .923 -‐.485 1.091 R2 .252 .238 .176 Adj. R2 .142 .158 .171 F 2.303* 2.956** 30.984**
* significant at the .05 level ** significant at .001 level
After running all the Models, there is not one variable that maintains a strong
relationship from the Model I to the Model V. The only theme that stays consistent and
appears in all the regressions, in all the data samples, showing a strong relationship
with G.P.A., is ‘educational expectation or aspiration’. The first one appears in the first
four models and the last one appears in the fifth model. The exception is the CILS
sample, where the ‘educational expectation’ variable appears in all the models.
The variable ‘parental level of education’ shows a negative relationship with
G.P.A. in Southwest models IV and V, and in San Diego model V, whereas this variable
showed a positive relationship with G.P.A. in previous models (I to III).
This finding contradicts the literature, which has consistently shown a positive
and strong relationship between these two variables. The order in which I entered the
variables on the regressions might explain why, in the last two regressions, ‘parental
level of education’ is negative. The first model contains the control variables, the
second and third models have the bilingual variables, and the fourth and fifth models
include the psychosocial variables. The rationale for choosing the order in which the
variables were entered into the regression was based on research mainly from the
articles that analyzed the CILS database. This last set of variables creates a lot of noise
in the model, making the effect of ‘parental level of education’ disappear.
After introducing all the variables in the regressions (model IV and V), what I
found is that the psychosocial variables weigh more than the other variables. This
does not mean that the rest of the variables (bilingual and control) are not important.

87
It also means that, because the bilingual variables were entered with other variables,
they are not relevant at this point. The bilingual variables may have had a different
effect if they had been entered in a different order or with other variables.
The findings from the models that assessed the relationship between G.P.A.
and the bilingual variables as well as the psychosocial variables will be discussed in
the next chapter.
88
CHAPTER 5: DISCUSSION & CONCLUSION
The purpose of this study was to investigate whether the segmented
assimilation model proposed by Portes and Rumbaut (2001) was applicable to a
Southwest sample of students when replicating the survey portion of the original CILS
study. In their findings, Portes and Rumbaut (2001) identified that parental SES, being
raised in an intact family, sex (being female), and being bilingual were all strongly
related to increased academic achievement. On the other hand, being born in the U.S.
and length of residency in the U.S. for the foreign-‐born, resulted in a decrease in
academic achievement, but an increase in participants’ English skills. In the following
chapter I will review the findings from the previous chapter and discuss how these
findings answer my research question. Additionally, I will offer recommendations for
future policy, practice, and research based on the findings of this study.
5.1 Findings
5.1.1 Bilingualism and Academic Outcomes
Research question 1 asked: What are the influences of non-‐English language
maintenance and bilingualism on academic achievement? Models II and III were
designed to address this question, and each of these regressions only added one of the
bilingual independent variables into the model in addition to the control variables.
Table 12 visually depicts the major findings of the regression models. Examining
Model II, the findings demonstrate that the bilingual fluency variable does not have a
strong relationship with GPA in any of the samples. Bilingual fluency was created
using the question that Portes and Rumbaut used to create their bilingual variables.
The control variable that played the most salient role in predicting GPA was
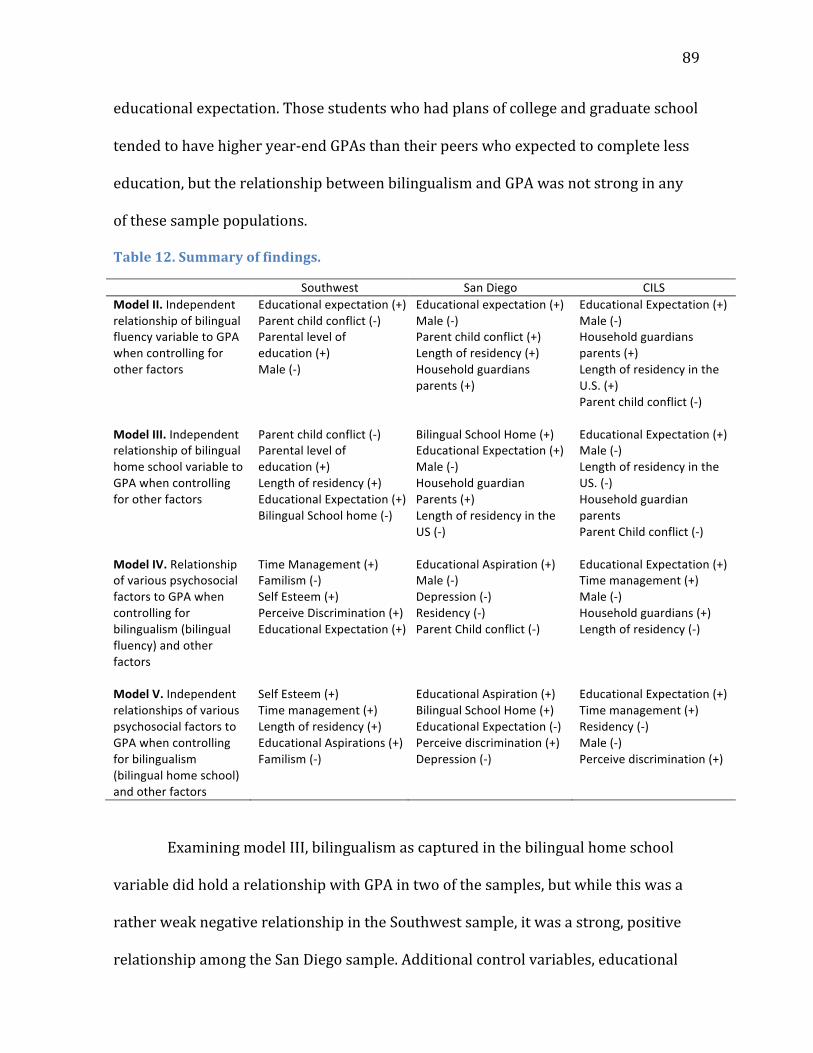
89
educational expectation. Those students who had plans of college and graduate school
tended to have higher year-‐end GPAs than their peers who expected to complete less
education, but the relationship between bilingualism and GPA was not strong in any
of these sample populations.
Table 12. Summary of findings.
Southwest San Diego CILS Model II. Independent relationship of bilingual fluency variable to GPA when controlling for other factors
Educational expectation (+) Parent child conflict (-‐) Parental level of education (+) Male (-‐)
Educational expectation (+) Male (-‐) Parent child conflict (+) Length of residency (+) Household guardians parents (+)
Educational Expectation (+) Male (-‐) Household guardians parents (+) Length of residency in the U.S. (+) Parent child conflict (-‐)
Model III. Independent relationship of bilingual home school variable to GPA when controlling for other factors
Parent child conflict (-‐) Parental level of education (+) Length of residency (+) Educational Expectation (+) Bilingual School home (-‐)
Bilingual School Home (+) Educational Expectation (+) Male (-‐) Household guardian Parents (+) Length of residency in the US (-‐)
Educational Expectation (+) Male (-‐) Length of residency in the US. (-‐) Household guardian parents Parent Child conflict (-‐)
Model IV. Relationship of various psychosocial factors to GPA when controlling for bilingualism (bilingual fluency) and other factors
Time Management (+) Familism (-‐) Self Esteem (+) Perceive Discrimination (+) Educational Expectation (+)
Educational Aspiration (+) Male (-‐) Depression (-‐) Residency (-‐) Parent Child conflict (-‐)
Educational Expectation (+) Time management (+) Male (-‐) Household guardians (+) Length of residency (-‐)
Model V. Independent relationships of various psychosocial factors to GPA when controlling for bilingualism (bilingual home school) and other factors
Self Esteem (+) Time management (+) Length of residency (+) Educational Aspirations (+) Familism (-‐)
Educational Aspiration (+) Bilingual School Home (+) Educational Expectation (-‐) Perceive discrimination (+) Depression (-‐)
Educational Expectation (+) Time management (+) Residency (-‐) Male (-‐) Perceive discrimination (+)
Examining model III, bilingualism as captured in the bilingual home school
variable did hold a relationship with GPA in two of the samples, but while this was a
rather weak negative relationship in the Southwest sample, it was a strong, positive
relationship among the San Diego sample. Additional control variables, educational
90
expectation and length of residency in the U.S. appeared among the five strongest
independent variables to dependent variable relationships across all three data
samples. Reviewing the literature I explain bellow the possible reasons to understand
the contradictory relationships between bilingualism and GPA outcomes seen
between the Southwest and San Diego samples.
Portes and Hao (1998) described in their study the factors that influence
bilingualism, and maintenance of primary language among immigrants. They found
that primary (non-‐English) language spoken at home and with friends of one’s
national origin played an important role in first language maintenance and long-‐term
bilingualism. They also found a negative relationship between retention of one’s
primary language and length of U.S. residency. However, for those who did achieve
bilingualism they experienced strong advantages in academic achievement, which
Portes and Hao found they could independently attribute to bilingualism.
The bilingual school home variable used in this study accounts for the extent
to which participants spoke a non-‐English language at home and with friends at
school, which may help to explain its strong relationship with GPA in the San Diego
sample. In the case of the Southwest sample, the relationship with GPA is negative, but
the relationship is quite weak, and the contradictory results could be attributed to the
small sample size. The weak negative relationship could change to positive with a
larger sample and the result could be similar to the San Diego sample case.
Alternatively, the results could be attributed to the way the variables were measured.
Another point to consider is that both of these samples (Southwest and San Diego) are
generally monocultural and reside in areas with tightly knit, relatively insular
91
Mexican/Mexican American communities which provide support for Spanish
language maintenance.
In order to understand the bilingualism results better, it is necessary to
consider some external factors that play an important role in, and are directly related
to, bilingualism in schools. The first factor to consider is the political context at the
time when the survey was administered (during 2006-‐2007), in particular the
language policy in the state where the southwest sample was located. A few years
before this survey was administered, the state passed a proposition eliminating
bilingual education in public schools, and replacing bilingual education with an
English-‐only language policy. The climate in educational policy was one of
stigmatization of foreign languages, in particular Spanish because it was the foreign
language most often spoken (Gandara and Orfield, 2012). Structured English
Immersion (SEI) became the new, state-‐mandated instructional approach to teach
English language learners (ELLs) (Combs 2012).
As summarized in the educational literature, “the SEI language policy reflected
the dominant societal discourse of assimilation and monolingualism, grounding
classroom instruction in mainstream cultural and linguistic conformity rather than
the tenets of second language acquisition” (Heineke, 2014, p.3) In comparison, the San
Diego sample was collected before a similar proposition (227) in another state
(California) was passed. In both cases the states had created subtractive conditions
for bilingual education.
This political climate also could explain the statistically weak relationship
between bilingualism and academic achievement in the Southwest sample. These
language policies look at bilingual and ELL children from a deficit point of view. Other
92
conditions that influenced the outcomes and are not captured by this survey are
teachers, instructional practices, resources, and the available funding that schools and
teachers can deploy to enrich the educational environment. These factors have to be
considered when conducting studies related to bilingualism and children of
immigrants.
Finally, this measure of bilingualism was done with self-‐reported data that
might present some lack of validity and reliability. Portes and Rumbaut claim that
self-‐reported data on language use are considered reliable and they cite a study
conducted in the late 60’s (1969) by Fishman, and another study by Fishman and
Terry from the same year (Portes and Rumbaut 2001). Future studies should
consider a better way to perform this type of complex language analysis. Let’s
remember that languages do not only transmit words, but they shape and transfer
sets of values and cultural ideas as well as ways of thinking (Nieto, 2007).
Consequently, reducing students’ ability to learn through their heritage languages
constitutes a reduction in their social status, and attack on their cultural wealth. As
Ronald Schimdt indicates, ‘English Only’ policies maintain social inequality between
diverse ethnolinguistic groups, who are in their own right American, in a effort to
make the U.S. an English-‐monolingual country (Schmidt, 2002) This kind of climate in
schools does not help students to practice or learn a second language. Therefore, we
should also consider that being bilingual must not always be favorable or inhibiting under
all circumstances, regardless of the concrete conditions of child learning and development.
5.1.2 Psychosocial Factors and Academic Outcomes
Research Question 2 explored which psychosocial factors affect the academic
achievement of students in the Southwest sample as compared to the other samples,
93
and when controlling for bilingualism, educational beliefs, and family characteristics,
Models IV and V were designed to answer this question, and the only difference
between the two models is the type of bilingual variable input into the regression,
bilingual fluency (Model IV) and bilingual home school (Model V). In both models
three psychosocial variables held strong relationships with GPA for the Southwest
sample, regardless of the bilingual control variable used in the regression and sample
size variations: time management, familism, and self-‐esteem.
Pedro Portes (1999) also identified these three psychosocial variables as
influencing GPA, but in his research he found all three to have a positive relationship
with GPA. While spending more time focused on one’s homework as compared to
hours in front of the television and having a positive self-‐esteem both intuitively lead
to the prediction of a higher GPA, it is necessary to further discuss the familism
finding. Potentially, one of the reasons why familism has a negative relationship to
GPA could be related to the sample size. The San Diego sample saw a positive, though
relatively weak relationship between familism and GPA. At the same time, one could
make the argument that this scaled variable is not a perfect measurement of the level
of family support one received, but rather a scale that measures one’s preference for
relying on family as compared to external ties or individual strengths when problems
or challenges arise. Perhaps, the negative relationship is indicative of the children in
the Southwest sample relying on individualism. I see this as another measurement of
acculturation into a society that reinforces individualism and self decision-‐making
processes, and may lead one to distance his or herself from family support that could
produce enhanced academic outcomes.
94
While the psychosocial variable ‘perceived discrimination’, from a statistical
point of view, did not show a strong relationship in both models for the Southwest
sample (it was stronger in Model IV), it did have a positive relationship with G.P.A.
across the two models, and showed a strong relationship with G.P.A. for both the San
Diego and CILS sample in Model V. While there may not have been statistical
significance, this does not mean that it is not important. Statistically, this finding
contradicts the work of Portes (1999), who found the opposite effect on academic
outcomes. However, they reaffirm the findings of Kasinitz et al. (2008) depicted in
Chapter 2, Figure 3, where the predicted outcome for upwardly mobile Hispanics
facing discrimination in school refers to “trying harder,” (p. 326).
Finally, although not a psychosocial variable, it is important to note that in
Models IV and V, despite controlling for a host of psychosocial variables, either the
control variable educational expectations or educational aspirations held a strong,
positive relationship with academic outcomes in every sample. Clearly,
simultaneously helping students to realize their academic potential and set high goals
for their educational attainment is a positive step toward enhancing academic
outcomes.
The last two models (IV and V) where I included the psychosocial variables
created a different dynamic, where the control and bilingual variables moved to a
secondary role, showing that the psychosocial variables have a stronger influence on
G.P.A. The bilingual and control variables are still important, but not as salient as the
psychosocial variables.
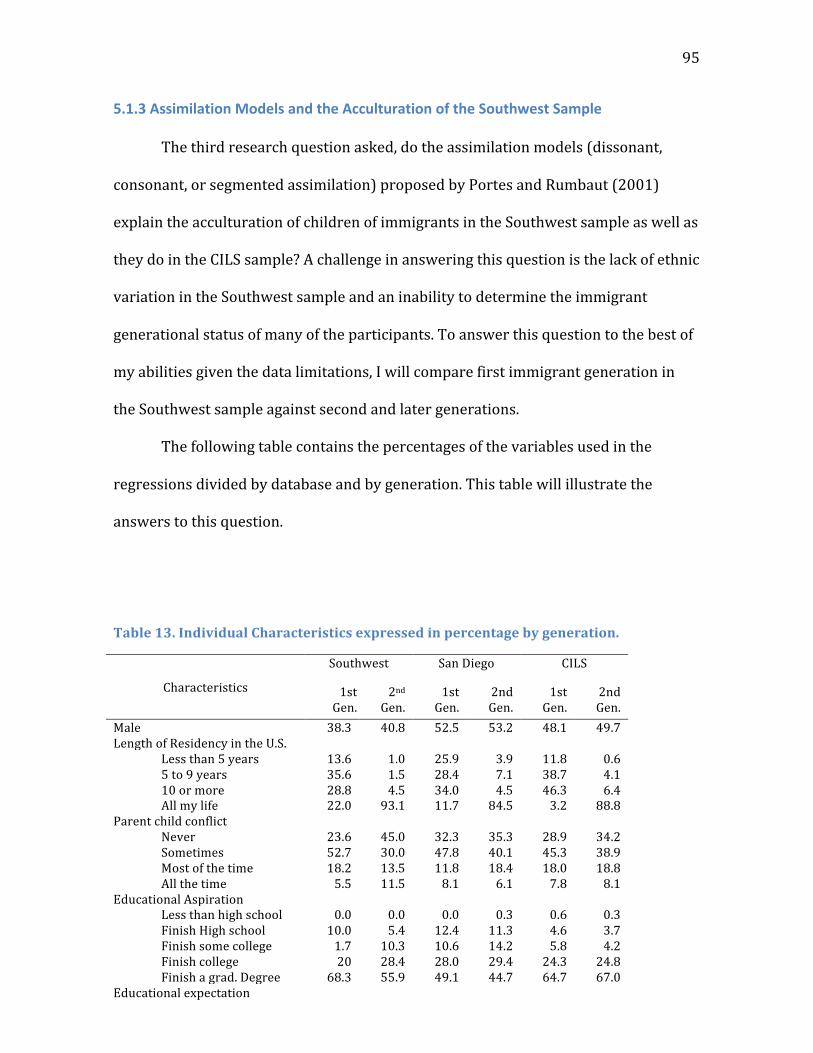
95
5.1.3 Assimilation Models and the Acculturation of the Southwest Sample
The third research question asked, do the assimilation models (dissonant,
consonant, or segmented assimilation) proposed by Portes and Rumbaut (2001)
explain the acculturation of children of immigrants in the Southwest sample as well as
they do in the CILS sample? A challenge in answering this question is the lack of ethnic
variation in the Southwest sample and an inability to determine the immigrant
generational status of many of the participants. To answer this question to the best of
my abilities given the data limitations, I will compare first immigrant generation in
the Southwest sample against second and later generations.
The following table contains the percentages of the variables used in the
regressions divided by database and by generation. This table will illustrate the
answers to this question.
Table 13. Individual Characteristics expressed in percentage by generation.
Characteristics
Southwest San Diego CILS
1st Gen.
2nd Gen.
1st Gen.
2nd Gen.
1st Gen.
2nd Gen.
Male 38.3 40.8 52.5 53.2 48.1 49.7 Length of Residency in the U.S.
Less than 5 years 13.6 1.0 25.9 3.9 11.8 0.6 5 to 9 years 35.6 1.5 28.4 7.1 38.7 4.1 10 or more 28.8 4.5 34.0 4.5 46.3 6.4 All my life 22.0 93.1 11.7 84.5 3.2 88.8
Parent child conflict Never 23.6 45.0 32.3 35.3 28.9 34.2 Sometimes 52.7 30.0 47.8 40.1 45.3 38.9 Most of the time 18.2 13.5 11.8 18.4 18.0 18.8 All the time 5.5 11.5 8.1 6.1 7.8 8.1
Educational Aspiration Less than high school 0.0 0.0 0.0 0.3 0.6 0.3 Finish High school 10.0 5.4 12.4 11.3 4.6 3.7 Finish some college 1.7 10.3 10.6 14.2 5.8 4.2 Finish college 20 28.4 28.0 29.4 24.3 24.8 Finish a grad. Degree 68.3 55.9 49.1 44.7 64.7 67.0
Educational expectation
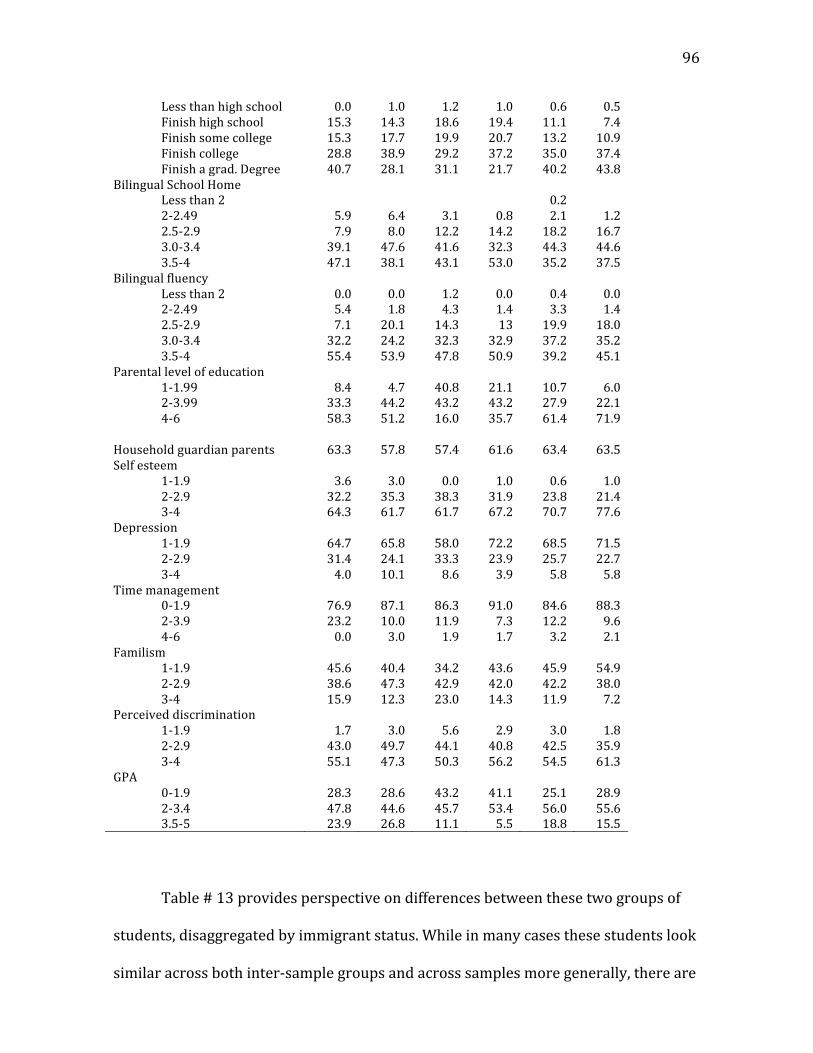
96
Less than high school 0.0 1.0 1.2 1.0 0.6 0.5 Finish high school 15.3 14.3 18.6 19.4 11.1 7.4 Finish some college 15.3 17.7 19.9 20.7 13.2 10.9 Finish college 28.8 38.9 29.2 37.2 35.0 37.4 Finish a grad. Degree 40.7 28.1 31.1 21.7 40.2 43.8
Bilingual School Home Less than 2 0.2 2-‐2.49 5.9 6.4 3.1 0.8 2.1 1.2 2.5-‐2.9 7.9 8.0 12.2 14.2 18.2 16.7 3.0-‐3.4 39.1 47.6 41.6 32.3 44.3 44.6 3.5-‐4 47.1 38.1 43.1 53.0 35.2 37.5
Bilingual fluency Less than 2 0.0 0.0 1.2 0.0 0.4 0.0 2-‐2.49 5.4 1.8 4.3 1.4 3.3 1.4 2.5-‐2.9 7.1 20.1 14.3 13 19.9 18.0 3.0-‐3.4 32.2 24.2 32.3 32.9 37.2 35.2 3.5-‐4 55.4 53.9 47.8 50.9 39.2 45.1
Parental level of education 1-‐1.99 8.4 4.7 40.8 21.1 10.7 6.0 2-‐3.99 33.3 44.2 43.2 43.2 27.9 22.1 4-‐6 58.3 51.2 16.0 35.7 61.4 71.9
Household guardian parents 63.3 57.8 57.4 61.6 63.4 63.5 Self esteem
1-‐1.9 3.6 3.0 0.0 1.0 0.6 1.0 2-‐2.9 32.2 35.3 38.3 31.9 23.8 21.4 3-‐4 64.3 61.7 61.7 67.2 70.7 77.6
Depression 1-‐1.9 64.7 65.8 58.0 72.2 68.5 71.5 2-‐2.9 31.4 24.1 33.3 23.9 25.7 22.7 3-‐4 4.0 10.1 8.6 3.9 5.8 5.8
Time management 0-‐1.9 76.9 87.1 86.3 91.0 84.6 88.3 2-‐3.9 23.2 10.0 11.9 7.3 12.2 9.6 4-‐6 0.0 3.0 1.9 1.7 3.2 2.1
Familism 1-‐1.9 45.6 40.4 34.2 43.6 45.9 54.9 2-‐2.9 38.6 47.3 42.9 42.0 42.2 38.0 3-‐4 15.9 12.3 23.0 14.3 11.9 7.2
Perceived discrimination 1-‐1.9 1.7 3.0 5.6 2.9 3.0 1.8 2-‐2.9 43.0 49.7 44.1 40.8 42.5 35.9 3-‐4 55.1 47.3 50.3 56.2 54.5 61.3
GPA 0-‐1.9 28.3 28.6 43.2 41.1 25.1 28.9 2-‐3.4 47.8 44.6 45.7 53.4 56.0 55.6 3.5-‐5 23.9 26.8 11.1 5.5 18.8 15.5
Table # 13 provides perspective on differences between these two groups of
students, disaggregated by immigrant status. While in many cases these students look
similar across both inter-‐sample groups and across samples more generally, there are
97
some results that are important to notice. The first generation participants in the
Southwest sample have higher educational aspirations than those in the second or
more generations. A drop in aspirations the longer you are here is a consistent with
Portes and Rumbaut findings (Portes & Rumbaut, 2001). While 68.3% of first-‐
generation students would like to finish a graduate degree, only 55.9% of second or
later generation students indicated the same. This shows a desire for higher education
among the first generation. If we look at the educational expectations within the
Southwest sample the findings look similar with 40.7% of the first generation
believing that they will get a graduate degree in comparison with a 28.1% for the
second and later generations category.
If we used the bilingual Home School variable to gain a sense how these
children are managing two languages we can notice a difference of nine percent for
the children who demonstrate the highest measures of bilingualism, with the first
generation immigrants higher on this scale than their second generation or greater
counterparts. This is particularly interesting because all monolingual participants
were excluded from the sample. Using the bilingual fluency variable we notice a
similar difference with 87.6% of first generation immigrants in the Southwest sample
scoring a 3 or higher, as compared to only 78.1% of second or more generational
students.
The parental level of education is another category that the first-‐generation
children in the Southwest sample score higher on in comparison with the second and
later generations, with more having completed or enrolled in some form of higher
education. Comparing these findings with that of the San Diego sample, the Southwest
sample as a whole has a much higher level of parental educational attainment, and the
98
gap is particularly salient between the first-‐generation immigrants in the two samples
(40%+ for higher education attainment), which indicates that the Southwest
immigrant families who arrived in the late 1990s and early 2000s were far more
educated than those who arrived in San Diego a decade or so earlier, as there is a
fifteen years difference between the administration of both surveys, which is
reflective of the economic conditions and labor markets at the time of immigration in
both cities.
Across all databases first generation immigrants appear to have better time
management than those in the second and later generations, meaning that they focus
more on homework and less on television. Among the Southwest sample this
difference is 13%.
First generation children in the Southwest sample show higher levels of
perceived higher discrimination (55.1%) than the second or later generations
(47.3%). The opposite was found among the other two samples which may be
explained by the survey administration timeframes and the sentiment at the time
against Mexican immigration and the policies in place especially the “English language
only” rules at the schools.
In summary, the first generation Southwest children show higher percentages
expecting to obtain a graduate degree, higher levels of bilingualism in both of the
bilingual variables, higher levels of parental education (cultural capital), and more
time spent doing homework. All of these measures suggest that the first generation
Southwest population will acculturate to the consonant or selective model.
Parental resources like higher education, intact families, economic status, lead
towards consonant or selective acculturation. The first generation in the Southwest
99
sample shows higher levels of parental education, 63.3% of parents as a head of the
household and from the demographic characteristic of the sample (Table 5) we can
get the percentage of home ownership that in the Southwest sample is high. All of
these signs indicate that the first generation will proceed with a selective
acculturation.
However, perceived discrimination—of which the Southwest first generation
sample has encountered higher levels—could lead to different and perhaps less
successful modes of acculturation. It will depend on how families confront these
barriers. If they are confronted directly by the children without support it may lead to
a dissonant acculturation; if they are confronted with the support of the family the
acculturation would be consonant, and finally if they are confronted with the support
of the family and the community it would lead to a selective acculturation (Portes and
Rumbaut 2001). With the information available from the survey, it is not possible to
determine how the discrimination is being confronted by the children, it requires
interviews to find enough information that will let us determine if there is any kind of
support to contest discrimination.
A concept that is necessary to include in any future study of immigrant families
is transnationalism. This social concept arose due to the different possibilities
(internet, phone and other media) that make it easier nowadays to maintain contact
with the home country. Transnationalism is defined as “the long term ties that
migrants maintain with friends and family in their home country through
communications, email, phone, video, visits, and economic activities” (Mouw, Chavez,
Edelblute, & Verdey, 2014). This exchange generates social ties with the societies that
migrants left behind. Online media allow youth to create a multilayered identity, using
100
local and trans-‐local networks which let them learn from, and contribute to, cultural
ideologies and languages (Lam & Warriner 2012).
Doubtless, these youth digital practices affect the Portes and Rumbaut model
of incorporation. These identities that change according to the circumstances are not
easy to fit in the Portes proposed model with a limited number of paths. It is
necessary to have a model that allows for several paths of adaptation to the U. S.
culture. Transnationalism helps immigrants and children of immigrants to maintain
their cultures and languages, allowing them to live in two societies, while only being
physically present in one (Lam & Warriner, 2012). Transnationalism, as a set of
practices, also implies that children of immigrants have more than one way to practice
their home languages. In order to fully comprehend the impact of transnational
practices on the Portes and Rumbaut model, it would be necessary to re-‐visit the
survey instrument, as I elaborated later on this chapter in addressing the implications
for future research section, with an eye to capturing data on communication practices.
Such data could help create a more multi-‐dimensional picture of bilingualism and
biculturality.
5.2 Implications for theory
The present study uses the Portes and Rumbaut (2001) theory of segmented
assimilation to examine the academic outcomes for immigrant youth and the children
of immigrants with a new sample of Mexican origin. Considering the findings from the
Southwest sample, it is apparent that first generation immigrant children exhibit high
levels of cultural capital in the way of bilingualism, high levels of parental education
and habits of study (hours studying vs. watching T.V.) These are signs of a consonant
or selective acculturation as suggested by Portes and Rumbaut but these students are
101
still facing high levels of discrimination that may moderate their pathways of
adaptation. The present findings suggest that the segmented assimilation model may
be more context-‐specific than originally proposed. Each of the three locations
featured in this study represent different social conditions and political environments
that shape the modes of acculturation, and these conditions or environments may
change rapidly, creating new and unforeseen contexts for adaptation.
The Portes and Rumbaut study involved participants already in the process of
acculturation, but did little to account for the changing conditions faced upon arrival
to the U.S. and how much these conditions improved or deteriorated while they were
on their paths of adaptation to the habits and customs of the new society. Their first
survey, used in the present study, also does not account for possible factors that could
have an important value or change in their lives.
The segmented assimilation model proposed by Portes and Rumbaut only
includes 4 different assimilation pathways (consonant, dissonant, selective and
downward). This model is an improvement from the one proposed by Gordon (1964)
in the 60’s, which only allowed for one way to assimilate, but is still not enough to
capture the different paths that immigrant children and children of immigrants take,
while adapting to this society, in particular in schools. For example, findings from
CILS secondary data analysis, conducted by Rios-‐Aguilar, Gonzales Canche and Portes
(2014), indicate that there are multiple paths of adaptation. Some scholars (e. g.,
Cammarota, 2008; Mendoza-‐Denton, 2008) do not use the term adaptation to refer to
the negotiation process that youth go through. They acknowledge that youth use
different strategies that change according to the social or spatial environment or
situation. In the same way that immigrants and children of immigrants negotiate with
102
the society, the non-‐immigrant population also acquires some practices and customs
from the incoming groups. The influence of these two groups (immigrants and locals)
is reciprocal.
The idea of assimilation to a slot (white elite) in U.S. society, in order to
experience “success,” is not logical, because American society, both today and
historically, exhibits persistent disparities. They are not unbreakable categories, but
there are enormous obstacles for those trying to leave this lowest income level. The
message for new immigrants is to assimilate to the white elite niche. This is not often
possible, since communities that have been living here for many generations cannot
move fluidly into an elite space; a newly-‐ arrived immigrant will have a harder time.
The American social status system is racialized from the beginning, making the
idea of assimilation for new immigrants doubtful, an idealization of the ‘American
dream’ that is not possible for the majority. All this means that, while Portes and
Rumbaut’s theory offers a valuable perspective on social change, it may not be
sufficient, as is, to address the complexity of today’s immigrant youth in schools and
society.
5.3 Implications for policy and practice
In this subsection I will address the implications of this study, divided by each
research question.
For the first research question, regarding the influence of bilingualism on GPA,
Model III found a positive relationship between the bilingual school home variable
and GPA in the San Diego database. Since there is an advantage that bilingual children
will display in academic achievement (Portes & Hao 1998), state departments of
education should create policies that:
103
a. Encourage language maintenance among non-‐English speakers (Rios-‐
Aguilar, Gonzalez-‐Canche, Moll 2010)
b. Remove content-‐poor policies like “Structured English Immersion” that
discourage and devalue one’s first language, if not English (Ma 2002)
c. Lift bans on teacher use of a non-‐English language
Policies like these may cause students to feel shame, embarrassment, or resentment
over their non-‐English language leading them to perceive that their first language is
not valued in the schools and may be viewed as a threat. This sort of message, either
explicit (visible) or implicit (implied, through actions, not overt), does not encourage
bilingualism; it only serves to discourage it, and with it the possibilities of developing
a formidable academic asset, fluency and literacy in two languages (Gandara & Orfield
2010).
If the idea of education is to enhance student knowledge, schools should
implement means of:
a. Encouraging students to maintain their first language (Rios-‐ Aguilar, Gonzalez-‐
Canche, Moll 2010)
b. Viewing a language other than English as a student's asset, rather than as a deficit
Communities with concentrated language diversity, San Diego, Miami, or the
one where the Southwest study took place, offer an educational opportunity to
students in their schools. In these schools, students can reinforce school language
learning with sociocultural interactions in extra-‐curricular, community settings,
creating a particularly strong environment for the long-‐term development of
multilingualism. It is important to remember that in less linguistically diverse school
systems, students must access various forms of media, sometimes at a cost, in order to
104
simulate this same effect of linguistic enrichment. Thus, schools would benefit from
taking advantage of the learning opportunities offered by their neighborhood
resources, if they want to serve students well and allocate their funds efficiently.
In relation to the second research question addressed in the present study,
some psychosocial variables rose to the top and were strongly connected to academic
achievement, regardless of bilingual status. Two of the strongest were time
management and self-‐esteem. On the other hand, the familism variable is weaker, and,
as Portes (1999) mentions, is harder to contextualize. However, time management
and self-‐esteem were positive, regardless of the model. As a result of these findings, it
seems reasonable to recommend that schools:
a. Work with children and their families to encourage homework time over TV/
computer or game time (Xu & Wu 2013).
b. Teach students time management strategies, giving priority to academics (Xu &
Wu 2013).
c. Encourage teachers to cultivate self-‐esteem in the classroom, setting high
expectations and encouraging students to reach their potential (Shi & Sam
2012). Also, educators should be helping students find their niche—noticing
where they demonstrate unusual skill, or where they excel. They should use that
niche to improve teaching and increase ease and fluidity in the learning
environment.
Using the funds of knowledge theory (Gonzalez, Moll, & Amanti 2005), educators
should learn about what students are familiar with or knowledgeable about in their
home environments, so that the educators can scaffold students’ attempts to build
new knowledge, using examples of things that students know. This requires that
105
teachers have knowledge and understanding the lives of students outside of school.
For the third research question in this study, while regression modeling could
not be done to examine the acculturation processes between first and second or more
generation immigrants, we do see some important differences between the two
groups. Perhaps most striking is that more recent immigrant youth seem to have a)
higher GPA, and b) higher academic expectations and aspirations (findings earlier in
the dissertation showed that these link to GPA). Since the enthusiasm for education
appears to be higher in this group, schools should work to maintain such positive
perceptions of educational attainment and try to cultivate them among their other
peers. Having a partnership with a local university might be one way to assist in these
efforts. When university students come to the primary and secondary school campus,
and young students visit the university campus, a continuum of steps to attend college
will be created. State departments of education should ensure that each school makes
a visit to a university at least once a year (Coller & Kou 2014). Also, the department of
education should make it mandatory for universities to maintain a physical presence
in schools, as a way to engage them in their communities. These visits should be
mandatory for all units, as part of their service to the university community, not only
for colleges of education.
After discussing the policy implications specifically for each of the research
questions, I would like to address some current events that are closely related with
policy and have nation-‐wide consequences for the immigrants as well as the
relationship between them and the rest of the non-‐immigrant population.
Over the past year, there have been thousands of minors detained for crossing
the border without the legal documentation (Euliuch 2014). These youth have been
106
placed in temporary detention centers. Witnessing the passivity that authorities have
demonstrated by not taking any direct actions aimed to solve this problem may
further exacerbate immigrant children’s perception that they are unwelcome and
insignificant. These authorities also need to consider, at the moment of understanding
how families, including the youth (like the participants in this study) who speak
another language besides English, perceive the community or town where they are
living. In addition, the negative reaction of some communities to the idea of hosting
these children until the public institutions process their cases most likely intensifies
such feelings of rejection. How will youth be impacted at school if they know that one
of their relatives or friends is going through these situation just described? This is a
psychosocial condition that merits close attention..
5.4 Implications for future research
Replicating a study such as this one would be enhanced by designing at
minimum a follow-‐up survey to determine how the participants are faring
academically and socially at the end of their high school careers. Interviewing a small
sample of participants to better understand the process of acculturation that these
children of immigrants are going through would also enhance the study design.
Finally, observations at the school and/or at home would allow the researcher (or
ideally, a research team), to have a more complete picture of the whole. All this extra
data would enhance the understanding of immigrants’ families’ process of adaptation
to the new society.
I will also like to address some implications for research that are particular to
each research question. To do so, as I did in the previous subsection, I will divide
these implications by research question.
107
For the first research question, although the original design of the CILS survey
measured second language knowledge, I created another similar measure within the
constraints of the survey instrument. From the quantitative researcher’s point of
view, it is an enticing prospect, and an interesting challenge, to try and come up with a
reliable variable to evaluate bilingualism. But, as the qualitative literature on language
policy, sociolinguistics, and language ideology shows, this is a tricky, and perhaps
misleading pursuit.
It is essential to acknowledge and value children who speak other languages,
and use the data we elicit from them to maintain and improve what skills they have.
The problem with allowing countless research hours to be spent on designing the
perfect “bilingual scale” is that, to achieve highly in academic and social life, it does
not only matter how much or little a child speaks, reads, understands, and writes a
foreign language. We need to treat these language skills as part of a complex
ecosystem, realizing that we can help maintain and increase those skills over time,
through the medium of (rather than in spite of) the mainstream public school
curriculum.
After conducting this study and analyzing the data, I noticed that it is
important to account for the efforts that school personnel have made to help
immigrant youth with language maintenance, and those that cultivate a positive
bicultural community. On the other hand, it is necessary to document the long–term
implications of Structured English Immersion on student learning outcomes (GPA),
self-‐esteem, and positive regard for the education system.
A redesign of the survey more specifically would be enhanced with items
related to trips to the motherland or visits from friends and families from one’s
108
country of origin. These questions account for language and cultural reinforcement or
replenishment. Also questions related to frequency of communications via phone or
internet (Skype) conversations with relatives and friends who speak the mother
tongue, could be asked to assess modes of primary language maintenance. Another
factor the current survey does not account for a measure of whether the children of
immigrants decide to learn their “mother tongue” later in life, for example as a foreign
language in high school or college or through an immersion experience.
Regarding the second research question; further study of the familism variable
is needed, in order to “unpack” its meaning, and what is really measuring, and to
consider possible ways to improve the measurement by complementing it with family
interviews and field observations.
As well, the variable ‘time management’ needs to be updated and new question
should include “screen time” in all its current contexts hours playing video games,
navigating the internet or posting messages on social networks website like Facebook
or Twitter.
For the third research question, it is necessary to consider the influence of the
local community where the immigrants are living. A qualitative approach that
includes observations in the community as well as interviews will be a better way to
investigate this factor that has an important and crucial influence on the future of
immigrant families. Furthermore, a description of the community climate before the
immigrant arrival, as well as how it has changed after the arrival of the immigrants.
This assessment of community climate will help us better understand and measure
the effect that the community has on the immigrant adaptation process. In addition to
the community climate, local and state policies as well as economic forces have to be
109
account for.
This study also would benefit from an English monolingual sample, similar to
what was included in the Kasinitz, Mollenkopf, Waters, and Holdaway (2008) study
discussed earlier, to have a better comparison of how some of the independent
variables will or will not impact this population’s educational attainment. Also, as I
tried to incorporate in my original design, a broad sample that includes participants of
the third generation of immigrants would also contribute to the literature.
There is a need in the literature for alternative models of the adaptation
process, models that consider different perspectives such us transnationalism,
ecological approaches, funds of knowledge, and multicultural approaches. Future
models need to avoid looking at immigrants from a deficit point of view.
Compartmentalizing them into strict slots, as Portes and Rumbaut’s model proposed,
is not realistic. The only route to academic success is no longer a unidirectional
assimilation path; unidirectional acculturation has to be rethought to include a
multicultural strategy (Conchas Oseguera Vigil, 2012). This inclusive and ecological
model has the potential to reflect accurately the multiple pathways that youth are
interacting and negotiating while they are going through adaptation to this society.
More generally, for those scholars who need to collect data from school
districts, I would caution them to make sure that they understand the format and
meaning of any data the school district supplies (e.g. what are the minimum and
maximum values of each of the variables), as data and personnel may be fluid from
one academic year to the next, and at times there may not be an individual from
whom you can gain such understanding a year or two after the data are collected.
Finally to consider the time that will take to gather the information from the school
110
district, not only the time needed for them to process a request, but more broadly the
time needed for their own research review process and the time (and methods) it will
take to gather participant consent from both minors and their parents.
5.5 Concluding thoughts
This dissertation analyzes the experiences of immigrant children, and children
of immigrants, and their school performance, and how several factors influence
academic achievement. Even though the Southwest sample size is small, it is possible
to identify how factors like educational aspiration and time management influence
G.P. A. in a positive way.
Reading through this long, and sometimes intrusive, survey, any educational
researcher would be hard put not to think about the respondents, who were high
school students, as someone’s children, when they answered those questions. The
survey directed its respondents to think about their families, their self-‐esteem, their
education, and their futures. While the resulting data cannot improve the material or
psychological conditions of those students who shared their responses, by gathering
and analyzing these data, I gained a better understanding of their lives and their
educational and cultural struggles.
This information will help me provide suggestions that hopefully will lead
legislators and teachers to improve the conditions of children in schools, so they can
experience a growth in opportunities throughout their lives, a more inclusive
environment in which to live and work, and a better informed set of public
institutions. Also, since this is a nation of immigrants, with different cultures, rather
than one homogeneous whole, suggesting or implying that these respondents’
assimilate or acculturate to a fictive “American” culture is not realistic. Instead, this

111
study illuminates a highly complex interplay between language, cultural identity, self-‐
conception, and academic achievement. It is imperative that the next educational
steps we take as a nation use data, rather than uninformed or outdated rhetorical
devices, to reform and re-‐create our public schools along more inclusive and equitable
lines.

112
APPENDIX A: SURVEY INSTRUMENT
113
University of Arizona College of Education
Youth Adaptation and Growth Questionnaire
2006 Adapted from Alejandro Portes and Ruben Rumbaut. (2001)

114
Arizona
9. A his father born?
V 9a
9.b his mother born?
V 9b

115
Arizona
15 A her father born ?
V 15 a
15 B her mother born?
V 15 b
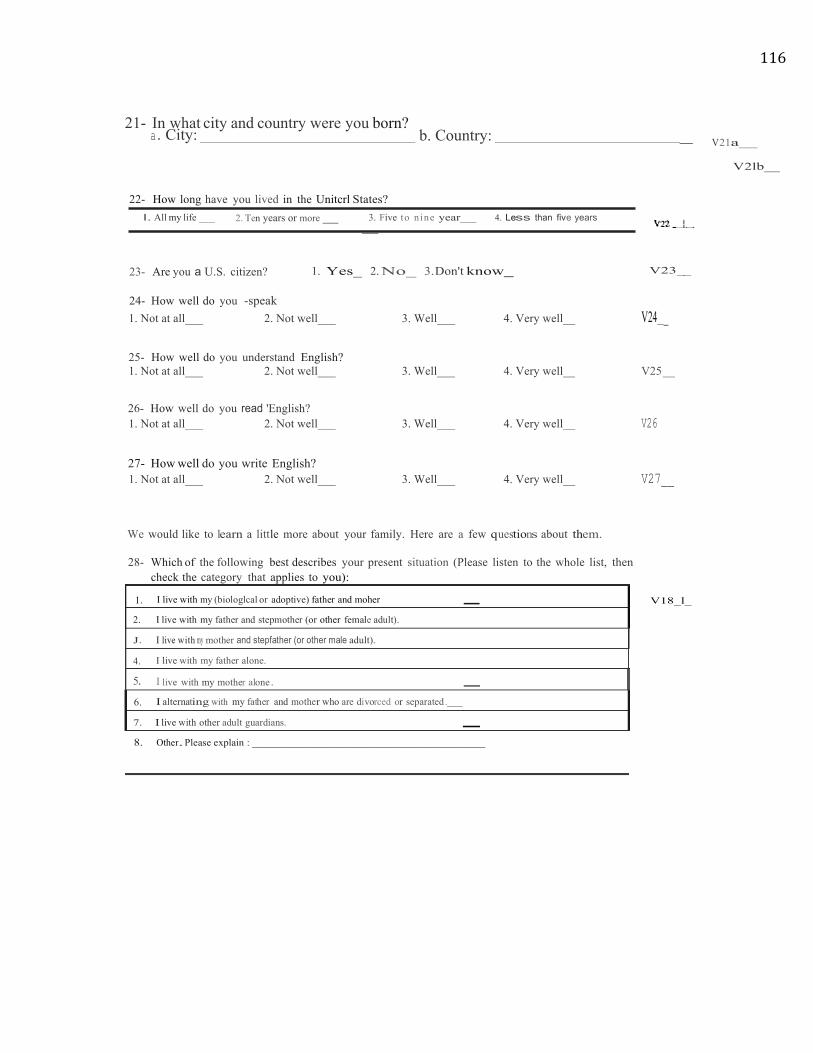
116
1. I live with (biologlcal or adoptive) father and moher 2. I live with my father and stepmother (or other female adult).
I mother
4. I live with my father
live with my mother 6. with my father and mother who are divorced or
live with other adult guardians.
21- In what city and country were you born?
a. City: b. Country: _ V21a__
V2lb__
22- How long have you lived in the Unitcrl States?
l. All my life _ 2. Ten years or more _ 3. Five to n ine year_ 4. Less than five years _
23- Are you a U.S. citizen? 1. Yes_ 2. No_ 3.Don't know_ V23__
24- How well do you -speak 1. Not at all___ 2. Not well___ 3. Well___ 4. Very well__ V24 _
25- How well do you understand English? 1. Not at all___ 2. Not well___ 3. Well___ 4. Very well__ V25 __
26- How well do you read 'English? 1. Not at all___ 2. Not well___ 3. Well___ 4. Very well__ V26
27- How well do you write English? 1. Not at all___ 2. Not well___ 3. Well___ 4. Very well__ V27__
We would like to learn a little more about your family. Here are a few questions about them.
28- Which of the following best describes your present situation (Please listen to the whole list, then check the category that applies to you):
V18_l_

117
1. at a occupation
2. for work 3. not for work
4. applicable
1. or less
2. or less 3. Some high school 4. High school graduate
5.Some or university
6. or more
7.Other Explain
29- Which of the following people, in addition to your parents or guardians, live with you, that is
in the house where you spend most of the time? (Check all that apply)
a. Brothers or step-brothers - How many? --
a. Sisters or step-sisters - How many? -- b. Grandfather or grandmother - How many? -- c. Uncles or aunts - How many? -- d. Other relatives - How many? -- e. Non-relatives - How many? --
30- In total, how many people, beside you, live in the same house with you? Number: _
V29a__
V29b__ V29c__
V29d__
V29e__
V30__
31- In total, how many older brothers (or stepbrothers) and sisters (or stepsisters) do you have?
Number: V31 __
32- Speaking about your father (or step-father or adult man who lives with you) what does he do for a living, that is what is his regular occupation? (Please describe clearly, including his main activity and the place where he works) V32 __
33- Is he working in this occupation now? 1. Yes__ 2. No__
34- (If not) What is his present situation?
35- How old is he now? Years Don't know_
36- What is the highest level of education that he completed?
V33__ V34a__
V34b__
V35__ V36_j_

118
45- Do you have a paying job at present? 1. Yes 2. No v45

119
46- If yes, what is your job? (Please describe clearly, including the place where you work) V46 _ _
47- How many hours per week do you work at it? V47 _
48- Approximately how much do you earn per week in this job? $ V48 _ _
Let's talk about the language that you speak at your home:
49- Do you know a language other than English? 1. Yes__ 2. No__ V49 _
50- (If yes) What language is that? (If more than one, please list first the language you know best) v50a _
V50b__
51- How well do you speak that language? (Or the foreign language that you know best)
1. Very little_ 2. Not well 3. Well 4. Very well_ V51_
52- How well do you understand that language?
1. Very little _ 2. Not well 3. Well 4. Very well_ V52_
53- How well do you read that language?
1. Very little _ 2. Not well 3. Well 4. Very well_ V53 _
54- How well do you write that language?
1. Very little_ 2. Not well 3. Well 4. Very well_ V54_
55- Do people in your home speak a language other than English? 1. Yes_ 2. No_ V55_

120
high school 2. Finish high school 3. some college
4. college 5. a (masters, doctor, etc.)
56- (If yes) What language is that? (If mo.re than one please list first the language that they use most often) V56a _
V56b_
57- How often do the people who live in your home use this language when they are talking to each other? (Or the language they use most often) 1. Seldom___ 2. From time to time___ 3. Often__ 4. Always___ V57__
58- When you talk to your parents (or guardians), what language do you most often use? (Write in)
VS8
59- In what language do you prefer to speak most of the time?
(Write in)_____________________________________
People of your age often have plans for the future, let's discuss these plans a bit.
60- What is the highest level of education that you would like to achieve?
1. Less than high school 2. Finish high school - I 3. Finish some college -
4. Finish college -
5. Finish a graduate degree (masters, doctor, etc.) -
61- And realistically speaking, what is the highest level of education that you think you will get?
VS9 __ V60_l_ V61_l
62- What job would you like to have as an adult? (Please write clearly)
V62_j_
63- And realistically speaking, how certain are you of getting this job as an adult?
1. Not certain at all I2. Pretty certain _ 13.Very certain_ V63_L
4. Other (Explain) : ---------------------

121
3.
programmer_
6.
9.
64- Among the following job categories, which is the one that comes closest to the job that you would like to have when you become an adult?
V64 _j_
65- And how do you see your chances of getting this job?
1.Very poor 2 Poor _ 3. Good 4. Very good
V65 __
67- (If father or stepfather born in a foreign country) Does he identify h i mself as an American now? l. Yes _ 2. No _ V67 ---L
68- (If no) How does he identify, that is what does he caJI himself? (Examples: Cuban, Cuban-
American, Haitian, Haitian-American, Colombian , Colombian-American , etc... - Please write clearly)
V68 L
70- (If mother or. stepmother born in a foreign country) Does she identify herself as an American now? 1. Yes_ 2. No_ v70 __
71- (If no) How does she identify, that is what does she call herself (Examples: Cuban, Cuban- American, Haitian, Haitian-American, Colombian, Colombian-A merican , etc...)
V71_
72- How many close friends do you have in school? (Write number)- -- -- -- V72___.
73- How many of these close friends have parents who came from foreign countries, that is who were not born in the United States?
1.None _ l 2. Some I 3. Many or most
75- In talking with your friends at school, do you sometimes use a language other than English? 1. Yes_ 2. No_
76- (If yes) What language is this? (Please write)
V7S l_
V76 l_
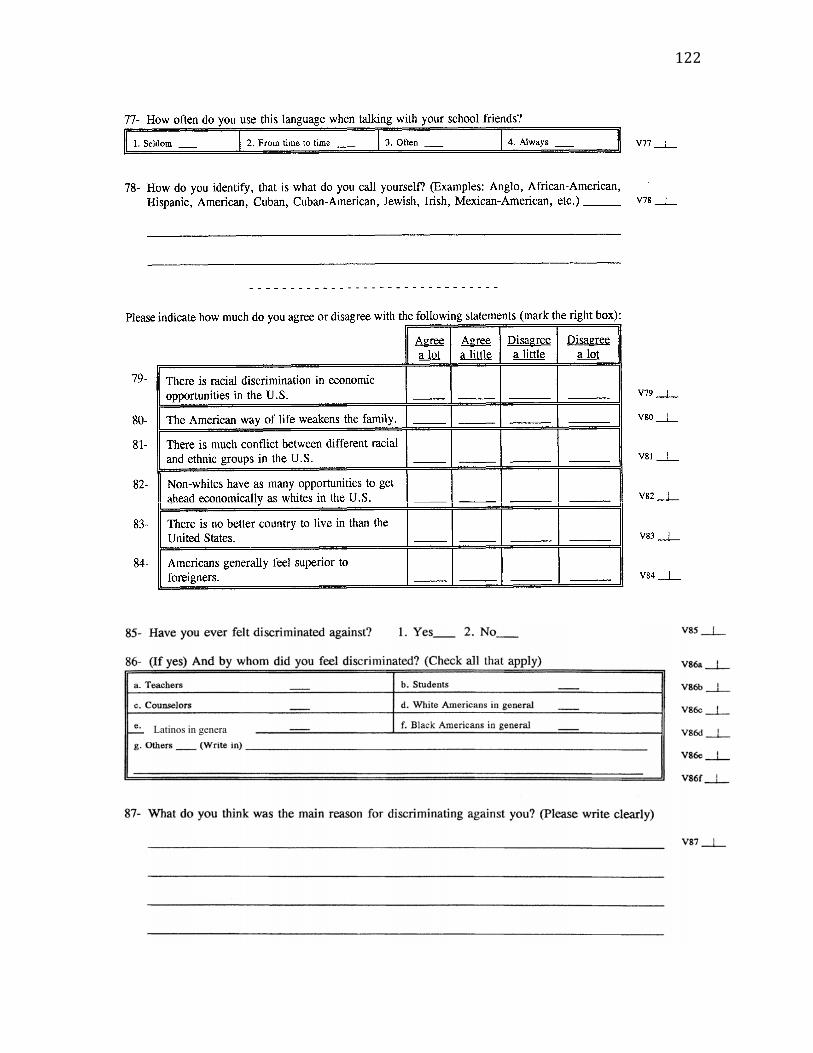
122
Latinos in genera

123
Les 2. One to two Two to lhree [o tour 5. Four to five Five or more
88- John said: "Education is the key to get ahead m this country. 1'11 get as much education as I can."
Peter said: "Education is less important than meeting the right people. As soon as I can, I’ll leave school."
Who do you think is right? 1. John ______ 2. Peter__
3. Neither ___ (explain)_____________
89- Mary said: "For a woman, the important thing is to meet the right man so that she can marry and have a nice family." Jane said: "For a woman, the important thing is to get an education so that she can be financially independent."
Who do you think is right? 1. Mary______ 2. Jane_
3. Neither ___ (explain)_____________
90- Juan and Pedro are both high school seniors. An older friend who just opened a store offers them
both jobs as salesmen. He argues that they will be better off going to work for him rather than staying in school because they will earn money and learn the business.
Juan says: ''l'll take the job, it's better than just sitting in class and I’ll learn about the real world”
Pedro says: "I'll stay in school, in the long run, getting a degree will be better for me "
Who do you think is right? 1. Juan______ 2. Pedro__
3. Neither ___ (explain)_____________
Please indicate how you feel about the following statements:
94- During the typical weekday, how many hours do you spend studying or doing school homework?
I
V94__

124
My or 2. My brother or sister 3. My
4. My
5. My counselor(s)
7. No one
Less than one
2. One to two 3. Two to three Three to four
Four to five 6. Five or more
95- Who helps you most with your homework when you need help? (Pick one)
96- During the typical weekday, how many hours do you spend watching television?
V95 _J_ V96_J_
97- Francois and Luis are both students whose parents are tore1gn-born. Francois says: "I am sometimes embarrassed because my parents don 't know American ways."
Luis says: "I am never embarrassed by my parents, I like the way they do things."
Which one comes closest to how you
feel?
!.Francois - 2. Luis - 3. Neither _(explain)
98- How often do you prefer American ways of doing things?
V97 _J_
1. All the time 2. Most of the time 3. Sometimes 4. Never V98_j_
99- How often do your parents (or adults with whom you live) prefer American ways of doing things?
1. All the time 2. Most of the time 3. Sometimes 4. Never
l00- And how often do you get in trouble because your way of doing things is different from that of your parents?
1. All the time 2. Most of the time 3. Sometimes 4. Never
V99_j_ V1OO__
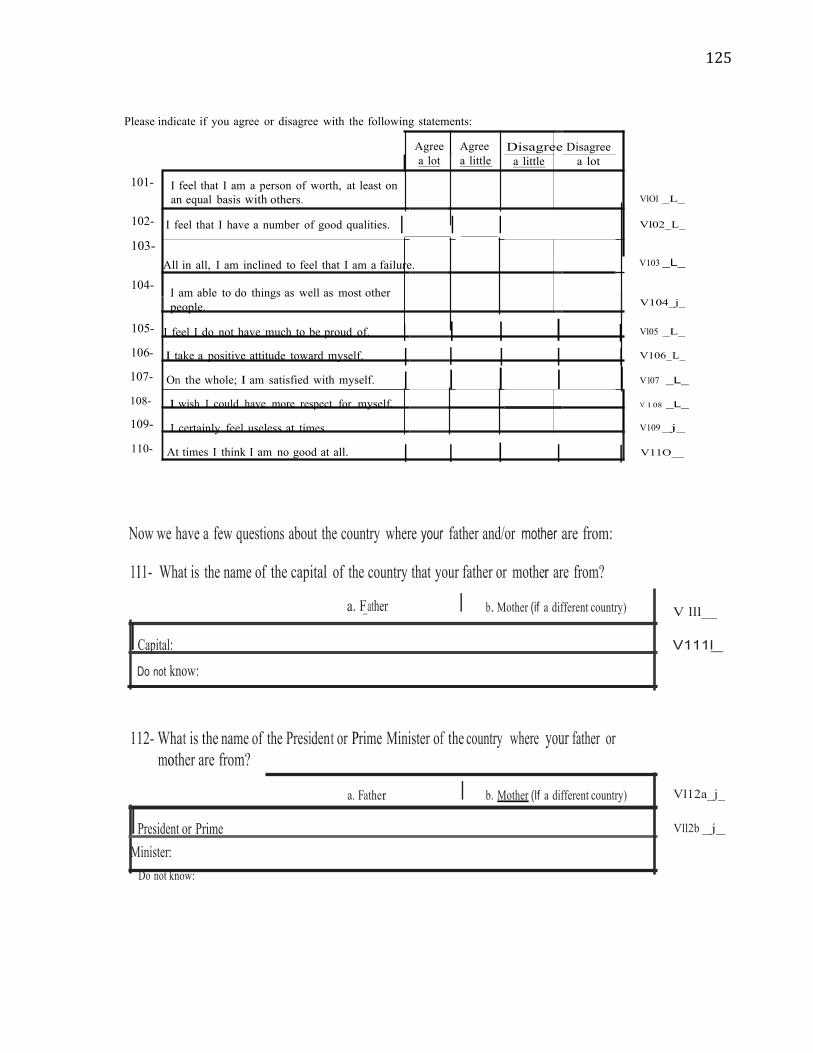
125
Please indicate if you agree or disagree with the following statements:
101-
I feel that I am a person of worth, at least on an equal basis with others.
Agree Agree Disagree Disagree a lot a little a little a lot
VlOl _L_
102-
103-
104-
I feel that I have a number of good qualities. I I I All in all, I am inclined to feel that I am a failure.
I am able to do things as well as most other people.
Vl02_L_
V103 _L_
V104_j_
105- I feel I do not have much to be proud of. I I I I I Vl05 _L_
106-
107-
108-
109-
110-
I take a positive attitude toward myself. I I I I I On the whole; I am satisfied with myself. I I I I I I wish I could have more respect for myself.
I certainly feel useless at times.
At times I think I am no good at all. I I I I I
V106_L_
V107 _L_
V l 08 _L_
V109 _j_
V11O__
Now we have a few questions about the country where your father and/or mother are from:
111- What is the name of the capital of the country that your father or mother are from?
a. F_ather I b. Mother (if a different country)
I Capital: Do not know:
112- What is the name of the President or Prime Minister of the country where your father or mother are from?
V lll__ V111l_
IPresident or Prime Minister:
Do not know:
a. Father I b. Mother (If a different country) Vl12a_j_
Vll2b _j_
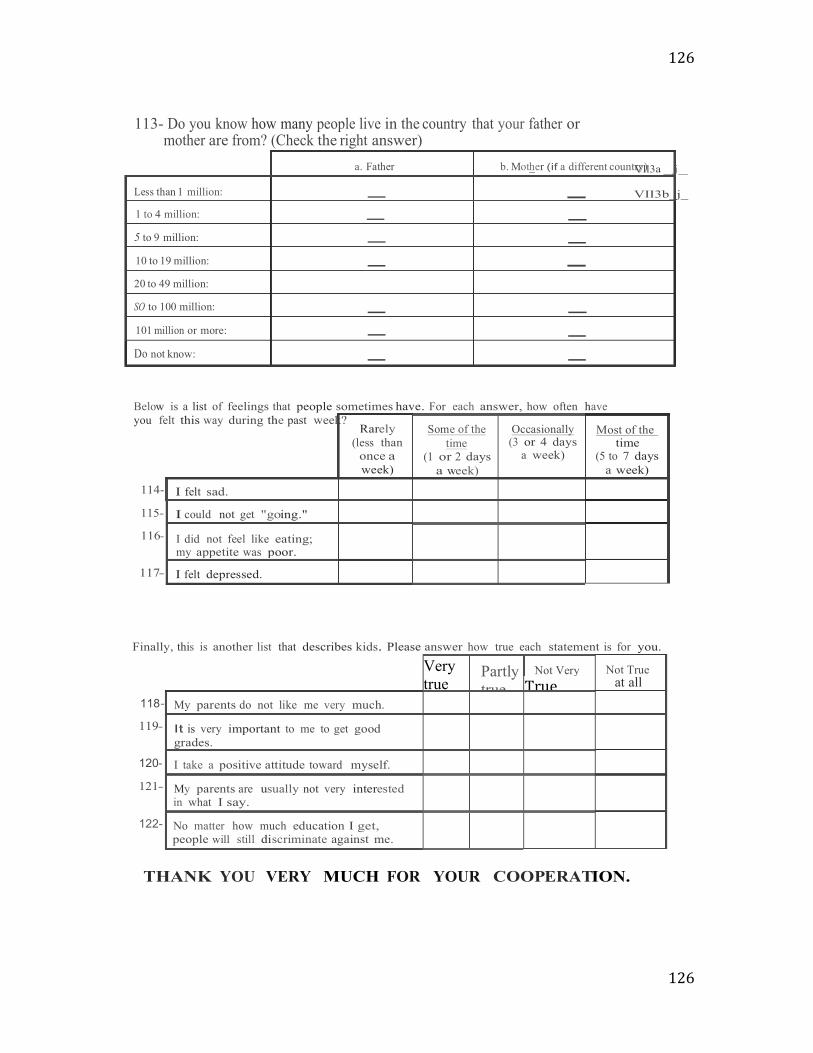
126
126
a.
b. Mother a different country)
than 1 million:
1 to 4 million:
5 to 9 million:
10 to 19 million: 20 to 49 million:
to 100 million: 101 or more:
not know:
(less
(1 2
Occasionally (3
a
(5 to
felt could not get
I did not feel like my was
felt
Very true
Partly true
Not Very
Not True atl< True at all
My do not like me very is very to me to get
I take a toward My are not very in what
No matter how much will still
113- Do you know how many people live in the country that your father or
mother are from? (Check the right answer)
Vll3a _j_
VII3b_j_
Below is a list of feelings that people sometimes have. For each answer, how often have you felt this way during the past week?
114-
115-
116-
117-
Finally, this is another list that describes kids. Please answer how true each statement is for you.
118-
119-
120-
121-
122-
THANK YOU VERY MUCH FOR YOUR COOPERATION.
127
127
REFERENCES Ahearn, L. M. (2001). Language and agency. Annual Review of Anthropology, 30, pp.
109-‐137. Bender, S. (2003) Greasers and Gringos. Latinos , Law and the American Imagination. New York: NYU Press. Bejarano, C.(2005) ¿Que Onda? Urban Youth culture and border identity. Tucson, AZ:
University of Arizona Press. Cabrera, N., Jaquette, O., Milem, J.F., Marx, R.W. (2014). Missing the (student
achievement) forest for all the (political) trees: Empiricism and the Mexican American studies controversy in Tucson. American Educational Research Journal, 51, 1084-‐1118.
Cammarota, J. (2008) Sueños Americanos. Barrio Youth negotiating social and
cultural identities. Tucson: University of Arizona press. Cammarota J., Romero A. (2006). A critically compassionate intellectualism for
Latina/o students: Raising voices above the silencing in our schools. Multicultural Education, 14, 16-‐23.
Center for Migration and Development webpage: The Children of Immigrants
Longitudinal Study. Retrieved September 8, 2011 from http://cmd.princeton.edu/data%20CILS.shtml
Chou, R. S. & Feagin, J.R. (2008). The Myth of the Model Minority: Asian Americans Facing Racism. Paradigm Publishers, Boulder, Colo.
Coms, M. C. (2012) Everything on its head: How Arizona‘s structure English immersion policy re-invents theory and practice. In M. B. Arias & C. Faltis (Eds.) , Implementing educational language policy in Arizona: Legal, historical and current practices in structured English immersion (pp. 59-85). Clevedon, UK: multilingual Matters.
Conchas G., Osegura L.,Vigil J. (2012) Acculturation and School Success: Understanding the variability of Mexican American Youth Adaptation across urban and suburban context. Urban Rev. 44, 401-422
Coller R., Kuo A. (2014) Youth development through Mentorship: A Los Angeles school-based mentorship program among Latino children. Journal Community Health 39 pp. 316-321
128
128
Eulich W. (2014, August 04) Why child migrants head to the US. Christian Science monitor. Retrieved from http://eds.b.ebscohost.com.ezproxy2.library.arizona.edu/ehost/detail/detail?vid=9&sid=56528c12-4de7-429b-9819-746c13173c00%40sessionmgr115&hid=103&bdata=JnNpdGU9ZWhvc3QtbGl2ZQ== - db=a9h&AN=97346176
Field, A. (2009) Discovering Statistics using SPSS. London. England. Sage publications Inc.
Foner, N., Kasinitz, P. (2007). The second generation. Pp270-‐282 in The new Americans: A guide to immigration since 1965, Waters M.C., Ueda, R., &Marrow, H. (Eds.)
Gandara P. Orfield G. (2010) A return to the “Mexican Room” the segregation of Arizona’s English Lanugage Learners. The civil Rights Project. Retrieven from: http://civilrightsproject.ucla.edu/research/k-‐12-‐education/language-‐minority-‐students/a-‐return-‐to-‐the-‐mexican-‐room-‐the-‐segregation-‐of-‐arizonas-‐english-‐learners-‐1/gandara-‐return-‐mexican-‐room-‐2010.pdf
Gandara P. Orfield G. (2012) Why Arizona matters: the historical, legal and political
context of 128rizona’s instructional policies and U. S. linguistics hegemony. Language Policy 11(1) 7-‐19
Gonzalez N., Moll L., Amanti K. (2005) Funds of Knowledge: Theorizing Practices in
Households and Classrooms. Mahwah, N.J. Lawrence Erlbaum Associates Gordon, M. M. (1964). Assimilation in American life: The role of race, religion, and
national origins. New York: Oxford University Press.
Heineke, A. (2014) Negotiating Language Policy and Practice: Teachers of English Learners in an Arizona Study group. Educational Policy. Retrieved from: http://epx.sagepub.com/content/early/2014/01/31/0895904813518101
Kasinitz, P., Mollenkopf, J., Waters, M.,(2004) (Eds.) Becoming New Yorkers:
Ethnographies of the New Second Generation. Rusell Sage Foundation. Kasinitz, P., Mollenkopf, J., Waters, M., & Holdaway, J. (2008). (Eds.). Inheriting the
city: The children of immigrants come of age. New York & Cambridge, MA: Russell Sage Foundation & Harvard University Press.
Lam W., Warriner D., (2012) transnationalism and Literacy: investigating the mobility of People, languages, text and practices in the context of migration. Reading research Quarterly 47(2) pp. 191-‐215
129
129
Ma J. (2002) What works for the Children? What we know and don’t know about bilingual education . The Civil Rights Project. Retrieved from : http://civilrightsproject.ucla.edu/research/k-‐12-‐education/language-‐minority-‐students/what-‐works-‐for-‐the-‐children-‐what-‐we-‐know-‐and-‐I-‐know-‐about-‐bilingual-‐education/crp-‐what-‐works-‐for-‐children-‐2002.pdf Mouw T., Chavez S., Edelblute H., Verdery A. Binational social Networks and
Assimilation: A test of the Importance of Transnaationalism. Social Problems V61(3) pp.329-‐359
Mendoza-‐Denton N. (2008) Homegirls: Lanmguage and cultural practice among
latina youth gangs. Wiley-‐Blackwell publisher. Nieto, D. (2007) The Emperor’s new words: Language and colonization. Human
Architecture. Journal of the Sociology of Self-‐Knowledge 5(3): 231-‐238.
Ogbu, J. (1978). Minority Education and Cast: The American System in Cross-‐Cultural Perspective. Academic Press Inc. New York.
Portes, A., Aparicio, R., Haller, W. & Vickstrom, E. (2010). Moving ahead in Madrid:
Aspirations and expectation in the Spanish second generation. International Migration Review 44(4).
Portes, A., Fernandez-‐Kelly, P., Haller, W. (2009). The Adaptation of the immigrant
second generation in America: A theoretical overview and recent evidence. Journal of Ethnic and Migration Studies, 35(7) pp.1077-‐1104
Portes, A. & Hao, L. (1998) E pluribus unum: Bilingualism and loss of language in the
second generation. Sociology of Education, 71(4) pp. 269-‐294. Portes, A. & Macleod, D. (1996). What shall I call myself? Hispanic identity formation
In the second generation. Ethnic and Racial Studies 19(3) pp.523-‐547 Portes, A. & Rumbaut, R. (2001). Legacies: The story of the immigrant second generation. University of California Press. Portes, A. & Rumbaut, R. (2006) Immigrant America : A portrait. University of California Press. Portes, P. (1999) Social and psychological factors in the academic achievement of
children of immigrants: A cultural history puzzle. American Educational Research Journal 36(3)
Rios-‐Aguilar C. Gonzalez Canche M., Moll L. (2010) A study of oArizona’s Teachers of
English language learners. The Civil Rights Project. Retrieve from : http://civilrightsproject.ucla.edu/research/k-‐12-‐education/language-‐
130
130
minority-‐students/a-‐study-‐of-‐arizonas-‐teachers-‐of-‐english-‐language-‐learners/rios-‐aguilar-‐arizonas-‐teachers-‐ell-‐2010.pdf
Rios-‐Aguilar C. Gonzalez Canche M., Portes P. (2014) Divergent Paths to school
adaptation among children of immigrants: New approaches and insights to existing data. In Portes P. Editor, Salas S. Baquedano-‐Lopez P. Editor, Mellom P. Editor (Edits) U.S. Latinos and Education Policy: research-‐based directions for change (Sociocultural, Political, and Historical Studies in Education) (69-‐91) New York: Routledge.
Rosenberg, M. (1979) Conceiving the self. New York: Basic Books. Rumbaut, R. (1994) The crucible within: Ethnic identity, self-‐esteem, and segmented
assimilation among children of immigrants. International Migration Review 28(4) pp. 748-‐794
Schimdt R. (2002) Racialization and language policy: the case of the U.S.A. Multilingua 21 pp.141-‐161.
Shi Q., Sam S. (2012) Using the achieving success everyday (ASE) group model to
promote self-‐esteem and academic achievement for English as a second language (ESL) students. Professional School Counseling. 16(1) pp.63-‐70
Stanton-‐Salazar, R.D., Spina, S.U. (2003). Informal Mentors and Role Models in the
Lives of Urban Mexican-‐Origin Adolescents. Anthropology & Education Quarterly, 34(3), 231-‐254.
Stepick, A. Stepick, C. (2010) The complexities and confusions of segmented
Assimilation. Ethnic and Racial Studies 33(7) pp. 1149-‐1167 Stones S. & Han, M. (2005) Perceived school environments, perceived
discrimination, and school performance among children of Mexican immigrants. Children and Youth Services Review, 27, 51-‐66
Suárez-‐Orozco, C. (2008). In Suárez-‐Orozco M. M., 1956-‐, Todorova I. (Eds.),
Learning a new land : Immigrant students in American society (1st ed.). Cambridge, MA: Belknap Press.
U.S. Census Bureau. Quickfacts. State and Country facts for 2013. Retrieved from: http://quickfacts.census.gov/qfd/states/00000.html
U.S. Census Bureau. Educational attainment in the United States 2013. Table 2. Educational attainment of the population 25 years and over by selected characteristics:2013. Retrieved from : http://www.census.gov/hhes/socdemo/education/data/cps/2013/tables.html
131
131
U.S. Census Bureau. Annual Estimates of the Resident Population: July 1, 2011 to
July 1, 2013. American survey office. Retrieved from : http://ftp2.census.gov/.
U.S. Department of Commerce website. Retrieved September 8, 2011 from
http://www.bea.gov/iTable/iTable.cfm?ReqID=9&step=1 U.S. Department of Education (2006). National Center for Education Statistics,
Common Core of Data (CCD), "Public Elementary/Secondary School Universe Survey", 2006-‐07 v.1c, 2011-‐12 v.1a. Retreived October 13, 2014 from < https://nces.ed.gov/ccd/elsi/tableGenerator.aspx>.
Vélez-‐Ibañez, C. G. (c1996.). Border visions: Mexican cultures of the southwest
United States. Tucson: University of Arizona Press.
Vermeulen, H. (2010) Segmented assimilation and cross-‐national comparative research on the integration of immigrants and their children, Ethnic and Racial Studies 33(7) pp. 1214-‐1230.
Waldinger, R., Feliciano, C., (2004) Will the new second generation experience
‘downward assimilation’? Segmented Assimilation re-‐assessed. Ethnic and Racial Studies 27(3)
Waters, Tran, Kasinitz, Mollenkopf. (2010) Segmented assimilation revisited: Types
of acculturation and socioeconomic mobility in young adulthood. Ethnic and Racial Studies 33(7).
Xu J., Wu H. (2013) Self-‐Regulation of Homework Behavior: Homework management
at the secondary school level. Journal of Educational Research 106(1) pp. 1-‐13.