Embed Size (px)
Citation preview
Attachment C
Grand AvenueFeasibility and EconomicImpact Assessment
by Rosenow Spevacek Group, Inc.
ROSENOW SPEVACEK GROUP, INCwww.webrsg.com
OFFICE OF THE CHIEF LEGISLATIVE ANALYSTCITY OF LOS ANGELES
200 N SPRING STCITY HALL ROOM 255
LOS ANGELES CA 90012
GRAND AVENUEFEASIBILITY AND ECONOMICIMPACT ASSESSMENT
JUNE 3,2014
OFFICE OF THE CHIEF LEGISLATIVE ANALYSTCITY OF LOS ANGELES
CONTENTS.
Introduction 1
Executive Summary 3
Background 5
Project Description 8
Development Feasibility Analysis 12
Supportable Investment 24
Fiscal Impact Analysis 33
Economic Impact Analysis .49
Conclusions 52
LIST OF FIGURES
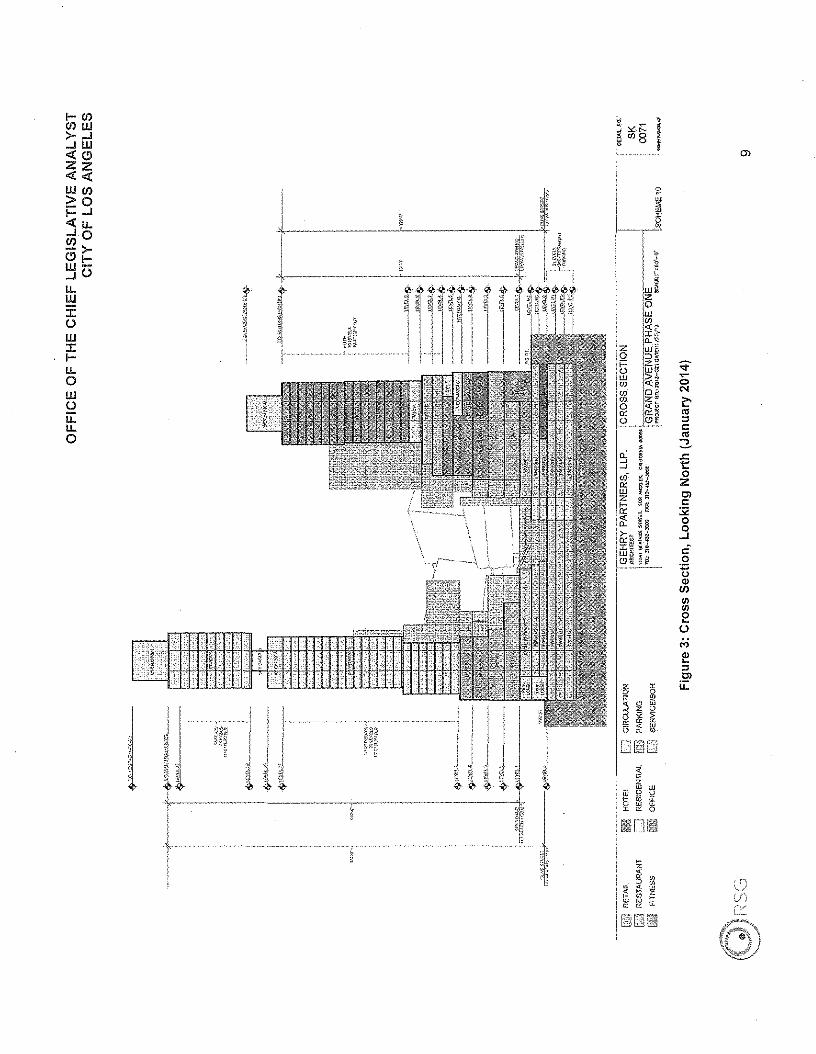
Figure 1: Conceptual Site Plan (January 2014) 2Figure 2: Project Scale Model, Looking South Across Grand Avenue (January 2014) 6Figure 3: Cross Section, Looking North (January 2014) '" 9
LIST OF TABLES
Table 1: Summary of Grand Avenue Project.. 4Table 2: Distribution of Space 8Table 3: Development Gap 12Table 4: Multifamily Cost Assumptions 17Table 5: Retail Cost Assumptions 18Table 6: Office Cost Assumptions 18Table 7: Condominium Cost Assumptions 19Table 8: Development Costs 21Table 9: Comparison of Development Costs : 23Table 10: Cash Flow and Return on Cost Assumptions 26Table 11: Multifamily Projected Cash Flow and Return on Cost 27Table 12: Retail Projected Cash Flow and Return on Cos!............ . 28Table 13: Office Projected Cash Flow and Return on Cost.... .. ..29Table 14: Condominium Projected Cash Flow and Return on Cost 30
OFFICE OF THE CHIEF LEGISLA TlVE ANALYSTCITY OF LOS ANGELES
Table 15: Development Feasibility and Gap 32Table 16: 25 Year Fiscal Impact Projections Summary 34Table 17: 25 Year Fiscal Impact Projections for City 36Table 18: 25 Year Fiscal Impact Projections for County 37Table 19: Transient Occupancy Tax Revenue 39Table 20: Property Tax Revenue .40Table 21: Sales Tax and In-Lieu Sales Tax Revenue .41Table 22: Motor Vehicle License Fee In-Lieu Revenue 42Table 23: Gross Receipts Tax Revenue .43Table 24: Parking Occupancy Tax Revenue, First 10 Years .44Table 25: Parking Occupancy Tax Revenue, After First 10 Years .44Table 26: Utility Users' Tax Revenue ..45Table 27: Property Transfer Tax Revenue .46Table 28: Construction Materials Sales Tax Revenue .47Table 29: Construction Gross Receipts Tax Revenue .48Table 30: Initial Property Transfer Tax Revenue 48Table 31: Economic Impacts 51
OFFICE OF THE CHIEF LEGISLATIVE ANALYSTCITY OF LOS ANGELES
INTRODUCTION
In January 2014, Related Companies (dba Grand Avenue L.A. LLC) ("Developer") receivedapproval of the form of the Fourth Amendment to their Disposition and Development Agreement("DDA") with the Los Angeles Grand Avenue Authority ("JPA"), which sets forth updates to theterms for developing the Parcel Q as an iconic 1.7 million-square-foot mixed-use project knownas Grand Avenue Los Angeles ("Project"). The Project is proposed to be located at Bunker HillRedevelopment Parcel Q ("Parcel Q") at the southern corner of the intersection of South GrandAvenue and West First Street in downtown Los Angeles. The Project cannot proceed under thearnended DDA without a series of actions by the Developer, including approval of amemorandurn of understanding for an updated subvention agreernent by the City of LosAngeles ("City") that was requested by the Developer to help finance the Project's developrnent.The Developer reports to the City that the Project's total costs, inclusive of sunk costs, exceedthe projected Project value by about $195.6 rnillion. (This was not without precedent, as theCity executed a Funding Agreement with the Developer to help underwrite some costs as part ofthe prior design for development of Parcel Q that was delayed due to the recession.)
In preparation for the City's evaluation of a funding agreernent for the new Project proposed, theCity's Office of the Chief Legislative Analyst ("CLA") retained two consultants - RosenowSpevacek Group, Inc ("RSG") and PKF Consulting USA ("PKF") 1 - to independently assess theneed for any assistance. The work was divided by the CLA, with PKF responsible for the hotelcornponent of the project and RSG responsible for the balance of the Project. (PKF's report iscontained under separate cover.)
This Report presents our findings on the proposed Project, incorporating PKF's work as well asour own to present our opinions on the following:
• Overall feasibility of the Project,
• The net fiscal impact of the Project to the City and the landowner, the County of LosAngeles ("County"), and
• The total economic impacts, including jobs, within the City and County.
This Report stands as an independent assessment of the overall terms, conditions, and irnpactsof the Project. The City rnay use this information to deterrnine if the Project requires financialassistance, as requested, and the level and type of such assistance that is needed.
The Project description, development cost, feasibility gap, and site-specific tax revenuespresented in this Report are primarily based upon information provided by the Developer inFebruary 2014. Though refinements to the Project are inevitable at this stage, our conclusionsare subject to change should the development program materially be altered.
1 PKF focused exclusively on the hotel component of the project. The analysis of the hotel componentcan be reviewed under separate cover.
1
I-Cf)~~...JW«0Zz««Wcf)
<::0I-...J«u.....JOcf)-)-01-W-...JUu,W5:UW:cI-u..oWUu,u..o
----~ ..
U '
"!it
"1i-'====:::::J
1~ '-c--.---'
",==="c=.<!'J ~ ~133>J1S osc
~ flh
(ri ._-\ II L r-
I
I ;Lr
N
OFFICE OF THE CHIEF LEGISLATIVE ANALYSTCITY OF LOS ANGELES
EXECUTIVE SUMMARY
The Developer provided RSG a February 20, 2014 feasibility analysis (consisting of a one-pagepro forma and supporting documentation), upon which RSG conducted our review. TheDeveloper's pro forma estimated a development gap of approximately $195.6 million across theentire Project, inclusive of land and Developer sunk costs. (In addition to independentlycalculating the estimated feasibility of the Project, RSG also reviewed the economic and fiscalimpacts of the project; neither of these studies were separately prepared by the Developer.)
RSG independently evaluated the assumptions presented by the Developer, and pursuedfollow-up inquiries and research with the Developer, the City and our own independent researchwhere appropriate. Therefore, some of the information contained herein relies on the dataprovided by the Developer, with some variations as detailed in this Report.
In general, RSG concludes that the Project faces a significant funding shortfall even without theDeveloper's land acquisition and other project costs that are 100 percent at-risk at this point intime. Still, the landmark development is not without its merits and there may be potential toclose the gap and achieve valuable fiscal and economic benefits for the City and County.
Based on the Project description, methodology and assumptions referenced herein, RSG andPKF have concluded the following:
• $162.9 Million Feasibility Gap - Compared to the Developer's pro forma analysis, RSGestimates a smaller gap. The variance in the development gap between the Developerand RSG is mainly attributable to RSG excluding land acquisition costs and earlyplanning, design and entitlement costs from the analysis
• $138.3 Million (NPV ten percent) Net New Fiscal Impacts - RSG expects that the Projectwill generate substantial Net New Fiscal Impacts, including property tax, sales tax, andtransient occupancy tax, among others.
• Substantial New Employment RSG finds that construction is expected to generate3,600 new temporary full-time and part-time jobs directly and the economic activity ofoperations will generate 1,588 new permanent full-time and part-time jobs directly. Bothconstruction and operations will also create significant amounts of indirect and inducedfull-time and part-time jobs.
The Developer acknowledges that the Project as proposed faces a significant gap, and hasstated they plan to "value engineer" construction (finding ways to reduce potential costs byadapting more efficient design and more cost-effective construction techniques), as well as seekassistance from the City and County. RSG doubts that without all of these considerations, theProject can be feasibly constructed at this time.
3
OFFICE OF THE CHIEF LEGISLATIVE ANALYSTCITY OF LOS ANGELES
Based on the results of the analyses by RSG, explained in detail in this Report, and PKF,detailed under separate cover, the following table summarizes the Project Net New Revenues,development feasibility gap, and Subvention Amount.
Table 1: Summary of Grand Avenue Project
Nominal NPV10% Reference TableTotal City Net New Revenue50% of Net New Revenue
407,234,212203,617,106
138,341,35669,170,678
Table 16Table 16
Project GapHotel Gap /1
162,900,000101,300,000
Table 15Table 15
Transient Occupancy Tax Revenues 186,366,332 58,201,356 Table 16
Available Subvention Amount is the Lesser of50% of Net New Revenue, orHotel Feasibility Gap
Available Subvention AmountAs a % of Net New Revenues
69,170,67850%
1! Refer to PKF Consulting ReportSources: Refer to Reference Tables
4
OFFICE OF THE CHIEF LEGISLATIVE ANALYSTCITY OF LOS ANGELES
BACKGROUNDParcel Q is owned by the County, but was long ago targeted as a catalyst site for theredevelopment of Bunker Hill, which led to a series of efforts over the past 11 years to developthis and other nearby blocks in partnership with the (now former) Community RedevelopmentAgency of the City of Los Angeles and the City. This redevelopment initiative led to the creationof a joint powers authority known as the Los Angeles Grand Avenue Authority ("JPA"). The JPAincludes the Los Angeles County Board of Supervisor 1'1 District Chair, Los Angeles CountyChief Administrative Officer, Los Angeles City Councilmember of the 9th District, Chief ExecutiveOfficer of the Community Redevelopment Agency of the City of Los Angeles, and arepresentative from the State of California.
In October 2003, the JPA released a Request for Qualifications soliciting responses fromqualified parties to develop a high quality, mixed use, high-density project on several parcels inDowntown Los Angeles, including Parcel Q. Qualified parties were selected and subsequentlyasked to submit proposals in response to a Request for Proposals, released in January 2004.The Developer submitted a response in April, 2004 and was thereafter selected and approvedby the JPA as the Developer of the Project. In September 2004, an Exclusive NegotiationAgreement was executed between the JPA and the Developer.
Between March 2007 and December 2012, the parties executed an original DDA and threeamendments that facilitated development of other portions of the Grand Avenue/Bunker Hillinitiative. Between 2009 and 2011, construction of Grand Park (formerly designated as "CivicPark" prior to its dedication) and Broad Museum began. In 2012, development of the Parcel MApartments (located next to the Broad Museum) began. With a $50 million land leaseprepayment from the Developer to the County, Grand Park was completed in 2012; while otherparts of the greater Grand Avenue/Bunker Hill redevelopment program proceeded, Parcel Q hasnot yet commenced redevelopment and remains to this day occupied by an obsolete parkingstructure.
The original schematic design for Parcel Q was created in 2006 by Gehry Partners, LLC.2 In2007, the Developer received approval of the DDA, land use entitlements, and a 20-yeartransient occupancy and 1O-year parking tax rebate, as well as certification of the environmentalimpact report. But, in 2008, after the Project achieved desiqn development approval and taxrebate district formation, and reached 80 percent completion on construction documents, theProject was put on hold due to the global financial crisis which had an acute impact on hotel andresidential uses that were a key part of Parcel Q's redevelopment.
With the return of investment in Downtown and a rebound of both residential and hotel demandcritical to the development of Parcel Q, the Developer re-engaged the JPA with plans for theproperty. After a year of planning and public review of different concepts, on January 14, 2014,the Los Angeles County Board of Supervisors approved a conceptual design for the two-towerhigh-rise project anchored by a hotel on the North Tower and the DDA amendment ("4th
2 "LosAngeleswith a Downtown?Gehry'sVision," New York Times,April 25, 2006www.nytimes.com/2006/04/25/arts/25gran.html?_r=O
5
OFFICE OF THE CHIEF LEGISLATIVE ANALYSTCITY OF LOS ANGELES
Amendment") was approved by the JPA on January 21, 2014. The 4th Amendment stipulatesthat the Developer shall receive preliminary approval of an updated Memorandum ofUnderstanding between the City and Developer concerning a parking and hotel tax rebate bythe end of July 2014, or the Developer stands to lose all development rights, including the $50million ground lease payment and any costs incurred to date.
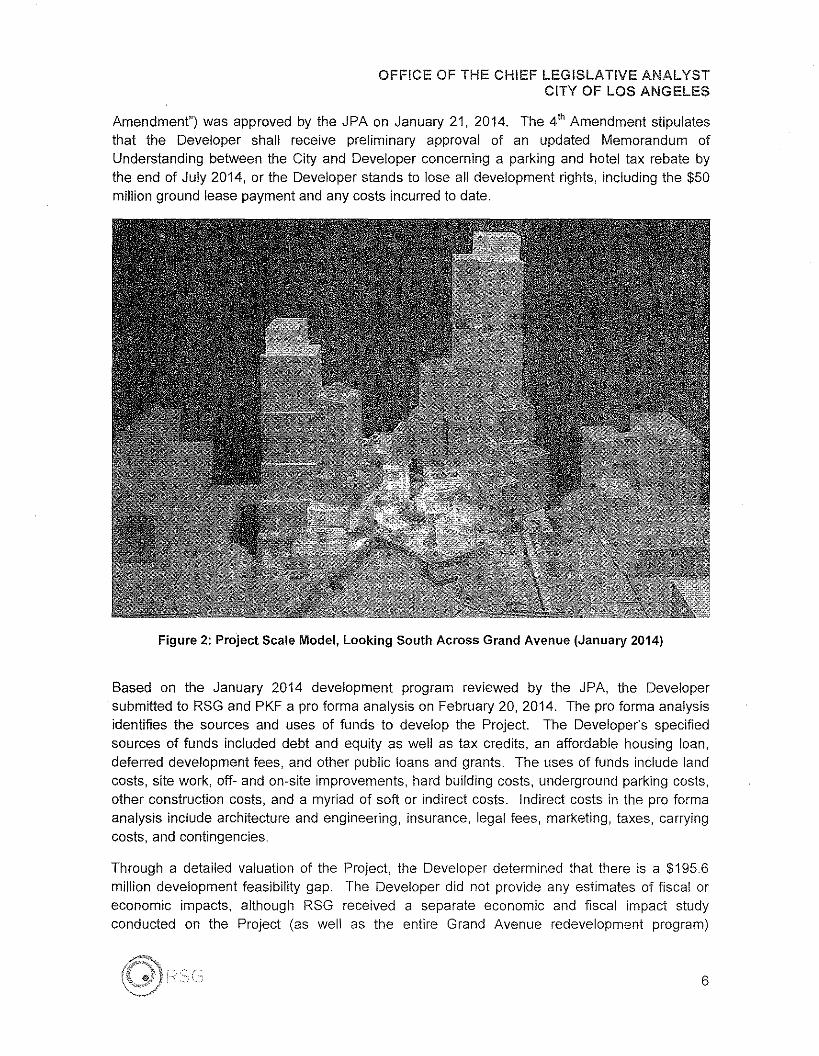
Figure 2: Project Scale Model, Looking South Across Grand Avenue (January 2014)
Based on the January 2014 development program reviewed by the JPA, the Developersubmitted to RSG and PKF a pro forma analysis on February 20, 2014. The pro forma analysisidentifies the sources and uses of funds to develop the Project. The Developer's specifiedsources of funds included debt and equity as well as tax credits, an affordable housing loan,deferred development fees, and other public loans and grants. The uses of funds include landcosts, site work, off- and on-site improvements, hard building costs, underground parking costs,other construction costs, and a myriad of soft or indirect costs. Indirect costs in the pro formaanalysis include architecture and engineering, insurance, legal fees, marketing, taxes, carryingcosts, and contingencies.
Through a detailed valuation of the Project, the Developer determined that there is a $195.6million development feasibility gap. The Developer did not provide any estimates of fiscal oreconomic impacts, although RSG received a separate economic and fiscal impact studyconducted on the Project (as well as the entire Grand Avenue redevelopment program)
6
OFFICE OF THE CHIEF LEGISLATIVE ANALYSTCITY OF LOS ANGELES
prepared by the Los Angeles Economic Development Corporation ("LAEDC") dated January2014.
7
OFFICE OF THE CHIEF LEGISLATIVE ANALYSTCITY OF LOS ANGELES
PROJECT DESCRIPTION
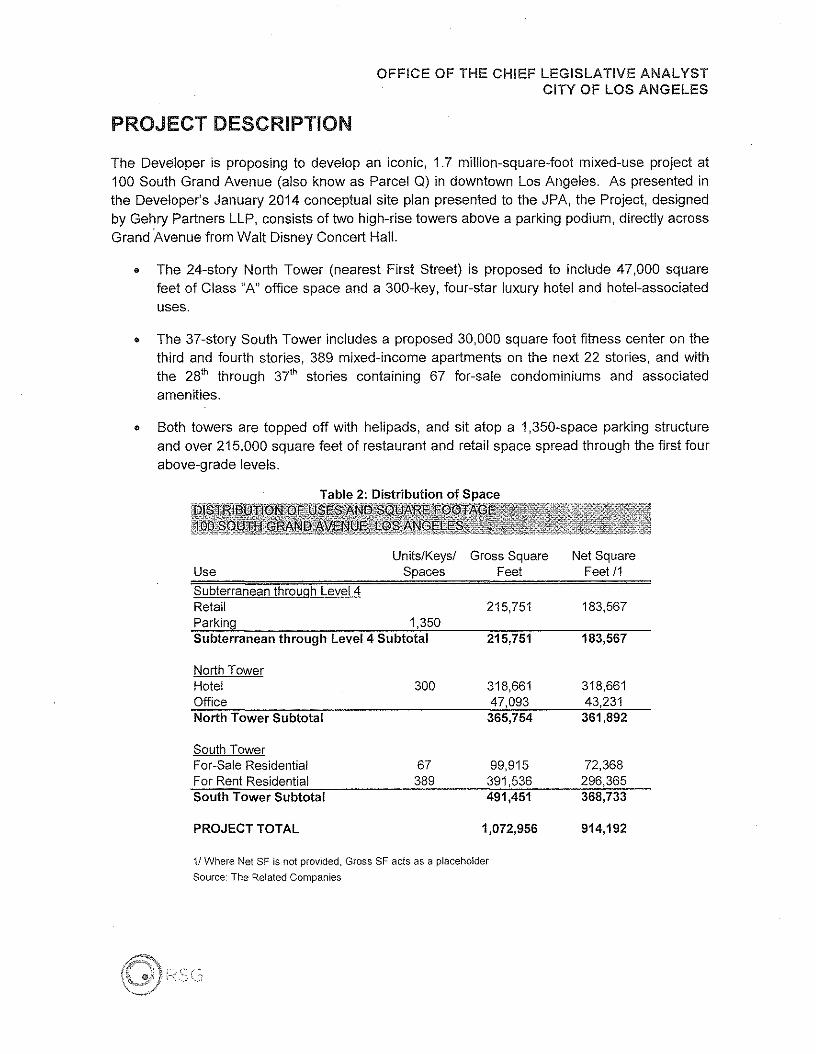
The Developer is proposing to develop an iconic, 1.7 million-square-foot mixed-use project at100 South Grand Avenue (also know as Parcel Q) in downtown Los Angeles. As presented inthe Developer's January 2014 conceptual site plan presented to the JPA, the Project, designedby Gehry Partners LLP, consists of two high-rise towers above a parking podium, directly acrossGrand 'Avenue from Walt Disney Concert Hall.
• The 24-story North Tower (nearest First Street) is proposed to include 47,000 squarefeet of Class "A" office space and a 300-key, four-star luxury hotel and hotel-associateduses.
• The 37-story South Tower includes a proposed 30,000 square foot fitness center on thethird and fourth stories, 389 mixed-income apartments on the next 22 stories, and withthe 28'h through 37'h stories containing 67 for-sale condominiums and associatedamenities.
• Both towers are topped off with helipads, and sit atop a 1,350-space parking structureand over 215,000 square feet of restaurant and retail space spread through the first fourabove-grade levels.
Table 2: Distribution of Space
Units/Keys/ Gross Square Net SquareUse Spaces Feet Feetl1Subterranean through Level 4Retail 215,751 183,567Parking 1,350Subterranean through Level 4 Subtotal 215,751 183,567
North TowerHotel 300 318,661 318,661Office 47,093 43,231North Tower Subtotal 365,754 361,892
South TowerFor-Sale Residential 67 99,915 72,368For Rent Residential 389 391,536 296,365South Tower Subtotal 491,451 368,733
PROJECT TOTAL 1,072,956 914,192
1/ Where Net SF is not provided, Gross SF acts as a placeholder
Source: The Related Companies
I-(f)(f)W>-..J..JW<l:ClZZ<l:<l:W(f)>0i=..J<l:u...JO!:!2>-Cll-W-..Jou,W:coW:cI-u,oWou::u,o
;:t-e-oN
e.,"c.,:::;...t:1:oZC)c:;;:oo..Jc:o:;:;o
'"en'"'"eoMe"C)
u:
OFFICE OF THE CHIEF LEGISLATIVE ANALYSTCITY OF LOS ANGELES
LOCATION
The Project is located in the Bunker Hill neighborhood of the City and generally bound by SouthGrand Avenue on the northwest, West First Street on the northeast, South Olive Street on thesoutheast, and West Second Street on the southwest. The site, known as Parcel Q, is currentlydeveloped as a steel and concrete three-story parking structure. In order to develop the Project,the entire site would be cleared and excavated. A 32-foot difference in elevation between OliveStreet and Grand Avenue provides for different experiences on different sides of the projectarea. The site is surrounded by the Walt Disney Concert Hall, Stanley Mosk Los AngelesCounty Courthouse, Parcel W, and the Colburn School. Other surrounding types of usesinclude office, civic and governmental, and residential.
ADDITIONAL PROJECT DETAILS
The hotel, described in more detail in the PKF Report, connects to West First Street andgenerally occupies the majority of the North Tower. The hotel contains a lobby, sky lobby,restaurants, meeting space and ballroom, spa, and 300 hotel rooms. The office space islocated on Levels 6 and 7 in the North Tower. According to the Developer, the office space isdesigned to be built out for future occupancy by the Developer and hotel partnership.
The retail space will likely be occupied by apparel and clothing, electronics, home furnishings,health and personal care, and specialty retail uses. According to interviews with the Developer,the mix of retailers that are expected to occupy the Project are anticipated to include luxuryretailers as well as other brands not presently found within downtown Los Angeles. (Some ofthese specific tenant targets have been shared with RSG confidentially to protect the ongoingrecruiting efforts by the Developer while allowing RSG to project potential benefits of theproject.) In addition, a food and beverage program is anticipated to include multiple offerings ata range of price points.
The Project contains parking across five levels of underground and mezzanine parking. Theprimary entrances to the parking levels are frorn South Olive Street for retail, office, and hotelself-parking, from West First Street for hotel valet parking, and from South Grand Avenue forresidential parking.
ANTICIPATED DEVELOPMENT CALENDAR
The amended DDA obligates the Developer to commence construction by December 31, 2015and complete the project no later than Septernber 30, 2019. Without achieving these deadlines,the Developer's rights under the DDA are terrninated. At this point, the Developer is targeting a38 month construction process. The following implementation schedule was provided to RSG inFebruary 2014:
7 Months Demolition, excavation, shoring, below grade structure up to GrandAvenue street level
7 Months Vertical construction from Grand Avenue to Level 7
-: 10
OFFICE OF THE CHIEF LEGISLATIVE ANALYSTCITY OF LOS ANGELES
15 Months Vertical construction from Level 7 to top of building
9 Months Building interiors and finishes
Based on consultations with the Developer, RSG assumed that construction would begin in2015 for the purpose of this analysis and Report.
11
OFFICE OF THE CHIEF LEGISLATIVE ANALYSTCITY OF LOS ANGELES
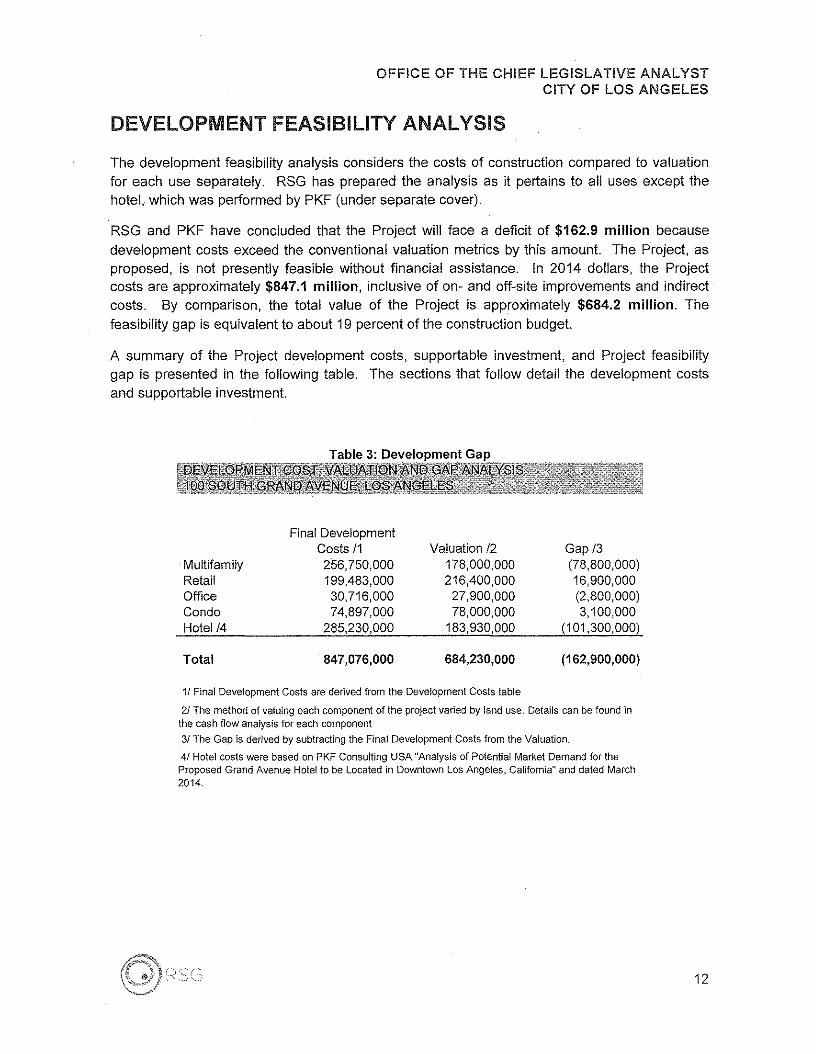
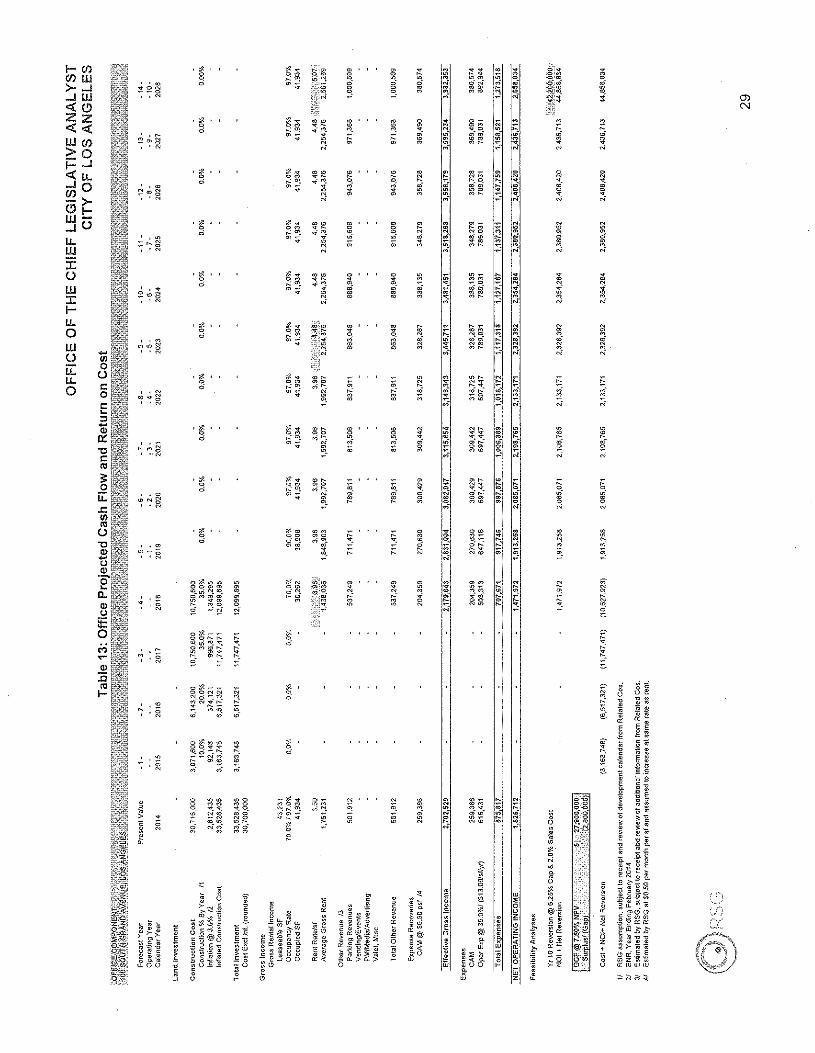
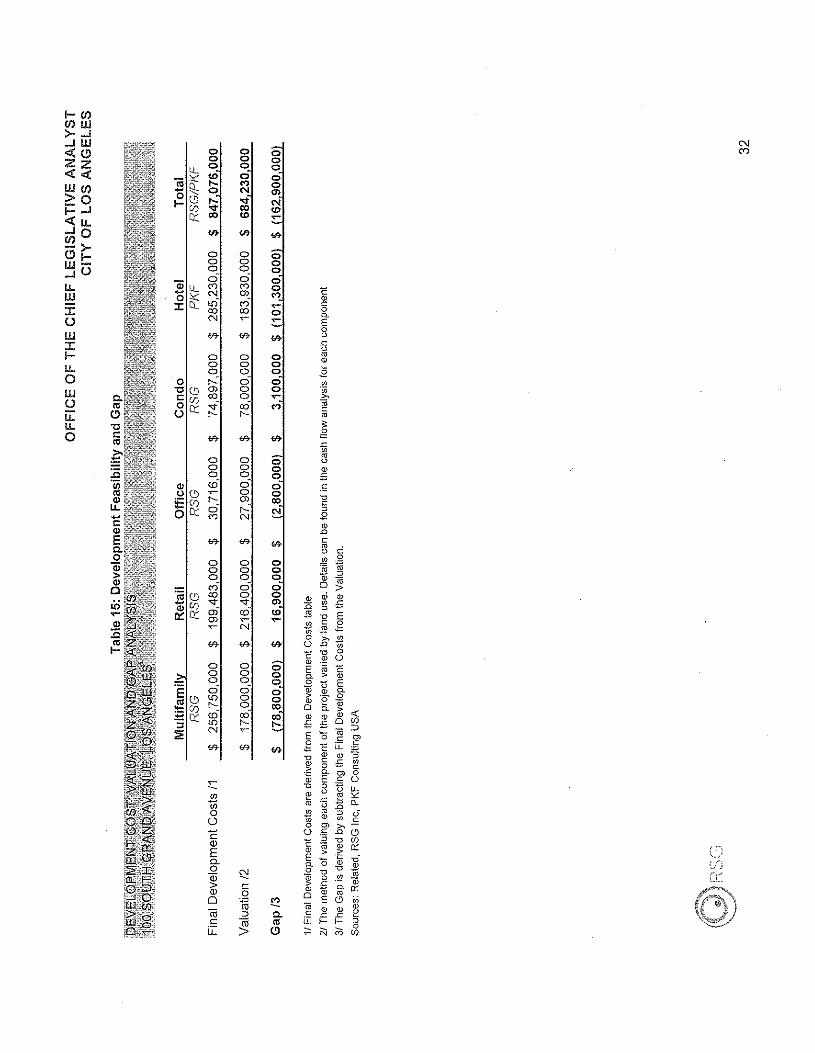
DEVELOPMENT FEASIBILITY ANALYSIS
The development feasibility analysis considers the costs of construction compared to valuationfor each use separately. RSG has prepared the analysis as it pertains to all uses except thehotel, which was performed by PKF (under separate cover).
RSG and PKF have concluded that the Project will face a deficit of $162.9 million becausedevelopment costs exceed the conventional valuation metrics by this amount. The Project, asproposed, is not presently feasible without financial assistance. In 2014 dollars, the Projectcosts are approximately $847.1 million, inclusive of on- and off-site improvements and indirectcosts. By comparison, the total value of the Project is approximately $684.2 million. Thefeasibility gap is equivalent to about 19 percent of the construction budget.
A summary of the Project development costs, supportable investment, and Project feasibilitygap is presented in the following table. The sections that follow detail the development costsand supportable investment.
Table 3: Development Gap
Final DevelopmentCosts 11 Valuation 12 Gap 13
.Multifamily 256,750,000 178,000,000 (78,800,000)Retail 199,483,000 216,400,000 16,900,000Office 30,716,000 27,900,000 (2,800,000)Condo 74,897,000 78,000,000 3,100,000Hotel 14 285,230,000 183,930,000 (101,300,000)
Total 847,076,000 684,230,000 (162,900,000)
1f Final Development Costs are derived from the Development Costs table
21 The method of valuing each component of the project varied by land use. Details can be found inthe cash flow analysis for each component
31 The Gap is derived by subtracting the Final Development Costs from the Valuation.
41 Hotel costs were based on PKF Consulting USA "Analysis of Potential Market Demand for theProposed Grand Avenue Hotel to be Located in Downtown Los Angeles, California" and dated March2014.
12
OFFICE OF THE CHIEF LEGISLATIVE ANALYSTCITY OF LOS ANGELES
DEVELOPMENT COSTS
APPROACH
The uses of funds includes land costs, site work, off- and on-site improvements, hard buildingcosts, underground parking costs, other construction costs, and a myriad of soft or indirectcosts. Indirect costs in the pro forma analysis include architecture and engineering, insurance,legal fees, marketing, taxes, carrying costs, and contingencies. The Developer's specifiedsources of funds included debt and equity as well as tax credits, an affordable housing loan,deferred development fees, and other public loans and grants.
RSG reviewed relevant reports and supporting exhibits provided by the Developer and made. numerous inquiries for additional information from the Developer to aid in understanding of theProject and the Developer's assumptions. RSG then prepared an independent estimate ofdevelopment costs, which included a combination of computing construction costs based onRSG's experience and credible industry standards and refinement of the information receivedfrom the Developer. RSG shared the development cost estimates with colleagues within thefirm to truth-test the figures, and presented the Draft Report to the City and Developer foradditional feedback.
DATA SOURCES
While RSG referenced the RS Means development cost guides, RSG primarily used MarshallValuation Service ("MVS") to develop replacement costs of the Project improvements. MVS is amonthly publication by Marshall and SwiftiBoeckh, LLC and is regarded as the complete,authoritative guide to construction replacement cost data. MVS is employed by appraisers,assessors, underwriters, insurance companies, and other entities in need of accurate estimatesof building values. MVS collects and consolidates updates to their cost guides monthly orquarterly based on input from current subscribers, phone surveys, field surveys, productcatalogs, trade associations and publications, government statistics and reports, lendinginstitutions, as well as building industry and trade representatives. MVS cost estimates are theindustry standard because the handbook contains over 300 different building occupancies, oftenwith several varying construction classes and qualities for each occupancy, and over 30,000component costs.
The replacement cost of a building includes the total cost of construction required to replace thesubject building with a substitute of like or equal utility using current standards of materials anddesign. The costs included in MVS include the costs of labor, materials, supervision,contractor's profits and overhead, architects plans and specifications, sales taxes, andinsurance.
MVS breaks down costs for more construction types than any other cost guide. Then it furtherrefines the costs based on building class, quality, and materials to yield an estimate of costs persquare foot referred to as the calculator method. The calculator method includes the final coststo the owner, including architect and engineering fees, plans, plan check, building permits, andsurveying. Also included are interest on construction loans, all material and labor costs, localstate and federal taxes, normal site preparation including finish, grading, and excavation for
13
OFFICE OF THE CHIEF LEGISLATIVE ANALYSTCITY OF LOS ANGELES
foundation and backfill, utilities from the structure to the lot line, and classes, occupancy types,and qualities of buildings. Refinements are made to the square foot costs based on the type offire suppression system and the total square footage and perimeter of the building. Finally,current cost multipliers and local cost multipliers adjust the published figures to the constructioncosts for the current month and location (in this case, the City of Los Angeles).
The calculator costs specifically exclude costs of assembling and buying land, pilings andhillside foundations, costs of land planning, preliminary concept and layout, financing costs,extensive yard improvements, off-site costs, tenant improvements, furnishings and fixtures,marketing costs and general contingency. For these cost categories, RSG considered theDeveloper's input or developed cost estimates based on the best information available.
In some cases, a more detailed compilation of costs became necessary, in which case RSGemployed a second technique known as the segregated cost method, wherein the costs ofimprovements are broken down into the component parts. The segregated cost method beginswith the cost per square foot of major building components, such as foundation, frame, wall,floor, etc. This method can be utilized essentially to build up a structure from the ground up, ifall details are known, selecting the quantities and qualities that are specific to the Project. Itshould be noted that the segregated cost method excludes the architect fees in addition to theother exclusions noted above under the calculator method.
The segregated cost method is largely infeasible due to the extensive time and energy requiredto account for the quantity, quality, and type of building components that make up a project ofthis scale. However, the segregated cost method is particularly useful in adding on projectcomponents that are excluded from the calculator method costs. For example, the Projectincludes 10 escalators, which are not normally included in the calculator methodology. Byworking with the Developer, RSG determined the size and height of the escalators andeffectively added the cost in using the segregated cost method.
RSG has used MVS to estimate building and construction costs for over 25 years. RSG hasdeveloped a methodology that utilizes MVS comprehensively and accurately, based on years ofcollaboration with MVS technicians.
ADDITIONAL ESTIMATES AND METHODOLOGY
RSG's consultant team includes a leading Principal with nearly 23 years of experienceanalyzing development project costs, revenues and impacts, a licensed general contractor withan active general building license since 1988, and a project analyst trained and practiced in theareas of project estimating, real estate pro formas, financial analysis and economic modeling.RSG's team independently verified the assumptions presented by the Developer and madeadjustments when market research could not validate the assumptions provided. Consequently,some variations occur between RSG's conclusions and the estimates provided by theDeveloper, as detailed in this Report.
As stated earlier, RSG had to employ additional refinement to the Project costs for items thatare either excluded entirely or not adequately tailored to the Project by MVS. Project costs thatfall into these categories include:
14
OFFICE OF THE CHIEF LEGISLATIVE ANALYSTCITY OF LOS ANGELES
• Furnishings, fixtures, and equipment;
• Feasibility and pre-development costs associated with the current Project;
• Financing and carry costs associated with the current Project;
• Additional overhead premiums;
• City fees and municipal contributions/exactions on the Project;
• Tenant improvement allowances and marketing costs; and
• Contingencies on the direct and indirect costs of the Project.
RSG estimated these additional costs based on the Developer's input, experience with similarprojects, consultation with the development team, interviews of industry professionals, andanalysis of trade and investment surveys.
INFORMATION REFERENCED
In addition to our own independent analysis and research, RSG developed cost estimates forthe Project based on information gleaned from the following resources:
• Responses to RSG's Requests for Information, provided by the Developer on February14,2014, March 14, 2014, March 17,2014, and March 20, 2014;
• Face-to-face coordination and discussion with The Related Companies and SBEEntertainment Group on February 12, 2014 and March 13, 2014 and various phone callsand email coordination;
• Review of the proposed site plan, including building sizes and perimeters, datedNovember 25, 2013;
e Review of the Developer's multifamily market positioning study, prepared by RCLCo inOctober 2013.
• Review of the Developer's pro forma analysis, dated February 20, 2014.
• Review of pertinent legal documents, including:
o the DDA and all four amendments;
o the December 2010 Funding Agreement between the City and Developer;
o the June 2008 Implementation Agreement between the City and Developer; and
o the July 2005 Project Implementation Agreement Plan.
15
OFFICE OF THE CHIEF LEGISLATIVE ANALYSTCITY OF LOS ANGELES
COST ASSUMPTIONS
RSG computed costs for each component of the Project, detailed in the following sections,including the following components:
• Subterranean parking levels;
• Multifamily shell and core;
• Retail shell, core, and tenant improvements;
• Office shell and core;
• Condo shell and core; and
• Hotel shell and core.
Based on the hard construction costs associated with each component of the Project, RSGestimated and distributed the costs associated with the interior circulation, underground andmezzanine parking, off site improvements, LEED Silver certification (required by the DDA), anddirect contingencies. The costs presented in the following sections are inclusive of thesefactors.
With the exception of several indirect cost categories, RSG acknowledges that the Developer'sindirect costs are realistic and conservative estimates based on the direct construction andother costs.
SUBTERRANEAN PARKING LEVELS
RSG utilized MVS cost estimates for Class A Underground Parking to estimate the costsassociated with the subterranean parking levels. Per MVS, underground parking garages areindependent structures built below grade with a load bearing roof. Basement parking is beneathan above-grade structure. Class A Underground Parking includes unfinished concrete,waterproofed walls, and load bearing roof. The load bearing roof is intended to support theabove-grade construction.
The total cost of the subterranean parking is $65,270,000, inclusive of only the areas allocatedto parking across the six subterranean and mezzanine levels. Costs associated with verticaltransportation (elevators, escalators, and stairs), storage, truck loading/unloading dock, securityand mechanical were estimated separately and included in the costs associated with eachcomponent.
MULTIFAMILY SHELL AND CORE
For the purpose of this analysis, RSG utilized MVS cost estimates for Luxury Apartments toestimate the construction costs associated with the multifamily component. According to MVS,Luxury Apartments are often high-end and owner occupied dwelling units, however, some rentalapartments can be built to these specifications. RSG utilized the high rise luxury apartments'shell and core build out, adding costs for built in appliances, sprinklers, and elevators.
16
OFFICE OF THE CHIEF LEGISLATIVE ANALYSTCITY OF LOS ANGELES
The shell build out is expected to have the best metal or stone, brick or block back up and solarglass exterior wails, plaster, high quality veneers, marble and carpet, and top quality lobbyfinishes within the core, and a luminous lobby ceiling with excellent lighting and fixtures, Theinterior finish is estimated with fine detail, hardwoods, ceramic, custom carpet and built-ins.Fine fixtures and more than one bath per bedroom fill out the units.
The multifamily apartments have some exterior terraces. Load bearing roofing has beenincluded above some multifamily apartment square footage to accommodate the added weightof exterior terraces.
Table 4: Multifamily Cost Assumptions
Building Square FeetLoad Bearing Roof Square FeetAverage PerimeterStories
380,43725,460
70413
Adjusted Cost per Square Foot 499.10Adjusted Total Cost $189,875,000Sources: The Related Companies, RSG, Marshall Valuation Service
The multifamily development costs are estimated at $189,875,000, inclusive of exterior sheilcosts (South Tower), interior build out, residential lobby and amenities, appliances, load bearingroofs, terrace hardscape and soft-scape, apartment pool and pool deck, parking, commonareas, and circulation elements associated with the multifamily residential.
RETAIL SHELL, CORE, AND TENANT IMPROVEMENTS
To evaluate the costs of the retail shell in a manner that most closely matches the actual typeand quality of construction, RSG utilized the MVS development costs for the Luxury Apartmentsfor shell construction, while employing highest quality retail shopping center MVS type for buildout for interior improvements.
RSG recognizes that the high concentration of food and beverage uses within the retailcomponent may skew the costs, Because a high portion of the retail component is dedicated torestaurant uses and restaurant uses have significantly higher improvement costs per squarefoot, RSG evaluated each interior improvement space separately, according to the followingtable.
17
OFFICE OF THE CHIEF LEGISLATIVE ANALYSTCITY OF LOS ANGELES
Table 5: Retail Cost Assumptions
BuildingSquareFeetAverage PerimeterStories
215,751VariesVaries
Adjusted Cost per SquareFOCit $733Adjusted Total Cost $158,121,000Sources: The Related Companies, RSG, Marshall Valuation Service
The total cost of the retail component is $158,121,000. The costs associated with the retailcomponent of the Project are relatively high compared to typical retail developments; largelybecause of the architectural and construction quality of the shell. RSG believes that this level ofconstruction quality may be supportable given the type of retailers sought by the Developer toachieve targeted rents and occupancy.
OFFICE SHELL AND CORE
As a means of estimating the office component development costs, RSG utilized office interiorfinish costs to estimate the interior build out and hotel shell costs for the shell. RSG utilized thehotel shell costs because the office space is integrated with the significantly larger hotelcomponent in the North Tower. RSG expects the architect to specify that, as with the SouthTower, the North Tower will have continuity among exterior finishes and construction qualityregardless of interior space use - office or hotel.
The costs associated with the office improvements are presented in the following table, afteradjusting for building height, floor area, story height, current costs, and local multipliers.
Table 6: Office Cost Assumptions
BuildingSquare FeetAverage PerimeterStories
46,567996
2
Adjusted Cost per SquareFoot $438Adjusted Total Cost $20,401,000Sources: The Related Companies, RSG, Marshall Valuation Service
The total costs of the office improvements are estimated at $20,401,000. RSG has estimatedthe costs associated with the office inclusive of shell, core improvements, common areas, lobbyspace, circulation, and parking improvements.
CONDO SHELL AND CORE
Above the multifamily apartments, there is one level of condominium amenities and then ninelevels of for-sale condominiums (which includes one floor of amenities, and one penthouse
18
OFFICE OF THE CHIEF LEGISLATIVE ANALYSTCITY OF LOS ANGELES
floor). In accordance with the other components of the Project, the shell for the South Tower isentirely valued as luxury apartment shell construction. The interior improvements for the firsteight levels are valued as Class A, good quality luxury apartments. The top floor, Level 37 wasevaluated at an additionally inflated construction cost as it contains three penthouse units. RSGanticipates that the penthouse unit construction will be at slightly higher quality than theremainder of the condominium units.
The costs associated with the construction of the condominiums are presented in the followingtable.
Table 7: Condominium Cost Assumptions
BuildingSquareFeetAveragePerimeterStories
99,400428
9
AdjustedCost per SquareFoot $586AdjustedTotal Cost $58,288,000Sources: The Related Companies, RSG, Marshall Valuation Service
The cost per square foot associated with the condominium construction is inclusive of off-siteimprovements, parking, LEED Silver certification, direct contingency, shell and core build out,and condominium amenities including pool and pool deck. The costs to develop thecondominiums are $58,288,000.
HOTEL SHELL AND CORE
As previously discussed, PKF analyzed the development costs associated with the Hotelcomponent of the Project. According to PKF, the Hotel will include hotel entrance, plaza, lobbybar, retail, restaurants, hotel kitchen, sky lobby, terraces, meeting space, pool, pool bar, pooldeck, cabanas, spa and health center on the first five floors. Floors ten and above will containthe hotel guestrooms. PKF concluded that the total development costs for the Hoteldevelopment, including land cost, parking, hard, and soft costs, is $285,230,000. For additionaldetail, please refer to the PKF Report entitled "Analysis of Potential Market Demand for theProposed Grand Avenue Hotel to be Located in Downtown Los Angeles, California" and datedMarch 2014.
OFF-SITE IMPROVEMENTS
Pursuant to the Amended DDA, the Developer must provide certain off-site improvements. Theoff-site improvements are described as streetscape improvernents, including landscaping,streetscape amenities, sidewalks, curbs, gutters, street trees, street lighting, otherimprovements to the street, and other off-site publicly owned improvements. The Developerhas estimated that the cost of off-site improvements will total $5.5 million.
19
OFFICE OF THE CHIEF LEGISLATIVE ANALYSTCITY OF LOS ANGELES
LEED CONSTRUCTION
Included in the direct hard costs, RSG incorporated a 3 percent LEED Silver certificationinflation factor. LEED stands for Leadership in Energy and Environmental Design and wasestablished by the United States Green Building Council as the most comprehensive greenconstruction rating system. The LEED system is now recognized as a nationwide benchmarkfor green design. LEED Silver is the second among four tiers in the LEED certification system.According to MVS, the additional cost of building green is estimated at between 0 and 7 percentfor commercial buildings and 3 to 20 percent for residential buildings.
It is RSG's belief that many of the construction types, qualities, and classes used in this analysisare already constructed at a very high standard, which, in the current construction climate,includes environmentally efficient materials. With this, RSG utilized the minimum LEED inflationfactor of 3 percent to estimate the additional costs associated with the LEED Silver certification.
ADDITIONAL COSTS OF CONSTRUCTION
In addition to hard construction costs, off site improvements, and LEED certified constructioncosts, RSG analyzed the indirect costs of the Project. Indirect costs include specialtyconsultants, insurance, legal, accounting, title, permitting, fees, taxes, marketing commissions,operating deficit, overhead reimbursements, the developer's fee, financing costs, debt and carrycosts, and an indirect contingency. For the most part, RSG finds that the Developer's indirectcosts are reasonable for a project of this scale. Several of these categories were included in thecost estimates and are described in more detail, based on input from the Developer:
• Specialty consultants include persons or companies specializing in verticaltransportation, curtain walls, loading docks, window washing, landscaping, and irrigation,among other aspects.
• Permits, impact fees, and surveys include estimates based on the Developer'sexperience in the market. Fee and permit benchmarks were used to estimate this figure.The benchmarks are $18 per square foot for retail and hotel uses, $17,500 percondominium unit, $20 per square foot for office use, and $10,000 per apartment, plusan estimated $1.94 million CRA Art Fee.
DEVELOPMENT COST SUMMARY
The total applicable development costs associated with the Project, excluding land costs andearly planning, design, and entitlements, are estimated at $847 million, approximately 13percent lower than the Developer's estimate. Total development costs are outlined in the tablethat follows.
20
OFFICE OF THE CHIEF LEGISLATIVE ANALYSTCITY OF LOS ANGELES
Multifamil~ Retail Office Condo Hotel TotalRSG RSG RSG RSG PKF RSGIPKF
COST ESTIMATES 11Vertical Construction 171,077,000 131,027,000 15,492,000 51,459,000 187,360,000 556,415,000Parking 16,788,000 25,984,000 4,669,000 6,319,000 11,510,000 65,270,000OTHER COSTS /2Off Site 2,010,000 1,110,000 240,000 510,000 1,630,000 5,500,000
Subtotal 189,875,000 158,121,000 20,401,000 58,288,000 200,500,000 627,185,000
Land Acquisition
RSG ADJUSTMENTSA&E/Special Consultants 4,450,000 2,460,000 1,050,000 18,530,000 26,490,000Insurance/Legal/Accounting 1,400,000 1,980,000 3,700,000 2,360,000 7,590,000 17,030,000Titie/Permits/Feesrraxes 3,900,000 1,620,000 230,000 780,000 8,120,000 14,650,000Marketing/Commissions 1,250,000 10,450,000 1,940,000 2,520,000 16,160,000Operating Deficit 1,580,000 2,830,000 250,000 400,000 6,670,000 11,730,000Overhead Reimb 6,980,000 5,651,000 867,000 2,114,000 8,560,000 24,172,000Developer's Fee 6,980,000 5,651,000 867,000 2,114,000 8,560,000 24,172,000Financing Costs 4,700,000 1,820,000 570,000 900,000 2,520,000 10,510,000Debt Interest Carry 32,450,000 6,930,000 1,400,000 3,580,000 10,100,000 54,460,000Indirect Contingency 3,185,000 1,970,000 491,000 791,000 14,080,000 20,517,000
Subtotal 66,875,000 41,362,000 10,315,000 16,609,000 84,730,000 219,891,000
Total Costs 256,750,000 199,483,000 30,716,000 74,897,000 285,230,000 847,076,000
11 Includes costs estimated using Marshall Valuation Service, MVS cost estimates, as outlined In this report, includes normal architectural and engineeringfees, and plan check, building permits, and survey'nq. among other costs.
21 Other Costs includes off site costs as reported by the Developer.Sources: The Related Companies, Marshall Valuation Service, RSGlnc, and PKF Consulting USA
VARIANCES WITH DEVELOPER'S COST ESTIMATES
The Developer has been pursuing development of the site for several years. Because of theduration of the Project, the developer has incurred many expenses that, for the purpose of thisanalysis, have not been considered direct costs of the development of the Project because theyare 100 percent at risk (such as the $50 million expended for Grand Park, which provided theDeveloper a long-term ground lease of the site only if development proceeds, as well as $49.9million in sunk costs for past (and abandoned) development programs). Including these costswould only exaggerate the gap on the Project from the City's perspective, so they have beenexcluded in this Report. However, the Developer recognizes all costs for development of ParcelQ, so their gap analysis would naturally be greater. When the land acquisition and earlyplanning, design, and entitlement costs are included in the development cost estimate, theProject costs would soar to over $950 million.
Aside from these exclusions, RSG also reached a different conclusion in some cases on thecosts for each component. In aggregate, these variances are not statistically significant -totaling approximately three percent of the Project cost, but still amount of $24.1 million giventhe scale of the development program.
21
OFFICE OF THE CHIEF LEGISLATIVE ANALYSTCITY OF LOS ANGELES
After adjusting for the abovementioned exclusions, the Developer estimates the totaldevelopment cost to be $871.2 million, compared to RSG's cost of $847.1 million. A summaryis presented in the table below.
22
I-enenw>-...J...JW«(!)zz««Wen>0i=...J«u.....Jo~>-(!)I-W-...J()u,W:coW::r:I-u,oWou::u,o
oooo g-g 0 =.o 1£ 0;U
oooQl gU (0 coE (/) 60'" .,.
'"'"'"CNco..;'"
oc>oci'"<6
o'"oci<D
'"ui
c»'"'"cic»coN
c>gcios05~
c>oo05'"<>05'"
cs'"o05"'ro.,f
c>'"o05"'co..."
c>o
'"gN
'"ggc>05
ooo05~ro
ooo05c»"'.ro
ooo05Nc»uico
'"oo058N~N
ooo05:::<6"'N
ooot'"ui
c-oc>
'"cocoN
'"'"'"'"'"ec;f
'"'"'"c'"....,;'"N
!!!(/)
~oUI-ZW:;;a.o-'willCl
;;;lZu:
OFFICE OF THE CHIEF LEGISLATIVE ANALYSTCITY OF LOS ANGELES
SUPPORTABLE INVESTMENTThe supportable investment for the Project is the projected value of the Project based on certainoperating and sales assumptions. There are a variety of metrics RSG typically considers whenperforming these analyses (including unleveraged internal rate of return and directcapitalization), but for purposes of the gap analysis, RSG used the following approaches:
• Income Property (All but Condorniniums): RSG employed the Discounted Cash FlowMethod, which uses a combination of the net present value of the net operating incomeover a holding period, typically at least 10-years, and the reversion value of the property,net of sales costs and expressed in current dollars. The majority of the value is derivedfrom the discounting of the net operating income, which is how this method earns itsname. Although computed similarly to the direct capitalization method, the reversionvalue is determined by dividing the net operating income in the year following the holdingperiod by a more conservative capitalization rate as determined by the market. Salescosts are typically deducted from this value, which is then discounted at a discount rate.This method is commonly used in hotel valuation, as well as projects with more volatilecash flows.
• Condominiums: RSG used a direct method of estimating the net sales proceeds basedon assumed sales prices, inflation, and sales costs.
Detailed cash flows are provided in this Report for reference. Ultimately, RSG and PKFcombined to estimate the value of the Project to be approximately $684.2 million primarilybased on the discounted cash flow method.
ASSUMPTIONS
Key to the computation of valuation of any income-generating real estate are the assumptionsused to apply to the property's revenue stream, consisting of two types of capitalization rates(going-in and residual) and the overall return on investment. These factors are contingent onthe expectations of the real estate investment market, and account for risk, location, and useamong other considerations.
INCOME-GENERATING PROJECT COMPONENTS
In order to evaluate the feasibility of the income-generating components of the Project, RSGlooked at the net operating income, reversion value, and total return on cost Manyassumptions come into play when projecting cash flow and developing a valuation forecast,including construction costs derived from the feasibility study, absorption rates, gross incomeprojections, operating expenses, capitalization rates, and inflation rates.
RSG's revenue and valuation forecast for the multifamily, retail and office components arepresented in the tables at the end of this section.
The assumptions are described below:
24
OFFICE OF THE CHIEF LEGISLATIVE ANALYSTCITY OF LOS ANGELES
• Construction Schedule - RSG utilized a construction schedule generally consistent withthe Developer's year-to-year equity outflow during the construction period. Constructioncosts are inflated by three percent per year over the construction period.
• Rental Rates - RSG combined industry research, experience and expertise with theDeveloper's assumptions and expectations. RSG assumed that the gross rental ratewould be $4.40 per square foot for market rate multifamily, $1.10 per square foot foraffordable multifamily, $5.75 per square foot (triple net) for retail, and $3.50 per squarefoot (triple net) for office. Multifamily rents are inflated at a rate of three and a halfpercent per year. Retail and office rents are inflated at a rate of two and a half percentper year.
• Occupancy Rates - RSG utilized generally accepted industry standards and reviewedthe Developer's pro forma for projected occupancy rates. The assumed occupancyrates at stabilization are 95 percent for market rate multifamily, retail and office uses. Aminor impact on the Project operating income, RSG assumed 97 percent occupancy forthe affordable multifamily due to expectation that this Project will have an extensivewaiting list.
• Absorption Rates - RSG estimated the absorption rates based on experience withsimilar projects and feedback from the Developer. Absorption rates for each use areincluded in the cash flow projections.
• Other Income and Common Area Maintenance -other income sources were identifiedvia coordination with the Developer and review of the Developer pro forma. Otherincome sources include parking revenues, vending and event revenues, advertisinq, andvalet parking. RSG utilized a $0.50 per square foot common area maintenancerecovered cost (income) for the retail component.
• Operating Expenses - the operating expenses included property taxes and operations.Property taxes are based on the current property tax rate for the Project multiplied by thecapitalized value upon completion. Other operating expenses are estimated based onsurveys of existing high-rise projects in Los Angeles as follows: $8,000 per unit formultifamily, 5 percent of gross rent for retail, and 35 percent of gross rent for office.Property taxes are inflated at a rate of two percent per year and other operatingexpenses are inflated at a rate of three percent per year.
• Capitalization Rates - For both the determination of going-in (initial) and residual (atreversion) capitalization rates, RSG collected data from several investor surveyscompiled by independent third parties of the Los Angeles real estate market, includingCBRE, RERC (Real Estate Research Corporation), IRR Viewpoint, andPricewaterhouseCoopers. As the Project includes a range of uses and very uniqueconstruction qualities, the Project does not fit perfectly into any categories tracked by theabove-mentioned data sources. RSG analyzed representative rates for each producttype, and compared rates from each investor survey data source to estimate thefollowing assumed capitalization rates:
25
OFFICE OF THE CHIEF LEGISLATIVE ANALYSTCITY OF LOS ANGELES
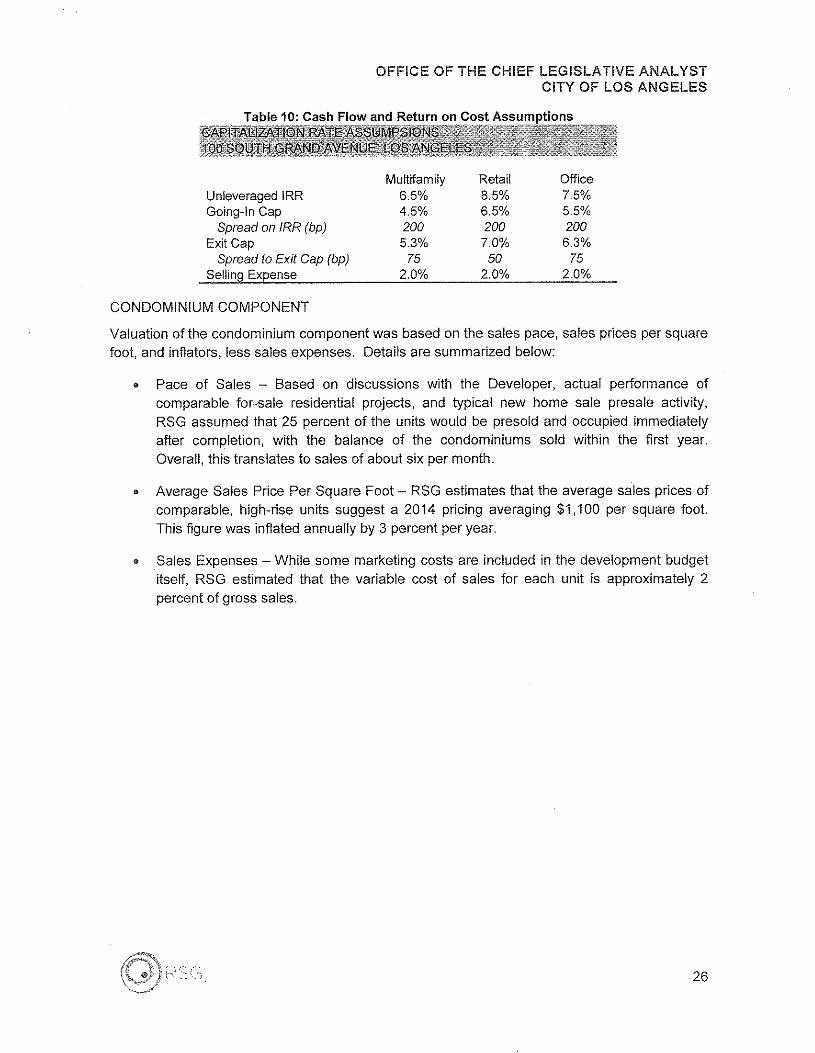
Table 10: Cash Flowand Return on Cost Assumptions
UnleveragedIRRGoing-InCap
Spread on IRR (bp)Exit Cap
Spread to Exit Cap (bp)SellingExpense
Multifamily6.5%4.5%2005.3%
752.0%
Retail8.5%6.5%2007.0%
502.0%
Office7.5%5.5%2006.3%
752.0%
CONDOMINIUM COMPONENT
Valuation of the condominium component was based on the sales pace, sales prices per squarefoot, and inflators, less sales expenses. Details are summarized below:
• Pace of Sales - Based on discussions with the Developer, actual performance ofcomparable for-sale residential projects, and typical new home sale presale activity,RSG assumed that 25 percent of the units would be presold and occupied immediatelyafter completion, with the balance of the condominiums sold within the first year.Overall, this translates to sales of about six per month.
• Average Sales Price Per Square Foot - RSG estimates that the average sales prices ofcomparable, high-rise units suggest a 2014 pricing averaging $1,100 per square foot.This figure was inflated annually by 3 percent per year.
• Sales Expenses - While some marketing costs are included in the development budgetitself, RSG estimated that the variable cost of sales for each unit is approximately 2percent of gross sales.
26
, "~O>~, 'N
, , .~<O~, 'N
, ,.::"'B', 'N
, ,,,.~<OB', 'N
N, '~'~
,.,
•~.
'"I~g I~SI '.
ilc
1-00OOLLI>-..J..JLLI~(!lZZ~~LLIoo>0j::..J~u....JO~>-(!lI-LLI-..JUu,LLI:cULLIJ:I-u,oLLIUu,u,o
~.I
~I~I~I~I
i
coN
1J? ... 0:)""
~*" :!';N"'" :; ~,oi
C»N
c:t
I- (f) ~ ~~~
til..J ±~g 0;
..J til ' ,N 0« (!)
'IC')
z z ~~ ~« « , , ~
til (f) "- ~ "> 0 ' '
1= ..J« ~~ eI.!.. ~..J 0 ' ,. i
~ >- ~";'~
e I-til l3 * , ;...J ~ ~, ,.I.!.. ;: .... ~til ' 'N
:c ,0 ~
g ~, '" 0; :g.til $:<08
J: ' 'N
l-I.!..
~ ~ •0 , ,M0;
~til ",''?~0u::
~~~ <0
~I.!.. 00
0 ' oN §~~,«;"':~
~ ~&~~'-;-"?~
S :,,~ <0 •, ,0
0; :;~.~""?":'~
S:~
~ ~~.~~~ ,. 8~ ~"i· ~0- ~ ·R "
o~",,,,
~ ~~. ~~.~ i",0""""
~ . ~~ g":} g. <~ :£ re~ i~ ~ S~ ~ ~"~
~.~~.~.~.
, ~o0; ~~ N
~.M~~~ ~N
!~~~° s ~" 8c, 0 ~c ~ c;~ 0'
~ ::: '/2" ~ " ~cc
g.~?i.~.~~ E
t " ~ g0
0;
~ jg:~~;!~ ;:: N:::. '" s
. if Ig ~~ mg~
gg ~ .s
~ " NO
~ 2~ 0,
~~.[;;":1;" i12'~ 3~ ~l,;" ~"". ~ ~" ~ ~ 0" iQ" ;::" z. ~,
s se~~~,~
c; ~~z 3 ¥ *]>;.~ .2 " ;;:.!
... <ii ... o;~~~ 1 :ei ~ ! i !:ia ~~0 e~:e>~ o '" '" ., .. .,IL. <::: 'e
~Q.9: @) s '" .. VJ .2 g~ 0 I~ill g~g~ 11~ ~~:5e-~ 00 § ~
~ g '" <II g" ~~ ~ f.. ;;;""J! .E~ li:.e~~~ • 0"'s 2 '" <II <II ~ .z000 " o;8~~
~u j0 , "W0 sJ 0 N ~ ~~
OFFICE OF THE CHIEF LEGISLATIVE ANALYSTCITY OF LOS ANGELES
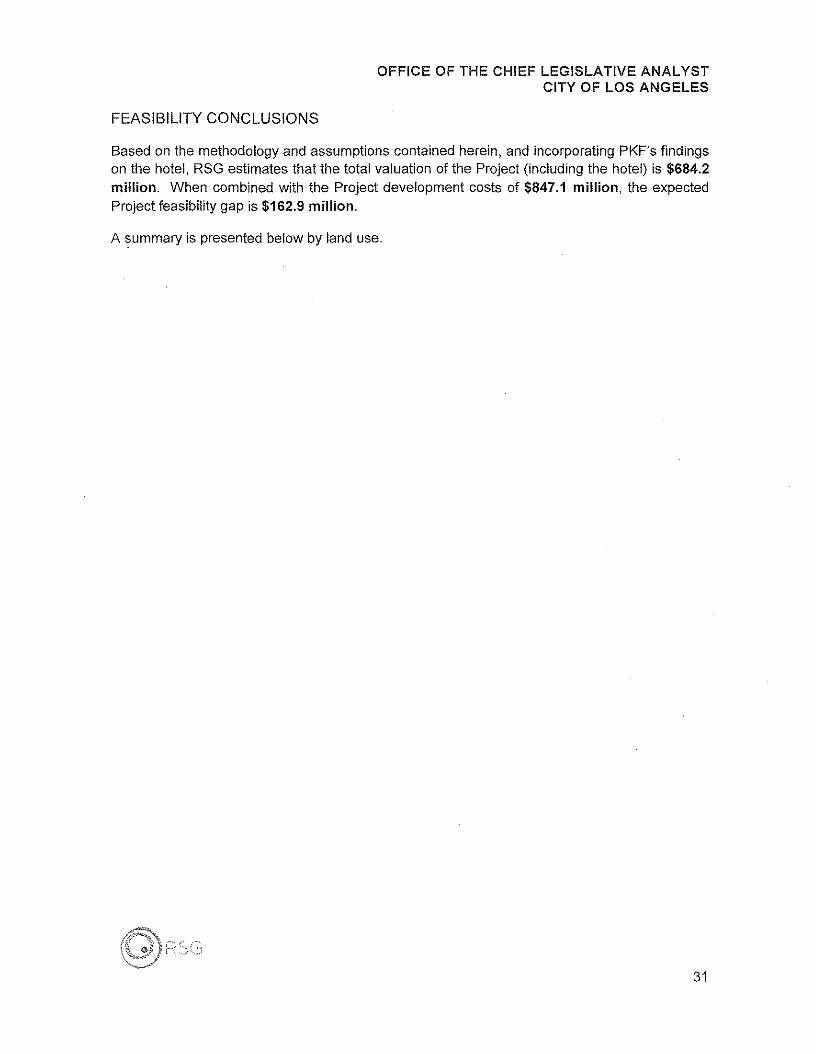
FEASIBILITY CONCLUSIONS
Based on the methodology and assumptions contained herein, and incorporating PKF's findingson the hotel, RSG estimates that the total valuation of the Project (including the hotel) is $684.2million. When combined with the Project development costs of $847.1 million, the expectedProject feasibility gap is $162.9 million.
A summary is presented below by land use.
31
I-e/)e/)W>-..JN..JW«(!) 0 0 0 '"0 0 0zz i2 0 0 0«« to 0 0We/) s Q, ... M 00 N '">0 I- (!) ... ... Nf=..J (f) ... co CD
«ll. 0:: CO to ~..JO <I> <J> <I>!!1>-
0(!)I- 0 00 0 0W- 0 0 0..JU 0 0 0u,
~ ~cc '" 0 cW N (J) M ID
J:..,- <'i e- C:c co co 0 0
0-U N ~ -e- E0W <F> ff> ... c
:c s:oI- 0 0 0 mm
u, 0 0 0 ~0 0 0 .£0 0 r--: 0 0 w
W '"0 (!) (J) 0 0 .~c ro 0 -e-U 0 ii! ...- ro M '"cu:: () I'- I'- m
u, ~0
0 ... <I> YO- ~s:w
0m
0 0 u0 0 0 ID0 0 0 £;
CI> cD 0 0 ,SiES; ~ 0 0 '0I'- (J) CO c;0 1'-- N ~00:: co N .£
IDD
<I> <I> <I> Cmo c'w 0
0 0 0
~:g
0 0 0 ~0 0 0 '"<'i 0 0 0 >'iii (!) co 0 0 ID ,; ID-(f) ... -e- 0> :0 w £;8!0:: m cD ~ec ~ '0 E(J) ~ -e-- C ,g~ N t1 ~
0 E t1<J> <I> YO- 0C '0 0
ID 00 0 ID -c
C0 E m0 0 0 0- > ID0 0 0 0 " EE(!)
0 0 0 OJ ID 0-
'" 0 0 > 'e- oID OJ
~CI) I'- 0 CO 0 0- >0=0:: cD ro co ID ID ID -c
to I'- r-, £; £; 0 </)
" ::>:a: NE "0 '"C 0>
<I>0 C u:: C
<I> <fie '" ~'0 ID ID "5c; £; wg: 0 C'C 0- 0> 0ID E C 0:<:: '0 0 U u,u
tl '" .c ~ "m o 0-0 2 m ~ <5U w ID w .E0 0> »,C 0 C D CJ
C 'S '0 </)(])~ ID 0::
E ID .f:E "0 -0Q. 0- ID * (/~j0 ~ 0 '0 '0Qi OJ 0 .~OJ .x> c > .c 0-ID 1;3 0::(]) 0 0 m0 ~ !:? E CJ 0;
'" ID ID ~ro ::> Q. c; .c .cC ro til u:: >- >- ~
0u; > o ;0 '" '" </)
OFFICE OF THE CHIEF LEGISLATIVE ANALYSTCITY OF LOS ANGELES
FISCAL IMPACT ANALYSIS
The Project will provide benefits to the City and County in the form of site-specific tax revenuesgenerated by the proposed development. The City is primarily interested in the net new site-specific revenues. Net new revenue is defined as tax revenues to the City General Fund orCounty General Fund generated by the Project less any revenue already generated from thesite or revenues transferred from other areas of the City or County.
The following analysis of Project-generated revenue is categorized by the following revenuesources:
• Property Tax;• Sales Tax and In-Lieu Sales Tax Revenues;• Transient Occupancy Tax (TOT);• Motor Vehicle License Fee and Property Tax In-Lieu;• Parking Occupancy Tax (split into first 10 years and afterwards);• Gross Receipts Tax;• Utility User's Tax;• Property Transfer Tax (split into initial and recurring revenues);• Construction Materials Sales Tax; and• Construction Gross Receipts Tax.3
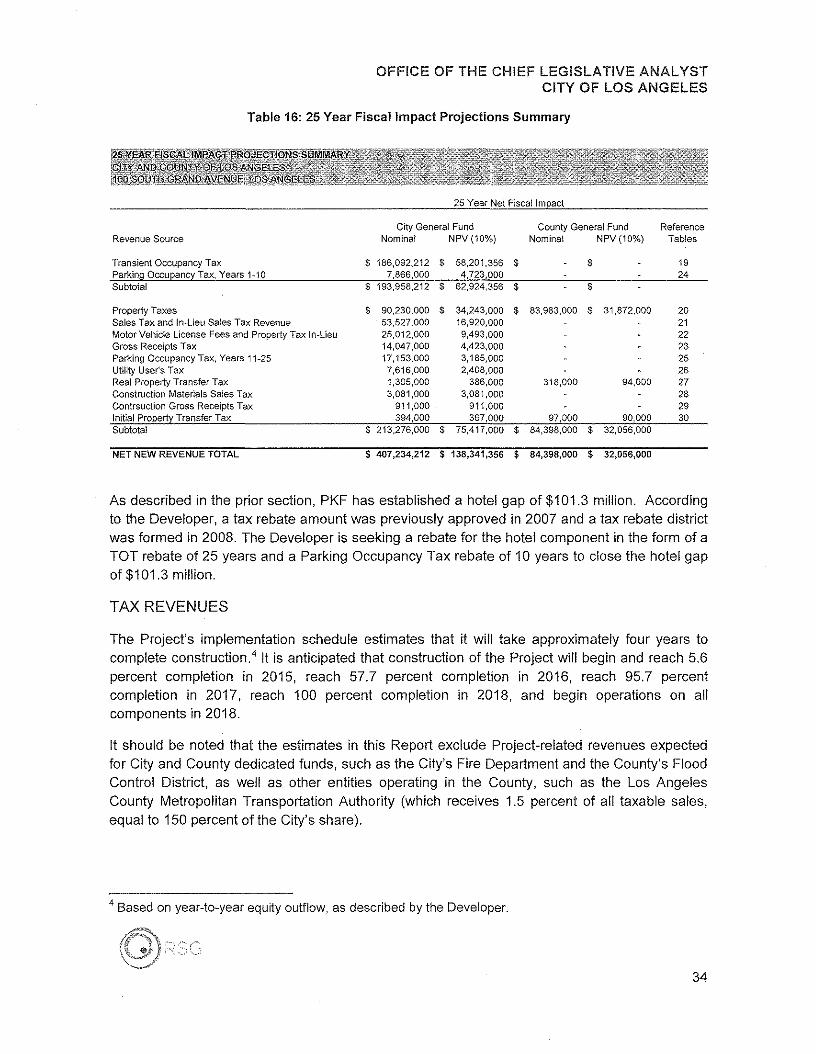
FISCAL IMPACT SUMMARY
The net new tax revenue presented in all fiscal impact revenue projections begins with"Construction Year One" in 2015 and ends in 2043, a 25-year term beginning in the first year ofoperations in addition to a four-year construction period. It is estimated that the Project willgenerate $62.9 million in tax revenue from certain sources (25-year discounted net presentvalue at ten percent represented as 2018 dollars) and $75.4 million (NPV ten percent) in taxrevenue from other sources through 2043, a total of $138.3 million (NPV ten percent).
Table 16 provides a summary by revenue source of the total net new revenues for the City andCounty over the 25-year period.
3 Construction Materials Sales Tax and Construction Gross Receipts Tax are one-time revenues generated frompurchases of materials and from the business tax during the construction period.
33
OFFICE OF THE CHIEF LEGISLATIVE ANALYSTCITY OF LOS ANGELES
Table 16: 25 Year Fiscal Impact Projections Summary
25 Year Net Fiscal Impact
City General Fund County General Fund ReferenceRevenue Source Nominal NPV(10%) Nomina! NPV(10%) Tables
Transient Occupancy Tax $ 186,092,212 $ 58,201,356 $ $ 19Parking Occu!2anc~Tax, Years 1~10 7.866,00Q 4,723,000 24Subtotal $ 193,958,212 $ 62,924,356 $ $
Property Taxes $ 90,230,000 $ 34,243,000 $ 83,983,000 $ 31,872,000 20Sales Tax and In-Lieu Sales Tax Revenue 53,527,000 16,920,000 21Motor Vehicle License Fees and Property Tax In-Lieu 25,012,000 9,493,000 22Gross Receipts Tax 14,047,000 4,423,000 23Parking Occupancy Tax, Years 11-25 17,153,000 3,185,000 25Utility User's Tax 7,616,000 2,408,000 26Real Property Transfer Tax 1,305,000 386,QOO 318,000 94,000 27Construction Materials Sales Tax 3,081,000 3,081,000 28Contrsuction Gross Receipts Tax 911,000 911,000 29Initial Proeertl Transfer Tax 394,000 367,000 97,000 90,000 30Subtotal $ 213,276,000 $ 75,417,000 $ 84,398,000 $ 32,056,000
NET NEW REVENUE TOTAL $ 407,234,212 $ 138,341,356 $ 84,398,000 $ 32,056,000
As described in the prior section, PKF has established a hotel gap of $101,3 million, Accordingto the Developer, a tax rebate amount was previously approved in 2007 and a tax rebate districtwas formed in 2008, The Developer is seeking a rebate for the hotel component in the form of aTOT rebate of 25 years and a Parking Occupancy Tax rebate of 10 years to close the hotel gapof $101,3 million,
TAX REVENUES
The Project's implementation schedule estimates that it will take approximately four years tocomplete construction." It is anticipated that construction of the Project will begin and reach 5,6percent completion in 2015, reach 57,7 percent completion in 2016, reach 95,7 percentcompletion in 2017, reach 100 percent completion in 2018, and begin operations on alicomponents in 2018,
It should be noted that the estimates in this Report exclude Project-related revenues expectedfor City and County dedicated funds, such as the City's Fire Department and the County's FloodControl District, as well as other entities operating in the County, such as the Los AngelesCounty Metropolitan Transportation Authority (which receives 1.5 percent of ali taxable sales,equal to 150 percent of the City's share),
4 Based on year-to-year equity outflow, as described by the Developer.
34
OFFICE OF THE CHIEF LEGISLATIVE ANALYSTCITY OF LOS ANGELES
The following subsections describe the special source, recurring, and one-time revenuesexamined; the methodology and approach used to project future revenue; and the amount ofsite-specific revenue generated.
Table 17 and Table 18, on the following pages, summarize the tax revenues projected for theCity and County, respectively.
35

1-00OOW>-...J...JW<:«(!)Zz<:(<:(WOO>0j::...J<:(LI.....Jo!:'2>-(!)I-W-...JULI..W5:oWJ:l-u,oWou:LI..o
000000000000000000000000000000000000000000000000000000000000000000000000000g~~~g~~~g~~gg~~~g~g~~gg~~NNNNNNNNNNNNNMMMMMMMMM~~V
, , , ,
0000000000OOOOOOOOCO0000000000ctir..:roONWol...:ioilIiroON'-OI'-O">.,...-~mO'1(01'-1'-1'-1'-1'-00 CO (O{O
00000000000000000000000000000 0
~~~~~~~~~~~~~~~~~~~~~~~~~~~~~ gro~I'-O~O'1~O">~O(oNO'1(DM""'-O'1l'-m'-O~~mm(DrooN~ NMO'1(o""'-NMm(D/;OO~M~m(OO~MmI'-O'1""'-MmI'-O'1N~(D .,...-nm~~~~~~rorororororommmmmm~~~~~~~~ ~
N
* *0000000000000000000000000 0
~~g~~~~~~~~~~~~~~~~~~~~~~g~~~3~~~gg~~~~~N~~~~~~~~~~~~mm(O(Dt-l'-roroO'10'100~NNM~~m(Dl'-roroO'1 ~,~~~~~~~~~~~~~~~~~~~~~~~~~ ri~
* *
mm
'":;: <Dn,,; <:')
~*000m-mn"*000«icon
~000«i0~N-
~000«i
'"n-
'"000riN~-e
'"000riN-e
"'"000n-m-eoi
~0006Nm«i
*000ri~N
"n'"comn_oNro-m
'" :y<f'.
">u,Z
ooo
~'"
OFFICE OF THE CHIEF LEGISLATIVE ANALYSTCITY OF LOS ANGELES
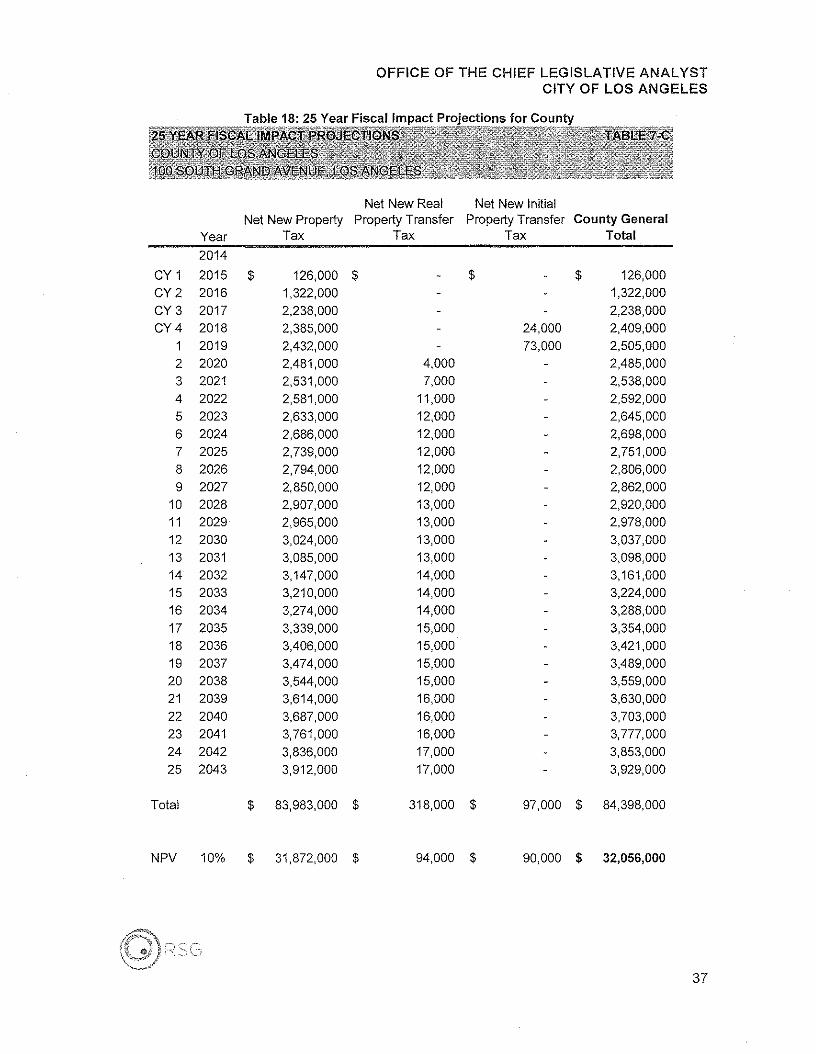
Table 18: 25 Year Fiscal Impact Projections for County
Net New Real Net New InitialNet New Property Property Transfer Property Transfer County General
Year Tax Tax Tax Total
2014
CY 1 2015 $ 126,000 $ $ $ 126,000CY2 2016 1,322,000 1,322,000CY3 2017 2,238,000 2,238,000CY4 2018 2,385,000 24,000 2,409,000
1 2019 2,432,000 73,000 2,505,0002 2020 2,481,000 4,000 2,485,0003 2021 2,531,000 7,000 2,538,0004 2022 2,581,000 11,000 2,592,0005 2023 2,633,000 12,000 2,645,0006 2024 2,686,000 12,000 2,698,0007 2025 2,739,000 12,000 2,751,0008 2026 2,794,000 12,000 2,806,0009 2027 2,850,000 12,000 2,862,000
10 2028 2,907,000 13,000 2,920,00011 2029 2,965,000 13,000 2,978,00012 2030 3,024,000 13,000 3,037,00013 2031 3,085,000 13,000 3,098,00014 2032 3,147,000 14,000 3,161,00015 2033 3,210,000 14,000 3,224,00016 2034 3,274,000 14,000 3,288,00017 2035 3,339,000 15,000 3,354,00018 2036 3,406,000 15,000 3,421,00019 2037 3,474,000 15,000 3,489,00020 2038 3,544,000 15,000 3,559,00021 2039 3,614,000 16,000 3,630,00022 2040 3,687,000 16,000 3,703,00023 2041 3,761,000 16,000 3,777,00024 2042 3,836,000 17,000 3,853,00025 2043 3,912,000 17,000 3,929,000
Total $ 83,983,000 $ 318,000 $ 97,000 $ 84,398,000
NPV 10% $ 31,872,000 $ 94,000 $ 90,000 $ 32,056,000
''"j (""
c<; ."\
37
OFFICE OF THE CHIEF LEGISLATIVE ANALYSTCITY OF LOS ANGELES
RECURRING REVENUES
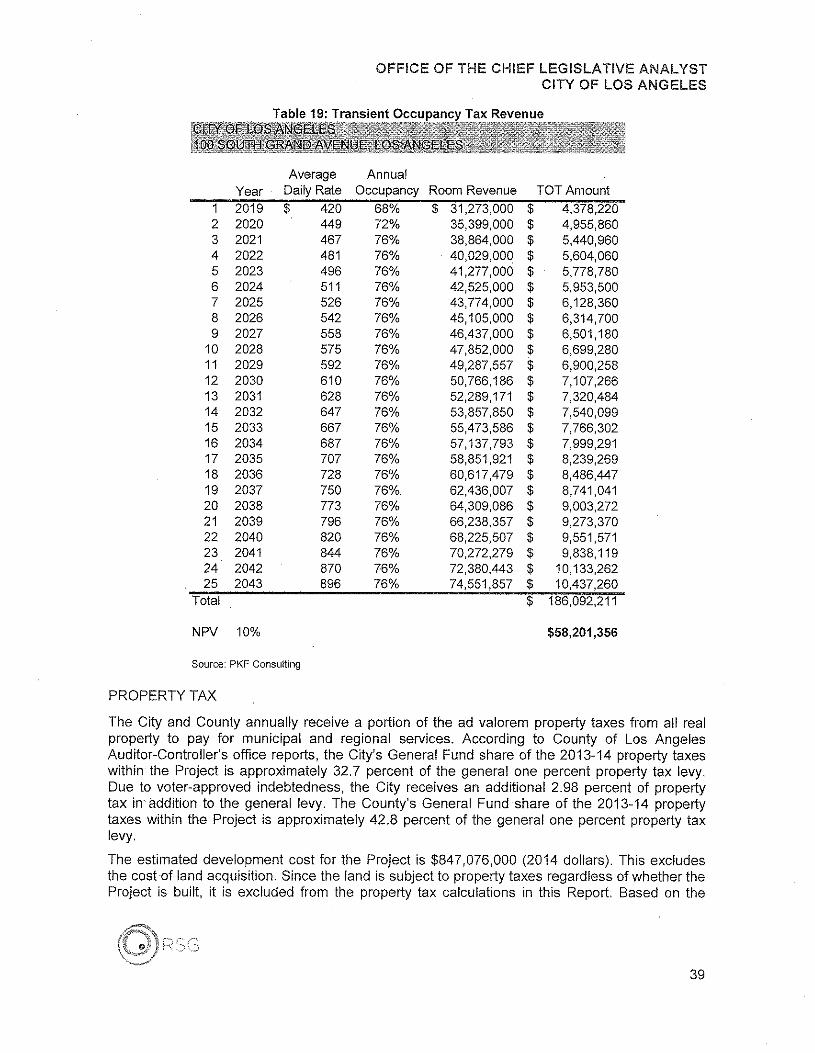
TRANSIENT OCCUPANCY TAX
Transient occupancy taxes ("TOT") result from a fee charged upon hotel room stays. The Cityhas a 14 percent TOT rate. The Developer proposes to construct as part of the Project a newhotel to occupy parts of 22 stories in the North Tower and provide 300 guest rooms, 23,180square feet of indoor meeting and event space, and 35,000 square feet of outdoor space.
The number of rooms occupied, the room rate, and the City's TOT tax rate determine theamount of TOT collected by the City. PKF performed a comprehensive analysis of average dailyrates and occupancy rates for the hotel product type proposed in the Project. The hotel offers atotal of 109,500 available annual rooms (the number of rooms multiplied by the number of daysper year). According to PKF, occupancy rates will increase from 68 to 76 percent between 2019and 2021, stabilizing thereafter at 76 percent. The market supports an average daily room rate(ADR) of $380 in 2014. PKF projects ADR to increase to $420 in 2019, $449 in 2020, $467 in2021, and a 3 percent annual inflation after that.
The Project is expected to generate over $5,400,000 per year once occupancy stabilizes in2021, and approximately $58.2 million over the 25-year projection period (2018 dollars). Table19 shows the transient occupancy tax expected from the hotel component of the Project.
38
OFFICE OF THE CHIEF LEGISLATIVE ANALYSTCITY OF LOS ANGELES
Table 19: Transient Occupancy Tax Revenue
Average AnnualYear Daily Rate Occupancy Room Revenue TOT Amount
1 2019 $ 420 68% $ 31,273,000 $ 4,378,2202 2020 449 72% 35,399,000 $ 4,955,8603 2021 467 76% 38,864,000 $ 5,440,9604 2022 481 76% 40,029,000 $ 5,604,0605 2023 496 76% 41,277,000 s 5,778,7806 2024 511 76% 42,525,000 $ 5,953,5007 2025 526 76% 43,774,000 $ 6,128,3608 2026 542 76% 45,105,000 $ 6,314,7009 2027 558 76% 46,437,000 $ 6,501,180
10 2028 575 76% 47,852,000 $ 6,699,28011 2029 592 76% 49,287,557 $ 6,900,25812 2030 610 76% 50,766,186 $ 7,107,26613 2031 628 76% 52,289,171 $ 7,320,48414 2032 647 76% 53,857,850 $ 7,540,09915 2033 667 76% 55,473,586 $ 7,766,30216 2034 687 76% 57,137,793 $ 7,999,29117 2035 707 76% 58,851,921 $ 8,239,26918 2036 728 76% 60,617,479 $ 8,486,44719 2037 750 76% 62,436,007 $ 8,741,04120 2038 773 76% 64,309,086 $ 9,003,27221 2039 796 76% 66,238,357 $ 9,273,37022 2040 820 76% 68,225,507 $ 9,551,57123 2041 844 76% 70,272,279 $ 9,838,11924 2042 870 76% 72,380,443 $ 10,133,26225 2043 896 76% 74,551,857 $ 10,437,260
Total $ 186,092,211
NPV 10% $58,201,356
Source: PKF Consulting
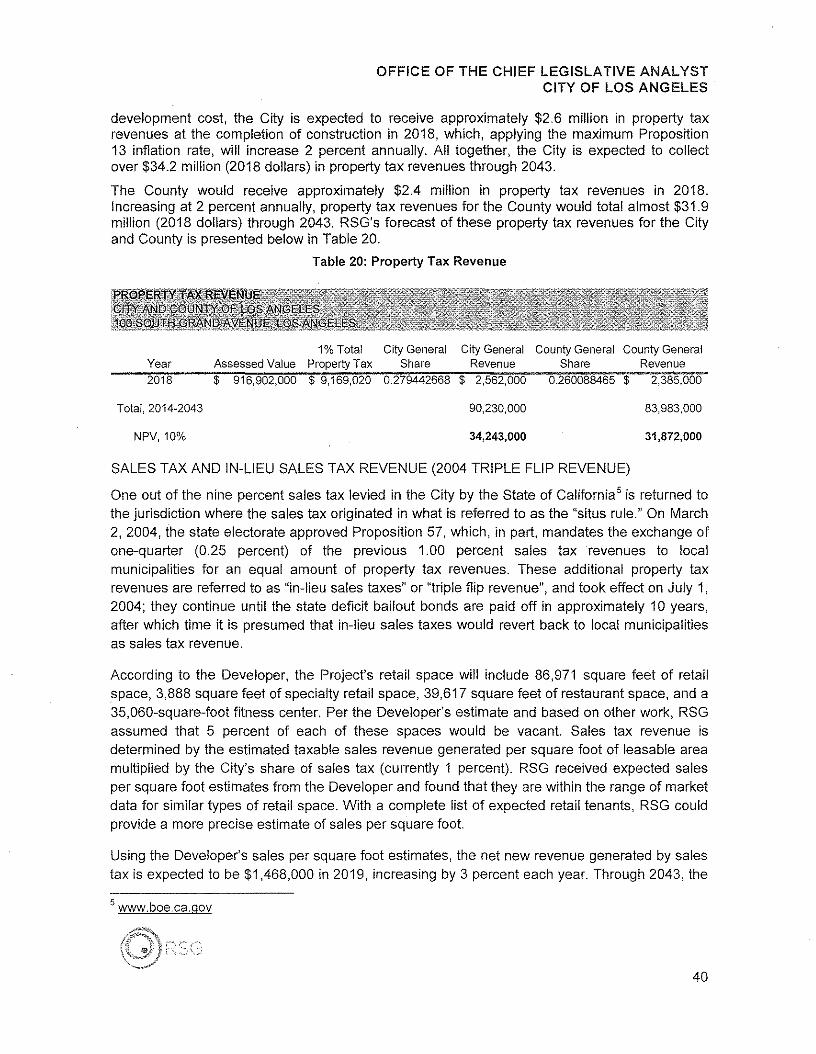
PROPERTY TAX
The City and County annually receive a portion of the ad valorem property taxes from all realproperty to pay for municipal and regional services, According to County of Los AngelesAuditor-Controller's office reports, the City's General Fund share of the 2013-14 property taxeswithin the Project is approximately 32,7 percent of the general one percent property tax levy,Due to voter-approved indebtedness, the City receives an additional 2,98 percent of propertytax in' addition to the general levy, The County's General Fund share of the 2013-14 propertytaxes within the Project is approximately 42,8 percent of the general one percent property taxlevy.
The estimated development cost for the Project is $847,076,000 (2014 dollars), This excludesthe cost of land acquisition, Since the land is subject to property taxes regardless of whether theProject is built, it is excluded from the property tax calculations in this Report. Based on the
39
OFFICE OF THE CHIEF LEGISLATIVE ANALYSTCITY OF LOS ANGELES
development cost, the City is expected to receive approximately $2,6 million in property taxrevenues at the completion of construction in 2018, which, applying the maximum Proposition13 inflation rate, will increase 2 percent annually, All together, the City is expected to collectover $34.2 million (2018 dollars) in property tax revenues through 2043,
The County would receive approximately $2.4 million in property tax revenues in 2018,Increasing at 2 percent annually, property tax revenues for the County would total almost $31,9million (2018 dollars) through 2043, RSG's forecast of these property tax revenues for the Cityand County is presented below in Table 20,
Table 20: Property Tax Revenue
1% Total City General City General County General County GeneralYear Assessed Value Property Tax Share Revenue Share Revenue2018 $ 916,902,000 $ 9,169,020 0,279442668 $ 2,562,000 0.260088465 $ 2,385,000
Total,2014-2043 90,230,000 83,983,000
NPV, 10% 34,243,000 31,872,000
SALES TAX AND IN-LIEU SALES TAX REVENUE (2004 TRIPLE FLIP REVENUE)
One out of the nine percent sales tax levied in the City by the State of California' is returned tothe jurisdiction where the sales tax originated in what is referred to as the "situs rule," On March2, 2004, the state electorate approved Proposition 57, which, in part, mandates the exchange ofone-quarter (0,25 percent) of the previous 1,00 percent sales tax revenues to localmunicipalities for an equal amount of property tax revenues, These additional property taxrevenues are referred to as "in-lieu sales taxes" or "triple flip revenue", and took effect on July 1,2004; they continue until the state deficit bailout bonds are paid off in approximately 10 years,after which time it is presumed that in-lieu sales taxes would revert back to local municipalitiesas sales tax revenue,
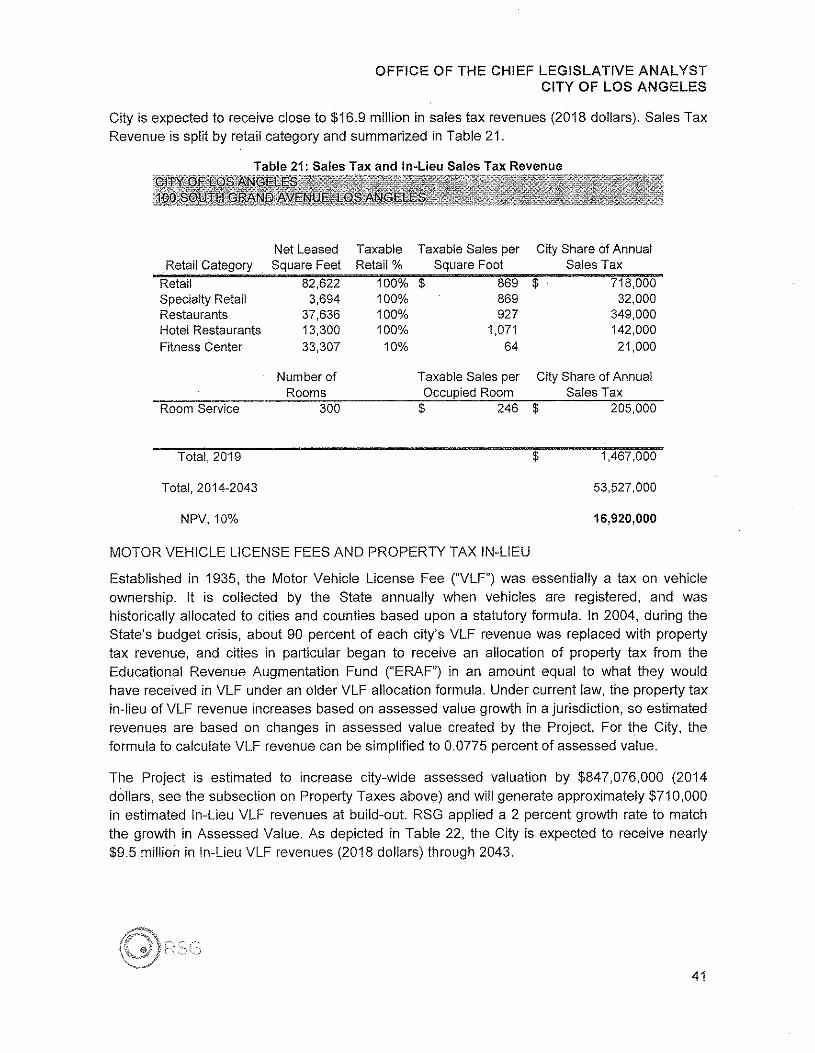
According to the Developer, the Project's retail space will include 86,971 square feet of retailspace, 3,888 square feet of specialty retail space, 39,617 square feet of restaurant space, and a35,060-square-foot fitness center. Per the Developer's estimate and based on other work, RSGassumed that 5 percent of each of these spaces would be vacant Sales tax revenue isdetermined by the estimated taxable sales revenue generated per square foot of leasable areamultiplied by the City's share of sales tax (currently 1 percent), RSG received expected salesper square foot estimates from the Developer and found that they are within the range of marketdata for similar types of retail space, With a complete list of expected retail tenants, RSG couldprovide a more precise estimate of sales per square foot
Using the Developer's sales per square foot estimates, the net new revenue generated by salestax is expected to be $1,468,000 in 2019, increasing by 3 percent each year. Through 2043, the
s www.boe.ca.gov
40
OFFICE OF THE CHIEF LEGISLATIVE ANALYSTCITY OF LOS ANGELES
City is expected to receive close to $16.9 million in sales tax revenues (2018 dollars). Sales TaxRevenue is split by retail category and summarized in Table 21.
Table 21: Sales Tax and In-Lieu Sales Tax Revenue
RetailCategoryNet LeasedSquareFeet
TaxableRetail %
Taxable SalesperSquareFoot
City Share of AnnualSalesTax
RetailSpecialtyRetailRestaurantsHotel RestaurantsFitnessCenter
82,6223,694
37,63613,30033,307
100% $100%100%100%10%
869 $869927
1,07164
718,00032,000
349,000142,00021,000
NumberofRooms
Taxable SalesperOccupiedRoom
City Shareof AnnualSalesTax
Room Service 300 $ 246 $ 205,000
Total,2019 $ 1,467,000
Total,2014-2043 53,527,000
NPV, 10% 16,920,000
MOTOR VEHICLE LICENSE FEES AND PROPERTY TAX IN-LIEU
Established in 1935, the Motor Vehicle License Fee ("VLF") was essentially a tax on vehicleownership. It is collected by the State annually when vehicles are registered, and washistorically allocated to cities and counties based upon a statutory formula. In 2004, during theState's budget crisis, about 90 percent of each city's VLF revenue was replaced with propertytax revenue, and cities in particular began to receive an allocation of property tax from theEducational Revenue Augmentation Fund ("ERAF") in an amount equal to what they wouldhave received in VLF under an older VLF allocation formula. Under current law, the property taxin-lieu of VLF revenue increases based on assessed value growth in a jurisdiction, so estimatedrevenues are based on changes in assessed value created by the Project. For the City, theformula to calculate VLF revenue can be simplified to 0.0775 percent of assessed value.
The Project is estimated to increase city-wide assessed valuation by $847,076,000 (2014dollars, see the subsection on Property Taxes above) and will generate approximately $710,000in estimated In-Lieu VLF revenues at build-out. RSG applied a 2 percent growth rate to matchthe growth in Assessed Value. As depicted in Table 22, the City is expected to receive nearly$9.5 million in In-Lieu VLF revenues (2018 dollars) through 2043.
41
OFFICE OF THE CHIEF LEGISLATIVE ANALYSTCITY OF LOS ANGELES
Table 22: Motor Vehicle License Fee In-Lieu Revenue
Year Assessed ValueCity VLF Share ofAssessed Value City Revenue
2018 $ 916,902,000 0.0775% $ 710,000
Total,2014-2043 25,012,000
NPV, 10% 9,493,000
GROSS RECEIPTS TAX
Section 21, Article 1, Chapter 2 of the Municipal Code outlines business taxes, to be imposedand collected by the City Office of Finance (also referred to as the Gross Receipts Tax). TheOffice of Finance Tax Information Booklet6 outlines the commercial categories and rates atwhich business taxes are imposed. The four categories critical to the analysis of recurring GrossReceipts Tax are Retail Sales (Section 21.44 of the Business Tax Ordinance), Professions andOccupations Businesses (Section 21.49 of the Business Tax Ordinance), Rental of DwellingUnits (Section 21.43 of the Business Tax Ordinance), and Rental of Commercial Property(Section 21.43 of the Business Tax Ordinance). Table 23 outlines the gross receipts tax ratesfor the varying business categories present in the Project.
The retail, specialty retail, and restaurant uses fall in the Retail Sales category. The hotel andmultifamily residential uses fit into the Rental of Dwelling Units category. The fitness centermatches the Professional and Occupations Businesses category. Finally, rental of retail andrestaurant space will result in taxable gross receipts in the Rental of Commercial Propertycategory.
Gross receipts tax is determined by applying the City's tax rate to the annual sales generated bythe tenants, similar to sales tax except that the tax is levied on the seller's gross income (i.e.,receipts) rather than the sale of goods themselves. RSG used the same estimation of grossannual sales for the Gross Receipts Tax as for Sales Tax. The Project is expected to increasegross receipts tax by $367,000 in 2019, the first full year of operation. Assuming an annualinflation rate of 3 percent, total gross receipts tax revenues are expected to reach $4.4 million(2018 dollars) through 2043, as shown in Table 23.
6 www.finance.lacity.orgfcontentfTaxln[oBooklet.htm
42
OFFICE OF THE CHIEF LEGISLATIVE ANALYSTCITY OF LOS ANGELES
Table 23: Gross Receipts Tax Revenue
BusinessCategoryAnnual Gross
Receipts
Gross ReceiptsTaxRate (per $1 ,000 of
gross receipts)
GrossReceiptsTax
RevenueRetailSpecialtyRetailRestaurantsFitnessCenterHotelApartmentsCommercialPropertyRental
$ 71,837,000 $3,211,000
34,904,00021,237,00062,620,00014,781,88216,871,000
127 $1271275.071271.271.27
91,0004,000
44,000108,00080,00019,00021,000
Total, 2019 $ 367,000
Total, 2014-2043 14,047,000
NPV,10% 4,423,000
PARKING OCCUPANCY TAX, YEARS 1-10
In 1990, the City passed Ordinance 165,949 to impose a 10 percent tax on parking occupancyfees in the City. Residential parking spaces are exempt. Hotel parking spaces are exempt if theoccupants remain at the hotel longer than 30 days. This Report assumes that no hoteloccupants will remain longer than 30 days.
The Developer plans to include 860 non-residential parking spaces, including hotel parking, aspart of the Project. RSG estimates that comparable spaces generate an average ofapproximately $8,000 in annual revenue per space in 2018 and projects a 3 percent annualinflation on this revenue.
The Project would generate almost $700,000 per year beginning in 2019, and approximately$4.7 million over the 10-year period through 2027 (2018 dollars). Table 24 illustrates the parkingoccupancy tax revenue expected in the first 10 years of the Project.
43
OFFICE OF THE CHIEF LEGISLATIVE ANALYSTCITY OF LOS ANGELES
Table 24: Parking Occupancy Tax Revenue, First 10 Years
Number of Non-residential
spaces
AnnualRevenue per
spaceAnnual Parking Tax
Revenue Rate Tax Revenue
2019 860 $ 8,000 $ 6,860,000 10% $ 686,000
Total, 2019-2028 $ 7,866,000
NPV, 10% $ 4,723,000
Using the same assumptions described in the subsection on the first 10 years of the ParkingOccupancy Tax, the tax revenue for the same source over the remaining 15 years (2029-2043)would equal slightly more than $3.2 million (2018 dollars). The parking occupancy tax fromyears 11-25 is summarized in Table 25.
Table 25: Parking Occupancy Tax Revenue, After First 10 Years
Number of Non-residential
spaces
AnnualRevenue per
spaceAnnual Parking Tax
Revenue Rate Tax Revenue
2029 860 $ 10,700 $ 9,220,000 10% $ 922,000
Total,2029-2043 $ 17,153,000
NPV, 10% s 3,185,000
UTILITY USERS' TAX
The City of Los Angeles Municipal Code Article 1.1, Chapter 2 imposes a tax on telephone,electricity, and natural gas users in the City. Telephone use has been excluded from thisanalysis due to unpredictable use patterns. Electricity and natural gas, however, are fairlypredictable utilities. RSG used data from the U.S. Energy Information Administration for theWestern States to calculate expenditures per square foot ("PSF") or per residential unit andapplied a factor to account for inflation since the data was produced.
Retail uses generally consume $1.87 in electricity costs per square foot and $0.18 in natural gascosts per square foot. Restaurants average $4.72 in electricity costs per square foot and $1.48in natural gas costs per square foot. Hotel and other lodging uses consume an average of $1.82per square foot in electricity costs and $0.59 per square foot in natural gas costs. Offices, on
[) c:
44
OFFICE OF THE CHIEF LEGISLATIVE ANALYSTCITY OF LOS ANGELES
average, spend $2.01 per square foot for electricity costs and $0.22 in natural gas costs. Utilityexpenditures for all of these uses were adjusted to account for vacant space, which requireslower use of utilities at $0.29 per square foot for electricity and $0.24 per square foot for naturalgas.
In addition, residential rentals located in multifamily structures tend to use $619 per unit onelectricity and $266 per unit on natural gas. Owned residential units located in multifamilystructures spend an average of $698 per unit in electricity costs and $313 per unit in natural gascosts. The City's electricity utility user tax is 12.5 percent of the electricity bill for commercialuses and 10 percent for residential uses, and the natural gas utility user tax is 10 percent of thenatural gas bill.
Following the same assumptions of use and occupancy as described in the Sales Taxsubsection. The Project is anticipated to generate electricity bills totaling approximately $1.4million and natural gas bills of $441,000. These bills will result in approximately $165,000 ofelectricity utility user tax revenues and $44,000 of natural gas utility user tax revenues per year.Assuming an annual 3 percent inflation rate, the Project will raise more than $2.4 million (2018dollars) in electricity and natural gas utility user taxes over the 25-year period (Table 26).
Net Leased Electricity ElectricityTax Natural Gas Natural Gas Tax Total Utility Users'Use Category Square Feet Tax Rate Revenue Tax Rate Revenue Tax Revenue
Retail 82,622 12.5% $ 22,500 10.0% $ 1,900 $ 24,400SpecialtyRetail 3,694 12.5% 1,000 10.0% $ 100 $ 1,100Restaurants 37,636 12.5% 25,800 10.0% $ 6,500 $ 32,300Hotel Restaurants 13,300 12.5% 9,100 10.0% $ 2,300 $ 11,400FitnessCenter 33,307 12.5% 9,100 10.0% $ 700 $ 9,800Hotel Rooms 231,542 12.5% 64,000 10.0% $ 18,200 $ 82,200
UnitsApartments 356 10.0% 27,400 10.0% $ 11,800 $ 39,200Condominiums 67 10.0% 5,800 10.0% $ 2,600 $ 8,400
Total, 2019 $ 208,800
Total,2014·2043 7,616,000
NPV, 10% 2,408,000
PROPERTY TRANSFER TAX
Pursuant to the authority contained in Part 6.7 (commencing with Section 11901) of Division 2 ofthe Revenue and Taxation Code of the State of California, the City imposes a tax on each deed,instrument, or writing by which any lands, tenements, or other realty are sold within the City atthe rate of $2.25 for each $500 or fractional part thereof of the transferred property's value. TheCounty imposes a similar tax at the rate of $1.10 for each $1,000 or fractional part thereof of thetransferred property's value.
45
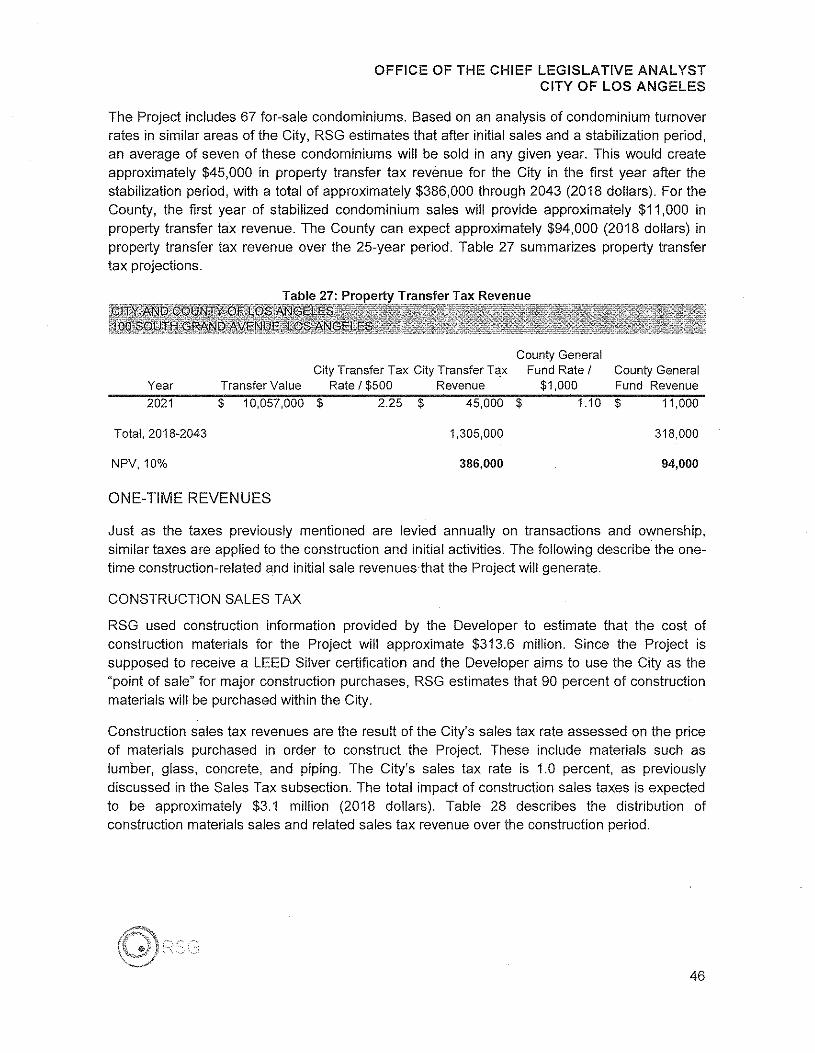
OFFICE OF THE CHIEF LEGISLATIVE ANALYSTCITY OF LOS ANGELES
The Project includes 67 for-sale condominiums. Based on an analysis of condominium turnoverrates in similar areas of the City, RSG estimates that after initial sales and a stabilization period,an average of seven of these condominiums will be sold in any given year. This would createapproximately $45,000 in property transfer tax revenue for the City in the first year after thestabilization period, with a total of approximately $386,000 through 2043 (2018 dollars). For theCounty, the first year of stabilized condominium sales will provide approximately $11,000 inproperty transfer tax revenue. The County can expect approximately $94,000 (2018 dollars) inproperty transfer tax revenue over the 25-year period. Table 27 summarizes property transfertax projections.
Table 27: Property Transfer Tax Revenue
CountyGeneralCityTransferTax CityTransferTax FundRate! CountyGeneral
Year TransferValue Rate! $500 Revenue $1,000 Fund Revenue2021 $ 10,057,000 $ 2.25 $ 45,000 $ 1.10 $ 11,000
Total,2018-2043 1,305,000 318,000
NPV,10% 386,000 94,000
ONE-TIME REVENUES
Just as the taxes previously mentioned are levied annually on transactions and ownership,similar taxes are applied to the construction and initial activities. The following describe the one-time construction-related and initial sale revenues that the Project will generate.
CONSTRUCTION SALES TAX
RSG used construction information provided by the Developer to estimate that the cost ofconstruction materials for the Project will approximate $313.6 million. Since the Project issupposed to receive a LEED Silver certification and the Developer aims to use the City as the"point of sale" for major construction purchases, RSG estimates that 90 percent of constructionmaterials will be purchased within the City.
Construction sales tax revenues are the result of the City's sales tax rate assessed on the priceof materials purchased in order to construct the Project. These include materials such aslumber, glass, concrete, and piping. The City's sales tax rate is 1.0 percent, as previouslydiscussed in the Sales Tax subsection. The total impact of construction sales taxes is expectedto be approximately $3.1 million (2018 dollars). Table 28 describes the distribution ofconstruction materials sales and related sales tax revenue over the construction period.
46
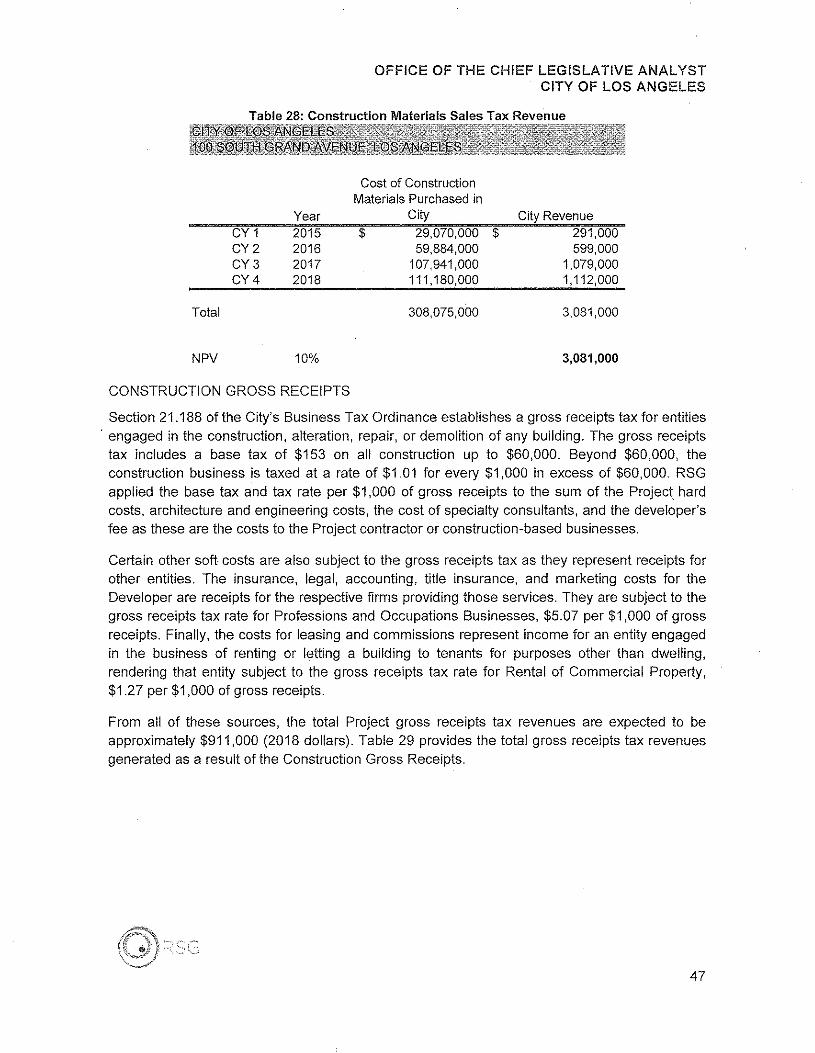
OFFICE OF THE CHIEF LEGISLATIVE ANALYSTCITY OF LOS ANGELES
Table 28: Construction Materials Sales Tax Revenue
Cost of ConstructionMaterialsPurchasedin
City City RevenueYearCY1CY2CY3CY4
2015201620172018
$ 29,070,000 $59,884,000
107,941,000111,180,000
291,000599,000
1,079,0001,112,000
Total 308,075,000 3,081,000
NPV 10% 3,081,000
CONSTRUCTION GROSS RECEIPTS
Section 21.188 of the City's Business Tax Ordinance establishes a gross receipts tax for entities. engaged in the construction, alteration, repair, or demolition of any building. The gross receipts
tax includes a base tax of $153 on ali construction up to $60,000. Beyond $60,000, theconstruction business is taxed at a rate of $1.01 for every $1,000 in excess of $60,000. RSGapplied the base tax and tax rate per $1,000 of gross receipts to the sum of the Project hardcosts, architecture and engineering costs, the cost of specialty consultants, and the developer'sfee as these are the costs to the Project contractor or construction-based businesses.
Certain other soft costs are also subject to the gross receipts tax as they represent receipts forother entities. The insurance, legal, accounting, title insurance, and marketing costs for theDeveloper are receipts for the respective firms providing those services. They are subject to thegross receipts tax rate for Professions and Occupations Businesses, $5.07 per $1,000 of grossreceipts. Finally, the costs for leasing and commissions represent income for an entity engagedin the business of renting or letting a building to tenants for purposes other than dwelling,rendering that entity subject to the gross receipts tax rate for Rental of Commercial Property,$1.27 per $1,000 of gross receipts.
From all of these sources, the total Project gross receipts tax revenues are expected to beapproximately $911,000 (2018 dollars). Table 29 provides the total gross receipts tax revenuesgenerated as a result of the Construction Gross Receipts.
47
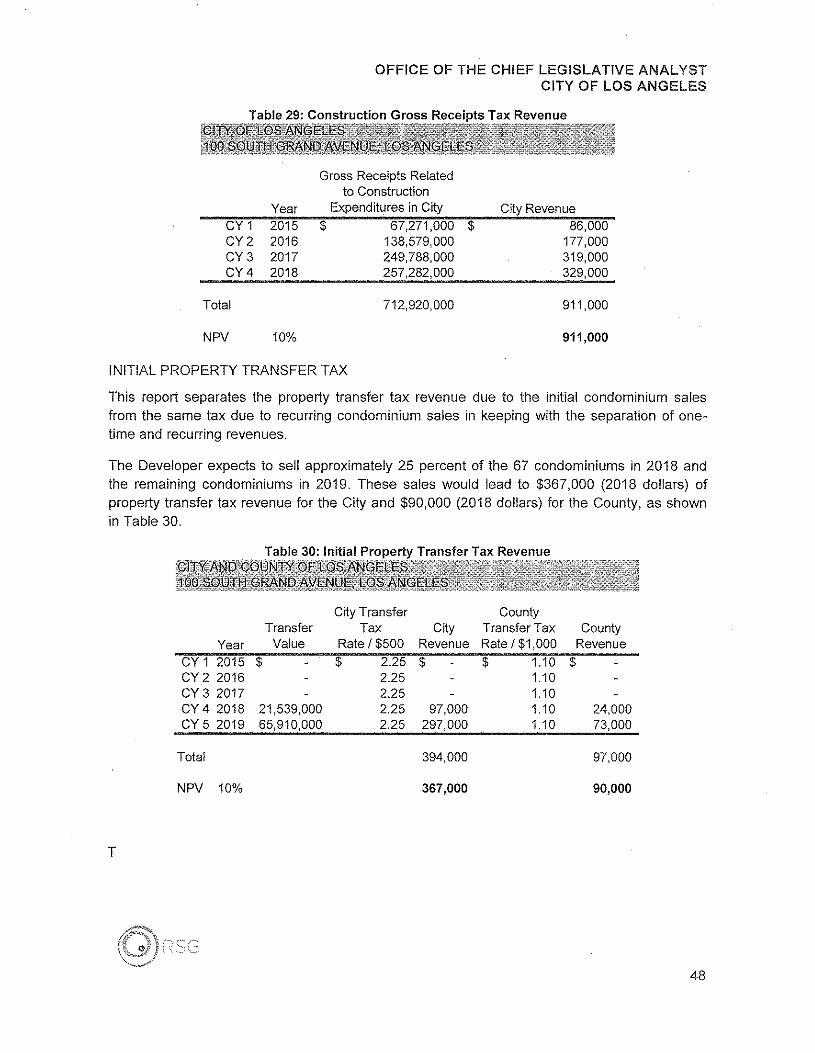
OFFICE OF THE CHIEF LEGISLATIVE ANALYSTCITY OF LOS ANGELES
Table 29: Construction Gross Receipts Tax Revenue
Gross Receipts Relatedto Construction
Year Expendituresin City City RevenueCY 1 2015 $ 67,271,000 $ 86,000CY2 2016 138,579,000 177,000CY3 2017 249,788,000 319,000CY4 2018 257,282,000 329,000
Total 712,920,000 911,000
NPV 10% 911,000
INITIAL PROPERTY TRANSFER TAX
This report separates the property transfer tax revenue due to the initial condominium salesfrom the same tax due to recurring condominium sales in keeping with the separation of one-time and recurring revenues.
The Developer expects to sell approximately 25 percent of the 67 condominiums in 2018 andthe remaining condominiums in 2019. These sales would lead to $367,000 (2018 dollars) ofproperty transfer tax revenue for the City and $90,000 (2018 dollars) for the County, as shownin Table 30.
Table 30: Initial Property Transfer Tax Revenue
CityTransfer CountyTransfer Tax City TransferTax County
Year Value Rate/ $500 Revenue Rate/ $1,000 RevenueCY 1 2015 $ $ 2.25 $ $ 1.10 $CY 2 2016 2.25 1.10CY 3 2017 2.25 1.10CY 4 2018 21,539,000 2.25 97,000 1.10 24,000CY 5 2019 65,910,000 2.25 297,000 1.10 73,000
Total 394,000 97,000
NPV 10% 367,000 90,000
T
48
OFFICE OF THE CHIEF LEGISLATIVE ANALYSTCITY OF LOS ANGELES
ECONOMIC IMPACT ANALYSIS
Development and ongoing operation of the Project will generate employment opportunities, addlabor income to the market area, and add value to the gross regional product. For the purposeof this analysis, RSG used the IMPLAN model to measure the economic impacts of the Projectusing zip code-based data for the City and County. IMPLAN is an input-output analysis softwaretool that tracks the interdependence among various producing and consuming sectors of theeconomy. According to MIG, Inc., the creators of IMPLAN, the software measures therelationship between a given set of demands for final goods and services and the inputsrequired to satisfy those demands. IMPLAN publishes countywide data on an annual basis; thisanalysis utilized the 2012 County of Los Angeles dataset to calculate direct, indirect, andinduced impacts.
The IMPLAN inputs are investment or operating costs of the Project and the resulting outputsare economic impacts, including employment generation, labor income, and gross regionalproduct. Jobs are the primary impacts calculated by IMPLAN. Labor income includes all formsof employee compensation, including wages and benefits added to the City. Finally, economicoutput represents the value of industry production - for service sectors, output is equivalent togross sales, and for retail and wholesale trade, output represents gross margin, not grosssales.'
RSG analyzed both temporary and permanent economic impacts. The total Project hard costs($627,185,000) derived from the feasibility analysis were used to determine temporaryeconomic impacts resulting during construction of the Project. These hard costs were dividedaccording to residential development ($248,163,000) and nonresidential development($379,022,000). The former corresponds to IMPLAN Sector 37, "Construction of new residentialpermanent site single-family and multifamily structures." The latter corresponds to IMPLANSector 34, "Construction of new nonresidential commercial and health care structures."
The Project's gross annual receipts, including from the retail, restaurants, fitness center,apartments, and hotel ($170,840,217) were used to determine permanent economic impactsresulting during operation of the Project. The permanent input data categories for the Projectare more complex than the temporary input data categories and are separated as follows:
• Retail Stores - Clothing and clothing accessories, IMPLAN Sector 327• Retail Stores - Electronics, IMPLAN Sector 322
7 http://implan.comN4/index.php?option=comglossary<emid=57. IMPLAN uses a concept called"margins" to allocate expendituresthrough a supply chain from a retailer to a manufacturer. Essentially,using margins enables the IMPLAN model to output producer or purchaser impacts. For example, thecost associated with the manufactureof a product is $60. By the time the product is transported ($10margin), sold by a wholesaler ($10 margin), and sold by a retailer ($20 margin), the product is $100 andincludesa variety of margins. Margins apply to retail stores, like furnitureand home furnishing stores andfood and beverage stores, but do not apply to services, like fitness and recreational sports centers andrestaurants.
49
OFFICE OF THE CHIEF LEGISLATIVE ANALYSTCITY OF LOS ANGELES
• Retail Stores - Furniture and home furnishings, IMPLAN Sector 321• Retail Stores - General merchandise, IMPLAN Sector 329• Retail Stores - Health and personal care, IMPLAN Sector 325• Retail Stores - Miscellaneous, IMPLAN Sector 3308
• Fitness and recreational sports centers, IMPLAN Sector 407• Real estate, IMPLAN Sector 360• Hotels and motels, including casino hotels, IMPLAN Sector 411
RSG analyzed the direct, indirect, and induced effects for each of the economic outputs bothduring the construction phase (Temporary Impacts) and operations phase (Permanent Impacts).The various types of effects are described below:
Direct Effects - Refers to the direct effects that occur on the Project site resulting fromdevelopment costs and operational sales revenue.
Indirect Effects - Changes in sales, jobs, and/or income within the businesses that supplygoods and services to the Project. Indirect effects do not occur directly on the Project-site butare an indirect effect to surrounding or related businesses.
Induced - Regional changes resulting from additional spending earned either directly orindirectly from the Project.
The IMPLAN analysis concludes that the temporary construction component of the Project willresult in 3,600 new direct full-time and part-time jobs, 1,710 indirect full-time and part-time jobs,and 1,828 induced full-time and part-time jobs within the City. The total temporary constructionjobs attributed to the Project exceed 7,100 full time and part time jobs.
The total temporary direct labor income resulting from the Project is $231.7 million, indirect laborincome is $87.1 million, and induced labor income totals $74.9 million. The temporary economicoutput of the Project directly correlates to the direct construction costs, including $627.2 millionof direct economic output, $225.3 million of indirect economic output, and $207.7 million ofinduced economic output. The total direct, indirect, and induced economic output generated bythe construction of the project exceeds $1.06 billion within the City limits and over $1.1 billionwithin the County boundary.
The permanent impacts attributed to the Project are 1,588 direct full-time and part-time jobs,247 indirect full-time and part-time jobs, and 329 induced full-time and part-time jobs. The totalpermanent operation jobs attributed to the Project exceed 2,160 full-time and part-time jobs.
The permanent labor income generated by the operations of the project totals $51.0 million ofdirect labor income, $13.6 million of indirect labor income, and $15.2 million of induced laborincome. The permanent economic output includes $132.3 million of direct economic output,$34.6 million of indirect economic output, and $42.1 million of induced economic output.
8 This category includes miscellaneous store retailers, such as florists, office supplies and stationarystores, pet and pet supplies stores, and tobacco stores.
50
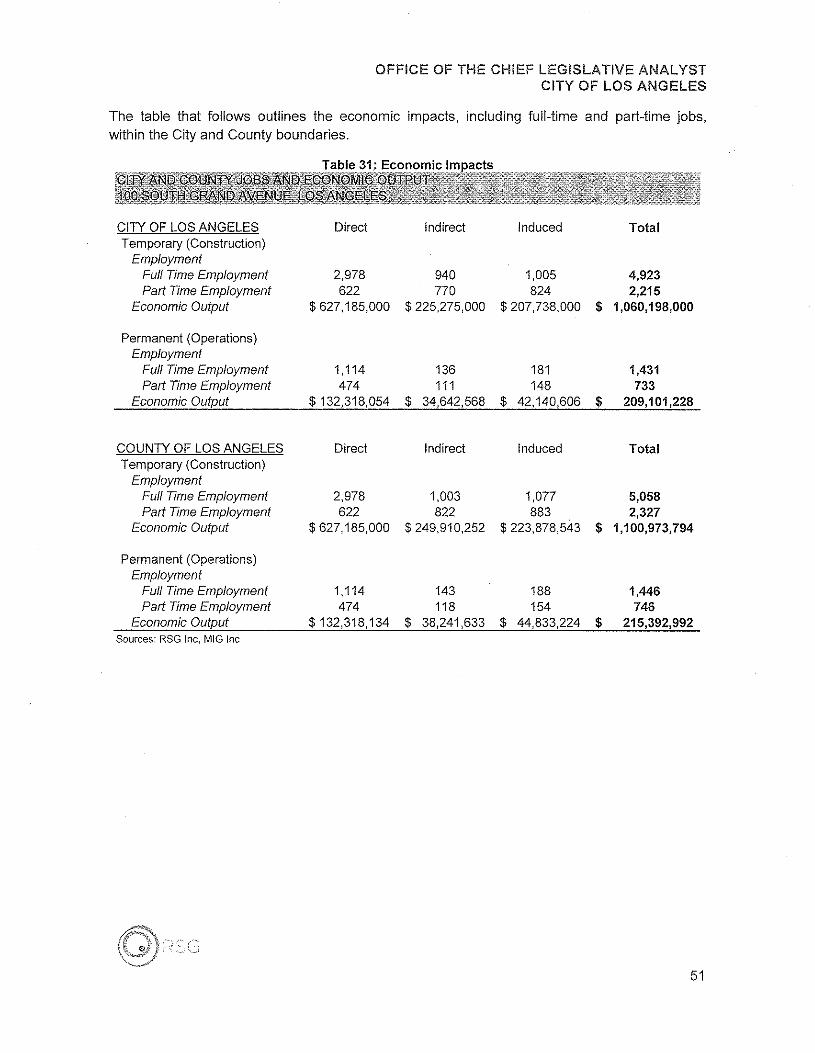
OFFICE OF THE CHIEF LEGISLATIVE ANALYSTCITY OF LOS ANGELES
The table that follows outlines the economic impacts, including full-time and part-time jobs,within the City and County boundaries.
CITY OF LOS ANGELES Direct Indirect Induced TotalTemporary (Construction)
EmploymentFull Time Employment 2,978 940 1,005 4,923Part Time Employment 622 770 824 2,215
Economic Output $ 627,185,000 $ 225,275,000 $ 207,738,000 $ 1,060,198,000
Permanent (Operations)Employment
Full Time Employment 1,114 136 181 1,431Part Time Employment 474 111 148 733
Economic Output $ 132,318,054 $ 34,642,568 $ 42,140,606 $ 209,101,228
COUNTY OF LOS ANGELES Direct Indirect Induced TotalTemporary (Construction)
EmploymentFull Time Employment 2,978 1,003 1,077 5,058Part Time Employment 622 822 883 2,327
Economic Output $ 627,185,000 $ 249,910,252 $ 223,878,543 $ 1,100,973,794
Permanent (Operations)Employment
Full Time Employment 1,114 143 188 1,446Part Time Employment 474 118 154 746
Economic Output $132,318,134 $ 38,241,633 $ 44,833,224 $ 215,392,992Sources: RSG Inc, MIG Inc
51
OFFICE OF THE CHIEF LEGISLATIVE ANALYSTCITY OF LOS ANGELES
CONCLUSIONS
RSG and PKF estimate that if the Project were developed as proposed, the Project would havea net positive impact on the local economy, be a catalyst for downtown development, and resultin nearly 1,200 permanent jobs, and generate over $138.3 million (NPV) over 25-years, withoutconsidering indirect and induced impacts. However, the Project currently faces a feasibility gapover $162.9 million. The shortfall could be closed by means of one or more of the followingmeasures:
• Developer Achieves Project Savings: the Developer absorbs all or a portion of thefeasibility gap and/or value engineers the Project without impairing the quality of theProject or reducing the net new fiscal and economic benefits to the City and County.
• Developer Plan Modifications: The Developer may find opportunities to increase theefficiency of the Project. For example, approximately 75 percent (nearly 100,000 squarefeet) of the gross area dedicated to the multifamily apartment component is leasable.Modifying the Project to increase efficiencies may dramatically increase leasable squarefootage, and, in turn, operating income.
• City Assistance: The City subsidizes the development with between $0 and $101.3million (2018 Dollars) of financial assistance in the form of tax rebates over the next 25years, subject to negotiations with the Developer, limited by the lesser of the hotelfeasibility gap or 50% of the net new revenues.
• County Assistance: The County, recognizing the fiscal and economic benefits of thisProject, provides a subsidy as a function of some portion or all of the County's $32.1(NPV ten percent) million net new fiscal benefits.
• Other Assistance: With a substantial affordable component, there may be other grantsor loans from governmental or pseudo-qovernrnental agencies that may help close thegap.
52