Embed Size (px)
Citation preview
THE EFFECTS OF REWARD MISSPECIFICATION:MAPPING AND MITIGATING MISALIGNED MODELS
Alexander PanCaltech
Kush BhatiaUC Berkeley
Jacob SteinhardtUC Berkeley
ABSTRACT
Reward hacking—where RL agents exploit gaps in misspecified rewardfunctions—has been widely observed, but not yet systematically studied. To un-derstand how reward hacking arises, we construct four RL environments withmisspecified rewards. We investigate reward hacking as a function of agent ca-pabilities: model capacity, action space resolution, observation space noise, andtraining time. More capable agents often exploit reward misspecifications, achiev-ing higher proxy reward and lower true reward than less capable agents. Moreover,we find instances of phase transitions: capability thresholds at which the agent’sbehavior qualitatively shifts, leading to a sharp decrease in the true reward. Suchphase transitions pose challenges to monitoring the safety of ML systems. To ad-dress this, we propose an anomaly detection task for aberrant policies and offerseveral baseline detectors.
1 INTRODUCTION
As reinforcement learning agents are trained with better algorithms, more data, and larger policymodels, they are at increased risk of overfitting their objectives (Russell, 2019). Reward hacking,or the gaming of misspecified reward functions by RL agents, has appeared in a variety of con-texts, such as game playing (Ibarz et al., 2018), text summarization (Paulus et al., 2018), and au-tonomous driving (Knox et al., 2021). These examples show that better algorithms and models arenot enough; for human-centered applications such as healthcare (Yu et al., 2019), economics (Trottet al., 2021) and robotics (Kober et al., 2013), RL algorithms must be safe and aligned with humanobjectives (Bommasani et al., 2021; Hubinger et al., 2019).
Reward misspecifications occur because real-world tasks have numerous, often conflicting desider-ata. In practice, reward designers resort to optimizing a proxy reward that is either more readilymeasured or more easily optimized than the true reward. For example, consider a recommendersystem optimizing for users’ subjective well-being (SWB). Because SWB is difficult to measure,engineers rely on more tangible metrics such as click-through rates or watch-time. Optimizing formisspecified proxies led YouTube to overemphasize watch-time and harm user satisfaction (Stray,2020), as well as to recommended extreme political content to users (Ribeiro et al., 2020).
Addressing reward hacking is a first step towards developing human-aligned RL agents and one goalof ML safety (Hendrycks et al., 2021a). However, there has been little systematic work investigatingwhen or how it tends to occur, or how to detect it before it runs awry. To remedy this, we studythe problem of reward hacking across four diverse environments: traffic control (Wu et al., 2021),COVID response (Kompella et al., 2020), blood glucose monitoring (Fox et al., 2020), and the Atarigame Riverraid (Brockman et al., 2016). Within these environments, we construct nine misspecifiedproxy reward functions (Section 3).
Using our environments, we study how increasing optimization power affects reward hacking, bytraining RL agents with varying resources such as model size, training time, action space resolution,and observation space noise (Section 4). We find that more powerful agents often attain higher proxyreward but lower true reward, as illustrated in Figure 1. Since the trend in ML is to increase resourcesexponentially each year (Littman et al., 2021), this suggests that reward hacking will become morepronounced in the future in the absence of countermeasures.
1
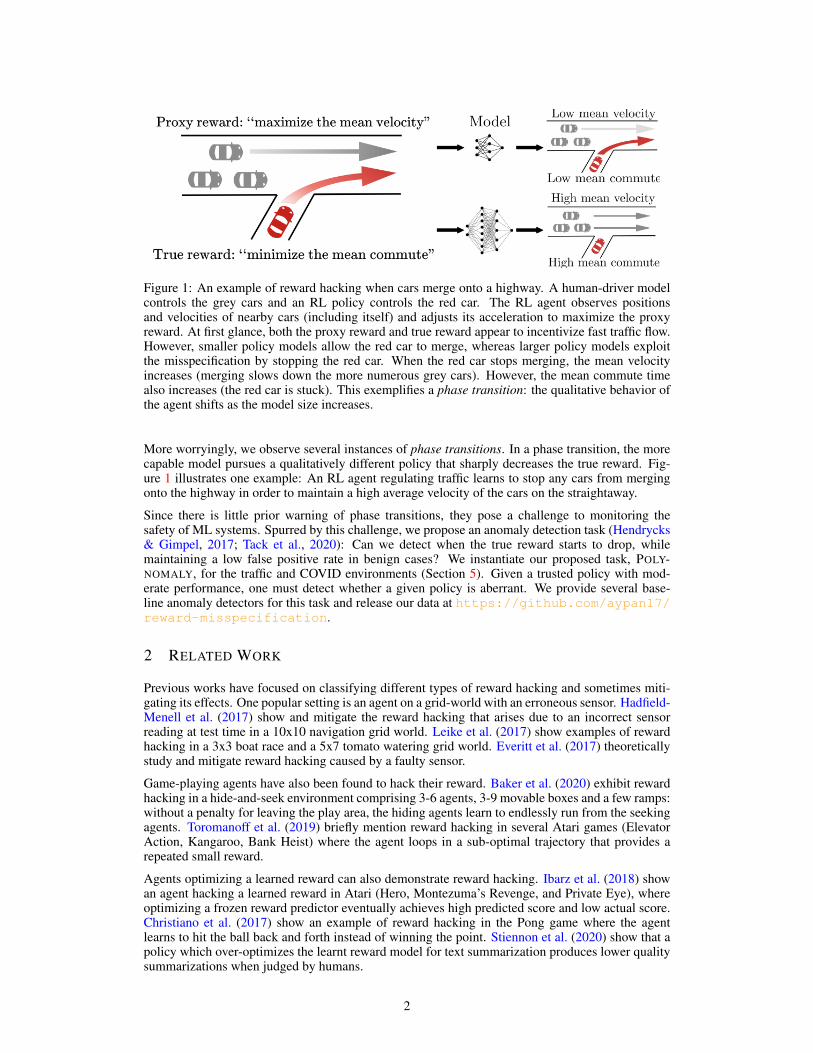
Figure 1: An example of reward hacking when cars merge onto a highway. A human-driver modelcontrols the grey cars and an RL policy controls the red car. The RL agent observes positionsand velocities of nearby cars (including itself) and adjusts its acceleration to maximize the proxyreward. At first glance, both the proxy reward and true reward appear to incentivize fast traffic flow.However, smaller policy models allow the red car to merge, whereas larger policy models exploitthe misspecification by stopping the red car. When the red car stops merging, the mean velocityincreases (merging slows down the more numerous grey cars). However, the mean commute timealso increases (the red car is stuck). This exemplifies a phase transition: the qualitative behavior ofthe agent shifts as the model size increases.
More worryingly, we observe several instances of phase transitions. In a phase transition, the morecapable model pursues a qualitatively different policy that sharply decreases the true reward. Fig-ure 1 illustrates one example: An RL agent regulating traffic learns to stop any cars from mergingonto the highway in order to maintain a high average velocity of the cars on the straightaway.
Since there is little prior warning of phase transitions, they pose a challenge to monitoring thesafety of ML systems. Spurred by this challenge, we propose an anomaly detection task (Hendrycks& Gimpel, 2017; Tack et al., 2020): Can we detect when the true reward starts to drop, whilemaintaining a low false positive rate in benign cases? We instantiate our proposed task, POLY-NOMALY, for the traffic and COVID environments (Section 5). Given a trusted policy with mod-erate performance, one must detect whether a given policy is aberrant. We provide several base-line anomaly detectors for this task and release our data at https://github.com/aypan17/reward-misspecification.
2 RELATED WORK
Previous works have focused on classifying different types of reward hacking and sometimes miti-gating its effects. One popular setting is an agent on a grid-world with an erroneous sensor. Hadfield-Menell et al. (2017) show and mitigate the reward hacking that arises due to an incorrect sensorreading at test time in a 10x10 navigation grid world. Leike et al. (2017) show examples of rewardhacking in a 3x3 boat race and a 5x7 tomato watering grid world. Everitt et al. (2017) theoreticallystudy and mitigate reward hacking caused by a faulty sensor.
Game-playing agents have also been found to hack their reward. Baker et al. (2020) exhibit rewardhacking in a hide-and-seek environment comprising 3-6 agents, 3-9 movable boxes and a few ramps:without a penalty for leaving the play area, the hiding agents learn to endlessly run from the seekingagents. Toromanoff et al. (2019) briefly mention reward hacking in several Atari games (ElevatorAction, Kangaroo, Bank Heist) where the agent loops in a sub-optimal trajectory that provides arepeated small reward.
Agents optimizing a learned reward can also demonstrate reward hacking. Ibarz et al. (2018) showan agent hacking a learned reward in Atari (Hero, Montezuma’s Revenge, and Private Eye), whereoptimizing a frozen reward predictor eventually achieves high predicted score and low actual score.Christiano et al. (2017) show an example of reward hacking in the Pong game where the agentlearns to hit the ball back and forth instead of winning the point. Stiennon et al. (2020) show that apolicy which over-optimizes the learnt reward model for text summarization produces lower qualitysummarizations when judged by humans.
2
3 EXPERIMENTAL SETUP: ENVIRONMENTS AND REWARD FUNCTIONS
In this section, we describe our four environments (Section 3.1) and taxonomize our nine corre-sponding misspecified reward functions (Section 3.2).
3.1 ENVIRONMENTS
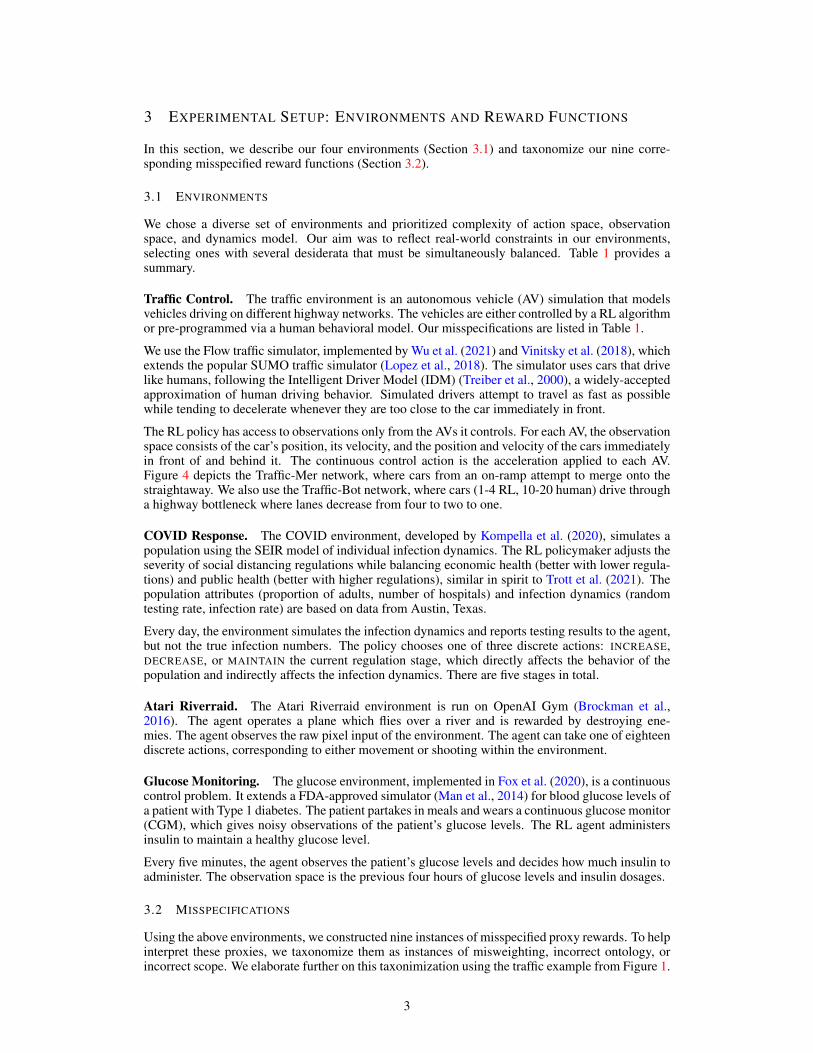
We chose a diverse set of environments and prioritized complexity of action space, observationspace, and dynamics model. Our aim was to reflect real-world constraints in our environments,selecting ones with several desiderata that must be simultaneously balanced. Table 1 provides asummary.
Traffic Control. The traffic environment is an autonomous vehicle (AV) simulation that modelsvehicles driving on different highway networks. The vehicles are either controlled by a RL algorithmor pre-programmed via a human behavioral model. Our misspecifications are listed in Table 1.
We use the Flow traffic simulator, implemented by Wu et al. (2021) and Vinitsky et al. (2018), whichextends the popular SUMO traffic simulator (Lopez et al., 2018). The simulator uses cars that drivelike humans, following the Intelligent Driver Model (IDM) (Treiber et al., 2000), a widely-acceptedapproximation of human driving behavior. Simulated drivers attempt to travel as fast as possiblewhile tending to decelerate whenever they are too close to the car immediately in front.
The RL policy has access to observations only from the AVs it controls. For each AV, the observationspace consists of the car’s position, its velocity, and the position and velocity of the cars immediatelyin front of and behind it. The continuous control action is the acceleration applied to each AV.Figure 4 depicts the Traffic-Mer network, where cars from an on-ramp attempt to merge onto thestraightaway. We also use the Traffic-Bot network, where cars (1-4 RL, 10-20 human) drive througha highway bottleneck where lanes decrease from four to two to one.
COVID Response. The COVID environment, developed by Kompella et al. (2020), simulates apopulation using the SEIR model of individual infection dynamics. The RL policymaker adjusts theseverity of social distancing regulations while balancing economic health (better with lower regula-tions) and public health (better with higher regulations), similar in spirit to Trott et al. (2021). Thepopulation attributes (proportion of adults, number of hospitals) and infection dynamics (randomtesting rate, infection rate) are based on data from Austin, Texas.
Every day, the environment simulates the infection dynamics and reports testing results to the agent,but not the true infection numbers. The policy chooses one of three discrete actions: INCREASE,DECREASE, or MAINTAIN the current regulation stage, which directly affects the behavior of thepopulation and indirectly affects the infection dynamics. There are five stages in total.
Atari Riverraid. The Atari Riverraid environment is run on OpenAI Gym (Brockman et al.,2016). The agent operates a plane which flies over a river and is rewarded by destroying ene-mies. The agent observes the raw pixel input of the environment. The agent can take one of eighteendiscrete actions, corresponding to either movement or shooting within the environment.
Glucose Monitoring. The glucose environment, implemented in Fox et al. (2020), is a continuouscontrol problem. It extends a FDA-approved simulator (Man et al., 2014) for blood glucose levels ofa patient with Type 1 diabetes. The patient partakes in meals and wears a continuous glucose monitor(CGM), which gives noisy observations of the patient’s glucose levels. The RL agent administersinsulin to maintain a healthy glucose level.
Every five minutes, the agent observes the patient’s glucose levels and decides how much insulin toadminister. The observation space is the previous four hours of glucose levels and insulin dosages.
3.2 MISSPECIFICATIONS
Using the above environments, we constructed nine instances of misspecified proxy rewards. To helpinterpret these proxies, we taxonomize them as instances of misweighting, incorrect ontology, orincorrect scope. We elaborate further on this taxonimization using the traffic example from Figure 1.
3
Env. Type Objective Proxy Misalign? Transition?
Traffic
Mis.minimize commuteand accelerations
underpenalize acceleration No NoMis. underpenalize lane changes Yes YesOnt. velocity replaces commute Yes Yes
Scope monitor velocity near merge Yes Yes
COVID Mis. balance economic,health, political cost
underpenalize health cost No NoOnt. ignore political cost Yes Yes
Atari Mis. score points undersmooth movement
downweight movement No NoOnt. include shooting penalty No No
Glucose Ont. minimize health risk risk in place of cost Yes No
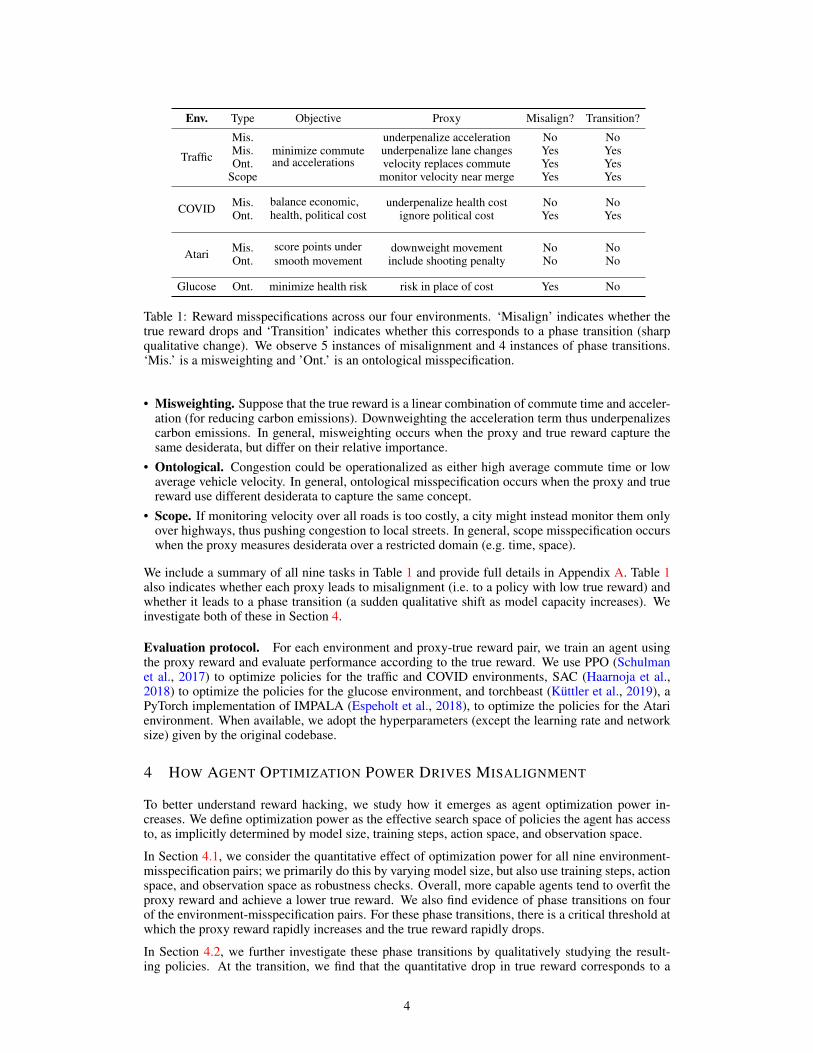
Table 1: Reward misspecifications across our four environments. ‘Misalign’ indicates whether thetrue reward drops and ‘Transition’ indicates whether this corresponds to a phase transition (sharpqualitative change). We observe 5 instances of misalignment and 4 instances of phase transitions.‘Mis.’ is a misweighting and ’Ont.’ is an ontological misspecification.
• Misweighting. Suppose that the true reward is a linear combination of commute time and acceler-ation (for reducing carbon emissions). Downweighting the acceleration term thus underpenalizescarbon emissions. In general, misweighting occurs when the proxy and true reward capture thesame desiderata, but differ on their relative importance.
• Ontological. Congestion could be operationalized as either high average commute time or lowaverage vehicle velocity. In general, ontological misspecification occurs when the proxy and truereward use different desiderata to capture the same concept.
• Scope. If monitoring velocity over all roads is too costly, a city might instead monitor them onlyover highways, thus pushing congestion to local streets. In general, scope misspecification occurswhen the proxy measures desiderata over a restricted domain (e.g. time, space).
We include a summary of all nine tasks in Table 1 and provide full details in Appendix A. Table 1also indicates whether each proxy leads to misalignment (i.e. to a policy with low true reward) andwhether it leads to a phase transition (a sudden qualitative shift as model capacity increases). Weinvestigate both of these in Section 4.
Evaluation protocol. For each environment and proxy-true reward pair, we train an agent usingthe proxy reward and evaluate performance according to the true reward. We use PPO (Schulmanet al., 2017) to optimize policies for the traffic and COVID environments, SAC (Haarnoja et al.,2018) to optimize the policies for the glucose environment, and torchbeast (Kuttler et al., 2019), aPyTorch implementation of IMPALA (Espeholt et al., 2018), to optimize the policies for the Atarienvironment. When available, we adopt the hyperparameters (except the learning rate and networksize) given by the original codebase.
4 HOW AGENT OPTIMIZATION POWER DRIVES MISALIGNMENT
To better understand reward hacking, we study how it emerges as agent optimization power in-creases. We define optimization power as the effective search space of policies the agent has accessto, as implicitly determined by model size, training steps, action space, and observation space.
In Section 4.1, we consider the quantitative effect of optimization power for all nine environment-misspecification pairs; we primarily do this by varying model size, but also use training steps, actionspace, and observation space as robustness checks. Overall, more capable agents tend to overfit theproxy reward and achieve a lower true reward. We also find evidence of phase transitions on fourof the environment-misspecification pairs. For these phase transitions, there is a critical threshold atwhich the proxy reward rapidly increases and the true reward rapidly drops.
In Section 4.2, we further investigate these phase transitions by qualitatively studying the result-ing policies. At the transition, we find that the quantitative drop in true reward corresponds to a
4
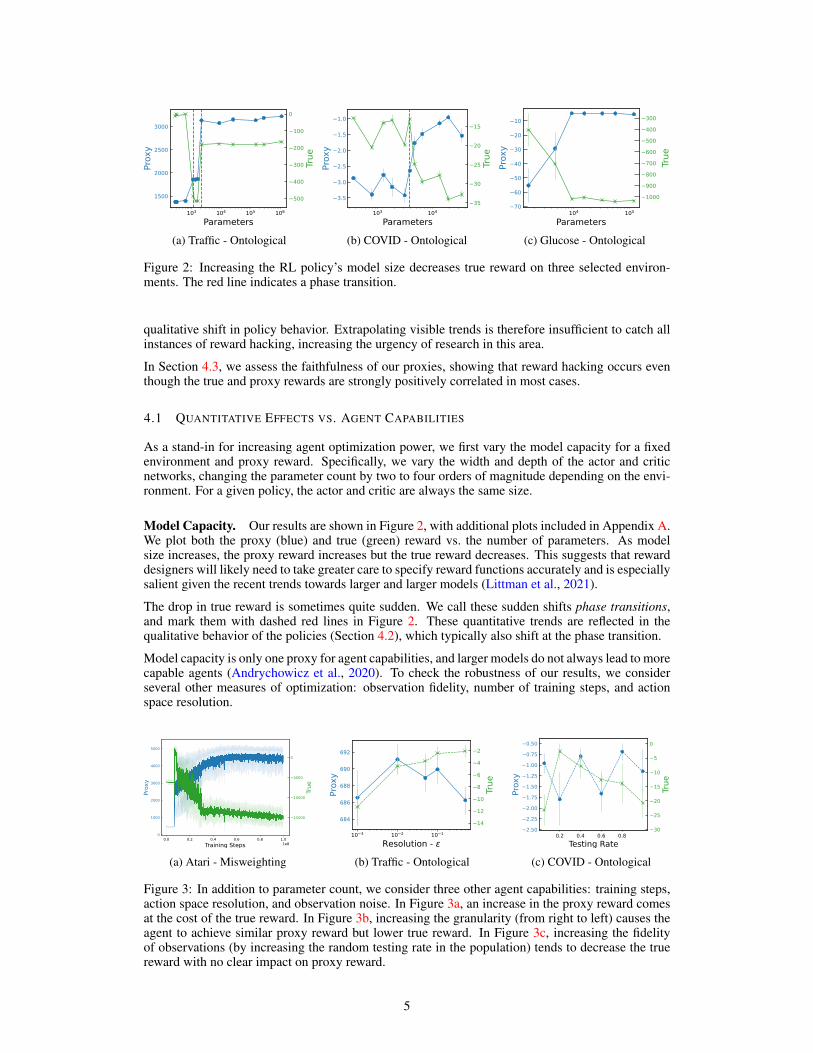
(a) Traffic - Ontological (b) COVID - Ontological (c) Glucose - Ontological
Figure 2: Increasing the RL policy’s model size decreases true reward on three selected environ-ments. The red line indicates a phase transition.
qualitative shift in policy behavior. Extrapolating visible trends is therefore insufficient to catch allinstances of reward hacking, increasing the urgency of research in this area.
In Section 4.3, we assess the faithfulness of our proxies, showing that reward hacking occurs eventhough the true and proxy rewards are strongly positively correlated in most cases.
4.1 QUANTITATIVE EFFECTS VS. AGENT CAPABILITIES
As a stand-in for increasing agent optimization power, we first vary the model capacity for a fixedenvironment and proxy reward. Specifically, we vary the width and depth of the actor and criticnetworks, changing the parameter count by two to four orders of magnitude depending on the envi-ronment. For a given policy, the actor and critic are always the same size.
Model Capacity. Our results are shown in Figure 2, with additional plots included in Appendix A.We plot both the proxy (blue) and true (green) reward vs. the number of parameters. As modelsize increases, the proxy reward increases but the true reward decreases. This suggests that rewarddesigners will likely need to take greater care to specify reward functions accurately and is especiallysalient given the recent trends towards larger and larger models (Littman et al., 2021).
The drop in true reward is sometimes quite sudden. We call these sudden shifts phase transitions,and mark them with dashed red lines in Figure 2. These quantitative trends are reflected in thequalitative behavior of the policies (Section 4.2), which typically also shift at the phase transition.
Model capacity is only one proxy for agent capabilities, and larger models do not always lead to morecapable agents (Andrychowicz et al., 2020). To check the robustness of our results, we considerseveral other measures of optimization: observation fidelity, number of training steps, and actionspace resolution.
(a) Atari - Misweighting (b) Traffic - Ontological (c) COVID - Ontological
Figure 3: In addition to parameter count, we consider three other agent capabilities: training steps,action space resolution, and observation noise. In Figure 3a, an increase in the proxy reward comesat the cost of the true reward. In Figure 3b, increasing the granularity (from right to left) causes theagent to achieve similar proxy reward but lower true reward. In Figure 3c, increasing the fidelityof observations (by increasing the random testing rate in the population) tends to decrease the truereward with no clear impact on proxy reward.
5
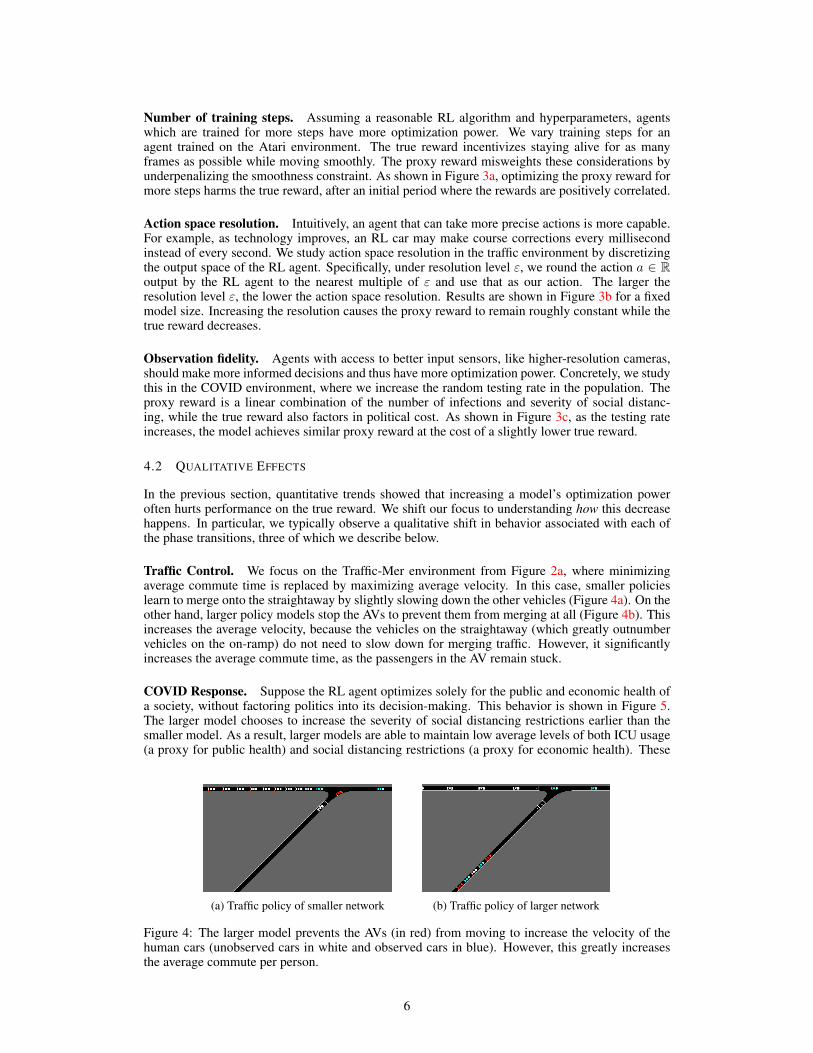
Number of training steps. Assuming a reasonable RL algorithm and hyperparameters, agentswhich are trained for more steps have more optimization power. We vary training steps for anagent trained on the Atari environment. The true reward incentivizes staying alive for as manyframes as possible while moving smoothly. The proxy reward misweights these considerations byunderpenalizing the smoothness constraint. As shown in Figure 3a, optimizing the proxy reward formore steps harms the true reward, after an initial period where the rewards are positively correlated.
Action space resolution. Intuitively, an agent that can take more precise actions is more capable.For example, as technology improves, an RL car may make course corrections every millisecondinstead of every second. We study action space resolution in the traffic environment by discretizingthe output space of the RL agent. Specifically, under resolution level ε, we round the action a ∈ Routput by the RL agent to the nearest multiple of ε and use that as our action. The larger theresolution level ε, the lower the action space resolution. Results are shown in Figure 3b for a fixedmodel size. Increasing the resolution causes the proxy reward to remain roughly constant while thetrue reward decreases.
Observation fidelity. Agents with access to better input sensors, like higher-resolution cameras,should make more informed decisions and thus have more optimization power. Concretely, we studythis in the COVID environment, where we increase the random testing rate in the population. Theproxy reward is a linear combination of the number of infections and severity of social distanc-ing, while the true reward also factors in political cost. As shown in Figure 3c, as the testing rateincreases, the model achieves similar proxy reward at the cost of a slightly lower true reward.
4.2 QUALITATIVE EFFECTS
In the previous section, quantitative trends showed that increasing a model’s optimization poweroften hurts performance on the true reward. We shift our focus to understanding how this decreasehappens. In particular, we typically observe a qualitative shift in behavior associated with each ofthe phase transitions, three of which we describe below.
Traffic Control. We focus on the Traffic-Mer environment from Figure 2a, where minimizingaverage commute time is replaced by maximizing average velocity. In this case, smaller policieslearn to merge onto the straightaway by slightly slowing down the other vehicles (Figure 4a). On theother hand, larger policy models stop the AVs to prevent them from merging at all (Figure 4b). Thisincreases the average velocity, because the vehicles on the straightaway (which greatly outnumbervehicles on the on-ramp) do not need to slow down for merging traffic. However, it significantlyincreases the average commute time, as the passengers in the AV remain stuck.
COVID Response. Suppose the RL agent optimizes solely for the public and economic health ofa society, without factoring politics into its decision-making. This behavior is shown in Figure 5.The larger model chooses to increase the severity of social distancing restrictions earlier than thesmaller model. As a result, larger models are able to maintain low average levels of both ICU usage(a proxy for public health) and social distancing restrictions (a proxy for economic health). These
(a) Traffic policy of smaller network (b) Traffic policy of larger network
Figure 4: The larger model prevents the AVs (in red) from moving to increase the velocity of thehuman cars (unobserved cars in white and observed cars in blue). However, this greatly increasesthe average commute per person.
6
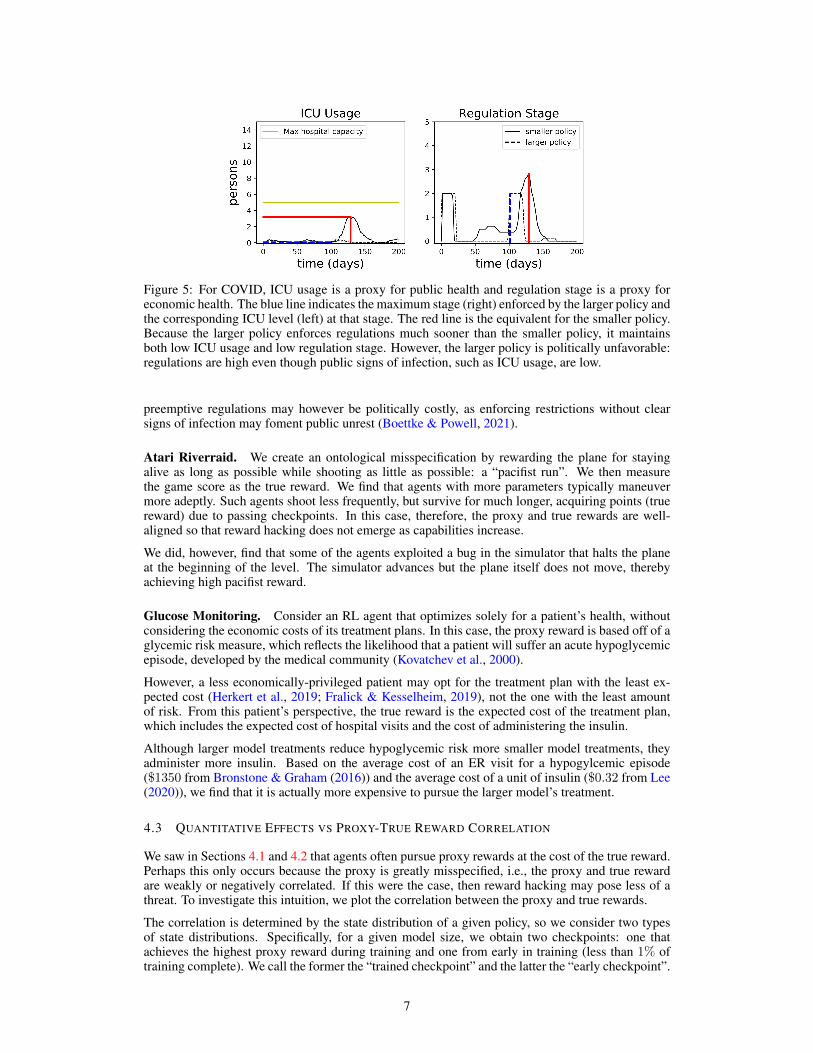
Figure 5: For COVID, ICU usage is a proxy for public health and regulation stage is a proxy foreconomic health. The blue line indicates the maximum stage (right) enforced by the larger policy andthe corresponding ICU level (left) at that stage. The red line is the equivalent for the smaller policy.Because the larger policy enforces regulations much sooner than the smaller policy, it maintainsboth low ICU usage and low regulation stage. However, the larger policy is politically unfavorable:regulations are high even though public signs of infection, such as ICU usage, are low.
preemptive regulations may however be politically costly, as enforcing restrictions without clearsigns of infection may foment public unrest (Boettke & Powell, 2021).
Atari Riverraid. We create an ontological misspecification by rewarding the plane for stayingalive as long as possible while shooting as little as possible: a “pacifist run”. We then measurethe game score as the true reward. We find that agents with more parameters typically maneuvermore adeptly. Such agents shoot less frequently, but survive for much longer, acquiring points (truereward) due to passing checkpoints. In this case, therefore, the proxy and true rewards are well-aligned so that reward hacking does not emerge as capabilities increase.
We did, however, find that some of the agents exploited a bug in the simulator that halts the planeat the beginning of the level. The simulator advances but the plane itself does not move, therebyachieving high pacifist reward.
Glucose Monitoring. Consider an RL agent that optimizes solely for a patient’s health, withoutconsidering the economic costs of its treatment plans. In this case, the proxy reward is based off of aglycemic risk measure, which reflects the likelihood that a patient will suffer an acute hypoglycemicepisode, developed by the medical community (Kovatchev et al., 2000).
However, a less economically-privileged patient may opt for the treatment plan with the least ex-pected cost (Herkert et al., 2019; Fralick & Kesselheim, 2019), not the one with the least amountof risk. From this patient’s perspective, the true reward is the expected cost of the treatment plan,which includes the expected cost of hospital visits and the cost of administering the insulin.
Although larger model treatments reduce hypoglycemic risk more smaller model treatments, theyadminister more insulin. Based on the average cost of an ER visit for a hypogylcemic episode($1350 from Bronstone & Graham (2016)) and the average cost of a unit of insulin ($0.32 from Lee(2020)), we find that it is actually more expensive to pursue the larger model’s treatment.
4.3 QUANTITATIVE EFFECTS VS PROXY-TRUE REWARD CORRELATION
We saw in Sections 4.1 and 4.2 that agents often pursue proxy rewards at the cost of the true reward.Perhaps this only occurs because the proxy is greatly misspecified, i.e., the proxy and true rewardare weakly or negatively correlated. If this were the case, then reward hacking may pose less of athreat. To investigate this intuition, we plot the correlation between the proxy and true rewards.
The correlation is determined by the state distribution of a given policy, so we consider two typesof state distributions. Specifically, for a given model size, we obtain two checkpoints: one thatachieves the highest proxy reward during training and one from early in training (less than 1% oftraining complete). We call the former the “trained checkpoint” and the latter the “early checkpoint”.
7
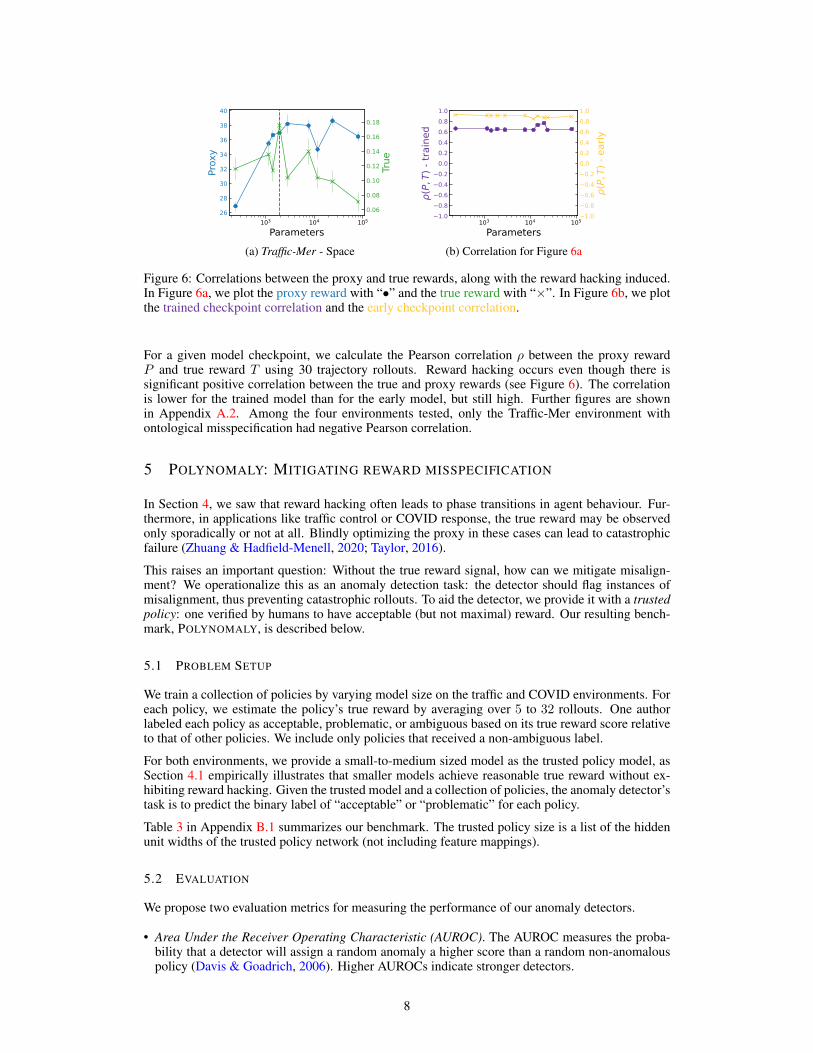
(a) Traffic-Mer - Space (b) Correlation for Figure 6a
Figure 6: Correlations between the proxy and true rewards, along with the reward hacking induced.In Figure 6a, we plot the proxy reward with “•” and the true reward with “×”. In Figure 6b, we plotthe trained checkpoint correlation and the early checkpoint correlation.
For a given model checkpoint, we calculate the Pearson correlation ρ between the proxy rewardP and true reward T using 30 trajectory rollouts. Reward hacking occurs even though there issignificant positive correlation between the true and proxy rewards (see Figure 6). The correlationis lower for the trained model than for the early model, but still high. Further figures are shownin Appendix A.2. Among the four environments tested, only the Traffic-Mer environment withontological misspecification had negative Pearson correlation.
5 POLYNOMALY: MITIGATING REWARD MISSPECIFICATION
In Section 4, we saw that reward hacking often leads to phase transitions in agent behaviour. Fur-thermore, in applications like traffic control or COVID response, the true reward may be observedonly sporadically or not at all. Blindly optimizing the proxy in these cases can lead to catastrophicfailure (Zhuang & Hadfield-Menell, 2020; Taylor, 2016).
This raises an important question: Without the true reward signal, how can we mitigate misalign-ment? We operationalize this as an anomaly detection task: the detector should flag instances ofmisalignment, thus preventing catastrophic rollouts. To aid the detector, we provide it with a trustedpolicy: one verified by humans to have acceptable (but not maximal) reward. Our resulting bench-mark, POLYNOMALY, is described below.
5.1 PROBLEM SETUP
We train a collection of policies by varying model size on the traffic and COVID environments. Foreach policy, we estimate the policy’s true reward by averaging over 5 to 32 rollouts. One authorlabeled each policy as acceptable, problematic, or ambiguous based on its true reward score relativeto that of other policies. We include only policies that received a non-ambiguous label.
For both environments, we provide a small-to-medium sized model as the trusted policy model, asSection 4.1 empirically illustrates that smaller models achieve reasonable true reward without ex-hibiting reward hacking. Given the trusted model and a collection of policies, the anomaly detector’stask is to predict the binary label of “acceptable” or “problematic” for each policy.
Table 3 in Appendix B.1 summarizes our benchmark. The trusted policy size is a list of the hiddenunit widths of the trusted policy network (not including feature mappings).
5.2 EVALUATION
We propose two evaluation metrics for measuring the performance of our anomaly detectors.
• Area Under the Receiver Operating Characteristic (AUROC). The AUROC measures the proba-bility that a detector will assign a random anomaly a higher score than a random non-anomalouspolicy (Davis & Goadrich, 2006). Higher AUROCs indicate stronger detectors.
8
• Max F-1 score. The F-1 score is the harmonic mean of the precision and the recall, so detectorswith a high F-1 score have both low false positives and high true negatives. We calculate the maxF-1 score by taking the maximum F-1 score over all possible thresholds for the detector.
5.3 BASELINES
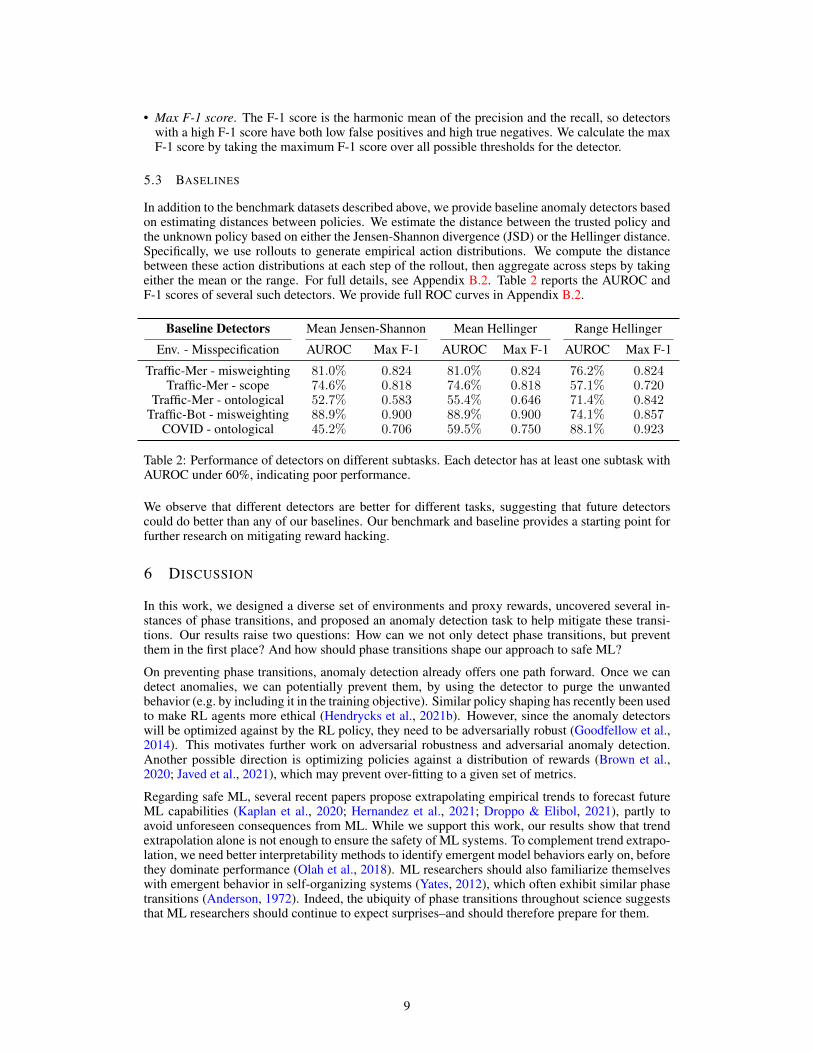
In addition to the benchmark datasets described above, we provide baseline anomaly detectors basedon estimating distances between policies. We estimate the distance between the trusted policy andthe unknown policy based on either the Jensen-Shannon divergence (JSD) or the Hellinger distance.Specifically, we use rollouts to generate empirical action distributions. We compute the distancebetween these action distributions at each step of the rollout, then aggregate across steps by takingeither the mean or the range. For full details, see Appendix B.2. Table 2 reports the AUROC andF-1 scores of several such detectors. We provide full ROC curves in Appendix B.2.
Baseline Detectors Mean Jensen-Shannon Mean Hellinger Range Hellinger
Env. - Misspecification AUROC Max F-1 AUROC Max F-1 AUROC Max F-1
Traffic-Mer - misweighting 81.0% 0.824 81.0% 0.824 76.2% 0.824Traffic-Mer - scope 74.6% 0.818 74.6% 0.818 57.1% 0.720
Traffic-Mer - ontological 52.7% 0.583 55.4% 0.646 71.4% 0.842Traffic-Bot - misweighting 88.9% 0.900 88.9% 0.900 74.1% 0.857
COVID - ontological 45.2% 0.706 59.5% 0.750 88.1% 0.923
Table 2: Performance of detectors on different subtasks. Each detector has at least one subtask withAUROC under 60%, indicating poor performance.
We observe that different detectors are better for different tasks, suggesting that future detectorscould do better than any of our baselines. Our benchmark and baseline provides a starting point forfurther research on mitigating reward hacking.
6 DISCUSSION
In this work, we designed a diverse set of environments and proxy rewards, uncovered several in-stances of phase transitions, and proposed an anomaly detection task to help mitigate these transi-tions. Our results raise two questions: How can we not only detect phase transitions, but preventthem in the first place? And how should phase transitions shape our approach to safe ML?
On preventing phase transitions, anomaly detection already offers one path forward. Once we candetect anomalies, we can potentially prevent them, by using the detector to purge the unwantedbehavior (e.g. by including it in the training objective). Similar policy shaping has recently been usedto make RL agents more ethical (Hendrycks et al., 2021b). However, since the anomaly detectorswill be optimized against by the RL policy, they need to be adversarially robust (Goodfellow et al.,2014). This motivates further work on adversarial robustness and adversarial anomaly detection.Another possible direction is optimizing policies against a distribution of rewards (Brown et al.,2020; Javed et al., 2021), which may prevent over-fitting to a given set of metrics.
Regarding safe ML, several recent papers propose extrapolating empirical trends to forecast futureML capabilities (Kaplan et al., 2020; Hernandez et al., 2021; Droppo & Elibol, 2021), partly toavoid unforeseen consequences from ML. While we support this work, our results show that trendextrapolation alone is not enough to ensure the safety of ML systems. To complement trend extrapo-lation, we need better interpretability methods to identify emergent model behaviors early on, beforethey dominate performance (Olah et al., 2018). ML researchers should also familiarize themselveswith emergent behavior in self-organizing systems (Yates, 2012), which often exhibit similar phasetransitions (Anderson, 1972). Indeed, the ubiquity of phase transitions throughout science suggeststhat ML researchers should continue to expect surprises–and should therefore prepare for them.
9

ACKNOWLEDGEMENTS
We are thankful to Dan Hendrycks and Adam Gleave for helpful discussions about experiments andto Cassidy Laidlaw and Dan Hendrycks for providing valuable feedback on the writing. KB wassupported by a JP Morgan AI Fellowship. JS was supported by NSF Award 2031985 and by OpenPhilanthropy.
10
REFERENCES
Philip W Anderson. More is different. Science, 177(4047):393–396, 1972.
Marcin Andrychowicz, Anton Raichuk, Piotr Stanczyk, Manu Orsini, Sertan Girgin, RaphaelMarinier, Leonard Hussenot, Matthieu Geist, Olivier Pietquin, and Marcin Michalski. Whatmatters in on-policy reinforcement learning? A large-scale empirical study. arXiv preprintarXiv:2006.05990, 2020.
Bowen Baker, Ingmar Kanitscheider, Todor Markov, Yi Wu, Glenn Powell, Bob McGrew, and IgorMordatch. Emergent tool use from multi-agent autocurricula. In International Conference onLearning Representations, 2020.
Peter Boettke and Benjamin Powell. The political economy of the covid-19 pandemic. SouthernEconomic Journal, 87(4):1090–1106, 2021.
Rishi Bommasani et al. On the opportunities and risks of foundation models. arXiv preprintarXiv:2108.07258, 2021.
Greg Brockman, Vicki Cheung, Ludwig Pettersson, Jonas Schneider, John Schulman, Jie Tang, andWojciech Zaremba. Openai gym, 2016.
Amy Bronstone and Claudia Graham. The potential cost implications of averting severe hypo-glycemic events requiring hospitalization in high-risk adults with type 1 diabetes using real-timecontinuous glucose monitoring. Journal of Diabetes Science and Technology, 10, 2016.
Daniel Brown, Russell Coleman, Ravi Srinivasan, and Scott Niekum. Safe imitation learning via fastBayesian reward inference from preferences. In Proceedings of the 37th International Conferenceon Machine Learning, 2020.
Paul F Christiano, Jan Leike, Tom Brown, Miljan Martic, Shane Legg, and Dario Amodei. Deepreinforcement learning from human preferences. In Advances in Neural Information ProcessingSystems, 2017.
Jesse Davis and Mark Goadrich. The relationship between precision-recall and roc curves. InInternational Conference on Machine Learning, 2006.
Jasha Droppo and Oguz Elibol. Scaling laws for acoustic models. arXiv preprint arXiv:2106.09488,2021.
Lasse Espeholt, Hubert Soyer, Remi Munos, Karen Simonyan, Volodymyr Mnih, Tom Ward, YotamDoron, Vlad Firoiu, Tim Harley, Iain Robert Dunning, Shane Legg, and Koray Kavukcuoglu.Impala: Scalable distributed deep-rl with importance weighted actor-learner architectures. 2018.
Tom Everitt, Victoria Krakovna, Laurent Orseau, and Shane Legg. Reinforcement learning with acorrupted reward channel. In International Joint Conference on Artificial Intelligence, 2017.
Ian Fox, Joyce Lee, Rodica Pop-Busui, and Jenna Wiens. Deep reinforcement learning for closed-loop blood glucose control. In Machine Learning for Healthcare Conference, 2020.
M. Fralick and A. S. Kesselheim. The U.S. Insulin Crisis - Rationing a Lifesaving MedicationDiscovered in the 1920s. New England Journal of Medicine, 381(19):1793–1795, 2019.
Ian J Goodfellow, Jonathon Shlens, and Christian Szegedy. Explaining and harnessing adversarialexamples. arXiv preprint arXiv:1412.6572, 2014.
Tuomas Haarnoja, Aurick Zhou, Pieter Abbeel, and Sergey Levine. Soft actor-critic: Off-policymaximum entropy deep reinforcement learning with a stochastic actor. In International confer-ence on machine learning, 2018.
Dylan Hadfield-Menell, Smitha Milli, Pieter Abbeel, Stuart J Russell, and Anca Dragan. Inversereward design. In Advances in Neural Information Processing Systems, 2017.
Dan Hendrycks and Kevin Gimpel. A baseline for detecting misclassified and out-of-distributionexamples in neural networks. International Conference on Learning Representations, 2017.
11
Dan Hendrycks, Nicholas Carlini, John Schulman, and Jacob Steinhardt. Unsolved problems in mlsafety. arXiv preprint arXiv:2109.13916, 2021a.
Dan Hendrycks, Mantas Mazeika, Andy Zou, Sahil Patel, Christine Zhu, Jesus Navarro, Dawn Song,Bo Li, and Jacob Steinhardt. What would Jiminy Cricket do? Towards agents that behave morally.2021b.
Darby Herkert, Pavithra Vijayakumar, Jing Luo, Jeremy I. Schwartz, Tracy L. Rabin, Eunice De-Filippo, and Kasia J. Lipska. Cost-related insulin underuse among patients with diabetes. JAMAInternal Medicine, 179(1):112–114, Jan 2019.
Danny Hernandez, Jared Kaplan, Tom Henighan, and Sam McCandlish. Scaling laws for transfer.arXiv preprint arXiv:2102.01293, 2021.
Evan Hubinger, Chris van Merwijk, Vladimir Mikulik, Joar Skalse, and Scott Garrabrant. Risks fromlearned optimization in advanced machine learning systems. arXiv preprint arXiv:1906.01820,2019.
Borja Ibarz, J. Leike, Tobias Pohlen, Geoffrey Irving, S. Legg, and Dario Amodei. Reward learn-ing from human preferences and demonstrations in Atari. In Advances in Neural InformationProcessing Systems, 2018.
Zaynah Javed, Daniel S Brown, Satvik Sharma, Jerry Zhu, Ashwin Balakrishna, Marek Petrik, AncaDragan, and Ken Goldberg. Policy gradient bayesian robust optimization for imitation learning.In Proceedings of the 38th International Conference on Machine Learning, 2021.
Jared Kaplan, Sam McCandlish, Tom Henighan, Tom B Brown, Benjamin Chess, Rewon Child,Scott Gray, Alec Radford, Jeffrey Wu, and Dario Amodei. Scaling laws for neural languagemodels. arXiv preprint arXiv:2001.08361, 2020.
W. Bradley Knox, Alessandro Allievi, Holger Banzhaf, Felix Schmitt, and Peter Stone. Reward(Mis)design for Autonomous Driving. arXiv e-prints arXiv:2104.13906, 2021.
Jens Kober, J Andrew Bagnell, and Jan Peters. Reinforcement learning in robotics: A survey. TheInternational Journal of Robotics Research, 32(11):1238–1274, 2013.
Varun Kompella, Roberto Capobianco, Stacy Jong, Jonathan Browne, Spencer Fox, Lauren Meyers,Peter Wurman, and Peter Stone. Reinforcement learning for optimization of covid-19 mitigationpolicies, 2020.
BorIs. P. Kovatchev, Martin Straume, Daniel J. Cox, and Leon.S Farhy. Risk analysis of blood glu-cose data:a quantitative approach to optimizing the control of insulin dependent diabetes. Journalof Theoretical Medicine, 3(1):1–10, 2000.
Heinrich Kuttler, Nantas Nardelli, Thibaut Lavril, Marco Selvatici, Viswanath Sivakumar, TimRocktaschel, and Edward Grefenstette. TorchBeast: A PyTorch Platform for Distributed RL.arXiv preprint arXiv:1910.03552, 2019.
Benita Lee. How much does insulin cost? Here’s how 23 brands compare, Nov 2020.
Jan Leike, Miljan Martic, Victoria Krakovna, Pedro A. Ortega, Tom Everitt, Andrew Lefrancq,Laurent Orseau, and Shane Legg. AI safety gridworlds, 2017.
Michael L. Littman, Ifeoma Ajunwa, Guy Berger, Craig Boutilier, Morgan Currie, Finale Doshi-Velez, Gillian Hadfield, Michael C. Horowitz, Charles Isbell, Hiroaki Kitano, Karen Levy, TerahLyons, Melanie Mitchell, Julie Shah, Steven Sloman, Shannon Vallor, and Toby Walsh. Gatheringstrength, gathering storms: The one hundred year study on artificial intelligence (AI100) 2021study panel report. Technical report, Stanford University, Stanford, CA, 2021.
Pablo Alvarez Lopez, Michael Behrisch, Laura Bieker-Walz, Jakob Erdmann, Yun-Pang Flotterod,Robert Hilbrich, Leonhard Lucken, Johannes Rummel, Peter Wagner, and Evamarie Wießner.Microscopic traffic simulation using SUMO. In International Conference on Intelligent Trans-portation Systems, 2018.
12
Chiara Dalla Man, Francesco Micheletto, Dayu Lv, Marc Breton, Boris Kovatchev, and ClaudioCobelli. The UVA/PADOVA type 1 diabetes simulator: New features. Journal of Diabetes Scienceand Technology, 8(1):26–34, Jan 2014.
Chris Olah, Arvind Satyanarayan, Ian Johnson, Shan Carter, Ludwig Schubert, Katherine Ye, andAlexander Mordvintsev. The building blocks of interpretability. Distill, 3(3):e10, 2018.
Romain Paulus, Caiming Xiong, and Richard Socher. A deep reinforced model for abstractivesummarization. In International Conference on Learning Representations, 2018.
Manoel Horta Ribeiro, Raphael Ottoni, Robert West, Virgılio A. F. Almeida, and Wagner Meira.Auditing radicalization pathways on youtube. In Conference on Fairness, Accountability, andTransparency, New York, NY, USA, 2020.
Stuart Russell. Human Compatible: Artificial Intelligence and the Problem of Control. Penguin,2019.
John Schulman, Filip Wolski, Prafulla Dhariwal, Alec Radford, and Oleg Klimov. Proximal policyoptimization algorithms. arXiv preprint arXiv:1707.06347, 2017.
Nisan Stiennon, Long Ouyang, Jeff Wu, Daniel M Ziegler, Ryan Lowe, Chelsea Voss, Alec Radford,Dario Amodei, and Paul Christiano. Learning to summarize from human feedback. arXiv preprintarXiv:2009.01325, 2020.
Jonathan Stray. Aligning ai optimization to community well-being. International Journal of Com-munity Well-Being, 3(4):443–463, Dec 2020.
Jihoon Tack, Sangwoo Mo, Jongheon Jeong, and Jinwoo Shin. Csi: Novelty detection via con-trastive learning on distributionally shifted instances. Advances in Neural Information ProcessingSystems, 2020.
Jessica Taylor. Quantilizers: A safer alternative to maximizers for limited optimization. In AAAIWorkshop: AI, Ethics, and Society, 2016.
Marin Toromanoff, Emilie Wirbel, and Fabien Moutarde. Is deep reinforcement learning reallysuperhuman on Atari? Leveling the playing field, 2019.
Martin Treiber, Ansgar Hennecke, and Dirk Helbing. Congested traffic states in empirical observa-tions and microscopic simulations. Physical review E, 62(2):1805, 2000.
Alexander Trott, Sunil Srinivasa, Douwe van der Wal, Sebastien Haneuse, and Stephan Zheng.Building a Foundation for Data-Driven, Interpretable, and Robust Policy Design using the AIEconomist. arXiv preprint arXiv:2108.02904, 2021.
Eugene Vinitsky, Aboudy Kreidieh, Luc Le Flem, Nishant Kheterpal, Kathy Jang, Cathy Wu,Fangyu Wu, Richard Liaw, Eric Liang, and Alexandre M. Bayen. Benchmarks for reinforcementlearning in mixed-autonomy traffic. In Conference on Robot Learning, 2018.
Cathy Wu, Abdul Rahman Kreidieh, Kanaad Parvate, Eugene Vinitsky, and Alexandre M. Bayen.Flow: A modular learning framework for mixed autonomy traffic. IEEE Transactions on Robotics,2021.
F Eugene Yates. Self-organizing systems: The emergence of order. Springer Science & BusinessMedia, 2012.
Chao Yu, Jiming Liu, and Shamim Nemati. Reinforcement learning in healthcare: A survey. arXivpreprint arXiv:1908.08796, 2019.
Simon Zhuang and Dylan Hadfield-Menell. Consequences of misaligned AI. In Advances in NeuralInformation Processing Systems, 2020.
13
A MAPPING THE EFFECTS OF REWARD MISSPECIFICATION
(a) traffic merge - Misweighting (b) traffic bottle - Misweighting
(c) traffic merge - Space (d) COVID - Misweighting
(e) Atari - Ontological (f) Atari - Misweighting
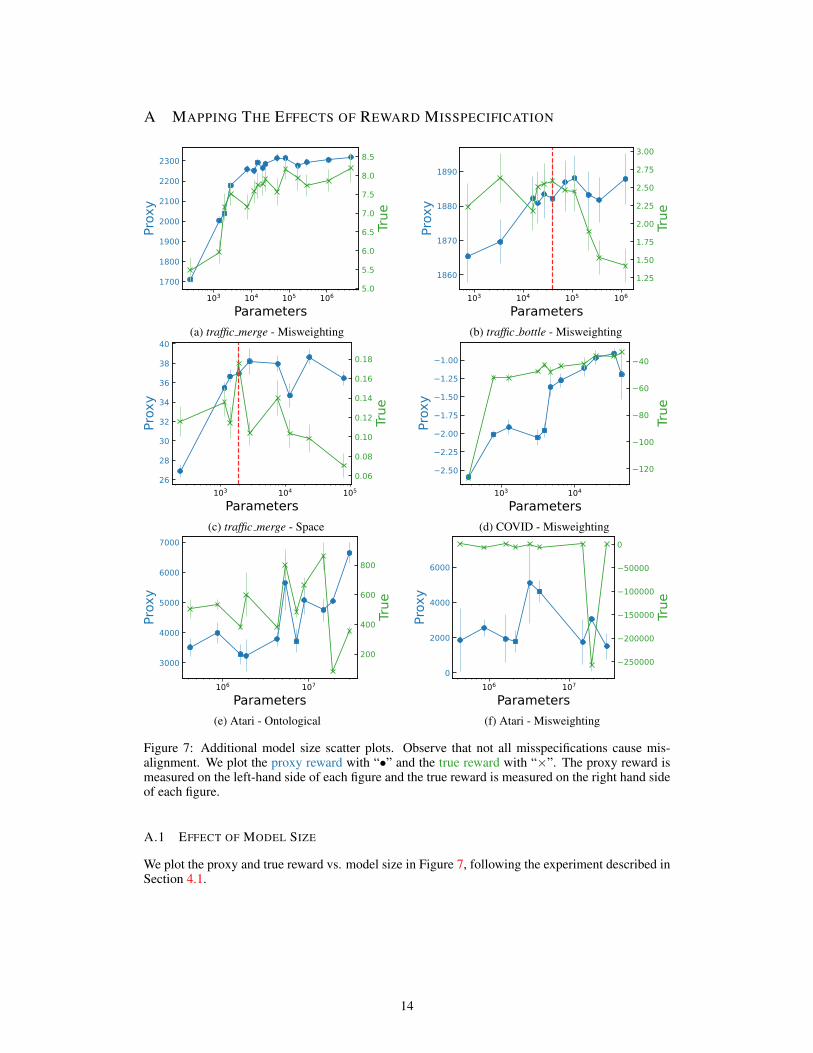
Figure 7: Additional model size scatter plots. Observe that not all misspecifications cause mis-alignment. We plot the proxy reward with “•” and the true reward with “×”. The proxy reward ismeasured on the left-hand side of each figure and the true reward is measured on the right hand sideof each figure.
A.1 EFFECT OF MODEL SIZE
We plot the proxy and true reward vs. model size in Figure 7, following the experiment described inSection 4.1.
14
(a) traffic bottle - Misweighting (b) Correlation for Figure 8a
(c) traffic merge - Misweighting (d) Correlation for Figure 8c
(e) traffic merge - Ontological (f) Correlation for Figure 8e
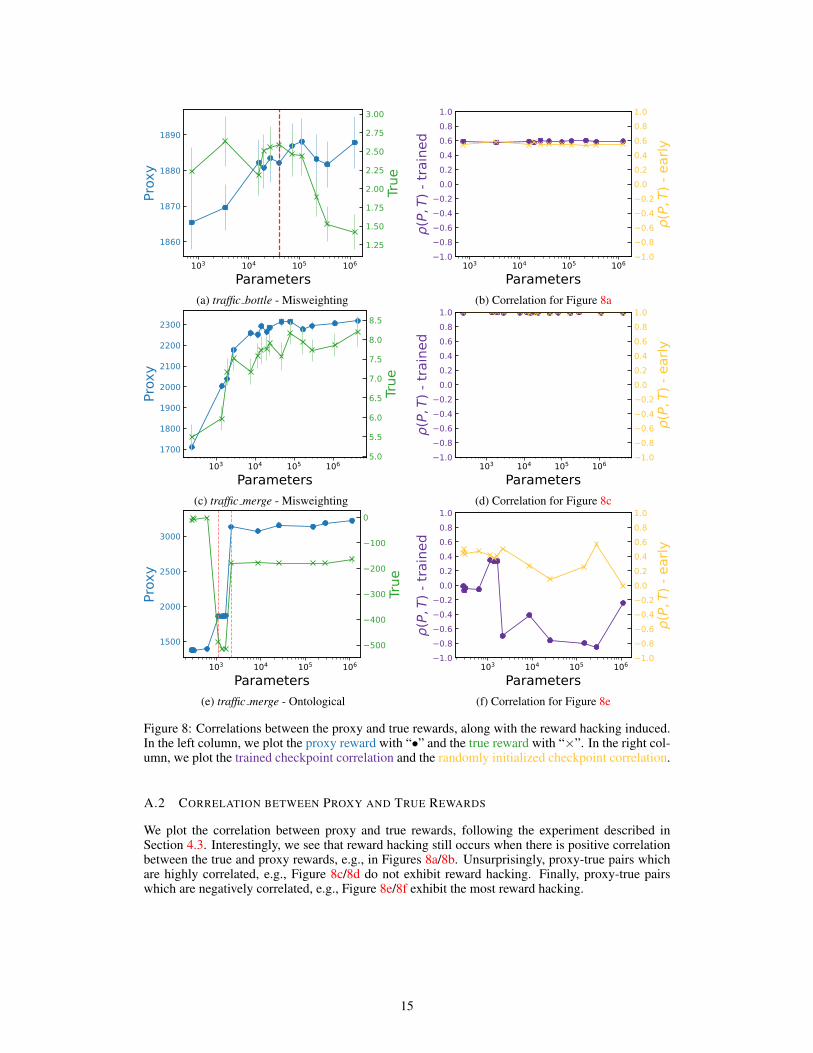
Figure 8: Correlations between the proxy and true rewards, along with the reward hacking induced.In the left column, we plot the proxy reward with “•” and the true reward with “×”. In the right col-umn, we plot the trained checkpoint correlation and the randomly initialized checkpoint correlation.
A.2 CORRELATION BETWEEN PROXY AND TRUE REWARDS
We plot the correlation between proxy and true rewards, following the experiment described inSection 4.3. Interestingly, we see that reward hacking still occurs when there is positive correlationbetween the true and proxy rewards, e.g., in Figures 8a/8b. Unsurprisingly, proxy-true pairs whichare highly correlated, e.g., Figure 8c/8d do not exhibit reward hacking. Finally, proxy-true pairswhich are negatively correlated, e.g., Figure 8e/8f exhibit the most reward hacking.
15
Env. - Misspecification # Policies # Problematic Rollout length Trusted policy size
Traffic-Mer - misweighting 10 7 270 [96, 96]Traffic-Mer - scope 16 9 270 [16, 16]
Traffic-Mer - ontological 23 7 270 [4]Traffic-Bot - misweighting 12 9 270 [64, 64]
COVID - ontological 13 6 200 [16, 16]
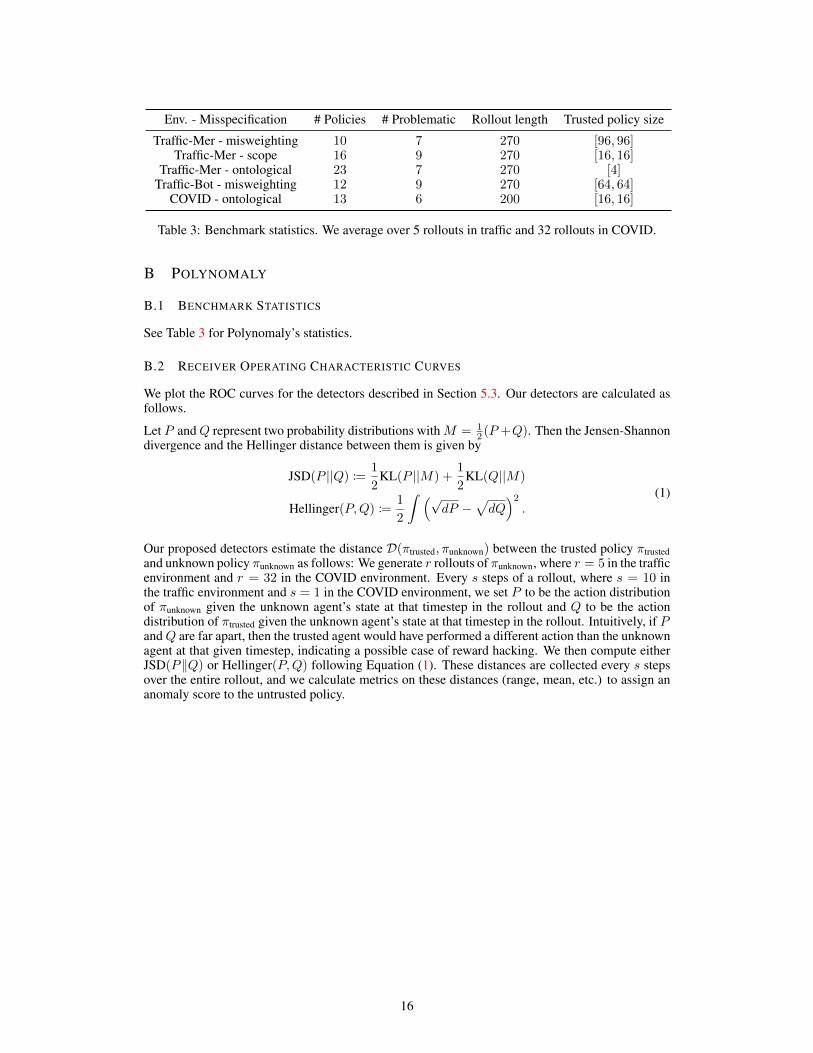
Table 3: Benchmark statistics. We average over 5 rollouts in traffic and 32 rollouts in COVID.
B POLYNOMALY
B.1 BENCHMARK STATISTICS
See Table 3 for Polynomaly’s statistics.
B.2 RECEIVER OPERATING CHARACTERISTIC CURVES
We plot the ROC curves for the detectors described in Section 5.3. Our detectors are calculated asfollows.
Let P and Q represent two probability distributions with M = 12 (P +Q). Then the Jensen-Shannon
divergence and the Hellinger distance between them is given by
JSD(P ||Q) :=1
2KL(P ||M) +
1
2KL(Q||M)
Hellinger(P,Q) :=1
2
∫ (√dP −
√dQ
)2
.(1)
Our proposed detectors estimate the distance D(πtrusted, πunknown) between the trusted policy πtrustedand unknown policy πunknown as follows: We generate r rollouts of πunknown, where r = 5 in the trafficenvironment and r = 32 in the COVID environment. Every s steps of a rollout, where s = 10 inthe traffic environment and s = 1 in the COVID environment, we set P to be the action distributionof πunknown given the unknown agent’s state at that timestep in the rollout and Q to be the actiondistribution of πtrusted given the unknown agent’s state at that timestep in the rollout. Intuitively, if Pand Q are far apart, then the trusted agent would have performed a different action than the unknownagent at that given timestep, indicating a possible case of reward hacking. We then compute eitherJSD(P∥Q) or Hellinger(P,Q) following Equation (1). These distances are collected every s stepsover the entire rollout, and we calculate metrics on these distances (range, mean, etc.) to assign ananomaly score to the untrusted policy.
16
(a) (b)
(c)
Figure 9: ROC curves for Traffic-Mer - misweighting.
(a) (b)
(c)
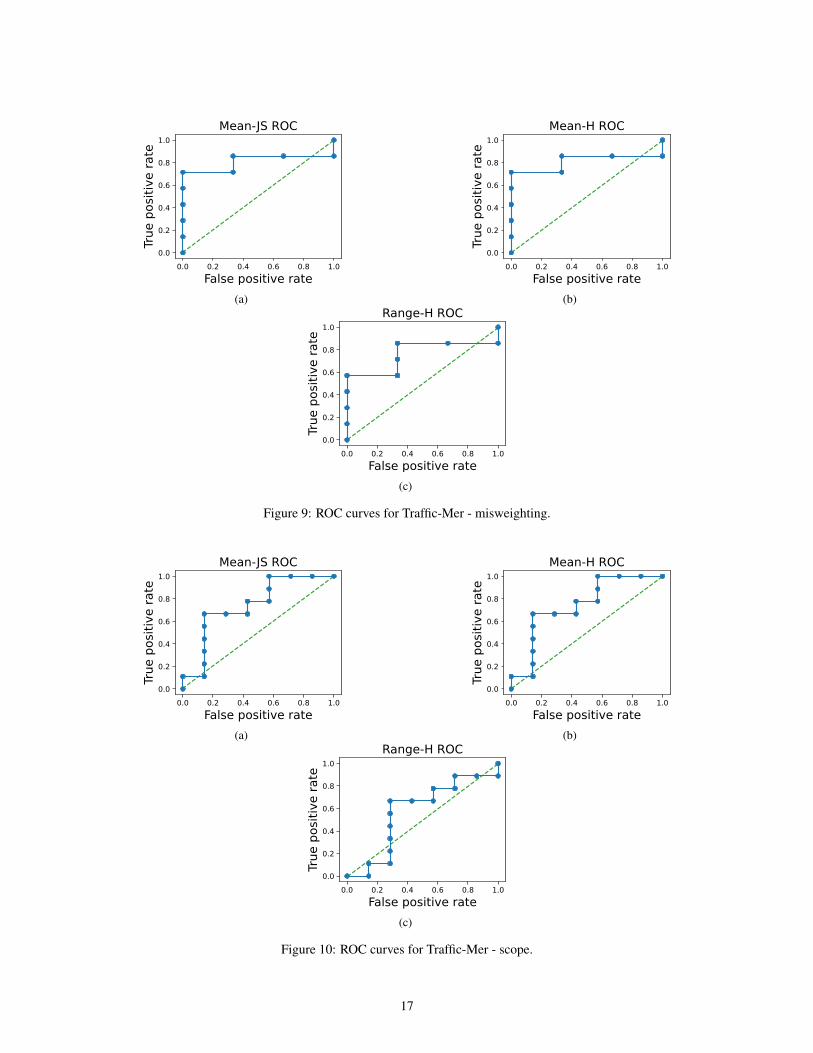
Figure 10: ROC curves for Traffic-Mer - scope.
17
(a) (b)
(c)
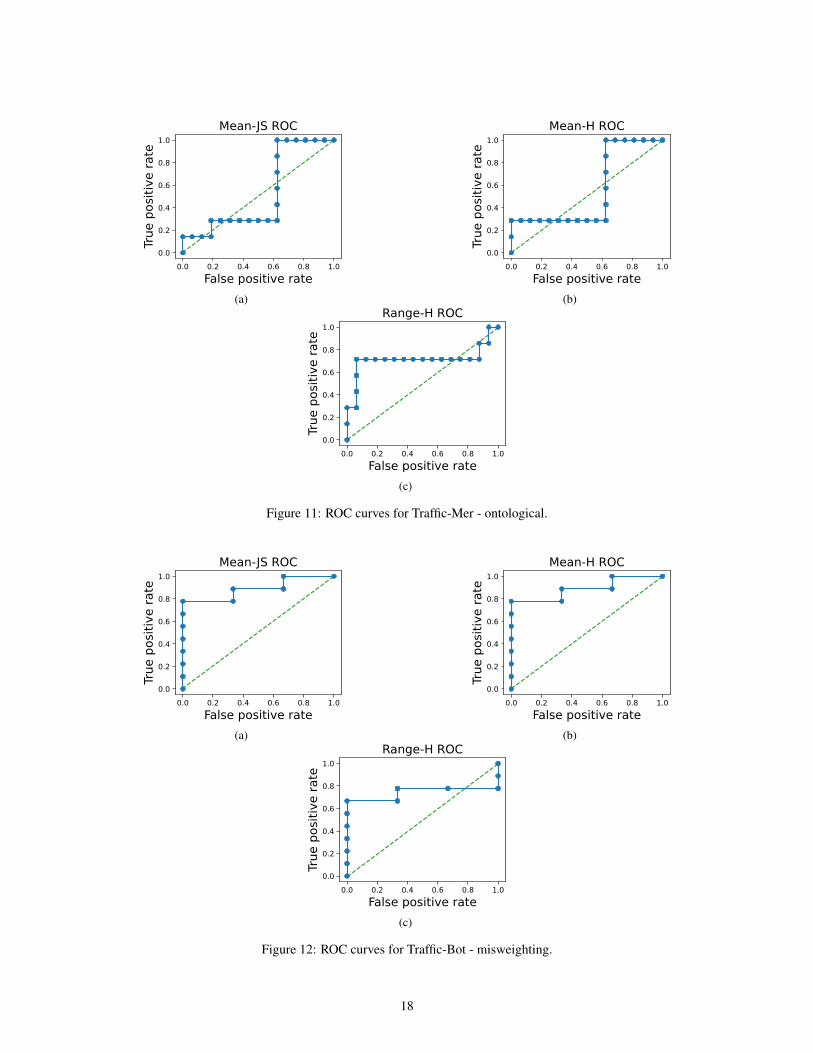
Figure 11: ROC curves for Traffic-Mer - ontological.
(a) (b)
(c)
Figure 12: ROC curves for Traffic-Bot - misweighting.
18
(a) (b)
(c)
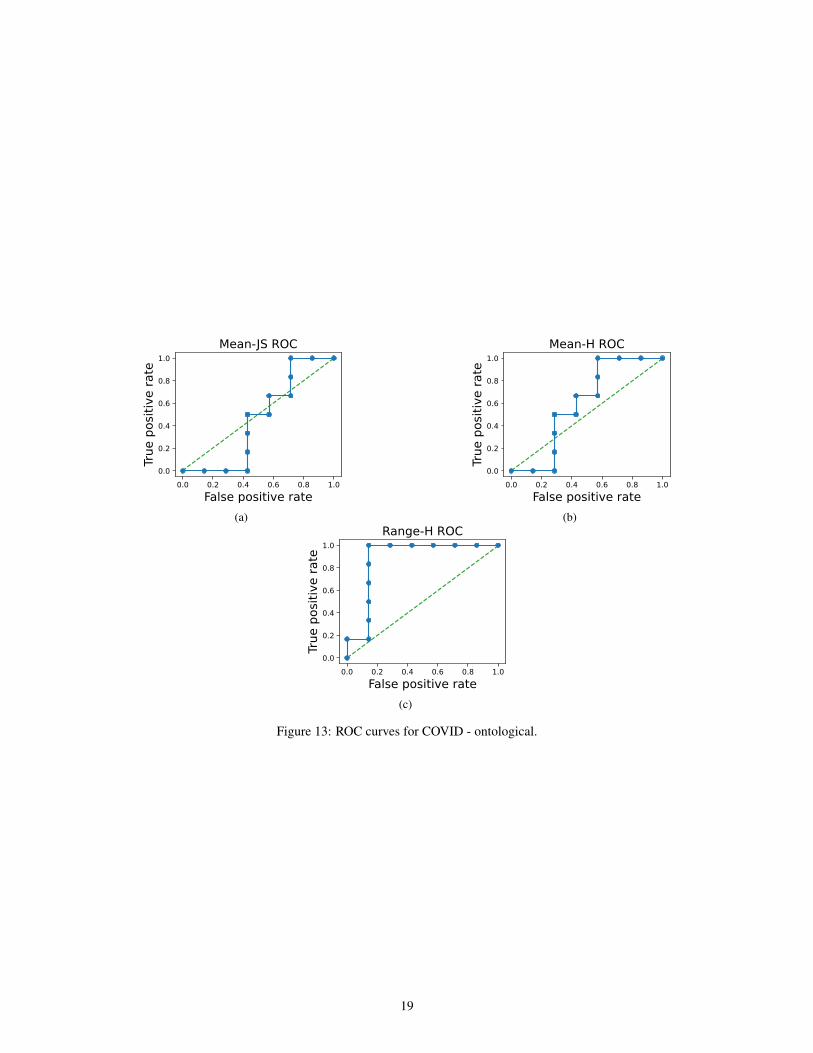
Figure 13: ROC curves for COVID - ontological.
19