Embed Size (px)
Citation preview

THE EFFECTS OF FINANCIAL LITERACY ON PERSONAL
INVESTMENT DECISIONS IN REAL ESTATE IN NAIROBI
COUNTY
BY
KEVIN M MUSUNDI
A RESEARCH PROJECT SUBMITTED IN PARTIAL
FULFILLMENT OF THE REQUIREMENTS FOR THE AWARD OF
THE DEGREE OF MASTERS OF SCIENCE IN FINANCE; SCHOOL
OF BUSINESS, UNIVERSITY OF NAIROBI
OCTOBER, 2014

ii
DECLARATION
Student Declaration:
I hereby declare that this research project is my original work and has not been presented
for a degree by myself or any other person from any other institution known and
unknown to me.
Signed……………………………………… Date …………….…………………
KEVIN M MUSUNDI
D63/63841/2013
Supervisor Declaration:
This research project has been submitted for presentation with my approval as University
Supervisor.
Signed……………………………………… Date …………….…………………
MIRIE MWANGI

iii
ACKNOWLEDGEMENTS
This project could not have been successful without the spiritual, technical and moral
support from all those I interacted with in the process of its compilation. First I would
like to thank the almighty God for his protection, care, blessings and energy throughout
the process.
My profound thanks and appreciation goes to my supervisor Mirie Mwangi for his
scholarly guidance throughout the conduct of this research project. His support, advice,
guidance and comments were very instrumental in the research implementation.
I express my sincere heartfelt appreciation to my family members for their
encouragement, financial, material and any other form of support they have given me for
the success of this project. They are a true source of inspiration and moral support to me.
Finally, I also acknowledge my friends who graciously shared their ideas and assisted me
in this research.

iv
DEDICATION
I dedicate this project to my family members for the love, tolerance, encouragement and
enduring support they have given me in pursuit of education. I also dedicate this study to
Patrick who has been there for my sake and for all-round support. May this be an
inspiration for you to strive for even greater things in life.
Thank you and God bless you abundantly.

v
TABLE OF CONTENTS
DECLARATION............................................................................................................... ii
ACKNOWLEDGEMENTS ............................................................................................ iii
DEDICATION.................................................................................................................. iv
ABSTRACT ....................................................................................................................... x
LIST OF TABLES ......................................................................................................... viii
LIST OF ABBREVIATIONS ......................................................................................... ix
CHAPTER ONE: INTRODUCTION ............................................................................. 1
1.1 Background of the Study ........................................................................................... 1
1.1.1 Financial Literacy ............................................................................................... 2
1.1.2 Personal Investment Decision ............................................................................ 3
1.1.3 Effects of Financial Literacy on Personal Investment Decision......................... 4
1.1.4 Real Estate Investments in Nairobi County ........................................................ 6
1.2 Research Problem ...................................................................................................... 7
1.3 Research Objectives .................................................................................................. 9
1.4 Value of the Study ..................................................................................................... 9
CHAPTER TWO: LITERATURE REVIEW .............................................................. 11
2.1 Introduction ............................................................................................................. 11
2.2 Theoretical Review ................................................................................................. 11
2.2.1 Decision Theory ............................................................................................... 11
2.2.2 Prospect Theory ................................................................................................ 12
2.2.3 Disposition Effect Theory ................................................................................ 13
2.2.4 Theory of Mental Accounting .......................................................................... 14

vi
2.2.5 Theory of Overconfidence ................................................................................ 15
2.3 Determinants of Personal Investment Decisions ..................................................... 16
2.4 Review of Empirical Studies ................................................................................... 19
2.5 Summary of the Literature Review ......................................................................... 22
CHAPTER THREE: RESEARCH METHODOLOGY.............................................. 25
3.1 Introduction ............................................................................................................. 25
3.2 Research Design ...................................................................................................... 25
3.3 Population................................................................................................................ 26
3.4 Sample Design......................................................................................................... 26
3.5 Data Collection ........................................................................................................ 27
3.6 Data Validity and Reliability................................................................................... 27
3.7 Data Analysis .......................................................................................................... 28
3.7.1 Simple Regression model ................................................................................. 28
CHAPTER FOUR: DATA ANALYSIS, RESULTS AND DISCUSSION ................. 30
4.1 Introduction ............................................................................................................. 30
4.2 Data Collection ........................................................................................................ 30
4.3 Response Rate ......................................................................................................... 30
4.4 Data Validity and Reliability Test ........................................................................... 31
4.5 Descriptive Statistics ............................................................................................... 32
4.6 Correlation Analysis ................................................................................................ 33
4.7 Regression Analysis and Hypothesis Testing ......................................................... 35
4.7.1 Strength of the Model ....................................................................................... 35
4.7.2 Analysis of Variance ........................................................................................ 36

vii
4.7.3 Coefficients of Determination .......................................................................... 37
4.8 Discussion of Research Findings ............................................................................ 38
CHAPTER FIVE: SUMMARY, CONCLUSION AND RECOMMENDATIONS .. 41
5.1 Introduction ............................................................................................................. 41
5.2 Summary of Findings .............................................................................................. 41
5.3 Conclusion ............................................................................................................... 42
5.4 Recommendations ................................................................................................... 43
5.5 Limitations of the Study .......................................................................................... 44
5.6 Suggestions for Further Research ........................................................................... 45
REFERENCES ................................................................................................................ 46
APPENDICES ................................................................................................................. 53
Appendix I: Letter of Introduction ................................................................................ 53
Appendix II: Questionnaire ........................................................................................... 54
Appendix III: Demographic data................................................................................... 59

viii
LIST OF TABLES
Table 4.1: Analysis of the response rate ....................................................................... 30
Table 4.2: Summary of the Measurement Reliability (Cronbach‟s Alpha) .................. 32
Table 4.3: Descriptive Statistics .................................................................................... 33
Table 4.4: Pearson Correlation Coefficients ................................................................. 34
Table 4.5: Model Summary ........................................................................................... 35
Table 4.6: Analysis of Variance .................................................................................... 36
Table 4.7: Coefficients of Determination ...................................................................... 37

ix
LIST OF ABBREVIATIONS
CBD Central Business District
CMA Capital Markets Authority
GDP Gross Domestic Product
NSE Nairobi Securities Exchange
PID Personal Investment Decision
REITs Real Estate Investment Trusts
SEO Seasoned Equity Offering
SPSS Statistical Package for Social Sciences

x
ABSTRACT This study assessed the financial literacy of the real estate investors who invested in the
real estate industry in Nairobi County. In addition, it examined the relationship between
financial literacy and the influence of the factors that affect the investment decision. The
objective of the study was to establish the effect of financial literacy on personal
investment decision making by real estate investors. This study employed a descriptive
research design. The target population of this study was the real estate investors in
Nairobi County. A modified questionnaire was developed and divided into three parts.
The first part covers demographic variables. The second part covers the issues regarding
personal investment decision making while the third part identifies several financial
literacy factors affecting the investment decision by real estate investors in Nairobi. Out
of a target population of 140, 115 respondents were used in the study. The results
indicated that the financial literacy of the real estate investors is far from the needed
level. The financial literacy level was found to have a significant effect on investment
decision making by real estate investors. To achieve optimal outcomes in this complex
decision-making environment requires decision-makers to have adequate levels of
financial knowledge and skills. The call for enhanced financial literacy amongst
consumers is a global phenomenon, driven by the growing complexity of financial
markets and products. The study was limited due to the small sample of respondents
which was 115 because of data collection cost. The design used was ex-post-facto
research design where the researcher had no control over the independent variables
because the effects of financial literacy on investment decisions had already occurred.
The study recommends for further study in the impact of inflation rates on investment
decisions and ways to mitigate against sudden losses due to inflation fluctuation. The
study also recommends further study into the effect of non – financial factors on the
process of making investment decisions.

1
CHAPTER ONE
INTRODUCTION
1.1 Background of the Study
Many individuals find investments to be fascinating because they can participate in the
decision making process and see the results of their choices. Not all investments will be
profitable, as investor will not always make the correct investment decisions over the
period of years; however, you should earn a positive return on a diversified portfolio
(Bodie, Kane and Marcus, 2007). Lobes (1987) observe that investing is not a game but a
serious subject that can have a major impact on investor's future wellbeing. Virtually
everyone makes investments, even if the individual does not select specific assets such as
stock, investments are still made through participation in pension plan, and employee
saving programme or through purchase of life insurance or a home or by some other
mode of investment like investing in Real Estate (Property) or in Banks or in saving
schemes of post offices (Lobes, 1987).
According to Baker and Nofsinger, (2010) the field of investment today is even more
dynamic than it was only a decade ago. World events have rapidly altered the values of
specific assets that the individual has to choose from, and the amount of information
available to the investors is staggering and continually growing. The key to a successful
financial plan is to keep apart a larger amount of savings and invest it intelligently, by
using a longer period of time. The turnover rate in investments should exceed the
inflation rate and cover taxes as well as allow you to earn an amount that compensates the
risks taken. Savings accounts, money at low interest rates and market accounts do not

2
contribute significantly to future rate accumulation. While the highest rate come from
stocks, bonds and other types of investments in assets such as real estate (Hussein, 2007).
1.1.1 Financial Literacy
Creating financial literacy interventions is an obvious and common sense response to the
increased complexity of the financial world. There are many domains of social policy
where it is obvious what should work to redress a social problem (Monticone and Chiara,
2010). Financial literacy is most commonly viewed as a specialized kind of consumer
expertise pertaining to how one manages one‟s financial affairs successfully or a personal
finance-specific form of human capital. According to Nye, Pete and Cinnamon, (2013)
“Financial literacy is a measure of the degree to which one understands key financial
concepts and possesses the ability and confidence to manage personal finances through
appropriate short term decision-making and sound, long-range financial planning, while
mindful of life events and changing economic conditions.” Though conceptually,
financial literacy refers to skills, existing measures of financial literacy are dominated by
measures of objective knowledge. Financial literacy is measured by percent correct on
knowledge tests where each question has a right answer (Al-Tamimi and Kalli, 2009).
In recent years, financial literacy has gained the attention of a wide range of major
banking companies, government agencies, grass-roots consumer and community interest
groups, and other organizations. Interested groups, including policymakers, are
concerned that consumers lack a working knowledge of financial concepts and do not
have the tools they need to make decisions most advantageous to their economic well-

3
being. Such financial literacy deficiencies can affect an individual's or family's day-to-
day money management and ability to save for long-term goals such as buying a home,
seeking higher education, or financing retirement. Ineffective money management can
also result in behaviors that make consumers vulnerable to severe financial crises
(Mandell and Lewis, 2006).
From a broader perspective, market operations and competitive forces are compromised
when consumers do not have the skills to manage their finances effectively. Informed
participants help create a more competitive, more efficient market. As knowledge able
consumers demand products that meet their short- and long-term financial needs,
providers compete to create products having the characteristics that best respond to those
demands (Monticone and Chiara, 2010).
1.1.2 Personal Investment Decision
According to Ayieko, (2004) investment planning is one of most important areas of
personal financial planning. It is an integral part of retirement and a direct inducement
protection planning. Financial independence after and during retirement, and with a view
of your estate is largely determined by effective retirement planning. Investment planning
includes developing investment strategies. These strategies should include designing a
systematic investment plan and developing an asset allocation strategy. Investment
planning is major part of retirement planning.

4
There are two reasons why people invest. The first reason is to accumulate assets and the
second reason is to derive an income. The investment goals will be tampered by financial
situation, age, tax position and the risk that are willing to bear. The personal investments
decision concept is that the person allocate limited resources between competing
opportunities (investments products) in a process known as capital budgeting. Making
this investment, or capital allocation, decision requires estimating the value of each
opportunity or project, which is a function of size, timing and predictability of future cash
flows (Hodge, 2000).
According to the economic concept cost of living (Agaba et al., 2008), a cost of living
adjustment is used to offset a change (usually a decrease) in the purchasing power of
income. Cost of living adjustments modify future benefits, typically on an annual basis,
to keep pace with inflation. These adjustments are usually linked to changes as measured
by an index of movements in prices: the most widely used is the consumer price index.
1.1.3 Effects of Financial Literacy on Personal Investment Decision
Poor financial decisions are often associated with low levels of financial literacy. For
instance, Rooij et al. (2009) explore the relationship between financial sophistication and
wealth, relying on specific measures of financial literacy. Calvet et al. (2009) find that
poor financial sophistication is associated with common investment mistakes, such as
under-diversification, portfolio inertia, and the tendency to sell winning stocks and hold
losing stocks. A growing literature has found strong links between financial literacy and
savings and investment behavior. De Bondt (2008), for example, show that households

5
with higher levels of financial literacy are more likely to plan for retirement, invest in
securities and that planners arrive at retirement with substantially more assets than non-
planners.
Financial literacy has been discussed by many researchers from different aspects.
Different research organizations have conducted research to identify the level of financial
literacy of investment decision makers. A research conducted by the OECD (2005)
examined the level of financial literacy in 12 major countries of the world including UK,
USA, European countries, Japan and Australia. The research concluded that the level of
financial literacy for most of the respondents is very low. Financial literacy has wide-
reaching implications for household savings and investment behaviour. Bernheim, (1997)
identifies that in households which lack basic financial knowledge, saving behaviours are
dominated by basic rules of thumb. In more recent work, Bernheim and Garrett (2003)
show that those individuals who are exposed to financial education in high school or in
the workplace save more than individuals who are not exposed to such education.
Similarly, Lusardi and Mitchell (2007) show that those who display low financial literacy
are less likely to plan for retirement and as a result accumulate much less wealth.
Monticone and Chiara (2010), found that in order to succeed at the stock market, the
investors engaged in online trading should be more knowledgeable and informed as
compared to other investors, because they lack information about what is happening
inside the stock market and they may also become the victims of information asymmetry.
Therefore, the researchers investigated the level of investors' literacy of nearly 500

6
investors dealing in online trading. They also examined the level of difference in
financial literacy among various groups of online investors using the demographic factors
and experience in online trading as variables. The research concluded that the level of
financial literacy varied in demographic factors.
1.1.4 Real Estate Investments in Nairobi County
Real estate market is a key contributor to the socio-economic developments of nations as
there is creation of employment through construction of houses and related infrastructure.
Also real estate sector is a significant contributor to the gross domestic product (GDP) of
many nations, Kenya included. Housing is a major problem in Kenya especially in
Nairobi. Despite initiatives by the Government of Kenya to ensure that Kenyans have
access to basic housing requirements millions of people are living in the sprawling slums
and also in other informal settlements around Nairobi (UN-HABITAT, 2008).
Statistics indicate that the demand for housing, which has possibly led to increase in
house prices, has been on the rise at a faster rate than the numbers of houses available or
under construction (National Housing Corporation, 2009). Even though plans are
underway to ensure adequate dwelling units for the Nairobi city residents are in place the
Government of Kenya and the private sector entities have been unable to meet the
shortfall in housing demand, which currently stand at 150,000 units annually. The
average annual supply is about 35,000 units. The GOK goal of meeting the annual hosing
demand is made more urgent by the bill of rights in the constitution of Kenya 2010 that
provides for adequate housing as a right to all Kenyans.

7
The perimeters of Nairobi are expanding to bursting point due to the demand for real
estate. Improved infrastructure like the Thika super highway project, access to utilities,
communication and financial services are some of the factors attributed to influencing
Kenya‟s real estate performance. The rising demand for quality housing and plush office
space has seen the emergence of innovative and futuristic multibillion-dollar gated
communities and mini cities. These include Northlands City, Thika Greens Golf Estate,
Four ways Junction, Tatu City, Migaa Golf Estate and Edenville Estate on the outskirts of
Nairobi. The move to introduce Real Estate Investment Trusts (REITS) by the Capital
Markets Authority (CMA) is another boost to the sector players. These plans will make
real estate companies to be listed in the Nairobi Securities Exchange (NSE).
According to the Kenya National Bureau of Statistics the real estate demand has
exceeded the supply by more than five times during the last decade. Heavy remittances
by Kenya‟s diaspora, hefty pensioners‟ funds, private equity investments and the large
base of expatriates are some of the factors that have led to spiraling costs of housing and
escalating property prices (Kabukuru, 2012).
1.2 Research Problem
Investment is the employment of funds on assets with the aim of earning income or
capital appreciation in future. It has two attributes namely the time and risk. Present
consumption is sacrificed to get a return in the future (Bodie, Kane and Marcus, 2007).
When an investor invests in real estate he must focus on the most reputed sector that will
provide the maximum return over the next few years. Proper financial planning is a must.

8
With a real estate investment property, there are more ways in which to realize a superior
return on the investment. Real estate investment can increase in value, as well as provide
good cash flow.
Investors think of themselves as rational and logical. But when it comes to investing,
their emotional inclinations, ingrained thought patterns, financial illiteracy and
psychological biases, color how they perceive the world and how they make decisions
(Iyer and Bhaskar, 2002). Research findings by Hodge, (2000) indicated that real estate
accounts for a large share of wealth; about 33% and Gross Domestic Product (GDP) of
about 11% in the United States of America. Baker and Haslem, (1973) contended that
dividends, expected returns and the firm‟s financial stability are critical investment
considerations for individual investors. Potter, (1971) identifies six factors: dividends,
rapid growth, investment for saving purposes, quick profits through trading, professional
investment management and long-term growth that affect individual investors‟ attitudes
towards their investment decisions.
Kariuki (2013) indentified three factors that affected the returns of real estate investments
in Nairobi. The factors included: finance factors, tax factors and demand factors.
Findings by Nabutola, (2004) were that herd behaviour was prevalent among individual
investors at the NSE. Omboi, (2011) carried out a research in Kenya to investigate factors
influencing real estate property prices a survey of real estates in Meru municipality,
Kenya. Robert A. et al, (2011) carried out a study to establish the relationship between
housing prices and the optimal time-on-the-Investment decision.

9
Several studies has been done in respect to real estate industry however non has sought
to look at the relationship between the effects of financial literacy and personal
investments decision in Real Estate in Nairobi County and therefore this study seeks to
determine this relationship. In so doing, the study seek to find answers to the following
research questions; What is the relationship between effects of financial literacy and
personal investments decision in Real Estate in Nairobi County and to what extent does
financial literacy influence the individual real estate investors in Nairobi County?
1.3 Research Objectives
To determine the effects of financial literacy on personal investment decisions of real
estate investors in Nairobi County.
1.4 Value of the Study
This study will be of importance to investors generally, and more specifically, to real
estate investors. They will be acquainted with knowledge about factors that influence
personal investment decisions and. They will be able to apply and relate the influences to
investment decisions they have made in the past. They will be able to learn their own
behavioural patterns that deviate from rationality and be equipped to make better and
more rewarding investment decisions in the future.
Investment advisors and financiers will benefit from this study by discovering that
investors are not always guided by rationality in their investment decisions. Equipped
with findings from this research, investment advisors and financiers will be able to offer

10
more informed quality advice to investors. Academicians and scholars in the field of
finance will find this study enriching to the already growing body of knowledge, and be
able to identify research gaps for further study.

11
CHAPTER TWO
LITERATURE REVIEW
2.1 Introduction
This chapter brings relevant literature required to find answers and connect to the
research. It focuses on theoretical review, financial literacy and individual investor
decision and empirical literature review.
2.2 Theoretical Review
A number of theories have been developed on real estate investment industry. Some of
these are the decision theory, prospect theory, disposition effect theory, mental
accounting theory and theory of overconfidence.
2.2.1 Decision Theory
Decision theory was developed by Warner in 1968. It is a theory about people‟s actions.
It has both a prescriptive and a descriptive version. The prescriptive version says that a
person should choose the action that maximizes expected utility. The description version
says that a person does choose the action that maximizes expected utility. Real estate
decisions are made by a variety of actors pursuing a broad range of objectives. These
actors include home buyers and renters, builders, brokers, bankers, and the public
agencies that provide physical networks and services such as streets, utilities and schools.
Property managers also face every day critical risk management decisions as determining
the price for sell or rent of a property, choice of financing, investment analysis, real estate
portfolio management, real estate valuation. In these cases a decision support system can

12
be very valuable in order to minimize the risk of potential losses due to wrong decisions.
Roberts and Henneberry (2007) explore the decision making processes of property
investors. The study covered a broader sample of countries across three European
markets namely France, Germany and U.K. Interviewees in this study constituted those
most likely to engage directly in property investment decision-making. The study
proposes a ten stage normative model. The study finds that the actual decision-making
process is much simpler than the normative model suggested. Both the UK and the
French and German models are found to follow a broadly similar path, with investors
setting a strategy, searching for properties, undertaking an analysis of market conditions
and purchasing properties that fulfill that strategy (Roberts and Henneberry, 2007).
2.2.2 Prospect Theory
The prospect theory was developed by Kahneman and Tversky in (1979). The theory
contradicts expected utility theory upon which Standard finance is based. According to
Jordan and Miller (2008), Prospect theory is an alternative to classical, rational economic
decision making. Prospect theory emphasizes that investors tend to behave differently
when they face prospective gains and losses; investors are much more distressed by
prospective losses than they are happy about equivalent gains, and a typical investor
considers the pain of losing one dollar to be twice the pleasure received from the gain of
one dollar.

13
Investors have been found to respond in different ways to identical situations, depending
on whether they are presented in terms of gains or in terms of losses. Investors seem to be
willing to take more risk to avoid loss than they are to make an equivalent profit. The
tendency of investors to be risk-averse regarding gains but risk-seeking regarding losses,
is the essence of prospect theory. When an investor has the choice between a sure gain
and a gamble that could increase or decrease the sure gain, the investor is likely to choose
the sure gain. But when faced with a choice between a sure loss and a gamble which
could increase or decrease the sure loss, investors are more likely to take the gamble
(Jordan and Miller, 2008).
2.2.3 Disposition Effect Theory
The disposition effect theory was developed by Shefrin and Statman in 1985. Disposition
effect refers to the tendency that investors have of selling assets that have gained value
(„winners‟) and keeping assets that have lost value („losers‟). When prices fall, investors
tend to hold to assets they already have, to avoid the regret of having sold at a loss,
hoping that the prices will rise in the future. On the other hand, when prices rise,
investors tend to sell assets too fast to realize gains.
According to Weber and Camerer (1998), disposition effects can be explained by the two
features of prospect theory: the idea that people value gains and losses relative to a
reference point (which is the initial purchase price of assets), and the tendency to seek
risk when faced with possible losses, and avoid risk when a certain gain is possible.

14
Shefrin and Statman (1985) found evidence that due to their desire to avoid regret,
investors tend to sell winners too early and ride losers too long. Shiller and Case (1988)
interviewed home buyers and found prevalence of disposition effects; that homeowners
were more eager to sell at a profit than at a loss. Real estate economists and agents widely
believe that volume slows, sometimes dramatically, when prices sag (Weber and
Camerer, 1998). Barber and Odean (1999) conclude that the disposition effect based on
loss aversion best explains the tendency for investors to hold losers and sell winners.
They even found that investors are more inclined to purchase additional shares of their
losing investments by almost 1.5 times than additional shares of their winning
investments.
2.2.4 Theory of Mental Accounting
This theory was developed by Thaler in (1985). In mental accounting theory, framing
means that the way a person subjectively frames a transaction in their mind will
determine the utility they receive or expect. According to Jordan and Miller (2008),
investors maintain a separate mental account for each asset and unknowingly, have a
personal relationship with each. As a result, it becomes difficult to sell one of them.
According to Shefrin and Statman (1985), the main idea underlying mental accounting is
that decision makers tend to segregate the different types of gambles faced into separate
accounts. When a new stock is purchased, rather than evaluating the whole investment, a
new mental account is opened. The asset purchase price is used as the reference point. A
running score is then kept on this account indicating gains or losses relative to the

15
purchase price. Investors find it difficult to close mental accounts at a loss, a situation
termed as „the break-even effect‟. Investors may resist the realization of a loss because it
stands as proof that their first judgment was wrong.
While closing a stock account at a loss induces regret, closing at a gain induces pride
(Shefrin and Statman, 2005). The quest for pride and the avoidance of regret lead to a
disposition to realize gains and defer losses. Regret is stronger than pride. As a result,
investors may be prone to inaction than action due to the strong desire to avoid regret.
For example, if an asset‟s price rises and the investor sells it, the pride of gain would
vanish away if the asset‟s price rises further. The investor would regret for having sold
too quickly. Thus some investors would prefer not selling at all (inaction) whether prices
rise or fall.
2.2.5 Theory of Overconfidence
This theory developed by Kent, David and Subrahmanyam (1997), says that people
generally rate themselves as being above average in their abilities. They also
overestimate the precision of their knowledge and their knowledge relative to others.
Many investors believe they can consistently time the market. But in reality there's an
overwhelming amount of evidence that proves otherwise. Overconfidence results in
excess trades, with trading costs denting profits (Tapia and Yermo, 2007).
According to Jordan and Miller (2008), overconfidence manifests itself through lack of
diversification. People tend to invest in local companies that they are familiar with, as

16
opposed to distant companies which might even be performing better. Another form of
overconfidence is the tendency for people, including investors, to remember their past
successes and disregard their past failures. Blume and Friend, (2008) highlight two
common mistakes investors make: excessive trading resulting from overconfidence, and
the tendency to hold on to losing investments while selling winners which is prompted by
the human desire to avoid regret.
2.3 Determinants of Personal Investment Decisions
The availability of financial information has been postulated as one of the variables that
could influence investor behavior while making investment decisions on the investment
option to select. Financial information refers to accounting reports, general information
relating to price movements, reputation of the firm, firm status in industry, past
performance of the firm stock, and expected performance (Chong and Lal, 2011).
Financial information is considered to influence an investor in making a decision to
invest in stocks as an individual would evaluate the underlying movements of the key
indicators of interest. Merika (2008) and Easley et al., (2010), find that financial
information and expected corporate returns do have a significant effect on the decision to
invest in shares.
According to Easley et al., (2010), when forming an intention to invest, individual
investors will normally begin with assessment of companies „financial positions‟ based
on some objective measures such as return on equity or earning per share. Subsequently,
their emotional perceptions of such evaluations may come into effect as they try to justify

17
their investing decisions in a given company‟s stocks. Chong and Lai (2011) explains that
in making an investment decision, rational individuals are likely to seek information on
performance as well as the behavior of other investors. The timing and delivery of the
information about the market had substantial effect on how investors made their decisions
(Hughes, 2008).
Gentry and Fernandez (2008) also find that Annual Reports and interviews with company
officials were the most important sources of information in assessing the firm value and
therefore informing the equity selection process. Investment decision makers use
financial statements of different firms for financial decision making purposes. In this
instance, financial analysts become useful in gathering, analyzing and interpreting the
accounting numbers the results of which is then circulated to potential investors for use to
make decisions. Kiplangat et al., (2010) examine determinants of investor confidence in
Kenya and their findings show that daily price movements in the NSE are significantly
related to investor sentiment, implying therefore that investors will be guided by the
available information to make a decision to invest in shares.
Totok et al., (2007) investigated the nature of indicators having influence on investor‟s
needs and motivation to invest in equity shares using data for firms trading in the Jakarta
Stock exchange and the findings show that investors in emerging markets require certain
metrics as tools to analyze and predict the value of shares. The researchers argue that the
metric provides a basis to ascertain the interrelationships among fundamentals, external
risks, and value of the shares influencing the quality of fundamental decisions.

18
There are several studies which generally indicate that financial illiteracy is widespread
and that many individuals lack knowledge of even the most basic economic principles
(Lusardi and Mitchell 2007; Hilgert, Hogarth, and Beverly 2003). The link between
financial literacy and (“good”) investment behavior is less clear. Van Rooij, Lusardi, and
Alessie (2011a) show that individuals with lower financial literacy are much less likely to
invest. Guiso and Jappelli (2008) find in the individual‟s financial literacy a good
indicator for the diversification of his/her portfolio. Using investor‟s wealth and
profession as a proxy for financial literacy, Dhar and Zhu (2006) find empirical evidence
that more literate investors are less prone to the disposition effect.
The results of Müller and Weber (2010) indicate that financial literacy is positively
related to investments in low-cost funds. Nevertheless, they report that even the most
sophisticated investors select actively managed funds instead of less expensive ETFs
(exchange traded funds) or index fund alternatives. Even finance professors with
presumably high financial literacy do not implement their knowledge when building their
own portfolio. For example, Doran, Peterson, and Wright (2010) find that the professors‟
perception regarding market efficiency and the consequential optimal investment strategy
are unrelated to their actual, realized behavior. The authors argue that the professors‟
investment decisions are, despite their high financial literacy, driven by behavioral
factors comparable to amateur investors. Hibbert, Lawrence, and Prakash (2012)
document that a significant number of finance professors do not participate in the
investment market at all. Moreover, several studies document only a weak, if any, impact

19
of financial literacy on the quality of investment decisions (Gathergood 2012; von
Gaudecker, 2011).
2.4 Review of Empirical Studies
Mahmood (2011) conducted a study in Pakistan to examine the role of various
socioeconomic and demographic factors affecting the investment decision of investors.
An investment model was developed that described the impact of past investment
experiences of investors, variation in regulatory policies, asymmetric information, their
marital status, gender, and reinvestment intentions of investors. They suggested that risk
perception performs the key role in the investment decision process and that the variation
in the government policies can impact the risk perception of an investor.
An empirical study conducted by Shyan, Gow and Hui (2010) among Taiwanese
investors to determine their past experiences and their outcomes when exposed to the
economic signals. Empirical results found no difference by gender to investor propensity
to take risk. However, higher and lower perceptions of risk were indicated by investors
according to their personal investment experience. Investors with little experience and
structured notes were found to have significantly heightened perception of risk.
Furthermore the married subjects believed that they have adequate financial management
knowledge and can make better investment decision.

20
Natalie (2010) conducted an exploratory study on factors influencing investment
decisions of potential investor. The study used a questionnaire of a sample of business
students in an undergraduate institution. It was found that attitude, subjective norms,
perceived behavior control, and risk propensity were significant predictors of investment
intentions. It was also found that risk propensity did not moderate the relationship
between the variables and the investment intentions. The findings showed that the
education in business finance can help to influence the investment decision.
An empirical research related to equity selection process in Malaysia conducted by Tun-
Pin and Ming-Ming Lai in 2011 indicated neutral information appeared to be the most
important factor the Malaysian investors, followed by accounting information, social
relevance and advocates‟ recommendations in equity selection process. Neutral
information was positively correlated in while accounting information was negatively
correlated with expected return. The study concluded that investment decision of
investors did not rely on single integrated factor.
Shiv (2008) focused on the relation between emotions and the investment behavior by
empirically tested the behaviour of 34 people in California, in which those people were
given the limited amount of money and were asked to make their investment decision
after enhancing their different emotions. The result suggested that the emotions triggered
by a given situation help the decision making process by narrowing down the option of
reaction, either by discarding those that are dangerous or by endorsing those that are
advantageous. Emotions serve an adoptive role in speeding up the decision making

21
process. However, depending on the circumstances, moods and emotions can play a
useful as well as disruptive role in decision making.
Al-Tamimi (2005) investigated the factors influencing individual investor behaviour on
the United Arab Emirates (UAE) financial markets. The study found that the six most
influencing factors in order of importance were: expected corporate earnings, get rich
quick, stock marketability, past performance of the firm‟s stock, government holdings
and the creation of the organised financial markets. He also found the least influencing
factors to be expected losses in other local investments, minimising risk, expected losses
in international financial markets, family member opinions and gut feeling on the
economy. But the results of a similar study carried out by Al-Tamimi and Kalli (2009) on
UAE investors indicate that the most influencing factor that affects the investment
decision is religious reasons and the least affecting factor is rumors.
The study by Obamuyi, (2013) sought to determine the main factors influencing
investment decisions of investors and how these factors are related to the investors‟
socio-economic characteristics in the Nigerian Capital Market. The study covers
individual investors using convenient sampling method to obtain information from 297
respondents through a modified questionnaire. The results indicated that the five most
influencing factors on investment decisions of investors in Nigeria are past performance
of the company‟s stock, expected stock split/capital increases/bonus, dividend policy,
expected corporate earnings and get-rich-quick. Also, the five least influencing factors
included religions, rumors, loyalty to the company‟s products/services, opinions of

22
members of the family and expected losses in other investments. The study found that the
socio-economic characteristics of investors (age, gender, marital status and educational
qualifications) statistically and significantly influenced the investment decisions of
investors in Nigeria.
Jagongo and Mutswenje (2014) conducted a survey by on the Factors Influencing
Investment Decisions at the Nairobi Stock Exchange. The study used a structured
questionnaire and conducted on the 42 investors out of 50 investors that constituted the
sample size. The researcher confirmed that there seems to be a certain degree of
correlation between the factors that behavioral finance theory and previous empirical
evidence identify as the for the average equity investor. The researcher found out that the
most important factors that influence individual investment decisions were: reputation of
the firm, firm‟s status in industry, expected corporate earnings, profit and condition of
statement, past performance firms stock, price per share, feeling on the economy and
expected divided by investors.
2.5 Summary of the Literature Review
Empirical studies challenge the validity and relevance of standard finance and its
underlying assumptions. Many behavioural finance scholars have carried out studies
which show that people, and specifically investors, are not always governed by rationality
when making decisions, including investment decisions. Cognitive psychological biases
which are a manifestation of people‟s deviation from rational utilitarianism have been
observed by behaviourists to influence investment decisions, leading to sub-optimization.

23
In addition to the behavioural factors, the price and location of the property are also
considered important factors when making property investment decisions. Furthermore,
the results indicate that property price changes and property market information have a
very high impact on property investment decisions.
Real estate markets in Kenya are not well developed in terms of regulation. But a
transformation is taking place, with CMA‟s introduction of REITs and on-going
establishment of regulations that will enhance the opening up of trading in real estate
properties (lands and buildings) at the NSE. Transactions in real estate properties have
been taking place in Kenya among individual and institutional investors, without being
undertaken via organized markets such as NSE. Home-ownership in Kenya is very low
and housing demand is by far greater than its supply. This wide gap which is further
escalated by rural-urban migration and population explosion, presents a great opportunity
for real estate investors due to high demand for residential and commercial premises.
When you invest in real estate, you are buying physical land or property. Some real estate
is cash generating think of an apartment building, rental houses, or strip mall where the
tenants are sending you checks each month, you pay the expenses, and keep the
difference as the profit. Real estate is often a more comfortable investment for the lower
and middle classes because they grew up exposed to it (just as the upper classes often
learned about stocks, bonds, and other securities during their childhood and teenage
years). Its likely most people heard their parents talking about the importance of “owning
a home”. The result is that they are more open to buying land than many other

24
investments. When you invest in real estate, you invest in something tangible. You can
look at it, feel it, drive by with your friends, point out the window, and say, “I own that”.
For some people, that‟s important psychologically.
It‟s more difficult to be defrauded in real estate compared to stocks if you do your
homework because you can physically show up, inspect your property, run a background
check on the tenants, make sure that the building is actually there before you buy it, do
repairs yourself with stocks, you have to trust the management and the auditors. Using
leverage (debt) in real estate can be structured far more safely than using debt to buy
stocks by trading on margin. Real estate investments have traditionally been a terrific
inflation hedge to protect against a loss in purchasing power of the dollar. (Casteleijn, A,
2001).

25
CHAPTER THREE
RESEARCH METHODOLOGY
3.1 Introduction
This chapter discusses the research methodology used for the study. Research
Methodology gives details regarding the procedures used in conducting the study. The
research design, population, data collection and analysis methods are elaborated.
3.2 Research Design
A research design is a programme to guide the researcher in collecting, analyzing and
interpreting observed facts (Orotho, 2003). This study used the descriptive research
design. A descriptive study is concerned with finding out who, what, where, when, or
how much (Cooper and Schindler, 2006). This research is descriptive because it is
concerned with discussing personal investment decisions (the „what‟) and its influence on
decisions by investors (the „who”) in real estate industry. The descriptive design was used
since it ensures complete description of the situation as it is, making sure that there is
minimum bias in the collection of data and to reduce errors in interpreting the data
collected. The design also provided a detailed and highly accurate picture of the situation
that was very useful in literature review. Both primary and secondary sources of data
were used in this research.

26
3.3 Population
According to Mugenda and Mugenda (2003), a population refers to a complete set of
individuals, cases or objects with some common observable characteristics, which
differentiate it from other populations. The target population of this study was the real
estate investors in Nairobi County (i.e. the 5,000 people who own rental
(residential/commercial) house(s) within Nairobi CBD). According to the Kenya Postal
Directory 2013 Nairobi edition, there were 45 real estate agents in Nairobi CBD and
these agents were used to identify the individual investors. The study covered the whole
area enclosed by Tom Mboya Street, University Way, Uhuru Highway and Haile Selassie
Avenue.
3.4 Sample Design
The names and addresses of investors from Nairobi CBD were given by the brokerage
firms. A simple random sample of seven real estate agents was selected from which 20
individual investors from it were randomly selected targeting one questionnaire each.
This made a sample size of 140 respondents. Random numbers were obtained using a
calculator, a spreadsheet, printed tables of random numbers, and by traditional methods
of drawing slips of paper from a hat, tossing coins or rolling dice (Neville & Sidney,
2004). The researchers study adopted the random number tables. Simple random
sampling helped to ensure that the sample represented the entire population, and was not
biased or prejudiced towards any particular groups within the population. It also helped
eliminate the tendency to select based on a basing factor (Cooper and Emory, 1995).

27
3.5 Data Collection
The data collection of this study was from both primary and secondary data. Primary data
was collected using questionnaires which were examined by the researcher personally.
The questionnaires were administered to the individual investors personally. This method
was appropriate since it encouraged prompt responses from the respondents.
The questionnaire was structured into three sections. Section 1 sought to capture the
general data (Bio-Data) about the investor. Section II involved data on personal
investment decision while Section III was concerned with the data on effects of financial
literacy on individual investment decisions. Respondents were asked to indicate their
degree of how they were influenced by each of the items on five point Likert scale.
The researcher used secondary data to obtain more information and got clearer about the
study. The researcher used and referred to articles, journals and reports to complete the
literature review. The researcher also surfed the internet and websites in order to find
more information and gather the electronic journals or articles that helped the researcher
to do the research well.
3.6 Data Validity and Reliability
To ensure validity and reliability of the data that was collected, formulated questionnaires
were pre-tested to establish their validity before they were administered to the
respondents. The questionnaires were structured to enhance the research objective.

28
Further, the researcher discussed in details the contents and the structure of the
questionnaire with the supervisor before going to the field to ensure validity.
3.7 Data Analysis
After all primary data had been collected; the researcher classified it in accordance with
variables. Statistical package for social scientist (SPSS) data analysis program was
utilized to generate inferential and descriptive statistics; charts and percentages from the
respondents to establish the relative importance and weight for each variable. MS excel
spread sheet tools was utilized in presenting the quantitative data. The researcher used
Simple Regression Model, whereby the variables of the interest here were financial
literacy which was the independent variable and investment decisions the dependent
variable. Thus the tentative hypothesis was that the higher the level of financial literacy
results in better investment decision other things held constant.
3.7.1 Simple Regression model
The Simple Regression equation or function that includes the independent and dependent
variables for this study was computed as follows as borrowed from the study of
Dimitrios, (2007).
Y = β0 + X1 β1+X2β2+X3β3+ε
Where β = regression coefficient (parameter of the function)
Y=Personal Investment decision measured by determining the value of real estate
investments made.
X1 = Financial Literacy measured by the level of financial knowledge attained
and number of years in real estate industry.

29
X2 = Gender of the respondent.
X3 = Age of the respondent.
ε = error term
The simple regression function shown above investigated the effect of the independent
variable on dependent variable at the same time and of the same set of analysis. Pearson
Correlation Analysis is the statistical tool that indicates the strength and direction of the
linear relationship between two random variables. Correlation was used to check the
overall strength to establish regression model and individual significance of the
independent variables. Reliability test and Regression analysis were also computed.

30
CHAPTER FOUR
DATA ANALYSIS, RESULTS AND DISCUSSION
4.1 Introduction
In this chapter data obtained from the questionnaires was examined analyzed and a
presentation of the finding done.
4.2 Data Collection
Data was collection from both primary and secondary sources. The researcher used the
questionnaire to collect data from the real estate investors who were the respondents. The
study findings revealed that majority of the respondent (92%) were male while 8% were
female. It was also noted that majority of the respondents were aged over 50 years. The
study findings found that majority of the respondents had reached up to an undergraduate
level as their highest level of education.
4.3 Response Rate
Table 4.1: Analysis of the response rate
Frequency Percentage
Returned 115 82.1%
Not returned 25 17.9%
TOTAL 140 100
Source: Author, 2014
Table 4.1 shows that out of the target sample of 140 respondents, the study managed to
collect data from 115 respondents whereby the questionnaires were filled and returned

31
thereby making a response rate of 82.1%, which is an adequate response rate for
statistical reporting.
4.4 Data Validity and Reliability Test
Reliability is a fundamental issue in any measurement scale. Scale reliability is
considered as the proportion of variance attributed to the true score of the latent construct
(DeVellis, 1991). It is usually measured by internal consistency reliability that indicates
the homogeneity of items comprising a measurement scale. Usually, the internal
consistency of a measurement scale is assessed by using Cronbach‟s coefficient alpha. It
is generally recommended that if a measurement scale having a Cronabach‟s coefficient
above 0.70 is acceptable as an internally consistent scale so that further analysis can be
possible. However, if the scale has a coefficient alpha below .70, the scale should be
examined for any sources of measurement errors such as inadequate sampling of items,
administration errors, situational factors, sample characteristics, number of items, and
theoretical errors in developing a measurement scale (Gable & Wolf, 1993).

32
Table 4.2: Summary of the Measurement Reliability (Cronbach’s Alpha)
Measurement Scale Number of
questionnaires
Number of
Items
Cronbach’s
Alpha (α)
Financial Literacy 5 3 0.240
Personal Investment Decision 5 3 0.443
Effects of financial literacy on
personal investment decision
5
3
0.434
Source: Author, 2014
In the pilot study, 5 questionnaires were used, they were filled by the respondents chosen
from the non-sampled population but within the target population and the results are
shown in the table above. It was evident that all the measurement scale the three variables
had a Cronbach‟s coefficient above, Financial Literacy 0.240, Personal Investment
Decision 0.443, Effects of Financial Literacy on Personal Investment Decision 0.434
which in this case is acceptable as an internally consistent scale for further analysis to be
possible.
4.5 Descriptive Statistics
The respondents were requested to indicate their level of extent with the following factors
with regard to investing. The responses were rated on a five point Likert scale where; 1 =
Not at all, 2 = Small extent, 3 = Moderate extent, 4 = Great extent, 5 = Very great extent
as shown in Table 4.3.
33
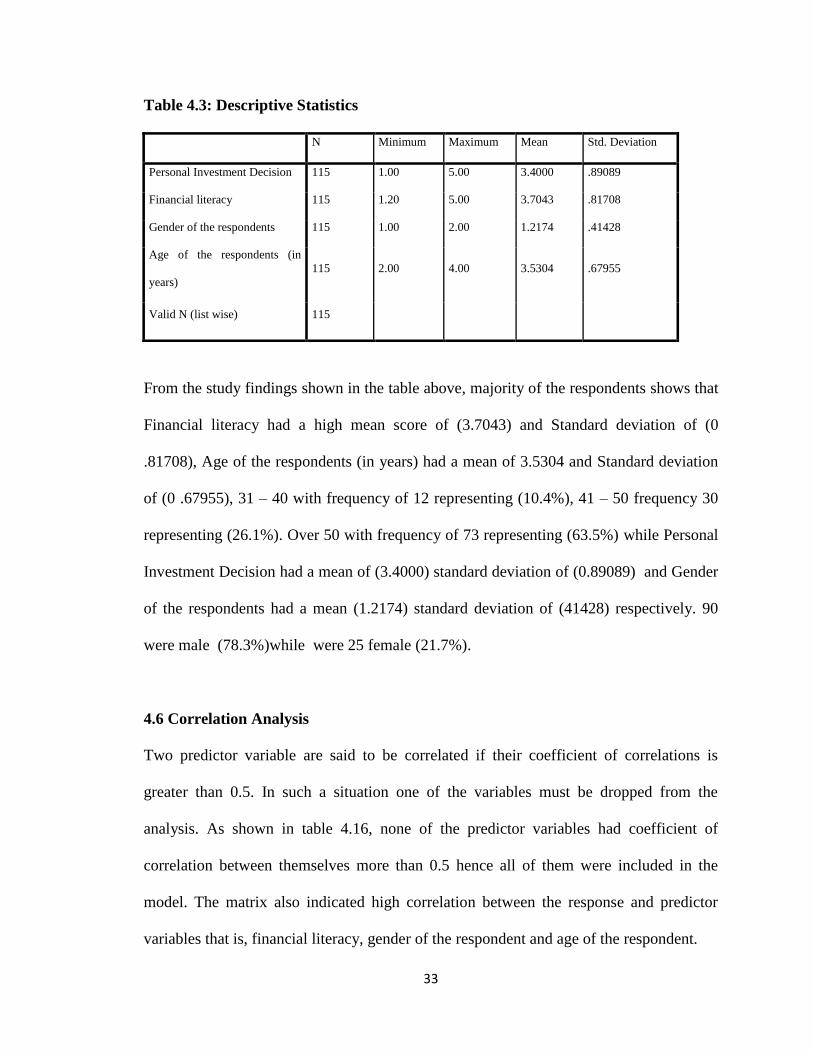
Table 4.3: Descriptive Statistics
N Minimum Maximum Mean Std. Deviation
Personal Investment Decision 115 1.00 5.00 3.4000 .89089
Financial literacy 115 1.20 5.00 3.7043 .81708
Gender of the respondents 115 1.00 2.00 1.2174 .41428
Age of the respondents (in
years)
115 2.00 4.00 3.5304 .67955
Valid N (list wise) 115
From the study findings shown in the table above, majority of the respondents shows that
Financial literacy had a high mean score of (3.7043) and Standard deviation of (0
.81708), Age of the respondents (in years) had a mean of 3.5304 and Standard deviation
of (0 .67955), 31 – 40 with frequency of 12 representing (10.4%), 41 – 50 frequency 30
representing (26.1%). Over 50 with frequency of 73 representing (63.5%) while Personal
Investment Decision had a mean of (3.4000) standard deviation of (0.89089) and Gender
of the respondents had a mean (1.2174) standard deviation of (41428) respectively. 90
were male (78.3%)while were 25 female (21.7%).
4.6 Correlation Analysis
Two predictor variable are said to be correlated if their coefficient of correlations is
greater than 0.5. In such a situation one of the variables must be dropped from the
analysis. As shown in table 4.16, none of the predictor variables had coefficient of
correlation between themselves more than 0.5 hence all of them were included in the
model. The matrix also indicated high correlation between the response and predictor
variables that is, financial literacy, gender of the respondent and age of the respondent.

34
Table 4.4: Pearson Correlation Coefficients
Personal
investment
decision
Financial
literacy
Gender of
the
respondent
Age of the
respondent
Personal
investment
decision
1.000
Financial
literacy
.736 1.000
Gender of the
respondent
.552 .418 1.000
Age of the
respondent
.567 .428 .447 1.000
Source: Author, 2014
The correlation analysis was done aimed at establishing the nature of the relationship
between Personal investment decision and financial literacy witnessed in the study. A
correlation coefficient of 0.736 was obtained suggesting a strong positive relationship
between the two variables. This indicates that those investors who have financial literacy
are most likely to make viable personal investment decisions.

35
4.7 Regression Analysis and Hypothesis Testing
A simple regression model was applied to determine the relative importance of each of
the variables with respect to the Personal investment decision
The regression model was as follows:
Y = β0 + X1 β1+X2β2+X3β3+ε
Where β = regression coefficient (parameter of the function)
Y = Personal Investment decision measured by determining the value of real
estate investments made.
X1 = 0.736 Financial Literacy measured by the level of financial knowledge
attained and number of years in real estate industry.
X2 = Gender of the respondent
X3 = Age of the respondent
ε = error term
4.7.1 Strength of the Model
Table 4.5: Model Summary
Model
R R Square
Adjusted R
Square
Std. Error of the
Estimate
1 .912a .832 .816 .66403
a. Predictors: (Constant), Financial Literacy, Gender of the respondent, Age of the
respondent

36
Analysis in Table 4.10 shows that the coefficient of determination (the percentage
variation in the dependent variable being explained by the changes in the independent
variables) R2 equals 0.832 (83.2%), that is, Financial Literacy, Gender of the respondent,
Age of the respondent leaving only 16.8 percent unexplained.
4.7.2 Analysis of Variance
Table 4.6: Analysis of Variance
ANOVAb
Model Sum of
Squares df
Mean
Square F Sig.
1 Regression 20.565 4 5.141 11.660 .000a
Residual 15.874 111 .441
Total 36.439 115
a. Predictors: (Constant), Financial Literacy, Gender of the respondent, Age of the
respondent
b. Dependent Variable: Personal investment decision
The summary of the basic logic of ANOVA is the discussion of the purpose and analysis
of the variance. The purpose of the analysis of the variance is to test differences in means
(for groups or variables) for statistical significance. The accomplishment is through
analyzing the variance, which is by partitioning the total variance into the component that
is due to true random error and the components that are due to differences between
means. The ANOVA analysis is intended to investigate whether the variation in the

37
independent variables explain the observed variance in the outcome in this study. The
ANOVA results indicate that the independent variables significantly in the F-Statistics
produced (F=11.660) was significant at 0 per cent level (Sig. F<.005) thus confirming the
fitness of the model. Analysis in table below shows that the coefficient of determination
(the percentage variation in the dependent variable being explained by the changes in the
independent variables).
4.7.3 Coefficients of Determination
Table 4.7: Coefficients of Determination
Coefficientsa
Model Unstandardized
Coefficients
Standardized
Coefficients
t Sig. B
Std.
Error Beta
1 (Constant) .022 1.029 .021 .783
Financial Literacy .969 .132 .061 .519 .004
Gender of the
respondent
.066 .137 .096 .833 .001
Age of the
respondent
.114 .145 .056 .459 .003
a. Dependent Variable: Personal investment decision

38
The established multiple linear regression equation becomes:
Y = 0.022+0.969X1 +0.066X2 +0.114 X3
Where
Constant = 0.022, shows that if Financial Literacy, Gender of the respondent and Age of
the respondent are all rated as zero, Personal investment decision would be
0.022.
X1= .969, shows that one unit change in Financial Literacy results in 0.969 units increase
in Personal investment decision
X2= .066, shows that one unit change in gender results in 0.066 units increase in Personal
investment decision.
X3= .114, shows that one unit change in age results in 0.114 units increase in Personal
investment decision.
4.8 Discussion of Research Findings
Major factors affecting investment decision making according to the findings of the study
include investment risk, returns, trend in interest rates and investment portfolio which are
the financial concepts this have been illustrated by table 4.4. They are various types of
risks that are taken into consideration in making investment decisions such market risks,
liquidity risks, strategy risks and regulatory risks which have a very great effect on the
decisions as shown in table 4.5. This adds to Benheim (1998) conclusion that if
individuals have insufficient knowledge concerning the retirement savings process, they

39
are unlikely to be able to make optimal retirement savings decisions and that lack of
financial education may result poor investment decision.
Roberts and Henneberry (2007) explore the decision making processes of property
investors. The study covered a broader sample of countries across three European
markets namely France, Germany and U.K. Interviewees in this study constituted those
most likely to engage directly in property investment decision-making. The study
proposes a ten stage normative model. The study finds that the actual decision-making
process is much simpler than the normative model suggested. Both the UK and the
French and German models are found to follow a broadly similar path, with investors
setting a strategy, searching for properties, undertaking an analysis of market conditions
and purchasing properties that fulfill that strategy (Roberts and Henneberry, 2007). The
correlation analysis was done aimed at establishing the nature of the relationship between
Personal investment decision and financial literacy witnessed in the study. A correlation
coefficient of 0.736 was obtained suggesting a strong positive relationship between the
two variables. This indicates that those investors who have financial literacy are most
likely to make viable personal investment decisions.
In regards to the irrational factors, this is the behavioral factors such stereotype,
preferences and external outcomes. There is an insignificant influence of such factors on
investment decision making. Table 46 to table 4.8 shows a small percentage of real estate
investors considering these factors while making investment decisions.

40
This can be further illustrated by simple regression model, where the independent
variable is the financial literacy and the dependent variable is the investment decision.
Using the above findings the study found that financial literacy has a strong positive
relationship on investment decision.
The findings shows that majority of the respondents shows that Financial literacy had a
high mean score of (3.7043) and Standard deviation of (0 .81708), Age of the
respondents (in years) had a mean of 3.5304 and Standard deviation of (0 .67955), 31 –
40 with frequency of 12 representing (10.4%), 41 – 50 with frequency of 30 representing
(26.1%). Over 50 with frequency of 73 representing (63.5%), the findings shows that
those over 50 had a high frequency of 73 representing (63.5%) indicating that advanced
age has high influences over personal investment decision with a mean of (3.4000) and
standard deviation of (0.89089). Gender of the respondents had a mean of (1.2174) and
standard deviation of (41428) respectively. 90 respondents were male representing
(78.3%) while female were 25 representing (21.7%).

41
CHAPTER FIVE
SUMMARY, CONCLUSION AND RECOMMENDATIONS
5.1 Introduction
The purpose of this study was to determine the effects of financial literacy on personal
investment decisions of real estate investors in Nairobi County. Having identified the
problem of study in chapter one, reviewed existing literature and shown gaps of
knowledge in chapter two, chapter three explained the methods that the study used to
collect data and chapter four analyzed the data obtained from the study. This chapter
provides the summary of the findings, the conclusions and recommendations of the study
based on the objective of the study. The chapter finally presents the suggestions for
further studies.
5.2 Summary of Findings
From the study findings, majority of the respondent (92%) were male while 8% were
female, this indicates a gender gap in the real estate industry in Nairobi. The age
composition was well distributed with majority (63%) being over 50 years of age. Most
of the respondents (87%) had reached up to a minimum of diploma education as their
highest level of education and this implies that majority had adequate skills and
knowledge to respond to the questions asked in the study. The data collected showed that
69% of the respondents had been in the real estate industry for more than 10 years, and
21% for 6-10 years and 10% for 1-5 years. This indicated that the respondents had the
required experience in investment to answer the study questions.

42
It was revealed from the study findings that majority of the respondents (72%) had
invested more than 10 million while 28% invested less than 10 million shillings. All the
respondents indicated that they would like their investment to last for more than 10 years.
It was also noted that 58% of the respondents were initially ready to lose up to 15% of
their investment while 42% were ready to lose between 15-30% of their investment.
In terms of motivation to investment, majority of the respondents indicated that their
personal investment decision was greatly motivated by retirement, career change, cash
flow, and tax shelter. 68% of the respondents had some academic financial knowledge
with 62% being members of a financial professional body. 85% of the respondents also
indicated that financial advice from their financial professional body influenced their
decision to invest in real estate to a great extent.
5.3 Conclusion
The findings on how financial literacy has an effect on investment decision making by
real estate investors shows that a high percentage of investors considers financial
concepts such as returns, investment risks, investment portfolio management and trends
in interest rates at a great extent. The results indicate that in general real estate investors
need to be financially literate in-order to make investment decisions. Beal and
Delpachitra (2003) argued that having financial literacy skills like risks, investment
portfolio, returns, diversification of the portfolio enable fund managers to make informed
investment decisions about their money and minimizes the chances of being misled on
financial matters. In addition Rooij et al. (2007) found that financial literacy affects

43
financial decision-making because individuals with low literacy are more likely to rely on
other people as their main source of financial advice and are less likely to make informed
investment decisions.
The findings on how irrational factors which do not depend on financial literacy rather
depend on investor attitude, behavior and characteristics such as stereotype, past
performance and individual talents, portrays a low percentage and therefore has a less
effect on investment decision. Therefore to make effective investment decision, investor
needs to select the right stock among different alternatives at the right time. In order to
choose superior stock, investor has to evaluate alternative investments and specify criteria
to minimize those alternatives and rank the lifted ones (Albadvi et al., 2006). The criteria
or factors that affect investment decision could be categorized to rational or analytical
factors because they have a significant effect on decision making by real estate investors
in Nairobi which implies that financial literacy has a strong positive relationship with
investment decision making.
5.4 Recommendations
The findings of the study show that acceptability and usage of financial literacy in
making decisions is important. Financial decisions are made in all organizations and
individuals. Organisations and individuals should therefore be ready to invest in building
capacity in terms of financial literacy where it is required. This would foster clearly
calculated decisions being made and reduce the number of bad outcomes from investment
decisions.

44
The research would also recommend that investment agencies should partner with other
stakeholders in increasing the amount of information available for use in making clear
investment decisions to investors and simplified financial courses for learning institutions
in all sectors. The researcher also recommends for more regulatory guidelines concerning
financial literacy in key institutions as is the case for accountants and procurement
officers who need certification to actively engage in their professional activities.
5.5 Limitations of the Study
This study was done in selected real estate investors in Nairobi. This location has given
sufficient proof to the study objectives of the research but may not serve all investment
agencies due to different aspects of the investment agencies. Another constraint to the
current study on the effect of financial literacy on investment decisions making was
collecting data as the respondents were scattered in different parts of the town and during
administration the respondents asked for additional time to return the questionnaires.
Many of the underlying assumptions about the effect of financial literacy on investment
decisions making by real estate investors emphasize the nature of investment as dynamic.
The study being based in one region (Nairobi) would not be able to gauge the attitudes of
the entire country towards the study and its influence. Another limiting factor was that
the sample of respondents was limited to a small number because of data collection cost.
The design used was ex-post-facto research design where the researcher has no control
over the independent variables because the effects of financial literacy on investment
decisions have already occurred.

45
5.6 Suggestions for Further Research
The study was limited to real estate investors. The researcher would thus recommend for
further study in the other areas of financial literacy among investors across the board and
look at its relevance to all elements of the economy. Further study in financial literacy
and its effect on key decisions and overall performance would improve literature on the
topic as well as improve the capacity of the organizations.
The study recommends for further study in the impact of inflation rates on investment
decisions and ways to mitigate against sudden losses due to inflation fluctuation. The
study also recommends further study into the effect of non – financial factors on the
process of making investment decisions.
There should also be a study to identify the individual investors and the necessary steps
that can be undertaken by incoming investors to manage the challenges identified. The
researcher also recommends study of other variable to be compared with the findings of
this study.

46
REFERENCES
Agaba, V., Muvumba, J., Opio, H.B., Besigiroha, M. & Mirembe, T.G. (2008). Global
Financial Crisis Hits Construction Hard, Estates and Homes. The Crunch, 2:12-
16.
Ayieko, F. (2004). Boom in Apartment Blocks Transforming Nairobi Suburbs. The East
African, 14-15.
Baker, H.K. & Nofsinger, J.R. (2010). Behavioral Finance: Investors, Corporations and
Markets. New Jersey: John Wiley and Sons.
Baker, H.K., Hargrove, M.B. & Haslem, J.A. (1997). An Empirical Analysis of the Risk
Return Preferences of Individual Investors. Journal of Financial and
Quantitative Analysis, 12(3), 377-389.
Barber, B.M. & Odean, T. (1999). The Courage of Misguided Convictions. Financial
Analysts Journal, 55(6), 41-55. CFA Institute.
Bernheim, B.D. & Garrett, D. M., (2003). The Effects of Financial Education in the
Workplace: Evidence of a Survey of Households. Journal of Public Economics,
87, (2003), 1487-1519.
Bernheim, B.D. (1997). Rethinking Saving Incentives. In Auerbaach, A.J. (Eds.), Fiscal
Policy: Lessons from Economic Research. MIT Press, Cambridge, pp. 259-311.
Bodie, Z. Kane, A. & Marcus, A.J. (2007). Essentials of Investments (6th ed.). New
York: McGraw-Hill, International Edition.
Calvet, K., Laurent E., John, Y.C. & Paolo S. (2009). Measuring the Financial
Sophistication of Households. American Economic Review, 99(2), 393-398.

47
Case, K.E. & Shiller, R.J. (1990). Forecasting Prices and Excess Returns in the Housing
Market. Journal of the American Real Estate & Urban Economics Association,
18 (3), 253-273.
Chen, H. &. Volpe, K. (1998). An Analysis of Personal Financial Literacy among
College Students. Financial Services Review, 28-107.
Chong, T.P. & Lal, M.M. (2011). An Empirical Evidence of Factors in Equity Selection
Process In Malaysia. African Journal of Business Management, 5 (15), 6221-
6232.
Cooper, D.R. & Schindler, P.S. (2003). Business Research Methods (8th ed). McGraw-
Hill: New York.
Daniel, K.H. (2002). Investor Psychology in Capital Markets: Evidence and Policy
Implications. Journal of Monetary Economics, 15, 139-209.
De Bondt, W.F. (2008). Behavioural Economics: A Portrait of the Individual Investor.
European Economic Review, 42, 831-844.
Dhar, R. & Zhu, N. (2006). Up Close and Personal: Investor Sophistication and the
Disposition Effect. Management Sci. 52(5): 726-740.
Dimitrios, I.M. (2007). Investors' Behaviour in the Athens Stock Exchange (ASE).
Journal of Accountancy, 120; 67-72.
Doran, J.S., Peterson, D.R. & Wright, C. (2010). Confidence, Opinions of Market
Efficiency, and Investment Behavior of Finance Professors. Journal of Financial
Markets 13(1): 174-195.
Easley, D., Hrickjaer, S. & O'Hara, M. (2010). Factoring Information Into Returns.
Journal of Finance, 45, 293 -309.

48
Gathergood, J. (2012). Self-Control, Financial Literacy and Consumer over-Indebtedness.
Journal of Economic Psychology, 33(3): 590-602.
Gentry, B. & Fernandez, L.O. (2008). Valuing the Environment: How Fortune 500 CFOs
& Analysts Measure Corporate Performance. USA, Yale: Yale School of
Forestry and Environmental Studies, Research Program of Private Finance and
Environment.
Guiso, L. & Jappelli, T. (2008). Financial Literacy and Portfolio Diversification. Working
Paper.
Hibbert, A.M, Lawrence E.R. & Prakash, A.J. (2012). Do Finance Professors Invest Like
Everyone Else? Financial Analysts Journal 68(5), 95-105.
Hilgert, M.A, Hogarth, J.M, & Beverly, S.G. (2003). Household Financial Management:
The Connection between Knowledge and Behavior. Fed. Res. Bull. 89, 309-322.
Hodge, F.D. (2000). Investors‟ Perceptions of Earnings Quality, Auditor Independence,
and the Usefulness of Audited Financial Information, Accounting Horizons, 17,
16-24.
Hughes, A. (2008). Head Space: Understanding Investor Psychology can help you steer
your Clients Toward Good Investing Decisions in Bad Markets. Bank Investment
Consultant, 16 (1), 28 - 35.
Hussein, A.H. (2007). Factors Influencing Individual Investor Behaviour in the UAE
Financial Markets. Journal of Business, 92(2), 24-26.
Iyer, S.B. & Bhaskar, R.K. (2002). Investor‟s Psychology: A Study of Investor Behavior
in the Indian Capital Market. Finance India, 15, 23-31.

49
Jagongo, A. & Mutswenje, V.S. (2014). Factors Influencing Investment Decisions at the
Nairobi Stock Exchange. International Journal of Humanities and Social
Science, 4(4), 11-14.
Jordan, B.D. & Miller, T.W. Jr. (2008). Fundamentals of Investments Valuation and
Management (4th ed.). New York: McGraw-Hill/Irwin.
Kabukuru, W. (2012). Kenya Property Values among the Best in the World. Africa
Business, 15, 139-209.
Kahneman, D. & Tversky, A. (1979). Prospect Theory: An Analysis of Decision Under
Risk. Econometrica, 47(2), 263-291.
Kamau, L.W. (2011). The Factors Affecting Investment in Real Estate: A Case Study of
Nairobi. A Research Thesis, Moi University.
Kariuki, K. J. (2013). Factors Affecting Returns of Real Estate Investments in Nairobi in
Buruburu. Kenya School of Monetary Studies.
Kent, D.D., David, A.H. & Subrahmanyam A., (1997). A Theory of Overconfidence, Self-
Attribution, and Security Market under- and Over-reactions. University of
California, Los Angeles (UCLA) - Finance Area; Centre for International
Finance and Regulation (CIFR).
Kenya Telephone Directory, (2013). Nairobi Edition, Kenya Postal Directories Ltd.
Nairobi. www.yellowpageskenya.com
Kiplangat, A.P., Bitok, J.L., Tenai, J. & Rono, L. (2010). Determinants of Investor
Confidence for Firms Listed In Nairobi Stock Exchange. Eldoret: Unpublished
Moi University.

50
Lobes, M. (1987). An Analysis of Investor‟s Risk Perception towards Mutual Funds
Services. International Journal of Business and Management. 4, 56-67.
Lusardi, A. & Olivia, S.M. (2007). Baby Boomer Retirement Security: The Roles of
Planning, Financial Literacy, and Housing Wealth. Journal of Monetary
Economics, 54(1), 205–224.
Mahmood, H.A. (2011). Behavioural Implications of Investors for Investments in the
Stock Market. European Journal of Social Science, 20, 23-34.
Mandell, S.T. & Lewis, H. (2006). Does Just in Time Instruction Improve Financial
Literacy?” Credit Union Magazine, Savingteen Supplement, 72 (1), 7-9.
Merika, A.A. (2008). Economic Factors and Individual Investor Behaviour. Journal of
Applied Business, 20 (4), 93 - 98.
Monticone, R. & Chiara, M., (2010). How Much Does Wealth Matter in the Acquisition
of Financial Literacy. Journal of Consumer Affairs, 44, 403-422.
Mugenda, A. & Mugenda, O. (2003). Readings in Research Methods: Quantitative and
Qualitative Approaches. African Centre for Technology Studies: Nairobi, Kenya.
Müller S. & Weber, M. (2010). Financial Literacy and Mutual Fund Investments: Who
Buys Actively Managed Funds? Schmalenbach Business Review 62(2), 126-153.
Nabutola, W. (2004). Affordable Housing: Some Experiences from Kenya. FIG Working
Week: Athens, Greece.
Natalie, C.N. (2010). Framework for Assessing Financial Literacy and Superannuation
Investment Choice Decisions. Australasian Accounting Business and Finance
Journal. 5 (2), 23-27.

51
Neville, M.N. & Sidney, R.K. (2004). Simple Random Sampling Techniques. New York:
Academic Press.
Nye, K., Pete, W. & Cinnamon H. (2013). Personal Financial Behavior: The Influence of
Quantitative Literacy and Material Values. Numeracy, 6 (1):23-26.
Obamuyi. T.M. (2013). Factors Influencing Investment Decisions In Capital Market: A
Study of Individual Investors In Nigeria. Organizations and Markets in
Emerging Economies. 4, 1(7).
Obudho, R.A. (2007). Nairobi: National Capital and Regional Hub, in The Urban
Challenge In Africa. Growth and management of Its Large Cities edited by
Carole Rakodi. United Nations University Press.
Orodho, A.J. (2003). Essentials of Educational and Social Science Research Methods.
Nairobi: Mazola Publishers.
Roberts, C. & Henneberry, J. (2007). Exploring office investment decision-making in
different European contexts. Journal of Property Investment and Finance, 25(3),
289-305.
Rooij, V., Maarten, D. Lusardi, A. & Alessie R. (2009), Financial Literacy and
Retirement Planning in the Netherlands, DNB Working Papers 231.
Schulz, R. & Werwatz, A. (2004). A state space model for Berlin house prices:
estimation and economic interpretation. Journal of Real Estate Finance and
Economics, 28, 37-57.
Shefrin, H. & Statman, M. (1985). The disposition To Sell Winners Too Early and Ride
Losers Too Long: Theory and Evidence. The Journal of Finance, 40(3), 777-790.

52
Shiv, B. (2008). Investment Behaviour and the Negative Side of Emotion. America
psychological society, 16, 435-439.
Shyan-Rong, C.L. (2010). Investor Attitudes and Behaviour towards Inherent Risk and
Potential Return in Financial Products. International Research Journal of
Finance and Economics (44), 16-29.
Thaler, R.H. (1985). Mental accounting and consumer choice. Marketing Science, 4, 199-
214
Totok, S., Inanga, E.L. & Sembel, R. (2007). A Survey of Investors Current Perceptions
and Valuation Approaches at Jarkata Stock Exchange. Investment Journal of
Finance & Economics, 10, 176-206.
Tun-Pin Chong, M. (2011). An Empirical Evidence of Factors in Equity Selection
Process in Malaysia. African Journal of Business Management, (34) 6221-6232.
Van Rooij, M.J., Lusardi, A. & Alessie R.M. (2011). Financial Literacy and Stock
Market Participation. Journal of Financial Economics 101(2): 449-472.
Von Gaudecker, H. M. (2011). How Does Household Portfolio Diversification Vary with
Financial Literacy and Financial Advice? Working Paper.
Warner, N.D. (1968). A Tutorial Introduction to Decision Theory. IEEE Transactions on
Systems Science and Cybernetics, 4,(3)12-24.
Weber, M., & Camerer, C. F. (1998). The Disposition Effect in Securities Trading: An
Experimental Analysis. Journal of Economic Behavior & Organization, 33, 167-
184.

53
APPENDICES
APPENDIX I: LETTER OF INTRODUCTION
Kevin Mmbaya Musundi,
University of Nairobi,
School of Business,
P.O Box 30197,
Nairobi.
Dear Sir/Madam,
I am a Masters student at the University of Nairobi, School of Business. In partial
fulfillment of the requirement for Master of Science Finance, I am conducting a survey
on the effects of financial literacy on personal investment decision of the real estate
investors in Nairobi County.
I am glad to inform you that you have been selected to form part of the study. I would
therefore kindly request you for assistance in completing the attached questionnaire
which forms a major input of the research process. The information and data will strictly
be used for academic purposes only and strict confidence shall be observed on the same.
You cooperation will go a long way in ensuring the success of this project.
I would like to thank you in advance for your time and consideration.
Yours Sincerely,
Kevin Mmbaya Musundi,
University of Nairobi.

54
APPENDIX II: QUESTIONNAIRE
Instructions: Kindly take a few minutes to respond to this questionnaire.
Information supplied is purely for academic research purposes and will be treated
with utmost confidentiality.
PART I: Background Information
1) What is your gender? (tick one)
Male [ ] Female [ ]
2) Please indicate your age in years _____________________
3) What is your highest level of education?
No formal education [ ] Primary level [ ]
Secondary level [ ] Diploma [ ]
Undergraduate [ ] Post Graduate [ ]
4) How long have you been in real estate industry? ____________________
PART II: Personal Investment Decision Making
5) Generally, how much money have you invested in real estate?
Less than 5 million [ ] 5-10 million [ ]
11- 15 million [ ] 16- 20 million [ ]
21-30 million [ ] 31-50 million [ ]
Above 50 million [ ]

55
6) What duration would you like your investment to last?
Less than a year [ ] 1-5 years [ ]
6-10 years [ ] More than 10 years [ ]
7. What level of your initial investment were you ready to lose?
Between 5 & 10% [ ] Between 11 &15% [ ]
Between 16 & 20% [ ] Between 21 & 25% [ ]
Between 26 & 30% [ ] Above 30% [ ]
8). To what extent are the following key motivators for investing in real estate
considered when making decision real estate investment? 1. Not at all, 2.small
extent, 3. Moderate extent, 4. Great extent, 5, very great
extent
Key motivators for investing 1 2 3 4 5
Retirement
Cash flow
Life style change
Tax shelter
Career change

56
Part III Financial literacy factors on investment decisions
10. (a) Do you have any financial academic knowledge?
Yes [ ] No [ ]
(b) If „Yes‟ in above question, kindly indicate to what level is your financial
academic knowledge?
Certificate level [ ] Diploma level [ ]
Undergraduate level [ ] Post Graduate level [ ]
11. (a) Are you a member of any financial professional body?
Yes [ ] No [ ]
(b) Do you get any advice concerning real estate investment from your financial
professional body?
Yes [ ] No [ ]
(c) To what extent did that advice influence your decision to invest in real estate?
Not at all [ ] Small extent [ ] Moderate extent [ ]
Great extent [ ] Very great extent [ ]

57
12. To what extend do you consider the following factors when making decision
on investment of funds? 1. Not at all, 2.small extent, 3. Moderate extent, 4, Great
extent, 5, very great extent
1 2 3 4 5
Returns
Investments risks
Trends in interest rates
Investment portfolio
13. To what extent do you consider the following areas of risks when making
investment decisions? 1. Not at all, 2.small extent, 3. Moderate extent, 4. Great
extent, 5, very great extent
Risk 1 2 3 4 5
Market risks
Liquidity risks
Valuation risks
Operational risks
Regulatory risk
Strategy risk
14) To what extent do you ascribe any good outcomes to your own talents?
Not at all [ ] Small extent [ ] Moderate extent [ ]
Great extent [ ] Very great extent [ ]

58
15) To what extent do you blame bad outcomes on external outcomes?
Not at all [ ] Small extent [ ] Moderate extent [ ]
Great extent [ ] Very great extent [ ]
16) To what extent do you tend to make decisions based on stereotypes formed
from experience?
Not at all [ ] Small extent [ ] Moderate extent [ ]
Great extent [ ] Very great extent [ ]
Thank you for your participation

59
APPENDIX III: DEMOGRAPHIC DATA
Gender of the respondents
Frequency Percent Valid Percent Cumulative
Percent
Valid
Male 90 78.3 78.3 78.3
Female 25 21.7 21.7 100.0
Total 115 100.0 100.0
Age of the respondents (in years)
Frequency Percent Valid Percent Cumulative
Percent
Valid
31 – 40 12 10.4 10.4 10.4
41 – 50 30 26.1 26.1 36.5
Over 50 73 63.5 63.5 100.0
Total 115 100.0 100.0

60
Financial literacy
Frequency Percent Valid Percent Cumulative
Percent
Valid
1.20 3 2.6 2.6 2.6
1.80 6 5.2 5.2 7.8
2.80 3 2.6 2.6 10.4
3.00 9 7.8 7.8 18.3
3.20 12 10.4 10.4 28.7
3.40 6 5.2 5.2 33.9
3.60 8 7.0 7.0 40.9
3.80 3 2.6 2.6 43.5
4.00 24 20.9 20.9 64.3
4.20 12 10.4 10.4 74.8
4.40 19 16.5 16.5 91.3
4.60 7 6.1 6.1 97.4
5.00 3 2.6 2.6 100.0
Total 115 100.0 100.0

61
Personal Investment Decision
Frequency Percent Valid Percent Cumulative
Percent
Valid
1.00 4 3.5 3.5 3.5
2.00 4 3.5 3.5 7.0
2.20 8 7.0 7.0 13.9
2.40 4 3.5 3.5 17.4
2.60 8 7.0 7.0 24.3
3.00 4 3.5 3.5 27.8
3.20 12 10.4 10.4 38.3
3.40 8 7.0 7.0 45.2
3.60 20 17.4 17.4 62.6
3.80 12 10.4 10.4 73.0
4.00 11 9.6 9.6 82.6
4.20 8 7.0 7.0 89.6
4.40 3 2.6 2.6 92.2
5.00 9 7.8 7.8 100.0
Total 115 100.0 100.0
Invest more in real estate
Frequency Percent Valid Percent Cumulative
Percent
Valid Yes 115 100.0 100.0 100.0

62
Age of the respondents (in years)
Frequency Percent Valid Percent Cumulative
Percent
Valid
31 – 40 12 10.4 10.4 10.4
41 – 50 30 26.1 26.1 36.5
Over 50 73 63.5 63.5 100.0
Total 115 100.0 100.0
Extent to make decisions based on stereotypes formed from experience
Frequency Percent Valid Percent Cumulative
Percent
Valid
Small extent 6 5.2 5.2 5.2
Moderate extent 12 10.4 10.4 15.7
Great extent 30 26.1 26.1 41.7
Very great extent 67 58.3 58.3 100.0
Total 115 100.0 100.0