Embed Size (px)
Citation preview
St. John's University St. John's University
St. John's Scholar St. John's Scholar
Theses and Dissertations
2021
EFFECTS OF SCRIPTED AND TEACHER GENERATED LITERACY EFFECTS OF SCRIPTED AND TEACHER GENERATED LITERACY
PROGRAM ON MIDDLE SCHOOL STUDENTS PROGRAM ON MIDDLE SCHOOL STUDENTS
Lindsay Blaszcyk Saint John's University, Jamaica New York
Follow this and additional works at: https://scholar.stjohns.edu/theses_dissertations
Part of the Education Commons
Recommended Citation Recommended Citation Blaszcyk, Lindsay, "EFFECTS OF SCRIPTED AND TEACHER GENERATED LITERACY PROGRAM ON MIDDLE SCHOOL STUDENTS" (2021). Theses and Dissertations. 266. https://scholar.stjohns.edu/theses_dissertations/266
This Dissertation is brought to you for free and open access by St. John's Scholar. It has been accepted for inclusion in Theses and Dissertations by an authorized administrator of St. John's Scholar. For more information, please contact [email protected].
EFFECTS OF SCRIPTED AND TEACHER GENERATED LITERACY
PROGRAM ON MIDDLE SCHOOL STUDENTS
A dissertation submitted in partial fulfillment
of the requirements for the degree of
DOCTOR OF EDUCATION
to the faculty of the
DEPARTMENT OF ADMINISTRATIVE AND INSTRUCTIONAL LEADERSHIP
of
THE SCHOOL OF EDUCATION
at
ST. JOHN'S UNIVERSITY
New York
by
Lindsay M. Blaszcyk
Approved Date: May 19, 2021
___________________________
Submitted Date: March 4, 2021
___________________________
Lindsay M. Blaszcyk Dr. Seokhee Cho

© Copyright by Lindsay M. Blaszcyk 2021
All Rights Reserved
ABSTRACT
EFFECTS OF SCRIPTED AND TEACHER GENERATED LITERACY PROGRAM
ON MIDDLE SCHOOL STUDENTS
Lindsay M. Blaszcyk
Will a teacher generated literacy curriculum be more effective for student literacy
growth more than a scripted literacy curriculum? Archived data of pre- and post-testing
of 535 public middle school students were analyzed to examine the effectiveness of these
two approaches over a two-year time span. The data were gathered using the Benchmark
Assessment System, second edition (BAS-2). Data were analyzed using an ANCOVA to
determine the significance of difference in students’ literacy growth by two literacy
programs. A series of ANOVAs were used to see any significant differences in literacy
growth between groups based on students’ characteristics. Regression analysis was used
to determine the interaction effects of students’ posttest and pretest scores based on
student characteristics. In the end, students’ literacy growth increased in both programs,
but with higher gains in the scripted program. Literacy program has a significant effect
on student literacy growth. Student characteristics can influence their growth, with the
expectation of gender and classification. Hispanic/ Latino and African American students
achieved higher growth in a scripted program. These results can steer educational leaders
and policy makers in the right direction concerning literacy curriculum.

ii
DEDICATION
To all the students I have taught, and those I have yet to teach.

iii
ACKNOWLEDGEMENTS
This would not have been possible without Dr. Seokhee Cho. Thank you for your
patience, knowledge and experience.

iv
TABLE OF CONTENTS
DEDICATION…………………………………………………………………...
ACKNOWLEDGEMENTS……………………………………………………...
LIST OF TABLES……………………………………………………………….
LIST OF FIGURES………………………………………………………………
CHAPTER 1: INTRODUCTION…….…………………………...……………..
Purpose of the Study………………………………………………………
Significance of the Study………………………………………………….
Research Questions………………………………………………………..
Definition of Terms………………………………………………………..
CHAPTER 2: REVIEW OF RELATED LITERATURE…………...…………...
Theoretical Framework……………………………………………………
Related Research…………………………………………………………..
Relationship Between Prior Research and Present Study…………………
ii
iii
vi
vii
1
1
2
3
4
6
6
8
34
CHAPTER 3: METHOD...……….………………………...……………………
Research Questions/ Hypotheses………………………………………….
Research Design and Data Analysis……………………………………….
Validity of Research Design………………………………………………
Reliability of Research Design…………………………………………….
Sample and Population…………………………………………………….
Instruments………………………………………………………………...
Intervention………………………………………………………………..
Procedures for Collecting Data……………………………………………
36
36
36
38
39
41
44
51
53
v
CHAPTER 4: RESULTS…..…………………………………………………….
Introduction………………………………………………………………..
Results: Research Question One…………………………………………..
Results: Research Question Two………………………………………….
Results: Research Question Three………………………………………...
56
56
56
58
67
CHAPTER 5: DISCUSSION………..…………………………………………...
Interpretation of Results…………………………………………………...
Relationship Between Results and Prior Research………………………..
Limitations………………………………………………………………...
Implications for Future Research………………………………………….
Implications for Future Practice…………………………………………...
75
75
77
80
80
81
APPENDIX A…………………………………………………………………… 83
REFERENCES…………………………………………………………………... 85
vi
LIST OF TABLES
Table 1 Teacher Demographics………………………………………………….. 41 Table 2 Student Sample for Literacy Services…………………………………... 43 Table 3 Student Population for Literacy Services by School Year……………… 44 Table 4 Fountas and Pinnell Reading Conversion………………………………. 48 Table 5 Word List Starting Point………………………………………………… 50 Table 6 Accuracy Rates………………………………………………………….. 50 Table 7 Comprehension Scale…………………………………………………… 50 Table 8 Overall Reading Score…………………………………………………... 51 Table 9 Mean and Standard Deviation of Reading Level at Pre and Posttest…… 58 Table 10 Significance of Difference between Teacher generated and Scripted
Program in Literacy Growth from Fall to Spring Semesters……………. 58
Table 11 Mean and Standard Deviation of Literacy Growth by Grade…………… 60 Table 12 Post Hoc Analysis of Literacy Growth by Grade……………………...... 60 Table 13 Mean and Standard Deviation of Reading Literacy Growth by
Ethnicity…………………………………………………………………... 62
Table 14 Post Hoc Analysis of Literacy Growth by Ethnicity……………………... 63 Table 15 Mean and Standard Deviation of Literacy Growth by Gender…………… 64 Table 16 Mean and Standard Deviation of Literacy Growth by Classification……. 65 Table 17 Post Hoc Analysis of Literacy Growth by Classification………………… 66 Table 18 Interaction Effects between Program Delivery Type and Ethnicity on
Literacy Growth…………………………………………………………... 68
Table 19 Coefficients: Program and Ethnicity……………………………………... 68 Table 20 Interaction Effects between Program Delivery Type and Gender on
Literacy Growth………………………………………………………….. 70
Table 21 Coefficients: Program and Gender……………………………………….. 70 Table 22 Interaction Effects between Program Delivery Type and Classification
on Literacy Growth………………………………………………………. 72
Table 23 Coefficients: Program and Classification………………………………… 72 Table 24 Descriptive Statistics: Program by Gender, Ethnicity and Classification
Fall to Spring……………………………………………………………... 74
vii
LIST OF FIGURES
Figure 1 Interaction Effects between Program Delivery Type and Ethnicity on Literacy Growth……………………………………………………….
69
Figure 2 Interaction Effects between Program Delivery Type and Gender on Literacy Growth……………………………………………………….
71
Figure 3 Interaction Effects between Program Delivery Type and Classification on Literacy Growth…………………………………….
73
1
CHAPTER 1: INTRODUCTION
Recent reports have suggested that American students’ literacy knowledge ranks
poorly compared to other countries (NAEP, 2017). The United States has experienced a
shift in literacy education with the introduction of the Common Core Standards (2011),
and the newly formed Next Generation Standards (2017). As educators our focus is to
make life-long readers, writers, and learners. Currently, there are trends of scripted
programs being pushed onto educators as if they are the golden standard of teaching
(Margolis & McCabe, 2006). It is vital for educators to understand the best possible
methods for instructing students and bring them up to their proper reading level. Overall,
this topic is important not just to the researcher, but to the educational community.
Purpose of the Study
The purpose of this study was to examine the effects of two types of literacy
curriculum on students’ literacy growth. The researcher determined if a teacher generated
literacy curriculum is more beneficial to increase student literacy growth compared to
that of a scripted literacy curriculum. Prior research in this area mainly focuses on
students in the primary grades (Powell, Cantrell, & Correll, 2017), where this study
focused specifically on secondary level students. In addition, this study connects the
impact of the literacy program to students’ literacy growth. Prior studies have focused on
teacher impact, not student impact (Demko, 2010). Every child should have access to the
best possible literacy curriculum. Reading is a right, not a privilege, and a literate society
is one that will flourish. It is the hope that the results of this research will allow
educational leaders to enact a literacy curriculum that best benefits student literacy
growth.
2
Significance of the Study
The United States Department of Education and the National Institute of Literacy
have recently released a series of eye-opening statistics concerning literacy in the United
States. According to their research, 14% of the American population is considered
illiterate (NAEP, 2017). With that, 21% of adults read below the fifth-grade level (NAEP,
2017). For our high school graduates, 19% of them graduate below a fifth-grade reading
level. Literacy is linked to crime as 85% of children who end up in the juvenile justice
system are considered “functionally illiterate” (NAEP, 2017). Furthermore, 70% of
American inmates in the prison system read below a fourth-grade reading level. Literacy
is not just a national concern, but a global one, “Worldwide, 774 million individuals
cannot read (NCES, 2017). We need to address these literacy concerns.
The research focus determined if a teacher generated literacy curriculum was
more effective than a scripted literacy curriculum. This was measured by determining
students’ literacy growth. It is clear from recent research that literacy levels need to be
increased. Various programs on the national, state, public and private level have appeared
because of national and global literacy rates. Recently, the federal government has called
on states to create a “comprehensive literacy state development program” to address these
needs (U.S. Department of Education, 2020). Past studies concentrated on the qualitative
effects of students and teachers. The research focused on children in primary schooling.
This research will directly connect the impact of the curriculum to the student’s reading
level. The results will inform decisions made for the future of the literacy curriculum and
measuring literacy rates.

3
Literacy is a function of life and is vital to the success of a person. This modern
era of public schooling was created to allow students to become citizens. John Dewey
(2018) preached a school system that would improve our society through making our
pupils into citizens. If a student is successful with their reading skills, they will be able to
succeed in many aspects of life. Education should be an investment. “…[T]he habits,
knowledge and skills that make individuals more productive” (Brimley, Verstegan, &
Garfield, 2016, p. 1) should occur within the educational system. We want our students to
be productive members of society and add to a growing civilization. Reading connects to
all the major content areas. We know that education is a right, and not a privilege (Brown
v. Board of Education of Topeka, Shawnee County, Kansas, et al, 1954), so let us make
sure that we, as educators, give our students the best platforms to be successful and
literate. Education should be viewed as human capital and the great equalizer, students
from all backgrounds should come into the school system and have a chance to be
successful. Horace Mann in 1848 proclaimed, “The most important producer of human
capital in the United States is the public education system” (Brimley et al., 2016, p. 1).
Research Questions
Research Question One: Will there be significant differences between two instructional
delivery modes of literacy programs (teacher generated versus scripted) on student’s
literacy growth during the school year?
Null Hypothesis: There will not be a significant difference between two instructional
delivery modes of the literacy programs (teacher generated versus scripted) on student’s
literacy growth during the school year.
4
Research Question Two: Will there be significant differences in literacy growth between
groups based on students’ characteristics such as gender, ethnicity, classification, and
grade?
Null Hypothesis: There will not be significant differences in literacy growth between
groups based on students’ characteristics such as gender, ethnicity, classification, and
grade.
Research Question Three: Will there be interaction effects between the literacy program’s
instructional delivery mode and students’ background characteristics such as gender,
ethnicity, and classification on student literacy growth?
Null Hypothesis: There will not be significant interaction effects between the literacy
program’s instructional delivery and each of the students’ background characteristics on
student literacy growth.
Definition of Terms
BAS-2: Benchmark Assessment System, second edition is a testing kit used to measure
student reading levels developed by Fountas and Pinnell.
Fall reading level: A student’s reading level measured in the months of September and
October using the BAS-2.
Student literacy growth: The increase in a student’s reading level from the baseline
reading level to the reading level after the experimental period has ended.
Leveled Literacy Intervention (LLI): A reading program developed by literacy specialists
Irene Fountas and Gary Pinnell and published through Heinemann Publishing Company.
According to their website, it is a program designed to provide “intensive, small-group,
supplementary literacy intervention for students who find reading and writing difficult. The goal

5
of LLI is to lift the literacy achievement of students who are not achieving grade-level
expectations in reading”: https://www.fountasandpinnell.com/lli/ (2020).
Scripted literacy curriculum: The literacy curriculum purchased by the district to increase
student literacy growth. In the case of this study, the school district uses Leveled Literacy
Intervention (LLI). The student’s Fall reading level is used a baseline data point. This
allows the teachers to begin at the correct point in the scripted curriculum.
Spring reading level: A student’s reading level measured in the months of May and June
using the BAS-2.
Teacher generated literacy curriculum: The literacy curriculum created by a teacher based
off student needs and baseline assessment data.
Winter reading level: A student’s reading level measured in the months of February and
March using the BAS-2.
6
CHAPTER 2: REVIEW OF RELATED LITERATURE
Theoretical Framework
One major theory which is seen in abundance in this research study is
constructivism. Constructivism focuses on active learning, and away from the notion of a
scripted curriculum. A teacher generated program moves away from such passive
learning and into the realm of critical thinking and creativity. Although it is stated that
“…over the past serval years, constructivism increasingly has been applied to learning
and teaching” (Schunk, 2016, p. 296), one can argue that while this theory has increased
in education, so has the increase in scripted programs. Lev Semenovich Vygotsky (1978)
focuses his theory of sociocultural constructivism as showing the importance of the social
environment in education. Moreover, according to Schunk, “…’school’ is not simply a
word or a physical structure but also an institution that seeks to promote learning and
citizenship” (Schunk, 2016, p. 312).
Vygotsky saw schooling as a way for students to become the person they are
supposed to be. Firstly, he believed that learning is a lifelong process as, “…children's
learning begins long before they attend school” (Vygotsky & Cole, 1981, p. 84). With
that, Vygotsky believed that all learning is connected to prior experiences, calling it the
scaffolding, “Any learning a child encounters in school always has a previous history”
(Vygotsky & Cole, 1981, p. 84). He believed that students learn best through social
interactions and peer collaboration, calling this the zone of proximal development. The
zone of proximal development is
…the distance between the actual developmental level as determined by
independent problem solving and the level of potential development as
7
determined through problem solving under adult guidance or in
collaboration with more capable peers (Vygotsky & Cole, 1981, p. 86).
These foundations are vital to the learning process.
Although many of Vygotsky’s notions were built upon by preceding theorists, his
work is an influence on this research. Vygotsky is noted for saying that learning does not
occur in isolation, and that it “…may play a role in the course of the development or
maturation” (Vygotsky & Cole, 1981, p. 80). We must vary our teaching styles for
students to reach their optimal learning points. With Vygotsky’s notion in mind, the
research will specifically look at students’ starting points, and see how the reading
curriculum effects their zone of proximal development and their ability to move. In other
words, does the scripted or a teacher generated program best meet the child where it is
supposed to and benefit their literacy growth?
Curriculum is a vital part of the educational system. Curriculum, concerning
scripted programs, has dramatically changed in traditional public schools, specifically in
secondary schooling (Randell, 2018). Secondary teachers have been used to a sort of
“freedom” to create their own units. They have been trained to teach a topic, using
whichever style or instructional tools best meet the needs of their students. However,
secondary education is currently experiencing the integration of scripted programs
(Randall, 2018). With this, we must ask which one is more effective for students’ literacy
growth?
Based on the theory of constructivism the researcher believes that a teacher
generated reading program will be more effective for student literacy growth. Although
both programs begin at the students’ specific starting put, a teacher generated classroom
8
will be able to vary teaching styles for students to reach their optimal learning points.
Scripted programs do not take students’ learning styles into account. This research is
designed to compare the two reading programs with and without adjustment according to
the students’ needs. In the end, this research design will allow to see whether the theory
really applies and works.
Related Research
Teacher Impact: A Teacher’s Perception of Literacy Scripted Programs
Many teachers often say that their role as a teacher has shifted since the
introduction of scripted programs in the classroom. “A teacher’s role was dramatically
changed from that of an educator to that of a facilitator with the adoption of semi-scripted
curriculums” (Ainsworth, Ortlieb, Cheek, Pate, & Fetters, 2012, p. 77). Ainsworth et al.
(2012) examined various teachers’ perceptions of “teaching a newly adopted semi-
scripted reading curriculum” the researchers observed and interviewed four first grade
elementary school teachers from a large urban district located in a southern state in the
United States (Ainsworth et al., 2012, p. 78). All schools, from the district, participating
in this case study were “chosen by purposive sampling…on the basis of student
diversity” (Ainsworth et al., 2012, p. 80). All the teachers were observed for four weeks,
during their designated 90-minute literacy block. The researchers used Spradley’s
Developmental Research Sequence protocols while observing the teachers. Each of the
teachers was “interviewed a minimum of two times” and all interviews were semi-
structured and were one-on -one (Ainsworth et al., 2012, p. 81). In addition, prior to the
interview, teachers received a questionnaire titled A Teacher’s View of the State-
Mandated Curriculum to answer. The survey “was discussed at a more in-depth level
9
than just ranking responses” during the interviews (Ainsworth et al., 2012, p. 82). The
survey was originally given to 16 first grade teachers, but only four were willing to
remain, and they consented to observations and interviews.
The study was guided by four research questions:
(1) How does reading instruction compare between first-grade teachers
using the state mandated English Language Arts (ELA) curriculum? (2)
To what degree do teachers feel supported (by the principal and via
professional development) in implementing the new state-mandated
curriculum? (3) What resources, if any, do teachers use other than those
listed in the mandated curriculum? (4) How has the state-mandated
curriculum impacted teachers’ planning and instruction? (Ainsworth et al.,
2012, p. 78).
Through qualitative analysis these research questions allowed for the researchers to
organize the data into three major themes. The first is “teachers were minimally
supported in professional development for using the curriculum” (Ainsworth et al., 2012,
p. 77). The teachers often expressed that they did not feel supported with the new
materials and programs put into place by the district. Due to this, the researchers noted, in
the second theme, that teachers “often ventured beyond the scope of the curriculum in
resource usage” because they did not fully understand how to properly implement and
use the materials in the program (Ainsworth et al., 2012, p. 77). Finally, the results
indicate that teachers “planning was eased with the adoption of a semi-scripted
curriculum” (Ainsworth et al., 2012, p. 77). Teachers felt as if they were able to just read
from the manual, even though many admitted they did not fully understand all lessons.
10
The findings of this study are clearly vital to educators, teachers, and administrators alike.
However, a major limitation to the study is the use of only one grade and the small
participants involved.
On the same notion, the article “Colonized Teachers: Examining the
Implementation of a Scripted Reading Program” also discusses teacher perceptions.
Several elementary teachers were observed and interviewed concerning a district wide
mandated literacy program called Open Court in a California school district. The school
district serves over 700,000 students and more than half receive free and/or reduced
lunch. Teachers from the Los Angeles Unified School District (LAUSD) described their
perspectives on scripted reading programs, and how it affects them and their students.
This study takes a qualitative approach to researching the importance of teacher
perspectives when it comes to scripted reading programs. The researchers took field notes
while conducting observations, as well as open-ended questions during the interview
process. In the end, the results indicate that many of the teachers believe “they have a
handle on using the scripted program, [but] they still harbor conflicting feelings”
(MacGillivray, Ardell, Curwen, & Palma, 2004, p. 136). The researchers observed that
the teachers had a “constant awareness of district surveillance” and felt that they had to
speak and act a certain way about the program due to the district mandate to use it
(MacGillivray et al., 2004, p. 136). The researchers also admit that they may have been a
large limitation to the study, but its useful information as it was used as a major finding.
Continuing, the researchers found that the “Teachers have multiple concerns
regarding the district’s mandated reading curriculum; specifically, how it affects their
daily interactions with students and their overall growth as a teacher” (MacGillivray et
11
al., 2004, p. 137). Some of these results are positive, while others are considered
negative. The authors declare that all the negative findings deal with teacher identity. The
first being that “teachers’ professional identities are being redefined” due to the scripted
reading mandate (MacGillivray et al., 2004, p. 137). In other words, teachers feel as if
“the district regards them all similarity” and they do not feel they have individual
characteristics (MacGillivray et al., 2004, p. 137). The second finding shows that teachers
believe that the programs implementation has restricted their professional identities. This
not only effects the teachers, but also the students as teachers feel “Forced to comply with
the district’s pacing of the lessons, teachers are restricted from making instructional
decisions to support the needs of their specific students” (MacGillivray et al., 2004, p.
138). The third negative finding suggested that “teachers’ professional identities are
subsumed” (MacGillivray et al., 2004, p. 139). The teachers just rationalize why the
program is being implemented and accept the lack of academic control in the classroom.
In all, the results declare that “The redefinition of what teachers can teach hinders their
professional growth” (MacGillivray et al., 2004, p. 137).
As for the positive findings the researchers describe them as “rewards” (MacGillivray
et al., 2004, p. 140). Firstly, whether the teachers feel their identity has been shifted or
not, they all feel a sense of group membership. The teachers “gain membership into a
group and enjoy a common bond with other teachers” (MacGillivray et al., 2004, p. 140).
A second realization is that teachers believe if they just accept and follow the program,
they have more control of their classroom and more expertise to share with their students.
This allows them to manage “simple rote tasks” and there is no need to do “active
planning to meet students; individual needs” as the program does it all for the teachers
12
(MacGillivray et al., 2004, p. 140). With that, teachers believe the program offers them a
“sense of security” as they know they are doing their job correctly, as they are simply
following the script. Overall, these findings suggest that “Responsibility for student
learning can be shifted from the teacher to the basal program” the teacher “simply needs
to follow directions correctly” (MacGillivray et al., 2004, p. 140).
Teacher Impact: A Teacher’s Knowledge, Experience and Development as
Professional
A teacher’s perception of a program is heavily influenced by their knowledge and
development as a professional. If teachers do not believe they are receiving proper
support, it hinders their development and leaves them with negative experiences.
Researchers have compared teachers’ “…perceptions of their own knowledge” and
quantify it in order to “...measure participants’ confidence in their responses” (Cohen, et
al, 2017, p. 653). The purpose of this study was to look at the definitions and knowledge
teachers have about literacy base concepts and then compare this information. The study
asked four target questions. Firstly, they wanted to know if there were significant
differences in the definition and knowledge scores of the teachers depending on the grade
taught and whether they were using a scripted literacy program or not. Secondly, the
researchers wanted to see which variables are the most valuable predictors for teacher
knowledge. The third research question asked if there were significant differences in
teachers’ perceptions of knowledge depending on the use or nonuse of a scripted reading
curriculum. The fourth research question connects to the third by asking “How accurate
are the perceptions of knowledge” between teachers who use and those who do not use
scripted literacy programs (Cohen et al., 2017, p. 659). The final research question
13
wanted to measure the differences in the “2013 third-grade reading scores” between the
schools using a scripted program, and those which are not (Cohen et al., 2017, p. 659).
The participants in the study included 114 kindergarten through third grade elementary
teachers from seven different schools. All the schools were in Arizona and varied in
demographics but were equal in state rating.
The researchers administered an untimed paper copy, in a group setting, of The
Survey of Preparedness and Knowledge of Language Structure Related to Teaching
Reading to Struggling Students. The survey was used had both multiple choice and open-
ended questions. Furthermore, “The survey’s knowledge items were divided into two
distinct parts: Definitions and application” (Cohen et al., 2017, p. 653). After the survey,
the “Participants were divided into groups based on their districts’ use or non-use of a
scripted, code-based reading program” (Cohen et al., 2017, p. 653). Out of the 114
teachers, 60 of the teachers taught using a scripted reading program and the remaining 54
did not. In addition, to compare achievement scores the researchers used Arizona’s
Instrument to Measure Standards (AIMS). It should be noted that the reliability and
validity of the AIMS data points, place a large limitation on the study.
The researchers conducted various data analyses using the survey and
achievement data including a multivariate analysis of covariance (MANCOVA), multiple
linear regression, analyses of covariance (ANCOVA), and a four sets of partial
correlation tests. The findings suggest that there is “no significant differences between
groups in definitions or application knowledge” as well as no significant differences in
teachers’ perceptions (Cohen et al., 2017, p. 653). Demographic variables proved to have
a weak non-significant correlation to teachers’ knowledge. In the end, the study suggests
14
that teachers do not have enough knowledge about reading concepts, regardless if they
use or do not use a scripted literacy program. The article states, “The results of this study
suggest that the use of a scripted, code-based reading program does not guarantee
mastery of language structure, phonics, and other code-based concepts” (Cohen et al.,
2017, p. 653). Overall, the results suggest that teacher knowledge and program show no
correlation; however, as the researchers state “teaching experience, coursework, and
professional development” could also interfere with teacher knowledge and may have
skewed the results. In addition, the results may not apply to upper grade students nor
schools outside of the “state rating”.
Sometimes a teacher’s experience teaching a scripted literacy program hinders
their development as a professional. The article “From Scripted Instruction to Teacher
Empowerment: Supporting Literacy Teachers to Make Pedagogical Transitions”
discusses a serious transformation teacher needed to make to move away from a script
and towards professional judgment. This four-year longitudinal study took place in
Florida with the purpose of supporting “the efforts of in-service teachers to make
pedagogical transitions from total reliance on prepackaged commercial programs to
making informed decisions about curriculum and pedagogy autonomously” (Fang &
Lamme, 2004, p. 58). Elementary school teachers from six rural schools in northeast
Florida took place in a professional development project aimed at transforming their
“total reliance on prepackaged commercial curricula to independently making informed
pedagogical decisions that are responsive to children’s needs and interests” (Fang &
Lamme, 2004, p. 58). Teachers were trained in a professional development project
“coordinated by the North East Florida Educational Consortium (NEFEC)” (Fang &
15
Lamme, 2004, p. 59). The trainings focused purely on creating “classrooms where
teachers grow as professionals who design and implement research-based, effective
literacy instruction that produces a positive impact on student learning and achievement”
(Fang & Lamme, 2004, p. 59). The teachers who participated were required to attend an
annual summer institute, agree to regular classroom visitations by the university faculty,
NEFEC staff and fellow teachers. They also were to attend monthly meetings and agree
to an end-of-year showcase/ reflection meeting.
The study began in four elementary schools. All teachers involved were volunteers
and their administrators agreed to create “professional development classrooms’, or
PDCs” (Fang & Lamme, 2004, p. 59). Into the study, two more elementary schools
entered the professional development project. To maintain reliability and validity, each of
the participating classrooms had “a student population comparable to that in other
classrooms in terms of gender, ethnicity, socioeconomic status and scholastic aptitude”
(Fang & Lamme, 2004, p. 59). Furthermore, one-third of the students who participated
were not reading on grade level at the beginning of the project. At the end of the study,
the researchers noted the major themes based on the findings. Firstly, teachers “learned to
trust their own professional wisdom and judgement based on their daily observation and
interaction with students” (Fang & Lamme, 2004, p. 61). Furthermore, they took charge
of planning, goal setting, material selection and specific teaching strategies for each child
in their classroom. With that, teachers also showed an increase in lesson adjustment for
each child. Participating teachers “understood and appreciated that instruction should be
based on documented student needs, rather than on what is specified in scripted manuals”
(Fang & Lamme, 2004, p. 61). Overall teachers gained extreme confidence in their
16
professional abilities, which allowed them to “become empowered professionals” which
truly led them to be more effective teachers (Fang & Lamme, 2004, p. 61).
“Curriculum Materials for Elementary Reading: Shackles and Scaffolds for Four
Beginning Teachers” is another longitudinal research study which puts emphasis on the
danger of scripted programs on teacher’s overall development and experience as a
literacy professional. The purpose of this four-year research study was to see how
elementary school teachers understand the instructional reading materials, and then how
these materials shape the way the teachers teach. The study followed four elementary
school teachers “…during their first 3 years on the job” (Valencia, Place, Martin, &
Grossman, 2006, p. 96). The teachers, who come from “markedly different school
situations” were specifically observed during the instructional reading and writing
portions of the day (Valencia, et al., 2006, p. 93). The teachers were provided with a
variety of reading curriculum materials, “…ranging from scripted reading programs to
supplemental materials without teaching guides” (Valencia, et al., 2006, p. 93). Some
teachers were provided with very restrictive materials and a script, while other teachers
were assigned a variety of reading materials with no guide. The researchers gathered their
data through classroom observation, interviews – both group and individual-, and a
document analysis from classroom and district level materials. Each teacher participant
was observed “…a minimum of 17 times and interviewed each individually on at least 32
occasions” (Valencia, et al., 2006, p. 96). During each observation, the researchers took
field notes and collected curriculum documents used during the observation. The teacher
participants also had a pre-observation and post-observation meetings with the
researchers to discuss the lesson layout.
17
Researchers “drew on data from interview transcriptions, classroom observation
field notes, and review of curriculum materials for each teacher as well as the cross-case
analyses to illuminate themes” (Valencia, et al., 2006, p. 101). During the data analysis
process, the researchers utilized a peer review process as, “At least two researchers
reviewed the data for each teacher, comparing and contrasting emerging categories and
supporting each with multiple data points” (Valencia, et al., 2006, p. 97). The findings
suggest that in the beginning stages of the study, teachers believed it was their job to
create a reading program in their classroom based on the materials given to them. With
that, “these elementary teachers were more concerned with how to address all the
components of a complete reading program” (Valencia, et al., 2006, p. 101). The second
theme showed that all the teachers were concerned that the materials did not meet the
needs of the large range of students in their classroom (ELL and special education
students). The researchers were “struck by how often they expressed concern about
having appropriate material and lessons to meet individual students’ needs” (Valencia, et
al., 2006, p. 101).
Furthermore, the teachers who were provided with the scripted materials were less
likely to assist and adapt their reading instruction to meet student needs. The teachers
who were provided with various reading materials and no teacher guide were more able
to adapt their instruction and meet student needs. In the end the study found that “…the
teachers in this study were deeply influenced by the curriculum materials provided to
them and the curriculum contexts in which they worked” (Valencia, et al., 2006, p. 114).
The scripted program truly shapes teacher development and a teacher’s ability to adapt
their lessons to meet their students’ needs. Connecting to teacher development, comes
18
teacher planning, was a limitation. “The teachers’ lack of preparation for using many of
the materials in their classrooms” was something the researchers did not anticipate. This
lack of knowledge and preparation could have skewed the results against the mandated
program.
The first year of a new program can be the most challenging. The notions of the
importance of literacy, and the vital connection to society are not new. Dixie Massey
(2004) in the article “You Teach!” Beginning Teachers’ Challenges to Teacher
Educators” follows three first year teachers and documents their struggle balancing
scripted literacy programs. Participants were three preservice elementary school teachers.
The researcher selected the participants based on their academic performance in their
undergraduate studies, as well as their student-teaching performance (Massey, 2004, p.
78). In addition, all the participating teachers were Caucasian and had similar
backgrounds, concerning their socio-economic status and family structure. Continuing,
all the teachers were hired in schools with similar demographics and socio-economic
rankings. One teacher taught kindergarten, another second grade and another third grade,
but they all were required to use a scripted literacy program. The teachers were followed
throughout their first and second years of teaching. The researcher used initial and
ongoing interviews, classroom observations, teacher lesson plans, field notes, and various
forms of informal conversations (phone and email) to document the teachers’ progress.
The researcher visited each classroom six times, and only during the designated literacy
time.
This qualitative research study asked two important research questions, the first
being how their instruction was categorized in their beginning years of teaching (Massey,
19
2004, p. 75)? The second question asks if the teachers were using the content and
methods, they learned in their literacy training and applying in their classroom (Massey,
2004, p. 75)? Massey (2004) used informal conversations, classroom observations,
emails, and interviews to document the teachers’ progress. Over time, Massey (2004)
noticed that all three teachers, in different schools and teaching different grades,
developed similar patterns concerning how they approach their scripted literacy
curriculum provided by the district. Massey (2004) described these as phases. All three
teachers, even though teaching different grades and teaching in different schools,
developed similar patterns in their approach to literacy instruction.
The patterns went in phases and the phases repeated themselves. In the first phase
all three teachers relied heavily on the mandated curricula and did not integrate new
ideas. With that, they felt overwhelmed by the structure and amount of materials to learn
and teach. During the second phase each of the teachers went through a period where
they ignored the mandated curricula and created their own lesson plans. This made the
teachers feel less overwhelmed. In the final phase, all the teachers wished to watch the
researcher model literacy instruction as they observed. All the beginning teachers asked
for help. In the end, from the final interviews of all the teachers, each one of them noted
“…the course [and methods] were helpful, if I could use it” (Massey, 2004, p. 93).
Overall, this shows that the scripted literacy program made the teachers feel
overwhelmed and less prepared to teach.
What happens when a teacher believes their opinion does not matter and they feel
forced to do something? Powell, Cantrell and Correll (2017) wanted to know what
teachers’ experiences were during their first year of implementing a scripted literacy
20
program. More specifically, the researchers sought to investigate “…the impact of a
scripted program in an urban, culturally, and linguistically diverse, low socioeconomic
elementary school” (Powell, Chambers Cantrell, & Correll, 2017, p. 94). The study
included 17 elementary school teachers, who taught in grades 3-5. All the teachers
worked in a “high poverty elementary school” and were from the same district (Powell et
al., 2017, p. 95). Furthermore, the researchers used purposive sampling and the teachers
recruited ranged from general education, special education, literacy specialist and English
as a second language (ESL) teachers. The researchers used the phenomenology
methodology as their purpose was to “…clarify the nature of a particular phenomenon”
(Powell et al., 2017, p. 100). The study utilized interviews as the major data collection
form. The interviews were “conducted in pairs or small groups” and the researchers
acted as engaged listeners (Powell et al., 2017, p. 101). The researchers used an interview
guide, but the interviews themselves were unstructured. “Each interview was transcribed,
and the first author transcribed a second time so that teachers’ exact wordings could be
captured” (Powell et al., 2017, p. 101).
From the data analysis of the interviews four themes emerged. The first theme
says that the “program supported teachers’ work with the most struggling students”
(Powell et al., 2017, p. 93). The second theme discussed how teachers felt forced to do
the scripted program and it than had “negative outcomes for students” (Powell et al.,
2017, p. 93). The third theme simply stated that the program, in general, had a negative
impact of teacher’s well-being. The fourth theme spoke about the structure of the school
system and how it made teachers feel that their professional opinion did not matter. In the
end, the findings suggest that teachers believe the program did benefit some students
21
positively, but most of the students negatively. Overall, the teachers “experienced a wide
range of reactions” and felt that they could not meet their students’ “academic and
emotional needs”, which made them feel powerless (Powell et al., 2017, p. 109). The
authors state the use of a phenomenological study could itself be a limitation.
“Phenomenology involves purposive versus random sampling in participant selection,
and therefore data are limited to the experiences of the selected participants” (Powell et
al., 2017, p. 109).
Student Impact: Does a Literacy Program Effect Student Success?
If teachers are impacted, you can guarantee it is also going to impact the students.
Motivation in students is key to success. Howard Margolis and Patrick McCabe (2006)
believe that “scripted programs can help teachers” as “many teachers do not know how to
teach reading, especially to struggling readers” (Margolis & McCabe, 2006, p. 435).
Their article “Motivating Struggling Readers in an Era of Mandated Instructional
Practices” suggests that teachers often complain about literacy programs, however, “the
culprit may not be scripts and programs per se, but the mandate that teachers follow them
submissively, unreflectively, and unresponsively, whether or not the readers benefit”
(Margolis & McCabe, 2006, p. 435). One of the popular complaints’ teachers have
concerning scripted reading programs, relates to student engagement and motivation.
Teachers say that scripted programs do not allow them to teach to what students like,
causing a lack of engagement and motivation. Margolis and McCabe (2006) train
teachers on five principles to incorporate into their scripted reading lessons to address
these concerns. As the two researchers act as trainers, they use field notes and
22
observations to see the progression and reactions of the teachers. Their goal was to see if
there was a change in the teachers’ perceptions.
All the teachers involved with elementary school teachers and varied in teaching
experience. A major validity and reliability concern in the article are the lack of
demographic and sample information provided by the researchers. However, the
researchers detailed the five principles taught to the teachers. They are as follows:
Principle 1—Use materials and assignments that promote successful performance.
Principle 2—Increase expectations of success by ensuring adequate background
and vocabulary. Principle 3—Create value by linking instruction to readers’
interests and goals. Principle 4—Create value by temporarily using extrinsic
reinforcers. Principle 5—Teach struggling readers to make facilitative attributions
(Margolis & McCabe, 2006, p. 437-8).
The researchers say that “By understanding motivation, teachers can help readers”
(Margolis & McCabe, 2006, p. 436). The results indicate that teachers respond positively
when understanding the importance of reflecting on the lessons taught and applying a
variation of the five principles within the reading lessons. For examples teachers learned
how to “use opportunities to support readers before, during, and after lessons” (Margolis
& McCabe, 2006, p. 443). Also, the researchers noticed that teachers focused less on the
mandated part of the program and more on knowing “what interests struggling readers
and hat goals are important to them” (Margolis & McCabe, 2006, p. 445). Overall,
teacher’s perception of the program can change when they focus on the student aspect of
the program and not the script.
23
On the same notion of student impact related to motivation, Applegate and
Applegate (2010) in their article “A Study of Thoughtful Literacy and the Motivation to
Read” wanted to build upon prior studies done in motivation and how it relates to student
reading success. It is known that “engaged and motivated readers have found that they
read more than their less enthusiastic counterparts” (Applegate & Applegate, 2010, p.
226). The researchers wondered if “children who achieved higher scores on a measure of
thoughtful literacy be more motivated to read than their lower scoring counterparts.
(Applegate & Applegate, 2010, p. 226). From there they organized elementary school
students into two groups: “Those who could recall what they read and who demonstrated
the inclination to think deeply about it “and “Those who could recall what they read but
who did not demonstrate the inclination to respond thoughtfully to the text:” (Applegate
& Applegate, 2010, p. 227). The two developed one straightforward research question:
Would “these two groups differ with respect to their overall motivation to read, the value
that they ascribed to reading, and their perceived self-efficacy as readers” (Applegate &
Applegate, 2010, p. 227).
To answer this research question, the researchers had a sample of “443 children (202
males and 241 females) ranging from grade 2 through grade 6” (Applegate & Applegate,
2010, p. 228). All the students went to school in either Pennsylvania, New Jersey, or
Delaware. The students came from 80 different schools, and a variety of different school
structures. “Public school students accounted for 63% of the sample, while parochial
students (26%), private school students (10%), and home-schooled children (1%)
accounted for the remainder” (Applegate & Applegate, 2010, p. 228). The student
demographics were not as diverse with “Eighty-six percent of the children were
24
Caucasian and 14% were members of minority groups.” (Applegate & Applegate, 2010,
p. 228). All the students were receiving literacy instruction using a scripted reading
program.
The participants were given the reading survey Motivation to Read Profile (MRP), a
20-item Likert scale instrument, and the Critical Reading Inventory (CRI). All these
instruments were used to measure reading comprehension, self-efficacy, and student
motivation. Comprehension scores allowed for the researchers to organize students into
two groups, a Red Group, and a Blue Group. “Red Group consisted of children strong in
text-based but weak in higher order comprehension” and the “Blue Group consisted of
children strong in both text-based and higher order comprehension” (Applegate &
Applegate, 2010, p. 228). Both groups scored “independent” for comprehension, but the
Blue Group students also scored independent in thoughtful response, whereas the Red
Group students tested at frustration. Consequently, the results indicate that students with
higher comprehension scored higher on thoughtful responses. “Children with high
inclination to respond thoughtfully to text were significantly more motivated to read than
children who excelled only in text-based comprehension” (Applegate & Applegate, 2010,
p. 229). The scripted program does not affect student motivation to read. One major
limitation is the fact that research has proven that “the motivation to read decreases with
age, even among elementary school children” (Applegate & Applegate, 2010, p. 227).
Those students in the upper elementary grades could have skewed the results.
To Script or Not to Script: Pro Teacher Generated Literacy Classes
Edwards and Chard (2000) compared two classes of students over a four-week
time span. The researchers used a quasi-experimental pretest-posttest comparison design
25
to see the difference between high teacher involvement classroom versus a more scripted
classroom. The participants in the study were 22 students with classified emotional and
behavioral disorders in a community residence treatment program. Each of the classes
would have 11 students, and both classrooms would integrate English language arts and
history curriculum, but one classroom would use a manual approach, while the other used
teacher designed lessons.
The researchers used a rubric based narrative writing prompt which must include
short story elements as their instrument. This rubric was created by the teachers and
based off the Massachusetts Curriculum Framework and statewide ELA and Social
Studies standards. It should be noted that the specific unit was chosen “due to the
teacher’s interest as well as prior plans to teach the unit” (Edwards & Chard, 2000, p.
260). Certain limitations can be raised about the use of this as a valid or reliable
instrument, specifically since the rubrics can be subjective in nature and were not
provided to the readers. Furthermore, the teachers created the rubrics, and it was based
off a unit they showed interest in, therefore enjoyed teaching. During the pretest students
showed little knowledge of story elements and narrative writing skills. However, the
posttest scores show that students who participated in the teacher input integrated
language arts and history unit plan benefitted. The results show successful improvements
in student academic engagement, teacher engagement, and student achievement. The
results indicate that student achievement will increase with high levels of teacher
engagement in the design of the unit plan. “Results from our intervention highlight the
importance of planning instruction that involves high levels of teacher engagement”
(Edwards & Chard, 2000, p. 262).
26
This suggests that student achievement will increase with a curriculum where
teachers are more engaged in the creation. Then why have a scripted literacy program at
all? Rocío Dresser’s article, “The Impact of Scripted Literacy Instruction on Teachers
and Students” connects the impact of a scripted literacy program on both teachers and
students. The article states how many districts are using these scripted programs to
“solve” problems in their district, as well as “close the achievement gap” (Dresser, 2012).
The article also details a history of legislation in which caused many districts to turn
towards such a route. In all, the article names the importance of moving away from such
scripted curricula, as it is time consuming and overwhelming towards teachers, and with
that negatively effects student achievement.
This action research study, aimed to address various concerns teachers had about
the ineffective nature of the scripted reading program they were using. To address this,
“this study examined the impact of blending two well-known teaching methods,
Reciprocal Teaching and Narrow Reading” to benefit student’s literacy progression
(Dresser, 2012, p. 72). The participants in this study were four fourth grade classrooms in
an inner-city elementary school and the four teachers in each participating classroom.
Before the research period began, the teachers were required to attend professional
development on the implementation of Reciprocal Teaching and Narrow Reading
strategies. The researcher and teachers integrated thematic language arts and science unit
for six weeks. During this study students were given three pre-tests and post-tests. The
instruments used for this were a “Qualitative Reading Inventory [QRI], an essay, and a
content area teacher-designed test” (Dresser, 2012, p. 73). Furthermore, “At the
beginning of the study, teachers and students participated in Reciprocal Teaching reading
27
activities” for students to learn the instructional procedures associated with the strategy
(Dresser, 2012, p. 73).
Pretest scores showed most of the students were reading below grade level and
had limited comprehension (Dresser, 2012, p. 73). The students were organized into three
groups based on their decoding and comprehension scores: frustration, instructional, and
independent. Dresser (2012) coded and analyzed the data. In the end, the results showed
that there was improvement in the student’s literacy scores, concerning decoding and
comprehension, in such a short period. For the frustration group of students, “There was a
small improvement among this group of students” (Dresser, 2012, p. 75). There was only
a 5% increase in scores for those students on the instructional level, and for students on
the independent level, they showed an increase of 7% (Dresser, 2012, p. 75). The English
Language Learners (ELL) students showed the most difficulty in reading gains (Dresser,
2012, p. 75). In the end, the teachers commented that they “found these methods to be
valuable and engaging” for the students and wished they could continue to integrate them
into the scripted curriculum (Dresser, 2012, p. 75). The inner-city demographics of the
participants may show limitations, as would the results be able to transfer into a more
rural setting. Furthermore, although the QRI is a proven reliable and valid instrument,
there is always a concern about interpretation of student reading results. Does a scripted
literacy program put too many restrictions on teachers, and learning styles? Perhaps if
teachers were able to incorporate various teaching methods into their literacy lessons,
students would succeed more.
28
To Script or Not to Script: Pro Scripted Literacy Classes
Teachers often wish for a mandated program to disappear, claiming it does not assist
the students’ needs. However, why would scripted programs be created if there was not
some positive research to support their need? Katz and Carlisle (2009) conducted a
feasibility study to determine if a literacy program can effectively increase students’ close
reading skills. The researchers conducted a case study of three students using a
standardized pretest and posttest for comparative analysis for 12 weeks. The participants
in the study titled “Teaching Students with Reading Difficulties to be Close Readers: A
Feasibility Study” were three fourth grade Caucasian girls “…who demonstrated mild-
to-moderate reading and language difficulties” (Katz & Carlisle, 2009, p. 328). The
participants were recruited from a private clinic and were finalized using parent reports
and the Woodcock-Johnson Psychoeducational Battery-Revised (WJPB-R) exam. The
same assessment was used to measure the students’ pretest and posttest scores. This
testing instrument is known as a reliable and validity reading measurement tool.
However, a major limitation to the study would be the use of only three participants and
all of them are females in one grade. One wonders if the results can be generalized.
“The purpose of this exploratory study of CR [close reading] was to evaluate the
potential benefits of a program” (Katz & Carlisle, 2009, p. 327). The program assigned to
the three students incorporated various literacy skills including decoding, comprehension
skills and “…daily reading in which the researchers guided the students’ engagement
with texts” (Katz & Carlisle, 2009, p. 327). To ensure reliability and validity the
researchers wrote down all their planned lessons and allotted a specific time amount for
each lesson. Furthermore, all the lessons were recorded with parental consent. Results
29
were broken down based on assessment subtests. For the reading subtests all the
participants showed “Gains on the passage Comprehension subtest of the WJPB-R were
notable for all 3 girls.” (Katz & Carlisle, 2009, p. 327). In addition, all the girls showed
small to moderate gains in their decoding skills, recognition of sight words, letter-word
identification and word attack skills. As for the language subtests, the girls made
“noteworthy gains on the listening comprehension subtest” as well as “substantial gains
on vocabulary measures (Oral Vocabulary and Picture Vocabulary) (Katz & Carlisle,
2009, p. 325). As the authors note, a limitation to the results of the listening combination
can be attributed to the students’ weaker word attack skills, which may have affected the
results. Overall, “All 3 students showed improved word reading and comprehension with
small to large effect sizes on standardized and experimental measures” (Katz & Carlisle,
2009, p. 325).
Many pre-packaged literacy programs are created to assist with a predetermined
reading disability. In the article “Linking Science-Based Research with a Structured
Literacy Program to Teach Students with Dyslexia to Read: Connections: OG 3D” the
authors discuss the use of a “structured literacy curriculum that systematically teaches the
entire structure of the English language” and how it benefits students with dyslexia
(Klages, Scholtens, Fowler, & Frierson, 2019, p. 49). The program is called
Connections: OG 3D can incorporates the five elements for foundational reading. The
researchers aim to investigate “any student literacy growth over an academic school year”
while using the Connections: OG 3D reading program. (Klages, et al., 2019, p. 50). The
participants in the study consisted of students in kindergarten, first, second, third and
fourth grade from two different elementary schools in the state of Arkansas. Both
30
elementary schools average with more than half of the students considered low-income.
However, one of the schools received a top rating from the state education department,
whereas the other school received a failing mark. The school ratings, and variety of
grades allows for better generalization of results. However, the use of two elementary
schools in the same district does not.
Students participated in this quasi-experimental pretest-posttest designed experiment
for an entire school year. Once the students were identified they were given the treatment
three times a week for 45 minutes each session. The instrument used for the pretest and
posttest measurement is a validated assessment called the Dynamic Indicator of Basic
Early Literacy Skills (DIBELS). This is a district determined instrument. In addition, the
posttests were given “periodically throughout the school year based upon predetermined
school district guidelines” (Klages, et al., 2019, p. 50). Result indicate that “not one
student regresses in learning nor remained stationary in reading development” (Klages, et
al., 2019, p. 56). Furthermore, the researchers say that every student that participated in
the study “earned double digit growth while learning with Connection: OG 3D” (Klages,
et al., 2019, p. 56). The highest improvement in reading gains came from the third-grade
cohort of students. Overall, future research is needed on this literacy program, as it is new
and “it is important on the use of Connection: OG 3D” (Klages, et al., 2019, p. 56).
In the modern era of education, literacy is being taught in various ways. Blended
learning is becoming a popular way for schools to mix the traditional and digital models
of teaching. The article “Elementary School–Wide Implementation of a Blended
Learning Program for Reading Intervention” discusses hybrid learning in depth, and its
effects on literacy instruction. “Blended learning incorporates face-to-face, teacher-led
31
instruction along with digital technology using actionable data to provide students with a
personalized educational path” (Prescott, Bundschuh, Kazakoff, & Macaruso, 2017, p.
497). Blended learning is not a one size fits all. “Blended learning can take various forms,
thus allowing users to adapt a program that best fits their pedagogical goals and physical
setting” (Prescott et al., 2017, p. 497). Prescott et al. (2017) “examined the
implementation of a blended learning program for literacy instruction” in elementary
school students (p. 497). The students ranged in age from kindergarten to fifth grade. 722
students had access to the digital component of the literacy program, but only 641
students were included in the final data analysis due to absences and missing data points.
The school in which the participants attended is considered a Title 1 urban school and is
“part of a district with one of the country’s largest populations of students who are both
ELs and Black” (Prescott et al., 2017, p. 499). “There were a total of 31 classes in the
study” and the classes varied in size and grade (Prescott et al., 2017, p. 499). The school
was purposefully picked due to their student population and the use of a blended reading
program.
The school used the Lexia Reading Core5 (Lexia Learning, Concord, MA) as the
digital aspect of the blended learning curriculum. Students were given a pretest and
posttest to compare scores. “Reading performance was pre- and post-tested with the
Group Reading Assessment and Diagnostic Evaluation (GRADE)” (Prescott et al., 2017,
p. 499). “The GRADE contains developmentally appropriate subtests designed to
measure component reading skills at each grade level” and is considered a standardized
test as “Standard scores reflect a student’s performance relative to a norm sample of
students in the same grade administered the same test at the same time point in the school
32
year” (Prescott et al., 2017, p. 501). For further assurance on reliability and validity the
researchers stated that “The data on student usage indicate that in general the online
component of Core5 was implemented with high fidelity” (Prescott et al., 2017, p. 500).
To see if the participating students showed growth the researchers used “repeated
measures analyses of variance (ANOVAs)” for the GRADE scores (Prescott et al., 2017,
p. 501). Furthermore, “To examine pre- and posttest differences both within and between
groups, post hoc tests were run with Bonferroni corrections” (Prescott et al., 2017, p.
501). In addition, the researchers used multiple regression analysis “to examine how well
the number of levels completed in Core5 predicted growth on the GRADE” (Prescott et
al., 2017, p. 501). The results were broken grade by grade. Kindergarten, first, second,
third and fifth grade students “showed significant growth on the GRADE from pretest to
posttest (Prescott et al., 2017, p. 501-2). Fourth grade students “did not show significant
growth on the GRADE from pretest to posttest” (Prescott et al., 2017, p. 502). Overall,
“Results of this study indicate that a blended learning program can provide a viable
means to enhance reading performance for students attending a Title I elementary
school.” (Prescott et al., 2017, p. 503). With that, there are limitations. The researchers
could have used a comparative model to contrast students in a treatment group versus a
control group. The study could have “included treatment and control classes within the
same school or compared students who used the blended learning program in a treatment
school with students from a similar school within the district who did not use the
program” (Prescott et al., 2017, p. 504).
So, not all students showed progress, but a majority did with a blended scripted
literacy program. There is no doubt that literacy concerns are best addressed in the
33
primary elementary years. “A Randomized Controlled Trial of an Early-Intervention,
Computer-Based Literacy Program to Boost Phonological Skills in 4- to 6-year-Old
Children” discusses the use of an early-intervention reading program. 98 students ranging
from ages 4-6 were participants in a study to evaluate the “effectiveness of the commonly
used the Lexia Reading Core5 intervention” (McIvor, McVeigh, Rushe, & O'Callaghan,
2016, p. 546). All the participants in the study were recruited from England, Wales, and
North America, and were labeled as either being in pre-kindergarten or kindergarten. The
study itself took place in Northern Ireland. The two schools used in the study were
chosen due to their technology access to computers and having already purchased the
rights to the computer-based scripted literacy program. The study was designed as a
parallel-group with a randomized controlled trial (RCT) with a no-treatment, and a wait-
list control group. Every child who participated in the study was “randomized to either
the Experimental group (8 weeks of daily 20- to 30-min sessions of the intervention) or a
wait-list control group (standard classroom teaching)” (McIvor et el., 2016, p. 548).
The scripted program uses the Phonological Assessment Battery 2nd Edition (PhAB-2)
for its measuring instrument. “Children were assessed individually pre-intervention (T0),
post-intervention (T1), and at 2-month follow-up (T2) (intervention group only)”
(McIvor et el., 2016, p. 548). The reliability and validity of the instrument was assured by
the researchers by stating it was a “standardized protocol for both test administration and
scoring, detailed in the test manual” (McIvor et el., 2016, p. 550). To calculate the
findings, the researchers used “Repeated-measures ANOVAs” that allowed them to
measure the effects of the subjects in the intervention groups for all variables. With that
34
“linear regression analysis was used to identify the demographic, procedural and baseline
variables” that could predict student literacy improvements (McIvor et el., 2016, p. 551).
The results of the study show that “Randomization resulted in no significant
difference on age, gender, year group” (McIvor et el., 2016, p. 552). However, the “Lexia
intervention group were better able to blend sounds….and read non-sense words… than
the wait-list control group after the intervention” (McIvor et el., 2016, p. 552). Overall,
the “Lexia Reading Core5 intervention group made significantly greater gains in
blending” and “An early-intervention, computer-based literacy program can be effective
in boosting the phonological skills of 4- to 6-year-olds” (McIvor et el., 2016, p. 546).
With that in mind, as the researchers note, a major limitation to the study is the fact that
two of the participants discontinued their interview due to frustration and four other
students were chronically absent during the treatment.
Relationship Between Prior Research and Present Study
The research articles have discussed the significant impact scripted literacy
programs have on teachers and students. There are mixed reviews on whether scripted
programs are a positive for teachers and students. Some research says a scripted literacy
curriculum is beneficial to staff and students alike, while others say it is not. There is
clearly a direct connection between literacy curriculum and the impact on students and
teachers. Most of the existing literature is conducted in the elementary school setting and
is solely about the points of view of teachers. This research will be conducted in a
secondary setting and will exclusively focus on students.
Overall, this research will examine the effects of two types of literacy curriculum
on students’ literacy growth. The researcher will determine if a teacher generated literacy
35
curriculum is more beneficial to student literacy growth compared to that of a scripted
literacy curriculum. There is a current gap in the existing state of knowledge of the topic
concerning sample setting, participants, and instrument/ program comparisons. As
already stated, many of the studies conducted about scripted literacy programs and
reading achievement take place in an elementary school setting, not a secondary setting.
Many of the studies also take a qualitative direction in research, where this study will be
purely quantitative and focuses just on students’ literacy growth.
The current studies have a lack of comparison of programs. Current research
looks at the effects of one scripted literacy program on either the students or the teachers.
This research will examine a comparison of students’ literacy growth in a scripted
program versus a teacher generated curriculum. Furthermore, the scripted curriculum
being examined is a program called Leveled Literacy Intervention (LLI). This program
has had truly little research, as it is a newer program. Furthermore, the instrument used
for assessment of students’ reading level, called the Benchmark Assessment System,
system 2 (BAS-2) is also a newer reading assessment, and has had little research
conducted on it. These provided reasons and acknowledged gaps assert that the research
topic will address a concern in the educational community and have positive implications
for both educators and students.

36
CHAPTER 3: METHOD
Research Questions/ Hypotheses
Research Question One: Will there be significant differences between two instructional
delivery modes of literacy programs (teacher generated versus scripted) on student’s
literacy growth during the school year?
Null Hypothesis: There will not be a significant difference between two instructional
delivery modes of the literacy programs (teacher generated versus scripted) on student’s
literacy growth during the school year.
Research Question Two: Will there be significant differences in literacy growth between
groups based on students’ characteristics such as gender, ethnicity, classification, and
grade?
Null Hypothesis: There will not be significant differences in literacy growth between
groups based on students’ characteristics such as gender, ethnicity, classification, and
grade.
Research Question Three: Will there be interaction effects between the literacy program’s
instructional delivery mode and students’ background characteristics such as gender,
ethnicity, and classification on student literacy growth?
Null Hypothesis: There will not be significant interaction effects between the literacy
program’s instructional delivery and each of the students’ background characteristics on
student literacy growth.
Research Design and Data Analysis
Research Design. This study utilized quasi-experimental research design.
37
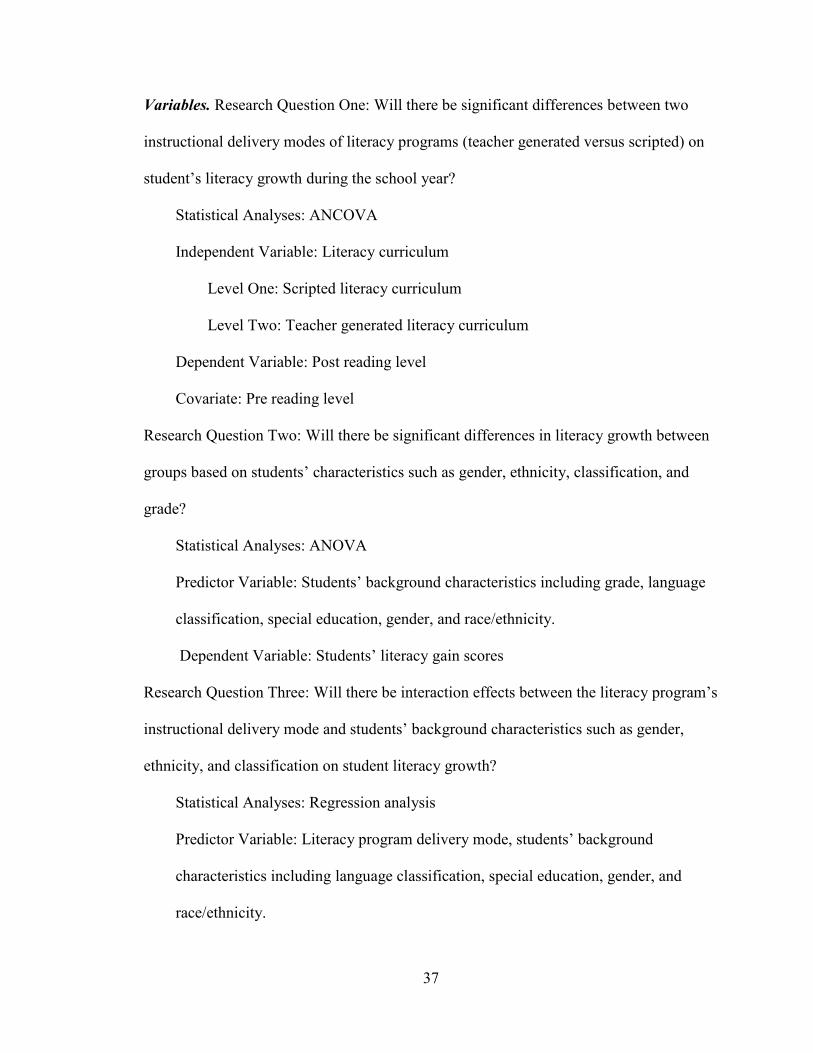
Variables. Research Question One: Will there be significant differences between two
instructional delivery modes of literacy programs (teacher generated versus scripted) on
student’s literacy growth during the school year?
Statistical Analyses: ANCOVA
Independent Variable: Literacy curriculum
Level One: Scripted literacy curriculum
Level Two: Teacher generated literacy curriculum
Dependent Variable: Post reading level
Covariate: Pre reading level
Research Question Two: Will there be significant differences in literacy growth between
groups based on students’ characteristics such as gender, ethnicity, classification, and
grade?
Statistical Analyses: ANOVA
Predictor Variable: Students’ background characteristics including grade, language
classification, special education, gender, and race/ethnicity.
Dependent Variable: Students’ literacy gain scores
Research Question Three: Will there be interaction effects between the literacy program’s
instructional delivery mode and students’ background characteristics such as gender,
ethnicity, and classification on student literacy growth?
Statistical Analyses: Regression analysis
Predictor Variable: Literacy program delivery mode, students’ background
characteristics including language classification, special education, gender, and
race/ethnicity.
38
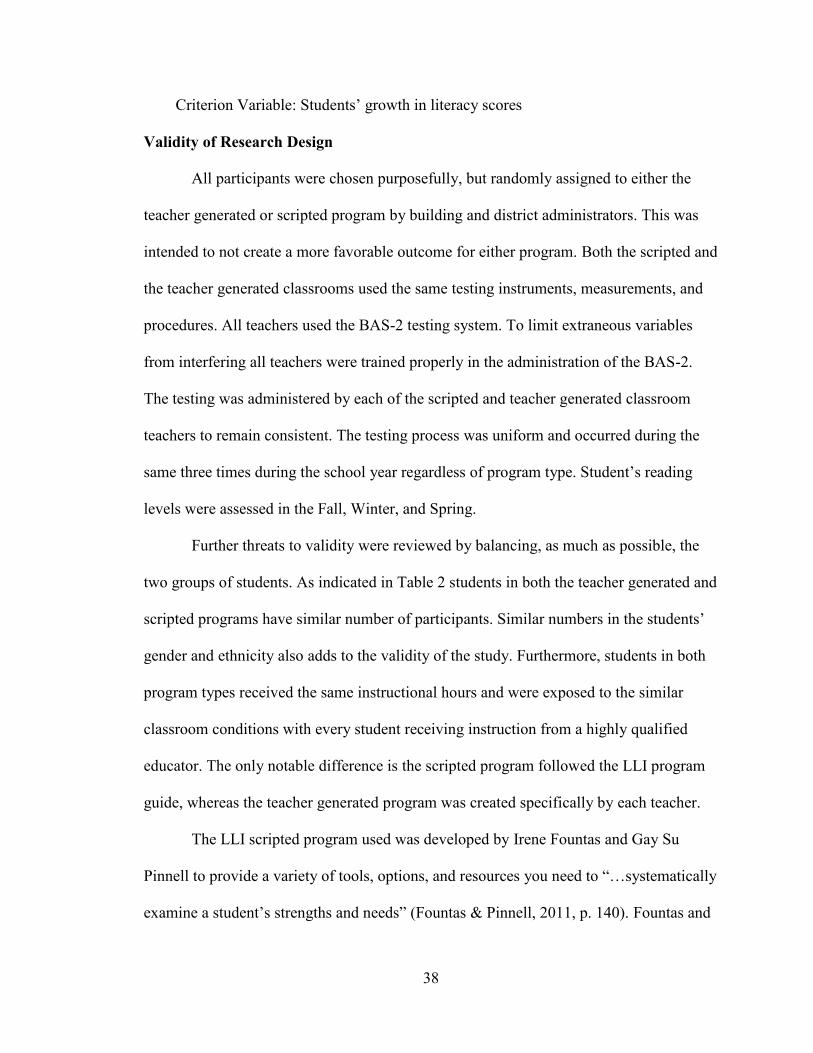
Criterion Variable: Students’ growth in literacy scores
Validity of Research Design
All participants were chosen purposefully, but randomly assigned to either the
teacher generated or scripted program by building and district administrators. This was
intended to not create a more favorable outcome for either program. Both the scripted and
the teacher generated classrooms used the same testing instruments, measurements, and
procedures. All teachers used the BAS-2 testing system. To limit extraneous variables
from interfering all teachers were trained properly in the administration of the BAS-2.
The testing was administered by each of the scripted and teacher generated classroom
teachers to remain consistent. The testing process was uniform and occurred during the
same three times during the school year regardless of program type. Student’s reading
levels were assessed in the Fall, Winter, and Spring.
Further threats to validity were reviewed by balancing, as much as possible, the
two groups of students. As indicated in Table 2 students in both the teacher generated and
scripted programs have similar number of participants. Similar numbers in the students’
gender and ethnicity also adds to the validity of the study. Furthermore, students in both
program types received the same instructional hours and were exposed to the similar
classroom conditions with every student receiving instruction from a highly qualified
educator. The only notable difference is the scripted program followed the LLI program
guide, whereas the teacher generated program was created specifically by each teacher.
The LLI scripted program used was developed by Irene Fountas and Gay Su
Pinnell to provide a variety of tools, options, and resources you need to “…systematically
examine a student’s strengths and needs” (Fountas & Pinnell, 2011, p. 140). Fountas and
39
Pinnell believe that this program is “highly supportive” and “The books are especially
engaging, and the comprehension conversation is warm and supportive” for students and
teachers (Fountas & Pinnell, 2011, p. 140). The quality of the program is highly rated as
it allows for teachers to monitor their student’s progress, assist with what instructional
interventions come next, and allow for teachers to learn more about literacy development.
“Over time, observations made through the assessment, instruction designed to move
students ahead from level to level, and follow-up assessment will deepen your
understanding of literacy development” (Fountas & Pinnell, 2011, p. 140).
Teachers in the teacher generated curriculum group created the curriculum based
on student needs and interests. They used their relationships with students to their
advantage, but bring in materials that the students will find engaging. In addition, all the
teacher generated classrooms used current event articles in their curriculum to
supplement the fiction with non-fiction articles. Just as there is literature and research to
support the use of such programs, there is also those who declare that a teacher generated
program is more beneficial to student literacy growth. The teacher generated program
prides itself on student engagement and teacher freedom to understand their students’
needs. Lee (2013) found that student engagement is important in all content areas of
school, but particularly in reading. In fact, student engagement “significantly predicted
reading performance” in his study (Lee, 2013, p. 179).
Reliability of Research Design
To maintain the reliability of the research, all student participants in the program
were either two or more grade levels below their proper reading level. In addition,
students were organized by grade level and reading level before being assigned into
40
either the treatment or comparison groups. For example, all students in one grade, on a
reading level were homogeneously grouped based on that criterion. Once they were
assigned to the treatment, they received the instruction for the entire school year, for each
of the two years of data collection. Furthermore, every participant in the program
maintained the same instructor throughout the research period. All 8 of the teachers are
New York State certified literacy teachers and had an overall score of either effective or
highly effective on their Annual Professional Performance Review (APPR). Many of the
teachers are dually certified and were placed in either a teacher generated, or scripted
classroom based on their certifications and seniority. Even though all the teachers did not
teach the scripted program, they all have been thoroughly trained in LLI for an entire year
prior to the data collection process. However, once the teacher was assigned to either be a
scripted or teacher generated instructor, they also maintained that status throughout the
data collection process. Teacher demographics can be seen in Table 1.
As for the instruction itself it was necessary to conduct “fidelity checks” to
maintain reliability. Throughout the year, teachers in both the scripted and teacher
generated classroom were asked to do informal “check-ins” with the researcher and
department chair. These check-ins were established to make sure the programs were
being followed and implemented properly. With that, during the specific data point
collection time periods teachers were responsible for testing students using the BAS-2
and getting the data to the department chair by a certain due date.
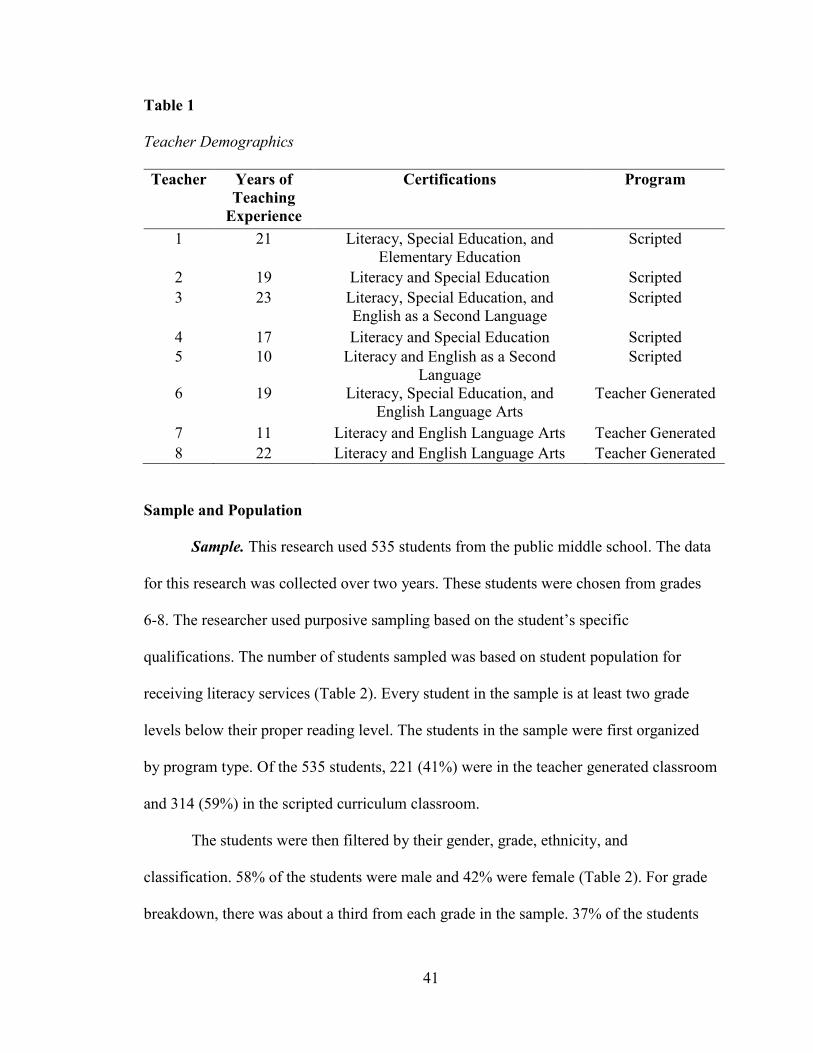
41
Table 1
Teacher Demographics
Teacher Years of Teaching
Experience
Certifications Program
1 21 Literacy, Special Education, and Elementary Education
Scripted
2 19 Literacy and Special Education Scripted 3 23 Literacy, Special Education, and
English as a Second Language Scripted
4 17 Literacy and Special Education Scripted 5 10 Literacy and English as a Second
Language Scripted
6 19 Literacy, Special Education, and English Language Arts
Teacher Generated
7 11 Literacy and English Language Arts Teacher Generated 8 22 Literacy and English Language Arts Teacher Generated
Sample and Population
Sample. This research used 535 students from the public middle school. The data
for this research was collected over two years. These students were chosen from grades
6-8. The researcher used purposive sampling based on the student’s specific
qualifications. The number of students sampled was based on student population for
receiving literacy services (Table 2). Every student in the sample is at least two grade
levels below their proper reading level. The students in the sample were first organized
by program type. Of the 535 students, 221 (41%) were in the teacher generated classroom
and 314 (59%) in the scripted curriculum classroom.
The students were then filtered by their gender, grade, ethnicity, and
classification. 58% of the students were male and 42% were female (Table 2). For grade
breakdown, there was about a third from each grade in the sample. 37% of the students
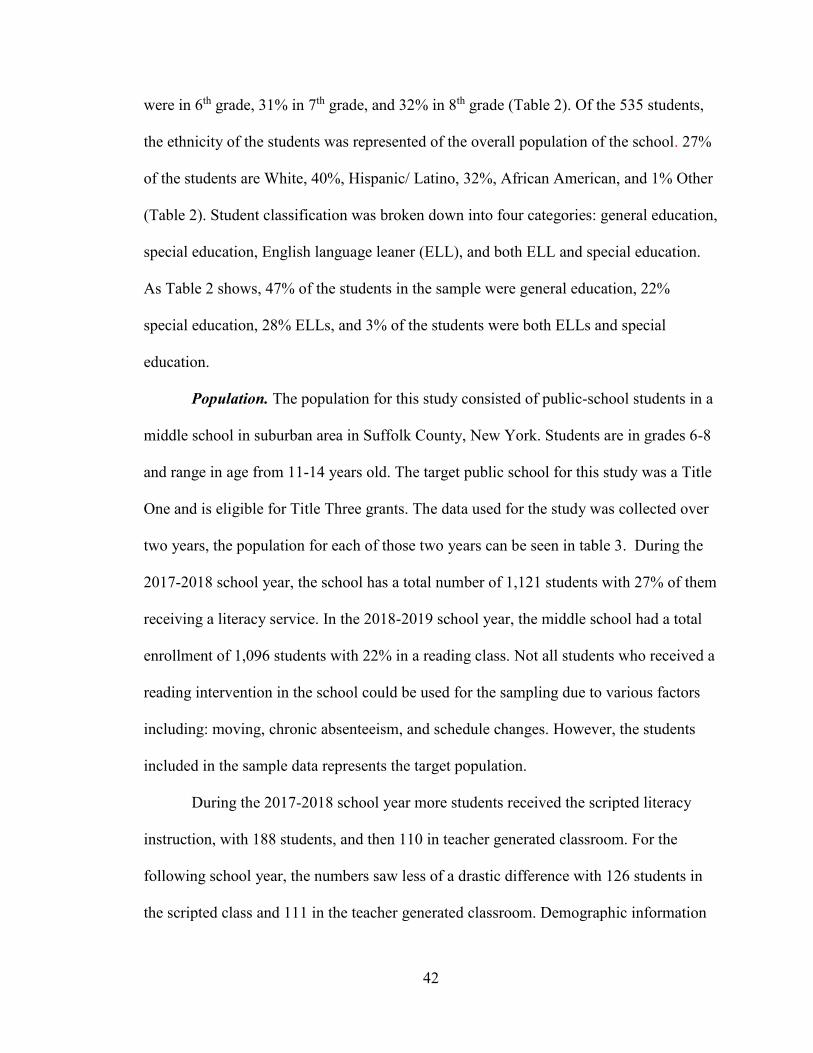
42
were in 6th grade, 31% in 7th grade, and 32% in 8th grade (Table 2). Of the 535 students,
the ethnicity of the students was represented of the overall population of the school. 27%
of the students are White, 40%, Hispanic/ Latino, 32%, African American, and 1% Other
(Table 2). Student classification was broken down into four categories: general education,
special education, English language leaner (ELL), and both ELL and special education.
As Table 2 shows, 47% of the students in the sample were general education, 22%
special education, 28% ELLs, and 3% of the students were both ELLs and special
education.
Population. The population for this study consisted of public-school students in a
middle school in suburban area in Suffolk County, New York. Students are in grades 6-8
and range in age from 11-14 years old. The target public school for this study was a Title
One and is eligible for Title Three grants. The data used for the study was collected over
two years, the population for each of those two years can be seen in table 3. During the
2017-2018 school year, the school has a total number of 1,121 students with 27% of them
receiving a literacy service. In the 2018-2019 school year, the middle school had a total
enrollment of 1,096 students with 22% in a reading class. Not all students who received a
reading intervention in the school could be used for the sampling due to various factors
including: moving, chronic absenteeism, and schedule changes. However, the students
included in the sample data represents the target population.
During the 2017-2018 school year more students received the scripted literacy
instruction, with 188 students, and then 110 in teacher generated classroom. For the
following school year, the numbers saw less of a drastic difference with 126 students in
the scripted class and 111 in the teacher generated classroom. Demographic information
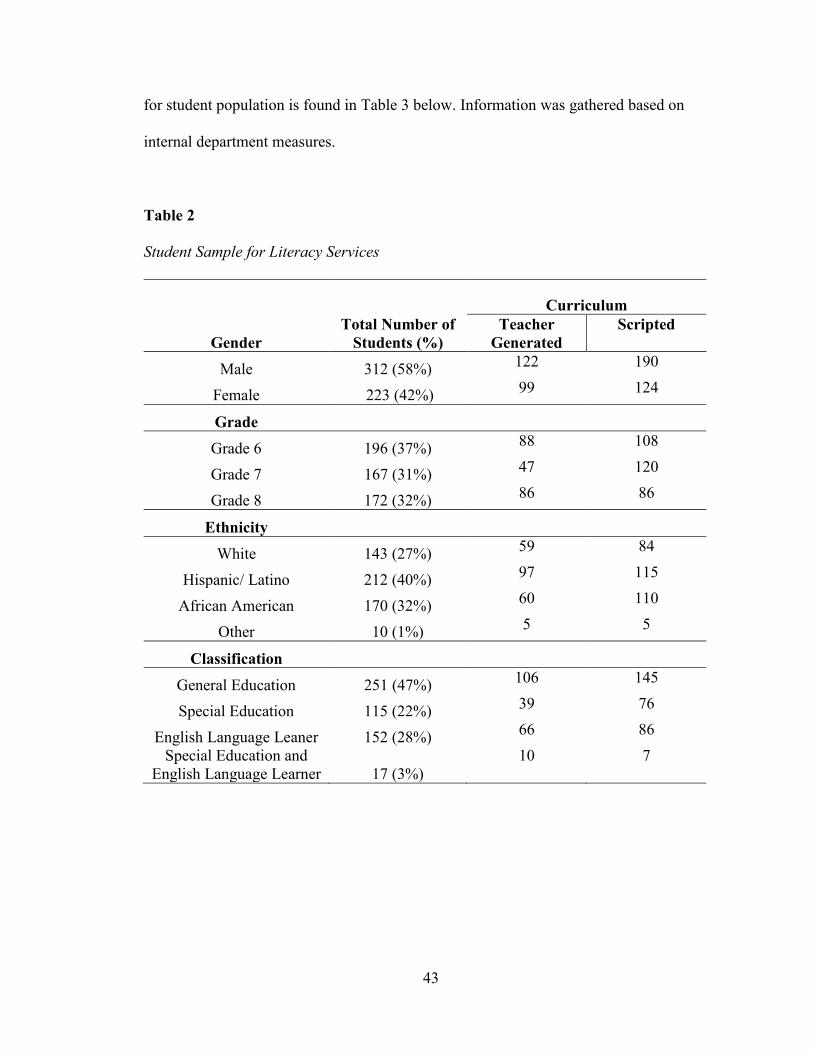
43
for student population is found in Table 3 below. Information was gathered based on
internal department measures.
Table 2
Student Sample for Literacy Services
Gender Total Number of
Students (%)
Curriculum Teacher
Generated Scripted
Male 312 (58%) 122 190
Female 223 (42%) 99 124
Grade
Grade 6 196 (37%) 88 108
Grade 7 167 (31%) 47 120
Grade 8 172 (32%) 86 86
Ethnicity
White 143 (27%) 59 84
Hispanic/ Latino 212 (40%) 97 115
African American 170 (32%) 60 110
Other 10 (1%) 5 5
Classification
General Education 251 (47%) 106 145
Special Education 115 (22%) 39 76
English Language Leaner 152 (28%) 66 86 Special Education and
English Language Learner 17 (3%) 10 7
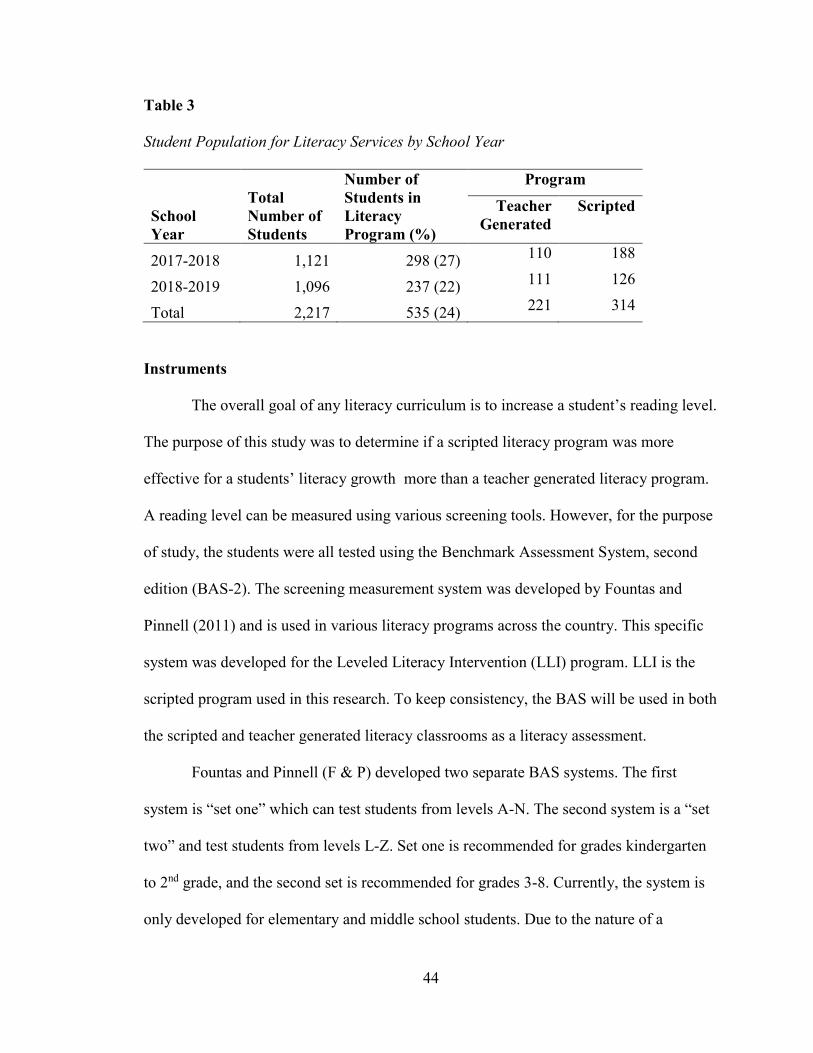
44
Table 3
Student Population for Literacy Services by School Year
School Year
Total Number of Students
Number of Students in Literacy Program (%)
Program
Teacher Generated
Scripted
2017-2018 1,121 298 (27) 110 188
2018-2019 1,096 237 (22) 111 126
Total 2,217 535 (24) 221 314
Instruments
The overall goal of any literacy curriculum is to increase a student’s reading level.
The purpose of this study was to determine if a scripted literacy program was more
effective for a students’ literacy growth more than a teacher generated literacy program.
A reading level can be measured using various screening tools. However, for the purpose
of study, the students were all tested using the Benchmark Assessment System, second
edition (BAS-2). The screening measurement system was developed by Fountas and
Pinnell (2011) and is used in various literacy programs across the country. This specific
system was developed for the Leveled Literacy Intervention (LLI) program. LLI is the
scripted program used in this research. To keep consistency, the BAS will be used in both
the scripted and teacher generated literacy classrooms as a literacy assessment.
Fountas and Pinnell (F & P) developed two separate BAS systems. The first
system is “set one” which can test students from levels A-N. The second system is a “set
two” and test students from levels L-Z. Set one is recommended for grades kindergarten
to 2nd grade, and the second set is recommended for grades 3-8. Currently, the system is
only developed for elementary and middle school students. Due to the nature of a
45
student’s pretest, posttest 1 and posttest 2 reading measurements, to determine a student’s
reading starting point measurement, the literacy professionals may need to utilize both set
one and set two of the BAS, from here on out referred to as BAS-1 and BAS-2.
Concerning the validity and reliability of this assessment, the assessment manual
describes:
You cannot get closer to authentic assessment than with this assessment. A
student reads several books, thinks, and talks about them, and writes about
reading. This is not only a valid assessment of the competencies you want
to measure but is a productive use of teacher and student time (Fountas &
Pinnell, p. 140).
Furthermore, the Fountas & Pinnell Benchmark Assessment System underwent a
“A formative evaluation” in order to ensure that “(1) the leveling of the texts is reliable
and (2) the reading scores are valid and accurately identify each student’s reading level.”
(Pearson, 2011). According to the Executive Summary published by Pearson:
Field testing was conducted with 498 students enrolled in a
socioeconomically and ethnically diverse group of 22 schools from five
geographic regions across the U.S. Determinations of each school’s
socioeconomic status were made using federal guidelines for categorizing
low-, middle-, and high-SES schools (Pearson, 2011).
With that, “Results from the field testing indicated that the fiction and nonfiction books
in the Fountas & Pinnell Benchmark Assessment System progressed in difficulty as the
levels increased from Levels A-Z” (Pearson, 2011). This shows the effectiveness of the
testing tool. “The field testing also confirmed that students’ developmental reading levels
46
are similar for fiction and nonfiction texts at each level…76% of the students read the
fiction and nonfiction books at similar reading levels within one level of text difficulty”
(Pearson, 2011).
In specific terms of its reliability, it is a standardized assessment. In other words,
the administration, coding, scoring, and interpretation are standardized in procedures to
get reliable results” (Fountas & Pinnell, 2011 p. 140). The BAS system underwent a
series of reliability measures.
To measure the test-retest reliability of Fountas & Pinnell Benchmark
Assessment System, the students’ reading scores on the fiction series were
correlated with their scores on the nonfiction series. In general, test-retest
results should exhibit a reliability coefficient of at least .85 for an
assessment’s information to be considered stable, consistent, and
dependable.” (Pearson, 2011).
As the test-retest results depict, the system passes the reliability test as Book Series A-N
had a score of .93, Book Series L-Z had a score of .94, and overall, all Books (A-Z) had
a rating of .97 (Pearson, 2011).
The validity of the instrument is also discussed in the executive summary. “There
was a strong relationship between the reading accuracy rates of Fountas & Pinnell
Benchmark System 1 fiction and nonfiction books (Book Levels A-N)” (Pearson, 2011).
The researchers compare the accuracy rates to similar standardized assessment such as
“Reading Recovery®” stating it has “correlations of .94 for fiction and .93 for
nonfiction” (Pearson, 2011). This is even more notable as “Reading Recovery® was
recently recognized by the U.S. Department of Education as an effective and
47
scientifically based reading program” (Pearson, 2011). Continuing, “There was a
moderate association between the Benchmark System 2 (Book Levels L-Z) fiction and
nonfiction books and other literacy assessments” (Pearson, 2011). The comparable
literacy measure was noted as the Slosson measure of word reading. The “study indicated
the Benchmark System fiction texts (correlation of .69) and nonfiction texts (correlation
of .62)” (Pearson, 2011).
These results confirm the validity and reliability of the Fountas & Pinnell
Benchmark Assessment System. “After two and a half years of editorial development,
field testing, and independent data analysis…the Benchmark Assessment System…were
demonstrated to be both reliable and valid measures for assessing students’ reading
levels.” (Pearson, 2011). Overall, it appears that the assessment being used for this study
aligns with the standards of validity and reliability. As already noted, In the BAS system,
the reading measurements when totaled, equal a letter. This letter can be translated to
either a grade level equivalent or a Lexile measurement range (Table 4). With that, set 1
and set 2 of the BAS have overlapping letters. In both the BAS-1 and BAS-2, letter
measurements L-N overlap. It should be noted that the testing tools used in these kits, for
the overlapping lettered measurements, are not the same. Therefore, only tools in BAS-2
for letters L-N are used to remain consistent.
To get to the total “lettered measurement” in the BAS, there is a series of aspects
the students are tested on. It is essential to explain the testing process. Students are first
given a series of “word lists”. The student reads the words from each of the word lists
until they reach a ceiling, or frustration point. It is from there, that the tester views a
“starting point chart”, therefore seeing where to begin the second phase of testing (Table
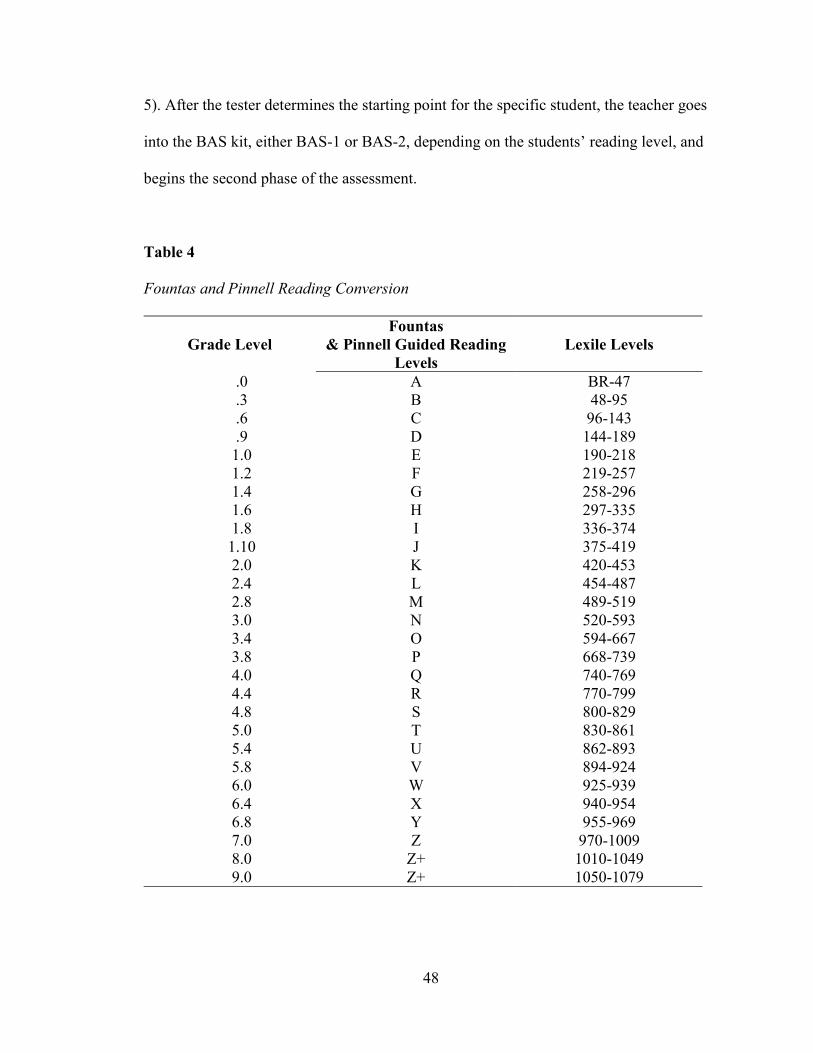
48
5). After the tester determines the starting point for the specific student, the teacher goes
into the BAS kit, either BAS-1 or BAS-2, depending on the students’ reading level, and
begins the second phase of the assessment.
Table 4
Fountas and Pinnell Reading Conversion
Grade Level Fountas
& Pinnell Guided Reading Levels
Lexile Levels
.0 A BR-47
.3 B 48-95
.6 C 96-143
.9 D 144-189 1.0 E 190-218 1.2 F 219-257 1.4 G 258-296 1.6 H 297-335 1.8 I 336-374 1.10 J 375-419 2.0 K 420-453 2.4 L 454-487 2.8 M 489-519 3.0 N 520-593 3.4 O 594-667 3.8 P 668-739 4.0 Q 740-769 4.4 R 770-799 4.8 S 800-829 5.0 T 830-861 5.4 U 862-893 5.8 V 894-924 6.0 W 925-939 6.4 X 940-954 6.8 Y 955-969 7.0 Z 970-1009 8.0 Z+ 1010-1049 9.0 Z+ 1050-1079
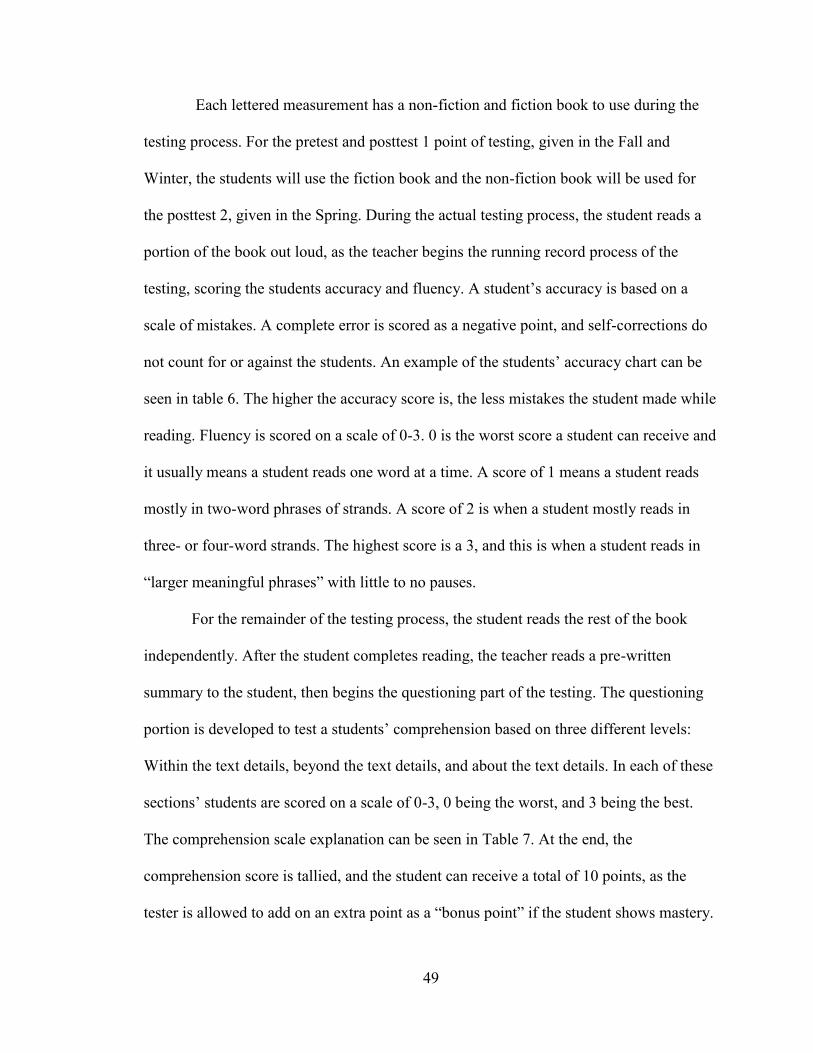
49
Each lettered measurement has a non-fiction and fiction book to use during the
testing process. For the pretest and posttest 1 point of testing, given in the Fall and
Winter, the students will use the fiction book and the non-fiction book will be used for
the posttest 2, given in the Spring. During the actual testing process, the student reads a
portion of the book out loud, as the teacher begins the running record process of the
testing, scoring the students accuracy and fluency. A student’s accuracy is based on a
scale of mistakes. A complete error is scored as a negative point, and self-corrections do
not count for or against the students. An example of the students’ accuracy chart can be
seen in table 6. The higher the accuracy score is, the less mistakes the student made while
reading. Fluency is scored on a scale of 0-3. 0 is the worst score a student can receive and
it usually means a student reads one word at a time. A score of 1 means a student reads
mostly in two-word phrases of strands. A score of 2 is when a student mostly reads in
three- or four-word strands. The highest score is a 3, and this is when a student reads in
“larger meaningful phrases” with little to no pauses.
For the remainder of the testing process, the student reads the rest of the book
independently. After the student completes reading, the teacher reads a pre-written
summary to the student, then begins the questioning part of the testing. The questioning
portion is developed to test a students’ comprehension based on three different levels:
Within the text details, beyond the text details, and about the text details. In each of these
sections’ students are scored on a scale of 0-3, 0 being the worst, and 3 being the best.
The comprehension scale explanation can be seen in Table 7. At the end, the
comprehension score is tallied, and the student can receive a total of 10 points, as the
tester is allowed to add on an extra point as a “bonus point” if the student shows mastery.
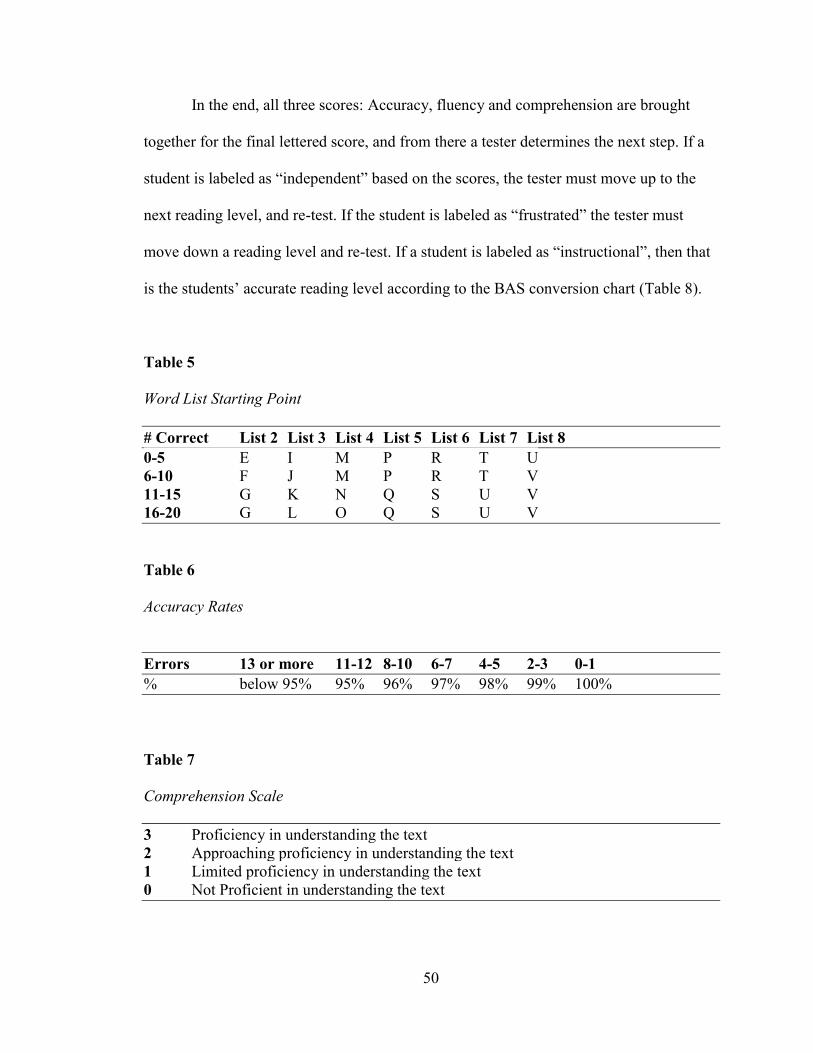
50
In the end, all three scores: Accuracy, fluency and comprehension are brought
together for the final lettered score, and from there a tester determines the next step. If a
student is labeled as “independent” based on the scores, the tester must move up to the
next reading level, and re-test. If the student is labeled as “frustrated” the tester must
move down a reading level and re-test. If a student is labeled as “instructional”, then that
is the students’ accurate reading level according to the BAS conversion chart (Table 8).
Table 5
Word List Starting Point # Correct List 2 List 3 List 4 List 5 List 6 List 7 List 8 0-5 E I M P R T U 6-10 F J M P R T V 11-15 G K N Q S U V 16-20 G L O Q S U V
Table 6
Accuracy Rates
Errors 13 or more 11-12 8-10 6-7 4-5 2-3 0-1 % below 95% 95% 96% 97% 98% 99% 100%
Table 7
Comprehension Scale
3 Proficiency in understanding the text 2 Approaching proficiency in understanding the text 1 Limited proficiency in understanding the text 0 Not Proficient in understanding the text
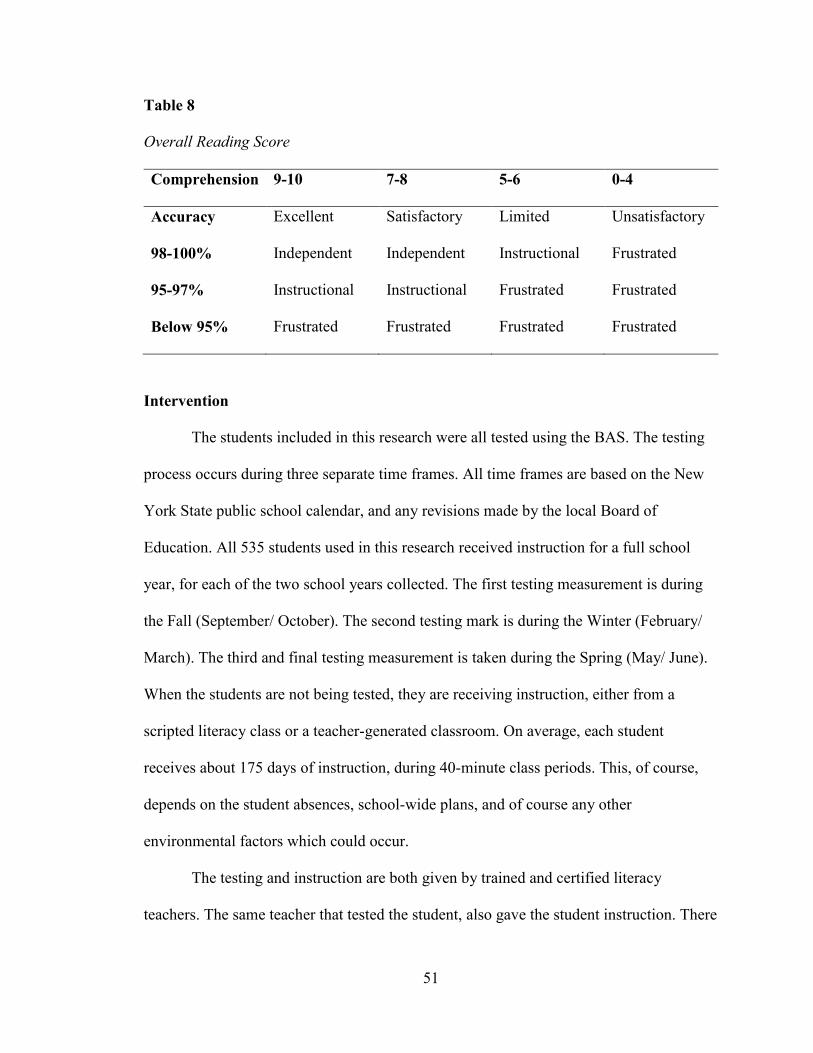
51
Table 8
Overall Reading Score
Comprehension 9-10 7-8 5-6 0-4
Accuracy Excellent Satisfactory Limited Unsatisfactory
98-100% Independent Independent Instructional Frustrated
95-97% Instructional Instructional Frustrated Frustrated
Below 95% Frustrated Frustrated Frustrated Frustrated
Intervention
The students included in this research were all tested using the BAS. The testing
process occurs during three separate time frames. All time frames are based on the New
York State public school calendar, and any revisions made by the local Board of
Education. All 535 students used in this research received instruction for a full school
year, for each of the two school years collected. The first testing measurement is during
the Fall (September/ October). The second testing mark is during the Winter (February/
March). The third and final testing measurement is taken during the Spring (May/ June).
When the students are not being tested, they are receiving instruction, either from a
scripted literacy class or a teacher-generated classroom. On average, each student
receives about 175 days of instruction, during 40-minute class periods. This, of course,
depends on the student absences, school-wide plans, and of course any other
environmental factors which could occur.
The testing and instruction are both given by trained and certified literacy
teachers. The same teacher that tested the student, also gave the student instruction. There
52
are 8 reading teachers. All the reading teachers have been trained in how to effectively
use the BAS testing system. In addition, all the literacy teachers spent an entire year, with
a total of 10 sessions, learning the LLI reading program. As part of this training, teachers
were asked to let professional developers into their classroom for model lessons and
fidelity checks. The teachers who teach the LLI program were assigned to the program
due to their specialty and years of teaching experience. The teachers who were certified
in both special education and literacy were placed in the scripted program. In addition,
those teachers with less seniority were also assigned to teach the LLI program. Therefore,
the teachers just certified in reading or certified in both English Language Arts and
Reading, and with higher seniority were placed in the teacher generated curriculum. All
assignments of teachers were made in collaboration with the department chair of reading,
the assistant principal in charge of creating the master schedule, and the Director of
Humanities for the district.
The participants in this study include 535 students from literacy classes in a
public-school setting. The student’s demographics will be broken down by gender, grade
level, ethnicity, student classification, as well as program type. Participants were tested
three times, for the pretest, posttest 1, and posttest 2. However, for the purposes of data
analysis only the students’ posttest 2 scores will be used as a comparison to pretest
scores. Students will be purposefully sampled and randomly assigned to either treatment
or comparison group. They are grouped due to their reading level. Reading classes are
organized by grade, so students were first separated into grade-level assignments. After
that, the student’s classification of special education and/or ENL was considered. Some
students had specific requirements based on their Individualized Learning Plan (IEP) and

53
could only fit into a teacher generated or scripted class. The rest of the students were
organized based on their reading level, and then placed into groups. For example, all
students in grade 6, with a letter L were grouped. Each of those groups was broken down
into subgroups of 6-10 students.
Whether students learned with a scripted or teacher generated curriculum was
randomly decided. Treatment group students learned teacher generated curriculum, while
comparison group students learned a scripted curriculum approach by their classroom
teacher. All students involved are students who were two or more grade levels below
their grade appropriate reading level. In addition, students in both the treatment and the
comparison group were assigned to each class based on the scheduling process in the
building. By creation of the master schedule, teacher availability, and grade level
requirements, the higher the reading level the more likely the student would end up in a
teacher-generated classroom. Many of the students had prior classifications of special
education and/or ENL. The process for assigning students to classes was done by the
department chair for reading and the Director of Humanities for the district. All student
and teacher information remained confidential throughout the process.
Procedures for Collecting Data
Consent. To use the archived data collected by the reading department, the
researcher first asked permission from the principal of the school. Upon receiving
permission from the principal, the researcher than asked the Director of Humanities for
the district, who also gave written approval for the use of the data.
Data Collection. For each of the years of data collection, the teachers taught and
assessed the students. Each of the 535 participants was assessed three times a year. The
54
data was collected by the teachers and stored in a department wide Microsoft Excel sheet.
All the data was gathered and compiled into one master Microsoft Excel sheet by the
department chair of Reading. Students’ names were gathered in this process but were re-
coded to keep their information confidential. This data sheet was stored on a password
protected computer. Students were also coded based on the type of literacy program they
were in. Level one students are those who received the scripted literacy program (LLI).
Whereas Level two students are those who received teacher generated literacy
curriculum. Students information was also coded based on gender, ethnicity, grade, and
student classification. Since the students are coming from various teachers, there was no
need to collect teacher information, as the focus of the research is on the curriculum and
not the instructor. The time frame for all data points is two school years. The testing data
points between each pretest to posttest 1 was 5-6 months. The time between the data
collection for posttest 1 and posttest 2 was 4-5 months. All data from the master
Microsoft Excel sheet with will be transferred to SPSS to analysis.
Data Analysis. After the data points were transferred into SPSS statistical
software, the data was analyzed. For Research Question 1, descriptive statistics were
computed to find the mean and standard deviations of the pretest (Fall) and posttest 2
(Spring) scores for both literacy groups. ANCOVA analysis was conducted to examine
the significance of the difference in students’ literacy level growth at the posttest between
literacy programs. Reading level at the pretest score was used as the covariate. For
Research Question 2, gain scores were computed to see the differences in students’
reading level based on student characteristics. Regression analysis was used with a series
of ANOVAs to determine significant differences among students’ literacy growth based

55
on student characteristics. For Research Question 3, to investigate the interaction effects
between program delivery types and students’ demographic identifiers, multiple
regression analyses with interactions between categorical variables were conducted.
56
CHAPTER 4: RESULTS
Introduction
The purpose of this study was to examine the effects of two types of literacy
curriculum on improving students’ reading literacy. The researcher explored the reading
growth in a teacher generated literacy curriculum and a scripted literacy curriculum with
the intention of discovering which is more beneficial to improve student reading levels.
With this, the researcher developed three research questions. The results and findings for
each of the following questions will be presented.
Research Question One: Will there be significant differences between two instructional
delivery modes of literacy programs (teacher generated versus scripted) on student’s
literacy growth during the school year?
Research Question Two: Will there be significant differences in literacy growth between
groups based on students’ characteristics such as gender, ethnicity, classification, and
grade?
Research Question Three: Will there be interaction effects between the literacy program’s
instructional delivery mode and students’ background characteristics such as gender,
ethnicity, and classification on student literacy growth?
Results: Research Question One
Research Question One: Will there be significant differences between two instructional
delivery modes of literacy programs (teacher generated versus scripted) on student’s
literacy growth during the school year?
Descriptive statistics on pretest scores (students’ reading level in Fall semester)
and posttest scores (students’ reading level in Spring semester) are presented in Table 9.
57
The type of literacy curriculum was the independent variable, with two levels. Level “1”
was a group of students who were taught using the scripted curriculum (n= 314), and
level “2” was another group of students who were instructed with a teacher generated
curriculum (n= 221).
Table 9 shows that the average pretest scores for the scripted literacy program
(m= 4.07) are lower than that of the teacher generated curriculum (m= 4.71). Likewise,
the posttest mean scores in the teacher generated curriculum (m = 5.72) is higher than the
mean score for the scripted literacy curriculum showed a lower average (m = 5.22). Gain
scores were computed by subtracting pretest scores from posttest scores of all students in
both curriculums. Gain scores of students in scripted curriculum were found to be
slightly higher than those in teacher generated curriculum.
To find out whether this difference is from the type of literacy curriculum,
ANCOVA analysis was run with posttest scores as an outcome variable and pretest
scores (students’ reading level in Fall semester) as the covariate variable. The difference
in the gain scores between scripted and teacher-generated program controlling pretest
scores was significant F(1, 532)=10.19, p<.01. One possibility is this reflects regression to
the mean effects, since the pretest scores of students in teacher-generated curriculum was
significantly higher than those in scripted curriculum F(1, 532)=2024.98, p<.001.
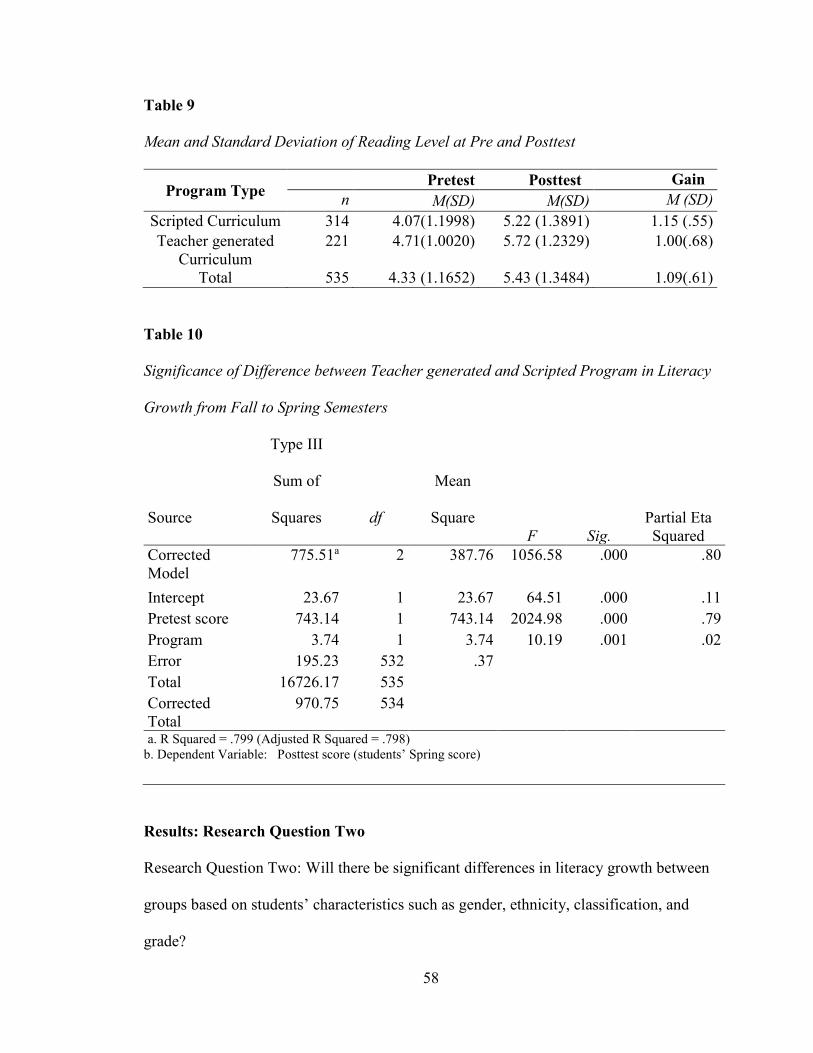
58
Table 9
Mean and Standard Deviation of Reading Level at Pre and Posttest
Program Type Pretest Posttest Gain
n M(SD) M(SD) M (SD) Scripted Curriculum 314 4.07(1.1998) 5.22 (1.3891) 1.15 (.55) Teacher generated
Curriculum 221 4.71(1.0020) 5.72 (1.2329) 1.00(.68)
Total 535 4.33 (1.1652) 5.43 (1.3484) 1.09(.61)
Table 10
Significance of Difference between Teacher generated and Scripted Program in Literacy
Growth from Fall to Spring Semesters
Source
Type III
Sum of
Squares df
Mean
Square F Sig.
Partial Eta Squared
Corrected Model
775.51a 2 387.76 1056.58 .000 .80
Intercept 23.67 1 23.67 64.51 .000 .11 Pretest score 743.14 1 743.14 2024.98 .000 .79 Program 3.74 1 3.74 10.19 .001 .02 Error 195.23 532 .37 Total 16726.17 535 Corrected Total
970.75 534 a. R Squared = .799 (Adjusted R Squared = .798)
b. Dependent Variable: Posttest score (students’ Spring score)
Results: Research Question Two
Research Question Two: Will there be significant differences in literacy growth between
groups based on students’ characteristics such as gender, ethnicity, classification, and
grade?
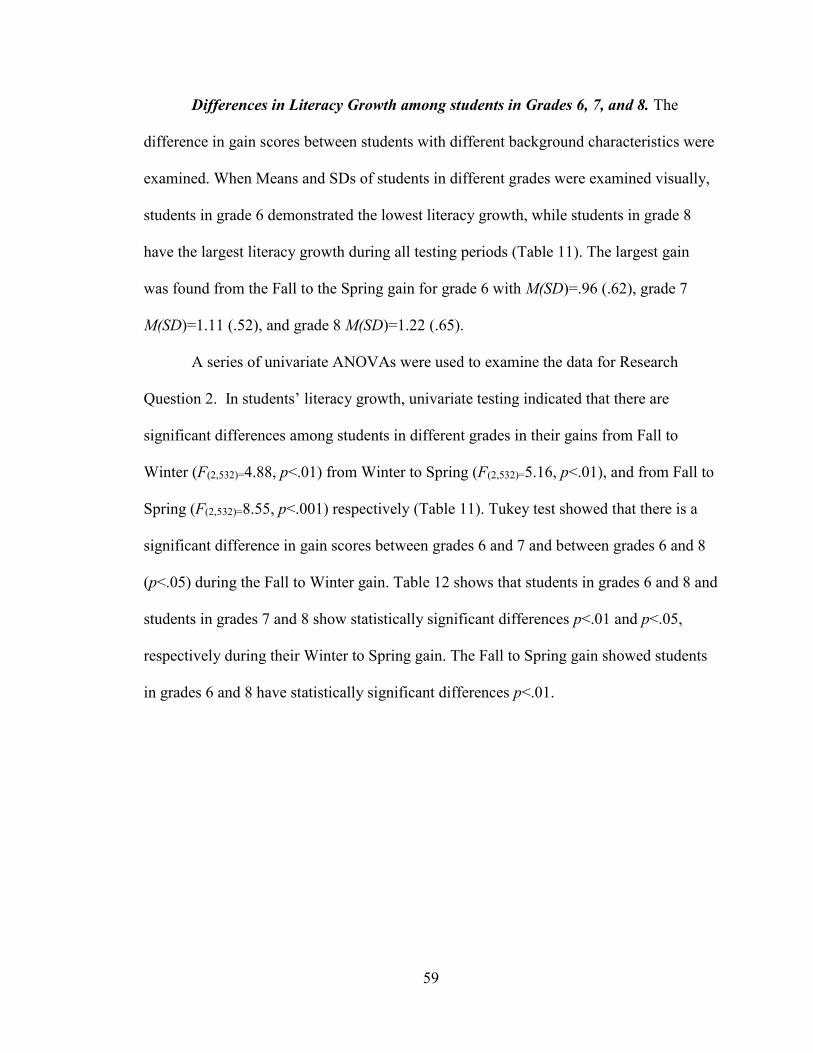
59
Differences in Literacy Growth among students in Grades 6, 7, and 8. The
difference in gain scores between students with different background characteristics were
examined. When Means and SDs of students in different grades were examined visually,
students in grade 6 demonstrated the lowest literacy growth, while students in grade 8
have the largest literacy growth during all testing periods (Table 11). The largest gain
was found from the Fall to the Spring gain for grade 6 with M(SD)=.96 (.62), grade 7
M(SD)=1.11 (.52), and grade 8 M(SD)=1.22 (.65).
A series of univariate ANOVAs were used to examine the data for Research
Question 2. In students’ literacy growth, univariate testing indicated that there are
significant differences among students in different grades in their gains from Fall to
Winter (F(2,532)=4.88, p<.01) from Winter to Spring (F(2,532)=5.16, p<.01), and from Fall to
Spring (F(2,532)=8.55, p<.001) respectively (Table 11). Tukey test showed that there is a
significant difference in gain scores between grades 6 and 7 and between grades 6 and 8
(p<.05) during the Fall to Winter gain. Table 12 shows that students in grades 6 and 8 and
students in grades 7 and 8 show statistically significant differences p<.01 and p<.05,
respectively during their Winter to Spring gain. The Fall to Spring gain showed students
in grades 6 and 8 have statistically significant differences p<.01.
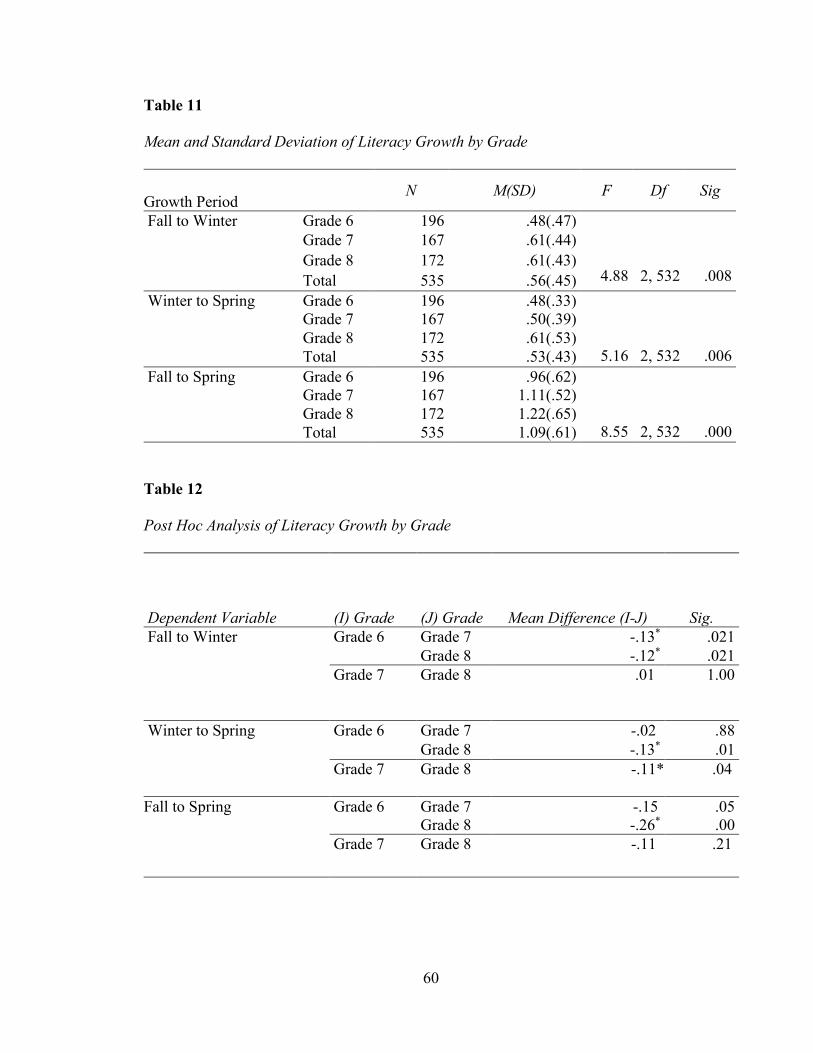
60
Table 11
Mean and Standard Deviation of Literacy Growth by Grade
Growth Period N M(SD) F Df Sig
Fall to Winter Grade 6 196 .48(.47)
4.88
2, 532
.008
Grade 7 167 .61(.44) Grade 8 172 .61(.43) Total 535 .56(.45)
Winter to Spring Grade 6 196 .48(.33)
5.16
2, 532
.006
Grade 7 167 .50(.39) Grade 8 172 .61(.53) Total 535 .53(.43)
Fall to Spring Grade 6 196 .96(.62)
8.55
2, 532
.000
Grade 7 167 1.11(.52) Grade 8 172 1.22(.65) Total 535 1.09(.61)
Table 12
Post Hoc Analysis of Literacy Growth by Grade
Dependent Variable (I) Grade (J) Grade Mean Difference (I-J) Sig. Fall to Winter Grade 6 Grade 7 -.13* .021
Grade 8 -.12* .021 Grade 7 Grade 8 .01 1.00
Winter to Spring Grade 6 Grade 7 -.02 .88 Grade 8 -.13* .01
Grade 7 Grade 8 -.11* .04
Fall to Spring Grade 6 Grade 7 -.15 .05 Grade 8 -.26* .00
Grade 7 Grade 8 -.11 .21
61
Differences in Literacy Growth among Ethnic Groups. Differences in students’
literacy growth was examined among different ethnic groups. As seen in Table 13,
students labeled as “other” have the highest literacy rate growth from Fall to Spring gain
score M(SD)=1.26 (.57). However, the small sample size of students may skew these
results (n=10). White students also showed an increase in literacy growth M(SD)=1.24
(.60). With that, Hispanic/ Latino students showed an increase only slightly below their
White peers M(SD)=1.11(.59). African American students showed the smallest reading
growth increase M(SD)=.94(.62).
Univariate testing indicated that there are significant differences among students
with different ethnicities from Fall to Winter (F(3,531)=5.31, p<.001) and from Fall to
Spring (F(3,531)=6.96, p<.001), but not from Winter to Spring. Post hoc analysis indicated
that during the Fall to Winter testing session there was a statistically significant
difference between White students and African American students (p<.001). The Fall to
Spring gain scores indicate that there is a statistically significant difference in scores
between White students and African American students (p<.001) and Hispanic/ Latino
students and African American students (p<.05).
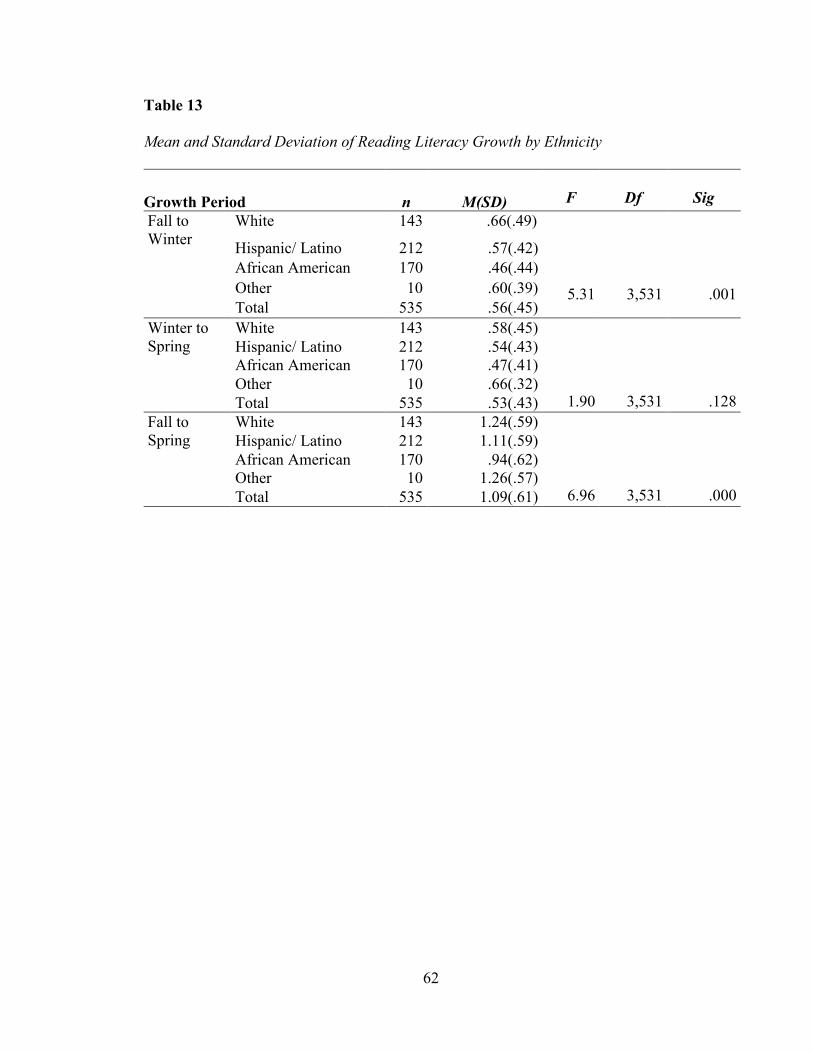
62
Table 13
Mean and Standard Deviation of Reading Literacy Growth by Ethnicity
Growth Period n M(SD)
F
Df
Sig Fall to Winter
White 143 .66(.49)
5.31
3,531
.001
Hispanic/ Latino 212 .57(.42) African American 170 .46(.44) Other 10 .60(.39) Total 535 .56(.45)
Winter to Spring
White 143 .58(.45)
1.90
3,531
.128
Hispanic/ Latino 212 .54(.43) African American 170 .47(.41) Other 10 .66(.32) Total 535 .53(.43)
Fall to Spring
White 143 1.24(.59)
6.96
3,531
.000
Hispanic/ Latino 212 1.11(.59) African American 170 .94(.62) Other 10 1.26(.57) Total 535 1.09(.61)
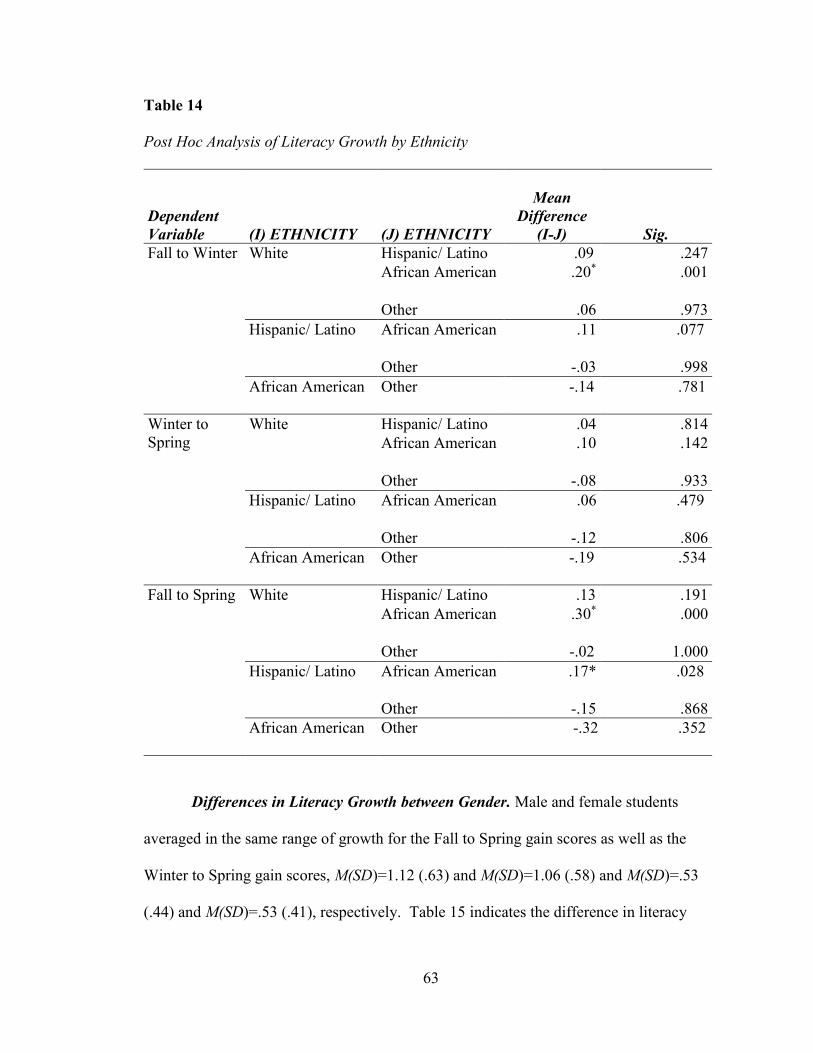
63
Table 14
Post Hoc Analysis of Literacy Growth by Ethnicity
Dependent Variable (I) ETHNICITY (J) ETHNICITY
Mean Difference
(I-J) Sig. Fall to Winter White
Hispanic/ Latino .09 .247 African American .20* .001
Other .06 .973 Hispanic/ Latino African American .11 .077
Other -.03 .998
African American Other -.14 .781
Winter to Spring
White Hispanic/ Latino .04 .814 African American .10 .142
Other -.08 .933 Hispanic/ Latino African American .06 .479
Other -.12 .806
African American Other -.19 .534
Fall to Spring White Hispanic/ Latino .13 .191 African American .30* .000
Other -.02 1.000 Hispanic/ Latino African American .17* .028
Other -.15 .868
African American Other -.32 .352
Differences in Literacy Growth between Gender. Male and female students
averaged in the same range of growth for the Fall to Spring gain scores as well as the
Winter to Spring gain scores, M(SD)=1.12 (.63) and M(SD)=1.06 (.58) and M(SD)=.53
(.44) and M(SD)=.53 (.41), respectively. Table 15 indicates the difference in literacy
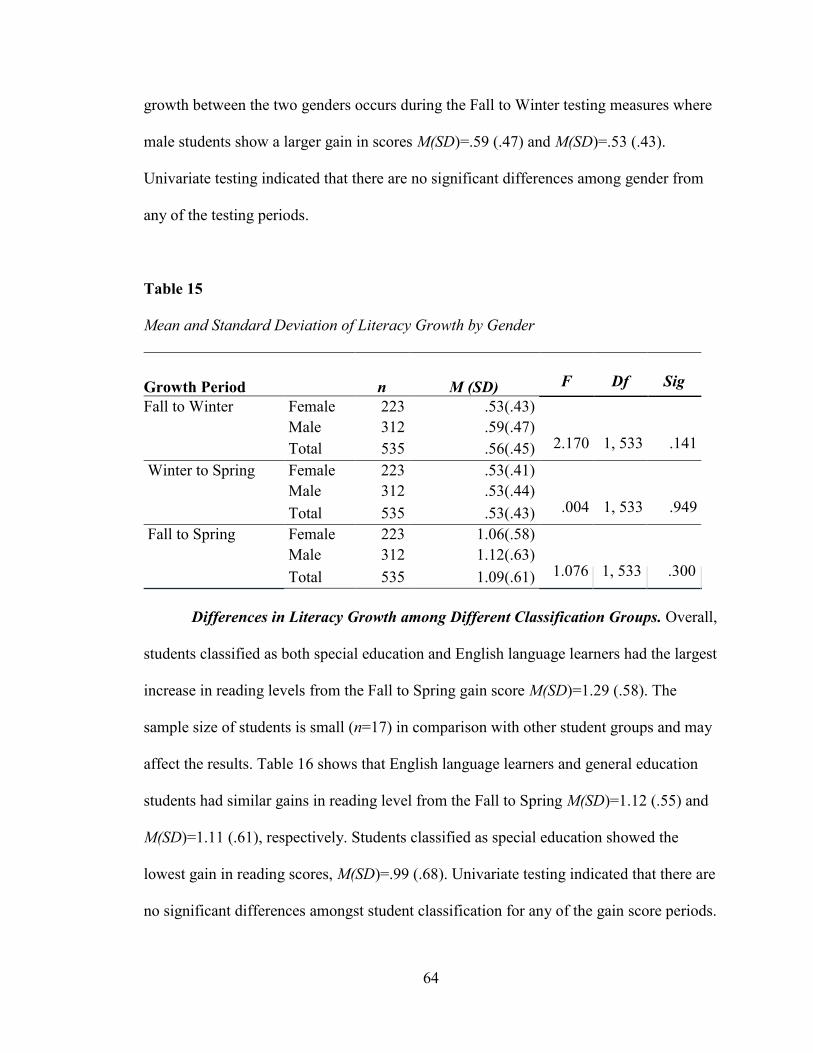
64
growth between the two genders occurs during the Fall to Winter testing measures where
male students show a larger gain in scores M(SD)=.59 (.47) and M(SD)=.53 (.43).
Univariate testing indicated that there are no significant differences among gender from
any of the testing periods.
Table 15
Mean and Standard Deviation of Literacy Growth by Gender
Growth Period n M (SD)
F
Df
Sig Fall to Winter Female 223 .53(.43)
2.170
1, 533
.141 Male 312 .59(.47) Total 535 .56(.45)
Winter to Spring Female 223 .53(.41)
.004
1, 533
.949 Male 312 .53(.44) Total 535 .53(.43)
Fall to Spring Female 223 1.06(.58)
1.076
1, 533
.300 Male 312 1.12(.63) Total 535 1.09(.61)
Differences in Literacy Growth among Different Classification Groups. Overall,
students classified as both special education and English language learners had the largest
increase in reading levels from the Fall to Spring gain score M(SD)=1.29 (.58). The
sample size of students is small (n=17) in comparison with other student groups and may
affect the results. Table 16 shows that English language learners and general education
students had similar gains in reading level from the Fall to Spring M(SD)=1.12 (.55) and
M(SD)=1.11 (.61), respectively. Students classified as special education showed the
lowest gain in reading scores, M(SD)=.99 (.68). Univariate testing indicated that there are
no significant differences amongst student classification for any of the gain score periods.
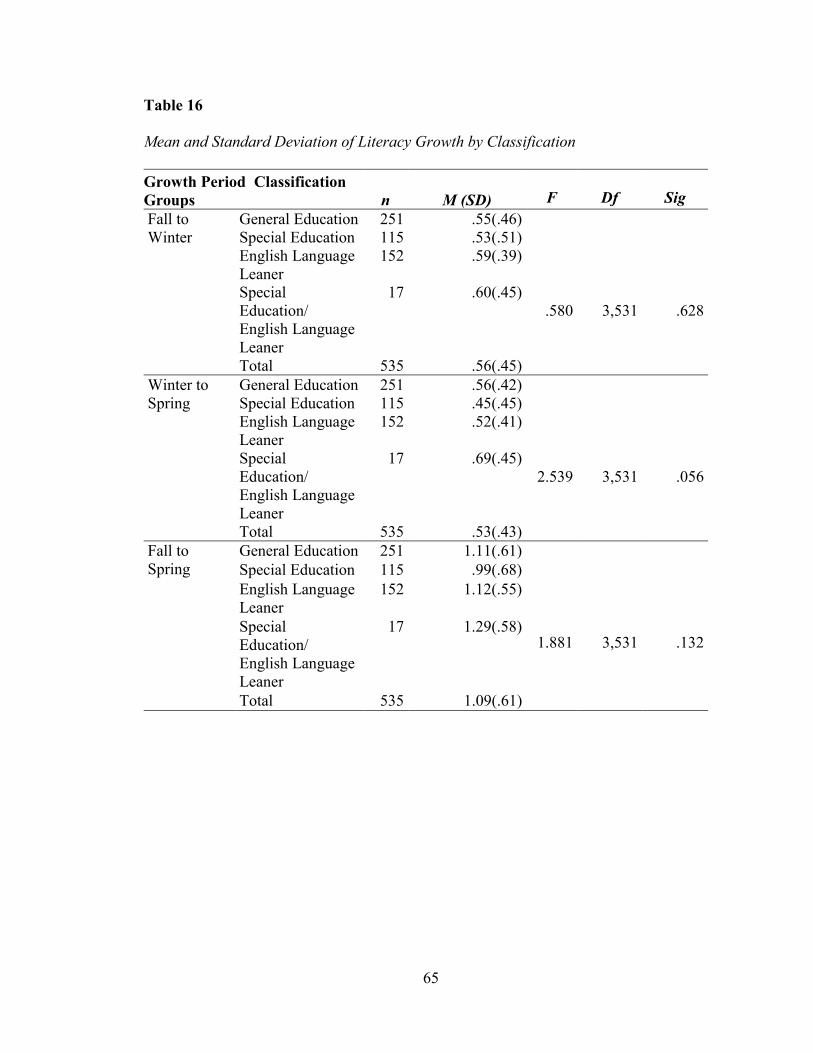
65
Table 16
Mean and Standard Deviation of Literacy Growth by Classification
Growth Period Classification Groups n M (SD)
F
Df
Sig
Fall to Winter
General Education 251 .55(.46)
.580
3,531
.628
Special Education 115 .53(.51) English Language Leaner
152 .59(.39)
Special Education/ English Language Leaner
17 .60(.45)
Total 535 .56(.45) Winter to Spring
General Education 251 .56(.42)
2.539
3,531
.056
Special Education 115 .45(.45) English Language Leaner
152 .52(.41)
Special Education/ English Language Leaner
17 .69(.45)
Total 535 .53(.43) Fall to Spring
General Education 251 1.11(.61)
1.881
3,531
.132
Special Education 115 .99(.68) English Language Leaner
152 1.12(.55)
Special Education/ English Language Leaner
17 1.29(.58)
Total 535 1.09(.61)
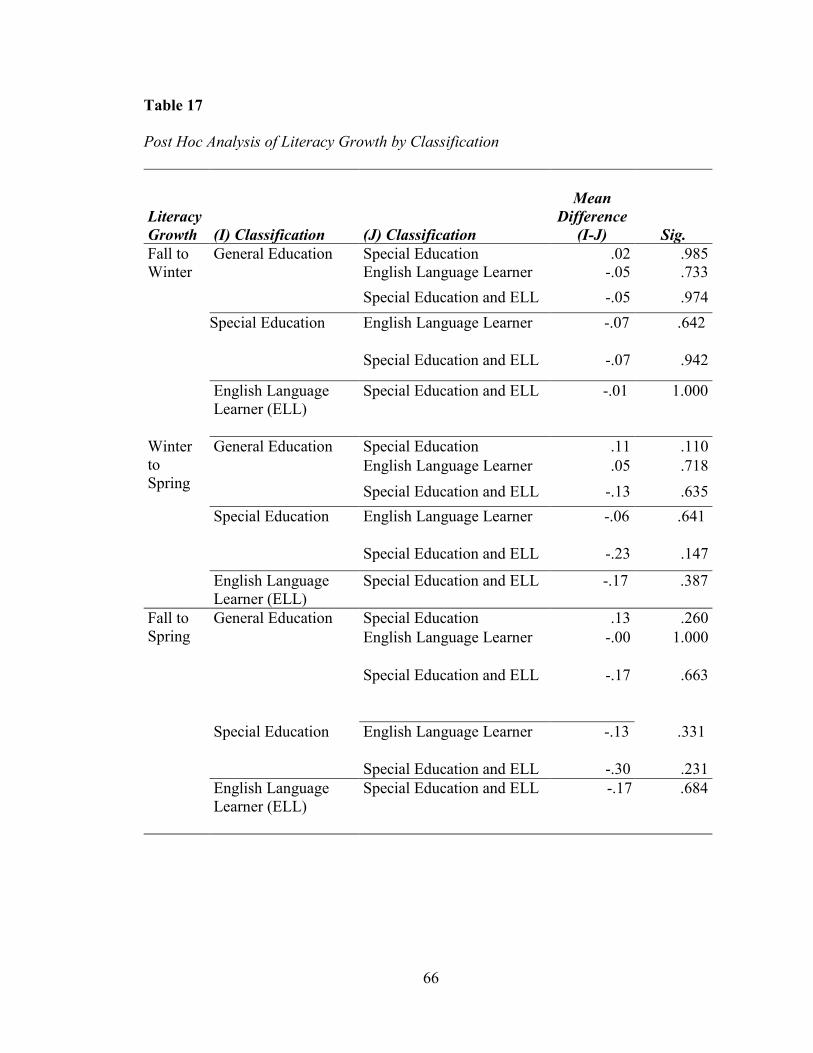
66
Table 17
Post Hoc Analysis of Literacy Growth by Classification
Literacy Growth (I) Classification (J) Classification
Mean Difference
(I-J) Sig. Fall to Winter
General Education Special Education .02 .985 English Language Learner -.05 .733 Special Education and ELL -.05 .974
Special Education English Language Learner -.07 .642
Special Education and ELL -.07 .942
English Language Learner (ELL)
Special Education and ELL -.01 1.000
Winter to Spring
General Education Special Education .11 .110 English Language Learner .05 .718 Special Education and ELL -.13 .635
Special Education English Language Learner -.06 .641
Special Education and ELL -.23 .147
English Language Learner (ELL)
Special Education and ELL -.17 .387
Fall to Spring
General Education Special Education .13 .260 English Language Learner -.00 1.000
Special Education and ELL -.17 .663
Special Education English Language Learner -.13 .331
Special Education and ELL -.30 .231 English Language Learner (ELL)
Special Education and ELL -.17 .684
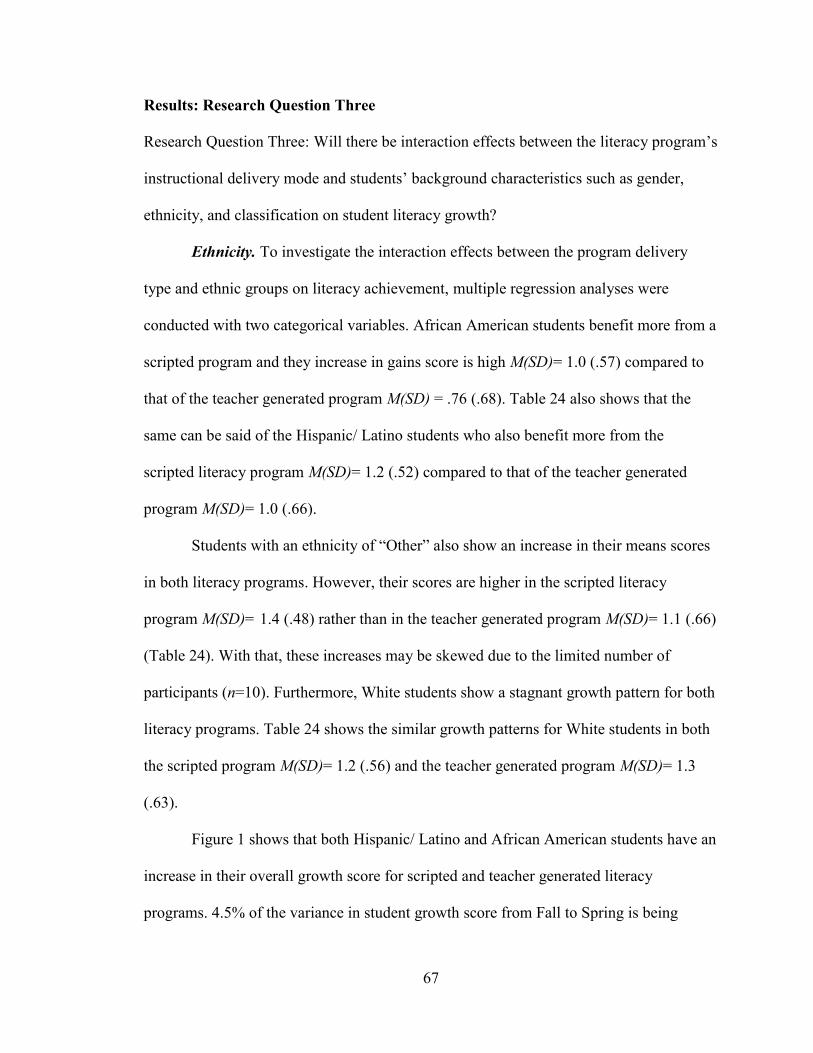
67
Results: Research Question Three
Research Question Three: Will there be interaction effects between the literacy program’s
instructional delivery mode and students’ background characteristics such as gender,
ethnicity, and classification on student literacy growth?
Ethnicity. To investigate the interaction effects between the program delivery
type and ethnic groups on literacy achievement, multiple regression analyses were
conducted with two categorical variables. African American students benefit more from a
scripted program and they increase in gains score is high M(SD)= 1.0 (.57) compared to
that of the teacher generated program M(SD) = .76 (.68). Table 24 also shows that the
same can be said of the Hispanic/ Latino students who also benefit more from the
scripted literacy program M(SD)= 1.2 (.52) compared to that of the teacher generated
program M(SD)= 1.0 (.66).
Students with an ethnicity of “Other” also show an increase in their means scores
in both literacy programs. However, their scores are higher in the scripted literacy
program M(SD)= 1.4 (.48) rather than in the teacher generated program M(SD)= 1.1 (.66)
(Table 24). With that, these increases may be skewed due to the limited number of
participants (n=10). Furthermore, White students show a stagnant growth pattern for both
literacy programs. Table 24 shows the similar growth patterns for White students in both
the scripted program M(SD)= 1.2 (.56) and the teacher generated program M(SD)= 1.3
(.63).
Figure 1 shows that both Hispanic/ Latino and African American students have an
increase in their overall growth score for scripted and teacher generated literacy
programs. 4.5% of the variance in student growth score from Fall to Spring is being
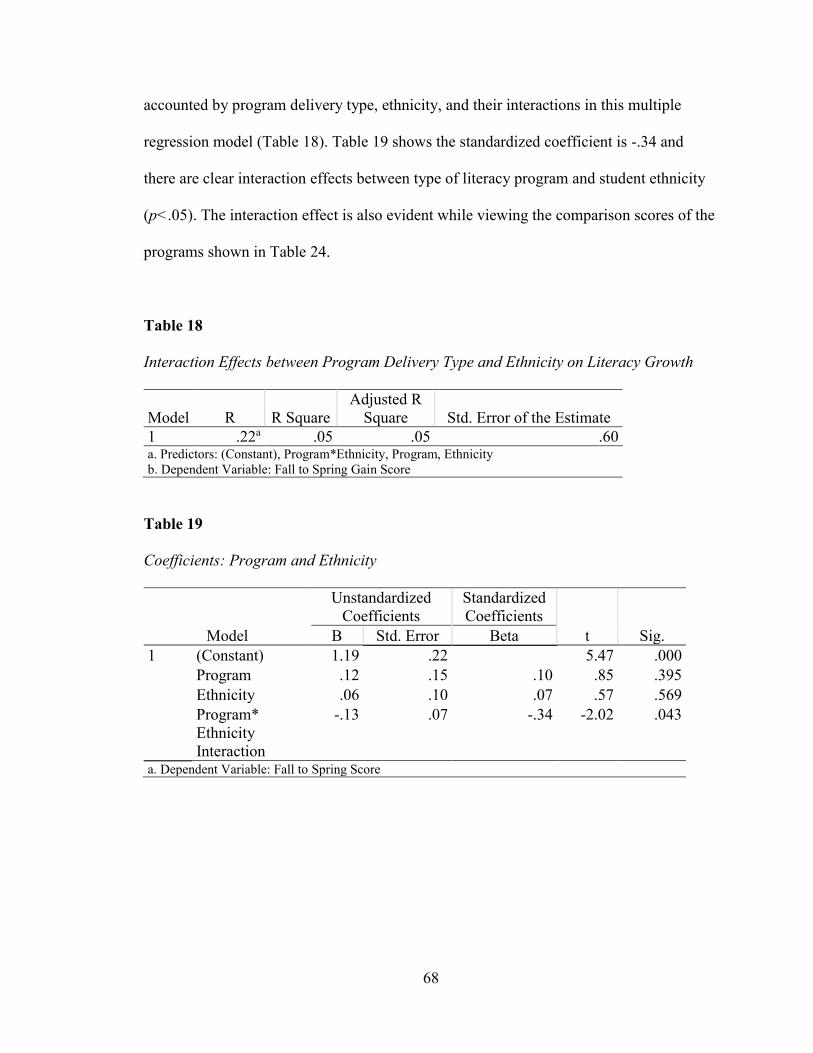
68
accounted by program delivery type, ethnicity, and their interactions in this multiple
regression model (Table 18). Table 19 shows the standardized coefficient is -.34 and
there are clear interaction effects between type of literacy program and student ethnicity
(p<.05). The interaction effect is also evident while viewing the comparison scores of the
programs shown in Table 24.
Table 18
Interaction Effects between Program Delivery Type and Ethnicity on Literacy Growth
Model R R Square Adjusted R
Square Std. Error of the Estimate 1 .22a .05 .05 .60 a. Predictors: (Constant), Program*Ethnicity, Program, Ethnicity b. Dependent Variable: Fall to Spring Gain Score
Table 19
Coefficients: Program and Ethnicity
Model
Unstandardized Coefficients
Standardized Coefficients
t Sig. B Std. Error Beta 1 (Constant) 1.19 .22 5.47 .000
Program .12 .15 .10 .85 .395 Ethnicity .06 .10 .07 .57 .569 Program* Ethnicity Interaction
-.13 .07 -.34 -2.02 .043
a. Dependent Variable: Fall to Spring Score
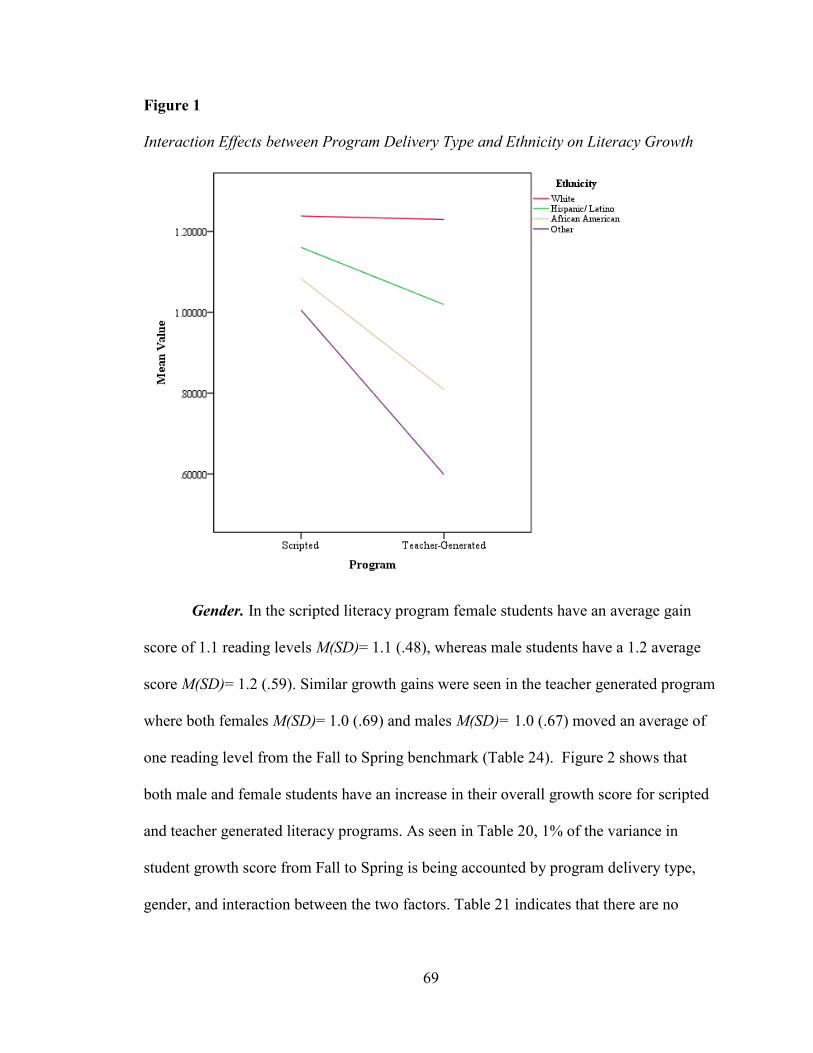
69
Figure 1
Interaction Effects between Program Delivery Type and Ethnicity on Literacy Growth
Gender. In the scripted literacy program female students have an average gain
score of 1.1 reading levels M(SD)= 1.1 (.48), whereas male students have a 1.2 average
score M(SD)= 1.2 (.59). Similar growth gains were seen in the teacher generated program
where both females M(SD)= 1.0 (.69) and males M(SD)= 1.0 (.67) moved an average of
one reading level from the Fall to Spring benchmark (Table 24). Figure 2 shows that
both male and female students have an increase in their overall growth score for scripted
and teacher generated literacy programs. As seen in Table 20, 1% of the variance in
student growth score from Fall to Spring is being accounted by program delivery type,
gender, and interaction between the two factors. Table 21 indicates that there are no
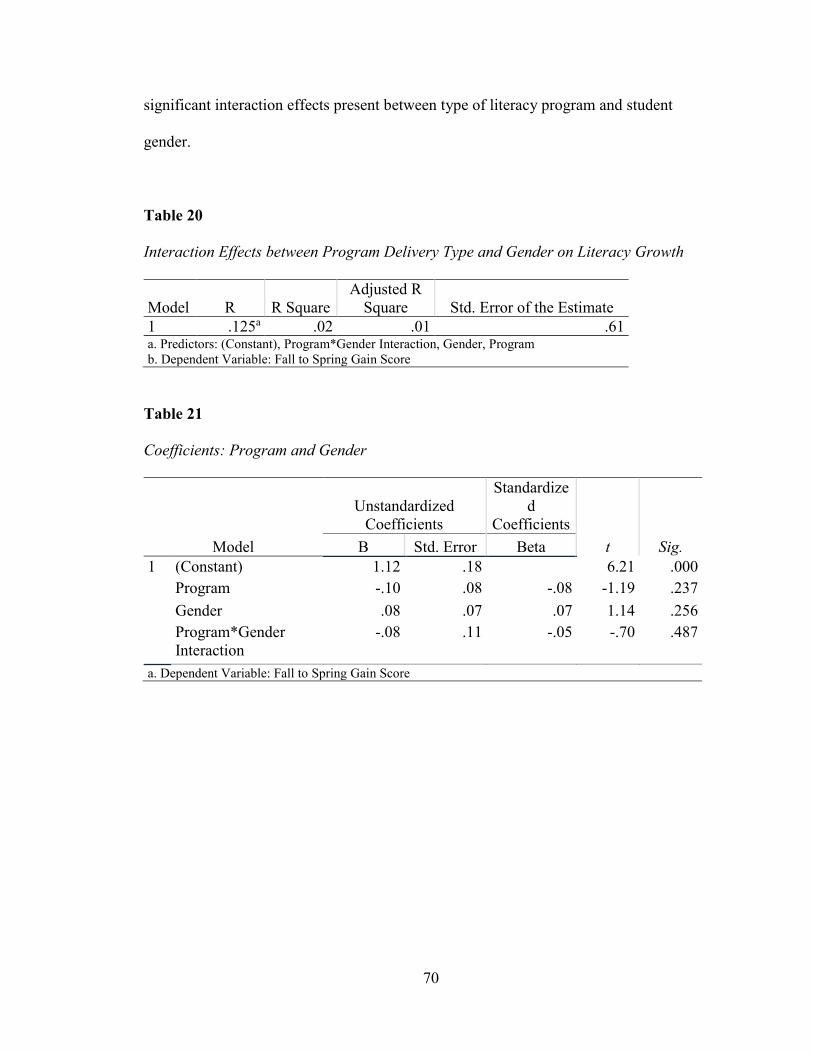
70
significant interaction effects present between type of literacy program and student
gender.
Table 20
Interaction Effects between Program Delivery Type and Gender on Literacy Growth
Model R R Square Adjusted R
Square Std. Error of the Estimate 1 .125a .02 .01 .61 a. Predictors: (Constant), Program*Gender Interaction, Gender, Program b. Dependent Variable: Fall to Spring Gain Score
Table 21
Coefficients: Program and Gender
Model
Unstandardized Coefficients
Standardized
Coefficients t Sig. B Std. Error Beta
1 (Constant) 1.12 .18 6.21 .000 Program -.10 .08 -.08 -1.19 .237 Gender .08 .07 .07 1.14 .256 Program*Gender Interaction
-.08 .11 -.05 -.70 .487
a. Dependent Variable: Fall to Spring Gain Score
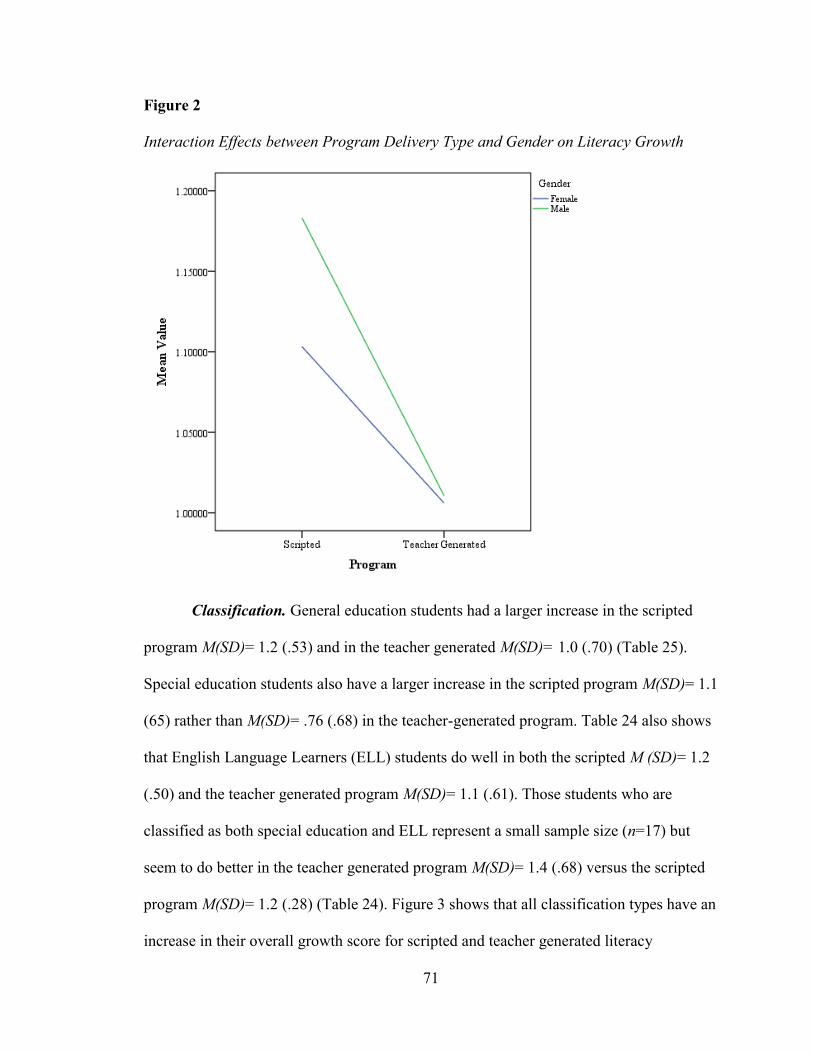
71
Figure 2
Interaction Effects between Program Delivery Type and Gender on Literacy Growth
Classification. General education students had a larger increase in the scripted
program M(SD)= 1.2 (.53) and in the teacher generated M(SD)= 1.0 (.70) (Table 25).
Special education students also have a larger increase in the scripted program M(SD)= 1.1
(65) rather than M(SD)= .76 (.68) in the teacher-generated program. Table 24 also shows
that English Language Learners (ELL) students do well in both the scripted M (SD)= 1.2
(.50) and the teacher generated program M(SD)= 1.1 (.61). Those students who are
classified as both special education and ELL represent a small sample size (n=17) but
seem to do better in the teacher generated program M(SD)= 1.4 (.68) versus the scripted
program M(SD)= 1.2 (.28) (Table 24). Figure 3 shows that all classification types have an
increase in their overall growth score for scripted and teacher generated literacy
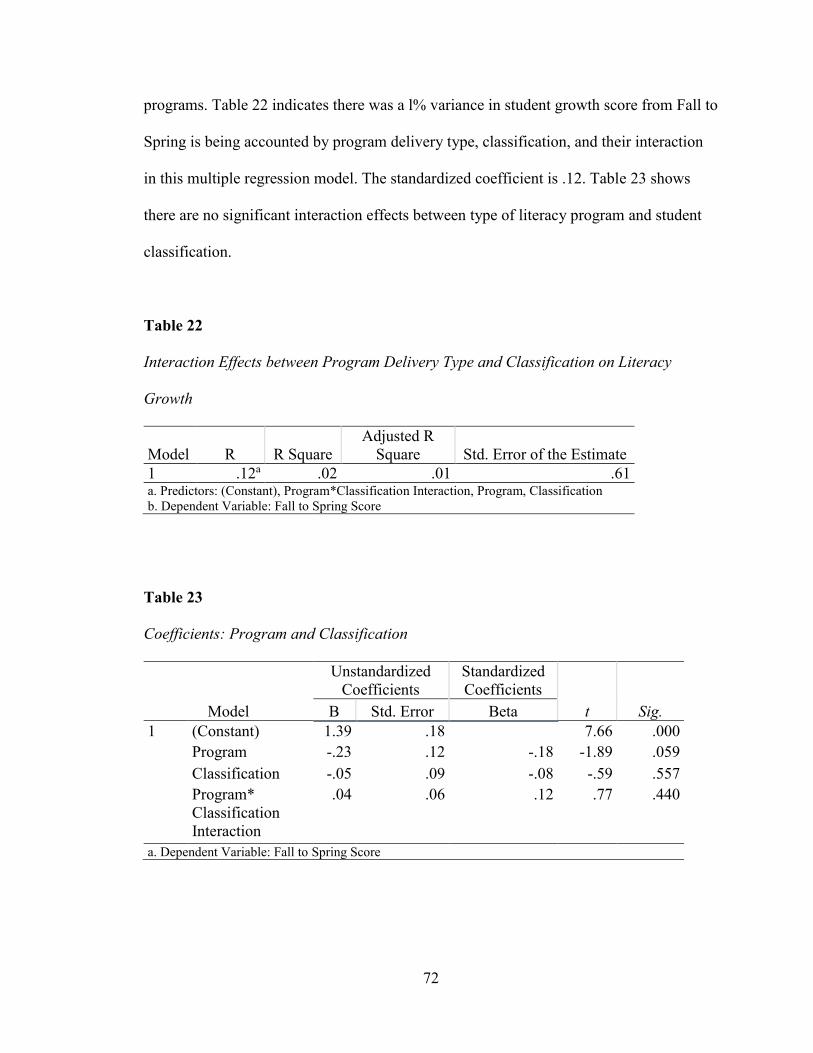
72
programs. Table 22 indicates there was a l% variance in student growth score from Fall to
Spring is being accounted by program delivery type, classification, and their interaction
in this multiple regression model. The standardized coefficient is .12. Table 23 shows
there are no significant interaction effects between type of literacy program and student
classification.
Table 22
Interaction Effects between Program Delivery Type and Classification on Literacy
Growth
Model R R Square Adjusted R
Square Std. Error of the Estimate 1 .12a .02 .01 .61 a. Predictors: (Constant), Program*Classification Interaction, Program, Classification b. Dependent Variable: Fall to Spring Score
Table 23
Coefficients: Program and Classification
Model
Unstandardized Coefficients
Standardized Coefficients
t Sig. B Std. Error Beta 1 (Constant) 1.39 .18 7.66 .000
Program -.23 .12 -.18 -1.89 .059 Classification -.05 .09 -.08 -.59 .557 Program* Classification Interaction
.04 .06 .12 .77 .440
a. Dependent Variable: Fall to Spring Score
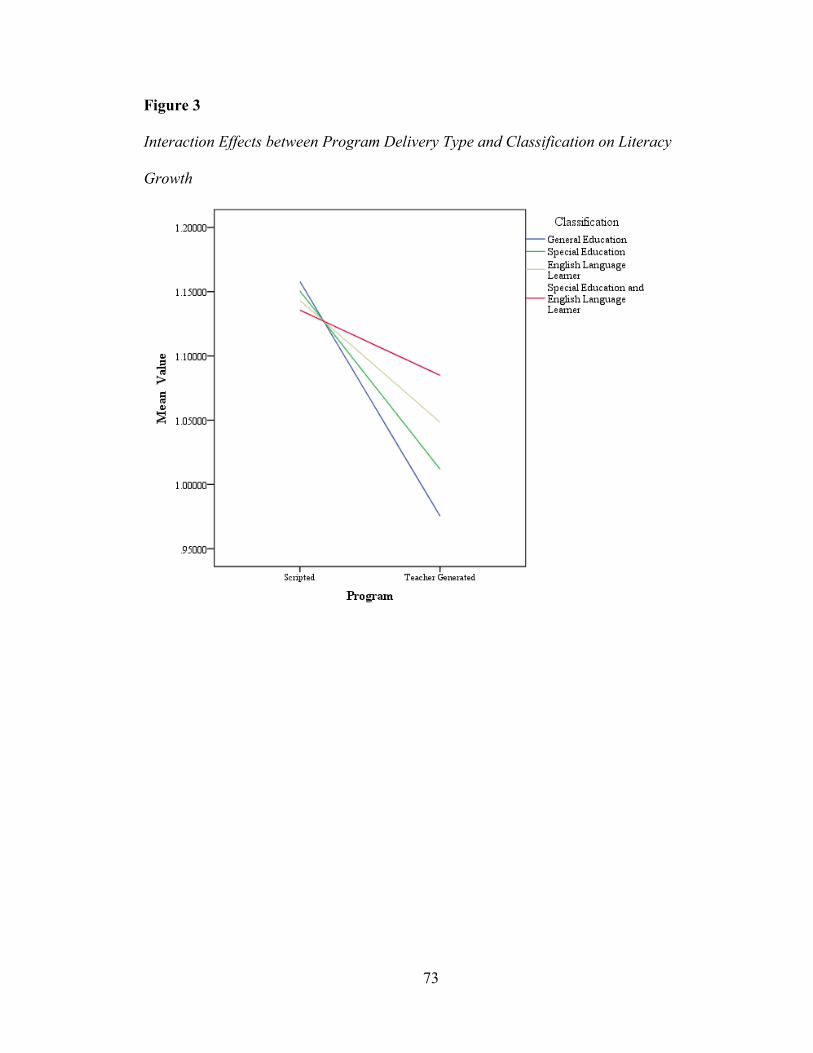
73
Figure 3
Interaction Effects between Program Delivery Type and Classification on Literacy
Growth
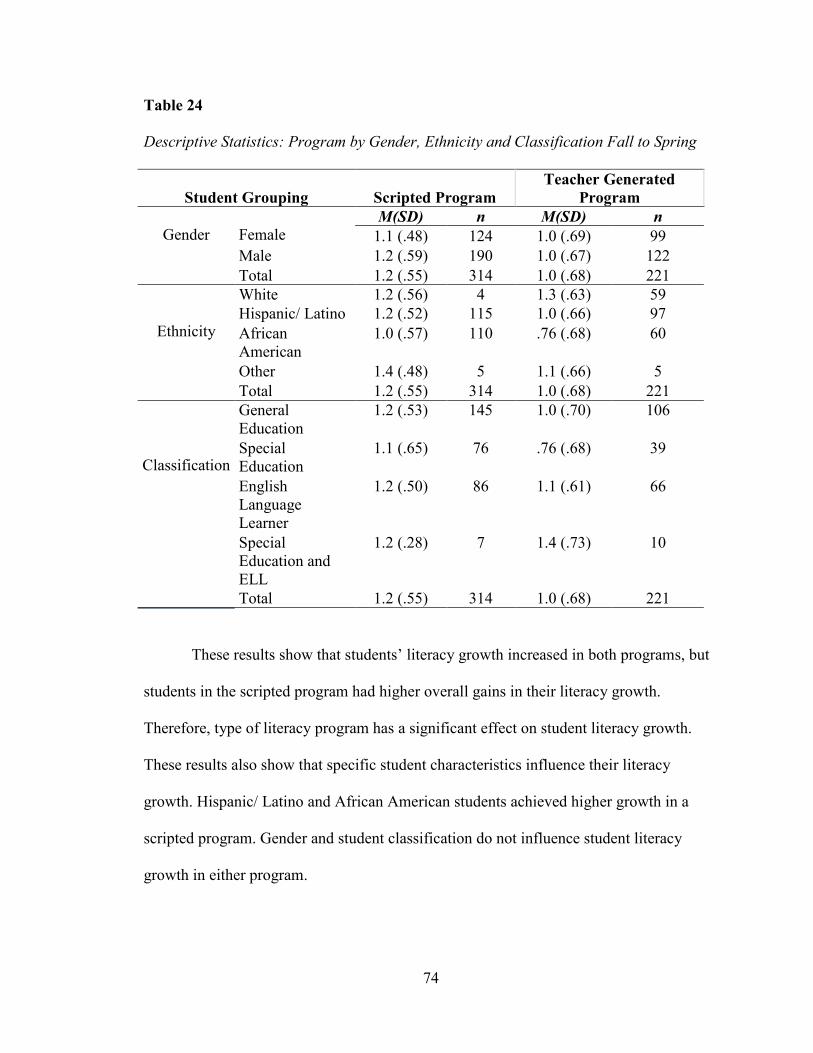
74
Table 24
Descriptive Statistics: Program by Gender, Ethnicity and Classification Fall to Spring
Student Grouping Scripted Program Teacher Generated
Program
Gender Female
M(SD) n M(SD) n 1.1 (.48) 124 1.0 (.69) 99
Male 1.2 (.59) 190 1.0 (.67) 122 Total 1.2 (.55) 314 1.0 (.68) 221
Ethnicity
White 1.2 (.56) 4 1.3 (.63) 59 Hispanic/ Latino 1.2 (.52) 115 1.0 (.66) 97 African American
1.0 (.57) 110 .76 (.68) 60
Other 1.4 (.48) 5 1.1 (.66) 5 Total 1.2 (.55) 314 1.0 (.68) 221
Classification
General Education
1.2 (.53) 145 1.0 (.70) 106
Special Education
1.1 (.65) 76 .76 (.68) 39
English Language Learner
1.2 (.50) 86 1.1 (.61) 66
Special Education and ELL
1.2 (.28) 7 1.4 (.73) 10
Total 1.2 (.55) 314 1.0 (.68) 221
These results show that students’ literacy growth increased in both programs, but
students in the scripted program had higher overall gains in their literacy growth.
Therefore, type of literacy program has a significant effect on student literacy growth.
These results also show that specific student characteristics influence their literacy
growth. Hispanic/ Latino and African American students achieved higher growth in a
scripted program. Gender and student classification do not influence student literacy
growth in either program.
75
CHAPTER 5: DISCUSSION
Interpretation of Results
This study examined the effect of a scripted versus a teacher generated literacy
curriculum on literacy growth. The literature on the topic of literacy programs mainly
focuses on the effects the curriculum has on teachers, not students (MacGillivray, Ardell,
Curwen & Palma, 2004). This study purely focused on students and how the programs
effect their reading levels throughout a year. Overall, students’ literacy growth increased
in both the scripted program and the teacher generated program. Instructional literacy
program has a significant effect on student literacy growth.
Students in the scripted program had a larger increase in their overall gain scores
than students in the teacher generated program. The results indicate that students in the
scripted literacy program started with a greater deficient in their reading levels but had a
larger increase in their literacy growth. In comparison, students with a higher pretest
scores still made progress in a teacher generated program. Students in the teacher
generated program started at a higher “starting point” for their reading scores, than those
students in the scripted program due to the random but purposeful placement of the
students. The difference in starting points could explain why the ending point for
students’ scores are not as high in the teacher generated program than in the scripted
program. There could have been a regression to the mean effects for students in teacher
generated program since their starting scores were much higher than those in scripted
program.
There is a connection between literacy program type and student literacy growth.
Next, student identifiers were examined to see if there were significant differences in
76
literacy growth based on student characteristics. Students in all grades showed a
significant difference in literacy growth. Grade 6 had the smallest gain, while students in
grade 8 appeared to have the largest gain from Fall to Spring reading level scores. In the
same fashion, grades 6 and 8 proved to be significant factors of reading level growth
during all three benchmark assessments. Students in grades 6 and 7 made gains based on
the Fall to Winter and the Fall to Spring benchmark periods. Grades 7 and 8 only showed
growth during Winter to Spring.
Students with different ethnicities showed a significant difference in their literacy
growth. The largest literacy growth gain occurred during for the Fall to Spring gain.
White students showed the most growth, while their African American peers showed the
smallest increase. Both White and African American students have significant growth for
the Fall to Winter and the Fall to Spring gains. Hispanic/ Latino students also showed
significant growth during the Fall to Spring gain.
A student’s gender did not show significant differences in literacy growth. Male
and female students averaged the same growth patterns from Fall to the Spring. The same
pattern of growth is seen during the Winter to Spring gain. Males did show a slight
increase their reading level more during the Fall to Winter testing frame, however it is not
significant. Student classification did not show a significant difference for student literacy
growth. Although certain student classification groups made gains during specific gain
periods, Post Hoc analysis proved that no student group had statistically significant
difference between scores. Student background characteristics do show significant
differences in literacy growth, with the expectation of student gender and classification.
77
Next, the interaction effects between the literacy program’s instructional delivery
mode and students’ background characteristics such as gender, ethnicity, and
classification on student literacy growth were examined. The Fall pretest and the Spring
posttest gain scores were used as the dependent variable. There were no interaction
effects between program delivery type and gender. There were also no interaction effects
between program delivery type and students’ classification of learning. All students,
regardless of their classification and gender with their literacy program showed literacy
growth.
On the other hand, the effects of literacy instruction delivery were different for
students with different ethnicities. All students, regardless of their ethnicity, showed
literacy growth in both the scripted and teacher generated literacy programs. More
specifically, both Hispanic/ Latino and African American students achieved higher
growth in a scripted literacy program rather than a teacher generated program. The same
can be said for students labeled “other”. However, White students showed similar growth
between both literacy programs.
Relationship Between Results and Prior Research
As already stated, much of the prior research on the topic of literacy programs
focuses on the effect on teachers, and not students (Powell, Cantrell, & Correll, 2017).
Many of these studies show the negative effect these programs have on teachers (Massey,
2004). According to the literature, these negative effects on teachers trickle down to the
students (Valencia, Place, Martin, & Grossman, 2006). Teachers feel that they are
unprepared to best serve the students and raise their reading levels when all they know is
how to follow a program (Valencia, et al., 2006). This is a major concern as this study
78
focuses on student literacy growth. How can teachers assist students when they do not
have the knowledge and skills to do so (Cohen, Mather, Schneider, & White, 2017)?
The entire purpose of a reading curriculum is to raise student reading levels. This
curriculum is vital and has changed dramatically with the introduction of scripted
programs (Randell, 2018). These programs have now been integrated into the reading
curriculum as the schools react to federal and state pressure (Dresser, 2012). The results
of this study show the importance of a reading curriculum, and the effect it has had on
student literacy growth. It is clear, as stated earlier, that students in scripted literacy
program achieved a higher rate of literacy growth than those in the teacher generated
program.
Past studies have shown how these pre-packaged programs negatively affect
teachers, but the results of this study indicate that the opposite is true for students. The
results of this study show that overall students in a scripted program are more likely to
increase their literacy growth than those students in a teacher generated program. A
student’s ethnicity showed significant differences in literacy growth. Hispanic/ Latino
and African American students achieved higher growth in scripted literacy program
rather than teacher generated program. Although the reasons for this need to be further
researched, a possible reason for this notable finding could be out of the 535 students in
this study, 314 of them were in the scripted program. A larger sample size for the scripted
program could impact the results.
Furthermore, 72% of the students enrolled in the reading programs were either
identified as African American or Hispanic/Latino (Table 2). Breaking that down even
more, 115 students were Hispanic/ Latino and 110 were African American in the scripted
79
program, with only 314 participating (Table 2). Most of the students in the scripted
program were either Hispanic/ Latino or African American. This could be a possible
reason why students who identified as either one of these ethnicities showed a larger
increase in their literacy growth in a scripted reading program.
Moving beyond the possible statistical reasoning for the findings, we should
examine the actual curriculum materials used in the programs. A possible reason for the
positive effect on African American and Hispanic/ Latino students in a scripted program
could be the relatable books, discussion questions, and writing prompts built into the
program. Throughout the LLI program, the books are designed to reach a diversity of
learners. The books have a variety of characters and conflicts in which many of the
students can relate to. In order to teach students higher ordering thinking skills, the
discussion questions and writing prompts are designed to engage students and catch their
attention. For example, a character in the book will be around the same age as a student
and have a problem that a typical middle school student has. This may have peaked the
student’s interest and engagement them in a way to increase their literacy growth.
The teachers and their use of the curriculum and learning materials, in both
programs, may also have led to the positive effect on specific students on their literacy
growth. Teachers in a scripted program were provided with all the needed materials and
trainings. While teachers in the teacher generated program were left to use their
professional judgement and find the curriculum resources themselves. Perhaps teachers in
the teacher generated program did not have the proper resources to accomplish the best
setting for increasing students’ literacy growth. Or was it perhaps that the teachers re
80
used materials and curriculum they already had without taken the student’s individual
reading needs into consideration?
Limitations
One of the major limitations to this study is the use of testing. If a student did not
move a reading level, they could be exposed to the same testing materials twice. This is
likely to happen during the Fall and Winter testing time periods. A second major
limitation to the study would be the setting and selection of participants. The study took
place at one middle school with grades 6-8. In addition, the school is a Title I suburban
public school, with low socio-economic standing. Furthermore, there is a high special
education and English language learners (ELL) population. Continuing, the school is
classified as low performing, based on past state assessment scores. All participants in
this study were two or more grade levels below their assigned grade reading level. This
may restrict the generalizability of the results.
Teaching styles and student relationships with a teacher could also affect the
results in this study. Irrelevancies in the experimental setting could skew results based on
subjective measures. The treatment can be interpreted differently by each instructor and
student. Teaching style and instructor and student relationships effect the experimental
setting. Limitations of this study will be addressed in the next section, to discuss future
research.
Implications for Future Research
Student literacy achievement and scores continue to be an area of concern in the
world of education. With the current trends on student reading levels in America, and all
over the world, schools are acting to address the known gaps (NEAP, 2017). Schools are
81
using these literacy programs as “fixers” and implementing them without the data to
support their effectiveness on students (Dresser, 2012). Further research is needed to see
how these programs effect students. The sample size of this study should be expanded, to
use more participants from various grade levels. This pool of participants should
particularly be expanded to the secondary level of students, as there is a gap in the
research for those students. With that, future research should include a variety of schools,
and not just hyper focus on one school.
Based on the results of this study, research should be conducted to see why a
teacher generated curriculum is not effective in increasing a student’s literacy. With that,
various scripted reading programs should be compared and evaluated. This study only
analyzed one scripted literacy program, Leveled Literacy Intervention. There are a
variety of scripted programs to compare. This researcher suggests that student
demographics continue to be taken while analyzing student literacy growth. If there are
any other available demographic identifiers besides gender, grade level, ethnicity, and
student classification, they should also be used to measure the impact on the student
literacy growth.
Implications for Future Practice
The results of this study show there are benefits to a scripted literacy program. A
scripted literacy program is more effective at raising student reading levels. Although all
students seem to benefit, this is especially seen for students who identify as African
American and Hispanic/ Latino. All grades showed growth, but grade 6 and grade 8
showed the largest increase in literacy growth. It is known, through the literature and
from personal experience that teachers often complain about using a scripted program.
82
However, do they not take into consideration the positive effects it could have on
student’s literacy growth? Teacher complaints about a scripted program hold no ground
when the results of this study prove it to be an effective tool for increasing students’
literacy growth.
It is the recommendation of the researcher, based on the results of this study that
schools look to use scripted literacy programs, especially for Hispanic/ Latino and
African American Students to close the reading deficits in their schools. It is further
suggested that Leveled Literacy Intervention (LLI) be used as an academic intervention
service to provide treatment for those students who are two or more grade levels below
their proper reading level. Teachers should be professionally trained in the program to
implement with fidelity to achieve the proper results.
83
APPENDIX A
Federal Wide Assurance: FWA00009066 Oct 22, 2020 11:35 AM EDT PI: Lindsay Blaszcyk CO-PI: Seokhee Cho Dept: Ed Admin & Instruc Leadership Re: Initial - IRB-FY2021-147 STUDENT ACHIEVEMENT IMPACT: SCRIPTED V. TEACHER- GENERATED LITERACY CURRICULUM Dear Lindsay Blaszcyk: The St John's University Institutional Review Board has rendered the decision below for STUDENT ACHIEVEMENT IMPACT: SCRIPTED V. TEACHER- GENERATED LITERACY CURRICULUM. Decision: Exempt PLEASE NOTE: If you have collected any data prior to this approval date, the data must be discarded. Selected Category: Category 4. Secondary research for which consent is not required: Secondary research uses of identifiable private information or identifiable biospecimens, if at least one of the following criteria is met:
(i) The identifiable private information or identifiable biospecimens are publicly available;
(ii) Information, which may include information about biospecimens, is recorded by the investigator in such a manner that the identity of the human subjects cannot readily be ascertained directly or through identifiers linked to the subjects, the investigator does not contact the subjects, and the investigator will not re-identify subjects;
84
(iii) The research involves only information collection and analysis involving the
investigator’s use of identifiable health information when that use is regulated under 45 CFR parts 160 and 164, subparts A and E, for the purposes of “health care operations” or “research” as those terms are defined at 45 CFR 164.501 or for “public health activities and purposes” as described under 45 CFR 164.512(b); or
(iv) The research is conducted by, or on behalf of, a Federal department or agency
using government-generated or government-collected information obtained for nonresearch activities, if the research generates identifiable private information that is or will be maintained on information technology that is subject to and in compliance with section 208(b) of the E-Government Act of 2002, 44 U.S.C. 3501 note, if all of the identifiable private information collected, used, or generated as part of the activity will be maintained in systems of records subject to the Privacy Act of 1974, 5 U.S.C. 552a, and, if applicable, the information used in the research was collected subject to the Paperwork Reduction Act of 1995, 44 U.S.C. 3501 et seq. Sincerely, Raymond DiGiuseppe, PhD, ABPP Chair, Institutional Review Board Professor of Psychology Marie Nitopi, Ed.D. IRB Coordinator
85
REFERENCES
Ainsworth, M. T., Ortlieb, E., Cheek, E. H., Pate, R. S., & Fetters, C. (2012). First-grade
teachers’ perception and implementation of a semi-scripted reading curriculum.
Language and Education, 26(1), 77-90. doi:10.1080/09500782.2011.618540
Applegate, A. J., & Applegate, M. D. (2010). A study of thoughtful literacy and the
motivation to read. The Reading Teacher, 64(4), 226-234. doi:10.1598/rt.64.4.1
Ardell, A. L., Curwen, M. S., Palma, J., & MacGillivray, L. (2004). Colonized teachers:
Examining the implementation of a scripted reading program. Teaching
Education, 15(2), 131-144. doi:10.1080/1047621042000213575
Brimley, V., Verstegan, D. A., & Garfield, R. R. (2016). Financing education in a
climate of change. Boston: Pearson.
Brown v. Board of Education of Topeka, Shawnee County, Kansas, et al (1954). U.S. 347
(U.S. Supreme Court), p.483.
Brozo, W. G. (2010). The role of content literacy in an effective RTI program. The
Reading Teacher, 64(2), 147-150. doi:10.1598/rt.64.2.11
Cohen, R. A., Mather, N., Schneider, D. A., & White, J. M. (2016). A comparison of
schools: Teacher knowledge of explicit code-based reading instruction. Reading
and Writing, 30(4), 653-690. doi:10.1007/s11145-016-9694-0
Demko, M. (2010). Teachers become zombies: The ugly side of scripted reading
curriculum. Voices from the Middle, 1(3), 62-64.
Dewey, J. (2018). The school and society. New Delhi: Education Foundation.
86
Dresser, R. (2012). The impact of scripted literacy instruction on teachers and students.
Issues in Teacher Education, 21(1), 71-87.
Ede, A. (2006). Scripted curriculum: Is it a prescription for success? Childhood
Education, 83(1), 29-32. doi:10.1080/00094056.2006.10522871
Edwards, L., & Chard, D. J. (2000). Curriculum reform in a residential treatment
program: Establishing high academic expectations for students with emotional
and behavioral disorders. Behavioral Disorders, 25(3), 259-263.
doi:10.1177/019874290002500302
Ehren, B. J., Deshler, D. D., & Graner, P. S. (2010). Using the content literacy continuum
as a framework for implementing RTI in secondary schools. Theory Into Practice,
49(4), 315-322. doi:10.1080/00405841.2010.510760
Fang, Z., Fu, D., & Lamme, L. L. (2004). From scripted instruction to teacher
empowerment: Supporting literacy teachers to make pedagogical transitions.
Literacy (formerly Reading), 38(1), 58-64. doi:10.1111/j.0034-
0472.2004.03801010.x
Heinemann. (n.d.). What is Leveled Literacy Intervention (LLI) and how is LLI used.
Fountas and Pinnell Literacy. https://www.fountasandpinnell.com/lli/
Fountas, I., & Pinnell, G. S. (2011). Assessment Guide: A Guide to Benchmark
Assessment System 2 (2nd ed.). Heinemann.
87
Katz, L. A., & Carlisle, J. F. (2009). Teaching students with reading difficulties to be
close readers: A feasibility study. Language, Speech, and Hearing Services in
Schools, 40(3), 325-340. doi:10.1044/0161-1461(2009/07-0096)
Klages, C., Scholtens, M. M., Fowler, K., & Frierson, C. (2019). Linking science-based
research with a structured literacy program to teach students with dyslexia to read:
Connections: OG in 3D. Reading Improvement, 47-57.
Lee, J. (2013). The relationship between student engagement and academic performance:
Is it a myth or reality? The Journal of Educational Research, 107(3), 177-185.
doi:10.1080/00220671.2013.807491
Mann, H. (2010). Annual reports on education. Place of publication not identified: Nabu
Press.
Margolis, H., & McCabe, P. P. (2006). Motivating struggling readers in an era of
mandated instructional practices. Reading Psychology, 27(5), 435-455.
doi:10.1080/02702710600848023
Massey, D. (2004). “You teach!” beginning teachers’ challenges to teacher educators.
Reading Research and Instruction, 43(4), 75-94.
doi:10.1080/19388070409558417
Mcivor, A., Mcveigh, C., Rushe, T., & O'Callaghan, P. (2016). A randomized controlled
trial of an early-intervention, computer-based literacy program to boost
phonological skills in 4- to 6-year-old children. British Journal of Educational
Psychology, 86(4), 546-558. doi:10.1111/bjep.12122
88
NAEP Nations Report Card - National Assessment of Educational Progress - NAEP.
(2017). Retrieved August 05, 2020, from https://nces.ed.gov/nationsreportcard/
NCES: Data & Statistics. (2017). Retrieved August 05, 2020, from
https://www2.ed.gov/rschstat/landing.jhtml?src=pn
Pearson. (2011). Benchmark Assessment System 2nd Edition Executive Summary.
https://assets.pearsonschool.com/asset_mgr/current/201138/BASExecSummary.pdf
Powell, R., Cantrell, S. C., & Correll, P. (2017). Power and agency in a high poverty
elementary school: How teachers experienced a scripted reading program. Journal
of Language and Literacy Education, 13(1), 93-124.
Prescott, J. E., Bundschuh, K., Kazakoff, E. R., & Macaruso, P. (2017). Elementary
school–wide implementation of a blended learning program for reading
intervention. The Journal of Educational Research, 111(4), 497-506.
doi:10.1080/00220671.2017.1302914
Randall, D. (2018). Charting academic freedom: 103 years of debate. National
Association of Scholars, 1-25.
Schunk, D. (2016). Learning theories: An educational perspective (7th ed.). Carolina del
Norte: Pearson.
U.S. Department of Education. (2020). Data and Statistics. from https://www.ed.gov/
89
Valencia, S. W., Place, N. A., Martin, S. D., & Grossman, P. L. (2006). Curriculum
materials for elementary reading: Shackles and scaffolds for four beginning
teachers. The Elementary School Journal, 107(1), 93-120. doi:10.1086/509528
Vygotsky, L. S., & Cole, M. (1978). Mind in society: The development of higher
psychological processes. Cambridge, MA: Harvard University Press.
Vita
Name Lindsay M. Blaszcyk
Baccalaureate Degree
Bachelor of Arts, Saint Joseph’s College Patchogue, NY Major: English Secondary Education Political Science Secondary English 7-12
Date Graduated June, 2010
Other Degrees and Certificates Master of Arts, Saint Joseph’s College Patchogue, NY Major: Literacy and Cognition Literacy 5-12
Date Graduated June, 2014
Other Degrees and Certificates Master of Arts, Saint Joseph’s College Patchogue, NY Major: Educational Leadership
School Building Leader
School District Leader
Date Graduated May, 2018