Embed Size (px)
Citation preview

THE EFFECTS OF A PAPERLESS CLASSROOM ON
STUDENT ACHIEVEMENT IN THE MIDDLE
SCHOOL SCIENCE CLASSROOM
by
Jason O. Hults
A professional paper submitted in partial fulfillment
of the requirements for the degree
of
Master of Science
in
Science Education
MONTANA STATE UNIVERSITY
Bozeman, Montana
July 2015

©COPYRIGHT
by
Jason O. Hults
2015
All Right Reserved

ii
DEDICATION
Dedicated to my wife Gina and my children: Steven, Jacob, Nicholas, and
Kimberly. Never give up on your dreams; they can come true with patience and
determination. I am proud of each of you and love you all.

iii
TABLE OF CONTENTS
1. INTRODUCTION AND BACKGROUND .......................................................................... 1
2. CONCEPTUAL FRAMEWORK .......................................................................................... 5
3. METHODOLOGY ................................................................................................................ 9
4. DATA AND ANALYSIS .................................................................................................... 14
5. INTERPRETATION AND CONCLUSION ....................................................................... 19
6. VALUE ............................................................................................................................... 21
REFERENCES CITED ........................................................................................................... 24
APPENDICES ......................................................................................................................... 26
APPENDIX A Institutional Review Board Memorandum ......................................... 27
APPENDIX B Standard Format of Pre and Post Test ................................................ 29
APPENDIX C Hults Engagement and Attitude Survey (Post Treatment) ................. 34
APPENDIX D Hults Engagement and Attitude Survey (Pretreatment) ..................... 36
APPENDIX E Hults Student Interview Questionnaire ............................................... 38

iv
LIST OF TABLES
1. Data Triangulation Matrix ................................................................................................... 14
v
LIST OF FIGURES
1. Average Percent Growth from Pretest to Posttest
by Achievement Level Group ......................................................................................15
2. Average Percent Growth by Achievement Level Group ..............................................16
3. Average Normalized Gain by Achievement Level Group ............................................16
4. Student Responses to “I felt more engaged in science during the
paperless unit than I did in the traditional unit” on the
Hults Engagement and Attitude Survey ........................................................................17
5. Comparison of Student Responses to Hults Engagement and
Attitude Survey (Pretreatment versus Post Treatment) ...............................................18

vi
ABSTRACT
The purpose of the study was to determine the effects of a paperless classroom on
student achievement in the middle school science classroom. Two sections of eight grade life
science students were used in the study. Each section of students was exposed to a paperless,
online format of instruction and assessment for two chapters during a four-chapter unit and
was required to do two chapters in the traditional paper orientated format. Student
achievement was measured by pre and posttest assessments, with the treatment chapters
compared to the non - treatment chapters to determine the overall effect of the paperless
classroom on student achievement.

1
INTRODUCTION AND BACKGROUND
As a veteran teacher of 20 years, I have seen many initiatives come and go in the
education world. From Differentiated Learning to Multiple Intelligences, it seems that as
educators we have always looked for the next big idea that would solve all our problems
and help our students be the best and brightest ever. Technology and its use and
implementation in schools across the country have been no exception.
From my own experiences, I have seen technology use in the classroom grow by
leaps and bounds. When I first started teaching in 1994, the school I taught at had a total
of 12 computers in the entire building, and most of them were in administrator’s or their
secretaries’ offices. As I moved to another district and the years went by, I observed
computer labs becoming available for all teachers to access with their students, and
funding appeared for technology based probes and software for use in my own classes.
When I started at my current school district in 1999, the building had 1 computer lab with
20 computers and each teacher had a desktop computer in their room. Today my building
has 2 computer classrooms with 25 computers in each room, every teacher has a laptop,
every classroom has a Promethean Board, and the whole building has Wi-Fi. Our
building also has 2 mobile laptop carts with 25 laptops in each one. The English
department has 40 Kindles that they share between 2 classrooms. The school district’s
Project Lead The Way teacher wrote a grant that allowed the school to buy 18 iPads. The
availability and lower costs of technology has changed the way I and other teachers
approach our classrooms.

2
The advance of technology use in our schools has paralleled the advance of
technology in our society. From the first mobile brick phones to the current generation of
smart phones, today’s students have seen technology become a larger part of their lives
every day. In my own home, each of my children and my wife has smartphones and
laptops. As a society, we have relied on technology more and more every day for
communicating, keeping our calendars and schedules aligned, and for learning. As a
senior in high school, my daughter had the option of taking online classes for the first
time for dual high school and college credit, and she is entering college this fall with 18
credits already completed. My three sons in college have each had multiple classes
taught in the online format. I have seen more and more of the classes I have taken to
further my education over the past 20 years taught through distance learning and the
online format similar to that which the Masters of Science in Science Education (MSSE)
program follows. It seems like every day there are more and more online or distance
learning opportunities available to not only our students but also to adults to further their
education and careers.
As these technological advances have made their way into our schools, the
students have changed as well. I have noticed it more in this past year in particular,
because my current group of students could not survive without their phones. I was
constantly fighting the battle to have them put their phones away until we were done with
the lesson or activity of the day.
I teach in Villisca, IA, a small, rural community of 1252 people (2010 Census).
Our district just finished the second year of a whole-grade sharing agreement with a

3
neighboring district approximately twice the population of our own. In the state of Iowa,
whole-grading sharing allows school districts to share the expenses of educating their
students, while offsetting costs and receiving financial incentives from the state. In the
case of our two school systems, my building became the middles school, while their
building became the high school. This means that all 6-8 grade students from both
districts come to our middle school campus in Villisca while all 9-12 grade students go to
the high school campus in Corning. After teaching high school for 19 years, 14 of them
for the Villisca Community Schools, I now teach middle school for Southwest Valley
Schools. Two years ago my building was a grade 6-12 building with approximately 165
students, and is now a grade 6-8 building with 144 students.
According to statistics from the Iowa Department of Education Website (2015),
during the 2014 – 2015 school year the student population was 97.22% Caucasian, 0.69%
Asian, and 2.08% Native American. The student body overall is 52% boys and 48%
girls. The Free and Reduced Lunch program served 52.78% of the students, which
reflects the lower socioeconomic backgrounds associated with the southern counties in
Iowa. Our building has a Level 1 Behavioral Disorder Room (BD Room) and 4.5% of
the student population was identified as BD students. A total of 15.28% of the overall
student population had an Individualized Education Plan (IEP).
In the spring of the 2013-2014 school year, the school district conducted a
technology survey of students, parents, and staff members using an online survey and
data analysis website called Clarity. According to results of the survey (Southwest
Valley Schools Technology Survey, May 2014), 90% of students reported having Internet

4
access at home as well as access to a device. The same students reported that 69% had to
share a device with others within their home. When asked about basic computing skills
such as sending emails or creating spreadsheets, 20% of the students reported finding
these tasks easy to perform.
I went from being the only high school science teacher, with six different preps a
day and approximately 100 students in my classes, to being the only middle school
science teacher with 3 different preps and 142 students a day. Last year I taught seven
sections out of an eight period day. I saw every student every day, with the exception of
2 boys who were in the BD room for all day instruction. The change from high school
students to middle school students has not been easy for me because they are so different.
I am looking forward to returning to the high school for the 2015-16 school year where
my teaching comfort level is. And one of their differences is the need for technology use.
I will admit that I am an old school teacher. When I student taught, it was with a
30 year veteran who stood in front of the classroom and lectured every day. I used to do
that, but I realized many years ago that I was not getting through to all of my students
using that teaching style. I still present to my classes on average three times a week, but
the presentations are more interactive, and technology has allowed me to do that. I use
the Promethean Board daily, and often have students come to the board and perform
some form of interactive activity that is part of the lesson. My classes often do research
using the schools laptops for major projects, such as researching alternative energies or
food chains in various ecosystems. But a few years ago, I began to wonder how the use
of technology was impacting the students? And I also started to question if we were
5
preparing them adequately for the digital word they would be living in? These were the
seeds of my desire to move to a paperless classroom.
At the end of the 2012-2013 school year, the superintendent asked our district
lead team, of which I was a member, to start to look into the 1-to-1 Laptop Initiative,
because he was interested in moving our district in that direction. During our last
discussion, the superintendent stated that we would not make the move to 1-to-1 laptops
until the 2015-16 school year at the earliest. This allowed me the perfect window of
opportunity to test how effective student integration with technology could be before the
school district invests in 100 or more additional laptops.
My primary research question was, What are the effects of the paperless
classroom on student achievement in the middle school science classroom? The sub-
questions to my research study were as follows:
1) How does the paperless classroom affect student engagement?
2) How does the paperless classroom affect student attitudes toward science?
CONCEPTUAL FRAMEWORK
The idea of a paperless classroom has evolved side by side with the development
of computer technology available to school systems. As Davis (2002) lamented
One day I’d be found alone in my office, still clutching my pen, rigor mortis
having set in, buried under a mountain of papers, assignments, and projects. It
was this frightening vision that ultimately prompted me to devise what I needed, a
more efficient and effective method for responding to and filing paperwork.
(p. 162)

6
Although educators have always sought ways to be more efficient in handling the day-to-
day organizational aspects of student assignments, this quest for efficiency is only one of
many reasons that the paperless classroom concept has become more popular in schools
around the world.
The driving force behind every education initiative of the last 100 years has been
student achievement. Since the first computers made their way into schools, thousands of
studies have been undertaken to determine what effect the use of technology has on
student achievement outcomes. Many of these studies have yielded negative results.
One review of selected literature suggested that the use of technology is actually
detrimental to student achievement (Wenglinsky, 2006). Other studies suggest that it is
how the technology is used in the classroom (Shapley, Sheehan, Maloney, & Caranikas-
Walker, 2011; Papanastasiou, Zembylas, & Vrasidas, 2003), how effectively the teachers
are trained to use the technology (Bester & Brand, 2013), or the students’ attitudes
towards the use of technology (Kay, 2011) that can negatively impact the overall
effectiveness of technology implementation on student achievement in schools.
There are also numerous studies that have shown positive results on student
achievement from the use of technology. Many of these studies have used the 1:1 laptop
initiative as the technology implementation in their research. Zucker and Hug (2008)
demonstrated that teachers needed to develop a new skill set that combined not only
content knowledge and effective pedagogy for the content, but also the skills to
effectively use technologies in the right way to maximize their potential. They called this
new skill set technological pedagogical content knowledge or TPCK. Through the use of

7
TPCK, teachers can more effectively use the technology tools available to them to
maximize the learning potential of their students. Survey results from this study
suggested that the majority of students, teachers, and administrators all believed the use
of 1:1 computers had a positive impact on student achievement (Zucker & Hug, 2008).
Other studies into the 1:1 laptop implementation have shown that student
engagement and students’ overall attitude about school increase because of the access and
use of technology (Zucker & Light, 2009). Another study concluded that the 1:1 laptop
model produced positive effects on student engagement and student behavior, but a
negative effect on student attendance (Shapley et al. 2011). Shapley proposes one reason
for the lower attendance rate was the students’ frustration with lower technology use at
school causing the students to stay home where they could utilize the laptops more often.
A third study showed a positive effect on student achievement overall, but that a gender
difference existed with males in the treatment group demonstrating larger gains than
females (Dunleavy & Heinecke, 2008). In all the case studies surveyed, the researchers
strongly suggested that more in-depth research with larger sample sizes is needed to
validate their findings.
Having the availability of 1:1 laptops or iPads is an essential first step to creating
a paperless classroom and having the software to support them is the second. Kay (2011)
studied the effectiveness of web-based learning tools (WBLTs) in the science classroom.
In her findings, she identified a number of criteria that support the use of WBLTs in the
paperless classroom. First, all teachers, with minimal training or experience, can easily
use WBLTs. Second, WBLTs have simply defined objectives, which can be easily

8
incorporated into lesson plans. Third, WBLTs are by their very nature accessible over
the Internet, making it easy to use in a wireless setting or a computer lab. Fourth, the
reusability of WBLTs makes them excellent tools to use in multiple classrooms from day
to day and year to year. Finally, WBLTs allow the students to set the pace of their own
learning, allowing for immediate feedback and eventual mastery of the concept. One of
the conclusions from this study found that the use of WBLTs produced significant gains
in student achievement, with some students showing increases of up to 40% on
standardized assessments (Kay, 2011).
Other studies looked into the effects of information technologies such as email,
web-based discussion boards, and teacher - developed websites on the performance of
students in paperless classrooms. One study found that students developed more
advanced organizational skills through the use of archival and retrieval tools, which
helped increase their achievement levels (Waskowitz, 2001). Davis (2002) discovered
that the implementation of a 60/40 model in his classrooms, where 60% of the course
work is done in class with technology tools and 40% is completed outside of class time
with web-based discussion boards, live chat, and emails increased the students’ efficiency
in turning in work on time. This allowed for more immediate feedback on the
instructor’s part, which in turn had a direct impact on the students’ achievement levels in
the course.
An additional set of research looked at the effectiveness of electronic assessments
on student achievement. The goal of the various electronic assessment tools is to provide
immediate onsite evaluations and feedback to the student (Edward, 2007). Osuji (2012)

9
notes that the use of electronic assessment will provide the learners the ability to work at
their own pace, anytime and anywhere that they choose, which can have a positive effect
on the student’s learning. In the same study, Osuji stated, “due to the personalized nature
of electronic assessments, their use can increase the validity of the assessment by
decreasing cheating and plagiarism that can occur in more traditional paper testing
scenarios” (p. 149).
The paperless classroom has other benefits to a school system. A few studies
focused on the cost savings to a district that the paperless classroom provides. One study
emphasized the impact on environmental awareness and education about sustainability
that the paperless classroom affords the educator (De Bonis & De Bonis, 2011). Another
study identified a 48% cost savings in paper usage for the science department from the
year before the implementation year (Arney, Jones, & Wolf, n.d.). Although these
considerations should be included when a school district decides to implement the
paperless classroom concept, they should be less relevant than the potential impact on
student achievement.
METHODOLOGY
The purpose of the study was to determine the effects of a paperless classroom on
student achievement in the middle school science classroom. The treatment for this
classroom research project included using two sections of eight-grade life science in a
rotating treatment/non-treatment group approach. Each section received the treatment for
two chapters during a four - chapter unit on ecosystems during March and April. The
research methodology for this project received an exemption by Montana State

10
University’s Institutional Review Board and compliance for working with human
subjects was maintained (Appendix A).
The eighth grade class contained 43 students divided into 2 sections of 19 and 24
students. The class overall contained 22 females, with 17 being 14 years old and the
remaining 5 being 13 years old. The class also contained 21 males, with 16 being 14
years old and the remaining 5 being 13 years old. According to information obtained
from school records by the secretary, all the students reported being of Caucasian decent
and 42% were eligible for the Free and Reduced Lunch Program (T. Swenson, personal
communication, April 10, 2015).
The treatment involved the use of school provided laptops for all instructional
tools during the treatment period. Students used Google Docs, Google Drive, Adobe,
Doc Hub, and Gmail to complete and submit assignments. The same worksheets
provided in the curriculum materials were used for both sections. Assignments were
scanned into the computer and converted into a pdf format using Adobe Pro software or
converted to a Google Docs format and shared with the students through their school
provided Gmail accounts. Each of the two sections received a shared folder through
Google Drive into which assignments were placed. Students were able to use the school’s
laptops during class time as well as during their study halls to work on the assignments
using Google Docs, Adobe, or Doc Hub depending on which software package was on
the laptop and their own personal preferences. Students could also access the assignments
at home through their Gmail accounts using their home computers if they needed to.
Assignments were then submitted electronically by the deadline to be graded. Students in

11
the non-treatment section received the worksheet in a traditional paper form and
submitted it when completed in the designated turn in box for their respective class
period.
Lectures and other presentation materials were presented to both sections using
the Promethean Smart Boards in the classroom. During the treatment chapters, students
were provided the notes in a Google Docs format for later review, while the students in
the non-treatment class were required to take notes in their notebooks. Students were
given a grade at the end of the unit for all notes taken during the unit based on teacher
observations of participation.
Hands on lab activities were supplemented by using Google Sheets for recording,
graphing, and analyzing data during the treatment chapters. The sections receiving the
treatment chapters were provided the lab activity electronically. Students were allowed
to use the laptops at their lab stations to read the lab directions and record any
observations as they worked through the lab activity. Completion of the lab write-ups and
turn in for grading was also completed electronically. The non-treatment sections
performed the same lab activities, but were provided paper copies of the lab and
completed any required graphing and analyzing of data by hand.
The primary research question, What is the effect of a paperless classroom on
student achievement, was evaluated through the use of pre and post-tests during each
chapter of the unit. Chapter pre and post-tests, provided in the curriculum materials, were
conducted in the online format for assessments during the treatment chapters using
Google Forms. The non-treatment section was given a traditional paper version for their

12
pre and post-tests. The same test format (Appendix B) was used for each chapter, so that
student improvement could be determined by comparing the students’ pre and post-test
scores. During the treatment and non-treatment chapters, raw score data from pre and
posttest’s were recorded by class for simplicity. The differential between the pretest and
posttest for each student during each chapter was then recorded and compiled into
achievement level groups. The data was then further analyzed to find the Average Raw
Score Differential for each achievement level group during both treatment and non-
treatment chapters.
Standard normalized gain for each student was determined based on the raw score
data. Once assigned into the achievement level groups, the average standard normalized
gain was calculated for the treatment and non-treatment chapters for each student.
Finally, the average normalized gain for each achievement level group was calculated for
both treatment and non-treatment chapters within the classroom research project.
During the course of the classroom research project, I wanted to determine how
the paperless classroom would affect different achievement level groups. I assigned the
students to high, middle, and low achievement groups based on data acquired from Iowa
Assessment scores and Measures of Academic Progress (MAP) test scores. Iowa
Assessment scores used for the study were based on seventh grade results, as the Iowa
Assessments were not administered until late April during the 2014 – 2015 school year.
The Iowa Assessment had been given to the students in the winter of their seventh grade
year, so I choose a National Grade Equivalent (NGE) score of 7.5 as a grade level
reference point to divide the achievement level groups. Students were assigned to the

13
low achievement group if their NGE was one year below grade level (NGE < 6.5).
Students were assigned to the middle achievement group if their NGE was plus or minus
one grade level (6.6 < NGE < 8.5), while students with a NGE greater than one grade
level (NGE > 8.6) were assigned to the high achievement group. MAP testing was
completed in the fall and spring semesters during the 2014 – 2015 school year, and the
fall results were used. These assessments showed the yearly growth the students had
made in science between seventh and eight grade. This data was used to validate the
placement of students into the assigned achievement groups.
The first secondary question, How does the paperless classroom affect student
engagement, was measured by teacher observations throughout the unit. These
observations included monitoring on-task versus off-task behavior during class time. On-
task behavior involved students working on science related assignments. Off-task
behavior included students doing schoolwork other than science, or using the computer
for non-science related tasks such as chat, YouTube, Facebook, or games. Tracking the
number of late assignments during treatment and non-treatment units also provided data
related to student engagement. The Hults Engagement and Attitude Survey (Post
Treatment) (Appendix C) was used to measure the student’s perspective of their own
engagement during both the treatment and non-treatment units. The online survey tool
SurveyMonkey was used to create the student surveys. The students were asked at the
beginning and end of the unit to access the survey through a link sent to their emails.
Student responses to the Hults Engagement and Attitude Survey (Post Treatment) were
analyzed using a five point Likert scale weighted average.
14
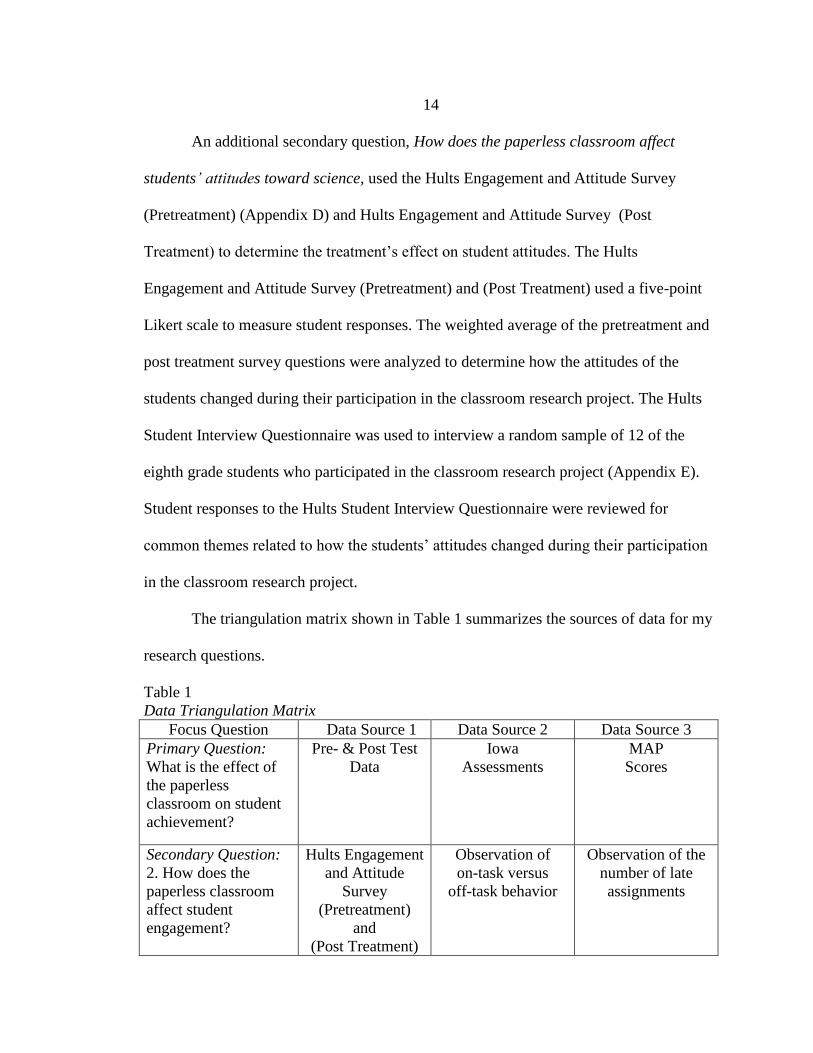
An additional secondary question, How does the paperless classroom affect
students’ attitudes toward science, used the Hults Engagement and Attitude Survey
(Pretreatment) (Appendix D) and Hults Engagement and Attitude Survey (Post
Treatment) to determine the treatment’s effect on student attitudes. The Hults
Engagement and Attitude Survey (Pretreatment) and (Post Treatment) used a five-point
Likert scale to measure student responses. The weighted average of the pretreatment and
post treatment survey questions were analyzed to determine how the attitudes of the
students changed during their participation in the classroom research project. The Hults
Student Interview Questionnaire was used to interview a random sample of 12 of the
eighth grade students who participated in the classroom research project (Appendix E).
Student responses to the Hults Student Interview Questionnaire were reviewed for
common themes related to how the students’ attitudes changed during their participation
in the classroom research project.
The triangulation matrix shown in Table 1 summarizes the sources of data for my
research questions.
Table 1
Data Triangulation Matrix
Focus Question Data Source 1 Data Source 2 Data Source 3
Primary Question:
What is the effect of
the paperless
classroom on student
achievement?
Pre- & Post Test
Data
Iowa
Assessments
MAP
Scores
Secondary Question:
2. How does the
paperless classroom
affect student
engagement?
Hults Engagement
and Attitude
Survey
(Pretreatment)
and
(Post Treatment)
Observation of
on-task versus
off-task behavior
Observation of the
number of late
assignments

15
Secondary Question:
2. How does the
paperless classroom
affect students’
attitudes toward
science?
Hults Engagement
and Attitude
Survey
(Pretreatment)
and
(Post Treatment)
Hults Student
Interview
Questionnaire
Teacher
Observations
DATA AND ANALYSIS
The Low Achievement Level Group (LALG) showed a wide range of values
when pretest to posttest data was compared (n=17). The average non-treatment percent
growth ranged from a value of -5% to 16% on a 100-point scale, with a mean value of
3.29%. The average treatment percent growth for the LALG was higher, as indicated by
a mean value of 5.82% within a range of -5% to 18%. The Middle Achievement Level
Group (MALG) data reflected a similar pattern (n=12). Average non-treatment percent
growth data for the MALG showed a range of values from -1.5% to 5% on a 100-point
scale, with a mean value of 3.5%. The MALG showed a positive increase during the
average treatment as the mean increased to 5.5% within a range of -2% to 8.5% on a 100-
point scale. The High Achievement Level Group (HALG) also showed positive growth
overall (n=14). Average non-treatment percent growth data for the HALG showed a
range of values from -2% to 8% on a 100-point scale, with a mean value of 2.57%. The
HALG showed a positive increase during the average treatment as the mean increased to
4.0% within a range of 0% to 8% on a 100-point scale (Figure 1).

16
Figure 1.
Average percent growth from pretest to posttest by achievement level group, (N=43).
Note. Avg NT = Average of Non-Treatment Chapters, Avg T = Average of Treatment
Chapters, HALG = High Achievement Level Group, (n=14), MALG = Middle
Achievement Level Group, (n=12), LALG = Low Achievement Level Group, (n=17).
In a final analysis of the pretest and posttest data, the average percent growth for
each achievement level group was determined. Comparing the values for each
achievement level group, a larger gain for all achievement level groups in the treatment
chapters is evident (Figure 2).
Figure 2. Average percent growth by achievement level group, (N=43).
Note. LALG = Low Achievement Group, (n=17), MALG = Middle Achievement Group,
(n=12), HALG = High Achievement Group, (n=14).
-10.00 -5.00 0.00 5.00 10.00 15.00 20.00
LALG Avg T
LAGL Avg NT
MALG Avg T
MALG Avg NT
HALG AVG T
HALG AVG NT
5.82
5.50
4.00
3.30
3.50
2.56
LALG
MALG
HALG
Avg Non Treatment Avg Treatment

17
The average normalized gain during the treatment and non-treatment units was
then calculated for each achievement level group (Figure 3).
Figure 3. Average normalized gain by achievement level group, (N=36).
Note. LALG = Low Achievement Group, (n=17), MALG = Middle Achievement Group,
(n=12), HALG = High Achievement Group, (n=7).
In observations made at the start of the treatment units, I observed students
performing off task behaviors such as chat or YouTube approximately 25% of the time.
As the treatment progressed, the number of students actively engaged increased, with the
frequency of off task activities decreasing to less than five percent of the time. During
the course of the classroom research project, a total of 17 assignments were given. This
results in a total of 731 worksheets, labs, and activities that were handed in. During the
non-treatment units, 42 assignments out of a total of 363 were turned in late, or 11.6% of
the total assignments. Late assignments were reduced during the treatment units with
only 14 late assignments out of 368 total, or 3.8% of all assignments. On the Hults
Engagement and Attitude Survey (Posttest), 74% of students agreed or strongly agreed
that they felt more engaged in science class during the paperless unit (Figure 4).
0.212
0.247
0.335
0.108
0.130
0.211
LALG
MALG
HALG
Avg NT Avg T

18
Figure 4. Student responses to “I felt more engaged in science during the paperless unit
than I did in the traditional unit” on the Hults Engagement and Attitude Survey, (N=42).
Student responses using weighted averages on a five point Likert scale were used
to compare the pretreatment to post treatment survey responses on the Hults Attitude and
Engagement Survey (N = 42). Five of the seven survey questions show positive gains
ranging from 0.1 to 0.38 in the weighted average caused by an increase in positive
students responses of agree or strongly agree of 9.5% to 16.7% of the students surveyed.
The weighted average of one question decreased by one tenth due to a negative two point
four percent shift in student responses caused by one student. The survey question, Using
technology in the classroom scares or intimidates me, showed the largest positive gain in
the weighted average of all the questions with a value of 0.43 caused by an 11.9%
increase in agree or strongly agree responses (Figure 5).
0%
12%
14%
33%
41%
Strongly Disagree
Disagree
Neither Disagree Nor
Agree
Agree
Strongly Agree

19
Figure 5. Comparison of student responses to Hults Engagement and Attitude Survey
(Pretreatment versus Post Treatment), (N= 42). Note: Weighted averages on a 5 point
Likert Scale where 1 = Strongly Disagree and 5 = Strongly Agree.
Student responses to the Hults Student Interview Questionnaire (N = 12) showed
a positive impact created by the paperless classroom treatment in almost every question
and student interviewed. All 12 students interviewed expressed a desire to continue the
paperless classroom, with the exception of one female student who said “except for labs,
they would be easier without the computer getting in the way.” In responding to how the
students enjoyed using computers during the unit, nine of the students responded that it
made them more organized, and seven responded that they “didn’t have to worry about
losing assignments because they were online.”
3.62
3.83
2.98
3.45
3.93
1.81
3.83
3.83
3.93
3.29
3.83
3.83
2.24
3.98
4.02
Science interests me:
I enjoy science:
I want to pursue a career in science:
I think science is challenging:
I think the use of technology in the
classroom would make science more…
Using technology in the classroom
scares or intimidates me:
I prefer to use technology in the
classroom to do my schoolwork…
I felt more engaged in science during
the paperless unit:
Pretreatment Post Treatment

20
When asked about concerns or fears that the students had before participating in
the paperless classroom, concerns about “how to turn in assignments” and “would the
computers work when we needed them to” were expressed by half of the students
interviewed. But 10 of the 12 students expressed a common theme that using the
computers became easier as they became more familiar with the experience. When asked
how their attitude changed toward science, 9 of the 12 students responded in some form
that it made science easier and that their attitude improved. One male student replied
“My attitude got better, and it felt like the computers were a good fit for science
compared to other classes where it would have been harder.”
INTERPRETATION AND CONCLUSION
The primary research question, What are the effects of the paperless classroom on
student achievement in the middle school science classroom, can be answered by looking
at the percent growth from pretest to posttest and the change in average normalized gain.
All three achievement level groups showed positive change in percent growth (Figure 2).
Variation in the scores between groups can be attributed to multiple factors. The larger
value of 2.52% for the Low Achievement Level Group (LALG) can be attributed to
lower pretest scores before instruction being offset by large gains on posttest
assessments. The smaller value of 1.44% for the High Achievement Level Group
(HALG) can be attributed to the opposite effect. The HALG regularly scored higher on
pretest assessments, which allowed for little, or in some cases zero growth resulting in an
overall lower average percent growth. An additional contributing factor in the HALG is

21
that on six occasions students scored the maximum value on the pretest and then scored
lower on the posttest, resulting in deflation of the average percent growth value.
The average normalized gain values also show a positive growth trend for all
achievement level groups (Figure 3). However, the validity of the values comes into
question for numerous reasons. First, the relative sample sizes for each achievement
group are small, ranging from 12 to 17. Second, because only two chapters were used in
both the treatment and non-treatment phases of the action research project, there is a
limited data set to use in statistical calculations. Finally, in the HALG, six students
scored lower on the posttest after scoring the highest maximum value on the pretest. This
resulted in almost half of the data for the HALG being discarded because the average
normalized gain could not be calculated for those students.
One set of factors that also could have affected all three achievement level groups
but could not be tangibly measured includes the subject material and students prior
knowledge and interest. The classroom research project was conducted during an
ecosystem unit of a life science class using eighth grade students. The interest level of
the students related to the actual subject matter was not quantitatively assessed during the
study and may have played a role in the outcome of the action research. Teacher
observations made during the unit of student engagement did show that the majority of
students were involved and on task the majority of the time.
Looking at the results of the Hults Engagement and Attitude Survey, it appears
that the paperless classroom had a positive impact on both student engagement and on
student attitudes toward science (Figure 5). Five of the seven questions asked on both the

22
pretreatment and post treatment surveys showed a positive gain in the weighted average
value as well as an increase in the total percentage of students responding agree or
strongly agree. The decrease in value for the question I think the use of technology in the
classroom would make science more interesting can be attributed to one student response
changing from strongly agrees to strongly disagree. Due to the anonymity of the survey
being conducted online, it was not possible to follow up with this one student to
determine why his or her attitude changed so dramatically. The results of question Using
technology in the classroom scares or intimidates me, which can be interpreted as a
negative impact, could be in response to student frustrations caused by technology issues
when the computers did not work as intended.
Student responses during the exit interviews conducted using the Hults Student
Interview Questionnaire were overwhelmingly positive. When conducting the
interviews, I observed all the students had a positive attitude about their experience and
participation in the paperless classroom. Many of the other students who were not
involved in the interviews also expressed positive comments and a desire to continue the
paperless classroom experience.
Although the data suggests that the paperless classroom treatment used in the
study was beneficial to the students by showing positive growth trends in both average
percent growth and average normalized gain, as well as student engagement and overall
attitude toward science, several questions can be raised. If the action research were
completed over a longer period of time encompassing more units, producing a more
reliable data set, would the results be similar? If a larger sample size of students were

23
used, would the outcome of the action research be the same? Finally, would similar
results be obtained if the action research were competed with the students studying
different content material?
VALUE
Conducting this classroom research project has impacted my teaching and my
classroom in several ways. First, it has made me aware that I am not as technologically
savvy as I thought I was. From my participation in a number of online courses and using
computers for the last 30 years, I felt I would be able to handle any technology issues,
which my students and I began to call “technology hurdles,” that would come up during
the course of the project. I very quickly learned that I was not as proficient on many of
the newer software programs that were available as I needed to be. I began to rely on my
students and other faculty members to help us get over those hurdles.
I spent a large amount of time practicing and becoming familiar with Google
Docs, Sheets, and Forms before I unleashed them on the students, and I still relied on
many of the students to help get other students over the hurdles, somewhat in a peer
tutoring style. Early in the projects planning stages, I relied heavily on other teachers in
the building who had experience with online teaching or who had attended the Google
Docs 101 class offered by our local Area Education Agency (AEA), which I wish I had
attended before beginning this classroom research project. I hope that I can find
opportunities to expand my technology knowledge so that I can incorporate more of it
into my classroom in the future.

24
I also learned that many of the teaching strategies that I learned and have
practiced for the last 20 years do not necessarily work with today’s students in a
technology oriented paperless classroom. Lecturing three days a week and having the
students do a group activity or lab the other two days was working for most of my
students. After seeing them do research online and participate in more collaborative and
performance based activities due to the use of technology; and seeing their engagement
level and attitudes increase because of that has opened my eyes to the possibilities that a
paperless classroom or 1:1 computer initiative can offer. I plan to implement many more
of these types of activities into my classroom so that I can more effectively engage my
students.
I do feel that my students also benefited from their participation in the paperless
classroom in a few ways. The majority of the students enhanced their basic computer
skills, from learning how to create formulas on a spreadsheet to creating and
manipulating graphs using Google Sheets. They learned how to use drop boxes and
create folders to help their organizational skills by using Google Drive. Some of them
made slide show presentations for the first time in their school careers. All of these skills
will be beneficial to them as they move on to high school, college, and eventually the
work force.
As I reflect on the overall experience, it has made me want to continue to pursue a
paperless classroom. Since I am transferring to the high school building next year and do
not fully know the amount of technology resources available to me; I will have to be
flexible as I try to plan for the coming school year. Due to my position on the district’s

25
Lead Team, I will be an advocate for our school district moving toward a 1:1 computer
model. I will also use my position on the lead team to encourage technology focused
Professional Development for my colleagues. Finally, I will encourage other teachers in
my district to embrace the benefits that technology can bring to our students.

26
REFERENCES CITED

27
Arney, J., Jones, I. & Wolf, A. (n.d). Going Green: Paperless Technology and Feedback
from the Classroom. Journal of Sustainability and Green Business (pp 1-9).
Retrieved February 12, 2014, from http://www.aabri.com/manuscripts/10539.pdf
Bester, G. & Brand, L. (2013). The effects of technology on learner attention and
achievement in the classroom. South African Journal of Education, 33(2), Article
405. Retrieved February 21, 2014, from http://www.sajournalofeducation.com.za
Davis, D, (2002). The Paperless Classroom: E-filing and E-valuating Students' Work in
English Composition. Teaching English in the Two-year College , 30 (2), 162-
176.
De Bonis, S. & De Bonis, N. (2011). Going Green: Managing a Paperless Classroom.
US – China Education Review (pp 83-87). Retrieved February 14, 2014, from
http://eric.ed.gov/?id=ED522208
Dunleavy, M. & Heinecke. W. (2008). The Impact of 1:1 Laptop use on Middle School
Math and Science Standardized Test Scores. Computers in the Schools:
Interdisciplinary Journal of Practice, Theory, and Applied Research, 23(3-4),
7-22.
Edwards, C. & Rule, A. (2013). Attitudes of Middle School Students: Learning Online
Compared to Face to Face. Journal of Computers in Mathematics and Science
Teaching, 32, 49-66.
Edwards, R. (2007). But Can They Do It? High Tech, Real Time Performance
Evaluation.
On the Horizon, 15(2) 118 – 123. Emerald Group Publishing Limited. Retrieved
February 23, 2014, from
http://www.emeraldinsight.com/Insight/viewContentItem.do?contentType=Articl
e&hdAction=lnkpdf&contentId=1603560&history=true
Hesser, T. & Schwartz, P. (2013). iPads in the science laboratory: experience in
designing and implementing a paperless chemistry laboratory course. Journal of
STEM Education, 14(2), 5-9.
Iowa Department of Education. (2015). School Demographics 2014-2015. Retrieved
from http://reports.educateiowa.gov/Home/reportWrapper
Kay, R. (2011). Examining the Effectiveness of Web-Based Learning Tools in Middle
and Secondary School Science Classrooms. Interdisciplinary Journal of E-
Learning and Learning Objectives, 7, 359 – 374.

28
Mason, D. (2003). It's not the Way I Learned. Journal of Chemical Education, 80(11),
1233.
Osuji, U.S.A. (2012). The use of E-Assessments in the Nigerian Higher Education
System. Turkish Online Journal of Distance Education, 13, 140-152
Papanastasiou, E., Zembylas, M., & Vrasidas, C. (2003). Can computer use hurt science
achievement? The USA results from PISA. Journal of Science Education and
Technology, 12(3), 325-332.
Shapley, K., Sheehan, D., Maloney, C., & Caranikas-Walker, F. (2011). Effects of
Technology Immersion on Middles School Students' Learning Opportunities and
Achievement. The Journal of Educational Research, 104, 299 - 315.
Southwest Valley Schools Technology Survey. (May 2014) Retrieved from
https://clarity.brightbytes.net
United States Census Bureau, 2010 Census. (2015) Villisca, IA Census 2010. Retrieved
from http://www.zip-codes.com/city/IA-VILLISCA-2010-census.asp
Van Eijck, M., & Roth, W-M. (2007). Rethinking the role of information technology-
based research tools in students’ development of scientific literacy. Journal of
Science Education and Technology, 16(3), 225-238.
Waskowitz, B. (2001). In praise of the paperless classroom. Independent School, 61(1),
11.
Wenglinshy, H. (2006). Technology and Achievement: The Bottom Line. Educational
Leadership, 63(4) 29 – 32.
Zucker, A. & Hug, S. (2008). Teaching and learning physics in a 1:1 laptop school.
Journal of Science Education and Technology, 17(6), 586-594.
Zucker, A. & Light, D. (2009). Laptop programs for students. Science, 323, 82-85.

29
APPENDICES

30
APPENDIX A
INSTITUTIONAL REVIEW BOARD MEMORANDUM

31

32
APPENDIX B
STANDARD FORMAT OF PRE AND POST TEST

33

34

35

36

37
APPENDIX C
HULTS ENGAGEMENT AND ATTITUDE SURVEY
(POSTTREATMENT)

38
Participation in this survey is voluntary and participation or non-participation will not
affect a student’s grade or standing in the class in any way.
Evaluate the following statements.
1) Science interests me:
Strongly Disagree Disagree Neither Disagree Nor Agree Agree Strongly Agree
2) I enjoy science:
Strongly Disagree Disagree Neither Disagree Nor Agree Agree Strongly Agree
3) I want to pursue a career in science
Strongly Disagree Disagree Neither Disagree Nor Agree Agree Strongly Agree
4) I think science is challenging
Strongly Disagree Disagree Neither Disagree Nor Agree Agree Strongly Agree
5) I think the use of technology in the classroom would make science more interesting
Strongly Disagree Disagree Neither Disagree Nor Agree Agree Strongly Agree
6) Using technology in the classroom scares or intimidates me
Strongly Disagree Disagree Neither Disagree Nor Agree Agree Strongly Agree
7) I prefer to use technology to do my schoolwork instead of paper
Strongly Disagree Disagree Neither Disagree Nor Agree Agree Strongly Agree
8) I felt more engaged in science during the paperless unit than I did in the traditional unit
Strongly Disagree Disagree Neither Disagree Nor Agree Agree Strongly Age

39
APPENDIX D
HULTS ENGAGEMENT AND ATTITUDE SURVEY
(PRETREATMENT)

40
Participation in this survey is voluntary and participation or non-participation will not
affect a student’s grade or standing in the class in any way.
Evaluate the following statements.
1) Science interests me:
Strongly Disagree Disagree Neither Disagree Nor Agree Agree Strongly Agree
2) I enjoy science:
Strongly Disagree Disagree Neither Disagree Nor Agree Agree Strongly Agree
3) I want to pursue a career in science
Strongly Disagree Disagree Neither Disagree Nor Agree Agree Strongly Agree
4) I think science is challenging
Strongly Disagree Disagree Neither Disagree Nor Agree Agree Strongly Agree
5) I think the use of technology in the classroom would make science more interesting
Strongly Disagree Disagree Neither Disagree Nor Agree Agree Strongly Agree
6) Using technology in the classroom scares or intimidates me
Strongly Disagree Disagree Neither Disagree Nor Agree Agree Strongly Agree
7) I prefer to use technology to do my schoolwork instead of paper
Strongly Disagree Disagree Neither Disagree Nor Agree Agree Strongly Agree

41
APPENDIX E
HULTS STUDENT INTERVIEW QUESTIONAIRE
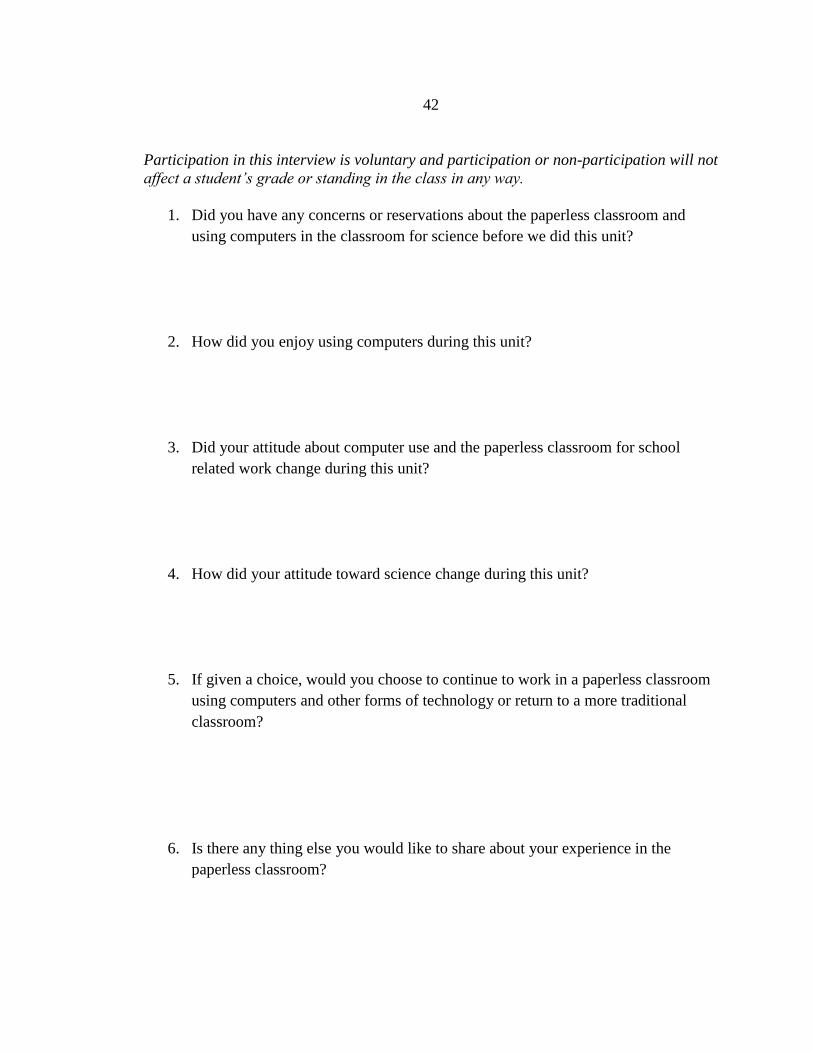
42
Participation in this interview is voluntary and participation or non-participation will not
affect a student’s grade or standing in the class in any way.
1. Did you have any concerns or reservations about the paperless classroom and
using computers in the classroom for science before we did this unit?
2. How did you enjoy using computers during this unit?
3. Did your attitude about computer use and the paperless classroom for school
related work change during this unit?
4. How did your attitude toward science change during this unit?
5. If given a choice, would you choose to continue to work in a paperless classroom
using computers and other forms of technology or return to a more traditional
classroom?
6. Is there any thing else you would like to share about your experience in the
paperless classroom?