Embed Size (px)
Citation preview
Educational Evaluation and Policy AnalysisMonth 201X, Vol. XX, No. X, pp. 1 –24
DOI: 10.3102/0162373715571437© 2015 AERA. http://eepa.aera.net
In 2012, the Brazilian Ministry of Education launched the National Pact of Literacy at the Right Age (Pacto Nacional pela Alfabetização na Idade Certa [PNAIC]). The PNAIC’s goal is ambitious. It seeks to improve the literacy skills of 6- to 8-year-olds in public schools throughout Brazil. The government’s decision to imple-ment this literacy intervention nationally in the first three grades of primary school was influ-enced by the apparent success of a similar 3-year program—Literacy Program at the Right Age (Pacto pela Alfabetização na Idade Certa [PAIC])—first implemented in 2007 in one (low-income) northeastern Brazilian state, Ceará. Ceará’s illiteracy rate among 7- to 14-year-olds declined from 18% in 2001 to 14% in 2007, simi-larly to the rest of the Northeast, in a period of increasing educational attainment for this age group. However, after introducing the PAIC, the literacy rate in Ceará fell to 6% by 2011, a
significantly larger drop than in other northeast-ern states (Instituto Brasileiro de Geografía e Estadística, 2001, 2007, 2011).
In addition to more rapid declines in illiteracy rates after 2007, primary school–age students in Ceará made significant gains in reading and mathematics achievement compared with other states, as measured by Brazil’s national test, the Prova Brasil. Yet, no rigorous impact evaluation has been done to assess whether students’ test-score gains (and, by implication, increases in lit-eracy rates) in Ceará were directly due to the PAIC or rather due to other educational condi-tions specific to Ceará in the period, 2007 to 2011.
PAIC resembles a widely implemented U.S. early reading intervention, Reading First. Based on the U.S. national evaluation of Reading First, we would not expect PAIC effects on student out-comes to be significant. Reading First had
571437 EPAXXX10.3102/0162373715571437Costa and CarnoyEffectiveness of an Early-Grade Literacy Interventionresearch-article2015
The Effectiveness of an Early-Grade Literacy Intervention on the Cognitive Achievement of Brazilian Students
Leandro Oliveira Costa
World BankMartin Carnoy
Stanford University
Beginning in 2007, the Literacy Program at the Right Age (Pacto pela Alfabetização na Idade Certa [PAIC]) in Brazil’s Ceará state required municipal schools to implement a tiered, whole-school early-grade literacy intervention. This intervention was complemented by other policies to help municipalities improve student achievement. The present study identifies PAIC’s impact using a tri-ple-difference analysis (Difference-in-Difference-in-Difference [DDD] approach) that relies on comparisons of the test-score changes in Ceará and bordering states and for grades and schools treated and not treated by the literacy program since 2007. The results show that PAIC had a positive effect on student achievement in both Portuguese and mathematics, but that it did not help reduce the gap between students who had or had not participated in early childhood education.
Keywords: literacy, early childhood, achievement gains
Costa and Carnoy
2
a considerable impact on how teachers teach reading and the implementation of more effective literacy curricula, small positive effects in first grade, but insignificant effects on overall stu-dents’ achievement scores (Gamse et al., 2008). Nevertheless, initial achievement levels are much lower in Brazil than in the United States. In a developing country context, early literacy inter-ventions such as PAIC could have had much larger effects and positive implications for educa-tional improvement.
In this article, we test PAIC’s causal effect on student achievement in Ceará. We use the exten-sive databases from Prova Brasil (Instituto Nacional de Estudos e Pesquisas [INEP], 2008, 2010, 2012) plus the fact that the same-age stu-dents in bordering states’ schools and older stu-dents in the same schools were not exposed to the PAIC program. We analyze whether the improve-ment in reading and mathematics for students who attended Ceará’s PAIC program was mainly the result of PAIC or of other, unobserved factors affecting all early-grade students in the region (and bordering states) or all students in Ceará’s municipal schools. Finally, we assess whether the PAIC has reduced the gap between students with and without early childhood education and whether the program affects student groups with lower and higher levels of achievement equally.1 Our research has implications for the potential success of the national program (PNAIC) and represents an important contribution to the empirical literature on large-scale early-grade lit-eracy interventions.
The PAIC was based on cooperation between the office of the state’s Secretary of Education (Secretaria da Educação [SEDUC]) and the state’s municipal governments, the administrative enti-ties most responsible for pre-school and early pri-mary education. It was designed to help achieve five interrelated program goals in the early grades of Ceará’s municipal schools: (a) reading promo-tion, (b) supporting municipal literacy strategies, (c) strengthening municipal management, (d) supporting early childhood education, and (e) providing external learning evaluation. In terms of implementation, the program was divided into three broad activities related to three program areas: (a) teacher and administrators training, (b) municipality network mobilization, and (c) provi-sion of books to students.
PAIC resembles Reading First in its focus on new literacy teaching materials and on teacher training to use the materials. However, there are important differences between the two programs. In Reading First, coupling between the designers of the intervention and its implementers is loose. The federal government provides funds to states, which in turn distribute those funds to districts to implement district-developed literacy improve-ment plans that include materials and teacher training of districts’ choosing. In contrast, PAIC is administered directly by Ceará’s state educa-tion ministry, which both developed the literacy materials and organized the professional devel-opment workshops for municipal teachers to assist them in applying the materials in their classrooms.
Thus, in PAIC, the state’s SEDUC distributes specific teaching materials and a teaching guide directly to municipalities to be distributed to teachers in schools and provides face-to-face training to early-grade teachers. PAIC training takes place 3 to 5 times per year in 20 regional centers throughout the state and 3 more centers in the state capital, Fortaleza, run by external con-sultants working with a team from the state’s SEDUC. Municipalities send teachers in groups to these centers to be trained to apply the model. The training is a good example of a well-designed, scripted literacy and numeracy training program initially developed in a single Ceará municipality (Sobral) and successfully scaled up to hundreds of municipalities in Ceará state.
This training is combined with in loco visits to evaluate the progress of the implementation of the scripted material. The team from the state’s SEDUC also plays an active role in promoting the importance of the PAIC program in each municipality among key municipal actors and creating an environment in which schools share best practices for improving measured literacy outcomes (“network mobilization”).2
In addition, unlike Reading First or other early reading interventions in other countries, PAIC adds financial incentives for schools and munici-palities whose third-grader students achieve the largest literacy gains in external literacy assess-ments. The state rewards schools whose third graders rank highest in the percent achieving an adequate level of literacy skills (as defined by the state) on a jointly run state and municipal annual
Effectiveness of an Early-Grade Literacy Intervention
3
literacy assessment given all students in the first, second, and third grades of public schools. Implemented along with the PAIC in 2007, the assessment is called the Sistema Permanente de Avaliação da Educação Basicá do Ceará–Alfa (SPAECE-Alfa). The monetary reward is defined in per student terms, but the total reward to the school is based on the number of third graders participating in the SPAECE-Alfa.3 The state also rewards municipalities whose students achieve the highest levels and gains on a state literacy index (for details on these incentives, see Gusmão & Ribeiro, 2011).4
The materials distributed by the state’s SEDUC were designed for improving the teach-ing of literacy, but the teacher training sessions focus not only on using the specific materials but also on better instructional practice more gener-ally, which likely spills over into the teaching of mathematics. Furthermore, the incentive system rewards higher test scores in both literacy and mathematics.
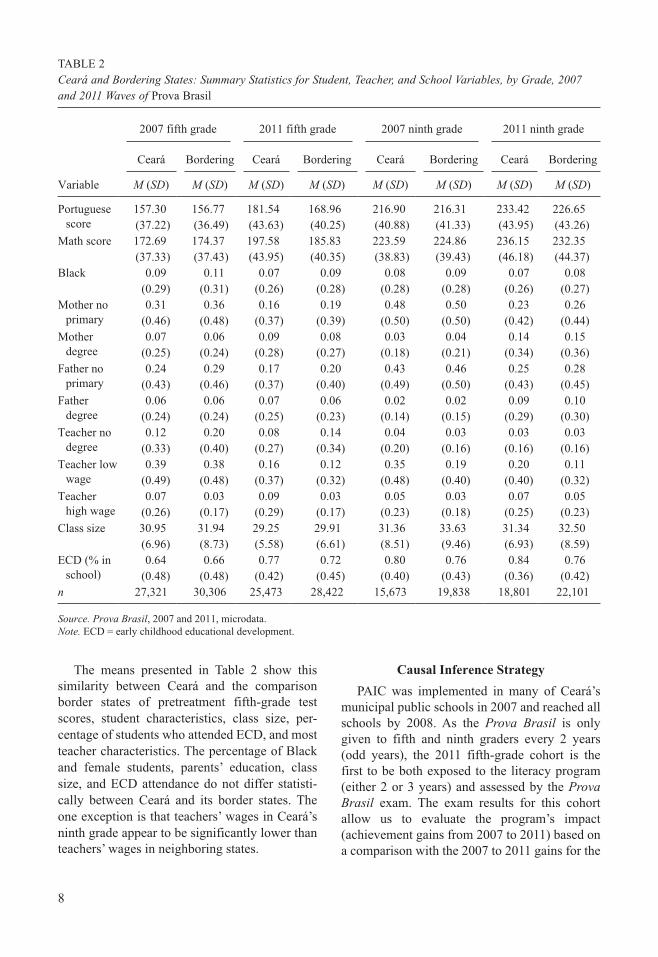
The outcome measures we use in our analysis are students’ mathematics and Portuguese scores on the Prova Brasil. From 2005 onward, the Prova Brasil has been administered every other year to all students in the last year of public pri-mary and middle schools.5 The test assesses mathematics and Portuguese language and also surveys students, teachers, and principals with extensive questionnaires. As the Prova Brasil is only administered to students at the end of pri-mary and middle school, the 2011 Prova Brasil was the first to assess the cohort starting primary school at the age of 6 in 2007. Furthermore, since the PAIC began to be implemented in 2007 and was fully in force by 2008 in the first three grades of Ceará’s municipal public schools, the students in the fifth grade who took the Prova Brasil in 2011 represent the first cohort participating in at least 2 years of the PAIC program, and for many, the full 3 years. This cohort is our treatment group.
We include three “control” groups in our study: fifth graders in Ceará who took the Prova Brasil in 2007 (they were not exposed to the PAIC), fifth graders in neighboring states who took the Prova Brasil in both 2007 and 2011 (neither group participated in the PAIC), and ninth graders who took the Prova Brasil in 2007 and 2011, who were not exposed to the PAIC, but
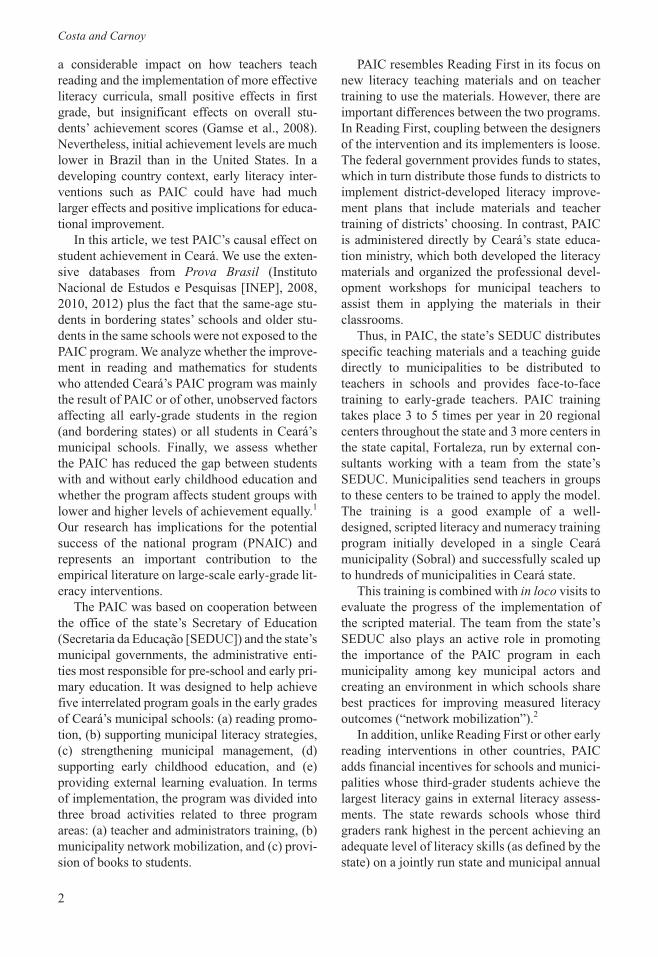
whose achievement may have been affected by other Ceará reforms also influencing fifth grad-ers’ achievement.6 We use the presence/absence of PAIC implementation between years, states, and grades to compare the 2011 fifth-grade stu-dent cohort in Ceará state with the untreated fifth graders in 2007 and in states bordering Ceará as well as the untreated ninth graders in Ceará state (Figure 1). We argue that this quasi-experimental research design allows us to estimate the effect of the literacy program on gains in students’ cogni-tive achievement, accounting for the influence of state-level constant unobservable factors and within-state programs that could have affected the students during the same period.
Our results indicate that PAIC produced sta-tistically significant gains in the average Portuguese performance of (treated) fifth graders in 2007 to 2011 (compared with our untreated control groups) and greater gains in their mathe-matics performance. Increases were estimated to be larger for students with higher test scores, but differed little for those students who had had or not had early childhood education.
This article is structured as follows: In the fol-lowing section, we briefly review the relevant empirical literature on literacy interventions and compare them with PAIC. Section “Data” describes the data. Section “Causal Inference Strategy” outlines our empirical strategy and Section “Results” shows the results. Section “Robustness Checks” performs some robustness checks. Finally, Section “Conclusion” summa-rizes the results and concludes.
The Impact of Literacy Interventions
The argument that early educational interven-tions have high payoffs in reducing large achieve-ment gaps at school entry between socially advantaged and disadvantaged children has led to increasing emphasis on early intervention pro-grams (see, for example, Barnett, 2002; Cunha & Heckman, 2010; Currie & Thomas, 1993; Heckman & Masterov, 2007; Jencks & Phillips, 1998).
Much of the policy focus of early interventions has been on early childhood educational develop-ment (ECD) because of studies showing cognitive and non-cognitive gains by disadvantaged chil-dren exposed to pre-school programs, producing

4
FIG
UR
E 1
. Sc
hem
atic
of D
DD
des
ign
for
test
ing
PA
IC e
ffec
t on
Cea
rá s
tude
nts’
ach
ieve
men
t sco
res,
trea
tmen
t gro
up, a
nd c
ontr
ol g
roup
s.So
urce
. Aut
hors
.N
ote.
Ora
nge:
3 y
ears
of
part
icip
atio
n in
PA
IC;
Red
: 2
year
s of
par
tici
pati
on;
Pin
k: 1
yea
r of
par
tici
pati
on;
Blu
e: C
ontr
ol g
roup
s. F
ifth
gra
ders
in
Pro
va B
rasi
l 20
07 w
ere
not
expo
sed
to
the
PA
IC p
rogr
am;
fift
h gr
ader
s in
Pro
va B
rasi
l 20
09 w
ere
expo
sed
up t
o 1
year
to
PA
IC;
and
fift
h gr
ader
s in
Pro
va B
rasi
l 20
09 w
ere
expo
sed
to 2
to
3 ye
ars
of P
AIC
(fu
ll t
reat
men
t).
DD
D =
Dif
fere
nce-
in-D
iffe
renc
e-in
-Dif
fere
nce.
PA
IC =
Pac
to p
ela
Alf
abet
izaç
ão n
a Id
ade
Cer
ta.
Pro
vaB
rasi
lW
ave
Pro
va B
rasi
l W
ave
Pro
vaB
rasi
lW
ave
Yea
rC
eará
1st
gr
ade
Cea
rá2n
d gr
ade
Cea
rá3r
d gr
ade
Cea
rá4t
h gr
ade
Cea
rá5t
h gr
ade
Bor
deri
ngSt
ates
5th
gr
ade
Cea
rá6t
h gr
ade
Cea
rá7t
h gr
ade
Cea
rá8t
h gr
ade
Cea
rá9t
h gr
ade
2006
2007
Con
trol
1
Con
trol
2
C
ontr
ol 3
2008
2009
One
Yea
r
2010
2011
Tre
ated
C
ontr
ol 2
C
ontr
ol 3
2012
Effectiveness of an Early-Grade Literacy Intervention
5
high economic and social payoffs in adulthood (Cunha & Heckman, 2010). In the same spirit of trying to reduce the achievement gap existing at school entry, there have also been large-scale lit-eracy interventions in kindergarten and the pri-mary grades. Programs with distinct designs have been implemented in various countries. The most important of these are Reading First (written in the U.S. No Child Left Behind [NCLB] Act) and Reading Recovery (New Zealand, the United Kingdom, and the United States).
Reading First is the intervention most closely related to the PAIC. It is a multi-layer interven-tion in kindergarten through third grade applied in school districts in a number of U.S. states as part of the 2001 NCLB, first implemented in 2003 and funded by the U.S. federal government. Funding can be used for special literacy curricula and materials, for professional development and coaching for teachers on how to use these materi-als and how to work with struggling readers, and for monitoring reading difficulties of struggling readers. Its main goal was to have all children read at or above grade level by the end of third grade (Gamse et al., 2008).
Early tutoring programs are an alternative to early in-school interventions such as Reading First and PAIC. Reading Recovery is the most well known of these programs. It was developed in the 1970s as a short-term one-to-one supple-mental tutoring intervention designed for chil-dren aged 5 or 6, who are struggling to be literate after their first year of school (see Ashdown & Simic, 2000; Lyons, 1998; Schwartz, 2005). It purports to increase literacy instruction time as a method to improve pupils’ reading in the early grades.
There have also been a number of small-scale literacy teaching interventions in Africa (see, for example, Ralaingita & Wetterberg, 2011) and a large-scale effort to promote such early reading interventions through the introduction in develop-ing countries of a cheap, simple-to-use literacy assessment instrument—the Early-Grade Reading Assessment (EGRA). Although it is a policy intervention directed at improving early literacy, EGRA differs qualitatively from curricular or teacher training interventions. It is based on the premise that reducing the complexity and cost of accurately assessing (low) reading skills in early grades will induce governments to introduce
reading improvement programs and conduct impact evaluations (Gove & Wetterberg, 2011).
Table 1 provides a brief comparison of such other early-grade literacy intervention programs with the PAIC.
Evaluations of Reading First and Reading Recovery show mixed results. The mandated national evaluation of Reading First (Gamse et al., 2008) used a regression discontinuity design and found that at national level, the pro-gram had a significant positive impact on instruc-tional time spent on the five key elements of the program and significantly increased the multiple practices promoted by the program (including professional development), but it did not have a significant impact on average student reading comprehension scores in Grades 1, 2, or 3.7 However, Baker et al. (2011) argued that national studies of Reading First could not be generalized to individual states, and found that in Oregon, stu-dent’s reading outcomes improve over time with high-quality reforms and strong implementation of the program. Their identification strategy was an outcome comparison of two implementation cohorts through a test for difference of aggregated student data at the school level.
The evaluations of Reading Recovery (Ashdown & Simic, 2000; Lyons, 1998; Schwartz, 2005) and one-to-one tutoring programs more generally (Elbaum, Vaughn, Hughes, & Moody, 2000) suggest mixed, although generally positive results. Slavin, Lake, Davis, and Madden’s (2011) more recent survey of 97 studies that used ran-domized or well-matched groups concludes that one-to-one tutoring, including Reading Recovery, is very effective in improving reading perfor-mance, and that teachers are more effective as tutors than paraprofessionals and volunteers. Furthermore, another recent evaluation using ran-dom assignment to estimate the impact of a major national scaling-up (in 2010) of Reading Recovery to almost 90,000 students also showed large statistically significant improvements in reading scores (May et al., 2013).
Overall, then, early reading interventions in the United States show some positive effects on students’ literacy, but these improvements are hardly consistent, and the intervention program most directly similar to PAIC—Reading First—shows insignificant average reading gains at a national level, but more positive results in a

6
single state study. Against this backdrop, we turn to estimating the effects of the PAIC, a program implemented in one Brazilian state.
Data
The data for this study are drawn from Brazil’s extensive educational evaluation system. The
National Evaluation System of Basic Education (Sistema de Avaliação da Educação Básica [SAEB]) is composed of two complementary surveys that aim to evaluate the quality of Brazil’s educational system. SAEB’s main survey from 1995 to 2005 involved a biannual state-level stu-dent sample, in both the public and private school systems, of schools located in rural and urban
TABLE 1Comparison of Early Literacy Program Designs, by Goals, Target Group, Areas for Intervention, Educational Activities, and Complementary Policies
VariablePAIC in Ceará
PNAIC in Brazil
Reading First in the United States
Reading Recovery in New Zealand, the
United Kingdom, and the United States
EGRA in Africa, LAC, and Asia
Main goals/strategies
All students to read at 7 years old
All students to read at 8 years old
All students to read at grade level by the end
of third gradeLiteracy of at-risk
children
Educational policymakers/assess
students’ reading skills
Areas of intervention Promotion of reading
in early gradesX X X X X
Support of local strategies to implement literacy program
X X X X
Strengthening of municipal/district management
X X
ECD support X X External evaluation X X X XEducational activities Teacher and
administrator trainingX X X X X
Teacher coaching X Network
mobilization among municipalities/districts
X X X
Use of literacy materials developed for program
X X X X
One-to-one supplemental tutoring
X
Complementary policies Financial reward
programX
Financial support policy
X
Source. PAIC: Gusmão and Ribeiro (2011); PNAIC: http://pacto.mec.gov.br/o-pacto; Reading First: Gamse et al. (2008); Reading Recovery: Lyons (1998); EGRA: Gove and Wetterberg (2011).Note. PAIC = Pacto pela Alfabetização na Idade Certa; PNAIC = Pacto Nacional pela Alfabetização na Idade Certa; EGRA = Early-Grade Reading Assessment; LAC = Latin America and Caribbean; ECD = early childhood educational development.
Effectiveness of an Early-Grade Literacy Intervention
7
areas, covering the fourth and eighth grades of elementary school (as noted, in 2011, the test was applied to fifth and eighth graders, and in 2015, will test fifth and ninth graders) and the third year of high school. The SAEB has continued to be administered biannually after 2005, although only the 2011 sample became publicly available.
The second survey is the Avaliação Nacional do Rendimento Escolar (ANRESC)—the National Assessment of Educational Achievement—which is publicly known as Prova Brasil. The Prova Brasil is also a biannual school-level assessment of fifth and ninth graders. It differs from SAEB in that it is administered to all students (not a sample of schools) in public schools with a mini-mum of 20 students per class. It has been admin-istered since 2005, but it is available as student-level microdata only for 2007, 2009, and 2011. For these three waves, we are therefore able to conduct our analysis at the individual stu-dent level within each test year. This rich data set provides information about students’ mathemat-ics and reading (Portuguese) exam scores and the socio-economic background of students, teach-ers, and principals. The exam scores in each grade are comparable over time and permit com-parison of results between grades. That is, we can follow the performance of grade cohorts, schools, networks, and the system as a whole (but not of individual students, as we do not have matchable student identifiers across grades and years). In 2011, this data set provided information on 5,201,730 students enrolled in 55,924 schools in 27 states, and in 2007, for 4,109,265 students and 48,704 schools.
In the 2011 Prova Brasil, 61.8% of the schools surveyed were administered by municipalities, 38.2% by states, and 0.1% by the federal govern-ment. Students attended schools in three shifts—55.5% in the morning shift, 42.4% in the afternoon, and 2.1% at night. To be able to include most of the schools participating in Ceará’s PAIC program, and to compare fifth and ninth graders in these schools within Ceará and fifth graders in similar schools between Ceará and bordering states, we selected only urban municipal schools in the morning and afternoon shifts. Also, we restricted our sample to schools with fifth and ninth grades that participated in the Prova Brasil both in 2007 and in 2011, in which we could iden-tify the teacher’s classroom subject. This resulted
in a school-level panel of student and teacher background variables with a sample size of 1,002 schools and 275,072 individual students in five states (Ceará, Piaui, Pernambuco, Paraiba, and Rio Grande do Norte).8
Table 2 presents the means of our outcome variables and important covariates in this sam-ple. The Portuguese and math scores on the Prova Brasil exam are our outcome variables. The scale of this variable ranges from 0 to 500 in both the fifth and ninth grades. The concepts cov-ered in the Prova Brasil test items are based on the 2001 revised version of a reference matrix of the Brazilian curriculum. This matrix was cre-ated through a broad national analysis of state-level curricula and textbooks used by primary and secondary teachers in Brazilian schools. Based on these curricula and textbooks, test designers constructed a set of competencies and skills that students should be able to execute at the end of the two basic education cycles (fifth and ninth grades) and used item response theory (IRT) to design the test at each level. With IRT, we can compare the results of fifth graders across years and ninth graders across years.9
We use a series of student covariates to con-trol for characteristics that could affect student achievement. We also control for teacher and school characteristics that may be related to the quality of education, such as teachers’ education and wages, and class size. Student attendance at an ECD center, day care, or kindergarten reflects early childhood education that could also influ-ence a student’s later school achievement. We created an ECD variable based on a positive answer to either of two questions in Prova Brasil’s student questionnaire that ask whether the student had attended a day care center and whether the student had attended a pre-school.10 In Table 2, we report the average percentage of students in the fifth and ninth grades with ECD.
We chose to compare students in Ceará with students in the bordering northeastern neighbors not only because of their geographic proximity but also because they are socio-economically similar and students there and in Ceará have had similar average scores on the SAEB and Prova Brasil since 1999. In contrast, students in the south and southeast regions averaged scores more than 10% higher than students in the Northeast.
8
The means presented in Table 2 show this similarity between Ceará and the comparison border states of pretreatment fifth-grade test scores, student characteristics, class size, per-centage of students who attended ECD, and most teacher characteristics. The percentage of Black and female students, parents’ education, class size, and ECD attendance do not differ statisti-cally between Ceará and its border states. The one exception is that teachers’ wages in Ceará’s ninth grade appear to be significantly lower than teachers’ wages in neighboring states.
Causal Inference Strategy
PAIC was implemented in many of Ceará’s municipal public schools in 2007 and reached all schools by 2008. As the Prova Brasil is only given to fifth and ninth graders every 2 years (odd years), the 2011 fifth-grade cohort is the first to be both exposed to the literacy program (either 2 or 3 years) and assessed by the Prova Brasil exam. The exam results for this cohort allow us to evaluate the program’s impact (achievement gains from 2007 to 2011) based on a comparison with the 2007 to 2011 gains for the
TABLE 2Ceará and Bordering States: Summary Statistics for Student, Teacher, and School Variables, by Grade, 2007 and 2011 Waves of Prova Brasil
2007 fifth grade 2011 fifth grade 2007 ninth grade 2011 ninth grade
Ceará Bordering Ceará Bordering Ceará Bordering Ceará Bordering
Variable M (SD) M (SD) M (SD) M (SD) M (SD) M (SD) M (SD) M (SD)
Portuguese score
157.30 156.77 181.54 168.96 216.90 216.31 233.42 226.65(37.22) (36.49) (43.63) (40.25) (40.88) (41.33) (43.95) (43.26)
Math score 172.69 174.37 197.58 185.83 223.59 224.86 236.15 232.35 (37.33) (37.43) (43.95) (40.35) (38.83) (39.43) (46.18) (44.37)Black 0.09 0.11 0.07 0.09 0.08 0.09 0.07 0.08 (0.29) (0.31) (0.26) (0.28) (0.28) (0.28) (0.26) (0.27)Mother no
primary 0.31 0.36 0.16 0.19 0.48 0.50 0.23 0.26
(0.46) (0.48) (0.37) (0.39) (0.50) (0.50) (0.42) (0.44)Mother
degree 0.07 0.06 0.09 0.08 0.03 0.04 0.14 0.15
(0.25) (0.24) (0.28) (0.27) (0.18) (0.21) (0.34) (0.36)Father no
primary 0.24 0.29 0.17 0.20 0.43 0.46 0.25 0.28
(0.43) (0.46) (0.37) (0.40) (0.49) (0.50) (0.43) (0.45)Father
degree 0.06 0.06 0.07 0.06 0.02 0.02 0.09 0.10
(0.24) (0.24) (0.25) (0.23) (0.14) (0.15) (0.29) (0.30)Teacher no
degree 0.12 0.20 0.08 0.14 0.04 0.03 0.03 0.03
(0.33) (0.40) (0.27) (0.34) (0.20) (0.16) (0.16) (0.16)Teacher low
wage 0.39 0.38 0.16 0.12 0.35 0.19 0.20 0.11
(0.49) (0.48) (0.37) (0.32) (0.48) (0.40) (0.40) (0.32)Teacher
high wage 0.07 0.03 0.09 0.03 0.05 0.03 0.07 0.05
(0.26) (0.17) (0.29) (0.17) (0.23) (0.18) (0.25) (0.23)Class size 30.95 31.94 29.25 29.91 31.36 33.63 31.34 32.50 (6.96) (8.73) (5.58) (6.61) (8.51) (9.46) (6.93) (8.59)ECD (% in
school) 0.64 0.66 0.77 0.72 0.80 0.76 0.84 0.76
(0.48) (0.48) (0.42) (0.45) (0.40) (0.43) (0.36) (0.42)n 27,321 30,306 25,473 28,422 15,673 19,838 18,801 22,101
Source. Prova Brasil, 2007 and 2011, microdata.Note. ECD = early childhood educational development.
Effectiveness of an Early-Grade Literacy Intervention
9
same cohort in bordering states and the 2007 to 2011 gains for the ninth-grade cohort in Ceará (see Figure 1).
To estimate the effect of PAIC on students’ achievement, we develop a model using state-level and school-level panel data from Prova Brasil. The identification strategy we use is the Difference-in-Difference-in-Difference (DDD) estimation. Good examples of the use of this methodology are Tyler, Taylor, Kane, and Wooten (2010); Ravallion, Galasso, Lazo, and Philipp (2005); Chaudhury and Parajuli (2010); and Chiapa, Garrido, and Prina (2012). Angrist and Pischke (2008) pointed out that this model is a modification of the Difference-in-Difference (DD) model with possible higher order control groups that contribute to the identification strat-egy of programs with more than one dimension of external variation.
To identify the impact of the PAIC on test scores, consider the DD estimates for the fifth grade of Ceará and bordering states (Ceará fifth graders vs. bordering states’ fifth grad-ers), and the DD estimates for fifth- and ninth-grade students in Ceará state (Ceará fifth-grade students’ gains vs. ninth-grade students’ gains). The first DD model (DD
1) seeks to estimate
the effect of the PAIC program for the fifth-grade students in Ceará compared with stu-dents in bordering states that have not implemented any early-grade literacy inter-vention. The second DD model (DD
2) aims to
control for any other program in Ceará state that could have affected fifth-grade students’ achievement since 2007. The DDD model is the difference of these two models. It controls for across state school differences and for between-grade differences. We need state-level panel data of Prova Brasil for fifth and ninth grades in Ceará state and border states. To set up this model, consider the following conditional expectation function (CEF):
E y s t g D X
X
istg it s t g st gt
sg istg
| , , , ,
,
( ) = + + + +
+ + +
α µ γ
θ
β δ
ρ ′βstg
(1)
where s represents states, t represents year, and g represents the grade of the student in a municipal public school. Angrist and Pischke (2008) argued that this model provides full non-parametric con-trol for state-specific time effects that are
common across grade groups (µst), time-varying
grade effects (γgt
), and state-specific grade effects (θ
sg). Also, we control for state-level fixed effects
(αs), a time trend (β
t), and a dummy for the grade
effect (δg).
To estimate the interaction of the PAIC pro-gram impact and whether a student participated in ECD, we stratify our data and results into stu-dents who attended ECD centers or not. We would like to fit Equation 1 separately for each of these two different literacy background groups. However, we cannot fit the hypothesized DDD model in Equation 1 because we do not have stu-dent identifiers who allow us to construct longi-tudinal student-level data on students’ test scores. Fortunately, based on Equation 1, the parameter of interest, ρ
sgt, representing the effect of the
PAIC on the achievement of students who attended fifth grade in 2011 as affected by state of residence is as follows:
DDD DD DD CE BO
CE BO
= − = −( )− −( )=
1 2 5 5
9 9
∆ ∆
∆ ∆
y y
y y
g g
g g
stg
, ,
, ,
.ρ (2)
In essence, Equation 2 permits us to identify the impact of the PAIC program on the achieve-ment of fifth graders in Ceará (y
CE,5g) based on
variation across states (yBO,5g) and between grades (y
CE,9g) in two periods. The Δ represents
the difference in time, so each component with Δ differences out any time fixed effect of each cohort in Ceará and its bordering states. Where the DD
1 differences net out any constant effect
for fifth graders’ achievement gains between Ceará and bordering states, the DD
2 differences
net out ninth graders’ constant effects. The DDD differences net out the fixed effect between the fifth- and ninth-grade cohorts. The triple differ-encing strategy allows us to account for the effect on achievement gains for fifth graders in Ceará of being exposed to the PAIC compared with untreated students in bordering states, but to net possible effects on test-score gains of unobserved, concurrent, efforts to improve edu-cation across all grades.
This can be estimated by using the following regression framework:
yit s it it it it
it
= + + ++
⋅⋅
µ β δ αγ
2011 5 2011
5 2011
th grade Cear
th grade iit it it
it it it it
++ +
⋅⋅ ⋅
θρ ε
Cear th grade
Cear th grade
5
5 2011 , (3)
á
á
á
Costa and Carnoy
10
where 2011 is a dummy variable for the 2011 year of the Prova Brasil; fifth grade is a dummy variables for the fifth-grade students in 2007 and 2011 (within-state comparison); and Ceará is a dummy for Ceará state students differentiated from students in border states (cross-state com-parison). The DDD effect is measured by esti-mating the ρ coefficient, which is obtained by the interaction of the fifth-grade dummy, the 2011 year dummy, and the Ceará state dummy. Finally, µ
s is the state-level fixed effect (the detailed
mathematical explanation on how differences identify this effect is available from the authors).
A usual challenge raised to estimating the effect of a program in a classical regression using multi-level data is that the estimate of the stan-dard errors is biased. For example, the likely het-eroskedasticity yielded by the school clusters of students’ achievement affects the classical stan-dard error estimate. Furthermore, when we work with information in a panel format we can expect a significant serial correlation. Following the strategy suggested in Angrist and Pischke’s (2008) study, we considered the school clusters to estimate the standard errors due to presumed heteroskedasticity and serial correlation.
In addition to estimating the overall PAIC effect on student achievement in Ceará, we esti-mate the DDD model using quantile regressions to provide information about the relationship between students’ achievement y
it and covariates
at different points in the conditional distribution of y
it. We use the sample median as an estimator
of the population median. If F y Y y( ) Pr( )= ≤ defines the cumulative distribution function (CDF), then F y( ) /med =1 2 is the equation whose solution defines the median y Fmed = −1 1 2( / ) . The quantile q, q∈ ( , )0 1 , is
defined as the value of y that splits the data into the proportions q below and 1 − q above, that is, F y qq( ) = and y F qq = −1( ) . These concepts extend to the conditional quantile regression function, denoted as Q y xq ( | ) , where the condi-tional quantile will be taken to be linear in x.
Furthermore, the PAIC effect may differ for schools with a smaller or larger achievement gap between students in a school who attended ECD or not. We developed a model that estimates the interaction between the literacy program (PAIC) and the ECD achievement gap of stu-dents in the same school and grade. This school
ECD achievement gap can be defined as the expected difference in achievement of students at the same school who have attended or not attended some form of ECD.
We can represent the school ECD gap as E y y t g D Xj ECD j noECD it( , , , , ,, ,- | )s e , where s is a vector of unobservable but fixed school confound-ers, such as parents’ motivation and ability to enroll their children in ECD centers, and e is the vector of observed previous ECD enrollment. We assume that the school ECD achievement gap is a characteristic correlated with parent’s school choice, based on the assumption that the unob-served variable related to attending ECD centers is likely the same as attending school, and that ECD attendance rates differ due to the supply of ECD centers in the regions. Also, because both the demand for and the supply of ECD have changed, we expect that the ECD gap varies across grades.
Thus, the main assumption to identify the interaction of the program impact and the school ECD achievement gap is the inclusion of school fixed effects that can control for unobserved variables related to the selection bias of ECD gap in each school; that is, E y y s t g e D Xj ECD j noECD it j( , , , , ,, ,− =| ) τ . This assumption combined with the external variation across grades and schools yields the interaction between the individual student’s ECD and par-ticipation in the PAIC program, controlling for school fixed effects. This means a modification of DDD that includes an additional difference, this one at the school level. We call this the “four difference” method (4D). The following equation represents this model:
E y t s g e D Xijstge it j s t g
ste gte sge
| , , , , ,( ) = + + +
+ + ++ +
τ µ β δ
α γ θρ πtsg ttsge + Xitsge β,
(4)
where τ j is the school fixed effect of school j and the πtsge is the interaction of attending ECD and the fifth grade in Ceará state in 2011 (ECD and treatment variable).
We model the second difference of students’ ECD status and time difference as ∆2jECD=(∆
ECDy
jt-
∆ECD y jt-1)=( y jECD( t )-y jnoECD( t ))-(y jECD( t-1)-yjnoECD(t-1)). ECD(t) represents the students with ECD status in time t and no ECD(t) represents the students with no ECD status in time t in the same school j. Note that the subscript j is in the school-level fixed effect, τ j , and the subscript i
'
Effectiveness of an Early-Grade Literacy Intervention
11
is in the dependent variable and the error vari-able. This means that we intend to examine the achievement gap of ECD inside schools (the dif-ference in the achievement gain of students with and without ECD in each school) and how it interacts with the PAIC effect (interested readers can contact the authors for the derivation of the model). The new difference method to obtain the interaction between the school ECD gap and par-ticipation in the PAIC program at the state level (difference-in difference-in-difference-in differ-ence [DDDD]) is as follows:
4 1 22
52
5
29
29
D DD DD CE BO
CE BO
= − = −( )− −
⋅ ⋅∆ ∆
∆ ∆
je g je g
je g je g
y y
y y
, ,
, ,(( )= ρstge.
(5)
This can be estimated by using another conve-nient regression framework:
yit j s it it
it it it
= + + ++ +⋅ ⋅τ µ β δα γ
2011 5
2011 5
thgrade
Cear ecd thgraade
ecd Cear thgrade ecd
Cear
it
it it it it it
it
⋅⋅ ⋅ ⋅
⋅+
+2011 5
2011
θρ iit it it
it it it it
⋅ ⋅⋅ ⋅
++
5 2011
5
thgrade
Cear thgrade ecd
πε .
(6)
An important assumption of this estimation strategy is that the proportion of ECD students is constant across years and the ECD variable is homogeneous among all students. This assump-tion may not hold, and, if it does not, selection bias in access to ECD and the amount and quality of ECD result in an overestimate of PAIC’s effect on student achievement in Ceará. Nevertheless, this estimation strategy provides us with an upper bound estimate of the program impact control-ling for the proportion of ECD students.
Finally, we run a series of robustness checks on the DDD model that test whether the PAIC effect is affected by (a) enlarging the sample by not restricting it to schools whose fifth and ninth grades were both tested by Prova Brasil in 2007 and 2011 (Table 3), (b) enlarging the comparison group of reference states, and (c) estimating a “1-year” PAIC effect on the cohort of Ceará fifth graders who were in the third grade in 2007 and were tested as fifth graders in the 2009 wave of the Prova Brasil (difference of 2009 fifth graders with 2007 fifth graders).11
There may also be further threats to our identification strategy (Bertrand, Duflo, & Mullainathan, 2004) that we cannot correct for
because we lack available data. For example, if there were significant numbers of Ceará students in the fifth grade in 2011 who had not attended 2 to 3 years of the PAIC program implementation because they had migrated or had failed to pass into fifth grade in 2010, this could bias our results.
Results
This section presents the results of regression estimates based on the various empirical strate-gies discussed above. However, before turning to those results, it is worth examining the overall pattern of SAEB and Prova Brasil public school achievement scores that persuaded policymakers in the Brazilian government to take PAIC nationwide.
Mean Test Scores in Ceará and Neighboring States, 1995 to 2011
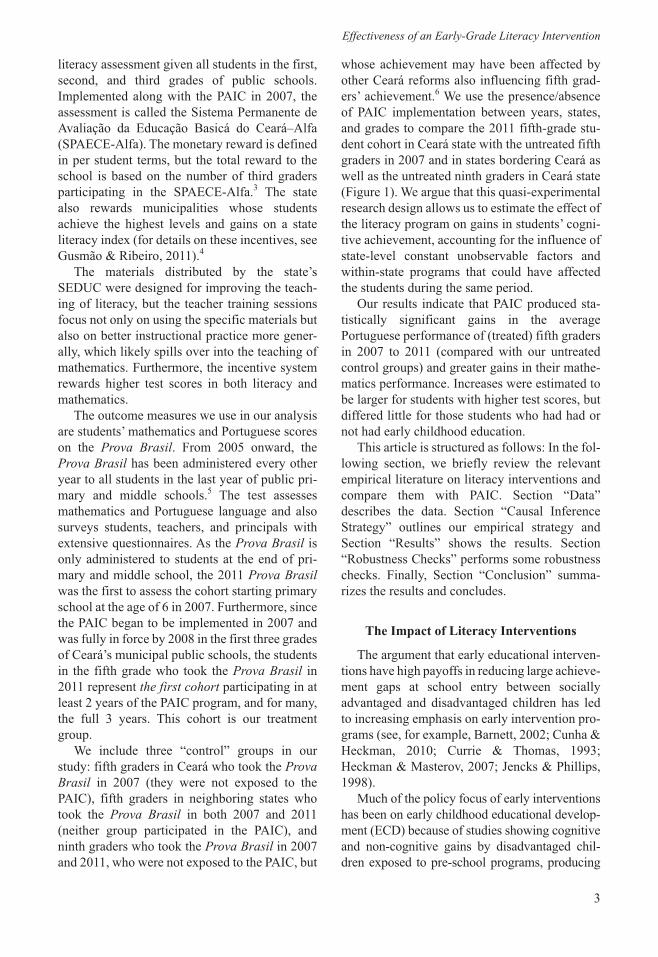
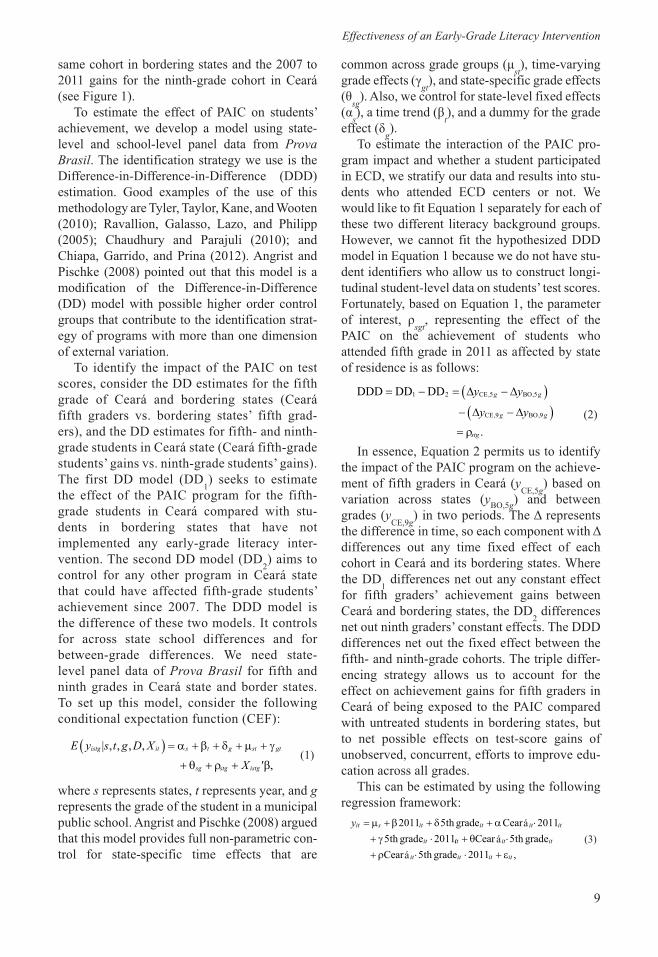
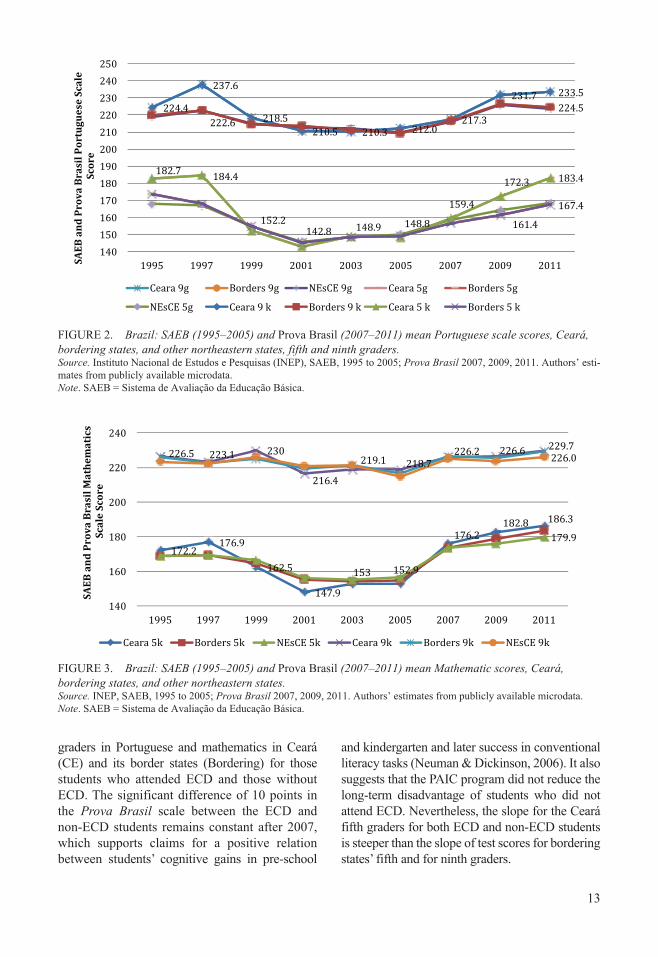
The estimated Portuguese mean scores in the SAEB surveys for fifth and ninth graders for Ceará (CE), border states (Borders), and the northeast states without Ceará (NEsCE) are shown in Figure 2. The mean test scores in all these state groupings decreased in 1995 to 2001. This decrease is associated with the universaliza-tion of basic education in this period, in which the proportion of lower socio-economic back-ground students attending school rose signifi-cantly (Vieira, Vidal, & Costa, 2010). Scores increased after 2005 and increased more rapidly in Ceará schools from 2007 to 2011. The increase is 10 points for the ninth grade and 15 points for the fifth grade. For policymakers, this appeared to be evidence of PAIC’s positive impact on stu-dent literacy skills.
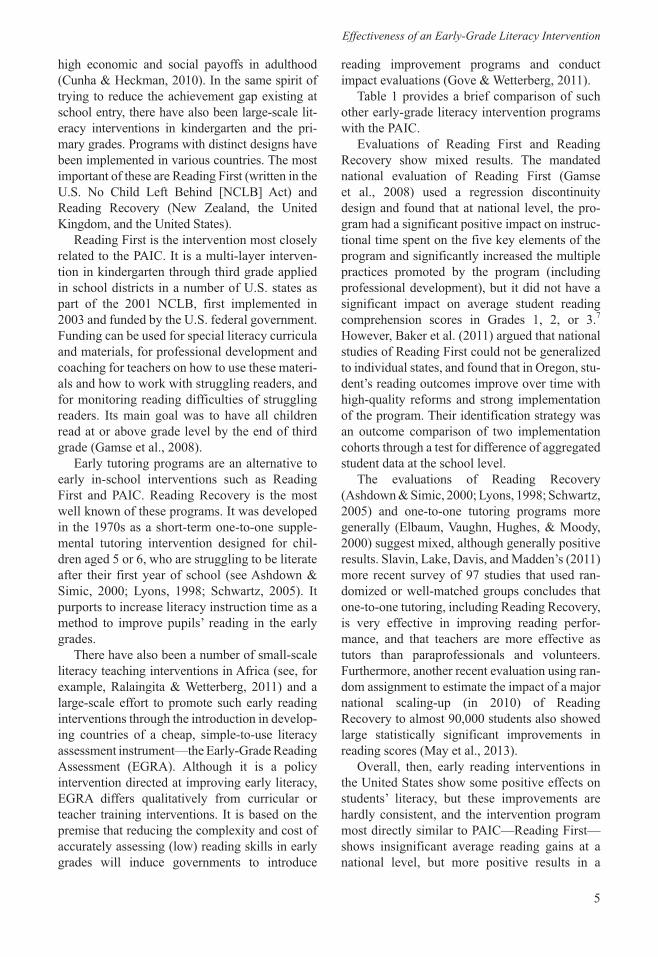
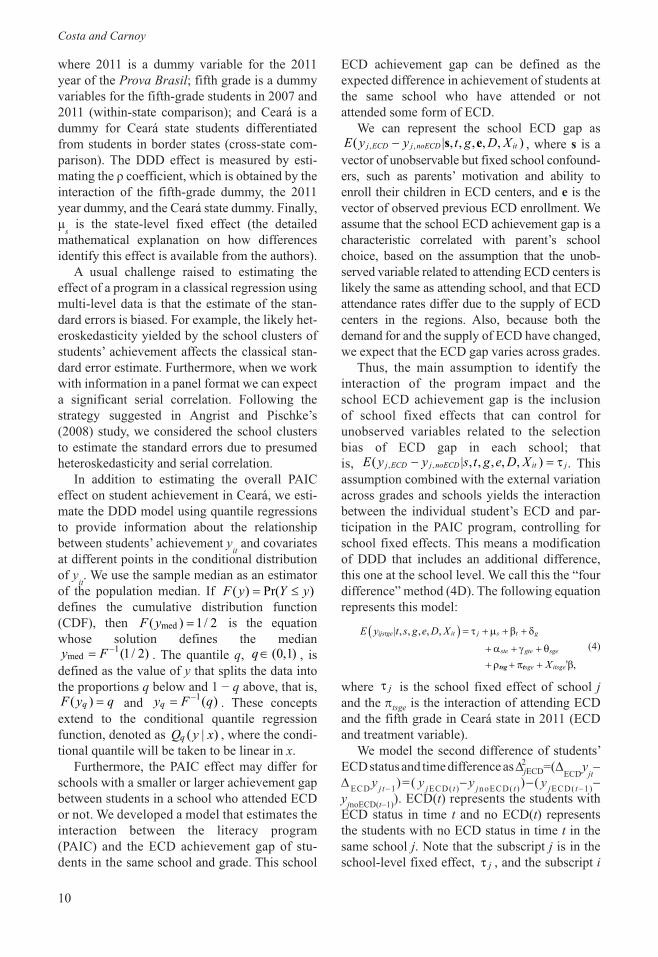
Figure 3 presents the Prova Brasil mean mathematics scores for these same state group-ings. The decline in scores after 1995 was smaller, particularly for ninth graders, and the difference in trends between Ceará and the other states is also smaller than for Portuguese. However, the overall gain for math was also large after 2005. The Ceará “advantage” after 2007 was much smaller than for Portuguese, but even so, there was a 3-point spread in the ninth grade and 6-point spread in the fifth grade by 2011.
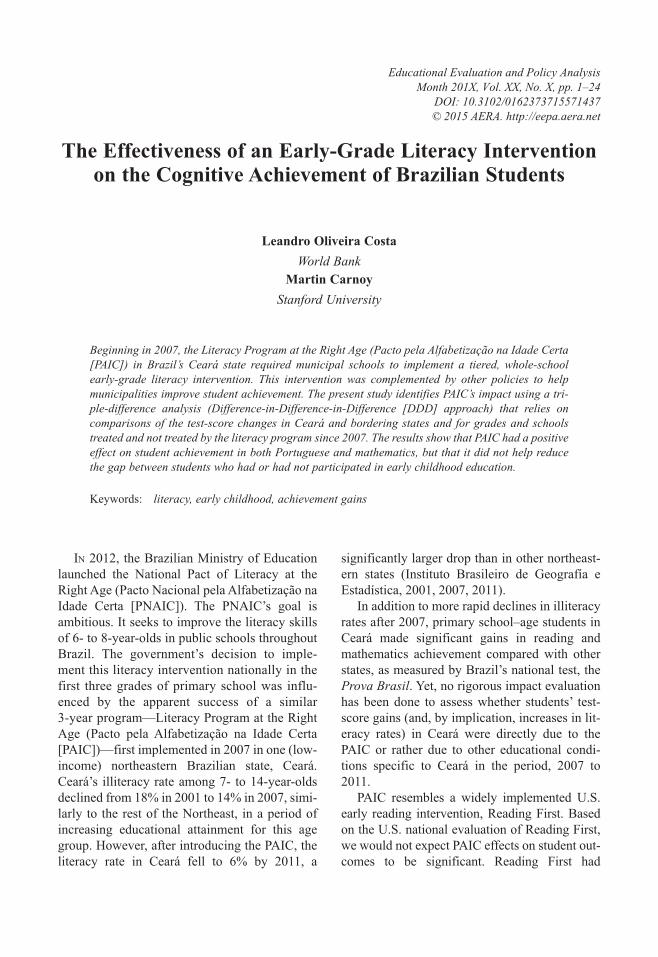
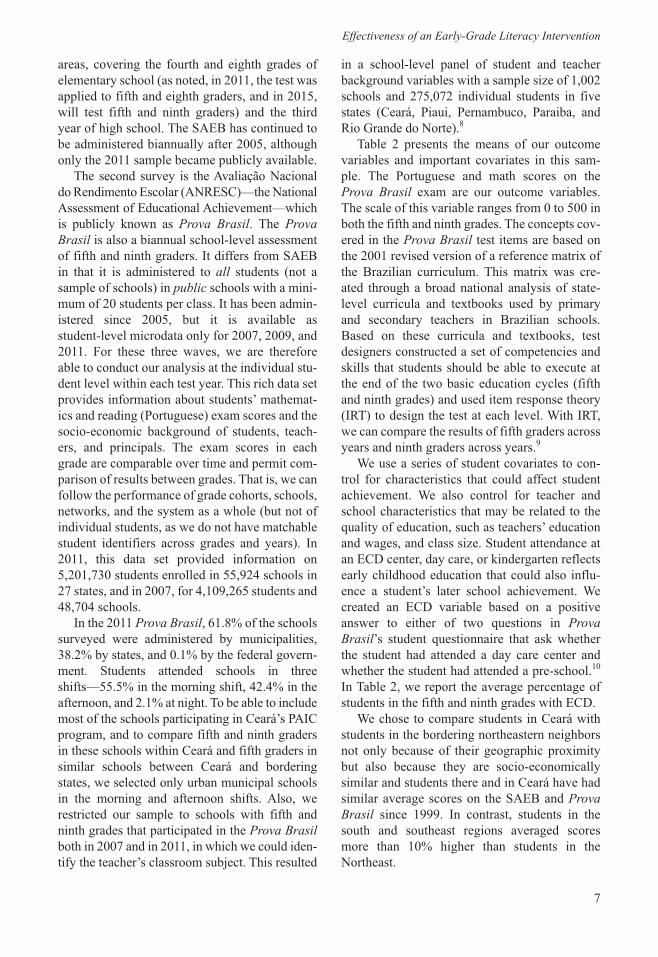
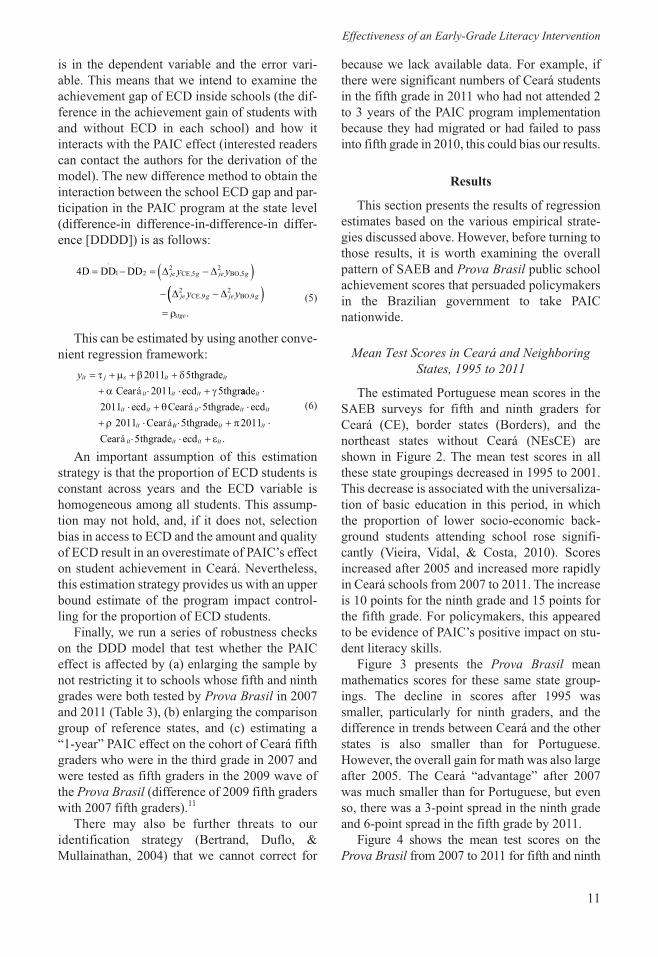
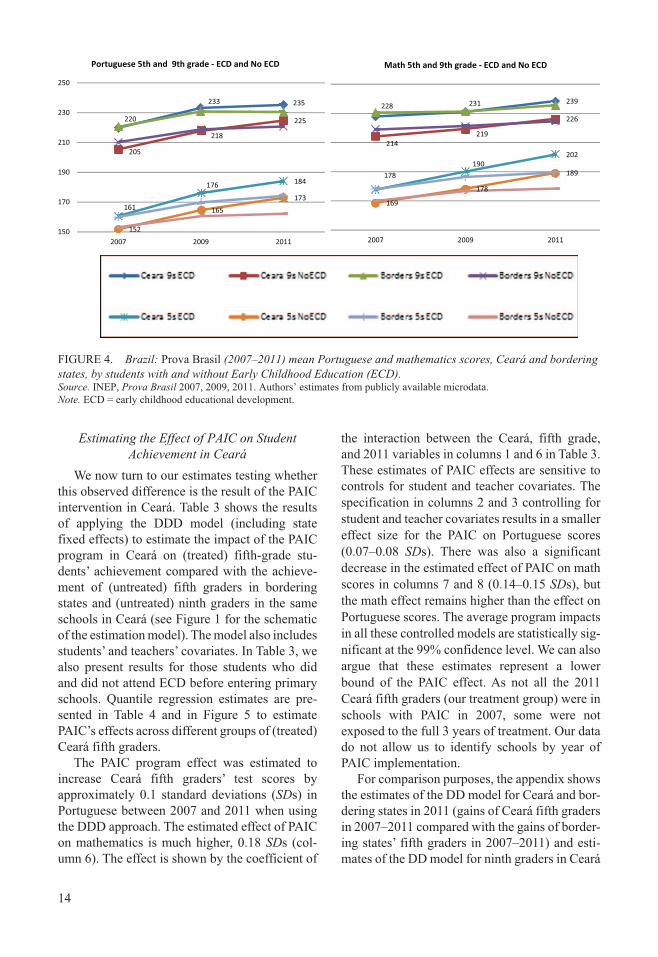
Figure 4 shows the mean test scores on the Prova Brasil from 2007 to 2011 for fifth and ninth
á
á
á
á
12
TAB
LE
3C
eará
: E
stim
ates
of P
AIC
Eff
ect o
n P
ortu
gues
e an
d M
athe
mat
ics
Ach
ieve
men
t Sco
res,
DD
D S
tate
-Lev
el F
ixed
-Eff
ects
Mod
el
Por
tugu
ese
Mat
hem
atic
s
Dep
ende
nt v
aria
ble
(1)
(2)
(3)
(4)
(5)
(6)
(7)
(8)
(9)
(10)
Cea
rá ×
Fif
th g
rade
×
201
1 0.
096
0.07
20.
079
0.07
40.
080
0.17
90.
146
0.14
30.
143
0.12
0(0
.025
)***
(0.0
24)*
*(0
.024
)***
(0.0
26)*
**(0
.035
1)**
*(0
.031
5)**
*(0
.032
4)**
*(0
.031
2)**
*(0
.032
7)**
*(0
.046
5)**
Cea
rá ×
Fif
th g
rade
0.01
30.
020
0.00
40.
005
0.03
5−
0.01
30.
003
0.00
80.
000
0.07
6
(0.0
19)*
**(0
.017
0)(0
.017
)***
(0.0
18)
(0.0
23)
(0.0
23)
(0.0
23)
(0.0
22)
(0.0
24)*
*(0
.03)
**C
eará
× 2
011
0.10
10.
124
0.11
80.
100
0.13
70.
100
0.12
30.
139
0.12
50.
159
(0
.021
)(0
.019
)***
(0.0
19)*
**(0
.020
)***
(0.0
3)**
*(0
.026
)***
(0.0
27)*
**(0
.026
)***
(0.0
27)*
**(0
.04)
***
Fif
th g
rade
× 2
011
0.06
8−
0.09
1−
0.10
1−
0.10
8−
0.10
80.
111
0.04
30.
051
0.04
20.
038
(0
.016
)***
(0.0
15)*
**(0
.016
)***
(0.0
17)*
**(0
.022
)***
(0.0
19)*
**(0
.02)
**(0
.02)
***
(0.0
21)
(0.0
29)
Cea
rá−
0.08
9−
0.11
1−
0.09
9−
0.09
1−
0.12
0−
0.17
1−
0.20
6−
0.21
2−
0.20
2−
0.25
1
(0.0
41)*
*(0
.035
)**
(0.0
33)*
**(0
.035
)**
(0.0
35)*
(0.0
43)*
**(0
.04)
*(0
.036
)***
(0.0
38)*
**(0
.037
)***
Fif
th g
rade
−1.
206
−1.
478
−1.
458
−1.
486
−1.
333
−1.
111
−1.
547
−1.
519
−1.
542
−1.
361
(0
.012
)***
(0.0
13)*
**(0
.013
)***
(0.0
14)*
**(0
.017
)***
(0.0
16)*
**(0
.019
)***
(0.0
18)*
**(0
.019
)***
(0.0
24)*
**20
110.
099
0.24
90.
246
0.25
50.
217
0.13
60.
193
0.17
70.
190
0.14
4
(0.0
13)*
**(0
.013
)***
(0.0
13)*
**(0
.014
)***
(0.0
2)**
*(0
.016
)***
(0.0
17)*
**(0
.016
)***
(0.0
17)*
**(0
.026
)***
Stu
dent
ch
arac
teri
stic
sN
oY
esY
esY
esY
esN
oY
esY
esY
esY
es
Tea
cher
ch
arac
teri
stic
sN
oN
oY
esY
esY
esN
oN
oY
esY
esN
o
Sta
te f
ixed
eff
ects
Yes
Yes
Yes
Yes
Yes
Yes
Yes
Yes
Yes
Yes
Sam
ple
Com
plet
eC
ompl
ete
Com
plet
eE
CD
st
uden
tsN
o E
CD
st
uden
tsC
ompl
ete
Com
plet
eC
ompl
ete
EC
D
stud
ents
No
EC
D
stud
ents
R2
.349
.396
.398
.394
.372
.285
.322
.323
.315
.302
Obs
erva
tion
s27
4,84
527
4,84
527
4,84
519
2,11
374
,234
181,
806
181,
806
181,
806
134,
810
46,9
54
Sour
ce. P
rova
Bra
sil,
2007
and
201
1, m
icro
data
.N
ote.
PA
IC =
Pac
to N
acio
nal p
ela
Alf
abet
izaç
ão n
a Id
ade
Cer
ta; D
DD
= D
iffe
renc
e-in
-Dif
fere
nce-
in-D
iffe
renc
e; E
CD
= e
arly
chi
ldho
od e
duca
tion
al d
evel
opm
ent.
Val
ues
in p
aren
thes
es a
re
stan
dard
err
ors
of th
e es
tim
ated
coe
ffic
ient
s.*S
tati
stic
ally
sig
nifi
cant
at 1
0% s
igni
fica
nce
leve
l. **
Sta
tist
ical
ly s
igni
fica
nt a
t 5%
sig
nifi
canc
e le
vel.
***S
tati
stic
ally
sig
nifi
cant
at 1
% s
igni
fica
nce
leve
l.
13
224.4
237.6
218.5
210.5 210.3 212.0217.3
231.7 233.5
222.6
224.5
182.7184.4
152.2142.8 148.9 148.8
159.4
172.3 183.4
161.4
167.4
140
150
160
170
180
190
200
210
220
230
240
250
1995 1997 1999 2001 2003 2005 2007 2009 2011SAEB
and
Pro
va B
rasi
l Por
tugu
ese
Scal
e Sc
ore
Ceara 9g Borders 9g NEsCE 9g Ceara 5g Borders 5g
NEsCE 5g Ceara 9 k Borders 9 k Ceara 5 k Borders 5 k
FIGURE 2. Brazil: SAEB (1995–2005) and Prova Brasil (2007–2011) mean Portuguese scale scores, Ceará, bordering states, and other northeastern states, fifth and ninth graders.Source. Instituto Nacional de Estudos e Pesquisas (INEP), SAEB, 1995 to 2005; Prova Brasil 2007, 2009, 2011. Authors’ esti-mates from publicly available microdata.Note. SAEB = Sistema de Avaliação da Educação Básica.
graders in Portuguese and mathematics in Ceará (CE) and its border states (Bordering) for those students who attended ECD and those without ECD. The significant difference of 10 points in the Prova Brasil scale between the ECD and non-ECD students remains constant after 2007, which supports claims for a positive relation between students’ cognitive gains in pre-school
and kindergarten and later success in conventional literacy tasks (Neuman & Dickinson, 2006). It also suggests that the PAIC program did not reduce the long-term disadvantage of students who did not attend ECD. Nevertheless, the slope for the Ceará fifth graders for both ECD and non-ECD students is steeper than the slope of test scores for bordering states’ fifth and for ninth graders.
172.2176.9
162.5
147.9
153 152.9
176.2182.8 186.3
179.9
226.5 223.1 230
216.4
219.1 218.7
226.2 226.6 229.7226.0
140
160
180
200
220
240
1995 1997 1999 2001 2003 2005 2007 2009 2011
SAEB
and
Pro
va B
rasi
l Mat
hem
atic
s Sc
ale
Scor
e
Ceara 5k Borders 5k NEsCE 5k Ceara 9k Borders 9k NEsCE 9k
FIGURE 3. Brazil: SAEB (1995–2005) and Prova Brasil (2007–2011) mean Mathematic scores, Ceará, bordering states, and other northeastern states.Source. INEP, SAEB, 1995 to 2005; Prova Brasil 2007, 2009, 2011. Authors’ estimates from publicly available microdata.Note. SAEB = Sistema de Avaliação da Educação Básica.
14
Estimating the Effect of PAIC on Student Achievement in Ceará
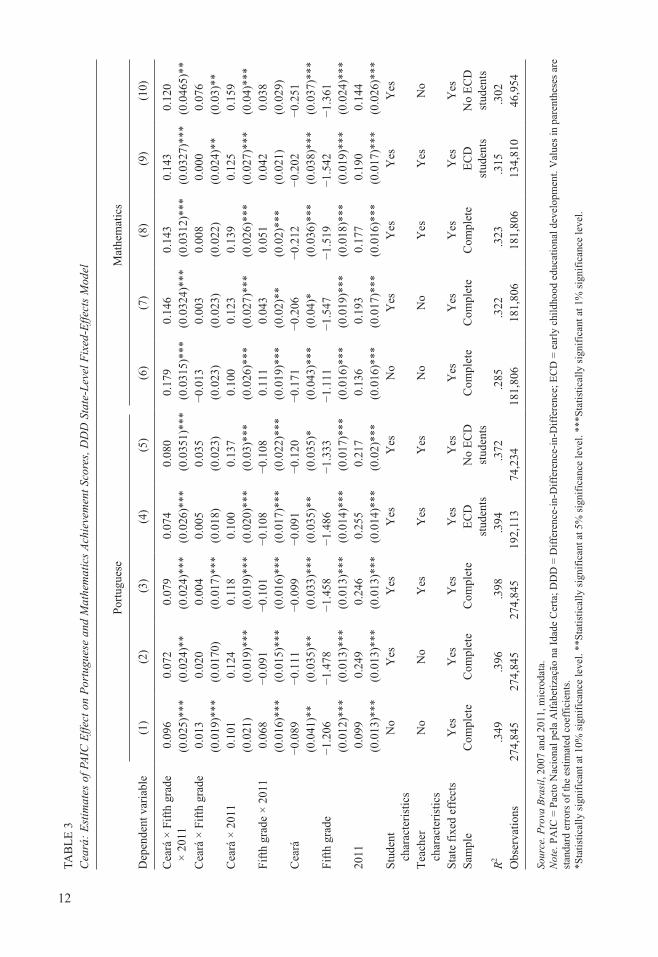
We now turn to our estimates testing whether this observed difference is the result of the PAIC intervention in Ceará. Table 3 shows the results of applying the DDD model (including state fixed effects) to estimate the impact of the PAIC program in Ceará on (treated) fifth-grade stu-dents’ achievement compared with the achieve-ment of (untreated) fifth graders in bordering states and (untreated) ninth graders in the same schools in Ceará (see Figure 1 for the schematic of the estimation model). The model also includes students’ and teachers’ covariates. In Table 3, we also present results for those students who did and did not attend ECD before entering primary schools. Quantile regression estimates are pre-sented in Table 4 and in Figure 5 to estimate PAIC’s effects across different groups of (treated) Ceará fifth graders.
The PAIC program effect was estimated to increase Ceará fifth graders’ test scores by approximately 0.1 standard deviations (SDs) in Portuguese between 2007 and 2011 when using the DDD approach. The estimated effect of PAIC on mathematics is much higher, 0.18 SDs (col-umn 6). The effect is shown by the coefficient of
the interaction between the Ceará, fifth grade, and 2011 variables in columns 1 and 6 in Table 3. These estimates of PAIC effects are sensitive to controls for student and teacher covariates. The specification in columns 2 and 3 controlling for student and teacher covariates results in a smaller effect size for the PAIC on Portuguese scores (0.07–0.08 SDs). There was also a significant decrease in the estimated effect of PAIC on math scores in columns 7 and 8 (0.14–0.15 SDs), but the math effect remains higher than the effect on Portuguese scores. The average program impacts in all these controlled models are statistically sig-nificant at the 99% confidence level. We can also argue that these estimates represent a lower bound of the PAIC effect. As not all the 2011 Ceará fifth graders (our treatment group) were in schools with PAIC in 2007, some were not exposed to the full 3 years of treatment. Our data do not allow us to identify schools by year of PAIC implementation.
For comparison purposes, the appendix shows the estimates of the DD model for Ceará and bor-dering states in 2011 (gains of Ceará fifth graders in 2007–2011 compared with the gains of border-ing states’ fifth graders in 2007–2011) and esti-mates of the DD model for ninth graders in Ceará
220
233 235
205
218
225
161
176 184
152
165
173
150
170
190
210
230
250
2007 2009 2011
Portuguese 5th and 9th grade - ECD and No ECD
228 231 239
214219
226
178190
202
169
178
189
2007 2009 2011
Math 5th and 9th grade - ECD and No ECD
FIGURE 4. Brazil: Prova Brasil (2007–2011) mean Portuguese and mathematics scores, Ceará and bordering states, by students with and without Early Childhood Education (ECD).Source. INEP, Prova Brasil 2007, 2009, 2011. Authors’ estimates from publicly available microdata.Note. ECD = early childhood educational development.
15
TABLE 4Ceará: Estimates of PAIC Effect on Portuguese and Mathematics Achievement Scores, Quantile Regressions, DDD State-Level Fixed-Effects Model
Quantile 1 Quantile 2 Quantile 3 Quantile 4 Quantile 5 OLS
Portuguese Ceará × Fifth
grade × 2011 0.067 0.129 0.178 0.166 0.148 0.096
(0.022)*** (0.020)*** (0.019)*** (0.022)*** (0.032)*** (0.026)*** Ceará × Fifth
grade −0.040 −0.027 0.000 0.043 0.108 0.014(0.013)*** (0.012)** (0.012) (0.013)*** (0.019) (0.019)***
Ceará × 2011 0.084 0.115 0.125 0.141 0.117 0.100 (0.017)*** (0.015)*** (0.015)*** (0.017)*** (0.024)*** (0.021)*** Fifth grade ×
2011 0.030 0.010 0.044 0.126 0.228 0.071
(0.015)* (0.014) (0.013)*** (0.015)*** (0.022)* (0.016)*** Ceará −0.082 −0.097 −0.099 −0.109 −0.147 −0.089 (0.013)* (0.012)*** (0.012)*** (0.013)*** (0.019)* (0.041)*** Fifth grade 0.112 −0.019 −0.106 −0.153 −0.123 −1.211 (0.009)*** (0.008)** (0.008)*** (0.009)*** (0.013)*** (0.013)*** 2011 0.111 0.121 0.129 0.119 0.129 0.100 (0.012)*** (0.010)*** (0.010)*** (0.011)*** (0.016)*** (0.013)***Mathematics Ceará × Fifth
grade × 2011 0.177 0.187 0.211 0.234 0.259 0.179
(0.024)*** (0.022)*** (0.021)*** (0.026)*** (0.038)*** (0.032)*** Ceará × Fifth
grade −0.040 −0.020 −0.013 −0.002 0.015 −0.013(0.017) (0.016) (0.015) (0.019) (0.027) (0.023)
Ceará × 2011 0.020 0.077 0.120 0.169 0.190 0.100 (0.018)*** (0.017)*** (0.017)*** (0.02)*** (0.029)*** (0.026)*** Fifth grade ×
2011 0.229 0.123 0.075 0.042 0.129 0.111
(0.016)*** (0.015)*** (0.015)*** (0.018) (0.026)*** (0.019)*** Ceará −0.129 −0.171 −0.184 −0.206 −0.270 −0.171 (0.016)*** (0.016)*** (0.015)*** (0.018)*** (0.026)*** (0.043)*** Fifth grade −0.088 −0.144 −0.175 −0.170 −0.173 −1.111 (0.012)*** (0.011)** (0.010)*** (0.013)*** (0.018)*** (0.016)*** 2011 0.015 0.117 0.166 0.236 0.264 0.136 (0.012)*** (0.012)*** (0.011)*** (0.014)*** (0.020)*** (0.016)***
Source. Prova Brasil, 2007 and 2011, microdata.Note. PAIC = Pacto Nacional pela Alfabetização na Idade Certa; DDD = Difference-in-Difference-in-Difference; OLS = ordi-nary least squares. Values in parentheses are standard errors of the estimated coefficients.*Statistically significant at 10% significance level. **Statistically significant at 5% significance level. ***Statistically signifi-cant at 1% significance level.
state in 2011. The results in Table A1 show that the effects of the PAIC program are greater than the Table 3 estimates. The effect on Portuguese scores increases to 0.20 SDs and on mathematics scores to 0.28 SDs. However, the justification for including the third difference (compared with the gains of untreated ninth graders) is that, for what-ever reason, the scores of ninth graders in Ceará also rose relative to the scores of ninth graders in
the border states (Table A2), about 0.1 to 0.14 SDs (see also Figures 2 and 3). This is a type of differential “trend” effect in Ceará and bordering states.
There could be many reasons why the efforts in Ceará to raise early achievement may have affected scores of students not directly exposed to early intervention programs. The efforts by the SEDUC to place more emphasis on coherent
16
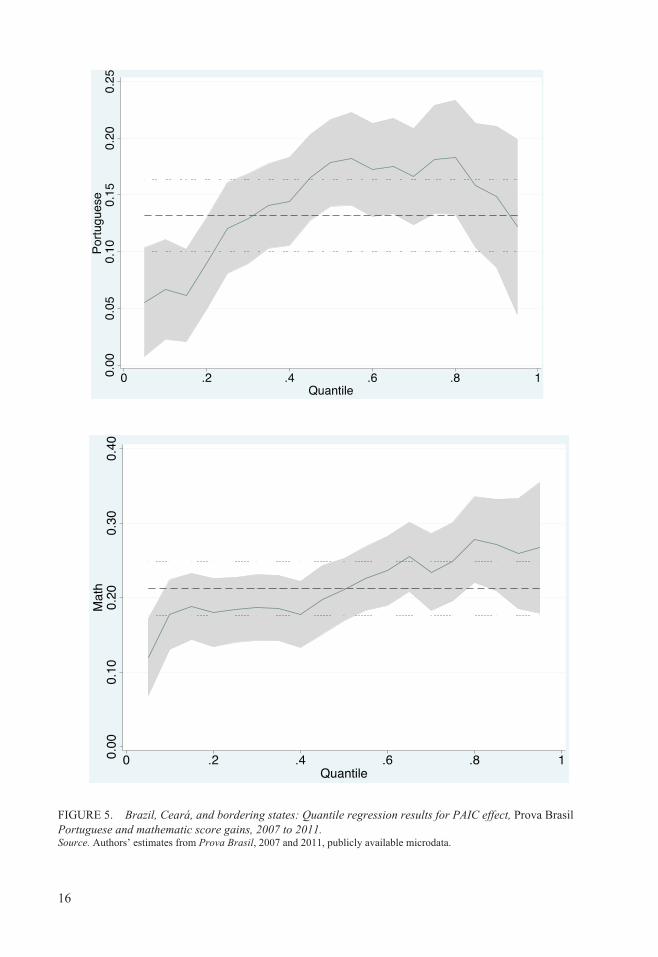
FIGURE 5. Brazil, Ceará, and bordering states: Quantile regression results for PAIC effect, Prova Brasil Portuguese and mathematic score gains, 2007 to 2011.Source. Authors’ estimates from Prova Brasil, 2007 and 2011, publicly available microdata.
Effectiveness of an Early-Grade Literacy Intervention
17
instruction in municipal schools could have spilled over into the sixth to ninth grades, most of which are in the same schools as early grades. Should the effect of this effort be included in esti-mates of the impact of the literacy intervention? The argument for it being included is that the effort to improve school instruction in municipal schools overall is part and parcel of the PAIC program. The argument against is that we are try-ing to estimate the impact of a literacy interven-tion, and that only our fifth-grade cohort in Ceará was subject to that treatment. If we assume that unobserved “Ceará education effects” in our sample of schools that increased ninth graders’ achievement in Ceará relative to achievement in bordering states also influenced fifth graders’ gains in Ceará, we would want to net out those effects to estimate the PAIC effect.
The estimated PAIC effect using the DDD method may be biased even when controlling for important student, teacher, and classroom vari-ables. Many students in Ceará and bordering states attended early childhood programs (ECD), and the PAIC effect could be confounded with the effect of ECD. However, when we make sep-arate estimates of the PAIC effect on students with and without ECD, the results are similar to those for the total set of students. The 0.07 SD estimate for the PAIC effect on Portuguese achievement in Table 3, column 4, for students who attended ECD is about the same as the PAIC effect for no ECD students (column 5). Similarly, for mathematics achievement, the PAIC effect size for students who attended ECD is about the same as for no ECD students (0.14 vs. 0.12). This means that although the PAIC program had a sta-tistically significant positive effect on students’ achievement, it did not reduce the achievement gap between students who attended and did not attend ECD.
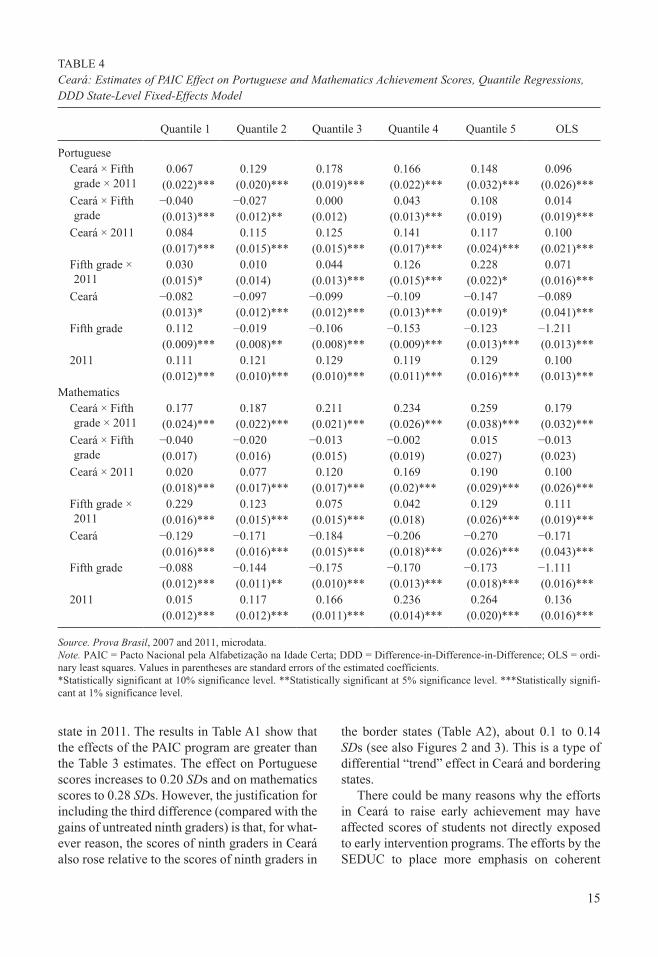
We test for possible heterogeneous effects of the PAIC intervention across the distribution of initial 2007 Prova Brasil scores of Ceará’s treated fifth graders with quantile DDD state-level fixed-effects regressions. The results are presented in Table 4 and in Figure 5. They show smaller PAIC effects (0.06 and 0.12 SDs) on Portuguese achievement gains for fifth-grade students in the first and second quantiles (initial Portuguese scores in the lowest 20th percentile and 20th–40th percentiles than for students in the third and
fourth quintiles—0.18 and 0.17 SDs). The PAIC effect fell slightly to 0.15 SDs for students in the fifth quintile. The pattern of PAIC effects is simi-lar for mathematics gains. The effect size rises steadily from the lowest to the highest quintile, from 0.18 to 0.26. Thus, even though the PAIC intervention increased achievement gains across the entire range of student initial Portuguese and mathematics achievement levels, initially lower achievers benefit less from the PAIC intervention than initially median and higher achieving stu-dents in both Portuguese and mathematics. It is therefore likely that the PAIC failed to reduce the test-score gap between initially lower and higher scoring students, and may have contributed to spreading the gap between them.
Robustness Checks
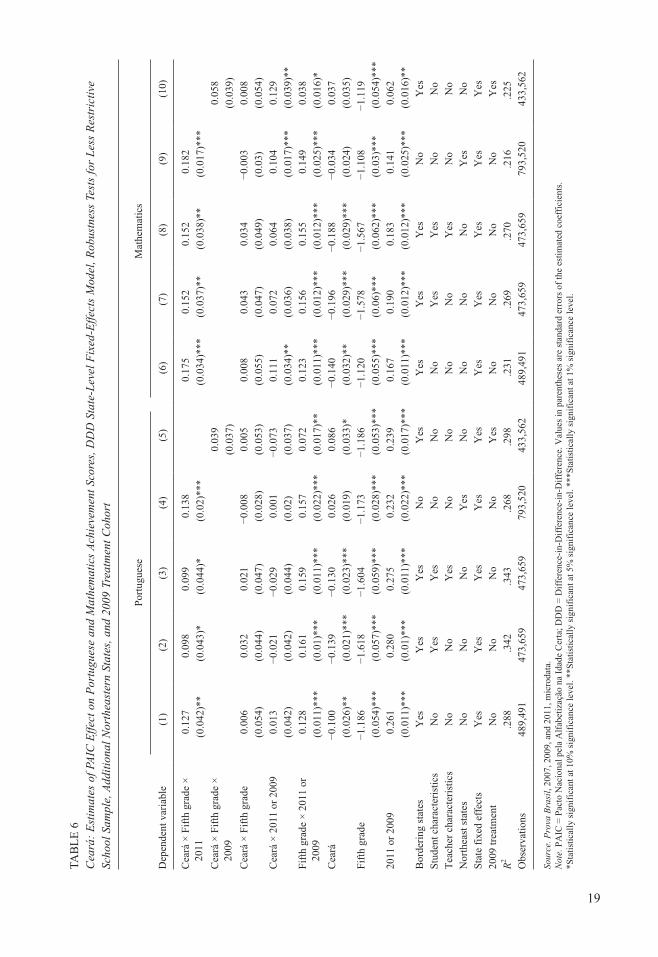
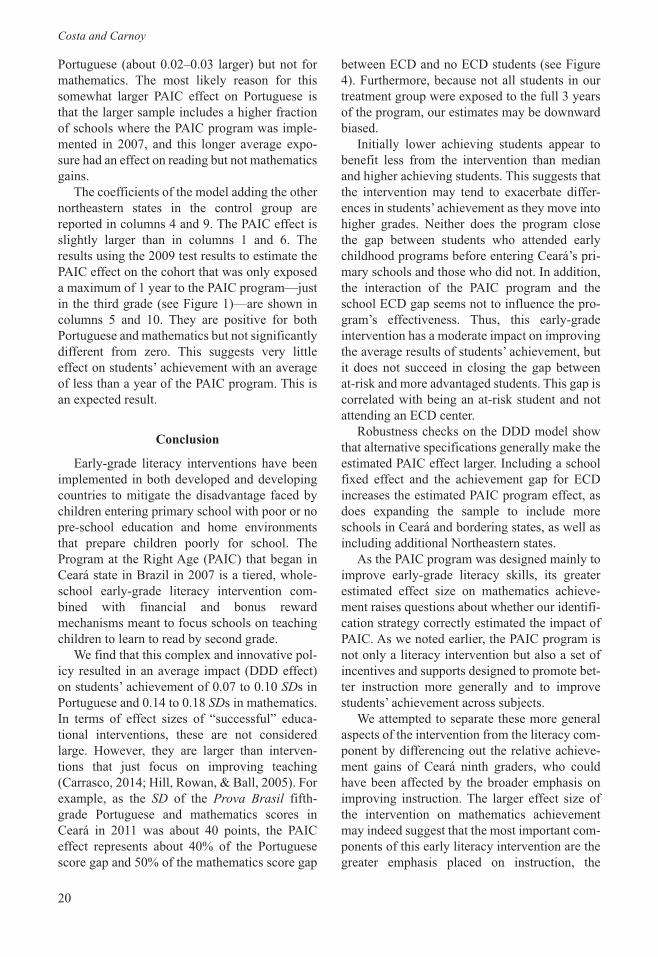
As a check on the robustness of our estimates of the PAIC effect, we re-estimate the effects based on strategic changes in the specifications of the model. First, we estimate the impact of the PAIC program conditioning on the interaction between the literacy program and the ECD achievement gap of students in the same school and grade, as proposed in Equations 5 and 6 in the methodology section. The results are shown in Table 5. Table 6 shows the DDD estimates for three new model specifications: (a) removing the “fifth and ninth grades tested in both test years” restriction on schools included in the sample, (b) adding four other states to the control group (Sergipe, Alagoas, Bahia, and Maranhão), and (c) comparing fifth graders in the 2009 Prova Brasil wave with fifth graders in the 2007 wave to test the PAIC effect on the cohort that was only exposed to the program for 1 year. Again, not all students in the cohort were exposed even for a year because PAIC was not implemented in all Ceará municipal schools in 2007.
Table 5 shows the estimated results of the interaction within a school (controlling for school fixed effects) of the PAIC program effect with the achievement difference between students with and without ECD. The larger the ECD achievement gap in a school, the smaller the PAIC effect. Although the size of ECD interac-tion with the PAIC effect does change when we control for student, teacher, and classroom char-acteristics, the PAIC effect remains significantly

18
negative and large, 0.19 to 0.25 SDs smaller for each SD of ECD achievement gap. If we assume that the ECD gap represents an unobserved quan-tity/quality measure of the ECD taken, this sug-gests that the higher the quantity/quality of students’ ECD in a school, the smaller the impact of the PAIC on students with ECD. The result makes some sense. It implies that although the PAIC effect does not reduce average differences between students with and without ECD (Table 3), it may reduce differences between students with higher and lower quality ECD. At the same time, controlling for the interaction of the ECD gap, the average PAIC effect within a school is larger than the average PAIC effect across schools in Table 3 (as measured by the DDD
coefficient—Ceará × Fifth grade × 2011), sug-gesting that the PAIC effect on students’ gains is greater in schools where students made smaller relative gains from “fixed” unobserved factors.
Table 6 presents the results of estimating the PAIC effect with alternative specifications of the sample and treatment group. Columns 1, 2, 3, and 6, 7, 8 in Table 6 present estimates of model specifications similar to those in Table 3, col-umns 1, 2, 3 and 6, 7, 8. However, the student sample size is much larger in Table 6 because unlike in Table 3 we included schools in which either fifth graders or ninth graders (not neces-sarily both) were tested in a Prova Brasil test wave. With this expanded sample, the PAIC effect is somewhat larger than in Table 3 for
TABLE 5Ceará: Estimates of PAIC Effect on Portuguese and Mathematics Achievement Scores, 4D (With ECD Interaction) School-Level Fixed-Effects Model
Portuguese Mathematics
Dependent variable (1) (2) (3) (4)
Ceará × Fifth grade × 2011
0.212 0.113 0.303 0.275(0.02)*** (0.020)*** (0.025)*** (0.024)***
ECD × Ceará × Fifth grade
0.197 0.204 0.204 0.198(0.015)*** (0.014)*** (0.019)*** (0.018)***
ECD × Ceará × 2011 0.140 0.109 0.126 0.100 (0.01)*** (0.009)*** (0.013)*** (0.013)***ECD × Fifth grade ×
2011 0.179 0.015 0.215 0.123
(0.011)*** (0.010) (0.007)*** (0.013)***ECD × Ceará × Fifth
grade × 2011 −0.299 −0.187 −0.315 −0.253(0.026)*** (0.025)*** (0.029)*** (0.028)***
Ceará −0.958 −0.926 −0.536 −0.057 (0.007)*** (0.009)*** (0.007)*** (0.013)***Fifth grade −1.256 −1.505 −1.142 −1.531 (0.008)*** (0.009)*** (0.01)*** (0.012)***2011 0.057 0.187 0.098 0.159 (0.009)*** (0.009)*** (0.011)*** (0.012)***Student characteristics No Yes No YesTeacher
characteristicsNo Yes No Yes
School fixed effects Yes Yes Yes YesR2 .399 .437 .349 .378Observations 275,072 275,072 181,806 181,806
Source. Prova Brasil, 2007 and 2011, microdata.Note. PAIC = Pacto Nacional pela Alfabetização na Idade Certa; 4D = four difference; ECD = early childhood educational development. Values in parentheses are standard errors of the estimated coefficients.*Statistically significant at 10% significance level. **Statistically significant at 5% significance level. ***Statistically signifi-cant at 1% significance level.
19
TAB
LE
6C
eará
: E
stim
ates
of P
AIC
Eff
ect o
n P
ortu
gues
e an
d M
athe
mat
ics
Ach
ieve
men
t Sco
res,
DD
D S
tate
-Lev
el F
ixed
-Eff
ects
Mod
el, R
obus
tnes
s Te
sts
for
Les
s R
estr
icti
ve
Scho
ol S
ampl
e, A
ddit
iona
l Nor
thea
ster
n St
ates
, and
200
9 Tr
eatm
ent C
ohor
t
Por
tugu
ese
Mat
hem
atic
s
Dep
ende
nt v
aria
ble
(1)
(2)
(3)
(4)
(5)
(6)
(7)
(8)
(9)
(10)
Cea
rá ×
Fif
th g
rade
×
2011
0.
127
0.09
80.
099
0.13
80.
175
0.15
20.
152
0.18
2
(0.0
42)*
*(0
.043
)*(0
.044
)*(0
.02)
***
(0.0
34)*
**(0
.037
)**
(0.0
38)*
*(0
.017
)***
C
eará
× F
ifth
gra
de ×
20
09
0.03
90.
058
(0.0
37)
(0.0
39)
Cea
rá ×
Fif
th g
rade
0.00
60.
032
0.02
1−
0.00
80.
005
0.00
80.
043
0.03
4−
0.00
30.
008
(0
.054
)(0
.044
)(0
.047
)(0
.028
)(0
.053
)(0
.055
)(0
.047
)(0
.049
)(0
.03)
(0.0
54)
Cea
rá ×
201
1 or
200
90.
013
−0.
021
−0.
029
0.00
1−
0.07
30.
111
0.07
20.
064
0.10
40.
129
(0
.042
)(0
.042
)(0
.044
)(0
.02)
(0.0
37)
(0.0
34)*
*(0
.036
)(0
.038
)(0
.017
)***
(0.0
39)*
*F
ifth
gra
de ×
201
1 or
20
09
0.12
80.
161
0.15
90.
157
0.07
20.
123
0.15
60.
155
0.14
90.
038
(0.0
11)*
**(0
.01)
***
(0.0
11)*
**(0
.022
)***
(0.0
17)*
*(0
.011
)***
(0.0
12)*
**(0
.012
)***
(0.0
25)*
**(0
.016
)*C
eará
−0.
100
−0.
139
−0.
130
0.02
60.
086
−0.
140
−0.
196
−0.
188
−0.
034
0.03
7
(0.0
26)*
*(0
.021
)***
(0.0
23)*
**(0
.019
)(0
.033
)*(0
.032
)**
(0.0
29)*
**(0
.029
)***
(0.0
24)
(0.0
35)
Fif
th g
rade
−1.
186
−1.
618
−1.
604
−1.
173
−1.
186
−1.
120
−1.
578
−1.
567
−1.
108
−1.
119
(0
.054
)***
(0.0
57)*
**(0
.059
)***
(0.0
28)*
**(0
.053
)***
(0.0
55)*
**(0
.06)
***
(0.0
62)*
**(0
.03)
***
(0.0
54)*
**20
11 o
r 20
090.
261
0.28
00.
275
0.23
20.
239
0.16
70.
190
0.18
30.
141
0.06
2
(0.0
11)*
**(0
.01)
***
(0.0
11)*
**(0
.022
)***
(0.0
17)*
**(0
.011
)***
(0.0
12)*
**(0
.012
)***
(0.0
25)*
**(0
.016
)**
Bor
deri
ng s
tate
sY
esY
esY
esN
oY
esY
esY
esY
esN
oY
esS
tude
nt c
hara
cter
isti
csN
oY
esY
esN
oN
oN
oY
esY
esN
oN
oT
each
er c
hara
cter
isti
csN
oN
oY
esN
oN
oN
oN
oY
esN
oN
oN
orth
east
sta
tes
No
No
No
Yes
No
No
No
No
Yes
No
Sta
te f
ixed
eff
ects
Yes
Yes
Yes
Yes
Yes
Yes
Yes
Yes
Yes
Yes
2009
trea
tmen
tN
oN
oN
oN
oY
esN
oN
oN
oN
oY
esR
2.2
88.3
42.3
43.2
68.2
98.2
31.2
69.2
70.2
16.2
25O
bser
vati
ons
489,
491
473,
659
473,
659
793,
520
433,
562
489,
491
473,
659
473,
659
793,
520
433,
562
Sour
ce. P
rova
Bra
sil,
2007
, 200
9, a
nd 2
011,
mic
roda
ta.
Not
e. P
AIC
= P
acto
Nac
iona
l pel
a A
lfab
etiz
ação
na
Idad
e C
erta
; DD
D =
Dif
fere
nce-
in-D
iffe
renc
e-in
-Dif
fere
nce.
Val
ues
in p
aren
thes
es a
re s
tand
ard
erro
rs o
f th
e es
tim
ated
coe
ffic
ient
s.*S
tati
stic
ally
sig
nifi
cant
at 1
0% s
igni
fica
nce
leve
l. **
Sta
tist
ical
ly s
igni
fica
nt a
t 5%
sig
nifi
canc
e le
vel.
***S
tati
stic
ally
sig
nifi
cant
at 1
% s
igni
fica
nce
leve
l.
Costa and Carnoy
20
Portuguese (about 0.02–0.03 larger) but not for mathematics. The most likely reason for this somewhat larger PAIC effect on Portuguese is that the larger sample includes a higher fraction of schools where the PAIC program was imple-mented in 2007, and this longer average expo-sure had an effect on reading but not mathematics gains.
The coefficients of the model adding the other northeastern states in the control group are reported in columns 4 and 9. The PAIC effect is slightly larger than in columns 1 and 6. The results using the 2009 test results to estimate the PAIC effect on the cohort that was only exposed a maximum of 1 year to the PAIC program—just in the third grade (see Figure 1)—are shown in columns 5 and 10. They are positive for both Portuguese and mathematics but not significantly different from zero. This suggests very little effect on students’ achievement with an average of less than a year of the PAIC program. This is an expected result.
Conclusion
Early-grade literacy interventions have been implemented in both developed and developing countries to mitigate the disadvantage faced by children entering primary school with poor or no pre-school education and home environments that prepare children poorly for school. The Program at the Right Age (PAIC) that began in Ceará state in Brazil in 2007 is a tiered, whole-school early-grade literacy intervention com-bined with financial and bonus reward mechanisms meant to focus schools on teaching children to learn to read by second grade.
We find that this complex and innovative pol-icy resulted in an average impact (DDD effect) on students’ achievement of 0.07 to 0.10 SDs in Portuguese and 0.14 to 0.18 SDs in mathematics. In terms of effect sizes of “successful” educa-tional interventions, these are not considered large. However, they are larger than interven-tions that just focus on improving teaching (Carrasco, 2014; Hill, Rowan, & Ball, 2005). For example, as the SD of the Prova Brasil fifth-grade Portuguese and mathematics scores in Ceará in 2011 was about 40 points, the PAIC effect represents about 40% of the Portuguese score gap and 50% of the mathematics score gap
between ECD and no ECD students (see Figure 4). Furthermore, because not all students in our treatment group were exposed to the full 3 years of the program, our estimates may be downward biased.
Initially lower achieving students appear to benefit less from the intervention than median and higher achieving students. This suggests that the intervention may tend to exacerbate differ-ences in students’ achievement as they move into higher grades. Neither does the program close the gap between students who attended early childhood programs before entering Ceará’s pri-mary schools and those who did not. In addition, the interaction of the PAIC program and the school ECD gap seems not to influence the pro-gram’s effectiveness. Thus, this early-grade intervention has a moderate impact on improving the average results of students’ achievement, but it does not succeed in closing the gap between at-risk and more advantaged students. This gap is correlated with being an at-risk student and not attending an ECD center.
Robustness checks on the DDD model show that alternative specifications generally make the estimated PAIC effect larger. Including a school fixed effect and the achievement gap for ECD increases the estimated PAIC program effect, as does expanding the sample to include more schools in Ceará and bordering states, as well as including additional Northeastern states.
As the PAIC program was designed mainly to improve early-grade literacy skills, its greater estimated effect size on mathematics achieve-ment raises questions about whether our identifi-cation strategy correctly estimated the impact of PAIC. As we noted earlier, the PAIC program is not only a literacy intervention but also a set of incentives and supports designed to promote bet-ter instruction more generally and to improve students’ achievement across subjects.
We attempted to separate these more general aspects of the intervention from the literacy com-ponent by differencing out the relative achieve-ment gains of Ceará ninth graders, who could have been affected by the broader emphasis on improving instruction. The larger effect size of the intervention on mathematics achievement may indeed suggest that the most important com-ponents of this early literacy intervention are the greater emphasis placed on instruction, the
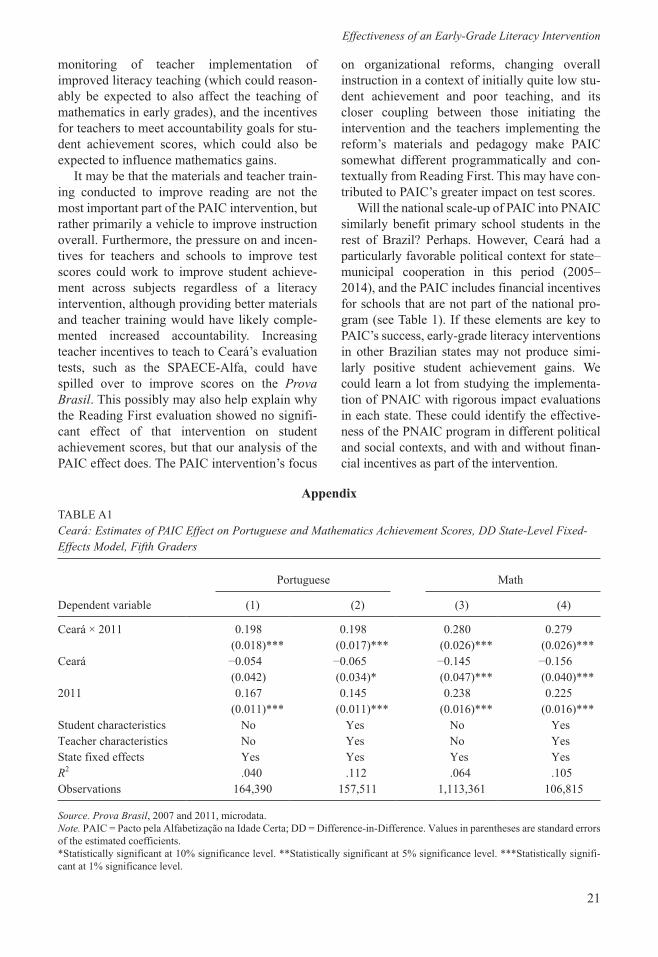
Effectiveness of an Early-Grade Literacy Intervention
21
monitoring of teacher implementation of improved literacy teaching (which could reason-ably be expected to also affect the teaching of mathematics in early grades), and the incentives for teachers to meet accountability goals for stu-dent achievement scores, which could also be expected to influence mathematics gains.
It may be that the materials and teacher train-ing conducted to improve reading are not the most important part of the PAIC intervention, but rather primarily a vehicle to improve instruction overall. Furthermore, the pressure on and incen-tives for teachers and schools to improve test scores could work to improve student achieve-ment across subjects regardless of a literacy intervention, although providing better materials and teacher training would have likely comple-mented increased accountability. Increasing teacher incentives to teach to Ceará’s evaluation tests, such as the SPAECE-Alfa, could have spilled over to improve scores on the Prova Brasil. This possibly may also help explain why the Reading First evaluation showed no signifi-cant effect of that intervention on student achievement scores, but that our analysis of the PAIC effect does. The PAIC intervention’s focus
on organizational reforms, changing overall instruction in a context of initially quite low stu-dent achievement and poor teaching, and its closer coupling between those initiating the intervention and the teachers implementing the reform’s materials and pedagogy make PAIC somewhat different programmatically and con-textually from Reading First. This may have con-tributed to PAIC’s greater impact on test scores.
Will the national scale-up of PAIC into PNAIC similarly benefit primary school students in the rest of Brazil? Perhaps. However, Ceará had a particularly favorable political context for state–municipal cooperation in this period (2005–2014), and the PAIC includes financial incentives for schools that are not part of the national pro-gram (see Table 1). If these elements are key to PAIC’s success, early-grade literacy interventions in other Brazilian states may not produce simi-larly positive student achievement gains. We could learn a lot from studying the implementa-tion of PNAIC with rigorous impact evaluations in each state. These could identify the effective-ness of the PNAIC program in different political and social contexts, and with and without finan-cial incentives as part of the intervention.
Appendix
TABLE A1Ceará: Estimates of PAIC Effect on Portuguese and Mathematics Achievement Scores, DD State-Level Fixed-Effects Model, Fifth Graders
Portuguese Math
Dependent variable (1) (2) (3) (4)
Ceará × 2011 0.198 0.198 0.280 0.279 (0.018)*** (0.017)*** (0.026)*** (0.026)***Ceará −0.054 −0.065 −0.145 −0.156 (0.042) (0.034)* (0.047)*** (0.040)***2011 0.167 0.145 0.238 0.225 (0.011)*** (0.011)*** (0.016)*** (0.016)***Student characteristics No Yes No YesTeacher characteristics No Yes No YesState fixed effects Yes Yes Yes YesR2 .040 .112 .064 .105Observations 164,390 157,511 1,113,361 106,815
Source. Prova Brasil, 2007 and 2011, microdata.Note. PAIC = Pacto pela Alfabetização na Idade Certa; DD = Difference-in-Difference. Values in parentheses are standard errors of the estimated coefficients.*Statistically significant at 10% significance level. **Statistically significant at 5% significance level. ***Statistically signifi-cant at 1% significance level.
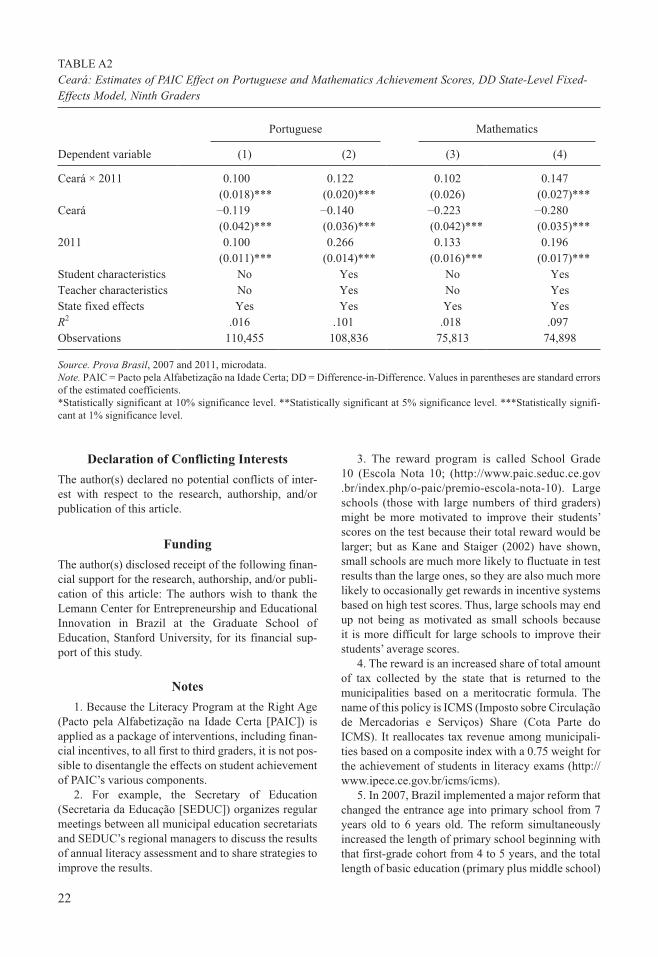
22
Declaration of Conflicting Interests
The author(s) declared no potential conflicts of inter-est with respect to the research, authorship, and/or publication of this article.
Funding
The author(s) disclosed receipt of the following finan-cial support for the research, authorship, and/or publi-cation of this article: The authors wish to thank the Lemann Center for Entrepreneurship and Educational Innovation in Brazil at the Graduate School of Education, Stanford University, for its financial sup-port of this study.
Notes
1. Because the Literacy Program at the Right Age (Pacto pela Alfabetização na Idade Certa [PAIC]) is applied as a package of interventions, including finan-cial incentives, to all first to third graders, it is not pos-sible to disentangle the effects on student achievement of PAIC’s various components.
2. For example, the Secretary of Education (Secretaria da Educação [SEDUC]) organizes regular meetings between all municipal education secretariats and SEDUC’s regional managers to discuss the results of annual literacy assessment and to share strategies to improve the results.
3. The reward program is called School Grade 10 (Escola Nota 10; (http://www.paic.seduc.ce.gov .br/index.php/o-paic/premio-escola-nota-10). Large schools (those with large numbers of third graders) might be more motivated to improve their students’ scores on the test because their total reward would be larger; but as Kane and Staiger (2002) have shown, small schools are much more likely to fluctuate in test results than the large ones, so they are also much more likely to occasionally get rewards in incentive systems based on high test scores. Thus, large schools may end up not being as motivated as small schools because it is more difficult for large schools to improve their students’ average scores.
4. The reward is an increased share of total amount of tax collected by the state that is returned to the municipalities based on a meritocratic formula. The name of this policy is ICMS (Imposto sobre Circulação de Mercadorias e Serviços) Share (Cota Parte do ICMS). It reallocates tax revenue among municipali-ties based on a composite index with a 0.75 weight for the achievement of students in literacy exams (http://www.ipece.ce.gov.br/icms/icms).
5. In 2007, Brazil implemented a major reform that changed the entrance age into primary school from 7 years old to 6 years old. The reform simultaneously increased the length of primary school beginning with that first-grade cohort from 4 to 5 years, and the total length of basic education (primary plus middle school)
TABLE A2Ceará: Estimates of PAIC Effect on Portuguese and Mathematics Achievement Scores, DD State-Level Fixed-Effects Model, Ninth Graders
Portuguese Mathematics
Dependent variable (1) (2) (3) (4)
Ceará × 2011 0.100 0.122 0.102 0.147 (0.018)*** (0.020)*** (0.026) (0.027)***Ceará −0.119 −0.140 −0.223 −0.280 (0.042)*** (0.036)*** (0.042)*** (0.035)***2011 0.100 0.266 0.133 0.196 (0.011)*** (0.014)*** (0.016)*** (0.017)***Student characteristics No Yes No YesTeacher characteristics No Yes No YesState fixed effects Yes Yes Yes YesR2 .016 .101 .018 .097Observations 110,455 108,836 75,813 74,898
Source. Prova Brasil, 2007 and 2011, microdata.Note. PAIC = Pacto pela Alfabetização na Idade Certa; DD = Difference-in-Difference. Values in parentheses are standard errors of the estimated coefficients.*Statistically significant at 10% significance level. **Statistically significant at 5% significance level. ***Statistically signifi-cant at 1% significance level.
Effectiveness of an Early-Grade Literacy Intervention
23
from 8 to 9 years. Thus, the 2005, 2007, and 2009 Prova tested students who had only been in primary school 4 years and 8 years, but the 2011 Prova tested cohorts of students who had been in school 5 years and 8 years. The 2015 Prova will be the first to test students completing basic education with the full 9 years of schooling. As a matter of nomenclature, the Brazilian government renamed the grades after 2007 to 2008, so that Prova Brasil tested students in the “fifth” and “ninth” grades even though the first cohort to actually be in school 5 years when they were tested was the 2011 fifth graders, and the first cohort to actu-ally be in school 9 years in the ninth grade will be the 2015 ninth-grade cohort.
6. As mentioned in the previous note, the ninth graders in 2011 had been in school only 8 years, but in terms of the new definition, they were in the ninth grade. We shall refer everywhere in this article to stu-dents as being in the fifth and ninth grades, even when we discuss earlier years data.
7. In Grade 1, the effect size was 0.1, statistically significant at a 10% level.
8. In the Prova Brasil 2011, there is no subject taught variable in the data set of teacher questionnaires, because many of the teachers in the fifth grade teach both subjects. But there were some questions specific to math and to Portuguese teachers that allowed us to identify the teacher subject taught.
9. For an explanation of the Prova Brasil scale and the content of test items, see http://download.inep.gov .br/educacao_basica/prova_brasil_saeb/downloads/livretos/livreto_prova_brasil_2009.pdf
10. We use these two questions to categorize each student as having attended early childhood educational development (ECD) or not, and we use this individ-ual student ECD dummy variable for all our regres-sion estimates, except for our robustness check on the influence of school-level ECD interaction with PAIC, where we use the percentage of fifth graders with ECD in each school.
11. We also use panel data to test whether the PAIC effect holds up when the achievement of fifth- and ninth-grade Ceará students in 2011 attending schools that participated in all the 2001–2011 SAEB/Prova Brasil tests is compared with the fifth- and ninth-grade achievement of students in bordering states in 2007 and all previous years (trend effects). This is a greatly reduced sample of schools, but should be reasonably representative of all schools. These results are avail-able from the authors on request.
References
Angrist, J. D., & Pischke, J.-S. (2008). Mostly harm-less econometrics: An empiricist’s companion. Princeton, NJ: Princeton University Press.
Ashdown, J., & Simic, O. (2000). Is early literacy intervention effective for English language learn-ers? Evidence from reading recovery. Literacy Teaching and Learning: An International Journal of Early Reading and Writing, 5, 27–42.
Baker, S. K., Smolkowski, K., Smith, J. M., Fien, H., Kame’enui, E. J., & Thomas Beck, C. (2011). The impact of Oregon Reading First on student read-ing outcomes. Elementary School Journal, 112, 307–331.
Barnett, W. S. (2002). Early childhood education. In A. Molnar (Ed.), School reform proposals: The research evidence (pp. 1-26). Charlotte, NC: Information Age Publishing.
Bertrand, M., Duflo, E., & Mullainathan, E. (2004). How much should we trust differences-in-differ-ences estimates? Quarterly Journal of Economics, 119, 249–275.
Carrasco, R. (2014). Leveling the playing field: How can we address educational inequalities? (Unpublished doctoral dissertation). Stanford Graduate School of Education, Stanford University, Stanford, CA.
Chaudhury, N., & Parajuli, D. (2010). Conditional cash transfers and female schooling: The impact of the female school stipend program on public school enrolments in Punjab, Pakistan. Applied Economics, 42, 3565–3583.
Chiapa, C., Garrido, J. L., & Prina, S. (2012). The effect of social programs and exposure to profes-sionals on the educational aspirations of the poor. Economics of Education Review, 31, 778–798.
Cunha, F., & Heckman, J. (2010). Investing in our young people. In A. J. Reynolds, A. J. Rollnick, M. M. Englund, & J. A. Temple (Eds.), Childhood programs and practices in the first decade of life (pp. 381-414). New York, NY: Cambridge University Press.
Currie, J., & Thomas, D. (1993). Does Head Start make a difference? (NBER Working Paper No. 4406). Cambridge, MA: National Bureau of Economic Research.
Elbaum, B., Vaughn, S., Hughes, M. T., & Moody, S. W. (2000). How effective are one-to-one tutor-ing programs in reading for elementary students at risk for reading failure? A meta-analysis of the intervention research. Journal of Educational Psychology, 92, 605–619.
Gamse, B. C., Jacob, R. T., Horst, M., Boulay, B., Unlu, F., Bozzi, L., . . . Rosenblum, S. (2008). Reading First impact study: Final report (NCEE 2008-4038). Washington, DC: U.S. Department of Education, Institute of Education Sciences, National Center for Education Evaluation and Regional Assistance.
Gove, A., & Wetterberg, A. (Eds.). (2011). The Early Grade Reading Assessment: Applications and
Costa and Carnoy
24
interventions to improve basic literacy. Research Triangle Park, NC: RTI Press.
Gusmão, J. B., & Ribeiro, V. M. (2011). Colaboração entre estado e municípios para a alfabetização de crianças na idade certa no Ceará [Collaboration between the state and municipalities to make chil-dren in Ceará literate at the right age]. Cadernos Cenpec, 1(1): 9–34.
Heckman, J., & Masterov, D. (2007). The productivity argument for investing in young children. Review of Agricultural Economics, 29, 446–493.
Hill, H., Rowan, B., & Ball, D. (2005). Effects of teachers’ mathematics knowledge for teaching on student achievement. American Educational Research Journal, 42, 371–406.
Instituto Brasileiro de Geografía e Estadística. (2001). Pesquisa nacional de amostra de domicilios (PNAD) [Microdata files]. Retrieved from http://www.ibge.gov.br/home/estatistica/populacao/ trabalhoerendimento/pnad2011/microdados.shtm
Instituto Brasileiro de Geografía e Estadística. (2007). Pesquisa nacional de amostra de domicilios (PNAD) [Microdata files]. Retrieved from http://www.ibge.gov.br/home/estatistica/populacao/ trabalhoerendimento/pnad2011/microdados.shtm
Instituto Brasileiro de Geografía e Estadística. (2011). Pesquisa nacional de amostra de domicilios (PNAD) [Microdata files]. Retrieved from http://www.ibge.gov.br/home/estatistica/populacao/ trabalhoerendimento/pnad2011/microdados.shtm
Instituto Nacional de Estudos e Pesquisas. (2008). Prova Brasil, 2007. Brasilia, Brazil: INEP. Available from http://portal.inep.gov.br/
Instituto Nacional de Estudos e Pesquisas. (2010). Prova Brasil, 2009. Brasilia, Brazil: INEP. Available from http://portal.inep.gov.br/
Instituto Nacional de Estudos e Pesquisas. (2012). Prova Brasil, 2011. Brasilia, Brazil: INEP. Available from http://portal.inep.gov.br/
Jencks, C., & Phillips, M. (1998). The Black-White test score gap. Washington, DC: Brookings Institution Press.
Kane, T., & Staiger, D. O. (2002). The promise and pitfalls of using imprecise school accountability measures. Journal of Economic Perspectives, 16, 91–114.
Lyons, C. A. (1998). Reading recovery in the United States: More than a decade of data. Literacy Teaching and Learning: An International Journal of Early Reading and Writing, 3, 77–92.
May, H., Gray, A., Gillespie, J. N., Sirinides, P., Sam, C., Goldsworthy, H., Armijo, M., & Tognatta, N.
(2013). Evaluation of the i3 scale-up of reading recovery: Year One Report, 2011-2012 (Report RR-76). Philadelphia, PA: Consortium for Policy Research in Education.
Neuman, S. B., & Dickinson, D. K. (2006). Handbook of early literacy research. New York, NY: Guilford Press.
Ralaingita, W., & Wetterberg, A. (2011). Program effec-tiveness with EGRA: Impact evaluations in South Africa and Mali. In A. Gove, & A. Wetterberg (Eds.), The Early Grade Reading Assessment: Applications and interventions to improve basic literacy (pp. 83-112). Research Triangle Park, NC: RTI Press.
Ravallion, M., Galasso, E., Lazo, T., & Philipp, E. (2005). What can ex-participants reveal about a program’s impact? Journal of Human Resources, 40, 208–230.
Schwartz, R. M. (2005). Literacy learning of at-risk first-grade students in the Reading Recovery early intervention. Journal of Educational Psychology, 97, 257–267.
Slavin, R., Lake, C., Davis, S., & Madden, N. (2011). Effective programs for struggling readers: A best-evidence synthesis. Educational Research Review, 6, 1–26.
Tyler, J. H., Taylor, E. S., Kane, T. J., & Wooten, A. L. (2010). Using student performance data to iden-tify effective classroom practices. The American Economic Review, 100, 256–260.
Vieira, S. L., Vidal, E., & Costa, L. O. (2010). Ensino fundamental: Fim de um ciclo expansionista? [Basic Education: The end of an expansionist cycle?]. Brasilia, Brazil: Study commissioned by the Center for Strategic Studies and Management in Science, Technology and Innovation (CGEE).
Authors
LEANDRO COSTA is an economist at the World Bank in Brasilia. He received his PhD from the Federal University of Ceará and specializes in the economics of education and public policy evaluation.
MARTIN CARNOY is Vida Jacks Professor of Education at Stanford University. He has published extensively in the economics of education, political economy, public policy, and comparative education.
Manuscript received December 28, 2013First revision received September 19, 2014
Second revision received November 23, 2014Accepted December 30, 2014