Embed Size (px)
Citation preview
0
Collier County Florida
Health Assessment
Prepared by:
The Health Planning Council
of Southwest Florida, Inc.
www.hpcswf.com
2016
2
Collier County Health Planning Council of SW Florida, Inc.
Community Health Assessment 2016
Table of Contents Introduction ...................................................................................................................................... 4
Demographic and Socioeconomic Characteristics ................................................................................ 5
Population Demographics ......................................................................................................................... 5
Population Growth .................................................................................................................................... 6
Age ............................................................................................................................................................ 7
Gender ...................................................................................................................................................... 7
Race and Ethnicity ..................................................................................................................................... 8
Socioeconomic Indicators ......................................................................................................................... 9
Health Status ................................................................................................................................... 12
Health Ranking ........................................................................................................................................ 12
Healthy People 2020 Objectives ............................................................................................................. 13
Death Rate .............................................................................................................................................. 15
Death Rates by Race ........................................................................................................................... 15
Leading Causes of Death ..................................................................................................................... 17
Deaths from All Causes ....................................................................................................................... 20
Chronic Diseases ..................................................................................................................................... 24
Cancer ................................................................................................................................................. 24
Heart Disease ...................................................................................................................................... 30
Diabetes .............................................................................................................................................. 32
Weight, Exercise and Nutrition ............................................................................................................... 35
Communicable Diseases ......................................................................................................................... 37
Sexually Transmitted Diseases ............................................................................................................ 38
Vaccine Preventable Diseases ............................................................................................................. 39
AIDS and Other Diseases ..................................................................................................................... 40
Maternal and Child Health ...................................................................................................................... 42
Mothers Who Smoked During Pregnancy .......................................................................................... 43
Teen Births .......................................................................................................................................... 44
Infant Deaths ...................................................................................................................................... 44
Senior Citizen Health ............................................................................................................................... 45
Alzheimer’s Disease ............................................................................................................................ 46
Oral Health .............................................................................................................................................. 48
Accessibility for Low-Income Residents .............................................................................................. 51
3
Collier County Health Planning Council of SW Florida, Inc.
Community Health Assessment 2016
Social and Mental Health ........................................................................................................................ 52
Crime and Domestic Violence ............................................................................................................. 55
Alcohol-related Motor Vehicle Crashes .............................................................................................. 57
Florida Youth Substance Abuse Survey............................................................................................... 59
Suicides ............................................................................................................................................... 62
Baker Act ............................................................................................................................................. 63
Hospitalizations ....................................................................................................................................... 64
Emergency Room Visits ........................................................................................................................... 66
Health Resources ............................................................................................................................. 67
Medicaid.................................................................................................................................................. 71
Florida KidCare ........................................................................................................................................ 72
Uninsured ................................................................................................................................................ 73
Physicians and Facilities .......................................................................................................................... 76
Healthcare Network Patient Origin by Zip Code ..................................................................................... 77
Federal Health Professional Shortage Designations ............................................................................... 80
Community Input ............................................................................................................................. 82
Survey on Health and Healthcare ........................................................................................................... 82
Interviews with Community Leaders ...................................................................................................... 90
Appendices:
Appendix A: County Health Rankings ..................................................................................................... 97
Appendix B: Behavioral Risk Factor Surveillance Survey .................................................................... 100
Appendix C: Survey on Health and Healthcare ................................................................................... 103
Appendix D: Key Informant Interview Guide ....................................................................................... 107
Appendix E: Community Leaders Interviewed ..................................................................................... 109
Appendix F: Definitions of Prevention Quality Indicators .................................................................... 110
Appendix G: Florida Youth Substance Abuse Survey ........................................................................... 111
Appendix H: Collier County Guide to Emergency and Health Services ................................................ 113
Appendix I: Selected Data Sources ...................................................................................................... 119
4
Collier County Health Planning Council of SW Florida, Inc.
Community Health Assessment 2016
Introduction
In an effort to improve the health of the residents of Collier County, a collaborative partnership was formed between the Healthcare Network of Southwest Florida and the Health Planning Council of Southwest Florida, Inc. (HPC) for the purpose of conducting a needs assessment for use by the Healthcare Network of Southwest Florida and other community partners.
HPC reviewed numerous data sources and received feedback from the Healthcare Network of Southwest Florida as well as from members of the community through surveys and interviews. The assessment group reviewed the preliminary data that was collected, and provided feedback to the Health Planning Council.
This needs assessment consists of demographic, socioeconomic and health status information that will be used to identify areas where targeted interventions and policy changes may have the greatest impact. Once community needs are identified through quantitative data analysis of demographic, socioeconomic and health status information, and qualitative interviews, the strategic planning process can begin.
5
Collier County Health Planning Council of SW Florida, Inc.
Community Health Assessment 2016
Demographic and Socioeconomic Characteristics
The demographic, social and economic characteristics of a community can strongly influence the community’s health status and related service needs. These indicators should be a primary consideration when designing and developing any system of care within the region. This section provides a brief overview of some of the characteristics and trends that make Collier County unique in comparison to the state of Florida.
Population Demographics
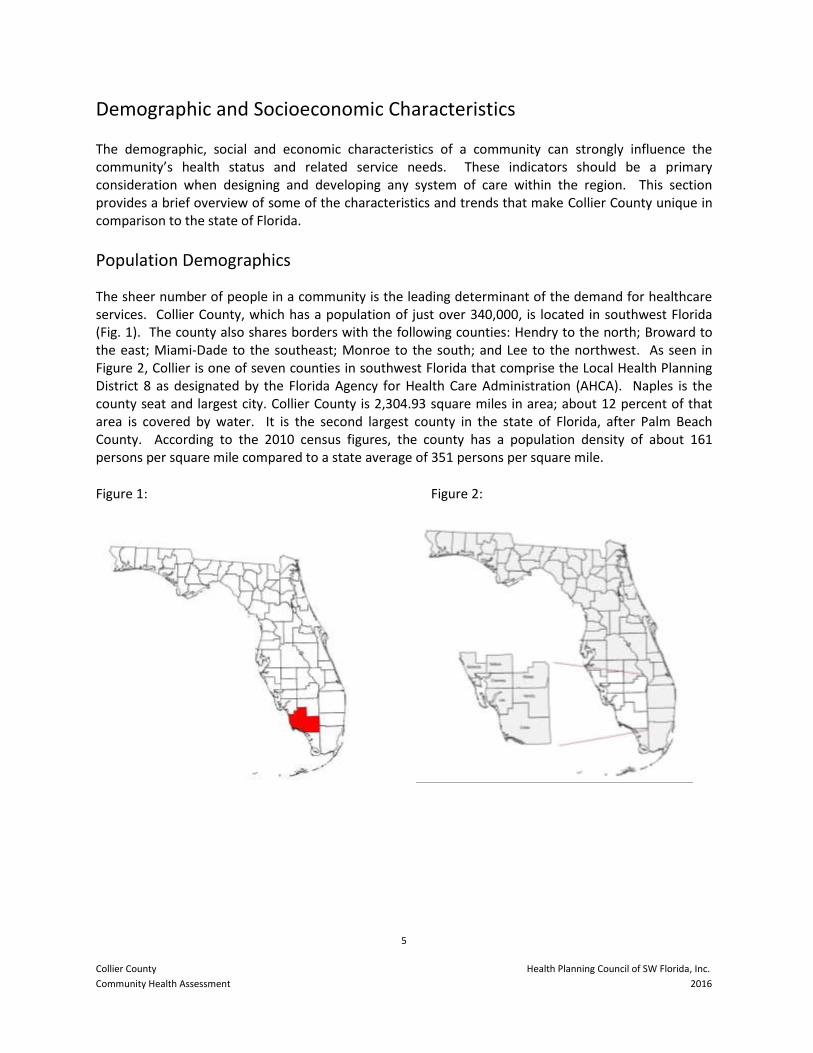
The sheer number of people in a community is the leading determinant of the demand for healthcare services. Collier County, which has a population of just over 340,000, is located in southwest Florida (Fig. 1). The county also shares borders with the following counties: Hendry to the north; Broward to the east; Miami-Dade to the southeast; Monroe to the south; and Lee to the northwest. As seen in Figure 2, Collier is one of seven counties in southwest Florida that comprise the Local Health Planning District 8 as designated by the Florida Agency for Health Care Administration (AHCA). Naples is the county seat and largest city. Collier County is 2,304.93 square miles in area; about 12 percent of that area is covered by water. It is the second largest county in the state of Florida, after Palm Beach County. According to the 2010 census figures, the county has a population density of about 161 persons per square mile compared to a state average of 351 persons per square mile.
Figure 1: Figure 2:
6
Collier County Health Planning Council of SW Florida, Inc.
Community Health Assessment 2016
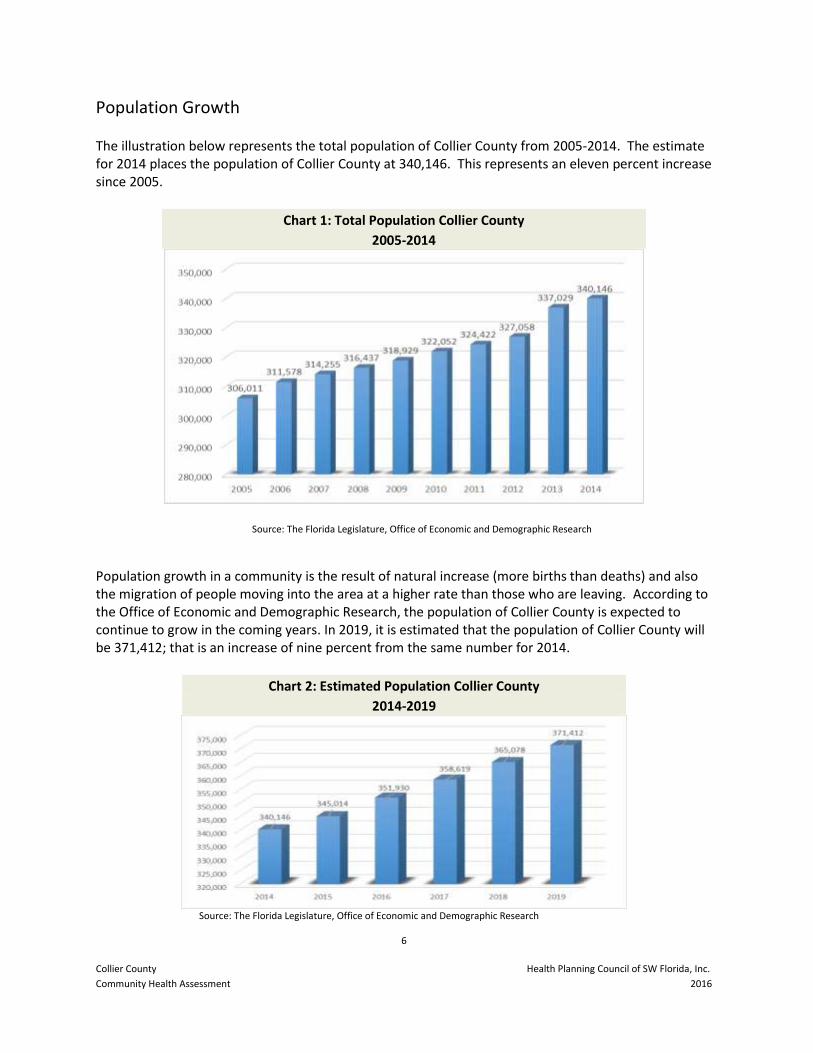
Population Growth
The illustration below represents the total population of Collier County from 2005-2014. The estimate for 2014 places the population of Collier County at 340,146. This represents an eleven percent increase since 2005.
Chart 1: Total Population Collier County
2005-2014
Source: The Florida Legislature, Office of Economic and Demographic Research
Population growth in a community is the result of natural increase (more births than deaths) and also the migration of people moving into the area at a higher rate than those who are leaving. According to the Office of Economic and Demographic Research, the population of Collier County is expected to continue to grow in the coming years. In 2019, it is estimated that the population of Collier County will be 371,412; that is an increase of nine percent from the same number for 2014.
Chart 2: Estimated Population Collier County
2014-2019
Source: The Florida Legislature, Office of Economic and Demographic Research
7
Collier County Health Planning Council of SW Florida, Inc.
Community Health Assessment 2016
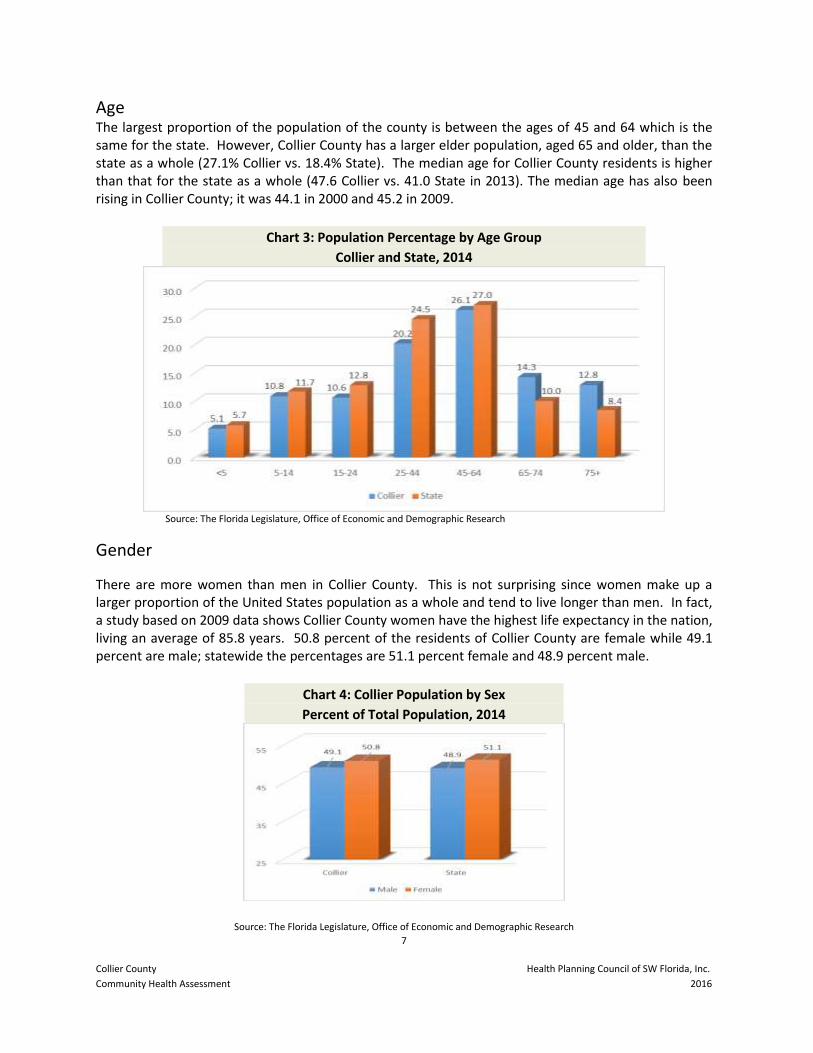
Age
The largest proportion of the population of the county is between the ages of 45 and 64 which is the same for the state. However, Collier County has a larger elder population, aged 65 and older, than the state as a whole (27.1% Collier vs. 18.4% State). The median age for Collier County residents is higher than that for the state as a whole (47.6 Collier vs. 41.0 State in 2013). The median age has also been rising in Collier County; it was 44.1 in 2000 and 45.2 in 2009.
Chart 3: Population Percentage by Age Group
Collier and State, 2014
Source: The Florida Legislature, Office of Economic and Demographic Research
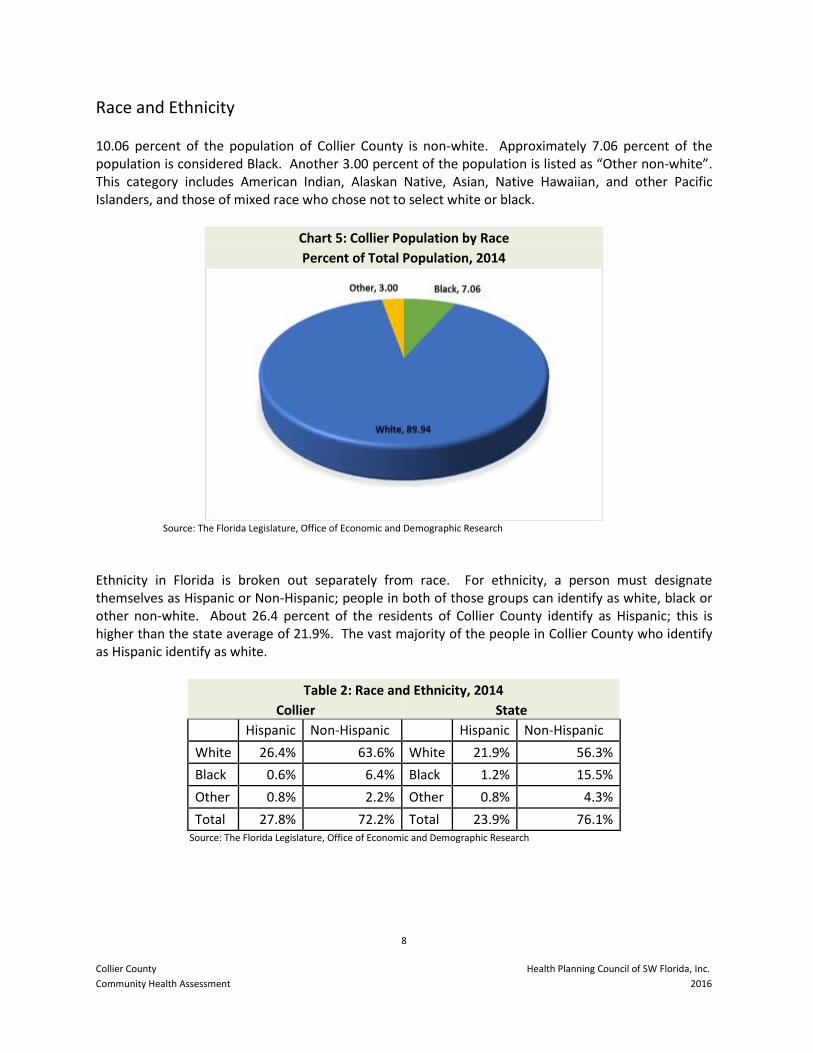
Gender
There are more women than men in Collier County. This is not surprising since women make up a larger proportion of the United States population as a whole and tend to live longer than men. In fact, a study based on 2009 data shows Collier County women have the highest life expectancy in the nation, living an average of 85.8 years. 50.8 percent of the residents of Collier County are female while 49.1 percent are male; statewide the percentages are 51.1 percent female and 48.9 percent male.
Chart 4: Collier Population by Sex
Percent of Total Population, 2014
Source: The Florida Legislature, Office of Economic and Demographic Research
8
Collier County Health Planning Council of SW Florida, Inc.
Community Health Assessment 2016
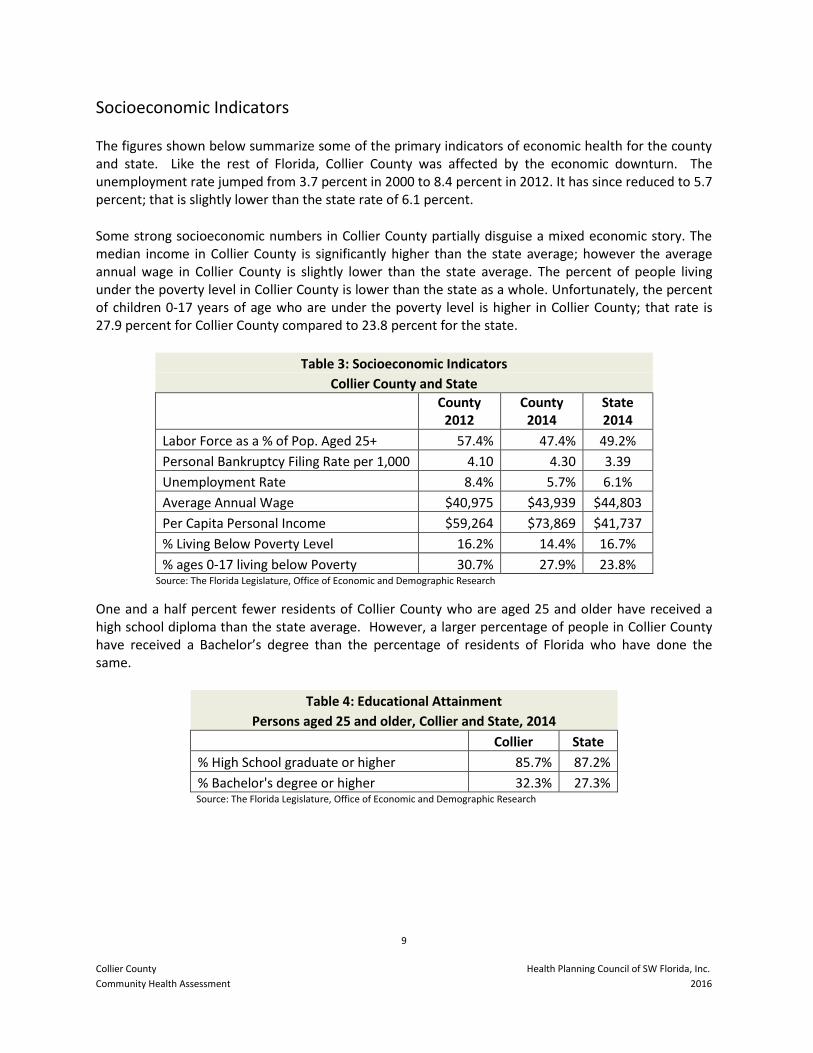
Race and Ethnicity
10.06 percent of the population of Collier County is non-white. Approximately 7.06 percent of the population is considered Black. Another 3.00 percent of the population is listed as “Other non-white”. This category includes American Indian, Alaskan Native, Asian, Native Hawaiian, and other Pacific Islanders, and those of mixed race who chose not to select white or black.
Chart 5: Collier Population by Race
Percent of Total Population, 2014
Source: The Florida Legislature, Office of Economic and Demographic Research
Ethnicity in Florida is broken out separately from race. For ethnicity, a person must designate themselves as Hispanic or Non-Hispanic; people in both of those groups can identify as white, black or other non-white. About 26.4 percent of the residents of Collier County identify as Hispanic; this is higher than the state average of 21.9%. The vast majority of the people in Collier County who identify as Hispanic identify as white.
Table 2: Race and Ethnicity, 2014
Collier State
Hispanic Non-Hispanic Hispanic Non-Hispanic
White 26.4% 63.6% White 21.9% 56.3%
Black 0.6% 6.4% Black 1.2% 15.5%
Other 0.8% 2.2% Other 0.8% 4.3%
Total 27.8% 72.2% Total 23.9% 76.1% Source: The Florida Legislature, Office of Economic and Demographic Research
9
Collier County Health Planning Council of SW Florida, Inc.
Community Health Assessment 2016
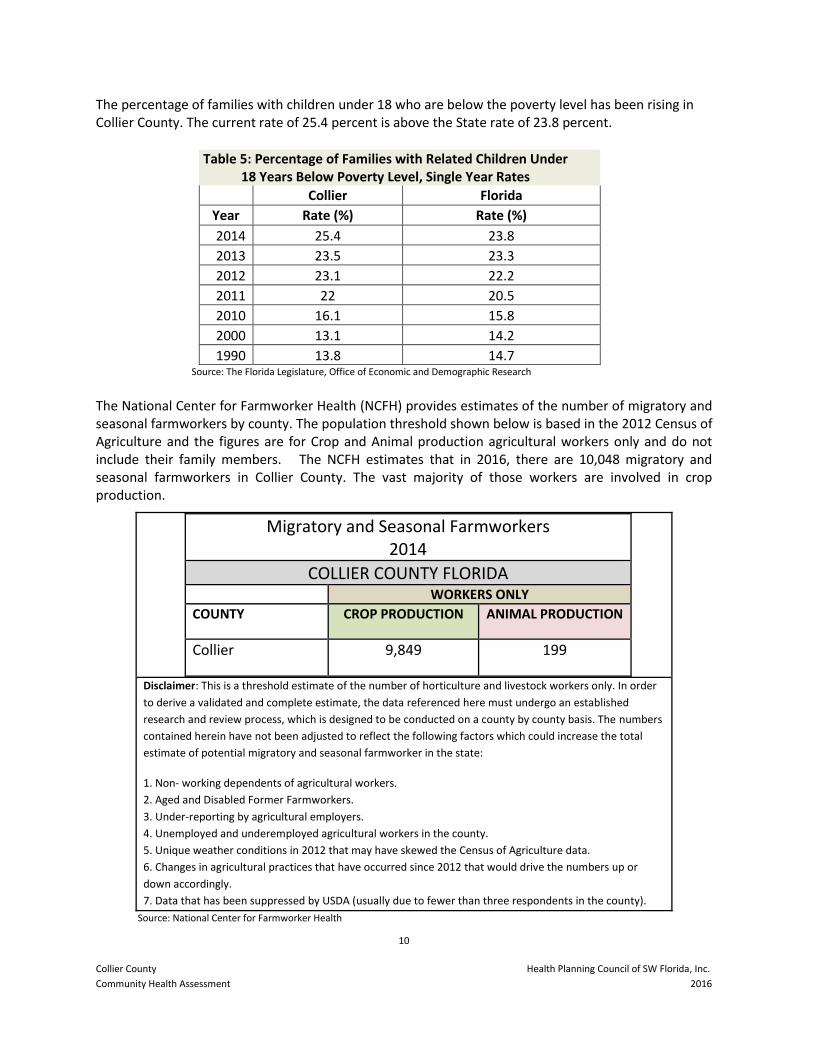
Socioeconomic Indicators
The figures shown below summarize some of the primary indicators of economic health for the county and state. Like the rest of Florida, Collier County was affected by the economic downturn. The unemployment rate jumped from 3.7 percent in 2000 to 8.4 percent in 2012. It has since reduced to 5.7 percent; that is slightly lower than the state rate of 6.1 percent.
Some strong socioeconomic numbers in Collier County partially disguise a mixed economic story. The median income in Collier County is significantly higher than the state average; however the average annual wage in Collier County is slightly lower than the state average. The percent of people living under the poverty level in Collier County is lower than the state as a whole. Unfortunately, the percent of children 0-17 years of age who are under the poverty level is higher in Collier County; that rate is 27.9 percent for Collier County compared to 23.8 percent for the state.
Table 3: Socioeconomic Indicators
Collier County and State
County
2012 County
2014 State 2014
Labor Force as a % of Pop. Aged 25+ 57.4% 47.4% 49.2%
Personal Bankruptcy Filing Rate per 1,000 4.10 4.30 3.39
Unemployment Rate 8.4% 5.7% 6.1%
Average Annual Wage $40,975 $43,939 $44,803
Per Capita Personal Income $59,264 $73,869 $41,737
% Living Below Poverty Level 16.2% 14.4% 16.7%
% ages 0-17 living below Poverty 30.7% 27.9% 23.8% Source: The Florida Legislature, Office of Economic and Demographic Research
One and a half percent fewer residents of Collier County who are aged 25 and older have received a high school diploma than the state average. However, a larger percentage of people in Collier County have received a Bachelor’s degree than the percentage of residents of Florida who have done the same.
Table 4: Educational Attainment
Persons aged 25 and older, Collier and State, 2014
Collier State
% High School graduate or higher 85.7% 87.2%
% Bachelor's degree or higher 32.3% 27.3% Source: The Florida Legislature, Office of Economic and Demographic Research
10
Collier County Health Planning Council of SW Florida, Inc.
Community Health Assessment 2016
The percentage of families with children under 18 who are below the poverty level has been rising in Collier County. The current rate of 25.4 percent is above the State rate of 23.8 percent.
Table 5: Percentage of Families with Related Children Under 18 Years Below Poverty Level, Single Year Rates
Collier Florida
Year Rate (%) Rate (%)
2014 25.4 23.8
2013 23.5 23.3
2012 23.1 22.2
2011 22 20.5
2010 16.1 15.8
2000 13.1 14.2
1990 13.8 14.7 Source: The Florida Legislature, Office of Economic and Demographic Research
The National Center for Farmworker Health (NCFH) provides estimates of the number of migratory and seasonal farmworkers by county. The population threshold shown below is based in the 2012 Census of Agriculture and the figures are for Crop and Animal production agricultural workers only and do not include their family members. The NCFH estimates that in 2016, there are 10,048 migratory and seasonal farmworkers in Collier County. The vast majority of those workers are involved in crop production.
Migratory and Seasonal Farmworkers 2014
COLLIER COUNTY FLORIDA WORKERS ONLY
COUNTY CROP PRODUCTION ANIMAL PRODUCTION
Collier 9,849 199
Disclaimer: This is a threshold estimate of the number of horticulture and livestock workers only. In order
to derive a validated and complete estimate, the data referenced here must undergo an established
research and review process, which is designed to be conducted on a county by county basis. The numbers
contained herein have not been adjusted to reflect the following factors which could increase the total
estimate of potential migratory and seasonal farmworker in the state:
1. Non- working dependents of agricultural workers.
2. Aged and Disabled Former Farmworkers.
3. Under-reporting by agricultural employers.
4. Unemployed and underemployed agricultural workers in the county.
5. Unique weather conditions in 2012 that may have skewed the Census of Agriculture data.
6. Changes in agricultural practices that have occurred since 2012 that would drive the numbers up or
down accordingly.
7. Data that has been suppressed by USDA (usually due to fewer than three respondents in the county). Source: National Center for Farmworker Health
11
Collier County Health Planning Council of SW Florida, Inc.
Community Health Assessment 2016
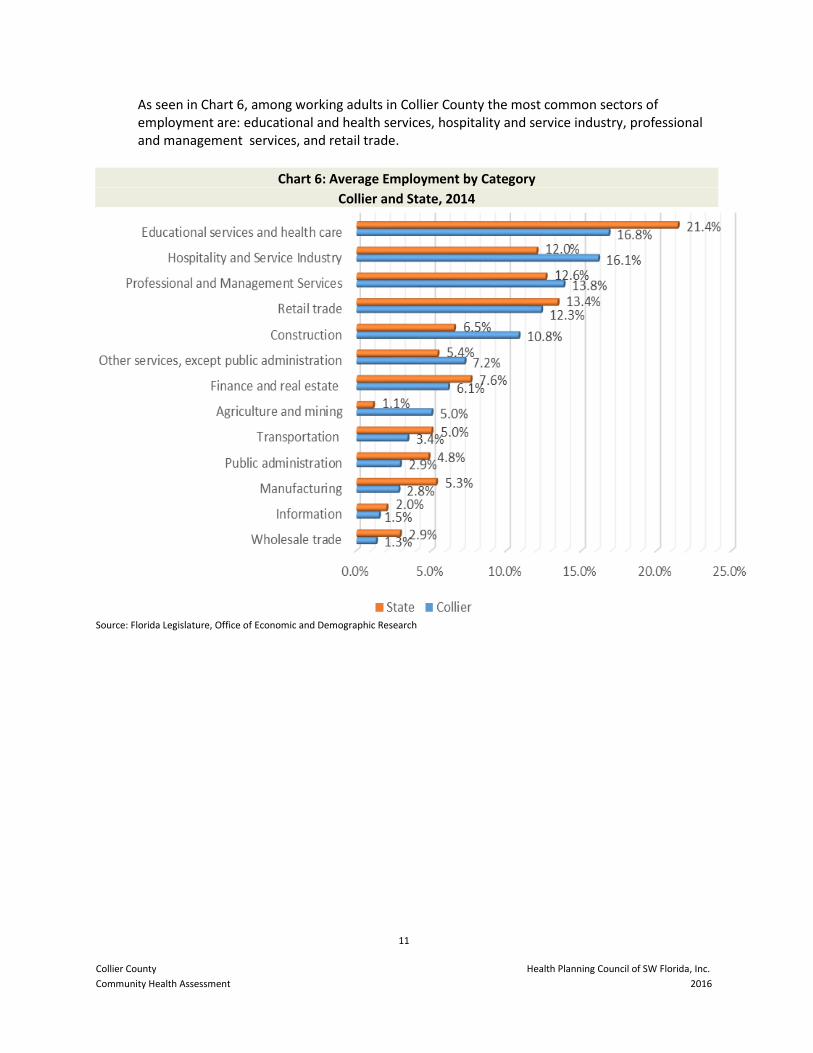
As seen in Chart 6, among working adults in Collier County the most common sectors of employment are: educational and health services, hospitality and service industry, professional and management services, and retail trade.
Chart 6: Average Employment by Category
Collier and State, 2014
Source: Florida Legislature, Office of Economic and Demographic Research
12
Collier County Health Planning Council of SW Florida, Inc.
Community Health Assessment 2016
Health Status
Health Ranking
County Health Rankings & Roadmaps, a collaboration between the Robert Wood Johnson Foundation and the University of Wisconsin Population Health Institute, has Collier County currently ranked the 2nd healthiest out of 67 counties in Florida for Health Outcomes, and 5th healthiest for Health Factors. This is a rise from 3rd and 10th respectively in 2013. These rankings are based on a variety of factors that affect the health of the county’s residents such as unemployment, levels of physical inactivity, and rates of smoking, obesity, and children living in poverty.
The Health Outcomes portion of the rankings includes data on Length of Life and Quality of Life. Collier County was ranked 3rd healthiest of the Florida counties for Length of Life, which is based on the years of potential life lost before the age of 75. Quality of Life includes overall quality of health (poor or fair health, poor physical health days, and poor mental health days) as well as the percent of live births with low birth weight. In this category, Collier County ranked 8th healthiest of all of the Florida counties.
The Health Factors portion of the rankings includes data on health behaviors, clinical care, social & economic factors, and physical environment. Collier County was ranked as the 2nd healthiest county in Florida for health behaviors, which includes rates of adult smoking, adult obesity, physical inactivity, excessive drinking, motor vehicle crash deaths, sexually transmitted infections, and teen births.
For clinical care, Collier County was ranked as the 18th healthiest county. Clinical care includes data on the number of uninsured, primary care physicians, dentists, preventable hospital stays, diabetic screening, and mammography screening. The percent of population under age 65 without health insurance in Collier County (30%) was higher than that of the state average (24%) and considerably higher than the national benchmark (11%).
Social & economic factors, where Collier County ranked 21st healthiest out of 67 counties in Florida, includes rates of high school graduation, some college, unemployment, children in poverty, inadequate social support, children in single-parent households, and violent crime. In Collier County, the percent of the population age 16 and older who are unemployed but seeking work was 5.9 percent. This rate is slightly lower than that of the state (6.3%), but more than the national benchmark (3.5%). The percent of Collier County children under age 18 in poverty was 26 percent, which is higher than the state average (24%) and significantly higher than the national benchmark (13%).
Physical environment includes rates of daily fine particulate matter, drinking water violations, severe housing problems, driving alone to work and long commutes. In this category, Collier County ranked 5th healthiest. A detailed breakdown of the rankings and full definitions for each health measure are available in Appendix A.
13
Collier County Health Planning Council of SW Florida, Inc.
Community Health Assessment 2016
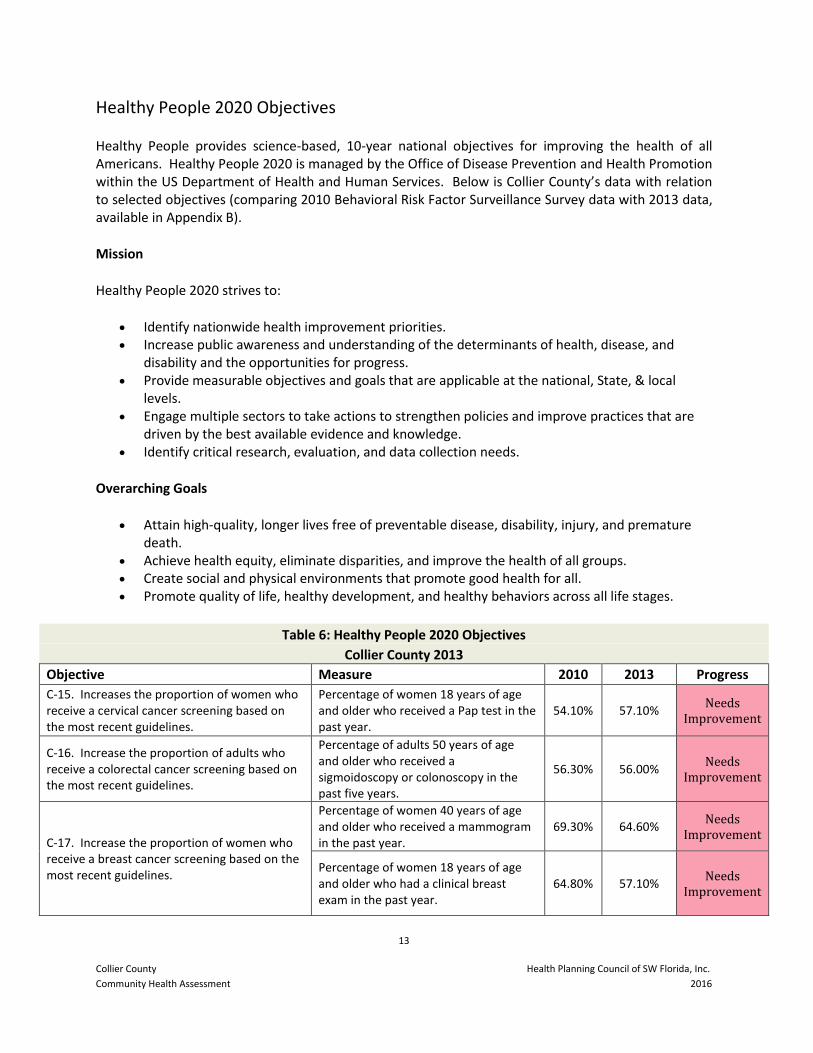
Healthy People 2020 Objectives
Healthy People provides science-based, 10-year national objectives for improving the health of all Americans. Healthy People 2020 is managed by the Office of Disease Prevention and Health Promotion within the US Department of Health and Human Services. Below is Collier County’s data with relation to selected objectives (comparing 2010 Behavioral Risk Factor Surveillance Survey data with 2013 data, available in Appendix B).
Mission
Healthy People 2020 strives to:
Identify nationwide health improvement priorities. Increase public awareness and understanding of the determinants of health, disease, and
disability and the opportunities for progress. Provide measurable objectives and goals that are applicable at the national, State, & local
levels. Engage multiple sectors to take actions to strengthen policies and improve practices that are
driven by the best available evidence and knowledge. Identify critical research, evaluation, and data collection needs.
Overarching Goals
Attain high-quality, longer lives free of preventable disease, disability, injury, and premature death.
Achieve health equity, eliminate disparities, and improve the health of all groups. Create social and physical environments that promote good health for all. Promote quality of life, healthy development, and healthy behaviors across all life stages.
Table 6: Healthy People 2020 Objectives
Collier County 2013
Objective Measure 2010 2013 Progress
C-15. Increases the proportion of women who receive a cervical cancer screening based on the most recent guidelines.
Percentage of women 18 years of age and older who received a Pap test in the past year.
54.10% 57.10% Needs
Improvement
C-16. Increase the proportion of adults who receive a colorectal cancer screening based on the most recent guidelines.
Percentage of adults 50 years of age and older who received a sigmoidoscopy or colonoscopy in the past five years.
56.30% 56.00% Needs
Improvement
C-17. Increase the proportion of women who receive a breast cancer screening based on the most recent guidelines.
Percentage of women 40 years of age and older who received a mammogram in the past year.
69.30% 64.60% Needs
Improvement
Percentage of women 18 years of age and older who had a clinical breast exam in the past year.
64.80% 57.10% Needs
Improvement
14
Collier County Health Planning Council of SW Florida, Inc.
Community Health Assessment 2016
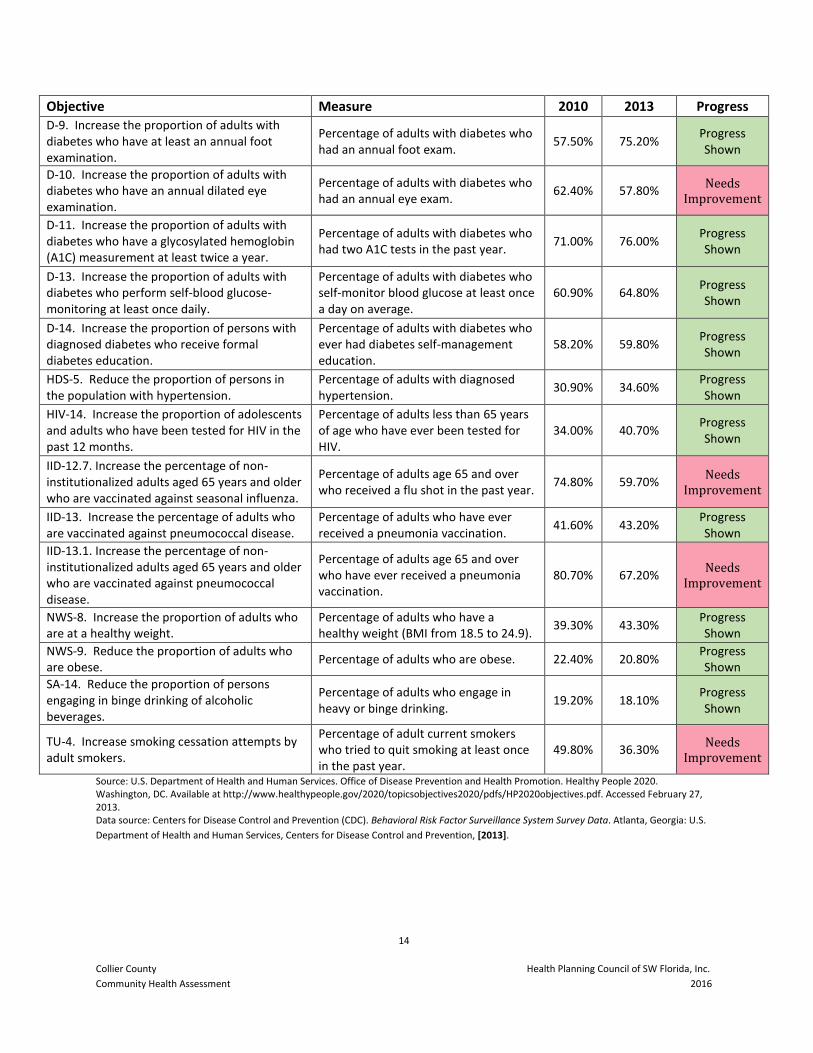
Objective Measure 2010 2013 Progress
D-9. Increase the proportion of adults with diabetes who have at least an annual foot examination.
Percentage of adults with diabetes who had an annual foot exam.
57.50% 75.20% Progress Shown
D-10. Increase the proportion of adults with diabetes who have an annual dilated eye examination.
Percentage of adults with diabetes who had an annual eye exam.
62.40% 57.80% Needs
Improvement
D-11. Increase the proportion of adults with diabetes who have a glycosylated hemoglobin (A1C) measurement at least twice a year.
Percentage of adults with diabetes who had two A1C tests in the past year.
71.00% 76.00% Progress Shown
D-13. Increase the proportion of adults with diabetes who perform self-blood glucose-monitoring at least once daily.
Percentage of adults with diabetes who self-monitor blood glucose at least once a day on average.
60.90% 64.80% Progress Shown
D-14. Increase the proportion of persons with diagnosed diabetes who receive formal diabetes education.
Percentage of adults with diabetes who ever had diabetes self-management education.
58.20% 59.80% Progress Shown
HDS-5. Reduce the proportion of persons in the population with hypertension.
Percentage of adults with diagnosed hypertension.
30.90% 34.60% Progress Shown
HIV-14. Increase the proportion of adolescents and adults who have been tested for HIV in the past 12 months.
Percentage of adults less than 65 years of age who have ever been tested for HIV.
34.00% 40.70% Progress Shown
IID-12.7. Increase the percentage of non-institutionalized adults aged 65 years and older who are vaccinated against seasonal influenza.
Percentage of adults age 65 and over who received a flu shot in the past year.
74.80% 59.70% Needs
Improvement
IID-13. Increase the percentage of adults who are vaccinated against pneumococcal disease.
Percentage of adults who have ever received a pneumonia vaccination.
41.60% 43.20% Progress Shown
IID-13.1. Increase the percentage of non-institutionalized adults aged 65 years and older who are vaccinated against pneumococcal disease.
Percentage of adults age 65 and over who have ever received a pneumonia vaccination.
80.70% 67.20% Needs
Improvement
NWS-8. Increase the proportion of adults who are at a healthy weight.
Percentage of adults who have a healthy weight (BMI from 18.5 to 24.9).
39.30% 43.30% Progress Shown
NWS-9. Reduce the proportion of adults who are obese.
Percentage of adults who are obese. 22.40% 20.80% Progress Shown
SA-14. Reduce the proportion of persons engaging in binge drinking of alcoholic beverages.
Percentage of adults who engage in heavy or binge drinking.
19.20% 18.10% Progress Shown
TU-4. Increase smoking cessation attempts by adult smokers.
Percentage of adult current smokers who tried to quit smoking at least once in the past year.
49.80% 36.30% Needs
Improvement
Source: U.S. Department of Health and Human Services. Office of Disease Prevention and Health Promotion. Healthy People 2020. Washington, DC. Available at http://www.healthypeople.gov/2020/topicsobjectives2020/pdfs/HP2020objectives.pdf. Accessed February 27, 2013. Data source: Centers for Disease Control and Prevention (CDC). Behavioral Risk Factor Surveillance System Survey Data. Atlanta, Georgia: U.S.
Department of Health and Human Services, Centers for Disease Control and Prevention, [2013].
15
Collier County Health Planning Council of SW Florida, Inc.
Community Health Assessment 2016
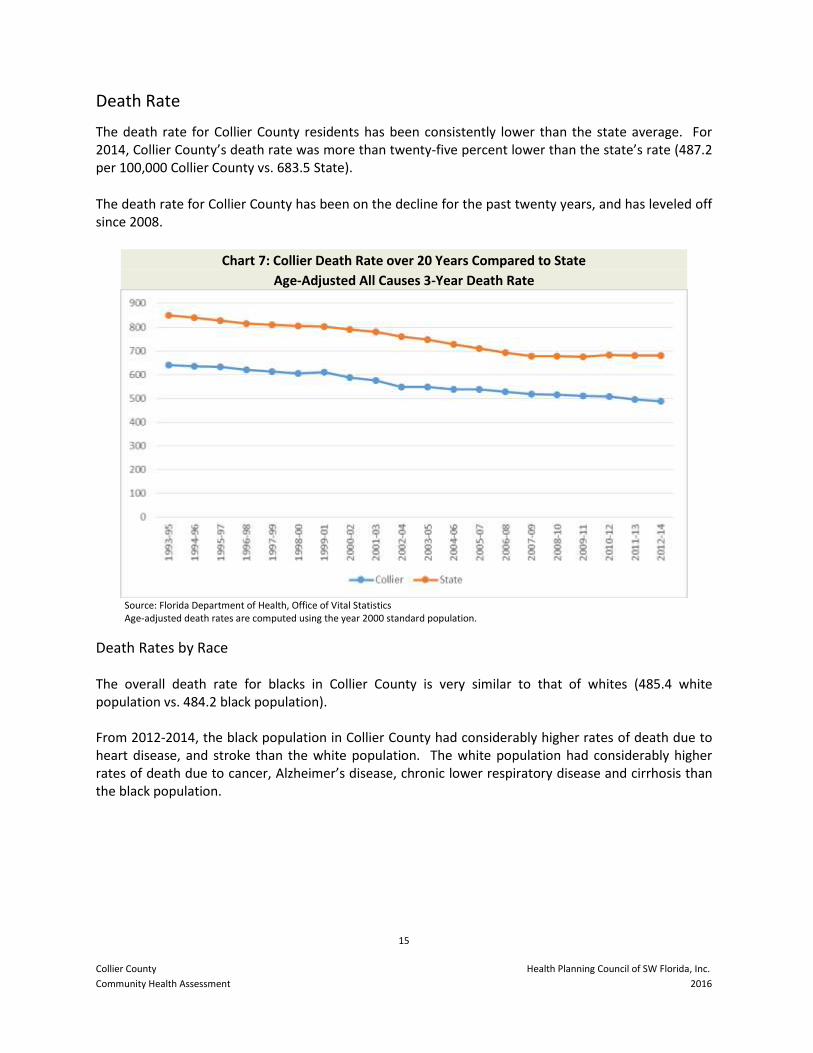
Death Rate
The death rate for Collier County residents has been consistently lower than the state average. For 2014, Collier County’s death rate was more than twenty-five percent lower than the state’s rate (487.2 per 100,000 Collier County vs. 683.5 State).
The death rate for Collier County has been on the decline for the past twenty years, and has leveled off since 2008.
Chart 7: Collier Death Rate over 20 Years Compared to State
Age-Adjusted All Causes 3-Year Death Rate
Source: Florida Department of Health, Office of Vital Statistics Age-adjusted death rates are computed using the year 2000 standard population.
Death Rates by Race The overall death rate for blacks in Collier County is very similar to that of whites (485.4 white population vs. 484.2 black population). From 2012-2014, the black population in Collier County had considerably higher rates of death due to heart disease, and stroke than the white population. The white population had considerably higher rates of death due to cancer, Alzheimer’s disease, chronic lower respiratory disease and cirrhosis than the black population.
16
Collier County Health Planning Council of SW Florida, Inc.
Community Health Assessment 2016
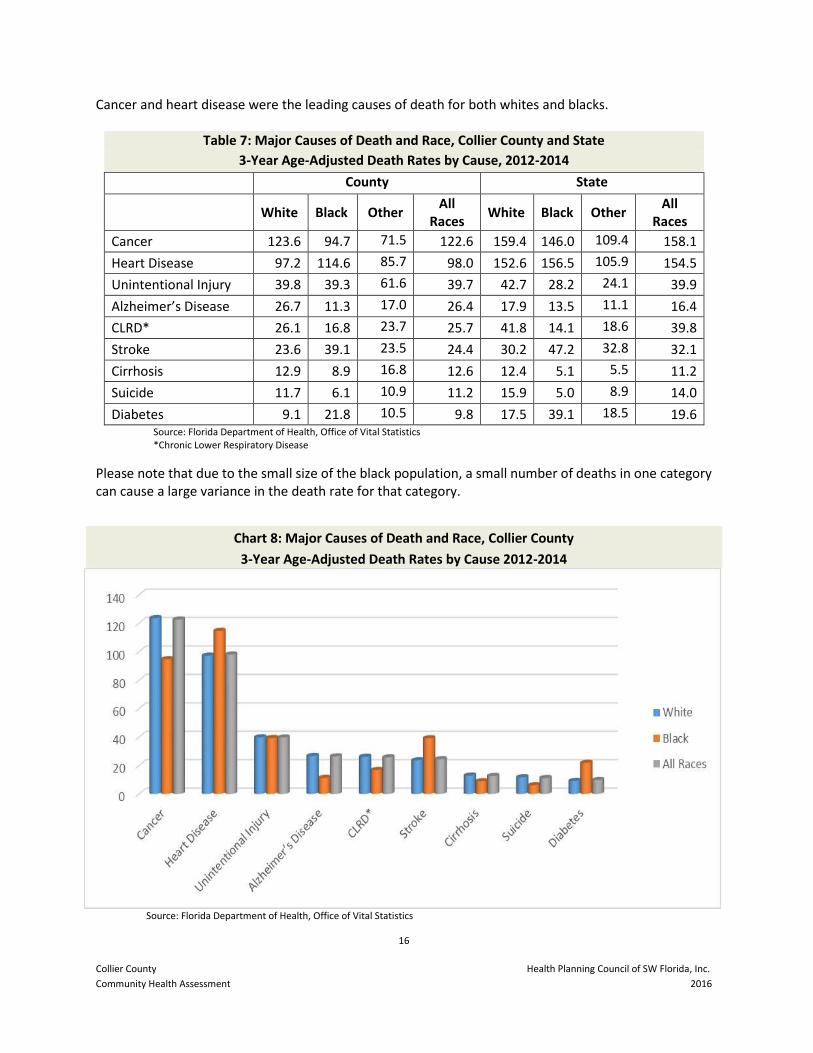
Cancer and heart disease were the leading causes of death for both whites and blacks.
Table 7: Major Causes of Death and Race, Collier County and State
3-Year Age-Adjusted Death Rates by Cause, 2012-2014
County State
White Black Other All
Races White Black Other
All Races
Cancer 123.6 94.7 71.5 122.6 159.4 146.0 109.4 158.1
Heart Disease 97.2 114.6 85.7 98.0 152.6 156.5 105.9 154.5
Unintentional Injury 39.8 39.3 61.6 39.7 42.7 28.2 24.1 39.9
Alzheimer’s Disease 26.7 11.3 17.0 26.4 17.9 13.5 11.1 16.4
CLRD* 26.1 16.8 23.7 25.7 41.8 14.1 18.6 39.8
Stroke 23.6 39.1 23.5 24.4 30.2 47.2 32.8 32.1
Cirrhosis 12.9 8.9 16.8 12.6 12.4 5.1 5.5 11.2
Suicide 11.7 6.1 10.9 11.2 15.9 5.0 8.9 14.0
Diabetes 9.1 21.8 10.5 9.8 17.5 39.1 18.5 19.6 Source: Florida Department of Health, Office of Vital Statistics *Chronic Lower Respiratory Disease
Please note that due to the small size of the black population, a small number of deaths in one category can cause a large variance in the death rate for that category.
Chart 8: Major Causes of Death and Race, Collier County
3-Year Age-Adjusted Death Rates by Cause 2012-2014
Source: Florida Department of Health, Office of Vital Statistics
17
Collier County Health Planning Council of SW Florida, Inc.
Community Health Assessment 2016
Leading Causes of Death
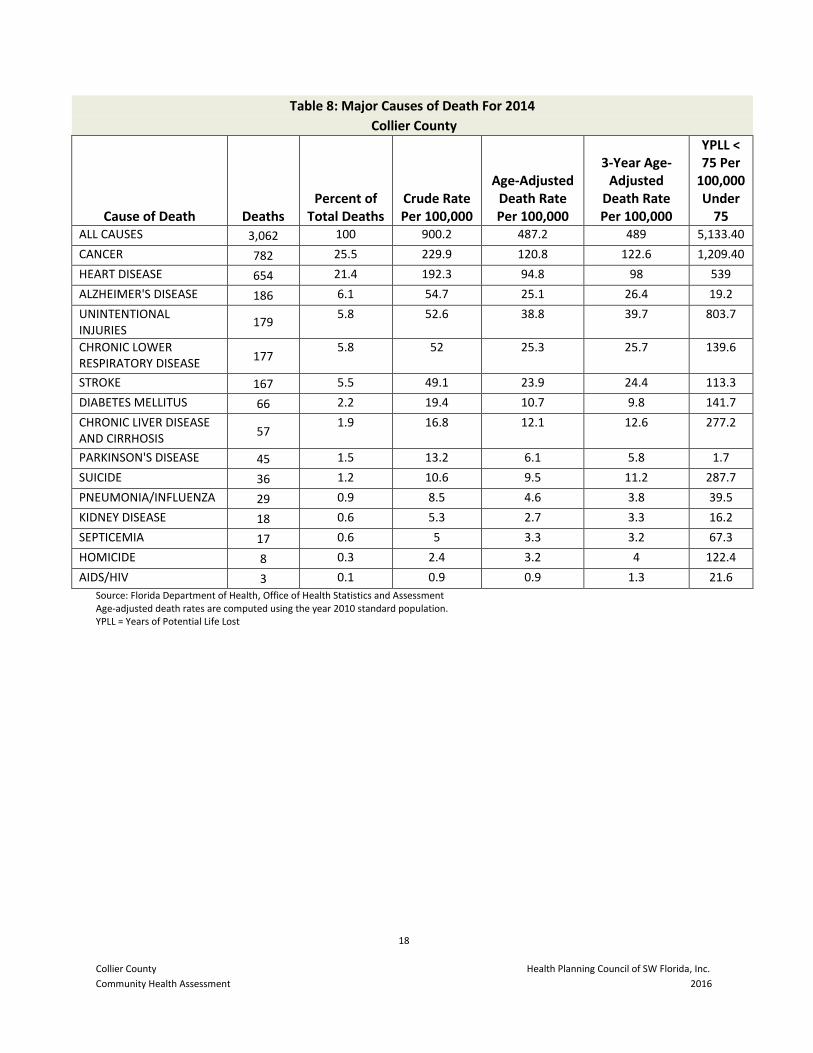
Mortality rates can be key indicators of the state of health of a community. A significant number of Collier County’s deaths are premature and preventable. Behavior modification and risk reduction can reduce the mortality rates of many of the leading causes of death, especially those attributed to heart disease, stroke, diabetes, lung cancer and motor vehicle accidents. Individuals may improve both the length and the quality of their lives by simply following a healthy lifestyle and receiving regular medical care.
Table 8 gives detailed information on the leading causes of death for residents of Collier County in 2014. The Deaths column is a simple count of the number of people who died by the listed cause during 2014. Percent of Total deaths lets you know what percent of the people who died in 2014 died from that cause.
Crude Rate per 100,000 gives a sense of how likely a person is to die of that cause in any given year. For example, out of every 100,000 people in Collier County, 49.1 of them died of a stroke in 2014. Using the rate per 100,000 allows comparison between areas with different populations such as comparing a small county to a large county or a county to the state.
The next column lists the Age-Adjusted Death Rate per 100,000. Age-adjusting a rate is a way to make fairer comparisons between groups with different age distributions. For example, a county having a higher percentage of elderly people may have a higher rate of death or hospitalization than a county with a younger population merely because the elderly are more likely to die or be hospitalized. The same distortion can happen when we compare races, genders, or time periods. Age adjustment can make the different groups more comparable.
The 3-Year Age-Adjusted Death Rate per 100,000 gives an average of the three years ending in 2014 (2012, 2013, and 2014). A small increase or decrease in the number of deaths in a given year can make a big difference in the rate so averages are used to flatten out large fluctuations.
The last column is Years of Potential Life Lost. This is an estimate of the number of years a person would have lived had they not died prematurely. In this case that number is given for all people who died under the age of 75 assuming that they would have lived to the age of 75. When the numbers are particularly low, such as they are for Alzheimer’s disease, it is generally because that cause of death largely impacts the elderly. Conversely, a particularly high number such as for unintentional injuries suggests that the average age of the people who died due to that cause was fairly low.
18
Collier County Health Planning Council of SW Florida, Inc.
Community Health Assessment 2016
Table 8: Major Causes of Death For 2014
Collier County
Cause of Death Deaths Percent of
Total Deaths Crude Rate Per 100,000
Age-Adjusted Death Rate Per 100,000
3-Year Age-Adjusted
Death Rate Per 100,000
YPLL < 75 Per
100,000 Under
75 ALL CAUSES 3,062 100 900.2 487.2 489 5,133.40
CANCER 782 25.5 229.9 120.8 122.6 1,209.40
HEART DISEASE 654 21.4 192.3 94.8 98 539
ALZHEIMER'S DISEASE 186 6.1 54.7 25.1 26.4 19.2
UNINTENTIONAL INJURIES
179 5.8 52.6 38.8 39.7 803.7
CHRONIC LOWER RESPIRATORY DISEASE
177 5.8 52 25.3 25.7 139.6
STROKE 167 5.5 49.1 23.9 24.4 113.3
DIABETES MELLITUS 66 2.2 19.4 10.7 9.8 141.7
CHRONIC LIVER DISEASE AND CIRRHOSIS
57 1.9 16.8 12.1 12.6 277.2
PARKINSON'S DISEASE 45 1.5 13.2 6.1 5.8 1.7
SUICIDE 36 1.2 10.6 9.5 11.2 287.7
PNEUMONIA/INFLUENZA 29 0.9 8.5 4.6 3.8 39.5
KIDNEY DISEASE 18 0.6 5.3 2.7 3.3 16.2
SEPTICEMIA 17 0.6 5 3.3 3.2 67.3
HOMICIDE 8 0.3 2.4 3.2 4 122.4
AIDS/HIV 3 0.1 0.9 0.9 1.3 21.6
Source: Florida Department of Health, Office of Health Statistics and Assessment Age-adjusted death rates are computed using the year 2010 standard population. YPLL = Years of Potential Life Lost
19
Collier County Health Planning Council of SW Florida, Inc.
Community Health Assessment 2016
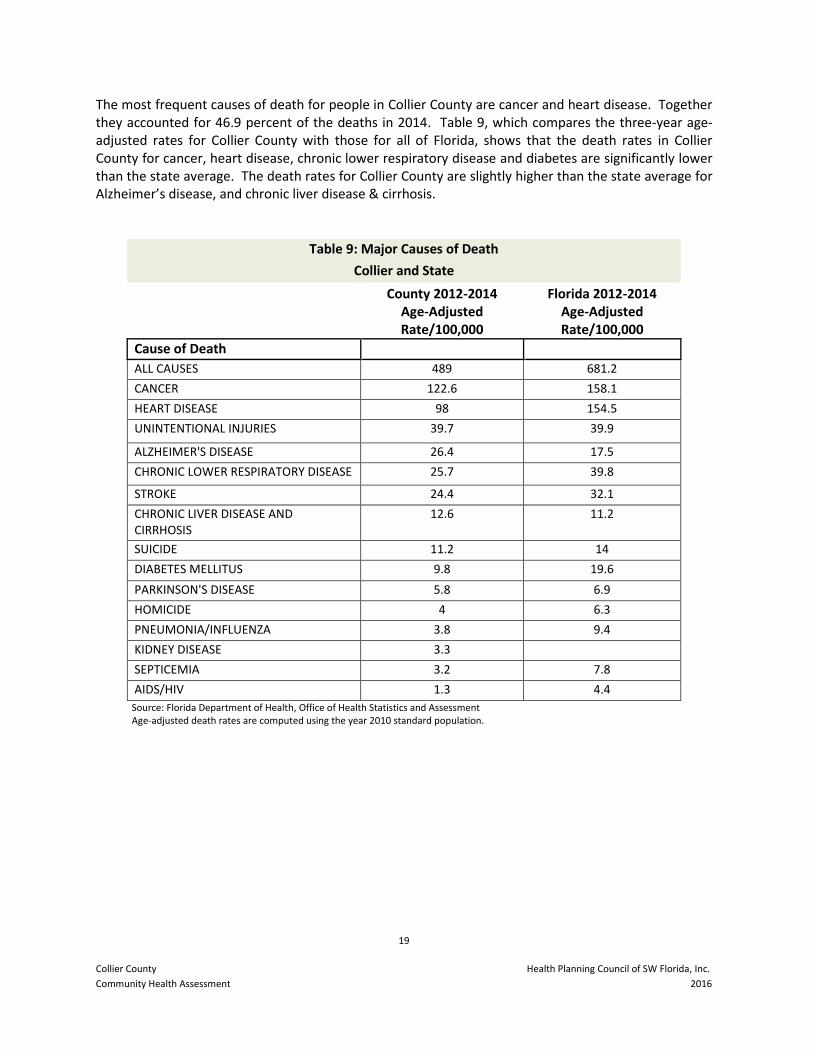
The most frequent causes of death for people in Collier County are cancer and heart disease. Together they accounted for 46.9 percent of the deaths in 2014. Table 9, which compares the three-year age-adjusted rates for Collier County with those for all of Florida, shows that the death rates in Collier County for cancer, heart disease, chronic lower respiratory disease and diabetes are significantly lower than the state average. The death rates for Collier County are slightly higher than the state average for Alzheimer’s disease, and chronic liver disease & cirrhosis.
Table 9: Major Causes of Death
Collier and State
County 2012-2014 Age-Adjusted Rate/100,000
Florida 2012-2014 Age-Adjusted Rate/100,000
Cause of Death
ALL CAUSES 489 681.2
CANCER 122.6 158.1
HEART DISEASE 98 154.5
UNINTENTIONAL INJURIES 39.7 39.9
ALZHEIMER'S DISEASE 26.4 17.5
CHRONIC LOWER RESPIRATORY DISEASE 25.7 39.8
STROKE 24.4 32.1
CHRONIC LIVER DISEASE AND CIRRHOSIS
12.6 11.2
SUICIDE 11.2 14
DIABETES MELLITUS 9.8 19.6
PARKINSON'S DISEASE 5.8 6.9
HOMICIDE 4 6.3
PNEUMONIA/INFLUENZA 3.8 9.4
KIDNEY DISEASE 3.3
SEPTICEMIA 3.2 7.8
AIDS/HIV 1.3 4.4
Source: Florida Department of Health, Office of Health Statistics and Assessment Age-adjusted death rates are computed using the year 2010 standard population.
20
Collier County Health Planning Council of SW Florida, Inc.
Community Health Assessment 2016
Deaths from All Causes
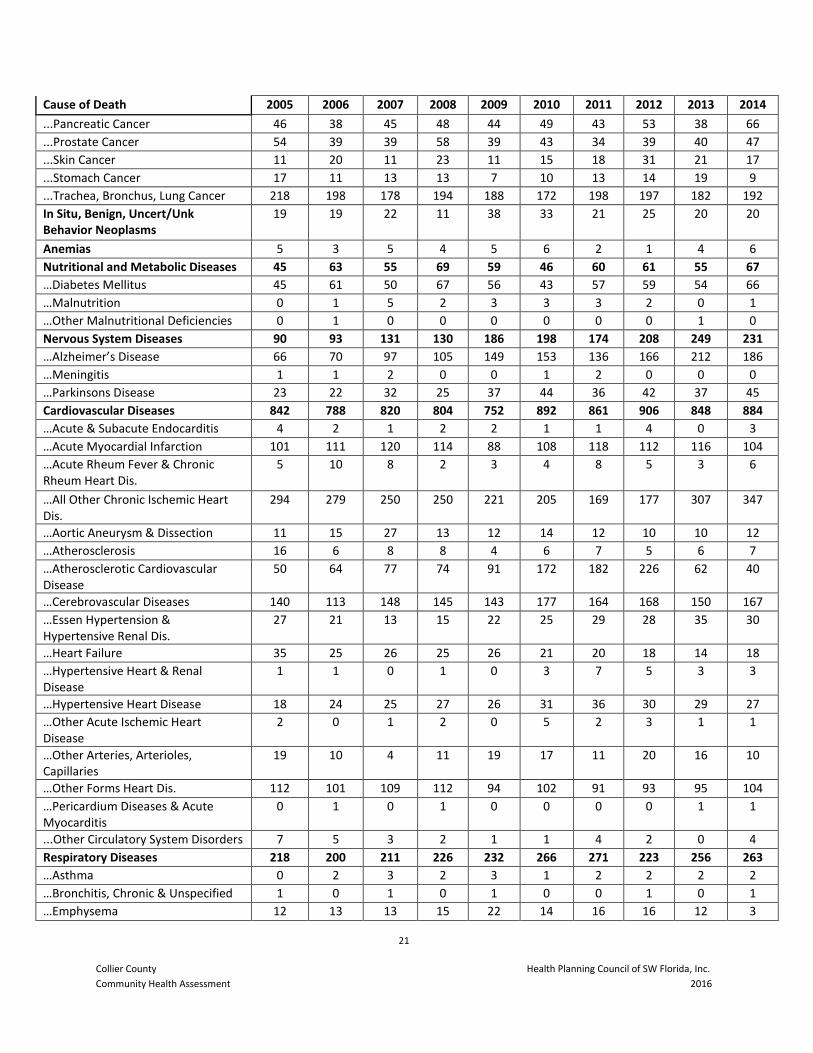
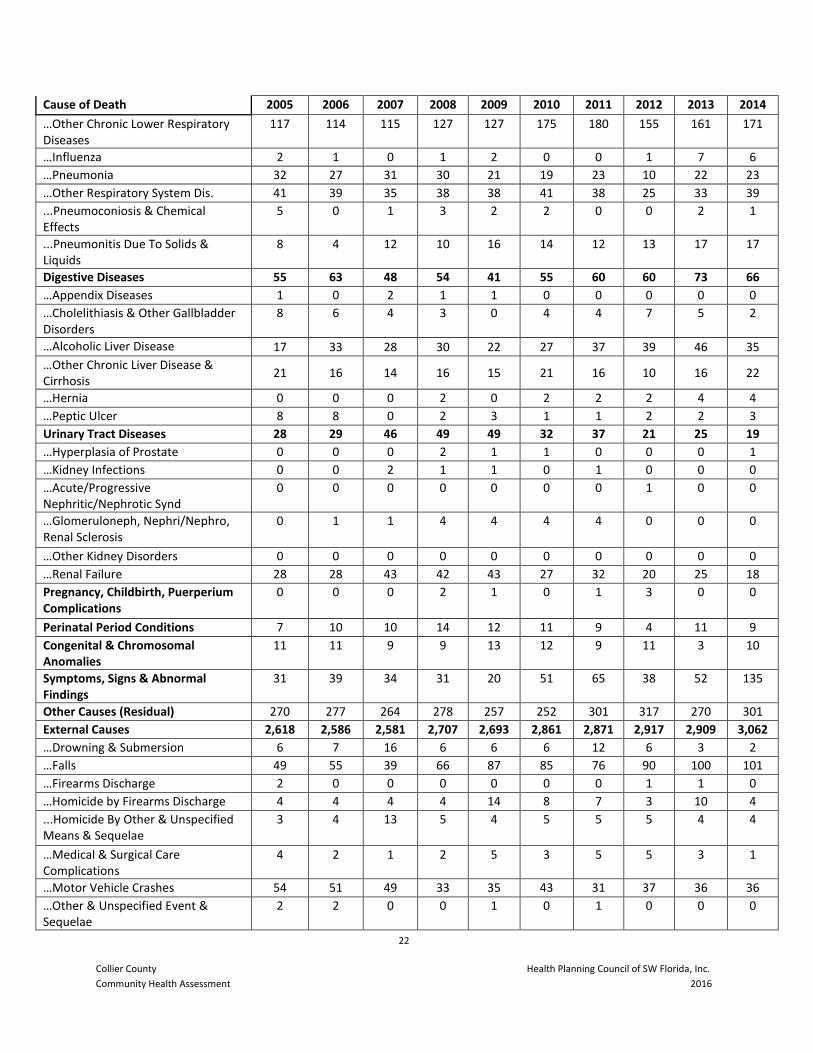
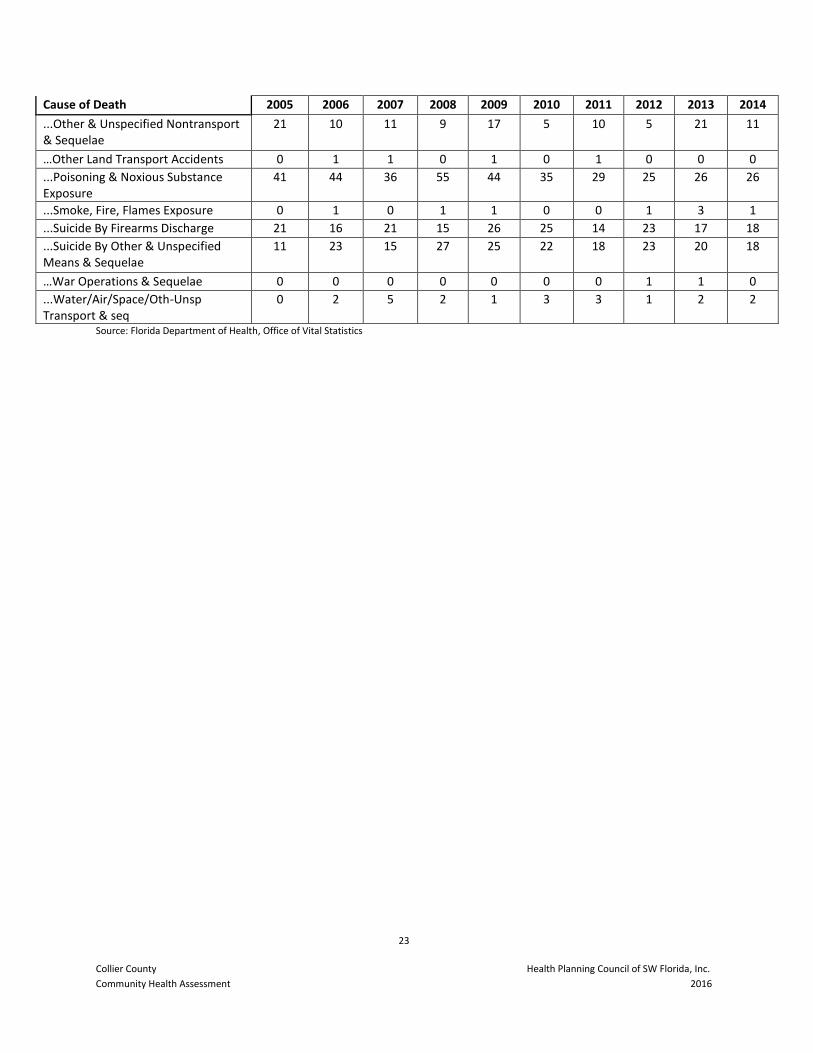
Table 8 lists the cause of death noted for all deaths in Collier County from 2005-2014. The total number of deaths has fluctuated within a fairly narrow range during this period, with the lowest total in 2006. The death rate has fallen considerably during this same period, in part because the population of Collier County has increased.
Table 10: Deaths From All Causes
All Races, All Sexes, All Ethnicities, All Ages
Collier County 2005-2014
Cause of Death 2005 2006 2007 2008 2009 2010 2011 2012 2013 2014
All Causes 2,618 2,586 2,581 2,707 2,693 2,861 2,871 2,917 2,909 3,062
Infectious Diseases 31 50 61 58 64 57 56 34 55 44
…Certain other Intestinal Infections 7 9 10 7 11 6 4 3 8 3
…Human Immunodeficiency Virus (HIV) Disease
0 0 0 0 0 1 0 0 0 0
…Meningococcal Infection 9 8 6 3 7 6 6 7 7 4
…Other & Unspecified Infectious/Parasitic Disease & Sequelae
0 0 2 0 0 1 0 0 0 0
…Other Tuberculosis 1 1 1 1 1 1 0 0 0 0
…Respiratory Tuberculosis 0 1 0 0 0 0 0 0 0 0
…Salmonella Infections 8 18 22 31 29 25 18 11 24 17
…Septicemia 5 7 9 4 2 5 7 4 9 7
…Viral Hepatitis 7 3 5 7 9 4 2 5 7 4
Malignant Neoplasm (Cancer) 745 714 653 739 693 707 730 779 734 782
...All Other & Unspecified – Cancer 74 74 73 90 74 88 100 92 88 81
...Bladder Cancer 23 15 17 16 16 24 19 13 33 20
...Breast Cancer 46 42 42 35 55 51 45 49 34 47
...Cervical Cancer 4 6 1 1 8 4 7 6 2 2
...Colon, Rectum, & Anus Cancer 58 60 56 67 50 65 51 56 59 71
...Corpus Uteri & Uterus, Part Unspec Cancer
7 9 10 8 4 13 7 5 10 11
...Esophagus Cancer 23 21 13 21 19 25 20 20 17 17
...Hodgkins Disease 0 2 1 1 3 0 2 2 1 0
...Kidney and Renal Pelvis Cancer 15 19 20 13 18 10 16 14 16 18
...Larynx Cancer 5 10 3 2 2 4 6 5 3 6
...Leukemia 29 25 21 30 42 27 29 40 32 40
...Lip, Oral Cavity, Pharynx 7 13 12 7 6 9 15 13 20 16
...Liver & Intrahepatic Bile Ducts Cancer
25 20 23 31 26 16 25 37 32 30
...Meninges, Brain, & Other Part Cen Nerv Sys Cancer
20 26 9 18 19 16 20 21 24 27
...Multiple Myeloma & Immunoprolifera Neoplas
13 13 18 17 16 13 19 20 12 19
...Non-Hodgkins Lymphona 28 33 32 23 29 32 26 28 25 30
...Ovarian Cancer 22 20 16 23 17 21 17 24 26 16
21
Collier County Health Planning Council of SW Florida, Inc.
Community Health Assessment 2016
Cause of Death 2005 2006 2007 2008 2009 2010 2011 2012 2013 2014
...Pancreatic Cancer 46 38 45 48 44 49 43 53 38 66
...Prostate Cancer 54 39 39 58 39 43 34 39 40 47
...Skin Cancer 11 20 11 23 11 15 18 31 21 17
...Stomach Cancer 17 11 13 13 7 10 13 14 19 9
...Trachea, Bronchus, Lung Cancer 218 198 178 194 188 172 198 197 182 192
In Situ, Benign, Uncert/Unk Behavior Neoplasms
19 19 22 11 38 33 21 25 20 20
Anemias 5 3 5 4 5 6 2 1 4 6
Nutritional and Metabolic Diseases 45 63 55 69 59 46 60 61 55 67
…Diabetes Mellitus 45 61 50 67 56 43 57 59 54 66
…Malnutrition 0 1 5 2 3 3 3 2 0 1
…Other Malnutritional Deficiencies 0 1 0 0 0 0 0 0 1 0
Nervous System Diseases 90 93 131 130 186 198 174 208 249 231
…Alzheimer’s Disease 66 70 97 105 149 153 136 166 212 186
…Meningitis 1 1 2 0 0 1 2 0 0 0
…Parkinsons Disease 23 22 32 25 37 44 36 42 37 45
Cardiovascular Diseases 842 788 820 804 752 892 861 906 848 884
…Acute & Subacute Endocarditis 4 2 1 2 2 1 1 4 0 3
…Acute Myocardial Infarction 101 111 120 114 88 108 118 112 116 104
…Acute Rheum Fever & Chronic Rheum Heart Dis.
5 10 8 2 3 4 8 5 3 6
…All Other Chronic Ischemic Heart Dis.
294 279 250 250 221 205 169 177 307 347
…Aortic Aneurysm & Dissection 11 15 27 13 12 14 12 10 10 12
…Atherosclerosis 16 6 8 8 4 6 7 5 6 7
…Atherosclerotic Cardiovascular Disease
50 64 77 74 91 172 182 226 62 40
…Cerebrovascular Diseases 140 113 148 145 143 177 164 168 150 167
…Essen Hypertension & Hypertensive Renal Dis.
27 21 13 15 22 25 29 28 35 30
…Heart Failure 35 25 26 25 26 21 20 18 14 18
…Hypertensive Heart & Renal Disease
1 1 0 1 0 3 7 5 3 3
…Hypertensive Heart Disease 18 24 25 27 26 31 36 30 29 27
…Other Acute Ischemic Heart Disease
2 0 1 2 0 5 2 3 1 1
…Other Arteries, Arterioles, Capillaries
19 10 4 11 19 17 11 20 16 10
…Other Forms Heart Dis. 112 101 109 112 94 102 91 93 95 104
…Pericardium Diseases & Acute Myocarditis
0 1 0 1 0 0 0 0 1 1
...Other Circulatory System Disorders 7 5 3 2 1 1 4 2 0 4
Respiratory Diseases 218 200 211 226 232 266 271 223 256 263
…Asthma 0 2 3 2 3 1 2 2 2 2
…Bronchitis, Chronic & Unspecified 1 0 1 0 1 0 0 1 0 1
…Emphysema 12 13 13 15 22 14 16 16 12 3
22
Collier County Health Planning Council of SW Florida, Inc.
Community Health Assessment 2016
Cause of Death 2005 2006 2007 2008 2009 2010 2011 2012 2013 2014
…Other Chronic Lower Respiratory Diseases
117 114 115 127 127 175 180 155 161 171
…Influenza 2 1 0 1 2 0 0 1 7 6
…Pneumonia 32 27 31 30 21 19 23 10 22 23
…Other Respiratory System Dis. 41 39 35 38 38 41 38 25 33 39
...Pneumoconiosis & Chemical Effects
5 0 1 3 2 2 0 0 2 1
...Pneumonitis Due To Solids & Liquids
8 4 12 10 16 14 12 13 17 17
Digestive Diseases 55 63 48 54 41 55 60 60 73 66
…Appendix Diseases 1 0 2 1 1 0 0 0 0 0
…Cholelithiasis & Other Gallbladder Disorders
8 6 4 3 0 4 4 7 5 2
…Alcoholic Liver Disease 17 33 28 30 22 27 37 39 46 35
…Other Chronic Liver Disease & Cirrhosis
21 16 14 16 15 21 16 10 16 22
…Hernia 0 0 0 2 0 2 2 2 4 4
…Peptic Ulcer 8 8 0 2 3 1 1 2 2 3
Urinary Tract Diseases 28 29 46 49 49 32 37 21 25 19
…Hyperplasia of Prostate 0 0 0 2 1 1 0 0 0 1
…Kidney Infections 0 0 2 1 1 0 1 0 0 0
…Acute/Progressive Nephritic/Nephrotic Synd
0 0 0 0 0 0 0 1 0 0
…Glomeruloneph, Nephri/Nephro, Renal Sclerosis
0 1 1 4 4 4 4 0 0 0
…Other Kidney Disorders 0 0 0 0 0 0 0 0 0 0
…Renal Failure 28 28 43 42 43 27 32 20 25 18
Pregnancy, Childbirth, Puerperium Complications
0 0 0 2 1 0 1 3 0 0
Perinatal Period Conditions 7 10 10 14 12 11 9 4 11 9
Congenital & Chromosomal Anomalies
11 11 9 9 13 12 9 11 3 10
Symptoms, Signs & Abnormal Findings
31 39 34 31 20 51 65 38 52 135
Other Causes (Residual) 270 277 264 278 257 252 301 317 270 301
External Causes 2,618 2,586 2,581 2,707 2,693 2,861 2,871 2,917 2,909 3,062
…Drowning & Submersion 6 7 16 6 6 6 12 6 3 2
…Falls 49 55 39 66 87 85 76 90 100 101
…Firearms Discharge 2 0 0 0 0 0 0 1 1 0
…Homicide by Firearms Discharge 4 4 4 4 14 8 7 3 10 4
...Homicide By Other & Unspecified Means & Sequelae
3 4 13 5 4 5 5 5 4 4
…Medical & Surgical Care Complications
4 2 1 2 5 3 5 5 3 1
…Motor Vehicle Crashes 54 51 49 33 35 43 31 37 36 36
…Other & Unspecified Event & Sequelae
2 2 0 0 1 0 1 0 0 0
23
Collier County Health Planning Council of SW Florida, Inc.
Community Health Assessment 2016
Cause of Death 2005 2006 2007 2008 2009 2010 2011 2012 2013 2014
...Other & Unspecified Nontransport & Sequelae
21 10 11 9 17 5 10 5 21 11
…Other Land Transport Accidents 0 1 1 0 1 0 1 0 0 0
...Poisoning & Noxious Substance Exposure
41 44 36 55 44 35 29 25 26 26
...Smoke, Fire, Flames Exposure 0 1 0 1 1 0 0 1 3 1
...Suicide By Firearms Discharge 21 16 21 15 26 25 14 23 17 18
...Suicide By Other & Unspecified Means & Sequelae
11 23 15 27 25 22 18 23 20 18
…War Operations & Sequelae 0 0 0 0 0 0 0 1 1 0
...Water/Air/Space/Oth-Unsp Transport & seq
0 2 5 2 1 3 3 1 2 2
Source: Florida Department of Health, Office of Vital Statistics
24
Collier County Health Planning Council of SW Florida, Inc.
Community Health Assessment 2016
Chronic Diseases
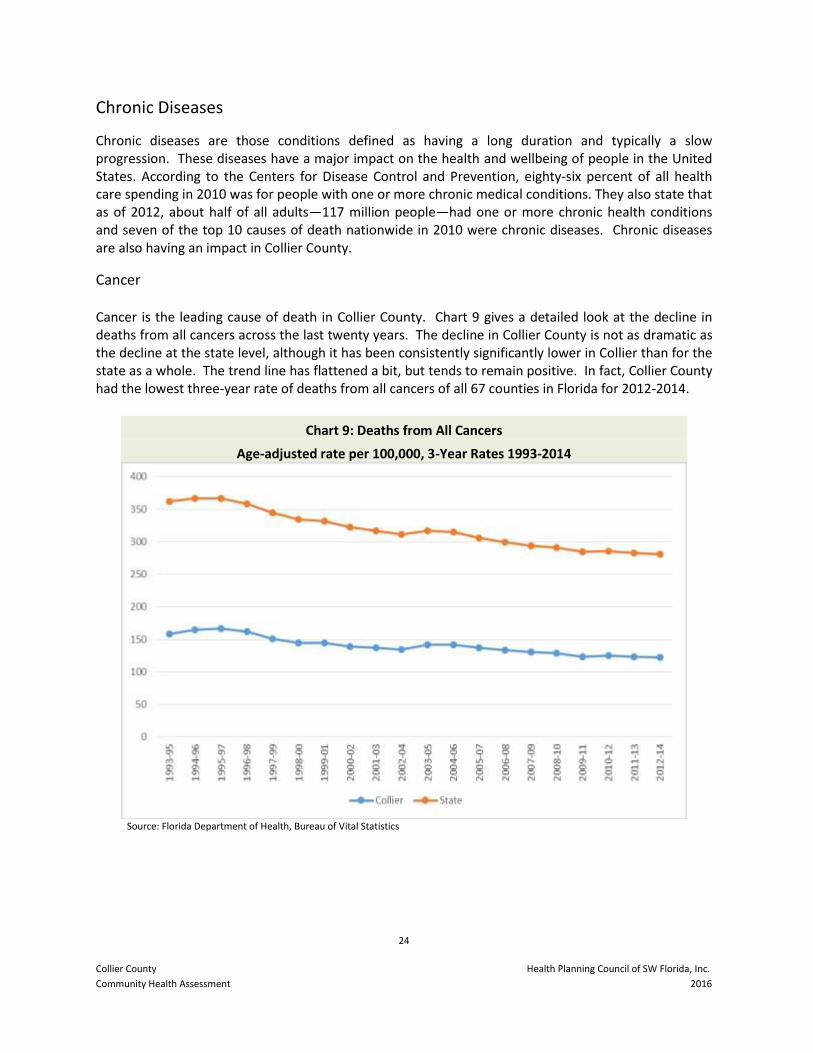
Chronic diseases are those conditions defined as having a long duration and typically a slow progression. These diseases have a major impact on the health and wellbeing of people in the United States. According to the Centers for Disease Control and Prevention, eighty-six percent of all health care spending in 2010 was for people with one or more chronic medical conditions. They also state that as of 2012, about half of all adults—117 million people—had one or more chronic health conditions and seven of the top 10 causes of death nationwide in 2010 were chronic diseases. Chronic diseases are also having an impact in Collier County.
Cancer
Cancer is the leading cause of death in Collier County. Chart 9 gives a detailed look at the decline in deaths from all cancers across the last twenty years. The decline in Collier County is not as dramatic as the decline at the state level, although it has been consistently significantly lower in Collier than for the state as a whole. The trend line has flattened a bit, but tends to remain positive. In fact, Collier County had the lowest three-year rate of deaths from all cancers of all 67 counties in Florida for 2012-2014.
Chart 9: Deaths from All Cancers
Age-adjusted rate per 100,000, 3-Year Rates 1993-2014
Source: Florida Department of Health, Bureau of Vital Statistics
25
Collier County Health Planning Council of SW Florida, Inc.
Community Health Assessment 2016
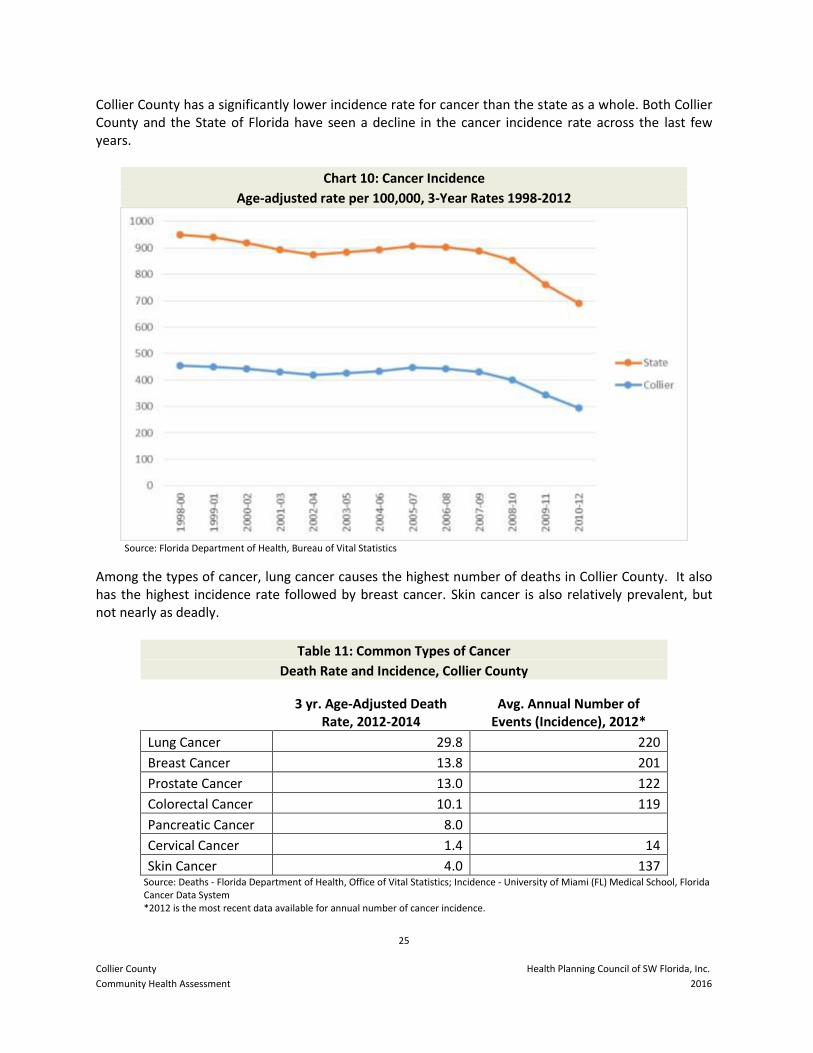
Collier County has a significantly lower incidence rate for cancer than the state as a whole. Both Collier County and the State of Florida have seen a decline in the cancer incidence rate across the last few years.
Chart 10: Cancer Incidence
Age-adjusted rate per 100,000, 3-Year Rates 1998-2012
Source: Florida Department of Health, Bureau of Vital Statistics
Among the types of cancer, lung cancer causes the highest number of deaths in Collier County. It also has the highest incidence rate followed by breast cancer. Skin cancer is also relatively prevalent, but not nearly as deadly.
Table 11: Common Types of Cancer
Death Rate and Incidence, Collier County
3 yr. Age-Adjusted Death Rate, 2012-2014
Avg. Annual Number of Events (Incidence), 2012*
Lung Cancer 29.8 220
Breast Cancer 13.8 201
Prostate Cancer 13.0 122
Colorectal Cancer 10.1 119
Pancreatic Cancer 8.0
Cervical Cancer 1.4 14
Skin Cancer 4.0 137 Source: Deaths - Florida Department of Health, Office of Vital Statistics; Incidence - University of Miami (FL) Medical School, Florida Cancer Data System *2012 is the most recent data available for annual number of cancer incidence.
26
Collier County Health Planning Council of SW Florida, Inc.
Community Health Assessment 2016
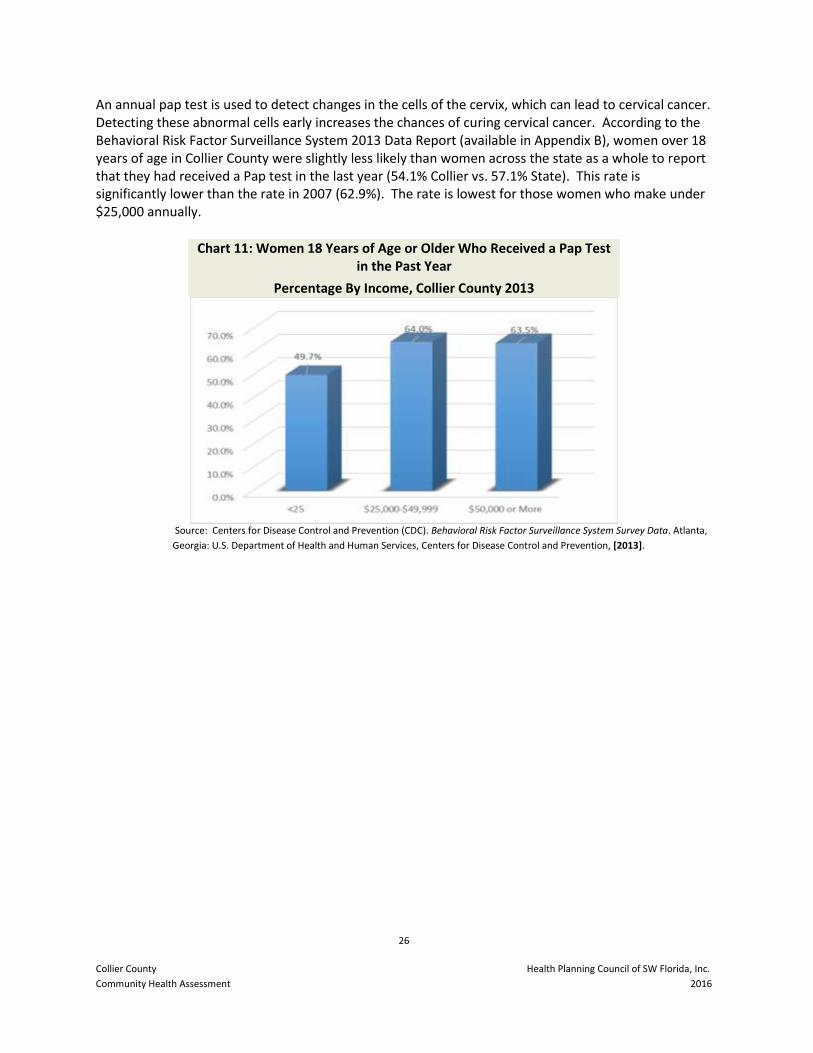
An annual pap test is used to detect changes in the cells of the cervix, which can lead to cervical cancer. Detecting these abnormal cells early increases the chances of curing cervical cancer. According to the Behavioral Risk Factor Surveillance System 2013 Data Report (available in Appendix B), women over 18 years of age in Collier County were slightly less likely than women across the state as a whole to report that they had received a Pap test in the last year (54.1% Collier vs. 57.1% State). This rate is significantly lower than the rate in 2007 (62.9%). The rate is lowest for those women who make under $25,000 annually.
Chart 11: Women 18 Years of Age or Older Who Received a Pap Test in the Past Year
Percentage By Income, Collier County 2013
Source: Centers for Disease Control and Prevention (CDC). Behavioral Risk Factor Surveillance System Survey Data. Atlanta,
Georgia: U.S. Department of Health and Human Services, Centers for Disease Control and Prevention, [2013].
27
Collier County Health Planning Council of SW Florida, Inc.
Community Health Assessment 2016
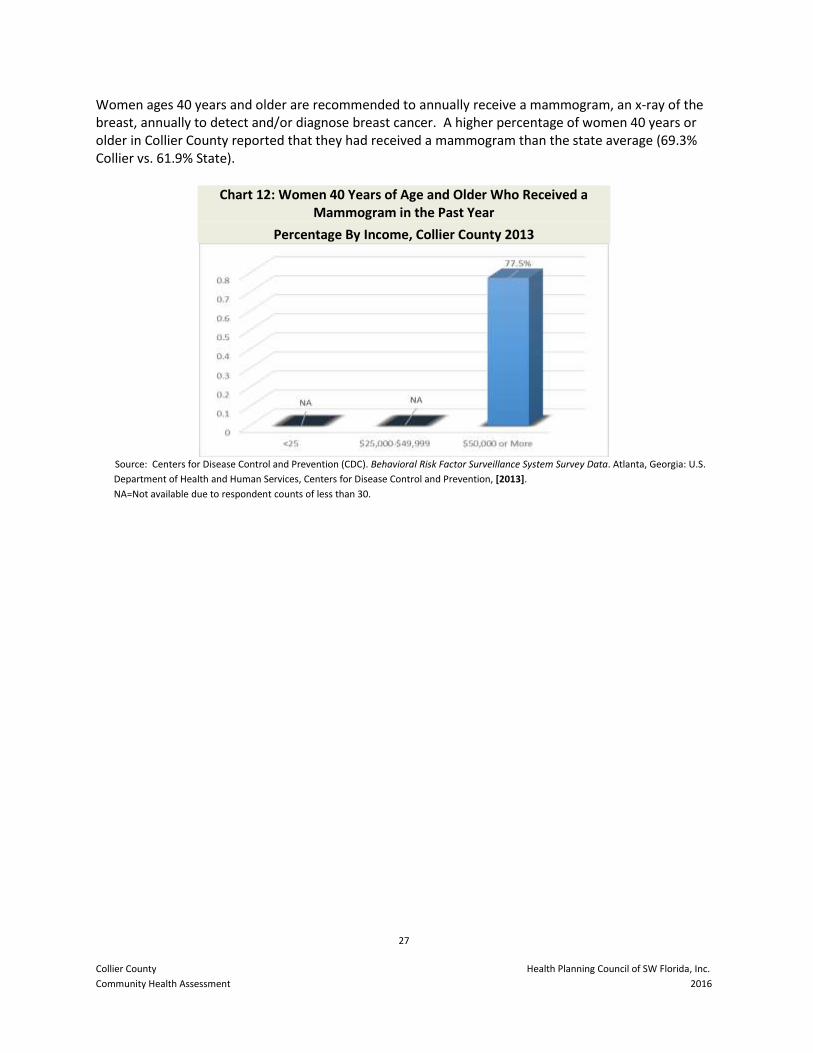
Women ages 40 years and older are recommended to annually receive a mammogram, an x-ray of the breast, annually to detect and/or diagnose breast cancer. A higher percentage of women 40 years or older in Collier County reported that they had received a mammogram than the state average (69.3% Collier vs. 61.9% State).
Chart 12: Women 40 Years of Age and Older Who Received a Mammogram in the Past Year
Percentage By Income, Collier County 2013
Source: Centers for Disease Control and Prevention (CDC). Behavioral Risk Factor Surveillance System Survey Data. Atlanta, Georgia: U.S.
Department of Health and Human Services, Centers for Disease Control and Prevention, [2013].
NA=Not available due to respondent counts of less than 30.
28
Collier County Health Planning Council of SW Florida, Inc.
Community Health Assessment 2016
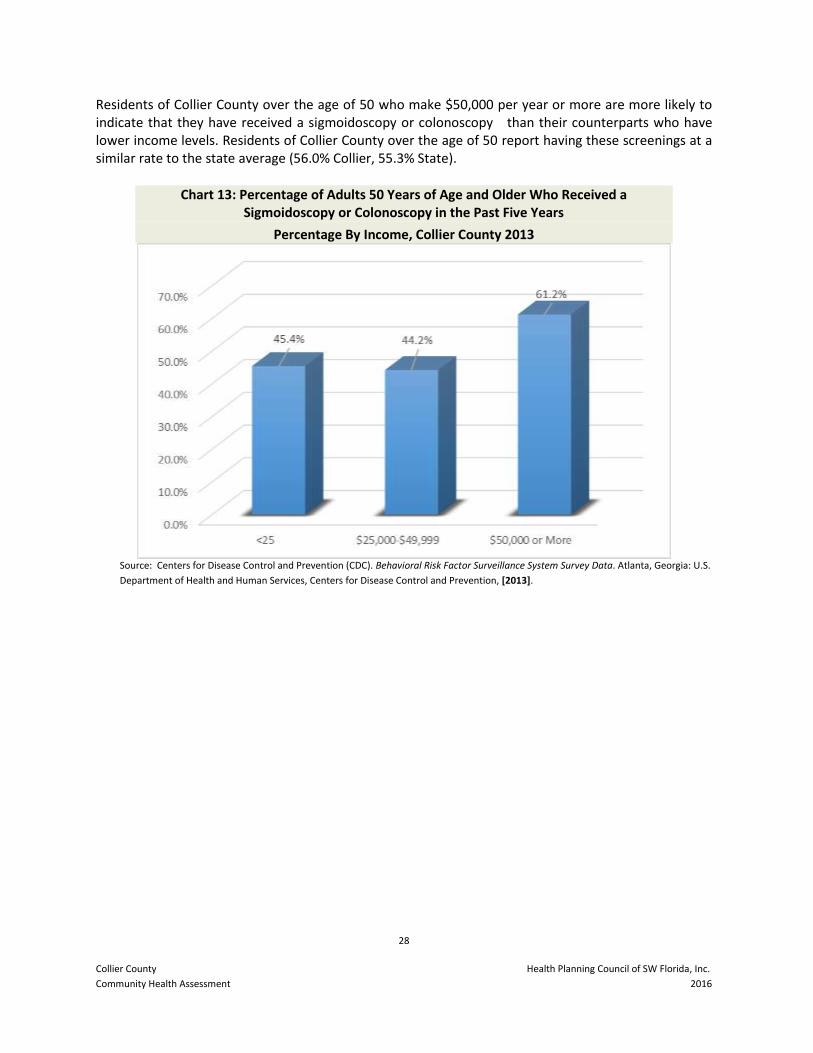
Residents of Collier County over the age of 50 who make $50,000 per year or more are more likely to indicate that they have received a sigmoidoscopy or colonoscopy than their counterparts who have lower income levels. Residents of Collier County over the age of 50 report having these screenings at a similar rate to the state average (56.0% Collier, 55.3% State).
Chart 13: Percentage of Adults 50 Years of Age and Older Who Received a Sigmoidoscopy or Colonoscopy in the Past Five Years
Percentage By Income, Collier County 2013
Source: Centers for Disease Control and Prevention (CDC). Behavioral Risk Factor Surveillance System Survey Data. Atlanta, Georgia: U.S.
Department of Health and Human Services, Centers for Disease Control and Prevention, [2013].
29
Collier County Health Planning Council of SW Florida, Inc.
Community Health Assessment 2016
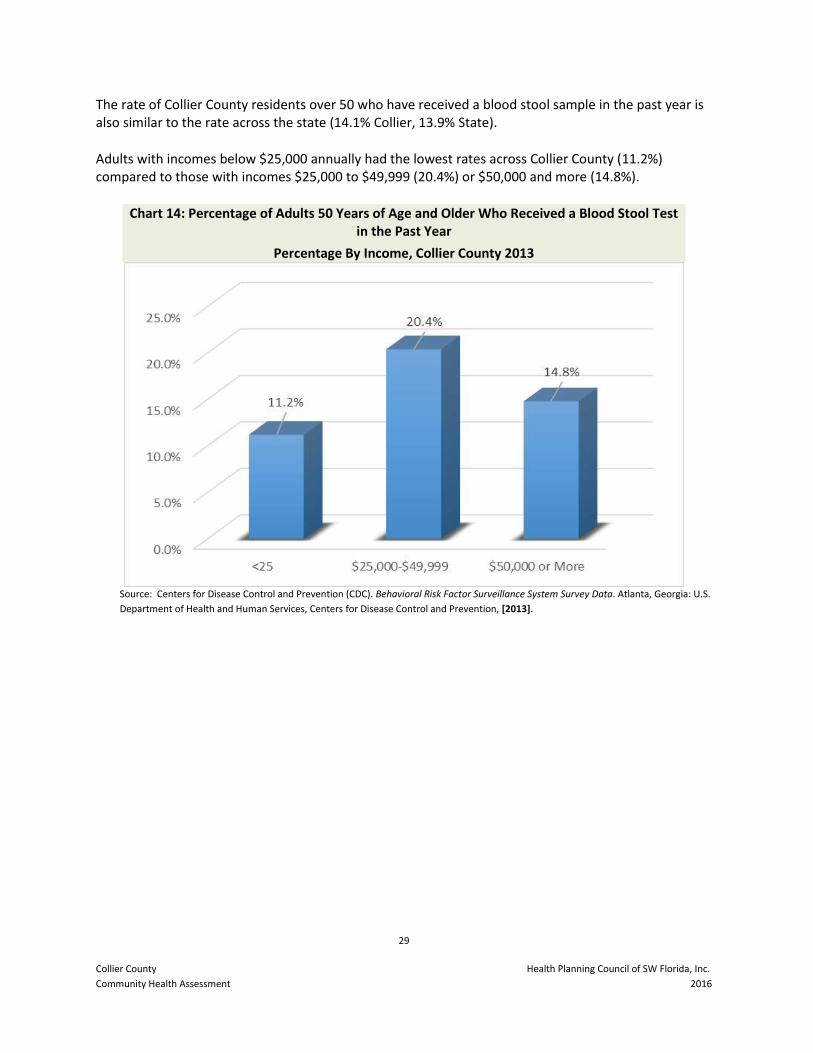
The rate of Collier County residents over 50 who have received a blood stool sample in the past year is also similar to the rate across the state (14.1% Collier, 13.9% State).
Adults with incomes below $25,000 annually had the lowest rates across Collier County (11.2%) compared to those with incomes $25,000 to $49,999 (20.4%) or $50,000 and more (14.8%).
Chart 14: Percentage of Adults 50 Years of Age and Older Who Received a Blood Stool Test in the Past Year
Percentage By Income, Collier County 2013
Source: Centers for Disease Control and Prevention (CDC). Behavioral Risk Factor Surveillance System Survey Data. Atlanta, Georgia: U.S.
Department of Health and Human Services, Centers for Disease Control and Prevention, [2013].
30
Collier County Health Planning Council of SW Florida, Inc.
Community Health Assessment 2016
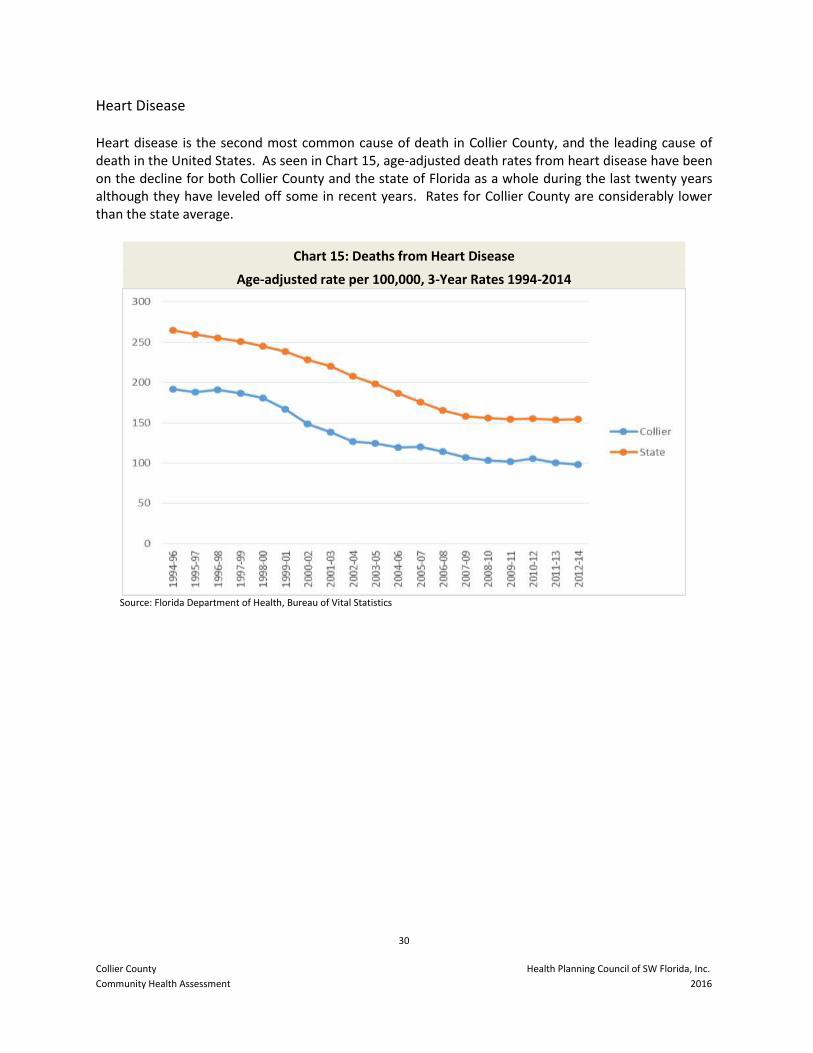
Heart Disease
Heart disease is the second most common cause of death in Collier County, and the leading cause of death in the United States. As seen in Chart 15, age-adjusted death rates from heart disease have been on the decline for both Collier County and the state of Florida as a whole during the last twenty years although they have leveled off some in recent years. Rates for Collier County are considerably lower than the state average.
Chart 15: Deaths from Heart Disease
Age-adjusted rate per 100,000, 3-Year Rates 1994-2014
Source: Florida Department of Health, Bureau of Vital Statistics
31
Collier County Health Planning Council of SW Florida, Inc.
Community Health Assessment 2016
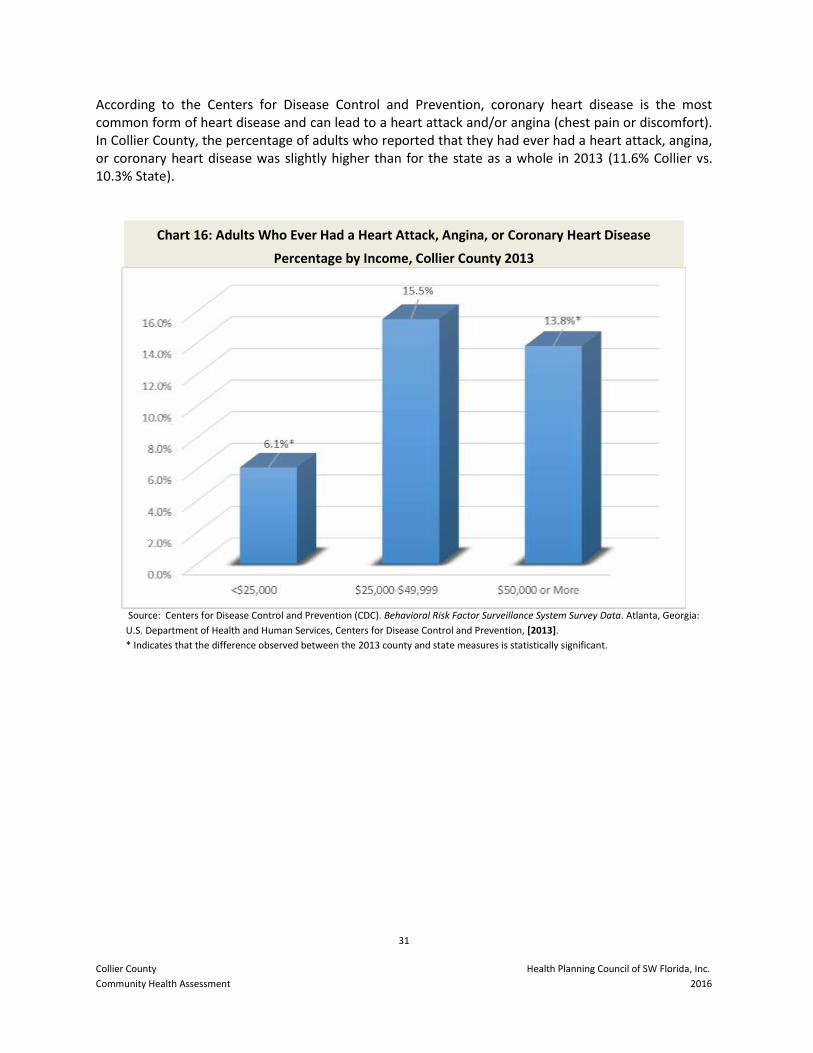
According to the Centers for Disease Control and Prevention, coronary heart disease is the most common form of heart disease and can lead to a heart attack and/or angina (chest pain or discomfort). In Collier County, the percentage of adults who reported that they had ever had a heart attack, angina, or coronary heart disease was slightly higher than for the state as a whole in 2013 (11.6% Collier vs. 10.3% State).
Chart 16: Adults Who Ever Had a Heart Attack, Angina, or Coronary Heart Disease
Percentage by Income, Collier County 2013
Source: Centers for Disease Control and Prevention (CDC). Behavioral Risk Factor Surveillance System Survey Data. Atlanta, Georgia:
U.S. Department of Health and Human Services, Centers for Disease Control and Prevention, [2013].
* Indicates that the difference observed between the 2013 county and state measures is statistically significant.
32
Collier County Health Planning Council of SW Florida, Inc.
Community Health Assessment 2016
Diabetes
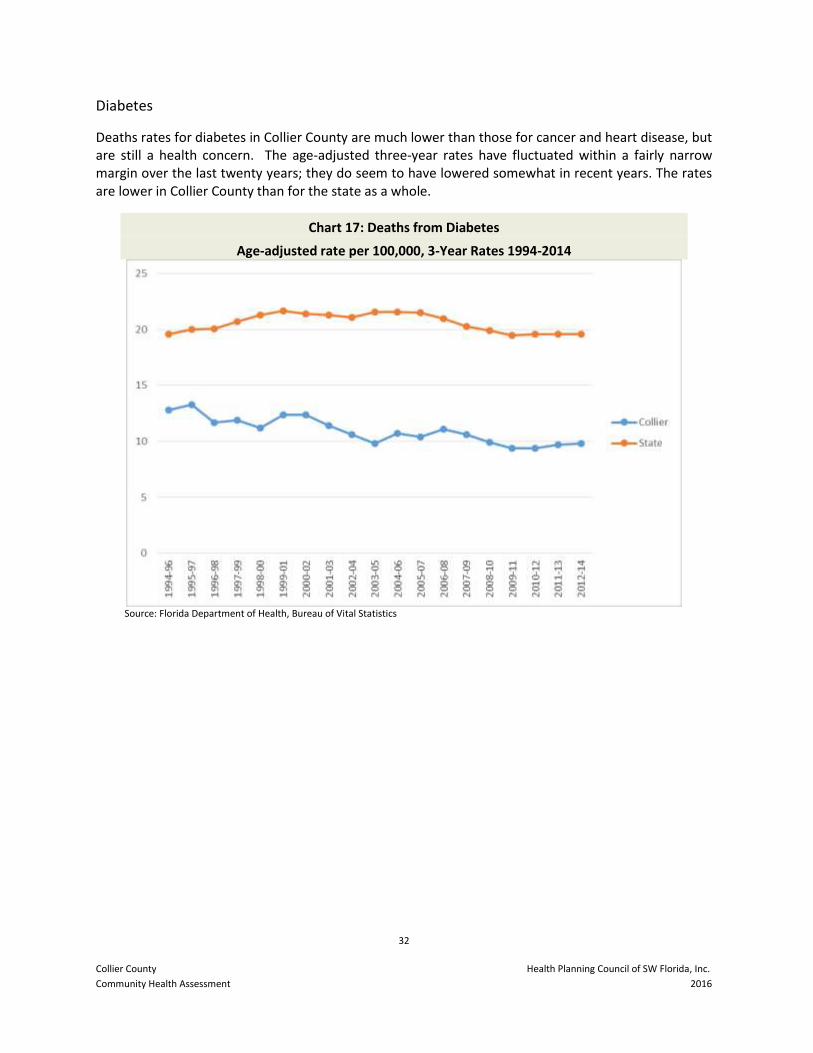
Deaths rates for diabetes in Collier County are much lower than those for cancer and heart disease, but are still a health concern. The age-adjusted three-year rates have fluctuated within a fairly narrow margin over the last twenty years; they do seem to have lowered somewhat in recent years. The rates are lower in Collier County than for the state as a whole.
Chart 17: Deaths from Diabetes
Age-adjusted rate per 100,000, 3-Year Rates 1994-2014
Source: Florida Department of Health, Bureau of Vital Statistics
33
Collier County Health Planning Council of SW Florida, Inc.
Community Health Assessment 2016
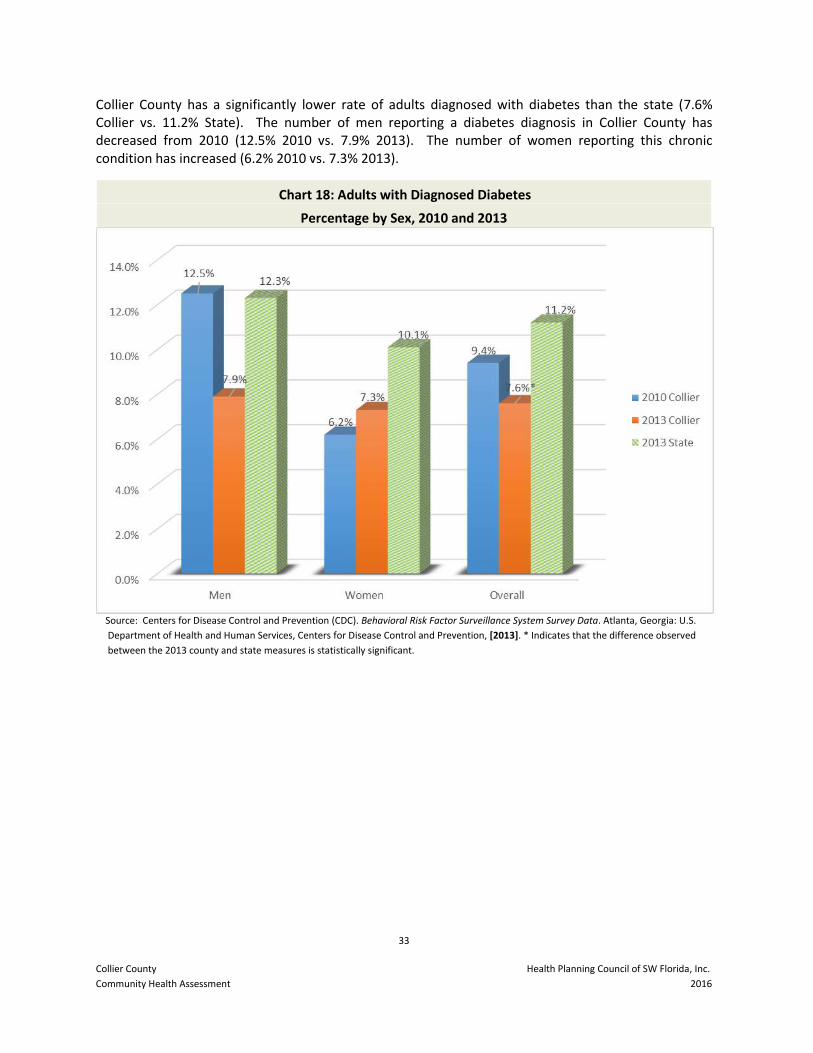
Collier County has a significantly lower rate of adults diagnosed with diabetes than the state (7.6% Collier vs. 11.2% State). The number of men reporting a diabetes diagnosis in Collier County has decreased from 2010 (12.5% 2010 vs. 7.9% 2013). The number of women reporting this chronic condition has increased (6.2% 2010 vs. 7.3% 2013).
Chart 18: Adults with Diagnosed Diabetes
Percentage by Sex, 2010 and 2013
Source: Centers for Disease Control and Prevention (CDC). Behavioral Risk Factor Surveillance System Survey Data. Atlanta, Georgia: U.S.
Department of Health and Human Services, Centers for Disease Control and Prevention, [2013]. * Indicates that the difference observed
between the 2013 county and state measures is statistically significant.
34
Collier County Health Planning Council of SW Florida, Inc.
Community Health Assessment 2016
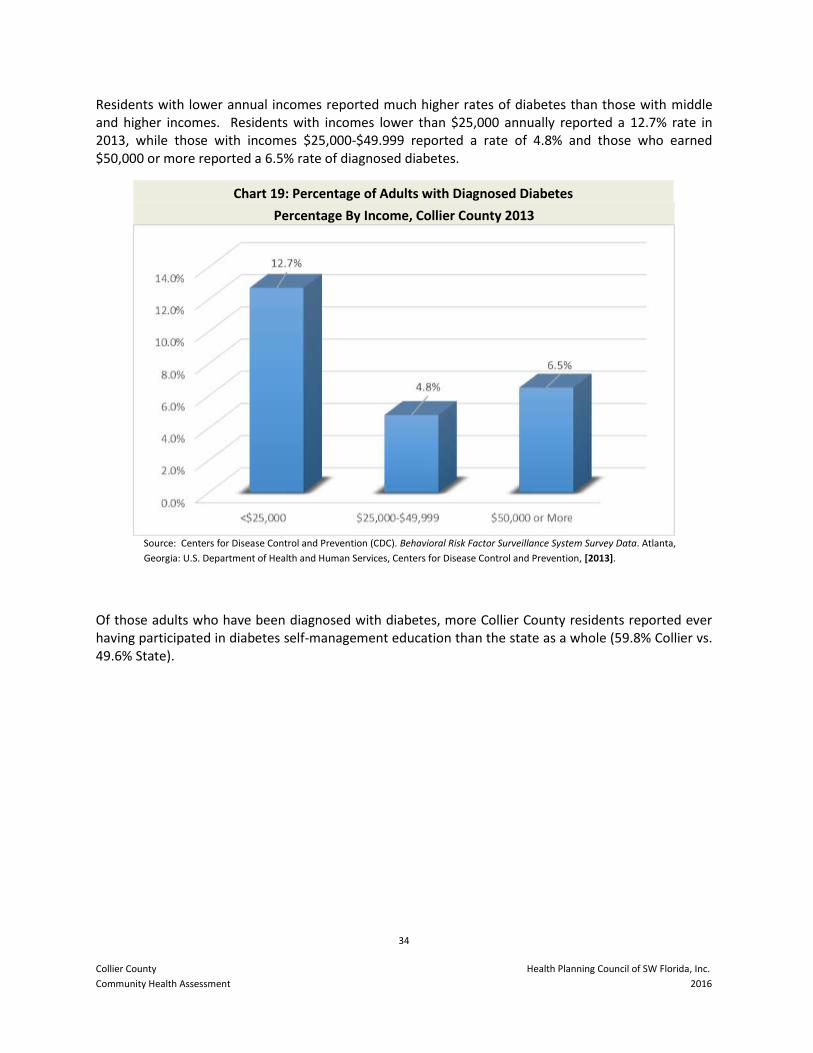
Residents with lower annual incomes reported much higher rates of diabetes than those with middle and higher incomes. Residents with incomes lower than $25,000 annually reported a 12.7% rate in 2013, while those with incomes $25,000-$49.999 reported a rate of 4.8% and those who earned $50,000 or more reported a 6.5% rate of diagnosed diabetes.
Chart 19: Percentage of Adults with Diagnosed Diabetes
Percentage By Income, Collier County 2013
Source: Centers for Disease Control and Prevention (CDC). Behavioral Risk Factor Surveillance System Survey Data. Atlanta,
Georgia: U.S. Department of Health and Human Services, Centers for Disease Control and Prevention, [2013].
Of those adults who have been diagnosed with diabetes, more Collier County residents reported ever having participated in diabetes self-management education than the state as a whole (59.8% Collier vs. 49.6% State).
35
Collier County Health Planning Council of SW Florida, Inc.
Community Health Assessment 2016
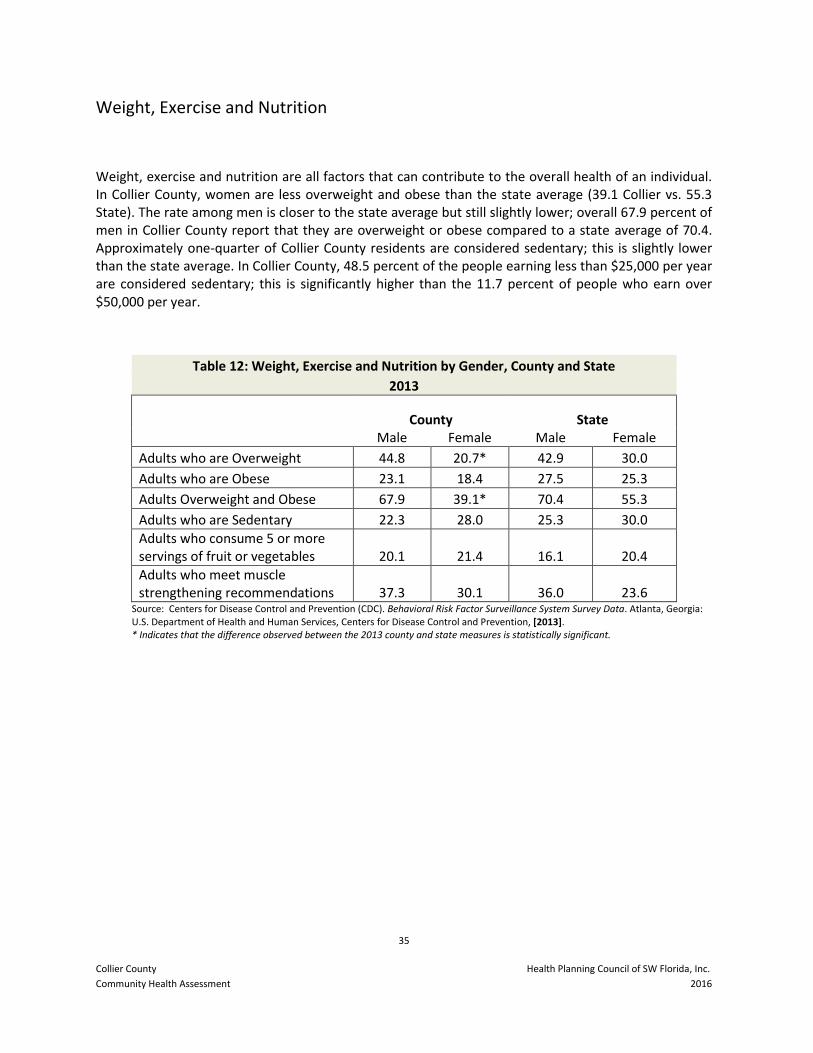
Weight, Exercise and Nutrition
Weight, exercise and nutrition are all factors that can contribute to the overall health of an individual. In Collier County, women are less overweight and obese than the state average (39.1 Collier vs. 55.3 State). The rate among men is closer to the state average but still slightly lower; overall 67.9 percent of men in Collier County report that they are overweight or obese compared to a state average of 70.4. Approximately one-quarter of Collier County residents are considered sedentary; this is slightly lower than the state average. In Collier County, 48.5 percent of the people earning less than $25,000 per year are considered sedentary; this is significantly higher than the 11.7 percent of people who earn over $50,000 per year.
Table 12: Weight, Exercise and Nutrition by Gender, County and State
2013
County State Male Female Male Female
Adults who are Overweight 44.8 20.7* 42.9 30.0
Adults who are Obese 23.1 18.4 27.5 25.3
Adults Overweight and Obese 67.9 39.1* 70.4 55.3
Adults who are Sedentary 22.3 28.0 25.3 30.0
Adults who consume 5 or more servings of fruit or vegetables 20.1 21.4 16.1 20.4
Adults who meet muscle strengthening recommendations 37.3 30.1 36.0 23.6
Source: Centers for Disease Control and Prevention (CDC). Behavioral Risk Factor Surveillance System Survey Data. Atlanta, Georgia: U.S. Department of Health and Human Services, Centers for Disease Control and Prevention, [2013]. * Indicates that the difference observed between the 2013 county and state measures is statistically significant.
36
Collier County Health Planning Council of SW Florida, Inc.
Community Health Assessment 2016
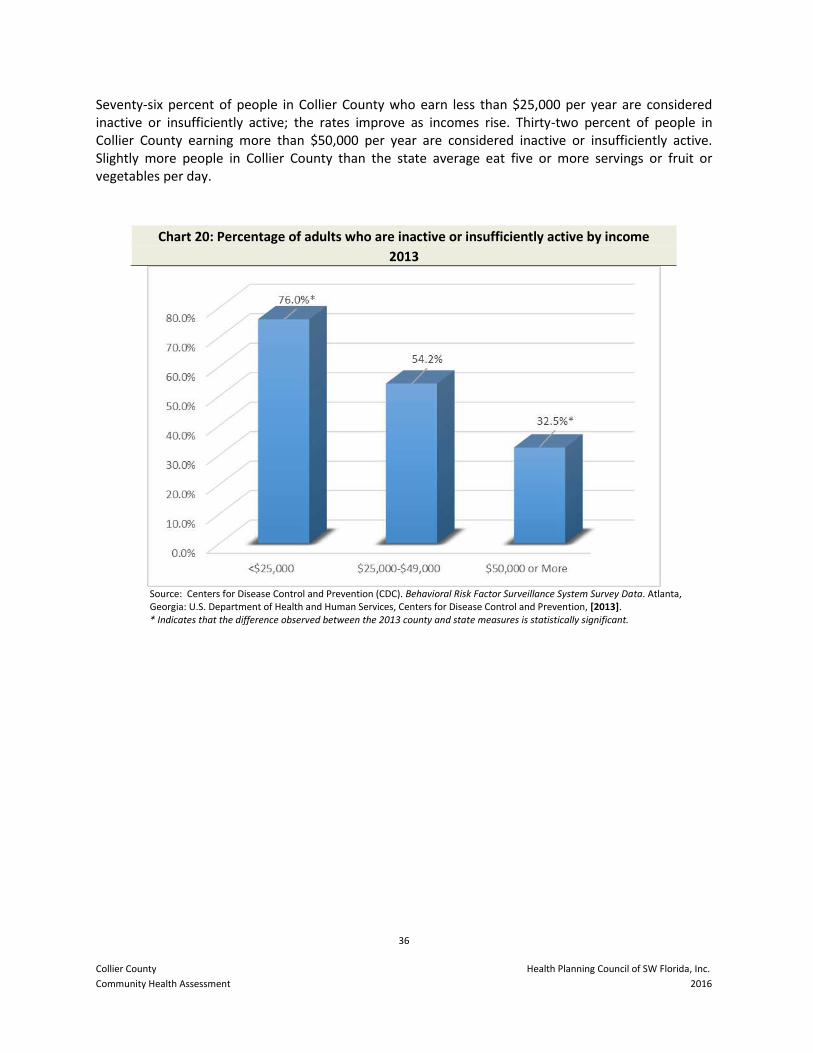
Seventy-six percent of people in Collier County who earn less than $25,000 per year are considered inactive or insufficiently active; the rates improve as incomes rise. Thirty-two percent of people in Collier County earning more than $50,000 per year are considered inactive or insufficiently active. Slightly more people in Collier County than the state average eat five or more servings or fruit or vegetables per day.
Chart 20: Percentage of adults who are inactive or insufficiently active by income
2013
Source: Centers for Disease Control and Prevention (CDC). Behavioral Risk Factor Surveillance System Survey Data. Atlanta, Georgia: U.S. Department of Health and Human Services, Centers for Disease Control and Prevention, [2013]. * Indicates that the difference observed between the 2013 county and state measures is statistically significant.
37
Collier County Health Planning Council of SW Florida, Inc.
Community Health Assessment 2016
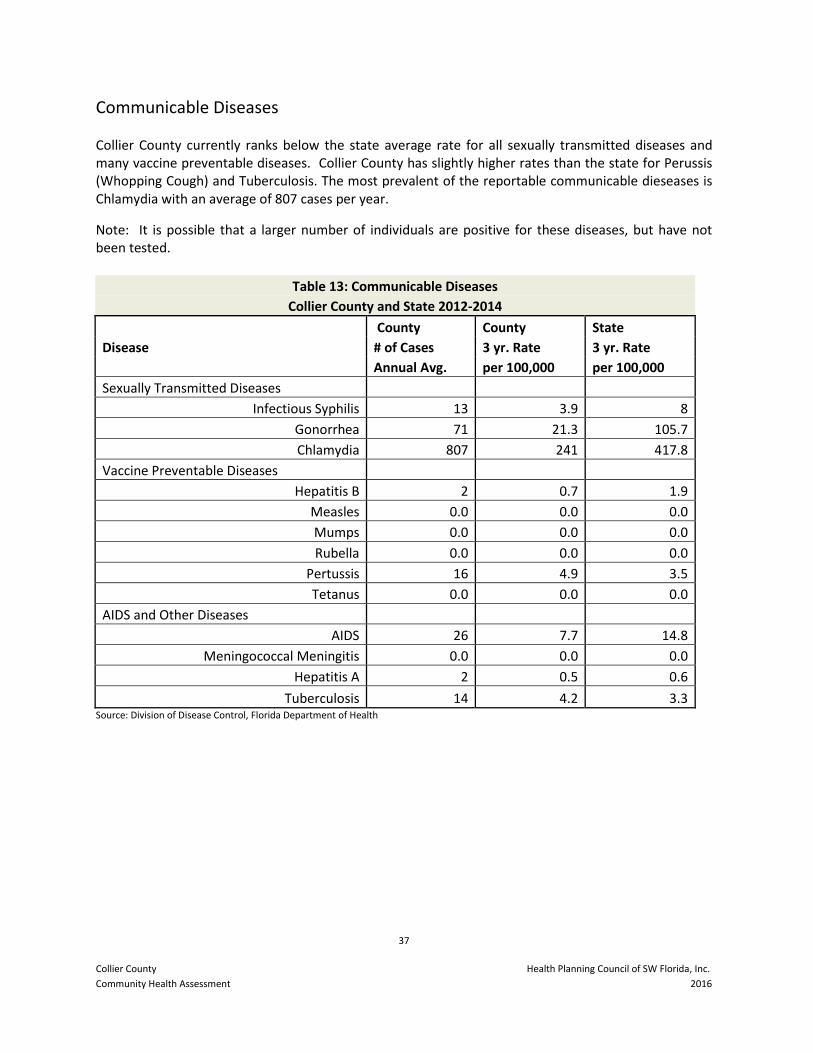
Communicable Diseases Collier County currently ranks below the state average rate for all sexually transmitted diseases and many vaccine preventable diseases. Collier County has slightly higher rates than the state for Perussis (Whopping Cough) and Tuberculosis. The most prevalent of the reportable communicable dieseases is Chlamydia with an average of 807 cases per year.
Note: It is possible that a larger number of individuals are positive for these diseases, but have not been tested.
Table 13: Communicable Diseases
Collier County and State 2012-2014
County County State
Disease # of Cases 3 yr. Rate 3 yr. Rate
Annual Avg. per 100,000 per 100,000
Sexually Transmitted Diseases
Infectious Syphilis 13 3.9 8
Gonorrhea 71 21.3 105.7
Chlamydia 807 241 417.8
Vaccine Preventable Diseases
Hepatitis B 2 0.7 1.9
Measles 0.0 0.0 0.0
Mumps 0.0 0.0 0.0
Rubella 0.0 0.0 0.0
Pertussis 16 4.9 3.5
Tetanus 0.0 0.0 0.0
AIDS and Other Diseases
AIDS 26 7.7 14.8
Meningococcal Meningitis 0.0 0.0 0.0
Hepatitis A 2 0.5 0.6
Tuberculosis 14 4.2 3.3 Source: Division of Disease Control, Florida Department of Health
38
Collier County Health Planning Council of SW Florida, Inc.
Community Health Assessment 2016
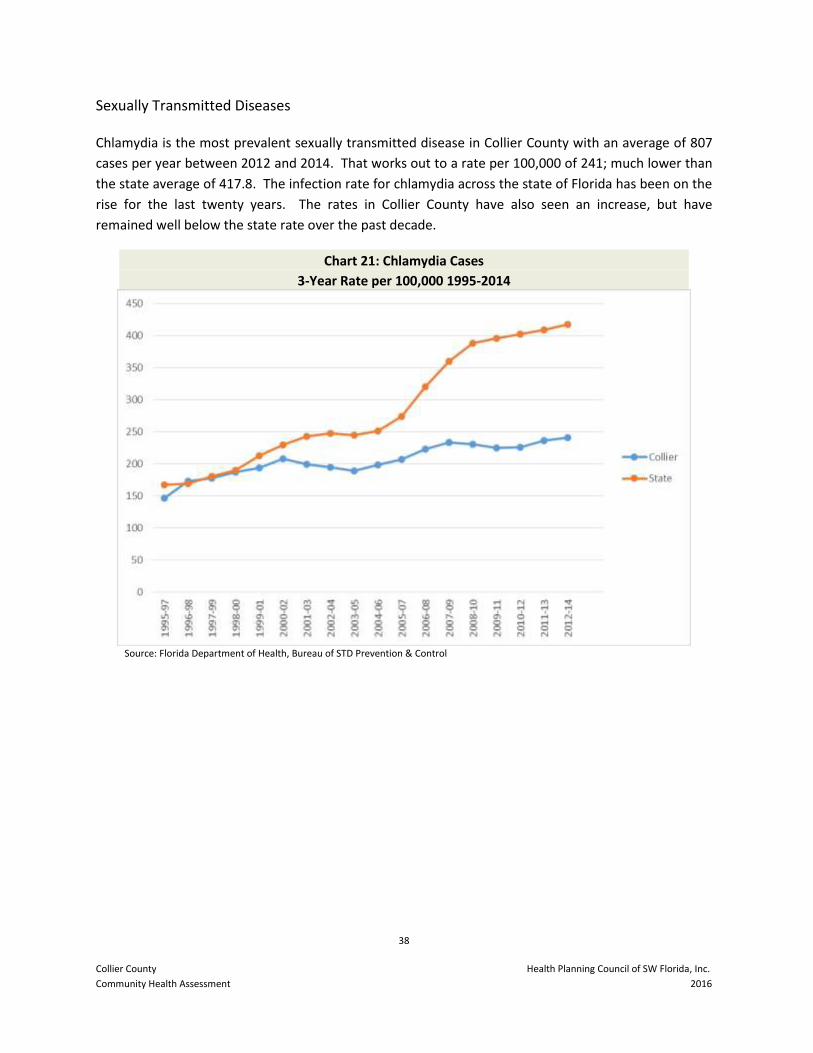
Sexually Transmitted Diseases
Chlamydia is the most prevalent sexually transmitted disease in Collier County with an average of 807
cases per year between 2012 and 2014. That works out to a rate per 100,000 of 241; much lower than
the state average of 417.8. The infection rate for chlamydia across the state of Florida has been on the
rise for the last twenty years. The rates in Collier County have also seen an increase, but have
remained well below the state rate over the past decade.
Chart 21: Chlamydia Cases
3-Year Rate per 100,000 1995-2014
Source: Florida Department of Health, Bureau of STD Prevention & Control
39
Collier County Health Planning Council of SW Florida, Inc.
Community Health Assessment 2016
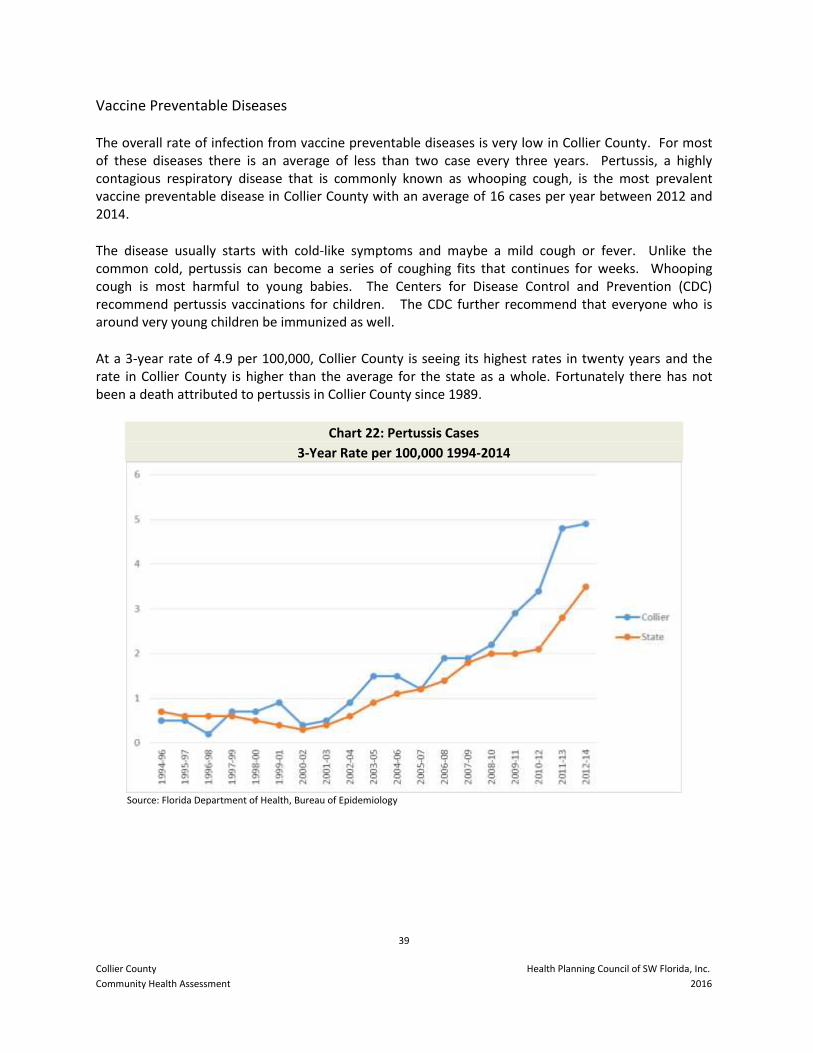
Vaccine Preventable Diseases
The overall rate of infection from vaccine preventable diseases is very low in Collier County. For most of these diseases there is an average of less than two case every three years. Pertussis, a highly contagious respiratory disease that is commonly known as whooping cough, is the most prevalent vaccine preventable disease in Collier County with an average of 16 cases per year between 2012 and 2014.
The disease usually starts with cold-like symptoms and maybe a mild cough or fever. Unlike the common cold, pertussis can become a series of coughing fits that continues for weeks. Whooping cough is most harmful to young babies. The Centers for Disease Control and Prevention (CDC) recommend pertussis vaccinations for children. The CDC further recommend that everyone who is around very young children be immunized as well.
At a 3-year rate of 4.9 per 100,000, Collier County is seeing its highest rates in twenty years and the rate in Collier County is higher than the average for the state as a whole. Fortunately there has not been a death attributed to pertussis in Collier County since 1989.
Chart 22: Pertussis Cases
3-Year Rate per 100,000 1994-2014
Source: Florida Department of Health, Bureau of Epidemiology
40
Collier County Health Planning Council of SW Florida, Inc.
Community Health Assessment 2016
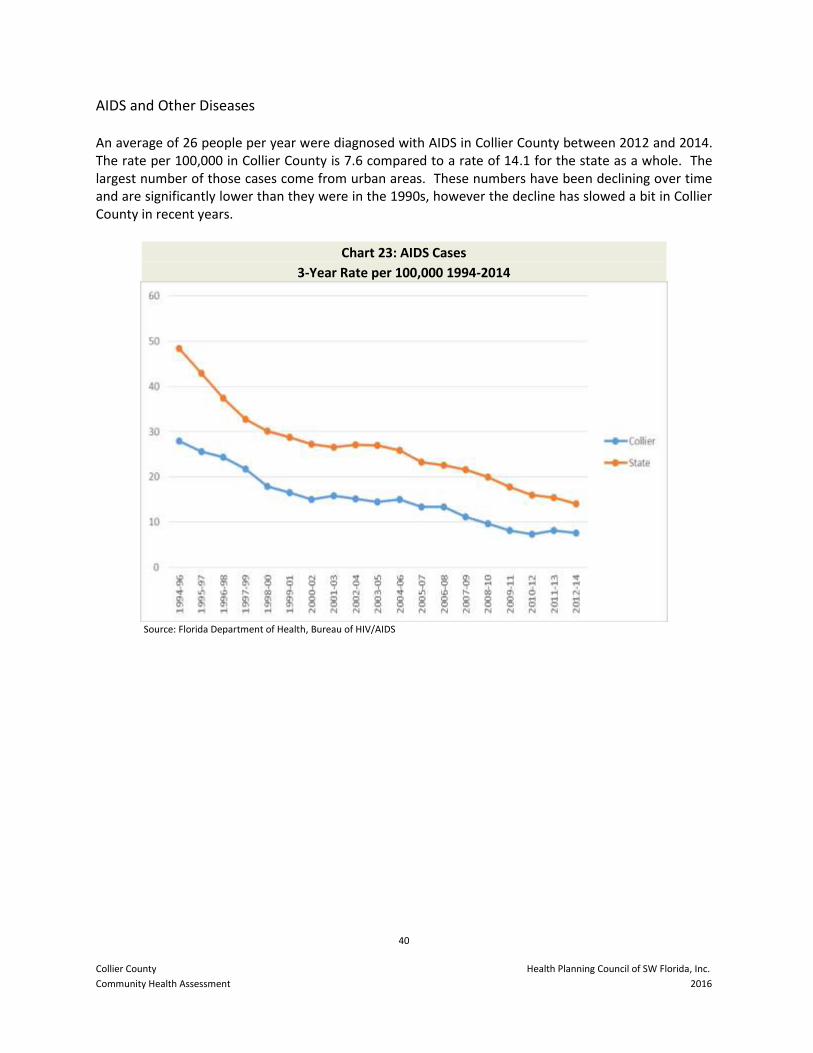
AIDS and Other Diseases
An average of 26 people per year were diagnosed with AIDS in Collier County between 2012 and 2014. The rate per 100,000 in Collier County is 7.6 compared to a rate of 14.1 for the state as a whole. The largest number of those cases come from urban areas. These numbers have been declining over time and are significantly lower than they were in the 1990s, however the decline has slowed a bit in Collier County in recent years.
Chart 23: AIDS Cases
3-Year Rate per 100,000 1994-2014
Source: Florida Department of Health, Bureau of HIV/AIDS
41
Collier County Health Planning Council of SW Florida, Inc.
Community Health Assessment 2016
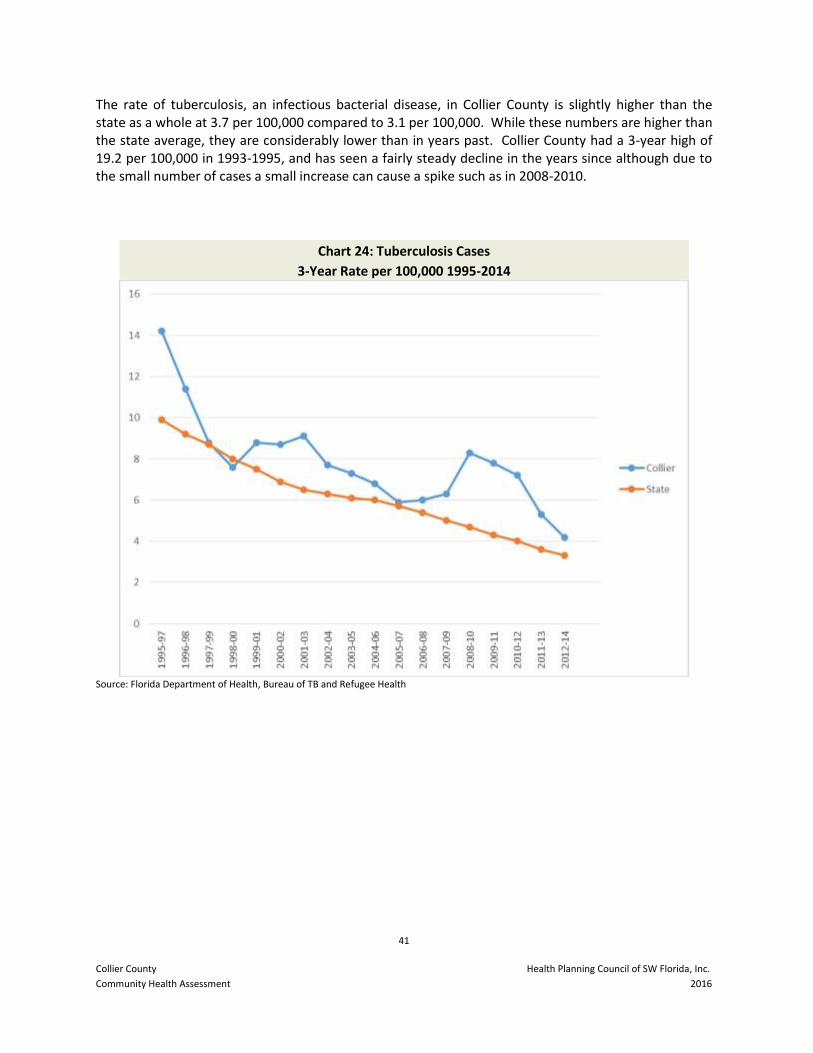
The rate of tuberculosis, an infectious bacterial disease, in Collier County is slightly higher than the state as a whole at 3.7 per 100,000 compared to 3.1 per 100,000. While these numbers are higher than the state average, they are considerably lower than in years past. Collier County had a 3-year high of 19.2 per 100,000 in 1993-1995, and has seen a fairly steady decline in the years since although due to the small number of cases a small increase can cause a spike such as in 2008-2010.
Chart 24: Tuberculosis Cases
3-Year Rate per 100,000 1995-2014
Source: Florida Department of Health, Bureau of TB and Refugee Health
42
Collier County Health Planning Council of SW Florida, Inc.
Community Health Assessment 2016
Maternal and Child Health
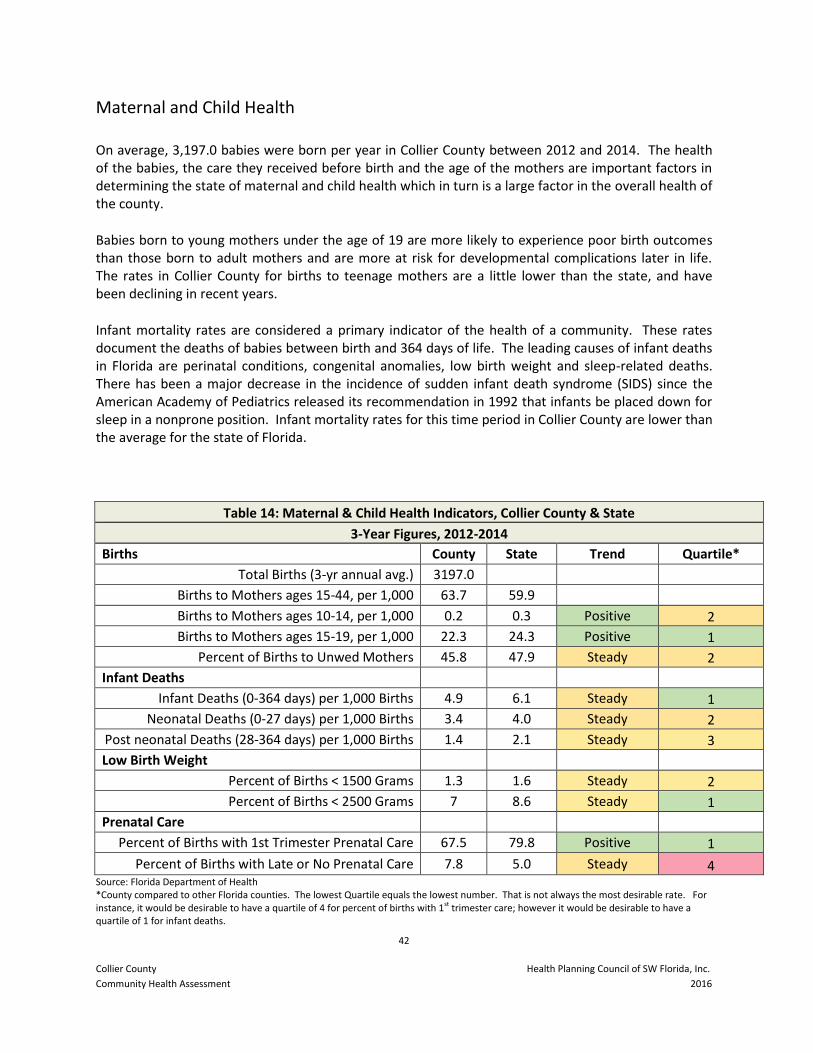
On average, 3,197.0 babies were born per year in Collier County between 2012 and 2014. The health of the babies, the care they received before birth and the age of the mothers are important factors in determining the state of maternal and child health which in turn is a large factor in the overall health of the county.
Babies born to young mothers under the age of 19 are more likely to experience poor birth outcomes than those born to adult mothers and are more at risk for developmental complications later in life. The rates in Collier County for births to teenage mothers are a little lower than the state, and have been declining in recent years.
Infant mortality rates are considered a primary indicator of the health of a community. These rates document the deaths of babies between birth and 364 days of life. The leading causes of infant deaths in Florida are perinatal conditions, congenital anomalies, low birth weight and sleep-related deaths. There has been a major decrease in the incidence of sudden infant death syndrome (SIDS) since the American Academy of Pediatrics released its recommendation in 1992 that infants be placed down for sleep in a nonprone position. Infant mortality rates for this time period in Collier County are lower than the average for the state of Florida.
Table 14: Maternal & Child Health Indicators, Collier County & State
3-Year Figures, 2012-2014
Births County State Trend Quartile*
Total Births (3-yr annual avg.) 3197.0
Births to Mothers ages 15-44, per 1,000 63.7 59.9
Births to Mothers ages 10-14, per 1,000 0.2 0.3 Positive 2
Births to Mothers ages 15-19, per 1,000 22.3 24.3 Positive 1
Percent of Births to Unwed Mothers 45.8 47.9 Steady 2
Infant Deaths
Infant Deaths (0-364 days) per 1,000 Births 4.9 6.1 Steady 1
Neonatal Deaths (0-27 days) per 1,000 Births 3.4 4.0 Steady 2
Post neonatal Deaths (28-364 days) per 1,000 Births 1.4 2.1 Steady 3
Low Birth Weight
Percent of Births < 1500 Grams 1.3 1.6 Steady 2
Percent of Births < 2500 Grams 7 8.6 Steady 1
Prenatal Care
Percent of Births with 1st Trimester Prenatal Care 67.5 79.8 Positive 1
Percent of Births with Late or No Prenatal Care 7.8 5.0 Steady 4 Source: Florida Department of Health *County compared to other Florida counties. The lowest Quartile equals the lowest number. That is not always the most desirable rate. For instance, it would be desirable to have a quartile of 4 for percent of births with 1st trimester care; however it would be desirable to have a quartile of 1 for infant deaths.
43
Collier County Health Planning Council of SW Florida, Inc.
Community Health Assessment 2016
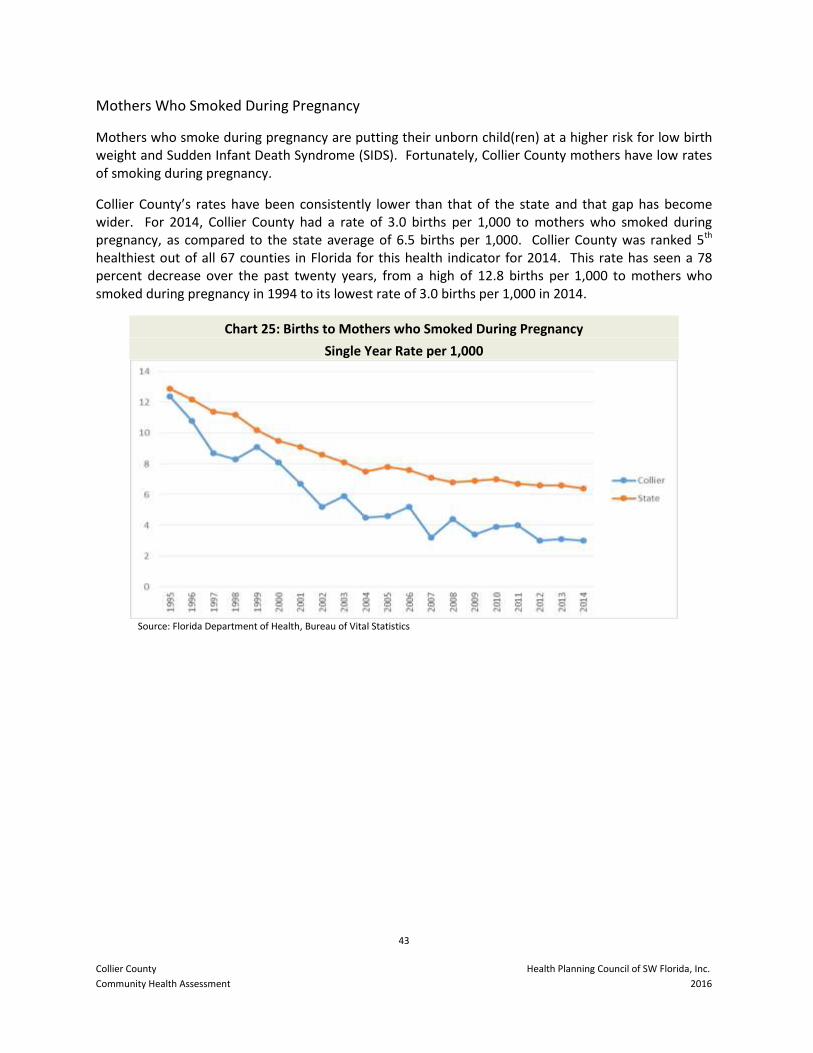
Mothers Who Smoked During Pregnancy
Mothers who smoke during pregnancy are putting their unborn child(ren) at a higher risk for low birth weight and Sudden Infant Death Syndrome (SIDS). Fortunately, Collier County mothers have low rates of smoking during pregnancy.
Collier County’s rates have been consistently lower than that of the state and that gap has become wider. For 2014, Collier County had a rate of 3.0 births per 1,000 to mothers who smoked during pregnancy, as compared to the state average of 6.5 births per 1,000. Collier County was ranked 5th healthiest out of all 67 counties in Florida for this health indicator for 2014. This rate has seen a 78 percent decrease over the past twenty years, from a high of 12.8 births per 1,000 to mothers who smoked during pregnancy in 1994 to its lowest rate of 3.0 births per 1,000 in 2014.
Chart 25: Births to Mothers who Smoked During Pregnancy
Single Year Rate per 1,000
Source: Florida Department of Health, Bureau of Vital Statistics
44
Collier County Health Planning Council of SW Florida, Inc.
Community Health Assessment 2016
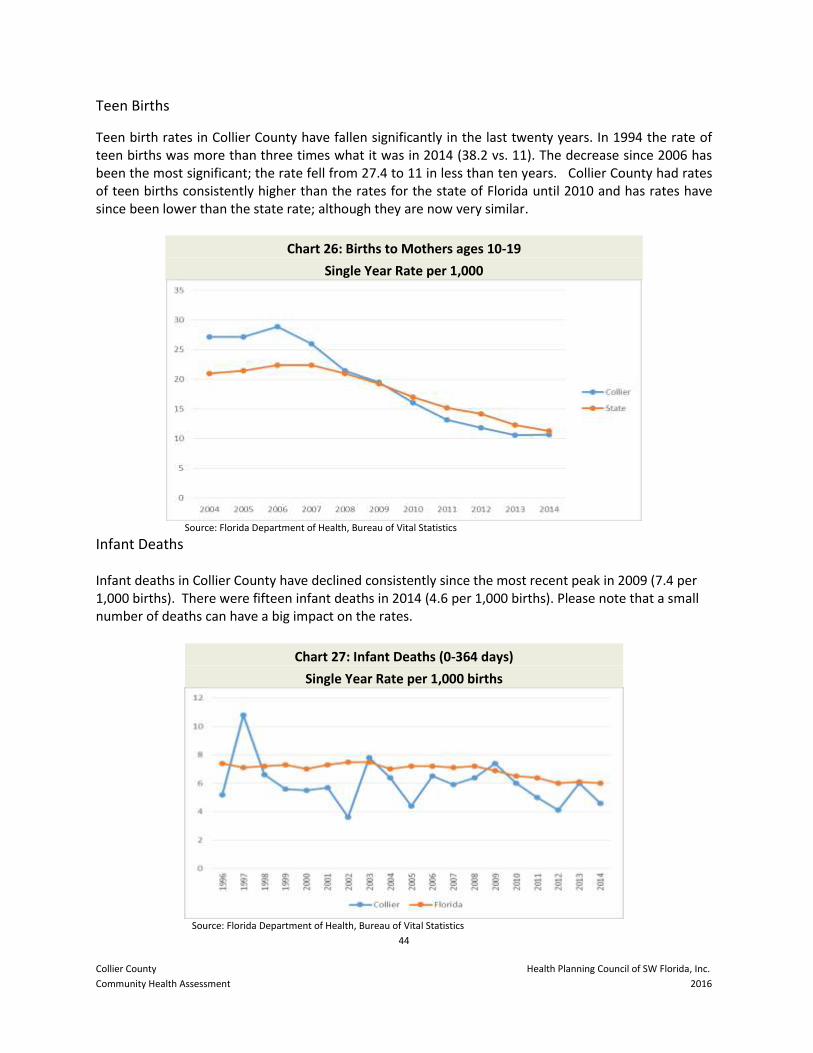
Teen Births
Teen birth rates in Collier County have fallen significantly in the last twenty years. In 1994 the rate of teen births was more than three times what it was in 2014 (38.2 vs. 11). The decrease since 2006 has been the most significant; the rate fell from 27.4 to 11 in less than ten years. Collier County had rates of teen births consistently higher than the rates for the state of Florida until 2010 and has rates have since been lower than the state rate; although they are now very similar.
Chart 26: Births to Mothers ages 10-19
Single Year Rate per 1,000
Source: Florida Department of Health, Bureau of Vital Statistics
Infant Deaths Infant deaths in Collier County have declined consistently since the most recent peak in 2009 (7.4 per 1,000 births). There were fifteen infant deaths in 2014 (4.6 per 1,000 births). Please note that a small number of deaths can have a big impact on the rates.
Chart 27: Infant Deaths (0-364 days)
Single Year Rate per 1,000 births
Source: Florida Department of Health, Bureau of Vital Statistics
45
Collier County Health Planning Council of SW Florida, Inc.
Community Health Assessment 2016
Senior Citizen Health
Over the past twenty years, the elderly population (those 65 and older) in Collier County has seen an increase of 82%. The overall population of Collier County has only increased 71% during that same time. The number of Collier County residents who are 85 and older has increased 209% during that time. As this unique population continues to grow in Collier County, their unique health concerns continue to grow as well.
The population in Collier County age 65 and over tends to have a higher median income than residents of the same age across the state of Florida as well as throughout the United States. While higher income does not necessarily equate to better health, it does play a role in an individual’s health.
Table 15: Median Household Income by Age
2014
Collier Florida United States
less than 25 $26,517 $26,315 $27,047
25 to 44 $52,891 $50,523 $58,970
45 to 64 $69,564 $55,546 $65,018
65 and over $57,191 $38,425 $39,186 Source: U.S. Census American Community Survey
For Collier County residents age 65 and over, the leading causes of death most recently have been cancer, heart disease, chronic lower respiratory disease, Cerebrovascular Diseases, Alzheimer’s disease and unintentional injuries. Alzheimer’s disease in particular has seen a large rise in the total number of deaths over the past ten years by those age 65 and over in Collier County. Please note when comparing death counts over time that the population has increased.
Table 16: Leading Causes of Death, Collier County Residents 65 and over
Total Number of Deaths*, 2005-2014
2005 2006 2007 2008 2009 2010 2011 2012 2013 2014 Total
Cancer 745 714 653 739 693 707 730 779 734 782 8,598
Heart Diseases 622 618 617 610 551 652 634 673 631 654 7,447
CLRD** 130 129 132 144 153 190 198 174 175 177 1,869
Cerebrovascular Diseases 140 113 148 145 143 177 164 168 150 167 1,787
Alzheimer’s Disease 66 70 97 105 149 153 136 166 212 186 1,469
Unintentional Injury 174 172 158 174 194 177 163 166 194 179 2,038 Source: Florida Department of Health, Office of Vital Statistics *Please note these are raw counts. Some fluctuations in counts may be due to changes in the population. **Chronic Lower Respiratory Disease
46
Collier County Health Planning Council of SW Florida, Inc.
Community Health Assessment 2016
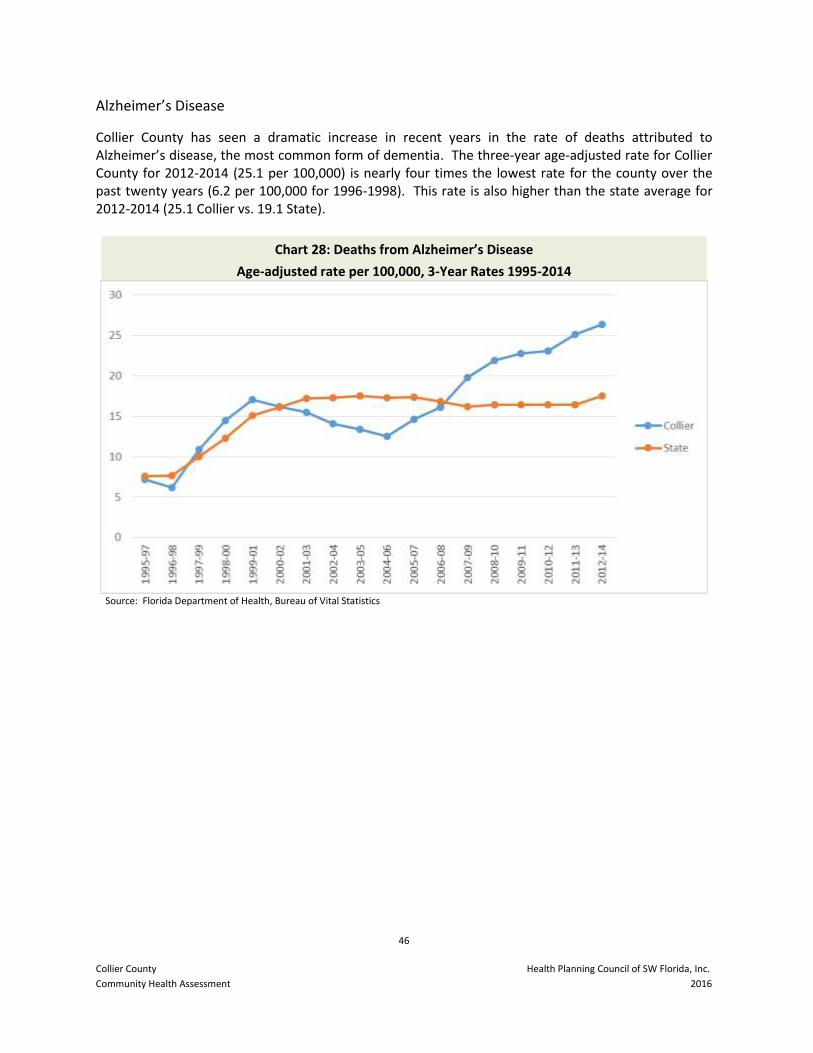
Alzheimer’s Disease
Collier County has seen a dramatic increase in recent years in the rate of deaths attributed to Alzheimer’s disease, the most common form of dementia. The three-year age-adjusted rate for Collier County for 2012-2014 (25.1 per 100,000) is nearly four times the lowest rate for the county over the past twenty years (6.2 per 100,000 for 1996-1998). This rate is also higher than the state average for 2012-2014 (25.1 Collier vs. 19.1 State).
Chart 28: Deaths from Alzheimer’s Disease
Age-adjusted rate per 100,000, 3-Year Rates 1995-2014
Source: Florida Department of Health, Bureau of Vital Statistics
47
Collier County Health Planning Council of SW Florida, Inc.
Community Health Assessment 2016
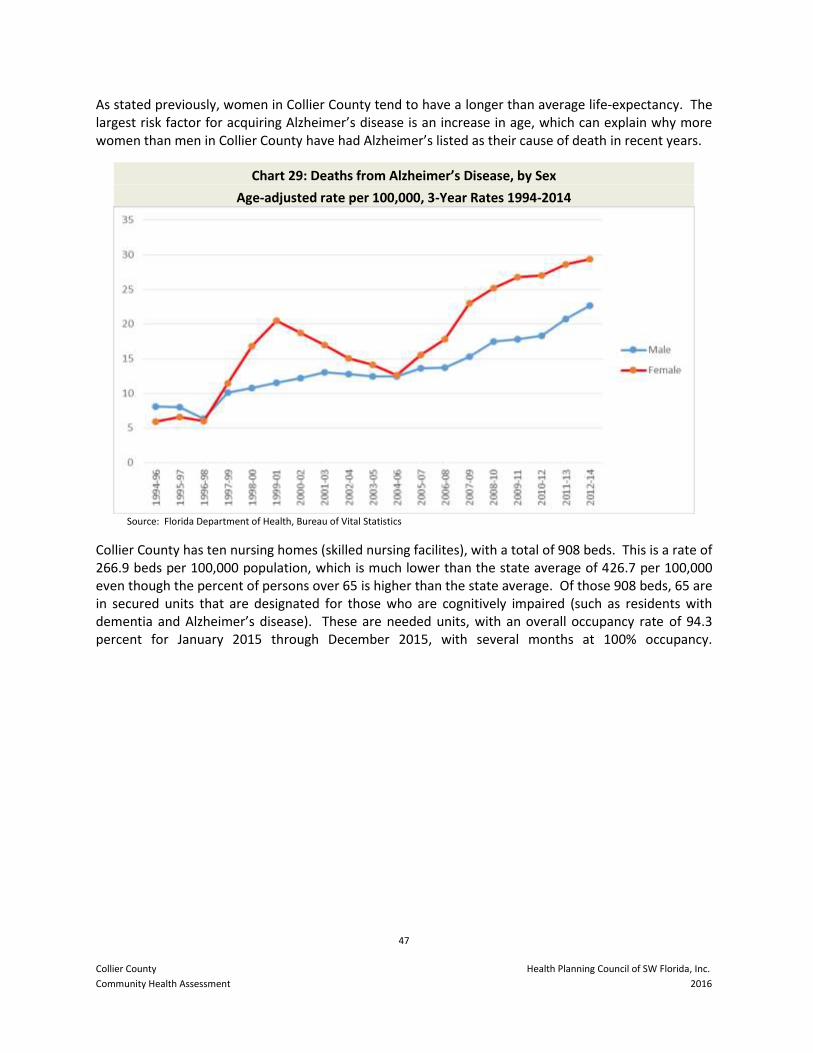
As stated previously, women in Collier County tend to have a longer than average life-expectancy. The largest risk factor for acquiring Alzheimer’s disease is an increase in age, which can explain why more women than men in Collier County have had Alzheimer’s listed as their cause of death in recent years.
Chart 29: Deaths from Alzheimer’s Disease, by Sex
Age-adjusted rate per 100,000, 3-Year Rates 1994-2014
Source: Florida Department of Health, Bureau of Vital Statistics
Collier County has ten nursing homes (skilled nursing facilites), with a total of 908 beds. This is a rate of 266.9 beds per 100,000 population, which is much lower than the state average of 426.7 per 100,000 even though the percent of persons over 65 is higher than the state average. Of those 908 beds, 65 are in secured units that are designated for those who are cognitively impaired (such as residents with dementia and Alzheimer’s disease). These are needed units, with an overall occupancy rate of 94.3 percent for January 2015 through December 2015, with several months at 100% occupancy.
48
Collier County Health Planning Council of SW Florida, Inc.
Community Health Assessment 2016
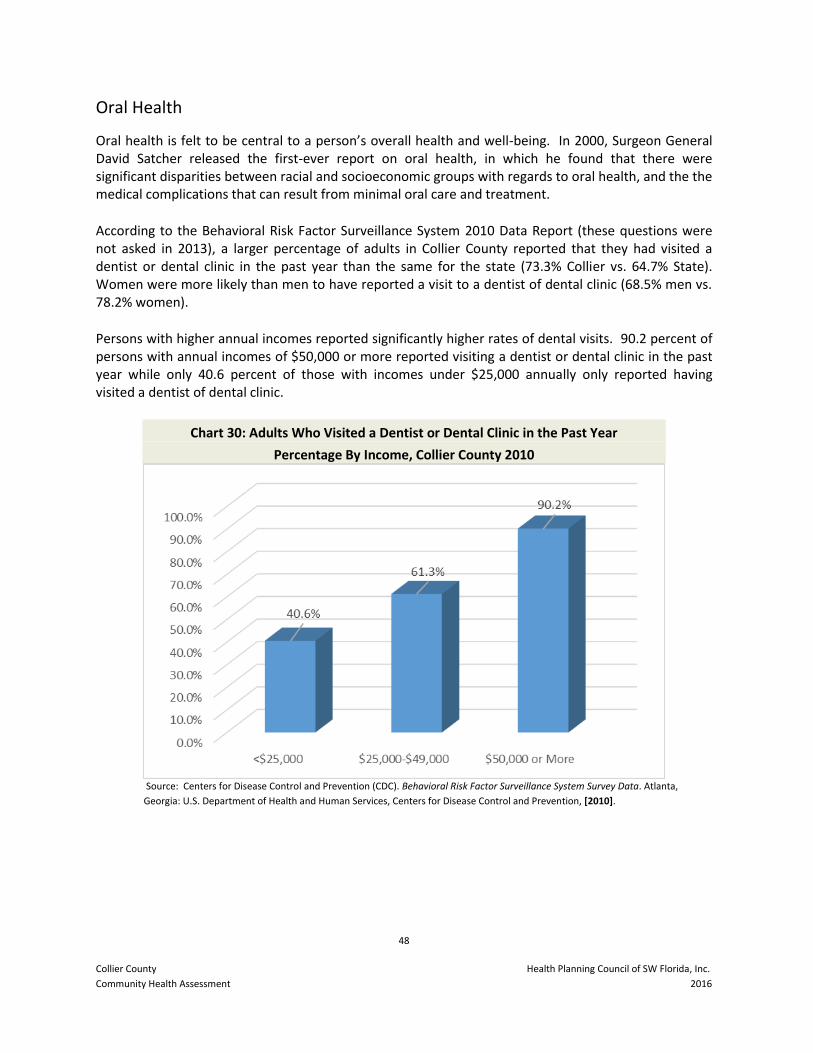
Oral Health
Oral health is felt to be central to a person’s overall health and well-being. In 2000, Surgeon General David Satcher released the first-ever report on oral health, in which he found that there were significant disparities between racial and socioeconomic groups with regards to oral health, and the the medical complications that can result from minimal oral care and treatment.
According to the Behavioral Risk Factor Surveillance System 2010 Data Report (these questions were not asked in 2013), a larger percentage of adults in Collier County reported that they had visited a dentist or dental clinic in the past year than the same for the state (73.3% Collier vs. 64.7% State). Women were more likely than men to have reported a visit to a dentist of dental clinic (68.5% men vs. 78.2% women).
Persons with higher annual incomes reported significantly higher rates of dental visits. 90.2 percent of persons with annual incomes of $50,000 or more reported visiting a dentist or dental clinic in the past year while only 40.6 percent of those with incomes under $25,000 annually only reported having visited a dentist of dental clinic.
Chart 30: Adults Who Visited a Dentist or Dental Clinic in the Past Year
Percentage By Income, Collier County 2010
Source: Centers for Disease Control and Prevention (CDC). Behavioral Risk Factor Surveillance System Survey Data. Atlanta,
Georgia: U.S. Department of Health and Human Services, Centers for Disease Control and Prevention, [2010].
49
Collier County Health Planning Council of SW Florida, Inc.
Community Health Assessment 2016
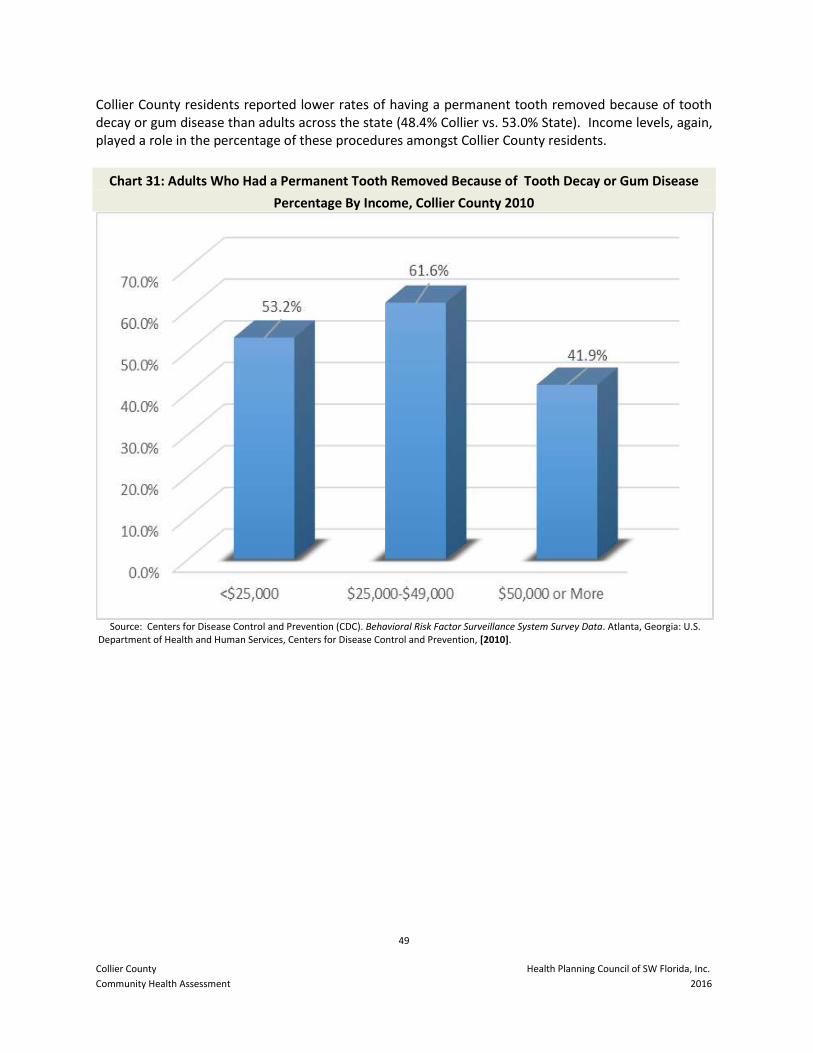
Collier County residents reported lower rates of having a permanent tooth removed because of tooth decay or gum disease than adults across the state (48.4% Collier vs. 53.0% State). Income levels, again, played a role in the percentage of these procedures amongst Collier County residents.
Chart 31: Adults Who Had a Permanent Tooth Removed Because of Tooth Decay or Gum Disease
Percentage By Income, Collier County 2010
Source: Centers for Disease Control and Prevention (CDC). Behavioral Risk Factor Surveillance System Survey Data. Atlanta, Georgia: U.S.
Department of Health and Human Services, Centers for Disease Control and Prevention, [2010].
50
Collier County Health Planning Council of SW Florida, Inc.
Community Health Assessment 2016
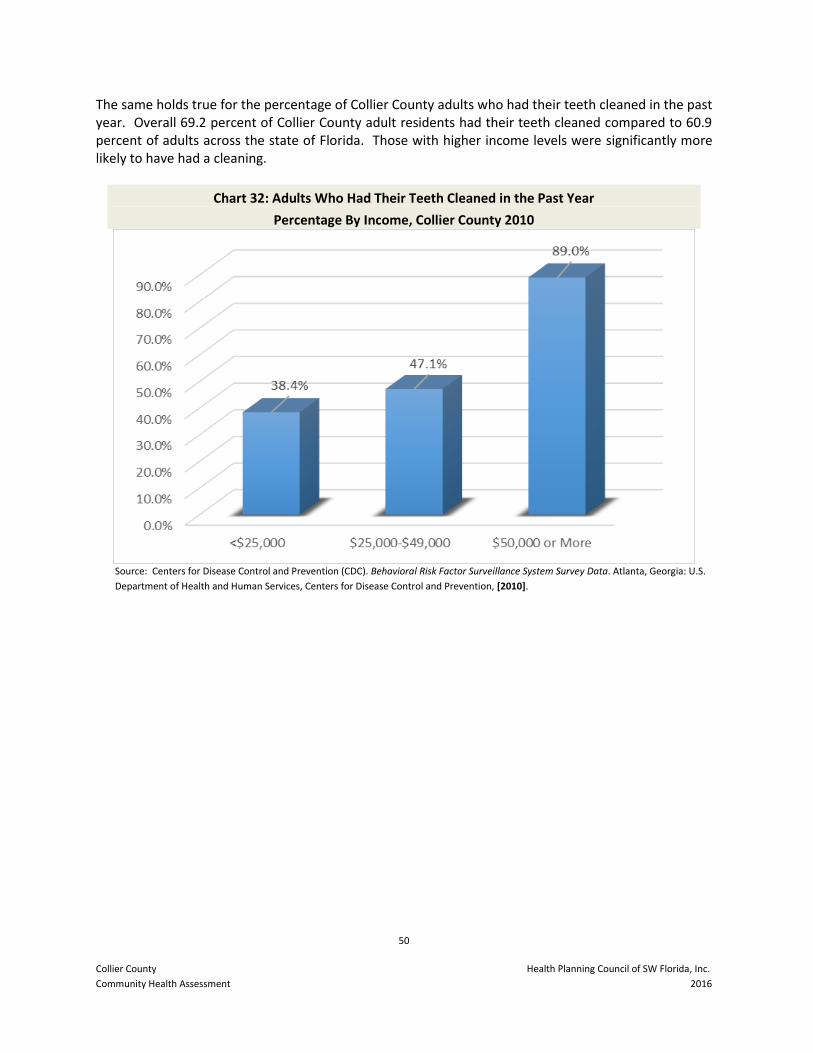
The same holds true for the percentage of Collier County adults who had their teeth cleaned in the past year. Overall 69.2 percent of Collier County adult residents had their teeth cleaned compared to 60.9 percent of adults across the state of Florida. Those with higher income levels were significantly more likely to have had a cleaning.
Chart 32: Adults Who Had Their Teeth Cleaned in the Past Year
Percentage By Income, Collier County 2010
Source: Centers for Disease Control and Prevention (CDC). Behavioral Risk Factor Surveillance System Survey Data. Atlanta, Georgia: U.S.
Department of Health and Human Services, Centers for Disease Control and Prevention, [2010].
51
Collier County Health Planning Council of SW Florida, Inc.
Community Health Assessment 2016
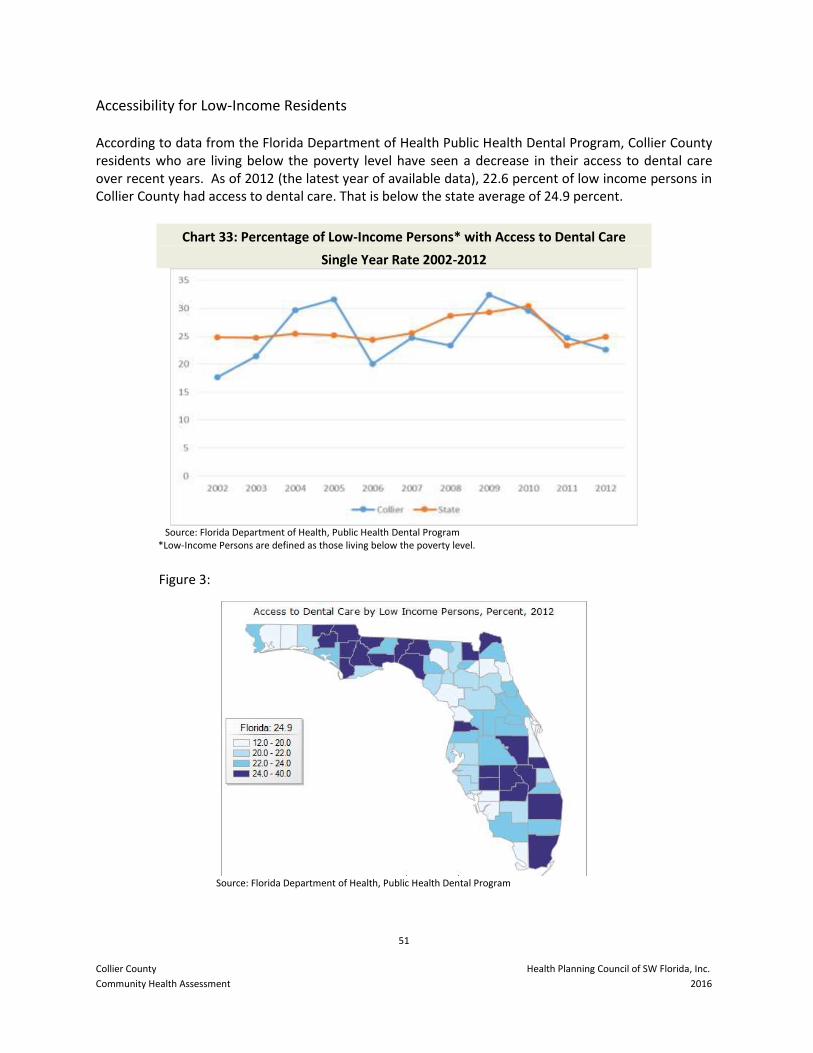
Accessibility for Low-Income Residents
According to data from the Florida Department of Health Public Health Dental Program, Collier County residents who are living below the poverty level have seen a decrease in their access to dental care over recent years. As of 2012 (the latest year of available data), 22.6 percent of low income persons in Collier County had access to dental care. That is below the state average of 24.9 percent.
Chart 33: Percentage of Low-Income Persons* with Access to Dental Care
Single Year Rate 2002-2012
Source: Florida Department of Health, Public Health Dental Program *Low-Income Persons are defined as those living below the poverty level.
Figure 3:
Source: Florida Department of Health, Public Health Dental Program
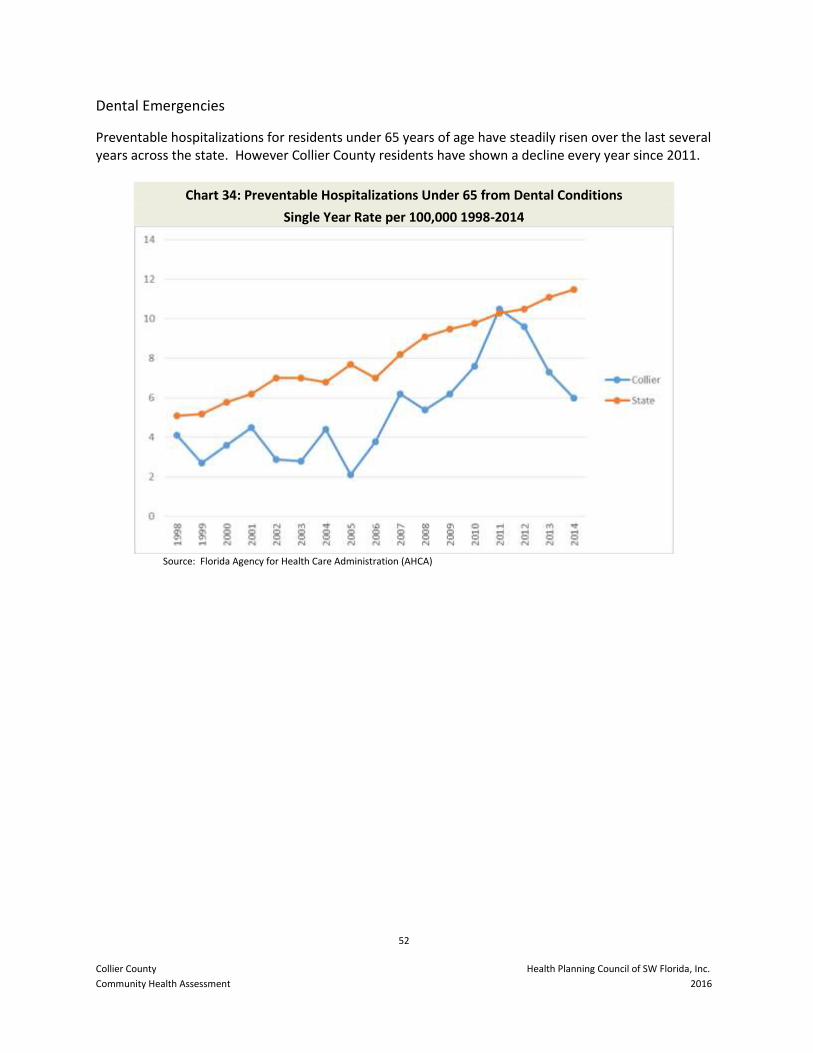
52
Collier County Health Planning Council of SW Florida, Inc.
Community Health Assessment 2016
Dental Emergencies
Preventable hospitalizations for residents under 65 years of age have steadily risen over the last several years across the state. However Collier County residents have shown a decline every year since 2011.
Chart 34: Preventable Hospitalizations Under 65 from Dental Conditions
Single Year Rate per 100,000 1998-2014
Source: Florida Agency for Health Care Administration (AHCA)
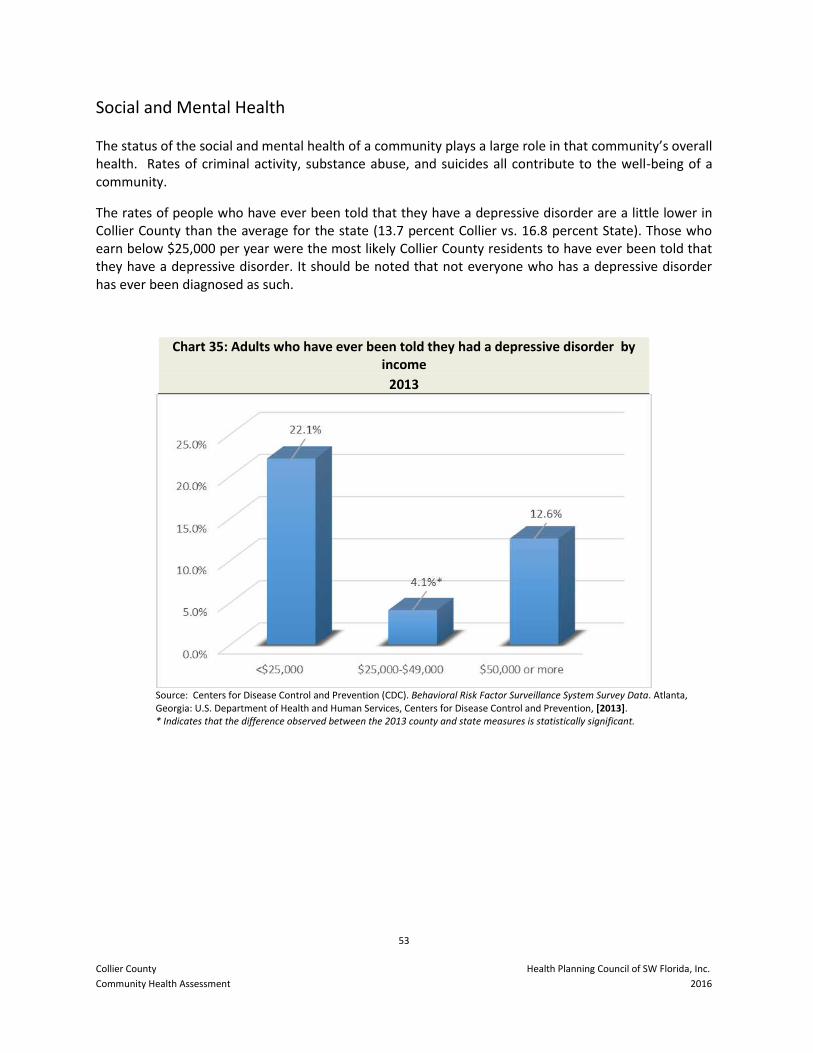
53
Collier County Health Planning Council of SW Florida, Inc.
Community Health Assessment 2016
Social and Mental Health
The status of the social and mental health of a community plays a large role in that community’s overall health. Rates of criminal activity, substance abuse, and suicides all contribute to the well-being of a community.
The rates of people who have ever been told that they have a depressive disorder are a little lower in Collier County than the average for the state (13.7 percent Collier vs. 16.8 percent State). Those who earn below $25,000 per year were the most likely Collier County residents to have ever been told that they have a depressive disorder. It should be noted that not everyone who has a depressive disorder has ever been diagnosed as such.
Chart 35: Adults who have ever been told they had a depressive disorder by income
2013
Source: Centers for Disease Control and Prevention (CDC). Behavioral Risk Factor Surveillance System Survey Data. Atlanta, Georgia: U.S. Department of Health and Human Services, Centers for Disease Control and Prevention, [2013]. * Indicates that the difference observed between the 2013 county and state measures is statistically significant.
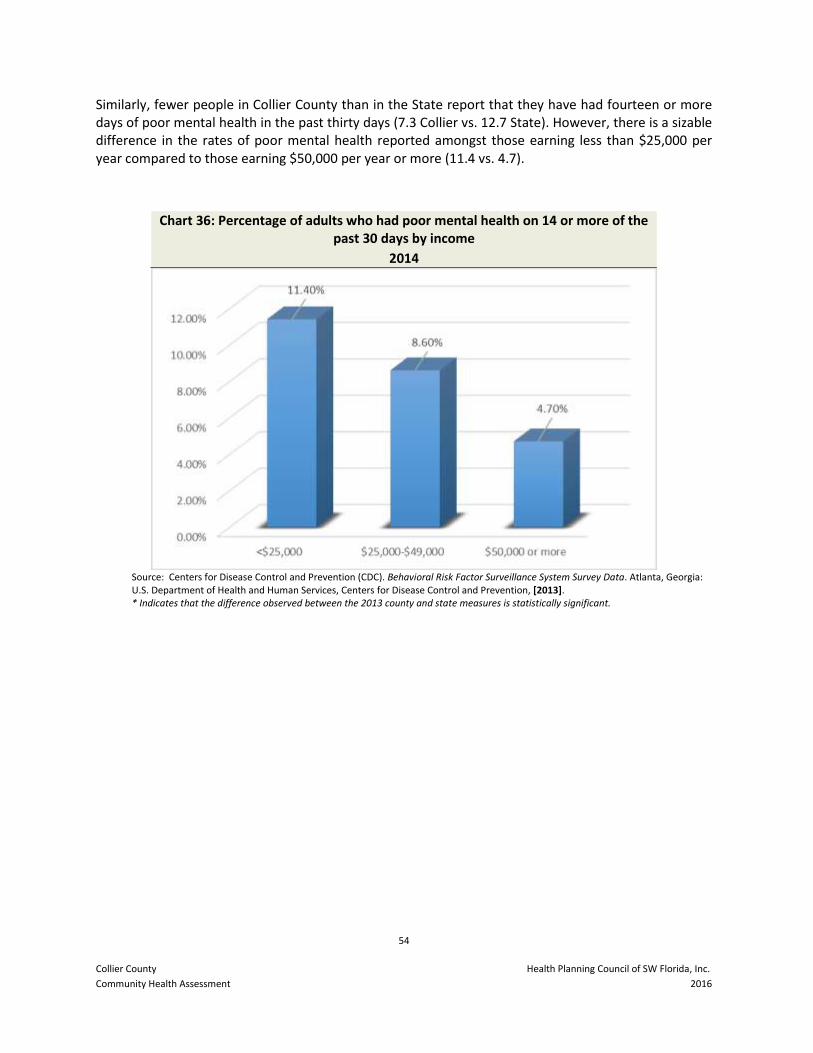
54
Collier County Health Planning Council of SW Florida, Inc.
Community Health Assessment 2016
Similarly, fewer people in Collier County than in the State report that they have had fourteen or more days of poor mental health in the past thirty days (7.3 Collier vs. 12.7 State). However, there is a sizable difference in the rates of poor mental health reported amongst those earning less than $25,000 per year compared to those earning $50,000 per year or more (11.4 vs. 4.7).
Chart 36: Percentage of adults who had poor mental health on 14 or more of the past 30 days by income
2014
Source: Centers for Disease Control and Prevention (CDC). Behavioral Risk Factor Surveillance System Survey Data. Atlanta, Georgia: U.S. Department of Health and Human Services, Centers for Disease Control and Prevention, [2013]. * Indicates that the difference observed between the 2013 county and state measures is statistically significant.
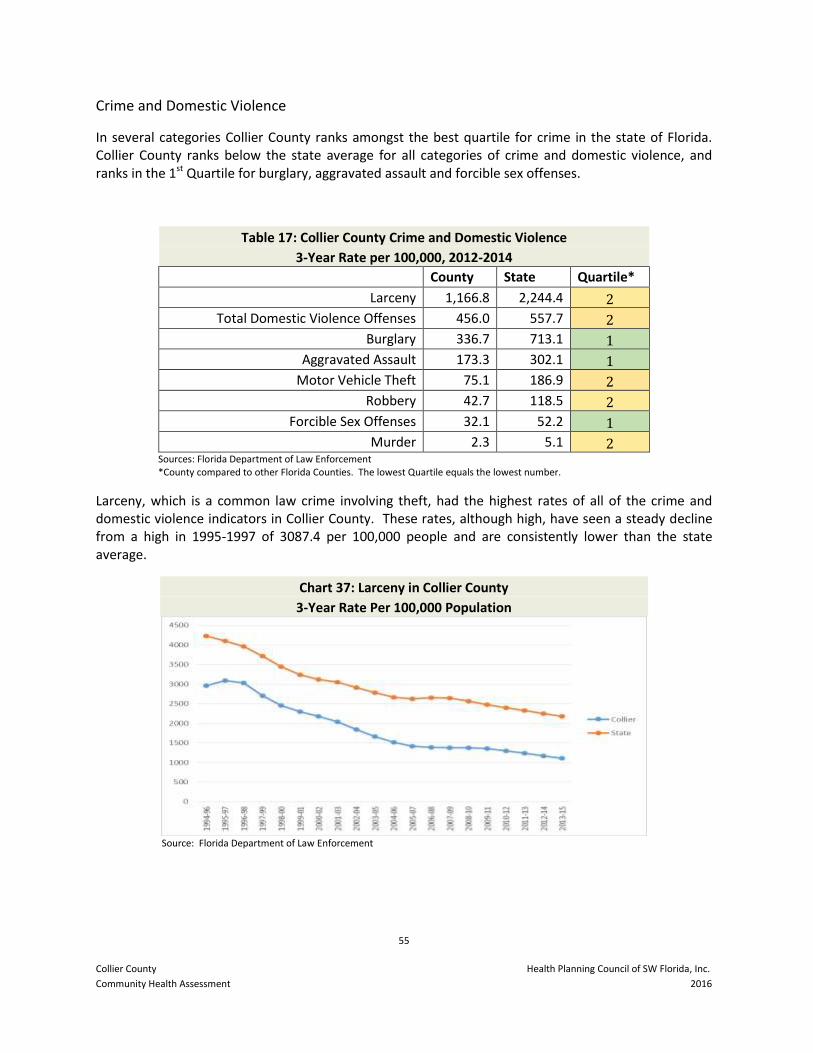
55
Collier County Health Planning Council of SW Florida, Inc.
Community Health Assessment 2016
Crime and Domestic Violence
In several categories Collier County ranks amongst the best quartile for crime in the state of Florida. Collier County ranks below the state average for all categories of crime and domestic violence, and ranks in the 1st Quartile for burglary, aggravated assault and forcible sex offenses.
Table 17: Collier County Crime and Domestic Violence
3-Year Rate per 100,000, 2012-2014
County State Quartile*
Larceny 1,166.8 2,244.4 2
Total Domestic Violence Offenses 456.0 557.7 2
Burglary 336.7 713.1 1
Aggravated Assault 173.3 302.1 1
Motor Vehicle Theft 75.1 186.9 2
Robbery 42.7 118.5 2
Forcible Sex Offenses 32.1 52.2 1
Murder 2.3 5.1 2 Sources: Florida Department of Law Enforcement *County compared to other Florida Counties. The lowest Quartile equals the lowest number.
Larceny, which is a common law crime involving theft, had the highest rates of all of the crime and domestic violence indicators in Collier County. These rates, although high, have seen a steady decline from a high in 1995-1997 of 3087.4 per 100,000 people and are consistently lower than the state average.
Chart 37: Larceny in Collier County
3-Year Rate Per 100,000 Population
Source: Florida Department of Law Enforcement
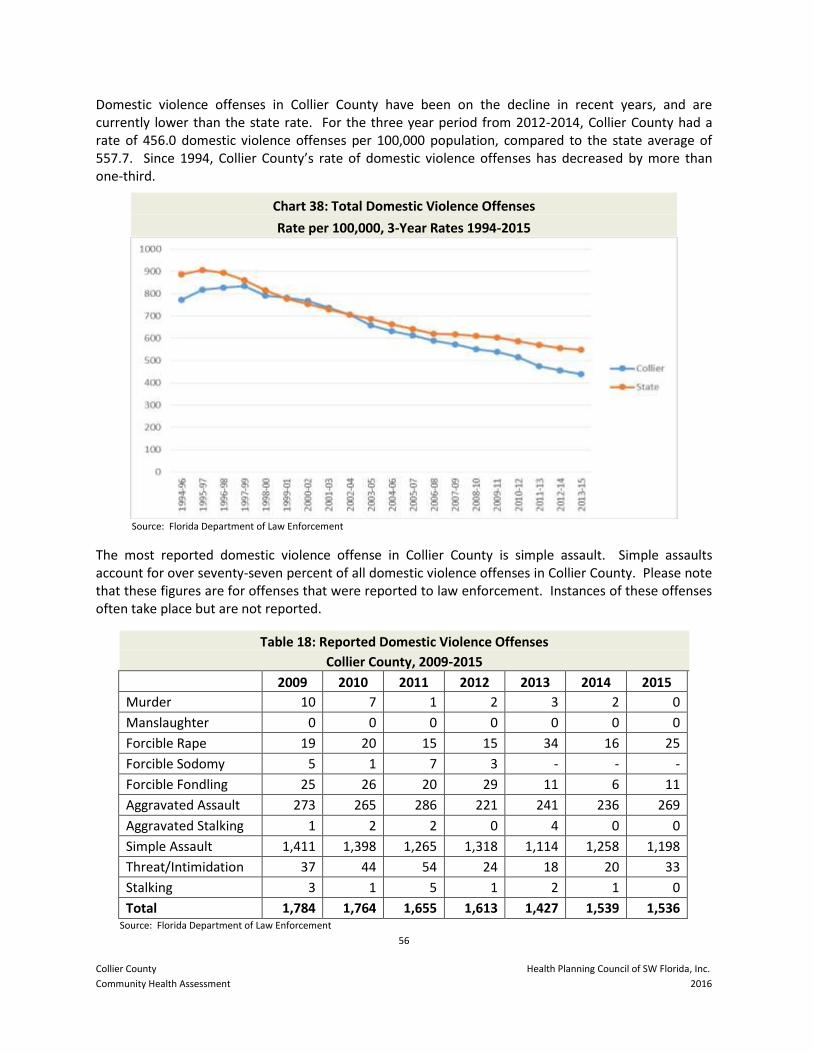
56
Collier County Health Planning Council of SW Florida, Inc.
Community Health Assessment 2016
Domestic violence offenses in Collier County have been on the decline in recent years, and are currently lower than the state rate. For the three year period from 2012-2014, Collier County had a rate of 456.0 domestic violence offenses per 100,000 population, compared to the state average of 557.7. Since 1994, Collier County’s rate of domestic violence offenses has decreased by more than one-third.
Chart 38: Total Domestic Violence Offenses
Rate per 100,000, 3-Year Rates 1994-2015
Source: Florida Department of Law Enforcement
The most reported domestic violence offense in Collier County is simple assault. Simple assaults account for over seventy-seven percent of all domestic violence offenses in Collier County. Please note that these figures are for offenses that were reported to law enforcement. Instances of these offenses often take place but are not reported.
Table 18: Reported Domestic Violence Offenses
Collier County, 2009-2015
2009 2010 2011 2012 2013 2014 2015
Murder 10 7 1 2 3 2 0
Manslaughter 0 0 0 0 0 0 0
Forcible Rape 19 20 15 15 34 16 25
Forcible Sodomy 5 1 7 3 - - -
Forcible Fondling 25 26 20 29 11 6 11
Aggravated Assault 273 265 286 221 241 236 269
Aggravated Stalking 1 2 2 0 4 0 0
Simple Assault 1,411 1,398 1,265 1,318 1,114 1,258 1,198
Threat/Intimidation 37 44 54 24 18 20 33
Stalking 3 1 5 1 2 1 0
Total 1,784 1,764 1,655 1,613 1,427 1,539 1,536 Source: Florida Department of Law Enforcement
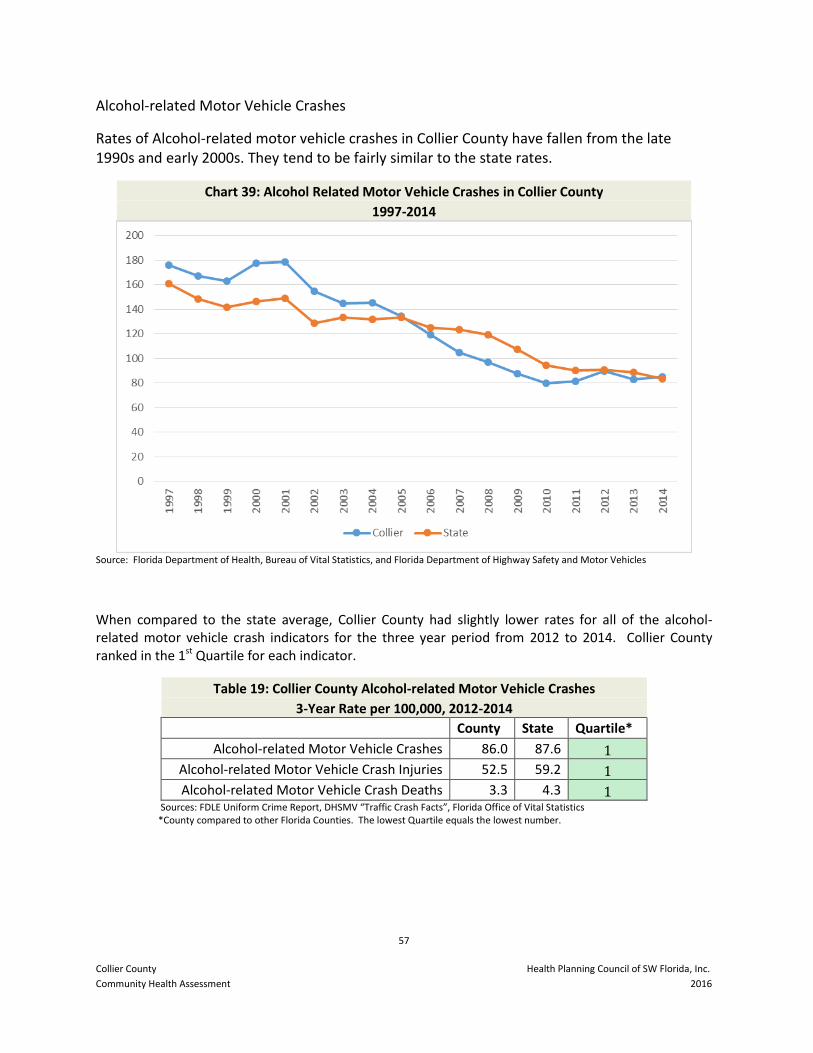
57
Collier County Health Planning Council of SW Florida, Inc.
Community Health Assessment 2016
Alcohol-related Motor Vehicle Crashes
Rates of Alcohol-related motor vehicle crashes in Collier County have fallen from the late 1990s and early 2000s. They tend to be fairly similar to the state rates.
Chart 39: Alcohol Related Motor Vehicle Crashes in Collier County
1997-2014
Source: Florida Department of Health, Bureau of Vital Statistics, and Florida Department of Highway Safety and Motor Vehicles
When compared to the state average, Collier County had slightly lower rates for all of the alcohol-related motor vehicle crash indicators for the three year period from 2012 to 2014. Collier County ranked in the 1st Quartile for each indicator.
Table 19: Collier County Alcohol-related Motor Vehicle Crashes
3-Year Rate per 100,000, 2012-2014
County State Quartile*
Alcohol-related Motor Vehicle Crashes 86.0 87.6 1
Alcohol-related Motor Vehicle Crash Injuries 52.5 59.2 1
Alcohol-related Motor Vehicle Crash Deaths 3.3 4.3 1 Sources: FDLE Uniform Crime Report, DHSMV “Traffic Crash Facts”, Florida Office of Vital Statistics *County compared to other Florida Counties. The lowest Quartile equals the lowest number.
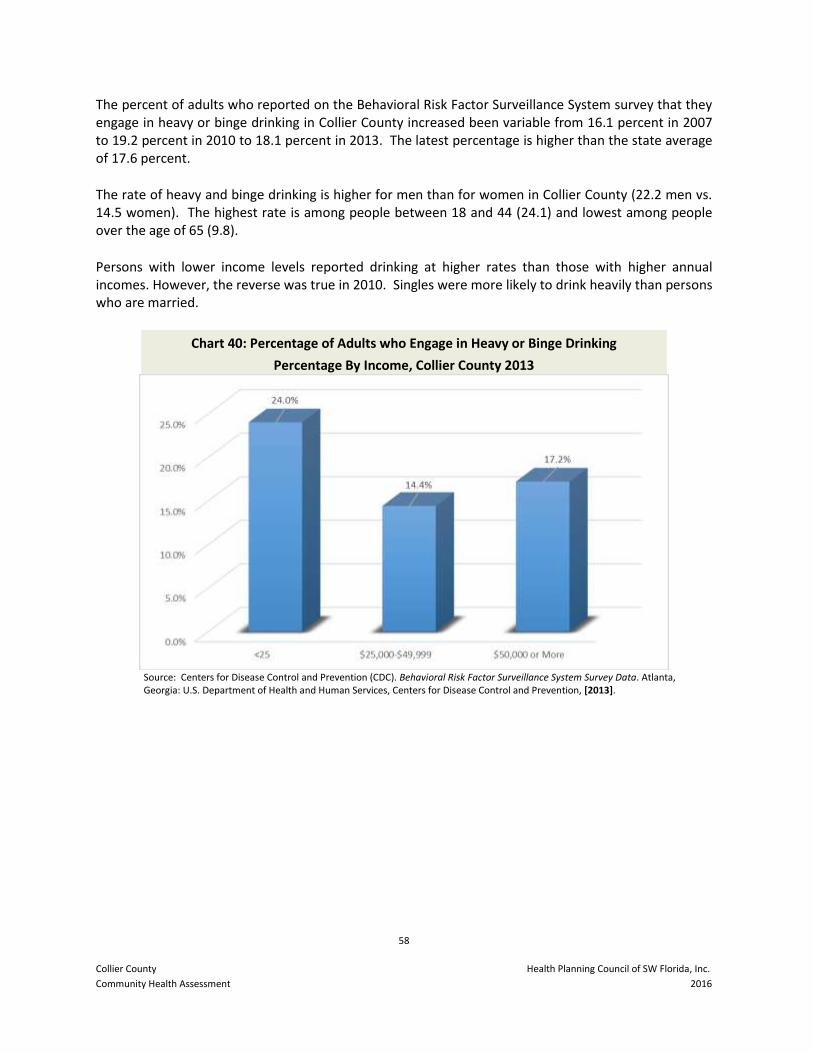
58
Collier County Health Planning Council of SW Florida, Inc.
Community Health Assessment 2016
The percent of adults who reported on the Behavioral Risk Factor Surveillance System survey that they engage in heavy or binge drinking in Collier County increased been variable from 16.1 percent in 2007 to 19.2 percent in 2010 to 18.1 percent in 2013. The latest percentage is higher than the state average of 17.6 percent.
The rate of heavy and binge drinking is higher for men than for women in Collier County (22.2 men vs. 14.5 women). The highest rate is among people between 18 and 44 (24.1) and lowest among people over the age of 65 (9.8).
Persons with lower income levels reported drinking at higher rates than those with higher annual incomes. However, the reverse was true in 2010. Singles were more likely to drink heavily than persons who are married.
Chart 40: Percentage of Adults who Engage in Heavy or Binge Drinking
Percentage By Income, Collier County 2013
Source: Centers for Disease Control and Prevention (CDC). Behavioral Risk Factor Surveillance System Survey Data. Atlanta, Georgia: U.S. Department of Health and Human Services, Centers for Disease Control and Prevention, [2013].
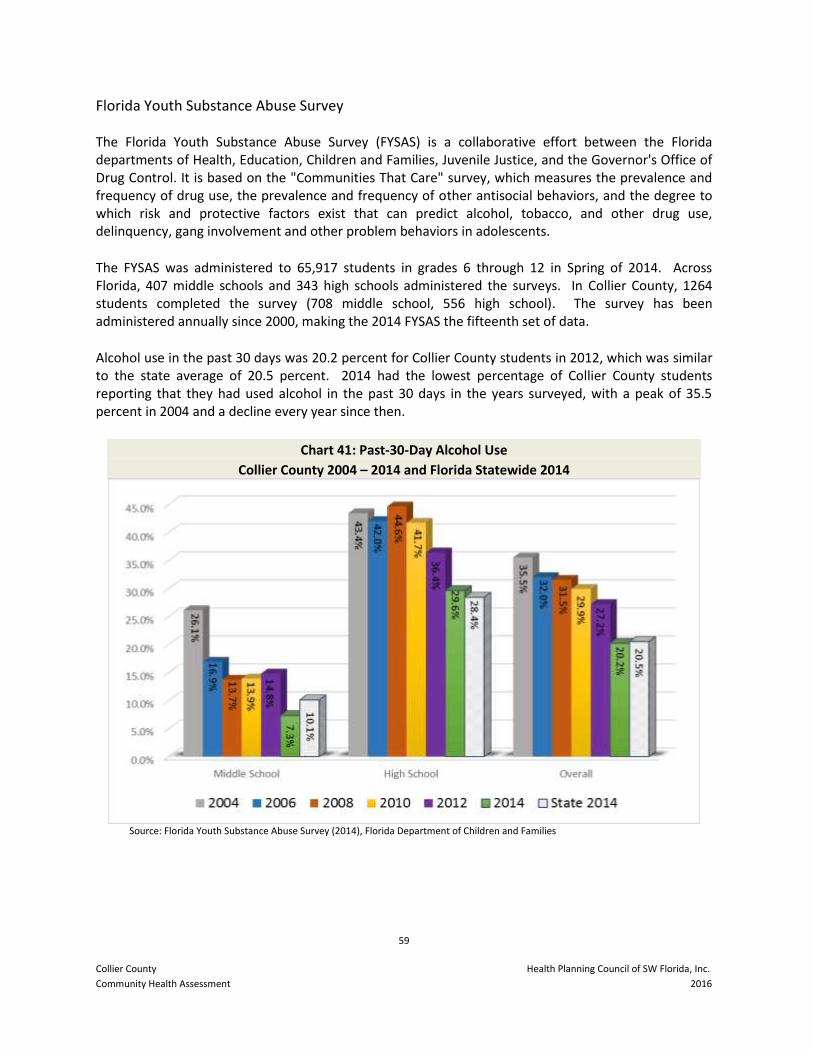
59
Collier County Health Planning Council of SW Florida, Inc.
Community Health Assessment 2016
Florida Youth Substance Abuse Survey The Florida Youth Substance Abuse Survey (FYSAS) is a collaborative effort between the Florida departments of Health, Education, Children and Families, Juvenile Justice, and the Governor's Office of Drug Control. It is based on the "Communities That Care" survey, which measures the prevalence and frequency of drug use, the prevalence and frequency of other antisocial behaviors, and the degree to which risk and protective factors exist that can predict alcohol, tobacco, and other drug use, delinquency, gang involvement and other problem behaviors in adolescents.
The FYSAS was administered to 65,917 students in grades 6 through 12 in Spring of 2014. Across Florida, 407 middle schools and 343 high schools administered the surveys. In Collier County, 1264 students completed the survey (708 middle school, 556 high school). The survey has been administered annually since 2000, making the 2014 FYSAS the fifteenth set of data.
Alcohol use in the past 30 days was 20.2 percent for Collier County students in 2012, which was similar to the state average of 20.5 percent. 2014 had the lowest percentage of Collier County students reporting that they had used alcohol in the past 30 days in the years surveyed, with a peak of 35.5 percent in 2004 and a decline every year since then.
Chart 41: Past-30-Day Alcohol Use
Collier County 2004 – 2014 and Florida Statewide 2014
Source: Florida Youth Substance Abuse Survey (2014), Florida Department of Children and Families
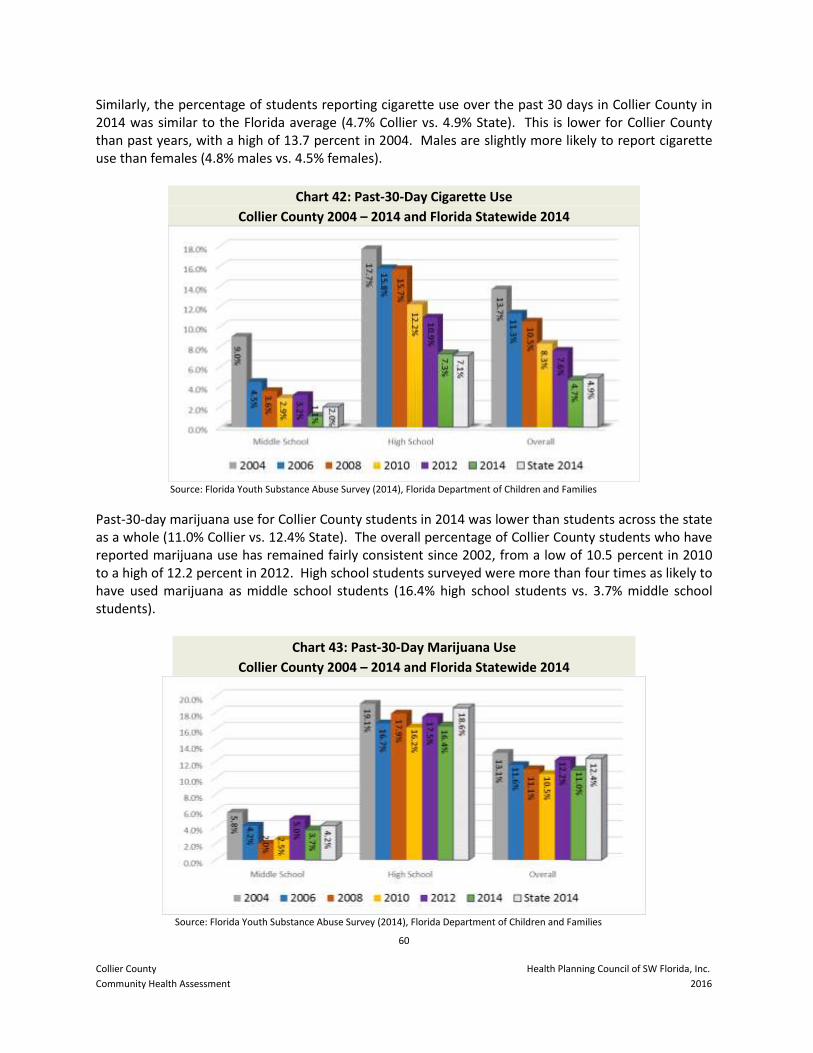
60
Collier County Health Planning Council of SW Florida, Inc.
Community Health Assessment 2016
Similarly, the percentage of students reporting cigarette use over the past 30 days in Collier County in 2014 was similar to the Florida average (4.7% Collier vs. 4.9% State). This is lower for Collier County than past years, with a high of 13.7 percent in 2004. Males are slightly more likely to report cigarette use than females (4.8% males vs. 4.5% females).
Chart 42: Past-30-Day Cigarette Use
Collier County 2004 – 2014 and Florida Statewide 2014
Source: Florida Youth Substance Abuse Survey (2014), Florida Department of Children and Families
Past-30-day marijuana use for Collier County students in 2014 was lower than students across the state as a whole (11.0% Collier vs. 12.4% State). The overall percentage of Collier County students who have reported marijuana use has remained fairly consistent since 2002, from a low of 10.5 percent in 2010 to a high of 12.2 percent in 2012. High school students surveyed were more than four times as likely to have used marijuana as middle school students (16.4% high school students vs. 3.7% middle school students).
Chart 43: Past-30-Day Marijuana Use
Collier County 2004 – 2014 and Florida Statewide 2014
Source: Florida Youth Substance Abuse Survey (2014), Florida Department of Children and Families
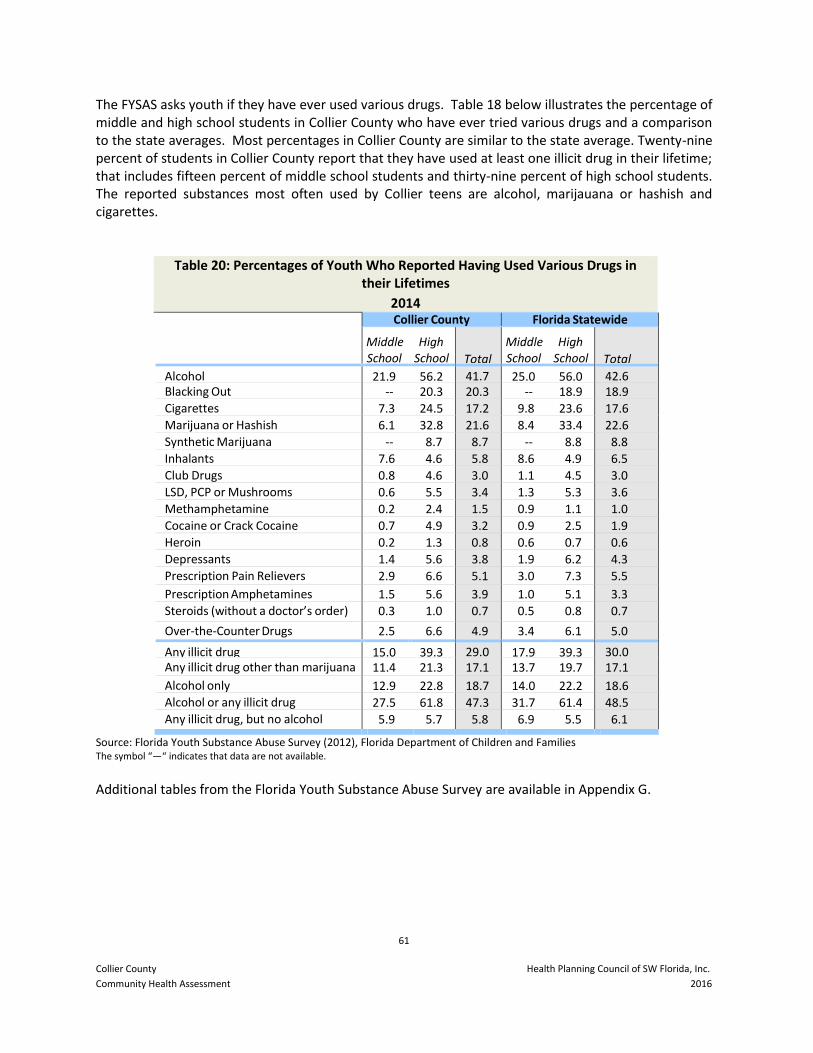
61
Collier County Health Planning Council of SW Florida, Inc.
Community Health Assessment 2016
The FYSAS asks youth if they have ever used various drugs. Table 18 below illustrates the percentage of middle and high school students in Collier County who have ever tried various drugs and a comparison to the state averages. Most percentages in Collier County are similar to the state average. Twenty-nine percent of students in Collier County report that they have used at least one illicit drug in their lifetime; that includes fifteen percent of middle school students and thirty-nine percent of high school students. The reported substances most often used by Collier teens are alcohol, marijauana or hashish and cigarettes.
Table 20: Percentages of Youth Who Reported Having Used Various Drugs in their Lifetimes
2014
Collier County Florida Statewide
Middle School
High School
Total
Middle School
High School
Total
Alcohol 21.9 56.2 41.7 25.0 56.0 42.6 Blacking Out -- 20.3 20.3 -- 18.9 18.9
Cigarettes 7.3 24.5 17.2 9.8 23.6 17.6
Marijuana or Hashish 6.1 32.8 21.6 8.4 33.4 22.6
Synthetic Marijuana -- 8.7 8.7 -- 8.8 8.8
Inhalants 7.6 4.6 5.8 8.6 4.9 6.5
Club Drugs 0.8 4.6 3.0 1.1 4.5 3.0
LSD, PCP or Mushrooms 0.6 5.5 3.4 1.3 5.3 3.6
Methamphetamine 0.2 2.4 1.5 0.9 1.1 1.0
Cocaine or Crack Cocaine 0.7 4.9 3.2 0.9 2.5 1.9
Heroin 0.2 1.3 0.8 0.6 0.7 0.6
Depressants 1.4 5.6 3.8 1.9 6.2 4.3
Prescription Pain Relievers 2.9 6.6 5.1 3.0 7.3 5.5
Prescription Amphetamines 1.5 5.6 3.9 1.0 5.1 3.3
Steroids (without a doctor’s order) 0.3 1.0 0.7 0.5 0.8 0.7
Over-the-Counter Drugs 2.5 6.6 4.9 3.4 6.1 5.0
Any illicit drug 15.0 39.3 29.0 17.9 39.3 30.0 Any illicit drug other than marijuana 11.4 21.3 17.1 13.7 19.7 17.1
Alcohol only 12.9 22.8 18.7 14.0 22.2 18.6 Alcohol or any illicit drug 27.5 61.8 47.3 31.7 61.4 48.5 Any illicit drug, but no alcohol 5.9 5.7 5.8 6.9 5.5 6.1
Source: Florida Youth Substance Abuse Survey (2012), Florida Department of Children and Families The symbol “—“ indicates that data are not available.
Additional tables from the Florida Youth Substance Abuse Survey are available in Appendix G.
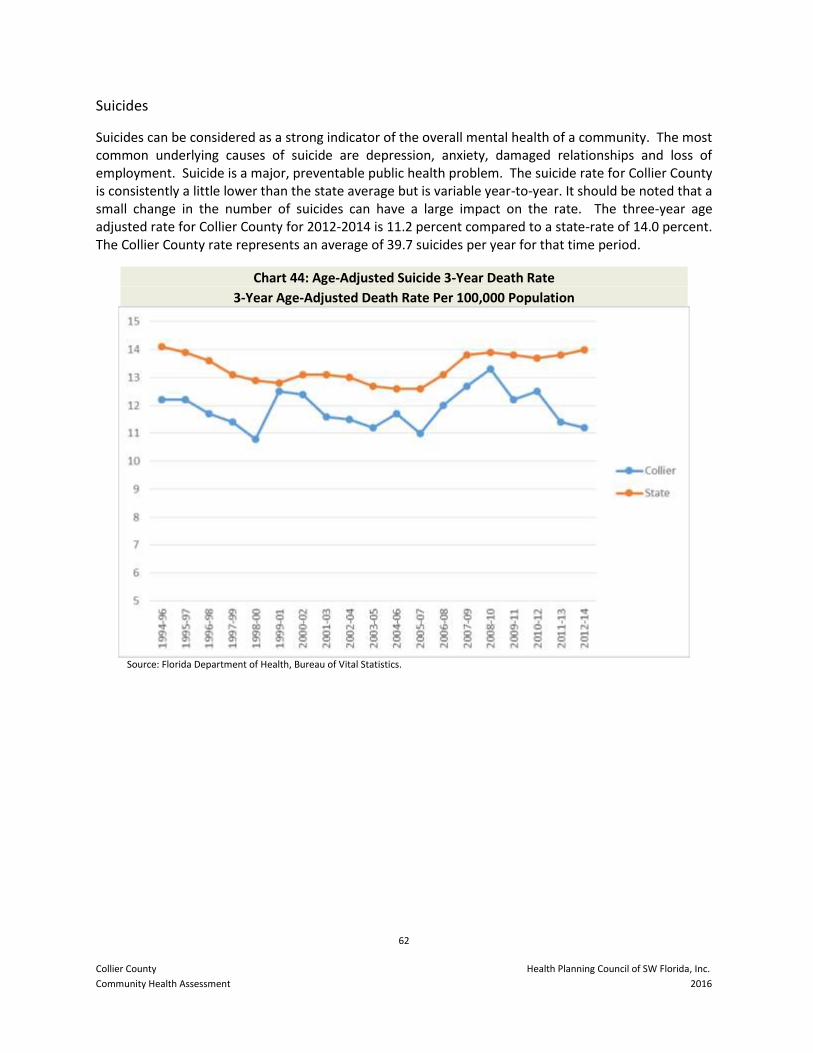
62
Collier County Health Planning Council of SW Florida, Inc.
Community Health Assessment 2016
Suicides
Suicides can be considered as a strong indicator of the overall mental health of a community. The most common underlying causes of suicide are depression, anxiety, damaged relationships and loss of employment. Suicide is a major, preventable public health problem. The suicide rate for Collier County is consistently a little lower than the state average but is variable year-to-year. It should be noted that a small change in the number of suicides can have a large impact on the rate. The three-year age adjusted rate for Collier County for 2012-2014 is 11.2 percent compared to a state-rate of 14.0 percent. The Collier County rate represents an average of 39.7 suicides per year for that time period.
Chart 44: Age-Adjusted Suicide 3-Year Death Rate
3-Year Age-Adjusted Death Rate Per 100,000 Population
Source: Florida Department of Health, Bureau of Vital Statistics.
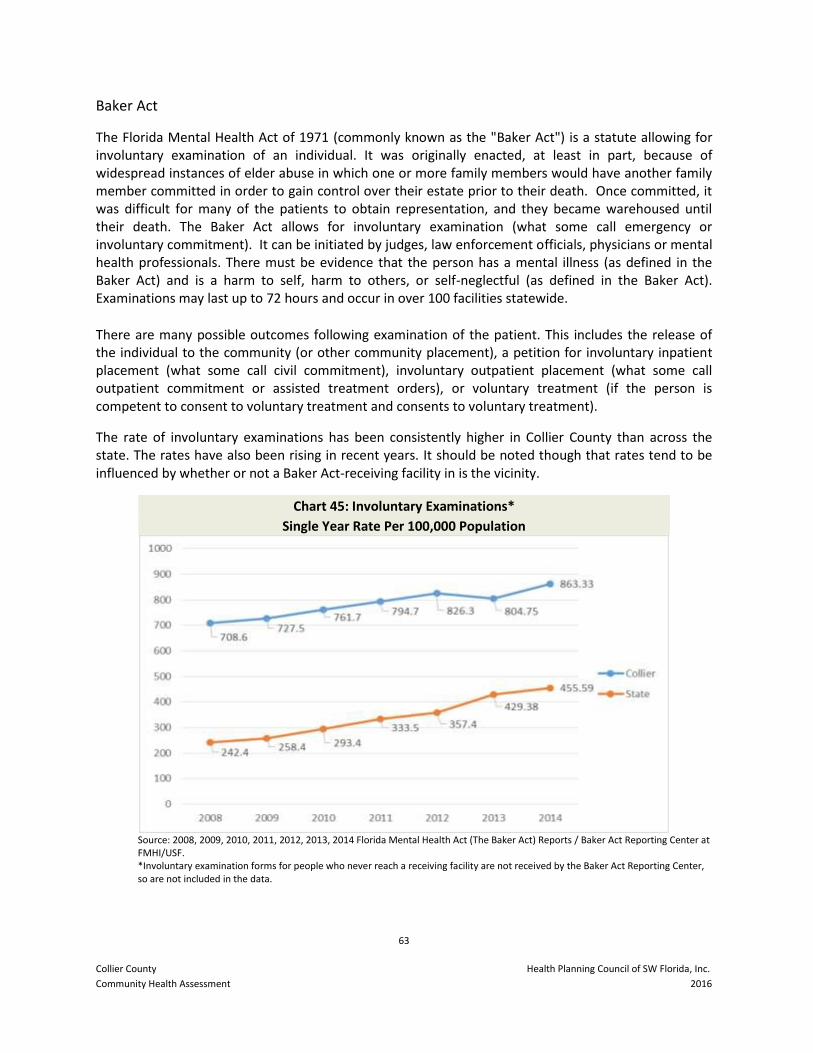
63
Collier County Health Planning Council of SW Florida, Inc.
Community Health Assessment 2016
Baker Act
The Florida Mental Health Act of 1971 (commonly known as the "Baker Act") is a statute allowing for involuntary examination of an individual. It was originally enacted, at least in part, because of widespread instances of elder abuse in which one or more family members would have another family member committed in order to gain control over their estate prior to their death. Once committed, it was difficult for many of the patients to obtain representation, and they became warehoused until their death. The Baker Act allows for involuntary examination (what some call emergency or involuntary commitment). It can be initiated by judges, law enforcement officials, physicians or mental health professionals. There must be evidence that the person has a mental illness (as defined in the Baker Act) and is a harm to self, harm to others, or self-neglectful (as defined in the Baker Act). Examinations may last up to 72 hours and occur in over 100 facilities statewide.
There are many possible outcomes following examination of the patient. This includes the release of the individual to the community (or other community placement), a petition for involuntary inpatient placement (what some call civil commitment), involuntary outpatient placement (what some call outpatient commitment or assisted treatment orders), or voluntary treatment (if the person is competent to consent to voluntary treatment and consents to voluntary treatment).
The rate of involuntary examinations has been consistently higher in Collier County than across the state. The rates have also been rising in recent years. It should be noted though that rates tend to be influenced by whether or not a Baker Act-receiving facility in is the vicinity.
Chart 45: Involuntary Examinations*
Single Year Rate Per 100,000 Population
Source: 2008, 2009, 2010, 2011, 2012, 2013, 2014 Florida Mental Health Act (The Baker Act) Reports / Baker Act Reporting Center at FMHI/USF. *Involuntary examination forms for people who never reach a receiving facility are not received by the Baker Act Reporting Center, so are not included in the data.
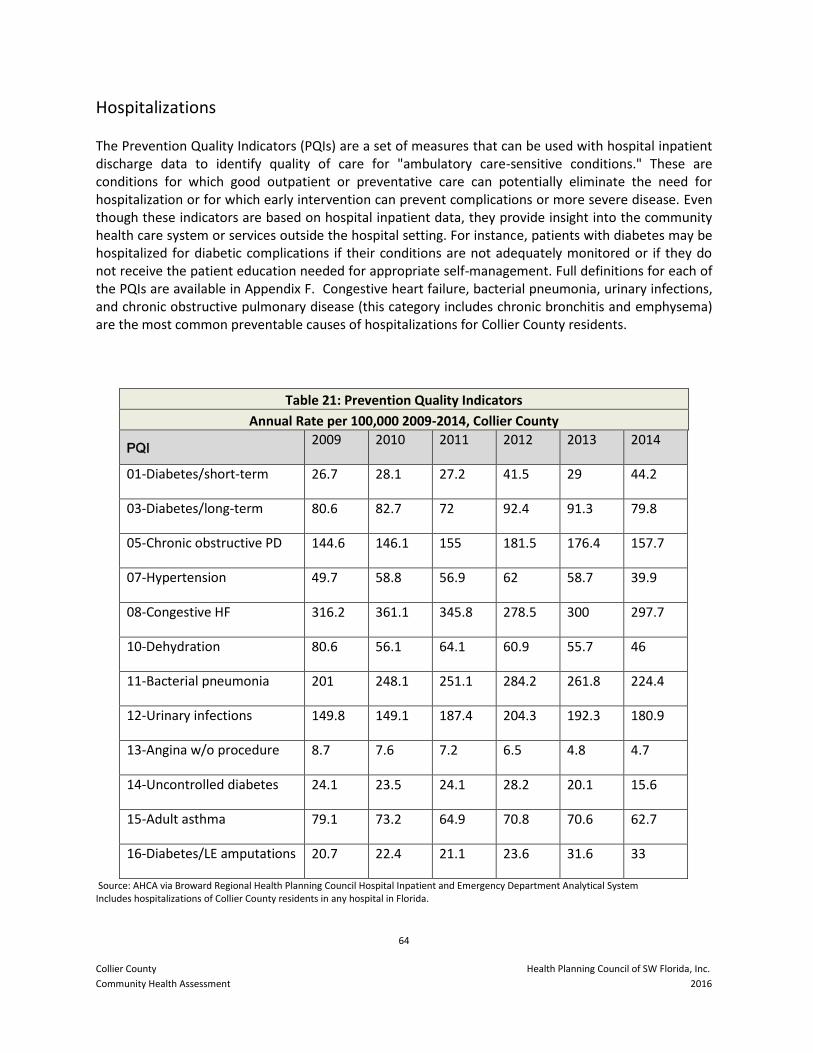
64
Collier County Health Planning Council of SW Florida, Inc.
Community Health Assessment 2016
Hospitalizations
The Prevention Quality Indicators (PQIs) are a set of measures that can be used with hospital inpatient discharge data to identify quality of care for "ambulatory care-sensitive conditions." These are conditions for which good outpatient or preventative care can potentially eliminate the need for hospitalization or for which early intervention can prevent complications or more severe disease. Even though these indicators are based on hospital inpatient data, they provide insight into the community health care system or services outside the hospital setting. For instance, patients with diabetes may be hospitalized for diabetic complications if their conditions are not adequately monitored or if they do not receive the patient education needed for appropriate self-management. Full definitions for each of the PQIs are available in Appendix F. Congestive heart failure, bacterial pneumonia, urinary infections, and chronic obstructive pulmonary disease (this category includes chronic bronchitis and emphysema) are the most common preventable causes of hospitalizations for Collier County residents.
Table 21: Prevention Quality Indicators
Annual Rate per 100,000 2009-2014, Collier County
PQI 2009 2010 2011 2012 2013 2014
01-Diabetes/short-term 26.7 28.1 27.2 41.5 29 44.2
03-Diabetes/long-term 80.6 82.7 72 92.4 91.3 79.8
05-Chronic obstructive PD 144.6 146.1 155 181.5 176.4 157.7
07-Hypertension 49.7 58.8 56.9 62 58.7 39.9
08-Congestive HF 316.2 361.1 345.8 278.5 300 297.7
10-Dehydration 80.6 56.1 64.1 60.9 55.7 46
11-Bacterial pneumonia 201 248.1 251.1 284.2 261.8 224.4
12-Urinary infections 149.8 149.1 187.4 204.3 192.3 180.9
13-Angina w/o procedure 8.7 7.6 7.2 6.5 4.8 4.7
14-Uncontrolled diabetes 24.1 23.5 24.1 28.2 20.1 15.6
15-Adult asthma 79.1 73.2 64.9 70.8 70.6 62.7
16-Diabetes/LE amputations 20.7 22.4 21.1 23.6 31.6 33
Source: AHCA via Broward Regional Health Planning Council Hospital Inpatient and Emergency Department Analytical System Includes hospitalizations of Collier County residents in any hospital in Florida.
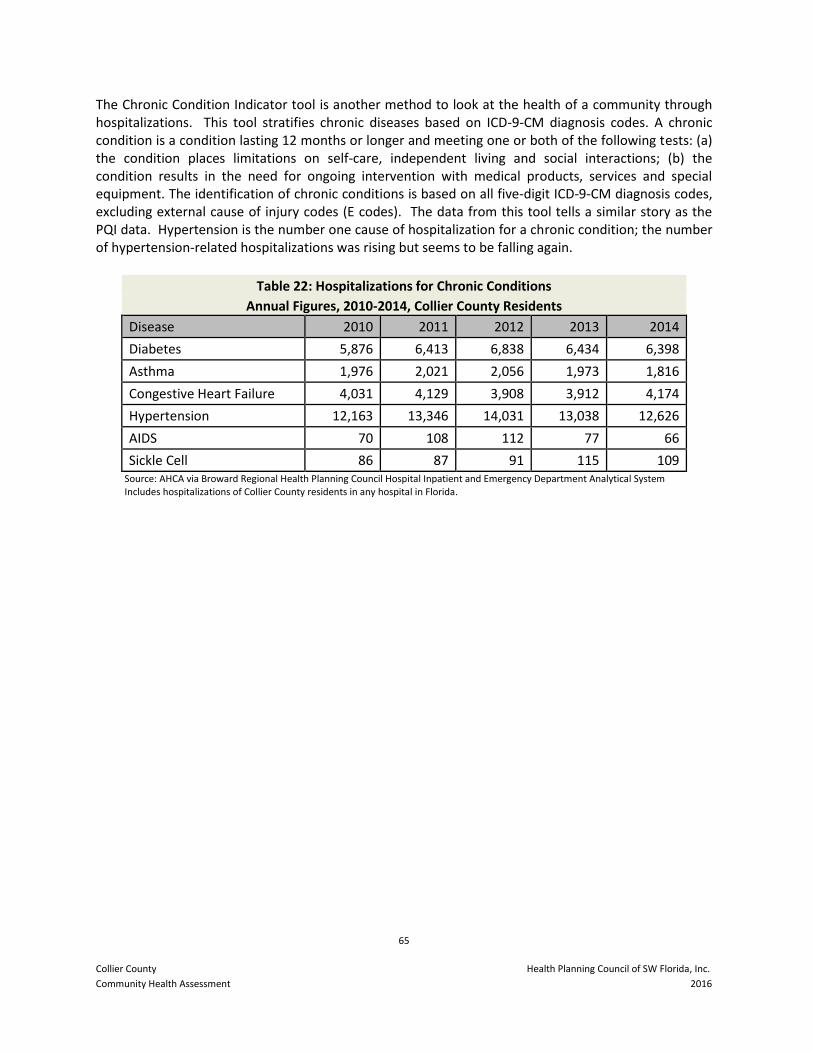
65
Collier County Health Planning Council of SW Florida, Inc.
Community Health Assessment 2016
The Chronic Condition Indicator tool is another method to look at the health of a community through hospitalizations. This tool stratifies chronic diseases based on ICD-9-CM diagnosis codes. A chronic condition is a condition lasting 12 months or longer and meeting one or both of the following tests: (a) the condition places limitations on self-care, independent living and social interactions; (b) the condition results in the need for ongoing intervention with medical products, services and special equipment. The identification of chronic conditions is based on all five-digit ICD-9-CM diagnosis codes, excluding external cause of injury codes (E codes). The data from this tool tells a similar story as the PQI data. Hypertension is the number one cause of hospitalization for a chronic condition; the number of hypertension-related hospitalizations was rising but seems to be falling again.
Table 22: Hospitalizations for Chronic Conditions
Annual Figures, 2010-2014, Collier County Residents
Disease 2010 2011 2012 2013 2014
Diabetes 5,876 6,413 6,838 6,434 6,398
Asthma 1,976 2,021 2,056 1,973 1,816
Congestive Heart Failure 4,031 4,129 3,908 3,912 4,174
Hypertension 12,163 13,346 14,031 13,038 12,626
AIDS 70 108 112 77 66
Sickle Cell 86 87 91 115 109 Source: AHCA via Broward Regional Health Planning Council Hospital Inpatient and Emergency Department Analytical System Includes hospitalizations of Collier County residents in any hospital in Florida.
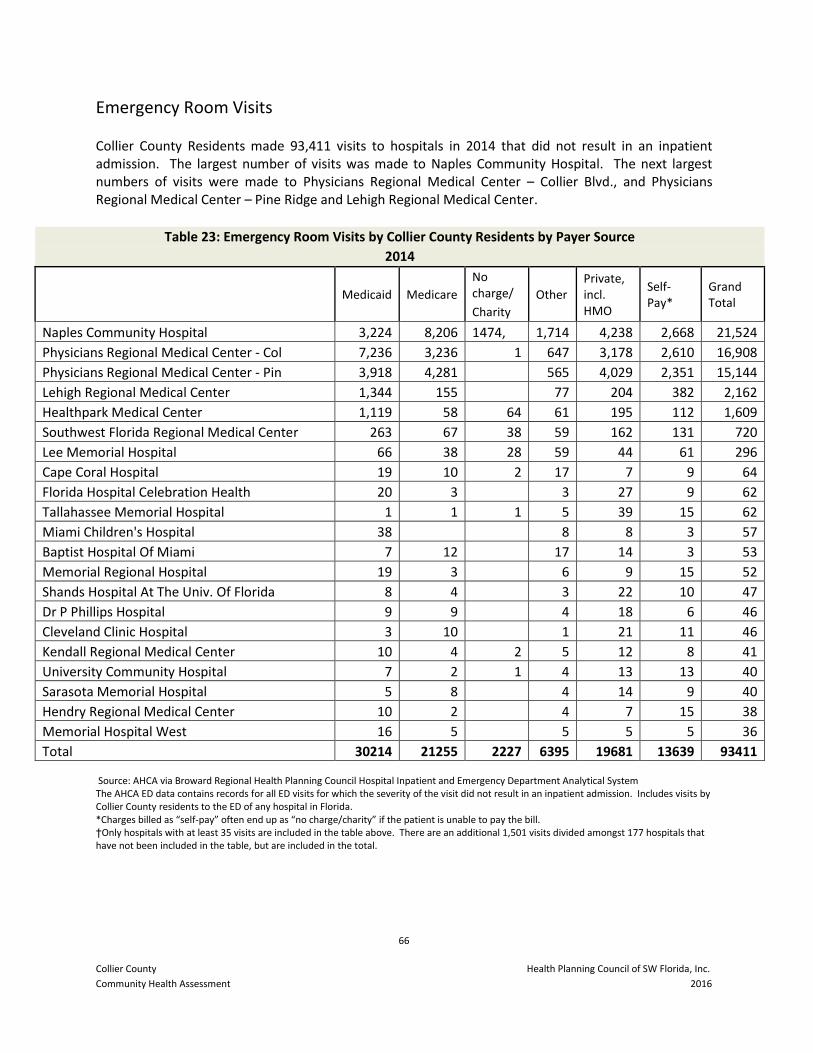
66
Collier County Health Planning Council of SW Florida, Inc.
Community Health Assessment 2016
Emergency Room Visits
Collier County Residents made 93,411 visits to hospitals in 2014 that did not result in an inpatient admission. The largest number of visits was made to Naples Community Hospital. The next largest numbers of visits were made to Physicians Regional Medical Center – Collier Blvd., and Physicians Regional Medical Center – Pine Ridge and Lehigh Regional Medical Center.
Table 23: Emergency Room Visits by Collier County Residents by Payer Source
2014
Medicaid Medicare
No charge/ Other
Private, incl. HMO
Self-Pay*
Grand Total
Charity
Naples Community Hospital 3,224 8,206 1474, 1,714 4,238 2,668 21,524
Physicians Regional Medical Center - Col 7,236 3,236 1 647 3,178 2,610 16,908
Physicians Regional Medical Center - Pin 3,918 4,281 565 4,029 2,351 15,144
Lehigh Regional Medical Center 1,344 155 77 204 382 2,162
Healthpark Medical Center 1,119 58 64 61 195 112 1,609
Southwest Florida Regional Medical Center 263 67 38 59 162 131 720
Lee Memorial Hospital 66 38 28 59 44 61 296
Cape Coral Hospital 19 10 2 17 7 9 64
Florida Hospital Celebration Health 20 3 3 27 9 62
Tallahassee Memorial Hospital 1 1 1 5 39 15 62
Miami Children's Hospital 38 8 8 3 57
Baptist Hospital Of Miami 7 12 17 14 3 53
Memorial Regional Hospital 19 3 6 9 15 52
Shands Hospital At The Univ. Of Florida 8 4 3 22 10 47
Dr P Phillips Hospital 9 9 4 18 6 46
Cleveland Clinic Hospital 3 10 1 21 11 46
Kendall Regional Medical Center 10 4 2 5 12 8 41
University Community Hospital 7 2 1 4 13 13 40
Sarasota Memorial Hospital 5 8 4 14 9 40
Hendry Regional Medical Center 10 2 4 7 15 38
Memorial Hospital West 16 5 5 5 5 36
Total 30214 21255 2227 6395 19681 13639 93411 Source: AHCA via Broward Regional Health Planning Council Hospital Inpatient and Emergency Department Analytical System The AHCA ED data contains records for all ED visits for which the severity of the visit did not result in an inpatient admission. Includes visits by Collier County residents to the ED of any hospital in Florida. *Charges billed as “self-pay” often end up as “no charge/charity” if the patient is unable to pay the bill. †Only hospitals with at least 35 visits are included in the table above. There are an additional 1,501 visits divided amongst 177 hospitals that have not been included in the table, but are included in the total.
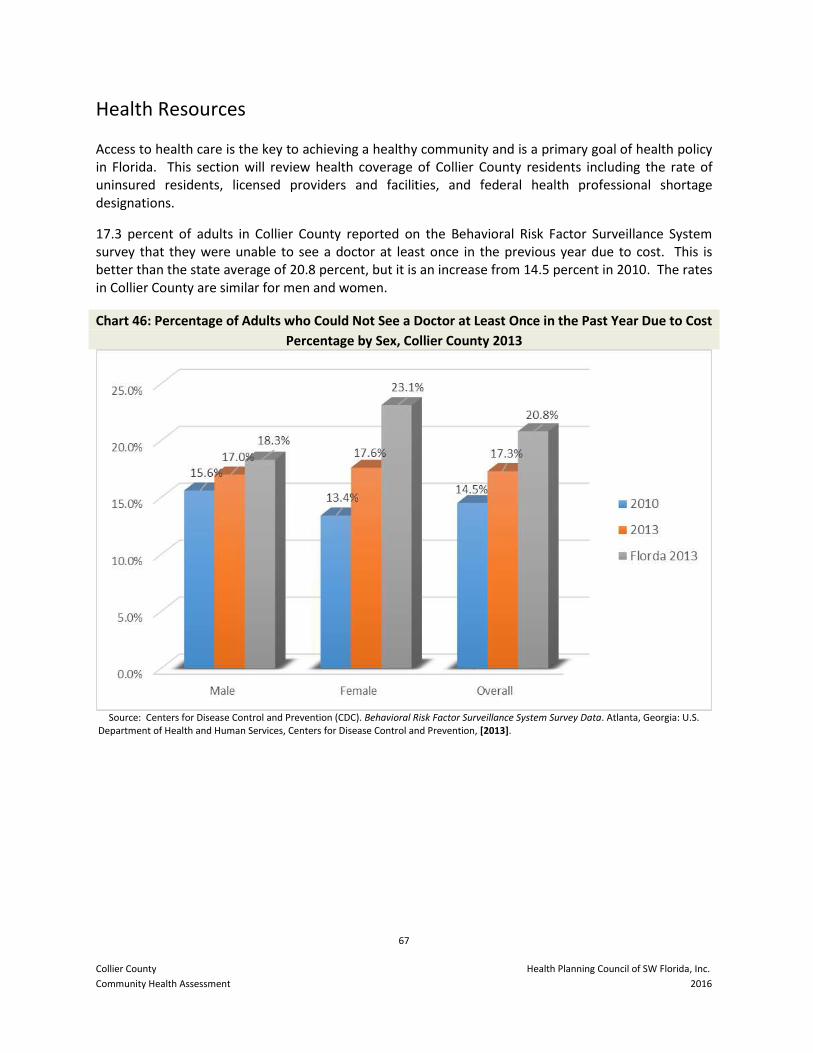
67
Collier County Health Planning Council of SW Florida, Inc.
Community Health Assessment 2016
Health Resources
Access to health care is the key to achieving a healthy community and is a primary goal of health policy in Florida. This section will review health coverage of Collier County residents including the rate of uninsured residents, licensed providers and facilities, and federal health professional shortage designations.
17.3 percent of adults in Collier County reported on the Behavioral Risk Factor Surveillance System survey that they were unable to see a doctor at least once in the previous year due to cost. This is better than the state average of 20.8 percent, but it is an increase from 14.5 percent in 2010. The rates in Collier County are similar for men and women.
Chart 46: Percentage of Adults who Could Not See a Doctor at Least Once in the Past Year Due to Cost
Percentage by Sex, Collier County 2013
Source: Centers for Disease Control and Prevention (CDC). Behavioral Risk Factor Surveillance System Survey Data. Atlanta, Georgia: U.S.
Department of Health and Human Services, Centers for Disease Control and Prevention, [2013].
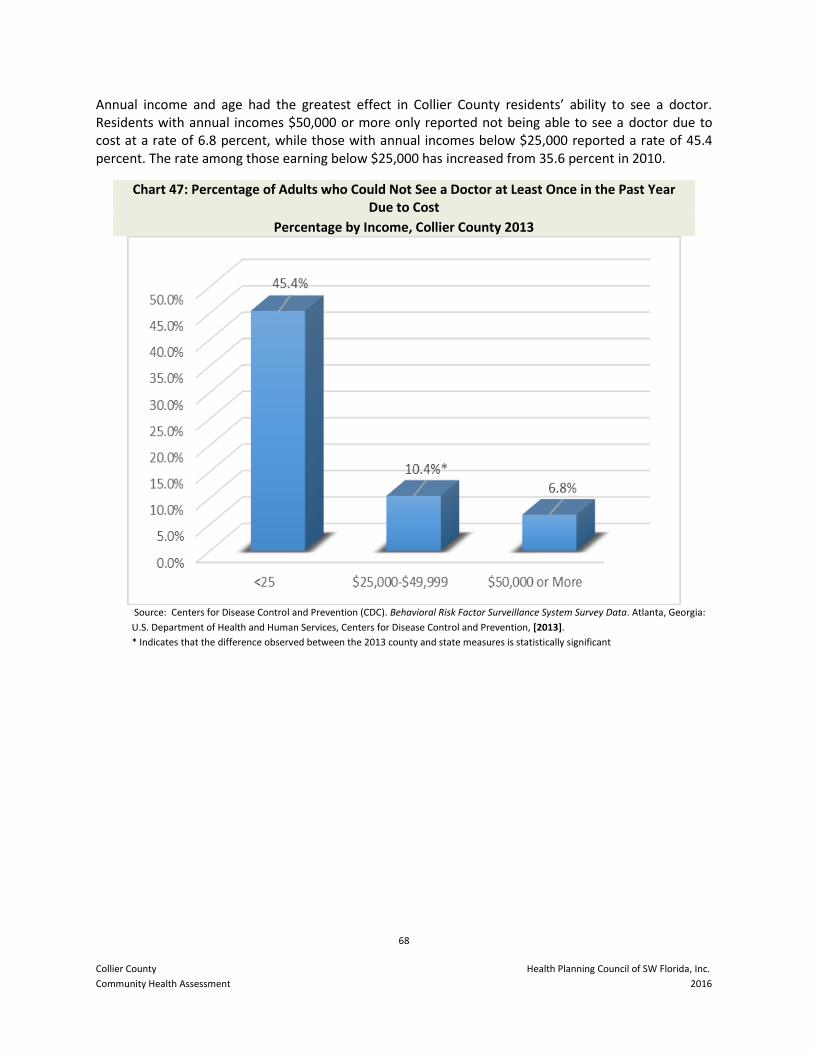
68
Collier County Health Planning Council of SW Florida, Inc.
Community Health Assessment 2016
Annual income and age had the greatest effect in Collier County residents’ ability to see a doctor. Residents with annual incomes $50,000 or more only reported not being able to see a doctor due to cost at a rate of 6.8 percent, while those with annual incomes below $25,000 reported a rate of 45.4 percent. The rate among those earning below $25,000 has increased from 35.6 percent in 2010.
Chart 47: Percentage of Adults who Could Not See a Doctor at Least Once in the Past Year Due to Cost
Percentage by Income, Collier County 2013
Source: Centers for Disease Control and Prevention (CDC). Behavioral Risk Factor Surveillance System Survey Data. Atlanta, Georgia:
U.S. Department of Health and Human Services, Centers for Disease Control and Prevention, [2013].
* Indicates that the difference observed between the 2013 county and state measures is statistically significant
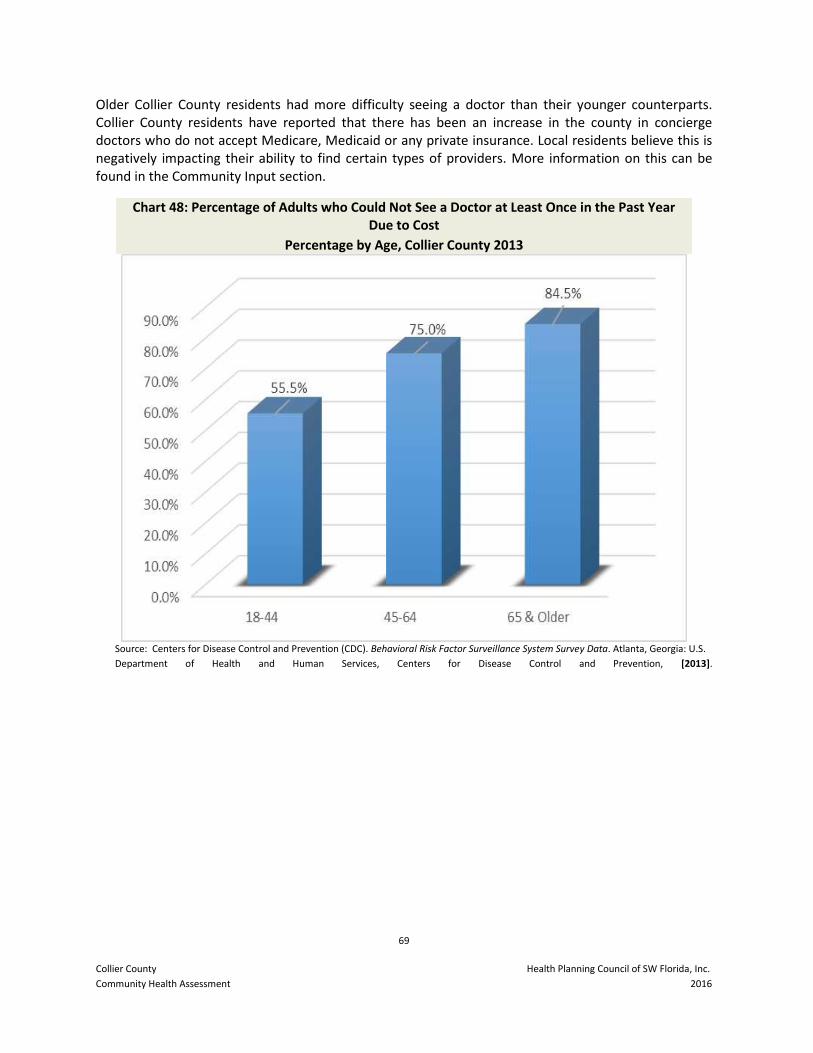
69
Collier County Health Planning Council of SW Florida, Inc.
Community Health Assessment 2016
Older Collier County residents had more difficulty seeing a doctor than their younger counterparts. Collier County residents have reported that there has been an increase in the county in concierge doctors who do not accept Medicare, Medicaid or any private insurance. Local residents believe this is negatively impacting their ability to find certain types of providers. More information on this can be found in the Community Input section.
Chart 48: Percentage of Adults who Could Not See a Doctor at Least Once in the Past Year Due to Cost
Percentage by Age, Collier County 2013
Source: Centers for Disease Control and Prevention (CDC). Behavioral Risk Factor Surveillance System Survey Data. Atlanta, Georgia: U.S.
Department of Health and Human Services, Centers for Disease Control and Prevention, [2013].
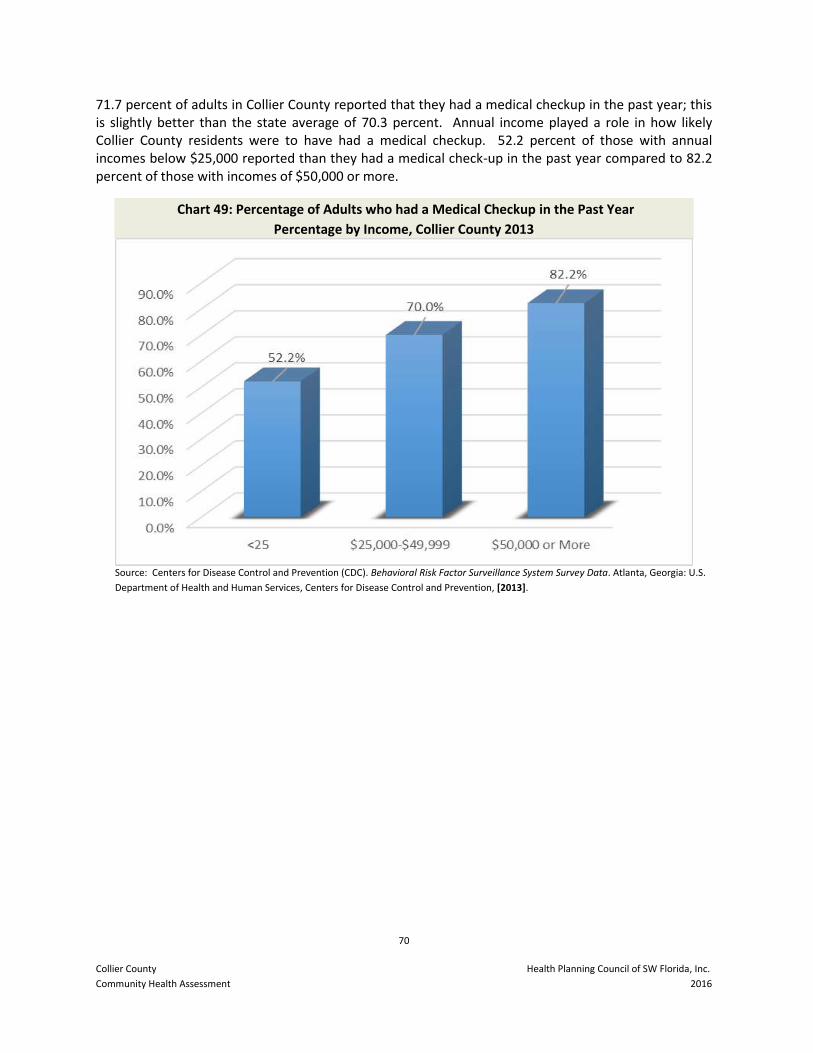
70
Collier County Health Planning Council of SW Florida, Inc.
Community Health Assessment 2016
71.7 percent of adults in Collier County reported that they had a medical checkup in the past year; this is slightly better than the state average of 70.3 percent. Annual income played a role in how likely Collier County residents were to have had a medical checkup. 52.2 percent of those with annual incomes below $25,000 reported than they had a medical check-up in the past year compared to 82.2 percent of those with incomes of $50,000 or more.
Chart 49: Percentage of Adults who had a Medical Checkup in the Past Year
Percentage by Income, Collier County 2013
Source: Centers for Disease Control and Prevention (CDC). Behavioral Risk Factor Surveillance System Survey Data. Atlanta, Georgia: U.S.
Department of Health and Human Services, Centers for Disease Control and Prevention, [2013].
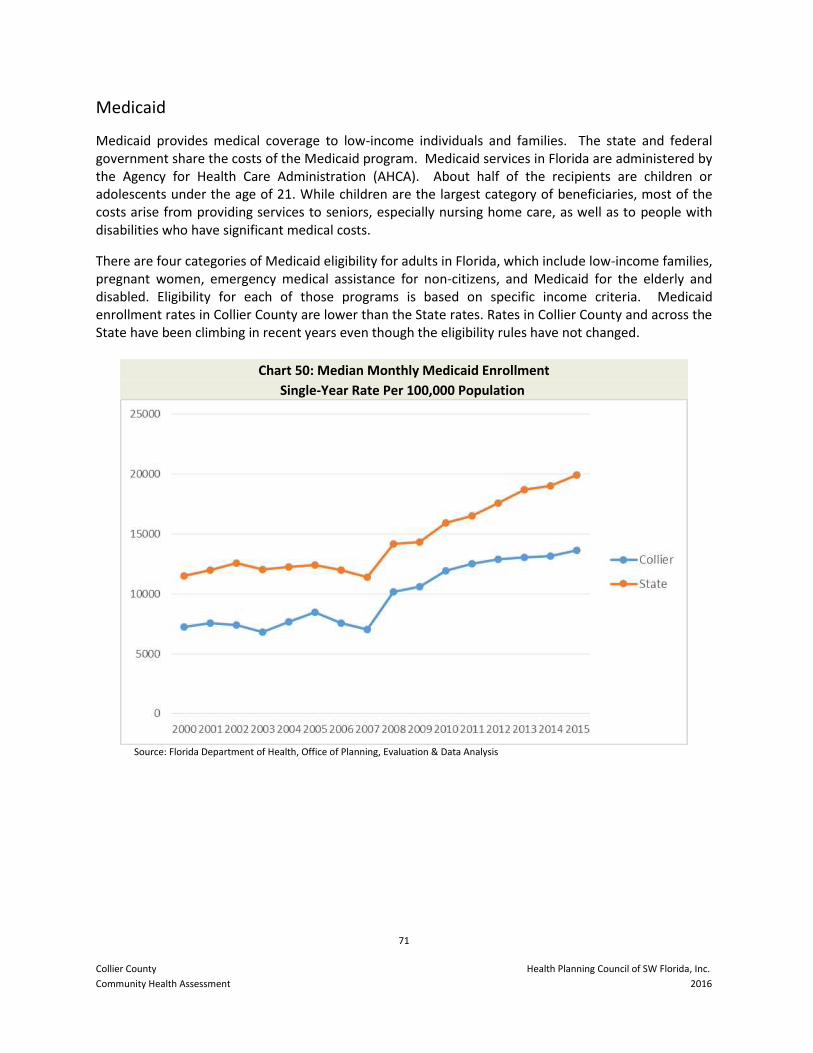
71
Collier County Health Planning Council of SW Florida, Inc.
Community Health Assessment 2016
Medicaid
Medicaid provides medical coverage to low-income individuals and families. The state and federal government share the costs of the Medicaid program. Medicaid services in Florida are administered by the Agency for Health Care Administration (AHCA). About half of the recipients are children or adolescents under the age of 21. While children are the largest category of beneficiaries, most of the costs arise from providing services to seniors, especially nursing home care, as well as to people with disabilities who have significant medical costs.
There are four categories of Medicaid eligibility for adults in Florida, which include low-income families, pregnant women, emergency medical assistance for non-citizens, and Medicaid for the elderly and disabled. Eligibility for each of those programs is based on specific income criteria. Medicaid enrollment rates in Collier County are lower than the State rates. Rates in Collier County and across the State have been climbing in recent years even though the eligibility rules have not changed.
Chart 50: Median Monthly Medicaid Enrollment
Single-Year Rate Per 100,000 Population
Source: Florida Department of Health, Office of Planning, Evaluation & Data Analysis
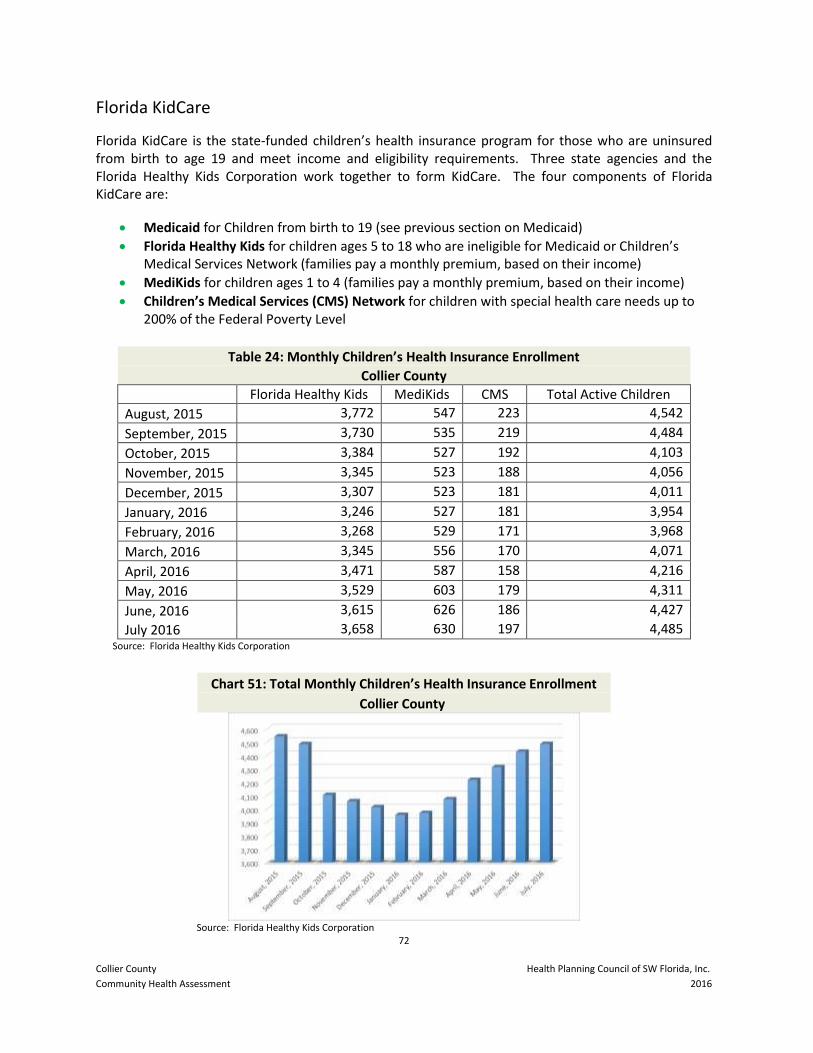
72
Collier County Health Planning Council of SW Florida, Inc.
Community Health Assessment 2016
Florida KidCare
Florida KidCare is the state-funded children’s health insurance program for those who are uninsured from birth to age 19 and meet income and eligibility requirements. Three state agencies and the Florida Healthy Kids Corporation work together to form KidCare. The four components of Florida KidCare are:
Medicaid for Children from birth to 19 (see previous section on Medicaid) Florida Healthy Kids for children ages 5 to 18 who are ineligible for Medicaid or Children’s
Medical Services Network (families pay a monthly premium, based on their income) MediKids for children ages 1 to 4 (families pay a monthly premium, based on their income) Children’s Medical Services (CMS) Network for children with special health care needs up to
200% of the Federal Poverty Level
Table 24: Monthly Children’s Health Insurance Enrollment
Collier County
Florida Healthy Kids MediKids CMS Total Active Children
August, 2015 3,772 547 223 4,542
September, 2015 3,730 535 219 4,484
October, 2015 3,384 527 192 4,103
November, 2015 3,345 523 188 4,056
December, 2015 3,307 523 181 4,011
January, 2016 3,246 527 181 3,954
February, 2016 3,268 529 171 3,968
March, 2016 3,345 556 170 4,071
April, 2016 3,471 587 158 4,216
May, 2016 3,529 603 179 4,311
June, 2016 3,615 626 186 4,427
July 2016 3,658 630 197 4,485 Source: Florida Healthy Kids Corporation
Chart 51: Total Monthly Children’s Health Insurance Enrollment
Collier County
Source: Florida Healthy Kids Corporation
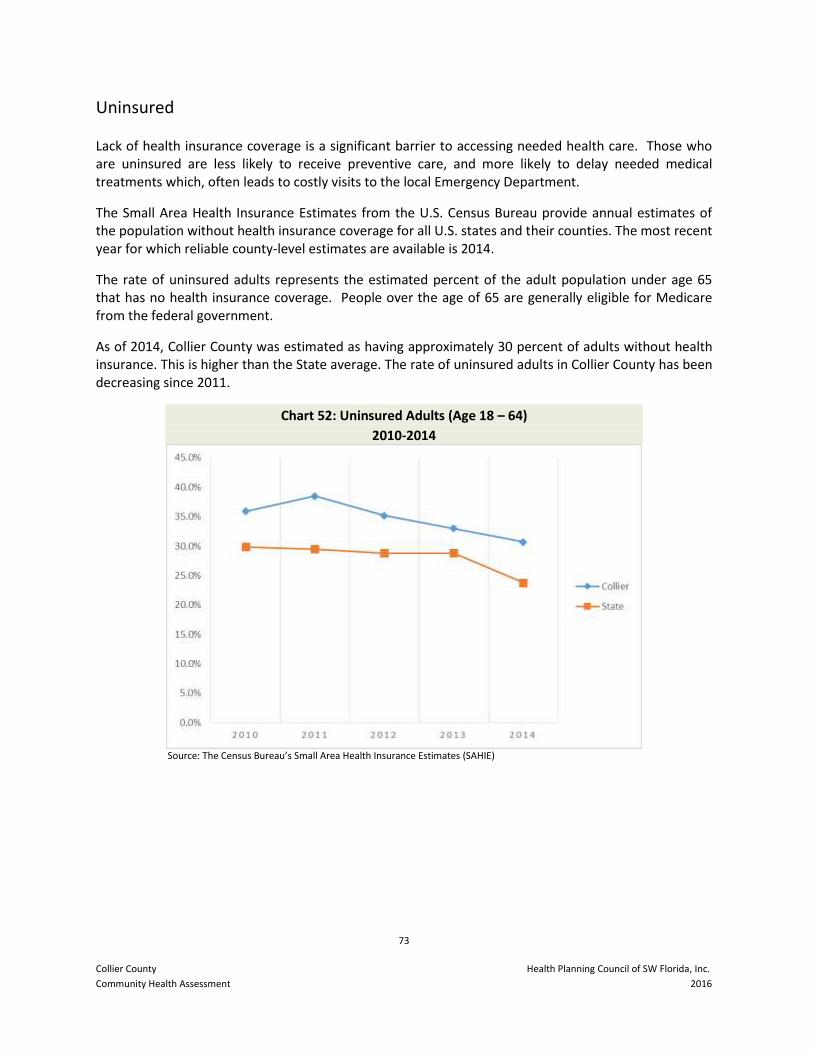
73
Collier County Health Planning Council of SW Florida, Inc.
Community Health Assessment 2016
Uninsured
Lack of health insurance coverage is a significant barrier to accessing needed health care. Those who are uninsured are less likely to receive preventive care, and more likely to delay needed medical treatments which, often leads to costly visits to the local Emergency Department.
The Small Area Health Insurance Estimates from the U.S. Census Bureau provide annual estimates of the population without health insurance coverage for all U.S. states and their counties. The most recent year for which reliable county-level estimates are available is 2014.
The rate of uninsured adults represents the estimated percent of the adult population under age 65 that has no health insurance coverage. People over the age of 65 are generally eligible for Medicare from the federal government.
As of 2014, Collier County was estimated as having approximately 30 percent of adults without health insurance. This is higher than the State average. The rate of uninsured adults in Collier County has been decreasing since 2011.
Chart 52: Uninsured Adults (Age 18 – 64)
2010-2014
Source: The Census Bureau’s Small Area Health Insurance Estimates (SAHIE)
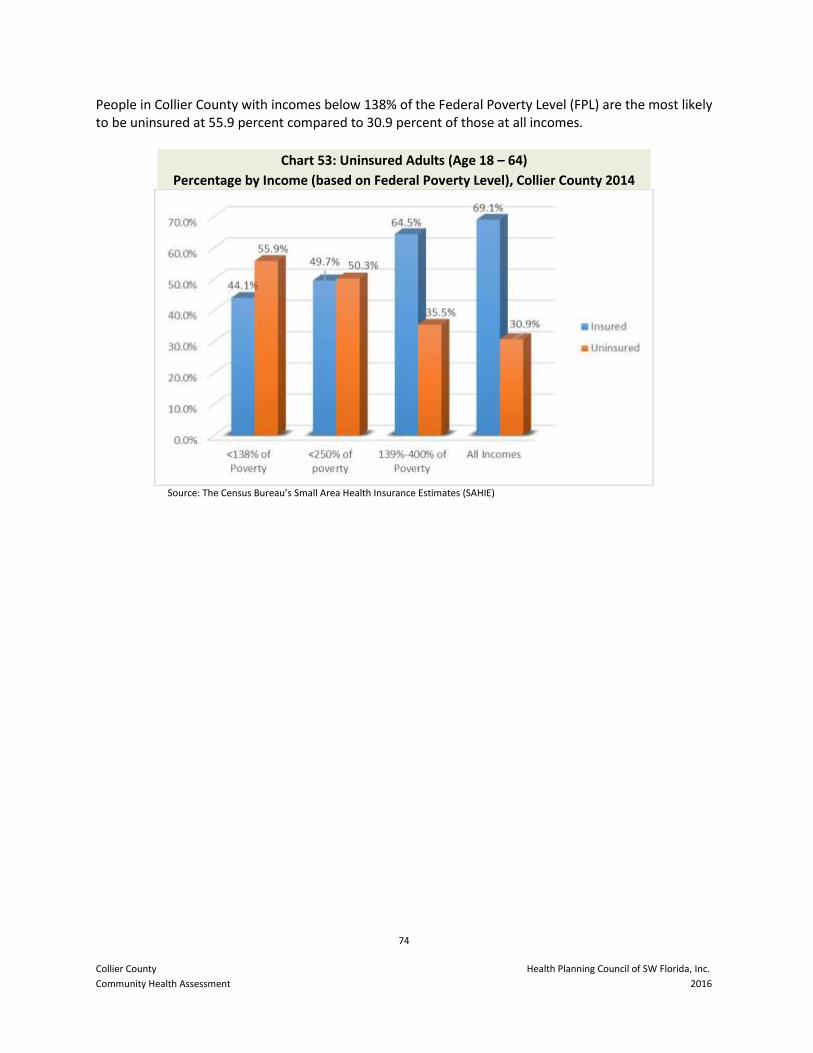
74
Collier County Health Planning Council of SW Florida, Inc.
Community Health Assessment 2016
People in Collier County with incomes below 138% of the Federal Poverty Level (FPL) are the most likely to be uninsured at 55.9 percent compared to 30.9 percent of those at all incomes.
Chart 53: Uninsured Adults (Age 18 – 64)
Percentage by Income (based on Federal Poverty Level), Collier County 2014
Source: The Census Bureau’s Small Area Health Insurance Estimates (SAHIE)
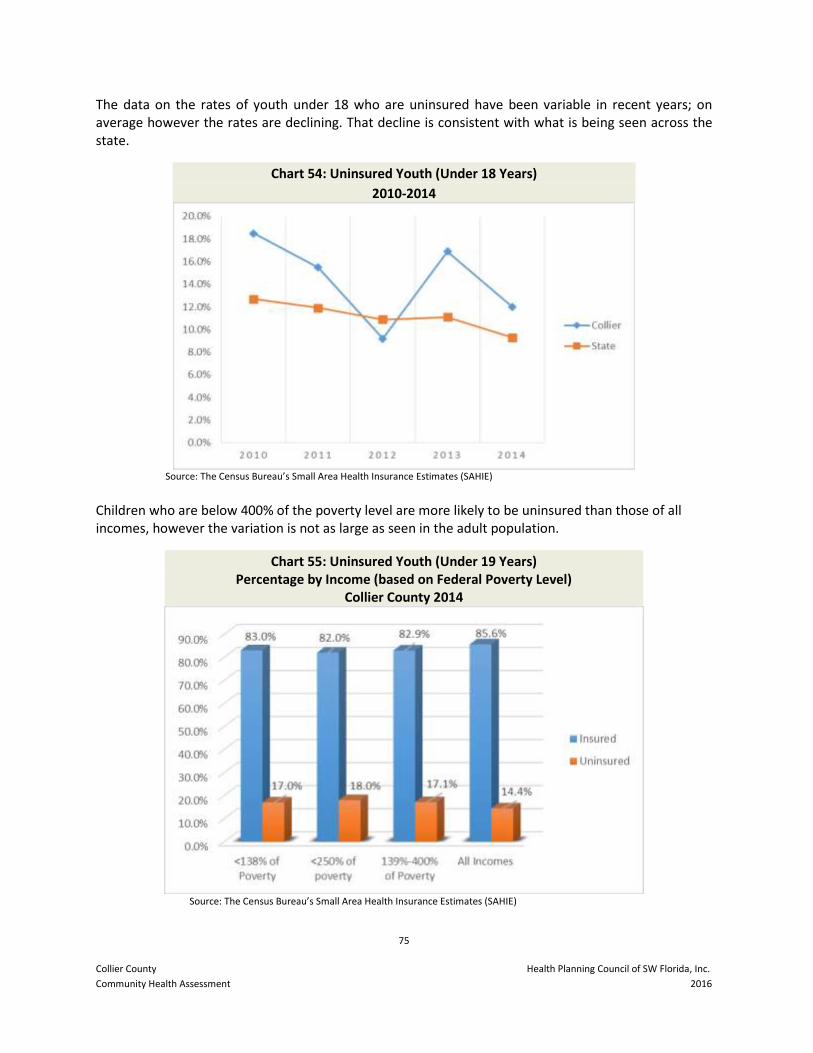
75
Collier County Health Planning Council of SW Florida, Inc.
Community Health Assessment 2016
The data on the rates of youth under 18 who are uninsured have been variable in recent years; on average however the rates are declining. That decline is consistent with what is being seen across the state.
Chart 54: Uninsured Youth (Under 18 Years)
2010-2014
Source: The Census Bureau’s Small Area Health Insurance Estimates (SAHIE)
Children who are below 400% of the poverty level are more likely to be uninsured than those of all incomes, however the variation is not as large as seen in the adult population.
Chart 55: Uninsured Youth (Under 19 Years) Percentage by Income (based on Federal Poverty Level)
Collier County 2014
Source: The Census Bureau’s Small Area Health Insurance Estimates (SAHIE)
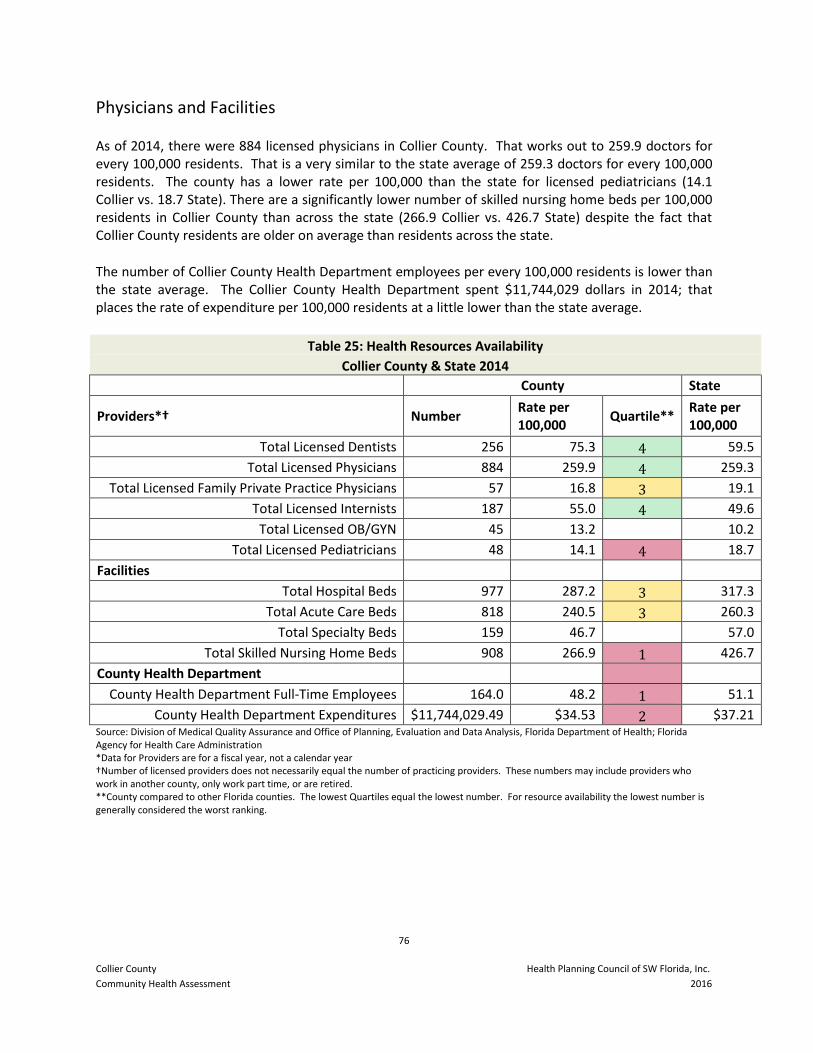
76
Collier County Health Planning Council of SW Florida, Inc.
Community Health Assessment 2016
Physicians and Facilities
As of 2014, there were 884 licensed physicians in Collier County. That works out to 259.9 doctors for every 100,000 residents. That is a very similar to the state average of 259.3 doctors for every 100,000 residents. The county has a lower rate per 100,000 than the state for licensed pediatricians (14.1 Collier vs. 18.7 State). There are a significantly lower number of skilled nursing home beds per 100,000 residents in Collier County than across the state (266.9 Collier vs. 426.7 State) despite the fact that Collier County residents are older on average than residents across the state.
The number of Collier County Health Department employees per every 100,000 residents is lower than the state average. The Collier County Health Department spent $11,744,029 dollars in 2014; that places the rate of expenditure per 100,000 residents at a little lower than the state average.
Table 25: Health Resources Availability
Collier County & State 2014
County State
Providers*† Number Rate per 100,000
Quartile** Rate per 100,000
Total Licensed Dentists 256 75.3 4 59.5
Total Licensed Physicians 884 259.9 4 259.3
Total Licensed Family Private Practice Physicians 57 16.8 3 19.1
Total Licensed Internists 187 55.0 4 49.6
Total Licensed OB/GYN 45 13.2
10.2
Total Licensed Pediatricians 48 14.1 4 18.7
Facilities
Total Hospital Beds 977 287.2 3 317.3
Total Acute Care Beds 818 240.5 3 260.3
Total Specialty Beds 159 46.7
57.0
Total Skilled Nursing Home Beds 908 266.9 1 426.7
County Health Department
County Health Department Full-Time Employees 164.0 48.2 1 51.1
County Health Department Expenditures $11,744,029.49 $34.53 2 $37.21 Source: Division of Medical Quality Assurance and Office of Planning, Evaluation and Data Analysis, Florida Department of Health; Florida Agency for Health Care Administration *Data for Providers are for a fiscal year, not a calendar year †Number of licensed providers does not necessarily equal the number of practicing providers. These numbers may include providers who work in another county, only work part time, or are retired. **County compared to other Florida counties. The lowest Quartiles equal the lowest number. For resource availability the lowest number is generally considered the worst ranking.
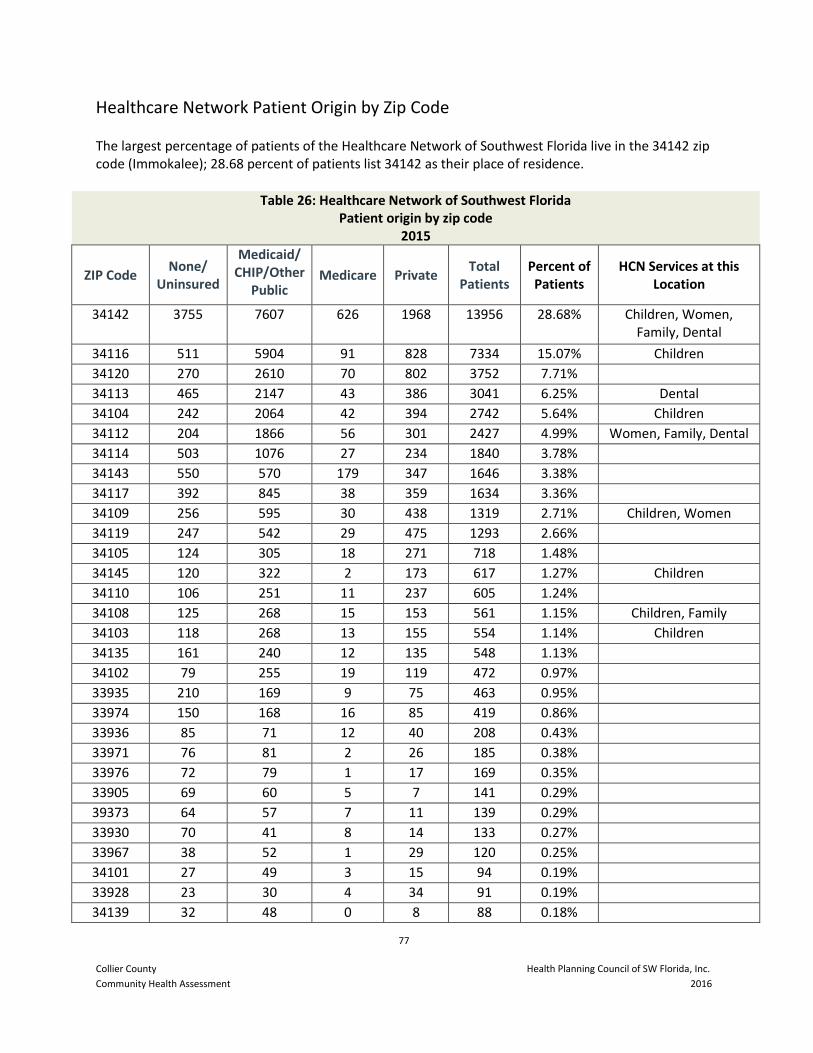
77
Collier County Health Planning Council of SW Florida, Inc.
Community Health Assessment 2016
Healthcare Network Patient Origin by Zip Code
The largest percentage of patients of the Healthcare Network of Southwest Florida live in the 34142 zip code (Immokalee); 28.68 percent of patients list 34142 as their place of residence.
Table 26: Healthcare Network of Southwest Florida Patient origin by zip code
2015
ZIP Code None/
Uninsured
Medicaid/ CHIP/Other
Public Medicare Private
Total Patients
Percent of Patients
HCN Services at this Location
34142 3755 7607 626 1968 13956 28.68% Children, Women, Family, Dental
34116 511 5904 91 828 7334 15.07% Children
34120 270 2610 70 802 3752 7.71%
34113 465 2147 43 386 3041 6.25% Dental
34104 242 2064 42 394 2742 5.64% Children
34112 204 1866 56 301 2427 4.99% Women, Family, Dental
34114 503 1076 27 234 1840 3.78%
34143 550 570 179 347 1646 3.38%
34117 392 845 38 359 1634 3.36%
34109 256 595 30 438 1319 2.71% Children, Women
34119 247 542 29 475 1293 2.66%
34105 124 305 18 271 718 1.48%
34145 120 322 2 173 617 1.27% Children
34110 106 251 11 237 605 1.24%
34108 125 268 15 153 561 1.15% Children, Family
34103 118 268 13 155 554 1.14% Children
34135 161 240 12 135 548 1.13%
34102 79 255 19 119 472 0.97%
33935 210 169 9 75 463 0.95%
33974 150 168 16 85 419 0.86%
33936 85 71 12 40 208 0.43%
33971 76 81 2 26 185 0.38%
33976 72 79 1 17 169 0.35%
33905 69 60 5 7 141 0.29%
39373 64 57 7 11 139 0.29%
33930 70 41 8 14 133 0.27%
33967 38 52 1 29 120 0.25%
34101 27 49 3 15 94 0.19%
33928 23 30 4 34 91 0.19%
34139 32 48 0 8 88 0.18%
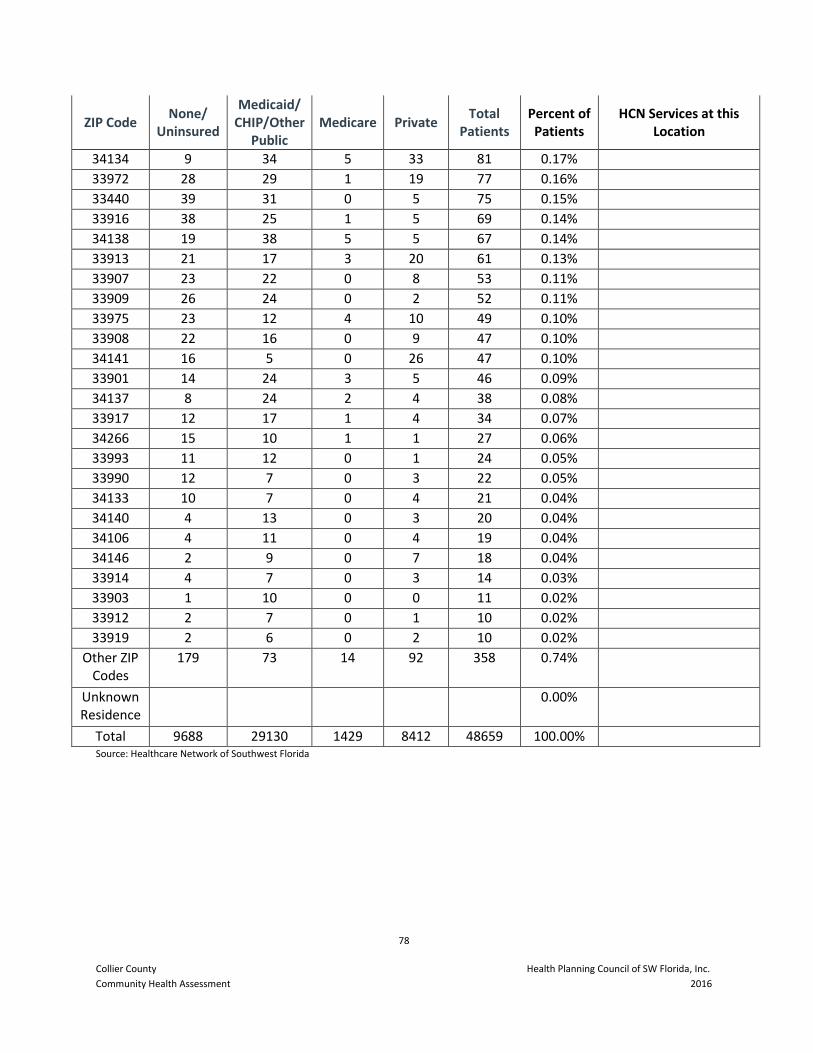
78
Collier County Health Planning Council of SW Florida, Inc.
Community Health Assessment 2016
ZIP Code None/
Uninsured
Medicaid/ CHIP/Other
Public Medicare Private
Total Patients
Percent of Patients
HCN Services at this Location
34134 9 34 5 33 81 0.17%
33972 28 29 1 19 77 0.16%
33440 39 31 0 5 75 0.15%
33916 38 25 1 5 69 0.14%
34138 19 38 5 5 67 0.14%
33913 21 17 3 20 61 0.13%
33907 23 22 0 8 53 0.11%
33909 26 24 0 2 52 0.11%
33975 23 12 4 10 49 0.10%
33908 22 16 0 9 47 0.10%
34141 16 5 0 26 47 0.10%
33901 14 24 3 5 46 0.09%
34137 8 24 2 4 38 0.08%
33917 12 17 1 4 34 0.07%
34266 15 10 1 1 27 0.06%
33993 11 12 0 1 24 0.05%
33990 12 7 0 3 22 0.05%
34133 10 7 0 4 21 0.04%
34140 4 13 0 3 20 0.04%
34106 4 11 0 4 19 0.04%
34146 2 9 0 7 18 0.04%
33914 4 7 0 3 14 0.03%
33903 1 10 0 0 11 0.02%
33912 2 7 0 1 10 0.02%
33919 2 6 0 2 10 0.02%
Other ZIP Codes
179 73 14 92 358 0.74%
Unknown Residence
0.00%
Total 9688 29130 1429 8412 48659 100.00% Source: Healthcare Network of Southwest Florida
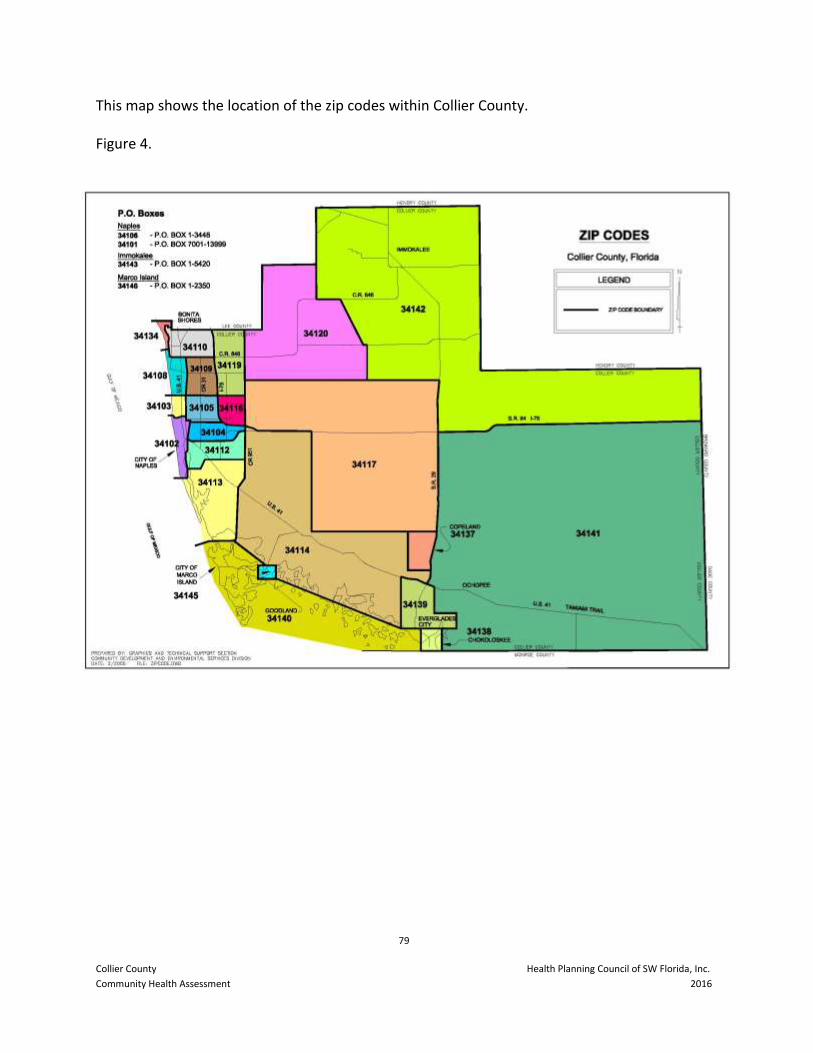
79
Collier County Health Planning Council of SW Florida, Inc.
Community Health Assessment 2016
This map shows the location of the zip codes within Collier County.
Figure 4.
80
Collier County Health Planning Council of SW Florida, Inc.
Community Health Assessment 2016
Federal Health Professional Shortage Designations
There are two types of health professional shortage designations: Health Professional Shortage Areas (HPSAs) and Medically Underserved Areas or Populations (MUAs/MUPs). Both designations consider primary care physician-to-population ratios, other high-need indicators (poverty levels, percent of the population that is elderly, infant death rate and rate of low birth weight), and barriers to access care. Designations are required for placement of health professionals under the National Health Service Corps and waiver programs for foreign physicians. Designations are also necessary for the location of community and migrant health centers and rural health clinics, programs that provide health care to underserved populations.
Medically Underserved Areas or Populations (MUAs/MUPs) are a measure of medical under service as defined by the U.S. Department of Health and Human Services. These designations determine the Index of Medical Under service (IMU) using the following variables: (1) percent of the population below 100 percent of the Federal Poverty Level, (2) percent of the population over age 65, (3) infant mortality rate (5 year average) and (4) population-to-physician ratio.
The low income/migrant farmworker population in Collier County has been designated as Medically Underserved Population. Any population with a score of 62 or lower on the Index of Medical Underservice is considered medically underserved. The areas with the lowest numbers are those that are determined to have the most need. The low income/migrant farmworker population in Collier County scored a 57.1.
Health Professional Shortage Areas (HPSAs) are defined in Section 332 of the Public Health Service Act, 42 U.S.C. 254e to include: (1) urban and rural geographic areas, (2) population groups, and (3) facilities with shortages of health professionals. Federal designation as a HPSA documents a shortage of health care providers (primary care, dental or mental health) as well as the existence of barriers to accessing care including lack of public transportation, travel time and distance to the next source of undesignated care and high poverty.
A geographic area will be designated as having a shortage of primary medical care professionals if the following three criteria are met:
1. The area is a rational area for the delivery of primary medical care services. 2. One of the following conditions prevails within the area:
(a) The area has a population to full-time-equivalent primary care physician ratio of at least 3,500:1. (b) The area has a population to full-time-equivalent primary care physician ratio of less than 3,500:1 but greater than 3,000:1 and has unusually high needs for primary care services or insufficient capacity of existing primary care providers.
3. Primary medical care professionals in contiguous areas are over utilized, excessively distant, or inaccessible to the population of the area under consideration.
81
Collier County Health Planning Council of SW Florida, Inc.
Community Health Assessment 2016
What a Designation Means
A geographic designation for the whole county means there is a shortage of providers (primary care physicians, dentists, mental health professionals) for everyone living in the county, regardless of ability to pay for services through insurance or other means.
A geographic area within the county means there is a shortage of health care providers for everyone living in that area of the county.
A special population designation for the whole county (or parts of counties) means there is a shortage of providers to meet the needs of low income, migrant or other special populations because the existing providers do not serve these patients.
The Immokalee/Everglades service area has been designated as a Health Professional Shortage Area (HPSA) for primary care. The HPSA designation scores counties between one and twenty-six, with the higher scores indicating higher levels of need. The Immokalee/Everglades service area scored a thirteen for primary care. Collier County also scored a seventeen for dental care for the low income and migrant farmworker population meaning it is designated as a shortage area.
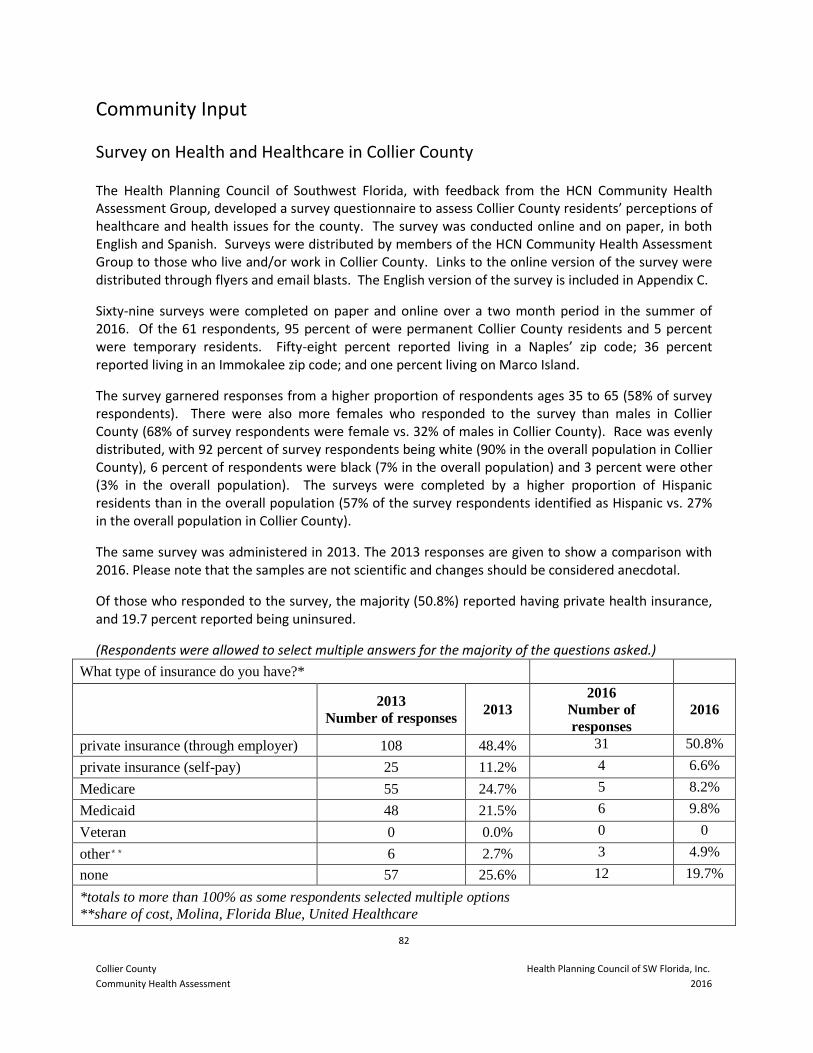
82
Collier County Health Planning Council of SW Florida, Inc.
Community Health Assessment 2016
Community Input
Survey on Health and Healthcare in Collier County
The Health Planning Council of Southwest Florida, with feedback from the HCN Community Health Assessment Group, developed a survey questionnaire to assess Collier County residents’ perceptions of healthcare and health issues for the county. The survey was conducted online and on paper, in both English and Spanish. Surveys were distributed by members of the HCN Community Health Assessment Group to those who live and/or work in Collier County. Links to the online version of the survey were distributed through flyers and email blasts. The English version of the survey is included in Appendix C.
Sixty-nine surveys were completed on paper and online over a two month period in the summer of 2016. Of the 61 respondents, 95 percent of were permanent Collier County residents and 5 percent were temporary residents. Fifty-eight percent reported living in a Naples’ zip code; 36 percent reported living in an Immokalee zip code; and one percent living on Marco Island.
The survey garnered responses from a higher proportion of respondents ages 35 to 65 (58% of survey respondents). There were also more females who responded to the survey than males in Collier County (68% of survey respondents were female vs. 32% of males in Collier County). Race was evenly distributed, with 92 percent of survey respondents being white (90% in the overall population in Collier County), 6 percent of respondents were black (7% in the overall population) and 3 percent were other (3% in the overall population). The surveys were completed by a higher proportion of Hispanic residents than in the overall population (57% of the survey respondents identified as Hispanic vs. 27% in the overall population in Collier County).
The same survey was administered in 2013. The 2013 responses are given to show a comparison with 2016. Please note that the samples are not scientific and changes should be considered anecdotal.
Of those who responded to the survey, the majority (50.8%) reported having private health insurance, and 19.7 percent reported being uninsured.
(Respondents were allowed to select multiple answers for the majority of the questions asked.)
What type of insurance do you have?*
2013
Number of responses 2013
2016
Number of
responses
2016
private insurance (through employer) 108 48.4% 31 50.8%
private insurance (self-pay) 25 11.2% 4 6.6%
Medicare 55 24.7% 5 8.2%
Medicaid 48 21.5% 6 9.8%
Veteran 0 0.0% 0 0
other** 6 2.7% 3 4.9%
none 57 25.6% 12 19.7%
*totals to more than 100% as some respondents selected multiple options
**share of cost, Molina, Florida Blue, United Healthcare
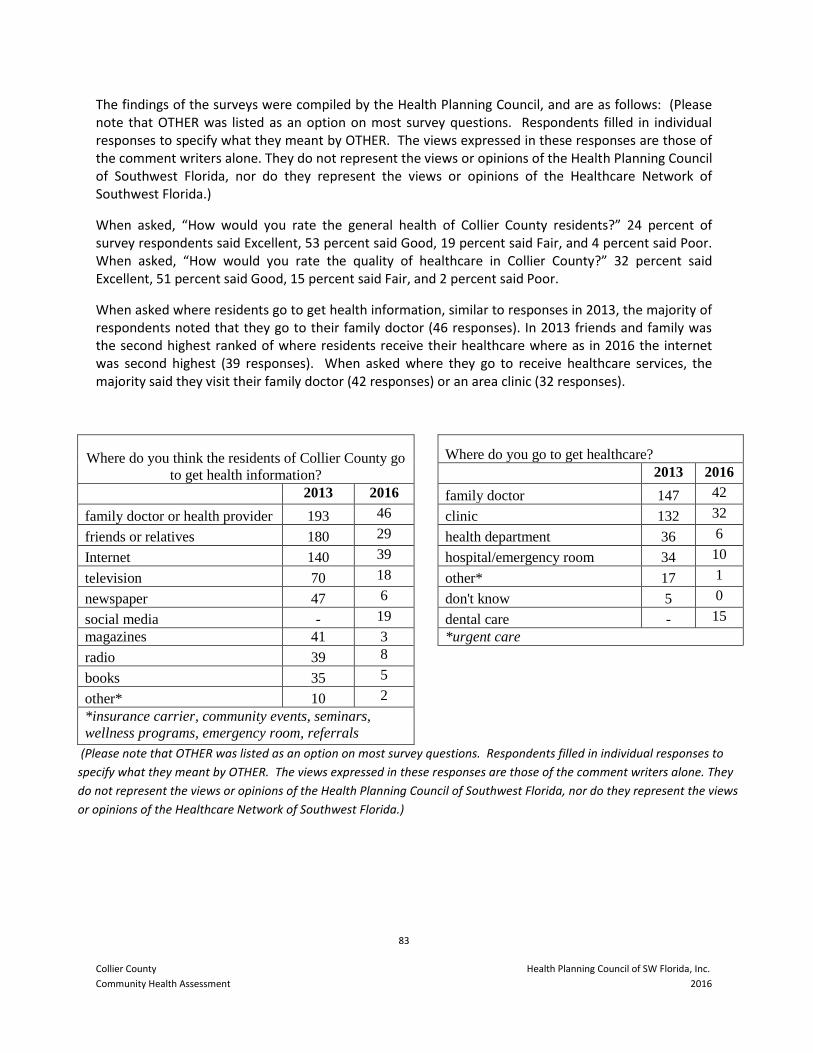
83
Collier County Health Planning Council of SW Florida, Inc.
Community Health Assessment 2016
The findings of the surveys were compiled by the Health Planning Council, and are as follows: (Please note that OTHER was listed as an option on most survey questions. Respondents filled in individual responses to specify what they meant by OTHER. The views expressed in these responses are those of the comment writers alone. They do not represent the views or opinions of the Health Planning Council of Southwest Florida, nor do they represent the views or opinions of the Healthcare Network of Southwest Florida.)
When asked, “How would you rate the general health of Collier County residents?” 24 percent of survey respondents said Excellent, 53 percent said Good, 19 percent said Fair, and 4 percent said Poor. When asked, “How would you rate the quality of healthcare in Collier County?” 32 percent said Excellent, 51 percent said Good, 15 percent said Fair, and 2 percent said Poor.
When asked where residents go to get health information, similar to responses in 2013, the majority of respondents noted that they go to their family doctor (46 responses). In 2013 friends and family was the second highest ranked of where residents receive their healthcare where as in 2016 the internet was second highest (39 responses). When asked where they go to receive healthcare services, the majority said they visit their family doctor (42 responses) or an area clinic (32 responses).
Where do you think the residents of Collier County go
to get health information?
Where do you go to get healthcare?
2013 2016
2013 2016 family doctor 147 42
family doctor or health provider 193 46 clinic 132 32
friends or relatives 180 29 health department 36 6
Internet 140 39 hospital/emergency room 34 10
television 70 18 other* 17 1
newspaper 47 6 don't know 5 0
social media - 19 dental care - 15
magazines 41 3 *urgent care
radio 39 8
books 35 5
other* 10 2
*insurance carrier, community events, seminars,
wellness programs, emergency room, referrals
(Please note that OTHER was listed as an option on most survey questions. Respondents filled in individual responses to
specify what they meant by OTHER. The views expressed in these responses are those of the comment writers alone. They
do not represent the views or opinions of the Health Planning Council of Southwest Florida, nor do they represent the views
or opinions of the Healthcare Network of Southwest Florida.)
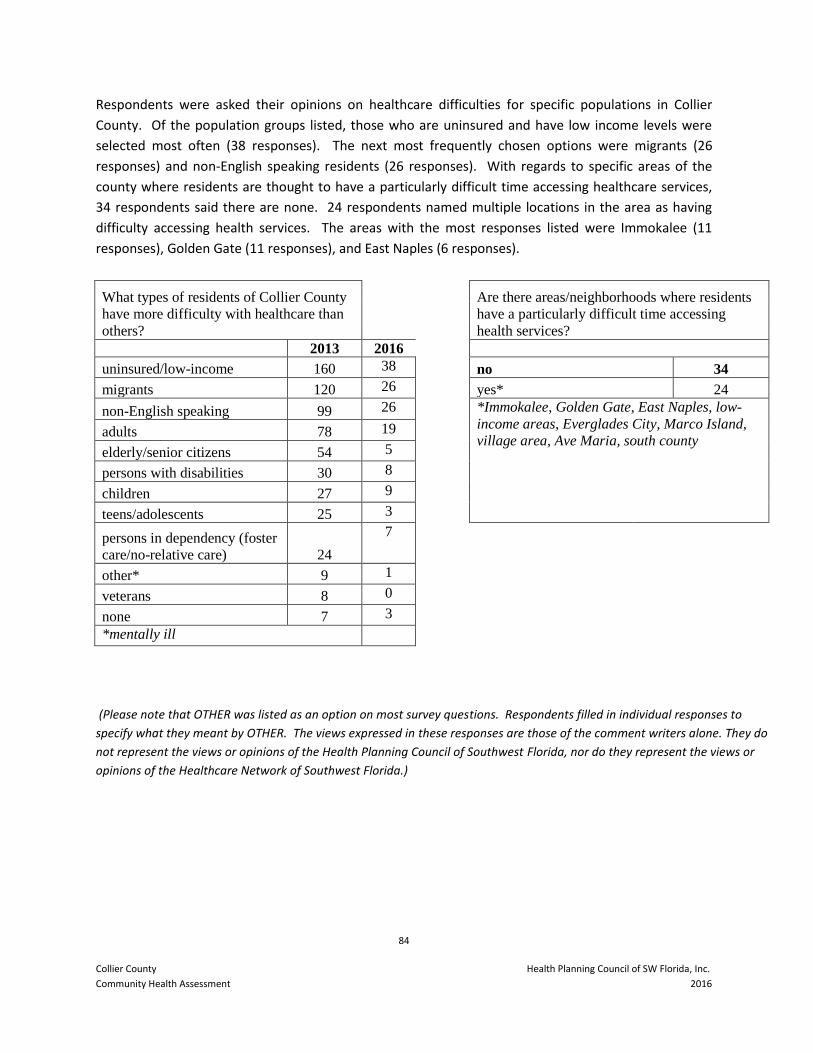
84
Collier County Health Planning Council of SW Florida, Inc.
Community Health Assessment 2016
Respondents were asked their opinions on healthcare difficulties for specific populations in Collier
County. Of the population groups listed, those who are uninsured and have low income levels were
selected most often (38 responses). The next most frequently chosen options were migrants (26
responses) and non-English speaking residents (26 responses). With regards to specific areas of the
county where residents are thought to have a particularly difficult time accessing healthcare services,
34 respondents said there are none. 24 respondents named multiple locations in the area as having
difficulty accessing health services. The areas with the most responses listed were Immokalee (11
responses), Golden Gate (11 responses), and East Naples (6 responses).
What types of residents of Collier County
have more difficulty with healthcare than
others?
Are there areas/neighborhoods where residents
have a particularly difficult time accessing
health services?
2013 2016
uninsured/low-income 160 38 no 34
migrants 120 26 yes* 24
non-English speaking 99 26 *Immokalee, Golden Gate, East Naples, low-
income areas, Everglades City, Marco Island,
village area, Ave Maria, south county adults 78 19
elderly/senior citizens 54 5
persons with disabilities 30 8
children 27 9
teens/adolescents 25 3
persons in dependency (foster
care/no-relative care) 24
7
other* 9 1
veterans 8 0
none 7 3
*mentally ill
(Please note that OTHER was listed as an option on most survey questions. Respondents filled in individual responses to
specify what they meant by OTHER. The views expressed in these responses are those of the comment writers alone. They do
not represent the views or opinions of the Health Planning Council of Southwest Florida, nor do they represent the views or
opinions of the Healthcare Network of Southwest Florida.)

85
Collier County Health Planning Council of SW Florida, Inc.
Community Health Assessment 2016
The surveys also asked about difficulties in receiving specific types of health services. Nineteen
respondents said, no, there are no services that individuals in Collier County have difficulty accessing.
Of those who felt there were services that were difficult to access, mental and behavioral health for
adults was number one, with 34 responses. Next highest on the list mental/behavioral health for
children, with 32 responses and dental care for adults (24 responses).
(Please note that OTHER was listed as an option on most survey questions. Respondents filled in individual responses to specify what they meant by OTHER. The views expressed in these responses are those of the comment writers alone. They do not represent the views or opinions of the Health Planning Council of Southwest Florida, nor do they represent the views or opinions of the Healthcare Network of Southwest Florida.)
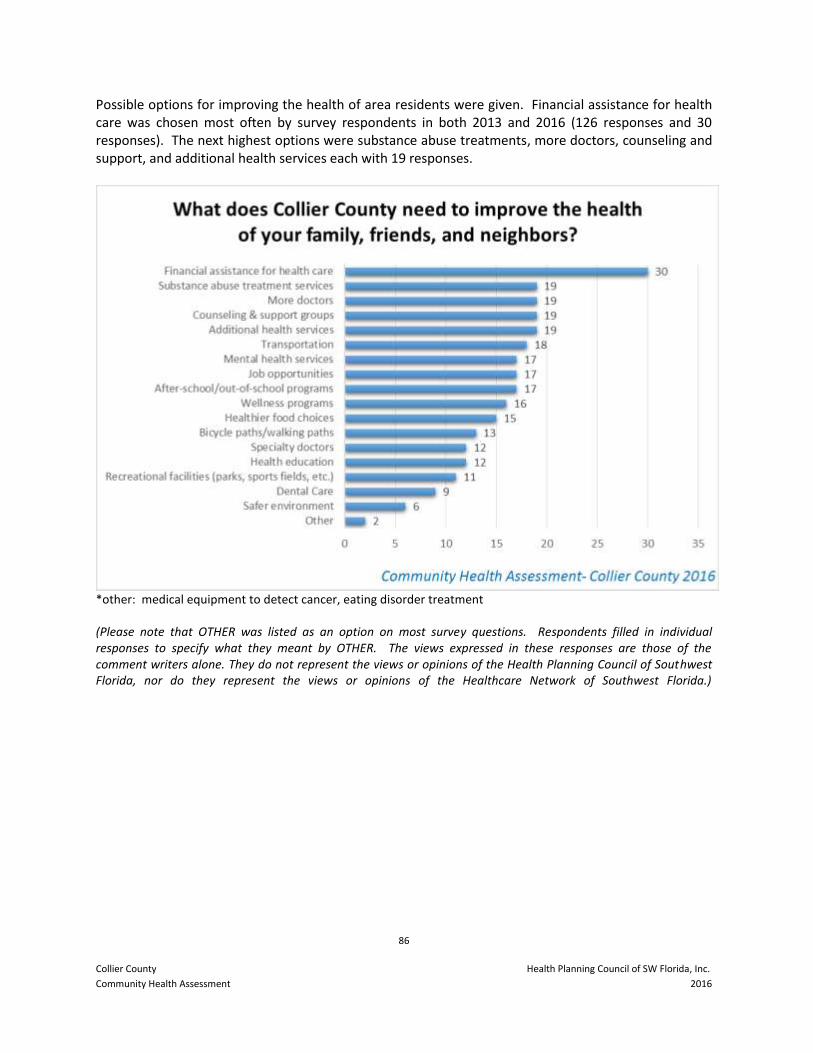
86
Collier County Health Planning Council of SW Florida, Inc.
Community Health Assessment 2016
Possible options for improving the health of area residents were given. Financial assistance for health care was chosen most often by survey respondents in both 2013 and 2016 (126 responses and 30 responses). The next highest options were substance abuse treatments, more doctors, counseling and support, and additional health services each with 19 responses.
*other: medical equipment to detect cancer, eating disorder treatment (Please note that OTHER was listed as an option on most survey questions. Respondents filled in individual responses to specify what they meant by OTHER. The views expressed in these responses are those of the comment writers alone. They do not represent the views or opinions of the Health Planning Council of Southwest Florida, nor do they represent the views or opinions of the Healthcare Network of Southwest Florida.)
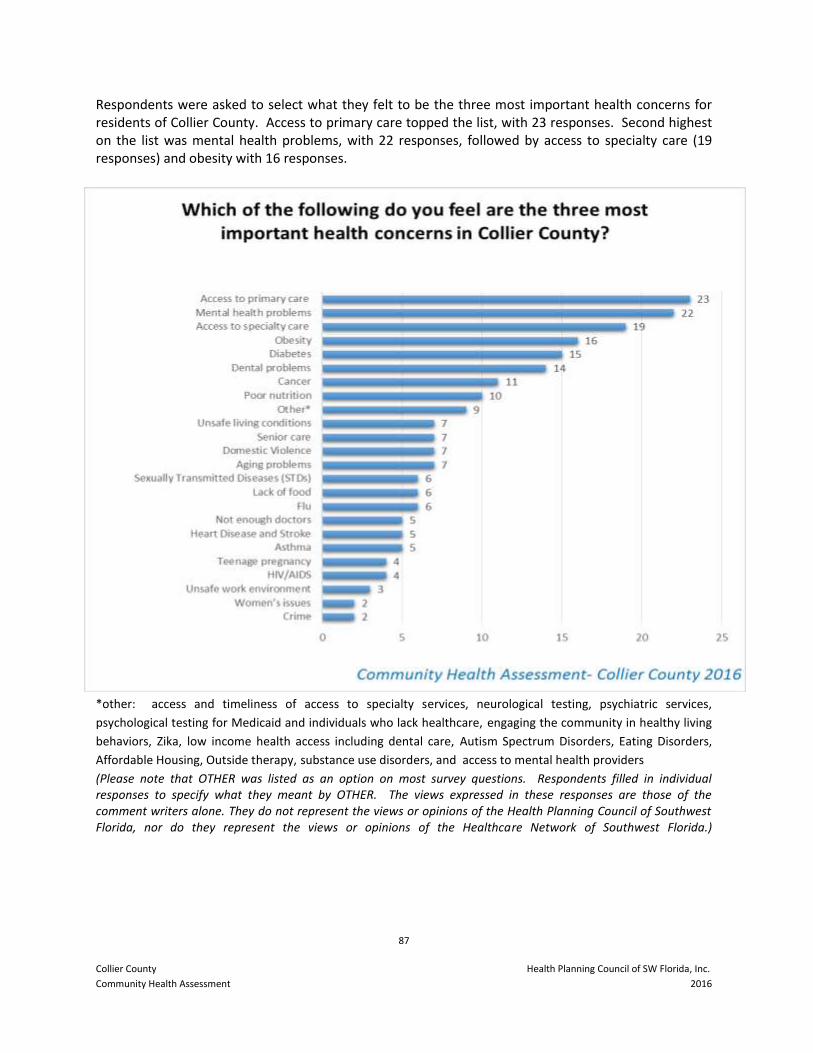
87
Collier County Health Planning Council of SW Florida, Inc.
Community Health Assessment 2016
Respondents were asked to select what they felt to be the three most important health concerns for residents of Collier County. Access to primary care topped the list, with 23 responses. Second highest on the list was mental health problems, with 22 responses, followed by access to specialty care (19 responses) and obesity with 16 responses.
*other: access and timeliness of access to specialty services, neurological testing, psychiatric services,
psychological testing for Medicaid and individuals who lack healthcare, engaging the community in healthy living
behaviors, Zika, low income health access including dental care, Autism Spectrum Disorders, Eating Disorders,
Affordable Housing, Outside therapy, substance use disorders, and access to mental health providers
(Please note that OTHER was listed as an option on most survey questions. Respondents filled in individual responses to specify what they meant by OTHER. The views expressed in these responses are those of the comment writers alone. They do not represent the views or opinions of the Health Planning Council of Southwest Florida, nor do they represent the views or opinions of the Healthcare Network of Southwest Florida.)
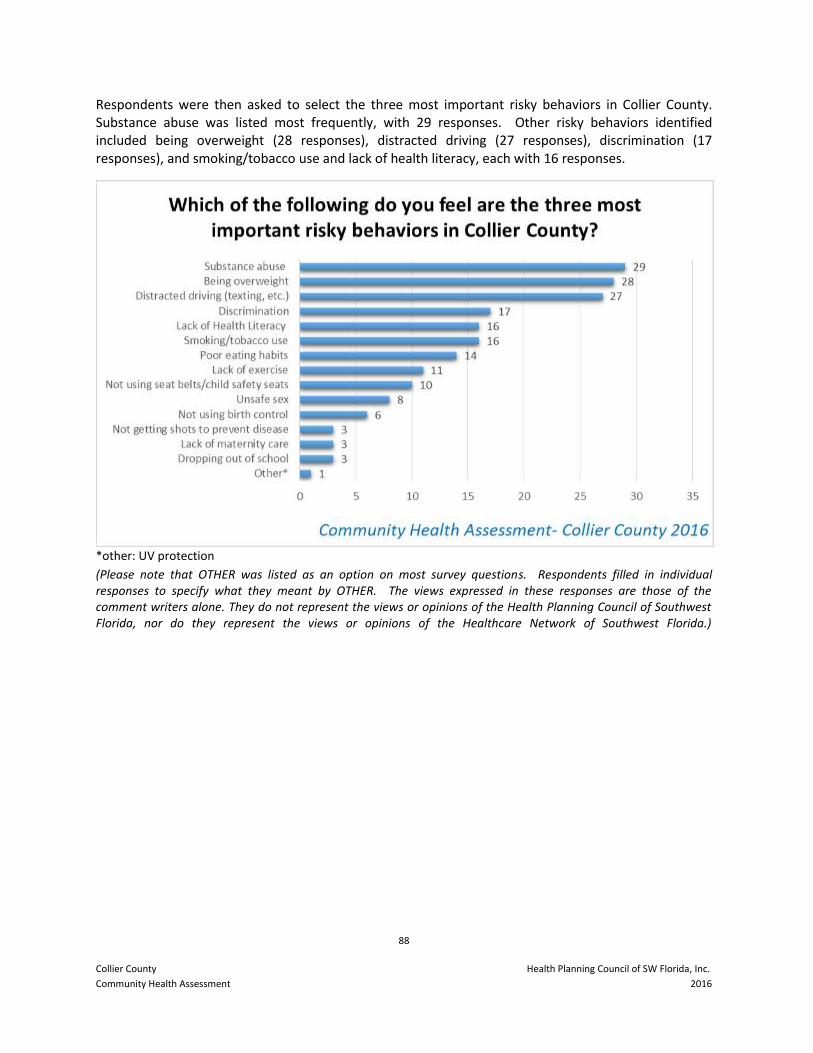
88
Collier County Health Planning Council of SW Florida, Inc.
Community Health Assessment 2016
Respondents were then asked to select the three most important risky behaviors in Collier County. Substance abuse was listed most frequently, with 29 responses. Other risky behaviors identified included being overweight (28 responses), distracted driving (27 responses), discrimination (17 responses), and smoking/tobacco use and lack of health literacy, each with 16 responses.
*other: UV protection
(Please note that OTHER was listed as an option on most survey questions. Respondents filled in individual responses to specify what they meant by OTHER. The views expressed in these responses are those of the comment writers alone. They do not represent the views or opinions of the Health Planning Council of Southwest Florida, nor do they represent the views or opinions of the Healthcare Network of Southwest Florida.)
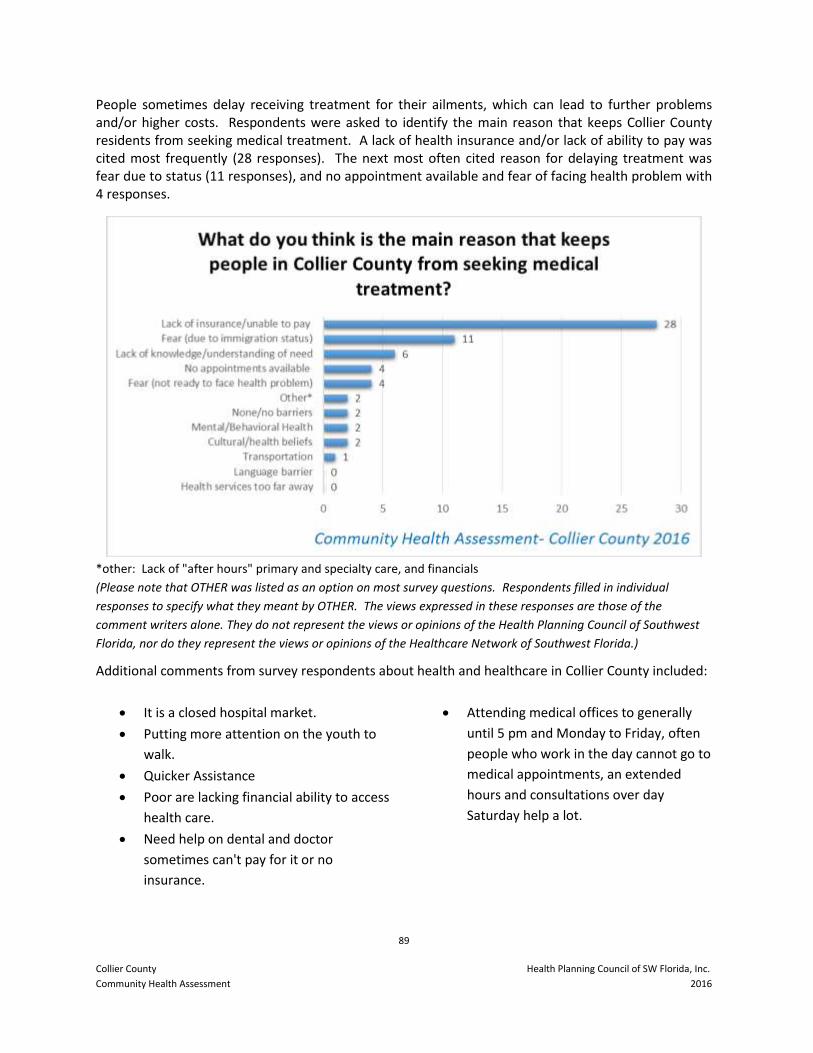
89
Collier County Health Planning Council of SW Florida, Inc.
Community Health Assessment 2016
People sometimes delay receiving treatment for their ailments, which can lead to further problems and/or higher costs. Respondents were asked to identify the main reason that keeps Collier County residents from seeking medical treatment. A lack of health insurance and/or lack of ability to pay was cited most frequently (28 responses). The next most often cited reason for delaying treatment was fear due to status (11 responses), and no appointment available and fear of facing health problem with 4 responses.
*other: Lack of "after hours" primary and specialty care, and financials
(Please note that OTHER was listed as an option on most survey questions. Respondents filled in individual
responses to specify what they meant by OTHER. The views expressed in these responses are those of the
comment writers alone. They do not represent the views or opinions of the Health Planning Council of Southwest
Florida, nor do they represent the views or opinions of the Healthcare Network of Southwest Florida.)
Additional comments from survey respondents about health and healthcare in Collier County included:
It is a closed hospital market.
Putting more attention on the youth to
walk.
Quicker Assistance
Poor are lacking financial ability to access
health care.
Need help on dental and doctor
sometimes can't pay for it or no
insurance.
Attending medical offices to generally
until 5 pm and Monday to Friday, often
people who work in the day cannot go to
medical appointments, an extended
hours and consultations over day
Saturday help a lot.
90
Collier County Health Planning Council of SW Florida, Inc.
Community Health Assessment 2016
Interviews with Community Leaders
Introduction
The Health Planning Council of Southwest Florida (HPC) conducted twenty-two key informant interviews in 2016 with the cooperation of the Healthcare Network of Southwest Florida. The purpose of conducting the interviews was to better understand the perspectives of key community leaders on the health and healthcare needs of Collier County residents. These interviews were intended to ascertain opinions among key individuals likely to be knowledgeable about the community and who are influential over the opinions of others about health concerns in the county. The findings provide qualitative information and reveal factors affecting the views and sentiments regarding healthcare services in Collier County. A summary of community leaders’ opinions is reported without judging the veracity of their comments.
Methodology
A community committee created by the Healthcare Network of Southwest Florida (HcN Community Health Assessment Group) compiled a list of possible interview subjects and made initial contact with the interviewees. The list included healthcare providers, healthcare consumers, and representatives of local businesses and community organizations. HPC staff conducted the interviews in person. The average interview lasted between thirty and sixty minutes. Twenty-two key community leaders were interviewed at the place of their employment or another location of their choosing in Collier County in August and September of 2016. The interviewees were told that none of their comments would be directly attributed to them but that a list of all participants would be included in this report. That list in included in Appendix E.
All interviews were conducted using a standard questionnaire. The instrument used to conduct the interviews is included in Appendix D. Community leaders were asked to provide comments on the following issues:
Overall perspective of healthcare in Collier County;
Perception of essential components of the county’s healthcare system;
Opinions of important health issues that affect county residents and the types of services needed to address these issues;
Impressions of specific health services available in the county;
Thoughts on helpful services that may be missing from the county; and
Opinions on the parties responsible for initiating and addressing health issues for the county.
91
Collier County Health Planning Council of SW Florida, Inc.
Community Health Assessment 2016
Interview Analysis
The leaders interviewed were asked whether they serve on any boards or have any affiliations with healthcare providers in the community that deliver healthcare services that may have helped form their opinions. These affiliations included Integral Health Plan, Collier County Immunization Task Force, Collier County Dental Association, Student Health Administration Council, PLAN board, Rural Health Network Advisory Board, Family Medicine Residency, Chamber of Commerce, Continuing Care Retirement Community, Health and Aging Foundation, Florida Board Psychiatric Association, Florida Hospital Association, American Hospital Association, FGCU Advisory Board, Healthcare Alliance, Blue Zone, Health Planning Council, Lee Memorial Trauma Advisory Committee.
The length of time that the community leaders have lived and/or worked in Collier County ranges from one year to thirty-eight years. The average number of years that an interviewee has lived or worked in Collier County is fifteen years.
The interview questions asked of each community leader were identical. The questions have been grouped into seven major categories. A summary of the leaders’ responses by each of the categories follows. There is some duplication of subject matter and feedback between the categories. Paraphrases are included to reflect some commonly held opinions and direct quotes are employed when appropriate. This section of the report summarizes what the community leaders said without assessing accuracy of their comments.
General Perceptions
When asked to share their impressions about health and healthcare in Collier County, community leaders spoke at length about the assets and deficiencies of the system. The majority of the respondents noted that there are many health services available in Collier County, but there are significant barriers to accessing these services. It was felt by many that, “if you have insurance or money, services are readily available,” but for those without, both preventive services and regular care are difficult to access. Immokalee and East Naples residents in particular, were felt to have limited resources readily available, although one interviewee felt “overall health seems better compared to other counties”.
The services that are available were felt by many to be of good quality. One respondent stated, “In general Collier County has good health care, especially for people who have private insurance or Medicare.” Others said it was, “quite good” and “fair”.
Assessing the overall health of Collier County residents was difficult for many of the interviewees. The difficulty was attributed to the distinctly different types of residents across the county. Health is felt to be divided along economic lines. One interviewee explained, “Collier is known as the healthiest County, but that does not reflect the situation with Migrant workers and Immigrants in Immokalee.” Racial disparities were also noted. Overall, though, many interviewees responded favorably about the health of the community. “There is still a sizeable amount with unmet health needs,” shared one interviewee.
There is always a need for quality health information in communities. By far the number one source for health information in the county cited by the interviewees was the Florida Department of Health in Collier County. The next most often mentioned were the Internet, a family doctor, and word of mouth. Also cited were emergency rooms, publications/books, the public library, local healthcare systems, the Medical Society, Neighborhood Health Clinic, Healthcare Network, radio, and schools.
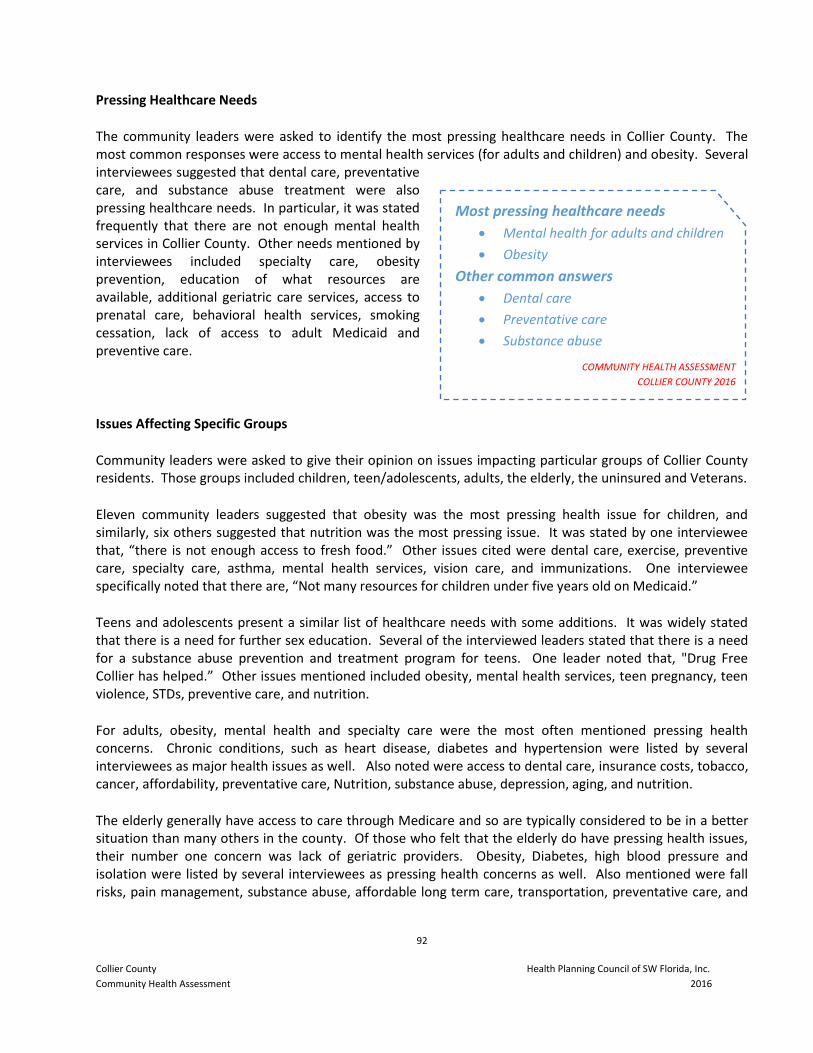
92
Collier County Health Planning Council of SW Florida, Inc.
Community Health Assessment 2016
Pressing Healthcare Needs
The community leaders were asked to identify the most pressing healthcare needs in Collier County. The most common responses were access to mental health services (for adults and children) and obesity. Several interviewees suggested that dental care, preventative care, and substance abuse treatment were also pressing healthcare needs. In particular, it was stated frequently that there are not enough mental health services in Collier County. Other needs mentioned by interviewees included specialty care, obesity prevention, education of what resources are available, additional geriatric care services, access to prenatal care, behavioral health services, smoking cessation, lack of access to adult Medicaid and preventive care.
Issues Affecting Specific Groups
Community leaders were asked to give their opinion on issues impacting particular groups of Collier County residents. Those groups included children, teen/adolescents, adults, the elderly, the uninsured and Veterans.
Eleven community leaders suggested that obesity was the most pressing health issue for children, and similarly, six others suggested that nutrition was the most pressing issue. It was stated by one interviewee that, “there is not enough access to fresh food.” Other issues cited were dental care, exercise, preventive care, specialty care, asthma, mental health services, vision care, and immunizations. One interviewee specifically noted that there are, “Not many resources for children under five years old on Medicaid.”
Teens and adolescents present a similar list of healthcare needs with some additions. It was widely stated that there is a need for further sex education. Several of the interviewed leaders stated that there is a need for a substance abuse prevention and treatment program for teens. One leader noted that, "Drug Free Collier has helped.” Other issues mentioned included obesity, mental health services, teen pregnancy, teen violence, STDs, preventive care, and nutrition.
For adults, obesity, mental health and specialty care were the most often mentioned pressing health concerns. Chronic conditions, such as heart disease, diabetes and hypertension were listed by several interviewees as major health issues as well. Also noted were access to dental care, insurance costs, tobacco, cancer, affordability, preventative care, Nutrition, substance abuse, depression, aging, and nutrition.
The elderly generally have access to care through Medicare and so are typically considered to be in a better situation than many others in the county. Of those who felt that the elderly do have pressing health issues, their number one concern was lack of geriatric providers. Obesity, Diabetes, high blood pressure and isolation were listed by several interviewees as pressing health concerns as well. Also mentioned were fall risks, pain management, substance abuse, affordable long term care, transportation, preventative care, and
Most pressing healthcare needs
Mental health for adults and children
Obesity
Other common answers
Dental care
Preventative care
Substance abuse
COMMUNITY HEALTH ASSESSMENT
COLLIER COUNTY 2016
93
Collier County Health Planning Council of SW Florida, Inc.
Community Health Assessment 2016
mental health services. It was mentioned by one community leader that there is a need for more activities for the elderly.
When discussing the uninsured in Collier County, the most common healthcare issue mentioned was access to mental health care. One interviewee stated, “Many uninsured are unaware of their access to care.” Mentioned nearly as frequently as access to mental health care for the uninsured, were the lack of specialty care for those without health insurance, as well as the large number of chronic conditions of this population. It was mentioned that many with chronic conditions go untreated until they feel they need to go through the ER. Interviewees were also concerned about preventive care, affordability of health care and health insurance, obesity, nutrition, health education, lack of Medicaid doctors, and the need for more activities.
Similar to the elderly who have access to Medicare, veterans are often felt to have better access to care due to Veterans’ Assistance benefits. In fact, multiple leaders interviewed stated that Veterans in Collier County seem have good access to care. However, health issues that were mentioned included mental health care, distance to services/transportation, difficulty navigating the VA system, depression, substance abuse, and getting preventative care.
Types of Residents with Difficulty Accessing Healthcare
Interviewees were asked about types of residents who have particular difficulty accessing care. Multiple community leaders felt that the uninsured/underinsured residents and migrant residents have difficulty accessing care, often due to lack of resources and knowledge of services available to them. Migrants were said by one interviewee to feel that “they are not welcomed”, when accessing services. The next most frequently mentioned group was Immigrants and Non-English Speakers. It was noted that some healthcare locations require non-English speaker to provide their own translators which can be a barrier to care. It was noted by one respondent, “Immigrants do not have insurance or an income, some might be eligible but do not know how to access it.” Other groups specifically mentioned as having difficulty with accessing care in Collier County were the elderly, children and middle class working families.
Impressions Regarding Services
The leaders were asked to give their impressions about the availability of different types of healthcare services and any obstacles that residents encounter when attempting to receive those types of services. When asked where residents who have difficulty paying go to receive health care services, fourteen leaders suggested the Healthcare Network of Southwest Florida or local FQHC, and seven mentioned the county health department. Multiple interviewees also stated that the Emergency Room was also a place for residents who do not have insurance as they would wait until they are in emergency situations. Other responses included that residents simply put off receiving care, Senior Friendship Center, the Physician Led Access Network (PLAN), Neighborhood Clinic, The David Lawrence Center for mental health issues, minute clinics and private doctors.
There were mixed feelings regarding the availability of primary care in Collier County. Just over half of respondents felt that primary care is unavailable, particularly for those who are uninsured, underinsured, and/or have Medicaid. Just under half of respondents stated that primary care was available for the most part, but it can be costly and wait times to get an appointment (particularly in Immokalee) can be long,
94
Collier County Health Planning Council of SW Florida, Inc.
Community Health Assessment 2016
suggesting that more primary care providers would be helpful. Of the care available, most felt it was good quality. One leader stated, “Good amount of options for most, but there is a shortage.”
Many of the community leaders interviewed felt there are a lot of dental services available for children but not for the adults in Collier County. One leader stated, “Services are expanding and high priority in Collier, there are enough providers but they don’t accept insurance/Medicaid.” Most leaders felt the largest barrier to receiving dental services is the high cost. One interviewee stated, “It is a problem for the poor, it is difficult to get dentists who are a part of the sliding fee.” Another leader stated of dental care that, “many don’t go until they are in pain.”
One community leader felt that Immokalee residents did not have quite enough dental care options, stating, “There is only one local dentist in private practice in Immokalee. He does accept payment plans but many people do not know about it.”
Most of the community leaders stated that residents have options in the county for specialty care but they are limited to Naples. One leader specifically noted, “No specialists here (Immokalee), can be referred to specialists in Naples or Fort Myers.” Another barrier that was stated was access for those who do not have insurance. “Plenty specialty services, but not available to everyone, especially those without insurance,” stated one interviewee. Residents without insurance were said to have long waits to get in, especially during the winter season. Additionally, residents with Medicaid or Medicare often have difficulty finding specialty providers who will accept their insurance. The majority of community leaders felt the quality of the specialty care in Collier County is very good or good. “It all depends on the ability to pay, but plenty available,” stated one interviewee.
The majority of community leaders felt that mental health care is not readily available in Collier County. David Lawrence was listed as a resource; but it was felt by many that more facilities are needed. Two other places mentioned that provide some mental health were FSW in Immokalee and Healthcare Network. Opinions of the quality of the available mental health services were mixed. Half had good things to say about the care available at David Lawrence. “David Lawrence Center has a good reputation,” stated one interviewee. Another interviewee mentioned the need for mental health services that are integrated into primary care. It was noted that the David Lawrence Center is working collaboratively with Healthcare Network to provide that type of service. Others felt the mental health care available in Collier County needs improvement. One leader stated, “Tremendous deficit. Mental health services are difficult to find at all levels.”
Substance abuse treatment was felt by most to not be widely available in the county, and limited for those who cannot afford to pay. One community leader stated that it is, “very limited. David Lawrence Center is inpatient only; there are no other options available.” Besides David Lawrence, leaders mentioned Hazelden, St. Matthew’s House and The Willough at Naples as substance abuse care options in Collier County as well as court mandated care. It was noted that there is a need for more options for those without insurance or the ability to pay. One community leader noted that, “Those without insurance are the ones who usually need it. There is a difficulty to get them in treatment; there are not enough inpatient services.” One interviewee mentioned that there is a need for assistance for family members to find the right services for their loved ones. Navigation of available services is considered limited.
95
Collier County Health Planning Council of SW Florida, Inc.
Community Health Assessment 2016
One interviewee stated, “Among adolescents it [substance abuse] is a big problem, it is seen in High School.” Suggestions for improvements in the county included prevention programs, and additional collaboration amongst providers.
Emergency care options in Collier County are available at the area hospitals as well as urgent care centers. Interviewees felt that emergency care in the county was “pretty good,” and “ok.” One interviewee stated, “No problems, takes everyone,” and, “Pretty ok. Utilized before primary care more often, easiest way to get coverage.” Many of the interviewees mentioned there being plenty of emergency services available but the wait times can vary depending on the time of year. One interviewee stated,” critically overwhelmed during the winter season.” It was also noted residents of Immokalee must travel to receive emergency care in Naples.
The level of hospital care in general (non-emergency) in Collier County was thought by most interviewees to be good. Comments included, “pretty good throughout all hospitals,” “Good quality, plenty of beds,” “Pretty good,” and “two good hospital systems.” A few respondents felt some improvements could be made, “No collaboration efforts between two hospitals,” “Support staff and services aren’t always comparable,” and “Not enough training.” It was noted by a few interviewees that transport was also an issue for those residents outside of Naples.
Resources for hospice care in Collier County were felt to be available. The quality was felt to be good overall. One interviewee stated that there are, “good options.” Another was pleased to note that, “They have great outreach to the community and good inpatient and outpatient services available.”
Pediatric care was felt by most respondents to be very well covered. The quality was considered good overall, but a few interviewees mentioned that there is a long wait for appointments. Many respondents stated that neonatal care still has room for improvement in Collier County, but services are easily accessible through Golisano Children’s Hospital and in Lee County.
According to the interviewed leaders, pediatric specialties and neonatal care are the services most often requiring residents to be referred outside the county. Dermatology services were also mentioned more than once as lacking in Collier County. Other services that were difficult to find in Collier County were a trauma center, dental services, a high risk obstetrics clinic, mental and behavioral health, disease support groups, transplants, clinical trials, cancer treatment, and care for severe burns.
It is generally believed that the residents of the areas outside of Naples often have greater difficulty accessing health services. The neighborhoods mentioned most frequently as having difficulty accessing services were Immokalee and Everglades City. Also mentioned were Golden Gate, East Naples, Farm Worker Village, Migrant Camps, rural areas, and Chokoloskee.
Transportation is seen as a major barrier to care for many of these areas. Most interviewees mentioned the local CAT bus as well as the buses provided by the Health Care Network as options that have been helpful to many residents. Several leaders felt that the limited routes and schedules need to be expanded for the needs of the entire county. With Immokalee residents in particular, one community leader stated, “The bus becomes full and many cannot make it to their appointment. There are a lot of people who have to rely on that.” Some suggestions for improving transportation barriers were, “Making the county easier to get around by walking or biking,” and “creating a discount voucher program.”
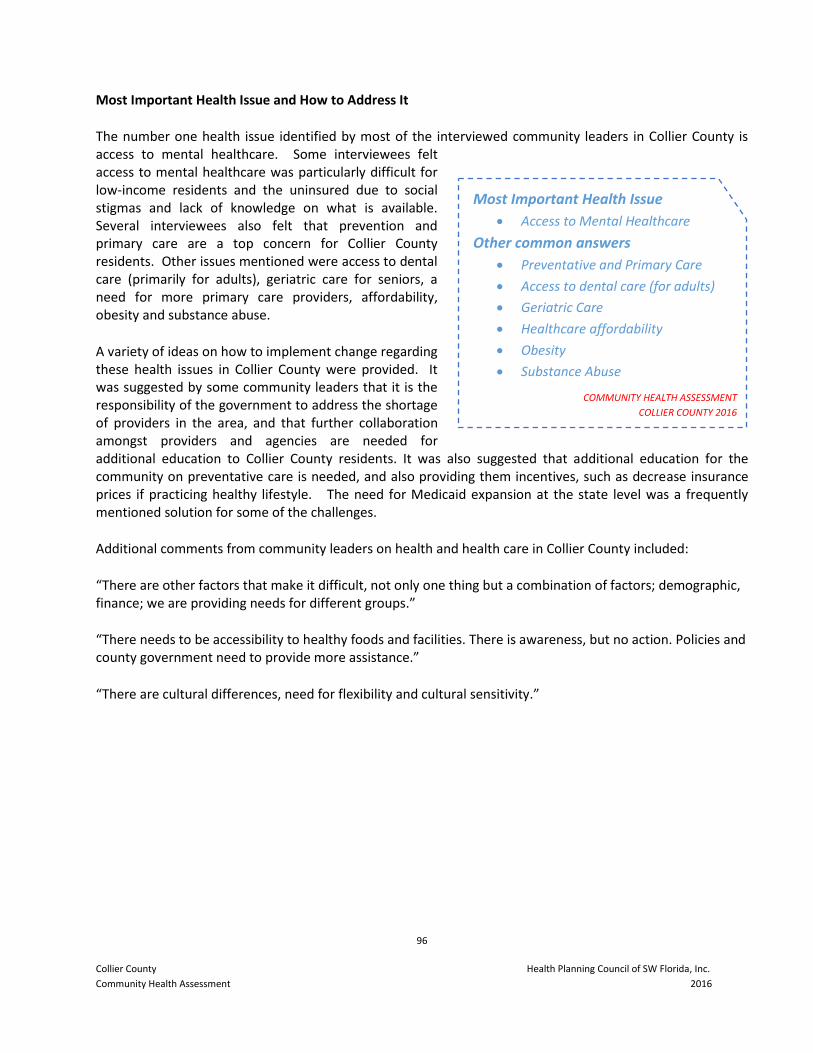
96
Collier County Health Planning Council of SW Florida, Inc.
Community Health Assessment 2016
Most Important Health Issue and How to Address It
The number one health issue identified by most of the interviewed community leaders in Collier County is access to mental healthcare. Some interviewees felt access to mental healthcare was particularly difficult for low-income residents and the uninsured due to social stigmas and lack of knowledge on what is available. Several interviewees also felt that prevention and primary care are a top concern for Collier County residents. Other issues mentioned were access to dental care (primarily for adults), geriatric care for seniors, a need for more primary care providers, affordability, obesity and substance abuse.
A variety of ideas on how to implement change regarding these health issues in Collier County were provided. It was suggested by some community leaders that it is the responsibility of the government to address the shortage of providers in the area, and that further collaboration amongst providers and agencies are needed for additional education to Collier County residents. It was also suggested that additional education for the community on preventative care is needed, and also providing them incentives, such as decrease insurance prices if practicing healthy lifestyle. The need for Medicaid expansion at the state level was a frequently mentioned solution for some of the challenges.
Additional comments from community leaders on health and health care in Collier County included:
“There are other factors that make it difficult, not only one thing but a combination of factors; demographic, finance; we are providing needs for different groups.”
“There needs to be accessibility to healthy foods and facilities. There is awareness, but no action. Policies and county government need to provide more assistance.”
“There are cultural differences, need for flexibility and cultural sensitivity.”
Most Important Health Issue
Access to Mental Healthcare
Other common answers
Preventative and Primary Care
Access to dental care (for adults)
Geriatric Care
Healthcare affordability
Obesity
Substance Abuse
COMMUNITY HEALTH ASSESSMENT
COLLIER COUNTY 2016
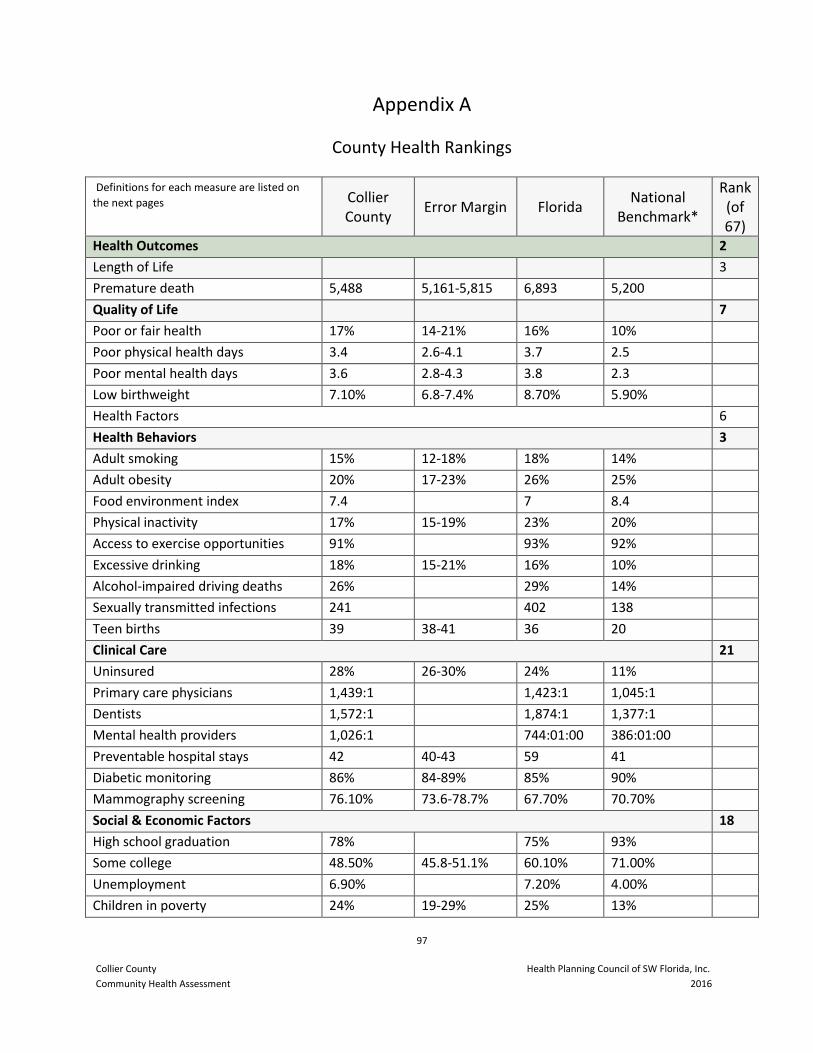
97
Collier County Health Planning Council of SW Florida, Inc.
Community Health Assessment 2016
Appendix A
County Health Rankings
Definitions for each measure are listed on
the next pages Collier County
Error Margin Florida National
Benchmark*
Rank (of 67)
Health Outcomes 2
Length of Life 3
Premature death 5,488 5,161-5,815 6,893 5,200
Quality of Life 7
Poor or fair health 17% 14-21% 16% 10%
Poor physical health days 3.4 2.6-4.1 3.7 2.5
Poor mental health days 3.6 2.8-4.3 3.8 2.3
Low birthweight 7.10% 6.8-7.4% 8.70% 5.90%
Health Factors 6
Health Behaviors 3
Adult smoking 15% 12-18% 18% 14%
Adult obesity 20% 17-23% 26% 25%
Food environment index 7.4 7 8.4
Physical inactivity 17% 15-19% 23% 20%
Access to exercise opportunities 91% 93% 92%
Excessive drinking 18% 15-21% 16% 10%
Alcohol-impaired driving deaths 26% 29% 14%
Sexually transmitted infections 241 402 138
Teen births 39 38-41 36 20
Clinical Care 21
Uninsured 28% 26-30% 24% 11%
Primary care physicians 1,439:1 1,423:1 1,045:1
Dentists 1,572:1 1,874:1 1,377:1
Mental health providers 1,026:1 744:01:00 386:01:00
Preventable hospital stays 42 40-43 59 41
Diabetic monitoring 86% 84-89% 85% 90%
Mammography screening 76.10% 73.6-78.7% 67.70% 70.70%
Social & Economic Factors 18
High school graduation 78% 75% 93%
Some college 48.50% 45.8-51.1% 60.10% 71.00%
Unemployment 6.90% 7.20% 4.00%
Children in poverty 24% 19-29% 25% 13%
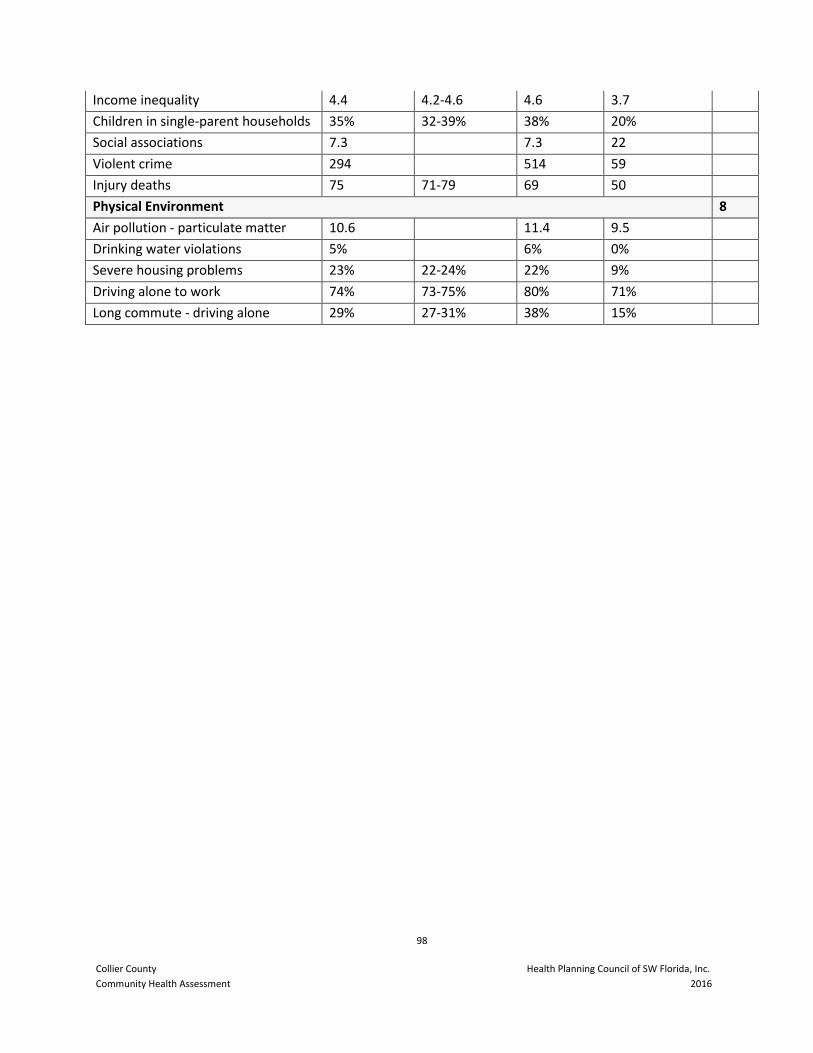
98
Collier County Health Planning Council of SW Florida, Inc.
Community Health Assessment 2016
Income inequality 4.4 4.2-4.6 4.6 3.7
Children in single-parent households 35% 32-39% 38% 20%
Social associations 7.3 7.3 22
Violent crime 294 514 59
Injury deaths 75 71-79 69 50
Physical Environment 8
Air pollution - particulate matter 10.6 11.4 9.5
Drinking water violations 5% 6% 0%
Severe housing problems 23% 22-24% 22% 9%
Driving alone to work 74% 73-75% 80% 71%
Long commute - driving alone 29% 27-31% 38% 15%
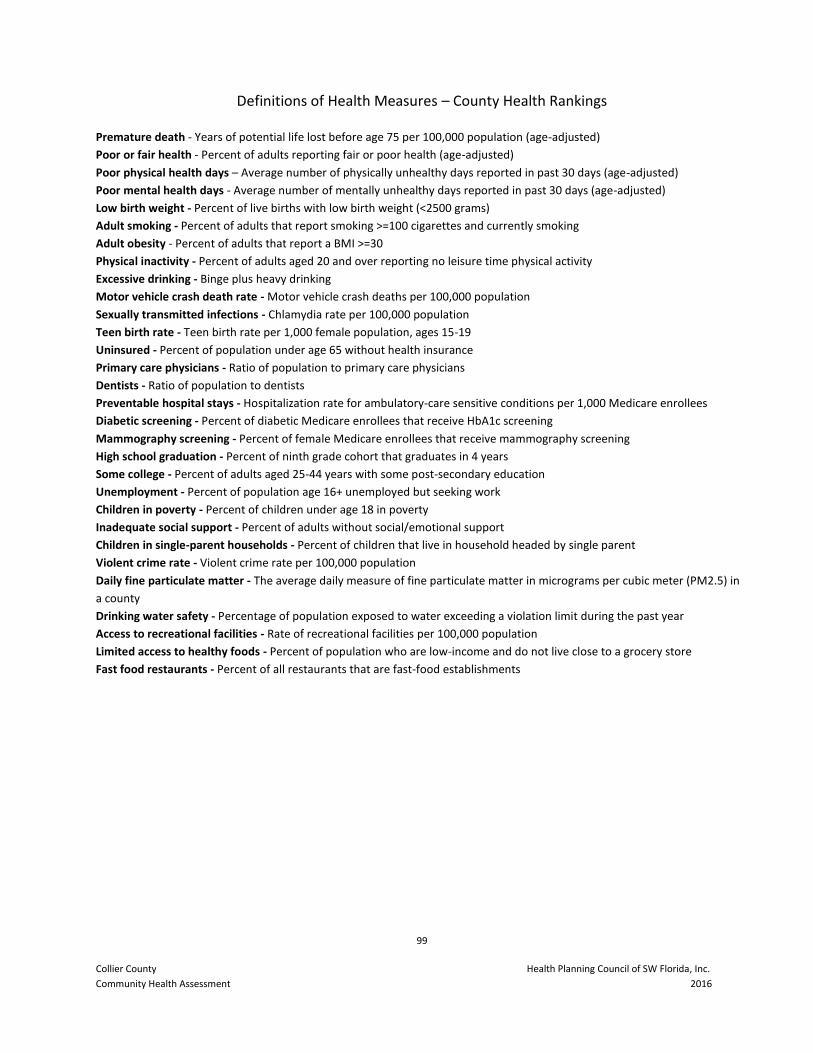
99
Collier County Health Planning Council of SW Florida, Inc.
Community Health Assessment 2016
Definitions of Health Measures – County Health Rankings
Premature death - Years of potential life lost before age 75 per 100,000 population (age-adjusted)
Poor or fair health - Percent of adults reporting fair or poor health (age-adjusted)
Poor physical health days – Average number of physically unhealthy days reported in past 30 days (age-adjusted)
Poor mental health days - Average number of mentally unhealthy days reported in past 30 days (age-adjusted)
Low birth weight - Percent of live births with low birth weight (<2500 grams)
Adult smoking - Percent of adults that report smoking >=100 cigarettes and currently smoking
Adult obesity - Percent of adults that report a BMI >=30
Physical inactivity - Percent of adults aged 20 and over reporting no leisure time physical activity
Excessive drinking - Binge plus heavy drinking
Motor vehicle crash death rate - Motor vehicle crash deaths per 100,000 population
Sexually transmitted infections - Chlamydia rate per 100,000 population
Teen birth rate - Teen birth rate per 1,000 female population, ages 15-19
Uninsured - Percent of population under age 65 without health insurance
Primary care physicians - Ratio of population to primary care physicians
Dentists - Ratio of population to dentists
Preventable hospital stays - Hospitalization rate for ambulatory-care sensitive conditions per 1,000 Medicare enrollees
Diabetic screening - Percent of diabetic Medicare enrollees that receive HbA1c screening
Mammography screening - Percent of female Medicare enrollees that receive mammography screening
High school graduation - Percent of ninth grade cohort that graduates in 4 years
Some college - Percent of adults aged 25-44 years with some post-secondary education
Unemployment - Percent of population age 16+ unemployed but seeking work
Children in poverty - Percent of children under age 18 in poverty
Inadequate social support - Percent of adults without social/emotional support
Children in single-parent households - Percent of children that live in household headed by single parent
Violent crime rate - Violent crime rate per 100,000 population
Daily fine particulate matter - The average daily measure of fine particulate matter in micrograms per cubic meter (PM2.5) in
a county
Drinking water safety - Percentage of population exposed to water exceeding a violation limit during the past year
Access to recreational facilities - Rate of recreational facilities per 100,000 population
Limited access to healthy foods - Percent of population who are low-income and do not live close to a grocery store
Fast food restaurants - Percent of all restaurants that are fast-food establishments
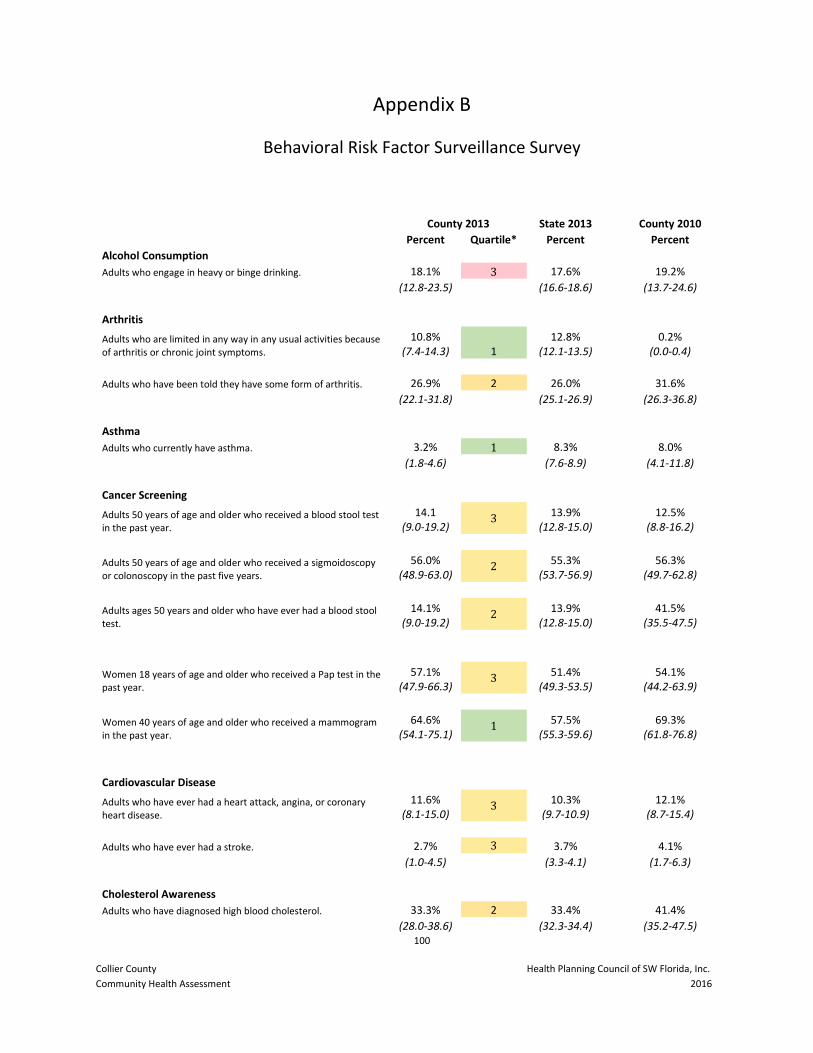
100
Collier County Health Planning Council of SW Florida, Inc.
Community Health Assessment 2016
Appendix B
Behavioral Risk Factor Surveillance Survey
County 2013 State 2013
County 2010
Percent Quartile* Percent
Percent
Alcohol Consumption Adults who engage in heavy or binge drinking. 18.1% 3 17.6%
19.2%
(12.8-23.5)
(16.6-18.6)
(13.7-24.6)
Arthritis Adults who are limited in any way in any usual activities because
of arthritis or chronic joint symptoms.
10.8% (7.4-14.3) 1
12.8% (12.1-13.5)
0.2% (0.0-0.4)
Adults who have been told they have some form of arthritis. 26.9% 2 26.0%
31.6%
(22.1-31.8)
(25.1-26.9)
(26.3-36.8)
Asthma Adults who currently have asthma. 3.2% 1 8.3%
8.0%
(1.8-4.6)
(7.6-8.9)
(4.1-11.8)
Cancer Screening Adults 50 years of age and older who received a blood stool test
in the past year.
14.1 (9.0-19.2)
3 13.9%
(12.8-15.0)
12.5% (8.8-16.2)
Adults 50 years of age and older who received a sigmoidoscopy
or colonoscopy in the past five years.
56.0% (48.9-63.0)
2 55.3%
(53.7-56.9)
56.3% (49.7-62.8)
Adults ages 50 years and older who have ever had a blood stool
test.
14.1% (9.0-19.2)
2 13.9%
(12.8-15.0)
41.5% (35.5-47.5)
Women 18 years of age and older who received a Pap test in the
past year.
57.1% (47.9-66.3)
3 51.4%
(49.3-53.5)
54.1% (44.2-63.9)
Women 40 years of age and older who received a mammogram
in the past year.
64.6% (54.1-75.1)
1 57.5%
(55.3-59.6)
69.3% (61.8-76.8)
Cardiovascular Disease Adults who have ever had a heart attack, angina, or coronary
heart disease.
11.6% (8.1-15.0)
3 10.3%
(9.7-10.9)
12.1% (8.7-15.4)
Adults who have ever had a stroke. 2.7% 3 3.7%
4.1%
(1.0-4.5)
(3.3-4.1)
(1.7-6.3)
Cholesterol Awareness Adults who have diagnosed high blood cholesterol. 33.3% 2 33.4%
41.4%
(28.0-38.6)
(32.3-34.4)
(35.2-47.5)
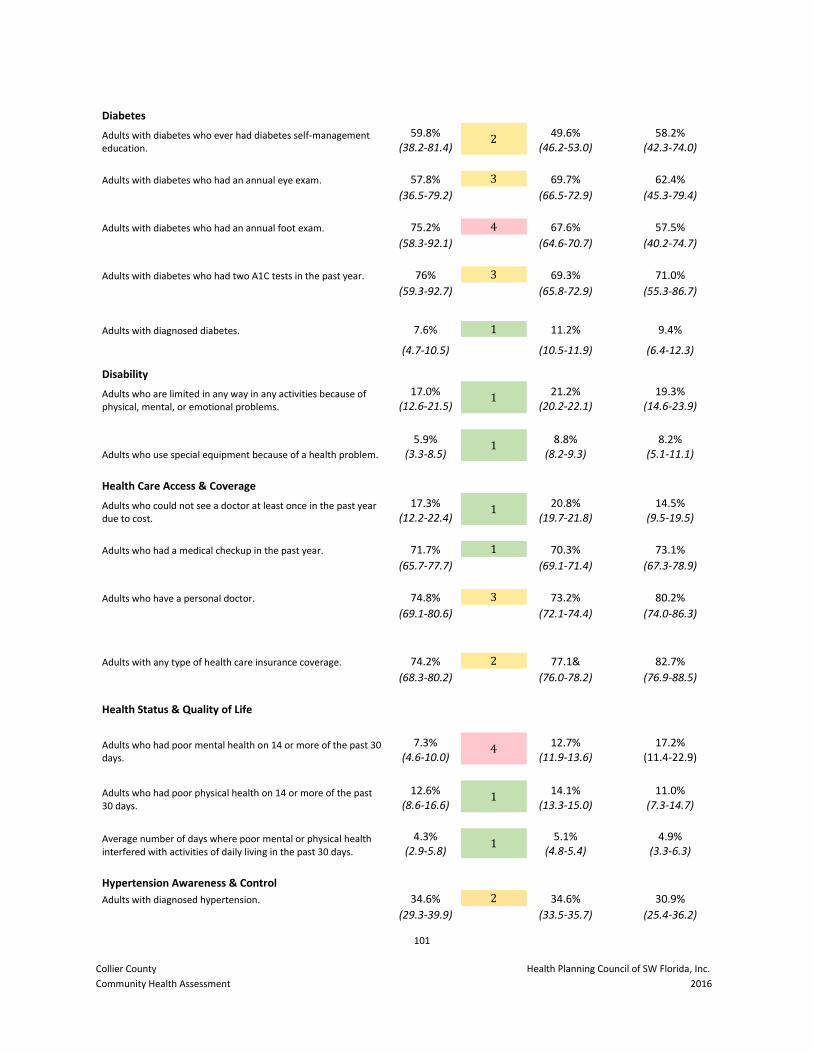
101
Collier County Health Planning Council of SW Florida, Inc.
Community Health Assessment 2016
Diabetes Adults with diabetes who ever had diabetes self-management
education.
59.8% (38.2-81.4)
2 49.6%
(46.2-53.0)
58.2% (42.3-74.0)
Adults with diabetes who had an annual eye exam. 57.8% 3 69.7%
62.4%
(36.5-79.2)
(66.5-72.9)
(45.3-79.4)
Adults with diabetes who had an annual foot exam. 75.2% 4 67.6%
57.5%
(58.3-92.1)
(64.6-70.7)
(40.2-74.7)
Adults with diabetes who had two A1C tests in the past year. 76% 3 69.3%
71.0%
(59.3-92.7)
(65.8-72.9)
(55.3-86.7)
Adults with diagnosed diabetes. 7.6% 1 11.2%
9.4%
(4.7-10.5)
(10.5-11.9)
(6.4-12.3)
Disability Adults who are limited in any way in any activities because of
physical, mental, or emotional problems.
17.0% (12.6-21.5)
1 21.2%
(20.2-22.1)
19.3% (14.6-23.9)
Adults who use special equipment because of a health problem.
5.9% (3.3-8.5)
1 8.8%
(8.2-9.3)
8.2% (5.1-11.1)
Health Care Access & Coverage Adults who could not see a doctor at least once in the past year
due to cost.
17.3% (12.2-22.4)
1 20.8%
(19.7-21.8)
14.5% (9.5-19.5)
Adults who had a medical checkup in the past year. 71.7% 1 70.3%
73.1%
(65.7-77.7)
(69.1-71.4)
(67.3-78.9)
Adults who have a personal doctor. 74.8% 3 73.2%
80.2%
(69.1-80.6)
(72.1-74.4)
(74.0-86.3)
Adults with any type of health care insurance coverage. 74.2% 2 77.1&
82.7%
(68.3-80.2)
(76.0-78.2)
(76.9-88.5)
Health Status & Quality of Life
Adults who had poor mental health on 14 or more of the past 30
days.
7.3% (4.6-10.0)
4 12.7%
(11.9-13.6)
17.2% (11.4-22.9)
Adults who had poor physical health on 14 or more of the past
30 days.
12.6% (8.6-16.6)
1 14.1%
(13.3-15.0)
11.0% (7.3-14.7)
Average number of days where poor mental or physical health
interfered with activities of daily living in the past 30 days.
4.3% (2.9-5.8)
1 5.1%
(4.8-5.4)
4.9% (3.3-6.3)
Hypertension Awareness & Control Adults with diagnosed hypertension. 34.6% 2 34.6%
30.9%
(29.3-39.9)
(33.5-35.7)
(25.4-36.2)
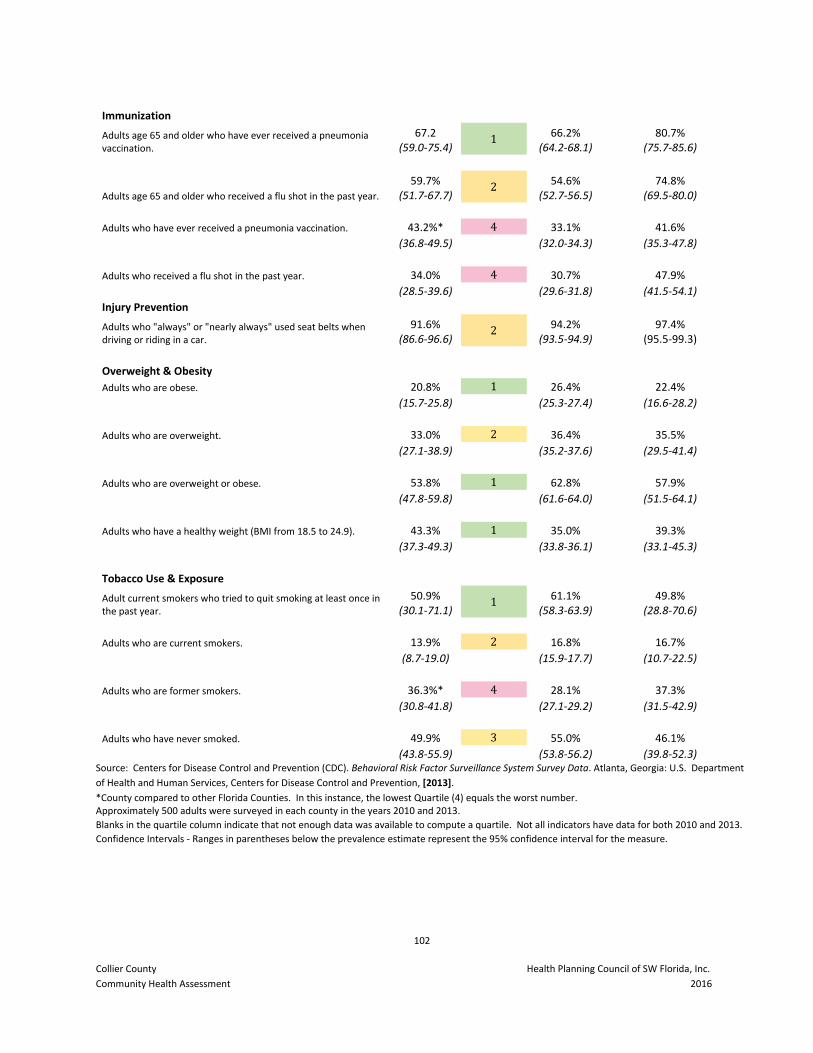
102
Collier County Health Planning Council of SW Florida, Inc.
Community Health Assessment 2016
Immunization Adults age 65 and older who have ever received a pneumonia
vaccination.
67.2 (59.0-75.4)
1 66.2%
(64.2-68.1)
80.7% (75.7-85.6)
Adults age 65 and older who received a flu shot in the past year.
59.7% (51.7-67.7)
2 54.6%
(52.7-56.5)
74.8% (69.5-80.0)
Adults who have ever received a pneumonia vaccination. 43.2%* 4 33.1%
41.6%
(36.8-49.5)
(32.0-34.3)
(35.3-47.8)
Adults who received a flu shot in the past year. 34.0% 4 30.7%
47.9%
(28.5-39.6)
(29.6-31.8)
(41.5-54.1)
Injury Prevention
Adults who "always" or "nearly always" used seat belts when driving or riding in a car.
91.6% (86.6-96.6)
2 94.2%
(93.5-94.9)
97.4% (95.5-99.3)
Overweight & Obesity Adults who are obese. 20.8% 1 26.4%
22.4%
(15.7-25.8)
(25.3-27.4)
(16.6-28.2)
Adults who are overweight. 33.0% 2 36.4%
35.5%
(27.1-38.9)
(35.2-37.6)
(29.5-41.4)
Adults who are overweight or obese. 53.8% 1 62.8%
57.9%
(47.8-59.8)
(61.6-64.0)
(51.5-64.1)
Adults who have a healthy weight (BMI from 18.5 to 24.9). 43.3% 1 35.0%
39.3%
(37.3-49.3)
(33.8-36.1)
(33.1-45.3)
Tobacco Use & Exposure Adult current smokers who tried to quit smoking at least once in
the past year.
50.9% (30.1-71.1)
1 61.1%
(58.3-63.9)
49.8% (28.8-70.6)
Adults who are current smokers. 13.9% 2 16.8%
16.7%
(8.7-19.0)
(15.9-17.7)
(10.7-22.5)
Adults who are former smokers. 36.3%* 4 28.1%
37.3%
(30.8-41.8)
(27.1-29.2)
(31.5-42.9)
Adults who have never smoked. 49.9% 3 55.0%
46.1%
(43.8-55.9)
(53.8-56.2)
(39.8-52.3)
Source: Centers for Disease Control and Prevention (CDC). Behavioral Risk Factor Surveillance System Survey Data. Atlanta, Georgia: U.S. Department
of Health and Human Services, Centers for Disease Control and Prevention, [2013].
*County compared to other Florida Counties. In this instance, the lowest Quartile (4) equals the worst number. Approximately 500 adults were surveyed in each county in the years 2010 and 2013.
Blanks in the quartile column indicate that not enough data was available to compute a quartile. Not all indicators have data for both 2010 and 2013.
Confidence Intervals - Ranges in parentheses below the prevalence estimate represent the 95% confidence interval for the measure.
103
Collier County Health Planning Council of SW Florida, Inc.
Community Health Assessment 2016
Appendix C
Survey on Health and Healthcare in Collier County
1. How would you rate the general health of Collier County residents?
Excellent Good Fair Poor
2. How would you rate the quality of healthcare in Collier County?
Excellent Good Fair Poor
3. Where do you think the residents of Collier County go to get health information (select all that apply)?
Books Magazines
Family doctor or health provider Newspaper
Friends or relatives Radio
Internet Television
Other _____________________________________________________
4. Where do you go to get healthcare (select all that apply)?
Clinic Health department
Family doctor Hospital/emergency room
Don't know
Other ____________________________
5. Which of the following do you feel are the three most important health concerns in Collier County (select
three)?
Access to primary care (family doctor) HIV/AIDS
Access to specialty care (doctors who provide care for one specific medical issue) Lack of food
Aging problems (arthritis, hearing or vision loss, etc.) Mental health problems
Asthma Not enough doctors
Cancer Obesity
Crime Poor nutrition
Dental problems Senior care
Diabetes Sexually transmitted diseases (STDs)
Domestic violence Teenage pregnancy
Flu Unsafe living conditions
Heart disease and stroke Unsafe work environment
Other ____________________________________ Women's issues
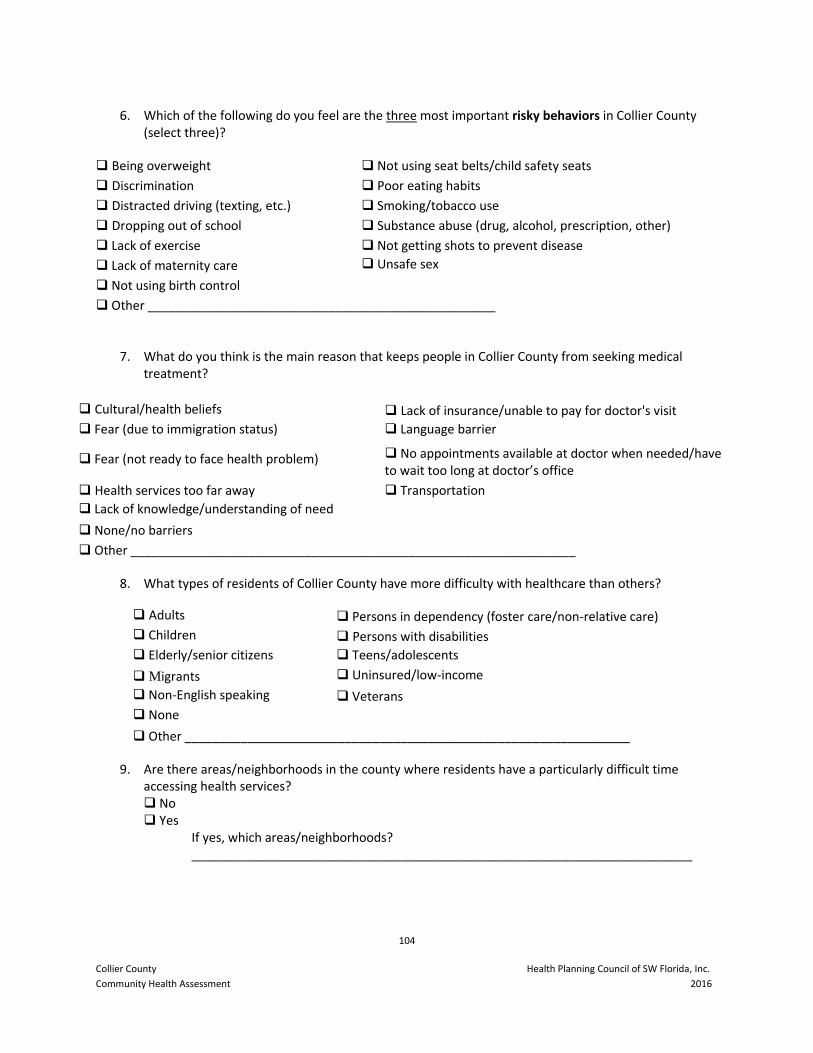
104
Collier County Health Planning Council of SW Florida, Inc.
Community Health Assessment 2016
6. Which of the following do you feel are the three most important risky behaviors in Collier County (select three)?
Being overweight Not using seat belts/child safety seats
Discrimination Poor eating habits
Distracted driving (texting, etc.) Smoking/tobacco use
Dropping out of school Substance abuse (drug, alcohol, prescription, other)
Lack of exercise Not getting shots to prevent disease
Lack of maternity care Unsafe sex
Not using birth control Other __________________________________________________
7. What do you think is the main reason that keeps people in Collier County from seeking medical treatment?
Cultural/health beliefs Lack of insurance/unable to pay for doctor's visit
Fear (due to immigration status) Language barrier
Fear (not ready to face health problem) No appointments available at doctor when needed/have to wait too long at doctor’s office
Health services too far away Transportation
Lack of knowledge/understanding of need
None/no barriers
Other ________________________________________________________________
8. What types of residents of Collier County have more difficulty with healthcare than others?
Adults Persons in dependency (foster care/non-relative care)
Children Persons with disabilities
Elderly/senior citizens Teens/adolescents
Migrants Uninsured/low-income
Non-English speaking Veterans
None
Other ________________________________________________________________
9. Are there areas/neighborhoods in the county where residents have a particularly difficult time accessing health services? No Yes
If yes, which areas/neighborhoods? ________________________________________________________________________
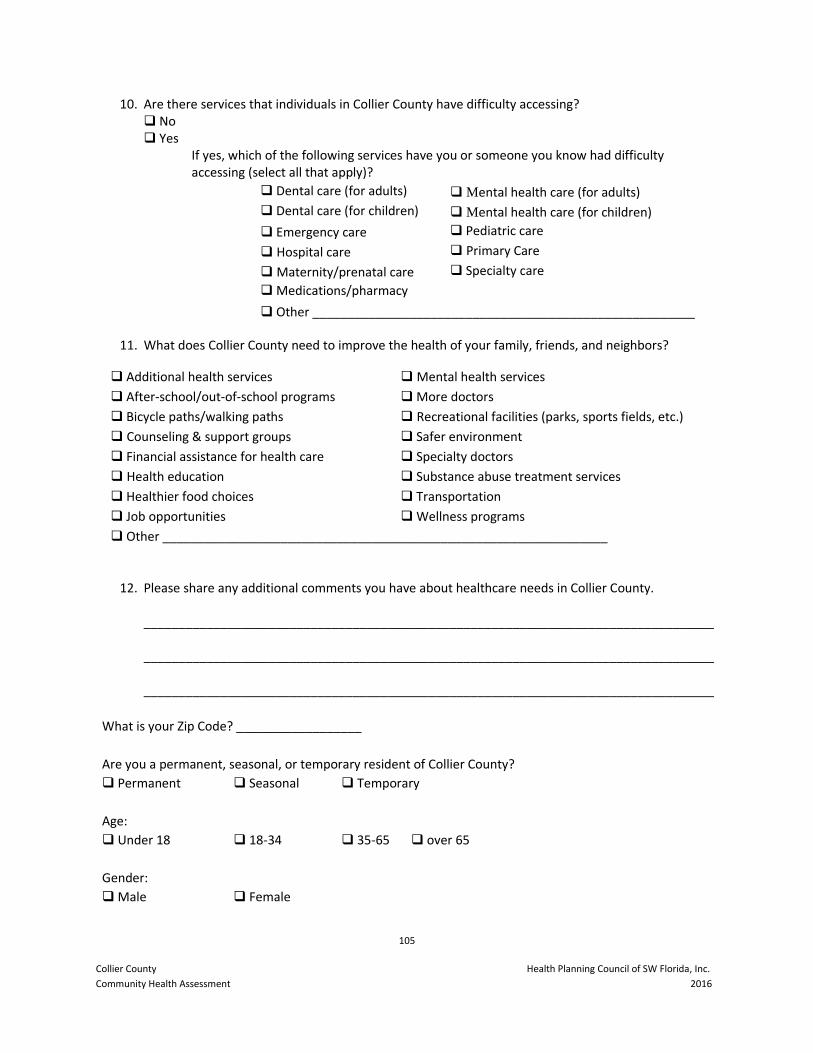
105
Collier County Health Planning Council of SW Florida, Inc.
Community Health Assessment 2016
10. Are there services that individuals in Collier County have difficulty accessing? No Yes
If yes, which of the following services have you or someone you know had difficulty accessing (select all that apply)?
Dental care (for adults) Mental health care (for adults)
Dental care (for children) Mental health care (for children)
Emergency care Pediatric care
Hospital care Primary Care
Maternity/prenatal care Specialty care
Medications/pharmacy
Other _______________________________________________________
11. What does Collier County need to improve the health of your family, friends, and neighbors?
Additional health services Mental health services
After-school/out-of-school programs More doctors
Bicycle paths/walking paths Recreational facilities (parks, sports fields, etc.)
Counseling & support groups Safer environment
Financial assistance for health care Specialty doctors
Health education Substance abuse treatment services
Healthier food choices Transportation
Job opportunities Wellness programs
Other ________________________________________________________________
12. Please share any additional comments you have about healthcare needs in Collier County.
__________________________________________________________________________________
__________________________________________________________________________________
__________________________________________________________________________________
What is your Zip Code? __________________
Are you a permanent, seasonal, or temporary resident of Collier County?
Permanent Seasonal Temporary
Age: Under 18 18-34 35-65 over 65
Gender: Male Female
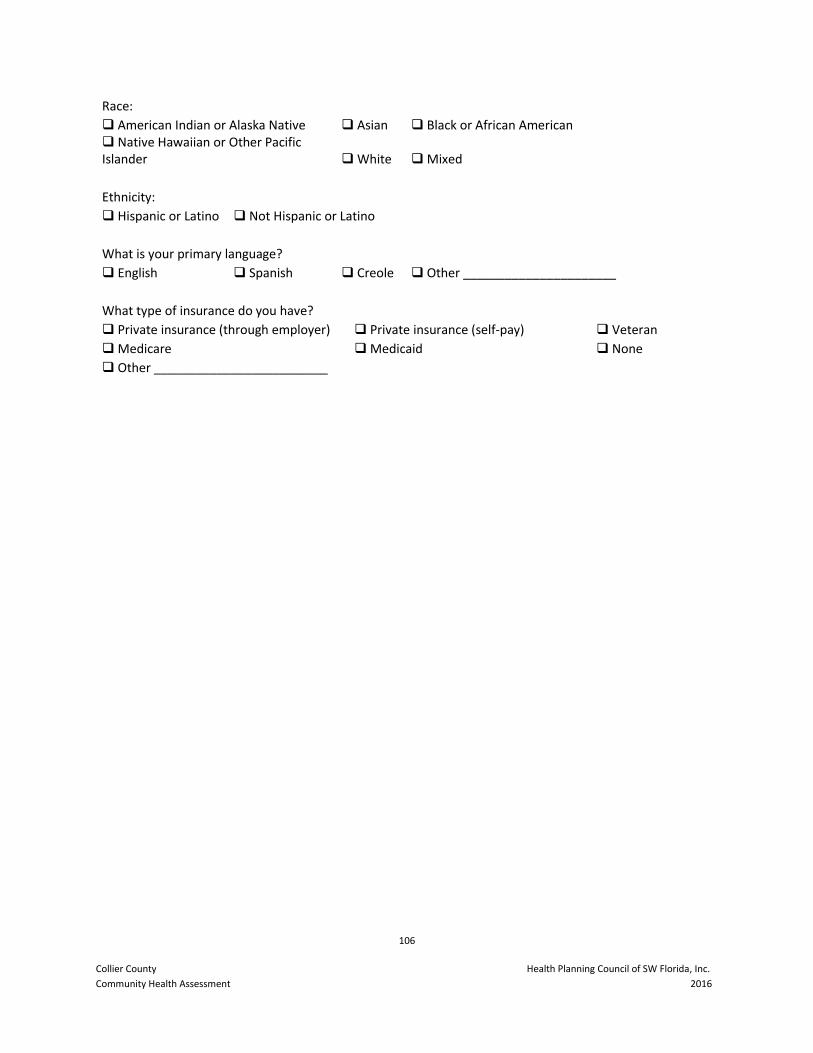
106
Collier County Health Planning Council of SW Florida, Inc.
Community Health Assessment 2016
Race: American Indian or Alaska Native Asian Black or African American
Native Hawaiian or Other Pacific Islander White Mixed
Ethnicity: Hispanic or Latino Not Hispanic or Latino
What is your primary language?
English Spanish Creole Other ______________________
What type of insurance do you have?
Private insurance (through employer) Private insurance (self-pay) Veteran
Medicare Medicaid None
Other _________________________
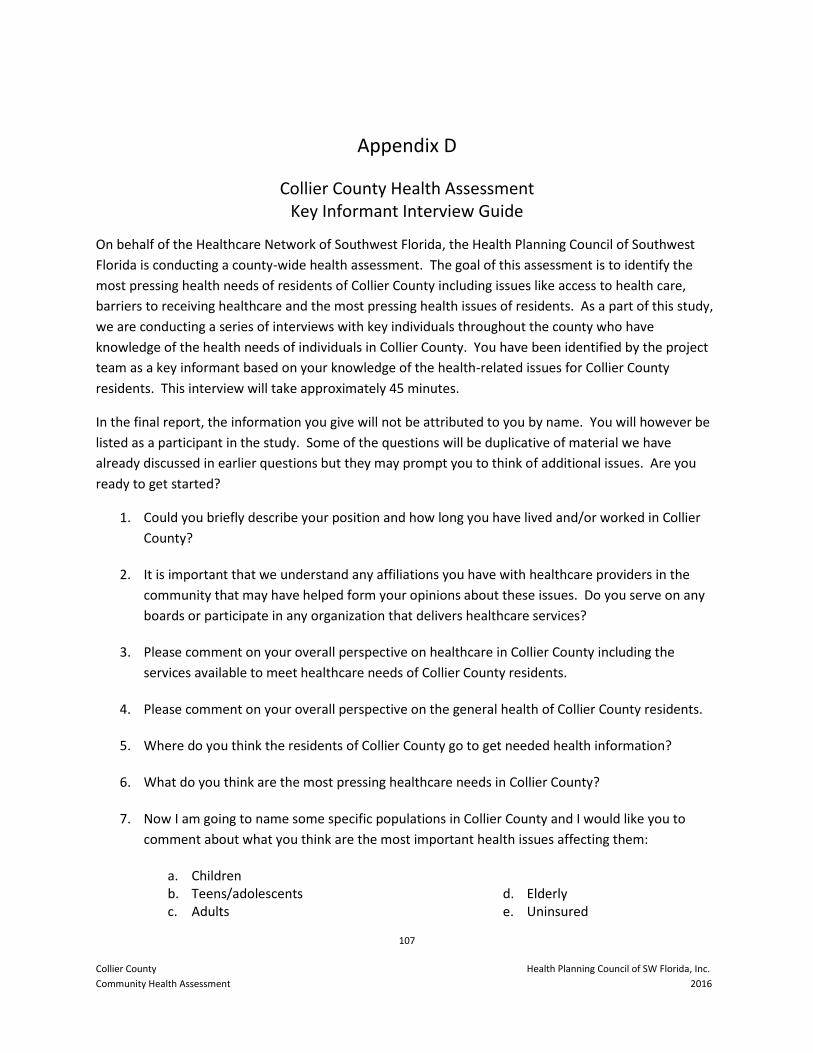
107
Collier County Health Planning Council of SW Florida, Inc.
Community Health Assessment 2016
Appendix D
Collier County Health Assessment Key Informant Interview Guide
On behalf of the Healthcare Network of Southwest Florida, the Health Planning Council of Southwest
Florida is conducting a county-wide health assessment. The goal of this assessment is to identify the
most pressing health needs of residents of Collier County including issues like access to health care,
barriers to receiving healthcare and the most pressing health issues of residents. As a part of this study,
we are conducting a series of interviews with key individuals throughout the county who have
knowledge of the health needs of individuals in Collier County. You have been identified by the project
team as a key informant based on your knowledge of the health-related issues for Collier County
residents. This interview will take approximately 45 minutes.
In the final report, the information you give will not be attributed to you by name. You will however be
listed as a participant in the study. Some of the questions will be duplicative of material we have
already discussed in earlier questions but they may prompt you to think of additional issues. Are you
ready to get started?
1. Could you briefly describe your position and how long you have lived and/or worked in Collier
County?
2. It is important that we understand any affiliations you have with healthcare providers in the
community that may have helped form your opinions about these issues. Do you serve on any
boards or participate in any organization that delivers healthcare services?
3. Please comment on your overall perspective on healthcare in Collier County including the
services available to meet healthcare needs of Collier County residents.
4. Please comment on your overall perspective on the general health of Collier County residents.
5. Where do you think the residents of Collier County go to get needed health information?
6. What do you think are the most pressing healthcare needs in Collier County?
7. Now I am going to name some specific populations in Collier County and I would like you to
comment about what you think are the most important health issues affecting them:
a. Children b. Teens/adolescents c. Adults
d. Elderly e. Uninsured
108
Collier County Health Planning Council of SW Florida, Inc.
Community Health Assessment 2016
f. Veterans 8. What types of residents of Collier County have more difficulty with healthcare than others?
What are these difficulties? Why do you believe these folks have more difficulties with
healthcare? What actions are necessary to address this issue?
9. Do you know where Collier County residents who have difficulty paying go to receive services?
10. What do you think are the essential components of a quality healthcare system for a community
like Collier County? Are these components currently in Collier County?
11. I am going to name some specific types of services and ask you to share any impressions you
have about them, particularly anything you know about how these services are available to all
persons in Collier County and whether there are any obstacles to receiving these types of
services:
a. Primary care b. Dental care c. Specialty care d. Mental Health care
e. Substance Abuse treatment f. Emergency care g. Hospital care
h. Hospice care i. Pediatric/Neonatal Care
12. Are there other types of services that individuals in Collier County have difficulty accessing?
13. Are there services that individuals in Collier County must go outside of the county to receive?
14. Are there areas/neighborhoods in the County where residents have a particularly difficult time
accessing services?
15. We often hear that transportation is an issue that impacts accessing needed health care. Is this
something that you have seen in the community?
16. Of all the issues and services we have discussed, which do you think is the most important
health care issue?
17. What actions are necessary to address this issue? Who do you think should take responsibility
for addressing this issue?
18. Do you have any additional comments you would like to share about health care needs in Collier
County?
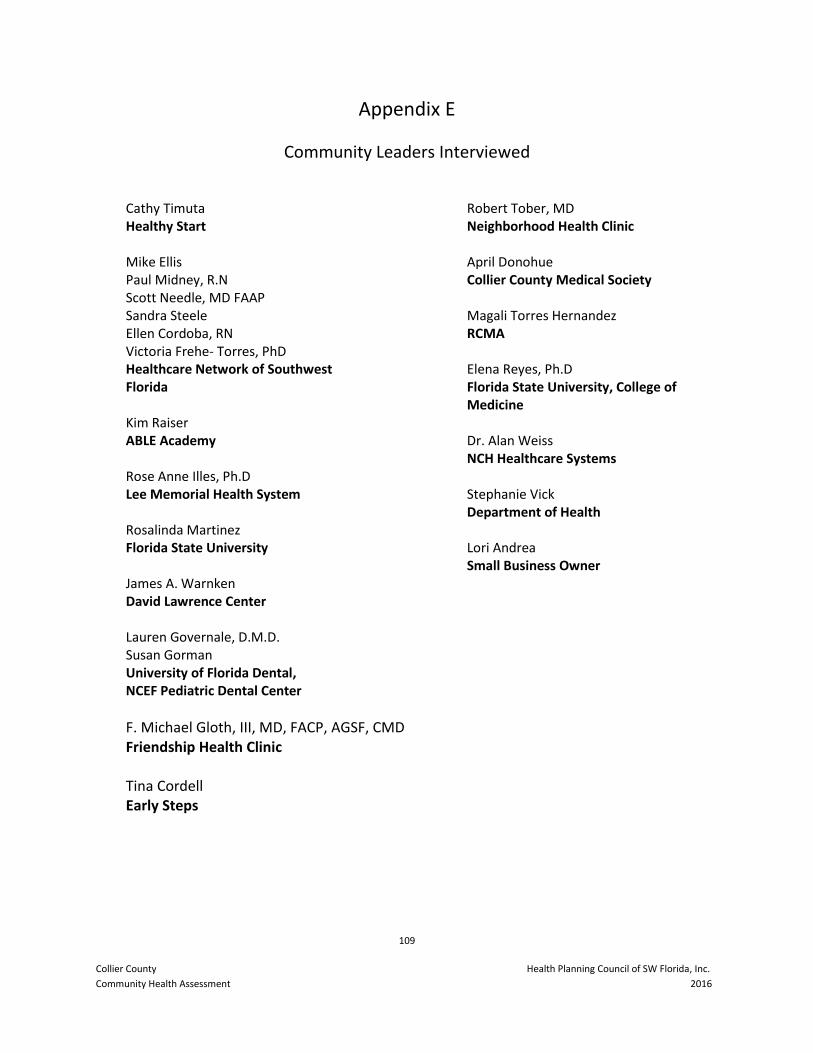
109
Collier County Health Planning Council of SW Florida, Inc.
Community Health Assessment 2016
Appendix E
Community Leaders Interviewed
Cathy Timuta Healthy Start Mike Ellis Paul Midney, R.N Scott Needle, MD FAAP Sandra Steele Ellen Cordoba, RN Victoria Frehe- Torres, PhD Healthcare Network of Southwest Florida Kim Raiser ABLE Academy Rose Anne Illes, Ph.D Lee Memorial Health System Rosalinda Martinez Florida State University James A. Warnken David Lawrence Center
Robert Tober, MD Neighborhood Health Clinic April Donohue Collier County Medical Society Magali Torres Hernandez RCMA Elena Reyes, Ph.D Florida State University, College of Medicine Dr. Alan Weiss NCH Healthcare Systems Stephanie Vick Department of Health Lori Andrea Small Business Owner
Lauren Governale, D.M.D. Susan Gorman University of Florida Dental, NCEF Pediatric Dental Center
F. Michael Gloth, III, MD, FACP, AGSF, CMD Friendship Health Clinic Tina Cordell Early Steps
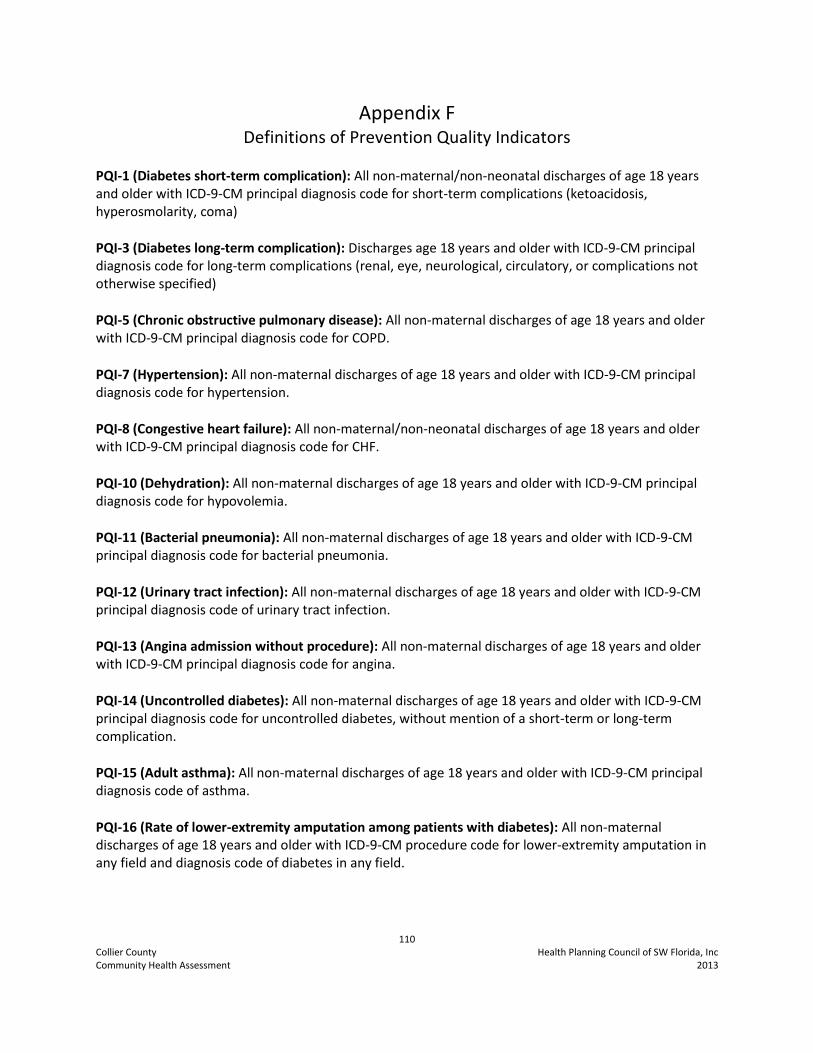
110 Collier County Health Planning Council of SW Florida, Inc Community Health Assessment 2013
Appendix F
Definitions of Prevention Quality Indicators
PQI-1 (Diabetes short-term complication): All non-maternal/non-neonatal discharges of age 18 years and older with ICD-9-CM principal diagnosis code for short-term complications (ketoacidosis, hyperosmolarity, coma)
PQI-3 (Diabetes long-term complication): Discharges age 18 years and older with ICD-9-CM principal diagnosis code for long-term complications (renal, eye, neurological, circulatory, or complications not otherwise specified)
PQI-5 (Chronic obstructive pulmonary disease): All non-maternal discharges of age 18 years and older with ICD-9-CM principal diagnosis code for COPD.
PQI-7 (Hypertension): All non-maternal discharges of age 18 years and older with ICD-9-CM principal diagnosis code for hypertension.
PQI-8 (Congestive heart failure): All non-maternal/non-neonatal discharges of age 18 years and older with ICD-9-CM principal diagnosis code for CHF.
PQI-10 (Dehydration): All non-maternal discharges of age 18 years and older with ICD-9-CM principal diagnosis code for hypovolemia.
PQI-11 (Bacterial pneumonia): All non-maternal discharges of age 18 years and older with ICD-9-CM principal diagnosis code for bacterial pneumonia.
PQI-12 (Urinary tract infection): All non-maternal discharges of age 18 years and older with ICD-9-CM principal diagnosis code of urinary tract infection.
PQI-13 (Angina admission without procedure): All non-maternal discharges of age 18 years and older with ICD-9-CM principal diagnosis code for angina.
PQI-14 (Uncontrolled diabetes): All non-maternal discharges of age 18 years and older with ICD-9-CM principal diagnosis code for uncontrolled diabetes, without mention of a short-term or long-term complication.
PQI-15 (Adult asthma): All non-maternal discharges of age 18 years and older with ICD-9-CM principal diagnosis code of asthma.
PQI-16 (Rate of lower-extremity amputation among patients with diabetes): All non-maternal discharges of age 18 years and older with ICD-9-CM procedure code for lower-extremity amputation in any field and diagnosis code of diabetes in any field.
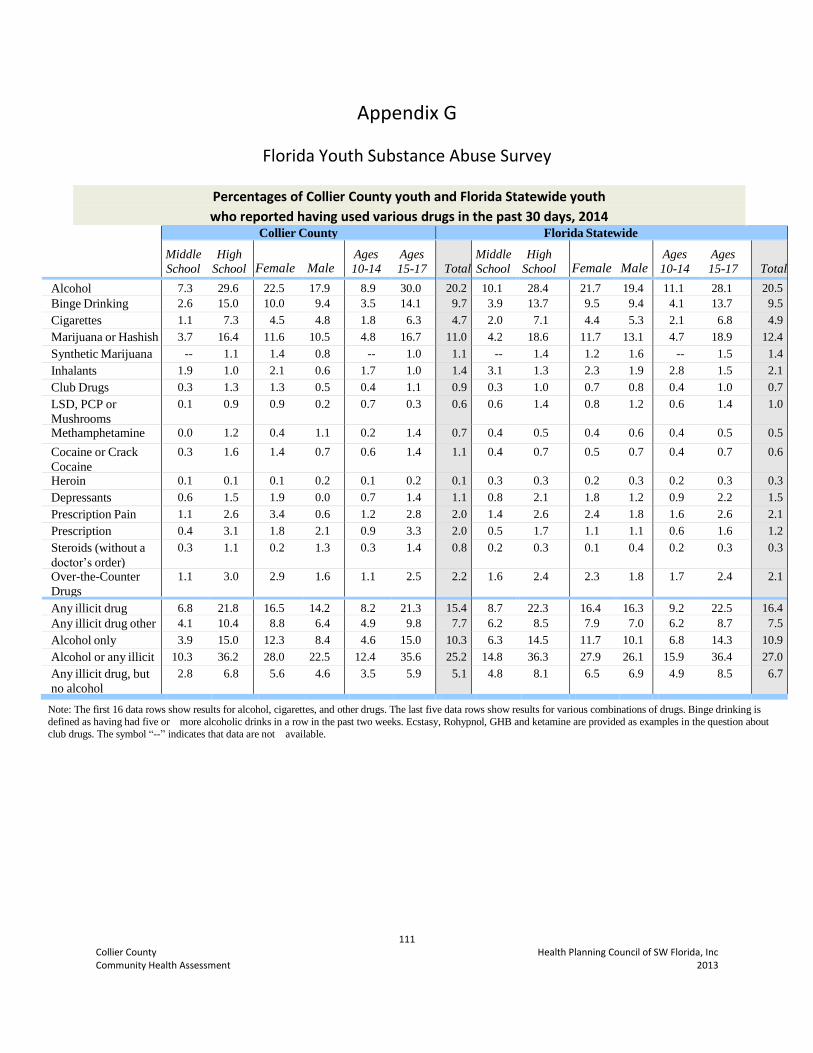
111 Collier County Health Planning Council of SW Florida, Inc Community Health Assessment 2013
Appendix G
Florida Youth Substance Abuse Survey
Percentages of Collier County youth and Florida Statewide youth
who reported having used various drugs in the past 30 days, 2014
Collier County Florida Statewide
Middle
School
High
School
Female
Male
Ages
10-14
Ages
15-17
Total
Middle
School
High
School
Female
Male
Ages
10-14
Ages
15-17
Total
Alcohol 7.3 29.6 22.5 17.9 8.9 30.0 20.2 10.1 28.4 21.7 19.4 11.1 28.1 20.5
Binge Drinking 2.6 15.0 10.0 9.4 3.5 14.1 9.7 3.9 13.7 9.5 9.4 4.1 13.7 9.5
Cigarettes 1.1 7.3 4.5 4.8 1.8 6.3 4.7 2.0 7.1 4.4 5.3 2.1 6.8 4.9
Marijuana or Hashish 3.7 16.4 11.6 10.5 4.8 16.7 11.0 4.2 18.6 11.7 13.1 4.7 18.9 12.4
Synthetic Marijuana -- 1.1 1.4 0.8 -- 1.0 1.1 -- 1.4 1.2 1.6 -- 1.5 1.4
Inhalants 1.9 1.0 2.1 0.6 1.7 1.0 1.4 3.1 1.3 2.3 1.9 2.8 1.5 2.1
Club Drugs 0.3 1.3 1.3 0.5 0.4 1.1 0.9 0.3 1.0 0.7 0.8 0.4 1.0 0.7
LSD, PCP or
Mushrooms
0.1 0.9 0.9 0.2 0.7 0.3 0.6 0.6 1.4 0.8 1.2 0.6 1.4 1.0
Methamphetamine 0.0 1.2 0.4 1.1 0.2 1.4 0.7 0.4 0.5 0.4 0.6 0.4 0.5 0.5
Cocaine or Crack
Cocaine
0.3 1.6 1.4 0.7 0.6 1.4 1.1 0.4 0.7 0.5 0.7 0.4 0.7 0.6
Heroin 0.1 0.1 0.1 0.2 0.1 0.2 0.1 0.3 0.3 0.2 0.3 0.2 0.3 0.3
Depressants 0.6 1.5 1.9 0.0 0.7 1.4 1.1 0.8 2.1 1.8 1.2 0.9 2.2 1.5
Prescription Pain
Relievers
1.1 2.6 3.4 0.6 1.2 2.8 2.0 1.4 2.6 2.4 1.8 1.6 2.6 2.1
Prescription
Amphetamines
0.4 3.1 1.8 2.1 0.9 3.3 2.0 0.5 1.7 1.1 1.1 0.6 1.6 1.2
Steroids (without a
doctor’s order)
0.3 1.1 0.2 1.3 0.3 1.4 0.8 0.2 0.3 0.1 0.4 0.2 0.3 0.3
Over-the-Counter
Drugs
1.1 3.0 2.9 1.6 1.1 2.5 2.2 1.6 2.4 2.3 1.8 1.7 2.4 2.1
Any illicit drug 6.8 21.8 16.5 14.2 8.2 21.3 15.4 8.7 22.3 16.4 16.3 9.2 22.5 16.4
Any illicit drug other
than marijuana
4.1 10.4 8.8 6.4 4.9 9.8 7.7 6.2 8.5 7.9 7.0 6.2 8.7 7.5
Alcohol only 3.9 15.0 12.3 8.4 4.6 15.0 10.3 6.3 14.5 11.7 10.1 6.8 14.3 10.9
Alcohol or any illicit
drug
10.3 36.2 28.0 22.5 12.4 35.6 25.2 14.8 36.3 27.9 26.1 15.9 36.4 27.0
Any illicit drug, but
no alcohol
2.8 6.8 5.6 4.6 3.5 5.9 5.1 4.8 8.1 6.5 6.9 4.9 8.5 6.7
Note: The first 16 data rows show results for alcohol, cigarettes, and other drugs. The last five data rows show results for various combinations of drugs. Binge drinking is
defined as having had five or more alcoholic drinks in a row in the past two weeks. Ecstasy, Rohypnol, GHB and ketamine are provided as examples in the question about
club drugs. The symbol “--” indicates that data are not available.
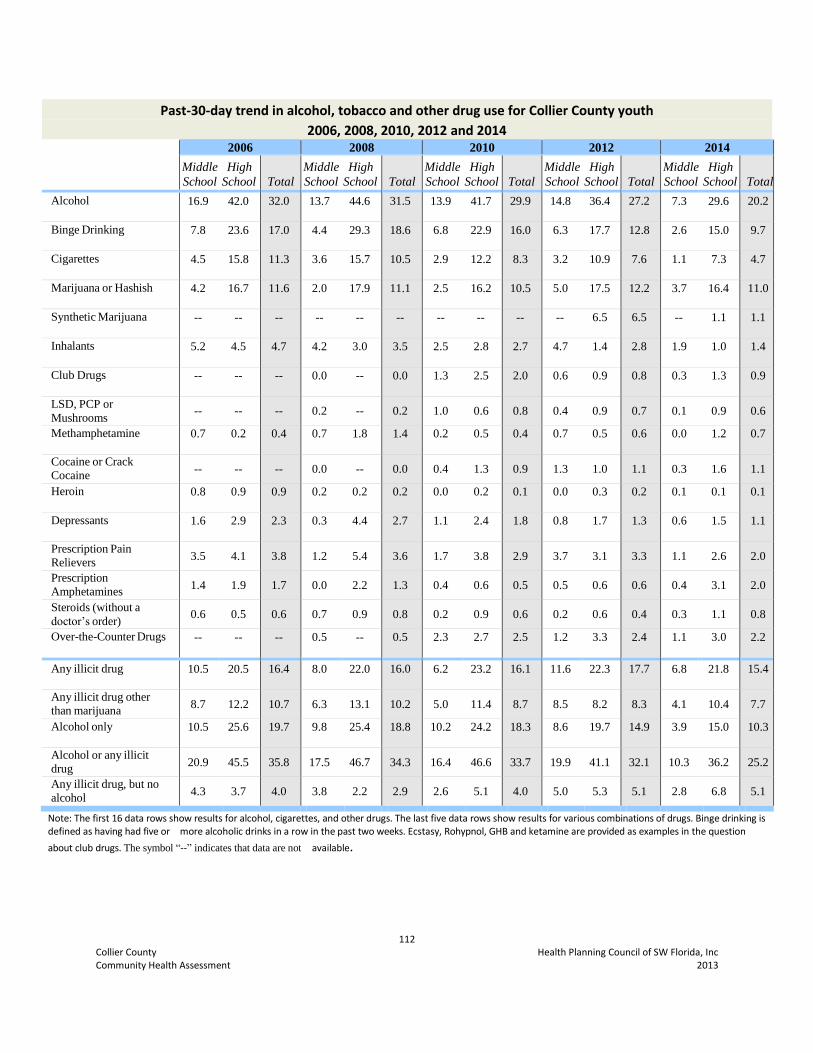
112 Collier County Health Planning Council of SW Florida, Inc Community Health Assessment 2013
Past-30-day trend in alcohol, tobacco and other drug use for Collier County youth
2006, 2008, 2010, 2012 and 2014
2006 2008 2010 2012 2014
Middle High
School School
Total
Middle High
School School
Total
Middle High
School School
Total
Middle High
School School
Total
Middle High
School School
Total
Alcohol 16.9 42.0 32.0 13.7 44.6 31.5 13.9 41.7 29.9 14.8 36.4 27.2 7.3 29.6 20.2
Binge Drinking 7.8 23.6 17.0 4.4 29.3 18.6 6.8 22.9 16.0 6.3 17.7 12.8 2.6 15.0 9.7
Cigarettes 4.5 15.8 11.3 3.6 15.7 10.5 2.9 12.2 8.3 3.2 10.9 7.6 1.1 7.3 4.7
Marijuana or Hashish 4.2 16.7 11.6 2.0 17.9 11.1 2.5 16.2 10.5 5.0 17.5 12.2 3.7 16.4 11.0
Synthetic Marijuana -- -- -- -- -- -- -- -- -- -- 6.5 6.5 -- 1.1 1.1
Inhalants 5.2 4.5 4.7 4.2 3.0 3.5 2.5 2.8 2.7 4.7 1.4 2.8 1.9 1.0 1.4
Club Drugs -- -- -- 0.0 -- 0.0 1.3 2.5 2.0 0.6 0.9 0.8 0.3 1.3 0.9
LSD, PCP or
Mushrooms -- -- -- 0.2 -- 0.2 1.0 0.6 0.8 0.4 0.9 0.7 0.1 0.9 0.6
Methamphetamine 0.7 0.2 0.4 0.7 1.8 1.4 0.2 0.5 0.4 0.7 0.5 0.6 0.0 1.2 0.7
Cocaine or Crack
Cocaine -- -- -- 0.0 -- 0.0 0.4 1.3 0.9 1.3 1.0 1.1 0.3 1.6 1.1
Heroin 0.8 0.9 0.9 0.2 0.2 0.2 0.0 0.2 0.1 0.0 0.3 0.2 0.1 0.1 0.1
Depressants 1.6 2.9 2.3 0.3 4.4 2.7 1.1 2.4 1.8 0.8 1.7 1.3 0.6 1.5 1.1
Prescription Pain
Relievers 3.5 4.1 3.8 1.2 5.4 3.6 1.7 3.8 2.9 3.7 3.1 3.3 1.1 2.6 2.0
Prescription
Amphetamines 1.4 1.9 1.7 0.0 2.2 1.3 0.4 0.6 0.5 0.5 0.6 0.6 0.4 3.1 2.0
Steroids (without a
doctor’s order) 0.6 0.5 0.6 0.7 0.9 0.8 0.2 0.9 0.6 0.2 0.6 0.4 0.3 1.1 0.8
Over-the-Counter Drugs -- -- -- 0.5 -- 0.5 2.3 2.7 2.5 1.2 3.3 2.4 1.1 3.0 2.2
Any illicit drug 10.5 20.5 16.4 8.0 22.0 16.0 6.2 23.2 16.1 11.6 22.3 17.7 6.8 21.8 15.4
Any illicit drug other
than marijuana 8.7 12.2 10.7 6.3 13.1 10.2 5.0 11.4 8.7 8.5 8.2 8.3 4.1 10.4 7.7
Alcohol only 10.5 25.6 19.7 9.8 25.4 18.8 10.2 24.2 18.3 8.6 19.7 14.9 3.9 15.0 10.3
Alcohol or any illicit
drug 20.9 45.5 35.8 17.5 46.7 34.3 16.4 46.6 33.7 19.9 41.1 32.1 10.3 36.2 25.2
Any illicit drug, but no
alcohol 4.3 3.7 4.0 3.8 2.2 2.9 2.6 5.1 4.0 5.0 5.3 5.1 2.8 6.8 5.1
Note: The first 16 data rows show results for alcohol, cigarettes, and other drugs. The last five data rows show results for various combinations of drugs. Binge drinking is defined as having had five or more alcoholic drinks in a row in the past two weeks. Ecstasy, Rohypnol, GHB and ketamine are provided as examples in the question
about club drugs. The symbol “--” indicates that data are not available.
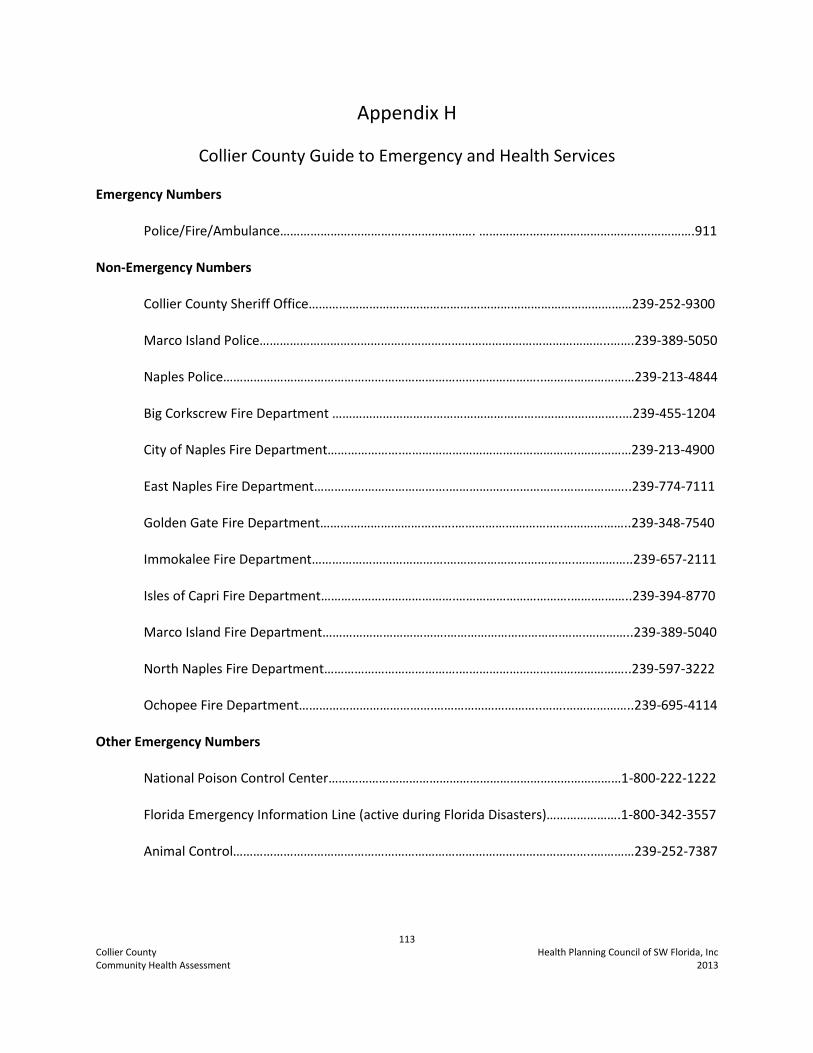
113 Collier County Health Planning Council of SW Florida, Inc Community Health Assessment 2013
Appendix H
Collier County Guide to Emergency and Health Services
Emergency Numbers
Police/Fire/Ambulance…………………………………………………. ……………………………………………………….911
Non-Emergency Numbers
Collier County Sheriff Office……………………………………………………………………………………239-252-9300
Marco Island Police…………………………………………………………………………………………..…….239-389-5050
Naples Police…………………………………………………………………………………..………………………239-213-4844
Big Corkscrew Fire Department …………………………………………………………………………..…239-455-1204
City of Naples Fire Department………………….……………………………………………..……………239-213-4900
East Naples Fire Department………………………………….…………………………….………………..239-774-7111
Golden Gate Fire Department………………………………….……………………….….………………..239-348-7540
Immokalee Fire Department………………………………….…………………………….….……………..239-657-2111
Isles of Capri Fire Department………………………………….…………………………….…….………..239-394-8770
Marco Island Fire Department……………………………….…………………………….…….…………..239-389-5040
North Naples Fire Department………………………………….……………………….…………………..239-597-3222
Ochopee Fire Department………………………………….…………………………..…….………………..239-695-4114
Other Emergency Numbers
National Poison Control Center……………………………………………………………………………1-800-222-1222
Florida Emergency Information Line (active during Florida Disasters)………………….1-800-342-3557
Animal Control……………………………………………………………………………………………..…………239-252-7387
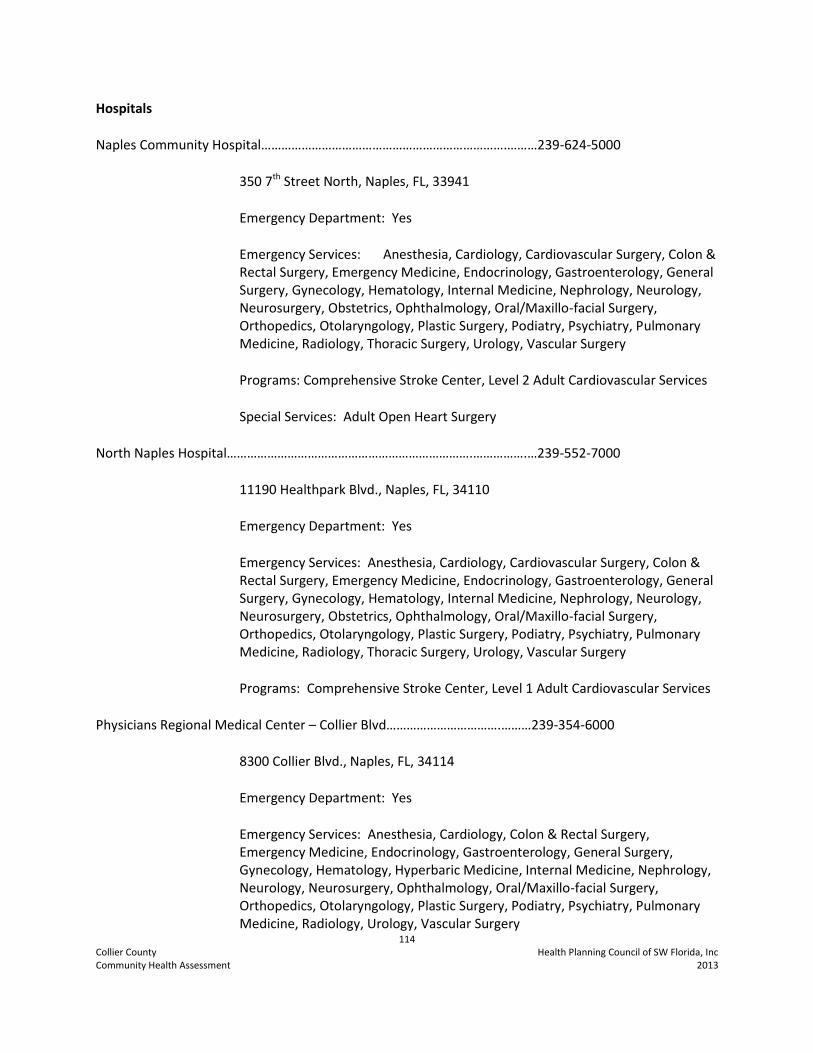
114 Collier County Health Planning Council of SW Florida, Inc Community Health Assessment 2013
Hospitals
Naples Community Hospital……………………………………………………………….………239-624-5000
350 7th Street North, Naples, FL, 33941
Emergency Department: Yes
Emergency Services: Anesthesia, Cardiology, Cardiovascular Surgery, Colon & Rectal Surgery, Emergency Medicine, Endocrinology, Gastroenterology, General Surgery, Gynecology, Hematology, Internal Medicine, Nephrology, Neurology, Neurosurgery, Obstetrics, Ophthalmology, Oral/Maxillo-facial Surgery, Orthopedics, Otolaryngology, Plastic Surgery, Podiatry, Psychiatry, Pulmonary Medicine, Radiology, Thoracic Surgery, Urology, Vascular Surgery
Programs: Comprehensive Stroke Center, Level 2 Adult Cardiovascular Services
Special Services: Adult Open Heart Surgery
North Naples Hospital……………………………………………………………….…………….…239-552-7000
11190 Healthpark Blvd., Naples, FL, 34110
Emergency Department: Yes
Emergency Services: Anesthesia, Cardiology, Cardiovascular Surgery, Colon & Rectal Surgery, Emergency Medicine, Endocrinology, Gastroenterology, General Surgery, Gynecology, Hematology, Internal Medicine, Nephrology, Neurology, Neurosurgery, Obstetrics, Ophthalmology, Oral/Maxillo-facial Surgery, Orthopedics, Otolaryngology, Plastic Surgery, Podiatry, Psychiatry, Pulmonary Medicine, Radiology, Thoracic Surgery, Urology, Vascular Surgery
Programs: Comprehensive Stroke Center, Level 1 Adult Cardiovascular Services
Physicians Regional Medical Center – Collier Blvd…………………………….………239-354-6000
8300 Collier Blvd., Naples, FL, 34114
Emergency Department: Yes
Emergency Services: Anesthesia, Cardiology, Colon & Rectal Surgery, Emergency Medicine, Endocrinology, Gastroenterology, General Surgery, Gynecology, Hematology, Hyperbaric Medicine, Internal Medicine, Nephrology, Neurology, Neurosurgery, Ophthalmology, Oral/Maxillo-facial Surgery, Orthopedics, Otolaryngology, Plastic Surgery, Podiatry, Psychiatry, Pulmonary Medicine, Radiology, Urology, Vascular Surgery
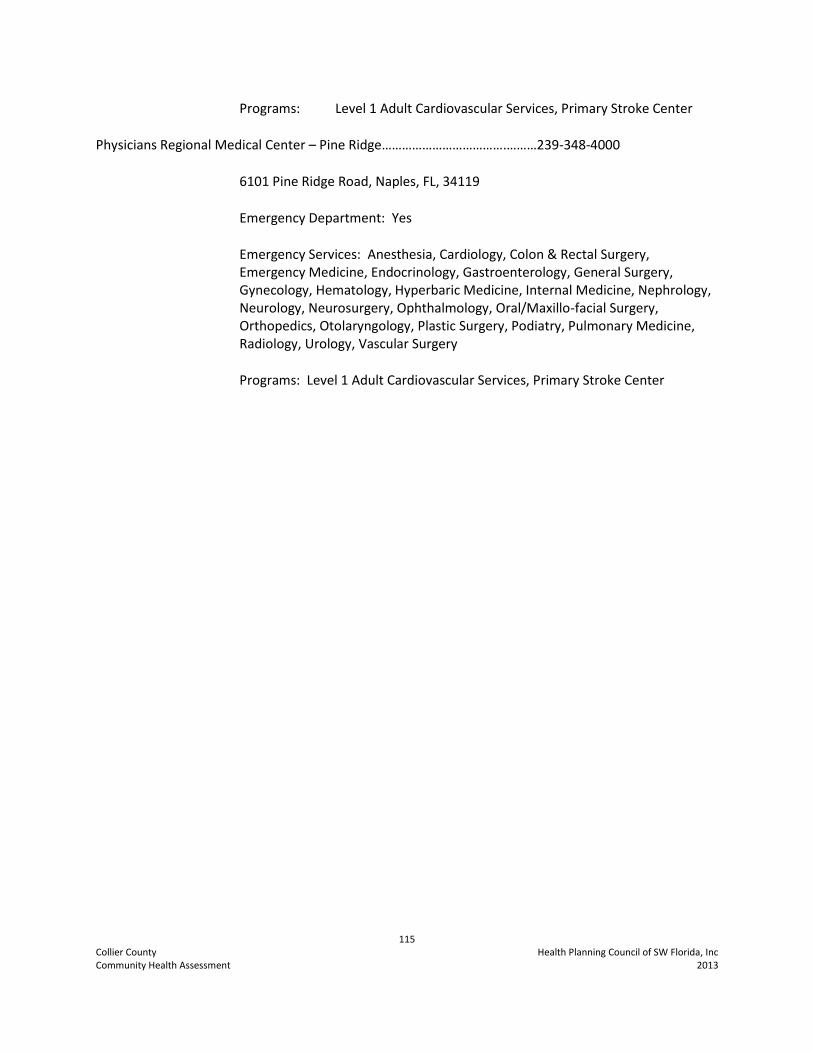
115 Collier County Health Planning Council of SW Florida, Inc Community Health Assessment 2013
Programs: Level 1 Adult Cardiovascular Services, Primary Stroke Center
Physicians Regional Medical Center – Pine Ridge……………………………….………239-348-4000
6101 Pine Ridge Road, Naples, FL, 34119
Emergency Department: Yes
Emergency Services: Anesthesia, Cardiology, Colon & Rectal Surgery, Emergency Medicine, Endocrinology, Gastroenterology, General Surgery, Gynecology, Hematology, Hyperbaric Medicine, Internal Medicine, Nephrology, Neurology, Neurosurgery, Ophthalmology, Oral/Maxillo-facial Surgery, Orthopedics, Otolaryngology, Plastic Surgery, Podiatry, Pulmonary Medicine, Radiology, Urology, Vascular Surgery
Programs: Level 1 Adult Cardiovascular Services, Primary Stroke Center
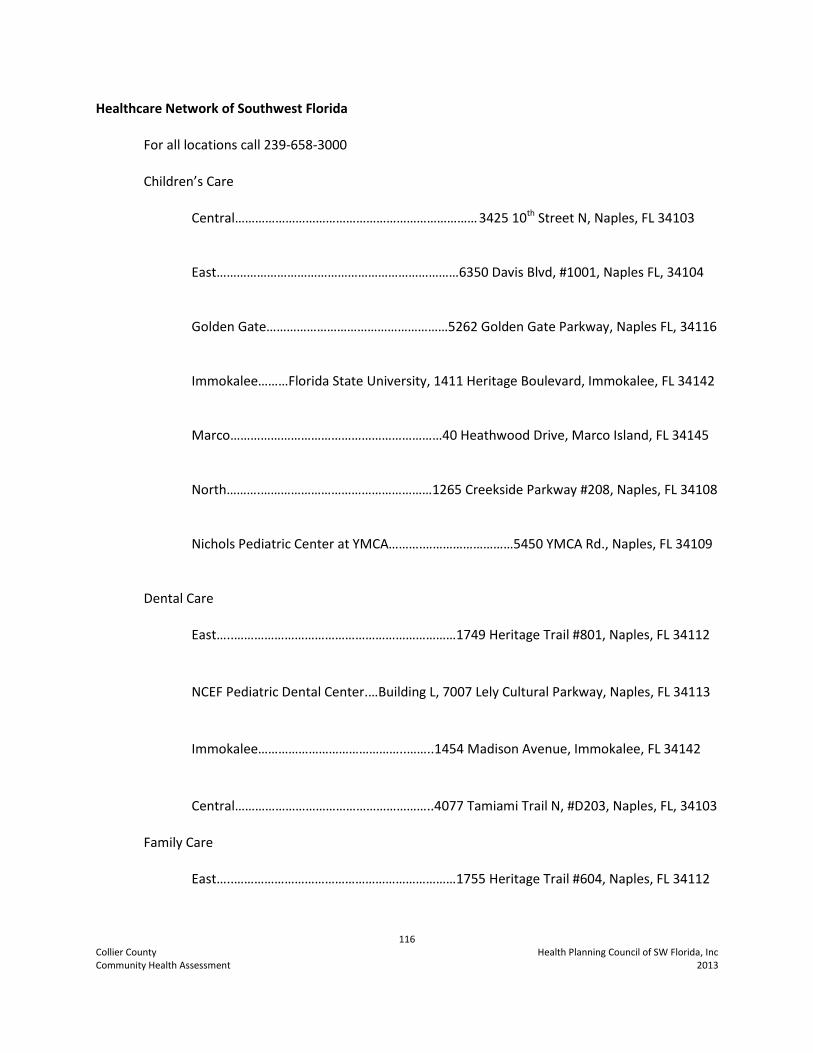
116 Collier County Health Planning Council of SW Florida, Inc Community Health Assessment 2013
Healthcare Network of Southwest Florida
For all locations call 239-658-3000
Children’s Care
Central……………………………………………………………… 3425 10th Street N, Naples, FL 34103
East………………………………………………………………6350 Davis Blvd, #1001, Naples FL, 34104
Golden Gate………………………………………………5262 Golden Gate Parkway, Naples FL, 34116
Immokalee………Florida State University, 1411 Heritage Boulevard, Immokalee, FL 34142
Marco………………………………………………………40 Heathwood Drive, Marco Island, FL 34145
North……….……………………………………………1265 Creekside Parkway #208, Naples, FL 34108
Nichols Pediatric Center at YMCA……….………………………5450 YMCA Rd., Naples, FL 34109
Dental Care
East…..…………………………………………………………1749 Heritage Trail #801, Naples, FL 34112
NCEF Pediatric Dental Center.…Building L, 7007 Lely Cultural Parkway, Naples, FL 34113
Immokalee……………………………………..……..1454 Madison Avenue, Immokalee, FL 34142
Central…………………………………………………..4077 Tamiami Trail N, #D203, Naples, FL, 34103
Family Care
East…..…………………………………………………………1755 Heritage Trail #604, Naples, FL 34112
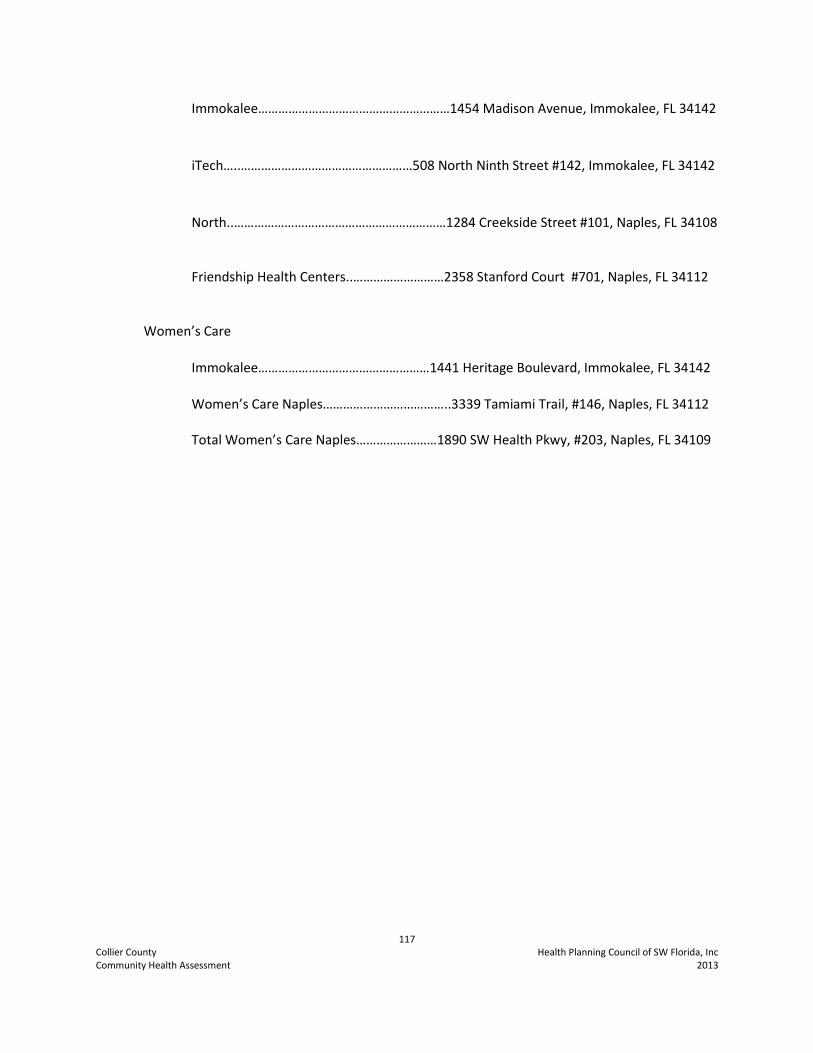
117 Collier County Health Planning Council of SW Florida, Inc Community Health Assessment 2013
Immokalee…………………………………………………1454 Madison Avenue, Immokalee, FL 34142
iTech…..……………………………………………508 North Ninth Street #142, Immokalee, FL 34142
North..………………………………………………………1284 Creekside Street #101, Naples, FL 34108
Friendship Health Centers..………………………2358 Stanford Court #701, Naples, FL 34112
Women’s Care
Immokalee……………………………………………1441 Heritage Boulevard, Immokalee, FL 34142
Women’s Care Naples………………………………..3339 Tamiami Trail, #146, Naples, FL 34112
Total Women’s Care Naples……………………1890 SW Health Pkwy, #203, Naples, FL 34109
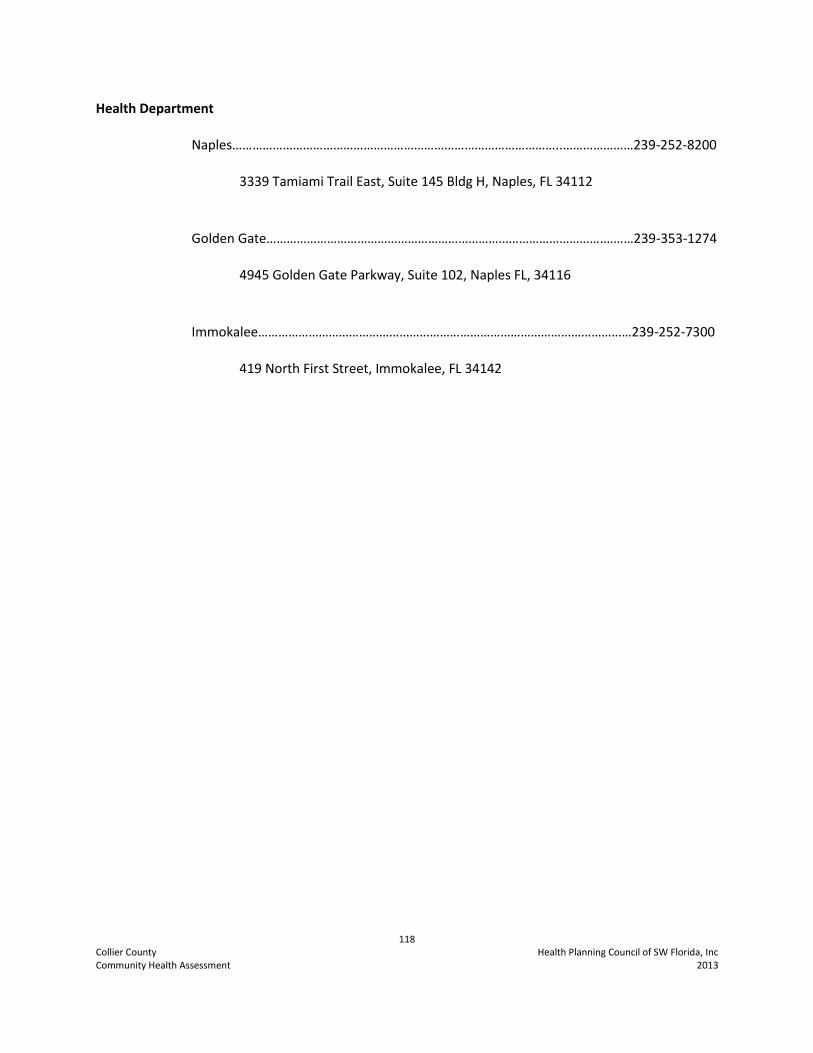
118 Collier County Health Planning Council of SW Florida, Inc Community Health Assessment 2013
Health Department
Naples……………………………………………………………………………………..…………………239-252-8200
3339 Tamiami Trail East, Suite 145 Bldg H, Naples, FL 34112
Golden Gate……………………………………………………………………………………….………239-353-1274
4945 Golden Gate Parkway, Suite 102, Naples FL, 34116
Immokalee…………………………………………………………………………………………………239-252-7300
419 North First Street, Immokalee, FL 34142
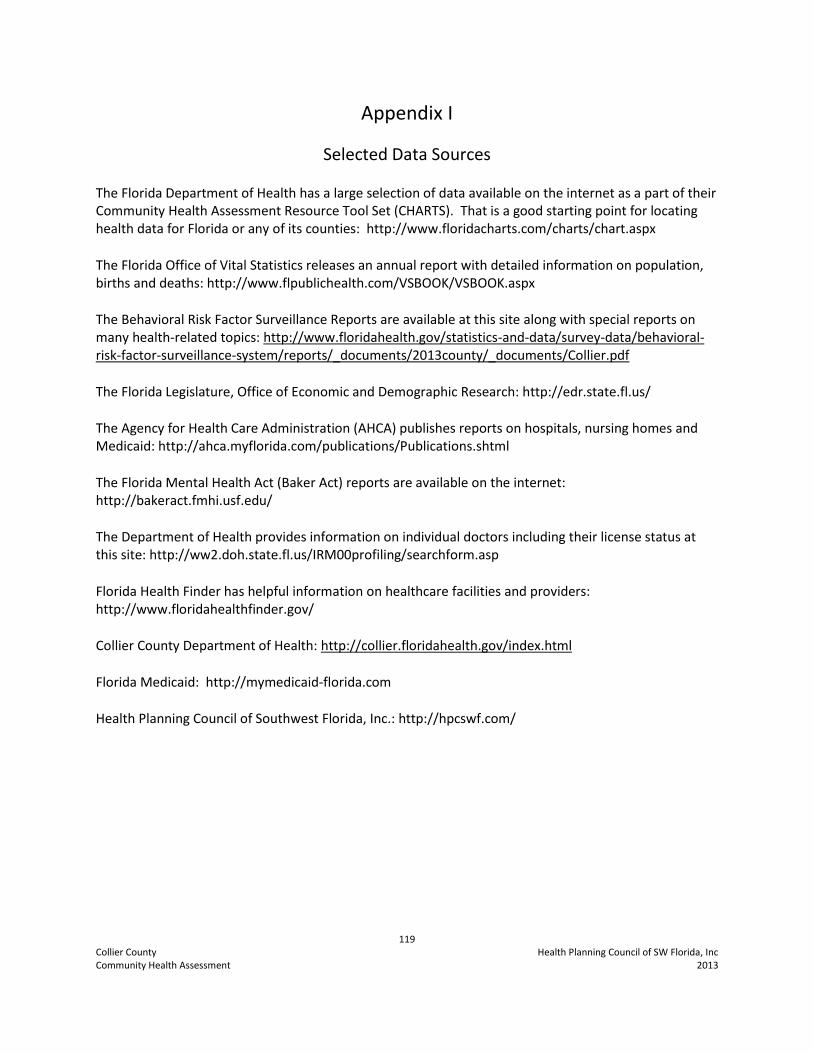
119 Collier County Health Planning Council of SW Florida, Inc Community Health Assessment 2013
Appendix I
Selected Data Sources
The Florida Department of Health has a large selection of data available on the internet as a part of their Community Health Assessment Resource Tool Set (CHARTS). That is a good starting point for locating health data for Florida or any of its counties: http://www.floridacharts.com/charts/chart.aspx
The Florida Office of Vital Statistics releases an annual report with detailed information on population, births and deaths: http://www.flpublichealth.com/VSBOOK/VSBOOK.aspx
The Behavioral Risk Factor Surveillance Reports are available at this site along with special reports on many health-related topics: http://www.floridahealth.gov/statistics-and-data/survey-data/behavioral-risk-factor-surveillance-system/reports/_documents/2013county/_documents/Collier.pdf
The Florida Legislature, Office of Economic and Demographic Research: http://edr.state.fl.us/
The Agency for Health Care Administration (AHCA) publishes reports on hospitals, nursing homes and Medicaid: http://ahca.myflorida.com/publications/Publications.shtml
The Florida Mental Health Act (Baker Act) reports are available on the internet: http://bakeract.fmhi.usf.edu/
The Department of Health provides information on individual doctors including their license status at this site: http://ww2.doh.state.fl.us/IRM00profiling/searchform.asp
Florida Health Finder has helpful information on healthcare facilities and providers: http://www.floridahealthfinder.gov/
Collier County Department of Health: http://collier.floridahealth.gov/index.html
Florida Medicaid: http://mymedicaid-florida.com
Health Planning Council of Southwest Florida, Inc.: http://hpcswf.com/