Embed Size (px)
Citation preview

The Effect of Water Occlusion on Gas Production in Coal Shilo Anthony Mahoney
Master of Science (Chemistry)
Master of Business Administration
A thesis submitted for the degree of Doctor of Philosophy at
The University of Queensland in 2017
School of Chemical Engineering

ii
Abstract
Relative permeability is of fundamental importance to understand and model the flow of
hydrocarbons and water in porous rocks including coal, and thus relative permeability is critical in
prediction of commercial gas and water production rates from coal seam gas (CSG) reservoirs.
Despite relative permeability being a primary parameter for determining reservoir performance, the
fundamental physics of how or where water may occlude or block cleats in a coal seam, and thereby
interfere with gas production rates, is not fully understood. This project aims to improve the
understanding of water occlusion in CSG reservoirs through fluid experiments with model coal cleats
and to evaluate the potential impact of water occlusion of reservoir performance.
The aim of this thesis is to develop a new experimental methodology that can be used identify the
main control factors that affect wettability in coal. There are two key objectives to satisfy the thesis
aim 1) develop methods to make artificial channels in coal and 2) create a world first microfluidic
device that assess micro scale flow through coal cleats, known as the cleat flow cell (CFC). The initial
features to be evaluated will include: lithotype, surface roughness, surface composition, specifically
chemical functional groups and pressure.
The first experimental chapter (Chapter Four) evaluates five different experimental methodologies
developed to create artificial micro cleats (20-40 µm) to replicate in situ coal cleat characteristics,
such as: width, depth, chemical and physical properties. A single channel was made in polished coal
from five different open Bowen Basin coal mines, Isaac Plains North (IPN), Oaky Creek (OAK),
Moorvale (MVL), Coppabella South (COP.S), and Coppabella East (COP.E) with a rank indicator
Rmax% 0.98 - 1.91 %. The techniques to create the channel included: reactive ion etching (RIE) in
oxygen plasma with a photolithography process to make the desired pattern on coal surface, UV Laser
ablation, mechanical machining, a mechanical scratch technique, and a chemical etching technique
that used potassium permanganate (KMnO4). Characteristics of the artificial channels were assessed
using a surface step profiler, scanning electron microscopy, micro-Raman spectroscopy and light
microscopy. A sixth methodology to create an artificial channel using pressed coal powder was also
used as a means of evaluating the influence of the surface chemistry on the wetting behaviour, without
the interference of surface topography.
In Chapter Five, I report the effect of rank and lithotype on the wettability of coal in microfluidic
experiments in two types of artificial microchannels; (1) reactive ion etched (RIE) channels and (2)
die-cast channels prepared by pressing powdered lithotype concentrates. Contact angles and entry
pressures of air and water in the artificial cleats were measured in imbibition experiments performed
iii
with a CFC. The relative contact angles measured in CFC imbibition experiments were in the range
110 -140° in the RIE channels and 85°-115° in the pressed discs, which are larger contact angles than
measured on the flat bulk surfaces of these samples by the conventional sessile drop technique (58°-
85°). The CFC observations show that the surface roughness of coal in inertinite-rich dull bands
effects contact angle and the entry pressure of the air-water interface differently to the vitrinite-rich
bright bands, with both lithotypes presenting unique wetting states. Drainage experiments revealed a
thin residual water film on the inertinite cleat wall, not observed on the smoother vitrinite channel.
The experimental observations are used to present a modified Cassie Equation model to predict coal
contact angles based on the fractions of dull and bright bands, surface mineral content, and surface
roughness.
In Chapter Six, I report the effect of five surface treatments on pressed coal discs: three 1 wt %
nanoparticle solutions of MgO, SiO2, and Al2O3 and two chemical solutions, a 15 vol.% hydrogen
peroxide and 2 wt.% Silicad® solution. Contact angles were measured using conventional sessile
drop technique and drainage experiments were performed using the CFC instrument. Relative contact
angles on the treated samples varied based on treatment, compared to an untreated sample reference
coal. Analysis of sessile drop results demonstrated that the 2% Siliclad® solution displayed the largest
relative contact angle range (121 -136°) compared to the reference cell (104-84°) meaning that the
Siliclad treated coal surface had become more hydrophobic. Conversely, the 15% vol. hydrogen
peroxide treatment indicated a more hydrophilic surface was generated with contact angles between
30 -40o. The 1% vol. MgO and SiO2 treatments exhibited a decrease in contact angle (~30 -50o), yet
Al2O3 did not show any measurable change in angle. Subsequent CFC imbibition results
demonstrated that the nanoparticles treatments were not effective in the cleat as the contact angles
were inconsistent, yet the Siliclad and hydrogen peroxide treatments reflected similar contact angle
results to the sessile drop values. Drainage experiments clearly showed the Siliclad treated samples
were hydrophobic, with no residual film present, while hydrogen peroxide treated channel had a thick
residual water film. Based on these results H2O2 and Siliclad were selected to treat a packed bed coal
core. These cores were used to measure the influence that surface wettability has on the relative
permeability of the cores using the steady state method, with the hydrogen peroxide treatment shifting
the gas and water permeability curve crossover point to the right and the Siliclad treatment shifting
to the left (compared to the untreated sample).
This study has provided valuable insight into the wetting behaviours of coal lithotypes and the effect
this has on gas-liquid flow through microchannels in coal. The results of this thesis provide the basis
to consider an improved relative permeability model that explicitly accounts for the effect of coal
lithotype and the unique flow regimes that are generated based on surface wettability.

iv
Declaration by author
This thesis is composed of my original work, and contains no material previously published or written
by another person except where due reference has been made in the text. I have clearly stated the
contribution by others to jointly-authored works that I have included in my thesis.
I have clearly stated the contribution of others to my thesis as a whole, including statistical assistance,
survey design, data analysis, significant technical procedures, professional editorial advice, and any
other original research work used or reported in my thesis. The content of my thesis is the result of
work I have carried out since the commencement of my research higher degree candidature and does
not include a substantial part of work that has been submitted to qualify for the award of any other
degree or diploma in any university or other tertiary institution. I have clearly stated which parts of
my thesis, if any, have been submitted to qualify for another award.
I acknowledge that an electronic copy of my thesis must be lodged with the University Library and,
subject to the policy and procedures of The University of Queensland, the thesis be made available
for research and study in accordance with the Copyright Act 1968 unless a period of embargo has
been approved by the Dean of the Graduate School.
I acknowledge that copyright of all material contained in my thesis resides with the copyright
holder(s) of that material. Where appropriate I have obtained copyright permission from the copyright
holder to reproduce material in this thesis.

v
Publications during candidature
Journals:
Mahoney, S. A., Rufford, T. E., Rudolph, V., Liu, K. Y., Rodrigues, S., & Steel, K. M., 2015. Creation
of microchannels in Bowen Basin coals using UV laser and reactive ion etching. International
Journal of Coal Geology, 144, 48-57.
Conference Papers:
Mahoney, S.A., Rufford, T.E., Dmyterko, A.S., Rudolph, V., Steel, K.M., 2015. The Effect of Rank
and Lithotype on Coal Wettability and its Application to Coal Relative Permeability Models, SPE
Asia Pacific Unconventional Resources Conference and Exhibition. Society of Petroleum Engineers.
SPE-176870-MS
Mahoney, S.A., Rufford, T.E., Rudolph, V., Steel, K.M., 2015. The Effect of Coal Rank on
Wettability and Cappillary Pressure in a Single Cleat, International Conference on Coal Science and
Technology, Melbourne, Australia.
Mahoney, S.A., Rufford, T.E., Rudolph, V., Liu, K.-Y., Rodrigues, S., Steel, K.M., 2015. Creation
of Microchannels in Bowen Basin Coals Using UV Laser and Reactive Ion Etching, AAPG
Opportunities and Advancements in Coal Bed Methane in the Asia Pacific.
Ge, L., Guenot, L., Rufford, T., Mahoney, S.A., 2014. Controlling Fines in Coal Seam Gas Wells
using MgO Nanoparticles. Energy Futures Conference, Sydney, Australia.
Conference Posters:
Mahoney, S.A., Rufford, T.E., Rudolph, V., Steel, K.M., 2016. Measuring Fluid Flow in Coal Using
Reactive Ion Etched Cleats, 7th ANZNMF Symposium, Brisbane, Australia.
Ge, L., Khan, C., Mahoney, S.A., Rufford, T., Rudolph, V., 2015. Effects of Effective Stress Changes
on Coal Relative Permeability, International Conference on Coal Science and Technology,
Melbourne, Australia.
Khan, C., Ge, L., Mahoney, S.A., Rufford, T., Rudolph, V., Steel, K., Towler, B., Honari, V., 2015.
Coal Bed-Methane Reservoir Simulation Study, AAPG Opportunities and Advancements in Coal
Bed Methane in the Asia Pacific.

vi
Publications included in this thesis
Mahoney, S. A., Rufford, T. E., Rudolph, V., Liu, K. Y., Rodrigues, S., & Steel, K. M., 2015. Creation
of Microchannels in Bowen Basin Coals using UV Laser and Reactive Ion Etching. International
Journal of Coal Geology, 144, 48-57.
Publication citation – incorporated as Chapter 3 and 4.
Contributor Statement of contribution Percentage
contributed
Shilo A Mahoney
(Candidate)
Designed and conducted experiments
Interpretation of results
Wrote the paper
80%
70%
90%
Thomas E. Rufford Edited the paper
Interpretation of results
10%
5%
Victor Rudolph Designed the experiments
Interpretation of results
10%
10%
Kai Yi Lui Designed the experiments 10%
Sandra Rodrigues Interpretation of results 5%
Karen M. Steel Interpretation of results 10%
vii
Contributions by others to the thesis
Simulation work reported in Chapter One, Figure 1.1C and D was conducted and included with the
approval of Dr Chawarwan Khan.
The reactive ion etching technique described in Chapter Four was collaborated with Dr Kai Yi Lui
from the Australian National Fabrication facility, Qld node.
Sessile Drop measurements reported in Chapter 5 were measured by Mr David Johnson, under my
supervision. Mercury porosimetry results reported in Chapter 5 were obtained by Anastasia
Dmyterko, including sample preparation.
The coal packed bed cores described in Chapter Six were constructed by Dr Lei Ge and Mr Fabio
Ferzini Sores who also performed the relative permeability measurements on the treated samples.
Statement of parts of the thesis submitted to qualify for the award
of another degree
None
viii
Acknowledgements
I thank my primary supervisor Professor Victor Rudolph for the opportunity to work with and become
a part of his research team. I appreciate the level of guidance and support that was always offered and
the positive atmosphere Victor created. I will always be grateful for the thorough manner in which he
would answer my questions, whether it related to coal relative permeability or naming all the
characters on Southpark; a solution was always provided.
To my co-supervisors, Dr Tom Rufford and Dr Karen Steel, I would also like to extend my deepest
thanks. Both were professional researchers and have my sincere admiration for their unique
leadership styles that enabled both a degree of freedom and structure in my research. Special thanks
must also be given to: Professor Joan Esterle, Professor Andrew (Alf) Garnett, Dr Chawarwan Khan,
Dr Lei Ge, and Dr Archana Patel for providing guidance, support, ideas and humour when needed.
Extra special thanks must also be given to Dr Luc Turner, because he really did do the same for me.
I also thank Ron Rasch and Ying Yu in the Centre for Microscopy and Microanalysis for their
dedication and expertise. Special thanks also to Jason Herriot and his team in the UQ Mechanical
Engineering workshop for their quality work and advice. I also acknowledge the work done by Dr
Elliot Cheng and Dr Kai Yi Lui from the Australian National Fabrication facility, Qld node. Thanks
also to Brian Roberts for his guidance and assistance in the early design work. It was greatly
appreciated.
To my father, Tony, you were right; this was easier then swinging a shovel. To my mother, Kaye,
thank you for spending those extra nights helping with my homework and for believing in me. You
both helped me achieve my goals and I thank you for the lessons you taught me. Thank you to Kareena
and Peter for your support and encouragement.
To Joanna, you put your dreams on hold so I could achieve mine and there is little I can say that could
express my sincere affection and admiration for your sacrifice. We did this together and I love you.
To Lorelei, Emily and Ethan, thank you for giving me the gift of being your dad.
ix
Keywords
Relative permeability, coal rank, reactive ion etching, two phase flow, cleats, wettability, lithotypes,
microfluidic flow, contact angle, nanoparticles
Australian and New Zealand Standard Research Classifications
(ANZSRC)
ANZSRC code: 091406, Petroleum and Reservoir Engineering, 60%
ANZSRC code: 040309, Petroleum and Coal Geology, 40%
Fields of Research (FoR) Classification
FoR code: 0914, Resources Engineering and Extractive Metallurgy, 100%
x
Table of Contents
Abstract ii
Declaration by author iv Publications during candidature v Publications included in this thesis vi Contributions by others to the thesis vii Statement of parts of the thesis submitted to qualify for the award of another degree vii
Acknowledgements viii Keywords ix Australian and New Zealand Standard Research Classifications (ANZSRC) ix Fields of Research (FoR) Classification ix
Chapter 1) Significance of Relative Permeability to the Coal Seam Gas
Industry ........................................................................................ 1
1.1 Research problem 1
1.2 Objectives of the Research 5
1.3 Structure of the Thesis 6
1.4 Significance of the Project to the Coal Seam Gas Industry 6
Chapter 2) Coal Wettability and Relative Permeability ............................. 9
2.1 Overview of Literature Review 9
2.2 Coal Fundamentals 10
2.3 Relative Permeability in Coal 18
2.4 Properties that Affect Wetting and Relative Permeability 35
2.5 Methods to Measure Wetting of Coal 41
2.6 Conclusions from the Literature Review 50
Chapter 3) Methodologies ............................................................................ 53
3.1 Coal Selection and Characterisation 53
3.2 Sample Visualisation and Characterisation Techniques 57
Chapter 4) Creation of Micro Channels in Bowen Basin Coals using UV
Laser and Reactive Ion Etching ............................................... 58
4.1 Introduction 58
4.2 General Materials and Methods 59
4.3 Channel Etching Techniques and Characterisation 60
4.4 Flow Cell for Two Phase Flow Visualisation 64

xi
4.5 Results and Discussion 66
4.6 Conclusions 81
Chapter 5) The Effect of Dull and Bright Banded Coal on Contact Angle
Measurements in Cleats ............................................................ 82
5.1 Introduction 82
5.2 Sample Selection and Preparation Techniques 84
5.3 Characterisation of the Natural and Artificial Cleats 87
5.4 Results of Imbibition Experiments 97
5.5 Observations in Cleat Drainage (RIE channels) 106
5.6 Conclusions 109
Chapter 6) Novel Chemical Treatments that alter the Wettability of Coal
and their effect on Relative Permeability ............................. 111
6.1 Introduction 111
6.2 Methodology 116
6.3 Results 122
6.4 Sessile Drop Results and Analysis 128
6.5 CFC Results and Analysis 130
6.6 Relative permeability results of packed bed cores 135
6.7 Conclusions 138
Chapter 7) Conclusions and Recommendations ...................................... 139
7.1 Conclusions 139
7.2 Recommendations 144
References ................................................................................................... 153
Appendix A ................................................................................................... 167
A1 Keller Equation 167
Appendix B ................................................................................................... 169
B1 Scratch Test Apparatus 169

xii
B2 Table of average values from micro-Raman analysis of RIE and UV Laser samples
170
Appendix C ................................................................................................... 171
C1 Sessile drop apparatus 171
C2 SEM image standardisation using Gwyddion v2.45 172
C3 Modified RIE channel procedure: 172
Appendix D ................................................................................................... 173
D1 Malvern Zetasizer Nano ZS results for nanoparticle solution 173
D2 Zeta potential results 176
Appendix E ................................................................................................... 179
E1 Table of relative permeability results using PorExpert software 179

xiii
List of Figures
Page
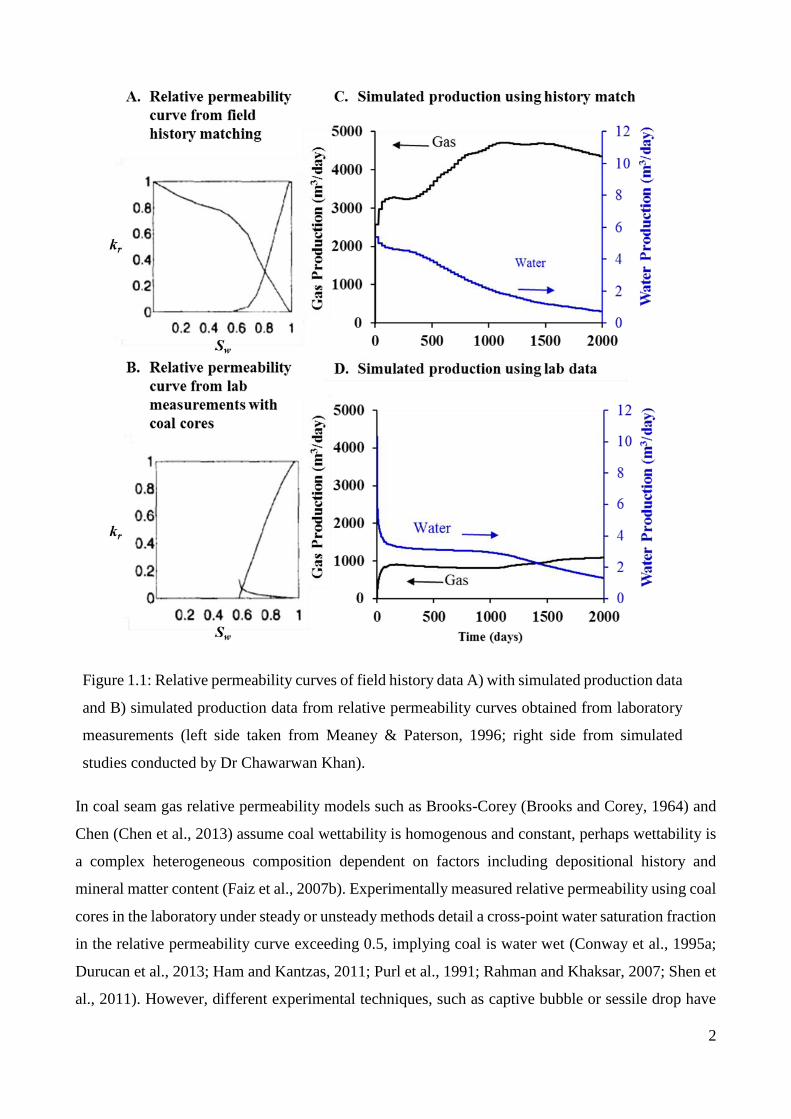
Figure 1.1: Relative permeability curves of field history data A) with simulated production data
and B) simulated production data from relative permeability curves obtained from
laboratory measurements (left side taken from Meaney & Paterson, 1996; right side
from simulated studies conducted by Dr Chawarwan Khan). ...................................... 2
Figure 1.2: Blockage A signifies a region in the cleat where adhered water creates a water film. In
this region of the cleat, the differential pressure is higher than the film threshold
pressure gradient (S) and the gas is able to pass through. Blockage B demonstrates a
scenario where the gas pressure is insufficient to rupture S. Thus preferential flow
pathways are created in the cleat network. Figure taken from Teng et al. (2016). ...... 3
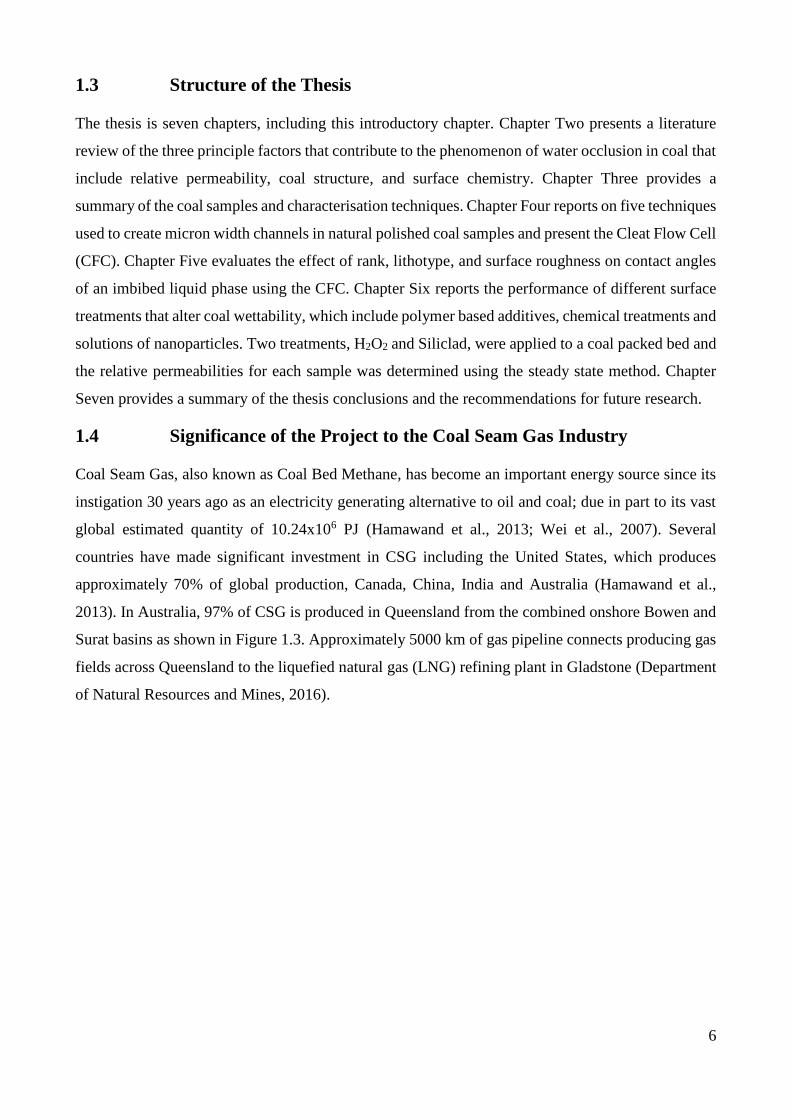
Figure 1.3: Total CSG production in petrojules (PJ) in Queensland based on the Bowen and Surat
basins (Department of Natural Resources and Mines, 2016). ...................................... 7
Figure 1.4: The Bowen and Surat basins in central Queensland (Department of Natural Resources
and Mines, 2015). ......................................................................................................... 8
Figure 2.1: Structure of the literature review based on factors that influence water occlusion in
coal. .............................................................................................................................. 9
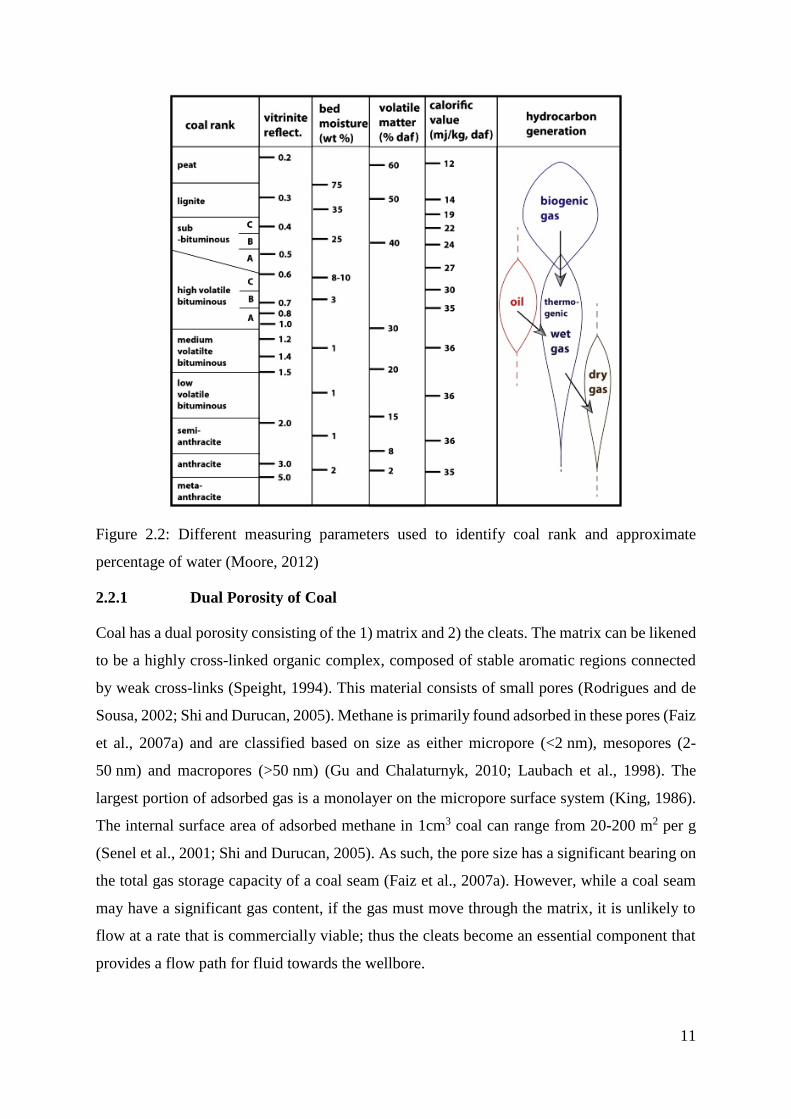
Figure 2.2: Different measuring parameters used to identify coal rank and approximate percentage
of water (Moore, 2012) .............................................................................................. 11
Figure 2.3: Pore size distribution in bituminous coal from Illinois Basin (Mosher et al., 2013) . 12
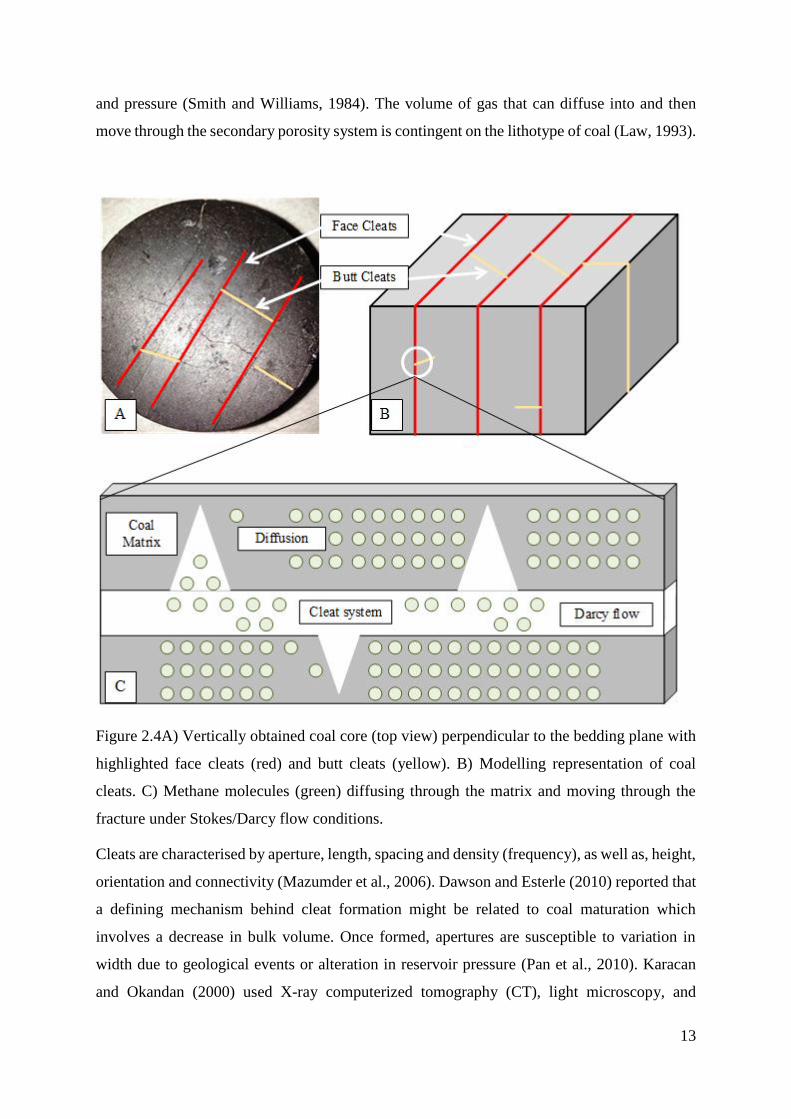
Figure 2.4: A) Vertically obtained coal core (top view) perpendicular to the bedding plane with
highlighted face cleats (red) and butt cleats (yellow). B) Modelling representation of
coal cleats. C) Methane molecules (green) diffusing through the matrix and moving
through the fracture under Stokes/Darcy flow conditions. ......................................... 13
Figure 2.5: SEM image of micro fractures in polished coal surface Acılık 2. Ocak coal (Karacan
and Okandan, 2000) ................................................................................................... 14
Figure 2.6: Cleat: pattern, directionality and length representation (Laubach et al., 1998) ......... 15
Figure 2.7: Correlation for permeability based on cleat spacing and orientation (Laubach et al.,
1998). .......................................................................................................................... 16
Figure 2.8: Representation of the four primary cleat classes the by Dawson & Esterle, (2010). . 17

xiv
Figure 2.9: A) Bundle of capillary tubes, B) matchstick model (D. Chen et al., 2013)
.................................................................................................................................... 19
Figure 2.10: Relationship between pore pressure, gas content and permeability (G. G. X. Wang et
al., 2011) ..................................................................................................................... 21
Figure 2.11: Idealised coal cleat geometries A) Isotropic matchstick geometry and B) Anisotropic
matchstick geometry. Figure from Pan and Connell (2013). ..................................... 22
Figure 2.12: Schematic of the workflow associated with the creation of a 2D microfluidic device
with cleat geometry based on CT coal core scans (Gerami et al., 2016). .................. 26
Figure 2.13: Relative permeability curve for two phase gas/water flow (Connell et al., 2007) ..... 27
Figure 2.14: Sessile drop contact angle measurements which show increased water wettability of
coal with an increased fluid pH (Chaturvedi et al., 2009). ......................................... 29
Figure 2.15: Proposed correlation between cleat size distribution and coal rank using a) fixed
carbon (d.a.f) % and b) vitrinite reflectance, Ro (%) for Chinese and European coal
samples (Chen et al., 2014). ....................................................................................... 32
Figure 2.16: Snapshots of the steady state flow experiment showing the main flow regimes A) LGD
flow, B) SGD flow, C) DTF and D) CPF. .................................................................. 34
Figure 2.17: Represented changes in molecular structure against increasing coal rank (Kaneko,
Derbyshire, Makino, Gray, & Tamura, 2000) ............................................................ 35
Figure 2.18: FTIR spectrum of different rank coal and their respective functional group
composition and related percentage of carbon/oxygen ratio (Chen et al., 2012). ...... 36
Figure 2.19: Characterization of chemical functional groups in macerals across different coal ranks
via micro-FTIR spectroscopy (Chen et al., 2012). ..................................................... 37
Figure 2.20: Adsorption isotherms of different coal ranks around the world using average vitrinite
reflectance maximums (Moore, 2012) ....................................................................... 38
Figure 2.21: Relationship between ash yield and in-situ gas content (M. Faiz et al., 2007) .......... 39
Figure 2.22: An SEM image of coal minerals from Australian Bowen basin coals. 1) kaolinite, 2)
pyrite and 3) ankerite (Dawson et al., 2012). ............................................................. 40
Figure 2.23: A representation of the cohesive forces at liquid/solid/air interface (Bracco & Holst,
2012) ........................................................................................................................... 41
Figure 2.24: Schematic diagram of the CSIRO contact angle system (Saghafi et al., 2014). ........ 42

xv
Figure 2.25: Variation in contact angle measurement (Bracco & Holst, 2012) ............................. 43
Figure 2.26: Sessile drop contact angle measurements and the effect of coal rank (maturity based
on vitrinite reflectance) on wettability (modified from He and Laskowski (1992)). . 44
Figure 2.27: Using an idealised coal sample (black) and pure water droplet (blue) A) the contact
angle generated on a flat surface is approximately 90°. B) When the same liquid is
placed on a textured or roughened surface, the droplet angle becomes larger than 90º
due in part to contact hysteresis. This phenomenon where gas is trapped is known as a
Cassie wetting state. C) A Wenzel wetting state exists where water can penetrate the
textured surface while still creating a contact angle that exceeds 90º. ....................... 45
Figure 2.28: A) A Bright band coal SEM image. B) Dull banded coal SEM image. Both images
taken from Gamson et al. (1996). ............................................................................... 46
Figure 2.29: Pure water/air flow patterns in hydrophilic channels. From low to high void fractions.
a) Bubbly flow, b) wedging flow, c) slug flow, d) dry flow (Cubaud et al., 2006). .. 47
Figure 2.30: Pure water/air flow patterns in hydrophobic channels. From low to high void fractions.
a) Isolated asymmetric bubble flow, b) wavy bubble flow, c) scattered droplet flow
(Cubaud et al., 2006). ................................................................................................. 48
Figure 2.31: Two-phase flow pattern visualization for various operating conditions with a) plastic
surface, b) PTFE surface and c) a rough carbon paper surface. ................................. 49
Figure 2.32: A) Representation of annular flow with liquid adhering to the coal surface, while gas
passes through the centre. B) Representation of Globular flow where discrete blobs of
gas and water move through the cleat, creating an alternating wet/dry surface. ........ 51
Figure 3.1: A) Top face of a large block of IPN showing mineral filled face cleats. B) Idealised
coal sample with mineral filled cleat having both a vitrinite rich band and inertinite
rich band. C) Sample IPN-NC shows an open cleat with minerals physically removed
and used to compare to the artificial cleats created. ................................................... 54
Figure 4.1: Top view of a coal core drilled perpendicular to the bedding plane (Bowen 6Z) with
face and butt cleating visible (plan view). .................................................................. 60
Figure 4.2: Post polished coal cube (IPN-1i) set in epoxy resin a) thin vitrinite band running the
length of the samples and perpendicular to the etched pathway (plan view), b) regions
of interest (ROI) were selected across the vitrinite band to assess the range of variation
in Raman spectra of the natural vitrinite. .................................................................. 63
xvi
Figure 4.3: Schematic of the flow cell apparatus and a photograph of the epoxy-mounted coal
sample containing a UV laser etched channel. ........................................................... 65
Figure 4.4: Intersection of a natural face cleat and butt cleat on the surface of DZ6 coal sample.
.................................................................................................................................... 66
Figure 4.5: Channel created by scratch method using a carbide cutting tool on IPN-S at (x50). . 68
Figure 4.6: Example of a UV laser etched channel on IPN-2L observed under light microscope at
(x50). .......................................................................................................................... 69
Figure 4.7: Optical light microscope image at (x200) of reactive ion etched channel on IPN- R1
(sample 1 of the two IPN samples). The defect labelled (a) resulted from over exposure
of the coal to the ion beam at this location due to a poor adhesion of the photoresist
layer. ........................................................................................................................... 70
Figure 4.8: Optical profile of PDMS impression of COP.S2i ion etched coal (green) and epoxy
(red) interface using a Vecco Wyko NT1100 optical profile system at x10
magnification. ............................................................................................................. 71
Figure 4.9: SEM of iridium coated PDMS impressions of a) a natural cleat in DZ6, b) reactive ion
etched channel in IPN-R2, and c) a UV laser etched channel in IPN-L2. ................. 72
Figure 4.10: Mean full width half maximum (FWHM) values of G band peak at 1604 cm-1 in
Raman spectra measured at six locations in the reactive ion etched channels in all coals
(represented as sample-R-Ch). G band FWHM values of vitrinite bands adjacent to the
RIE channel (represented as sample-R-V) and the untreated coal references (sample-
P-U) are shown. Vertical bars represent one standard deviation. .............................. 74
Figure 4.11: Mean full width half maximum (FWHM) values of G band peak at 1604 cm-1 in
Raman spectra measured at six locations in the UV laser etched channels in IPN.
FWHM values of vitrinite bands adjacent to channel (outside) and the untreated coal
references are shown. Vertical bars represent one standard deviation. ...................... 75
Figure 4.12: Mean full width half maximum (FWHM) values of D band peak in Raman spectra
measured at six locations in the reactive ion etched channels in coals IPN and COPS.
D band FWHM values of vitrinite bands adjacent to the RIE channel (Outside) and the
untreated coal references are shown. Vertical bars represent one standard deviation.
.................................................................................................................................... 76
xvii
Figure 4.13: Mean full width half maximum (FWHM) values of D band peak in Raman spectra
measured at six locations in the UV laser etched channels in IPN. FWHM values of
vitrinite bands adjacent to channel (Outside) and the untreated coal references are
shown. Vertical bars represent one standard deviation. ............................................. 77
Figure 4.14: Images captured during flow experiment with 1200 µL/min of water containing 1%
w/v fluorescein solutions (green) and pulses of air through ion etched channel IPN-
R2. The arrow indicates flow direction. A) Discreet gas bubbles moving through
solution. B) Multiple bubbles occurring at the bottom of the channel with some
residual water seen near the centre and two bubbles near the top. C) Volume of channel
occupied by the water increased as the gas bubbles are pushed out of the channel. .. 78
Figure 4.15: Image of an air bubble (dark region) in the water filled IPN-3L channel with the flow
cell valves closed (x500 magnification). The arrow indicates flow direction. A mineral
deposit in the channel protrudes from the right side wall. ......................................... 80
Figure 5.1: A) Stainless steel die dimensions, including raised sections. B) 25 mm compressed
coal disc with indented cleat in the centre. C) A special epoxy disc capable of holding
the pressed disc in place and enables fluid injection through the cleat. ..................... 85
Figure 5.2: A) IPN-P1 polished dull banded coal. B) IPN-P1 polished bright band. The light
coloured flakes in both images are mineral plates deposited during the polishing
process. Both images were acquired when the sample was tilted 45˚ to the electron
detector. ...................................................................................................................... 88
Figure 5.3: A) IPN-NC SEM image of the boundary between the bright (vitrinite) band and the
dull (inertinite) band in a continuous cleat from Isaac Plain North bulk coal. B) The
bright band has a smoother surface morphology with less notable pores. C) The dull
band has substantial roughness and greater porosity. ................................................. 88
Figure 5.4: A) SEM image of IPN-R polished coal sample lithotype boundary (bright and dull)
with the RIE channel passing through each band. B) The etched channel wall in the
bright band is smooth and displays some similarity in morphology to that of the natural
cleat shown in Figure 5B. C) The dull banded cleat wall displays a greater roughness
than seen in Figure 6B and shares some similarity in roughness to the natural cleat in
Figure 5C. ................................................................................................................... 90
Figure 5.5: A) Top view of IPN-DD pressed cleat. There is some surface damage on the top of the
cleat, adjacent to the channel floor which occurs when the steel die is removed. B)

xviii
Sample tilted 45 to show the channel floor and wall displaying a unique smoothness.
.................................................................................................................................... 91
Figure 5.6: 3D images generated from SEM scans of coal channel surfaces. Ra and Rq values for
each sample are shown under each 3D representation. Note that the vertical scale varies
between pictures, as polished samples are in nm scale, while the other samples are in
μm. .............................................................................................................................. 93
Figure 5.7: (Top) polished coal COPS-PD SEM BS image details a portion of the liquid droplet
zone that was used for sessile drop experiment. The bright portions of the image
indicate mineral deposits (shown) in the dull band region, as well as surface voids.
(Bottom) sample COPS-PB details a section of the bright band drop zone, flanked by
dull bands. The two mineral filled (kaolinite) cleats also formed a portion of the liquid
drop zone. ................................................................................................................... 94
Figure 5.8: Cumulative mercury porosimetry results of selected coal samples show vitrinite-rich
coals (OAK-BR and MVL-BB) have less macro and mesopores than inertinite-rich
coal (Dmyterko and Esterle (2014). ........................................................................... 96
Figure 5.9: Inlet and breakthrough pressure drops in four coals measured in four CFC cells. COPS
measurement was not possible due to surface damage. ............................................. 97
Figure 5.10: COPE-R sample with two distinct changes (circled in red) in cleat geometry in the dull
band region. This narrowing of the cleat is believed to be the reason why the
breakthrough pressure is so high for COPE and not the other samples. The bottlenecks
may be due to a hardened material within the coal that etched at a slower rate to the
rest of the dull band material. ..................................................................................... 98
Figure 5.11: Summary of mean (coloured symbols) contact angles, measured using the sessile drop
measurements on polished coal samples, pressed discs and RIE samples. OAK-R’ was
the only sample that had contact angle measurements made in the bright band; all other
measurements for RIE are from the dull inertinite rich bands. Bars are ±1 standard
deviation from the measured angles. .......................................................................... 99
Figure 5.12: Due to the surface roughness the total contact angle cos θt is formed due to a portion
of gas (1-fd) and only some of the (in this case dull coal) surface (fd) which makes
contact with the water. ............................................................................................ 102
Figure 5.13: The contact angle measurement of the fluid flow in MVL-R channel using Image-J
software. ................................................................................................................... 103

xix
Figure 5.14: Residual fluid film on the dull inertinite rich bands in RIE channel samples. The white
ovals in the cleat space are artifacts caused by water vapour condensation due to the
heat from the light microscope ................................................................................. 106
Figure 5.15: Residual water film on the bright banded (vitrinite-rich) channel walls in RIE samples.
Since the RIE technique is creating a channel out of the coal matrix, the nature of
vitrinite means significantly less mineral filled pores compared to the inertinite. Thus
there is a lower number of mineralised pores for the water to penetrate during the
drainage experiment and hence no water film. ......................................................... 107
Figure 5.16: A) An example of gas trapping between the rough surface features inherent in the
vitrinite band and small pore size. B) Matrix in-filled pores allow for imbibition of
water once the liquid phase passes over the rough surface, creating trapped pockets of
water; the result is a Wenzel wetting effect. ............................................................ 108
Figure 6.1: A) A 30 g pressed coal core (DC-U) using coal powder. B) A cross section
representation of the coal core interior. .................................................................... 119
Figure 6.2: A schematic of the packed bed core holder. ............................................................. 120
Figure 6.3: SEM back scatter (BS) image of Silicad treated coal channel MVL-SD. The dark
regions are the untreated coal. .................................................................................. 122
Figure 6.4: A) Deposition of SiO2 nanoparticles on the cleat surface sample MVL-Si with SEM
EDS results showing B) SiO2 nanoparticles and C) clean coal surface. .................. 123
Figure 6.5: A) Deposition of Al2O3 nanoparticles on the surface of the cleat sample MVL-Al with
SEM EDS results showing B) nanoparticle C) mineral deposit (possibly gypsum).124
Figure 6.6: A) Deposition of MgO nanoparticles on the surface of sample MVL-Mg with
respective SEM EDS results showing 1) MgO nanoparticles 2) mineral deposit
(possibly magnesiochromite) ................................................................................... 125
Figure 6.7: XPS surface scan of MVL-H2O2 and MVL-U samples. .......................................... 126
Figure 6.8: High resolution C1s spectra of the A) MVL-U; B) MVL-H2O2 sample. ................. 127
Figure 6.9: Unique Sessile drop profiles of various chemical treated coal surfaces. The red tangent
line in A is the auto-correction line of the software, while the blue tangents were the
manual control. ......................................................................................................... 129
Figure 6.10: Sessile drop mean contact angle results based on 10 points of contact obtained from
each sample. Vertical bars represent one standard deviation. .................................. 130

xx
Figure 6.11: CFC advancing contact angle of injected liquid phase post nanoparticle treatments for
A) MgO, B) SiO2 and C) Al2O3. Arrow indicates direction of flow. ....................... 131
Figure 6.12: CFC advancing contact angle of injected liquid phase post chemical treatments for A)
MVL-U, B) MVL-SD and C) MVL-H2O2. Arrow indicates direction of flow. ....... 132
Figure 6.13: Initial drainage via withdrawal of the liquid phase in the MVL-U cleat at 5μL/min. B)
Five seconds after initial drainage, small residual globs of liquid remain until they too
are drained several seconds later. Arrow indicates flow direction ........................... 133
Figure 6.14: A) Initial drainage via withdrawal of the liquid phase in the MVL-SD treated cleat at
5μL/min. B) Five seconds after initial drainage, small residual globs of liquid remain
until they too are drained within seconds. Arrow indicates flow direction .............. 134
Figure 6.15: A) Initial drainage via withdrawal of the liquid phase in the MVL-H2O2 treated cleat
at 5μL/min. B) Five seconds after initial drainage a thick residual film of liquid
remained for several minutes. Arrow indicates flow direction ................................ 135
Figure 6.16: Relative permeability of packed bed cores derived from DC untreated coal and
chemical treated coal powders (DC-H2O2 and DC-SD respectively). .................... 136
Figure 7.1: A) Uploaded intrusion and extrusion mercury porosimetry data. B) A 10x10x10 pore
size vertically banded pore structure based on the fitted curve. The solid phase is
shown as transparent, while the pores within the solid material are represented as boxes
and the pore throats are characterized as connecting cylinder. ................................ 147
Figure 7.2: A) PorExpert coal structure with the black region representing the coal matrix, blue
cylinders and boxes represent water filled pores and throats respectively, with the
yellow indicative of air filling the pores. B) The orange color is air filled pores and the
dark blue indicative of water filling the structure. ................................................... 148
Figure 7.3: Injection of non-wetting fluid (water) from the top of the PorExpert hydrophobic
surface scenario with incremental increases in non-wetting fluid uptake shown as
percentage (non-wetting fluid is blue) and the corresponding differential pressure.
.................................................................................................................................. 149
Figure 7.4: Relative permeability curve from scenario 1 based on globular flow regime and an
advancing contact angle for water of 50°. ................................................................ 150
Figure 7.5: Relative permeability curve from scenario 2 based on globular flow regime and an
advancing contact angle for water of 85°. ................................................................ 151

xxi
Figure 7.6: Relative permeability curve from scenario 3 based on globular flow regime and an
advancing contact angle for water of 130°. .............................................................. 151

xxii
List of Tables
Page
Table 2-1: General classification of rock permeability (Z. Chen, 2007) ..................................... 18
Table 3-1: Petrographic, proximate and ultimate analysis of coal samples from Isaac Plains North
(IPN), Oaky Creek (OAK), Moorvale (MVL), Coppabella South and Coppabella East
(COPE) (COPS) ......................................................................................................... 54
Table 3-2: Description and classification of samples used in micro-channel creation. ............... 56
Table 4-1: Key characteristics and design features required for creating an artificial cleat in
polished coal. .............................................................................................................. 59
Table 4-2: Summary of the characteristics of channels etched in Bowen Basin coal samples using
UV laser, reactor ion etching, mechanical scratching and chemical oxidation in
KMnO4. ...................................................................................................................... 67
Table 5-1: A quantitative summary of the fraction composition (area percentage) of coal
lithotypes identified by light microscopy and the mineral and porosity from SEM and
ImageJ analysis of a section of the sessile drop surface on each sample (~400 µm2)
and it is assumed that the remaining area in the droplet zone have a comparable
composition. ............................................................................................................... 95
Table 5-2: Sessile drop contact angles derived using fraction values of bright, dull, mineral,
voidage and gas compared to the measured value. .................................................. 101
Table 5-3: Use of Sessile drop data obtained from Ofori (2010) to compare their measured contact
angle against the calculated contact angle using Equation 5-4. ............................... 102
Table 5-4: Experimental RIE contact angles results (Meas.) compared to the calculated values
(cal.) based on the data using Equation 5-5-9. ......................................................... 104
Table 5-5: A comparison of the pressed disc contact angle measurements against those derived
using Equation 5-7. ................................................................................................... 105
Table 6-1: A survey of nanoparticles applied to change surface wetting properties used in the oil
and gas industry. ....................................................................................................... 113
Table 6-2: Experimental results of dry powder and 0.5% wt solution samples MgO, Al2O3 and
SiO2 nanoparticles. ................................................................................................... 117
Table 6-3: Relative atomic composition (at %) XPS surface scan of MVL-U and MVL-H2O2 126

xxiii
Table 6-4: Relative concentration (at %) of oxygen functional groups on untreated (MVL-U) and
oxidised (MVL-H2O2) samples calculated from deconvolution of high resolution XPS
C1s spectra. .............................................................................................................. 128
xxiv
List of Equations
Page
Equation 2-1 ....................................................................................................................................... 12
Equation 2-2 ....................................................................................................................................... 18
Equation 2-3 ....................................................................................................................................... 19
Equation 2-4 ....................................................................................................................................... 20
Equation 2-5 ....................................................................................................................................... 20
Equation 2-6 ....................................................................................................................................... 22
Equation 2-7 ....................................................................................................................................... 22
Equation 2-8 ....................................................................................................................................... 30
Equation 2-9 ....................................................................................................................................... 30
Equation 2-10 ..................................................................................................................................... 30
Equation 2-11 ..................................................................................................................................... 30
Equation 2-12 ..................................................................................................................................... 31
Equation 2-13 ..................................................................................................................................... 31
Equation 2-14 ..................................................................................................................................... 32
Equation 2-15 ..................................................................................................................................... 33
Equation 2-16 ..................................................................................................................................... 33
Equation 2-17 ..................................................................................................................................... 33
Equation 2-18 ..................................................................................................................................... 42
Equation 2-19 ..................................................................................................................................... 43
Equation 2-20 ..................................................................................................................................... 44
Equation 5-1 ....................................................................................................................................... 86
Equation 5-2 ....................................................................................................................................... 86
Equation 5-3 ....................................................................................................................................... 98
Equation 5-4 ..................................................................................................................................... 100
Equation 5-5 ..................................................................................................................................... 103

xxv
Equation 5-6 ..................................................................................................................................... 105
Equation 5-7 ..................................................................................................................................... 105
Equation 6-1 ..................................................................................................................................... 120
Equation 6-2 ..................................................................................................................................... 121
Equation 6-3 ..................................................................................................................................... 121
Equation 7-1 ..................................................................................................................................... 149
Equation 7-2 ..................................................................................................................................... 150
Equation 7-3 ..................................................................................................................................... 150
Equation 7-4 ..................................................................................................................................... 150

1
Chapter 1) Significance of Relative Permeability to the Coal Seam Gas
Industry
1.1 Research problem
Absolute permeability of a porous media is a physical property that determines the transport capacity
of a single fluid to move through the medium (Ahmed, 2006). Coal is a porous rock with a natural
fracture network known as cleats that enables fluid flow (Levine, 1996). In the case of coal seam gas
(CSG) both gas (predominately methane) and water adopt laminar flow and obey Darcy’s law that is
limited to the cleat network. Effective permeability is the ability of one fluid to preferentially flow
when two immiscible fluid phases coexist, as is the case for CSG production. Relative permeability
is the ratio of the effective permeability of a particular fluid against the absolute permeability of that
fluid at total saturation (Clarkson et al., 2011; Moore, 2012; Shen et al., 2011). Since gas production
depends on the gas relative permeability, methods for evaluation, measurement and prediction are of
critical importance for the establishment of an economic case to develop a reservoir (Clarkson et al.,
2011; Ham and Kantzas, 2011).
While relative permeability has been successfully applied to conventional oil and gas experiments
and models (Anderson, 1987; Baker, 1988; Brooks and Corey, 1964; Johnson et al., 1959; Mercer
and Cohen, 1990; Purcell, 1949), the adoption of these models and the underlying physics have not
been successfully integrated in CSG. This is evidenced by the substantial degree of disagreement
between laboratory measurements of relative permeability in coal and that derived from field
production data. Figure 1.1A and B are relative permeability curves taken from Meaney and Paterson
(1996) that demonstrates the poor correlation between relative permeability curves derived from field
data and laboratory measurements respectively. Simulated production profiles using hypothetical
reservoir data based on the relative permeability curves from field data, shown in Figure 1.1C,
demonstrate very different rates of production for gas and water compared to the relative permeability
curves from laboratory measurements, shown in Figure 1.1D. It is apparent that many key parameters
such as the wetting state of coal are not individually accounted, but rather lumped together as a
function of the water saturation state parameter (Sw).
2
Figure 1.1: Relative permeability curves of field history data A) with simulated production data
and B) simulated production data from relative permeability curves obtained from laboratory
measurements (left side taken from Meaney & Paterson, 1996; right side from simulated
studies conducted by Dr Chawarwan Khan).
In coal seam gas relative permeability models such as Brooks-Corey (Brooks and Corey, 1964) and
Chen (Chen et al., 2013) assume coal wettability is homogenous and constant, perhaps wettability is
a complex heterogeneous composition dependent on factors including depositional history and
mineral matter content (Faiz et al., 2007b). Experimentally measured relative permeability using coal
cores in the laboratory under steady or unsteady methods detail a cross-point water saturation fraction
in the relative permeability curve exceeding 0.5, implying coal is water wet (Conway et al., 1995a;
Durucan et al., 2013; Ham and Kantzas, 2011; Purl et al., 1991; Rahman and Khaksar, 2007; Shen et
al., 2011). However, different experimental techniques, such as captive bubble or sessile drop have

3
shown that coal may have a mixed wetting state: hydrophilic, hydrophobic and intermediate based on
pressure (Kaveh et al., 2012; Saghafi et al., 2014), gas desorption (Ham and Kantzas, 2008; Ham and
Kantzas, 2011), mineral matter (Gosiewska et al., 2002b) and liquid characteristics including ion
concentration (Albijanic et al., 2010; Mishra et al., 2002) and pH (Chaturvedi et al., 2009). Coal rank
is also another important factor that contributes to coal wettability, as high rank coal, such as
anthracite are not water-wet, yet low rank coal like peat has both a high moisture content and is water-
wet (Moore, 2012). As water-wet surfaces are more likely to trap water in smaller pores (both
micropores and micro-cleats), the result is that sections of the cleat network may not allow Darcy
flow, as well as capillary effects that hinder gas diffusion from the matrix until the pressure difference
has sufficiently decreased (Saghafi et al., 2014; Sakurovs and Lavrencic, 2011). Teng et al. (2016)
identified these restrictions in the cleats as a water film threshold pressure gradient (S) that could be
ruptured if the differential gas pressure was sufficiently large. If the pressure was insufficient then
the section of cleat becomes blocked and Darcy flow does not occur. In this thesis I refer to these
blockages as water occlusion illustrated in Figure 1.2.
Figure 1.2: Blockage A signifies a region in the cleat where adhered water creates a water film. In
this region of the cleat, the differential pressure is higher than the film threshold pressure gradient (S)
and the gas is able to pass through. Blockage B demonstrates a scenario where the gas pressure is

4
insufficient to rupture S. Thus preferential flow pathways are created in the cleat network. Figure
taken from Teng et al. (2016).
Most of the techniques commonly used to measure the wettability of coal, like sessile drop and captive
bubble, offer a limited understanding of the impact the fluid flow regime in the coal as these methods
cannot enable visualization of either globular or annular fluid flow, and thus cannot demonstrate
where or how water occlusion may occur. While core flooding computerized tomography (CT)
experiments that use natural coal cores have been used to illustrate flow pathways in coal, the
technique still lacks the resolution (at the appropriate scale) to see real time flow regimes and the
impact that surface characteristics have on creating preferential flow pathways based on the coal
wetting state. Also operational problems, such as cost and access, hinder the full utilisation of CT
scanning. Therefore, a new methodology that better understands the wettability of coal based on
evaluation of mobile gas/liquid interface through coal cleats is warranted. Measurement and
subsequent change of contact angle and capillary pressure though idealised channels that mimic coal
cleats would enable a detailed understanding of the impact surface chemistry, cleat morphology, coal
lithotype and mineral matter have on fluid flow in coal; and thus how and where water occlusion may
occur.
The focus on the micro-cleat, which can range from 6-260 μm (Dawson and Esterle, 2010; Kumar et
al., 2011; Laubach et al., 1998; Mazumder et al., 2006; Solano-Acosta et al., 2007), was selected in
this thesis for several reasons. 1) Surface wettability which may induce a residual liquid film will
have a greater influence on the absolute flow permeability of micro-cleats compared to larger
fractures. 2) Initial Darcy flow occurs in the micro-cleats and at present a gap exists in the literature
pertaining to how wettability influences flow regimes in these channels, 3) Cleat apertures are
generally considered to be smaller in a stressed environment, such as within the reservoir compared
to open cut surface coal. 4) Micro-cleats provide an efficient means to ensure high quality image
capture in relation to wettability studies that utilise contact angle measurements. The information
from this thesis will provide a basis to model fluid flow more accurately through a pore network that
would more precisely determine dewatering and production rates through an improved relative
permeability model that accounts for the effect of wetting.

5
1.2 Objectives of the Research
The primary aim of this thesis is to experimentally quantify the behaviour of the gas-liquid interface
moving through a coal micro-cleat. A key contribution to achieving this aim is the development of a
new experimental approach using artificial channels etched or pressed in coal and a microfluidics
device. To facilitate this research aim, several project objectives were identified:
1. Develop methodologies to prepare artificial one-dimensional channels in coal that mimic a
range of natural coal cleat properties, and thereby allow systematic studies of fluid flow
through coal structures. The six channel preparation techniques evaluated were reactive ion
etching (RIE), UV laser ablation, chemical oxidation, two mechanical machining methods
(scratch and machining) and indenting a cleat into powdered coal under force to create a
pressed disc with a single channel.
2. Develop a microfluidics cleat flow cell (CFC) to measure contact angles, capillary pressure
and observe the flow behaviour of gas (air) and water in the artificial coal channels. This
experimental approach allows the observation of mobile gas-water interface behaviour in
different ranks of coal and through different lithotype bands.
3. Investigate the effect of the surface roughness on the wetting contact angles on polished coal
using the sessile drop technique and in cleats by using the CFC. Based on experimental results
a modified equation founded on the Cassie and Keller equation using four principle
constituents that determine the wetting angle: bright coal (mildly hydrophobic); dull coal
(mildly hydrophilic); void space (completely non-wetting); mineral matter (highly wetting)
will be used to predict and explain the contact angle results.
4. Measure the effect of surface treatments with (a) nanoparticles including, SiO2, MgO and
Al2O3, (b) hydrogen peroxide and (c) a Siliclad polymer® on coal wettability and evaluate the
potential of these surface treatments using conventional techniques like sessile drop and the
CFC apparatus to create a homogenous wetting state on the coal surface. Based on the results
of the treatments select two that induce the greatest change in wettability and apply the
treatments to packed bed coal cores and assess their effect on relative permeability. The goal
is to provide a potential agent that may enhance coal seam gas extraction.
6
1.3 Structure of the Thesis
The thesis is seven chapters, including this introductory chapter. Chapter Two presents a literature
review of the three principle factors that contribute to the phenomenon of water occlusion in coal that
include relative permeability, coal structure, and surface chemistry. Chapter Three provides a
summary of the coal samples and characterisation techniques. Chapter Four reports on five techniques
used to create micron width channels in natural polished coal samples and present the Cleat Flow Cell
(CFC). Chapter Five evaluates the effect of rank, lithotype, and surface roughness on contact angles
of an imbibed liquid phase using the CFC. Chapter Six reports the performance of different surface
treatments that alter coal wettability, which include polymer based additives, chemical treatments and
solutions of nanoparticles. Two treatments, H2O2 and Siliclad, were applied to a coal packed bed and
the relative permeabilities for each sample was determined using the steady state method. Chapter
Seven provides a summary of the thesis conclusions and the recommendations for future research.
1.4 Significance of the Project to the Coal Seam Gas Industry
Coal Seam Gas, also known as Coal Bed Methane, has become an important energy source since its
instigation 30 years ago as an electricity generating alternative to oil and coal; due in part to its vast
global estimated quantity of 10.24x10⁶ PJ (Hamawand et al., 2013; Wei et al., 2007). Several
countries have made significant investment in CSG including the United States, which produces
approximately 70% of global production, Canada, China, India and Australia (Hamawand et al.,
2013). In Australia, 97% of CSG is produced in Queensland from the combined onshore Bowen and
Surat basins as shown in Figure 1.3. Approximately 5000 km of gas pipeline connects producing gas
fields across Queensland to the liquefied natural gas (LNG) refining plant in Gladstone (Department
of Natural Resources and Mines, 2016).
7
Figure 1.3: Total CSG production in petrojules (PJ) in Queensland based on the Bowen and Surat
basins (Department of Natural Resources and Mines, 2016).
The Bowen basin covers an area 600 x 200 km in central Queensland with the coal laid down during
the late Permian-Triassic era and is predominately bituminous in rank. The Surat basin covers
approximately 400 x 800 km2 over central southern Queensland and central northern New South
Wales, with the coal formed during the Early Jurassic-Albian era (Figure 1.4). These coals are less
mature and have thinner seam thickness then Bowen basin coals, as well as a lower gas content,
though they typically have a higher permeability (Department of Natural Resources and Mines, 2016).
However, the total 2P reserves for both basins is approximately 42 733 PJ (9391 PJ in the Bowen and
33 342 PJ in the Surat basin) implying that despite current investment in the region, significant
development will likely continue throughout this century.

8
Figure 1.4: The Bowen and Surat basins in central Queensland (Department of Natural Resources and
Mines, 2015).
A relative permeability equation that is sensitive to the coal wetting state would yield two significant
advantages. With respect to field development it would assist in optimized well location and
frequency, which would see a reduced number of wells and in turn minimize the footprint. For
existing wells, a better understanding of the wetting state could assist in implementation of targeted
chemical treatments to alter the near wellbore wetting state to enhance gas flow during production.
Both advantages have the potential to be applied in the Bowen and Surat basin, and then expanded
globally upon verification.

9
Chapter 2) Coal Wettability and Relative Permeability
2.1 Overview of Literature Review
Since water occlusion in coal has not been reported directly in the literature, a composite
analysis of the different conditions that influence water blockage is required. The review of the
literature will be analysed in four distinct, yet interconnected sections as represented in Figure
2.1.
Figure 2.1: Structure of the literature review based on factors that influence water occlusion in
coal.
Methods to measure wettability
Factors that influence relative permeability
Relative permeability
Coal fundamentals
Water Occlusion
10
2.2 Coal Fundamentals
Generally, coal is a readily combustible, insoluble and non-crystalline solid that contains
carbonaceous material formed from the hardening of plant remains and stress (Moore, 2012;
Phillips and Bustin, 1998). The organic composition consists of condensed cyclic aromatics
and heterocyclic collections cross-linked with ether links or aliphatic chains (Speight, 1994).
The unique makeup of coal can be divided into three physiognomies: grade, type and rank.
The grade is the percentage of organic to mineral matter, typically the degree of impurity
measured by the quantity of ash left after burning (Sharma and Gihar, 1991). Type refers to the
petrographic composition or relative proportion of macerals distinguished by constituent plant
materials, and megascopic classification relates to lithotypes (i.e. bright or dull banded) (Polat
et al., 2003). Microscopic classification, identified under light optical microscopy, use maceral
designations and can be grouped as vitrinite, inertinite and exinite (liptinite) (Laxminarayana
and Crosdale, 1999). Vitrinite groups form from the tissue of the plant remains including the
wood, periderm and may contain the remnants of intact cellular structures. Generally, they are
typically in higher abundance proportional to increased coal rank and have a lower composition
of oxygen than other lithotypes. Inertinite groups have typically undergone a degree of
oxidation during coalification. Inertinite is usually found in high abundance within coal (Diez
et al., 2002). Liptinites form from the remains of plant resins and the material resistant to fungal
and bacteriological decomposition. Liptinite groups often contain greater hydrogen to carbon
ratio compared to the other groups and are highly combustible (Diez et al., 2002; Guo and
Bustin, 1998), though this can vary based on geographical location.
Rank refers to the level of coalification that has occurred or the degree to which the material
matter has undergone irreversible physical and chemical transformation (Moore, 2012). Rank
may be based on organic material such as lignite or bituminous, vitrinite reflectance (VR), or
based on the percentage of volatile matter (see Figure 2.2). Vitrinite reflectance is a commonly
used maturation tool due to its non-destructive assessment technique and vitrinite is more
resistant to oil and gas formation, leaving it as an easily identifiable residue in the source rock
(Burnham and Sweeney, 1989; Hower and Davis, 1981). Thus, the percentage of reflectance is
a measure of coal maturity as the refractive index will be dependent on the degree of
aromatisation and density (McCartney and Teichmüller, 1972). Reflectance is maximised when
cutting parallel to the bedding plane (Burnham and Sweeney, 1989). Coals used in this thesis
have a Rmax between 0.9% and 1.91%.
11
Figure 2.2: Different measuring parameters used to identify coal rank and approximate
percentage of water (Moore, 2012)
2.2.1 Dual Porosity of Coal
Coal has a dual porosity consisting of the 1) matrix and 2) the cleats. The matrix can be likened
to be a highly cross-linked organic complex, composed of stable aromatic regions connected
by weak cross-links (Speight, 1994). This material consists of small pores (Rodrigues and de
Sousa, 2002; Shi and Durucan, 2005). Methane is primarily found adsorbed in these pores (Faiz
et al., 2007a) and are classified based on size as either micropore (<2 nm), mesopores (2-
50 nm) and macropores (>50 nm) (Gu and Chalaturnyk, 2010; Laubach et al., 1998). The
largest portion of adsorbed gas is a monolayer on the micropore surface system (King, 1986).
The internal surface area of adsorbed methane in 1cm3 coal can range from 20-200 m2 per g
(Senel et al., 2001; Shi and Durucan, 2005). As such, the pore size has a significant bearing on
the total gas storage capacity of a coal seam (Faiz et al., 2007a). However, while a coal seam
may have a significant gas content, if the gas must move through the matrix, it is unlikely to
flow at a rate that is commercially viable; thus the cleats become an essential component that
provides a flow path for fluid towards the wellbore.

12
Cleats are considered the secondary porosity system within coal and are a function of rank and
lithotype (Kumar et al., 2011; Levine, 1996; Moore, 2012). These natural fractures consist of
two orthogonal joint types: face and butt (Kumar et al., 1998) with an aperture that can range
from one µm to tens of mm (Clarkson and Bustin, 1996). Both the face and butt cleats propagate
perpendicular fissures about the bedding plane. Face cleat are more prominent and continuous
(Dawson and Esterle, 2010; Gamson et al., 1993; Laubach et al., 1998). The butt cleats tend to
terminate once it intersects perpendicular to the face cleats and thus is the shortest of the pair
(Kumar et al., 2011; Mavor and Gunter, 2006) and are assumed to have formed later (Mandal
et al., 2004). Mosher et al. (2013) reported that the cleat system in bituminous coal from Illinois
basin represented less than 5% of the total porosity as shown in Figure 2.3.
Figure 2.3: Pore size distribution in bituminous coal from Illinois Basin (Mosher et al., 2013)
Typically, the gas must first diffuse from the matrix to pass into the fracture network. CSG
seams are water saturated, so to reduce the pressure water needs to be removed, which enables
gas to migrate from the matrix. Once in the cleats, gas and fluid move towards the wellbore by
a differential pressure gradient (Mavor and Gunter, 2006). Diffusion through the matrix is
dependent on a concentration gradient and can is expressed using Fick's Law in Equation 2-1
(Moore, 2012).
𝐹 = −𝐷 𝑑𝐶
𝑑𝑥 Equation 2-1
where F is the diffusion flux (kg/[m2s]), D is the effective diffusivity (m2coal/s), dC/dx is the
concentration gradient ([m3g]/[m
3coal]/[gradient length]), C is measured in (m3 of gas)/(m3 of
coal), x is the transport distance (gradient length) in meters. Methane diffuses via a variety of
mechanisms including Knudsen flow, bulk, and surface, all of which depend on coal structure
13
and pressure (Smith and Williams, 1984). The volume of gas that can diffuse into and then
move through the secondary porosity system is contingent on the lithotype of coal (Law, 1993).
Figure 2.4A) Vertically obtained coal core (top view) perpendicular to the bedding plane with
highlighted face cleats (red) and butt cleats (yellow). B) Modelling representation of coal
cleats. C) Methane molecules (green) diffusing through the matrix and moving through the
fracture under Stokes/Darcy flow conditions.
Cleats are characterised by aperture, length, spacing and density (frequency), as well as, height,
orientation and connectivity (Mazumder et al., 2006). Dawson and Esterle (2010) reported that
a defining mechanism behind cleat formation might be related to coal maturation which
involves a decrease in bulk volume. Once formed, apertures are susceptible to variation in
width due to geological events or alteration in reservoir pressure (Pan et al., 2010). Karacan
and Okandan (2000) used X-ray computerized tomography (CT), light microscopy, and
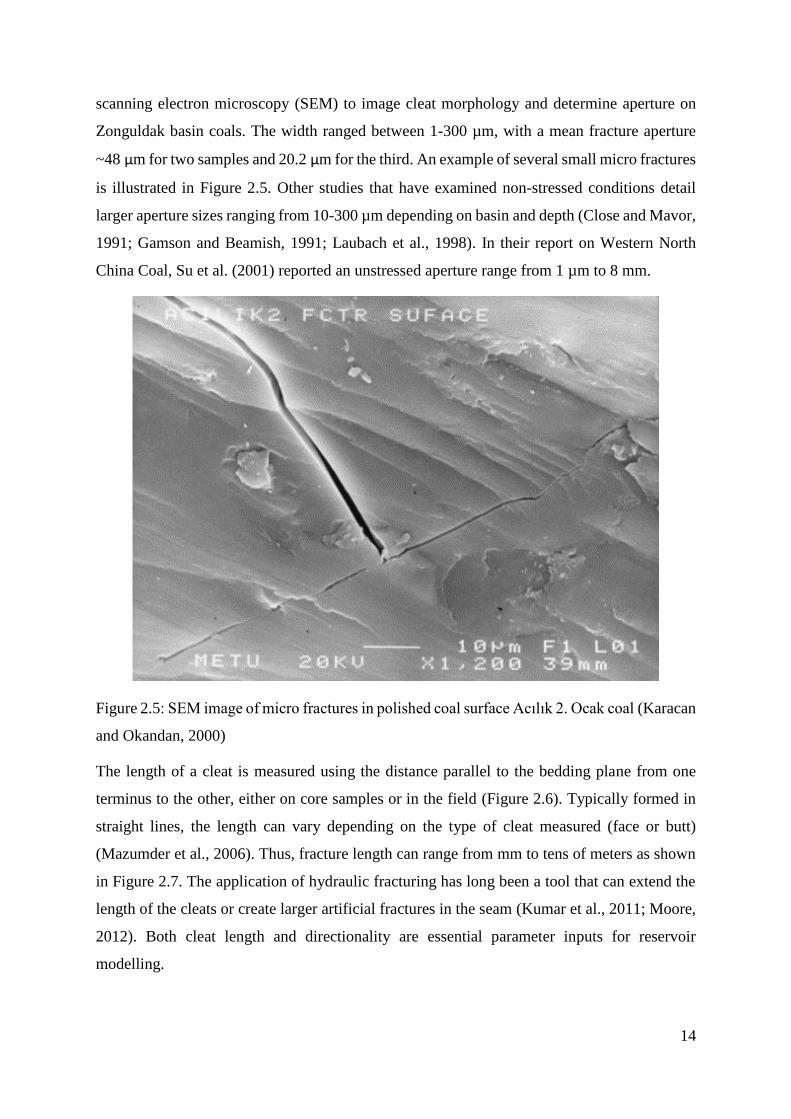
14
scanning electron microscopy (SEM) to image cleat morphology and determine aperture on
Zonguldak basin coals. The width ranged between 1-300 µm, with a mean fracture aperture
~48 μm for two samples and 20.2 μm for the third. An example of several small micro fractures
is illustrated in Figure 2.5. Other studies that have examined non-stressed conditions detail
larger aperture sizes ranging from 10-300 µm depending on basin and depth (Close and Mavor,
1991; Gamson and Beamish, 1991; Laubach et al., 1998). In their report on Western North
China Coal, Su et al. (2001) reported an unstressed aperture range from 1 µm to 8 mm.
Figure 2.5: SEM image of micro fractures in polished coal surface Acılık 2. Ocak coal (Karacan
and Okandan, 2000)
The length of a cleat is measured using the distance parallel to the bedding plane from one
terminus to the other, either on core samples or in the field (Figure 2.6). Typically formed in
straight lines, the length can vary depending on the type of cleat measured (face or butt)
(Mazumder et al., 2006). Thus, fracture length can range from mm to tens of meters as shown
in Figure 2.7. The application of hydraulic fracturing has long been a tool that can extend the
length of the cleats or create larger artificial fractures in the seam (Kumar et al., 2011; Moore,
2012). Both cleat length and directionality are essential parameter inputs for reservoir
modelling.

15
Figure 2.6: Cleat: pattern, directionality and length representation (Laubach et al., 1998)
Cleat spacing is the distance between adjacent cleat surfaces. Measured over a specified area,
one can calculate the density or frequency of the cleats. Both fracture spacing and thus cleat
density, is controlled by coal rank, lithotype and bed thickness (Clarkson and Bustin, 1996;
Close and Mavor, 1991; Dawson and Esterle, 2010). Ammosov and Eremin (1963) detailed the
relationship between rank and cleat density, concluding that cleat density increased from brown
coal to medium volatile bituminous followed by a decrease in frequency correlating to a further
increase in coal rank. However, Laubach et al. (1998) stated that higher ranked coals surpassing
a vitrinite reflectance of 1.5% (low volatile bituminous to anthracite) stayed constant with
increasing maturity. Su et al. (2001) in studying Western North China Coal concluded that both
scenarios existed within the confines of their samples. They reported that when reflectance
exceeded 1.35%, as coal rank increased: 1) cleat frequency decreased, 2) remained constant;
3) decreased slowly to about 3.5% reflectance then remained constant. However, the
mechanisms involved in coal seam creation are both varied and complex, involving different
constituents and devices. As such, variation between basins may be extensive. Spacing varies
with coal rank to form a bell-shaped distribution curve, decreasing from lignite to medium
volatile bituminous and increasing through the anthracite range (Gamson et al., 1993; Law,
1993; Mazumder et al., 2006); and is influenced by coal lithotype and ash yield (Law, 1993).
Laubach et al. (1998) stated that coal with high ash yield had a greater degree of cleat spacing
compared to low ash yield. Furthermore, a relationship between aperture, spacing, and
permeability was proposed, based on measurements taken from the San Juan and Black Warrior

16
Basin that a linear relationship existed between increasing frequency and effective
permeability.
Figure 2.7: Correlation for permeability based on cleat spacing and orientation (Laubach et al.,
1998).
Cleat height is the distance between the topmost points to the bottom perpendicular to the
bedding plane. Coal lithotypes are the primary influence on fracture heights (Close and Mavor,
1991). Dawson and Esterle (2010) examined four different ranked Bowen basin coal (two high,
one medium and one low volatile) and categorised four types of cleats: 1) master, 2) single
vitrain layer, 3) multiple vitrain layers and 4) durain layer (Figure 2.8). The master cleats were
of greatest interest in the application of modelling due to the vertical and lateral extent that they
displayed, passing through many lithotype layers. The length of master cleats can exceed 1m.
Other fracture heights can range from 1 mm to 60 mm (Close and Mavor, 1991; Su et al., 2001)
However; no trends have been established between decreasing joint or master cleat spacing
with coal rank (Dawson and Esterle, 2010).

17
Figure 2.8: Representation of the four primary cleat classes the by Dawson & Esterle, (2010).
However, Dawson and Esterle (2010) did conclude that Bowen basin coal displayed an inverse
relationship between cleat spacing frequency and fracture height. Variance in height between
the durain layer and the vitrain layer clearly illustrates the relationship between cleat frequency
and height. This study may rationalise why permeability fluctuates between different beds, but
also laterally and even horizontally within a seam. Previous studies have also reported that
lithotype layer thickness has a linear proportionality to cleat spacing (Law, 1993; Mazumder
et al., 2006).
Cleat connectivity refers to the attached continuousness of fracture interconnections along a
lateral plane (Close and Mavor, 1991). Laubach et al. (1998) concluded that cleat geometry
and fractures connectivity was a critical component to enhancing permeability. Dawson and
Esterle (2010) reported master cleats as a key feature to connectivity, as they can span across
many lithotypes. A study by Rodrigues et al. (2014) elucidated the complex structure of the
cleat network using the “coal core tectonics” (CCT) method, which illustrated the multifaceted
orientation and interconnectedness of cleats using borehole samples.

18
2.3 Relative Permeability in Coal
Permeability is the extent by which a fluid passes through a porous medium (Gu and
Chalaturnyk, 2010). Typically measured in milliDarcy (mD), coal permeability is based
primarily on the particular basin and geological conditions that form the cleat system. The flow
of fluid through a porous medium such as coal can be calculated using Darcy's Law represented
in Equation 2-2:
𝑄 = 𝑘∆𝑃. 𝐴
𝜇𝐿 Equation 2-2
where: Q is the flow rate in cm3/sec, A is the cross-sectional area of the sample in cm2, ΔP is
the pressure difference across the sample in atm, µ is the viscosity in centipoise, L is the length
of the sample in cm, k is permeability in Darcy. A study by Chen (2007) tabulated a generalised
classification of rocks permeability as seen in Table 2-1. Coal seam gas reservoirs can have a
low permeability range and still be economically viable as hydraulic fracturing can be
employed to increase the total number of pathways fluid can migrate through.
Table 2-1: General classification of rock permeability (Z. Chen, 2007)
Classification Permeability range (mD)
Poor to fair 1-15
Moderate 15-20
Good 50-250
Very good 250-1000
Excellent +1000
Relative permeability is an indicator of multiphase flow. This flow may be transient with the
imbibition of a wetting fluid displacing a non-wetting fluid, or drainage when the non-wetting
displaces a wetting fluid. However, in conventional oil reservoirs, relative permeability has
more often been described as the steady state simultaneous injection of fluids through the
porous media. The concept of a relative permeability is expressed as ratio of the permeability
of one or more phase against the permeability to one phase only since the interaction between

19
two or more immiscible fluids as their flows through the pore space would interfere with each
other; This relationship can be expressed mathematically in Equation 2-3:
𝑘𝑟 = 𝑘𝑒
𝑘 Equation 2-3
where: ke is effective permeability. Effective permeability is the ability of a porous medium to
conduct passage of fluid under a potential gradient when the passage has been previously
saturated with one or more fluids. k is the absolute permeability. Absolute permeability refers
to the permeability when one fluid is present at complete saturation. kr is the relative
permeability.
2.3.1 Absolute permeability
Gates and Lietz (1950) visualised the clear pathway through which fluids move as a bundle of
capillary tubes (Figure 2.9a). This representation provided a physical geometry to calculate
absolute permeability. However, experimental results showed that gas flow through the
fractures in coal did not correlate to the results predicted by capillary tube bundles (Chen et al.,
2013). Puri and Seidle (1992) proposed that fluid moving through parallel plates better
represents flow through coal and is described by a matchstick geometry (Figure 2.9b). The
matchstick model has become the preferred conceptual model for fluid movement in the cleat
network (Chen et al., 2013; Pan and Connell, 2012; Shi and Durucan, 2005).
Figure 2.9a) Bundle of capillary tubes, b) matchstick model (D. Chen et al., 2013)
Absolute permeability is calculated on the flow rate of the fluid at 100% saturation of the
porous material with the same fluid. Thus, using the matchstick model, flow through plates can
be mathematically described using:

20
𝑘 = 𝑘𝑜(𝜙
𝜙𝑜)3 Equation 2-4
where: k is the permeability, ko is the initial permeability, ϕ is the porosity and ϕo is the initial
porosity. Equation 2-4 is widely accepted as the mathematical representation of permeability
change on porosity change. Increased cleat frequency enables a greater series of flow pathways
thus resulting in a greater absolute permeability (Faraj et al., 1996; Law, 1993; Mandal et al.,
2004). Generally cleats are considered the primary pathway, the intact coal matrix contains
mostly micropores which do not significantly contribute to fluid flow; and are also more
resistant to stress changes then the cleats. Work by Puri and Seidle (1992) derived a relationship
involving changes in effective stress, σe, and permeability in Equation 2-5
𝑘 = 𝑘𝑜𝑒−3𝐶𝜙𝜎(𝜎𝑒−𝜎𝑜𝑒) Equation 2-5
where Cϕσ is the cleat compressibility volume, 𝜎𝑜𝑒is the initial effective stress and σe is the total
effective stress. The relationship between effective stress and permeability has been well
established with several studies indicating an exponential relationship (Cui et al., 2007; Liu et
al., 2010; Palmer, 2009; Puri and Seidle, 1992). As effective stress increases, absolute
permeability is reduced. Conversely, shrinkage of the coal matrix, caused by gas desorption
from the coal matrix due to a decrease in pore pressure from the reduction in water volume,
causes an increase in the cleat aperture and thus increases absolute permeability. Han et al.
(2010) reported that the breakthrough capillary threshold pressure for the fluid flow was
contingent on the size of the throat radii of the cleat. A small cleat aperture was unlikely to
allow gas flow, and thus preferential pathways for gas and liquid flow are contingent on cleat
aperture.
The two processes can be considered opposed, the relationship between effective stress
(pressure) and shrinkage is a dynamic relationship that induces an equilibrium style change to
absolute permeability. When pressure is high, the associated sorption-induced strain is small.
Thus the dominant force acting on the elastic compression or expansion results in a decrease
in width. However, as pressure decreases, cleat pressure is reduced. Thus the dominant force
acting on the fractures is the expansion or compression of the matrix due to changes in gas
volume. Wang et al. (2011a) represented this relationship in Figure 2.10.

21
Figure 2.10: Relationship between pore pressure, gas content and permeability (G. G. X. Wang
et al., 2011)
2.3.2 Anisotropic modelling of stress/strain in cleats
As mentioned, the absolute permeability of coal is an idealised representation of the cleats to
create a matchstick geometry (Figure 2.11A). However, due to the orientation and
interconnectedness of the face and butt cleats, permeability is typically anisotropic (Figure
2.11B). Anisotropic stress/strain is considered as the underlying physical representation of the
coal cleat network to understand absolute permeability. Pan and Connell (2013) produced a
thorough literature review of permeability models and explained the need to enhance them to
enable a better representation the reality of reservoir behaviour. This thesis will reflect on
several of the most commonly accepted models currently used in both academic and industrial
fields.

22
Figure 2.11: Idealised coal cleat geometries A) Isotropic matchstick geometry and B)
Anisotropic matchstick geometry. Figure from Pan and Connell (2013).
Shi and Durucan Model
The Shi-Durucan model incorporates uniaxial strain and constant vertical stress conditions into
an isotropic linear proto-elasticity framework shown in Equation 2-6. The model represents
changes in permeability to effective stress. The model also uses clear compressibility expressed
in Equation 5 to show changes in cleat permeability.
𝜎ℎ𝑒 − 𝜎ℎ0
𝑒 = 𝑣
1 − 𝑣(𝑝 − 𝑝0) +
𝐸𝜀𝑠
3(1 − 𝑣) Equation 2-6
Cui and Bustin Model
The Cui-Bustin model also adopts a linear proto-elastic framework but includes an assumption
that the uniaxial strain and a constant lithostatic stress. The changes in stress are presented in
Equation 2-7.
𝜎 − 𝜎0 = 2(1 − 2𝑣)
3(1 − 𝑣)[(𝑝 − 𝑝0) + 𝐾(𝜀𝑠 − 𝜀𝑠0] Equation 2-7

23
2.3.3 Methods to determine Relative Permeability
Methods to determine coal relative permeability are characterised into those where data is
derived from laboratory experiments and reported from field production. Laboratory tests
typically use either: 1) unsteady-state method, 2) steady-state, 3) capillary pressure and the
novel technique of 4) microfluidic frameworks. These techniques were adopted directly from
multiphase fluid flow tests used in conventional oil sandstone formations and as such have not
undergone significant modifications (except in sample handling and preservation) to measure
relative permeability in coal (Ham and Kantzas, 2008). Experimental data is reported from the
use of coal cores, obtained from a core drill bit ensuring the natural cleat structure, maintaining
porosity and absolute permeability. However, size should be 2.5-3.5 inches and a
length/diameter ratio of between 1-0.75 to provide a representative structure (Purl et al., 1991).
Field production data is used as an input for 5) history matching.
Unsteady state is relatively quick compared to the steady state method. In an unsteady state
test, the coal core is saturated with a wetting fluid (under pressure) then a non-wetting fluid is
injected either at a constant pressure or flow rate to displace the wetting fluid, while the flow
rate and differential pressure are measured over the duration of the test. The Johnson, Bossler,
and Naumann (JBN) (Johnson et al., 1959) method is the most common to derive relative
permeability curves from the displacement of the wetting fluid. Other methods include Welge
(Welge, 1952) Jones-Roszelle (Jones and Roszelle, 1978), and Hagoort (Hagoort, 1980).
Several assumptions are used in all methods including fluids are immiscible, fluids are
incompressible, flow is linear, flow is uni-directional, the porous medium is homogeneous and
capillary effects are negligible. However, these assumptions are not valid for coal cores, given
the degree of heterogeneity inherent to coal, cleat interconnectedness, and gas desorption.
These assumptions create the discrepancy in the validity of the results obtained from unsteady
state tests. The steady state method is considered a more accurate test and thus is a preferred
method to determine relative permeability in coal (Ali, 1997).
Steady state method injects both gas and water simultaneously at a constant rate until pressure
equilibrium across the core increased which enables a more realistic assessment of relative
permeability based on the unique wettability of the coal. Relative permeability versus
saturation curves is calculated through ratio changes in the injection rates, usually determined
by volumetric or gravimetric material balance. Other techniques used in conjunction with core
flooding tests such as CT scanning and X-ray imaging have also been used to determine relative
permeability (Cnudde and Boone, 2013; Permana, 2012). The steady state method still has

24
similar problems to unsteady state, in that cleat connectivity, and fines migration can distort
permeability results, as well as the influence of capillary pressure and capillary end effect.
Capillary end effect arguably induces the most serious source of error as it can cause a capillary
pressure gradient along the porous material. The result is that Darcy's Law (Equation 2-2) is
no longer valid, as the wetting fluid will remain in the narrow capillary pore throats near the
exit, as opposed to entering the non-capillary space downstream of the exit.
Capillary pressure technique is a broad term that encompasses a range of experimental
techniques used to derive relative permeability curves using samples that are typically smaller
than cores and measure the displacement of a single fluid (wetting or non-wetting depending
on the process) versus changes in pressure. These techniques include 1) Mercury methods, 2)
porous plate methods, and 3) centrifuge methods.
1) Purcell (1949) first reported a correlated relationship between mercury capillary
pressure and air/water capillary pressure. This approach enabled estimating
permeability from mercury intrusion. The Mercury method injects mercury (a non-
wetting fluid in the case of coal) into the small pores of an evacuated rock sample, at
increasing pressure (Jones et al., 1985). The mercury is well suited to penetrate the
irregular shape of the pore throats and in combination with extrusion data can predict
the shape, size and interconnectedness of the macropore structure in coal (Friesen and
Mikula, 1987; Yao and Liu, 2012). Results are achieved within hours, yet the nature of
the mercury intrusion (toxicity and damage to the micro structure due to pressure)
means that the technique is considered destructive to the sample and non-repeatable.
2) Porous plate uses a porous rock with a flat face placed on a porous membrane. The rock
is saturated with water and pressure in the gas phase is increased incrementally on top
of the material, displacing the liquid in the rock. When the displacement at that pressure
is complete, the change in pressure between the gas surrounding the sample and the
water on the lower side of the plate is the capillary pressure and corresponds to the
water saturation of the sample (Gilliland and Maloney, 1994). Incremental increases in
pressure are applied, and the result is a capillary pressure relationship against
decreasing water saturation. The process can be very time-consuming and results using
coal can produce a range of values based on the frequency of cleating in the sample,
stone layers, and orientation.
25
3) Centrifuge methods use an oil saturated sample spun at increasing speed to force the oil
to displace. The volume of oil is measured by a collector, and the gas/oil capillary
pressure relationship is calculated (Newsham et al., 2004).
Microfluidic devices have been used in a range of different industries and are popular due to
their relative ease of construction, real-time visualisation of fluid flow and fluid behaviour
characterisation, as well as being cost effective compared to established core flooding
techniques. These devices have been used previously in EOR experiments (Blunt, 2001;
Galindo-Rosales et al., 2012; Nilsson et al., 2013) and to investigate the effect of pore structure
on relative permeability (Jerauld and Salter, 1990). Gerami et al. (2016) proposed the use of a
polydimethylsiloxane (PDMS) 2D microfluidic chip with a flow pathway based on CT scans
of a coal core cleat system which would represent the actual size and geometry of a real cleat
structure. A water relative permeability end point of 0.15 was measured with the residual gas
saturation of 0.16. The results of this experiment could be applied to develop a greater
understanding the relationship between coal cleat structure and the resulting relative
permeability can be used to interpret larger scale tests. While the PDMS wettability was
uniform, chemical alteration of sections of the PDMS to create regions with different contact
angle may better parallel the heterogeneous nature of the coal.

26
Figure 2.12: Schematic of the workflow associated with the creation of a 2D microfluidic
device with cleat geometry based on CT coal core scans (Gerami et al., 2016).
History matching technique predicts the in situ relative permeability of a reservoir. Used in
conventional and unconventional gas wells utilising key reservoir properties as inputs, such as
(but not limited to) the: seam thickness, absolute permeability, gas content, gas desorption and
diffusion rates, effective pressure and water saturation, into a numerical model that simulates
the production profile of a well based on similar comparable wells with a known production
profile (Young et al., 1991). Additional information following well completion, such as skin
factor, well orientation and other completion data are also used to modify the relative
permeability curves, within acceptable limits, to match similar wells. The major advantage of
history matching is that the technique does not rely on laboratory studies to determine relative
permeability, which is useful when core analysis may not be possible due to the conditions of
the well, cost limitations or, as previously mentioned, the inherent uncertainty in upscaling
laboratory core results to reservoir scale. The result is a relative permeability based on known

27
physical well characteristics and defined production data, making the technique widely used in
the petroleum industry. The difficulty with relying solely on this method is that there is a
number of possible fitting parameters which could be varied to obtain the history match and
these cannot be validated without core measurements.
2.3.4 Relative Permeability Curves
In CSG relative permeability relates to gas and water flow in the cleats. Initially, cleats are
usually water saturated, but during depressurisation, gas bubbles are formed from desorption
of gas from the matrix into the cleat, lowering the pore space available for water. As gas content
increases, it begins to flow through the cleats (Connell et al., 2007). Thus, relative permeability
as described in Equation 2-3 is a dimensionless value between 1, representing total saturation
of one fluid, to 0, a non-continuous flow of that phase. This can be graphed as in Figure 2.13.
Important characteristics of Relative permeability include the end point saturations for the
respective fluids and cross point saturation.
Figure 2.13: Relative permeability curve for two phase gas/water flow (Connell et al., 2007)
Cross point saturation is the saturation at which the relative permeability of gas equals water.
It is commonly stated that the cross point saturation can be used to infer the degree of coal
hydrophilicity, as cross point saturations over 0.5, imply that water has a greater propensity
than the gas phase to adhere to the coal surface. Some studies that measured relative
permeability of coal cores in the laboratory using steady or unsteady method detailed a cross
point water saturation fraction exceeding 0.5, implying coal is water wet (Conway et al., 1995a;

28
Durucan et al., 2013; Ham and Kantzas, 2011; Purl et al., 1991; Rahman and Khaksar, 2007;
Shen et al., 2011). However, experimental results have also shown that coal may have a mixed
wetting state based on mineralisation, pressure, gas desorption, rank, lithotype, and pH (Gash
et al., 1992; Ham and Kantzas, 2011).
The end point saturation of water is the fraction of residual water left in the coal based on the
experimental conditions (e.g. temperature and pressure). The end point water saturation
fraction of is an amalgamation of three characteristics: 1) water absorbed in matrix, 2) water
trapped in dead end coal pores (both micro-cleats and micropores), 3) even though the cleats
are well connected, due to the physical conditions of the cleat (coal surface, material properties
of the surface, significant aperture) water is not able to flow through the entire cleat network
(Wang et al., 2011a; Wang et al., 2011b). This high water saturation is a unique occurrence in
coal and is not seen in conventional sandstone formations.
Several studies have reported differences between calculated relative permeability against field
history matching (Chen et al., 2013; Clarkson et al., 2011; Conway et al., 1995b; Ham and
Kantzas, 2011; Meaney and Paterson, 1996). As previously discussed relative permeability is
difficult to accurately quantify due in part to dynamic variations in the absolute permeability.
Tao et al. (2012) reported that dewatering rates and bottom-hole pressure are two factors that
can induce permeability damage on the cleats, especially when dewatering rates are too high
in the early stages of gas production. (Ham and Kantzas, 2011).
Willem-Jan Plug et al. (2008) reported that the coal surface was affected by changes in pressure
such that the coal surface adopted a hydrophobic interface at high pressure and becoming a
water-wet system once pressure decreased. While this study used CO2 the concept that coal
may have a preference to different fluids at varying pressures is an interesting result.
Chaturvedi et al. (2009) and Sakurovs and Lavrencic (2011) also present research that supports
the concept that coal may have a variable wettability preference based on pressure. Gash (1991)
also stated that at high pressures the coal surface less water-wet and preferred methane contact.
Chaturvedi et al. (2009) detailed that an increased alkalinity decreased contact angles and
improved coal wettability illustrated in Figure 2.14. While relative permeability is an accepted
means of understanding and predicting multiphase flow behaviour in porous media, the
techniques currently adopted do not enable a complete and systematic understanding of
multiphase flow through coal cleats, specifically fluid interactions with different coal
lithotypes.

29
Figure 2.14: Sessile drop contact angle measurements which show increased water wettability
of coal with an increased fluid pH (Chaturvedi et al., 2009).
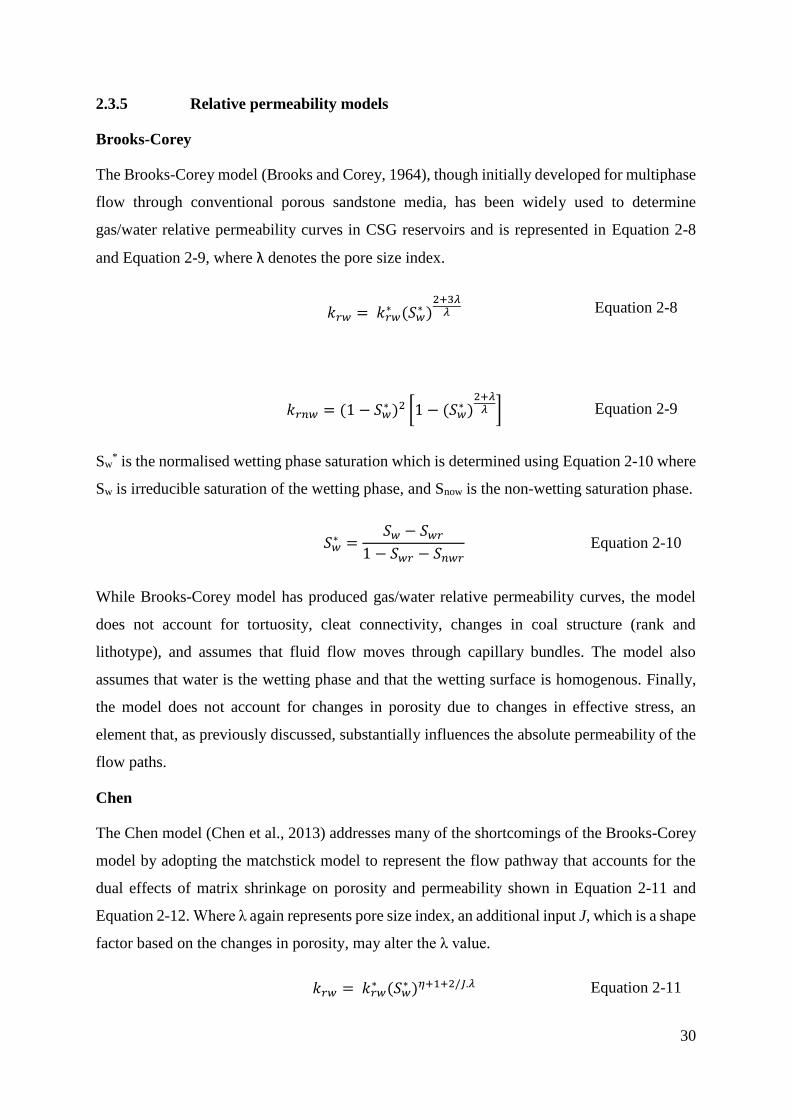
30
2.3.5 Relative permeability models
Brooks-Corey
The Brooks-Corey model (Brooks and Corey, 1964), though initially developed for multiphase
flow through conventional porous sandstone media, has been widely used to determine
gas/water relative permeability curves in CSG reservoirs and is represented in Equation 2-8
and Equation 2-9, where λ denotes the pore size index.
𝑘𝑟𝑤 = 𝑘𝑟𝑤∗ (𝑆𝑤
∗ )2+3𝜆
𝜆 Equation 2-8
𝑘𝑟𝑛𝑤 = (1 − 𝑆𝑤∗ )2 [1 − (𝑆𝑤
∗ )2+𝜆
𝜆 ] Equation 2-9
Sw* is the normalised wetting phase saturation which is determined using Equation 2-10 where
Sw is irreducible saturation of the wetting phase, and Snow is the non-wetting saturation phase.
𝑆𝑤∗ =
𝑆𝑤 − 𝑆𝑤𝑟
1 − 𝑆𝑤𝑟 − 𝑆𝑛𝑤𝑟 Equation 2-10
While Brooks-Corey model has produced gas/water relative permeability curves, the model
does not account for tortuosity, cleat connectivity, changes in coal structure (rank and
lithotype), and assumes that fluid flow moves through capillary bundles. The model also
assumes that water is the wetting phase and that the wetting surface is homogenous. Finally,
the model does not account for changes in porosity due to changes in effective stress, an
element that, as previously discussed, substantially influences the absolute permeability of the
flow paths.
Chen
The Chen model (Chen et al., 2013) addresses many of the shortcomings of the Brooks-Corey
model by adopting the matchstick model to represent the flow pathway that accounts for the
dual effects of matrix shrinkage on porosity and permeability shown in Equation 2-11 and
Equation 2-12. Where λ again represents pore size index, an additional input J, which is a shape
factor based on the changes in porosity, may alter the λ value.
𝑘𝑟𝑤 = 𝑘𝑟𝑤∗ (𝑆𝑤
∗ )𝜂+1+2/𝐽.𝜆 Equation 2-11

31
𝑘𝑟𝑛𝑤 = 𝑘𝑟𝑛𝑤∗ (1 − 𝑆𝑤
∗ )𝜂[1 − 𝑆𝑤∗ )1+2/𝐽.𝜆] Equation 2-12
k*rw and k*
rnw represent the end point relative permeability of the wetting and non-wetting phase
respectively. S*w is numerically expressed in Equation 2-13 and incorporates effective stress
(σ), cleat compressibility (cf), gas density (pg). The 0 subscript represents the initial state.
𝑆𝑤
∗ =𝑆𝑤 − 𝑆
𝑤𝑟0𝑒𝑛𝑤𝑟𝑐𝑓(𝜎−𝜎0)
1 − 𝑆𝑤𝑟0𝑒
𝑛𝑤𝑟𝑐𝑓(𝜎−𝜎0) − 𝑆𝑔𝑟0𝑒
𝑛𝑔𝑟𝑐𝑓(𝜎−𝜎0) (𝑝𝑔
𝑝𝑔0)
−1 Equation 2-13
Chen’s model still does not evaluate the effect that changing lithotype has on fluid flow. While
the model accounts for the changes in pore size distribution, and the influence of stress, the
model still assumes that water is a wetting fluid for the coal. A subsequent study by Chen et al.
(2014) proposed a tentatively correlated U-shape relationship between λ and rank, based on the
European and Chinese coal samples (Figure 2.15), based on a limited sample size.

32
Figure 2.15: Proposed correlation between cleat size distribution and coal rank using a) fixed
carbon (d.a.f) % and b) vitrinite reflectance, Ro (%) for Chinese and European coal samples
(Chen et al., 2014).
Shen
The Shen model (Shen et al., 2011), is an empirical model derived from multiple regression
analysis on experimental data (using a Whole Core Flow System) from five different Chinese
rank coals (0.89-2.87 Ro, max,%). The equations (Equation 2-14 and Equation 2-15) account for
the unique pore structure inherent to different coal macerals of varying rank. Shen’s model
attempts to account for these inimitable variables inherent in coal.
𝑘𝑟𝑔 = (−0.29𝑅𝑜,𝑚𝑎𝑥 + 0.0073𝑉 − 0.0031𝐼 + 0.097𝐴) 𝑆𝑛𝑔9.5𝑅𝑜,𝑚𝑎𝑥−0.11𝑉+0.48𝐼−5.64𝐴
Equation 2-14

33
𝑘𝑟𝑤 = (−0.2𝑅𝑜,𝑚𝑎𝑥 + 0.0018𝑉 − 0.0069𝐼 + 0.06𝐴) 𝑆𝑛𝑔403.36𝑅0,𝑚𝑎𝑥−13.96𝑉+2.59𝐼−104.41𝐴
Equation 2-15
where Ro, max is the vitrinite reflectance, V and I is the vitrinite and inertinite maceral group
percentage, A is the ash content, and Sng is the particular gas saturation. While the model
captures elements of the coal composition, the previous models did not, the equations are based
on a limited sample size, and restricted to a regional area. Also, the model does not account for
the range of micro-macerals within the two groups identified (such as the different maceral in
vitrinite like telovitrinite) and does not include other lithotypes, such as aliphatic based groups.
Avraam & Payatakes
The Avraam and Payatakes model are based on conventional oil and gas reservoirs, yet their
model explores several key themes that are relatable to CSG two-phase flow. Since the model
based on conventional oil and gas conventions, water refers to the wetting fluid and oil based
fluids non-wetting. Avraam and Payatakes used an etched glass pore network model to
experimentally determine the effect flow capillary number (Ca), viscosity (κ) and flow rate ratio
(r) on steady-state two-phase relative permeability (Avraam and Payatakes, 1999). These
experimental parameters were varied, while values such as wettability (moderate ~40˚),
coalescence factor (high) and geophysical and morphological (micro-roughens) characteristics
of the glass model remained fixed. The Ca, and κ are mathematically expressed in Equation
2-16 and Equation 2-17 respectively.
𝐶𝑎 = 𝜇𝑤𝜇𝑡
𝛾𝑜𝑤 Equation 2-16
𝜅 = 𝜇𝑜
𝜇𝑤 Equation 2-17
where μt is the wetting phase superficial flow velocity and μw is the wetting fluid viscosity, μo
is the non-wetting fluid viscosity and γow represents the oil/water interfacial tension. Three
different types of oil/water based fluids were used to alter the Ca and κ. This experimental study
found four distinct flow regimes based on the average mean size oil mobilised ganglia flow.
They included: large-ganglion dynamics (LGD), small ganglion dynamics (SGD), drop traffic
flow (DTF) and connected pathway flow (CPF). These flow regimes were dependent on the
capillary number (Ca), viscosity (κ) and flow rate ratio (r) during two phase steady state flow.

34
LGD flow occurred with a small Ca and significant Sw value, while DTF and SGD occurred with
a large Ca and lower Sw value. CPF was only observed in the instance of high flow rates. The
relative permeability to oil was minor in LGD but increased as the flow regime changed from
LGD to SGD to DTF and finally CPF. The relative permeability to water was slight in the SGD
flow domain and rose faintly in LGD flow, but had a significant increase as the flow mechanism
changed from SGD to DTF to CPF. Figure 2.16 details the experimental visualisation of these
flow regimes.
Figure 2.16: Snapshots of the steady state flow experiment showing the main flow regimes A)
LGD flow, B) SGD flow, C) DTF and D) CPF.
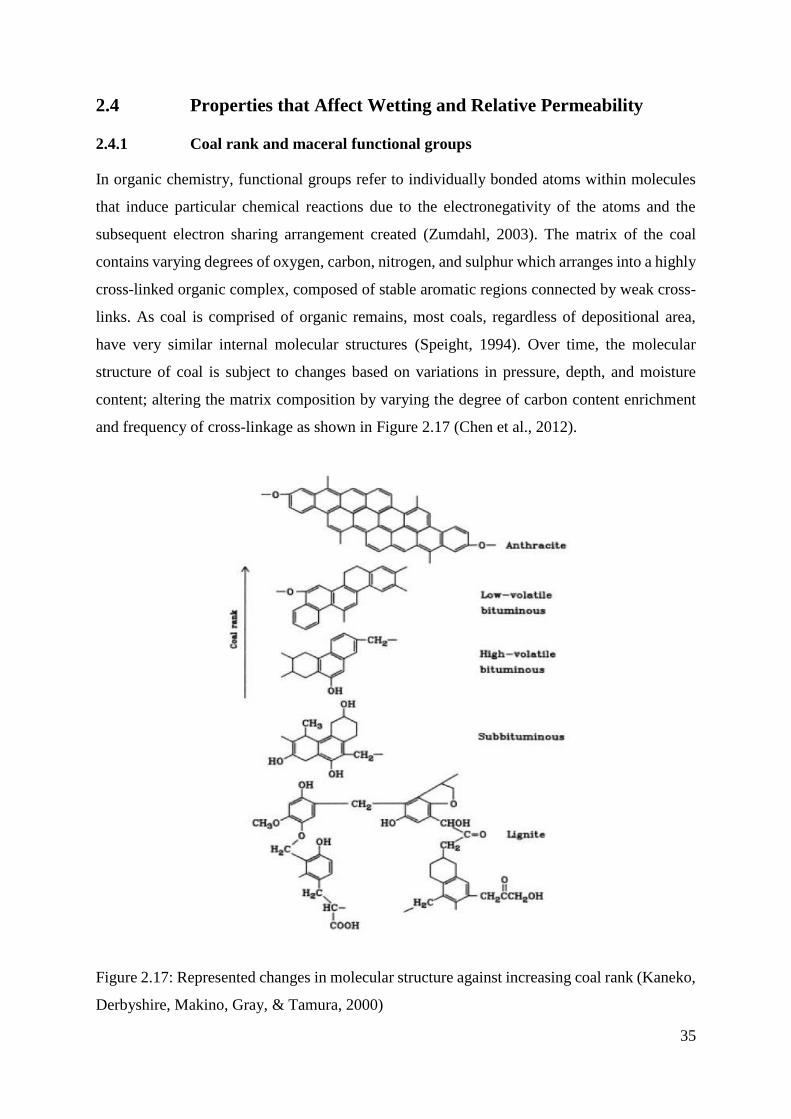
35
2.4 Properties that Affect Wetting and Relative Permeability
2.4.1 Coal rank and maceral functional groups
In organic chemistry, functional groups refer to individually bonded atoms within molecules
that induce particular chemical reactions due to the electronegativity of the atoms and the
subsequent electron sharing arrangement created (Zumdahl, 2003). The matrix of the coal
contains varying degrees of oxygen, carbon, nitrogen, and sulphur which arranges into a highly
cross-linked organic complex, composed of stable aromatic regions connected by weak cross-
links. As coal is comprised of organic remains, most coals, regardless of depositional area,
have very similar internal molecular structures (Speight, 1994). Over time, the molecular
structure of coal is subject to changes based on variations in pressure, depth, and moisture
content; altering the matrix composition by varying the degree of carbon content enrichment
and frequency of cross-linkage as shown in Figure 2.17 (Chen et al., 2012).
Figure 2.17: Represented changes in molecular structure against increasing coal rank (Kaneko,
Derbyshire, Makino, Gray, & Tamura, 2000)

36
In low-rank coal (peat to lignite) there is a high frequency of oxygen functional groups
compared to aromatic rings. These oxygen groups include carboxylic acids, ketones, and
ethers. As coal rank increases (sub-bituminous to anthracite) the frequency of these oxygen
functional groups decreases and the incidence of large-scale poly aromatization of constituent
carbon increases. The increasing maturity results in a decline in hydrophilic functional groups
and a more condensed ring system with fewer cross-links (Laskowski, 2001). A study by Chen
et al. (2012) using Micro-Fourier Transform Infrared Spectroscopy (FTIR) on different rank
coal showed that the frequency of oxygen-containing functional groups (such as –OH and –
COOH) decreased in response to coalification as illustrated in Figure 2.18.
Figure 2.18: FTIR spectrum of different rank coal and their respective functional group
composition and related percentage of carbon/oxygen ratio (Chen et al., 2012).
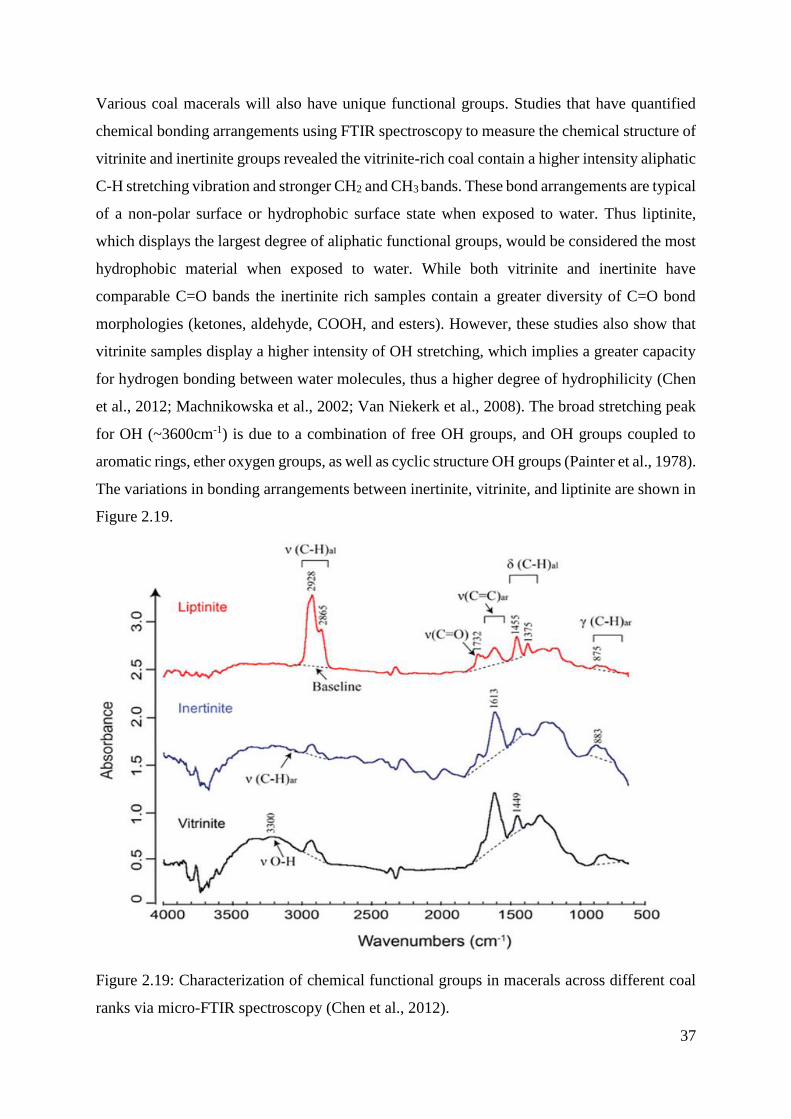
37
Various coal macerals will also have unique functional groups. Studies that have quantified
chemical bonding arrangements using FTIR spectroscopy to measure the chemical structure of
vitrinite and inertinite groups revealed the vitrinite-rich coal contain a higher intensity aliphatic
C-H stretching vibration and stronger CH2 and CH3 bands. These bond arrangements are typical
of a non-polar surface or hydrophobic surface state when exposed to water. Thus liptinite,
which displays the largest degree of aliphatic functional groups, would be considered the most
hydrophobic material when exposed to water. While both vitrinite and inertinite have
comparable C=O bands the inertinite rich samples contain a greater diversity of C=O bond
morphologies (ketones, aldehyde, COOH, and esters). However, these studies also show that
vitrinite samples display a higher intensity of OH stretching, which implies a greater capacity
for hydrogen bonding between water molecules, thus a higher degree of hydrophilicity (Chen
et al., 2012; Machnikowska et al., 2002; Van Niekerk et al., 2008). The broad stretching peak
for OH (~3600cm-1) is due to a combination of free OH groups, and OH groups coupled to
aromatic rings, ether oxygen groups, as well as cyclic structure OH groups (Painter et al., 1978).
The variations in bonding arrangements between inertinite, vitrinite, and liptinite are shown in
Figure 2.19.
Figure 2.19: Characterization of chemical functional groups in macerals across different coal
ranks via micro-FTIR spectroscopy (Chen et al., 2012).

38
2.4.2 Coal rank and maceral gas sorption capacity
Langmuir isotherm is a mathematical representation of the measure of the gas storage capacity
in coal. At a constant temperature sorption, isotherms can vary significantly based on rank
(Bustin and Clarkson, 1998), moisture (Mavor et al., 1990) and temperature (Liu et al., 2010),
as well as gas. Kim (1977) stated that increased coal rank corresponded to an increase in gas
storage capacity at given pressure and temperatures. However a review of CSG literature by
Moore (2012) compared the sorption results of several studies to rank and found no supporting
evidence of a correlation to sorption, as seen in Figure 2.20. As maturity increases, the
coalification process reduces moisture content. Moisture reduces the sorption capacity of gas
on the coal surface through a combination of competitive surface binding and via physical
blockage of the nano-sized pore throats (Bustin and Clarkson, 1998).
Figure 2.20: Adsorption isotherms of different coal ranks around the world using average
vitrinite reflectance maximums (Moore, 2012)
Macerals, such as vitrinite have been found to contain a higher frequency of micropores than
inertinite at respective ranks (Faiz et al., 2007a; Unsworth et al., 1989). These studies have
demonstrated a relationship with vitrinite-rich coals absorbing more methane than inertinite
rich coals (Lamberson and Bustin, 1993; Law, 1993; Levine, 1993). However, other studies
have contradicted this finding (Faiz, 1993; Krooss et al., 2002). An explanation for this
discrepancy may be due to the inherent difficulty to separate the influence of rank from maceral

39
characteristic as well as sample comparison across basins. Another explanation is the difference
in maceral composition, as opposed to maceral group. For example, Sydney basin has Permian
coals, which consists of an inertinite composition capable of storing more methane than
northern hemisphere coals (Faiz et al., 2007a).
Arguably the most consistent relationship is between ash yeild and gas sorption. Mineral
matter, is the inorganic constituent of coal. Minerals are fine particles that are deposited in
regions due to liquid migration, primarily in the cleats or parts of the matrix if porosity is
sufficient. An increase in ash content (mineral matter) results in a linear decrease of gas
adsorption capacity as shown in Figure 2.21, as the mineral acts as a diluting agent (Faiz et al.,
2007a; Laxminarayana and Crosdale, 1999; Levine, 1993).
Figure 2.21: Relationship between ash yield and in-situ gas content (M. Faiz et al., 2007)

40
2.4.3 Minerals and clays
Mineral matter in CSG is a broad term encompassing the constituent elements of large
inorganic compounds present in coal (Ward, 2002). Minerals can originate in coal via 1) a
primary mechanism which involves the mineral being deposited with peat accumulation and
from the original organic composition of the plant or; 2) a secondary mechanism which relates
to precipitation during coalification. Ward (2002) defined inorganic minerals in coal as having
three fundamentally different types of constituents 1) dissolved salts in pore water; 2) Inorganic
elements integrated into the organic compounds within the macerals; and 3) Crystalline as well
as non-crystalline minerals.
The mineral matter found in coals can be grouped into the following mineral ions: Silicates
(quartz, feldspars and clays), Carbonates (calcite, dolomite and siderite), sulphides (pyrite),
phosphates (apatite, monazite) and others (anatase, rutile and zircon). Several of these minerals
are illustrated in Figure 2.22. Most of these mineral groups are clays and aluminosilicate
(Flores, 2013). The introduction of minerals in the cleat network decreases the permeability of
the system as mineral matter is impermeable to fluid flow. Faraj et al. (1996) study found that
Australian Bowen Basin coals commonly contained minerals in the cleats such as illite,
kaolinite, calcite, and chlorite. Studies have demonstrated that mineral matter in coal is
hydrophilic and displays a propensity to hold, and in some cases, absorb water (Gosiewska et
al., 2002a).
Figure 2.22: An SEM image of coal minerals from Australian Bowen basin coals. 1) kaolinite,
2) pyrite and 3) ankerite (Dawson et al., 2012).
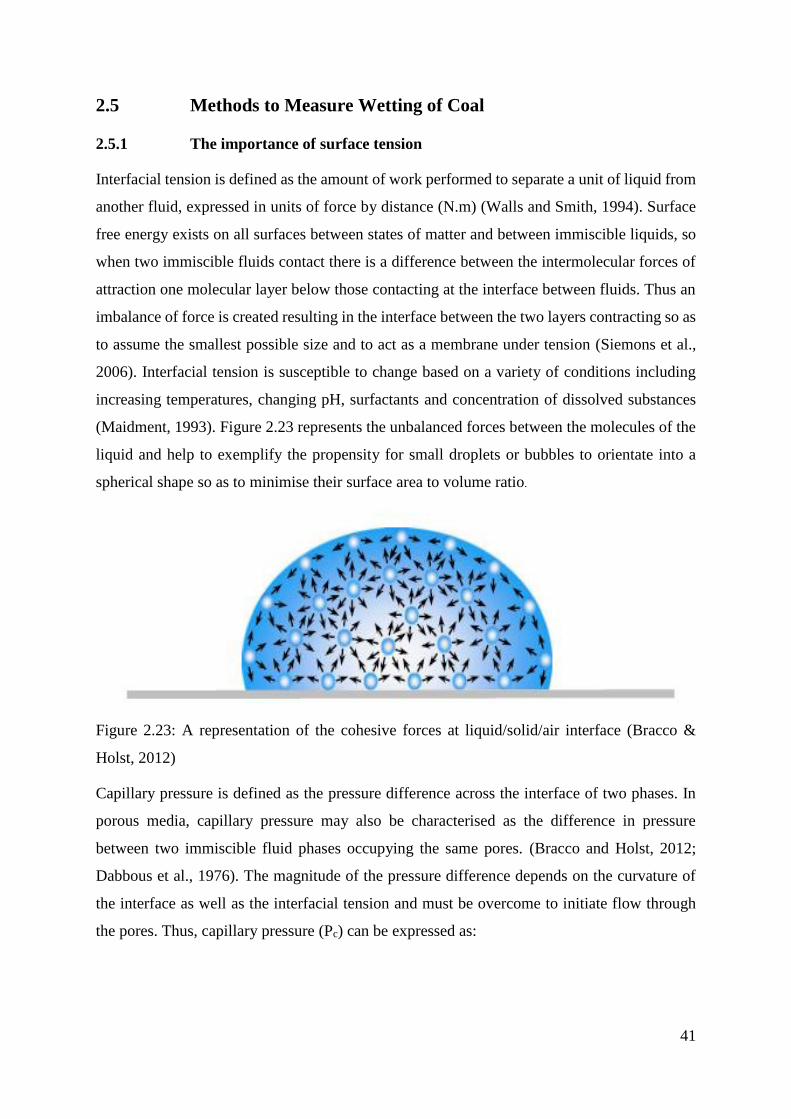
41
2.5 Methods to Measure Wetting of Coal
2.5.1 The importance of surface tension
Interfacial tension is defined as the amount of work performed to separate a unit of liquid from
another fluid, expressed in units of force by distance (N.m) (Walls and Smith, 1994). Surface
free energy exists on all surfaces between states of matter and between immiscible liquids, so
when two immiscible fluids contact there is a difference between the intermolecular forces of
attraction one molecular layer below those contacting at the interface between fluids. Thus an
imbalance of force is created resulting in the interface between the two layers contracting so as
to assume the smallest possible size and to act as a membrane under tension (Siemons et al.,
2006). Interfacial tension is susceptible to change based on a variety of conditions including
increasing temperatures, changing pH, surfactants and concentration of dissolved substances
(Maidment, 1993). Figure 2.23 represents the unbalanced forces between the molecules of the
liquid and help to exemplify the propensity for small droplets or bubbles to orientate into a
spherical shape so as to minimise their surface area to volume ratio.
Figure 2.23: A representation of the cohesive forces at liquid/solid/air interface (Bracco &
Holst, 2012)
Capillary pressure is defined as the pressure difference across the interface of two phases. In
porous media, capillary pressure may also be characterised as the difference in pressure
between two immiscible fluid phases occupying the same pores. (Bracco and Holst, 2012;
Dabbous et al., 1976). The magnitude of the pressure difference depends on the curvature of
the interface as well as the interfacial tension and must be overcome to initiate flow through
the pores. Thus, capillary pressure (Pc) can be expressed as:
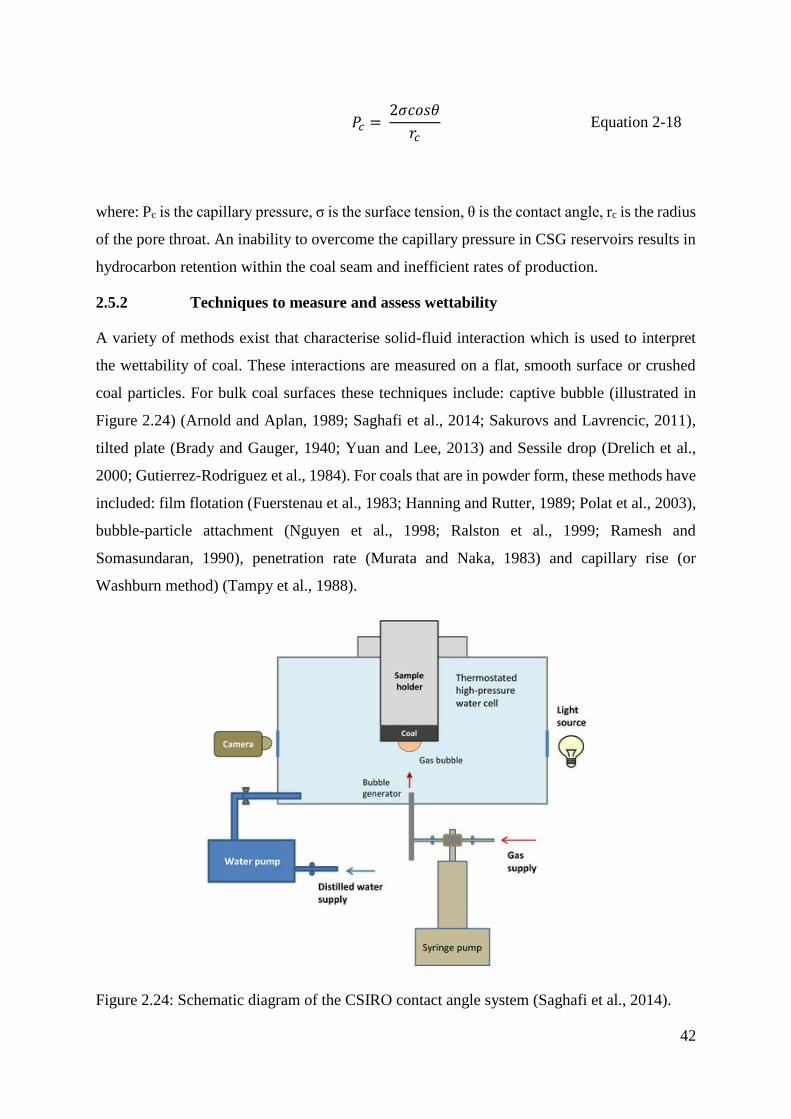
42
𝑃𝑐 = 2𝜎𝑐𝑜𝑠𝜃
𝑟𝑐 Equation 2-18
where: Pc is the capillary pressure, σ is the surface tension, θ is the contact angle, rc is the radius
of the pore throat. An inability to overcome the capillary pressure in CSG reservoirs results in
hydrocarbon retention within the coal seam and inefficient rates of production.
2.5.2 Techniques to measure and assess wettability
A variety of methods exist that characterise solid-fluid interaction which is used to interpret
the wettability of coal. These interactions are measured on a flat, smooth surface or crushed
coal particles. For bulk coal surfaces these techniques include: captive bubble (illustrated in
Figure 2.24) (Arnold and Aplan, 1989; Saghafi et al., 2014; Sakurovs and Lavrencic, 2011),
tilted plate (Brady and Gauger, 1940; Yuan and Lee, 2013) and Sessile drop (Drelich et al.,
2000; Gutierrez-Rodriguez et al., 1984). For coals that are in powder form, these methods have
included: film flotation (Fuerstenau et al., 1983; Hanning and Rutter, 1989; Polat et al., 2003),
bubble-particle attachment (Nguyen et al., 1998; Ralston et al., 1999; Ramesh and
Somasundaran, 1990), penetration rate (Murata and Naka, 1983) and capillary rise (or
Washburn method) (Tampy et al., 1988).
Figure 2.24: Schematic diagram of the CSIRO contact angle system (Saghafi et al., 2014).
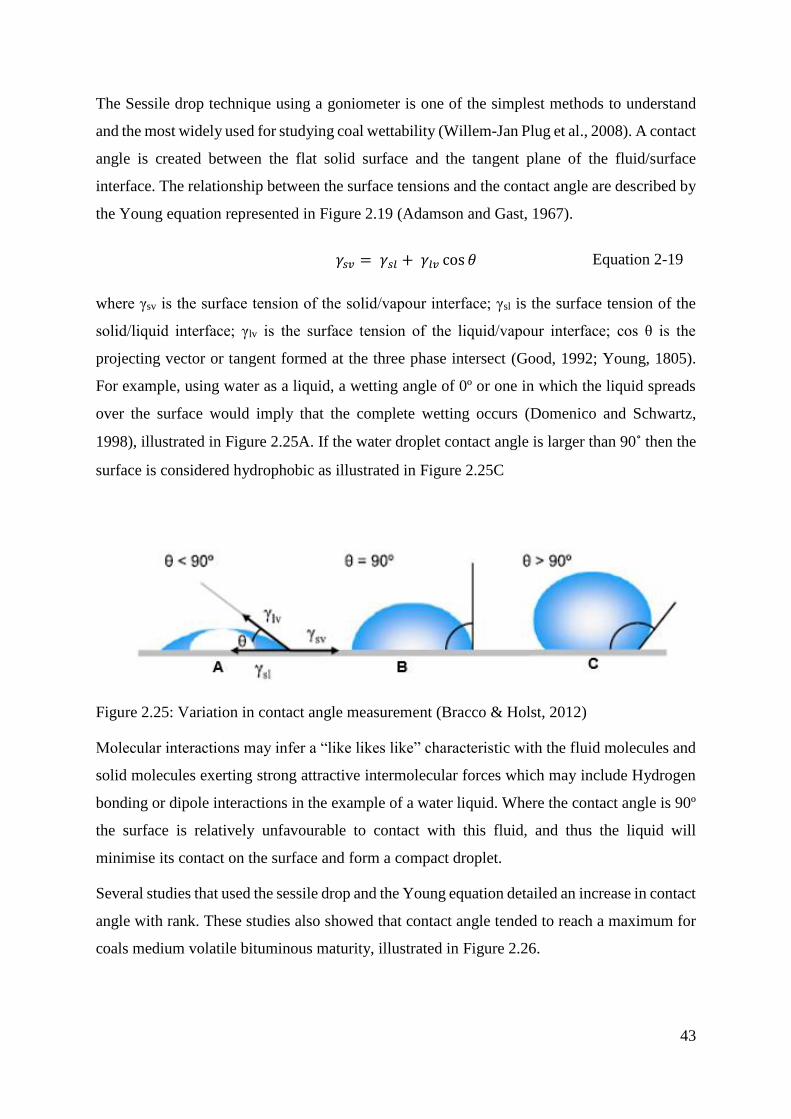
43
The Sessile drop technique using a goniometer is one of the simplest methods to understand
and the most widely used for studying coal wettability (Willem-Jan Plug et al., 2008). A contact
angle is created between the flat solid surface and the tangent plane of the fluid/surface
interface. The relationship between the surface tensions and the contact angle are described by
the Young equation represented in Figure 2.19 (Adamson and Gast, 1967).
where γsv is the surface tension of the solid/vapour interface; γsl is the surface tension of the
solid/liquid interface; γlv is the surface tension of the liquid/vapour interface; cos θ is the
projecting vector or tangent formed at the three phase intersect (Good, 1992; Young, 1805).
For example, using water as a liquid, a wetting angle of 0º or one in which the liquid spreads
over the surface would imply that the complete wetting occurs (Domenico and Schwartz,
1998), illustrated in Figure 2.25A. If the water droplet contact angle is larger than 90˚ then the
surface is considered hydrophobic as illustrated in Figure 2.25C
Figure 2.25: Variation in contact angle measurement (Bracco & Holst, 2012)
Molecular interactions may infer a “like likes like” characteristic with the fluid molecules and
solid molecules exerting strong attractive intermolecular forces which may include Hydrogen
bonding or dipole interactions in the example of a water liquid. Where the contact angle is 90º
the surface is relatively unfavourable to contact with this fluid, and thus the liquid will
minimise its contact on the surface and form a compact droplet.
Several studies that used the sessile drop and the Young equation detailed an increase in contact
angle with rank. These studies also showed that contact angle tended to reach a maximum for
coals medium volatile bituminous maturity, illustrated in Figure 2.26.
𝛾𝑠𝑣 = 𝛾𝑠𝑙 + 𝛾𝑙𝑣 cos 𝜃 Equation 2-19

44
Figure 2.26: Sessile drop contact angle measurements and the effect of coal rank (maturity
based on vitrinite reflectance) on wettability (modified from He and Laskowski (1992)).
The Young equation was developed to represent ideal flat, homogenous surfaces. However,
coal is a heterogeneous material for which the contact angle may be considered a function of
properties of the different materials which make up the surface, as well as the surface
roughness. The Cassie Equation (Cassie, 1948; Cassie and Baxter, 1944) provides a simple
averaging for two or more chemically different materials that contribute to a heterogeneous
surface (Equation 2-20).
where θ1 and θ2 are the contact angles for different materials, and x1 and x2 are the fraction of
surface each material covers and θc is the overall wetting angle. The Cassie equation has been
used in several Sessile drop studies to explain and predict the contact angle of a heterogeneous
surface, such as coal (Ding, 2009; Drelich et al., 1996; Fuerstenau et al., 1990; Gosiewska et
al., 2002b; He and Laskowski, 1992; Keller, 1987; Rosenbaum and Fuerstenau, 1984). Results
from several studies have demonstrated that different lithotypes have unique wetting surfaces,
with inertinite rich coal creating a contact angle ~70°, vitrinite rich ~80º and liptinite rich
~110°.
Keller (1987) (full equation in Appendix A, on page 167) proposed a modified Cassie equation
that could be used to predict contact angle on a polished coal surface given specific information
such as mineral percentage, carbon content, rate of oxidation and percentage lithotype. When
this equation was applied to previous coal wettability studies that used Sessile drop a general
cos 𝜃𝑐 = 𝑥1 cos 𝜃1 + 𝑥2 cos 𝜃2 Equation 2-20

45
agreement between the estimated and experimental contact angle was reported. However, these
measurements were made on a flat, polished surface, a property that does not occur in natural
coal features.
2.5.3 Measuring contact angle on a rough surface and hysteresis
Gamson et al. (1993) reported that coal possessed a range of different surface textures,
predominately based on the lithotype. Bright banded coal displayed a smooth surface compared
to dull banded coal which had a rougher more fractured surface. The phenomenon of roughness
is an important factor in examining liquid-solid contact angle as the surface roughness can
create hysteresis in the tangent created between the liquid and solid surface as shown in Figure
2.27 (Drelich et al., 1996). This roughness, if not accounted for in the measurement typically
generates a larger contact angle which implies a higher degree of hydrophobicity.
Figure 2.27: Using an idealised coal sample (black) and pure water droplet (blue) A) the contact
angle generated on a flat surface is approximately 90°. B) When the same liquid is placed on a
textured or roughened surface, the droplet angle becomes larger than 90º due in part to contact
hysteresis. This phenomenon where gas is trapped is known as a Cassie wetting state. C) A
Wenzel wetting state exists where water can penetrate the textured surface while still creating
a contact angle that exceeds 90º.
Micron and nano-scale roughness on surfaces can also dictate the contact state of the liquid
droplet and thus the wetting property of the material (Ishino and Okumura, 2008). These states
include the 1) Cassie state where air becomes trapped in the “valleys” of the roughened surface
which creates a buffer between the liquid-solid interface, and 2) the Wenzel state, where the
liquid is able to imbibe into the valley recesses created on the rough surface (Figure 2.27B and
C) (Feng et al., 2008; Marmur, 2003; Truong et al., 2010; Wenzel, 1949). The Cassie state
creates the “lotus effect” where water droplets on a lotus leaf can be displaced with minimal
kinetic energy due to the trapped air creating zero surface energy between the liquid and solid
(Gao and McCarthy, 2006). In this state, only a fraction of the textured surface is in contact

46
with the liquid phase. The Wenzel effect is the mechanism responsible for the “petal effect”
which is seen on certain flower petals (Feng et al., 2008). The droplet shape is still in excess of
90° implying that the surface is hydrophobic, yet the imbibed water can imbibe into the surface
texture and pores which creates a water-wet film that causes the water droplet to adhere to the
surface. In certain situations, depending on surface mineral composition, surface chemistry,
porosity and micro-topography, a Cassie wetting state may also transition to a Wenzel state
(Feng et al., 2008; Marmur, 2003; Truong et al., 2010; Wenzel, 1949).
Work by Gamson et al. (1996) shows that the Bowen Basin dull and bright band lithotypes
typically exhibit very different topographies at a micron scale, illustrated in Figure 2.28. This
difference is due to the dull banded coal possess phyterals that create a more porous and
interconnected structure, compared to the bright band. Gamson et al. (1996) also reported that
these microstructures in the dull band are heavily mineralised and both the dull and bright
bands have different diffusivity rates, as well as the potential to exhibit significant differences
in gas and water flow behaviour.
Figure 2.28A) A Bright band coal SEM image. B) Dull banded coal SEM image. Both images
taken from Gamson et al. (1996).
Though surface roughness has been demonstrated to influence the wetting state of a surface,
there exists a gap in the literature that addresses coal roughness, and the influence this may
have on flow regimes through the cleat. The wetting state of dull and bright band coal lithotypes
may provide a fundamental understanding of how the physical properties of Sw should be
applied in coal.

47
2.5.4 Surface wetting state and fluid flow
As dimensions shrink to a micron scale, surface to volume forces, such as surface tension and
viscosity become more important compared to buoyancy (Cubaud et al., 2006). In micron
channels the capillary forces become sensitive to changes in surface chemistry and roughness.
For a hydrophilic surface with smooth with a consistent texture there are several possible flow
regimes as illustrated in Figure 2.29. In the hydrophilic channel, the bubbles are lubricated and
as such the pressure drop becomes a critical factor in understanding the flow regime.
Figure 2.29: Pure water/air flow patterns in hydrophilic channels. From low to high void
fractions. a) Bubbly flow, b) wedging flow, c) slug flow, d) dry flow (Cubaud et al., 2006).
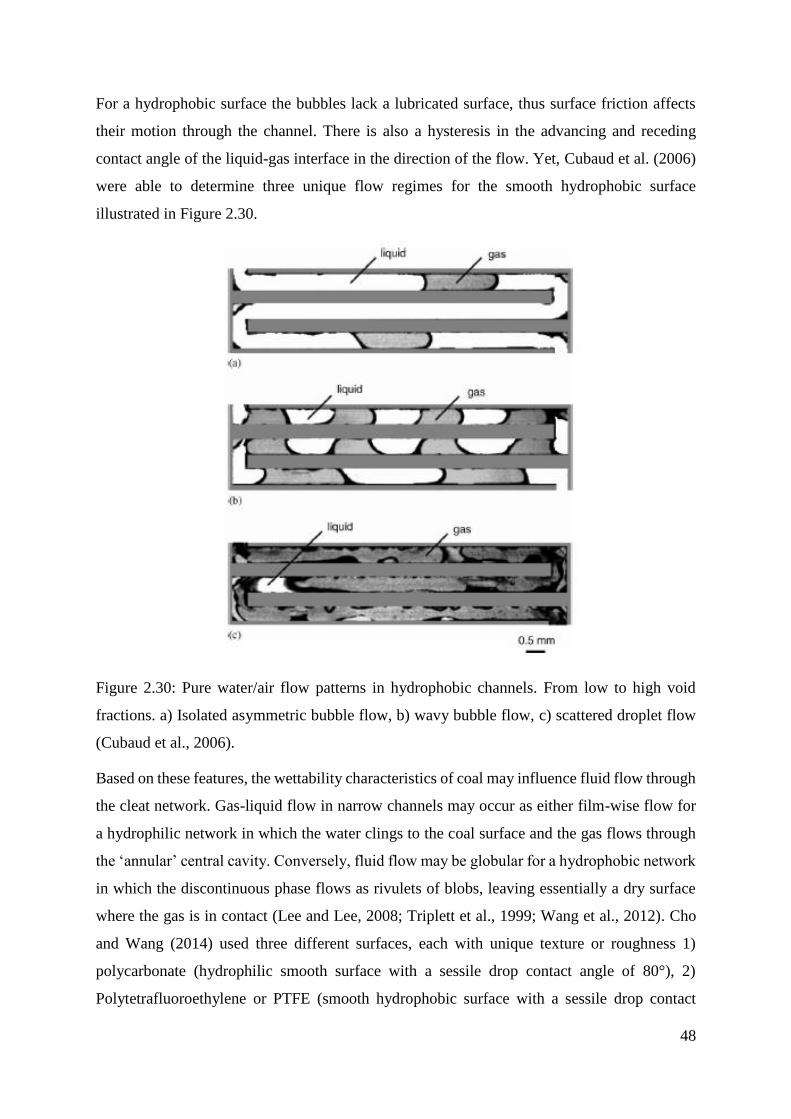
48
For a hydrophobic surface the bubbles lack a lubricated surface, thus surface friction affects
their motion through the channel. There is also a hysteresis in the advancing and receding
contact angle of the liquid-gas interface in the direction of the flow. Yet, Cubaud et al. (2006)
were able to determine three unique flow regimes for the smooth hydrophobic surface
illustrated in Figure 2.30.
Figure 2.30: Pure water/air flow patterns in hydrophobic channels. From low to high void
fractions. a) Isolated asymmetric bubble flow, b) wavy bubble flow, c) scattered droplet flow
(Cubaud et al., 2006).
Based on these features, the wettability characteristics of coal may influence fluid flow through
the cleat network. Gas-liquid flow in narrow channels may occur as either film-wise flow for
a hydrophilic network in which the water clings to the coal surface and the gas flows through
the ‘annular’ central cavity. Conversely, fluid flow may be globular for a hydrophobic network
in which the discontinuous phase flows as rivulets of blobs, leaving essentially a dry surface
where the gas is in contact (Lee and Lee, 2008; Triplett et al., 1999; Wang et al., 2012). Cho
and Wang (2014) used three different surfaces, each with unique texture or roughness 1)
polycarbonate (hydrophilic smooth surface with a sessile drop contact angle of 80°), 2)
Polytetrafluoroethylene or PTFE (smooth hydrophobic surface with a sessile drop contact
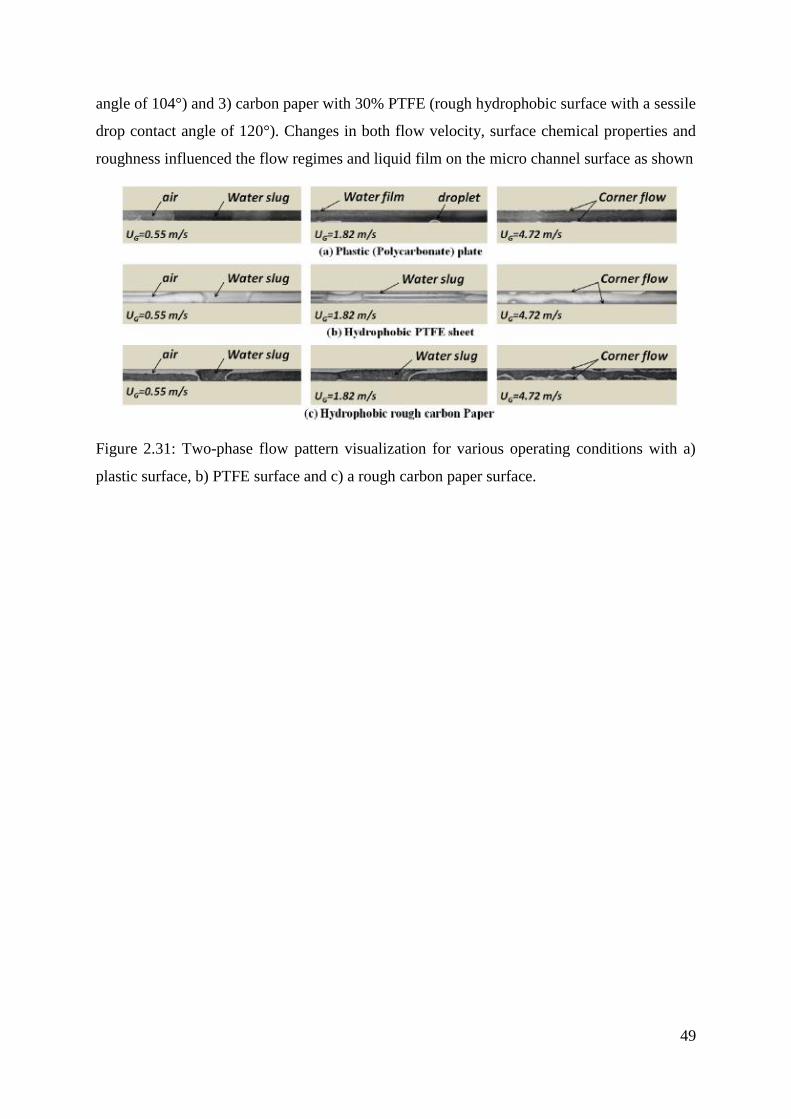
49
angle of 104°) and 3) carbon paper with 30% PTFE (rough hydrophobic surface with a sessile
drop contact angle of 120°). Changes in both flow velocity, surface chemical properties and
roughness influenced the flow regimes and liquid film on the micro channel surface as shown
Figure 2.31: Two-phase flow pattern visualization for various operating conditions with a)
plastic surface, b) PTFE surface and c) a rough carbon paper surface.

50
2.6 Conclusions from the Literature Review
Based on the literature review, an integrated method to understand relative permeability in coal
does not currently exist. This is exemplified as laboratory measurements using a number of
techniques produce a wide range of results that are very different from field history matching.
Currently, relative permeability is widely correlated to water saturation which depends
decisively on wetting behaviour, yet from the literature sources reviewed, there is little
consistency concerning coal wetting behaviour or indeed how to properly interpret and
compare wetting measurement results obtained using different techniques. The wetting state of
coal provides an insight into how fluids will flow through the cleat network.
Two phase flow through microchannels can manifest as unique flow regimes based on the
surface composition (chemical functional groups) and topography (surface roughness) as these
conditions directly influence the wetting state of the surface. Gas-liquid movement in narrow
channels may develop as either (A) annular film flow in a hydrophilic network where water
clings to the coal surface and gas flows through the central cavity, or (B) discontinuous globular
or rivulets of two-phase flow in a hydrophobic network, which can leave a dry surface where
the gas is in contact with the cleat wall illustrated in Figure 2.32 (Lee and Lee, 2008; Triplett
et al., 1999; Wang et al., 2012). In coal, the presence of a liquid film has the potential to block
cleats, creating bottlenecks in the network unless sufficient gas pressure can overcome the
restrictive liquid droplet (Teng et al., 2016). While coal lithotype (dull and bright) have been
shown to possess both varied functional groups (Chen et al., 2012), as well as surface roughness
(Gamson et al., 1996), no study has reported the collective impact these characteristics have on
flow regime in the cleats.

51
Figure 2.32A) Representation of annular flow with liquid adhering to the coal surface, while
gas passes through the centre. B) Representation of Globular flow where discrete blobs of gas
and water move through the cleat, creating an alternating wet/dry surface.
The real world outcome from not understanding the potential impact different flow regimes is
the belief of a perceived uniform radial flow through the reservoir towards the well bore with
the final product a weighted average of the fluid flow, not dissimilar to many modelled
assumptions currently utilised. Yet, the reality is an uneven migration of gas and water where
regions within the coal would adopt preferential flow paths for liquid and another for gas based
on cleat size, lithotype and differential pressure. Long term, this may result in regions of the
reservoir being isolated from the wellbore and a loss in gas production.

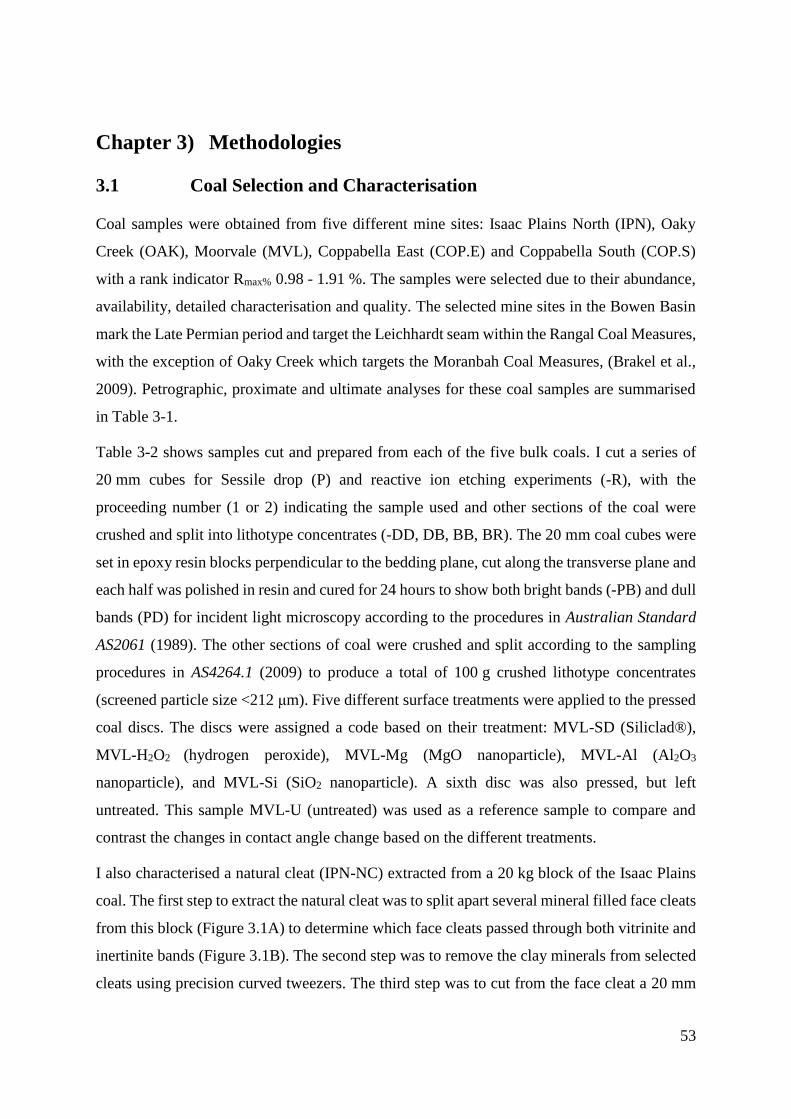
53
Chapter 3) Methodologies
3.1 Coal Selection and Characterisation
Coal samples were obtained from five different mine sites: Isaac Plains North (IPN), Oaky
Creek (OAK), Moorvale (MVL), Coppabella East (COP.E) and Coppabella South (COP.S)
with a rank indicator Rmax% 0.98 - 1.91 %. The samples were selected due to their abundance,
availability, detailed characterisation and quality. The selected mine sites in the Bowen Basin
mark the Late Permian period and target the Leichhardt seam within the Rangal Coal Measures,
with the exception of Oaky Creek which targets the Moranbah Coal Measures, (Brakel et al.,
2009). Petrographic, proximate and ultimate analyses for these coal samples are summarised
in Table 3-1.
Table 3-2 shows samples cut and prepared from each of the five bulk coals. I cut a series of
20 mm cubes for Sessile drop (P) and reactive ion etching experiments (-R), with the
proceeding number (1 or 2) indicating the sample used and other sections of the coal were
crushed and split into lithotype concentrates (-DD, DB, BB, BR). The 20 mm coal cubes were
set in epoxy resin blocks perpendicular to the bedding plane, cut along the transverse plane and
each half was polished in resin and cured for 24 hours to show both bright bands (-PB) and dull
bands (PD) for incident light microscopy according to the procedures in Australian Standard
AS2061 (1989). The other sections of coal were crushed and split according to the sampling
procedures in AS4264.1 (2009) to produce a total of 100 g crushed lithotype concentrates
(screened particle size <212 μm). Five different surface treatments were applied to the pressed
coal discs. The discs were assigned a code based on their treatment: MVL-SD (Siliclad®),
MVL-H2O2 (hydrogen peroxide), MVL-Mg (MgO nanoparticle), MVL-Al (Al2O3
nanoparticle), and MVL-Si (SiO2 nanoparticle). A sixth disc was also pressed, but left
untreated. This sample MVL-U (untreated) was used as a reference sample to compare and
contrast the changes in contact angle change based on the different treatments.
I also characterised a natural cleat (IPN-NC) extracted from a 20 kg block of the Isaac Plains
coal. The first step to extract the natural cleat was to split apart several mineral filled face cleats
from this block (Figure 3.1A) to determine which face cleats passed through both vitrinite and
inertinite bands (Figure 3.1B). The second step was to remove the clay minerals from selected
cleats using precision curved tweezers. The third step was to cut from the face cleat a 20 mm

54
x 20 mm section containing both bright vitrinite rich and dull inertinite rich bands (Figure
3.1C).
Figure 3.1A) Top face of a large block of IPN showing mineral filled face cleats. B) Idealised
coal sample with mineral filled cleat having both a vitrinite rich band and inertinite rich band.
C) Sample IPN-NC shows an open cleat with minerals physically removed and used to compare
to the artificial cleats created.
Table 3-1: Petrographic, proximate and ultimate analysis of coal samples from Isaac Plains
North (IPN), Oaky Creek (OAK), Moorvale (MVL), Coppabella South and Coppabella East
(COPE) (COPS)

55
Samples
Components (%) IPN OAK MVL COPS COPE
Petrographic
Analysis
(air dried
basis)
Rmax 0.94 1.37 1.49 1.89 1.97
Vol. Vitrinite 35 67 49 52 46
Vol. Liptinite 2 0 0 0 0
Vol. Inertinite 50 14 42 44 46
Vol. Mineral 12 20 9 4 0
Proximate
Analysis
(air dried
basis)
Moisture 2.3 1.4 2.0 1.9 1.5
Ash 18.0 8.3 13.6 6.4 8.4
Volatile Matter 21.3 22.9 16.1 11.9 11.3
Ultimate
Analysis
(dry ash free
basis)
Carbon 85.55 87.89 89.16 90.93 91.24
Hydrogen 4.79 4.95 4.59 4.13 4.11
Nitrogen 1.56 2.25 1.66 1.69 1.54
Sulfur 0.35 0.54 0.41 0.27 0.25
Oxygen
(by difference)
7.76 4.38 4.18 2.98 2.86

56
Table 3-2: Description and classification of samples used in micro-channel creation.
Coal sample
code
Bulk coal 20 mm cubes Crushed coal pressed disc process
Reference Chemical and mechanical etching processes Lithotype concentrates Chemical treatments on pressed disc samples
Polished
&
untreated
Natural
coal cleat
Reactive Ion
Etched
UV Laser
ablation
Mechanic
scratch KMnO4
Lithotype
code Lithotype description
15%
Hydrogen
Peroxide
1%
Silicad ®
MgO
nanoparticle
Al2O3
nanoparticle
SiO2
nanoparticle
IPN
-P1
D&B
-NC
-R1 -L1
-S
-DB
Mainly dull with
frequent bright bands
(10-40%)
-P2
D&B -R2
-L2
-DD Dull (less than1%
bright)
-L3
OAK
-P1
D&B -R1
-BR Bright (>90%)
-P2
D&B -R2
MVL
-P1
D&B -R1 -BB
Bright with dull bands
(60-90% bright)
-P2
D&B -R2 -DB
Mainly dull with
frequent bright bands
(10-40%)
-H2O2 -SD -Mg -Al -Si
COP.S
-P1
D&B -R1
-K
-BB Bright with dull bands
(60-90% bright)
-P2
D&B -R2 -DB
Mainly dull with
frequent bright bands
(10-40%)
COP.E
-P1
D&B -R1 -BB Bright with dull bands
(60-90% bright)
-P2
D&B -R2 -DB
Mainly dull with
frequent bright bands
(10-40%)

57
3.2 Sample Visualisation and Characterisation Techniques
3.2.1 Scanning Electron Microscopy (SEM)
The polished, natural, RIE and pressed coal discs were characterised by light microscopy
(Leica DM6000 at x50 magnification) and scanning electron microscopy (SEM, Hitachi
SU3500 Premium VP-SEM with EDS). For the SEM the natural cleat was iridium coated under
argon in a Bal Tec MED 020 coater at a pressure of 3.75 x 10⁻² mTorr with a sputter time of
200 s at 15 mA, and the SEM images of this sample were collected at 15 kV. The RIE channels
and pressed disc channels were coated with carbon instead of iridium to reduce surface
charging during the SEM, and SEM images for these samples were collected at 20 kV. Both
secondary electron and backscatter mode were used and are indicated in each image presented
throughout the thesis.
3.2.2 Light Microscopy (LM)
Optical images were collected with a Leica DM6000 light microscope equipped with a Leica
DFC365 FX Digital high-speed camera and 12V 100W tungsten halogen lamp. Images were
observed using bright field as well as fluorescence with N Plan EPI x5, x10, x20 and x50
objective lenses. Image analysis was performed with the Leica Application Suite Advanced
Fluorescence software package and Image-J Version 1.46r.
3.2.3 X-ray Photoelectron Spectroscopy (XPS)
XPS spectra were acquired by Kratos Axis ULTRA X-ray photoelectron spectrometer with a
monochromatic Al Kα (1486.6 eV) radiation at 225 W (15 kV, 15 mA) and 165 mm
hemispherical electron energy analyser. The C 1s peak at 284.4 eV was used as an internal
standard to correct for charging of the samples. Quantitative analysis was performed using the
CASAXPS software after Shirley background subtraction. The best fits of peaks were obtained
using mixed 30% Gaussian–Lorentzian line shapes. The full width at half maximum (FWHM)
values was fixed at a maximum limit of 1.5 eV for all peaks in the curve fitting procedure. All
samples were oven dried for 12 hours at 60ºC prior to testing.

58
Chapter 4) Creation of Micro Channels in Bowen Basin Coals
using UV Laser and Reactive Ion Etching
4.1 Introduction
The relative permeability behaviour of gas and water is one of the primary controls on
productivity of coal seam gas (CSG), or coal bed methane (CBM), reservoirs. Relative
permeability of coal is often still described using adaptions of the relative permeability models
such as those developed by Brooks and Corey (1966b) and Purcell (Purcell, 1949), which are
based on the assumption of flow through a bundle of capillary tubes. These conventional
models, including LET-type correlations (Lomeland et al., 2005) correlations and the Buckley-
Leverett theory (Buckley and Leverett, 1941), relate the flow of each phase to the fraction of
pore volume occupied by the water phase or the water saturation (Sw). These assumptions may
not be as valid for multiphase flow in coal for several reasons including: (a) the flow may be
restricted at certain bottle-necks in the cleat network (Wang et al., 2007), and (b) the wetting
behaviour of coal may vary from that observed for sandstone rocks, for example the wetting
behaviour of a coal surface may vary with the absorbed gas concentrations, differing rank,
presence of macerals and mineralisation (He and Laskowski, 1992; Kaveh et al., 2011; Ofori
et al., 2010b; Shen et al., 2011).
One of the challenges in the characterisation of relative permeability of coal is the
heterogeneous nature of coal. This includes a range of length scales: from defects in a single
cleat, to bedding layers in a core sample, through to variations at the metre length scale across
a coal seam (Laubach et al., 1998). This chapter reports an experimental approach designed to
allow systematic investigations of the flow of water and gas in coal cleats by creating artificial
channels with controlled properties. I evaluated four methods to etch 20 – 40 μm channels
(wide and deep) in coal with characteristics similar to those natural micro-cleats. The flow of
water and gas (air) in these channels was studied using a microfluidic flow cell and optical
microscope. This method provides an alternative technique to determine wetting contact angles
and provides a visual multiphase flow in coal cleats. The use of the visualising fluid flow in
manufactured cleats may yield quantifiable data on the physics associated with two phase flow
regimes, previously undocumented in CSG reservoirs. This would enhance existing models
used in industry to provide more accurate production predictions and well optimisation
systems.

59
4.2 General Materials and Methods
A typical micro-cleat aperture range is between 6-250 µm (Dawson and Esterle, 2010; Kumar
et al., 2011; Laubach et al., 1998; Mazumder et al., 2006; Solano-Acosta et al., 2007). Cleat
aperture is contingent upon the opposing effects of: increasing effective net stress (reduction
in aperture) and gas desorption from the coal matrix (increase in aperture). Reduction in fluid
pressure is the primary mechanism that increases the effective stress on the cleats and, yet
enables gas migration from the matrix to the cleat, prompting shrinkage of the coal (Gray,
1987; Han et al., 2010; Levine, 1996; Wang et al., 2011a). However, this chapter does not
observe the effect of pressure on cleat aperture. For this thesis we selected cleat widths of 20 -
40 µm as representative of apertures of critical interest to study water and gas flow behaviour.
Other desirable characteristics in the artificial channels are detailed in Table 4-1.
Table 4-1: Key characteristics and design features required for creating an artificial cleat in
polished coal.
Characteristics Design features
Chemical Impact Minimum change to the chemical properties of the coal sample
across a broad range of ranks (0.5-2 Rmax
)
Geo-physical Regular channel width dimensions of 20-40 µm
Angle of wall to floor ~ 90º (±5º)
Depth of channel must be consistent across the length of the etch (±
10 µm)
Length of a channel with the above characteristics should be at a
minimum ~500 µm
Cleat network Capacity to tailor geometry/pathway
Operability Practical or feasible
Repeatable and reproducible
4.2.1 Sample selection
A total of 25 sample cubes (each 20 mm length) were cut perpendicular to the bedding plane
in coals from those listed in Table 3-2 on 56. An additional cored coal sample (Bowen 6Z,
location in confidence) was used as a reference to determine critical natural cleat characteristics
such as cleat aperture and angle of the cleat face (Figure 4.1). The coal sample cubes were
mounted in 50 x 35 x 20 mm epoxy blocks. The mounted samples were ground and polished
for incident light microscopy according to the procedures in Australian Standard AS2061
(1989).

60
Figure 4.1: Top view of a coal core drilled perpendicular to the bedding plane (Bowen 6Z) with
face and butt cleating visible (plan view).
4.3 Channel Etching Techniques and Characterisation
The channel etching methods evaluated for making an idealised cleat channel in this study
included (1) UV laser ablation, (2) reactive ion etching in oxygen plasma (RIE), (3) mechanical
scratching with a tungsten carbide cutting tool, and (4) chemical etching in an acidic solution
of KMnO4. The potential of each technique to create artificial channels was assessed with the
criteria described in Table 4-1. Channels were etched in 15 of mounted coal samples (as
summarised in Table 3-2 under chemical and mechanical etching processes); two untreated
samples from each mine location were retained as reference samples for the Raman
spectroscopy analysis.
4.3.1 UV laser ablation
The UV laser cut channels were fabricated at MiniFab, Melbourne (www.minifab.com.au)
using an Excimer laser (Lambda Physik, LPX 210i) operated at 248 nm with pulses of
approximately 20 ns at a frequency of 100 Hz. Chrome-on-quartz photo masks with a 300 µm
circular pattern were applied to the coal samples. The beam delivery optics (S8000, Exitech
Ltd) included a 6 x 6 double array homogeniser that illuminated 10 x 10 mm2 field and
provided an intensity distribution across the plane of approximately 5% RMS deviation. The
beam exposing the selected pattern on the mask was directed through a 10x projection lens to

61
give a 1x1 mm2 field. The projection lens had a numerical aperture of 0.3 with a diffraction
limited resolution of 0.8 mm.
4.3.2 Reactive ion etching (RIE)
There were 8 stages in the RIE process: (1) A 200 nm thick aluminium film was deposited on
the mounted coal sample by electron beam evaporation at 2 Å/s in a vacuum of 1.5 x 10⁻⁶ Torr
using a Temescal FC-2000 apparatus. (2) A negative photoresist AZ2070 (Microchemicals)
was applied on top of the aluminium layer using a Brewer Science® CeeTM 200X spin coater at
1200 rpm for 45 s. The AZ2070 layer was pre-baked for 5 min at 65ºC then for 10 min at 95
ºC. (3) A glass mask with the desired channel dimensions (20 µm width) was placed over the
mounted coal sample and the block was exposed to a UV light source for 16 s. The UV treated
samples were heated again at 95 ºC for a total of 20 min and then to 120 ºC for another 5 min
before being cooled to room temperature. (4) The mounted block was immersed in a developer
solution, AZ726, for 90 s then heated at 120 ºC for 30 min. (5) Coated coal samples were
exposed to 50 sccm O2 flow and 200 W power for 5 min in the ion etching instrument
(PROG200 Reactive Ion Etcher) at a pressure of 150 mTorr to de-scum the surface. (6) The
cleaned, coated samples were immersed in another developer solution, AZ400K, for 2 min 15
s to etch the 20 µm channel in the aluminium film to expose the coal surface, then dried and
returned to the RIE. (7) The channel is created in the coal in the seventh stage of the RIE
process by treating the sample for several 5 min intervals at 300 W and 200 mTorr in 50 sccm
O2 over 90 min to achieve the desired 20 µm depth. After each 5 min etch the coal block was
removed from the RIE and cooled in N2 to prevent the Epoxy mount from getting too hot. (8)
Finally, the etched coal samples were washed in acetone for 15 s to remove any residual photo
resistance layers.
4.3.3 Mechanical scratching
The coal sample was cut with a 100 µm tungsten-carbide cutting tool at an angle of
approximately 55˚ to ensure that only the sharp corner edge of the cutting tool would impact
the coal surface. The cutting tool was moved by hand control across the coal block at speeds
of approximately 5 cm/s to 20 cm/s and applied force over a range of 10-30 N; cutting speed
did not have a significant effect on the produced channels. A schematic is included in Appendix
B on page 169.

62
4.3.4 Chemical etching in KMnO4
A 100 µm dam was constructed on the surface of coal block between two epoxy plates (20 mm
x 20 mm x 0.5 mm), which were attached to the coal sample using a liquid graphite adhesive.
The epoxy plates were then slowly pushed together by hand whilst using x5 light microscope
objective as a visual aid to achieve an approximate distance between the plates of 40 µm. A
total of 2 mL of a 1M KMnO4 solution acidified with dilute H2SO4 was added drop wise to the
channel over 30 s and allowed to react with the coal.
4.3.5 Soft Lithography
A soft lithography approach was used to create polydimethylsiloxane (PDMS) impressions of
the cleat/channel structures. This method, coupled with SEM provided a more detailed analysis
of the channel morphological features, as opposed to using SEM directly. A small region of
the coal sample was damned using Bostik Blu-TackTM (shown as a white rectangle in Figure
4.1) and this volume was filled with 10 mL of PDMS, which was hardened at 80 ºC for 45 min
in an oven. The impression was removed from the coal surface using a scalpel then stuck to a
glass cover slide with liquid graphite and a 20mm diameter carbon tab. An iridium coating was
applied to the PDMS impression under argon in a Bal Tec MED 020 coater at a pressure of
3.75 x 10⁻² mTorr with a sputter time of 200 s at 15 mA. The PDMS impression was coated at
a 45º angle relative to the iridium source and a second time with the sample turned clockwise
180º to ensure both sides of the impression were adequately coated in Iridium. Electron
microscopy images were collected with a JEOL 6460LA SEM.
4.3.6 Raman spectroscopy
Raman spectroscopy was performed with a 514.2 nm argon laser (Renishaw InVia Raman
Microscope) to examine vitrinite rich bands running perpendicular to the etched channels.
Figure 4.2 shows a typical selection of three regions of interest (ROI) in the vitrinite rich band
outside the etched channel and three ROIs in the channels of each sample. Raman spectra of
untreated vitrinite bands in the 4 reference coal samples were also collected. The Raman spectra
were deconvoluted using a Lorentzian curve fitting algorithm (Origin Pro 8) with peaks
analysed at 1604 cm-1, 1368 cm-1 and 1262 cm-1. These peaks were examined as characteristic
markers to determine if the coal structure at the surface of the etched channels had changed
significantly compared to untreated vitrinite rich bands in the coals. Vitrinite rich bands were
selected as the reference maceral because vitrinite is considered to be more sensitive than other
macerals to chemical or thermal reactions that may induce changes in sp2-sp3 electron

63
configurations observable by Raman spectroscopy. Moreover, there are several published data
sets available for comparison that describe changes in vitrinite Raman spectra induced by
pyrolysis or thermal coking (Das, 2001; Hodek et al., 1991; Li, 2007; Rentel, 1987; Scaroni et
al., 1988).
Figure 4.2: Post polished coal cube (IPN-1i) set in epoxy resin a) thin vitrinite band running
the length of the samples and perpendicular to the etched pathway (plan view), b) regions of
interest (ROI) were selected across the vitrinite band to assess the range of variation in Raman
spectra of the natural vitrinite.

64
4.4 Flow Cell for Two Phase Flow Visualisation
Flow of gas and water through the RIE channel in IPN-R2 and the UV laser ablated channel in
IPN-L3 was observed in a microfluidic cell. Figure 4.3 shows a simplified flow diagram of the
flow cell and a photograph of the five 1.5 mm holes drilled in a typical epoxy-mounted coal
block to connect the tubing. The top of the channel was sealed with adhesive film (Thermo
Scientific ABsolute qPCR seal #AB-1170) that was cured for 7 days to form a hydrophobic,
fluorescence resistant and air tight seal. Flow experiments were conducted by injecting water
containing 1 wt% solution of fluorescein acid yellow 73 at rate of 25 µl/min using a 2 ml
syringe pump (Model 74905-52 Cole Parmer) and injecting pulses of air manually from a
second 2 ml syringe. The flow rates were determined based on the requirement to achieve
visualisation and image capture of two phase flow, not as an indication of reservoir subsurface
flow rates. The pressure drop across the cleat was measured with a Dwyer Series 490 Wet/Wet
Handheld Digital manometer (0 to 15 psi range). The flow could be shut-in to trap a gas bubble
or water plug in the field of view to examine characteristics such as contact angles. Several
fluid withdrawal tests were also performed by operating the water pump in the reverse direction
at a rate of 5000 µL/min. Optical images were captured with the Leica DM6000.
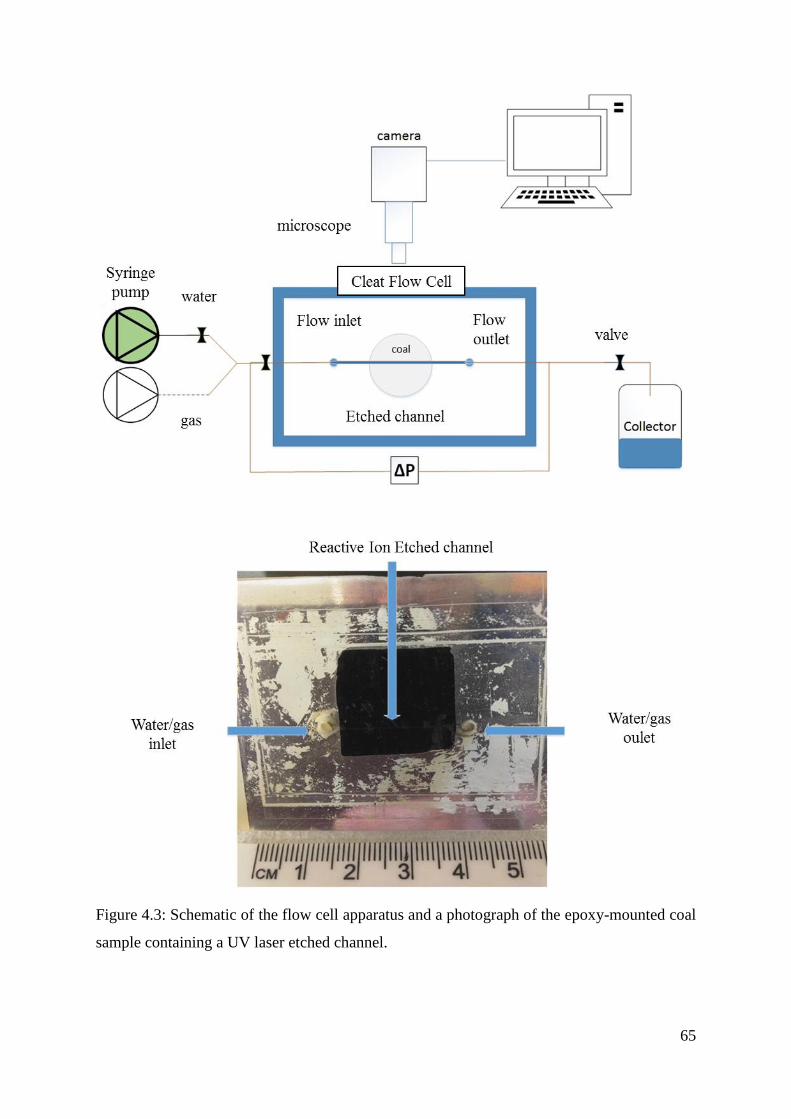
65
Figure 4.3: Schematic of the flow cell apparatus and a photograph of the epoxy-mounted coal
sample containing a UV laser etched channel.

66
4.5 Results and Discussion
4.5.1 Channel geometry and morphology
The natural cleat examined in the DZ6 coal sample is shown in Figure 4.4. The widths of the
face cleats and butt cleats in this sample are both within the range 63 – 98 µm. The morphology
of this natural cleat was used as a reference for defining design criteria for the etched channels,
but we targeted narrower channels at 20 – 40 μm width for the investigation of water and gas
flow because of predicted pressure drops during flow experiments. Table 4-2 provides a
summary of the characteristics of the channels produced by the four etching processes
described in section 4.3. Further descriptions of channel observation by optical imaging, optical
profiling, SEM and Raman spectroscopy are described onwards.
Figure 4.4: Intersection of a natural face cleat and butt cleat on the surface of DZ6 coal sample.

67
Table 4-2: Summary of the characteristics of channels etched in Bowen Basin coal samples
using UV laser, reactor ion etching, mechanical scratching and chemical oxidation in KMnO4.
Etching technique
UV Laser Reactive Ion
Etching
Mechanical
(scratch)
Chemical
(KMnO4)
Facility MiniFab
(Melbourne)
ANFF (UQ) UQ Chemical
Engineering
workshop
UQ Chemical
Engineering
laboratories
Channel width
and depth)
~35 µm x 35
µm
20 µm x 20 µm ~240 µm x 300
µm
~150 µm x 300
µm
Shape: V shape
Channel width
on top surface
~30 µm
Channel width
on the bottom~8
µm
U shape
Pattern on the
bottom highly
irregular and
rough
U and V shape
Pattern on the
bottom
appeared
fractured and
irregular.
V shape at
bottom.
Indeterminate
Width
consistency
Varied over the
length
± 15 µm
Consistent
± 5 µm
Extreme
variation
± 80 µm
Extreme
variation
± 60 µm
Wall
straightness
Irregular Close to 90 Irregular Irregular
Channel
features
Smooth
Cracked tile
appearance.
Wave like
features and
large
projections
Fractured Irregular
Morphology Smooth and
consistent walls
Similar to
natural cleat
Irregular Some
similarities
Time required
for single
sample
15 min
(maximum)
9-12 hours
(minimum)
10 min
(maximum)
15-30 min
Preferred
technique: Preferred

68
4.5.2 Channel geometry examined by light microscopy
The chemical oxidation of coal with KMnO4 was not a successful method for etching cleats in
this study. I tried several strategies to control the area of coal exposed to KMnO4 through
modification to the block molds and KMnO4 concentration, but the coal channels could not be
satisfactorily and consistently etched to any suitable length. The channels produced by
chemical etching had large variations in depth and channel pattern along the channels.
Furthermore, chemical oxidation with like KMnO4 will induce significant changes in the
oxygen concentration on the coal surface (Somasundaran et al., 1991; Sorokina et al., 2005).
Figure 4.5 shows a channel scratched in coal using the carbide cutting tool. This method
produced the widest channels in this study. Although the tip of the cutting tool was
approximately 100 µm in diameter, we found that it was difficult to control the depth of incision
with this tool. We observed that as the cutting tool was moved across the coal sections of
macerals were sheared off, and this shearing mechanism left maceral deposits protruding into
the channel and produced uneven sections along the channel with depths varying between 20
– 80 µm. Better control of the cutting tool together with a lubricant to reduce friction and
shearing of the coal surface might deliver improvements. However, for the purpose of this
study it was deemed unlikely that a scratch method would be capable of creating a clean,
regular cleat width given coal’s material properties and heterogeneity.
Figure 4.5: Channel created by scratch method using a carbide cutting tool on IPN-S at (x50).

69
The UV laser and RIE methods produced channels in the coal that satisfied the key width,
length and regularity criteria listed in Table 4-1. Typical examples of the UV laser etched
channels and RIE channels are shown in Figure 4.6 and Figure 4.7, respectively. These
channels are generally straight, although some minor defects can be observed. For example, in
the IPN- R1 sample a defect at the side of the channel resulted from a poor adhesion of the
photoresist layer at this later, which led to over exposure of the coal to the ion source. Based
on the optical microscope observations I selected the etched channels in IPN-R1 and 2, OAK-
R1 and 2, MVL-R1 and 2, COP.S-R1 and 2, COPS-R1 and 2, COPE-R1 and 2, as well as
IPN- L1-3 for more detailed characterisation with optical profiling, SEM and Raman
spectroscopy.
Figure 4.6: Example of a UV laser etched channel on IPN-2L observed under light
microscope at (x50).

70
Figure 4.7: Optical light microscope image at (x200) of reactive ion etched channel on
IPN- R1 (sample 1 of the two IPN samples). The defect labelled (a) resulted from over
exposure of the coal to the ion beam at this location due to a poor adhesion of the photoresist
layer.

71
4.5.3 Characterisation of channel depth
The PDMS impressions of the UV laser and RIE channels were examined using a Vecco Wyko
NT100 optical profile system and SEM. The soft lithography approach was selected for the
characterisation of channel depth as the optical profiler could not reliably measure the channel
depth directly because too much light was absorbed by the floor of the coal channels. Figure
4.8 shows the depth profile of a RIE channel in COPS-R2 as an example of a channel
impression measured with the optical profiler and the depth of this RIE channel is 14-20 μm.
The intersection of the etched channel with the epoxy block is clearly shown in Figure 4.8, and
this step profile highlights that the epoxy was etched at almost twice the rate that the coal was
removed. Based on the rate of coal etching, the channel depth could be controlled by adjusting
the time the sample was exposed to the ion beam. However, in this study, the practical limit
for the RIE channels was found to be a depth of 25 μm because the photo-resistant layer only
lasted 90 min when exposed to the ion source. The UV laser method could produce channels
up to 35 μm deep.
Figure 4.8: Optical profile of PDMS impression of COP.S2i ion etched coal (green) and epoxy
(red) interface using a Vecco Wyko NT1100 optical profile system at x10 magnification.
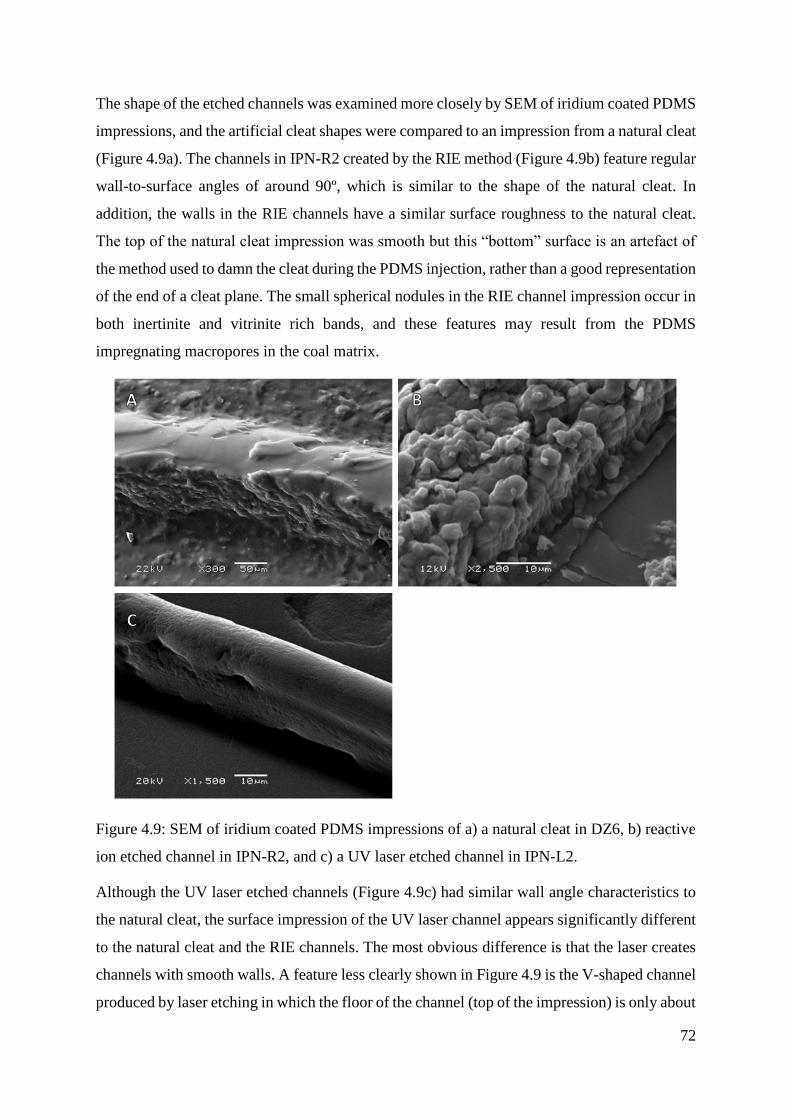
72
The shape of the etched channels was examined more closely by SEM of iridium coated PDMS
impressions, and the artificial cleat shapes were compared to an impression from a natural cleat
(Figure 4.9a). The channels in IPN-R2 created by the RIE method (Figure 4.9b) feature regular
wall-to-surface angles of around 90º, which is similar to the shape of the natural cleat. In
addition, the walls in the RIE channels have a similar surface roughness to the natural cleat.
The top of the natural cleat impression was smooth but this “bottom” surface is an artefact of
the method used to damn the cleat during the PDMS injection, rather than a good representation
of the end of a cleat plane. The small spherical nodules in the RIE channel impression occur in
both inertinite and vitrinite rich bands, and these features may result from the PDMS
impregnating macropores in the coal matrix.
Figure 4.9: SEM of iridium coated PDMS impressions of a) a natural cleat in DZ6, b) reactive
ion etched channel in IPN-R2, and c) a UV laser etched channel in IPN-L2.
Although the UV laser etched channels (Figure 4.9c) had similar wall angle characteristics to
the natural cleat, the surface impression of the UV laser channel appears significantly different
to the natural cleat and the RIE channels. The most obvious difference is that the laser creates
channels with smooth walls. A feature less clearly shown in Figure 4.9 is the V-shaped channel
produced by laser etching in which the floor of the channel (top of the impression) is only about

73
8 μm wide and the top of the channel is up to 35 μm wide. Another significant feature of the
UV laser etched channel that may affect wetting studies is the tile-like appearance of the PDMS
impression which can indicate that pyrolysis of the coal matrix occurred during the UV laser
exposure. The tile-like feature may result from molten compounds from the coal matrix cooling
quickly and cracking. Raman spectroscopy was used to examine if changes in the structural
ordering had occurred on the coal surface during the UV laser treatment.
4.5.4 Effect of laser and RIE on coal structure examined by micro-Raman
spectroscopy
Petrographic analysis of the etched surface was not possible using standard visualisation
techniques, due to the surface roughness following both the RIE and Laser treatments.
Therefore, use of micro-Raman spectroscopy was selected. The application of Raman
spectroscopy as a tool to identify unique crystal lattice arrangements in vitrinite, and other coal
macerals, has been described in several studies including reports by Wang et al. (2014),
Ulyanova et al. (2014) and Beyssac et al. (2003). The amalgamation of peaks in the Raman
spectra of carbon based materials, including coal, are categorised into two broad bands: G and
D (Ferrari, 2007). The G band observed around 1600 cm-1 refers to highly organised
polyaromatic structures with D46h crystal symmetry. The D band consists of poorly organised
crystal arrangements, impurities and tetrahedral arrangements. The sensitivity of Raman
spectroscopy allows changes in the crystalline structure of coal to be observed as changes in
band width. In this thesis I used changes in the full width at half maximum (FWHM) of peaks
at 1604 cm-1, 1368 cm-1 and 1262 cm-1 in the Raman spectra of vitrinite bands as a measure of
broad changes in coal structures (specifically the crystalline bonding arrangement) that may be
induced by the channel etching procedures. The deconvolution process in this study was limited
to only three bands as we are mostly interested in bulk changes to the coal surface chemistry
that could affect the coal wettability; this broad approach is not intended to provide the level
of detail about coal structure reported in other studies, for example the work of Guedes et al.
(2010).
Kelemen and Fang (2001) and Quirico et al. (2005) reported that the vitrinite G band generally
narrows with increasing rank for bulk coal samples as a more ordered crystalline arrangement
is achieved by prolonged geological and thermal processes As the Raman spectra varies with
the maceral and rank of coal, un-etched samples (see Table 3-2) were also analysed to provide
a benchmark for the range of natural variation in the FWHM values in natural vitrinite bands.

74
The decrease in FWHM for the G band with an increase in rank in Isaac Plains (Rmax = 0.94%)
through to Coppabella (Rmax = 1.91 %) is shown in Figure 4.10.
Figure 4.10: Mean full width half maximum (FWHM) values of G band peak at 1604 cm-1 in
Raman spectra measured at six locations in the reactive ion etched channels in all coals
(represented as sample-R-Ch). G band FWHM values of vitrinite bands adjacent to the RIE
channel (represented as sample-R-V) and the untreated coal references (sample-P-U) are
shown. Vertical bars represent one standard deviation.
The G band FWHM values of vitrinite in the RIE channels were not significantly different to
the ROIs examined outside the channel or the vitrinite bands in the untreated sample (Figure
4.10). Laser treated samples also fell within the virgin sample range for FWHM G band values
(Figure 4.11) Although the change in the RIE channel of the COP.S is outside the range of the
standard deviation bars for the untreated COPS G band, it should be noted that the natural
variation observed in the Raman spectra of the virgin sample was much narrower than might
be expected and based on these results the change in FWHM of the ion etched COPS channel
is not considered to represent a significant change in the G band. The ranges of variation in the

75
G band FWHM values for the COPS are much smaller than in the lower rank IPN. Two factors
that may contribute to the greater variation between ROIs in the IPN are: 1) in the low rank
coal a small shoulder peak is observed at ~1620 cm-1 attributed to a disordered crystal
arrangement that would increase the width of the G band peak we fitted at 1600 cm-1; and 2)
low rank coals are more susceptible to the effects of temperature then high ranked coals
(Dorrestijn et al., 2000; Li, 2007; Sheng, 2007).
Figure 4.11: Mean full width half maximum (FWHM) values of G band peak at 1604 cm-1 in
Raman spectra measured at six locations in the UV laser etched channels in IPN. FWHM values
of vitrinite bands adjacent to channel (outside) and the untreated coal references are shown.
Vertical bars represent one standard deviation.
The Isaac Plains coal is a relatively low rank coal, and as explained by Quirico et al. (2005) the
frequency of disordered structures in low rank coals are higher than in mature coals. Therefore,
for IPN analysis of the D band may be a more sensitive tool than the G band to evaluate the
effect of the RIE and laser treatment on coal structure. Figure 4.12 and Figure 4.13 show the

76
spread of FWHM values for the D band peaks of Raman spectra for channels cut in IPN and
COP.S, and show that the range of D band peak widths in the untreated samples is much greater
than for the G band. The ion etched channels have D band widths slightly greater than the
means of the untreated samples, but channel spectra have D band FWHMs only a few cm-1
units broader than the ROIs examined outside the channel. These results suggest that RIE does
not have a significant effect on the disordered structure of the coal in the channel walls and
floor. The UV laser etched channels in IPN show a larger range of D band widths (Figure 4.13)
than the RIE channels, and the mean of the D band FWHM in the laser channels is 8 cm-1 wider
than the vitrinite ROIs outside the channel. This change in Raman spectra may suggest that
some structural change has occurred in the coal of the laser etched channels; a conclusion
consistent with the channel’s morphology observed by SEM (Figure 4.9).
Figure 4.12: Mean full width half maximum (FWHM) values of D band peak in Raman spectra
measured at six locations in the reactive ion etched channels in coals IPN and COPS. D band
FWHM values of vitrinite bands adjacent to the RIE channel (Outside) and the untreated coal
references are shown. Vertical bars represent one standard deviation.

77
Figure 4.13: Mean full width half maximum (FWHM) values of D band peak in Raman spectra
measured at six locations in the UV laser etched channels in IPN. FWHM values of vitrinite
bands adjacent to channel (Outside) and the untreated coal references are shown. Vertical bars
represent one standard deviation.
In summary, the morphology and Raman spectra of channels created by the RIE method more
closely resembled the characteristics of natural cleats and untreated vitrinite than the channels
cut by UV laser. The Raman spectroscopy results suggest that RIE induces less severe changes
on the remaining coal in the channel walls and floor than the UV laser method. Full results can
be found in Appendix B2.
78
4.5.5 Flow of water and air in etched channels
The flow of water and air in the RIE and UV laser etched channels was investigated using the
flow cell described in Section 4.4. The scope of the current thesis is to demonstrate the use of
the etched channels for flow experiments and detailed investigations of the wetting of the
channels, specifically the channel roughness and the influence different lithotypes have on flow
regimes will be reported in the next chapter. Figure 4.14 shows an example of a series of images
captured during a flow experiment with fluorescein dyed water injected together with pulses
of air to a RIE channel in IPN-R2.
Figure 4.14: Images captured during flow experiment with 1200 µL/min of water containing
1% w/v fluorescein solutions (green) and pulses of air through ion etched channel IPN-R2. The
arrow indicates flow direction. A) Discreet gas bubbles moving through solution. B) Multiple
bubbles occurring at the bottom of the channel with some residual water seen near the centre
and two bubbles near the top. C) Volume of channel occupied by the water increased as the gas
bubbles are pushed out of the channel.
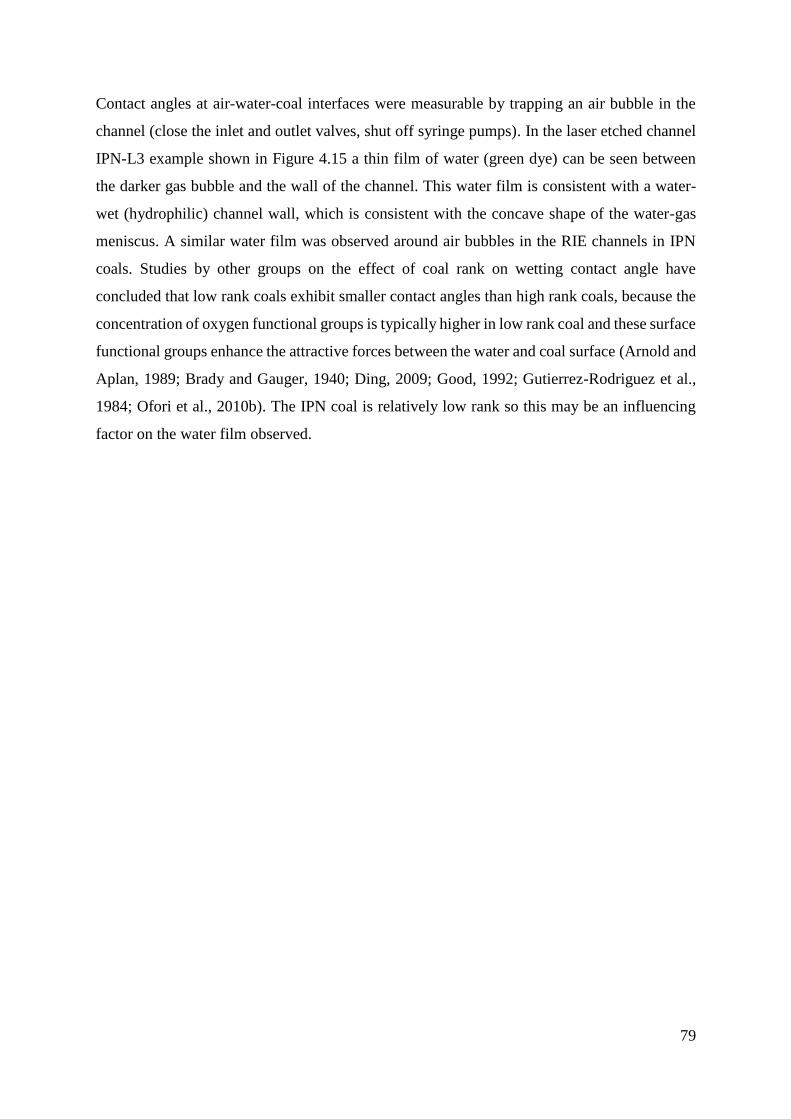
79
Contact angles at air-water-coal interfaces were measurable by trapping an air bubble in the
channel (close the inlet and outlet valves, shut off syringe pumps). In the laser etched channel
IPN-L3 example shown in Figure 4.15 a thin film of water (green dye) can be seen between
the darker gas bubble and the wall of the channel. This water film is consistent with a water-
wet (hydrophilic) channel wall, which is consistent with the concave shape of the water-gas
meniscus. A similar water film was observed around air bubbles in the RIE channels in IPN
coals. Studies by other groups on the effect of coal rank on wetting contact angle have
concluded that low rank coals exhibit smaller contact angles than high rank coals, because the
concentration of oxygen functional groups is typically higher in low rank coal and these surface
functional groups enhance the attractive forces between the water and coal surface (Arnold and
Aplan, 1989; Brady and Gauger, 1940; Ding, 2009; Good, 1992; Gutierrez-Rodriguez et al.,
1984; Ofori et al., 2010b). The IPN coal is relatively low rank so this may be an influencing
factor on the water film observed.

80
Figure 4.15: Image of an air bubble (dark region) in the water filled IPN-3L channel with the
flow cell valves closed (x500 magnification). The arrow indicates flow direction. A mineral
deposit in the channel protrudes from the right side wall.
The average contact angle of the air bubble shown in Figure 4.15 was θ = 144.5°. Here I defined
the contact angle of the gas bubble as the angle between the gas-water interface and the parallel
walls of the channel. The average angle was calculated as the mean of the four visible contact
points: 138.9º and 139.4º on the advancing surface of the bubble (top of Figure 4.15), and
147.2º and 152.6º at the receding bubble surface. This result is comparable to other contact
angles measured by the captive bubble technique. For example, Saghafi et al. (2014) measured
with a captive bubble instrument an angle of θ =141° for a N2 bubble on coal (Southern
Coalfield of Sydney Basin, Rmax= 1.22 %) at 1.8 MPa. These two results cannot be directly

81
compared because the coal rank is different and the contact angle will be affected by the fluid
pressure (Han et al., 2010; Kaveh et al., 2011; Murata, 1981; Sakurovs and Lavrencic, 2011;
Siemons et al., 2006). An additional effect on the measurement may result from the use of the
fluorescein dye to enhance the image contrast as the salt can affect the wetting angle (Espinoza
and Santamarina, 2010; Orumwense, 2001). Despite these experimental challenges, these
results suggest the experimental apparatus has potential to measure wetting properties
comparable with other methods.
4.6 Conclusions
1. Channels cut by RIE and UV laser were 20 – 40 μm wide and had geometrical features
similar to a natural coal cleat. The walls in UV laser cut channels were smoother than
natural cleats, but the ion etched ones were morphologically quite similar to natural cleats.
The smooth formation created from the laser process may be attributed to thermoplastic
behaviour from the rapid heating. .
2. Analysis of the Raman fingerprints of regions in the cut channels, outside the channels and
virgin reference coal samples indicates that there was no significant change in the coal
structure of induced by the UV laser or RIE. Although the micro Raman results did not
indicate significant structural variation at a molecular level, RIE demonstrated the least
impact on the coal structure by a smaller spread of FWHM values.
3. Preliminary two phase flow experiments using the UV laser etched channel show a water
film present after water has been displaced by the gas, which suggests the channel wall is
water-wet for low rank coal Isaac Plains coal.

82
Chapter 5) The Effect of Dull and Bright Banded Coal on Contact
Angle Measurements in Cleats
5.1 Introduction
The relative permeability behaviour of gas and water in the cleats of a coal seam gas (CSG)
reservoir is dependent on many factors including fluid pressure, phase saturations, effective
stress, the geometry of individual cleats, the interconnectedness of the cleat network, cleat
frequency and the wettability of the coal (Saghafi et al., 2014; Su et al., 2001). Most laboratory
studies that report relative permeability in coals measured by steady state or unsteady state core
flooding methods derive a crossover point water saturation fraction (Sw) exceeding 0.5, which
is usually interpreted as the coal being water wet or hydrophilic (Conway et al., 1995a; Durucan
et al., 2013; Ham and Kantzas, 2011; Purl et al., 1991; Rahman and Khaksar, 2007; Shen et al.,
2011). However, a problem with this standard approach is that it reports an average relative
permeability for the core which assumes that the core has a uniform composition, homogenous
wetting state and that the effects of capillary pressures are negligible. These assumptions fail
to adequately describe the highly heterogeneous nature of coals (minerals and macerals) and
do not consider that a range of wetting states (hydrophobic, intermediate, and hydrophilic) may
exist in a coal during a core flood experiment due to changes in fluid pressure and desorption
of gas from the matrix (Gash et al., 1992; Ham and Kantzas, 2011).
Although core flooding methods rarely consider the effect of the coal heterogeneity in
determination of relative permeability curves, other experimental studies using the Sessile drop
and captive bubble techniques have demonstrated that coal wettability can be dependent on
rank (Keller, 1987; Tampy et al., 1988), maceral composition (Arnold and Aplan, 1989; Ding,
2009; Fuerstenau et al., 1983; Ofori et al., 2010a), mineralisation (Gosiewska et al., 2002b;
Susana et al., 2012) and the roughness of the coal surface (Drelich et al., 1996; Li et al., 2013).
The Sessile drop technique is convenient for the collection of contact angle data on a large
number of coal samples, or sites on a sample, but there are limitations of this technique when
I want to understand how coal wettability effects flow in cleats because contact angles obtained
in a sessile drop measurement provide an average wettability of an area approximately 1 cm
(10,000 µm) in diameter that may cover mineral islands and multiple coal bands, and be
effected by surface roughness. Furthermore, flow in narrow coal cleats (perhaps 10 – 200 µm
wide) manifests more complex flow regimes compared to the behaviour of stationary droplets

83
on a surface observed in the Sessile drop technique. Gas-liquid flow in narrow channels may
develop as either (a) annular film flow in a hydrophilic network where water clings to the coal
surface and gas flows through the central cavity, or (b) discontinuous globular or rivulets of
two-phase flow in a hydrophobic network, which can leave a dry surface where the gas is in
contact with the cleat wall (Lee and Lee, 2008; Triplett et al., 1999; Wang et al., 2012).
In this chapter I examine the wetting behaviour and flow regimes that develop in artificial cleats
featuring bands rich in vitrinite or bands rich in inertinite using the Cleat Flow Cell (CFC)
microfluidic tool reported previously in chapter 4, section 4.4 on page 64. I show that lithotypes
in banded coals present cleat walls with different surface roughness and that this feature affects
the local wettability of the cleat.

84
5.2 Sample Selection and Preparation Techniques
Selected for this chapter included only sample one from each of the polished, reactive ion
etched, natural coal and pressed disc samples listed in Table 3-2.
5.2.1 Preparation of artificial cleat channels
Reactive ion etched channels approximately 40 μm wide and 20 μm deep were cut
perpendicular to the bedding plane in the 20 mm cubes set in epoxy blocks. Details of the RIE
process using the PROG200 Reactive Ion Etcher are described in chapter 4, section 4.3.2 on
page 61 and subsequently published in Mahoney et al. (2015). Several minor modifications to
the settings and conditions used in the RIE treatment were introduced to improve control of the
channel length, width and depth. A summary of the RIE process modifications is provided in
Appendix C3 on page 172.
Nine pressed channels were prepared in 25 mm discs from the lithotype concentrates listed in
Table 3-2 using a 25 mm diameter stainless steel die machined with a raised surface 200 μm
deep and 80 μm wide (Figure 5.1A) and 3g powdered coal discs were compressed with this die
to 10 tonnes in a Carver 12 Tonne hydraulic press for 3 min or until the pressure relaxed to
7 tonnes. After relaxation, the pressure was raised to 10 tonnes again and held for 2 min. The
sample was cooled in a refrigerator to -10 C for 5 min to allow the metal to contract from the
coal surface before the sample was removed; this contraction allowed coal channels to be
removed without the coal sticking to the die. An example of a pressed coal channel is shown
in (Figure 5.1B).

85
Figure 5.1A) Stainless steel die dimensions, including raised sections. B) 25 mm compressed
coal disc with indented cleat in the centre. C) A special epoxy disc capable of holding the
pressed disc in place and enables fluid injection through the cleat.
5.2.2 Characterisation techniques
Relevant samples underwent SEM and LM imaging using techniques described in chapter 3.2
on page 57. The pore size distribution in each of the lithotype concentrates was characterised
by mercury intrusion porosimetry (Micromeritics AutoPore IV 9500).
5.2.3 Analysis of SEM images to quantify surface roughness
The SEM images were analysed with ImageJ (Fiji plugin) to estimate the mineral
concentrations and surface porosity of the coals. Here I use the term surface porosity to describe
the valleys, pitting, or fractures that are present on a polished coal surface. A filter of a
minimum surface feature size of 1.0 pixels was applied in the SEM image analysis.
Surface roughness refers to the small mean surface irregularities comprised from the height,
depth, repetitiveness and interval of a surface from the perfectly flat ideal. Surface waviness is

86
not considered a component of roughness, nor are isolated features such as pitting, cracks and
fractures on the polished coal surface (Whitehouse, 2004). SEM images of samples IPN-NC
(dull band), IPN-NC’ (bright band) IPN-DB, IPN-DD, IPN-R (dull band) and IPN-R’ (bright
band) were analysed using the open source software Gwyddion (v2.45) to calculate the
arithmetic average (Ra) and root mean square roughness (RMS or Rq) detailed in (Nečas and
Klapetek, 2012).
where Zj is the vertical mean height of the jth data point and n is the number of points in the
area of investigation. The height scale using the SEM images is a pseudo height scale that
corresponds to the image brightness related to the number of secondary electrons emitted at
different locations on the sample. These lengths where converted to approximate heights and
inputted a peak height, or Z value into Gwyddion software. This feature enabled the 2D image
to be analysed as 3D. Each sample displayed a very unique and different surface, which resulted
in a different height scale for each sample. For example, IPN-R had the highest observable
peaks measuring 7.5 μm from base to tip, compared to IPN-DB which had the lowest record
peak height (approximately 2 μm). Thus each sample does not possess a comparable height
scale to the other.
5.2.4 Contact angle and wettability measurement techniques
Sessile drop contact angle measurements
Sessile drop contact angles of water in air on polished coal samples were measured by a
goniometer using a 3 Megapixel CMOS digital camera with a 50 mm Nikon lens and a 12V
light source. Image analysis to determine contact angles was performed using ImageJ (1.46r)
with a drop analysis plugin based on the snake analysis method (Stalder et al., 2006). A Gilson
Distriman pipette (1-1250 μL range) was used to dispense 10 μL ± 0.2 μL volume droplets of
deionised water on selected locations of the polished coal samples. For each sample sessile
𝑅𝑎 = 1
𝑛 ∑|𝑍𝑗|
𝑛
𝑗=1
Equation 5-1
𝑅𝑞 = √1
𝑛∑ 𝑍𝑗
2
𝑛
𝑗=1
Equation 5-2

87
drop contact angles were measured at five locations. The designated water drop zones on the
polished coal surface were visually differentiated into bright band zones and dull band zones.
A schematic is included in Appendix C1 on page 171.
Fluorescein dye (or Acid Yellow 73) is an organic compound with an adsorption maximum at
494 nm and emission maximum at 512 nm in water. The compound has both an instability to
UV light (photochemical) (Lindqvist, 1960) and pH changes (Smith and Pretorius, 2002),
though does possess a low sorption tendency that makes it an ideal image enhancing agent for
coal studies, due to the dark colour and structure of the coal matrix. At low concentrations
(such as those used in this thesis of 0.1-1%) the change in contact angle is negligible. A
preliminary comparison of contact angles using Sessile drop results using pure water and 0.1%
fluorescein solution on IPN-PD and COPE-PD did not show a measurable difference between
the two solutions.
Cleat flow cell microfluidics device
Apparatus detailed in chapter 4.4 on page 64.
5.3 Characterisation of the Natural and Artificial Cleats
5.3.1 Morphology observed by SEM
Polished Coal
Samples IPN-P, which contained both dull (D) and bright (B) banding was examined using
SEM with a resolution of 256 dpi. Figure 5.2A and B shows the surface morphology of the
sample following polishing as per Australian Standard AS2061 (1989). Neither region on the
sample exhibited a rough surface, with the exception of increased voids in the dull region,
compared to the bright band. Small bright discs that appear on both surfaces are likely mineral
platelets that have been displaced and deposited due to the polishing procedure and it are these
topographies that present small roughened features on an otherwise smooth, flat landscape.
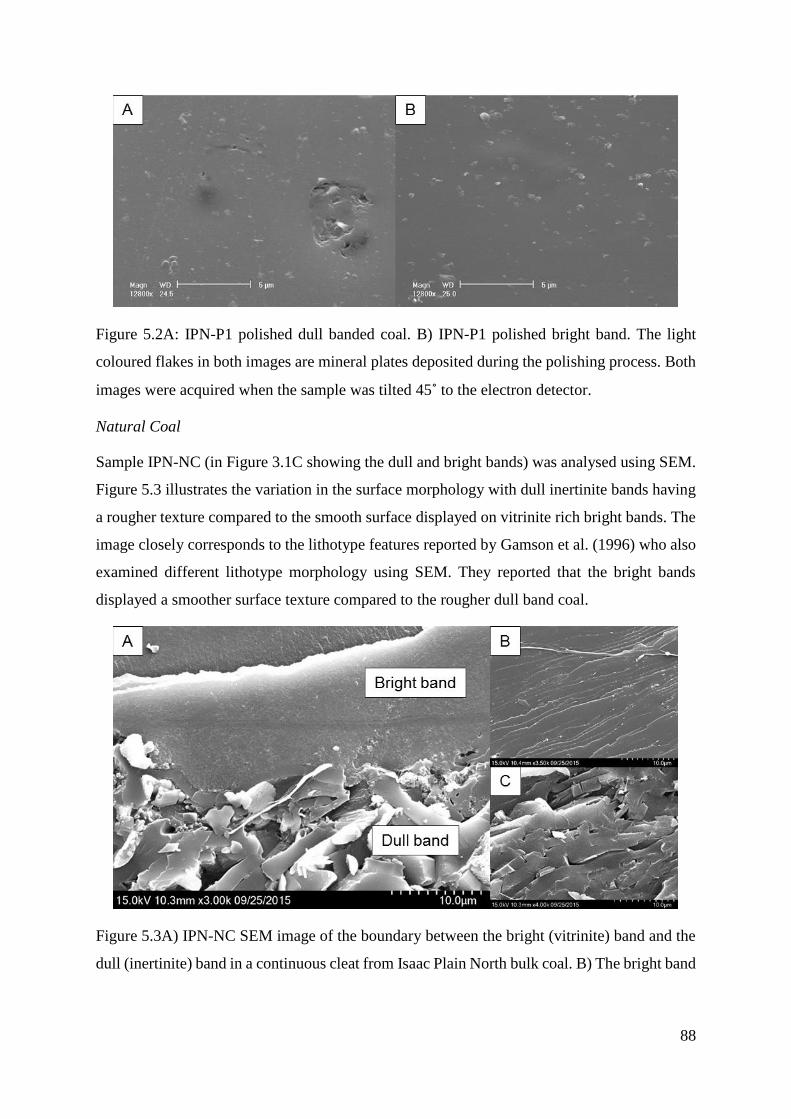
88
Figure 5.2A: IPN-P1 polished dull banded coal. B) IPN-P1 polished bright band. The light
coloured flakes in both images are mineral plates deposited during the polishing process. Both
images were acquired when the sample was tilted 45˚ to the electron detector.
Natural Coal
Sample IPN-NC (in Figure 3.1C showing the dull and bright bands) was analysed using SEM.
Figure 5.3 illustrates the variation in the surface morphology with dull inertinite bands having
a rougher texture compared to the smooth surface displayed on vitrinite rich bright bands. The
image closely corresponds to the lithotype features reported by Gamson et al. (1996) who also
examined different lithotype morphology using SEM. They reported that the bright bands
displayed a smoother surface texture compared to the rougher dull band coal.
Figure 5.3A) IPN-NC SEM image of the boundary between the bright (vitrinite) band and the
dull (inertinite) band in a continuous cleat from Isaac Plain North bulk coal. B) The bright band
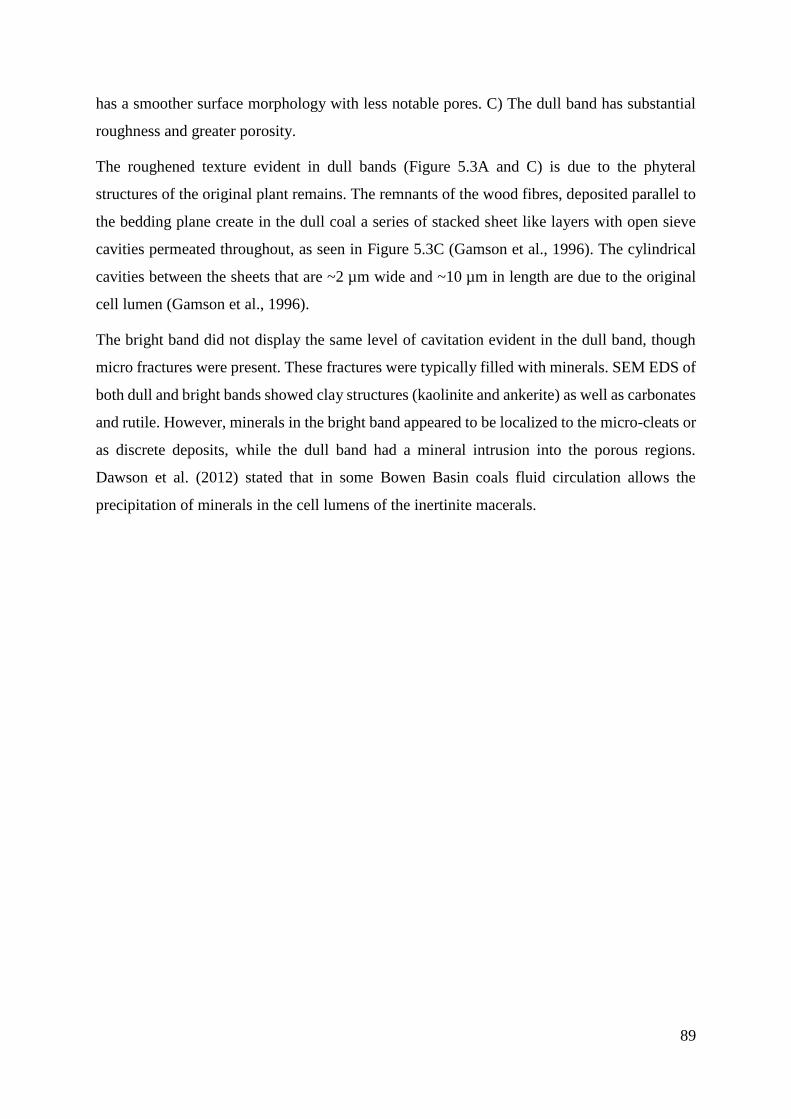
89
has a smoother surface morphology with less notable pores. C) The dull band has substantial
roughness and greater porosity.
The roughened texture evident in dull bands (Figure 5.3A and C) is due to the phyteral
structures of the original plant remains. The remnants of the wood fibres, deposited parallel to
the bedding plane create in the dull coal a series of stacked sheet like layers with open sieve
cavities permeated throughout, as seen in Figure 5.3C (Gamson et al., 1996). The cylindrical
cavities between the sheets that are ~2 µm wide and ~10 µm in length are due to the original
cell lumen (Gamson et al., 1996).
The bright band did not display the same level of cavitation evident in the dull band, though
micro fractures were present. These fractures were typically filled with minerals. SEM EDS of
both dull and bright bands showed clay structures (kaolinite and ankerite) as well as carbonates
and rutile. However, minerals in the bright band appeared to be localized to the micro-cleats or
as discrete deposits, while the dull band had a mineral intrusion into the porous regions.
Dawson et al. (2012) stated that in some Bowen Basin coals fluid circulation allows the
precipitation of minerals in the cell lumens of the inertinite macerals.

90
Reactive ion etched channel
The physical process of RIE is effectively an ablative process similar to sand blasting, though
obviously at a smaller scale. Gas molecules are ionised creating plasma which is accelerated
onto the surface material. This process is repeated and with each pass more of the surface is
ablated from the material, creating, in this case, a channel. As I have previously reported in
chapter 4.5.3 different material is etched at different rates if input variables such as voltage,
gas type and time are kept constant. The RIE process should not induce chemical changes to
surface moieties (such as increased oxygen functional groups through oxidation) or unnatural
features (e.g. annealing), though thermal expansion of the epoxy resin will occur if the process
exceeded 5 min bursts; which tended to induce fractures in the coal surface.
The RIE process of etching the channel appeared to create a comparable wall roughness pattern
based on lithotype composition compared to the natural coal sample. Sample IPN-R (Figure
5.4A) shows the contrast between the porous dull inertinite band and the bright vitrinite band,
provided in closer detail in figure B and C. The inertinite rich band (B) has an increased
roughness with a higher frequency of peaks and valleys in both the channel wall and floor,
while the vitrinite channel wall and floor(C) display a relatively smooth finish.
Figure 5.4A) SEM image of IPN-R polished coal sample lithotype boundary (bright and dull)
with the RIE channel passing through each band. B) The etched channel wall in the bright band
is smooth and displays some similarity in morphology to that of the natural cleat shown in
Figure 5B. C) The dull banded cleat wall displays a greater roughness than seen in Figure 6B
and shares some similarity in roughness to the natural cleat in Figure 5C.

91
Since dull banded coal possesses a greater frequency of open sieve like cavities permeated
throughout the matrix to bright bands, the dull coal is etched at a different rate, which creates
a more cratered or pitted surface compared to the dense bright band. The end result is a dull
band channel that displays both a rougher and more porous surface then the bright band region
with the contrast clearly visible in Figure 5.4B and C. While some minor differences in the
roughness still exists between the RIE and the natural cleat in illustrated in Figure 5.3, their
respective lithotypes display comparable morphology.
Pressed coal disc channels.
The pressed disc samples possess none of the surface roughness in the natural or etched cleats,
regardless of lithotype composition. The channel surface has a plate-like texture with small
indentations spaced at regular intervals as shown in Figure 5.5B. This is most likely due to
surface imperfection on the metal die. The topography may be due to the high pressure which
deforms and melds the coal particles so that the discreet particle nature is lost and the surface
is smooth. Nevertheless, the material properties of coal in terms of functional groups exposed
to the flow are retained. This consequently is taken to be representative of the influence of the
surface chemistry on the wetting behaviour, without the interference of any roughness factor.
The result is a surface that does not show similarities in roughness to either the natural or RIE
coal cleat, yet retains the inherent surface functional groups of the natural and etched coal.
Figure 5.5A) Top view of IPN-DD pressed cleat. There is some surface damage on the top of
the cleat, adjacent to the channel floor which occurs when the steel die is removed. B) Sample
tilted 45 to show the channel floor and wall displaying a unique smoothness.
5.3.2 Calculated surface roughness of natural, RIE and pressed channels
The roughness values, Ra and Rq, were calculated from the SEM images previously shown of
the natural cleat, the artificial channels using RIE and pressed method. These results are shown

92
in Figure 5.6. The Rmax was highest peak measured from the SEM images. The roughness
calculations in Figure 5.6 show similar ranges between the dull and bright bands of the natural
cleat and RIE channel, though the RIE channel does have a larger value (Rq 1.332 and 0.984 μm
respectively). The results show that the RIE sample has the highest surface roughness for both
the bright and dull band. However, the IPN-R’ (bright band) surface roughness is significantly
less than the rough band (Ra: 1.211 μm and 0.306 μm respectively).
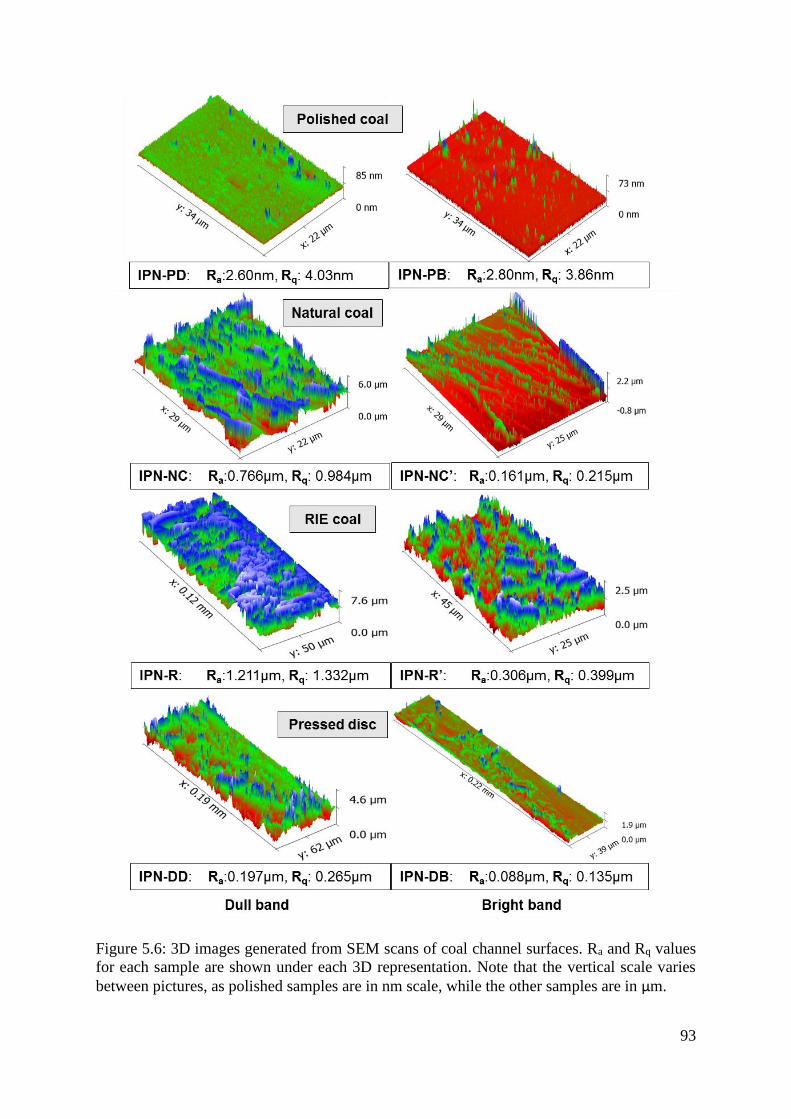
93
Figure 5.6: 3D images generated from SEM scans of coal channel surfaces. Ra and Rq values
for each sample are shown under each 3D representation. Note that the vertical scale varies
between pictures, as polished samples are in nm scale, while the other samples are in μm.
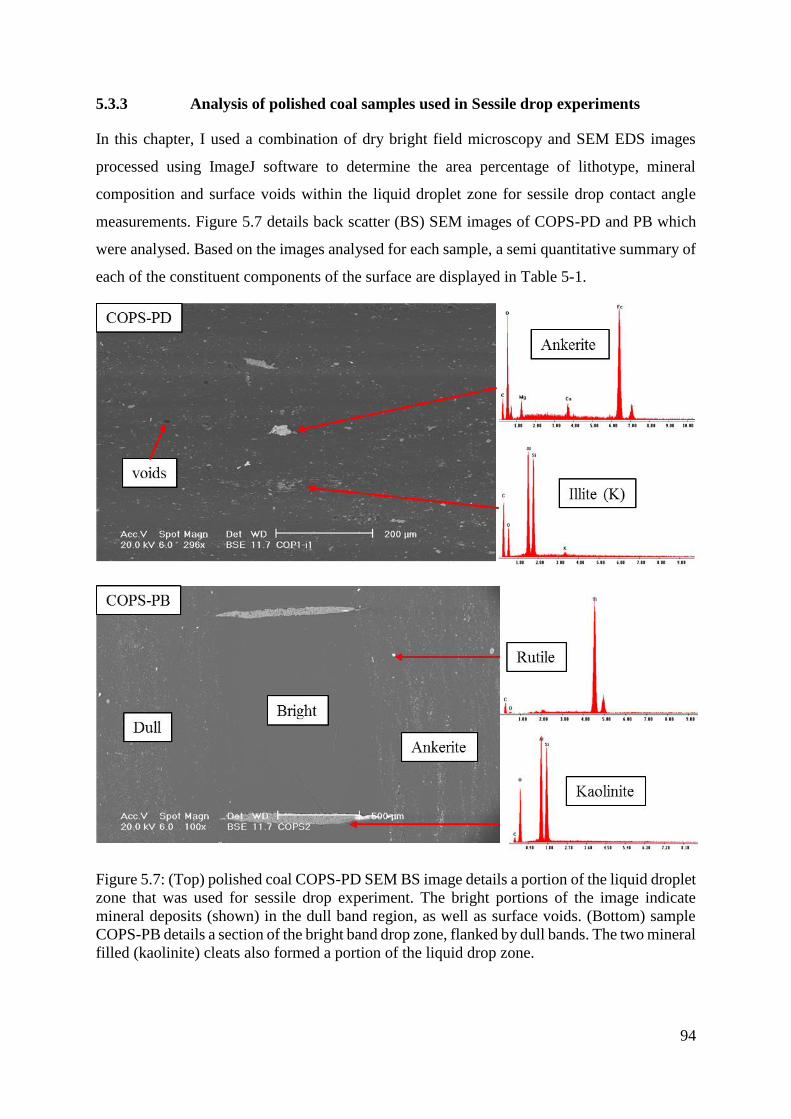
94
5.3.3 Analysis of polished coal samples used in Sessile drop experiments
In this chapter, I used a combination of dry bright field microscopy and SEM EDS images
processed using ImageJ software to determine the area percentage of lithotype, mineral
composition and surface voids within the liquid droplet zone for sessile drop contact angle
measurements. Figure 5.7 details back scatter (BS) SEM images of COPS-PD and PB which
were analysed. Based on the images analysed for each sample, a semi quantitative summary of
each of the constituent components of the surface are displayed in Table 5-1.
Figure 5.7: (Top) polished coal COPS-PD SEM BS image details a portion of the liquid droplet
zone that was used for sessile drop experiment. The bright portions of the image indicate
mineral deposits (shown) in the dull band region, as well as surface voids. (Bottom) sample
COPS-PB details a section of the bright band drop zone, flanked by dull bands. The two mineral
filled (kaolinite) cleats also formed a portion of the liquid drop zone.

95
Table 5-1: A quantitative summary of the fraction composition (area percentage) of coal
lithotypes identified by light microscopy and the mineral and porosity from SEM and ImageJ
analysis of a section of the sessile drop surface on each sample (~400 µm2) and it is assumed
that the remaining area in the droplet zone have a comparable composition.
Sample Dull band Bright
band
Other coal
lithotype Mineral Surface voids
IPN-PD 74 6 0 13 7
IPN-PB 32 61 0 5 2
OAK-PD 65 6 3 16 9
OAK-PB 24 70 0 4 2
MVL-PD 71 5 9 10 5
MVL-PB 22 69 4 2.5 2
COPS-PD 54 6 12 18 10
COPS-PB 21 53 13 8 1
COPE-PD 75 0 2 15 8
COPE-PB 23 57 12 5 3

96
5.3.4 Porosity and pore size distribution in the lithotype concentrates
The cumulative mercury porosimetry results are shown in Figure 5.8 assuming a 130˚ mercury
contact angle and inter-particle void correction. Vitrinite-rich samples (OAK-BR and MVL-
BB) have lower volumes of macropores and mesopores than the inertinite-rich coals (IPN-DD).
These results are consistent with a previous study by Unsworth et al. (1989). It is expected that
the larger pores in the inertinite bands will enhance the surface roughness of the ion etched
channels, and this result is confirmed by SEM images of the cleats previously detailed.
Figure 5.8: Cumulative mercury porosimetry results of selected coal samples show vitrinite-
rich coals (OAK-BR and MVL-BB) have less macro and mesopores than inertinite-rich coal
(Dmyterko and Esterle (2014).

97
5.4 Results of Imbibition Experiments
5.4.1 Pressure measurement during imbibition for RIE channels
In these experiments the water-fluorescein solution was injected from a syringe pump set at
20 μL/min and the CFC effluent valve was fully open to atmosphere. Figure 5.9 shows for each
coal sample the pressure drop (ΔPentry) at which the advancing liquid interface was first
observed in the cleat (i.e. after the slug passed through the inlet tubing) and the breakthrough
pressure drop (ΔPbkthr), which we define in this study as largest pressure driving force required
to flow 20 μL/min liquid through the cleat. Thus, ΔPbkthr is a measure of the greatest restriction
met by advancing liquid interface in the channel due to changes in contact angle or cleat
geometry (such as a change in cross sectional area around a defect in the cleat).
Figure 5.9: Inlet and breakthrough pressure drops in four coals measured in four CFC cells.
COPS measurement was not possible due to surface damage.
The COPE-R sample had the highest ΔPbkthr, wherein pushing the gas-liquid interface across
this band required a ΔPbkthr= 40 kPa. The wetting angles fluctuate between 110-140° in all the
RIE channels. That equates well with the ‘entry’ pressure shown on the graph when capillary
pressure is calculated using Equation 5-3. However, since the contact angles did not typically
exceed 140° a ΔPbrkthr of 40 kPa implies a blockage point reducing the open size to ~15 μm.

98
Three main blockage points were identified in the COPE-R sample and two of these are shown
in Figure 5.10. This region was also sighted during the imbibition experiment where the liquid
phase stopped until the measured differential pressure exceeded 40 kPa.
where:
γ is the interfacial tension of water and air at 25°C
r is the radius of the channel
cos θ is the contact angle of the gas-liquid-solid interface.
Figure 5.10: COPE-R sample with two distinct changes (circled in red) in cleat geometry in the
dull band region. This narrowing of the cleat is believed to be the reason why the breakthrough
pressure is so high for COPE and not the other samples. The bottlenecks may be due to a
hardened material within the coal that etched at a slower rate to the rest of the dull band
material.
∆P =2𝛾 𝑐𝑜𝑠𝜃
𝑟 Equation 5-3
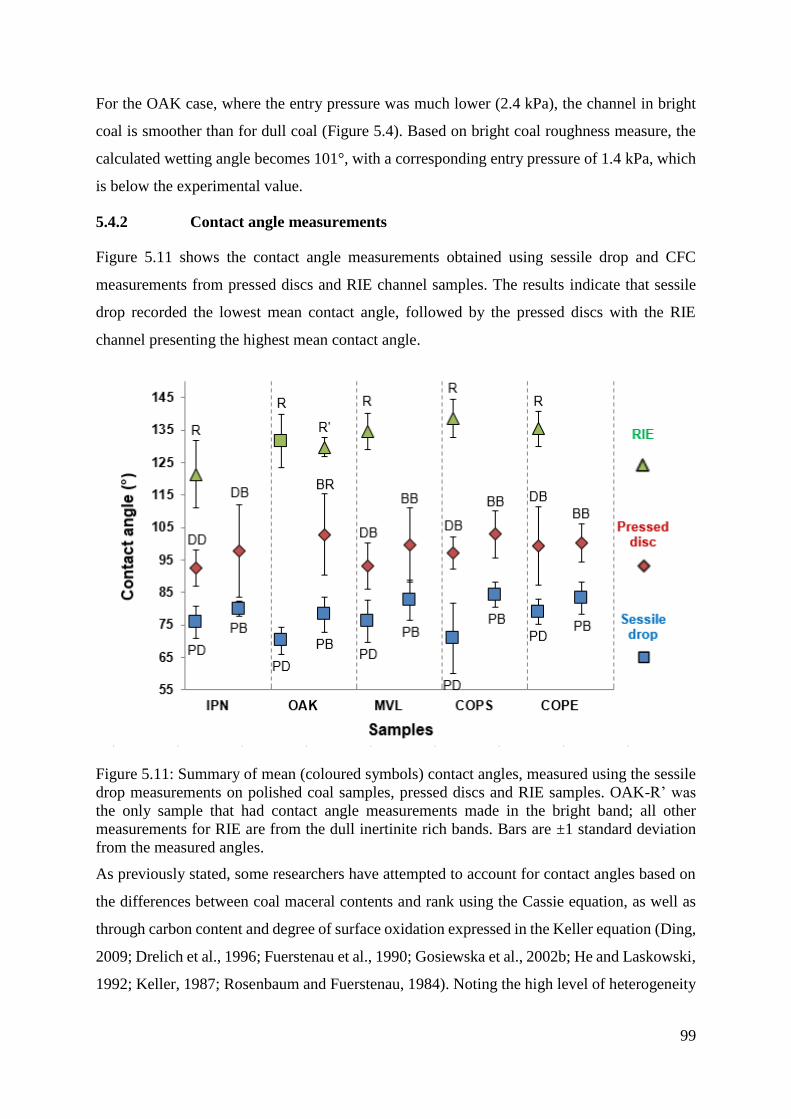
99
For the OAK case, where the entry pressure was much lower (2.4 kPa), the channel in bright
coal is smoother than for dull coal (Figure 5.4). Based on bright coal roughness measure, the
calculated wetting angle becomes 101°, with a corresponding entry pressure of 1.4 kPa, which
is below the experimental value.
5.4.2 Contact angle measurements
Figure 5.11 shows the contact angle measurements obtained using sessile drop and CFC
measurements from pressed discs and RIE channel samples. The results indicate that sessile
drop recorded the lowest mean contact angle, followed by the pressed discs with the RIE
channel presenting the highest mean contact angle.
Figure 5.11: Summary of mean (coloured symbols) contact angles, measured using the sessile
drop measurements on polished coal samples, pressed discs and RIE samples. OAK-R’ was
the only sample that had contact angle measurements made in the bright band; all other
measurements for RIE are from the dull inertinite rich bands. Bars are ±1 standard deviation
from the measured angles.
As previously stated, some researchers have attempted to account for contact angles based on
the differences between coal maceral contents and rank using the Cassie equation, as well as
through carbon content and degree of surface oxidation expressed in the Keller equation (Ding,
2009; Drelich et al., 1996; Fuerstenau et al., 1990; Gosiewska et al., 2002b; He and Laskowski,
1992; Keller, 1987; Rosenbaum and Fuerstenau, 1984). Noting the high level of heterogeneity

100
in coal, and the need to clearly quantify the surface composition of the material we take a
simpler approach in which there are four principle constituents that determine the wetting
angle: bright coal (mildly hydrophobic); dull coal (mildly hydrophilic); void space (completely
non-wetting); mineral matter (highly wetting).
Following Cassie these may be combined as a micro-patchwork of surfaces each influencing
the contact angle in proportion to their area fraction. A more rigorous analysis is provided by
Swain and Lipowski (Swain and Lipowsky, 1998), but given the heterogeneous nature of coal
and the simplicity of reducing the constituents to 4, a simple proportioning is suitable for the
present purposes. This is represented in Equation 5-4.
Equation 5-4
where:
cos 𝜃𝑡is the total contact angle.
fd, fb and fm is the fraction surface of dull band, bright band and minerals respectively.
cos (𝜃𝑐𝑑), cos (𝜃𝑐
𝑏), and is the contact angle on dull and bright bands respectively. The 𝜃𝑐𝑑 value
is based on literature values from Keller [11] and Ofori (Ofori et al., 2010a) while the (𝜃𝑐𝑏 was
assigned a value of 90˚ based on regression analysis using Equation 5-4.
cos (𝜃𝑐𝑚) is the contact angle of minerals which equals 45˚ based on literature values from
Keller [11] and Ofori (Ofori et al., 2010a).
𝑐𝑜𝑠(𝜃𝑐𝑔
) is the contact angle of gas which equals 180˚
5.4.3 Flat polished coal surfaces
Sessile drop results
Figure 5.11 shows that the sessile drop measurements typically show a higher contact angle for
bright band sample (less inertinite to vitrinite) with COPS-PB recording the highest mean
result, compared to dull banded samples with OAK-PD recording the lowest mean contact
angle. The results of this study are similar to previous studies that report larger contact angles
for vitrinite rich coals compared to higher inertinite coal surfaces using sessile drop
measurements and coal flotation, meaning that the dull band is more hydrophilic compared to
the bright band (Arnold and Aplan, 1989; Ding, 2009; Ofori et al., 2010a). The contact angle
cos(𝜃𝑡) = 𝑓𝑑 cos(𝜃𝑐𝑑) + 𝑓𝑏 cos(𝜃𝑐
𝑏) + 𝑓𝑚 cos(𝜃𝑐𝑚) + (1 − 𝑓𝑑 − 𝑓𝑏) cos(𝜃𝑐
𝑔)

101
depends only on the coal in contact (some bright, some dull); the mineral matter and the surface
voids (detailed in Table 5-1). Roughness is taken to be zero since the surface is polished.
Equation 5-4 was used to calculate contact angle and a comparison to the experimental results
is provided in Table 5-2. The calculated values showed a close approximation to the measured
contact angles (between ±2-5˚), with the exception OAK-PB (difference of 7˚). This may be
due to an over estimation of bright banded coal in the water droplet region, which caused a
higher estimated contact angle compared to the experimental value.
Table 5-2: Sessile drop contact angles derived using fraction values of bright, dull, mineral,
voidage and gas compared to the measured value.
Samples fb fd fm fg cos (θt) Calc.˚ Meas˚.
IPN-PD 6 74 13 7 0.275 74 75
IPN-PB 61 32 5 2 0.124 83 80
OAK-PD 6 68 16 10 0.240 76 70
OAK-PB 71 24 4 1 0.100 84 77
MVL-PD 5 80 10 5 0.278 73 75
MVL-PB 69 26 3 2 0.083 85 83
COP-PD 6 66 18 10 0.232 75 70
COP-PB 53 38 8 1 0.147 80 84
COPE-DB 0 77 15 8 0.286 73 77
COPE-PB 57 35 5 3 0.105 83 83
Equation 5-4 was used to calculate the contact angle from Sessile drop data detailed in Ofori
(2010) (Ofori et al., 2010a), as a comparison. Several assumptions were made, including the
roughness factor being zero, fraction of surface voids as well as the assumption that the
percentage of liptinite in the samples reported (2.5% and below) was relatively negligible to
the overall contact angle. Table 5-3 details similar contact results using the modified Cassie
equation to the measured results (±4˚) with the exception of sample 2599-3. This may be due
to the high mineralisation of the sample having a different surface texture compared to the coal
that is not accounted for. Additionally, the value of cos (𝜃𝑐𝑚) being 45˚ is an averaged value
and does not account for the unique wetting properties that different minerals possess.
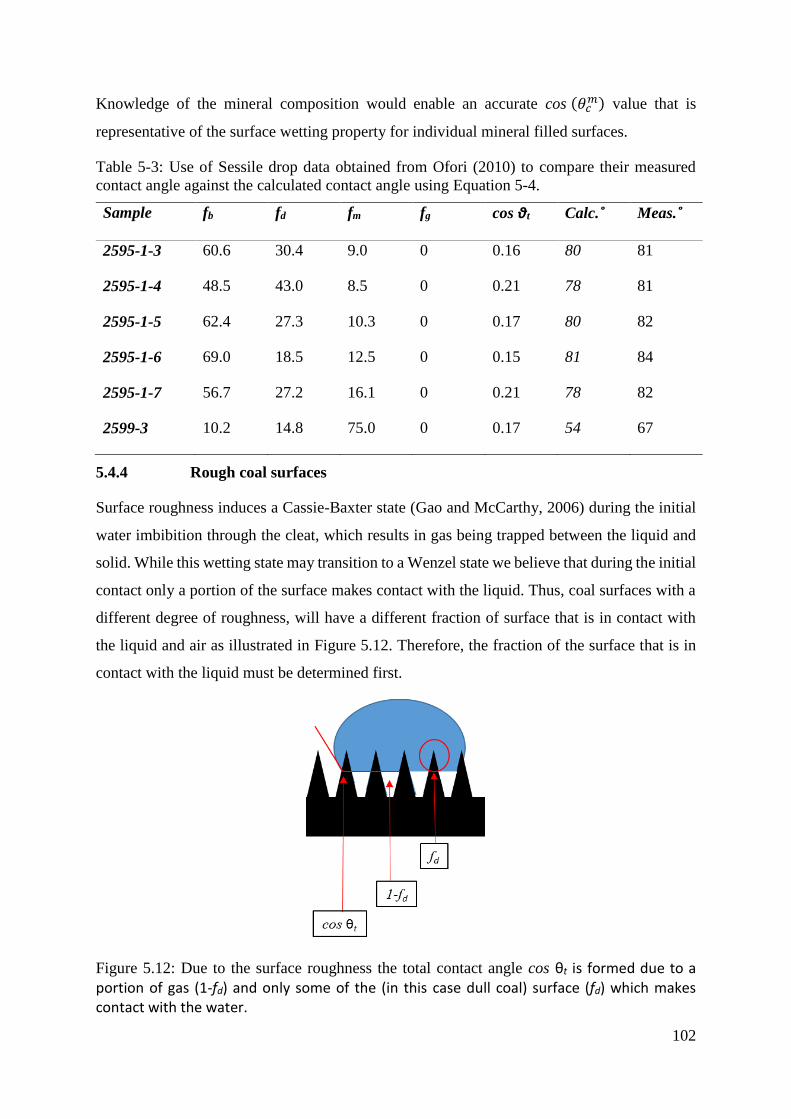
102
Knowledge of the mineral composition would enable an accurate cos (𝜃𝑐𝑚) value that is
representative of the surface wetting property for individual mineral filled surfaces.
Table 5-3: Use of Sessile drop data obtained from Ofori (2010) to compare their measured
contact angle against the calculated contact angle using Equation 5-4.
Sample fb fd fm fg cos θt Calc.˚ Meas.˚
2595-1-3 60.6 30.4 9.0 0 0.16 80 81
2595-1-4 48.5 43.0 8.5 0 0.21 78 81
2595-1-5 62.4 27.3 10.3 0 0.17 80 82
2595-1-6 69.0 18.5 12.5 0 0.15 81 84
2595-1-7 56.7 27.2 16.1 0 0.21 78 82
2599-3 10.2 14.8 75.0 0 0.17 54 67
5.4.4 Rough coal surfaces
Surface roughness induces a Cassie-Baxter state (Gao and McCarthy, 2006) during the initial
water imbibition through the cleat, which results in gas being trapped between the liquid and
solid. While this wetting state may transition to a Wenzel state we believe that during the initial
contact only a portion of the surface makes contact with the liquid. Thus, coal surfaces with a
different degree of roughness, will have a different fraction of surface that is in contact with
the liquid and air as illustrated in Figure 5.12. Therefore, the fraction of the surface that is in
contact with the liquid must be determined first.
Figure 5.12: Due to the surface roughness the total contact angle cos θt is formed due to a portion of gas (1-fd) and only some of the (in this case dull coal) surface (fd) which makes contact with the water.

103
Reactive Ion Etched coal
Figure 5.13 shows a typical example of contact angles at the advancing interface of a water
slug in the MVL coal channel. The range of contact angles observed in each RIE sample is
shown in Figure 5.11. In all samples except the OAK I observed that the velocity of the
advancing liquid interface was observed to increase when it entered a bright band and thus,
using the settings reported here, images of sufficient quality for moving liquid interfaces to
determine contact angles in vitrain bands could not be obtained.
Figure 5.13: The contact angle measurement of the fluid flow in MVL-R channel using Image-
J software.
Since the RIE channel is primarily dull band the total contact angle depends only on the coal
in contact (all dull, except for OAK) and surface roughness. The fraction of dull coal for each
RIE sample can be calculated using Equation 5-5 and a mean fraction of dull coal was derived
based on a surface with an Rq of 1.332 (based on Figure 5.6) shown in Table 5-4.
𝑓𝑑 = (cos 𝜃𝑡 + 1)
(cos 𝜃𝑑 + 1) Equation 5-5

104
Table 5-4: Experimental RIE contact angles results (Meas.) compared to the calculated values
(cal.) based on the data using Equation 5-5-9.
Samples Meas.˚ 𝒇𝒃 𝒇𝒅 𝟏 − 𝒇𝒃 𝟏 − 𝒇𝒅 𝒇𝒃 𝒇𝒅
IPN-R 120 0.372 0.627
OAK-R 132 0.246 0.753
OAK-R' 130 0.357 0.643 0
MVL-R 135 0.218 0.781
COPS-R 140 0.174 0.825
COPE-R 136 0.209 0.791
0.357 0.244
Pressed disc samples
The pressed disc samples presented an additional level of complexity as the fraction of dull-
bright banded coal had a range of values (fractional amounts of bright and dull are in Table
5-1). For the purpose of the calculations, the maximum estimated percentage of bright banded
coal was used. For example, sample IPN-DB was assumed to have 40% bright banded coal,
though the range states between 10-40%. Additional to this process was the inclusion of a
porosity value due to the pressing procedure leaving some degree of interstitial space between
the particles, in addition natural porosity due to the micro, meso and macropores. However,
this value was not able to be accurately quantified using the method detailed in section 5.3.3.
Thus a porosity value of 2% was assigned to each sample and multiplied by the fraction of dull
and bright coal. The mineral matter is taken to be zero, since the coal is sorted to be free of
minerals as far as possible.
Since it is assumed that a linear relationship exists between the fraction of gas and solid in
contact with the advancing water phase and the surface roughness (expressed as Rq),
proportionality of the roughness can be applied to calculate the new fraction of solid and gas
in contact with the water. The proportionality of roughness (𝑓𝑃𝑅) for dull coal bands was
calculated using Equation 5-6. The roughness factor for the dull and bright band was 0.8495
and 0.9233 respectively.

105
where:
𝑅𝑞𝑃 is the Rq value of the pressed disc.
𝑅𝑞𝑅 is the Rq value for the RIE channel.
The value 0.244 was the average RIE roughness for the dull band calculated in Table 5-4.
The roughness factor was multiplied by the original fraction of dull and bright coal to derive
the new fraction of coal (𝑓𝑏′ & 𝑓𝑑
′) and gas (1 − 𝑓𝑑′ − 𝑓𝑏
′) that will be in contact with the water
phase (Equation 5-7). The results for the pressed disks samples are shown Table 5-5 and when
compared to the measured values are seen to be comparable.
Table 5-5: A comparison of the pressed disc contact angle measurements against those derived
using Equation 5-7.
Samples 𝒇𝒃′
𝒇𝒅′ 𝟏 − 𝒇𝒅
′ − 𝒇𝒃′ Cos θt Calc.˚ Meas.
IPN-DD 0.877 79.904 19.218 0.0810 85 92
IPN-DB 8.772 72.640 18.587 0.0620 86 97
OAK-PD 78.949 8.0711 12.980 -0.102 96 100
OAK-BR 53.286 33.140 13.573 -0.022 91 103
MVL-DB 8.772 72.640 18.587 0.062 86 92
MVL-BB 52.632 32.285 15.082 -0.040 92 98
COP-DB 8.772 72.640 18.587 0.0620 86 96
COP-BB 52.632 32.285 15.082 -0.040 92 102
COPE-DB 8.772 72.640 18.587 0.0620 86 98
COPE-BB 52.632 32.285 15.082 -0.040 92 100
𝑓𝑑𝑃𝑅 =
1 − 𝑅𝑞𝑃
𝑅𝑞𝑅 . (1 − 0.244)
Equation 5-6
𝑓𝑑𝑃𝑅 𝑥 𝑓𝑑 = 𝑓𝑑
′ Equation 5-7

106
5.5 Observations in Cleat Drainage (RIE channels)
The second type of experiment performed was to displace water from cleats by injection of 20
µL/min air. After the liquid slug was pushed from the cleats, air flow was maintained for 2 hrs
and across dull bands a residual liquid film was observed at the channel walls (Figure 5.14).
However, the same residual film was not observed on the bright band wall (Figure 5.15).
Figure 5.14: Residual fluid film on the dull inertinite rich bands in RIE channel samples. The
white ovals in the cleat space are artifacts caused by water vapour condensation due to the heat
from the light microscope

107
Figure 5.15: Residual water film on the bright banded (vitrinite-rich) channel walls in RIE
samples. Since the RIE technique is creating a channel out of the coal matrix, the nature of
vitrinite means significantly less mineral filled pores compared to the inertinite. Thus there is
a lower number of mineralised pores for the water to penetrate during the drainage experiment
and hence no water film.
The presence of water films on porous mineral coated rocks has been previously reported in
the literature (Nakagawa et al., 2000; Nishiyama and Yokoyama, 2013; Nishiyama et al., 2012;
Teng et al., 2016; Tokunaga, 2011). In general, for hydrophobic surfaces a film of liquid should
be swept away by the air flow and should not be retained. However, the dull coal is in fact
intrinsically hydrophilic (𝜃𝑐𝑑
= 70°) though the cleats were not, because of roughness induced
Cassie-Baxter hydrophobicity. Once the wetting front had passed, the surface transitions to
Wenzel-type wetting, its hydrophilic nature restored and hence a surface film of water was
retained. The bright coal on the other hand is inherently hydrophobic in nature (𝜃𝑐𝑏= 90°), and
so does not retain a film (although small mineral islands on the surface may do so). During the
wetting transition from the Cassie state to the Wenzel state, the air pockets are no longer
thermodynamically stable and water can migrate into the pore space (Ishino and Okumura,
2008). This explains why the water film is present on the dull bands, but not the bright, as its
surface is smoother, the macroporosity is less and the degree of matrix mineralisation in the
bright bands is not as prevalent compared to dull banded coal (Figure 5.16) (Tokunaga, 2012).

108
Figure 5.16A) An example of gas trapping between the rough surface features inherent in the
vitrinite band and small pore size. B) Matrix in-filled pores allow for imbibition of water once
the liquid phase passes over the rough surface, creating trapped pockets of water; the result is
a Wenzel wetting effect.
5.5.1 Observations in cleat drainage (pressed discs)
Water was displaced from the cleat using air injected at a constant 5 µL/min. After the water
slug was passed, air injection was continued for 1 hour. No samples displayed any residual
water film after 1 hour. The surfaces of the pressed disks, being a mixture of dull and bright
coals, were all measured to be hydrophobic (92~103°) and with a smooth surface, a residual
film would not be expected.
5.5.2 Implications of the research
1. Variations in the pore texture of micro-cleat walls and matrix mineralisation between
dull banded cleats and bright banded vitrinite rich cleats affects the behaviour of air-
water interfaces flowing through the cleat. As a result, a water film may be left
following a continuous injection of air in the inertinite region of a cleat. This behaviour
is likely to have a significant impact on drainage rates and relative permeability in
different lithotype regions at localised positions within a coal seam. This may lead to
considering the dewatering rates as critical to accounting for the compositional makeup
of the reservoir, especially near wellbore. Sections that are inertinite rich for instance
may require higher dewatering rates to ensure the water phase stays mobile.
2. Parts of the coal may not drain properly resulting in gas unable to overcome the local
capillary pressure and not desorb from the matrix. This may leave sections of the
reservoir isolated from the wellbore. This has a significant impact on accounting for
water saturation and production rates.

109
5.6 Conclusions
1. Preparation of the coal surface generated varied contact angle measurements due to
surface roughness and functional groups. Contact angles measured using the CFC for
RIE channels had the highest measured values (110-140˚). Contact angles measured in
the CFC for pressed discs varied within lithotype concentrates (lower for dull banded
coal compared to bright) and ranged from (85-110˚). Sessile drop values were the
lowest recorded values of the techniques used, though mirrored the pressed disc results
with dull banded coal recording a lower contact angle compared to the bright banded
coal. The results parallel previous studies that have shown that dull banded coal
lithotype is generally more hydrophilic compared to bright band.
2. A modified equation based on the Cassie and Keller equation using four principle
constituents that determine the wetting angle: bright coal (mildly hydrophobic); dull
coal (mildly hydrophilic); void space (completely non-wetting); mineral matter (highly
wetting) were used to predict and explain the contact angle results. The large contact
angle results recorded for the dull banded RIE coal was attributed to an enhanced
surface roughness which created a Cassie transition wetting state. This roughness
displayed a similar morphology to the seen in the natural dull banded cleat. The surface
roughness on the pressed discs was lower; however, the compressed nature of the
surface and low mineral composition meant that gas could become trapped between the
surface and the liquid phase. The result was larger contact angles due to a “lotus effect”
or Cassie wetting state.
3. A modified surface equation was used to compare Sessile drop contact angle measured
in this experiment to results obtained from Ofori et al. (2010a). The results were
comparable, based on the assumption that the literature values had a zero roughness.
While further testing is required to provide statistical validity of the equation, it is
reasonable to conclude that the modified surface equation proposed in this study may
be applied to coal surfaces with a known roughness value, mineral and void
composition and lithotype abundance to estimate the contact angle that would be
created in an air-water system in a coal cleat.
4. Using the CFC, several samples had a typical capillary pressure of 5 kPa during initial
entry into the manufactured cleat. The calculated capillary pressure measurements
matched closely experimental pressure values and their appropriate gas-liquid contact
angle. However, blockage points were in the COPE sample: maceral transition regions

110
(from vitrinite to inertinite bands, or semifusinite to inertinite bands), deformations in
cleat geometry (bottlenecks), as well as when natural fractures bisected the
manufactured cleat. Permeability is contingent on these minor changes in structure and
composition.
5. Presence of the thin liquid film during drainage experiments on the RIE channel dull
band, but not the bright band supports the argument that both lithotypes have a unique
wetting state. The liquid film on the dull band is likely due to a Cassie Baxter wetting
transitions, where water is able to penetrate into the small, mineral filled textures. The
bright band did not display a similar roughness texture to the dull band and also did not
possess a mineral coated surface. This resulted in the displacing from the surface more
effectively under the same differential pressure compared to the dull band. These
different wetting states will influence the flow regimes at a micron scale. Thus, the
current understanding of water saturation may be insufficient to account for flow
through the sections of a CSG reservoir.
111
Chapter 6) Novel Chemical Treatments that alter the Wettability
of Coal and their effect on Relative Permeability
6.1 Introduction
The wettability of the coal surface plays an important role in determining relative permeability,
as water-wet surfaces can trap water in small openings, potentially isolating sections of the
cleat network and preventing gas flow through these regions until they are cleared out by a
sufficient pressure difference across them (Saghafi et al., 2014; Sakurovs and Lavrencic, 2011;
Teng et al., 2016). The ability to alter the coal surface to create a known homogenous wetting
state has the potential to mitigate capillary effects and improve fluid flow. Naik et al. (2015)
proposed the use of targeted chemical treatments in the drilling or fracturing fluid that would
create a water–wet surface during the dewatering stage, thus reduce water retention, followed
by a subsequent treatment that would create a hydrophobic surface during gas production, to
reduce water blockage and improve gas flow, that is to say provide an improved relative
permeabilities at the appropriate production stages for the water and the gas.
Examples of experiments that have examined the potential of using chemical treatments to alter
surface properties of coal surfaces. The studies by Liu et al. (2003) and Yu et al. (2014)
demonstrated that H2O2 treatment generates hydroxyl functional groups after oxidation of
electron rich aromatic rings, creating a more hydrophilic surface on coal. Subsequent use of
stronger oxidants could induce carboxyl or aldehyde moieties further increasing surface polar
functional groups (Liu et al., 2013). The benefit for CSG is that water production rates may be
improved in the initial stages if the near wellbore is water-wet. Surface modification using
oxidants has also been applied in coal flotation studies (Fuerstenau et al., 1991; Fuerstenau et
al., 1983; Kilau and Pahlman, 1987; Polat et al., 2003) and also as a means of impurity removal
or improved surface visualisation (Boron et al., 1981; Cho et al., 1983; Rhoads et al., 1983;
Vasilakos and Clinton, 1983; Ward, 1974). Additionally, Sadler and Chang (1988) used heated
sodium hydroxide (NaOH) to dissolve the coal around the cleat walls to increase width and
improve absolute permeability. Yet chemical treatments used in enhanced oil recovery (EOR),
such as nanoparticles are yet to be examined as a possible means of altering the wettability of
coal.
Nanoparticles are ultrafine particles with lengths in two or three dimensions not exceeding
100 nm. The unique surface properties of nanoparticles have generated significant interest in

112
conventional oil and gas research as a means of penetrating small sandstone pores to alter the
wetting properties of the rock to improve oil recovery, partly reviewed in Table 6-1. Based on
this review there are three primary mechanisms by which nanofluids improve oil recovery: 1)
reduction in interfacial tension which reduces the deformation energy for oil droplets to move
through pore throats, (Donaldson et al., 1989; Roustaei et al., 2012); 2) alteration of surface
wettability by nanoparticle adhesion (Vafaei et al., 2006; Zhang et al., 2014); and 3)
nanoparticle structuring (colloidal ordering and layering) in the wedge of the film that enables
fluid displacement (Wasan and Nikolov, 2003).
To date, there has been no study published that has specifically examined the change of
wettability on gas/liquid contact angles, the presence of residual water films in coal cleats using
nanoparticle or novel chemical treatments like polymers and the impact these changes to
wettability may have on relative permeability. In this chapter I examine the effects of different
chemical treatments including: MgO, SiO2 and Al2O3 nanoparticles, 15% H2O2 solution and
2% Silicad® solution on coal wettability, by treating a series of artificially etched channels in
a microfluidic Cleat Flow Cell (CFC) device. Based on these results, the two chemical
treatments that demonstrated the greatest change to surface wettability (H2O2 and Siliclad)
were used to treat a packed bed coal core. The use of the packed bed core enabled a systematic
study of wetting changes over a normal coal as the packed bed provides a homogeneous,
isotropic sample with controllable solid surface properties, pore size and channel geometry (set
by particle size); and constant porosity. The results of this chapter provide the basis to consider
targeted chemical treatments that may be used on coal in the near wellbore of CSG wells to
enhance gas production.

113
Table 6-1: A survey of nanoparticles applied to change surface wetting properties used in the oil and gas industry.
Experiment Treatment Application Surfactant/
dispersant
Experimental measurement Comment
Alomair et al.
(2015)
Al2O3, NiO, SiO2,
TiO2, with
concentrations for
each of: 0.01, 0.05
and 0.1 wt%
EOR in
sandstone
flooding
experiments.
30000 ppm
brine solution
and sonicated.
Core flooding experiments using Berea
sandstone cores.
Pendant drop interfacial tension (IFT)
measuring system using drop shape
analysis software.
Interfacial tension values decrease with an
increase in nanoparticle concentration up to
0.05 wt% in formation water, but the opposite
is observed at high concentration. SiO2 and
Al2O3 yield higher oil recovery volumes then
TiO2 and NiO2 because of their ability to
reduce inter facial tension.
Esfandyari
Bayat et al.
(2014)
SiO2, Al2O3, TiO2 EOR Deionised
water.
Flooding experiment using limestone
grains in a tubular holder using various
temperatures (26-60°)
Sessile drop contact angle measurements
Contact angle results showed that SiO2
produced the lowest contact angle, however,
Al2O3 and TiO2 demonstrated better EOR
results at all temperatures. Improved EOR was
attributed to reduction in capillary forces. .
Giraldo et al.
(2013)
Al2O3 EOR in
sandstone
flooding
experiments.
Anionic
surfactant PRNS
with a
concentration
range from
100 - 1000 ppm.
Imbibition core flood tests using oil wet
sandstone cores.
Contact angle measurement (oil/air
system) on the core surface.
Al2O3-PRNS nanofluid greatly altered oil wet
core surfaces to water wet. Low concentration
of Al2O3 and PRNS (100 ppm) generated
significant changes to surface wettability and
oil recovery.
Hendraningrat
et al. (2013)
SiO2 (0.01%, 0.05%
and 0.1 wt%)
nanofluid.
EOR in
sandstone
flooding
experiments
3% brine
solution
Preliminary study using a glass
micromodel.
Berea sandstone cores (low-medium
permeability to high permeability).
Sessile drop measurement of oil droplets
in nanofluid solution.
SiO2 nanofluids reduce interfacial tension
between oil-water system and contact angle.
Higher concentration of nanoparticle (0.1
wt%) blocked pore throats and reduced
permeability. 0.05 wt% achieved the best
outcomes for EOR in this study.
Karimi et al.
(2012)
ZrO2 (5 wt%) EOR in
carbonate rock
Distilled water,
non-ionic
surfactants:
ethoxylatyed
nonylphenol-4
mol (NON-
EO4)
Tween 80,
Span 20,
Contact angle measurements on
carbonate plates.
Saturated core plugs in an Amott-Harvey
cell with an elevated temperature of 75ºC
ZrO2 nanofluids showed a reduction in contact
angle in all tests, demonstrating the ability to
create a water-wet surface. This process
involved growing the ZrO2 on the rock surface
over 2 days. However, the mechanism of
improved oil recovery was not directly related
to surface modification in this experiment.

114
Span 80,
Spn 85,
Lauryl alcohol-2
mol (LA2),
lauryl alcohol-7
mol (LA7)
Maghzi et al.
(2011)
SiO2 EOR in
sandstone
flooding
experiments
Polyacrylamide
(DNSP),
distilled water
Cumulative oil recovery by injecting
nanofluids into five spot glass
micromodel with an acid etched surface
to mimic pore throats.
Sessile drop measurements
Improved oil recovery using the SiO2-DSNP
solution, by altering the glass surface from oil-
wet to water wet.
Contact angle measurements also showed a
decrease in contact angle from oil-wet to
water wet.
Moustafa et al.
(2015)
Mg/Al layered
double hydroxide
(Mg/Al-LDH),
Si/Zr, and
80% Mg/Al layered
double hydroxide
and Si/Zi
EOR in
sandstone
flooding
experiments.
Brine and
sonicated.
4.0 g/L nanoparticle fluid concentration
injected into brine flooded sandstone
cores surfaces.
Sessile drop contact angle measurements
were recorded on the surface in air
Mg/Al-LDH created a more hydrophilic
surface on the sandstone rock, as
demonstrated by a lower contact angle
compared to the reference sample. Si/Zr
nanofluid caused a shift to an oil- wet surface.
Ogolo et al.
(2012)
Al2O3, MgO, Fe2O3,
Ni2O2, SnO, ZnO,
ZrO2, Silane treated
SiO2 and
hydrophobic
surface treated SiO2
(0.3 wt%)
EOR in
sandstone
flooding
experiments.
Distilled water,
brine solution,
ethanol, and
diesel.
Sand packed beds with nanofluids
injected followed by oil injection (40%
of pore volume).
Sand packed bed was pre-soaked in
nanofluids for 60 days followed by oil
injection (40% of pore volume).
Al2O3 nanoparticles dispersed in brine had the
greatest EOR through reduced oil viscosity.
SiO2 silane and hydrophobic surface treated
ethanol dispersed nanoparticles improved oil
recovery through changes to the rock
wettability. MgO and ZnO in distilled water
and brine generated pore blockages and
reduced permeability.
Roustaei et al.
(2012)
Hydrophobic and
lipophilic
polysilicon (HLP)
Naturally wet
polysilicon (NWP)
EOR in
sandstone core
flooding
experiment.
Ethanol and
sonicated.
Contact angle of oil phase in water on
pre-treated nanofluid sandstone plate
surface.
Sandstone core flood experiments.
HLP nanoparticles had a greater influence on
oil-water interfacial tension, resulting in an
increased recovery of residual oil. NWP
nanoparticles had a greater impact on
wettability alteration.
Sefiane et al.
(2008)
Al2O3 Enhanced
dynamic
wetting
behaviour.
Ethanol,
sonicated and
heated solution
Drop shape analysis on Teflon coated
surface for enhanced slip.
Enhanced velocity of advancing nano
enhanced fluid (up to 1% concentration) was
attributed to the nanoparticles forming a
ordering in the fluid wedge at the three phase
interface.
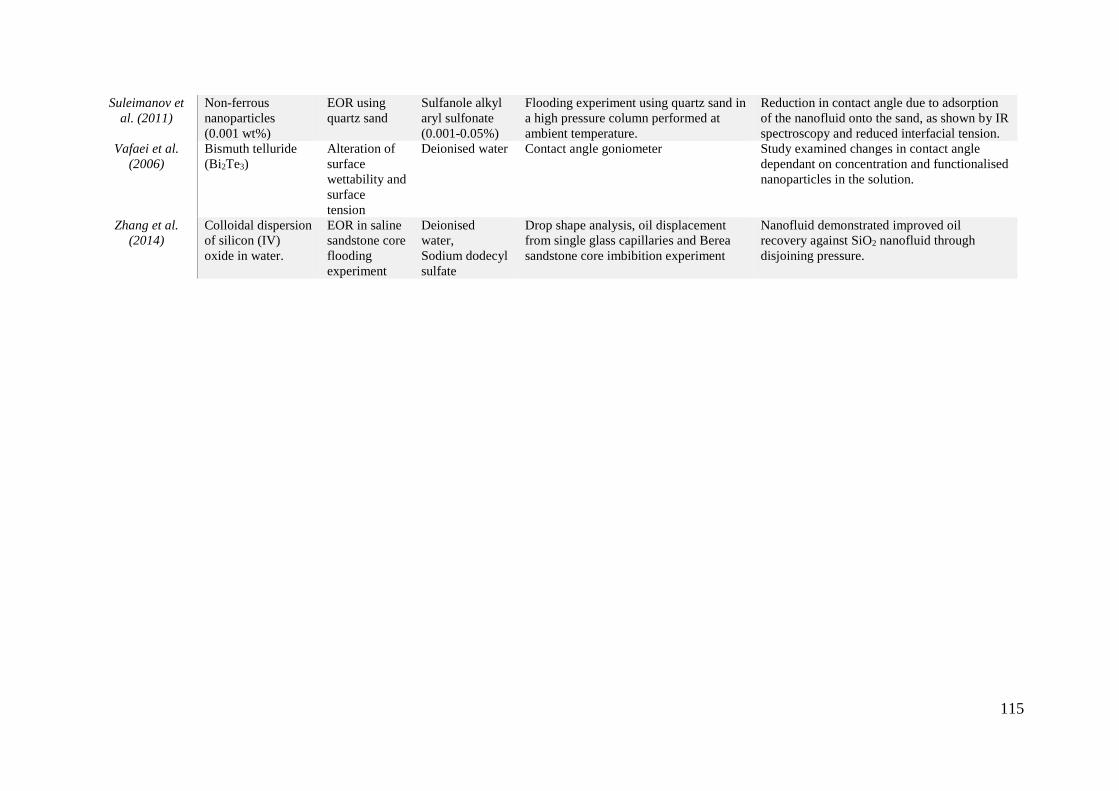
115
Suleimanov et
al. (2011)
Non-ferrous
nanoparticles
(0.001 wt%)
EOR using
quartz sand
Sulfanole alkyl
aryl sulfonate
(0.001-0.05%)
Flooding experiment using quartz sand in
a high pressure column performed at
ambient temperature.
Reduction in contact angle due to adsorption
of the nanofluid onto the sand, as shown by IR
spectroscopy and reduced interfacial tension.
Vafaei et al.
(2006)
Bismuth telluride
(Bi2Te3)
Alteration of
surface
wettability and
surface
tension
Deionised water Contact angle goniometer Study examined changes in contact angle
dependant on concentration and functionalised
nanoparticles in the solution.
Zhang et al.
(2014)
Colloidal dispersion
of silicon (IV)
oxide in water.
EOR in saline
sandstone core
flooding
experiment
Deionised
water,
Sodium dodecyl
sulfate
Drop shape analysis, oil displacement
from single glass capillaries and Berea
sandstone core imbibition experiment
Nanofluid demonstrated improved oil
recovery against SiO2 nanofluid through
disjoining pressure.

116
6.2 Methodology
6.2.1 Coal sample selection and characterisation
Coal samples used in this chapter area detailed in Table 3-2 under the pressed disc chemical
treatments (MVL coal only).
6.2.2 Preparation of artificial channels in crushed MVL-DB coal
Preparation of the six pressed discs was identical to that used in chapter 5.2.1 on page 84.
6.2.3 Characterisation techniques
Use of SEM and image characterisation was identical to that described in chapter 3.2.1 on page
57.
6.2.4 Chemical treatments of the pressed discs
Siliclad® treatment
A 50 mL solution of 2% wt. Siliclad octadecyl functional silane, (Sigma Aldrich product ID
25265-100g) and 1 wt. % DTAB (Dodecyltrimethylammonium bromide) was stirred for 24
hours at room temperature. The pH was adjusted to 3 with the addition of HCl and stirred for
1 hour. The solution was then poured into a 100 mL measuring cylinder and the MVL-SD was
immersed in the solution for 12 hours. The sample was removed and washed with deionised
water then oven dried at 60˚C for 12 hours. The side without the cleat indentation was used for
sessile drop contact angle measurement for this and all treated samples.
15 vol.% hydrogen peroxide treatment
A 50 ml solution of 15% H2O2 was prepared using a 32% stock solution. 1) A 1 g sample of
MVL coal powder was immersed in 10 mL of 15% H2O2 for 30 min. The coal was filtered and
oven dried for 12 hours at 60ºC and was used for XPS analysis. 2) The remaining 15% H2O2
solution was poured into a 100 mL measuring cylinder and the MVL-H2O2 was immersed in
the solution for 10 min. The disc was removed and dried in an oven for 60 min at 60˚C. 3)

117
Nanoparticle treatments
Fifty mL solutions containing 1% wt. of MgO, SiO2 and Al2O3 were prepared using deionized
water. Although many previous works establish methods to disperse nanoparticles in ethanol
or other solvents, in this study we used only sonication in deionised water to disperse NPs
because solvents such as ethanol are known to swell coal and may affect the wettability of coal.
Each nanoparticle solution was poured into a 250 mL beaker. The solutions were sonicated for
15 min to help separate the nanoparticles in solution, though as shown in Table 6-2 the liquid
suspension still remained partially agglomerated even after sonication. The pH for each
solution was measured using a TPS Aqua pH probe meter. The Zeta potential and particle size
for was measured with a Malvern Zetasizer Nano ZS and DTS 1070 zeta potential cell with
results shown in Table 6-2. The aim of the Zeta potential and particle size measurement was to
investigate the quality of nanoparticle dispersion in pure water, as previous studies have used
a dispersive agent to ensure homogenous coverage of nanoparticles to the solid surface. This
information will be used to establish the duration required for sonication to ensure the particles
are adequately dispersed in solution, prior to application.
Table 6-2: Experimental results of dry powder and 0.5% wt solution samples MgO, Al2O3 and
SiO2 nanoparticles.
Sample Supplier Dry
particle
size (nm)
Surface
area
(m2/g)
pH Mean particle size
(diameter, nm)
Zeta potential
and S.D (m.V)
MgO Nano
Armor
40-60 30-40 6.5 1483 -20.5 ± 3.07
Al2O3 Nano
Armor
20 No data 6.7 220 +18.2 ± 2.96
SiO2 Sigma
Aldrich
12 175-225 6.7 512 +19.1 ± 3.91
A single coal disc was assigned for each nanoparticle treatment and placed in the appropriate
solution for 5 min without sonication. The samples were removed and dried for 60 min at 60 ˚C.
Each artificial cleat was examined after drying to see if nanoparticle aggregation had occurred
and blocked the cleat. Blockages occurred for both the SiO2 and Al2O3 cleat samples which
were gently washed with deionised water and the blockage then cleared with a scalpel blade,
then air dried. The artificial cleat was then examined using a Leica DM 6000 light microscope

118
to further ensure aggregation had not blocked the flow path and that nanoparticles had adhered
to the surface of the channel.
Based on the aggregation of the of the nanoparticles and their need to have a dispersive agent
to ensure a homogenous deposition on the coal surface, the Siliclad and hydrogen peroxide
treatment were selected as the preferred treatments for the packed coal bed experiment.
6.2.5 Packed bed preparation
Due to limitations on the quantity of Moorvale coal, a substitute of similar rank and lithotype
from the Bowen basin, Dawson Creek (DC) coal, was selected. Dawson Creek coal is part of
the Baralaba Coal measures. Three packed beds were made using 30 g of crushed DC coal (53-
212 μm); 1) left untreated (DC-U), 2) treated with Siliclad using the above technique (DC-SD)
and 3) treated with 10% hydrogen peroxide (DC-H2O2). Pre-treating the coal particles, prior to
creating the packed bed ensures that the surface area of the coal core will have a homogenous
wetting state. Each sample was sieved and dried following treatment to ensure the particle
range between 53-212 μm was maintained. Each 30 g sample was compressed with a flat
25 mm die to 10 tonnes in a Carver 12 Tonne hydraulic press for 3 min or until the pressure
relaxed to 7 tonnes. After relaxation, the pressure was raised to 10 tonnes again and held for
2 min. A pressed core is shown in Figure 6.1A, as well as an idealised cross section of the coal
particles.
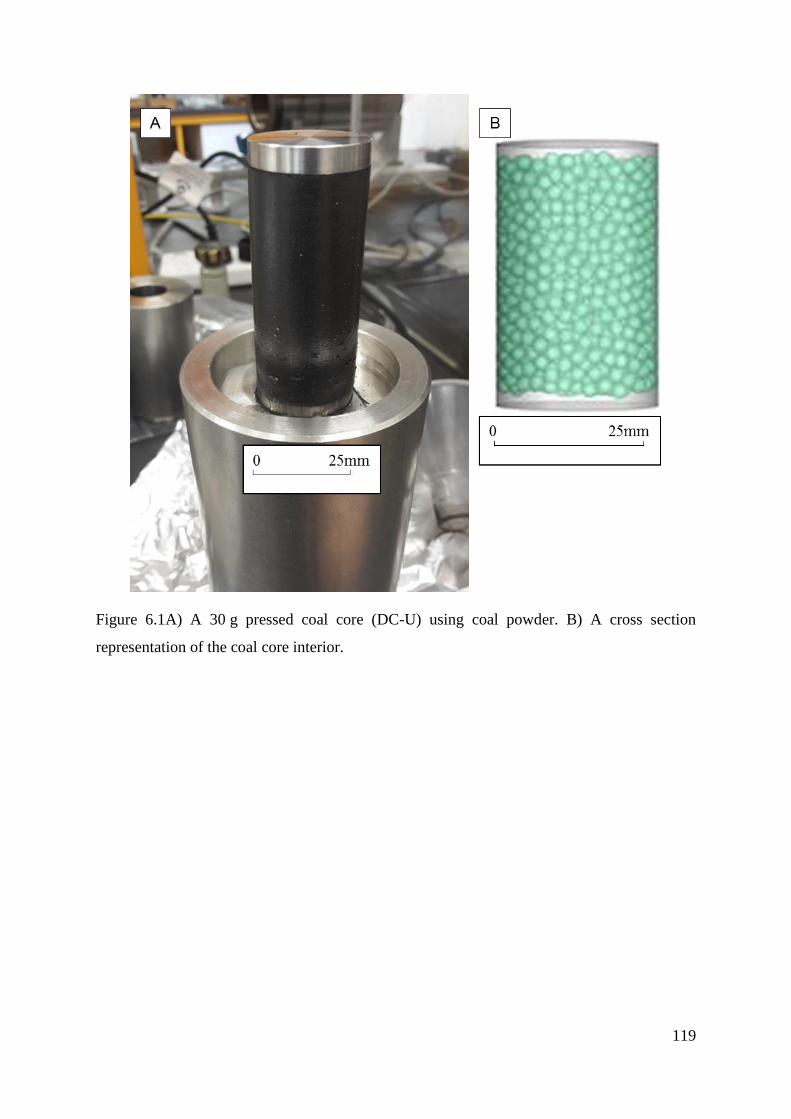
119
Figure 6.1A) A 30 g pressed coal core (DC-U) using coal powder. B) A cross section
representation of the coal core interior.

120
6.2.6 Packed bed core holder
Figure 6.2: A schematic of the packed bed core holder.
Absolute permeability measurements
A Hassler-type biaxial core flooding apparatus with 4% KCl was used at an applied confining
stress (radial and axial) using water as the confining fluid and an ISCO 260D syringe pump to
deliver and control the pressure. GEM 3200 pressure transducers with 0.01 bar resolution
measured inlet pressure (P1) and outlet pressure (P2) with the outlet pressure controlled with an
Equilibar back pressure regulator. LabView software recorded in real time the instrument
control and data acquisition. The absolute liquid permeability, kL, was calculated at equilibrium
state based on the Darcy equation (Equation 6-1):
𝐾𝐿 = [4𝑄𝑝𝐿𝜇𝑙
𝜋𝐷2(𝑃1 − 𝑃2)] Equation 6-1

121
Relative Permeability measurements
Steady state method was used to measure the relative permeability. 1) A 4 wt.% KCl solution
was used to first saturate the core at a contestant injection pressure of 10bar for 1 h. 2) N2(g)
was injected at different constant pressures to displace the brine solution with the flow of gas
from the core recorded using a mass flow meter. Equilibrium was achieved when the pressure
and gas flowrate remained constant over time. 3) Water saturation was measured at the
downstream of the core holder. 4) Post drainage, imbibition by injection of a 4 wt. % KCl
solution was applied constant flowrates that ranged from 0.002 to 5 mL/min to displace gas
trapped in the pores. 5) Effective permeability (𝐾𝑒𝑙 and 𝐾𝑒𝑔 for liquid and gas phase
respectively) was derived from the pressure gradients at each stage of equilibrium using
Equation 6-2 & 3)
where, Qo and Qb are the flow rate of downstream liquid and gas (m3/s), 𝜇𝑔 is the gas viscosity
at ambient temperature (22 ± 1oC).
𝐾𝑒𝑙 = [4𝑄𝑜𝐿𝜇𝑙
𝜋𝐷2(𝑃1 − 𝑃2)] Equation 6-2
𝐾𝑒𝑔 = [8𝑄𝑏𝐿𝜇𝑔𝑃2
𝜋𝐷2(𝑃12 − 𝑃2
2)] Equation 6-3
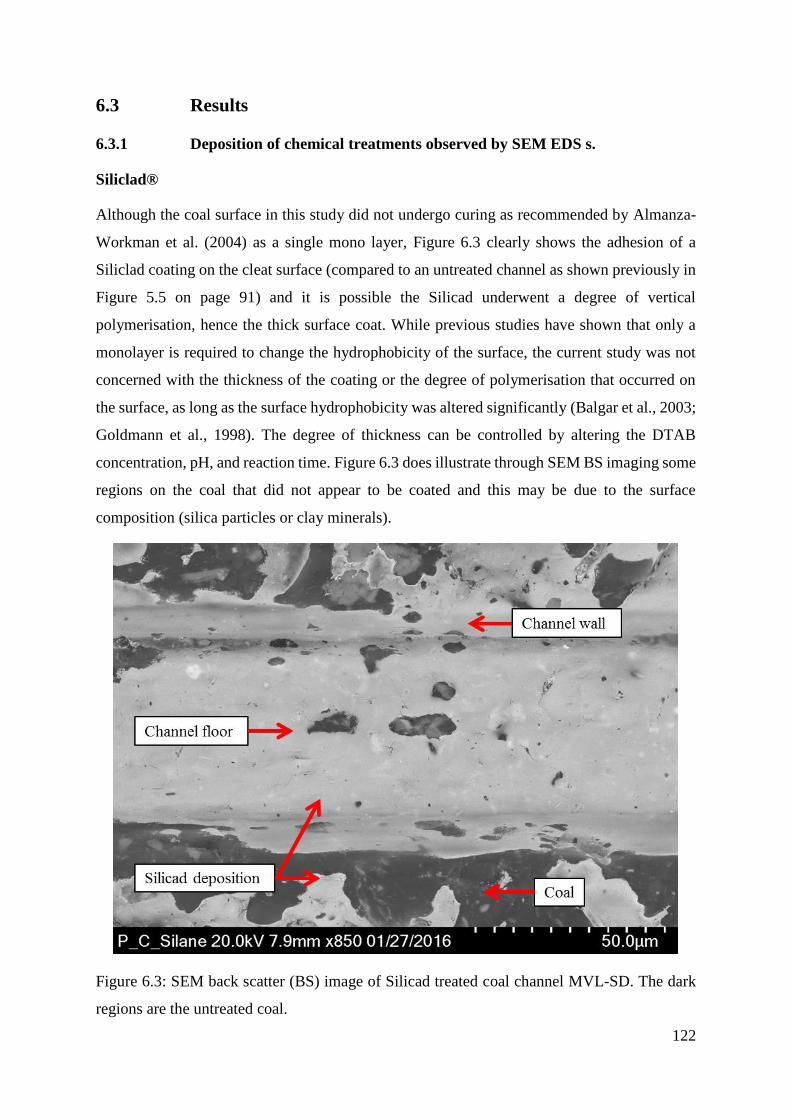
122
6.3 Results
6.3.1 Deposition of chemical treatments observed by SEM EDS s.
Siliclad®
Although the coal surface in this study did not undergo curing as recommended by Almanza-
Workman et al. (2004) as a single mono layer, Figure 6.3 clearly shows the adhesion of a
Siliclad coating on the cleat surface (compared to an untreated channel as shown previously in
Figure 5.5 on page 91) and it is possible the Silicad underwent a degree of vertical
polymerisation, hence the thick surface coat. While previous studies have shown that only a
monolayer is required to change the hydrophobicity of the surface, the current study was not
concerned with the thickness of the coating or the degree of polymerisation that occurred on
the surface, as long as the surface hydrophobicity was altered significantly (Balgar et al., 2003;
Goldmann et al., 1998). The degree of thickness can be controlled by altering the DTAB
concentration, pH, and reaction time. Figure 6.3 does illustrate through SEM BS imaging some
regions on the coal that did not appear to be coated and this may be due to the surface
composition (silica particles or clay minerals).
Figure 6.3: SEM back scatter (BS) image of Silicad treated coal channel MVL-SD. The dark
regions are the untreated coal.

123
Nanoparticles
The goal of the research was to examine alteration of surface wettability, thus all nanofluids
were attached to the coal surface and dried, as opposed to direct injection with the fluid phase.
SiO2 nanoparticles adhered to the cleat surface as shown in Figure 6.4A that was confirmed
with SEM EDS (Figure 6.4B and C). The size and agglomeration of the SiO2 nanoparticles
closely resemble similar formations reported by Esfandyari Bayat et al. (2014). Positive zeta
potential values indicate that the nanoparticles would aggregate in solution and is confirmed
with the nano-sizer results which recorded an average particle size of 0.51μm in Table 6-2
(Clogston and Patri, 2011). The size of the particle deposition may be due to the high solution
concentration (Riddick, 1968). However, from the SEM images it appears that the
nanoparticles were well attached to the coal surface.
Figure 6.4A) Deposition of SiO2 nanoparticles on the cleat surface sample MVL-Si with SEM
EDS results showing B) SiO2 nanoparticles and C) clean coal surface.
The Al2O3 nanoparticle solution also had a positive zeta potential, and like the SiO2
nanoparticles, were heavily aggregated on the coal surface. Figure 6.5A shows the cleat and a
range of different sized aggregate clusters of Al2O3 nanoparticle. Figure 6.5B confirms that the
larger particles are Al2O3 nanoparticles, though regions close to the scan area (C) show
underlying mineral deposits present in the pressed coal. Post flush SEM imagining did not
show any significant displacement of Al2O3 nanoparticles.

124
Figure 6.5A) Deposition of Al2O3 nanoparticles on the surface of the cleat sample MVL-Al
with SEM EDS results showing B) nanoparticle C) mineral deposit (possibly gypsum).
Figure 6.6A shows that the MgO nanoparticles tended to have a finer distribution over the
surface compared to the other nanoparticle solutions. While the average particle size was larger
compared to the other samples (Table 6-2 shows the average particle size was 1.4μm), the
zetapotential value of the MgO was -20.5 mV. This suggests that the nanoparticles have a
dispersive effect on each other as they have a negative charge (Clogston and Patri, 2011).

125
Figure 6.6A) Deposition of MgO nanoparticles on the surface of sample MVL-Mg with
respective SEM EDS results showing 1) MgO nanoparticles 2) mineral deposit (possibly
magnesiochromite)
6.3.2 XPS analysis of H2O2 coal treatment
The use of X-ray photoelectron spectroscopy to assess the functional group composition of
coal surfaces has been well documented (Bartle et al., 1987; Kelemen et al., 1990; Perry and
Grint, 1983). The coal matrix, depending on depositional history, rank and lithotype, can
consist of high molecular weight molecules present as condensed cyclic aromatics and
heterocyclic collections cross-linked with ether bonds or aliphatic chains (Moore, 2012;
Speight, 1994; Yu et al., 2014). Changes in the surface functional groups by the use strong
oxidants, like H2O2, can be reflected in the percentage change of the atoms on the
macrostructure, as well as deconvolution of the high resolution carbon spectra. Figure 6.7
shows the percentage composition of the MVL-U sample. The presence of Na, Si and Al are
most likely from carbonate minerals inherent in the MVL coal. Figure 6.7 (MVL-H2O2) shows
that the oxygen/carbon ratio almost doubles from that recorded in Figure 6.7, with the
numerical values stated in Table 6-3. Since the Na, Si and Al percentages in between the
untreated and treated sample stay reasonably close when compared to each other, it is
reasonable to assume that the two samples had similar quantities of carbonate minerals, and
that the changes in the carbon/oxygen ratio are not driven by changes in mineral concentration.
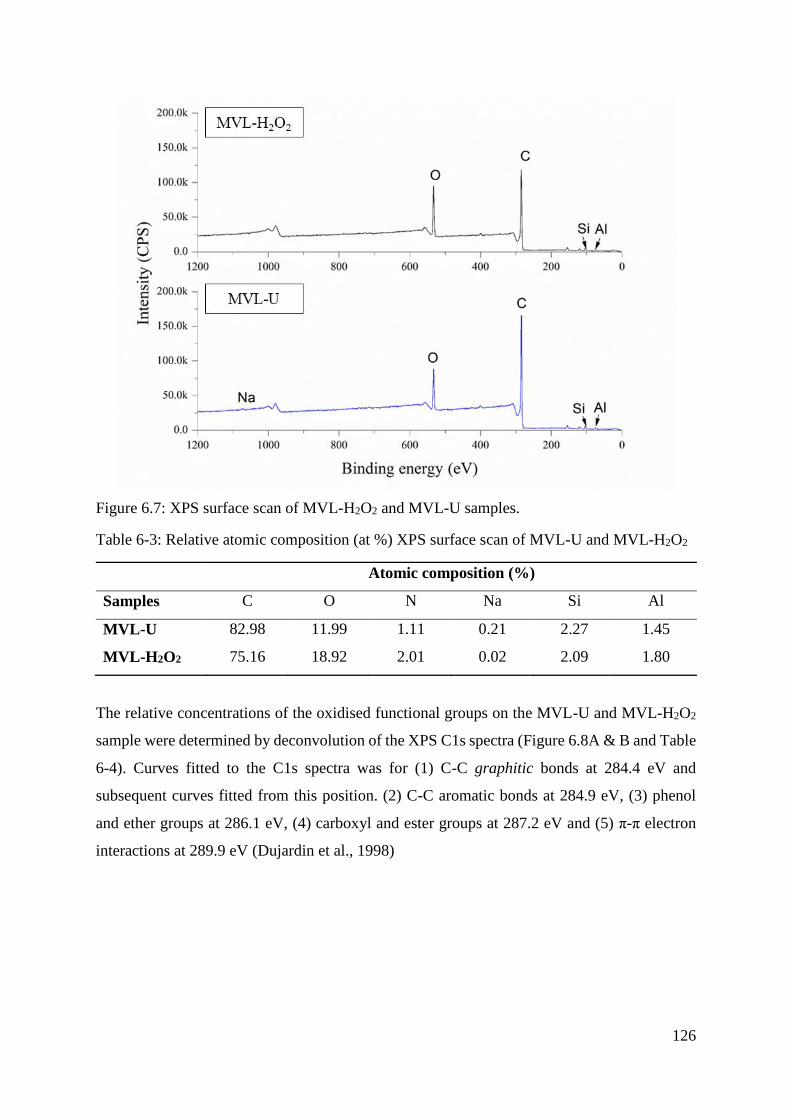
126
Figure 6.7: XPS surface scan of MVL-H2O2 and MVL-U samples.
Table 6-3: Relative atomic composition (at %) XPS surface scan of MVL-U and MVL-H2O2
Atomic composition (%)
Samples C O N Na Si Al
MVL-U 82.98 11.99 1.11 0.21 2.27 1.45
MVL-H2O2 75.16 18.92 2.01 0.02 2.09 1.80
The relative concentrations of the oxidised functional groups on the MVL-U and MVL-H2O2
sample were determined by deconvolution of the XPS C1s spectra (Figure 6.8A & B and Table
6-4). Curves fitted to the C1s spectra was for (1) C-C graphitic bonds at 284.4 eV and
subsequent curves fitted from this position. (2) C-C aromatic bonds at 284.9 eV, (3) phenol
and ether groups at 286.1 eV, (4) carboxyl and ester groups at 287.2 eV and (5) π-π electron
interactions at 289.9 eV (Dujardin et al., 1998)

127
Figure 6.8: High resolution C1s spectra of the A) MVL-U; B) MVL-H2O2 sample.

128
Table 6-4: Relative concentration (at %) of oxygen functional groups on untreated (MVL-U)
and oxidised (MVL-H2O2) samples calculated from deconvolution of high resolution XPS C1s
spectra.
Group C-C
graphitic
C-C
aromatic C-O C=O π-π*
Binding energy (eV) 284.4 284.9 286.1 287.2 289.9
MVL-U 63.26 24.82 5.387 1.645 4.89
MVL-H2O2 48.59 34.47 6.678 3.735 4.44
Comparison of the two spectra in Figure 6.8 clearly shows an increase in the phenol functional
groups. It is also possible that the 15% H2O2 treatment would produce carboxyl functional
groups or ester moieties, hence the increase in C=O groups. Previous studies by Liu et al.
(2003) and Yu et al. (2014) indicate that mild H2O2 treatment would most likely generate –OH
functional groups after oxidation of electron rich aromatic rings, with a requirement to use
additional oxidants to induce –COOH groups or aldehydes (Liu et al., 2013). Regardless, there
is an increase in hydrogen bonding capable functional groups that results in a coal surface that
has a higher degree of hydrophilicity.
6.4 Sessile Drop Results and Analysis
Sample MVL-U was not treated with any chemical and was therefore considered the standard,
thus any deviations in contact angle measurements for the other coal discs would be due to
their respective chemical treatments. Figure 6.9 illustrates the unique droplet profile for each
of the chemical treatments. The Mg and Si nanoparticle treatments (Figure 6.9C and D)
displayed a more spread droplet profile and thus a lower measured contact angle compared to
the untreated sample (Figure 6.9A), yet the Al treatment did not demonstrate a reduction in
contact angle and in some results, showed an increase, implying that the surface became
slightly more hydrophobic. One explanation for this result is the poor dispersal of particles on
the surface which may have created rough surface regions. This roughness (previously reported
in Chapter 5) may have increased the contact angle. A second explanation is that the Al2O3
does not actually work via the same mechanism as MgO and SiO2 nanoparticles. Previous
studies discussed in Figure 6.3 stated that Al nanoparticles were employed in solution to
influence the interfacial tension of the liquid, as opposed to altering the surface wettability of
sandstone.

129
Figure 6.9: Unique Sessile drop profiles of various chemical treated coal surfaces. The red
tangent line in A is the auto-correction line of the software, while the blue tangents were the
manual control.
Both chemical treatments, H2O2 and Siliclad, also generated changes in the droplet profile
compared to MVL-U, specifically the MVL-SD treatment (Figure 6.9E) which displayed a
larger contact angle indicating that the treatment resulted in a more hydrophobic surface. The
MVL- H2O2 profile (Figure 6.9F) was similar to the nanoparticle treatments, in that the contact
angle was reduced, and as expected this was due to an increase in the hydrophilicity of the
surface post hydrogen peroxide exposure. However, the H2O2 treatment did differ slightly from
the MgO and SiO2 nanoparticle treatment as represented in the standard deviation of contact
angle results illustrated in Figure 6.10. While the mean values for the three treatments were
similar, the larger spread of values for the nanoparticle treatments may again be attributed to
poor particle dispersal on the surface, compared to the homogeneous H2O2 application. This
result has implications to which treatment may be more appropriate for reservoir tests, as
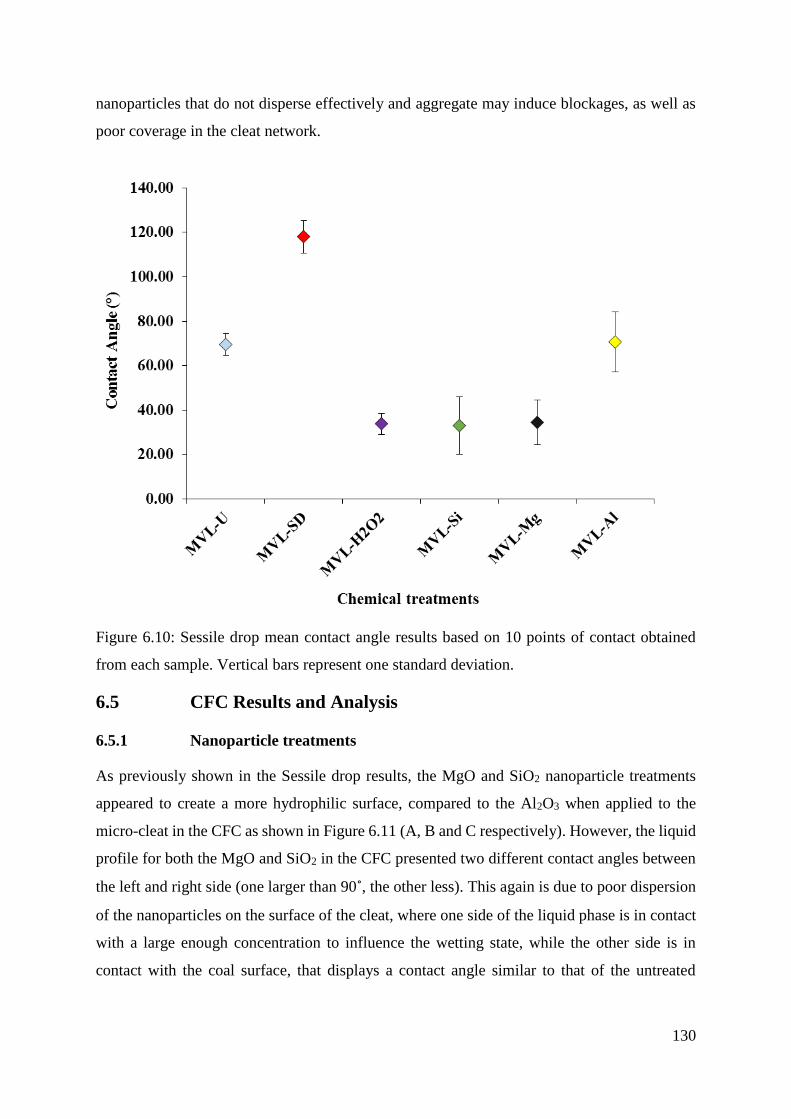
130
nanoparticles that do not disperse effectively and aggregate may induce blockages, as well as
poor coverage in the cleat network.
Figure 6.10: Sessile drop mean contact angle results based on 10 points of contact obtained
from each sample. Vertical bars represent one standard deviation.
6.5 CFC Results and Analysis
6.5.1 Nanoparticle treatments
As previously shown in the Sessile drop results, the MgO and SiO2 nanoparticle treatments
appeared to create a more hydrophilic surface, compared to the Al2O3 when applied to the
micro-cleat in the CFC as shown in Figure 6.11 (A, B and C respectively). However, the liquid
profile for both the MgO and SiO2 in the CFC presented two different contact angles between
the left and right side (one larger than 90˚, the other less). This again is due to poor dispersion
of the nanoparticles on the surface of the cleat, where one side of the liquid phase is in contact
with a large enough concentration to influence the wetting state, while the other side is in
contact with the coal surface, that displays a contact angle similar to that of the untreated

131
MVL- U sample. The Al2O3 profile shows a large contact angle (in excess of 90˚) due to the
rough texture of the deposited nanoparticles on the cleat surface.
Figure 6.11: CFC advancing contact angle of injected liquid phase post nanoparticle treatments
for A) MgO, B) SiO2 and C) Al2O3. Arrow indicates direction of flow.
6.5.2 H2O2 and Siliclad treatments
Compared to MVL-U advancing contact angle (shown in Figure 6.12A) the Siliclad treatment
generated the largest hydrophobic advancing contact angle change in the CFC device (Figure
6.12B), which mirrored the result obtained in the sessile drop measurement. Likewise the
MVL-H2O2 treatment created a lower contact angle then the untreated sample, but not to the
same degree shown in the sessile drop result. However, the flow rate of the advancing liquid
phase in the MVL-H2O2 was significantly faster compared to the other samples, such that the
syringe pump was turned off during the initial seconds of the imbibition experiment. This
accelerated liquid phase would have definitely altered the liquid profile shape, thus a
comparable examination of the contact angles between the MVL-H2O2 and the other treatments
was not directly possible.

132
Figure 6.12: CFC advancing contact angle of injected liquid phase post chemical treatments
for A) MVL-U, B) MVL-SD and C) MVL-H2O2. Arrow indicates direction of flow.
However, drainage experiments (via a withdrawal method as opposed to the previous drainage
technique outlined in chapter 5.5 on page 106) revealed three very different flow regimes. The
flow regime in MVL-U (illustrated in Figure 6.13) shows a thin residual film following a
reverse in the flow direction, which is likely a hydrodynamic effect since several seconds later
under constant withdrawal rate of 5μL/min the cleat surface does not retain any residual film.
This result was also observed in chapter 5.5.1 and confirms the hydrophobicity of the pressed
cleat surface.

133
Figure 6.13: Initial drainage via withdrawal of the liquid phase in the MVL-U cleat at 5μL/min.
B) Five seconds after initial drainage, small residual globs of liquid remain until they too are
drained several seconds later. Arrow indicates flow direction
MVL-SD also exhibited a similar phenomenon illustrated in Figure 6.14, except there is no
residual film observed during the initial withdrawal of the liquid phase from the cleat. While
some residual globs of fluid are observed several seconds during the withdrawal, there does
not appear to be an observable liquid film following this time. These results closely match
those obtained by Cubaud et al. (2006) and Cho and Wang (2014) that examined residual films
of water left on hydrophobic surfaces, compared to hydrophilic material.

134
Figure 6.14A) Initial drainage via withdrawal of the liquid phase in the MVL-SD treated cleat
at 5μL/min. B) Five seconds after initial drainage, small residual globs of liquid remain until
they too are drained within seconds. Arrow indicates flow direction
Conversely the MVL-H2O2 sample displayed a thick residual film following withdrawal
(shown in Figure 6.15). This film was persistent, remaining in place during an extended period
(over 120 seconds). Again, this was an expected observation based on results published by
Cubaud et al. (2006) and Cho and Wang (2014). The hydrophilic surface has a much greater
propensity to produce an annular flow regime compared to the globular hydrophobic surface.

135
Figure 6.15A) Initial drainage via withdrawal of the liquid phase in the MVL-H2O2 treated
cleat at 5μL/min. B) Five seconds after initial drainage a thick residual film of liquid remained
for several minutes. Arrow indicates flow direction
6.6 Relative permeability results of packed bed cores
Figure 6.16 shows the relative permeability curves of DC-U, -H2O2 and -SD using the mobile
water saturation as an appropriate representation of the relationship between relative
permeability and saturation rather than the conventional basis of total residual water saturation.
This method excludes the volume of water adsorbed in the micropores and pore bottlenecks,
thus, mobile water saturation represents the volume of water as a fraction of the cleat volume
that contributes to inhibition of gas flow through the cleat network.

136
Figure 6.16: Relative permeability of packed bed cores derived from DC untreated coal and
chemical treated coal powders (DC-H2O2 and DC-SD respectively).
137
The crossover point for the DC-H2O2 is further right compared to the DC-U curve, and displays
a higher critical water saturation which was the expected given the hydrophilic nature of the
surface. This result supports the assumption that the core has a more hydrophilic water-wet
surface creating an annular flow regime through the core. As detailed by Tokunaga (2011), the
presence of a residual film in porous media will reduce the flow velocity and rate of fluid
transport. Further, work by Xu and Dehghanpour (2014) highlight that a residual film reduces
fracture connectivity, face permeability, and effective fracture length. However, the DC-SD
relative permeability curve has shifted to the left based on the DC-U curve and has significantly
lower residual water saturation. This result confirms that the Siliclad treatment has induced a
more hydrophobic, non-water wet surface, and created a globular flow regime within the core.
Both the shape and crossover points of the relative permeability curves are consistent with that
reported in the literature that has used natural coal cores (Durucan et al., 2014; Durucan et al.,
2013). Based on these results, it is clear that the surface wettability plays a significant role in
the relative permeability curves of coal.
138
6.7 Conclusions
1) Three 1% nanoparticle solutions (MgO, SiO2 and Al2O3), as well as a 15% H2O2
solution and a 2% wt. Siliclad octadecyl functional silane with 1% DTAB were
individually used to treat a 3 g pressed coal discs with an indented 80 μm x 200 μm
cleat on the surface. Analysis of the nanoparticle solutions using Malvern Zetasizer
Nano ZS and DTS 1070 zeta potential cell showed that in the absence of a dispersive
agent, large aggregation of nanoparticles occurred. This was confirmed under SEM
which showed poor coverage on the coal surface and in the cleat. The H2O2 and Siliclad
treatments displayed a more even coverage over the coal surface.
2) Sessile drop results showed that MgO and SiO2 increased the hydrophilicity of the coal
surface, yet Al2O3 had limited effect on contact angle compared to the untreated
MVL- U sample. MVL- H2O2 also increased the hydrophilicity of the coal surface by
displaying a contact angle lower than 90˚, while the Siliclad treatment (MVL-SD)
exhibited an increased hydrophobic surface with a contact angle in excess of 120˚.
3) The CFC imbibition results for the nanoparticle treatments was not as effective as the
chemical treatments, mainly due to poor dispersion of the particles on the cleat surface,
and did not display similar changes in contact angle as those from the sessile drop
experiment. MVL-H2O2 showed some reduction in contact angle, but not as significant
to that seen in Sessile drop, primarily due to dynamic effects resulting from an increase
in the liquid flow rate. MVL- SD showed comparable contact angle results to those seen
in the sessile drop experiment.
4) Drainage results using the CFC on samples MVL-U, MVL-H2O2, MVL-SD showed
three unique flow regimes, with both the untreated and Siliclad treatments displaying a
globular flow regime, while the H2O2 displayed an annular flow regime as evidenced
by a thick residual film on the cleat surface. Both the H2O2 and Siliclad treatments were
used on the packed bed coal core to observe the changes in relative permeability.
5) The shifts of nitrogen-brine relative permeability curves of DC-H2O2 and DC-SD were
observed compared to the DC-U which indicated the influence of surface wettability on
crossover point (right shift for DC-H2O2 and left shift for DC-SD) and residual water
saturation.

139
Chapter 7) Conclusions and Recommendations
7.1 Conclusions
In this chapter, I review the primary objectives of the thesis and the pertinent results obtained.
Objective 1: Develop methodologies to prepare artificial one-dimensional channels in coal
that mimic a range of natural coal cleat properties, and thereby allow systematic studies
of fluid flow through coal structures.
The five channel preparation techniques used on natural polished coal evaluated were
reactive ion etching (RIE), UV laser ablation, chemical oxidation and two mechanical
machining (scratch and machining). The two mechanical techniques did not meet the
desired geophysical characteristics. Chemical oxidation involving 1M KMnO4 altered
the chemistry of the coal, as well as presented difficulties creating the square surface
edge required to observe flow. UV Laser ablation and RIE presented the most
promising channel methodologies as each was capable of creating a channel with
desirable geophysical characteristics (as stated in Table 4-1 on page 59) and minimal
changes to surface chemistry. However, detailed analysis using micro-Raman
spectroscopy showed that UV Laser did alter the chemical composition of the vitrinite
bands compared to the RIE. Later comparison of a natural cleat (both by soft
lithography and direct SEM analysis) showed that the RIE channel possessed
morphology similar to that of the natural lithotype in terms of roughness (as illustrated
on pages 74-77). Thus, RIE channels were selected as a means of producing artificial
channels that best represented the natural coal. Reactive ion etched ‘cleats’ were 20-
40 m wide and 20-30m deep had geometrical features similar to a natural coal cleat.
It should be noted that natural cleats have a deeper channel depth, but the use of RIE
limited the depth that could be manufactured. These channels were cut through both
dull and bright bands in the coal. Comparison with a natural cleat possessing showed
that the ion etched ones were morphologically quite similar to natural cracks. RIE was
determined to provide a method that could generate both simple and complex cleat
geometries and has been adopted as the preferred method of creating a systematic study
of the flow of fluids in coal cleats.
The sixth Channels of 80-100 μm wide and 150-200 μm deep were also made by
pressing powdered coal in a custom made steel die. The powders were taken from the
same bulk coal as used for the RIE experiments, but were separately extracted from the
140
dull (inertinite rich) and bright (vitrinite rich) bands. The Cleat Flow Cell (CFC) was
used to investigate water and gas behaviour including measurement of advancing fluid
phase contact angles, evaluation pressure required to move a water droplet through a
cleat and locations in the cleat that could restrict flow (narrow sections, mineral
particles, changes in lithotype), identification of residual water film to specific
lithotypes and observation of two phase flow.
Analysis of the Raman fingerprints of regions in the cut channels, outside the channels
and virgin reference coal samples indicates that there was no significant change in the
coal structure of induced by the UV laser or RIE. Although the micro Raman results
did not indicate significant structural variation at a molecular level, RIE demonstrated
the least impact on the coal structure by a smaller spread of Full Width, Half Maximum
(FWHM) values.
Objective 2: Develop a microfluidics cleat flow cell (CFC) to measure contact angles,
capillary pressure and observe the flow behaviour of gas (air) and water in the artificial
coal channels. This experimental approach allows the observation of mobile gas-water
interface behaviour in different ranks of coal and through different lithotype bands.
Several samples had a typical capillary pressure of 5 kPa during initial entry into the
manufactured micro-cleat. The calculated capillary pressure measurements matched
closely to experimental pressure values and their appropriate gas-liquid contact angle.
However, blockage points were observed during the imbibition test in the COPE
sample: maceral transition regions (from vitrinite to inertinite bands, or semifusinite to
inertinite bands), deformations in cleat geometry (bottlenecks), as well as when natural
fractures bisected the manufactured cleat. Permeability is contingent on these minor
changes in structure and composition.
Preparation of the coal surface Contact angles measured using the CFC for RIE
channels had the highest measured values (110-140˚). Contact angles measured in the
CFC for pressed discs varied within lithotype concentrates (lower for dull banded coal
compared to bright) and ranged from (85-110˚). A more traditional contact angle
measurement technique Sessile drop was employed and when compared to the CFC
results displayed values that were the significantly less, though compared to the trend
established in the pressed disc results with dull banded coal recording a lower contact
angle compared to the bright banded coal. The results parallel previous studies that have

141
shown that dull banded coal lithotype is generally more hydrophilic compared to bright
band.
Objective Three: Investigate the effect of the surface roughness on the wetting contact
angles on polished coal using the sessile drop technique and in cleats by using the CFC.
A modified equation constructed on the Cassie and Keller equation based on four
principle coal constituents effect wetting: bright coal (mildly hydrophobic); dull coal
(mildly hydrophilic); void space (completely non-wetting); mineral matter (highly
wetting) was used to predict contact angles of water and air in samples that had been
polished, channels that had been pressed from coal powder and channels formed in
natural coal blocks with reactive ion etching (Equation 5-4 on page 100).
Contact angles measured using sessile drop on polished samples and those calculated
using the modified equation were comparable, based on the assumption that the
literature values had a zero roughness (see pages 100-102). While further testing is
required to provide statistical validity of the equation, it is reasonable to conclude that
the modified surface equation proposed in this study may be applied to coal surfaces
with a known roughness value to estimate the contact angle that would be created in an
air-water system in a coal cleat. Contact angles measured on rough surfaces (RIE
channels), were also calculated to have similar contact angles using Equation 5-4 based
on a roughness value determined from the SEM image analysis and subsequent Rq
values Figure 5.6 on page 93). These values were used to compare the contact angles
measured from the pressed discs and those calculated using Equation 5-4. The surface
topography does have a notable effect on the advancing contact angle in the coal
samples tested in this thesis.
The presence of a thin liquid film on dull banded regions of the RIE channel in all coal
samples during drainage experiments was observed, but this film was not observed in
the bright bands. The liquid film on the dull band is likely due to a Cassie Baxter wetting
transitions, where water is able to penetrate into the small, mineral filled textures. The
bright band did not display a similar roughness texture to the dull band and also did not
possess a mineral coated surface. The liquid phase displaces from the surface in the
bright bands more effectively under the same differential pressure compared to the dull
band. These different wetting states will influence the flow regimes at a micron scale.

142
Thus, the current understanding of water saturation may be insufficient to account for
flow through the sections of a CSG reservoir.
Objective Four: Measure the effect of surface treatments with (a) nanoparticles
including, SiO2, MgO and Al2O3, (b) hydrogen peroxide and (c) a polymer based agent
called Siliclad ® on coal wettability and evaluate the potential of these surface treatments
using conventional techniques like sessile drop and the CFC apparatus to create a
homogenous wetting state on the coal surface. Based on the results of the previous
treatments two were selected applied to packed bed coal cores and their effect on relative
permeability was assessed.
The contact angles measured by the sessile drop method show that nanoparticle
treatments MgO and SiO2 increase the hydrophilicity of the coal surface and Al2O3 had
limited effect on contact angle compared to the untreated sample. The hydrogen
peroxide treatment (MVL-H2O2) also increased the hydrophilicity of the coal surface
by displaying a contact angle lower than 40˚. The Siliclad treatment (MVL-SD)
exhibited an increased hydrophobic surface with a contact angle in excess of 120˚.
Imbibition contact angle results using the CFC for the nanoparticle treatments was not
as effective as the chemical treatments, mainly due to poor dispersion of the particles
on the cleat surface, and did not display similar changes in contact angle as those from
the sessile drop experiment. The hydrogen peroxide treated sample showed some
reduction in contact angle, but not as significant to that seen in sessile drop, primarily
due to an increase in the liquid flow rate. The Siliclad treated sample showed
comparable contact angle results to those seen in the sessile drop experiment.
Drainage results using the CFC on samples MVL-U, MVL-H2O2, MVL-SD showed
three unique flow regimes, with both the untreated and Siliclad treatments displaying a
globular flow regime, while the H2O2 displayed an annular flow regime as evidenced
by a thick residual film on the cleat surface. Both the H2O2 and Siliclad treatments were
used on the packed bed coal core to observe the changes in relative permeability.
The shifts of nitrogen-brine relative permeability curves of hydrogen peroxide treated
and Siliclad packed bed core were observed compared to the untreated sample which
indicated the influence of surface wettability on crossover point (right shift for DC-
H2O2 and left shift for DC-SD) and residual water saturation, as illustrated in Figure

143
6.16 on page 136. This demonstrates that the wetting behaviour of the surface and the
subsequent flow regime do impact the relative permeability curves in coal.

144
7.2 Recommendations
This thesis has identified the potential influence coal lithotypes may have on relative
permeability and water occlusion events. The thesis results and conclusions lead to several
recommendations to continue this research and further understand relative permeability in coal.
1. Improvements to the CFC
a. Alternate cleat geometries to measure the effect of tortuosity and preferential flow
pathways.
A fundamental limitation of all 2D microfluidic devices is flow channel depth is typically
comparable in terms of size to the width. Without a sufficient variation in width to depth
geometry the flow regime through the channel is affected, specifically the interface curvatures,
interface profile and capillary pressure values. The use of the CFC is subject to this
imperfections, yet it is important to note that while the experimental results have restrictions,
the outcomes are still comparable to other microfluidic experiments. As such, a range of
recommendations on the CFC have been provided that may help to present new information to
the literature, yet mitigate some of the existing systemic issues.
The experimental CFC apparatus developed in this thesis has established that observation of
microfluidic flow in natural coal is possible. The impact that coal lithotype has on the flow
regimes have been documented in this thesis, but the channel geometry, specifically the single
straight tortuosity is not typically encountered in natural coal. Since the RIE process can adopt
any shaped channel, there exists the potential to explore a number of alternating tortuosities
and examine the influence these have on flow regimes and relative permeabilities. However,
while complex, observation of flow through natural cleats would be the most advantageous
experimental design.
Another option is to create a series of 2D channels and assess flow through interconnected
cleats. Given that coal lithotypes appear to possess unique flow regimes based on surface
topography and chemical composition, there is an opportunity to study how concurrent two
phase flow through a complicated cleat network would move. The results of such a study would
help develop a better understanding of flow passing through different lithotype layers in the
coal seam.

145
b. Pressurised vessel with the ability to observe gas desorption into the cleat network.
All contact angle measurements in this thesis were performed at ambient room temperature and
pressure. Work by Saghafi et al. (2014) clearly demonstrated the effect pressure has on contact
angle using captive bubble experiments. While maintaining the ability to create channels in
natural coal using RIE, there exists the option to contain the etched samples in a pressurised
cell with a sapphire viewing window. By re-gassing the etched coal block with methane and
allowing desorption at ever decreasing pressures, it would enable visualisation of gas
desorption from the matrix into the cleat channel at condition similar to that seen in the
reservoir. The results would provide insight into gas desorption and flow mechanics under
pressure and the influence this has on the contact angle and surface wettability over time.
c. Analysis of flow in 3D cleat configuration made from soft polymers
Recent work by Gerami et al. (2016) demonstrated how CT imagining of coal cores can be
imposed into PDMS molds to mimic the natural flow pathways. A combination of micro3D
printing to add roughened textures and chemical treatments that alter the surface chemistry of
sections of the channel provide an ability to consider where water occlusion events may occur
in complex 3D networks. This can be further enhanced by CT imagining of two phase flow to
better visualise the contact angle of the fluid interface and flow pathways.
d. Changes in liquid ion concentration and varying gas types.
This thesis used air and de-ionised water as a means of observing flow through artificial cleats.
However, CSG reservoir fluid typically possesses a high range of soluble ionic compounds that
vary at depth and location. The CFC device has the potential to explore the impact changes in
ionic character, as well as gas content may have on surface wetting and by extension the effect
these factors have on relative permeability.
2. Maceral pressed disc concentrates
A limitation of this thesis was that the broad lithotype range was examined in terms of
topography and contact angle. Additionally, the pressed discs used a combination of bright and
dull bands, making exact approximations regarding their individual effect on the contact angle
of water difficult. By using a range of maceral concentrates, it would be conclusive as to the
contribution each maceral would have on the surface wetting state and better understand how

146
these would influence the flow regime. One simple example would be to use two different
maceral concentrates in a single disc, one half for each side and observe the changes in flow
speed, contact angle and pressure drop as the liquid/gas interface passes through each region.
3. Modelling relative permeability using PorExpert
Simulating fluid flow through CSG reservoir using conventional software, such as ECLIPSE
or CMG to visualise fluid flow regimes in micron size channels is difficult as these software
packages use governing equations to model flow through the entire reservoir, and as previously
discussed, many of these governing equations do not account for unique flow regimes through
different coal lithotypes or changes to the coal wetting state. An alternative to conventional
reservoir simulation software is PorExpert which is a software package that investigates flow
through porous media by constructing a virtual 3D representation of the material based on
experimental mercury porosimetry intrusion and extrusion curves. The software allows for
systematic changes to liquid and solid properties, such as fluid type, interfacial tension,
viscosity, temperature, contact angle (advancing and receding), as well as density and pore
throat size. The construction of a pore network at a micron scale mimics the fluid flow
pathways through low permeability material, such as coals <1mD that do not have a master
cleat or propagated fracture.
Demonstration of PorExpert capability using IPN-DB coal sample to construct relative
permeability curves.
Intrusion and extrusion mercury porosimetry curves were measured on IPN-DB (the
methodology used was previously detailed in chapter 5.2.2) and the MIP curves for IPN-DB
were uploaded to PorExpert. The steps for constructing the 3D structure of the sample are as
follows: 1) uploaded porosimetry data (Figure 7.1A) is curve fitted and a structure type (which
is short range size auto correlation function that optimises the 3D arrangement to better fit the
input data) was chosen. The structure types include random, vertical banded, small centre zone,
large centre zone and capillary tubes. The capillary tube structure takes the first derivative of
the intrusion curve and is only valid for specific samples with a defined configuration, like
etched membranes. 2) A simulated curve is fit against the experimental data using an automated
Boltzmann anneal simplex equation. 3) The unit dimensions range from 10x10x10 pores with
up to 3000 pore throats (shown in Figure 7.1B) upwards to a 30x30x30 arrangement. In this
instance, a 20x20x20 unit scaffold was selected. While the arrangement appears simplistic and
does not match the physical structure of the sample, it is important to note that if the 3D

147
structure were real and placed in a mercury porosimeter, the intrusion and extrusion curves
would mirror that of the original sample.
Figure 7.1A) Uploaded intrusion and extrusion mercury porosimetry data. B) A 10x10x10 pore
size vertically banded pore structure based on the fitted curve. The solid phase is shown as
transparent, while the pores within the solid material are represented as boxes and the pore
throats are characterized as connecting cylinder.
Based on the findings from the CFC drainage experiment in Chapter 5.5 (page 106) and
Chapter 6.5.2 (page 131), three general surface wetting conditions were investigated: A) a very
hydrophilic surface (shown as a light blue and yellow colour respectively in Figure 7.2A). B)
An intermediate wetting surface. C) Hydrophobic surface with no residual water film that
mimics the conditions found in the bright vitrinite rich coal bands. Figure 7.2B illustrates the
injected fluid is water (shown as dark blue) while the orange colour is air filled pores.

148
Figure 7.2A) PorExpert coal structure with the black region representing the coal matrix, blue
cylinders and boxes represent water filled pores and throats respectively, with the yellow
indicative of air filling the pores. B) The orange color is air filled pores and the dark blue
indicative of water filling the structure.
In each scenario, the non-wetting fluid is injected using the percolation function during fluid
uptake. For the hydrophilic surface, the wetting fluid (water) had an advancing contact angle
of 50˚ and a second value of 85˚ (to represent an intermediate wetting state) while for the
hydrophobic surface the water was the non-wetting fluid and had a contact angle of 130˚. The
numerical parameters for each scenario were unique as each condition adopted different surface
properties flow conditions, based on the desired solid properties, either hydrophilic or
hydrophobic. For instance, the hydrophilic scenario assumes that water already occupies the
open pore voids, thus the solid material has fluid properties that have to be accounted for during
the percolation phase.
During fluid uptake, the direction of flow (top, sides or bottom) and percentage of pores filled
is pre-selected. In both cases, injection from the top of the material was selected and a range of
non-wetting fluid uptake percentages from 1-100% were selected. After each pre-selected fluid
uptake percentage, a corresponding differential pressure was displayed that represented the
pressure required to displace the existing fluid phase (Figure 7.3).

149
Figure 7.3: Injection of non-wetting fluid (water) from the top of the PorExpert hydrophobic
surface scenario with incremental increases in non-wetting fluid uptake shown as percentage
(non-wetting fluid is blue) and the corresponding differential pressure.
Capillary pressure (Pc) was plotted against wetting phase saturation (Sw) and the irreducible
wetting phase saturation (Swr) was based on the highest pressure value and corresponding water
saturation. The normalised wetting phase saturation (Sw*) was calculated using Equation 7-1and
the log value of Sw* and Pc were plotted to derive the pore size distribution index (λ) using
Equation 7-2 (Brooks and Corey, 1966a).
𝑆𝑤∗ =
𝑆𝑤 − 𝑆𝑤𝑟
1 − 𝑆𝑤 Equation 7-1

150
The values for Sw* and λ based on each scenario were then inputted into Equation 7-3 and
Equation 7-4 to calculate the relative permeability curve of the wetting phase (krw), water and
the non-wetting phase (krnw), air.
Three relative permeability curves were obtained for each scenario is listed below in Figure
7.4, 5 and 6. For table of results for each scenario can be found in Appendix E from page 179.
Figure 7.4: Relative permeability curve from scenario 1 based on globular flow regime and an
advancing contact angle for water of 50°.
log 𝑃𝑐 = log 𝑃𝑒 − 1
𝜆log 𝑆𝑤
∗ Equation 7-2
𝑘𝑟𝑤 = (𝑆𝑤∗ )
2+3𝜆𝜆 Equation 7-3
𝑘𝑟𝑛𝑤 = (1 − 𝑆𝑤∗ )2[1 − (𝑆𝑤
∗ )2+𝜆
𝜆 ] Equation 7-4

151
Figure 7.5: Relative permeability curve from scenario 2 based on globular flow regime and an
advancing contact angle for water of 85°.
Figure 7.6: Relative permeability curve from scenario 3 based on globular flow regime and an
advancing contact angle for water of 130°.
152
Further modifications to the software, such as the introduction of residual water films to
targeted locations in the 3D arrangement, as well as governing equations that alter the thickness
based on gas flux, temperature and absolute permeability would enable a better understanding
of unique surface wetting conditions and offer a package that could better model flow through
coal cores under that use steady or unsteady state laboratory experiments.
4. Field trials using chemical treatments to alter wettability
On a reservoir scale, altering the near wellbore surface wetting property may enhance gas flow
during the production stage of the well. Although several chemical treatments were trailed in
this thesis, additional testing is required before full scale testing is considered. The nanoparticle
treatments in this thesis necessitate a greater range of testing. Specifically, the use of dispersing
agents and the subsequent impact they may have on the coal. Additionally, different delivery
mechanism for the nanoparticles into the CFC should be tested, as this thesis only explored
direct immersion method. Other techniques may include continuous injection at varying flow
rates or a combination of intrusion and withdrawal methods to investigate particle dispersion
and adhesion to the coal surface. After completing a series of these experiments, additional
packed bed coal core flooding tests could be conducted using the nanoparticle fluids. Once a
thorough understanding of the treatment delivery and effect should natural coal core flooding
experiments be considered.
The Siliclad cure may be potentially useful in creating a hydrophobic surface that improves gas
flow under a decreasing reservoir pressure differential. Investigation into similar polymer
based agents may produce an optimal candidate that alters the wetting state of the coal, while
ensuring gas desorption from the matrix is not reduced. Further chemical treatments using
hydrogen peroxide should also be considered on natural coal cores in core flooding
experiments, to investigate the potential negative effects of cleat blockage due to coal fine
migration. A possible optimal concentration may be discovered that influences the surface
wetting state, without inducing surface fragmentation.

153
References
2009. AS 4264.1 Coal and Coke - Sampling - Coal - Sampling Procedures. Standards Australia.
Adamson, A.W., Gast, A.P., 1967. Physical chemistry of surfaces.
Ahmed, T., 2006. Reservoir engineering handbook. Gulf Professional Publishing.
Albijanic, B., Ozdemir, O., Nguyen, A.V., Bradshaw, D., 2010. A review of induction and
attachment times of wetting thin films between air bubbles and particles and its relevance in
the separation of particles by flotation. Advances in colloid and interface science 159, 1-21.
Ali, J., 1997. Developments in measurement and interpretation techniques in coreflood tests to
determine relative permeabilities, Latin American and Caribbean petroleum engineering
conference. Society of Petroleum Engineers.
Almanza-Workman, A.M., Raghavan, S., Deymier, P., Monk, D.J., Roop, R., 2004. Aqueous
silane-surfactant co-dispersions for deposition of hydrophobic coatings onto pre-oxidized
polysilicon. Colloids and Surfaces A: Physicochemical and Engineering Aspects 232, 67-75.
Alomair, O.A., Matar, K.M., Alsaeed, Y.H., 2015. Experimental study of enhanced-heavy-oil
recovery in Berea sandstone cores by use of nanofluids applications. SPE Reservoir Evaluation
& Engineering.
Ammosov, I.I., Eremin, I.V., 1963. Facturing in Coal. Israel Program for Scientific
Translations. ;[available from the Office of Technical Services, US Department of Commerce,
Washington].
Anderson, W.G., 1987. Wettability literature survey part 5: the effects of wettability on relative
permeability. J Petrol Technol 39, 1,453-451,468.
Arnold, B., Aplan, F., 1989. The hydrophobicity of coal macerals. Fuel 68, 651-658.
Australian Standard, 1989. AS2061. Preparation of coal samples for incident light microscopy.
Standards Australia International Ltd.
Avraam, D., Payatakes, A., 1999. Flow mechanisms, relative permeabilities, and coupling
effects in steady-state two-phase flow through porous media. The case of strong wettability.
Industrial & engineering chemistry research 38, 778-786.
Baker, L., 1988. Three-phase relative permeability correlations, SPE Enhanced Oil Recovery
Symposium. Society of Petroleum Engineers.
Balgar, T., Bautista, R., Hartmann, N., Hasselbrink, E., 2003. An AFM study of the growth
kinetics of the self-assembled octadecylsiloxane monolayer on oxidized silicon. Surface
science 532, 963-969.
Bartle, K., Perry, D., Wallace, S., 1987. The functionality of nitrogen in coal and derived
liquids: an XPS study. Fuel Processing Technology 15, 351-361.
Beyssac, O., Goffé, B., Petitet, J.-P., Froigneux, E., Moreau, M., Rouzaud, J.-N., 2003. On the
characterization of disordered and heterogeneous carbonaceous materials by raman
spectroscopy. Spectrochimica Acta Part A: Molecular and Biomolecular Spectroscopy 59,
2267-2276.
Blunt, M.J., 2001. Flow in porous media - pore-network models and multiphase flow. Curr
Opin Colloid In 6, 197-207.

154
Boron, D.J., Dietz, A.G., Taylor, S.R., 1981. Sulphur removal from coal via hydrogen peroxide
oxidation. Fuel 60, 991-992.
Bracco, G., Holst, B., 2012. Surface Science Techniques. Springer London, Limited.
Brady, G.A., Gauger, A.W., 1940. Properties of coal surfaces. Ind Eng Chem 32, 1599-1604.
Brakel, A., Totterdell, J., Wells, A., Nicoll, M., 2009. Sequence stratigraphy and fill history of
the bowen basin, queensland. Australian Journal of Earth Sciences 56, 401-432.
Brooks, R.H., Corey, A.T., 1964. Hydraulic properties of porous media and their relation to
drainage design. Transactions of the ASAE 7, 26-0028.
Brooks, R.H., Corey, A.T., 1966a. Properties of porous media affecting fluid flow. Journal of
the Irrigation and Drainage Division 92, 61-90.
Brooks, R.H., Corey, A.T., 1966b. Properties of porous media affecting fluid flow. Journal of
Irrigation and Drainage Division 92.
Buckley, S., Leverett, M., 1941. Mechanism of fluid displacement in sands. Trans. Aime 146.
Burnham, A.K., Sweeney, J.J., 1989. A Chemical Kinetic-Model of Vitrinite Maturation and
Reflectance. Geochim Cosmochim Ac 53, 2649-2657.
Bustin, R., Clarkson, C., 1998. Geological controls on coalbed methane reservoir capacity and
gas content. International Journal of Coal Geology 38, 3-26.
Cassie, A., 1948. Contact angles. Discussions of the Faraday Society 3, 11-16.
Cassie, A., Baxter, S., 1944. Wettability of porous surfaces. Transactions of the Faraday
Society 40, 546-551.
Chaturvedi, T., Schembre, J.M., Kovscek, A.R., 2009. Spontaneous imbibition and wettability
characteristics of Powder River Basin coal. International Journal of Coal Geology 77, 34-42.
Chen, D., Pan, Z.J., Liu, J.S., Connell, L.D., 2013. An improved relative permeability model
for coal reservoirs. International Journal of Coal Geology 109, 45-57.
Chen, D., Shi, J.-Q., Durucan, S., Korre, A., 2014. Gas and water relative permeability in
different coals: model match and new insights. International Journal of Coal Geology 122, 37-
49.
Chen, Y., Mastalerz, M., Schimmelmann, A., 2012. Characterization of chemical functional
groups in macerals across different coal ranks via micro-FTIR spectroscopy. International
Journal of Coal Geology 104, 22-33.
Chen, Z., 2007. Reservoir simulation. SIAM.
Cho, E.H., Chang, K.H., Rollins, R.R., 1983. A kinetic study of leaching of coal pyrite with
nitric acid. Metallurgical Transactions B 14, 317-324.
Cho, S.C., Wang, Y., 2014. Two-phase flow dynamics in a micro channel with heterogeneous
surfaces. International Journal of Heat and Mass Transfer 71, 349-360.
Clarkson, C.R., Bustin, R.M., 1996. Variation in micropore capacity and size distribution with
composition in bituminous coal of the Western Canadian Sedimentary Basin - Implications for
coalbed methane potential. Fuel 75, 1483-1498.
Clarkson, C.R., Rahmanian, M., Kantzas, A., Morad, K., 2011. Relative permeability of cbm
reservoirs: Controls on curve shape. International Journal of Coal Geology 88, 204-217.

155
Clogston, J.D., Patri, A.K., 2011. Zeta potential measurement. Characterization of
nanoparticles intended for drug delivery, 63-70.
Close, J.C., Mavor, M.J., 1991. Influence of Coal Composition and Rank on Fracture
Development in Fruitland Coal Gas Reservoirs of Suan Jan Basin. In: Schwochow, S.D. (Ed.),
Coalbed Methane of Western North America, Rk. Mt. Assoc. Geol. Field Conf., pp. 109–121.
Cnudde, V., Boone, M.N., 2013. High-resolution X-ray computed tomography in geosciences:
A review of the current technology and applications. Earth-Sci Rev 123, 1-17.
Conway, M., Mavor, M., Saulsberry, J., Barree, R., Schraufnagel, R., 1995a. Multi-phase flow
properties for coalbed methane wells: a laboratory and field study, Low Permeability
Reservoirs Symposium. Society of Petroleum Engineers.
Conway, M.W., Mavor, M.J., Saulsberry, J., Barree, R.B., Schraufnagel, R.A., 1995b. Multi-
Phase Flow Properties for Coalbed Methane Wells: A Laboratory and Field Study. Society of
Petroleum Engineers, Joint Rocky Mountain Regional Meatrng and Low-Permeability
Reservoirs Symposium held in Danver Colorado, U. S.A.
Cubaud, T., Ulmanella, U., Ho, C.-M., 2006. Two-phase flow in microchannels with surface
modifications. Fluid Dynamics Research 38, 772-786.
Cui, X.J., Bustin, R.M., Chikatamarla, L., 2007. Adsorption-induced coal swelling and stress:
Implications for methane production and acid gas sequestration into coal seams. J Geophys
Res-Sol Ea 112.
Dabbous, M.K., Reznik, A.A., Mody, B.G., Fulton, P.F., Taber, J.J., 1976. Gas-Water
Capillary-Pressure in Coal at Various Overburden Pressures. Soc Petrol Eng J 16, 261-268.
Das, T., 2001. Evolution characteristics of gases during pyrolysis of maceral concentrates of
russian coking coals. Fuel 80, 489-500.
Dawson, G., Golding, S., Esterle, J., Massarotto, P., 2012. Occurrence of minerals within
fractures and matrix of selected Bowen and Ruhr Basin coals. International Journal of Coal
Geology 94, 150-166.
Dawson, G.K.W., Esterle, J.S., 2010. Controls on coal cleat spacing. International Journal of
Coal Geology 82, 213-218.
Department of Natural Resources and Mines, 2015. Figure 2: Queensland Coal Report.
Department of Natural Resources and Mines, 2016. Queensland's petroleum and coal seam gas,
2014-15.
Diez, M.A., Alvarez, R., Barriocanal, C., 2002. Coal for metallurgical coke production:
predictions of coke quality and future requirements for cokemaking. International Journal of
Coal Geology 50, 389-412.
Ding, L.P., 2009. Investigation of bituminous coal hydrophobicity and its influence on
flotation. Energy Fuel 23, 5536-5543.
Dmyterko, A., Esterle, J., 2014. Variability Of Porosity And Gas Sorption Within The
Leichhardt Seam, Rangal Coal Measures, Bowen Basin, Central Queensland. 31st Annual
Meeting of the Society for Organic Petrogpraphy, Sydney, 42-49
Domenico, P.A., Schwartz, F.W., 1998. Physical and Chemical Hydrogeology. Wiley.
Donaldson, E.C., Chilingarian, G.V., Yen, T.F., 1989. Enhanced oil recovery, II: Processes and
operations. Elsevier.
156
Dorrestijn, E., Laarhoven, L.J., Arends, I.W., Mulder, P., 2000. The occurrence and reactivity
of phenoxyl linkages in lignin and low rank coal. Journal of Analytical and Applied Pyrolysis
54, 153-192.
Drelich, J., Laskowski, J., Pawuk, M., 2000. Improved sample preparation and surface analysis
methodology for contact angle measurements on coal (heterogeneous) surfaces. Coal
Perparation 21, 247-275.
Drelich, J., Miller, J.D., Good, R.J., 1996. The effect of drop (bubble) size on advancing and
receding contact angles for heterogeneous and rough solid surfaces as observed with sessile-
drop and captive-bubble techniques. Journal of Colloid and Interface Science 179, 37-50.
Dujardin, E., Ebbesen, T.W., Krishnan, A., Treacy, M.M., 1998. Purification of single‐shell
nanotubes. Advanced materials 10, 611-613.
Durucan, S., Ahsan, M., Shi, J.-Q., Syed, A., Korre, A., 2014. Two phase relative
permeabilities for gas and water in selected European coals. Fuel 134, 226-236.
Durucan, S., Ahsan, M., Syed, A., Shi, J.-Q., Korre, A., 2013. Two phase relative permeability
of gas and water in coal for enhanced coalbed methane recovery and CO 2 storage. Energy
Procedia 37, 6730-6737.
Esfandyari Bayat, A., Junin, R., Samsuri, A., Piroozian, A., Hokmabadi, M., 2014. Impact of
metal oxide nanoparticles on enhanced oil recovery from limestone media at several
temperatures. Energy and Fuels 28, 6255-6266.
Espinoza, D.N., Santamarina, J.C., 2010. Water‐CO2‐mineral systems: Interfacial tension,
contact angle, and diffusion—implications to CO2 geological storage. Water Resour Res 46.
Faiz, M., 1993. Geological controls on the distribution of coal seam gases in the southern
Sydney Basin. Ph. D. Thesis. University of Wollongong, 326 pp.
Faiz, M., Saghafi, A., Sherwood, N., Wang, I., 2007a. The influence of petrological properties
and burial history on coal seam methane reservoir characterisation, Sydney Basin, Australia.
International Journal of Coal Geology 70, 193-208.
Faiz, M., Saghafi, A., Sherwood, N., Wang, I., 2007b. The influence of petrological properties
and burial history on coal seam methane reservoir characterisation, Sydney Basin, Australia.
International Journal of Coal Geology 70, 193-208.
Faraj, B.S., Fielding, C.R., Mackinnon, I.D., 1996. Cleat mineralization of Upper Permian
Baralaba/Rangal Coal Measures, Bowen Basin, Australia. Geological Society, London, Special
Publications 109, 151-164.
Fashina, A., Adama, K., Zebaze Kana, M., Soboyejo, W.O., 2016. Improving the Performance
of Light Trapping in Crystalline Silicon Solar Cell through Effective Surface Texturing,
Advanced Materials Research. Trans Tech Publ, pp. 144-159.
Feng, L., Zhang, Y., Xi, J., Zhu, Y., Wang, N., Xia, F., Jiang, L., 2008. Petal effect: a
superhydrophobic state with high adhesive force. Langmuir 24, 4114-4119.
Ferrari, A.C., 2007. Raman spectroscopy of graphene and graphite: Disorder, electron–phonon
coupling, doping and nonadiabatic effects. Solid State Communications 143, 47-57.
Flores, R.M., 2013. Coal and Coalbed Gas: Fueling the Future. Elsevier Science & Technology
Books.
Friesen, W., Mikula, R., 1987. Fractal dimensions of coal particles. Journal of colloid and
interface science 120, 263-271.

157
Fuerstenau, D., Diao, J., Hanson, J., 1990. Estimation of the distribution of surface sites and
contact angles on coal particles from film flotation data. Energy & Fuels 4, 34-37.
Fuerstenau, D., Diao, J., Williams, M., 1991. Characterization of the wettability of solid
particles by film flotation 1. Experimental investigation. Colloids and Surfaces 60, 127-144.
Fuerstenau, D., Rosenbaum, J.M., Laskowski, J., 1983. Effect of surface functional groups on
the flotation of coal. Colloids and Surfaces 8, 153-173.
Galindo-Rosales, F., Campo-Deano, L., Pinho, F., Van Bokhorst, E., Hamersma, P., Oliveira,
M., Alves, M., 2012. Microfluidic systems for the analysis of viscoelastic fluid flow
phenomena in porous media. Microfluidics and Nanofluidics 12, 485-498.
Gamson, P., Beamish, B., Johnson, D., 1996. Coal microstructure and secondary
mineralization: their effect on methane recovery. Geological Society, London, Special
Publications 109, 165-179.
Gamson, P.D., Beamish, B.B., 1991. Characterization of Coal Microstructure Using Scanning
Electron-Microscopy. Queensland Coal Symposium, 9-22.
Gamson, P.D., Beamish, B.B., Johnson, D.P., 1993. Coal Microstructure and
Micropermeability and Their Effects on Natural-Gas Recovery. Fuel 72, 87-99.
Gao, L., McCarthy, T.J., 2006. The “lotus effect” explained: two reasons why two length scales
of topography are important. Langmuir 22, 2966-2967.
Gash, B.W., 1991. Measurement of Rock Properties in Coal for Coal-Bed Methane Production.
AAPG Bulletin-American Association of Petroleum Geologists 75, 1395-1395.
Gash, B.W., Volz, R.F., Potter, G., Corgan, J.M., 1992. The effects of cleat orientation and
confining pressure on cleat porosity, permeability and relative permeability in coal. In
Proceedings of the SPWLA/SCA Symposium, Oklahoma City, OK, June 15–16, 1992.
Gates, J.I., Lietz, W.T., 1950. Relative permeabilities of California cores by the capillary-
pressure method. Drilling and Production Practice.
Gerami, A., Mostaghimi, P., Armstrong, R.T., Zamani, A., Warkiani, M.E., 2016. A
microfluidic framework for studying relative permeability in coal. International Journal of Coal
Geology 159, 183-193.
Gilliland, R.E., Maloney, D.R., 1994. Apparatus and method for measuring relative
permeability and capillary pressure of porous rock. Google Patents.
Giraldo, J., Benjumea, P., Lopera, S., Cortes, F.B., Ruiz, M.A., 2013. Wettability alteration of
sandstone cores by alumina-based nanofluids. Energy and Fuels 27, 3659-3665.
Goldmann, M., Davidovits, J., Silberzan, P., 1998. Kinetics of self-assembled silane
monolayers at various temperatures: evidence of 2d foam. Thin Solid Films 327, 166-171.
Good, R.J., 1992. Contact-angle, wetting, and adhesion - a critical-review. J Adhes Sci Technol
6, 1269-1302.
Gosiewska, A., Drelich, J., Laskowski, J., Pawlik, M., 2002a. Mineral matter distribution on
coal surface and its effect on coal wettability. Journal of Colloid and Interface Science 247,
107-116.
Gosiewska, A., Drelich, J., Laskowski, J.S., Pawlik, M., 2002b. Mineral matter distribution on
coal surface and its effect on coal wettability. Journal of Colloid and Interface Science 247,
107-116.

158
Gray, I., 1987. Reservoir engineering in coal seams: Part 1-the physical process of gas storage
and movement in coal seams. SPE Reservoir Engineering 2, 28-34.
Gu, F., Chalaturnyk, R., 2010. Permeability and porosity models considering anisotropy and
discontinuity of coalbeds and application in coupled simulation. Journal of Petroleum Science
and Engineering 74, 113-131.
Guedes, A., Valentim, B., Prieto, A., Rodrigues, S., Noronha, F., 2010. Micro-raman
spectroscopy of collotelinite, fusinite and macrinite. International Journal of Coal Geology 83,
415-422.
Guo, Y.T., Bustin, R.M., 1998. Micro-FTIR spectroscopy of liptinite macerals in coal.
International Journal of Coal Geology 36, 259-275.
Gutierrez-Rodriguez, J.A., Purcell Jr, R.J., Aplan, F.F., 1984. Estimating the hydrophobicity
of coal. Colloids and Surfaces 12, 1-25.
Hagoort, J., 1980. Oil recovery by gravity drainage. Soc Petrol Eng J 20, 139-150.
Ham, Y., Kantzas, A., 2008. Measurement of relative permeability of coal: approaches and
limitations, CIPC/SPE Gas Technology Symposium 2008 Joint Conference. Society of
Petroleum Engineers.
Ham, Y.S., Kantzas, A., 2011. Relative Permeability of Coal to Gas (Helium, Methane, and
Carbon dioxide) and Water - Results and Experimental Limitations Canadian Unconventional
Resources Conference. Society of Petroleum Engineers, Calgary, Alberta, Canada.
Hamawand, I., Yusaf, T., Hamawand, S.G., 2013. Coal seam gas and associated water: a review
paper. Renewable and Sustainable Energy Reviews 22, 550-560.
Han, F., Busch, A., Krooss, B.M., Liu, Z., van Wageningen, N., Yang, J., 2010. Experimental
study on fluid transport processes in the cleat and matrix systems of coal. Energy and Fuels 24,
6653-6661.
Hanning, R., Rutter, P., 1989. A simple method of determining contact angles on particles and
their relevance to flotation. Int J Miner Process 27, 133-146.
He, Y.B., Laskowski, J.S., 1992. Contact angle measurements on discs compressed from fine
coal. Coal Preparation 10, 19-36.
Hendraningrat, L., Li, S., Torsæter, O., 2013. A coreflood investigation of nanofluid enhanced
oil recovery. Journal of Petroleum Science and Engineering 111, 128-138.
Hodek, W., Kirschstein, J., van Heek, K.-H., 1991. Reactions of oxygen containing structures
in coal pyrolysis. Fuel 70, 424-428.
Hower, J.C., Davis, A., 1981. Vitrinite reflectance anisotropy as a tectonic fabric element.
Geology 9, 165-168.
Ishino, C., Okumura, K., 2008. Wetting transitions on textured hydrophilic surfaces. The
European Physical Journal E: Soft Matter and Biological Physics 25, 415-424.
Jerauld, G.R., Salter, S.J., 1990. The Effect of Pore-Structure on Hysteresis in Relative
Permeability and Capillary-Pressure - Pore-Level Modeling. Transport in Porous Media 5, 103-
151.
Johnson, E., Bossler, D., Bossler, V., 1959. Calculation of relative permeability from
displacement experiments.

159
Jones, A., Bush, D., Kelkar, S., Ahmed, U., Bell, G., 1985. Performance forecasting and
economic evaluation of a deeply buried coalbed methane reservoir in the San Juan Basin, SPE
Annual Technical Conference and Exhibition. Society of Petroleum Engineers.
Jones, S., Roszelle, W., 1978. Graphical techniques for determining relative permeability from
displacement experiments. J Petrol Technol 30, 807-817.
Karacan, C.O., Okandan, E., 2000. Fracture/cleat analysis of coals from Zonguldak Basin
(northwestern Turkey) relative to the potential of coalbed methane production. International
Journal of Coal Geology 44, 109-125.
Karimi, A., Fakhroueian, Z., Bahramian, A., Pour Khiabani, N., Darabad, J.B., Azin, R., Arya,
S., 2012. Wettability alteration in carbonates using zirconium oxide nanofluids: EOR
implications. Energy & Fuels 26, 1028-1036.
Kaveh, N.S., Rudolph, E.S.J., Wolf, K.H.A.A., Ashrafizadeh, S.N., 2011. Wettability
determination by contact angle measurements: Hvbb coal-water system with injection of
synthetic flue gas and co2. Journal of colloid and interface science 364, 237-247.
Kaveh, N.S., Wolf, K., Ashrafizadeh, S., Rudolph, E., 2012. Effect of coal petrology and
pressure on wetting properties of wet coal for CO 2 and flue gas storage. Int J Greenh Gas Con
11, S91-S101.
Kelemen, S., Fang, H., 2001. Maturity trends in raman spectra from kerogen and coal. Energy
& fuels 15, 653-658.
Kelemen, S., George, G., Gorbaty, M., 1990. Direct determination and quantification of
sulphur forms in heavy petroleum and coals: 1. The X-ray photoelectron spectroscopy (XPS)
approach. Fuel 69, 939-944.
Keller, D.V., 1987. The Contact-Angle of Water on Coal. Colloids and Surfaces 22, 21-35.
Kilau, H.W., Pahlman, J.E., 1987. Coal wetting ability of surfactant solutions and the effect of
multivalent anion additions. Colloids and Surfaces 26, 217-242.
Kim, A.G., 1977. Estimating methane content of bituminous coalbeds from adsorption data.
Department of the Interior, Bureau of Mines.
King, G.R., Ertekin, Turgay, Schwerer, Fred C., 1986. Numerical Simulation of the Transient
Behavior of Coal-Seam Degasification Wells SPE Formation Evaluation 1, 165-183.
Krooss, B.M., van Bergen, F., Gensterblum, Y., Siemons, N., Pagnier, H.J.M., David, P., 2002.
High-pressure methane and carbon dioxide adsorption on dry and moisture-equilibrated
Pennsylvanian coals. International Journal of Coal Geology 51, 69-92.
Kumar, H., Lester, E., Kingman, S., Bourne, R., Avila, C., Jones, A., Robinson, J., Halleck,
P.M., Mathews, J.P., 2011. Inducing fractures and increasing cleat apertures in a bituminous
coal under isotropic stress via application of microwave energy. International Journal of Coal
Geology 88, 75-82.
Kumar, R., Rundwal, V., Das, T., 1998. Identification of Coal Cleats/Fractures Using 2D and
3D Imaging Computed, SPE India Oil and Gas Conference and Exhibition.
Lamberson, M.N., Bustin, R.M., 1993. Coalbed Methane Characteristics of Gates Formation
Coals, Northeastern British-Columbia - Effect of Maceral Composition. Aapg Bulletin-
American Association of Petroleum Geologists 77, 2062-2076.
Laskowski, J., 2001. Coal Flotation and Fine Coal Utilization. Elsevier Science.

160
Laubach, S.E., Marrett, R.A., Olson, J.E., Scott, A.R., 1998. Characteristics and origins of coal
cleat: A review. International Journal of Coal Geology 35, 175-207.
Law, B., 1993. The relationship between coal rank and cleat spacing: implications for the
prediction of permeability in coal, Proceedings of the 1993 International Coalbed Methane
Symposium. Twscaloosa, ALabma: University of ALabama.
Laxminarayana, C., Crosdale, P.J., 1999. Role of coal type and rank on methane sorption
characteristics of Bowen Basin, Australia coals. International Journal of Coal Geology 40, 309-
325.
Lee, C.Y., Lee, S.Y., 2008. Influence of surface wettability on transition of two-phase flow
pattern in round mini-channels. International Journal of Multiphase Flow 34, 706-711.
Levine, J.R., 1993. Coalification: The Evolution of Coal as Source Rock and Reservoir Rock
for Oil and Gas: Chapter 3.
Levine, J.R., 1996. Model study of the influence of matrix shrinkage on absolute permeability
of coal bed reservoirs. Geological Society, London, Special Publications 109, 197-212.
Li, C.-Z., 2007. Some recent advances in the understanding of the pyrolysis and gasification
behaviour of Victorian brown coal. Fuel 86, 1664-1683.
Li, Q.Z., Lin, B.Q., Zhao, S., Dai, H.M., 2013. Surface physical properties and its effects on
the wetting behaviors of respirable coal mine dust. Powder Technol 233, 137-145.
Lindqvist, L., 1960. A flash photolysis study of fluorescein. Almqvist & Wiksell.
Liu, F.-J., Wei, X.-Y., Zhu, Y., Wang, Y.-G., Li, P., Fan, X., Zhao, Y.-P., Zong, Z.-M., Zhao,
W., Wei, Y.-B., 2013. Oxidation of Shengli lignite with aqueous sodium hypochlorite
promoted by pretreatment with aqueous hydrogen peroxide. Fuel 111, 211-215.
Liu, J.S., Chen, Z.W., Elsworth, D., Miao, X.X., Mao, X.B., 2010. Linking gas-sorption
induced changes in coal permeability to directional strains through a modulus reduction ratio.
International Journal of Coal Geology 83, 21-30.
Liu, Z.-X., Liu, Z.-C., Zong, Z.-M., Wei, X.-Y., Wang, J., Lee, C.W., 2003. GC/MS analysis
of water-soluble products from the mild oxidation of Longkou brown coal with H2O2. Energy
& Fuels 17, 424-426.
Lomeland, F., Ebeltoft, E., Thomas, W.H., 2005. A new versatile relative permeability
correlation, Reviewed Proceedings of the 2005 International Symposium of the SCA, Abu
Dhabi, United Arab Emirates, Oct, p. 32.
Machnikowska, H., Krztoń, A., Machnikowski, J., 2002. The characterization of coal macerals
by diffuse reflectance infrared spectroscopy. Fuel 81, 245-252.
Maghzi, A., Mohebbi, A., Kharrat, R., Ghazanfari, M.H., 2011. Pore-scale monitoring of
wettability alteration by silica nanoparticles during polymer flooding to heavy oil in a five-spot
glass micromodel. Transport in porous media 87, 653-664.
Mahoney, S.A., Rufford, T.E., Rudolph, V., Liu, K.-Y., Rodrigues, S., Steel, K.M., 2015.
Creation of microchannels in Bowen Basin coals using UV laser and reactive ion etching. Int
J Coal Geol 144, 48-57.
Maidment, D.R., 1993. Handbook of hydrology. McGraw-Hill.

161
Mandal, D., Tewari, D., Rautela, M., 2004. Analysis of micro-fractures in coal for the coal bed
methane exploitation in Jharia Coal field, Abstract 5th conference and exposition on petroleum
geophysics, Hyderabad-2004, India, pp. 904-909.
Marmur, A., 2003. Wetting on hydrophobic rough surfaces: to be heterogeneous or not to be?
Langmuir 19, 8343-8348.
Mavor, M., Owen, L., Pratt, T., 1990. Measurement and evaluation of coal sorption isotherm
data, SPE Annual Technical Conference and Exhibition. Society of Petroleum Engineers.
Mavor, M.J., Gunter, W.D., 2006. Secondary porosity and permeability of coal vs. gas
composition and pressure. Spe Reservoir Evaluation & Engineering 9, 114-125.
Mazumder, S., Wolf, K.H.A.A., Elewaut, K., Ephraim, R., 2006. Application of x-ray
computed tomography for analyzing cleat spacing and cleat aperture in coal samples.
International Journal of Coal Geology 68, 205-222.
McCartney, J.T., Teichmüller, M., 1972. Classification of coals according to degree of
coalification by reflectance of the vitrinite component. Fuel 51, 64-68.
Meaney, K., Paterson, L., 1996. Relative permeability in coal, SPE Asia Pacific Oil and Gas
Conference, pp. 231-236.
Mercer, J.W., Cohen, R.M., 1990. A review of immiscible fluids in the subsurface: properties,
models, characterization and remediation. Journal of Contaminant Hydrology 6, 107-163.
Mishra, S., Senapati, P., Panda, D., 2002. Rheological behavior of coal-water slurry. Energ
Source 24, 159-167.
Moore, T.A., 2012. Coalbed methane: A review. International Journal of Coal Geology 101,
36-81.
Mosher, K., He, J., Liu, Y., Rupp, E., Wilcox, J., 2013. Molecular simulation of methane
adsorption in micro- and mesoporous carbons with applications to coal and gas shale systems.
International Journal of Coal Geology 109–110, 36-44.
Moustafa, E.-A., Noah, A., Beshay, K., Sultan, L., Essam, M., Nouh, O., 2015. Investigating
the Effect of Various Nanomaterials on the Wettability of Sandstone Reservoir. World Journal
of Engineering and Technology 3, 116.
Murata, T., 1981. Wettability of coal estimated from the contact angle. Fuel 60, 744-746.
Murata, T., Naka, A., 1983. A modified penetration rate method for measuring the wettability
of coal powders. Yukagaku 32, 498-502.
Naik, S., You, Z., Bedrikovetsky, P., 2015. Effect of Wettability Alteration on Productivity
Enhancement in Unconventional Gas Reservoirs: Application of Nanotechnology, SPE Asia
Pacific Unconventional Resources Conference and Exhibition. Society of Petroleum
Engineers.
Nakagawa, T., Komaki, I., Sakawa, M., Nishikawa, K., 2000. Small angle X-ray scattering
study on change of fractal property of Witbank coal with heat treatment. Fuel 79, 1341-1346.
Nečas, D., Klapetek, P., 2012. Gwyddion: an open-source software for SPM data analysis.
Open Physics 10, 181-188.
Newsham, K., Rushing, J., Lasswell, P., Cox, J., Blasingame, T., 2004. A comparative study
of laboratory techniques for measuring capillary pressures in tight gas sands, SPE Annual
Technical Conference and Exhibition. Society of Petroleum Engineers.

162
Nguyen, A.V., Ralston, J., Schulze, H.J., 1998. On modelling of bubble–particle attachment
probability in flotation. Int J Miner Process 53, 225-249.
Nilsson, M.A., Kulkarni, R., Gerberich, L., Hammond, R., Singh, R., Baumhoff, E., Rothstein,
J.P., 2013. Effect of fluid rheology on enhanced oil recovery in a microfluidic sandstone device.
Journal of Non-Newtonian Fluid Mechanics 202, 112-119.
Nishiyama, N., Yokoyama, T., 2013. Does the reactive surface area of sandstone depend on
water saturation?—The role of reactive-transport in water film. Geochim Cosmochim Ac 122,
153-169.
Nishiyama, N., Yokoyama, T., Takeuchi, S., 2012. Size distributions of pore water and
entrapped air during drying‐infiltration processes of sandstone characterized by water‐expulsion porosimetry. Water Resour Res 48.
Ofori, P., Firth, B., O'Brien, G., McNally, C., Nguyen, A.V., 2010a. Assessing the
Hydrophobicity of Petrographically Heterogeneous Coal Surfaces. Energy & Fuels 24, 5965-
5971.
Ofori, P., Firth, B., O’Brien, G., McNally, C., Nguyen, A.V., 2010b. Assessing the
hydrophobicity of petrographically heterogeneous coal surfaces. Energy & Fuels 24, 5965-
5971.
Ogolo, N., Olafuyi, O., Onyekonwu, M., 2012. Enhanced oil recovery using nanoparticles, SPE
Saudi Arabia Section Technical Symposium and Exhibition. Society of Petroleum Engineers.
Orumwense, F.F.O., 2001. Wettability of coal - a comparative study. Scand J Metall 30, 204-
211.
Painter, P.C., Coleman, M.M., Jenkins, R.G., Whang, P.W., Walker, P.L., 1978. Fourier
transform infrared study of mineral matter in coal. A novel method for quantitative
mineralogical analysis. Fuel 57, 337-344.
Palmer, I., 2009. Permeability changes in coal: Analytical modeling. International Journal of
Coal Geology 77, 119-126.
Pan, Z.J., Connell, L.D., 2012. Modelling permeability for coal reservoirs: A review of
analytical models and testing data. International Journal of Coal Geology 92, 1-44.
Pan, Z.J., Connell, L.D., Camilleri, M., 2010. Laboratory characterisation of coal reservoir
permeability for primary and enhanced coalbed methane recovery. International Journal of
Coal Geology 82, 252-261.
Pavlović, Ž., Risović, D., Novaković, D., 2012. Comparative study of direct and indirect
image‐based profilometry in characterization of surface roughness. Surface and interface
analysis 44, 825-830.
Permana, A.K., 2012. 3-D Imaging of Cleat and Micro-cleat Characteristics, South Walker
Creek Coals, Bowen Basin, Australia: Microfocus X-ray Computed Tomography Analysis.
Indonesian Journal of Geology 7.
Perry, D.L., Grint, A., 1983. Application of XPS to coal characterization. Fuel 62, 1024-1033.
Phillips, S., Bustin, R.M., 1998. Accumulation of organic rich sediments in a dendritic fluvial
lacustrine mire system at Tasik Bera, Malaysia: implications for coal formation. International
Journal of Coal Geology 36, 31-61.
Polat, M., Polat, H., Chander, S., 2003. Physical and chemical interactions in coal flotation. Int
J Miner Process 72, 199-213.

163
Purcell, W., 1949. Capillary pressures-their measurement using mercury and the calculation of
permeability therefrom. J Petrol Technol 1, 39-48.
Puri, R., Seidle, J.P., 1992. Measurement of Stress-Dependent Permeability in Coal and Its
Influence on Coalbed Methane Production. In Situ 16, 183-202.
Purl, R., Evanoff, J., Brugler, M., 1991. Measurement of coal cleat porosity and relative
permeability characteristics, SPE Gas Technology Symposium. Society of Petroleum
Engineers.
Quirico, E., Rouzaud, J.-N., Bonal, L., Montagnac, G., 2005. Maturation grade of coals as
revealed by raman spectroscopy: Progress and problems. Spectrochimica Acta Part A:
Molecular and Biomolecular Spectroscopy 61, 2368-2377.
Rahman, K., Khaksar, A., 2007. Implications of geomechanical analysis on the success of
hydraulic fracturing: lesson learned from an Australian coalbed methane gas field, SPE
Hydraulic Fracturing Technology Conference. Society of Petroleum Engineers.
Ralston, J., Fornasiero, D., Hayes, R., 1999. Bubble–particle attachment and detachment in
flotation. Int J Miner Process 56, 133-164.
Ramesh, R., Somasundaran, P., 1990. Centrifugal Immersion Technique for Characterizing the
Wettability of Coal Particles. Journal of colloid and interface science 139, 291-294.
Rentel, K., 1987. The combined maceral-microlithotype analysis for the characterization of
reactive inertinites. International journal of coal geology 9, 77-86.
Rhoads, C.A., Senftle, J.T., Coleman, M.M., Davis, A., Painter, P.C., 1983. Further studies of
coal oxidation. Fuel 62, 1387-1392.
Riddick, T.M., 1968. Control of colloid stability through zeta potential. Blood 10.
Rodrigues, C., Laiginhas, C., Fernandes, M., De Sousa, M.L., Dinis, M., 2014. The coal cleat
system: A new approach to its study. Journal of Rock Mechanics and Geotechnical Engineering
6, 208-218.
Rodrigues, C.F., de Sousa, M.J.L., 2002. The measurement of coal porosity with different
gases. International Journal of Coal Geology 48, 245-251.
Rosenbaum, J., Fuerstenau, D., 1984. On the variation of contact angles with coal rank. Int J
Miner Process 12, 313-316.
Roustaei, A., Moghadasi, J., Bagherzadeh, H., Shahrabadi, A., 2012. An experimental
investigation of polysilicon nanoparticles' recovery efficiencies through changes in interfacial
tension and wettability alteration, SPE International Oilfield Nanotechnology Conference and
Exhibition. Society of Petroleum Engineers.
Sadler, L., Chang, C., 1988. Chemical enhancement of coal seam permeability. In Situ 12, 1-
14.
Saghafi, A., Javanmard, H., Pinetown, K., 2014. Study of coal gas wettability for co2 storage
and ch4 recovery. Geofluids 14, 310-325.
Sakurovs, R., Lavrencic, S., 2011. Contact angles in co2-water-coal systems at elevated
pressures. International Journal of Coal Geology 87, 26-32.
Scaroni, A.W., Kim, S.T., Fatemibadi, M., 1988. Effect of maceral composition and vitrinite
reflectance on the combustion behavior of 6 hva bituminous coals. In Prepr. Pap., Am. Chem.
Soc., Div. Fuel Chem.; (United States). Vol. 33:4. United States.

164
Sefiane, K., Skilling, J., MacGillivray, J., 2008. Contact line motion and dynamic wetting of
nanofluid solutions. Advances in colloid and interface science 138, 101-120.
Senel, I.G., Guruz, A., Yucel, H., 2001. Characterization of pore structure of Turkish coals.
Energy & Fuels 15, 331-338.
Sharma, D.K., Gihar, S., 1991. Chemical Cleaning of Low-Grade Coals through Alkali-Acid
Leaching Employing Mild Conditions under Ambient Pressure. Fuel 70, 663-665.
Shen, J., Qin, Y., Wang, G.X., Fu, X.H., Wei, C.T., Lei, B., 2011. Relative permeabilities of
gas and water for different rank coals. International Journal of Coal Geology 86, 266-275.
Sheng, C., 2007. Char structure characterised by raman spectroscopy and its correlations with
combustion reactivity. Fuel 86, 2316-2324.
Shi, J.-Q., Durucan, S., 2005. Gas Storage and Flow in Coalbed Reservoirs: Implementation of
a Bidisperse Pore Model for Gas Diffusion in Coal Matrix. SPE Reservoir Evaluation &
Engineering 8, 169-175.
Siemons, N., Bruining, H., Castelijns, H., Wolf, K.H., 2006. Pressure dependence of the contact
angle in a co2-h2o-coal system. Journal of colloid and interface science 297, 755-761.
Smith, D.M., Williams, F.L., 1984. Diffusion-Models for Gas-Production from Coals -
Application to Methane Content Determination. Fuel 63, 251-255.
Smith, S., Pretorius, W., 2002. The conservative behaviour of fluorescein. Water SA 28, 403-
406.
Solano-Acosta, W., Mastalerz, M., Schimmelmann, A., 2007. Cleats and their relation to
geologic lineaments and coalbed methane potential in pennsylvanian coals in indiana.
International Journal of Coal Geology 72, 187-208.
Somasundaran, P., Roberts, C., Ramesh, R., 1991. Effects of oxidizing methods on the flotation
of coal. Miner Eng 4, 43-48.
Sorokina, N., Khaskov, M., Avdeev, V., Nikol’Skaya, I., 2005. Reaction of graphite with
sulfuric acid in the presence of kmno4. Russian journal of general chemistry 75, 162-168.
Speight, J.G., 1994. The Chemistry and Technology of Coal. M. Dekker.
Stalder, A., Kulik, G., Sage, D., Barbieri, L., Hoffmann, P., 2006. A snake-based approach to
accurate determination of both contact points and contact angles. Colloids and surfaces A:
physicochemical and engineering aspects 286, 92-103.
Su, X.B., Feng, Y.L., Chen, J.F., Pan, J.N., 2001. The characteristics and origins of cleat in
coal from Western North China. International Journal of Coal Geology 47, 51-62.
Suleimanov, B., Ismailov, F., Veliyev, E., 2011. Nanofluid for enhanced oil recovery. Journal
of Petroleum Science and Engineering 78, 431-437.
Susana, L., Campaci, F., Santomaso, A.C., 2012. Wettability of mineral and metallic powders:
applicability and limitations of sessile drop method and Washburn's technique. Powder
Technol 226, 68-77.
Swain, P.S., Lipowsky, R., 1998. Contact angles on heterogeneous surfaces: A new look at
Cassie's and Wenzel's laws. Langmuir 14, 6772-6780.
Tampy, G.K., Chen, W.J., Prudich, M.E., Savage, R.L., 1988. Wettability Measurements of
Coal Using a Modified Washburn Technique. Energy & Fuels 2, 782-786.

165
Tao, S., Wang, Y.B., Tang, D.Z., Xu, H., Lv, Y.M., He, W., Li, Y., 2012. Dynamic variation
effects of coal permeability during the coalbed methane development process in the Qinshui
Basin, China. International Journal of Coal Geology 93, 16-22.
Teng, T., Wang, J., Gao, F., Ju, Y., Xia, T., 2016. Impact of Water Film Evaporation on Gas
Transport Property in Fractured Wet Coal Seams. Transport in Porous Media 113, 357-382.
Tokunaga, T.K., 2011. Physicochemical controls on adsorbed water film thickness in
unsaturated geological media. Water Resour Res 47.
Tokunaga, T.K., 2012. DLVO-based estimates of adsorbed water film thicknesses in geologic
CO2 reservoirs. Langmuir 28, 8001-8009.
Triplett, K., Ghiaasiaan, S., Abdel-Khalik, S., Sadowski, D., 1999. Gas–liquid two-phase flow
in microchannels Part I: two-phase flow patterns. International Journal of Multiphase Flow 25,
377-394.
Truong, V.K., Lapovok, R., Estrin, Y.S., Rundell, S., Wang, J.Y., Fluke, C.J., Crawford, R.J.,
Ivanova, E.P., 2010. The influence of nano-scale surface roughness on bacterial adhesion to
ultrafine-grained titanium. Biomaterials 31, 3674-3683.
Ulyanova, E.V., Molchanov, A.N., Prokhorov, I.Y., Grinyov, V.G., 2014. Fine structure of
raman spectra in coals of different rank. International Journal of Coal Geology 121, 37-43.
Unsworth, J.F., Fowler, C.S., Jones, L.F., 1989. Moisture in Coal .2. Maceral Effects on Pore
Structure. Fuel 68, 18-26.
Vafaei, S., Borca-Tasciuc, T., Podowski, M., Purkayastha, A., Ramanath, G., Ajayan, P., 2006.
Effect of nanoparticles on sessile droplet contact angle. Nanotechnology 17, 2523.
Van Niekerk, D., Pugmire, R.J., Solum, M.S., Painter, P.C., Mathews, J.P., 2008. Structural
characterization of vitrinite-rich and inertinite-rich Permian-aged South African bituminous
coals. International Journal of Coal Geology 76, 290-300.
Vasilakos, N., Clinton, C., 1983. Chemical coal beneficiation with aqueous hydrogen
peroxide/sulfuric acid solutions. Prepr. Pap., Am. Chem. Soc., Div. Fuel Chem.;(United States)
28.
Walls, J.M., Smith, R., 1994. Surface Science Techniques. Pergamon Press.
Wang, F., Zhu, Z., Massarotto, P., Rudolph, V., 2007. Mass transfer in coal seams for co2
sequestration. AIChE journal 53, 1028-1049.
Wang, G.G.X., Zhang, X., Wei, X., Fu, X., Jiang, B., Qin, Y., 2011a. A review on transport of
coal seam gas and its impact on coalbed methane recovery. Frontiers of Chemical Science and
Engineering 5, 139-161.
Wang, J., Kabir, A., Liu, J., Chen, Z., 2012. Effects of non-Darcy flow on the performance of
coal seam gas wells. International Journal of Coal Geology 93, 62-74.
Wang, S., Cheng, H., Jiang, D., Huang, F., Su, S., Bai, H., 2014. Raman spectroscopy of coal
component of late permian coals from southern china. Spectrochimica Acta Part A: Molecular
and Biomolecular Spectroscopy 132, 767-770.
Wang, S., Elsworth, D., Liu, J., 2011b. Permeability evolution in fractured coal: The roles of
fracture geometry and water-content. International Journal of Coal Geology 87, 13-25.
Ward, C.R., 1974. Isolation of mineral matter from Australian bituminous coals using hydrogen
peroxide. Fuel 53, 220-221.

166
Ward, C.R., 2002. Analysis and significance of mineral matter in coal seams. International
Journal of Coal Geology 50, 135-168.
Wasan, D.T., Nikolov, A.D., 2003. Spreading of nanofluids on solids. Nature 423, 156-159.
Wei, X.R., Wang, G.X., Massarotto, P., Golding, S.D., Rudolph, V., 2007. A review on recent
advances in the numerical simulation for coalbed-methane-recovery process. SPE Reservoir
Evaluation & Engineering 10, 657-666.
Welge, H.J., 1952. A simplified method for computing oil recovery by gas or water drive. J
Petrol Technol 4, 91-98.
Wenzel, R.N., 1949. Surface Roughness and Contact Angle. The Journal of Physical Chemistry
53, 1466-1467.
Whitehouse, D.J., 2004. Surfaces and their Measurement. Elsevier.
Willem-Jan Plug, S., Saikat Mazumder, S., Johannes Bruining, S., 2008. Capillary pressure
and wettability behavior of CO2 sequestration in coal at elevated pressures.
Wong, P.C.Y., Kwon, Y.-N., Criddle, C.S., 2009. Use of atomic force microscopy and fractal
geometry to characterize the roughness of nano-, micro-, and ultrafiltration membranes. Journal
of Membrane Science 340, 117-132.
Xu, M., Dehghanpour, H., 2014. Advances in understanding wettability of gas shales. Energy
& Fuels 28, 4362-4375.
Yao, Y., Liu, D., 2012. Comparison of low-field NMR and mercury intrusion porosimetry in
characterizing pore size distributions of coals. Fuel 95, 152-158.
Young, G., McElhiney, J., Paul, G., McBane, R., 1991. An analysis of Fruitland coalbed
methane production, Cedar Hill field, northern San Juan Basin, SPE Annual Technical
Conference and Exhibition. Society of Petroleum Engineers.
Young, T., 1805. An essay on the cohesion of fluids. Philosophical Transactions of the Royal
Society of London 95, 65-87.
Yu, J., Jiang, Y., Tahmasebi, A., Han, Y., Li, X., Lucas, J., Wall, T., 2014. Coal oxidation
under mild conditions: current status and applications. Chemical Engineering & Technology
37, 1635-1644.
Yuan, Y., Lee, T.R., 2013. Contact angle and wetting properties, Surface science techniques.
Springer, pp. 3-34.
Zhang, H., Nikolov, A., Wasan, D., 2014. Enhanced oil recovery (EOR) using nanoparticle
dispersions: Underlying mechanism and imbibition experiments. Energy & Fuels 28, 3002-
3009.
Zumdahl, S.S., 2003. a Susan A. Zumdahl. Chemistry. Boston: Houghton Mifflin Company.
167
Appendix A
A1 Keller Equation
The contact angle of water on a pure mixture of paraffinic (P) and aromatic hydrocarbons (α)
The contact angle of water on a mixture of pure hydrocarbons and oxygen containing
hydrocarbon molecules.
The contact angle of water on an organic molecular surface containing areas where the pores
intersect with the surface.
The contact angle of water on a porous organic surface such as coal.
Contact angle of water on aromatic hydrocarbons.
Contact angle of water on paraffinic hydrocarbons.
Contact angle of water on oxygen polar functional sites.
Contact angle of water on pore areas (water filled)
Contact angle of water on mineral matter
cos(𝐶′′′) = 𝐴 cos(𝛼) + (1 − 𝐴) cos (𝑃) 1
cos(𝐶′′) = 𝑜′ cos(𝑜) + (1 − 𝑜) cos (𝐶′′′) 2
cos(𝐶′) = 𝑝′ cos(𝑝) + (1 − 𝑝′) cos (𝐶′′) 3
cos(𝐶) = 𝑓 cos(𝑓′) + (1 − 𝑓) cos (𝐶′) 4
cos(α) = cos 88˚ = 0.035 5
cos(P) = cos 110˚ = -0.342 6
cos(o) = 1 7
cos(p) = 1 8
cos(f’) = 1 9

168
Fraction of surface area due to aromatic molecules
1/3 of the weight fraction of molecular oxygen plus absorbed oxygen
The fraction of the surface that is pore area
C% - dmmf% of carbon in coal: variable 10
A = 0.02C% + 1.04 11
o’ = (-2.6x10⁻³ C% - 0.224) + h 12
h = fraction of surface oxidised by air 13
p’ = 2.642x10⁻³ C%2 – 0.4689C% + 20.818 14
f = fraction of surface due to mineral matter: variable 15
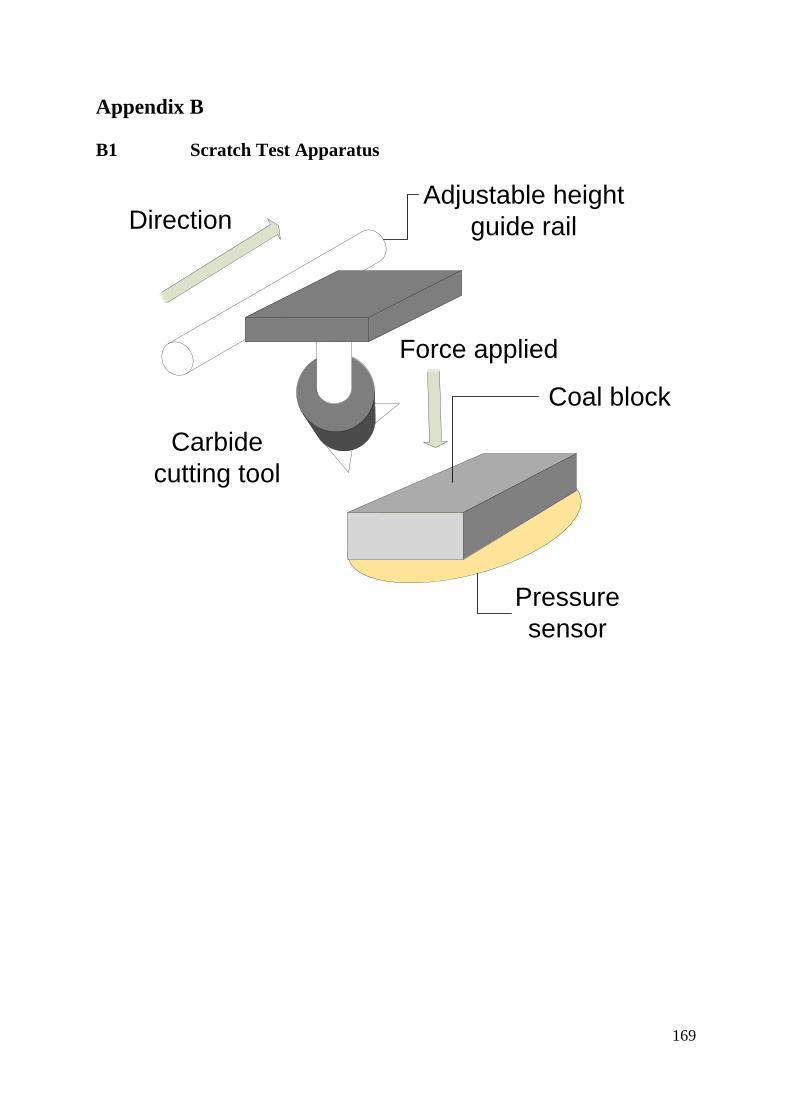
169
Appendix B
B1 Scratch Test Apparatus
Carbide
cutting tool
Coal block
Pressure
sensor
Adjustable height
guide railDirection
Force applied

170
B2 Table of average values from micro-Raman analysis of RIE and UV Laser samples
Samples RIE w-G (cm-1) w-G St
Dev
FHWM -
G
FWHM - G St
Dev
w-D (cm-1) w-D
StDev
FWHM-D FWHM - D
StDev
IPN-P-U 1602.10212 0.4093263 59.811447 1.18582248 1372.65195 1.1823521 166.0186317 10.13883501
IPN-R-Ch 1602.380417 0.514525 60.448336 1.405743 1371.80219 2.6167361 174.592211 5.184803154
IPN-R-V 1602.58076 0.2472425 60.278912 1.631145859 1371.39337 1.4331084 175.8148983 4.068809721
OAK-P-U 1602.6203 0.2608307 56.745958 1.295782337 1369.98716 1.3706581 166.9170683 4.700864861
OAK-R-Ch 1603.160304 0.956815 53.416267 3.298716 1367.820591 1.174221 160.394537 4.160899
OAK-R-V 1602.789217 0.756938 55.287150 1.364490 1369.000577 2.466764 164.936227 11.239193
MVL-P-U 1603.41192 0.239674 54.208768 0.755843723 1369.82546 1.4488617 168.3684667 3.049537802
MVL-R-Ch 1603.466058 0.270832 55.528407 0.988386 1370.675647 1.200839 165.700375 4.407148
MVL-R-V 1603.396156 0.326120 54.960772 1.482768 1367.814055 0.649691 171.369131 5.202616
COPS-P-U 1604.51781 0.0893635 48.39578 0.637489685 1367.12494 0.8971917 159.7094267 5.012925097
COPS-R-Ch 1604.24316 0.1212615 49.343285 0.439247475 1367.78383 1.4941943 164.9865 4.185805697
COPS-R-V 1604.33273 0.2745684 50.408085 0.73884875 1366.89048 1.7868686 168.11428 2.315353576
COPE-P-U 1604.59007 0.3484465 48.822267 1.607966376 1367.4556 1.7462979 157.8487 6.100199469
COPE-R-Ch 1604.462310 0.367229 48.668365 1.391607 1367.073150 0.948244 160.552755 8.780350
COPE-R-V 1604.682692 0.315621 47.086028 0.485284 1367.112597 0.519721 160.658997 2.539638
Laser
IPN-L-Ch 1602.7456 0.301955 61.477432 1.085256586 1374.84055 4.6077842 175.2624528 12.42015167
IPN-L-V 1602.69721 0.1743777 59.387442 0.854690678 1373.06439 4.8073721 182.6288844 11.30027813

171
Appendix C
C1 Sessile drop apparatus
172
C2 SEM image standardisation using Gwyddion v2.45
Since electron density is concentrated on pointed or sharp features in SEM, and that the change
in light intensity was a feature that the Gwyddion software uses to discern changes in height,
it was important to prepare each image using a consistent procedure to remove shadows as well
as minimise light fluctuations thus standardising each image to ensure that comparable
roughness values could be calculated.
The following methodology was applied to SEM images of samples using Gwyddion software
features: (1) the surface elevation data was levelled by mean plane subtraction, 2) the image
data was automatically levelled to make facets point upwards, 3) image rows were aligned by
matching method, 4) horizontal strokes were corrected, 5) the area of interest was cropped, 6)
the cropped region was reproduced in 3D and the surface roughness calculated. The technique
to measure roughness using SEM images is similar to what has previously been reported in
studies that have examined roughness using AFM and SEM images (Fashina et al., 2016;
Pavlović et al., 2012; Truong et al., 2010; Wong et al., 2009).
C3 Modified RIE channel procedure:
Several modifications were made to the etching processes that was previously published in
Mahoney et al. (2015). 1) Prior to the application of the AZ2070 layer, all samples were placed
in a vacuum oven at 40°C for 48 hours. This reduced the frequency and size of gas bubbles
expelled from cleats and surface macropore structures in the coal during the initial pre-bake
and post UV bake sessions. 2) Prior to spin coating, the AZ2070 solution was raised to room
temperature and allowed to sit on the sample surface for 30 seconds. 3) The Brewer Science®
CeeTM 200× spin coater speed was reduced from 1200 rpm to 800 rpm and the spin time
increased from 45s to 60s. 4) UV exposure time was increased to 20 seconds. 5) De-scum
power setting reduced from 200W to 150W, while maintaining the previous exposure interval.
These modifications resulted in a greater continuity in the etched channels, as well as a
reduction in channel depth variation and consistent linear wall etching (reduced cavities and
imperfections in cleat wall).
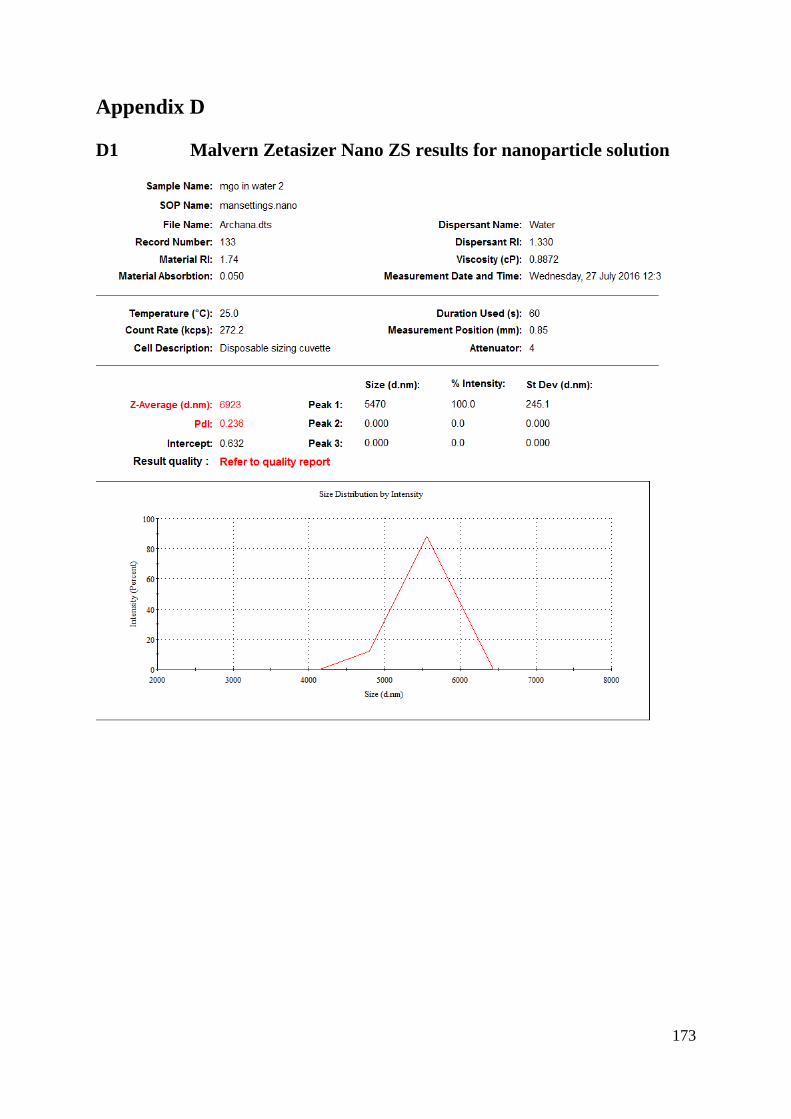
173
Appendix D
D1 Malvern Zetasizer Nano ZS results for nanoparticle solution

174

175

176
D2 Zeta potential results

177

178

179
Appendix E
E1 Table of relative permeability results using PorExpert software
Table 1: Scenario 1 water saturation and capillary pressure measurements calculated from
adopting a hydrophilic surface. Relative permeability curves for wetting phase krw and non-
wetting krg are also detailed.
Sw Sw* log Sw* Pc log Pc krw krg
0.08 0.001086 -2.9643 56.19 1.749659 1.72E-23 9.98E-01
0.09 0.011944 -1.9229 46.05 1.66323 1.71E-15 9.76E-01
0.1 0.022801 -1.642 41.69 1.620032 2.45E-13 9.55E-01
0.13 0.055375 -1.2567 34.17 1.533645 2.23E-10 8.92E-01
0.154 0.081433 -1.0892 30.93 1.49038 4.32E-09 8.44E-01
0.1882 0.118567 -0.926 28 1.447158 7.73E-08 7.77E-01
0.24 0.17481 -0.7574 20 1.30103 1.52E-06 6.81E-01
0.3 0.239957 -0.6199 15 1.176091 1.74E-05 5.77E-01
0.3731 0.319327 -0.4958 10 1 1.56E-04 4.63E-01
0.4377 0.389468 -0.4095 8 0.90309 7.16E-04 3.71E-01
0.4974 0.454289 -0.3427 5.7 0.755875 2.34E-03 2.94E-01
0.5402 0.50076 -0.3004 4.67 0.669317 4.93E-03 2.44E-01
0.5891 0.553855 -0.2566 3.83 0.583199 1.07E-02 1.92E-01
0.6307 0.599023 -0.2226 3.14 0.49693 1.95E-02 1.52E-01
0.6654 0.636699 -0.1961 2.33 0.367356 1.72E-23 9.98E-01
0.7172 0.692942 -0.1593 1.91 0.281033 1.71E-15 9.76E-01
0.7595 0.738871 -0.1314 1.56 0.193125 2.45E-13 9.55E-01
0.7848 0.766341 -0.1156 1.28 0.10721 2.23E-10 8.92E-01
0.8588 0.846688 -0.0723 1.05 0.021189 4.32E-09 8.44E-01
0.8918 0.882519 -0.0543 0.95 -0.02228 7.73E-08 7.77E-01
0.9172 0.910098 -0.0409 0.64 -0.19382 1.52E-06 6.81E-01
0.9417 0.936699 -0.0284 0.12 -0.92082 1.74E-05 5.77E-01
0.9755 0.973398 -0.0117 0.04 -1.39794 1.56E-04 4.63E-01

180
Table 2: Scenario 2 water saturation and capillary pressure measurements calculated from
adopting an intermediate hydrophilic surface. Relative permeability curves for wetting phase
krw and non-wetting krg are also detailed.
Sw Sw* log Sw* Pc log Pc krw krg
7.50E-03 1.01E-04 -4.00E+00 7.62E+00 8.82E-01 1.12E-15 1.00E+00
8.36E-02 7.68E-02 -1.11E+00 5.12E+00 7.09E-01 9.78E-05 8.51E-01
1.88E-01 1.82E-01 -7.40E-01 3.80E+00 5.80E-01 2.60E-03 6.56E-01
2.58E-01 2.52E-01 -5.98E-01 3.44E+00 5.37E-01 8.93E-03 5.33E-01
3.63E-01 3.58E-01 -4.46E-01 2.82E+00 4.50E-01 3.39E-02 3.64E-01
5.10E-01 5.06E-01 -2.96E-01 7.00E-01 -1.55E-01 1.26E-01 1.75E-01
5.89E-01 5.86E-01 -2.32E-01 5.20E-01 -2.84E-01 2.20E-01 1.00E-01
6.65E-01 6.63E-01 -1.79E-01 3.20E-01 -4.95E-01 3.51E-01 4.84E-02
7.85E-01 7.83E-01 -1.06E-01 1.70E-01 -7.70E-01 6.60E-01 5.41E-03
8.92E-01 8.91E-01 -5.01E-02 1.30E-01 -8.86E-01 1.08E+00 -2.82E-03
Table 3: Scenario 3water saturation and capillary pressure measurements calculated from
adopting hydrophobic surface. Relative permeability curves for wetting phase krw and non-
wetting krg are also detailed.
Sg Pc Sg* log Sg* log Pc Sw krw krg
8.3E-02 2.6E+01 7.4E-02 -1.1E+00 1.4E+00 9.2E-01 4.6E-11 8.6E-01
1.7E-01 1.9E+01 1.6E-01 -7.9E-01 1.3E+00 8.3E-01 6.9E-08 7.0E-01
3.0E-01 1.6E+01 2.9E-01 -5.3E-01 1.2E+00 7.0E-01 1.4E-05 5.0E-01
3.4E-01 1.3E+01 3.4E-01 -4.7E-01 1.1E+00 6.6E-01 5.1E-05 4.4E-01
4.9E-01 1.0E+01 4.9E-01 -3.1E-01 1.0E+00 5.1E-01 1.4E-03 2.6E-01
5.8E-01 5.0E+00 5.8E-01 -2.4E-01 7.0E-01 4.2E-01 6.7E-03 1.7E-01
6.9E-01 1.1E+00 6.9E-01 -1.6E-01 4.1E-02 3.1E-01 3.4E-02 8.9E-02
7.9E-01 6.1E-01 7.9E-01 -1.0E-01 -2.1E-01 2.1E-01 1.2E-01 3.6E-02
9.2E-01 3.7E-01 9.2E-01 -3.6E-02 -4.3E-01 7.9E-02 4.7E-01 2.8E-03
9.5E-01 2.7E-01 9.5E-01 -2.4E-02 -5.7E-01 5.2E-02 6.1E-01 8.9E-04
9.6E-01 1.2E-01 9.6E-01 -1.9E-02 -9.2E-01 4.3E-02 6.7E-01 5.1E-04
9.7E-01 2.0E-02 9.7E-01 -1.3E-02 -1.7E+00 3.0E-02 7.5E-01 1.8E-04
9.8E-01 1.0E-02 9.8E-01 -9.1E-03 -2.0E+00 2.1E-02 8.3E-01 6.0E-05