Embed Size (px)
Citation preview
423
http://journals.tubitak.gov.tr/botany/
Turkish Journal of Botany Turk J Bot(2018) 42: 423-439© TÜBİTAKdoi:10.3906/bot-1712-4
The effect of photosynthetic parameters on speciesacclimation in an arid mountainous region of China
Tianyu GUAN1,2, Jihua ZHOU1,2
, Xiaolong ZHANG1,2, Nannan GAO1,2,
Hui DU1, Wentao CAI1,2, Lianhe JIANG1, Liming LAI1, Yuanrun ZHENG1,*
1Key Laboratory of Resource Plants, West China Subalpine Botanical Garden, Institute of Botany,Chinese Academy of Sciences, Xiangshan, Beijing, P.R. China
2University of Chinese Academy of Sciences, Beijing, P.R. China
* Correspondence: [email protected]
1. IntroductionTerrestrial ecosystems have been altered, both directly and indirectly, by changes to soil properties, modification of global biogeochemical cycles, alteration of the number and identity of constituent species, and climate change (Fortunel et al., 2009). As the climate changes around the globe (Chardon et al., 2015), many species are projected to move poleward or to higher elevations to track suitable conditions (Chardon et al., 2015). In many parts of the world, mountainous regions have experienced significant recent environmental change and are considered to be particularly sensitive to global climate change (Podwojewski et al., 2011). However, the decrease in temperature and increase in precipitation that occurs across an elevational range of a few hundred meters makes elevational gradients valuable tools for studying the effects of global climate change (De Long et al., 2015). Because plant performance and community composition respond to increasing elevation, performing experiments along elevational gradients has an advantage over manipulating environmental factors for assessing ecosystem responses to
temperature and precipitation change because community and ecosystem processes can be assessed over longer timeframes and larger spatial scales (De Long et al., 2015).
Understanding the factors that determine the distribution and abundance of species is a central goal of ecology and biogeography (Kanagaraj et al., 2011), and the importance of analyzing the ecological adaptability of plants to multiple environmental factors is increasingly recognized to mitigate the influence of climate change (Sternberg and Dan, 2015). Plants are frequently exposed to environmental constraints, such as drought and high temperatures, which are both considered to be among the most important environmental factors that limit net photosynthesis worldwide and often occur simultaneously (González-Cruz and Pastenes, 2012). Research on the physiological responses of plants to environmental resource gradients is important for predicting ecosystem responses to climate change.
Leaf photosynthesis is the fundamental plant physiological process that affects plant distribution on scales ranging from local to global (Cavaleri et al., 2008).
Abstract: Understanding the mechanisms of how environmental factors limit species distribution along environmental gradients is a central question in ecology. This study aimed to understand species acclimation in view of photosynthetic parameters in an arid mountainous region. We measured some photosynthetic parameters and light and CO2 photosynthesis response curves for all plant communities with seven dominant species in 13 sites along an elevation gradient in the Qilian Mountains in arid northwestern China. The results showed that species in xerothermic environments had low maximum rate of carboxylation (Vcmax) (14.5 µmol m–2 s–1) and maximum rate of electron transport (Jmax) (22.7 µmol m–2 s–1), high light compensation points (60.0 µmol m–2 s–1) and light saturation points (1150.7 µmol m–2 s–1), high dark respiration rates (5.3 µmol m–2 s–1), and high maximum photosynthetic rates (Amax) (18.1 µmol m–2 s–1) compared with species in mesic environments. Photosynthesis parameters did not vary with temperature, precipitation, and altitude in different communities dominated by the same species, Picea crassifolia. However, some photosynthesis parameters varied with temperature, precipitation, and altitude in communities dominated by species other than spruce at different elevations. Selected photosynthesis parameters could be used to measure species adaptation to environmental gradients in arid mountain regions.
Key words: Ecological adaptability, leaf photosynthesis, multivariate environmental index, mountain environment, arid area
Received: 04.12.2017 Accepted/Published Online: 09.04.2018 Final Version: 24.07.2018
Research Article
GUAN et al. / Turk J Bot
424
Leaf acclimation to environmental changes occurs mainly through modifications to leaf physiology such as electron transport and carbon fixation (Delagrange, 2011). The maximum rate of carboxylation (Vcmax) and the maximum rate of electron transport (Jmax) are the key parameters determining the photosynthetic capacity of plants and are the primary values in Farquhar-type photosynthesis models (Sharkey et al., 2010). The relationship between these parameters and photosynthetic capacity as well as environmental factors such as hours of sunshine, water, and photosynthetically active radiation been the subject of research in many plant species and have been widely applied to other terrestrial ecosystem models (Sharkey et al., 2010). The traditional way to determine Vcmax is through gas exchange experiments, where Vcmax values for different species are derived from A/Ci curves obtained in closed cuvettes (Zheng et al., 2017).
Climate change scenarios predict increasing aridity and temperature in many regions worldwide, including those in mountainous areas (Varone and Gratani, 2015). Rugged topography affects species distributions and community composition by creating contrasting mesic (cold, moist) and xeric (warm, dry) microclimates, especially on adjacent slopes in arid areas (Copeland and Harrison, 2015). Therefore, it is an effective method to study plant responses to climate change in arid mountainous regions.
The Qilian Mountains in northwestern China are an ecotone of the Tibetan Plateau, the Loess Plateau, the Central Asian deserts, and the Qaidam Desert. The vegetation is typical arid alpine vegetation, and many vegetation types are distributed across different elevations and habitats (Zhou et al., 2016). The vegetation includes meadow, scrub, grassland, forest, and desert ranging from higher elevations to the foot of the mountains. However, it is not clear how these vegetation types adapt to different environmental conditions, especially with regard to photosynthetic capacity (Wang et al., 2017).
The hypothesis tested was that leaf photosynthesis parameters could explain species acclimation along an elevation gradient ranging from a xerothermic desert environment at the foot of the mountains to a favorable habitat at middle elevation and to a cool, moist mesic environment at high elevations in an arid mountainous region, and that leaf photosynthetic capability might better explain variation among plant communities dominated by different species compared with that within communities dominated by the same species. The main objectives of this research were to understand the following questions: (1) What kinds of relationship exist between leaf photosynthetic and environmental factors? (2) How did different plant communities adapt to the mountain environment? Answering these questions by assessing the linkages between key leaf photosynthetic characteristics of
13 typical species in the Qilian Mountains and single or multivariate environmental indexes would be significant for improving our understanding of variation in leaf photosynthesis occurring along a single axis of variation (Reich, 2014).
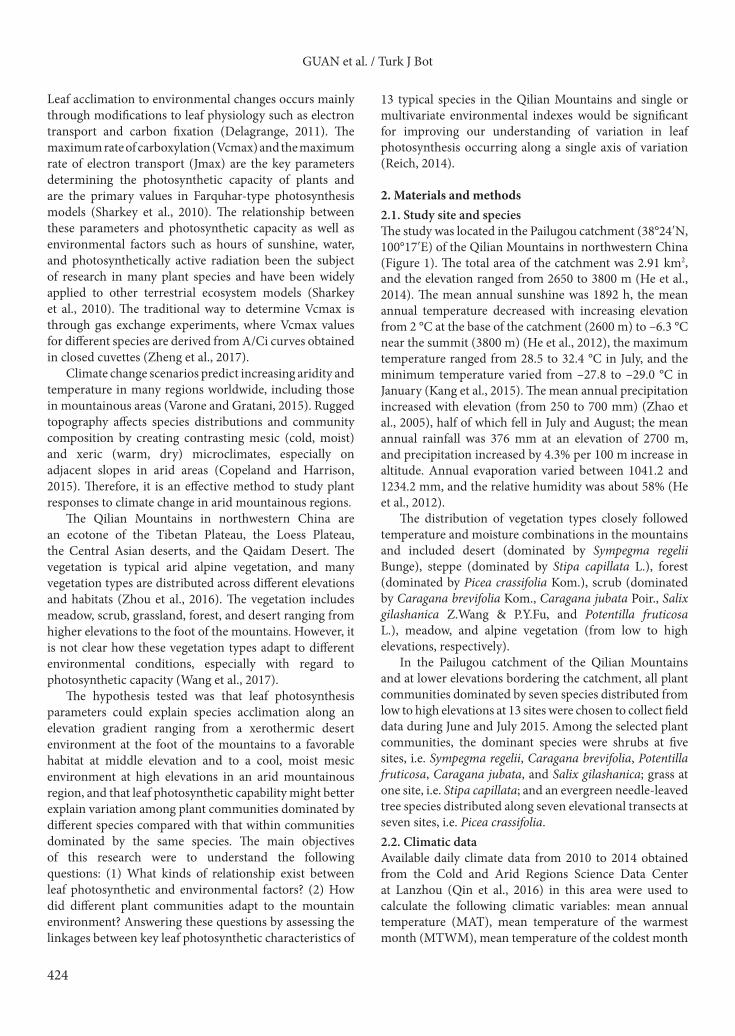
2. Materials and methods 2.1. Study site and speciesThe study was located in the Pailugou catchment (38°24′N, 100°17′E) of the Qilian Mountains in northwestern China (Figure 1). The total area of the catchment was 2.91 km2, and the elevation ranged from 2650 to 3800 m (He et al., 2014). The mean annual sunshine was 1892 h, the mean annual temperature decreased with increasing elevation from 2 °C at the base of the catchment (2600 m) to –6.3 °C near the summit (3800 m) (He et al., 2012), the maximum temperature ranged from 28.5 to 32.4 °C in July, and the minimum temperature varied from –27.8 to –29.0 °C in January (Kang et al., 2015). The mean annual precipitation increased with elevation (from 250 to 700 mm) (Zhao et al., 2005), half of which fell in July and August; the mean annual rainfall was 376 mm at an elevation of 2700 m, and precipitation increased by 4.3% per 100 m increase in altitude. Annual evaporation varied between 1041.2 and 1234.2 mm, and the relative humidity was about 58% (He et al., 2012).
The distribution of vegetation types closely followed temperature and moisture combinations in the mountains and included desert (dominated by Sympegma regelii Bunge), steppe (dominated by Stipa capillata L.), forest (dominated by Picea crassifolia Kom.), scrub (dominated by Caragana brevifolia Kom., Caragana jubata Poir., Salix gilashanica Z.Wang & P.Y.Fu, and Potentilla fruticosa L.), meadow, and alpine vegetation (from low to high elevations, respectively).
In the Pailugou catchment of the Qilian Mountains and at lower elevations bordering the catchment, all plant communities dominated by seven species distributed from low to high elevations at 13 sites were chosen to collect field data during June and July 2015. Among the selected plant communities, the dominant species were shrubs at five sites, i.e. Sympegma regelii, Caragana brevifolia, Potentilla fruticosa, Caragana jubata, and Salix gilashanica; grass at one site, i.e. Stipa capillata; and an evergreen needle-leaved tree species distributed along seven elevational transects at seven sites, i.e. Picea crassifolia. 2.2. Climatic dataAvailable daily climate data from 2010 to 2014 obtained from the Cold and Arid Regions Science Data Center at Lanzhou (Qin et al., 2016) in this area were used to calculate the following climatic variables: mean annual temperature (MAT), mean temperature of the warmest month (MTWM), mean temperature of the coldest month
GUAN et al. / Turk J Bot
425
(MTCM), mean annual precipitation (MAP) (White and Searle, 2009), monthly mean temperature, monthly mean precipitation, monthly mean evaporation, and mean annual evaporation (MAE). Additional climate indices, namely warmth index (WI), coldness index (CI), biotemperature (BT), annual range of temperature (ART) (Tang and Fang, 2006), humid/arid index (S), and aridity index (Al) (Xu et al., 2009), were also calculated (Table 1). 2.3. Soil parametersThirteen sites from low elevation to high elevation that had other plant communities dominated by different species and Picea crassifolia communities dominated by Picea crassifolia were selected with three replicates. Soil samples were collected in each of the 39 plots from 0 to 10 cm, 10 to 20 cm, 20 to 30 cm, 30 to 40 cm, and 40 to 50 cm depths. Gravimetric soil water content [g water (100 g dry soil)–1] and soil bulk density were measured for each soil layer (Zheng et al., 2006). Soil pH and electrical conductivity (EC) were determined (Mukhopadhyay et al., 2016). Soil total organic C and total N were measured using the solid combustion method with an elemental analyzer. Soil total phosphorus was measured with a spectrophotometer (Zou et al., 2014). Soil total K was measured with an atomic absorption spectrophotometer (Chen et al., 2013). The mean for data from the soil depth of 0 to 50 cm for each soil parameter was calculated (Table 1).2.4. Gas exchange leaf photosynthesisLeaf photosynthesis was measured with a portable photosynthesis system (LI-6400, LI-COR, Lincoln, NE,
USA). Leaf samples were chosen from the south side of the 2-m position of trees, the top position of shrubs, and from the south side of grasses on clear days in July in 2015. One leaf from each of three different plants in each plot was measured between 0900 and 1300 hours. Measurements were carried out at a relative humidity of 50%–60% and leaf temperature of 25 °C using a leaf chamber fluorometer as a light source. A steady-state light response curve (A/Q) was obtained at 400 µmol mol–1 CO2 and was determined at photosynthetic photon flux density levels of 0, 20, 50, 100, 200, 300, 400, 600, 800, 1000, 1200, 1600, and 1800 µmol m–2 s–1 PPFD (Geissler et al., 2015). Each step in the response curve lasted a minimum of 3 min and a maximum of 4 min (Dechant et al., 2017). The parameters obtained were light saturation point (LSP), light compensation point (LCP), CO2 assimilation (A), transpiration (T), stomatal conductance, and intercellular CO2 concentration (De Long et al., 2015). CO2 response curves (A/Ci) were obtained at 800 µmol m–2 s–1 PPFD and CO2 concentrations of 1500, 1200, 1000, 800, 600, 400, 200, 150, 120, 100, 80, 50, and 0 µmol mol–1 in the leaf cuvette. Several parameters were calculated from the curve, including Vcmax and Jmax (Silva et al., 2015). Vcmax and Jmax from the measured A/Ci curves were fitted to the FvCB model using a least-squares curve-fitting method (Sharkey et al., 2010; Silva et al., 2015).2.5. Data analysesCorrelation analysis between environmental factors and between the multivariate environmental index and leaf
Figure 1. Location of the study area.
GUAN et al. / Turk J Bot
426
traits, and regression analysis between leaf physiological traits and environmental factors and the multivariate environmental index, were conducted using SPSS 20.0 for Windows (IBM Corp., Armonk, NY, USA) (Li et al., 2011).
The species–environment relationship of multispecies communities can be analyzed by ordination methods, e.g., principal component analysis (PCA). Therefore, PCA was used to build a multivariate environmental index that represented most environmental factors, instead of explaining plant community distribution through individual environmental factors. To meet the prerequisite of PCA that the number of environmental variables should be fewer than the number of sites, Pearson correlation was applied with SPSS 20.0 to environmental variables to determine the appropriate data to be used in PCA. As a
result, 16 environmental variables, namely soil total C, soil total N, soil pH, soil bulk density, gravimetric soil water content of 0–50 cm soil depth, mean annual temperature, warmth index, coldness index, mean temperature for the warmest month, mean temperature for the coldest month, annual range of temperature, biotemperature, mean annual precipitation, mean annual evaporation, humid/arid index, and aridity index, were used. PC-ORD 5.0 software (MjM Software Design, Gleneden Beach, OR, USA) was used to perform PCA.
3. Results3.1. Response curvesFrom the light curve, the entire light response of the species could be divided into three stages. The first, where the
Table 1. Climate and soil data (mean ± SD) of different plant communities distributed in different sites around Pailugou catchment. MAT, Mean annual temperature; MAP, mean annual precipitation; MAE, mean annual evaporation; TN, soil total nitrogen; TP, soil total phosphorous; TK, soil total potassium; SBD, soil bulk density; SW, gravimetric soil water content.
Plantcommunities Locations Altitude
(m)MAT(°C)
MAP(mm)
MAE(mm)
TN(%)
TP(mg kg–1)
TK(mg kg–1)
SBD(g cm–3)
SW(%)
Sympegmaregelii (SRB)
38°41.670′N100°22.724′E 1855 5.92
± 0.01197.7± 0.30
9.24± 0.01
0.07± 0.01
3.38± 0.26
117.32± 20.86
1.39± 0.02
5.14± 0.46
Picea crassifolia (PC7)
38°34.916′N100°17.351′E 2562 2.04
± 0.01284.2± 1.20
33.51± 0.14
0.31± 0.07
7.49± 0.90
137.13± 48.03
0.73± 0.06
39.91± 7.23
Caraganabrevifolia (CBK)
38°34.961′N100°17.246′E 2602 1.19
± 0.00286.8± 0.30
34.20± 0.03
0.19± 0.05
2.57± 0.37
132.86± 32.02
1.17± 0.12
23.90± 1.80
Stipa capillata(SC)
38°34.936′N100°17.260′E 2603 1.79
± 0.06279.6± 0.90
29.93± 0.23
0.24± 0.02
4.00± 0.95
123.83± 30.30
0.92± 0.03
32.90± 1.28
Picea crassifolia (PC6)
38°33.230′N100°17.109′E 2754 1.53
± 0.00308± 0.70
32.75± 0.08
0.37± 0.08
8.39± 1.46
138.90± 15.66
0.72± 0.04
35.40± 3.33
Picea crassifolia (PC5)
38°32.775′N100°17.779′E 2876 0.35
± 0.01304.2± 0.10
35.83± 0.02
0.42± 0.04
7.80± 1.42
111.35± 22.98
0.79± 0.14
64.39± 14.84
Picea crassifolia (PC4)
38°32.625′N100°17.967′E 2936 0.16
± 0.00313.1± 0.20
39.33± 0.02
0.37± 0.04
7.11± 0.31
110.67± 34.34
0.69± 0.05
57.71± 4.30
Picea crassifolia (PC3)
38°32.463′N100°18.031′E 3053 –0.59
± 0.07320.1± 1.10
39.65± 0.27
0.62± 0.06
6.91± 0.60
125.05± 33.28
0.50± 0.06
100.02± 27.52
Potentillafruticasa (PF)
38°32.446′N100°18.284′E 3057 –0.61
± 0.02320.5± 0.30
39.75± 0.07
0.44± 0.07
6.74± 0.75
103.14± 12.33
0.90± 0.09
68.23± 7.18
Picea crassifolia (PC2)
38°32.292′N100°18.055′E 3165 –1.18
± 0.06330.2± 1.10
42.06± 0.25
0.59± 0.06
6.71± 0.46
160.34± 59.18
0.50± 0.05
113.72± 1.80
Picea crassifolia (PC1)
38°32.212′N100°18.059′E, 3249 –0.63
± 0.01337.8± 0.20
43.89± 0.06
0.53± 0.11
4.65± 0.11
101.88± 28.80
0.42± 0.06
99.24± 25.78
Caragana jubata (CJP)
38°32.184′N100°18.053′E 3274 –0.71
± 0.00318.6± 0.90
38.69± 0.11
0.80± 0.11
10.21± 0.19
118.74± 18.16
0.48± 0.08
113.02± 12.99
Salix gilashanica (SG)
38°32.183′N100°18.059′E 3285 –0.82
± 0.01341± 0.20
44.66± 0.06
0.68± 0.11
9.07± 0.40
185.28± 37.29
0.49± 0.17
100.52± 25.96
GUAN et al. / Turk J Bot
427
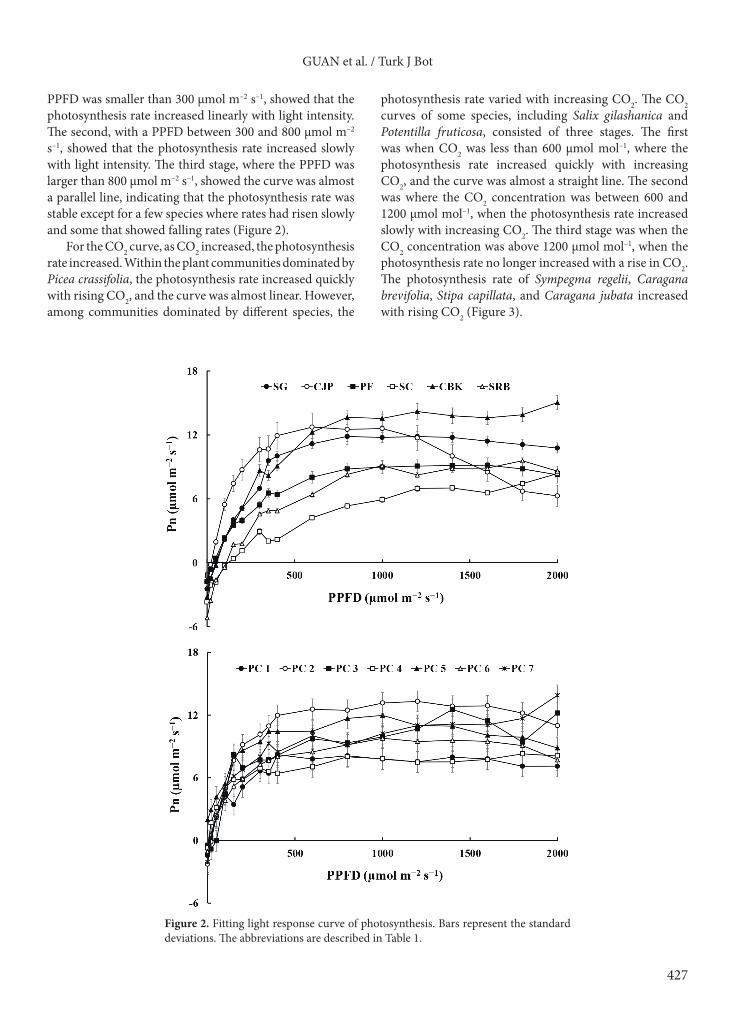
PPFD was smaller than 300 µmol m–2 s–1, showed that the photosynthesis rate increased linearly with light intensity. The second, with a PPFD between 300 and 800 µmol m–2 s–1, showed that the photosynthesis rate increased slowly with light intensity. The third stage, where the PPFD was larger than 800 µmol m–2 s–1, showed the curve was almost a parallel line, indicating that the photosynthesis rate was stable except for a few species where rates had risen slowly and some that showed falling rates (Figure 2).
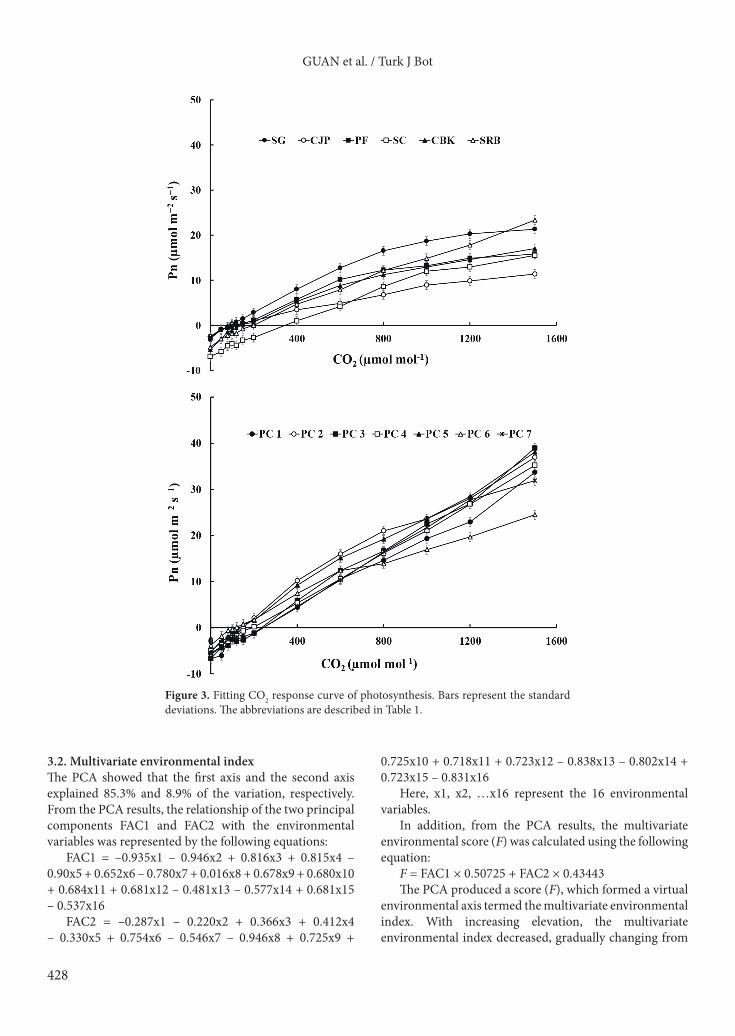
For the CO2 curve, as CO2 increased, the photosynthesis rate increased. Within the plant communities dominated by Picea crassifolia, the photosynthesis rate increased quickly with rising CO2, and the curve was almost linear. However, among communities dominated by different species, the
photosynthesis rate varied with increasing CO2. The CO2 curves of some species, including Salix gilashanica and Potentilla fruticosa, consisted of three stages. The first was when CO2 was less than 600 µmol mol–1, where the photosynthesis rate increased quickly with increasing CO2, and the curve was almost a straight line. The second was where the CO2 concentration was between 600 and 1200 µmol mol–1, when the photosynthesis rate increased slowly with increasing CO2. The third stage was when the CO2 concentration was above 1200 µmol mol–1, when the photosynthesis rate no longer increased with a rise in CO2. The photosynthesis rate of Sympegma regelii, Caragana brevifolia, Stipa capillata, and Caragana jubata increased with rising CO2 (Figure 3).
Figure 2. Fitting light response curve of photosynthesis. Bars represent the standard deviations. The abbreviations are described in Table 1.
GUAN et al. / Turk J Bot
428
3.2. Multivariate environmental indexThe PCA showed that the first axis and the second axis explained 85.3% and 8.9% of the variation, respectively. From the PCA results, the relationship of the two principal components FAC1 and FAC2 with the environmental variables was represented by the following equations:
FAC1 = –0.935x1 – 0.946x2 + 0.816x3 + 0.815x4 – 0.90x5 + 0.652x6 – 0.780x7 + 0.016x8 + 0.678x9 + 0.680x10 + 0.684x11 + 0.681x12 – 0.481x13 – 0.577x14 + 0.681x15 – 0.537x16
FAC2 = –0.287x1 – 0.220x2 + 0.366x3 + 0.412x4 – 0.330x5 + 0.754x6 – 0.546x7 – 0.946x8 + 0.725x9 +
0.725x10 + 0.718x11 + 0.723x12 – 0.838x13 – 0.802x14 + 0.723x15 – 0.831x16
Here, x1, x2, …x16 represent the 16 environmental variables.
In addition, from the PCA results, the multivariate environmental score (F) was calculated using the following equation:
F = FAC1 × 0.50725 + FAC2 × 0.43443The PCA produced a score (F), which formed a virtual
environmental axis termed the multivariate environmental index. With increasing elevation, the multivariate environmental index decreased, gradually changing from
Figure 3. Fitting CO2 response curve of photosynthesis. Bars represent the standard deviations. The abbreviations are described in Table 1.
GUAN et al. / Turk J Bot
429
a positive value to zero and then to a negative value, and the environment changed from a xerothermic desert environment at low elevation to a favorable habitat suitable for Picea crassifolia growth, and then to a clammy subalpine shrub zone at high elevation.
Given that the optimum environment for a plant was at a location where water and temperature levels were balanced, a multivariate score of 0 represented the balanced condition where water and temperature levels were the most suitable for plant growth. The closer the absolute value of the multivariate score was to 0, the more suitable the environment was for a plant.
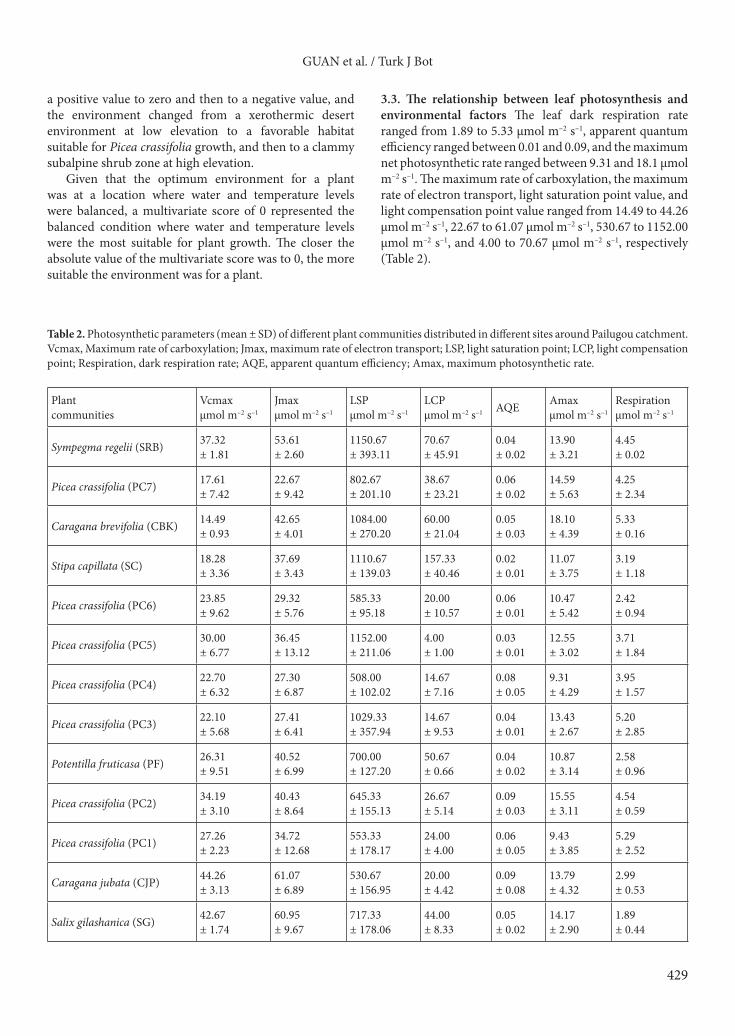
3.3. The relationship between leaf photosynthesis and environmental factors The leaf dark respiration rate ranged from 1.89 to 5.33 µmol m–2 s–1, apparent quantum efficiency ranged between 0.01 and 0.09, and the maximum net photosynthetic rate ranged between 9.31 and 18.1 µmol m–2 s–1. The maximum rate of carboxylation, the maximum rate of electron transport, light saturation point value, and light compensation point value ranged from 14.49 to 44.26 µmol m–2 s–1, 22.67 to 61.07 µmol m–2 s–1, 530.67 to 1152.00 µmol m–2 s–1, and 4.00 to 70.67 µmol m–2 s–1, respectively (Table 2).
Table 2. Photosynthetic parameters (mean ± SD) of different plant communities distributed in different sites around Pailugou catchment. Vcmax, Maximum rate of carboxylation; Jmax, maximum rate of electron transport; LSP, light saturation point; LCP, light compensation point; Respiration, dark respiration rate; AQE, apparent quantum efficiency; Amax, maximum photosynthetic rate.
Plantcommunities
Vcmaxµmol m–2 s–1
Jmaxµmol m–2 s–1
LSPµmol m–2 s–1
LCPµmol m–2 s–1 AQE Amax
µmol m–2 s–1Respirationµmol m–2 s–1
Sympegma regelii (SRB) 37.32± 1.81
53.61± 2.60
1150.67± 393.11
70.67± 45.91
0.04± 0.02
13.90± 3.21
4.45± 0.02
Picea crassifolia (PC7) 17.61± 7.42
22.67± 9.42
802.67± 201.10
38.67± 23.21
0.06± 0.02
14.59± 5.63
4.25± 2.34
Caragana brevifolia (CBK) 14.49± 0.93
42.65± 4.01
1084.00± 270.20
60.00± 21.04
0.05± 0.03
18.10± 4.39
5.33± 0.16
Stipa capillata (SC) 18.28± 3.36
37.69± 3.43
1110.67± 139.03
157.33± 40.46
0.02± 0.01
11.07± 3.75
3.19± 1.18
Picea crassifolia (PC6) 23.85± 9.62
29.32± 5.76
585.33± 95.18
20.00± 10.57
0.06± 0.01
10.47± 5.42
2.42± 0.94
Picea crassifolia (PC5) 30.00± 6.77
36.45± 13.12
1152.00± 211.06
4.00± 1.00
0.03± 0.01
12.55± 3.02
3.71± 1.84
Picea crassifolia (PC4) 22.70± 6.32
27.30± 6.87
508.00± 102.02
14.67± 7.16
0.08± 0.05
9.31± 4.29
3.95± 1.57
Picea crassifolia (PC3) 22.10± 5.68
27.41± 6.41
1029.33± 357.94
14.67± 9.53
0.04± 0.01
13.43± 2.67
5.20± 2.85
Potentilla fruticasa (PF) 26.31± 9.51
40.52± 6.99
700.00± 127.20
50.67± 0.66
0.04± 0.02
10.87± 3.14
2.58± 0.96
Picea crassifolia (PC2) 34.19± 3.10
40.43± 8.64
645.33± 155.13
26.67± 5.14
0.09± 0.03
15.55± 3.11
4.54± 0.59
Picea crassifolia (PC1) 27.26± 2.23
34.72± 12.68
553.33± 178.17
24.00± 4.00
0.06± 0.05
9.43± 3.85
5.29± 2.52
Caragana jubata (CJP) 44.26± 3.13
61.07± 6.89
530.67± 156.95
20.00± 4.42
0.09± 0.08
13.79± 4.32
2.99± 0.53
Salix gilashanica (SG) 42.67± 1.74
60.95± 9.67
717.33± 178.06
44.00± 8.33
0.05± 0.02
14.17± 2.90
1.89± 0.44
GUAN et al. / Turk J Bot
430
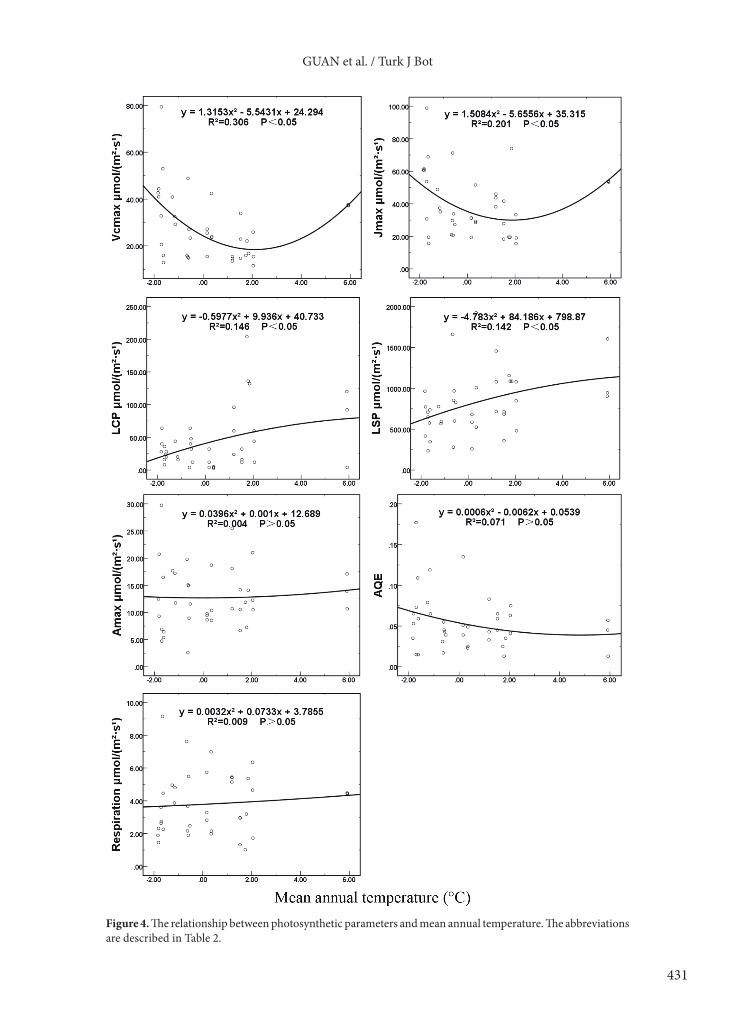
3.3.1. Photosynthetic parameters and mean annual temperatureFor all plant communities dominated by different species, the leaf light saturation point and light compensation point had significant correlations with mean annual temperature (r = 0.370 and 0.374, respectively). For Picea crassifolia communities, photosynthetic parameters had no obvious correlations with mean annual temperature. For other plant communities dominated by species excluding Picea crassifolia, the light saturation point and dark respiration rate were significantly correlated with mean annual temperature (r = 0.584 and 0.536, respectively) (Table 3).
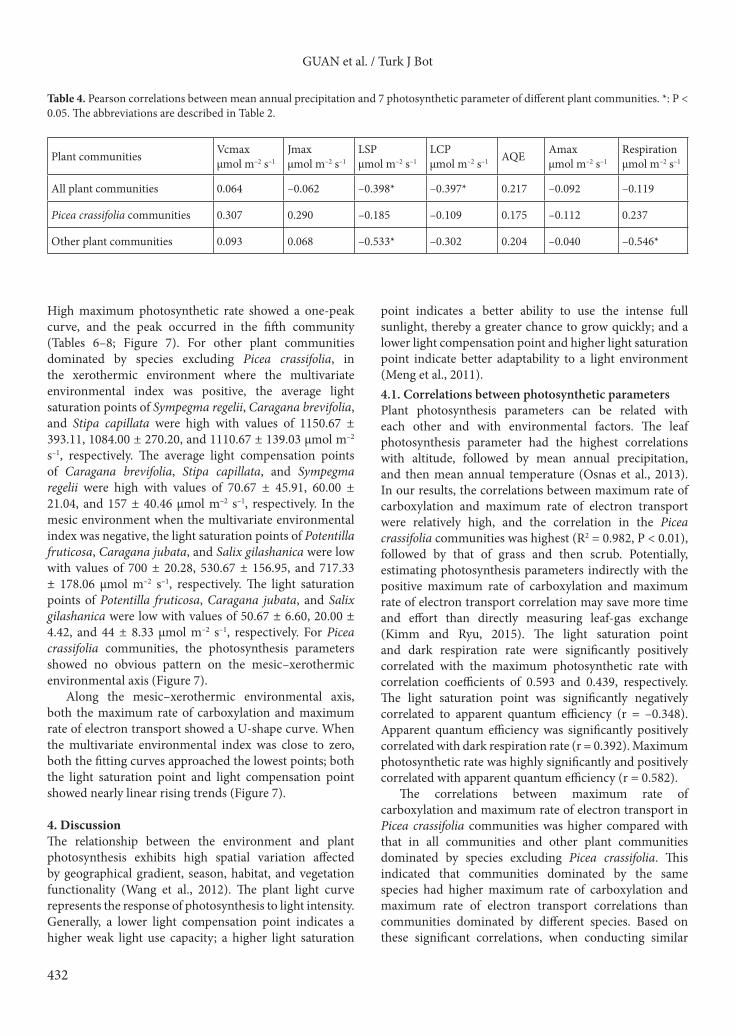
The relationship between photosynthesis parameters and mean annual temperature could be described by different equations (Figure 4). The maximum rate of carboxylation and the maximum rate of electron transport increased with higher mean annual temperature at first, then declined. The light compensation point and light saturation point tended to rise with an increase in mean annual temperature. Apparent quantum efficiency, dark respiration rate, and maximum net photosynthetic rate had no obvious relation with temperature.3.3.2. Photosynthetic parameters and mean annual precipitationFor all plant communities dominated by different species, the light saturation point (r = 0.398) and light compensation point (r = 0.397) had a significant correlation with mean annual precipitation. For Picea crassifolia communities, photosynthetic parameters had no obvious correlation with mean annual precipitation. For other plant communities dominated by species excluding Picea crassifolia, the light saturation point (r = 0.533) and dark respiration rate (r = 0.546) showed a significant relationship with mean annual precipitation (Table 4).
The relationship between photosynthesis parameters and mean annual precipitation could be described by different equations (Figure 5). With the increase of precipitation, the maximum rate of carboxylation and the maximum rate of electron transport tended to decline at first and then rise, whereas the light compensation point
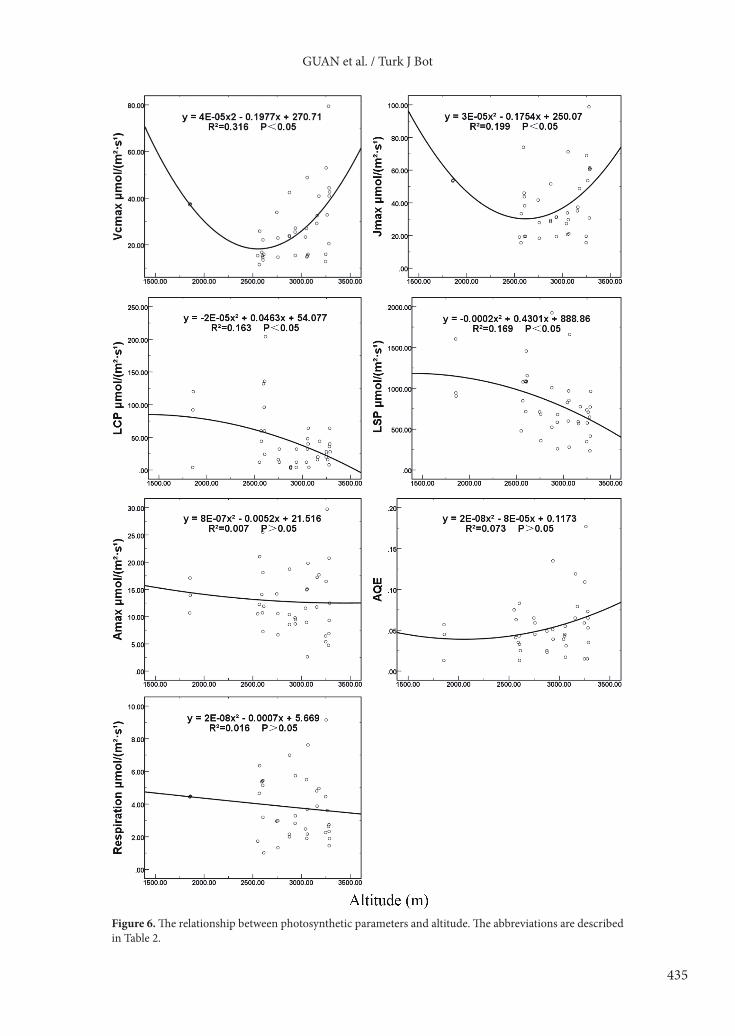
and light saturation point tended to increase first and then decline. Other photosynthetic parameters had no obvious relationship with rising precipitation.3.3.3. Photosynthetic parameters and altitudeFor all plant communities dominated by different species, the light saturation point (r = 0.403) and light compensation point (r = 0.379) were significantly correlated with altitude. For Picea crassifolia communities, photosynthetic parameters had no obvious correlations with altitude. For other plant communities dominated by species excluding Picea crassifolia, the light saturation point (r = 0.606) and dark respiration rate (r = 0.586) were significantly related to altitude (Table 5).
The relationship between photosynthesis parameters and altitude could be described by different equations (Figure 6). With increasing altitude, the maximum rate of carboxylation and the maximum rate of electron transport tended to decline first and then rise. The light compensation point and light saturation point tended to decline slowly with greater altitude. Other plant photosynthetic parameters showed no obvious change with rising altitude.3.4. Photosynthetic parameters and multivariate environmental indexFor all plant communities dominated by different species, xerothermic species had a low maximum rate of carboxylation and maximum rate of electron transport, high light saturation points and light compensation points, high average dark respiration rates, low apparent quantum efficiency, and high maximum photosynthetic rates. For Picea crassifolia communities, as the environment changed from xerothermic to mesic, both the maximum rate of carboxylation and maximum rate of electron transport showed a two-peak curve; the two peaks occurred in the first and fifth communities, the valley appearing in the seventh community. The light saturation points also showed a two-peak curve, while the light compensation points showed a one-peak curve: both peaked in the fifth community. The dark respiration rate showed a one-peak curve. Apparent quantum efficiency had no obvious trend.
Table 3. Pearson correlations between mean annual temperature and 7 photosynthetic parameter of different plant communities. *: P < 0.05. The abbreviations are described in Table 2.
Plant communities Vcmaxµmol m–2 s–1
Jmaxµmol m–2 s–1
LSPµmol m–2 s–1
LCPµmol m–2 s–1 AQE Amax
µmol m–2 s–1Respirationµmol m–2 s–1
All plant communities –0.163 –0.062 0.370* 0.374* –0.245 0.049 0.094
Picea crassifolia communities –0.316 –0.298 0.060 0.142 –0.126 0.034 –0.318
Other plant communities –0.163 –0.119 0.584* 0.378 –0.283 0.026 0.536*
GUAN et al. / Turk J Bot
431
Figure 4. The relationship between photosynthetic parameters and mean annual temperature. The abbreviations are described in Table 2.
GUAN et al. / Turk J Bot
432
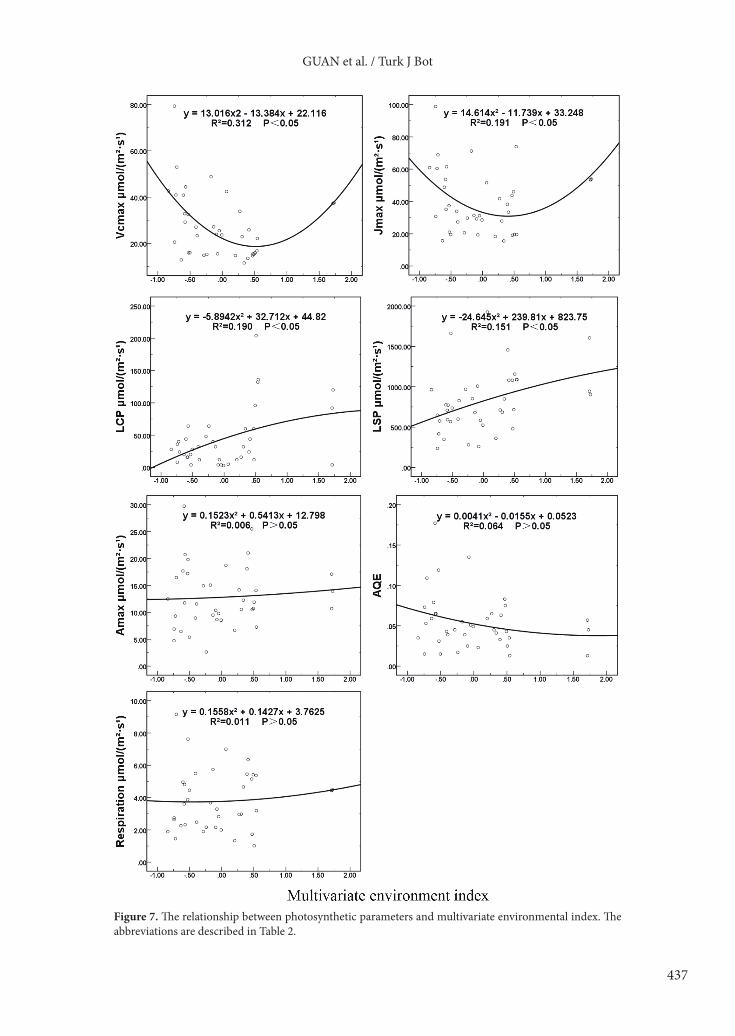
High maximum photosynthetic rate showed a one-peak curve, and the peak occurred in the fifth community (Tables 6–8; Figure 7). For other plant communities dominated by species excluding Picea crassifolia, in the xerothermic environment where the multivariate environmental index was positive, the average light saturation points of Sympegma regelii, Caragana brevifolia, and Stipa capillata were high with values of 1150.67 ± 393.11, 1084.00 ± 270.20, and 1110.67 ± 139.03 µmol m–2 s–1, respectively. The average light compensation points of Caragana brevifolia, Stipa capillata, and Sympegma regelii were high with values of 70.67 ± 45.91, 60.00 ± 21.04, and 157 ± 40.46 µmol m–2 s–1, respectively. In the mesic environment when the multivariate environmental index was negative, the light saturation points of Potentilla fruticosa, Caragana jubata, and Salix gilashanica were low with values of 700 ± 20.28, 530.67 ± 156.95, and 717.33 ± 178.06 µmol m–2 s–1, respectively. The light saturation points of Potentilla fruticosa, Caragana jubata, and Salix gilashanica were low with values of 50.67 ± 6.60, 20.00 ± 4.42, and 44 ± 8.33 µmol m–2 s–1, respectively. For Picea crassifolia communities, the photosynthesis parameters showed no obvious pattern on the mesic–xerothermic environmental axis (Figure 7).
Along the mesic–xerothermic environmental axis, both the maximum rate of carboxylation and maximum rate of electron transport showed a U-shape curve. When the multivariate environmental index was close to zero, both the fitting curves approached the lowest points; both the light saturation point and light compensation point showed nearly linear rising trends (Figure 7).
4. DiscussionThe relationship between the environment and plant photosynthesis exhibits high spatial variation affected by geographical gradient, season, habitat, and vegetation functionality (Wang et al., 2012). The plant light curve represents the response of photosynthesis to light intensity. Generally, a lower light compensation point indicates a higher weak light use capacity; a higher light saturation
point indicates a better ability to use the intense full sunlight, thereby a greater chance to grow quickly; and a lower light compensation point and higher light saturation point indicate better adaptability to a light environment (Meng et al., 2011). 4.1. Correlations between photosynthetic parametersPlant photosynthesis parameters can be related with each other and with environmental factors. The leaf photosynthesis parameter had the highest correlations with altitude, followed by mean annual precipitation, and then mean annual temperature (Osnas et al., 2013). In our results, the correlations between maximum rate of carboxylation and maximum rate of electron transport were relatively high, and the correlation in the Picea crassifolia communities was highest (R2 = 0.982, P < 0.01), followed by that of grass and then scrub. Potentially, estimating photosynthesis parameters indirectly with the positive maximum rate of carboxylation and maximum rate of electron transport correlation may save more time and effort than directly measuring leaf-gas exchange (Kimm and Ryu, 2015). The light saturation point and dark respiration rate were significantly positively correlated with the maximum photosynthetic rate with correlation coefficients of 0.593 and 0.439, respectively. The light saturation point was significantly negatively correlated to apparent quantum efficiency (r = –0.348). Apparent quantum efficiency was significantly positively correlated with dark respiration rate (r = 0.392). Maximum photosynthetic rate was highly significantly and positively correlated with apparent quantum efficiency (r = 0.582).
The correlations between maximum rate of carboxylation and maximum rate of electron transport in Picea crassifolia communities was higher compared with that in all communities and other plant communities dominated by species excluding Picea crassifolia. This indicated that communities dominated by the same species had higher maximum rate of carboxylation and maximum rate of electron transport correlations than communities dominated by different species. Based on these significant correlations, when conducting similar
Table 4. Pearson correlations between mean annual precipitation and 7 photosynthetic parameter of different plant communities. *: P < 0.05. The abbreviations are described in Table 2.
Plant communities Vcmaxµmol m–2 s–1
Jmaxµmol m–2 s–1
LSPµmol m–2 s–1
LCPµmol m–2 s–1 AQE Amax
µmol m–2 s–1Respirationµmol m–2 s–1
All plant communities 0.064 –0.062 –0.398* –0.397* 0.217 –0.092 –0.119
Picea crassifolia communities 0.307 0.290 –0.185 –0.109 0.175 –0.112 0.237
Other plant communities 0.093 0.068 –0.533* –0.302 0.204 –0.040 –0.546*
GUAN et al. / Turk J Bot
433
Figure 5. The relationship between photosynthetic parameters and mean annual precipitation. The abbreviations are described in Table 2.
GUAN et al. / Turk J Bot
434
research, we recommend using only the most necessary indices to save time and labor.4.2. Change of photosynthetic parametersThe photosynthesis behavior of alpine plants reflects their response and adaption to the special natural environmental conditions of plateaus. Light and CO2 curves reflect how plant physiological functions respond to transient environmental changes (Shi et al., 2006). The maximum photosynthetic rate of species may suffer from depression in different degrees under higher irradiance (Mao et al., 2014). Studies have demonstrated that plants obtain the maximum photosynthesis by optimizing resource allocation between RuBisCo and chlorophyll to maintain a balance between Vcmax and Jmax (Wilson et al., 2000). Leaf Vcmax varies immensely from one species to another in a range of 6–194 µmol m–2 s–1 (Yan et al., 2014). Within the same species, leaf Vcmax also changes with the season and year (Grassi et al., 2005). Among the different species in our study, Vcmax and Jmax were in the ranges of 14.49–44.26 µmol m–2 s–1 and 22.67–61.07 µmol m–2 s–1, respectively. Within the Picea crassifolia communities, the range was from 17.61 to 34.19 µmol m–2 s–1 and 22.67 to 40.43 µmol m–2 s–1, respectively. Caragana brevifolia had the smallest Vcmax while Caragana jubata had the largest. The Vcmax of Picea crassifolia was 25.39 µmol m–2 s–1, which was smaller than the 57.7 µmol m–2 s–1 (mean ± SD, n = 404) of global temperate broadleaved deciduous trees measured by Kattge et al. (2009) and the 30–80 µmol m–2 s–1 (n = 12) of the Amazon tropical forests measured by Domingues et al. (2014), and far smaller than the 82.9 ± 37.3 µmol m–2 s–1 (mean + SD, n =7) of temperate broadleaved functional trees measured by Kimm and Ryu (2015). This suggests that measured Vcmax values vary substantially in interval and range.
When the environment changed from xerothermic to mesic, apparent quantum efficiency did not show any obvious change. The average apparent quantum efficiency was 0.06 for tree communities, 0.05 for shrub communities, and 0.02 for grass communities. This implied that tree communities (Picea crassifolia communities)
in the area were better able to use weak light than shrub communities, and shrub communities were better than grass communities. This result confirmed that, in the warming climate, Picea crassifolia might continue to live on the darker hillsides and its forest line might move upward, similar to other trees (Slot and Kitajima, 2015). Grass communities were less competitive than bryophytes in a weak light habitat, and they could redistribute in patches in sunward-facing bare ground (Wang et al., 2017).
The response of the photosynthesis rate to light intensity was similar among different communities in this area. Under a low light intensity (PPFD < 300 µmol m–2 s–1), the photosynthesis rate increased quickly in proportion to light intensity, suggesting that within this light intensity interval, light intensity was the main constraint to photosynthesis. When light intensity was higher than the light saturation point, the plant photosynthesis rate fell significantly. It has been reported that the light saturation point varies with soil water content (Han et al., 2010). In our study, the light saturation point of Picea crassifolia changed with environmental variation along the vertical gradient, from 508 to 1152 µmol m–2 s–1, and the light compensation point changed from 4 to 38.67 µmol m–2 s–1. This indicated that Picea crassifolia could use both weak and strong light (Ye and Kang, 2012) and had high ecological adaptability. The average light saturation point of Sympegma regelii was 1151 µmol m–2 s–1, the second largest light saturation point among all plant communities in the area. This might be why Sympegma regelii could grow in a xerothermic environment and be tolerant of drought and adapt to strong light. Species with high light saturation points are very useful for reducing the photoinhibition of high light intensities for plants in arid or semiarid areas (Zhou et al., 2011).
In conclusion, species adaptability to mountain environments was investigated from a photosynthesis perspective. Species in xerothermic environments had low Vcmax and Jmax, high light compensation points and light saturation points, and high dark respiration rates and maximum photosynthetic rates compared with species
Table 5. Pearson correlations between altitude and 7 photosynthetic parameter of different plant communities. **, P<0.01; *, P<0.05. The abbreviations are described in Table 2.
Plant communities Vcmaxµmol m–2 s–1
Jmaxµmol m–2 s–1
LSPµmol m–2 s–1
LCPµmol m–2 s–1 AQE Amax
µmol m–2 s–1Respirationµmol m–2 s–1
All plant communities 0.185 0.050 –0.403* –0.397* 0.248 –0.083 –0.126
Picea crassifolia community 0.320 0.302 –0.099 –0.149 0.137 –0.068 0.288
Other plant communities 0.208 0.136 –0.606** –0.377 0.277 –0.055 –0.586*
GUAN et al. / Turk J Bot
435
Figure 6. The relationship between photosynthetic parameters and altitude. The abbreviations are described in Table 2.
GUAN et al. / Turk J Bot
436
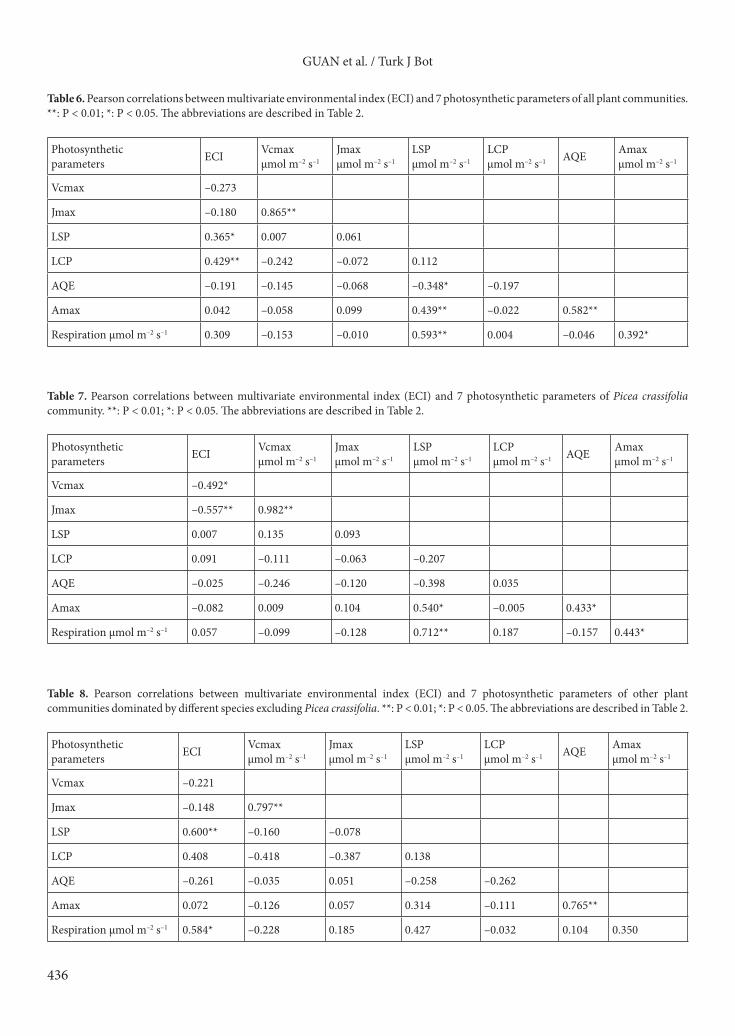
Table 8. Pearson correlations between multivariate environmental index (ECI) and 7 photosynthetic parameters of other plant communities dominated by different species excluding Picea crassifolia. **: P < 0.01; *: P < 0.05. The abbreviations are described in Table 2.
Photosynthetic parameters ECI Vcmax
µmol m–2 s–1Jmaxµmol m–2 s–1
LSPµmol m–2 s–1
LCPµmol m–2 s–1 AQE Amax
µmol m–2 s–1
Vcmax –0.221
Jmax –0.148 0.797**
LSP 0.600** –0.160 –0.078
LCP 0.408 –0.418 –0.387 0.138
AQE –0.261 –0.035 0.051 –0.258 –0.262
Amax 0.072 –0.126 0.057 0.314 –0.111 0.765**
Respiration µmol m–2 s–1 0.584* –0.228 0.185 0.427 –0.032 0.104 0.350
Table 6. Pearson correlations between multivariate environmental index (ECI) and 7 photosynthetic parameters of all plant communities. **: P < 0.01; *: P < 0.05. The abbreviations are described in Table 2.
Photosyntheticparameters ECI Vcmax
µmol m–2 s–1Jmaxµmol m–2 s–1
LSPµmol m–2 s–1
LCPµmol m–2 s–1 AQE Amax
µmol m–2 s–1
Vcmax –0.273
Jmax –0.180 0.865**
LSP 0.365* 0.007 0.061
LCP 0.429** –0.242 –0.072 0.112
AQE –0.191 –0.145 –0.068 –0.348* –0.197
Amax 0.042 –0.058 0.099 0.439** –0.022 0.582**
Respiration µmol m–2 s–1 0.309 –0.153 –0.010 0.593** 0.004 –0.046 0.392*
Table 7. Pearson correlations between multivariate environmental index (ECI) and 7 photosynthetic parameters of Picea crassifolia community. **: P < 0.01; *: P < 0.05. The abbreviations are described in Table 2.
Photosyntheticparameters ECI Vcmax
µmol m–2 s–1Jmaxµmol m–2 s–1
LSPµmol m–2 s–1
LCPµmol m–2 s–1 AQE Amax
µmol m–2 s–1
Vcmax –0.492*
Jmax –0.557** 0.982**
LSP 0.007 0.135 0.093
LCP 0.091 –0.111 –0.063 –0.207
AQE –0.025 –0.246 –0.120 –0.398 0.035
Amax –0.082 0.009 0.104 0.540* –0.005 0.433*
Respiration µmol m–2 s–1 0.057 –0.099 –0.128 0.712** 0.187 –0.157 0.443*
GUAN et al. / Turk J Bot
437
Figure 7. The relationship between photosynthetic parameters and multivariate environmental index. The abbreviations are described in Table 2.
GUAN et al. / Turk J Bot
438
in mesic environments. The multivariate environmental index had a significant relationship with the light compensation point and light saturation point in all plant communities dominated by different species; with Vcmax and Jmax in Picea crassifolia communities; and with the light saturation point and dark respiration rate in other plant communities dominated by species excluding Picea crassifolia. It is possible to evaluate species adaptability in arid mountain environments using photosynthesis
parameters such as Vcmax, Jmax, light compensation points, light saturation points, dark respiration rates, and maximum photosynthetic rates.
Acknowledgments This work was supported by the National Natural Science Foundation of China (No. 91425301). We also greatly appreciate the anonymous reviewers for the insightful comments.
References
Cavaleri MA, Oberbauer SF, Ryan MG (2008). Foliar and ecosystem respiration in an old-growth tropical rain forest. Plant Cell Environ 31: 473-483.
Chardon NI, Cornwell WK, Flint LE, Flint AL, Ackerly DD (2015). Topographic, latitudinal and climatic distribution of Pinus coulteri: geographic range limits are not at the edge of the climate envelope. Ecography 38: 590-601.
Chen SY, Mochizuki T, Abe Y, Toba M, Yoshimura Y (2013). Production of high-quality biodiesel fuels from various vegetable oils over Ti-incorporated SBA-15 mesoporous silica. Catal Commun 41: 136-139.
Copeland SM, Harrison SP (2015). Identifying plant traits associated with topographic contrasts in a rugged and diverse region (Klamath-Siskiyou Mts, OR, USA). Ecography 38: 569-577.
Dechant B, Cuntz M, Vohland M, Schulz E, Doktor D (2017). Estimation of photosynthesis traits from leaf reflectance spectra: correlation to nitrogen content as the dominant mechanism. Remote Sens Environ 196: 279-292.
Delagrange S (2011). Light- and seasonal-induced plasticity in leaf morphology, N partitioning and photosynthetic capacity of two temperate deciduous species. Environ Exp Bot 70: 1-10.
De Long JR, Kardol P, Sundqvist MK, Veen GF, Wardle DA (2015). Plant growth response to direct and indirect temperature effects varies by vegetation type and elevation in a subarctic tundra. Oikos 124: 772-783.
Domingues TF, Martinelli LA, Ehleringer JR (2014). Seasonal patterns of leaf-level photosynthetic gas exchange in an eastern Amazonian rain forest. Plant Ecol Divers 7: 189-203.
Fortunel C, Garnier E, Joffre R, Kazakou E, Quested H, Grigulis K, Lavorel S, Ansquer P, Castro H, Cruz P (2009). Leaf traits capture the effects of land use changes and climate on litter decomposability of grasslands across Europe. Ecology 90: 598-611.
Geissler N, Hussin S, El-Far MMM, Koyro HW (2015). Elevated atmospheric CO2 concentration leads to different salt resistance mechanisms in a C3 (Chenopodium quinoa) and a C4 (Atriplex nummularia) halophyte. Environ Exp Bot 118: 67-77.
González-Cruz J, Pastenes C (2012). Water-stress-induced thermotolerance of photosynthesis in bean (Phaseolus vulgaris L.) plants: the possible involvement of lipid composition and xanthophyll cycle pigments. Environ Exp Bot 77: 127-140.
Grassi G, Vicinelli E, Ponti F, Cantoni L, Magnani F (2005). Seasonal and interannual variability of photosynthetic capacity in relation to leaf nitrogen in a deciduous forest plantation in northern Italy. Tree Physiol 25: 349-360.
Han W, Xu XW, Li L, Li SY, Guo LL (2010). Variation of rapid light curves of Ulmus pumila leaves after high-light and low-light acclimation. Arid Zone Research 27: 738-744 (article in Chinese with an abstract in English).
He ZB, Yang JJ, Du J, Zhao WZ, Liu H, Chang XX (2014). Spatial variability of canopy interception in a spruce forest of the semiarid mountain regions of China. Agr Forest Meteorol 188: 58-63.
He ZB, Zhao WZ, Liu H, Tang ZX (2012). Effect of forest on annual water yield in the mountains of an arid inland river basin: a case study in the Pailugou catchment on northwestern China’s Qilian Mountains. Hydrol Process 26: 613-621.
Kimm H, Ryu Y (2015). Seasonal variations in photosynthetic parameters and leaf area index in an urban park. Urban For Urban Gree 14: 1059-1067.
Kanagaraj R, Wiegand T, Kramer-Schadt S, Anwar M, Goyal SP (2011). Assessing habitat suitability for tiger in the fragmented Terai Arc Landscape of India and Nepal. Ecography 34: 970-981.
Kang JJ, Zhao WZ, Zhao M, Li GY, Zhang JQ, Zhang ZS (2015). The type, position and age effect on the cutting reproduction of Picea crassifolia and its rooting mechanism in the Qilian Mountains. J Forest Res 26: 993-1002.
Kattge J, Knorr W, Raddatz T, Wirth C (2009). Quantifying photosynthetic capacity and its relationship to leaf nitrogen content for global-scale terrestrial biosphere models. Glob Change Biol 15: 976-991.
Li Y, Zhao HX, Duan BL, Korpelainen H, Li CY (2011). Adaptability to elevated temperature and nitrogen addition is greater in a high-elevation population than in a low-elevation population of Hippophae rhamnoides. Trees 25: 1073-1082.
Mao PL, Zang RZ, Shao HB, Li YD, Lin MX, Yu JB (2014). The ecological adaptability of four typical plants during the early successional stage of a tropical rainforest. Plant Biosyst 148: 288-296.
GUAN et al. / Turk J Bot
439
Meng QC, Zhang XF, Liu X, Yue M (2011). Photosynthetic mechanisms of northern boundary formation of Quercus wutaishanica forest in Loess Plateau of northern Shaanxi Province. Chinese Journal of Applied Ecology 22: 1409-1415 (article in Chinese with an abstract in English).
Mukhopadhyay S, Masto RE, Yadav A, George J, Ram LC, Shukla SP (2016). Soil quality index for evaluation of reclaimed coal mine spoil. Sci Total Environ 542: 540-550.
Osnas JLD, Lichstein JW, Reich PB, Pacala SW (2013). Global leaf trait relationships: mass, area, and the leaf economics spectrum. Science 340: 741-744.
Podwojewski P, Poulenard J, Nguyet ML, de Rouw A, Nguyen VT, Pham QH, Tran DT (2011). Climate and vegetation determine soil organic matter status in an alpine inner-tropical soil catena in the Fan Si Pan Mountain, Vietnam. Catena 87: 226-239.
Qin Y, Lei HM, Yang DW, Gao B, Wang YH, Cong ZT, Fan WJ (2016). Long-term change in the depth of seasonally frozen ground and its ecohydrological impacts in the Qilian Mountains, northeastern Tibetan Plateau. J Hydrol 542: 204-221.
Reich PB (2014). The world-wide ‘fast-slow’ plant economics spectrum: a traits manifesto. J Ecol 102: 275-301.
Sharkey TD, Bernacchi CJ, Farquhar GD, Singsaas EL (2010). Fitting photosynthetic carbon dioxide response curves for C3 leaves. Plant Cell Environ 30: 1035-1040.
Shi SB, Li HM, Wang XY, Yue XG, Xu WH, Chen GC (2006). Comparative studies of photosynthetic characteristics in typical alpine plants of the Qinghai-Tibet Plateau. Chinese Journal of Plant Ecology 30: 40-46 (article in Chinese with an abstract in English).
Silva EN, Silveira JAG, Ribeiro RV, Vieira SA (2015). Photoprotective function of energy dissipation by thermal processes and photorespiratory mechanisms in Jatropha curcas plants during different intensities of drought and after recovery. Environ Exp Bot 110: 36-45.
Slot M, Kitajima K (2015). General patterns of acclimation of leaf respiration to elevated temperatures across biomes and plant types. Oecologia 177: 885-900.
Sternberg M, Dan Y (2015). Coordinated approaches for studying long-term ecosystem responses to global change. Oecologia 177: 921-924.
Tang ZY, Fang JY (2006). Temperature variation along the northern and southern slopes of Mt. Taibai, China. Agr Forest Meteorol 139: 200-207.
Varone L, Gratani L (2015). Leaf respiration responsiveness to induced water stress in Mediterranean species. Environ Exp Bot 109: 141-150.
Wang Q, Tang Y, Xie T, Wang H (2017). Distinctive responses of photosynthetic characteristics to warming of invasive Alternanthera philoxeroides and native Sambucus chinensis. Acta Ecologica Sinica 37: 770-777 (article in Chinese with an abstract in English).
Wang YX, Li SS, Li HX (2012). Photosynthetic physiological characteristics of Eucalyptus around garbage landfill. Ecology and Environmental Sciences 21: 919-923 (article in Chinese with an abstract in English).
White TA, Searle JB (2009). Ecomorphometric variation and sexual dimorphism in the common shrew (Sorex araneus). J Evolution Biol 22: 1163-1171.
Wilson KB, Baldocchi DD, Hanson PJ (2000). Spatial and seasonal variability of photosynthetic parameters and their relationship to leaf nitrogen in a deciduous forest. Tree Physiol 20: 565-578.
Xu ZL, Zhao CY, Feng ZD (2009). A study of the impact of climate change on the potential distribution of Qinghai spruce (Picea crassifolia) in Qilian Mountains. Acta Ecologica Sinica 29: 278-285 (article in Chinese with an abstract in English).
Yan S, Zhang L, Jing YS, He HL, Yu GR (2014). Variations in the relationship between maximum leaf carboxylation rate and leaf nitrogen concentration. Chinese Journal of Plant Ecology 38: 640-652 (article in Chinese with an abstract in English).
Ye ZP, Kang HJ (2012). Effects of CO2 concentration on the quantum yield in the vicinity of plant light compensation point. Chinese Journal of Plant Ecology 31: 1949-1953 (article in Chinese with an abstract in English).
Zhao CY, Nan ZR, Cheng GD (2005). Methods for modelling of temporal and spatial distribution of air temperature at landscape scale in the southern Qilian mountains, China. Ecol Model 189: 209-220.
Zheng T, Chen J, He LM, Arain MA, Thomas SC, Murphy JG, Geddes JA, Black TA (2017). Inverting the maximum carboxylation rate (Vcmax) from the sunlit leaf photosynthesis rate derived from measured light response curves at tower flux sites. Agr Forest Meteorol 236: 48-66.
Zheng YR, Xie ZX, Jiang LH, Shimizu H, Rimmington GM, Zhou GS (2006). Vegetation responses along environmental gradients on the Ordos plateau, China. Ecol Res 21: 396-404.
Zhou JH, Lai LM, Guan TY, Cai WT, Gao NN, Zhang XL, Yang DW, Cong ZT, Zheng YR (2016). Comparison modeling for alpine vegetation distribution in an arid area. Environ Monit Assess 188: 1-14.
Zhou XB, Zhang YM, Wang SS, Zhang BC, Zhang J (2011). Effect of nitrogen input on growth and photosynthetic physiology of three desert species seedlings. Journal of Desert Research 31: 82-89 (article in Chinese with an abstract in English).
Zou DA, Chi Y, Dong J, Fu C, Ni MJ (2014). Supercritical water oxidation of MSW leachate: factor analysis and behavior of heavy metals. Environ Prog Sustain 33: 1117-1124.


![Leaf Photosynthetic Parameters Related to …Leaf Photosynthetic Parameters Related to Biomass Accumulation in a Global Rice Diversity Survey1[OPEN] Mingnan Qu,a,2 Guangyong Zheng,b,2](https://img.pdfslide.us/doc/110x75/5e82af8633f1a058be1de845/leaf-photosynthetic-parameters-related-to-leaf-photosynthetic-parameters-related.jpg)