Embed Size (px)
Citation preview
Plant Physiol. (1984) 74, 1-60032-0889/84/74/000 1/06/$0 1.00/0
Photosynthetic and Stomatal Responses of Two MangroveSpecies, Aegiceras corniculatum and Avicennia marina, to LongTerm Salinity and Humidity Conditions'
Received for publication April 13, 1983 and in revised form August 5, 1983
MARILYN C. BALL* AND GRAHAM D. FARQUHARP.O. Box 475, Department ofEnvironmental Biology, Research School ofBiological Sciences, AustralianNational University, Canberra, ACT 2601 Australia
ABSTRACTI MATERIALS AND METHODS
Gas exchange characteristics were studied in two mangrove species,Aegiceras cornicalatum (L.) Blanco and Avicennia marina (Forstk.)Vierh. var australasica (Walp.) Moldenke, grown under a variety ofsalinity and humidity conditions. The assimilation rate was measured as
a function of the intercellular CO2 concentration IA(c,) curve]. Thephotosynthetic capacity decreased with increase in salinity from 50 to500 millimolar NaC1, as shown by decline in both the initial linear slopeand the upper plateau of the A(c;) curve, with A. corniculatum being themore sensitive species. The decline in photosynthetic capacity was en-
hanced by increase in the leaf to air vapor pressure difference from 6 to24 millibars, but this treatment caused a decrease in only the upperplateau of the A(cp) curve. Stomatal conductance was such that theintercellular CO2 concentration obtaining under normal atmospheric con-
ditions occurred near the transition between the lower linear and upperplateau portions of the A(c;) curves. Thus, stomatal conductance andphotosynthetic capacity together co-limited the assimilation rate, whichdeclined with increasing salinity and decreasing humidity. The marginalwater cost of carbon assimilation was similar in most treatments, despitevariation in the water loss/carbon gain ratio.
Humidity has been reported to modify the response to salinityin several plant species, presumably because ofinteractive effectsof these factors on carbon gain in relation to water use and hencealso ion uptake. With increasing salinity, increasing humidityadversely affected the growth ofAtriplex halimus, a halophyte ofarid regions ( 14), but ameliorated the reduction in growth in theglycophyte, Gossypium hirsutum (11), and in the mangroves,Aegiceras corniculatum and Avicennia marina (1). The declinein growth rates of the mangrove species with increasing salinityand decreasing humidity was attributed to decrease in both theleaf area/plant mass ratio and A2, with the latter being the majorfactor (1). The present study describes the influence of changesin stomatal conductance and photosynthetic metabolism onwater use in relation to carbon gain by A. corniculatum and A.marina grown under different salinity and humidity regimes.
'This work has been submitted by M. C. B. in partial fulfillment ofthe requirement for the Ph.D. degree.
2Abbreviations: A, photosynthetic CO2 assimilation rate; c,, intercel-lular CO2 concentration; A(c,), assimilation rate as a function of theintercellular CO2 concentration; E, evaporation rate; g, leaf (primarilystomatal) conductance to water vapor, vpd, leaf to air vapor pressure
difference.
Plant Material. Propagules3 of Aegiceras corniculatum (L.)Blanco and Avicennia marina (Forstk.) Vierh. var australasica(Walp.) Moldenke were collected from trees growing along Cul-lendulla Creek, New South Wales, Australia (35°42'S, 150°1 2'E).These propagules were cultivated in sand beds, and subirrigatedwith 10% and 50% seawater, respectively, at which growth ofthe respective species is optimum at this stage of their life cycle(1). The beds were kept in a growth cabinet adjusted to provideday/night leaf temperatures of 25/20°C, RH of 70% to give aleaf to air vpd of approximately 12 mbar, and a 12-h light periodwith quantum flux density of 400 uE m 2 s-' incident on thebed. The propagules were kept in this way for 6 weeks until thecotyledons had senesced and the seedlings had four leaves.
Forty-five seedlings of similar dimensions and fresh weightswere then selected from the populations of each species anddivided into nine groups of five. The seedlings were placed inplastic containers (volume 200 ml for A. corniculatum and 500ml for A. marina) for hydroponic culture. The seawater solutionsinitially used to cultivate the propagules were replaced at a rateof 25%/d with Johnson's nutrient solution (17) amended withthe appropriate concentration of NaCl to maintain the salinity.The salinities were then adjusted at a rate of 50 mM NaCl/d(approximately 10% seawater) to give the three final concentra-tions of50, 250, and 500 mm NaCl. Water levels were maintainedby the addition of demineralized water every other day andsolutions were changed weekly.
Seedlings receiving these salinity treatments were then distrib-uted among three growth chambers adjusted for high, medium,and low humidity regimes to give a total of nine growth condi-tions. RH of approximately 90, 70, and 30% were used to givevpd of 6, 12, and 24 mbar, respectively. The light period was 12h and the average quantum flux density close to the leaves was400 pE m-2 s-', as measured with a Lambda quantum sensor.Day/night air temperatures were adjusted to give average leaftemperatures of 25/20°C. The plants were grown for 3 monthsbefore gas exchange characteristics were studied on leaves whichhad developed fully under the different salinity and humidityregimes. The leaves had been fully expanded for 1 week at thetime of gas exchange measurements.Gas Exchange. Rates of CO2 and water vapor exchange in
intact, attached leaves were determined with an open system gasanalysis apparatus as described by Wong et al. (30) with modi-fications as noted in Ball and Critchley (2). Calculations areaccording to von Caemmerer and Farquhar (29). The conditionsof measurement were similar to those in the growth cabinets, i.e.
3 These mangroves are viviparous species. Seeds germinate on themother tree and develop into seedlings (propagules), which are thedispersive units.
Dow
nloaded from https://academ
ic.oup.com/plphys/article/74/1/1/6079345 by guest on 04 O
ctober 2021
BALL AND FARQUHAR
leaf temperature of 25°C, quantum flux density of 500 uE m-2s-', and vpd of 6, 12, or 24 mbar. Atmospheric pressure averaged950 mbar. Boundary layer conductance to water vapor was 0.4mol m-2 s-'. Assimilation rate was measured as a function oftheintercellular CO2 concentration, ci, by varying the ambient CO2concentration according to the sequence 330, 400, 500, 200, 100,and 50 ,l I-', allowing 30 min at each concentration to permitvariables relating to gas exchange to attain steady state. Allmeasurements were made during normal photoperiods.
Foliar Ion Levels. Leaves were harvested for ion determinationfollowing measurement of their photosynthetic characteristics.Leaves were washed in distilled H20, blotted dry, and weighedbefore oven drying at 80°C to constant weight. The dry tissuewas weighed, pulverized in a mortar and pestle, and added todouble distilled H20 (H1 g tissue/100 ml water). Ions wereextracted by boiling for 2 h. The filtered extract was analyzed forCl- by silver titration with a Buchler-Cotlove chloridometer andfor Na+ and K+ by flame emission spectroscopy with a VarianTechtron Series AA.6 spectrophotometer.
RESULTS
Ion Concentrations in Leaves. The concentrations of Cl-, Na+,and K+ in leaves ofA. corniculatum and A. marina grown underdifferent salinity and humidity conditions are summarized inTable I. Leaves of both species contained high concentrations ofthese ions which accounted for as much as 4% to 10% of thetotal leaf dry weight. There was considerable variability in thedata within humidity treatments, and it appears that the foliarion concentrations may be largely a function of the externalsalinity.
The patterns of ion accumulation differed between species(Table I). The concentrations of Cl- and Na+ were maximum inleaves of A. corniculatum grown in a solution containing 250mM NaCl whereas those of A. marina increased with increasingsalinity of the growth media. The concentrations of Cl- and Na+in leaves exceeded those of the nutrient solutions in which theplants were grown except for Cl- in A. corniculatum grown in500 mM NaCl. Although growth of the latter group of plants wasseverely stunted, they did not show signs of damage. The differ-ence between foliar and substrate concentrations of Cl- and Na+declined with increasing salinity, the differences being greater inA. corniculatum grown in 50 and 250 mm NaCl than in A.marina grown under the same conditions.The concentration of K+ decreased with increasing salinity in
both species, with A. marina maintaining higher foliar levels ofK+ than A. corniculatum (Table I). These concentrations areconsiderably greater than the 6 mm K+ in the nutrient solution.Gas Exchange Characteristics under Normal Atmospheric
Conditions, i.e. Ambient CO2 Concentration of 330 ,ul l` and 210ml Il' 02. The gas exchange characteristics of A. corniculaturnand A. marina grown under different salinity and humiditytreatments are shown in Figure 1. Stomatal conductance declinedwith increasing salinity, thereby causing a proportional decreasein the evaporation rate because the leafto air vpd was maintainedconstant (Fig. 1). In A. corniculatum, the decline in assimilationrate was relatively greater than the decrease in stomatal conduct-ance with increasing salinity. Thus, the assimilation rate declinedwhile the intercellular CO2 concentration (c1) increased (Fig. 1).In contrast, in A. marina the reduction in stomatal conductancewas nearly proportional to the decrease in assimilation rate.
Table I. Contents ofCl-, Na+, and K+ in Leaves ofAegiceras corniculatum and Avicennia marina Grown under Different Salinity and vpdRegimes
Values are mean + SE, n = S except * in which n = 2. ND indicates no data; plants were lost in an accident prior to measurements.
Salinity Humidity NaeSpecies Nal) Humdit Fresh/Dry Weight Cl- Na+ K+
mM mbar g g9' mmol ion kg-' leafwater ratioA. corniculatum 50 6 2.71 ±0.06 360 ± 16 419 ± 30 30 ± 4 14.87 2.99
12 2.84 ± 0.15 343 ± 35 465 ± 76 70 ± 15 8.82 3.5024 2.77±0.11 416± 14 379±32 68± 10 6.65±0.88
Average 2.77 ±0.06 381 ± 14 413 ± 26 58 ± 7 9.49 1.67
250 6 3.69 ± 0.12 462 ± 8 633 ± 4 26 ± 3 25.07 2.3612 3.38 ± 0.19 426 ± 52 709 ± 41 22 ± 2 33.78 5.0824* 3.15±0.35 489± 11 1006± 194 52±8 19.13±0.88
Average 3.41 ± 0.10 459 ± 15 783 ± 98 33 ± 4 25.99 2.24
500 6 3.15±0.54 370± 13 514±5 28±7 21.90±5.3712 3.72±0.06 397±32 571 ±33 36±8 21.00±6.1324 3.26 ± 0.23 308 ± 17 540 ± 34 29 ± 3 19.90 3.20
Average 3.42±0.15 356± 17 547 ± 17 31 ± 3 20.75 2.53
A. marina 50 6 ND ND ND ND ND12 4.00 ± 0.67 337 ± 38 219 ± 27 159 ± 25 1.59 ± 0.3624 3.59±0.15 368±34 204±42 157±21 1.31 ±0.34
Average 3.80±0.29 352±21 212± 19 157± 13 1.53±0.19
250 6 4.18 ± 0.26 482 ± 26 398 ± 37 67 ± 23 6.87 ± 1.5212 3.39 ± 0.09 467 ± 17 403 ± 23 144 ± 22 3.09 ± 0.4724 3.66±0.37 490±63 411 ±54 97±21 4.46± 1.06
Average 3.67 ±0.17 481 ± 25 405 ± 23 105 ± 14 4.50±0.67
500 6 ND ND ND ND ND12 3.47 ± 0.09 534 ± 37 409 ± 48 91 ± 21 5.11 ± 0.7924 3.53±0.11 710±76 611 ±94 105±11 6.18± 1.08
Average 3.50± 0.06 628 ± 41 517 ± 50 98 ± 10 5.68 ± 0.55
2 Plant Physiol. Vol. 74, 1984
Dow
nloaded from https://academ
ic.oup.com/plphys/article/74/1/1/6079345 by guest on 04 O
ctober 2021
PHOTOSYNTHETIC RESPONSES TO SALINITY AND HUMIDITY
250 mM NaCI 500 mM NaCI
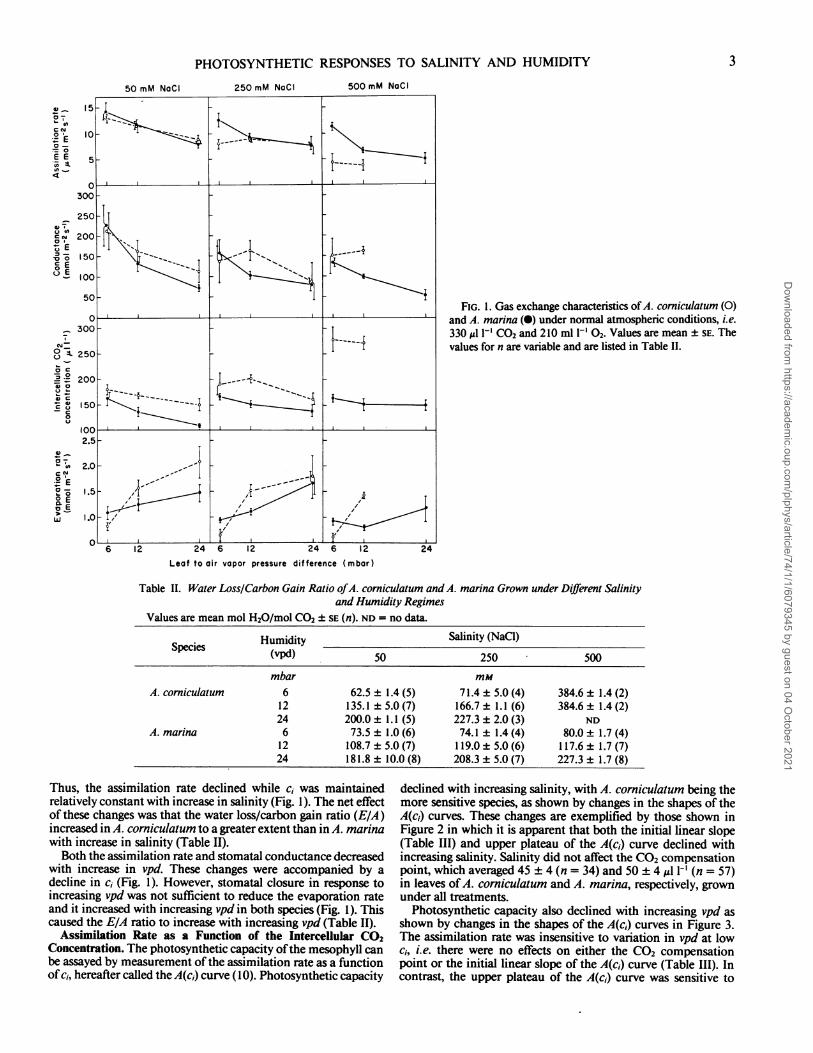
FIG. 1. Gas exchange characteristics of A. corniculatum (0)and A. marina (0) under normal atmospheric conditions, i.e.330 Al I-' CO2 and 210 ml I-' 02. Values are mean ± SE. Thevalues for n are variable and are listed in Table II.
Leaf to air vapor pressure difference (mbar)
Table II. Water Loss/Carbon Gain Ratio ofA. corniculatum and A. marina Grown under Different Salinityand Humidity Regimes
Values are mean mol H20/mol CO2 + SE (n). ND = no data.
Species Humidity Salinity (NaCI)(vpd) 50 250 500mbar mM
A. corniculatum 6 62.5 ± 1.4 (5) 71.4 ± 5.0 (4) 384.6 ± 1.4 (2)12 135.1 ± 5.0 (7) 166.7 ± 1.1 (6) 384.6 ± 1.4 (2)24 200.0 ± 1.1 (5) 227.3 ± 2.0 (3) ND
A. marina 6 73.5 ± 1.0 (6) 74.1 ± 1.4 (4) 80.0 ± 1.7 (4)12 108.7 ± 5.0 (7) 119.0 ± 5.0 (6) 117.6 ± 1.7 (7)24 181.8 ± 10.0 (8) 208.3 ± 5.0 (7) 227.3 ± 1.7 (8)
Thus, the assimilation rate declined while c, was maintainedrelatively constant with increase in salinity (Fig. 1). The net effectof these changes was that the water loss/carbon gain ratio (EIA)increased in A. corniculatum to a greater extent than in A. marinawith increase in salinity (Table II).Both the assimilation rate and stomatal conductance decreased
with increase in vpd. These changes were accompanied by adecline in c, (Fig. 1). However, stomatal closure in response toincreasing vpd was not sufficient to reduce the evaporation rateand it increased with increasing vpd in both species (Fig. 1). Thiscaused the EIA ratio to increase with increasing vpd (Table II).
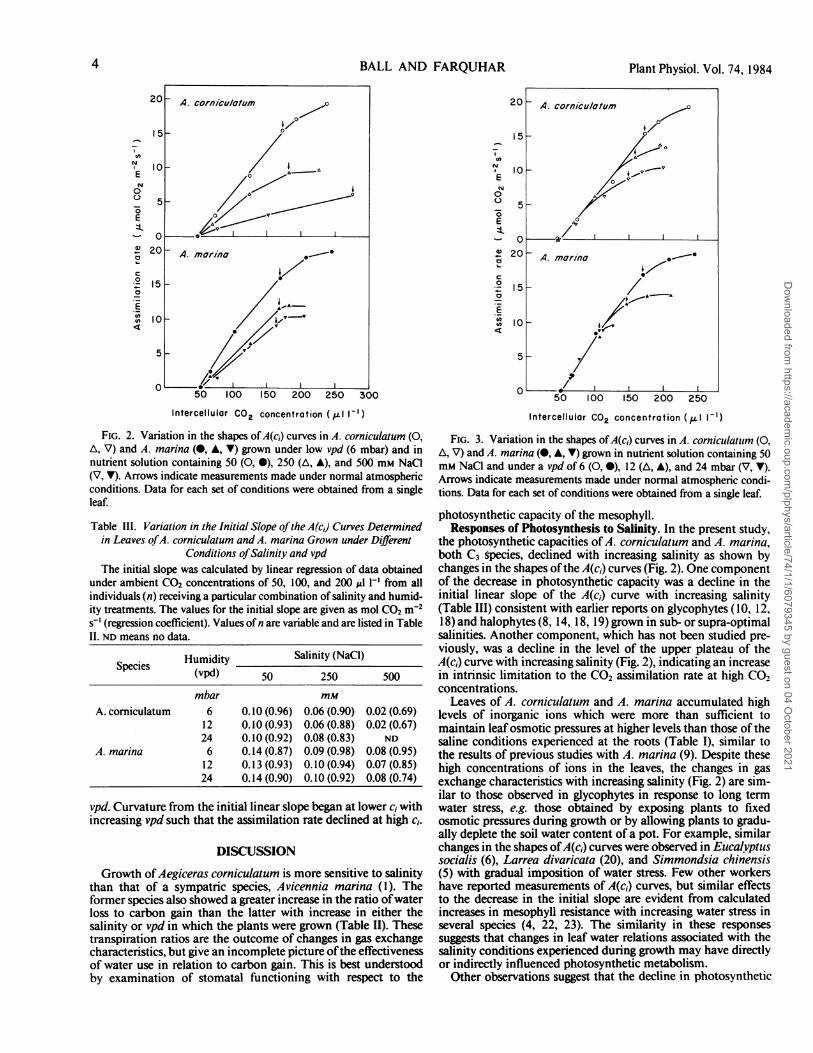
Assimilation Rate as a Function of the Intercellular CO2Concentration. The photosynthetic capacity ofthe mesophyll canbe assayed by measurement of the assimilation rate as a functionof ci, hereafter called the A(c1) curve (10). Photosynthetic capacity
declined with increasing salinity, with A. corniculatum being themore sensitive species, as shown by changes in the shapes of theA(c,) curves. These changes are exemplified by those shown inFigure 2 in which it is apparent that both the initial linear slope(Table III) and upper plateau of the A(c,) curve declined withincreasing salinity. Salinity did not affect the CO2 compensationpoint, which averaged 45 ± 4 (n = 34) and 50 + 4 1-' (n = 57)in leaves of A. corniculatum and A. marina, respectively, grownunder all treatments.
Photosynthetic capacity also declined with increasing vpd asshown by changes in the shapes of the A(ci) curves in Figure 3.The assimilation rate was insensitive to variation in vpd at lowci, i.e. there were no effects on either the CO2 compensationpoint or the initial linear slope of the A(c,) curve (Table III). Incontrast, the upper plateau of the A(ci) curve was sensitive to
50 mM NaCI
3
07
uo,
c clo_ E
7_
OC
EE
*0
00
-c
a-
E
0
7s .2_
O
0 E-ERC
Dow
nloaded from https://academ
ic.oup.com/plphys/article/74/1/1/6079345 by guest on 04 O
ctober 2021
BALL AND FARQUHAR
0
EN0
C)
0
E
7._
.I-a
n0
Intercellular CO2 concentration (,ul l-l)
FIG. 2. Variation in the shapes of A(ci) curves in A. corniculatum (0,A, V) and A. marina (0, A, V) grown under low vpd (6 mbar) and innutrient solution containing 50 (0, 0), 250 (A, A), and 500 mM NaCl(V, V). Arrows indicate measurements made under normal atmosphericconditions. Data for each set of conditions were obtained from a singleleaf.
Table III. Variation in the Initial Slope ofthe A(cJ) Curves Determinedin Leaves ofA. corniculatum and A. marina Grown under Different
Conditions ofSalinity and vpdThe initial slope was calculated by linear regression of data obtained
under ambient CO2 concentrations of 50, 100, and 200 ol 1-' from allindividuals (n) receiving a particular combination of salinity and humid-ity treatments. The values for the initial slope are given as mol CO2 m-2s_' (regression coefficient). Values of n are variable and are listed in TableII. ND means no data.
Humidity Salinity (NaCI)Species vd(vpd) 50 250 500
mbar mMA. corniculatum 6 0.10 (0.96) 0.06 (0.90) 0.02 (0.69)
12 0.10 (0.93) 0.06 (0.88) 0.02 (0.67)24 0.10 (0.92) 0.08 (0.83) ND
A. marina 6 0.14 (0.87) 0.09 (0.98) 0.08 (0.95)12 0.13 (0.93) 0.10 (0.94) 0.07 (0.85)24 0.14 (0.90) 0.10 (0.92) 0.08 (0.74)
vpd. Curvature from the initial linear slope began at lower ci withincreasing vpd such that the assimilation rate declined at high ci.
DISCUSSION
Growth ofAegiceras corniculatum is more sensitive to salinitythan that of a sympatric species, Avicennia marina (1). Theformer species also showed a greater increase in the ratio ofwaterloss to carbon gain than the latter with increase in either thesalinity or vpd in which the plants were grown (Table II). Thesetranspiration ratios are the outcome of changes in gas exchangecharacteristics, but give an incomplete picture ofthe effectivenessof water use in relation to carbon gain. This is best understoodby examination of stomatal functioning with respect to the
2
E
0
E
0
0
0
0c
.8
n
50 100 150 200 250
Intercellular CO2 concentration (pi. 1I1)
FIG. 3. Variation in the shapes of A(c,) curves in A. cornictilattim (0,A, V) and A. marina (0, A, V) grown in nutrient solution containing 50mM NaCl and under a vpd of 6 (0, 0), 12 (A, A), and 24 mbar (V, V).Arrows indicate measurements made under normal atmospheric condi-tions. Data for each set of conditions were obtained from a single leaf.
photosynthetic capacity of the mesophyll.Responses of Photosynthesis to Salinity. In the present study,
the photosynthetic capacities ofA. corniculatum and A. marina,both C3 species, declined with increasing salinity as shown bychanges in the shapes ofthe A(ci) curves (Fig. 2). One componentof the decrease in photosynthetic capacity was a decline in theinitial linear slope of the A(ci) curve with increasing salinity(Table III) consistent with earlier reports on glycophytes (10, 12,18) and halophytes (8, 14, 18, 19) grown in sub- or supra-optimalsalinities. Another component, which has not been studied pre-viously, was a decline in the level of the upper plateau of theA(c,) curve with increasing salinity (Fig. 2), indicating an increasein intrinsic limitation to the CO2 assimilation rate at high CO,concentrations.
Leaves of A. corniculatum and A. marina accumulated highlevels of inorganic ions which were more than sufficient tomaintain leaf osmotic pressures at higher levels than those of thesaline conditions experienced at the roots (Table I), similar tothe results of previous studies with A. marina (9). Despite thesehigh concentrations of ions in the leaves, the changes in gasexchange characteristics with increasing salinity (Fig. 2) are sim-ilar to those observed in glycophytes in response to long termwater stress, e.g. those obtained by exposing plants to fixedosmotic pressures during growth or by allowing plants to gradu-ally deplete the soil water content of a pot. For example, similarchanges in the shapes ofA(c,) curves were observed in Eucalvptutssocialis (6), Larrea divaricata (20), and Simmondsia chinensis(5) with gradual imposition of water stress. Few other workershave reported measurements of A(c1) curves, but similar effectsto the decrease in the initial slope are evident from calculatedincreases in mesophyll resistance with increasing water stress inseveral species (4, 22, 23). The similarity in these responsessuggests that changes in leaf water relations associated with thesalinity conditions experienced during growth may have directlyor indirectly influenced photosynthetic metabolism.Other observations suggest that the decline in photosynthetic
:v A. cornicla/otum o
4/'5-I~~~~~~~~~~~~I0
I~~~~~~~~
50
!O-A. marina 0--
10~~~~~~~~~
5-
4 Plant Physiol. Vol. 74, 1984
,^
2
Dow
nloaded from https://academ
ic.oup.com/plphys/article/74/1/1/6079345 by guest on 04 O
ctober 2021
PHOTOSYNTHETIC RESPONSES TO SAL!NITY AND HUMIDITY
capacity with increasing salinity may be related to internal ionconcentrations, particularly the Na+ to K+ ratio. It increasedwith increasing salinity (Table I), presumably because the highlevels of Na+ present in culture solutions interfered with K+absorption (16, 21, 25, 26). It should be noted that the K+concentration in the nutrient solutions was 6 mm, whereas openseawater typically contains 10 mm K+. Further, the Na+ to K+ratio at the roots would remain constant in dilutions of seawater,whereas the ratio varied as the Na+ level increased from 50 to500 mM in the nutrient solutions of the present study.The decline in the K+ concentration in the leaves (Table I)
was accompanied by decrease in the initial slope of the A(ci)curve (Fig. 2; Table III), which can be a symptom of K+ defi-ciency (24, 27, 28). A. corniculatum apparently has a lowerselectivity for K+ absorption under saline conditions than A.mnarina (Table I) and the decline in the initial slope of the A(c,)curve was greater in the former than in the latter species withincreasing salinity (Table III). Conversely, the photosyntheticcapacity of A. marina was unaffected by the same range ofsalinity (1) when the plants were grown such that the K+ concen-tration of the leaves increased with increasing salinity. It ispossible that A. corniculatum and A. marina may have experi-enced some metabolic dysfunction relating to their requirementsfor K+ and the capacity to satisfy those needs with increasingsalinity.
Responses of Photosynthesis to Humidity. The decline inphotosynthetic capacity with increasing salinity was enhancedby increasing vpd. In contrast to the aforementioned effects ofsalinity, the decrease in photosynthetic capacity with decrease inhumidity was due only to a decline in the level of the upperplateau of the A(c,) curve (Fig. 3). No comparable data from longterm treatments are available. However, it has been shown in asubsequent study on A. marina (1) that exposure to short term(i.e. 2 h and 2 d) changes in vpd, or more specifically in thetranspiration rate, caused reversible effects in the plateau regionof the A(c,) curve similar in magnitude to those reported here.Thus, there may have been little intrinsic effect of vpd experi-enced during growth on the A(c1) characteristics.
Integration of the Responses of Photosynthesis and StomatalConductance to Variation in Salinity and Humidity. Stomata,through their influence on ci, may modify the assimilation rateunder normal atmospheric conditions. This influence ofstomatalconductance is shown by examining the shape of the A(c1) curvewith reference to the operational point at which the leafnormallyfunctions, i.e. the point corresponding to an ambient CO2 con-centration of 330 ,g I-'. These operational points are summarized
1.5 A. cornicul/tum . A. marina
0 0.5 1.0 1.5 2.0 0 0.5 1.0 1.5
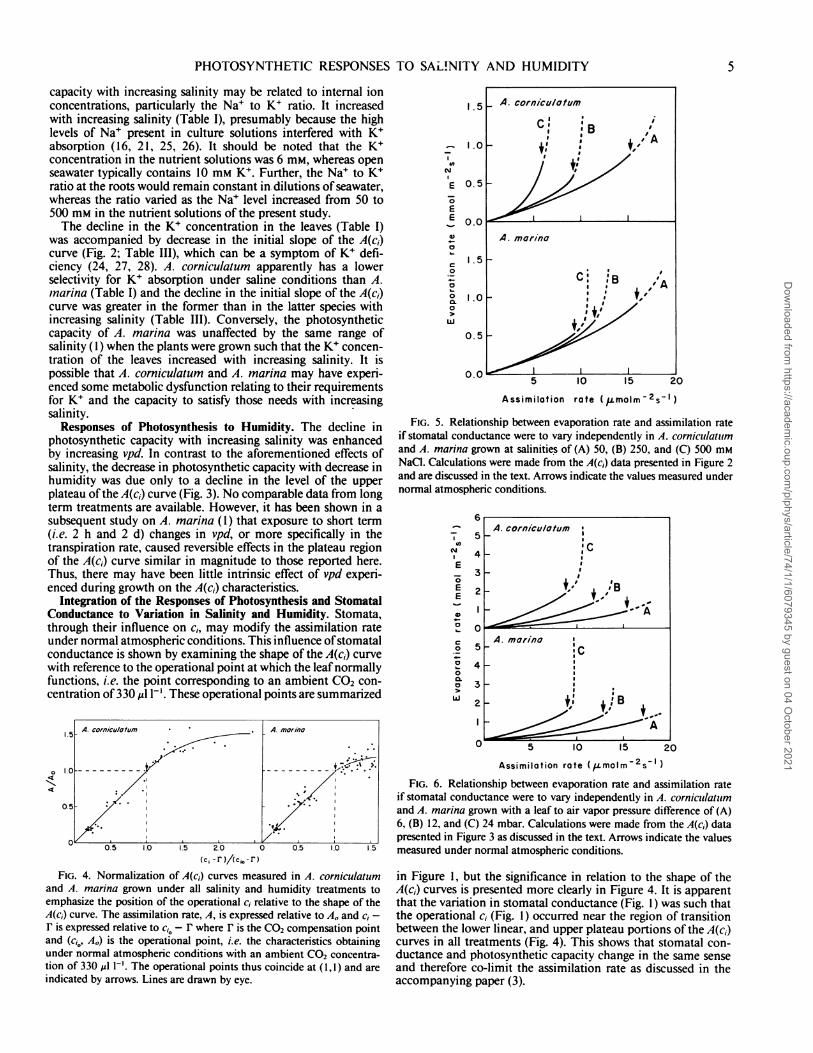
(ci -r )1(Cj.-r)FIG. 4. Normalization of A(c,) curves measured in A. corniculatum
and A. marina grown under all salinity and humidity treatments toemphasize the position of the operational c, relative to the shape of theA(c,) curve. The assimilation rate, A, is expressed relative to AO and c, -F is expressed relative to ci0 - F where r is the CO2 compensation pointand (c,0, AO) is the operational point, i.e. the characteristics obtainingunder normal atmospheric conditions with an ambient CO2 concentra-tion of 330 ,ul 1-'. The operational points thus coincide at (1,1) and areindicated by arrows. Lines are drawn by eye.
I
.
N
E 0.0
_ 0.
I-
CI
0
0o
0
w
0.
0.
5
5 10 15 20
Assimilation rate ( .tmolm-2s-1 )
FIG. 5. Relationship between evaporation rate and assimilation rateif stomatal conductance were to vary independently in A. cornicullatulmand A. marina grown at salinities of (A) 50, (B) 250, and (C) 500 mMNaCI. Calculations were made from the A(c,) data presented in Figure 2and are discussed in the text. Arrows indicate the values measured undernormal atmospheric conditions.
0
E-
EE
0
0
0
w
u 5 10 I5 20
Assimilation rate (,Lrmolm 2s-1 )
FIG. 6. Relationship between evaporation rate and assimilation rateif stomatal conductance were to vary independently in A. cornicullatulmand A. marina grown with a leaf to air vapor pressure difference of (A)6, (B) 12, and (C) 24 mbar. Calculations were made from the A(cj) datapresented in Figure 3 as discussed in the text. Arrows indicate the valuesmeasured under normal atmospheric conditions.
in Figure 1, but the significance in relation to the shape of theA(c,) curves is presented more clearly in Figure 4. It is apparentthat the variation in stomatal conductance (Fig. 1) was such thatthe operational c, (Fig. 1) occurred near the region of transitionbetween the lower linear, and upper plateau portions of the A(c,)curves in all treatments (Fig. 4). This shows that stomatal con-ductance and photosynthetic capacity change in the same senseand therefore co-limit the assimilation rate as discussed in theaccompanying paper (3).
s _ A. cornicula/tum
cC ' 'B I'
5-
A. marina
5
:C B I'AI
5 -
o I_ I_
A. corniculatum ;5
4 c
3-I
-C AA. marina
5-:4
3-I
2 _ I, + B
I _ A'
b
v.
w
Dow
nloaded from https://academ
ic.oup.com/plphys/article/74/1/1/6079345 by guest on 04 O
ctober 2021
6. BALL AND FARQUHAR
The occurrence of the operational c1 in the transition regionof the A(c,) curve has implications for water loss in relation tocarbon gain as shown in Figures 5 and 6. These graphs show thesimultaneous changes in the rates of evaporation and assimila-tion of plants grown under different salinity and humidity con-ditions, respectively, which would occur if stomatal conductancewere the independent variable. These curves were calculatedaccording to Farquhar and Sharkey (11), assuming that leaftemperature remained constant and ignoring the effects ofchanges in the transpiration rate on the assimilation rate (1).Thus, the values of the assimilation rate corresponding to theplateau region of the A(c1) curve are overestimated in Figures 5and 6, and the lines are dashed to emphasize this uncertainty.With c; occurring in the transition region of the A(c,) curve,
further opening of the stomata leading to an increase in c, wouldcause an increase in the assimilation rate which is less thanproportional to the increase in c;, whereas closure would cause adecrease which is proportional. Thus, the sensitivity ofthe assim-ilation rate to change in the stomatal conductance to water vapor,dA/Og, shows large changes in the transition region of the A(c1)curve. In contrast, the evaporation rate varies directly withstomatal conductance provided that the boundary layer con-ductance is comparatively large. Thus, the sensitivity of theevaporation rate to change in stomatal conductance, E/Og,shows little change over the same region of the A(c,) curve. Thiscauses the ratio of these two sensitivities, dE/dA or the marginalwater cost of carbon assimilation (7), to show large changes inthe transition region of the A(c1) curve (3, 29). It is evident thatthere can be a large range of values of OE/6A for which minimalwater loss relative to carbon gain requires the operational c, tobe in the transition region of the A(ci) curve (3, 29) as occurredin the present study under all treatments (Fig. 4). The values ofdPEIA at the operational points in Figures 5 and 6 and in otherdata not shown were approximately 250 mol H20/mol CO2.
In summary, there were substantial differences in both the wayin which photosynthetic metabolism changed with variation insalinity and humidity conditions and in the extent to whichphotosynthesis of A. corniculatum and A. marina was sensitiveto these treatments (Figs. 2 and 3). Despite these differences,stomatal behavior was such that the operational ci occurred inthe transition region of the A(c,) curve (Fig. 4). This behavior hastwo major consequences to the carbon and water economy ofthe leaf. First, the facility with which CO2 was allowed to enterthe leaf was consistent with the capacity of the leaf to assimilateCO2 under all treatments (Figs. 2-4). Second, water loss wasminimum relative to carbon gain (Figs. 5 and 6) even thoughdifferences in the proportionality between stomatal conductanceto water vapor and photosynthetic CO2 assimilation (Fig. 1)caused the transpiration ratio, E/A, to vary (Table II).
Acknowledgments-It is a pleasure to thank Professor C. Barry Osmond andDrs. Eldon Ball, Ian Cowan, and Thomas Sharkey for their thoughtful commentsand criticisms during this study, and Dr. S. C. Wong and Mr. Win Coupland fortechnical expertise.
LITERATURE CITED
1. BALL MC 1981 Physiology of photosynthesis in two mangrove species: Re-sponses to salinity and other environmental factors. Ph.D. thesis. AustralianNational University, Canberra
2. BALL MC, C CRITCHLEY 1982 Photosynthetic responses to irradiance by thegrey mangrove, Avicennia marina, grown under different light regimes. Plant
Plant Physiol. Vol. 74, 1984
Physiol 70: 1101-11063. BALL MC, GD FARQUHAR 1984 Photosynthetic and stomatal responses of the
grey mangrove, Avicennia marina, to transient salinity conditions. PlantPhysiol 74: 7-1 1
4. BUNCE JA 1977 Nonstomatal inhibition of photosynthesis at low water poten-tials in intact leaves of species from a variety of habitats. Plant Physiol 59:348-350
5. COLLATZ GJ 1977 Influences of certain environmental factors on photosyn-thesis and photorespiration in Simmondsia chinensis. Planta 134: 127-132
6. COLLATZ GJ, PJ FERRAR, RO SLATYER 1976 Effects of water stress anddifferential hardening treatments on photosynthetic characteristics of a xe-romorphic shrub, Eucalyptus socialis F. Muell. Oecologia 23: 95-105
7. COWAN IR, GD FARQUHAR 1977 Stomatal function in relation to leaf metab-olism and environment. In DH Jennings, ed, Integration of Activity in theHigher Plant. Cambridge University Press, pp 471-505
8. DE JONG TM 1978 Comparative gas exchange of four California beach taxa,Oecologia 34: 343-351
9. DOWNTON WJS 1982 Growth and osmotic relations of the mangrove, Avicen-nia marina, as influenced by salinity. Aust J Plant Physiol 9: 519-528
10. DOWNTON WJS 1977 Photosynthesis in salt-stressed grapevines. Aust J PlantPhysiol 4: 183-192
1 1. FARQUHAR GD, TD SHARKEY 1982 Stomatal conductance and photosynthesis.Annu Rev Plant Physiol 33: 317-345
12. GALE J, HC KOHL, RM HAGAN 1967 Changes in the water balance andphotosynthesis of onion, bean and cotton plants under saline conditions.Physiol Plant 20: 408-420
13. GALE J, R NAAMAN, A POUAKOFF-MAYBER 1970 Growth of Atriplex halimusL. in sodium chloride salinized culture solution as affected by the relativehumidity of the air. Aust J Biol Sci 23: 947-952
14. GALE J, A POUAKOFF-MAYBER 1970 Interrelations between growth and pho-tosynthesis of salt bush (Atriplex halimus L.) grown in saline media. Aust JBiol Sci 23: 937-945
15. HOFFMAN GJ, SL RAWLINS, MJ GARBER, EM CULLEN 1971 Water relationsand growth of cotton as influenced by salinity and relative humidity. AgronJ 63: 822-826
16. JEFFERIES RL 1973 The ionic relations of seedlings of the halophyte Triglochinmaritima L. In WP Anderson, ed, Ion Transport in Plants. Academic Press,London, pp 297-321
17. JOHNSON CM, PR STOUT, TC BROYER, AB CARLTON 1957 Comparativechlorine requirements of different plant species. Plant Soil 8: 337-353
18. LONGSTRETH DJ, PS NOBEL 1979 Salinity effects on leafanatomy. Plant Physiol63: 700-703
19. LONGSTRETH DJ, BR STRAIN 1977 Effects of salinity and illumination onphotosynthesis and water balance of Spartina alterniflora Loisel. Oecologia31: 191-199
20. MOONEY H, 0 BJORKMAN, GJ COLLATZ 1977 Photosynthetic acclimation totemperature and water stress in the desert shrub Larrea divaricata. CarnegieInst Wash Yearbook 76: 328-335
21. MOZAFAR A, JR GOODIN, JJ OERTLI 1970 Na+ and K+ interactions in increas-ing salt tolerance ofAtriplex halimus L. II. Na+ and K+ uptake characteristics.Agron J 62: 481-484
22. NOBEL PS, DJ LONGSTRETH, TL HARTSOCK 1978 Effect of water stress on thetemperature optima of net CO2 exchange for two desert species. PhysiolPlant 44: 97-101
23. O'ToOLE JC, JL OZBUN, DH WALLACE 1977 Photosynthetic response to waterstress in Phaseolus vulgaris. Physiol Plant 40: 111-114
24. PEOPLES TR, DW KoCH 1979 Role ofpotassium in carbon dioxide assimilationin Medicago sativa L. Plant Physiol 63: 878-881
25. RAINS DW, E EPSTEIN 1967 Preferential absorption of K' by leaf tissue of themangrove Avicennia marina: An aspect of halophytic competence in copingwith salt. Aust J Biol Sci 20: 847-857
26. STOREY R, RG WYN JONES 1979 Responses of Atriplex spongiosa and Suaedamonoica to salinity. Plant Physiol 63: 156-162
27. TERRY N, A ULRICH 1973 Effects ofpotassium deficiency on the photosynthesisand respiration of leaves of sugar beet. Plant Physiol 51: 783-786
28. TERRY N, A ULRICH 1973 Effects ofpotassium deficiency on the photosynthesisand respiration of leaves of sugar beet under conditions of low sodiumsupply. Plant Physiol 51: 1099-1 101
29. VON CAEMMERER S, GD FARQUHAR 1981 Some relationships between thebiochemistry of photosynthesis and the gas exchange of leaves. Planta 153:376-387
30. WONG SC, IR COWAN, GD FARQUHAR 1978 Leaf conductance in relation toassimilation in Eucalyptus pauciflora Sieb. ex Spreng. Plant Physiol 62: 670-674
Dow
nloaded from https://academ
ic.oup.com/plphys/article/74/1/1/6079345 by guest on 04 O
ctober 2021


![Stomatal Biology of CAM Plants1[CC-BY] - Plant … on Stomatal Biology Stomatal Biology of CAM Plants1[CC-BY] Jamie Males* and Howard Griffiths Department of Plant Sciences, University](https://img.pdfslide.us/doc/110x75/5ae808d37f8b9a08778f24b1/stomatal-biology-of-cam-plants1cc-by-plant-on-stomatal-biology-stomatal.jpg)

![Evolution of the Stomatal Regulation of Plant Water ...Update on Stomatal Evolution Evolution of the Stomatal Regulation of Plant Water Content[OPEN] Timothy J. Brodribb* and Scott](https://img.pdfslide.us/doc/110x75/5e87e202c27a1d71d24f112b/evolution-of-the-stomatal-regulation-of-plant-water-update-on-stomatal-evolution.jpg)