Embed Size (px)
Citation preview
1
THE EFFECT OF MOBILE PHONE SHORT
MESSAGE SERVICE (SMS) ON DRUG
ADHERENCE AMONG ADULT HYPERTENSIVE
PATIENTS ATTENDING THE GENERAL OUT-
PATIENT DEPARTMENT OF JOS UNIVERSITY
TEACHING, JOS
A DISSERTATION SUBMITTED TO THE NATIONAL
POSTGRADUATE MEDICAL COLLEGE OF NIGERIA IN PARTIAL
FULFILLMENT OF THE REQUIREMENTS FOR THE AWARD OF
FELLOWSHIP OF THE COLLEGE IN FAMILY MEDICINE (FMCFM)
BY
DR WAKDOK, SABASTINE STEPHEN
M.B.B.S JOS (2006)
DEPARTMENT OF FAMILY MEDICINE,
JOS UNIVERSITY TEACHING HOSPITAL,
JOS, NIGERIA
MAY 2013

2
Declaration
It is hereby declared that this work is original. It has not been presented to any College for
award of fellowship or any University for award of degree. It has not been submitted elsewhere
for publication.
________________________________________
DR WAKDOK, SABASTINE STEPHEN
Date_______________

3
Certification
The study reported in this dissertation was carried out by Dr WAKDOK, SABASTINE
STEPHEN under our supervision. We have also supervised the writing of this dissertation.
SUPERVISORS:
1. SIGNATURE AND YEAR OF FELLOWSHIP_______________________________
DR NIMKONG LAR-NDAM (MBBS, FMCGP)
Consultant Family Physician
Jos University Teaching Hospital, Jos
DATE_______________________
2. SIGNATURE AND YEAR OF FELLOWSHIP__________________________________
DR SIMON L. PITMANG (B.M.B.Ch, FMCGP)
Consultant Family Physician
Jos University Teaching Hospital, Jos
DATE_______________________
3. HEAD OF DEPARTMENT: SIGNATURE_______________________________
DR. J. K. A. MADAKI (MBBS, MA-HMPP, FWACP)
Consultant Family Physician
Head, Department of Family Medicine
Jos University Teaching Hospital, Jos
DATE_______________________

4
DEDICATION
This work is dedicated to my wife, Olije. It was tough for both of us preparing
for the same examination in the same faculty at the same time. Thanks for your
support through this journey.
It is also dedicated to my elder brother Samuel, without whom I would not have
seen the four corners of a University.
To my dad and mum, Mr and Mrs Stephen Wakdok, thanks for giving me life and
to my sisters, Felicia and Priscilla you are the best.
5
Acknowledgement
My gratitude goes to God for the gift of life and his unrelenting faithfulness in my life.
This work would not have seen the light of the day if not for Dr Nimkong Lar-Ndam and Dr
Simon L. Pitmang, my supervisors who led me to the practice of holistic and psychosocial
medicine. Thank you for your sacrifice, dedication and support even when it was not
convenient for you. You donated your leisure time to me, I will never forget this!
I sincerely appreciate my teachers Dr Madaki, Dr Obadofin, Dr Longmut, Dr Dawam and Dr
Isandu for fine tuning my ideas and for their selfless efforts during the development of this
work.
I wish to express my gratitude to the consultants and residents of the Department of Family
Medicine of the Jos University Teaching Hospital for being there for me through my training
period. I appreciate your encouragement and support.

6
TABLE OF CONTENTS
Declaration...........................................................................................................................i
Certification.........................................................................................................................ii
Dedication…………...........................................................................................................iii
Acknowledgement...............................................................................................................iv
Table of Contents ................................................................................................................v
List of Tables ......................................................................................................................ix
List of Figures .....................................................................................................................x
List of Abbreviations ..........................................................................................................xi
Abstract ..............................................................................................................................xiv
Chapter One
1.0 Introduction………………………………………………………………………….....1
1.1 Background .....................................................................................................................1
1.2 Statement of the Problem……….. ..................................................................................5
1.3 Justification of the study…………………………………………………………..........9
1.4 Aim and Objectives………………………………………………………………........10
1.4.1 Aim…………………………………………………………………………………..10
1.4.2 Objectives…………………………………………………………………………....10
Chapter Two
2.0 Literature Review...........................................................................................................12
2.1 Hypertension ...................................................................................................................12
2.1.1 Brief History of Hypertension .....................................................................................12
2.1.2 Definition and classification of Hypertension…..……………………………………12
2.1.3 Epidemiology ...............................................................................................................19
2.1.4 Pathophysiology............................................................................................................26
7
2.1.6 Complications...............................................................................................................31
2.1.7 Management of Hypertension….. ...............................................................................34
2.2 Drug Adherence...............................................................................................................45
2.2.1 Overview.......................................................................................................................45
2.2.2 Definition of Adherence ..............................................................................................45
2.2.3 Measures of drug Adherence........................................................................................46
2.2.4 Drug Adherence in Management of Hypertension…...................................................50
2.2.4.1 Non-Adherence to HypertensionTreatment...............................................................50
2.2.5 Interventions to improve drug Adherence ....................................................................55
2.2.6 SMS and Drug Adherence ............................................................................................58
2.2.6.1 Definition of SMS ......................................................................................................58
2.2.6.2 Role of SMS in Drug Adherence................................................................................58
2.2.7 SMS and Hospital Missed Appointments......................................................................63
Chapter Three
3.0 Methodology ....................................................................................................................68
3.1 Study Design ....................................................................................................................68
3.2 Study Area.........................................................................................................................68
3.3 Study Population................................................................................................................69
3.4 Study Hypothesis ..............................................................................................................69
3.5 Sample size determination.................................................................................................69
3.6 Eligibility ..........................................................................................................................70
3.6.1 Inclusion Criteria...........................................................................................................70
3.6.2 Exclusion Criteria..........................................................................................................70
3.7 Recruitment, Allocation and Randomization...................................................................71
3.8 Instruments of data collection…………………………………………………………..72
8
3.9 Data collection..................................................................................................................72
3.10 Period and duration of Study…………………………………………………………..75
3.11 Data Analysis..................................................................................................................75
3.12 Ethical consideration……………………………………………………………….......76
Chapter Four
4.0 Results .............................................................................................................................77
4.1 Subjects flow through the study ......................................................................................77
4.2 Baseline characteristics of the study groups....................................................................79
4.3 Baseline medical history of the study groups...................................................................82
4.4. Baseline clinical characteristics of the study groups.......................................................86
4.5 Drug Adherence of the study groups………………………………………………........87
4.5.1 Pre-intervention drug Adherence of the study groups………………………………...87
4.5.2 Post-intervention drug Adherence of the study groups……………………………......88
4.6 Blood Pressure of the study groups………………………………………………………91
4.6.1 Baseline blood pressure of both groups……………………………………..................91
4.6.2 Post-intervention blood pressure of both groups………………………….....................93
4.7 Proportion of missed hospital appointments in the study groups…………………….......96
Chapter Five
5.0 Discussion........................................................................................................................99
5.1 Socio-demographic characteristics of the study groups……………………………….100
5.2 Medical history of the study participants………………………………………….......101
5.3 Drug Adherence of the study groups…………………..................................................102
5.4 Blood pressure of the study groups……………………………………………….........105
5.5 Proportion of missed hospital appointments in the study groups……………………...107

9
5.6 Strengths of the study …………………………………………………………………108
5.7 Limitations of the study……………………………………………………………….109
5.8 Conclusion…………………………………………………………………………......110
5.9 Recommendation………………………………………………………………………111
References……………………………………………………………………………….....113
Appendices…………………………………………………………………………….131-140
10
LIST OF TABLES
Table 2.1: JNC classification of blood pressure for Adults……..........................................17
Table 2.2: WHO/ISH classification of blood pressure..........................................................18
Table 2.3: Classes of antihypertensive drugs………………………………........................41
Table 4.1: Baseline socio-demographic characteristics of the study subjects………….......80
Table 4.2: Baseline medical history of the study groups…………………...........................83
Table 4.3: Pre-intervention clinical characteristics of the study groups…………………...86
Table 4.4: Baseline drug Adherence of the study groups………………………………….87
Table 4.5: Post-intervention drug Adherence of the study groups………………………...89
Table 4.6: Logistic regression of factors associated with improvement in Morisky score…90
Table 4.7: Baseline blood pressure of the study groups…………………………................92
Table 4.8: Post-intervention blood pressure of the study groups…………………………...94
Table 4.9: Proportion of missed hospital appointments at 12 weeks in both groups……......96
Table 4.10 Other post-intervention clinical characteristics of the study groups…………....98
11
LIST OF FIGURES
Figure 4.1: Study trial profile................................................................................................78
Figure 4.2: Showing reasons for missed medications in the study groups…………………85
Figure 4.3: Showing number of medications taken by study participants………………….85
Figure 4.4: Showing drug adherence of the study groups at baseline....................................88
Figure 4.5: Showing drug adherence of the study groups at 12 weeks.................................89
Figure 4.6: Showing SBP of the study groups at baseline…………….................................92
Figure 4.7: Showing DBP of the study groups at baseline….................................................93
Figure 4.8: Showing SBP of the study groups at 12 weeks………………………………...95
Figure 4.9: Showing DBP of the study groups at 12 weeks……………………………….95
Figure 4.10: Proportion of missed hospital appointments at 12 weeks……………….........97
Figure 4.11: Number of missed hospital appointments at 12 weeks……………………….97
12
LIST OF ABBREVIATIONS
% Percentage
< Less than
< More/greater than
± Plus or minus
≤ Less than or equals to
≥ More than or equals to
0C Degree(s) Celsius
ACE Angiotensin converting enzyme
ALLHAT Antihypertensive and lipid lowering treatment
to prevent heart attack trial
AIDS Acquired immune deficiency syndrome
BMI Body Mass Index
CVD Cardiovascular disease
Cm Centimetre
DALYS Disability adjusted life years
DASH Dietary Approaches to Stop Hypertension
DBP Diastolic blood pressure
ft feet/foot
g/dl gram(s) per decilitre
g/L gram(s) per litre
Hb Haemoglobin
HDL High density lipoprotein
HIV Human immunodeficiency virus
ISH International society of hypertension
13
JNC Joint National Committee on Prevention, Detection,
Evaluation and Treatment of High Blood Pressure
GOPD General Out-patient Department
JUTH Jos University Teaching Hospital
Kg Kilogram
LVH Left ventricular hypertrophy
M metre(s)
Mm Millimetre(s)
mEq Miliequivalent
NHANES National health and nutrition examination survey
MMAS Modified Morisky Adherence scale
PCV Packed Cell Volume
PHC Primary health care
SMS Short Message Service
SSA Sub-Saharan Africa
SBP Systolic blood pressure
UK United Kingdom
UK NHS United Kingdom National Health Service
USA United States of America
W.H.O World Health Organisation
χ2 Chi- square
14
APPENDICES
Appendix 1: Consent Form ..........................................................................................140
Appendix 2: The Study Questionnaire .........................................................................141
Appendix 3: Drug Adherence instruction sheet ...........................................................145
Appendix 4: Short Message Service (text reminder) ...................................................146
Appendix 5: Modified Morisky scale............................................................................147
Appendix 6: Ethical Clearance......................................................................................149
15
ABSTRACT
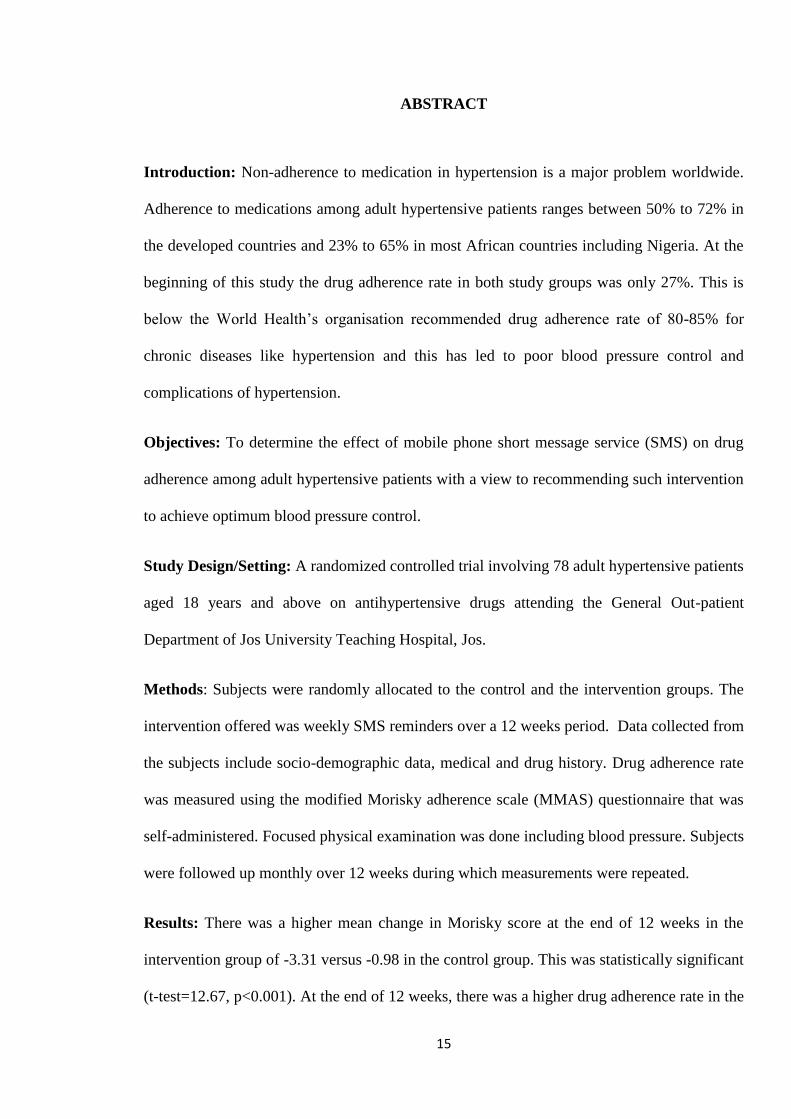
Introduction: Non-adherence to medication in hypertension is a major problem worldwide.
Adherence to medications among adult hypertensive patients ranges between 50% to 72% in
the developed countries and 23% to 65% in most African countries including Nigeria. At the
beginning of this study the drug adherence rate in both study groups was only 27%. This is
below the World Health’s organisation recommended drug adherence rate of 80-85% for
chronic diseases like hypertension and this has led to poor blood pressure control and
complications of hypertension.
Objectives: To determine the effect of mobile phone short message service (SMS) on drug
adherence among adult hypertensive patients with a view to recommending such intervention
to achieve optimum blood pressure control.
Study Design/Setting: A randomized controlled trial involving 78 adult hypertensive patients
aged 18 years and above on antihypertensive drugs attending the General Out-patient
Department of Jos University Teaching Hospital, Jos.
Methods: Subjects were randomly allocated to the control and the intervention groups. The
intervention offered was weekly SMS reminders over a 12 weeks period. Data collected from
the subjects include socio-demographic data, medical and drug history. Drug adherence rate
was measured using the modified Morisky adherence scale (MMAS) questionnaire that was
self-administered. Focused physical examination was done including blood pressure. Subjects
were followed up monthly over 12 weeks during which measurements were repeated.
Results: There was a higher mean change in Morisky score at the end of 12 weeks in the
intervention group of -3.31 versus -0.98 in the control group. This was statistically significant
(t-test=12.67, p<0.001). At the end of 12 weeks, there was a higher drug adherence rate in the
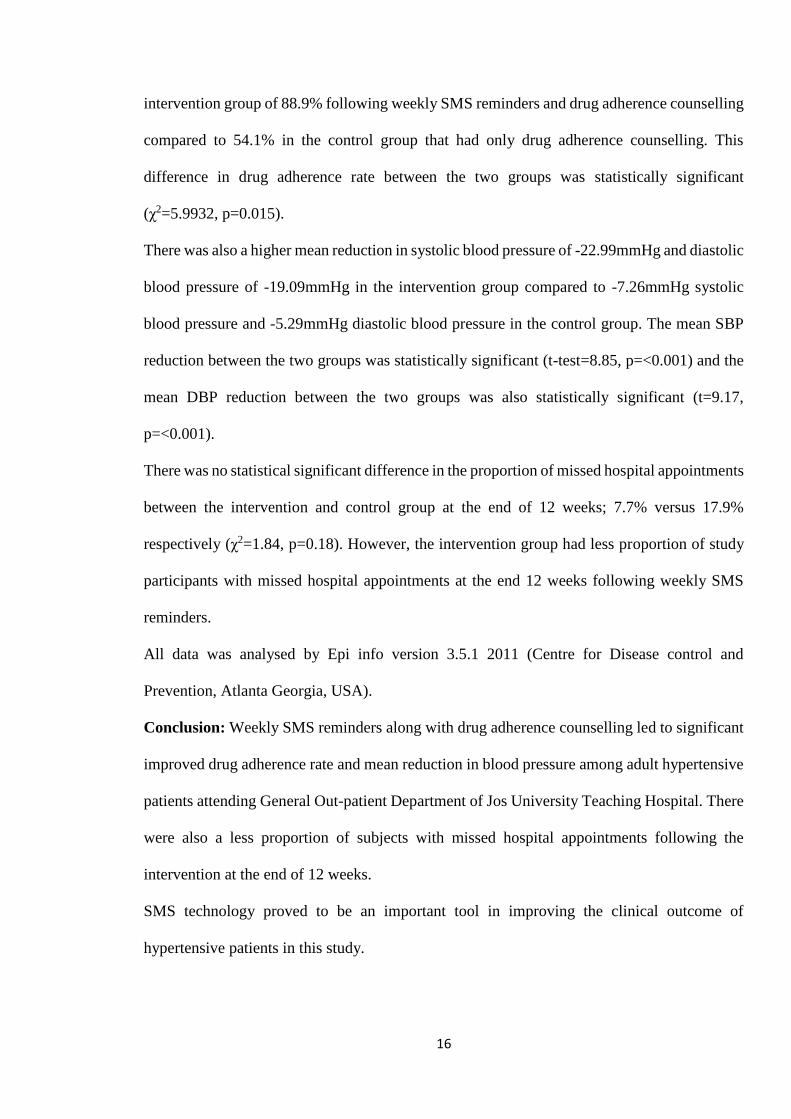
16
intervention group of 88.9% following weekly SMS reminders and drug adherence counselling
compared to 54.1% in the control group that had only drug adherence counselling. This
difference in drug adherence rate between the two groups was statistically significant
(χ2=5.9932, p=0.015).
There was also a higher mean reduction in systolic blood pressure of -22.99mmHg and diastolic
blood pressure of -19.09mmHg in the intervention group compared to -7.26mmHg systolic
blood pressure and -5.29mmHg diastolic blood pressure in the control group. The mean SBP
reduction between the two groups was statistically significant (t-test=8.85, p=<0.001) and the
mean DBP reduction between the two groups was also statistically significant (t=9.17,
p=<0.001).
There was no statistical significant difference in the proportion of missed hospital appointments
between the intervention and control group at the end of 12 weeks; 7.7% versus 17.9%
respectively (χ2=1.84, p=0.18). However, the intervention group had less proportion of study
participants with missed hospital appointments at the end 12 weeks following weekly SMS
reminders.
All data was analysed by Epi info version 3.5.1 2011 (Centre for Disease control and
Prevention, Atlanta Georgia, USA).
Conclusion: Weekly SMS reminders along with drug adherence counselling led to significant
improved drug adherence rate and mean reduction in blood pressure among adult hypertensive
patients attending General Out-patient Department of Jos University Teaching Hospital. There
were also a less proportion of subjects with missed hospital appointments following the
intervention at the end of 12 weeks.
SMS technology proved to be an important tool in improving the clinical outcome of
hypertensive patients in this study.
17
CHAPTER ONE
1.0 INTRODUCTION
1.1 BACKGROUND OF THE STUDY
Chronic diseases are now the major cause of death and disability worldwide, responsible for
59% of deaths and 46% of the global burden of disease.1 The number of persons with chronic
illness is growing at an astonishing rate because of the rapid aging of the population and the
greater longevity of persons with many chronic conditions.2 Diabetes, an important component
of the non-communicable diseases, is undoubtedly a rising problem globally.2
Diabetes mellitus is a metabolic disorder characterized by chronic hyperglycaemia due to
disturbances of carbohydrate, fat, and protein metabolism that are associated with absolute or
relative deficiencies in insulin secretion.3 The number of people with diabetes is increasing due
to population growth, aging, urbanization, and increasing prevalence of obesity and physical
inactivity.4 The dramatic worldwide increase in the prevalence of type 2 diabetes is posing a
massive health problem in both developed and developing countries.5 Interestingly, in
developed countries, lower socioeconomic groups are most affected, while, in developing
countries, the reverse applies.6 The magnitude of the healthcare problem of type 2 diabetes
results not just from the disease itself but also from its association with obesity and
cardiovascular risk factors, particularly dyslipidaemia and hypertension.7
Type 2 diabetes is the predominant form of diabetes in sub-Saharan Africa, accounting for over
90% of cases. As 50% of cases of type 2 diabetes are currently undiagnosed, enhanced
detection and diagnosis are critical.7
Diabetes presents a major challenge to the health care industry now and in the foreseeable
future. However, strategies for the improved management of diabetes and its associated
18
conditions are available. Compelling evidence indicates that controlling glycaemic levels as
well as hypertension and dyslipidaemia in diabetes patients cost-effectively reduces the risk of
related morbidity and mortality and improves their quality of life.8
The epidemic of type 2 diabetes and the recognition that achieving specific glycaemic goals
can substantially reduce morbidity have made the effective treatment of hyperglycaemia a top
priority.9
Diabetes is a complex chronic disorder with major short- and long-term health implications.
Diabetes care hinges on the daily commitment of the person with diabetes to self-management,
balancing appropriate lifestyle choices and pharmacologic therapy. Improving clinical
outcomes in diabetes requires patients to undertake and sustain a complex array of self-care
behaviours, including taking medications, monitoring blood glucose levels, following a diet,
engaging in regular exercise, and caring for their feet. These and other skilled behaviours to
promote health and prevent complications are often called “self-management.” How best to
evaluate and support patients’ diabetes self-management is a critically important question.10
Improving diabetic self-management is critical in improving glycaemic control. Multiple
studies have found that diabetes self-management education (DSME) is associated with
improved diabetes knowledge, improved self-care behaviour and improved clinical outcomes
such as lower HbA1c, improved quality of life, healthy coping, and lower costs. Patients’
behaviour alone does not determine glycaemic control but these studies have shown significant
association between self-management and glycaemic control. However; the studies are cross-
sectional and so it might be that patients with better glycaemic control assess their self-
management as better.
Medical care then must assure that persons with chronic illness have the confidence and skills
to manage their condition; the most appropriate treatments to assure optimal disease control
19
and prevention of complications; a mutually understood care plan; and careful, continuous
follow-up.1
Decades ago, pioneers such as John Runyon recognized that the effective management of
chronic illness requires a new kind of practice designed expressly to help patients meet the
challenges of chronic disease.2 More recently, stronger evidence suggests that busy practices
can redesign their care and do much better than “care as usual.” For example, a Cochrane
Collaboration review carefully examined the more rigorously tested interventions to improve
primary care for diabetes. Among the forty-one studies examined, many showed increases in
recommended care processes such as the prevalence of eye or foot examinations and a few
improved health and disease-control outcomes. Also a few randomized controlled trials
revealed that the group receiving the experimental program achieved average improvements in
blood glucose control (reduction in HbA1c of 1 percent or more) that, if sustained over time,
would result in a 21 percent reduction in mortality, a 14 percent reduction in myocardial
infarction, and a 37 percent reduction in microvascular complications.2
Today’s medical system is optimized for the delivery of acute, episodic care by individual
physicians, yet the primary burden on the system is from chronic illnesses that are not
effectively managed under the current healthcare system.12 Evidence-based guidelines from the
American Diabetes Association (ADA) describe a care pattern that, if followed, would greatly
reduce the impact of diabetes and its complications, yet repeated studies in a variety of settings
continue to show suboptimal processes or outcomes of care.13 The Chronic Care Model (CCM)
was designed by Wagner and colleagues to build on the interrelationships between six
evidence- based elements that lead to improved clinical quality. It aims to facilitate productive
interactions between “informed and activated patients” and “prepared, proactive practice
teams” For example, for patients to engage in proactive care (delivery system design), practices
need to be able to view all of the patients in their panels (clinical information systems) who
20
need certain guideline-based treatments (decision support), and patients must agree to any
changes in their care and integrate them into their lives (self-management support). Increasing
access to effective programming in the community through linkages with the relevant agencies
is a cost-effective way to obtain important services such as nutrition counseling or peer-support
groups (integration of community resources). For all these to occur chronic illness
improvement should be represented in the organization’s goals (healthcare organization
redesign).2,14
Implementation of the CCM from the patient perspective can be assessed using the Patient
Assessment of Chronic Illness Care (PACIC) survey. It focuses on the receipt of patient-
centred care and self-management behaviours. It is a 20-item patient report instrument that
assesses patient’s receipt of clinical services and actions consistent with the CCM.15
Studies done in Nigeria have shown that the morbidity and mortality associated with diabetes
is high due to suboptimal management and noncompliance with global standards.16 Though
these studies were cross-sectional and might not reflect the actual magnitude of the disease.
Studies have also shown the need for restructuring of the healthcare delivery systems in Nigeria
in order to adopt more appropriate and effective preventive treatment strategies in the
management of diabetes in Nigeria.
Interventions based on the CCM have not been widely or systematically adopted in primary
care practices, however, and few data exist to demonstrate that the incremental incorporation
of CCM elements in small, independent primary care practices is associated with better clinical
outcomes.12 These studies are limited by the self- reported nature of both clinician use of CCM
elements and processes of care measures. But the patient report of services and laboratory
ascertainment of physiologic data lends some strength to the associations.
21
Although quality diabetes care is essential to prevent long-term complications, care often falls
below recommended standards regardless of healthcare setting or patient population,
emphasizing the necessity for system change.16
1.2 STATEMENT OF THE PROBLEM
Diabetes is a common chronic disease. It also meets all 3 criteria for a public health disorder
“a high disease burden, changing burden suggesting preventability, and fear that things are
unknown and out of control.”17
The United States and the rest of the world are in the midst of a diabetes epidemic.18 The global
prevalence of diabetes was 8.3% in 2011 and is still on the increase, particularly in developing
countries, where provision and delivery of care is most difficult.4 In Africa, the prevalence is
3.8% and is rapidly on the increase, especially among urban communities. The reason can be
attributed principally to the nature of food consumed and lifestyles adopted. According to
Sobnigwe and colleagues, ‘the prevalence of diabetes mellitus and other non-communicable
diseases is on the rise in African communities due to the ageing of the population and drastic
lifestyle changes and accompanying urbanization and westernization.19
Sub-Saharan Africa is not immune to the process, and is experiencing a triple and in many
instances, a quadruple burden of disease, as the traditional infectious diseases such as malaria
and tuberculosis have been joined by non-communicable diseases in addition to HIV.6 All this
occurs in a region in which over 40% of the population live on less than US$1/day.20
It threatens to overwhelm the healthcare system in the near future. Sadly, the majority of the
people with diabetes in developing countries are within the productive age range of 45–64 years
(179 million). These are the same individuals who are expected to drive the economic engines
of their countries in order to achieve the agreed international development goals. Besides their
22
reduced productivity, diabetes further imposes a high economic burden in terms of healthcare
expenditure, lost productivity, and foregone economic growth.21
Diabetes and its complications impose significant economic consequences on individuals,
families, health systems and countries.21 The threat is growing, the number of people, families
and communities afflicted is increasing. This growing threat is an under-appreciated cause of
poverty and hinders the economic development of many countries.21 Diabetes takes a
staggering toll on the people in Nigeria and the economic burden is heavy.22
In resource-poor countries, shortage of insulin, other drugs, monitoring and laboratory
facilities and trained staff all lead to serious shortfalls in diabetes care.23 The rural areas of
Africa present particular problems, due to scattered populations, difficulties in access to clinic
facilities, poor provision of health care personnel, and shortage of drugs and equipment.24
These factors potentially lead to poor glycaemic control and a high burden of complications.25
Very little research has been carried out concerning care delivery and its problems in such
areas. 24
The growing number of persons suffering from major chronic illnesses face many obstacles in
coping with their condition, not least of which is medical care that often does not meet their
needs for effective clinical management, psychological support, and information.2 The
physical, social, and economic burden of diabetes mellitus result mostly from the complications
of the disease, which occur because of poor compliance to treatment. Studies done in Kano by
Lawan and colleagues showed that diabetic patients are being selective on the use of the disease
control measures prescribed to them by their physicians.26 However, Physicians commonly
ignore this important aspect of diabetic management.
Well-designed interactions between practice team and patient will be needed to complete the
important clinical and behavioral work of modern chronic illness care. Evidence suggests that
23
the typical acute problem–oriented visit practiced in the primary care settings, which is similar
to that practised in Nigeria is a barrier to such care.4
Type 2 diabetes accounts for 90% of diabetes and people living with type 2 diabetes are more
vulnerable to varied forms of both short- and long term complications, which often lead to their
premature death. This vulnerability to increased morbidity and mortality is as a result of the
commonness of this type of diabetes, its insidious onset, and late recognition, especially in
resource-poor developing countries like Nigeria.27 Studies have shown that in Nigeria and
many sub Saharan countries, professional adherence to approved guidelines for diabetes care
is poor. It also showed that Nigerians are at substantial risk of premature death and
complications related to diabetes even while in care.28 A study by Chijioke and collegues in
Ilorin showed that contributory factors to the high mortality were ignorance, poor hygiene,
infections, lack of foot care and inadequate glycaemic/blood pressure control. This emphasises
the importance of early diagnosis of diabetes and proper management.29
To curb this scourge of diabetes, public health interventions are required to prevent diabetes or
delay the onset of its complications.30 This will entail redesigning of the health care structure
with emphasis on self- management education. CCM emphasizes self-management training
and counselling and patient participation as essential in improving outcome in the management
of diabetes.
Diabetes is a major challenge for the health care system and especially for the primary care
provider. There is a dearth of information on the extent to which diabetic patients receive care
congruent with the chronic care model (CCM) and evidence-based behavioural counseling.31
While CCM has been shown to improve the care of patients with chronic illnesses, primary
care physicians have been unprepared in its use, and residencies have encountered challenges
in introducing it into the academic environment.14 The lack of physician training in chronic
illness management is an obstacle.14 This might be due to the fact that there is no laid down
24
CCM protocol in most health care settings, though the fact that aspects of CCM are difficult to
implement due to the low economic status of most patients and lack of electronic medical
records in most primary care settings might be a contributing factor. The public health care
system is overburdened and under-resourced, often leading to overcrowded clinics, inadequate
number of staff, high patient load, short consultation time and poor record keeping. A huge
burden is placed on these public health facilities and may contribute to the quality of care
delivered to chronic disease patients.32
1.3 JUSTIFICATION OF STUDY
The main justification for this study is that the findings may lead to recommendations that
would improve the management of diabetes and outcome of care. Although diabetes, especially
type 2 DM, is a major cause of morbidity and mortality world-wide, the associated burden is
felt more in developing countries like Nigeria because of delays in diagnosis, and late
presentation and poor compliance with recommended management guidelines. Interventions
based on the CCM have not been widely or systematically adopted in primary care practices in
Nigeria. Studies have shown that small primary care practices have been able to incorporate
elements of the CCM into their practice style, often without major structural change in the
practice. Despite advances in the effectiveness of treatment, research shows that patients
frequently do not get the care they want or need.1
Restructuring of the health system is important in order to improve the outcome of care of
chronic illnesses like diabetes in Nigeria. A Cochrane review showed that complex
interventions that only target providers’ behavior did not change patient outcomes unless
accompanied by interventions directed at patients.2 Hence implementation of elements of the
CCM involving patient self- management support is a step in redesigning chronic care in
resource poor countries Nigeria. Because implementing and maintaining CCM requires on-
25
going advocacy as it requires educational and financial support, and a leadership committed to
change.
Family physicians play a key role in chronic disease prevention, identification and management
since they are the frontlines and gateway to the healthcare system.33 A survey done by Madaki
and collegues in Jos University Teaching Hospital General Out-Patient Department in 2007
showed that 3% of the total number of patients seen are diabetic.34 Hence it is one of the
common diseases managed by the family Physician. They are in the best position to deal with
chronic disease. Their unique training, based on the principles of Family Medicine, is well
suited to this challenge. They are skilled clinicians who remain up to date and capable of
incorporating best evidence into clinical regimens as new information emerges.
The doctor-patient relationship is the hallmark of family medicine. As family doctors follow
their patients over time, a trusting relationship develops. This relationship is key to engaging
the patient in the management of own their disease(s) by incorporating self management plans
into their daily lives, an essential element of the Chronic Care Model that encourages high
quality chronic disease care.35 Furthermore, family physicians come to understand the illness
experience of their patient with chronic disease. Patient engagement in the disease process and
management is enhanced when care is provided within the context of the illness experience for
any individual patient.
Family physicians focus on prevention, which is the key to preventing diabetes and further
complications when already established. They coordinate the team based care which is essential
in the management of diabetes. Only family doctors have the dedication to continuity of care
that enhances chronic disease management. They see their patients in the office / clinic, at
home, hospital, and in long term/chronic care settings.
26
Elements of the CCM to be implemented in this study will involve patient self- management
support, aspects of delivery system design through appropriate referral, and integration of
community resources by advocacy to join the local Diabetic association. These are aspects of
the CCM that can be incorporated into the health care delivery in resource poor settings like
Nigeria. Also, counselling on self-management behaviour modification can be effected in
patients irrespective of gender, literacy or financial status. The effect of these interventions on
self- management behaviour and glycaemic control of patients in our setting will be evaluated
and thus identify areas where changes can be made to improve diabetic care. The outcome of
the study could lead to recommendations aimed at improving the outcome of diabetes
management in a cost effective manner.
27
1.4 AIMS AND OBJECTIVES
AIM OF THE STUDY
To determine the effect of the chronic care model on self-management behaviour and
glycaemic control among adults 18 years and above with Type 2 Diabetes attending the
General out-patient department, Jos university teaching hospital (GOPD), JUTH, Jos , Plateau
State with a view to recommending its use in routine care so as to ensure improved diabetes
care in patients.
SPECIFIC OBJECTIVES
1. To determine the mean change in glycated haemoglobin in subjects allocated to the
chronic care model versus usual care.
2. To determine the mean change in self-management behaviour in subjects allocated to
the chronic care model versus usual care.
3. To determine the mean change in Patient Assessment of Chronic Illness Care (PACIC)
scores in subjects allocated to the chronic care model versus usual care using the PACIC
scale.
28
CHAPTER TWO
2.0 LITERATURE REVIEW
2.1 DIABETES MELLITUS
2.1.1 DEFINITION
Diabetes is a group of metabolic diseases of multiple aetiologies characterized by
hyperglycemia due to disturbance of carbohydrate, fats and protein metabolism resulting from
defects in insulin secretion, insulin action, or both.11
2.1.2 EPIDEMIOLOGY
Chronic diseases, such as heart disease, stroke, cancer, chronic respiratory diseases and
diabetes, are by far the leading causes of mortality in the world, representing 63% of all deaths.
Out of the 36 million people who died from chronic disease in 2008, nine million were under
60 and ninety per cent of these premature deaths occurred in low- and middle-income
countries.36
World Health Organization (WHO) projections show that non- communicable diseases (NCDs)
will be responsible for a significantly increased total number of deaths in the next decade. NCD
deaths are projected to increase by 15% globally between 2010 and 2020 (to 44 million
deaths).37 The greatest increases will be in the WHO regions of Africa, South-East Asia and
the Eastern Mediterranean, where they will increase by over 20%. In the African Region, there
are still more deaths from infectious diseases than NCDs.37 Even here, however, the prevalence
of NCDs is rising rapidly and is projected to cause almost three-quarters as many deaths as
communicable, maternal, perinatal, and nutritional diseases by 2020, and to exceed them as the
most common causes of death by 2030.37
In contrast, in the European Region, WHO estimates there will be no increase. In the African
Region, NCDs will cause around 3.9 million deaths by 2020. The regions that are projected to
29
have the greatest total number of NCD deaths in 2020 are South-East Asia (10.4 million deaths)
and the Western Pacific (12.3 million deaths).37
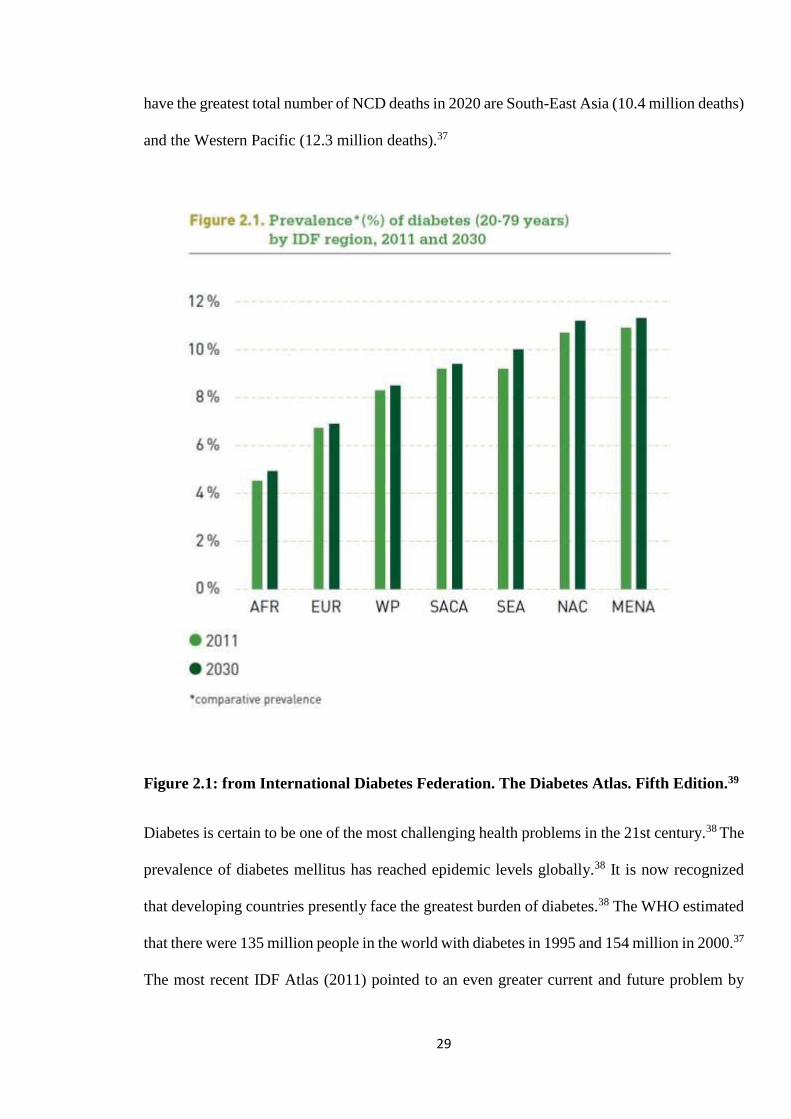
Figure 2.1: from International Diabetes Federation. The Diabetes Atlas. Fifth Edition.39
Diabetes is certain to be one of the most challenging health problems in the 21st century.38 The
prevalence of diabetes mellitus has reached epidemic levels globally.38 It is now recognized
that developing countries presently face the greatest burden of diabetes.38 The WHO estimated
that there were 135 million people in the world with diabetes in 1995 and 154 million in 2000.37
The most recent IDF Atlas (2011) pointed to an even greater current and future problem by
30
calculating that, at present, diabetes affects 366 million people worldwide, with a projected rise
to 552 million by 2030.39 Each report has highlighted the fact that low- and middle-income
countries will bear the brunt of the increase accounting for 80% and that Africa will contribute
significantly to this rise.39 The greatest increases in numbers of people with diabetes over the
next 20 years will occur in low- and middle-income countries.39 This is driven by an increase
in the adult population, people living longer, and through changes in behaviours associated
with rapidly increasing urbanization and development. Key changes in behaviour include
reduced physical activity, a shift to higher calorie diets, and the associated increases in
obesity.40
Type 2 diabetes is now a common and serious global health problem. Type 2 diabetes makes
up about 85 to 95% of all diabetes in high-income countries and may account for an even higher
percentage in low- and middle-income countries. 39 The greatest number of people with
diabetes is in the 40 to 59 age group (179 million).39 It is expected that this number will increase
to 250 million by 2030.39 The majority of people with diabetes in low- and middle-income
countries are under 60 years of age and in the peak of their productive years. This is different
from the age distribution found in high-income countries which has many more people with
diabetes in older age groups. People with poorly managed diabetes or people who do not have
access to proper care and treatment are more likely to miss work due to the consequences of
the disease, which can lead to loss of productivity. This in turn has a negative effect on the
economy in those countries.40
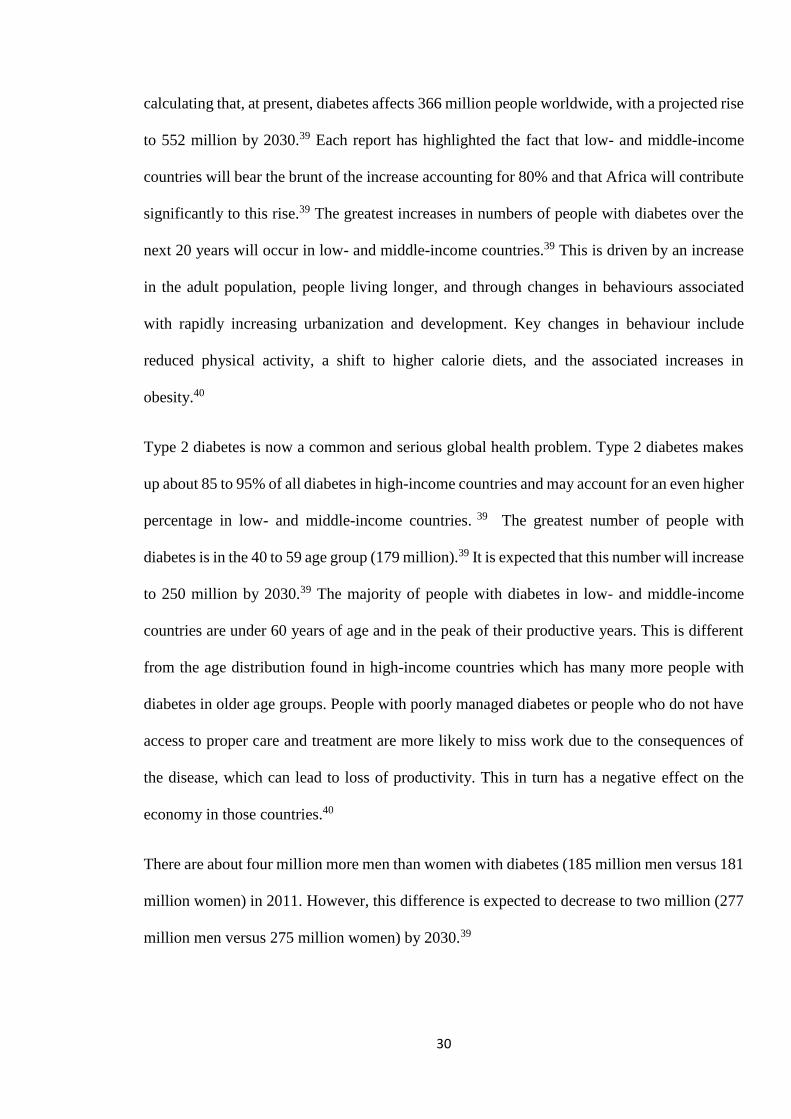
There are about four million more men than women with diabetes (185 million men versus 181
million women) in 2011. However, this difference is expected to decrease to two million (277
million men versus 275 million women) by 2030.39
31
Figure 2.2: From International Diabetes Federation. The Diabetes Atlas. Fifth Edition.39
The lowest rates of type 2 diabetes are found in rural communities where people retain
traditional lifestyles. In low- and middle-income countries, the number of people with diabetes
in urban areas is 172 million while 119 million live in rural areas.39
Currently in the United States, approximately 17 million people or 8.6% of the adult population
aged 20 and older have diabetes. Each year 1 million new cases are diagnosed, yet almost 6
million people, or around one-third of those with diabetes, remain undiagnosed. Another 16 to
26 million people have “pre-diabetes.18
Although the prevalence of diabetes is lower in developing countries; these countries have
experienced the greatest increase in diabetes. In sub-Saharan Africa, the rising prevalence
presents a substantial public health and socioeconomic burden in the face of scarce resources.41
32
The African continent accounted for approximately 14.7million people with diabetes in 2011
with a regional prevalence of 3.8%.42 The Africa Region of IDF, which mainly includes sub-
Saharan Africa, accounted for approximately 7.1 million people with diabetes in 2011.43
Estimates for the region for 2030 are likely to double and reach 28 million.42,43 Nigeria has the
highest number of people with diabetes (3.0 million), followed by South Africa (1.9 million),
Ethiopia (1.4 million), and Kenya (769,000). The top six countries with the highest number of
people with diabetes make up just over half of the total number in the region.42, Reunion has
the highest diabetes prevalence in the African Region (16.3%). followed by Seychelles
(12.4%), Botswana (11.1%) and Gabon (10.6%). Consistent rural-urban disparities in the
prevalence of type 2 diabetes have been noted in SSA with urban areas recording higher rates.
The studies from Tanzania (urban/rural ratio of 5:1) and Cameroon (ratio of 2:1) both confirm
the marked urban/rural discrepancy in diabetes prevalence. It is estimated that undiagnosed
diabetes accounts for 60% of those with the disease in Cameroon, 70% in Ghana and over 80%
in Tanzania.42
More than 90% of cases in Nigeria are type 2 and this is the predominant diabetes all over the
world.44 Diabetes has an age-adjusted prevalence rate of between 1–10% in rural and urban
areas. In Nigeria, with over 250 tribes and different cultures and food values, the prevalence
values has not been uniform.45 Over the past 30 years the prevalence of diabetes has been
increasing steadily. In 1971, a hospital survey by Osuntokun et al46 in Ibadan estimated a
prevalence of 0.4%; In 1989, while screening for Diabetes during a World Diabetes Day in
Lagos metropolis, Ohwovoriole et al47 found a prevalence of undiscovered Diabetes of 1.6%;
A national survey in 1992 by the Non-communicable Disease Expert Committee of the Federal
Ministry of Health recorded a prevalence of 2.2% (National) - lowest 0.5% in Mangu, Plateau
State and highest 7% in Lagos Island,44,45 A survey done in rural South-western Nigeria places
the prevalence at 2.5%, while in another study done in urban Port Harcourt, the crude and
33
standardized prevalence rates of type 2 diabetes was 6.8 and 7.9% respectively.44,45 In a survey
by Puepet among urban adults in Jos metropolis the prevalence of Diabetes was found to be
3.1%.48 More recent studies in Port-Harcourt and Zaria showed a prevalence of 7.9% and 5%
respectively.44,49 A second survey in Jos in 2004 recorded a prevalence of 10.3%.50 The
International Diabetes Federation 2010 country rankings of Diabetes place the prevalence in
Nigeria at 3.9%.52 The difference in prevalence may be due to the fact that Puepet and
colleagues carried out their survey in an urban settlement which usually has a higher prevalence
due to urbanization and western influence, compared to the IDF country rankings which factors
both rural and urban settlements. However the country ranking might also have been under-
reported since they are hospital based reports compared to the community based studies done
by Puepet and colleagues.
2.1.3 DIAGNOSIS
The occurrence of diabetes-specific complications has been used to derive diagnostic cut-points
for diabetes. The diagnosis of diabetes is based on the following criteria:53
1. The spectrum of fasting plasma glucose (FPG) and the response to an oral glucose load
varies among normal individuals.
2. Diabetes is defined as the level of glycaemia at which diabetes-specific complications
occur rather than as deviations from a population-based mean.
Fasting plasma glucose ≥ 7.0 mmol/L (126 mg/dL) or
Symptoms of diabetes plus random blood glucose concentration ≥ 11.1mmol/L (200
mg/dL) or
Two-hour plasma glucose ≥ 11.1 mmol/L (200 mg/dL) during an oral glucose tolerance
test or
34
Glycated haemoglobin HbA1c of ≥ 6.5%.
Random is defined as without regard to time since the last meal. Fasting is defined as no caloric
intake for 8 – 12 hours. The oral glucose tolerance test should be performed as recommended
by the World Health Organisation (WHO); using a glucose load containing the equivalent of
75g anhydrous glucose dissolved in water.53 The diagnostic test should be performed using a
method that is certified by the National Glycohemoglobin Standardization Program (NGSP)
and standardized or traceable to the Diabetes Control and Complications Trial (DCCT)
reference assay.11
CLASSIFICATION
WHO (1999) classify diabetes into four clinical groups:11
I. Type 1 diabetes (β-cell destruction, usually leading to absolute insulin deficiency)
A. Immune-mediated
B. Idiopathic
II. Type 2 diabetes (may range from predominantly insulin resistance with relative insulin
deficiency to a predominantly insulin secretory defect with insulin resistance)
III. Other specific types of diabetes
A. Genetic defects of β -cell function
B. Genetic defects in insulin action
C. Diseases of the exocrine pancreas
D. Endocrinopathies
E. Drug- or chemical-induced
F. Infections
35
G. Uncommon forms of immune-mediated diabetes
H. Other genetic syndromes sometimes associated with diabetes
IV. Gestational diabetes mellitus (GDM)
2.1.5 PATHOPHYSIOLOGY
Plasma glucose concentration is a function of the rate of glucose entering the circulation
(glucose appearance) balanced by the rate of glucose removal from the circulation (glucose
disappearance).54 The maintenance of normal glucose homeostasis is largely dependent on
three factors: normal insulin secretion by pancreatic beta-cells in response to glycaemic
stimulus, ability of insulin to inhibit endogenous hepatic glucose production (insulin
sensitivity), and to some extent, the ability of the glucose to independently suppress hepatic
output (glucose selective).54
In the post absorptive state the majority of total body glucose disposal takes place in insulin-
independent tissues. Thus, approximately 50% of all glucose use occurs in the brain, which is
insulin-independent and becomes saturated at a plasma glucose concentration of approximately
40 mg/dL.55 Another 25% of glucose disposal occurs in the splanchnic area (liver plus gastro
intestinal tissues), which is also insulin-independent. The remaining 25% of glucose use in the
post absorptive state takes place in insulin-dependent tissues, primarily muscle, and to a lesser
extent adipose tissue. Basal glucose use, approximately 2.0 mg/kg/min, is precisely matched
by the rate of endogenous glucose production. Approximately 85% of endogenous glucose
production is derived from the liver, and the remaining 15% is produced by the kidney.56
Glycogenolysis and gluconeogenesis contribute equally to the basal rate of hepatic glucose
production. Following glucose ingestion, the increase in plasma glucose concentration
stimulates insulin release, and the combination of hyperinsulinemia and hyperglycemia
stimulates glucose uptake by splanchnic (liver and gut)and peripheral (primarily muscle)
36
tissues and suppresses endogenous(primarily hepatic) glucose production.57 The majority
(80%–85%) of glucose uptake by peripheral tissues occur in muscle, with a small amount (4%–
5%) metabolized by adipocytes.56 Although fat tissue is responsible for only a small amount of
total body glucose disposal, it plays a very important role in the maintenance of total body
glucose homeostasis by regulating the release of free fatty acids (FFA)from stored triglycerides
and through the production of adipocytokines that influence insulin sensitivity in muscle and
liver. Impaired insulin secretion is found uniformly in type 2 diabetic patients in all ethnic
population.57 Early in the natural history of type 2diabetes, insulin resistance is well established
but glucose tolerance remains normal because of a compensatory increase in insulin secretion.
In type 2 diabetics, the fasting plasma insulin concentration is normal or increased and basal
insulin secretion is elevated. As the fasting glucose rises from 80 to 140 mg/dL, the fasting
plasma insulin concentration increases progressively, reaching a peak value 2.0–2.5-fold
greater than in normal weight, non-diabetic, age-matched controls. The progressive rise in
fasting plasma insulin level can be viewed as an adaptive response of the pancreas to offset
the progressive deterioration in glucose homeostasis. When the FPG exceeds 140 mg/dL, the
beta cell is unable to maintain its elevated rate of insulin
secretion, and the fasting insulin concentration declines precipitously. This decrease in fasting
insulin level has important physiologic implications, because it is at this point that hepatic
glucose production (the primary determinant of the FPG concentration) increases.56 A number
of pathogenic genetic and acquired factors have been implicated in the progressive
impairment in insulin secretion. Pancreatic beta cells are in a constant state of dynamic change,
with continued regeneration of islets from ductal endothelial
cells of the exocrine pancreas and simultaneous apoptosis.58
The pathophysiology of type 2 diabetes is multi-faceted and includes insulin secretion from
pancreatic islet cells, insulin resistance in peripheral tissues, and inadequate suppression of
37
glucagon production. These processes result in inadequate uptake, storage, and disposal of
ingested glucose accompanied by elevated hepatic production of glucose and hyperglycemia.
Loss of β-cell mass in the pancreatic islets can progress to a clinically significant degree even
in patients with IGT, such that at the time of diagnosis of type 2 diabetes, a significant number
of cells may already be lost.59 Bakari and colleagues in Northern Nigeria, in their work found
significant (60%) pancreatic beta cell dysfunction among type 2 diabetic patients.60
Apart from genetic predisposition, acquired factors causing insulin resistance include central
obesity and physical inactivity. Excess production of free fatty acids and over expression of
tumour necrosis factor alpha (TNF) by adipocytes are proposed mechanisms for the
development of insulin resistance. Both hepatic and peripheral insulin resistance result in
abnormal glucose production by the liver i.e. increase hepatic glucose output. In addition, the
production of glucose by the liver is regulated by the relative actions of insulin and glucagon
to suppress or activate glucose production respectively.56
Multiple genes have been identified that are involved in the development of type 2 diabetes,
increasing our understanding of the pathophysiology of type 2 diabetes and offering potential
new treatment options. Newer therapies for the management of type 2 diabetes include incretin-
based agents, which act by targeting many of the key pathophysiologic processes in type 2
diabetes, including enhancing insulin secretion and inhibiting glucagon production.59
2.1.6 COMPLICATIONS
People living with type 2 DM are more vulnerable to varied forms of both acute and chronic
complications, which often lead to their premature death. This vulnerability to increased
morbidity and mortality is seen in patients with type 2 diabetes because of the commonness of
38
this type of diabetes, its insidious onset and late recognition, especially in resource-poor
developing countries like Nigeria.61
Acute complications
Acute symptoms of diabetes are due to severe hyperglycaemia and include polyuria,
polydipsia, polyphagia, weight loss and blurred vision. Patients may exhibit increased
susceptibility to infections. Acute complications occurring in diabetes can broadly be divided
into metabolic and non-metabolic. The non-metabolic complications include severe infections
such as sepsis, malignant externa otitis etc. The acute metabolic (hyperglycaemic)
complications which include: Diabetic Ketoacidosis (DKA), Hyperglycaemic Hyperosmolar
State (HHS) and lactic acidosis.61 The underlying pathophysiological problem is absolute
(DKA) or relative DKA by definition consists of the occurrence of a triad: hyperglycaemia,
ketonaemia and high anion gap metabolic acidosis.61 HHS similar but different from DKA in
that ketonaemia is minimal, hyperglycaemia and osmolality are much higher and consequently,
dehydration is more severe.61 The basic underlying mechanism for both disorders is a reduction
in the net effective action of circulating insulin coupled with a concomitant elevation of counter
regulatory hormones such as glucagon, catecholamines, cortisol, and growth hormone.61 In
patients with DKA, the deficiency of insulin can be absolute or it can be insufficient relative to
an excess of counterregulatory hormones which rise in response to stress like infection, trauma
etc.61 In HHS, there is a residual amount of insulin secretion that minimizes ketosis but does
not control hyperglycemia. This leads to severe dehydration and impaired renal function,
leading to decreased excretion of glucose. These factors coupled with stress result in a more
severe hyperglycaemia than that seen in DKA. In addition, inadequate fluid intake contributes
to the hyperosmolality without ketosis, the hallmark of HHS. The clinical presentation of DKA
and HHS are similar, though with few areas of major difference. The patient with DKA is
usually young and lean while HHS is usually elderly. Both present with prostration, polyuria,
39
polydipsia and often have alteration in level of consciousness.61 Major areas of differences are
that clinical evolutions of symptoms tend to be relatively more rapid in DKA than HHS, usually
over a period of 2-3 days. Patients with DKA may also present with nausea and vomiting, and
occasionally abdominal pain. Kussmaul (fast and deep) breathing may occur in both types, but
especially in DKA. Other physical findings include dehydration, tachycardia and
hypotension.61
In the United States of America (USA) DKA occurs at the rate of 5-8 episodes per 1000 patients
with DM. In recent studies in the USA, it was estimated that hospitalizations for DKA during
the past two decades are increasing. The mortality rate of DKA prior to insulin treatment was
100%.62 With insulin treatment it is now at about 2% in good Centres. The mortality of HHS
is higher at about 15%.62 Although the mortality rate of these complications is reducing in
Western developed countries,63 the situation has not changed in developing countries like
Nigeria.61
In the Lagos University Teaching Hospital (LUTH), Hyperglycemic complications accounted
for 2.4% of all admissions and 27.8% of DM related admissions.62 Okoro and colleagues64 in
Ilorin reported a crude mortality rate of 22% and 25% for DKA and HHS respectively. More
recently, Ogbera and colleagues65 reported a crude mortality rate of 20% among 111 diabetic
patients in Lagos. These studies are however hospital based, hence actual figures might be
higher. Ignorance about diabetes and its acute complications, financial constraints, and an
inefficient health care system may be some of the factors responsible for this high mortality.65
Chronic complications
Chronic complications occur as a result of long term effect of hyperglycaemia. The risk of
developing diabetic complications is proportional to both the magnitude and duration of
hyperglycemia. Persistent hyperglycaemia leads to vascular damage and eventually end-organ
40
damage.66 Well-conducted epidemiological data regarding chronic diabetic complications in
Africa are limited. Most reports have small samples derived from tertiary referral clinics,
underlining the need for larger scale community-based studies. However, there is little doubt
that the prevalence of complications has increased in keeping with the rising occurrence of
diabetes.67
Generally, the injurious effects of hyperglycaemia are separated into macrovascular
complications (coronary artery disease, peripheral arterial disease, and stroke) and
microvascular complications (diabetic nephropathy, neuropathy, and retinopathy).66
Hyperglycemia, as assessed by the hemoglobin A lc (HbA 1c) measurement, is the prime cause
of diabetic microvascular complications and plays a role in the premature and accelerated
development of diabetic macrovascular complications.68
Most Nigerian diabetics have suboptimal glycaemic control, are hypertensives, and have
chronic complications of DM. Improved quality of care and treatment to target is recommended
to reduce diabetes-related morbidity and mortality.69
Diabetes Retinopathy
Diabetic retinopathy (DR) is a complication of diabetes mellitus (DM) that affects the blood
vessels of the retina and leads to blindness. The progression of retinopathy is gradual,
advancing from mild abnormalities, characterized by increased vascular permeability, to
moderate and severe non-proliferative diabetic retinopathy, characterized by the growth of new
blood vessels on the retina and posterior surface of the vitreous. DR is one of the most serious
complications of diabetes.70 Diabetic retinopathy is the leading cause of blindness in adults
between the ages of 20 and 65 in industrialized countries.71 It is said to account for 12% of new
cases of blindness in the USA and 11.9% of all blind registration in those aged 16–64 years in
the United Kingdom.72 Diabetic retinopathy is also a leading cause of blindness in developing
41
countries.73 Mbanya and Sobngwi looked at data for the prevalence of diabetic complications
in Africa and reported that retinopathy was present in 16–55% of people with diabetes.74
Ashaye and colleagues reported a prevalence of 42.1%.72 while studies done in LUTH showed
that it was the commonest diabetic chronic complication and was seen in 65% of patients.73
Diabetes Nephropathy
Diabetic nephropathy is the leading cause of renal failure in the United States. It is defined by
proteinuria > 500 mg in 24 hours in the setting of diabetes, but this is preceded by lower degrees
of proteinuria, or “microalbuminuria.” Microalbuminuria is defined as albumin excretion of
30-299 mg/24 hours. Without intervention, diabetic patients with microalbuminuria typically
progress to proteinuria and overt diabetic nephropathy.66 It is the leading cause of kidney
disease in patients starting renal replacement therapy and affects approximately 40% of type 1
and type 2 diabetic patients.75 Screening for diabetic nephropathy must be initiated at the time
of diagnosis in patient with type 2 diabetes,76 since approximately 7% of them already have
microalbuminuria at that time (Adler et al., 2003).75 However, the prevalence of
microalbuminuria before 5 years in this group can reach 18% especially in patients with poor
glycaemic and lipid control and high normal blood pressure levels.77 It is a leading cause of
end stage renal disease in Nigeria. The prevalence rose from 7% in 1967 to 56.5% in 1999.78
A study done in 2009 in Southern Nigeria revealed a prevalence of 72.63%.79
Diabetic neuropathy
Diabetic neuropathy is recognized by the American Diabetes Association (ADA) as “the
presence of symptoms and/or signs of peripheral nerve dysfunction in people with diabetes
after the exclusion of other causes.66 Diabetes can affect the somatic and autonomic nervous
system. Diabetes is the leading cause of neuropathy in the Western world, and neuropathy is
42
the most common complication and greatest source of morbidity and mortality in diabetes
patients.80 It is estimated from a comprehensive collection of epidemiologic studies that the
prevalence of neuropathy in diabetes patients is approximately 30% in hospital patients and
20% in community patients. The primary risk factor for diabetic neuropathy is
hyperglycemia.80 Neuropathy is associated with pain in about 4% to 5% of all patients with
diabetes.66 Peripheral neuropathy is the most common chronic complication of diabetes.81 It is
the main risk factor in the pathogenesis of foot ulceration in diabetic patients.82 The diabetic
foot, characterised by the triad of neuropathy, infection, and ischaemia is a common and serious
complication of diabetes with associated long periods of hospitalization of the affected patient
and the risk of limb amputation.83
Foot complications in Africa are mainly as a result of infection in the neuropathic foot rather
than due to PVD.82 Although with the rapid urbanisation of communities across Africa, the
prevalence is on the increase. Chijioke and colleagues observed that diabetic foot ulceration
and gangrene were responsible for 40% of limb amputations, with about 35% of these
complicated by severe infection which accounted for 25% mortality in diabetic ketoacidosis.
The majority of the patients were traders and civil servants who were ignorant about foot care.29
Comprehensive foot care programs can reduce amputation rates by 44% to 85%.84 Since
peripheral arterial disease (PAD) is a major risk factor for lower-extremity amputation84 and
many patients are asymptomatic, screening for PAD is another important way to prevent
amputations.85
Diabetic autonomic neuropathy
Autonomic neuropathy can cause postural hypotension, vomiting, diarrhoea, bladder paresis,
impotence,sweating abnormalities, impaired light reflex, impotence and retrograde ejaculation.
Abnormal heart rateresponses and prolonged QT intervals have been associated with increased
43
risk of sudden death. The symptoms and signs of autonomic dysfunction should be elicited
carefully during the history and physical examination.11,88
Erectile Dysfunction
Erectile dysfunction (ED) is one of the chronic complications seen in men with diabetes
mellitus. Autonomic neuropathy is a common cause of ED, although vascular, psychogenic,
and endocrine factors are also important in its aetiology.87 The prevalence of ED in persons
with diabetes is between 35 and 75%.87; Shaeer and colleagues 88 reported a prevalence of
63.3% in Nigeria, while Olarinoye and colleagues89 reported a prevalence rate of 74% thus
showing a high prevalence of ED in diabetes. Adding screening and treatment for
complications can have a large impact on the quality of life for patients with diabetes.
Cardiovascular Disease
The clinical spectrum of cardiovascular disease is coronary heart disease, cerebrovascular
disease and peripheral vascular disease. Coronary heart disease includes; Angina (which may
be silent), acute coronary artery syndrome, congestive cardiac failure and sudden death.
Cerebrovascular accident includes; Stroke, transient ischaemic attacks and dementia. And
peripheral vascular disease includes; intermittent claudication, foot ulcers and gangrene.90 The
pathophysiology of the link between diabetes and cardiovascular disease (CVD) is complex
and multifactorial.91 Atherosclerosis is the major threat to the macrovasculature for patients
with and without diabetes.92 Cardiovascular disease (CVD) accounts for 50% of diabetes-
associated deaths.93 Women with diabetes and CVD, regardless of menopausal status, have a
four- to sixfold increase in the risk of developing CVD, whereas men with diabetes have a two-
to threefold increased risk of CVD compared to women and men without diabetes.94 In 2002,
a survey of people in the United States with diagnosed diabetes found that, surprisingly, 68%
of patients did not consider themselves at risk for heart attack or stroke.95 Ogbera and
44
colleagues reported that Cerebrovascular Accidents (CVA) had one of the highest case fatality
rates of 25%.96Timely and accurate diagnosis can lead to appropriate preventive and
therapeutic interventions and lower mortality rates.96
2.1.7 MANAGEMENT
Type 2 diabetes is not a particularly well-managed disease, with fewer than 50% of patients
meeting glycaemic targets, even in developed countries. More disturbingly, fewer than 10%
achieve glycaemic, lipid and blood pressure targets, despite evidence that multifactorial
interventions are extremely effective at improving morbidity and mortality outcomes.97
Management of diabetes in Nigeria is suboptimal with poor outcomes.16 There is a need for
improved management of diabetes in Nigeria.98
The overall goal of diabetes management is to help individuals with diabetes and their families
gain the necessary knowledge life skills, resources, and support them to achieve optimal health.
This is especially important as 95 % of diabetes care is provided by people with diabetes
themselves, and their families. Diabetes management is improved by: Early diagnosis,
prevention, prompt treatment, promotion of self-care practices and empowerment of people
with diabetes and reduction of the personal, family and societal burden of diabetes.90
A complete medical evaluation is performed to classify the diabetes, detect the presence of
diabetes complications.90 Diabetic history, both recent and historical. Symptoms of potential
complications are assessed. Also important is the social history such as level of exercise, type
of diet, smoking history, use of alcohol and recreational drugs. Important physical
examinations include weight, height and body mass index (BMI). Examination of the feet (for
ulcers and loss of sensation), blood pressure measurement, examination of peripheral pulses
and fundoscopy is also an essential part of assessment. Previous treatment and glycaemic
control in patients with established diabetes should be reviewed and patients assisted in
45
formulating a management plan . Laboratory tests appropriate to the evaluation of each
patient’s medical condition are usually done. Record-keeping is important to ensure good
quality of care and for follow-up and monitoring.11,90
Management of Type 2 diabetes entails the following components:11,90
1. Treatment of hyperglycaemia
Non –pharmacological which involves lifestyle modification through:
Education
Diet
Physical activity
Pharmacological
Oral glucose lowering agents(oral hypoglycaemic agents)
Insulin
Combination Therapies - Oral glucose lowering agents and insulin
2. Treatment of hypertension and dyslipidaemias
3. Prevention and treatment of microvascular complications
4. Prevention and treatment of macrovascular complications
2.1.7.1 Non-pharmacological
Diabetes education is the provision of knowledge and skill to people with diabetes that will
empower them to render self-care in the management of their diabetes and associated disorders.
This is one of the cornerstones of management together with diet, physical activity and
pharmacotherapy, and is critical in improving the outcome.90
Diet
46
Dietary modification is one of the cornerstones of diabetes management, and is based on the
principle of healthy eating in context of social, cultural and psychological influences of food
choices. Dietary modification and increasing level of physical activity are the first steps in the
management of newly diagnosed people with Type 2 diabetes, and have to be maintained. All
members of the diabetes-care team must have knowledge about nutrition to be able to educate
people with diabetes about dietary measures. Dietary counseling is best given by a dietitian or
nutritionist with an interest in diabetes mellitus.90,99 To achieve ideal weight loss, an
appropriate diet is prescribed together with an exercise regimen. Caloric restrictions are
moderate and provide a balanced nutrition. Patients are advised to eat at least three meals a day
and binge eating avoided. The diet is individualized, based on traditional eating patterns
ensuring it is palatable and affordable. Animal fat, salt and pure (simple) sugars in foods and
drinks are discouraged. And food, higher in complex carbohydrates (starches) and fibre
content, vegetables and limited numbers of fruits encouraged. It is essential that simple
explained and written dietary instructions are provided. Patients are advised to measure food
quantities in volumes using available household items, such as cups, or count them in, such as
number of fruits or slices of yam or bread.99 Patients are advised to avoid alcohol. Dietary
modification can reduce HbA1c by 1-2%, depending on the duration of diabetes.11
Physical activity and exercise.
Physical activity or exercise is one of the essentials in the prevention and management of Type
2 diabetes mellitus. Regular physical activity improves metabolic control, increases insulin
sensitivity, improves cardiovascular health, and helps weight loss and its maintenance, as well
as giving a sense of well-being. There are two main types of physical activity: Aerobic or
endurance exercise (e.g. walking or running) and anaerobic or resistance exercise (e.g. lifting
weights). Both types of activity are prescribed to persons with Type 2 diabetes mellitus, but
the aerobic form is usually preferred. Patients are encouraged to integrate increased physical
47
activity into their daily routine.90 People with type 2 diabetes are advised to perform at least
150 minutes per week of moderate intensity aerobic physical activity (50-70% of maximum
heart rate). Randomised, controlled trials have demonstrated that physical activity combined
with dietary changes can delay the progression of impaired glucose tolerance to type 2 diabetes.
In patients with established type 2 diabetes, regular physical activity significantly improves
glycaemic control and reduces cardiovascular risk factors, and may reduce chronic medication
dosages.100 Regular physical activity may also improve symptoms of depression and improve
health-related quality of life. Structured exercise interventions of at least 8 weeks’ duration
have been shown to lower HbA1c by an average of 0.66% in people with type 2 diabetes, even
with no significant change in BMI.101
2.1.7.2 Pharmacological Management
Up to now, many kinds of anti-diabetic medicines have been developed for
the patients and most of them are chemical or biochemical agents aiming at controlling blood
glucose. Despite the impressive advances in health sciences and medical care, there are many
patients who use alternative therapies alone or complementary to the prescribed medication.
Traditional plant remedies or herbal formulations exist from ancient times and are still widely
used to treat hypoglycemic and hyperglycemic conditions all over the world, despite all the
controversy concerning their efficacy and safety.104 It must be noted that many ethno-botanical
surveys on medicinal plants used by the local population have been performed in different parts
of the world and there is a considerable number of plants described as anti-diabetic. Some of
48
the anti-diabetic medicinal plants in use include; Viscum album (mistletoe), Abelmoschus
moschatus (Malvaceae), Acacia arabica (Leguminoseae), Azadirachta indica (Meliaceae),
Abroma augusta(Sterculiaceae), Acer ginnala (Aceraceae), Illicium religiosum (Illiciaceae),
Cornus macrophylla (Cornaceae) and Achyranthes aspera L. (Amaranthaceae). In addition a
variety of compounds have been isolated (alkaloids, glycosides, terpenes, flovonoids, etc) but
further studies need to be done for these to be used as clinically useful medicines. Metformin
(a biguanide), is a derivative of an active natural product, galegine, isolated from the plant
Galega officinalis L. It is the only drug derived from a plant that is approved for use in the
treatment of type 2 diabetes mellitus.104
Oral Glucose Lowering Agents (OGLAs)
These were previously referred to as oral hypoglycaemic agents. Oral pharmacotherapy is
indicated when an individuals glycaemia targets are not met by the combination of dietary
modifications and physical activity/exercise. In some cases, oral pharmacotherapy or insulin is
indicated at the first presentation of diabetes, i.e. a fasting blood glucose level > 11mmol/L or
random blood glucose level > 15 mmol/L.11,90,102,103
Choice of Oral Glucose Lowering Agents (OGLA)
The use of low cost proven effective generic drugs instead of proprietary brands, which are
usually expensive is encouraged. The choice of OGLAs depends on the patient’s
characteristics, lifestyle, degree of glycaemic control, access to drugs, economic status and
mutual agreement between the doctor and the person with diabetes.88 The sulphonylureas and
metformin are the agents most widely available. Monotherapy with any of the drugs is the
initial choice. Use of the stepped-care approach is recommended, as monotherapy is seldom
sufficient, because of the progressive nature of the disease. Combination therapy is considered
as initial choice if HbAIC is greater than 8 %88. Yussuff and colleagues in Ibadan showed that
49
Oral Hypoglycaemic Agents (OHA) were prescribed for 86% of patients while insulin and
OHA was prescribed in 14%. About 70.8%) of patients on OHA were on combination therapy.
The most frequently prescribed OHA combination was glibenclamide and metformin (95.8%).
Only 44% of patients had adequate glycaemic control.103 Another study in Ibadan showed that
biguanides (66%) are the commonest oral hypoglycaemic prescribed.104 The clinical trials, in
concert with epidemiological data support decreasing glycaemia as an effective means of
reducing long-term microvascular and neuropathic complications. Typically, metformin
monotherapy will lower HbA1c levels by 1.5 %. The United Kingdom Prospective Diabetes
Study (UKPDS) demonstrated a beneficial effect of metformin therapy on CVD outcomes
which needs to be confirmed.105 Prospective randomised trials have documented reduced rates
of microvascular complications in type 2 diabetic patients treated to lower glycaemic target.
Finally, a meta-analysis of cardiovascular outcomes in these trials suggested that every HbA1c
reduction of ~1% may be associated with a 15% relative risk reduction in non-fatal myocardial
infarction, but without benefits on stroke or mortality.106 The glucose-lowering effectiveness
of non-insulin pharmacological agents is said to be high for metformin, sulfonylureas, TZDs
and GLP-1 agonists (expected HbA1c reduction ~1.0–1.5%) and generally lower for
meglitinides, DPP-4 inhibitors, AGIs, colesevelam and bromocriptine (~0.5–1.0%).90
Precautions: Metformin is the first choice in overweight patients. Thiazolidinediones may be
used when Metformin is contraindicated. Long-acting sulphonylureas are avoided in elderly
patients. In such patients, short-acting sulphonylureas such as glimepiride, gliclazide are used.
Metformin is contraindicated in people with elevated serum creatinine, liver disease and severe
respiratory, cardiac and peripheral vascular disease. Combination therapy using OGLAs with
different mechanisms of action is indicated if monotherapy with one of the agents has
failed.88,98 Two drugs from the same class are not used.
50
The rapid acting secretagogues (glitinides) and the alpha glucosidase inhibitors allow for
flexibility in the glycaemic management but are relatively expensive. When oral combination
therapy fails, insulin is added to the treatment regimen or the OGLAs replaced. Three-drug
combination therapy can be used when two-drug regimens fail to achieve target values.
However, such regimens are very expensive and difficult to manage. Such patients should be
referred to a specialist. Use of combination therapy often results in an increased number of
tablets to be taken and creates new adherence problems. Fixed combination therapies inhibit
flexibility in dosing prescription.
Insulin Therapy
Indications for use of insulin in type 2 diabetes
Initial presentation with severe hyperglycaemia and are symptomatic
Presentation in hyperglycaemic emergency
Peri-operative period especially major or emergency surgery
Other medical conditions requiring tight glycaemic control e. g acute MIs, strokes,
sepsis
Organ failure (e.g. renal, liver, heart)
Pregnancy
Latent autoimmune diabetes of adults (LADA)
Contraindications to OGLAs
Failure to meet glycaemic targets with OGLAs
Supplemental Therapy:
Intermediate acting (NPH) insulin is given as a Total Daily Dose calculated by: Kg x 0.2 IU of
insulin (70 kg patient x 0.2 IU = 14IU insulin). The OGLAs are continued (half maximum dose
of sulphonylureas and metformin dose of 2 g/day, or the sulphonylureas stopped and metformin
continued). Blood glucose levels monitored.11,90,102
51
Substitution Therapy:
OGLAs are discontinued (unless the patient is obese where metformin will be continued), and
a pre-mixed insulin is introduced twice daily at a dosage of 0.2 IU/kg body weight. This is split
into 2/3 in the morning and 1/3 in the evening, at 30 minutes before the morning and the
evening meals. If the requirement of insulin exceeds 30 units/day, referral should be
considered.90
2.1.7.3 Management of Co-Morbidities in Type 2 Diabetes Mellitus
Hypertension11,90.107
Hypertension is a common co-morbidity of diabetes, affecting the majority of patient. The
diagnostic cut-off for a diagnosis of hypertension is lower in people with diabetes (blood
pressure of 130/80) than those without diabetes (blood pressure of140/90 mmHg) due to
synergistic risks of hypertension and diabetes.11 Epidemiologic analyses show that blood
pressure values of 115/75mmHg and below are associated with increased cardiovascular event
rates and mortality in individuals with diabetes.11 Randomized clinical trials have demonstrated
the benefit (reduction in CHD events, stroke, and nephropathy) of lowering blood pressure to
140 mmHg systolic and 80 mmHg diastolic in individuals with diabetes.107
Management of hypertension should be integrated with that of diabetes, starting with education
lifestyle modifications (physical exercise, diet and weight loss) and setting goals. Lifestyle
therapy for hypertension consists of: weight loss, if overweight; Dietary Approaches to Stop
Hypertension (DASH)-style dietary pattern including reducing sodium and increasing
potassium intake; vegetables (8 –10 servings/day), and low-fat dairy products (2–3
servings/day); avoiding excessive alcohol consumption moderation of alcohol intake; and
increased physical activity.11,108 Pharmacologic therapy for patients with diabetes and
hypertension is a regimen that includes either an ACE inhibitor or an ARB. If one class is not
52
tolerated, the other is substituted. Multiple drug therapy (two or more agents at maximal doses)
is generally required to achieve blood pressure targets. When ACE inhibitors, ARBs, or
diuretics are used, kidney function and serum potassium levels are monitored.11
Diabetes and other Cardiovascular Diseases
Annual assessment is recommended for cardiovascular risk factors. Evaluation for coronary
artery disease includes ECG, X-ray of the chest (in people with breathlessness) and if warranted
an echocardiogram, stress test and coronary angiography is done. Evaluation for
Cerebrovascular disease includes carotid Doppler and carotid angiography. Doppler and
angiography of the lower limbs is used to evaluate for peripheral vascular disease.90,108,109
Lipids disorders in Diabetes
The risk of coronary artery disease and other macrovascular disorders is two to five times
higher in people with diabetes than in non-diabetic subjects and increases in parallel with the
degree of dyslipidaemia. Lipids are assessed annually if normal, and if abnormal or on
treatment; every three to six months. Non-pharmacological is the initial treatment for six
months. Statins are used for raised LDLC, fibrates for raised triglycerides, nicotinic acid or
fibrates for low HDLC.100 For diabetic patients: with overt CVD and without CVD who are
over age 40 years with one or more other CVD risk factors ;statin therapy is recommended
regardless of baseline lipid levels.11
Antiplatelet agents
Aspirin therapy (75–162 mg/day) is considered as a primary prevention strategy in those with
type 1 or type 2 diabetes at increased cardiovascular risk. This includes most men 50 years of
age or women 60 years of age who have at least one additional major risk factor (family history
of CVD, hypertension, smoking, dyslipidemia, or albuminuria). It can be as a secondary
53
prevention strategy in those with diabetes with a history of CVD. For patients with CVD and
documented aspirin allergy, clopidogrel (75mg/day) is recommended.11
Smoking cessation
All patients are advised not to smoke. Smoking cessation counseling and other forms of
treatment is a component of diabetes care. 11
2.1.7.4 Management of Complications of diabetes
Hyperglycaemic Emergencies
The stress of illness, trauma, and/or surgery frequently aggravates glycaemic control and may
precipitate diabetic ketoacidosis (DKA) or non-ketotic hyperosmolar state, life-threatening
conditions that require immediate medical care to prevent complications and death. Marked
hyperglycaemia requires temporary adjustment of the treatment. The patient treated with
noninsulin therapies or MNT alone may temporarily require insulin. Adequate fluid and caloric
intake must be assured. In the setting of severely uncontrolled diabetes with catabolism, defined
as fasting plasma glucose levels of 13.9 mmol/l (250 mg/dl), random glucose levels
consistently above 16.7 mmol/l (300 mg/dl), A1C above 10%, or the presence of ketonuria, or
as symptomatic diabetes with polyuria, polydipsia and weight loss, insulin therapy in
combination with lifestyle intervention is the treatment of choice. Insulin is titrated rapidly and
is associated with the greatest likelihood of returning glucose levels rapidly to target levels.
After symptoms are relieved and glucose levels decreased, oral agents can often be added and
it may be possible to withdraw insulin.11
Hypoglycemia
Glucose (15–20 g) is the preferred treatment for the conscious individual with hypoglycemia,
although any form of carbohydrate that contains glucose may be used. Once glucose returns to
54
normal, the individual should consume a meal or snack to prevent recurrence of
hypoglycemia.11,90
Glucagon should be prescribed for all individuals at significant risk of severe hypoglycemia,
and caregivers or family members of these individuals should be instructed in its
administration. Glucagon administration is not limited to health care professionals. Individuals
with hypoglycemia unawareness or one or more episodes of severe hypoglycemia should be
advised to raise their glycaemic targets to strictly avoid further hypoglycemia for at least
several weeks, to partially reverse hypoglycemia unawareness and reduce risk of future
episodes.11
Microvascular complications mainly involve the kidney, eyes, lower extremities and nerves.
These complications can be prevented or their progression delayed by optimal treatment of
hyperglycaemia and hypertension. Screening for the complications and prompt interventions
reduce the risk of major outcomes such as blindness and leg amputations.11
Diabetic nephropathy
Patients with clinical nephropathy almost always have retinopathy and coronary artery disease.
Numerous interventions are appropriate at different stages of renal function in order to prevent
or slow the progression of renal disease and associated cardiovascular disease. Improved
glucose control at any stage of renal function reduces renal disease progression. ACE inhibitor
or ARB should be used in all non-pregnant patients with micro or macroalbuminuria. For
patients with type 2 diabetes mellitus, ACE inhibitors or ARBs can reduce progression of
macrovascular complications.11,110
Diabetic Neuropathy
55
Peripheral neuropathy is difficult to prevent and treat. Most patients with type 2 diabetes and
peripheral neuropathy have few symptoms. Good glycaemic control should be the first control
to symptomatic neuropathy. For those patients with painful neuropathy treatment choices
include: antidepressants such as the tricyclics or vanticonvulsants (gabapentin, pregablin)
topical treatment with capsaicin. Aggressive daily foot care, inspection of the feet at every
office visit is recommended. Early treatment of foot infections, treatment of callus, use of
moisturizing lotion and proper footwear may forestall problems, including amputation.
Vascular surgery may also prevent amputation in some patients with established severe
peripheral vascular disease Proper high-risk foot management is necessary to prevent
ulceration and amputation. Patients with claudication and/or absent pedal pulses should be
referred to vascular surgery.11,110
Diabetic Retinopathy
Screening for diabetic retinopathy saves vision at a relatively low cost. In fact, screening costs
may be less than the costs of disability payments for those who become blind. Laser
photocoagulation surgery is effective in preventing visual loss in diabetic retinopathy.
Treatment includes glycaemic and blood pressure control. Periodic screening and dilated eye
exams by an eye specialist and early treatment of diabetic retinopathy can prevent visual
loss.11,110 The ADA recommends an initial eye exam for those who have type 1 diabetes within
five years of diagnosis and shortly after diagnosis for those who have type 2 diabetes.
Thereafter, nearly all patients with diabetes should have annual exams, and more often if
retinopathy is progressing.11
2.1.7.5 Psychosocial assessment and care
Assessment of psychological and social situation should be included as an ongoing part of the
medical management of diabetes. Psychosocial screening and follow-up should include, but is
not limited to, attitudes about the illness, expectations for medical management and outcomes,
56
affect/mood, general and diabetes- related quality of life, resources (financial, social, and
emotional), and psychiatric history. Referral to appropriate services should be done when
necessary. Psychological and social problems can impair the individual’s or family’s ability to
carry out diabetes care tasks and therefore compromise health status.
2.2 GLYCAEMIC CONTROL
2.2.1 Assessment of Glycaemic Control
Two primary techniques are available for health providers and patients to assess the
effectiveness of the management plan on glycemic control: patient self-monitoring of blood
glucose (SMBG) or interstitial glucose and glycated haemoglobin.
2.2.1.1 Glucose Monitoring
Self-monitoring of blood glucose (SMBG) is an important component of modern therapy for
diabetes mellitus. SMBG is recommended for people with diabetes and their health care
professionals in order to achieve a specific level of glycaemic control and to prevent
hypoglycaemia. The goal of SMBG is to collect detailed information about blood glucose
levels at many time points to enable maintenance of a more constant glucose level by more
precise regimens. It can be used to aid in the adjustment of a therapeutic regimen in response
to blood glucose values and to help individuals adjust their dietary intake, physical activity,
and insulin doses to improve glycaemic control on a day-to-day basis.111 SMBG may be useful
as a guide to the success of therapy.20 Studies clearly demonstrate that frequent SMBG
improves A1c and related outcomes in T1DM and T2DM regardless of the therapy used.112
SMBG helps protect patients by allowing them to immediately confirm hypoglycemia and
hyperglycaemia. Further, SMBG facilitates diabetes self-management education and motivates
57
patients to live healthier lives.113 Other studies, however, have suggested that SMBG has not
achieved its true potential impact as an aid to improving glycemic control.113
A meta-analysis of SMBG in non–insulin-treated patients with type 2 diabetes concluded that
some regimen of SMBG was associated with a reduction in A1C of 0.4%.114 However, many
of the studies in this analysis also included patient education with diet and exercise counseling
and, in some cases pharmacologic intervention, making it difficult to assess the contribution of
SMBG alone to improved control.115 Several recent trials have called into question the clinical
utility and cost-effectiveness of routine SMBG in non–insulin-treated patients.116,117,118
Because the accuracy of SMBG is instrument and user dependent,119 evaluation of each
patient’s monitoring technique is important, both initially and at regular intervals thereafter. In
addition, optimal use of SMBG requires proper interpretation of the data. Patients need to be
taught how to use the data to adjust food intake, exercise, or pharmacological therapy to achieve
specific glycaemic goals, and these skills reevaluated periodically. Other factors that inhibit
testing frequency include pain, and inconvenience.114 All of these factors work against seeing
a benefit in T2DM patients.114
In Nigeria, self-monitoring isn’t practised routinely. Most patients’ do not own a glucose
meter.120 Glucose monitoring is usually done by measurement of fasting plasma glucose at the
hospital on appointment days.120 A fasting or preprandial target of 4.0-7.0 mmol/l is
recommended.11 Unachukwu and colleagues in a tertiary hospital in Portharcourt showed that
though 96% of patients knew about SMBG, only 27% owned glucose meters and this was likely
to be due to financial reasons.120 However, the income level of the patients was not assessed
and the study was carried out in an urban setting so might not be representative of the entire
population. The study also showed that frequency of monitoring was quite poor among those
who used their meters with only six of them monitoring at least once a day.120 In another study
in UCH, SMBG use was found to be extremely low as more than two-third of the respondents
58
were not aware of SMBG for regular and prompt detection of fluctuations in their blood glucose
levels.104
In developed countries with well-established health systems, owning a glucose meter for
diabetic patients is the rule, rather than the exception. However in resource-poor settings this
is hardly the case. Financial support for SBGM in Africa remains a major barrier to improved
blood glucose control, both in type 1 and type 2 diabetic patients.120
Continuous glucose monitoring (CGM) through the measurement of interstitial glucose (which
correlates well with plasma glucose) is available. These sensors require calibration with
SMBG, and the latter are still recommended for making acute treatment decisions. CGM may
be particularly useful in those with hypoglycemia unawareness and/or frequent episodes of
hypoglycemia, and studies in this area are ongoing.11
2.2.1.2 Glycated Haemoglobin
Glycated haemoglobin has been the key measure of glycaemic control in diabetic patients for
last two decades. It is considered to be the gold standard test, and most widely accepted test of
glycaemia among clinicians and patients. The glycated Hb concentration levels are also more
closely related to the risk of chronic complications than random single or episodic glucose
levels.121
Glycated hemoglobin (HbA1c) expressed as a percentage of total blood hemoglobin
concentration gives a good retrospective assessment of the mean plasma glucose concentration
during the preceding eight to 12 weeks.122 while the recent glycaemic level has the highest
influence and the preceding 30 days contribute only up to 50%.123
59
It can be performed at any time of the day and does not require any special preparation such
as fasting. These properties have made it the preferred test for assessing glycaemic control in
people with diabetes.122
Because HbA1c is thought to reflect average glycaemia over several months,119 and has strong
predictive value for diabetes complications,124 HbA1c testing should be performed routinely
in all patients with diabetes, at initial assessment and then as part of continuing care.
Measurement approximately every 3 months determines whether a patient’s glycaemic targets
have been reached and maintained. For any individual patient, the frequency of HbA1c testing
is dependent on the clinical situation, the treatment regimen used, and the judgment of the
clinician. Some patients with stable glycaemia well within target may do well with testing only
twice per year, while unstable or highly intensively managed patients (e.g., pregnant type
1women) may be tested more frequently than every 3 months. The availability of the HbA1c
result at the time that the patient is seen (point-of-care testing) has been reported to result in
increased intensification of therapy and improvement in glycemic control.125 The HbA1c test is
subject to certain limitations. Conditions that affect erythrocyte turnover (hemolysis, blood
loss) and hemoglobin variants must be considered, particularly when the HbA1c result does not
correlate with the patient’s clinical situation.119 In addition, HbA1c does not provide a measure
of glycaemic variability or hypoglycemia. For patients prone to glycaemic variability
(especially type 1 patients, or type 2 patients with severe insulin deficiency), glycemic control
is best judged by the combination of results of SMBG testing and the HbA1c The HbA1c may
also serve as a check on the accuracy of the patient’s meter (or the patient’s reported SMBG
results) and the adequacy of the SMBG testing schedule. The HbA1c has several advantages
to the FPG and OGTT, including greater convenience, since fasting is not required; evidence
to suggest greater pre-analytical stability; and less day-to-day perturbations during periods of
stress and illness. These advantages must be balanced by greater cost, the limited availability
60
of HbA1c testing in certain regions of the developing world, and the incomplete correlation
between HbA1c and average glucose in certain individuals.
Other measures of chronic glycaemia such as fructosamine are available, but their linkage to
average glucose and their prognostic significance are not as clear as is the case for HbA1c.20
Even though HbA 1c is the most acceptable measure of chronic glycemia. It is not widely
available and/or affordable in Nigeria.126
2.2.2 Glycaemic Goals in Adults
Control of glycaemia is a priority in diabetes management, and is reflected in target values for
HbA1c level endorsed by professional organizations. The glycaemic goal recommended by the
American diabetes association, selected on the basis of practicality and the projected reduction
in complications over time is, in general, an HbA1c level of < 7%.127 The American Diabetes
Association (ADA) recommended a goal of HbA1c < 6.0% in individuals to the extent that, it
can be achieved without such adverse effects as hypoglycemia, with a population goal of <
7.0%.11 Preprandial capillary plasma glucose 70–130 mg/dl (3.9–7.2 mmol/l) and Peak
postprandial capillary plasma glucose of 180 mg/dl (10.0 mmol/l) are also recommended.
Goals are individualized based on duration of diabetes, age/life expectancy, comorbid
conditions, known CVD or advanced microvascular complications, hypoglycemia
unawareness and individual patient considerations. Postprandial glucose may be targeted if
HbA1c goals are not met despite reaching preprandial glucose goals. Postprandial glucose
measurement is made one to two hours after the beginning of the meal.11
Lowering HbA1c to below or around 7% has been shown to reduce microvascular and
neuropathic complications of diabetes and, if implemented soon after with long-term reduction
in macrovascular disease.11 Because additional analyses from several randomized trials suggest
a small but incremental benefit in microvascular outcomes with HbA1c values closer to normal,
61
providers might reasonably suggest more stringent HbA1c goals for selected individual
patients, if this can be achieved without significant hypoglycemia or other adverse effects of
treatment. Such patients might include those with short duration of diabetes, long life
expectancy, and no significant CVD. Conversely, less stringent HbA1c goals may be
appropriate for patients with a history of severe hypoglycemia, limited life expectancy,
advanced microvascular or macrovascular complications, extensive comorbid conditions, and
those with longstanding diabetes in whom the general goal is difficult to attain despite DSME,
appropriate glucose monitoring, and effective doses of multiple glucose-lowering agents
including insulin.11 Glycaemic control is fundamental to the management of diabetes.
Landmark RCTs have demonstrated that meticulous glycaemic control reduces risk of
microvascular and neurological complications of diabetes. Studies in prediabetes have shown
that early intervention slows progression to diabetes.11 Presently, HbA1c is the most acceptable
and widely used measure of chronic glycemia.119 Elevated HbA1c levels have been associated
with long-term complications of diabetes mellitus.11 Its level is therefore used to determine
whether treatment is adequate. Many Nigerians with diabetes mellitus do not achieve good long
term glycaemic control when HbA1c is used as an index of chronic glycaemia. Idogun and
Olumese 128reported that only 53% of 64 type 2 diabetic patients seen in a tertiary medical
centre in Benin City had good glycaemic control. Adebisi and colleagues129 found only 36%
of diabetic patients had a HbA1c ≤7.2% in Ilorin.128 Another study done in Benin showed that
35% of patients had good long-term glycaemic control of the diabetes mellitus. These studies
however are cross-sectional and the sample sizes small.
2.2.3 Measurement of Glycated Haemoglobin
Glycated haemoglobin is formed by non-enzymatic interaction between glucose and the amino
groups of the valine and lysine residues of the N-terminus of beta chain of haemoglobin. This
represents a reliable average of blood glucose over preceding three months.121 Formation of
62
glycohaemoglobin is irreversible and the level in the red blood cell depends on the blood
glucose concentration. The method used in measurement of HbA1c should be standardized to
Diabetes Control and Complication Trial (DCCT) reference assay or the National
Glycohaemoglobin Standardisation Programme (NGSP) certified method.130 Different Lab
techniques and many clinical conditions may result in under-estimation or over-estimation of
HbA1c.121 There are currently four different assay principles (ion-exchange chromatography,
electrophoresis, affinity chromatography and immunoassay) and approximately 20 different
methods used to measure glycohaemoglobin which measure different glycated products, report
different units and which can produce numerically different results for the same specimen.
Standardisation, which will lead to all assays reporting results in a standard unit, % HbA1c, is
recommended. The liquid chromatography ionic exchange using high performance liquid
chromatography (HPLC) is now the most reliable methodology. It is based on the difference in
electric charge and has numerous advantages. It is completely automatic and presents an
excellent reproducibility in different laboratories. It allows to measure with precision all sub-
fractions of HbA1c and anomalous haemoglobin. Its cost is high and it is not available in all
the laboratories.131 The immunochemical method DCA 2000 is the most popular and utilizes
antigenic properties. It is based on a latex immunoagglutination inhibition methodology. This
is the method used in this study. It allows to dose the HbA1c in 6 minutes, it requires a small
amount of blood (1 microliter), it is done with sample of capillary blood, it presents a strict
correlation (r=97) with the high performance liquid chromatography (HPLC) method.132 It is a
certified method for the analysis of glycated haemoglobin.
Both methods (the HPLC and immunochemical method) are standardized for HbA1c assay.
They are certified by the National Glyco-haemoglobin Standardization Program (NGSP) as
traceable to and standardized against the Diabetes Control and Complications Trial (DCCT)
reference method.11
63
2.3 SELF MANAGEMENT BEHAVIOUR
Self-management is the cornerstone of good diabetes care; more than 95 percent of diabetes
care is carried out by patients themselves.133 Self- management includes behaviours such as
healthy eating, being active, blood glucose monitoring, taking medication, problem solving,
reducing risks, and healthy coping.134 These are the seven specific self-care behaviors
developed by the American Association of Diabetes Educators, known collectively as the
AADE7™ which have are defined to guide the process of diabetic self-management education
and training (DSME/T) and helps patients achieve behaviour change.135 Facilitating positive
self-care behaviors directed at successful diabetes self-management is a desired outcome of
DSME/T.136
2.3.1 Healthy Eating
Making healthy food choices, understanding portion sizes and learning the best times to eat are
central to managing diabetes. By making appropriate food selections, children and teenagers
grow and develop as they would if they didn’t have diabetes. And, by controlling their weight,
many adults may be able to manage their condition for a time without medications. Diabetes
self-management education can assist people with diabetes gain knowledge about the effect of
food on blood glucose, sources of carbohydrates and fat, appropriate meal planning and
resources to assist in making food choices. Skills taught include reading labels, planning and
preparing meals, measuring foods for portion control, fat control and carbohydrate counting.
Barriers, such as environmental triggers like diet and exercise, emotional, financial, and
cultural factors, are also addressed.134 There is now good evidence to show the benefits of
healthy eating for people with diabetes. These include: improvement in glycaemic control and
lipid profiles, maintenance of blood pressure in the target range, and weight loss or
maintenance.137-9 Because there is no one set of nutrition recommendations or intervention that
64
apply to all persons with diabetes. Nutrition and education should begin with an assessment of
each individual’s current eating habits and preferences.134
2.3.2 Being Active
Regular activity is important for overall fitness, weight management and blood glucose
control. With appropriate levels of exercise, those at risk for type 2 diabetes can reduce that
risk, and those with diabetes can improve glycaemic control. Being active can also help
improve body mass index, enhance weight loss, help control lipids and blood pressure, and
reduce stress. Diabetes educators and their patients collaborate to address barriers, such as
physical, environmental, psychological, and time limitations. Developing an appropriate
activity plan that balances food and medication with the activity level is essential. Exercise is
important in both type 1 and type 2 diabetes.140 For persons with type 2 diabetes, engaging in
regular exercise may improve glycaemic control and reduce the risk of microvascular and
macrovascular complications, increase insulin sensitivity, reduce stress and depression,
contribute to weight loss/maintenance,135 and contribute to control of lipids and blood pressure,
thereby reducing the risk of cardiovascular disease, which is the leading cause of death in
persons with diabetes.134,140-2
2.3.3 Monitoring
Daily self-monitoring of blood glucose provides people with diabetes the information they
need to assess how food, physical activity, and medications affect their blood glucose levels.
Patients should be instructed about equipment choice and selection, timing and frequency of
testing, target values, and interpretation and use of results. Self-monitoring may include such
assessments as blood glucose levels, blood pressure, foot checks, steps walked, weight, and
achievement of goals.143-4 Self-monitoring behaviors aim to prevent or slow the progression of
diabetes complications. Information and instruction on self-monitoring for foot care will
65
promote self-care and reduce complications.144-5 Blood pressure monitoring is effective in
detecting and helping to control hypertension, which is a major risk factor for cardiovascular
and cerebral vascular disease and microvascular complications.144Self-monitoring of blood
glucose (SMBG) is a tool that guides glycaemic management strategies and has the potential
to improve problem-solving and decision-making skills for persons with diabetes and their
healthcare providers. SMBG can promote improved understanding of the impact of foods,
physical activity, and medications on blood glucose levels. It can facilitate more timely
adjustment of therapeutic regimens, and support flexibility in meal planning, physical activity,
and medication administration.143-4
2.3.4 Taking Medication
Diabetes is a progressive condition.134 Effective drug therapy in combination with healthy
lifestyle choices, can lower blood glucose levels, reduce the risk for diabetes complications,
and produce other clinical benefits.145 The goal is for the patient to be knowledgeable about
each medication, including its action, side effects, efficacy, toxicity, prescribed dosage,
appropriate timing and frequency of administration, effect of missed and delayed doses, and
instructions for storage, travel, and safety. The value of pharmacologic therapy in achieving
and maintaining diabetes control has been clearly established. In addition to investigating
pharmacotherapy and improved A1C, well-designed trials have explored the benefit of
pharmacologic therapy in improving avoidable and costly microvascular and macrovascular
outcomes of diabetes. 146,147,148
2.3.5 Problem Solving
A person with diabetes must keep their problem-solving skills sharp because on any given day,
a high or low blood glucose episode or a sick day will require them to make rapid, informed
decisions about food, activity, and medications. This skill is continuously put to use because
66
even after decades of living with the disease, stability is never fully attained; the disease is
progressive, chronic complications emerge, life situations change, and the patient is aging.
Collaboratively, diabetes educators and patients address barriers, such as physical, emotional,
cognitive, and financial obstacles and develop coping strategies. Problem solving is a strategy
that has been used to facilitate patients' attainment of each of the other self-management
behaviors (healthy eating, being active, taking medications, monitoring, healthy coping, and
reducing risks).134 Problem solving is defined as "a learned behavior that includes generating a
set of potential strategies for problem resolution, selecting the most appropriate strategy,
applying the strategy, and evaluating the effectiveness of the strategy."135
Problem solving is most commonly characterized as involving a sequence of rational steps, and
it is recognized as a core component of effective diabetes self-management.147-9 Some evidence
associates low levels of problem solving with poor glycaemic outcomes. Overall, the evidence
suggests that problem solving training may be an effective intervention tool for select
outcomes.148-9 More studies are needed to elucidate mechanisms of action and optimal
approaches to standardizing assessment and intervention.134
2.3.6 Healthy Coping
An important part of the diabetes education is identifying the individual’s motivation to change
behavior, then helping set achievable behavioral goals and guiding the patient through multiple
obstacles. Patients can be supported by encouraging them to talk about their concerns and fears
and this can help them learn what they can control and offer ways for them to cope with what
they cannot. Health status and quality of life are affected by cognitive, emotional, social, and
situational factors. Psychological distress may directly affect physiological aspects of health
and indirectly influence a person’s thoughts, motivation to keep his or her diabetes in control,
and healthcare behaviors. When motivation is dampened, the commitment to and behavioral
67
steps required for effective self-care are difficult to maintain. When barriers seem
insurmountable, good intentions alone cannot sustain the behavior.150 Coping efforts may
become difficult and, in turn, a person's ability to self-manage his or her diabetes may
deteriorate.151-3 The literature also has demonstrated the benefits of interventions to promote
healthy coping on metabolic control.151-4
2.3.7 Reducing Risks
Effective risk reduction behaviors such as smoking cessation and regular eye, foot, and dental
examinations reduce diabetes complications and maximize health and quality of life. An
important part of self-care is learning to understand, seek, and regularly obtain an array of
preventive services. Assisting patients in gaining knowledge about standards of care,
therapeutic goals, and preventive care services to decrease risks is essential. Reducing risks is
defined as implementing effective risk reduction behaviors to prevent or slow the progression
of diabetes complications.11,155-7
Diabetes care processes and outcomes have improved over the past 10 years, but in one study,
only approximately 7% of persons with diabetes had achieved established goals for glycaemic
control, blood pressure, and lipids.158 The following skills need to be taught to people with
diabetes as interventions that reduce diabetes complications and maximize health and quality
of life: smoking cessation, foot checks, blood pressure monitoring, self-monitoring of blood
glucose, maintenance of personal care records, and regular eye, foot, and dental
examinations.134
2.4 TRADITIONAL MODEL OF CARE
2.4.1 Overview
68
Today’s medical system is optimized for the delivery of acute, episodic care by individual
physicians.159,160 This paradigm, referred to here as the traditional medical model, views the
physician as responsible for diagnosing the illness, deciding on an appropriate treatment, and
ensuring that that treatment is carried out as prescribed.The physician is then in charge of, and
responsible for, treatment of the illness.161,162 It is disease centred and based on the bio-medical
theory of disease.163 It explains the patient’s symptoms from a pathophysiological point of
view.162 Treatment of acute illness remains the dominant paradigm in the training and,
subsequently, in the practice of medicine.161,162 In this model, the physician is viewed as active,
powerful, knowledgeable, and in control of the care process. The patient is viewed as passive,
accepting, compliant, and dependent on the physician's medical knowledge and goodwill. The
traditional is the dominant paradigm in our health care system, influencing almost all health
care.161
2.4.2 Advantages and Disadvantages
The acute episodic care practised in the Primary care settings in Nigeria while helpful in coping
with busy out-patient clinics is not effective in equipping patients with the self –care skills
which is central to the management of chronic illnesses like diabetes. Patients carry out 95%
or more of the daily self-care of diabetes.161 If such self-care merely involved taking a pill each
morning, this issue might never have arisen, since taking a pill once a day is not nearly as
difficult or intrusive on the patient's life as are many diabetes self-care regimens. In the
traditional model, the professionals are the experts who tell the patient what to do and the
patients are passive. This is not workable in the management of diabetes because diabetes and
its self-care affect virtually every aspect of the patient's life. As a result, patients are often asked
to substantially reshape the way in which they live.161 Traditional patient education imparts
disease specific information and technical skills.161 Mounting evidence indicates that while
such interventions increased knowledge, they are unsuccessful in changing behavior or
69
improving disease control and other outcomes while self management education teaches
problem solving skills.2 For some patients, a major benefit of the traditional medical model is
the opportunity for patients to turn over the anxiety inherent in being ill to a physician.164 They
are unable or unwilling to assume a significant decision-making role in the treatment of their
diabetes and would rather have passive roles.164
In traditional health care systems, problems are identified and solved by the professional.
Behaviour change is by external motivation (making changes to please the physician). Patients
are regarded as non-compliant based on physician-defined problems and patient’s failure to
solve them.165 In diabetic care, patients need to be internally motivated to gain understanding
and confidence to accomplish behaviour change. Principally trained in the acute care of
patients, physicians may have inappropriate expectations of the degree to which patients can
change behavior.164 Acute care requires change for a few weeks but in diabetes, patients must
change their behavior for a lifetime.111 Hence the traditional medical model-compliance-
oriented approach is inappropriate and unworkable in the treatment of diabetes.
2.5 CHRONIC CARE MODEL
2.5.1 Overview
Effective management of chronic disease requires scheduled and regular patient visits to clinics
for monitoring disease control, detecting complications, adjusting medications, and negotiating
lifestyle changes.166 The quality of care for diabetes continues to fall short of recommended
guidelines and result regardless of the health care setting or patient populations.167,168 The
increasingly well-documented gap between clinical research findings and practice has spurred
a number of efforts to improve the quality of chronic illness care. It also is apparent that this
70
problem cannot be solved by simply trying to do more; instead, fundamental changes are
needed in the way that care is structured and delivered.15 For chronic illness care, this change
entails shifting from medical care that is reactive and event-driven to care that is proactive and
planned.15 Recent models for improving the care of chronic illnesses advocate a
multidisciplinary team dedicated to proactively managing a population of patients. 167
Based on the evidence of these interventions, summarized in a review of Tsai et al, Wagner
and colleagues developed the Chronic Care Model (CCM) as a conceptual framework.13,169
The Chronic Care Model, or CCM is one approach to improving chronic illness care that is
being used increasingly to assess and improve care.15 The CCM is based on evidence-based
practices and reviews of the literature on effective care.
2.5.2 Elements of the CCM
The Chronic Care Model (CCM) includes six core elements for the provision of optimum care
for patients with chronic disease:1) delivery system design (moving from a reactive to a
proactive care delivery system, where planned visits are coordinated through a team-based
approach; 2) self-management support; 3) decision support (basing care on consistent, effective
care guidelines); 4) clinical information systems (using registries that can provide patient-
specific and population based support to the care team); 5) community resources and policies
(identifying or developing resources to support healthy lifestyles); and 6) health systems (to
create a quality-oriented culture).2,15,159,170
High-quality chronic illness care is characterized by productive interactions between practice
team and patients that consistently provide the assessments support for self-management,
optimization of therapy, and follow-up associated with good outcomes. (1) elicit and review
data concerning patients’ perspectives and other critical information about the course and
management of the condition(s); (2) help patients to set goals and solve problems for improved
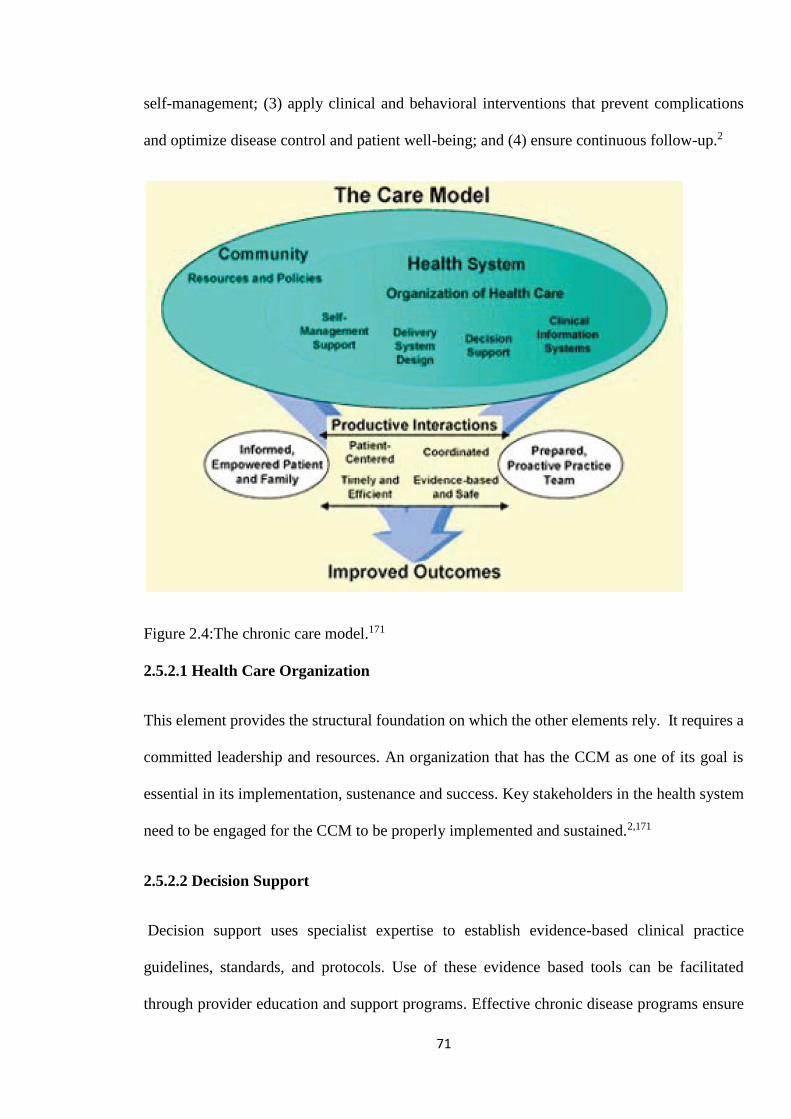
71
self-management; (3) apply clinical and behavioral interventions that prevent complications
and optimize disease control and patient well-being; and (4) ensure continuous follow-up.2
Figure 2.4:The chronic care model.171
2.5.2.1 Health Care Organization
This element provides the structural foundation on which the other elements rely. It requires a
committed leadership and resources. An organization that has the CCM as one of its goal is
essential in its implementation, sustenance and success. Key stakeholders in the health system
need to be engaged for the CCM to be properly implemented and sustained.2,171
2.5.2.2 Decision Support
Decision support uses specialist expertise to establish evidence-based clinical practice
guidelines, standards, and protocols. Use of these evidence based tools can be facilitated
through provider education and support programs. Effective chronic disease programs ensure
72
that providers have access to expertise facilitated through evidence-based guidelines.171
Although providers need to rely on expertise such as guidelines, they are often reluctant to do
so. Studies done within the University of Pittsburgh Medical Center UPMC demonstrated that
physicians were not delivering care based on evidence-based guidelines. Because more than
90% of visits are to primary care practices, it is crucial that they adopt a process delivery system
that included use of evidence-based guidelines. This can be done through continuing medical
education, clinical meetings in resource poor countries like Nigeria. Practices can have an
evidence based protocol for chronic illnesses. Studies show that engaging in decision support
improves clinical outcomes.171
2.5.2.3 Self-Management Support
This element engages the patient in the active self-management of his or her illness. When
informed patients take an active role in managing their disease and providers are prepared,
proactive, and supported with time and resources, their interaction is likely to be productive.172
The goal is to customize care to engage the patient in setting goals that change their behavior
to self-manage their diabetes. Systems that support the development of informed, activated
patients have demonstrated positive outcomes.173,174 The CCM differs from traditional
approaches in that it emphasizes self-management training and counseling. Increasing patient
participation is a crucial element in successful chronic disease management.171
DSME is critical in laying the foundation for promoting the knowledge and skills necessary for
patients with diabetes to appropriately perform and manage self-care tasks. DSME is now
widely considered to be an important part of diabetes management.172
Although the provider office provides a unique opportunity to reach patients at point of service,
DSME programs have traditionally been delivered in hospitals, not office settings. This is a
remnant of the acute care model, in which services were provided at the hospital, and referral
73
to a program within the hospital was expected. Within the structure of the CCM, which is now
recognized as best representing the care needs of people with diabetes, exploring new methods
for care delivery is recommended.171 Culturally appropriate DSME within the limits of the
available resources can be offered to individuals even in resource limited countries.175 Both the
AADE and ADA have concluded that adoption of a systems approach specific to DSME is
critically important and much needed.176
2.5.2.4 Community Resources and Policies
Communities provide individuals with diabetes, their caregivers, friends, and employers with
a variety of ancillary services that provide support for diabetes self-management. Policies
define relationships within a community between various agencies (e.g, networks, how services
are accessed and provided, etc). Policies are also important for reimbursement and
sustainability. Identifying or developing resources to support healthy lifestyles can be achieved
through community based diabetic associations. This can be done by implementing surveys,
town hall meetings, and focus groups. Working with community partners in churches, wellness
sites and schools is helpful. Partnership with insurers, government agencies, policy makers is
esssential.2`
2.5.2.5 Clinical Information System
These systems are necessary for collecting and housing timely, useful data about individual
patients and populations of patients, using tools such as patient registries and care reminders.
The information system allows quality measures to be assessed and care evaluated, providing
ongoing feedback to the provider and patient.2
2.5.2.6 Delivery System Design
74
Effective chronic illness management also requires attention to delivery system design.171
Moving from a reactive to a proactive care delivery system, where planned visits are
coordinated through a team-based approach. And appropriate referral ensured. This element
defines team roles and delegates tasks. Planned management ensures continuity of care and
regular follow-up through redesigning how care is delivered. New partners and approaches for
DSME support such as community workers, office staff, and telephonic and computer systems
should be engaged.172 Team-based care has repeatedly been shown to improve outcomes, yet
it is often unavailable in primary care practice settings.171
2.5.3 Effect on Self-Management Behaviour and Glycaemic Control
Studies have also shown that clinicians in small independent Primary Care practices are able
to incorporate elements of the CCM into their practice style, often without major structural
change in the practice. This incorporation is associated with higher levels of recommended
processes and better intermediate outcomes of diabetes care. Clinician-reported use of elements
of CCM was significantly associated with lower HbA(1c) values with 0.30% reduction in
HbA1c value.12 These findings are however limited by their self- reported nature which may
lack precision. Though the data assessed the patterns of care in practices where no previous
systematic efforts to implement CCM has been attempted so a cause to hope that small efforts
might lead to improvement. Simenero and colleagues showed that implementation of the CCM
in a primary care setting is associated with improvement in glycaemic control with sixty
percent of patients having A1C results < 7%,177
An integral facet of the CCM is the importance of self-management support. A growing body
of evidence demonstrates that interventions that foster patient self-management behaviors
improve health status and lower health care costs in chronic disease.172 A systematic review of
71 trials by Warsi and colleagues also showed reductions in A1C in patients who received
75
formal training in diabetes self-management (summary effect size, 0.45; 95% confidence
interval [CI], 0.17-0.74) .178 Although a limitation of the review is that methods used in
reporting the trials were heterogeneous, it showed that self management education has benefits
in diabetes.
Positive outcomes are linked to DSME/T that focuses on self-management, emphasizes
behavioral strategies, and provides culturally relevant information. Models that encourage
active engagement of patients and build self efficacy have been shown to increase the
effectiveness of self-management skills and improve outcomes.179 A review and meta-analysis
of self-management interventions for diabetes concluded that, although education alone does
not lead to improved outcomes, self-management interventions can improve glycaemic control.
It improved glycated hemoglobin levels at immediate follow up, and that increased contact
time is associated with an increased effect. Self-management education was shown to decrease
HbA1c levels in the intervention group at immediate follow-up by 0.76% more than the control
group. 179 The studies included in this review use a variety of measurement techniques for
HBA1c and most of the studies included in this review predate standardization efforts.179
However, there is evidence of the benefits of these interventions in improving glycaemic
control.179
A randomized controlled trial by Piatt and colleagues showed that DSME/T, when
implemented within the context of the Chronic Care Model, improved clinical and behavioral
outcomes in an underserved community. And a marked decline in HbA1c of 0.6% was
observed in the CCM group.180 An advantage of this study is that analysis of HbA1c was done
using a standardized method.
Vallis and colleagues examining the long term effect of diabetes self-management education
showed significant improvements in adherence to most aspects of self-care, including
76
medication use, self testing, exercise, foot care and general health behaviours like nutrition,
exercise, and weight. Identification of goals and achieving them increased substantially as a
result of these strategies. Importantly, all of these changes, with the exception of medication
adherence, were sustained at the 2-year follow-up.181 These data validate the importance of
self-management education beyond its effect on glycaemic status. Another study showed
significant improvement in clinical indicators of diabetes management, higher rates of self-
management goal setting and achievement, and increased satisfaction with diabetes care. Also
a reduction of 0.8 percentage point was observed in A1C levels.182 Interpretation and
generalizability of these data are limited by the lack of a true control group.182 Self-care
behaviours (e.g. self-testing, healthy eating, physical activity) are important outcomes, since
they are directly targeted for change during self-management education. However, the
assessment of self-care outcomes has been limited by a lack of reliable and valid measures.
Brown and colleagues demonstrated that culturally competent self-management education, in
both individual and support group settings, improved health outcomes in Mexican-Americans,
particularly those with an A1C level under 10%.183
Studies done among Family Medicine Residents in the United States where the chronic care
model was implemented among diabetic patients showed an overall improvement in measures
of care for patients, with the percentage achieving HbA1c, LDL, and BP goals simultaneously
increasing from 5.7% to 17.1%.14 Also, educational outcomes for the residents, measured by
compliance with review of provider performance reports and self-management goal-setting
with patients, also significantly improved.14 However, there was no control group in this study
so it cannot be ascertained that the clinical changes observed were due to the intervention.
Implementing systems to support decision support, self-management education, and delivery
system redesign has been shown to have a positive influence on practices and patient outcomes
77
in outlying rural communities.184 And studies have shown that delivery system design is
associated with improved A1C and LDL outcomes for people with diabetes.185
2.5.4 Challenges
Despite the rise in incidence, diabetes care remains less than optimal when judged by the
percentage of patients receiving recommended care or achieving certain results. For example,
although widely disseminated evidence-based recommendations support achieving a
haemoglobin A1c (HbA1c) level of less than 7%, only 42% of diabetics in the US achieved
this goal in a national population-based survey.186 Academic practices face additional
challenges, including faculty physicians with part-time practices, lack of care coordination
across an open-model health system, care teams that include medical students and residents
with widely varying clinical experience in ambulatory settings, and a higher prevalence of
underinsured patients with fewer resources for care optimization.167.
Various trials provide substantial evidence that application of elements of the CCM will
improve care for individuals with diabetes.167 But despite the CCM’s success for several
chronic illnesses, implementation in Primary Care practices has been minimal. And little is
known about the effectiveness of such models in an academic setting with a diverse patient
population and resident physicians participating in clinical care.167
The lack of physician training in chronic illness management is an obstacle.14 This might be
due to the fact that there is no laid down CCM protocol in most health care settings, though the
fact that aspects of CCM are difficult to implement due to the low economic status of most
patients and lack of electronic medical records in most primary care settings might be a
contributing factor. These factors also contribute to the difficulty in implementation of CCM
in Primary Care settings in Nigeria. Also, implementing and maintaining CCM requires on-
78
going advocacy as it requires educational and financial support, and a leadership committed to
change.2
The criticism that follow-up of chronically ill patients tends to be sporadic, prevention
underutilised, and the patient's role in disease management overlooked in many health
systems166 is generally applicable to Nigerian primary care. Inadequate health infrastructure,
poverty, low literacy level and poor health seeking habits are also contributing factors. A
number of other studies have reported findings that strongly support cost reduction as a benefit
of diabetes education. Adisa and colleagues in Southwestern Nigeria showed that high cost of
medication (35.5%) was one of the major non-intentional reasons for nonadherence.187 Another
study done in UCH Ibadan also showed that high cost of the drugs and the large number of
drugs to be taken (43.5%) were the commonest reasons that militate against adherence. It also
showed that most patients were mainly from the low socio-economic class.104 The care of
diabetes is expensive compared to management of other chronic illnesses. Most patients with
diabetes in Nigeria have little or no formal education and are poor with little understanding of
the nature of their disease.104 Self- management behaviours with emphasis on self- monitoring
of blood glucose was poor. Many patients did not understand the importance of lifestyle
modification.104 This probably implied that many patients would not adhere to dietary and
lifestyle modifications recommended by their health care providers. The use of patient self -
report measures in assessing adherence to lifestyle modification in these studies..
Additionally, scarcity of health resources, prohibitive cost of drugs or their non-availability,
sale of fake drugs and the easy access to the traditional and faith healers militate against the
optimal management of a chronic disease like diabetes mellitus.104 Efforts are needed to
increase the medication adherence and self –management practices of these patients in Nigeria
so they can realize the full benefits of prescribed therapies relevance of these non-drug
therapies in the management of type 2 diabetes.187
79
Implementing elements of CCM in diabetic care will improve health outcomes for patients in
a cost effective manner as it will help patients maintain effective self-management behaviour
throughout a lifetime of diabetes. This can be implemented in resource limited countries like
Nigeria to all categories of patients irrespective of gender, educational status or social class.
Hence the need to experimentally test whether application of CCM based practices would
improve the process of care and evaluate its impact on the self- management behaviour and
glycaemic control of patients in our setting and thus pinpoint areas where changes can be made
to improve diabetic care.
2.6. PATIENT ASSESSMENT OF CHRONIC ILLNESS CARE (PACIC)
Implementation of the CCM from the patient perspective can be assessed using the Patient
Assessment of Chronic Illness Care (PACIC) survey. It focuses on the receipt of patient-
centred care and self-management behaviours. It is a 20-item validated patient report
instrument that assesses patient’s receipt of clinical services and actions consistent with the
CCM.15
Assessment of system-level CCM implementation has primarily focused on the perspective of
the clinician and the health plan, using tools such as the Assessment of Chronic Illness Care
(ACIC).188
The PACIC collects patient reports of the extent to which they have received specific actions
and care during the past 6 months that are congruent with various aspects of the CCM.15
It is designed to complement the ACIC by providing a patient perspective on receipt of CCM
related chronic illness care. The PACIC consists of 5 scales which represent; patient activation,
delivery system, goal setting, problem solving/ contextual counselling , and follow-
up/coordination and an overall summary score, each having good internal consistency for brief
scales. The PACIC demonstrated moderate test-retest reliability (r _ 0.58 during the course of
80
3 months) and The PACIC and its scales demonstrated substantial construct validity by
correlating moderately, as predicted (r _ 0.32– 0.60, median _ 0.50, P _ 0.001) to measures of
primary care and patient activation.
It has potential for use as a patient-centred measure of the implementation of the Chronic Care
Model (CCM). Using a patient-level assessment of health care such as the PACIC is consistent
with calls for both practical tools for evaluating chronic care management 189,190 and for quality
measurement tools that are patient-centred and focus on patient perspectives.15 It can
potentially be used to track delivery of self-management support for patients by health care
organizations and to support overall quality improvement efforts.190-1 This is useful in
evaluating the strengths and weaknesses in health care systems even in resource poor settings
like Nigeria, though it was not developed to be an actual representation of evidence but a tool
that could be used to encourage physicians to identify problems and discover solutions to the
problems.
CHAPTER THREE
3.0 METHODOLOGY
3.1 Study design:
The study was a single blinded randomized controlled trial, comprising an intervention group
that received care by the Chronic Care Model and a control group that received usual care/
traditional model of care.
3.2 Study setting
81
The study was conducted in the GOPD of JUTH. The hospital is located in Jos, the capital city
of Plateau State, North Central Nigeria. It is located at latitude 9º55´N and longitude 8º 53´ E
with an altitude of about 1250m (about 4100 ft) above sea level. It covers an area of about
7,800 sq km. Temperatures on the Plateau are generally about 4ºC cooler than those on the
coast, and the annual rainfall of about 1,300 mm is considerably higher than that in the
surrounding lowlands.192 Jos is a cosmopolitan city where various tribes of the country are
represented. According to the 2006 national census, the state had a population of 3,178,712
and Jos had a population of 900,000.193
The Jos University Teaching Hospital provides primary, secondary and tertiary care to the
population of Plateau and the neighbouring states of Nassarawa, Benue, Kaduna, Bauchi,
Gombe, Adamawa, Taraba, Federal capital territory and Kogi. The GOPD provides continuous,
holistic and comprehensive healthcare for both acute and chronic medical conditions while
referring outpatients to specialist departments or clinics in a two way referral system as
necessary. In 2010, the average population of patients attending the GOPD was 17,659 and
diabetic patients accounted for 3% of this population.170
3.3 Study population
The study population comprised type 2 diabetes patients who had been diagnosed for at least
one year; confirmed with a FBG of ≥ 7mmol/L (126 mg/dL) at diagnosis, aged 18 years and
above presenting in the General Outpatient Department of the Jos University Teaching
Hospital.
3.4 Study Hypothesis
82
The study postulates that there will be a difference in the mean glycated haemoglobin and self-
management behaviour in type 2 diabetes patients who receive care by the Chronic Care Model
compared to those who receive usual care.
3.5 Sample size determination
Using a Power of 80% and a 95% confidence level, the sample size for the study was calculated
using the formula for the difference between the means of two groups194
N = (Zα +Zβ)2 × 2 × (S)2
d2
Where: N = minimum sample size required for each group.
zα = 1.96 which is the t-value of the desired confidence level of 95% when alpha is 0.05
(Statistical standard values in a normal population distribution).194
zβ = 0.842 which is the t-value of the desired power of 80% when β is 0.2 (Statistical standard
values in a normal population distribution).194
S= the degree of variability of observation (SD) = 1.5180 (based on previous study)
d= difference to be detected in the HbA1c scores between the two groups (control and
intervention) which was = 1%
Therefore given:
zα = 1.96 zβ = 0.84 S= 1.5 d = 1.0
N= (1.96+0.84)2×2×(1.5)2 = 33
(1.0)2
83
N=35
To account for follow-up losses and ensure adequate numbers for subgroup analysis, 10% of
the minimum sample size was added to each group as the attrition rate which was 3 per group.
Therefore N= 35+ 3= 38 Subjects per group. The total number of patients recruited was 76 (i.e.
10% attrition).
The sample size in each group will be at least 38 in order to account for subjects lost to attrition
(i.e. 10% attrition).
3.6 Eligibility
3.6.1 Inclusion criteria
1. Patients diagnosed with Type 2 diabetes mellitus for at least one year confirmed by a
FBG of ≥ 7mmol/L at diagnosis ( Fasting is defined as no caloric intake for at least 8
hours), aged 18 years and above attending GOPD, JUTH.
2. Subjects who consent to the study and sign the consent form.
3. Subjects who understand English or Hausa language
3.6.2 Exclusion Criteria
1. Patients ill enough to require hospitalization
2. Pregnant women (because they would require specialized care)
3. Patients who are unlikely to be available for the whole duration of the study
3.7 Recruitment, allocation and randomization
84
Using systematic random sampling technique, all type 2 diabetic patients who met the inclusion
criteria were recruited voluntarily into the study after written informed consent was obtained.
(All phone numbers and baseline fasting blood glucose before commencement of the study
were recorded). An average of 150 diabetic patients are seen per month in the GOPD (study
population). Sample size calculated was 76. Sampling interval was thus; 150/76= 2 patients.
(Number of population/number of sample size).
Recruiting patients as they present, the first patient was selected from the first two patients by
balloting and was thus number 1, (counting the next 2 patients that met the inclusion criteria);
the 3rd patient was the 2nd subject. Subsequent patients were recruited following this sequence
(i.e. sampling intervals of 2) until a total of 76 patients were recruited. This took four weeks.
All the 76 type 2 diabetic patients who were recruited using the systematic random sampling
technique were given an inclusion number and then randomized. Using a computer–generated
sequence table, patients were randomly allocated to two groups; A and B in block sizes of four.
Subjects in group A were allocated to the control group i.e. those who received the traditional
model of care/usual care (n=38) and those in group B were allocated to the intervention group
i.e. those who received care by the chronic care model (n = 38). They were assigned to either
of the groups by means of previously sealed opaque numbered envelopes, which were only
opened at the time of treatment allocation. So the subjects did not know which study group
they belonged to.
3.8 Instruments of data collection
1. Study questionnaire (Appendix B)
2. PACIC scale (Appendix C).
3. Chronic Care Model instruction sheet (Appendix D).
85
4. Digital bathroom weighing scale (Camry)
5. Wall-mounted Standiometer.
6. Sphygmomanometer ( ACCOSON)
7. Littman’s stethoscope
3.9 Assessment tool
The Patient Assessment of Chronic Illness Care (PACIC) scale (Appendix D): Is a 20 item
validated scale divided into 5 sub-scales:
Patient activation – 1-3
Delivery system - 4-6
Goal setting – 7-11
Problem solving/ contextual counselling – 12-15
Follow-up/coordination – 16-20
This scale was used to assess the receipt of patient-centered care, which emphasizes the key
elements of modern self-management. It gathers data on receipt of quality chronic condition
care from the patient’s perspective and collates data on the extent to which specific actions
have been received in the previous six months.
Respondents answered each item with a response from 1 = almost never to 5 = almost always.
Each scale was scored by simple averaging of items completed within that scale, and the overall
PACIC was scored by averaging scores across all 20 items. Thus, scores on the PACIC ranged
from 1 to 5 with higher scores indicating patient’s perception of greater involvement in self-
management and receipt of chronic care counselling. When fewer than 20 questions were
86
answered, the PACIC score represented the mean score of all completed questions.15 The mean
score was computed for each study group both pre and post intervention. Scores < the median
score were classified as poor and ≥ median score as good. The questionnaire was interviewer-
administered and this was done in English or Hausa language where necessary. Translation of
the questionnaires was done by a doctor who was a native speaker then back translated by a
non-medical person to ensure content validity and standardization.
3.10 Data collection
A pilot test of the instruments was performed among twelve diabetic patients in May 2012,
four weeks before the commencement of the study. It was done at the GOPD. Those twelve
subjects were excluded from the study. The pretesting of the questionnaires was done to test
duration, ease and feasibility of administration. The pre-test also assessed how well the subjects
understood the questions and helped in clarification of any ambiguity. It revealed that self -
administration of the questionnaire might be inappropriate considering the varying levels of
education of the subjects. The instruments were therefore administered to the respondents by
the research assistant who was trained in administering the tools. The questionnaire was
administered in English language or Hausa language. Translation of the questionnaires was
done by a doctor who was a native speaker then back translated by a non-medical person to
ensure standardization. After recruiting and allocation was done, each subject was interviewed
by the researcher using a structured questionnaire (Appendix B). Items recorded on the
questionnaire were the subject’s socio-demographic details (including age, sex, tribe, religion,
education level, occupation and marital status, phone numbers of the patient, contact address),
medical history (including family history of diabetes, history of diabetic complications,
comorbid conditions, knowledge of diabetes and lifestyle practices) and family and social
history. The PACIC score of each subject were also assessed at initial and final visits by the
research assistant. Each subject also had a focused physical examination. The physical
87
examination included the height, weight, blood pressure, and body mass index (BMI). The
weight was to the nearest 0.1kg, height to the nearest 0.01m from which body mass index was
calculated. Height was measured in centimetres (cm) using a wall-mounted standiometer. The
subjects were without shoes and head gear and they stood erect with their hands at their sides.
The head, buttocks and feet against a vertical wall, with the head level with the horizontal
plane. Weight was measured in kilogrammes (kg) to the nearest 100 g without shoes and with
minimal clothing using a digital bathroom scale that was calibrated with a known weight daily.
Body mass index (BMI) was calculated as weight (in kg) divided by height (in metres) squared
(kg/m2). The waist circumference was measured by placing a measuring tape in a horizontal
plane around the abdomen at the level of the iliac crest with the subject standing. Measurement
was done at the end of a normal expiration. The hip circumference was measured at the level
of the greater trochanters. The waist–hip ratio (WHR) was calculated by dividing the waist
measurement in centimetres by the hip measurement in centimetres.
Subjects’ blood pressure was measured three times in the sitting position on the left arm using
a mercury sphygmomanometer after at least 5 minutes of rest, with at least 5 minutes between
measurements. First appearance and disappearance (phase V) of Korotkoff’s sounds heard with
the aid of a Littman’s stethoscope were used to define systolic and diastolic pressures
respectively. Blood pressure readings were recorded to the nearest even number and the mean
of the three recordings computed. All these measurements were done by the researcher at each
visit to avoid inter-observer error. A standard mercury sphygmomanometer (Accoson) was
used for blood pressure measurement. They were instructed to avoid cigarette smoking,
ingestion of kolanut and coffee prior to measurement of the blood pressure. The above
mentioned physical examinations were repeated for each subject at each visit.
Foot inspection was done and any abnormalities like calluses, conns, fungal infections and
ulcers noted and treated appropriately. Palpation of the dorsalis pedis and posterior tibial pulses
88
was done to identify any compromise. Vibration sense using a tuning fork of 126Hz and
sensation were assessed. All these were done at initial and final visits. The glycated
haemoglobin was also assessed at initial and final visits. The glycated haemoglobin was
assayed using the DCA analyzer. It is a quantitative assay based on a latex
immunoagglutination inhibition methodology. It is certified by the National Glyco-
haemoglobin Standardization Program (NGSP) and standardized against the Diabetes Control
and Complications Trial (DCCT) reference method. Hence it is a DCCT approved method as
recommended.11
Control Group
In the control arm, patients received the usual care provided to all diabetic patients attending
the GOPD. They were asked if there were problems and adherence to treatment plan reviewed.
FBG and past prescriptions were reviewed and adjustments made where necessary
They were given verbal advice on lifestyle modification (drugs, exercise, diet) and advised on
any other problem. They were asked to return for follow up at four weeks, eight weeks and 12
weeks.
Intervention Group
All patients in the intervention group received care based on some elements of the CCM using
a structured format (Appendix C).
It involved counselling on elements of DSME involving key self-care behaviours that include;
eating healthy, being active, monitoring( glucose monitoring and foot care), taking medication,
problem solving(identifying and responding to diabetic emergencies), healthy coping (setting
a self- management goal), and reducing risk.
89
It also involved appropriate referral so they were all given referral letters to the
Ophthalmologist and dietician; and subjects with diabetic foot referred for surgical review.
Feedback was requested and progress of their care with the Specialists was monitored. Their
visits were planned and coordinated by the researcher. The control group was seen on Mondays
and Wednesdays while the intervention group was seen on Tuesdays and Fridays. The head of
record in the GOPD was informed about the study and a record officer was engaged to help
during the duration of the study. This ensured that cards were retrieved promptly and made
available to the researcher on the appointment days. Proper documentation of results of each
subject was ensured and made easily available on each appointment day. The patients were
updated on their clinical progress and their self-management goals for each month discussed.
They were encouraged to discuss their challenges, counselled on self-help skills and
collaboratively a management plan made for each month.
Integration of community resources in the management was encouraged by advocacy to join
the Jos branch of the Diabetic Association of Nigeria which meets every first Saturday of the
month in the GOPD, JUTH.
They were given written instructions on aspects of the CCM management in either English or
Hausa language (which is a common language spoken in the environment) for easy
comprehension for the subjects who read and write in Hausa language. The Hausa instruction
sheet was translated into Hausa by a Doctor who was a native speaker and back translated by
a non-medical person in order to ensure content validity and a standardized instruction sheet.
They were asked to keep a diary of the recommended activities they did each day. Subjects that
were not literate were taught how to use a tally system. Responses to participants’ level of
engagement in key self-management behaviours: following an eating plan; eating fruits and
vegetables; engaging in physical activity (30 minutes of aerobic exercises); and taking
medications were recorded. Behaviour change was assessed from the percent of patient visits
90
in which a specific behaviour was reported for either <four days per week or four days or more
per week.175 They were asked to return for follow up at four weeks, eight weeks and 12 weeks.
At each follow-up visit, the instructions were repeated according to the structured format in
order to ensure comprehension. The obstacles that prevented the patient from adhering to the
instruction sheet were noted and ways to overcome them discussed.
The subjects in the two groups were seen on different follow-up dates to avoid contamination
and there was no crossing over of subjects during the entire study.
3.11 Duration of study:
The pilot test was done in May 2012. Eighteen patients were recruited per week and recruitment
of 76 patients took four weeks. Follow up was done over three months, making a total of four
months for data collection. Data collection took place between June and September 2012. An
additional four weeks was used to analyze and write up the data.
3.12 Data analysis:
The data was analysed using the Statistical Sciences for Social (SPSS) software (Version 18;
SPSS, Chicago , USA). 194-5 Descriptive analysis was done to compare both groups. Primary
outcome variables of interest were HbA1c and PACIC score. The t-test was used to compare
the continuous outcome variables of both study arms while proportions of categorical variables
between the groups were compared using the χ2 test and the Fisher’s exact. The Fisher’s exact
test was used to test for statistically significant associations when a cell contained five or less
observed variables. Continuous variables were expressed as mean and standard deviation while
categorical variables as number and percentages. Data of all the subjects who completed the
study was analyzed. P-values of <0.05 were considered significant. The results were presented
in the form of tables, bar and pie charts.
91
3.13 Ethical considerations
Approval for the study was obtained from the ethical committee of the Jos University Teaching
Hospital. The nature, aim and objectives of the study were explained to the patients.
Participation in the study was voluntary and informed consent was obtained from all
participants. The study was at no cost to the patients with all laboratory investigations paid for
by the investigator. The study involved no extra cost to the patient or extra clinic attendance.
The information obtained from the study was treated as confidential. The subjects had the
option of opting out of the study at any point with no prejudice to their further treatment.
CHAPTER FOUR
4.0 Results
4.1 Subjects flow through the study
Seventy-six (76) subjects fulfilled the inclusion criteria and participated in the study. This
number was randomised into the intervention and the control groups. However, only seventy
(92.1%) subjects completed the study. This included thirty-four in the control group and thirty-
six in the intervention group. The attrition rate was therefore 7.9%. Among the six (7.9%)
subjects that did not complete the study, four were in the control group and two were in the
intervention group. Out of the six subjects that did not complete the study, two relocated out
of Jos due to the sectarian crisis, one voluntarily withdrew from the study, while three subjects
were lost to follow-up despite all attempts at calling them. One of them opted for traditional
medication for treatment of his diabetic foot and didn’t come back after the first visit. He didn’t
come back to Jos throughout the duration of the study.
Analysis was carried out on the data of the seventy subjects that completed study.
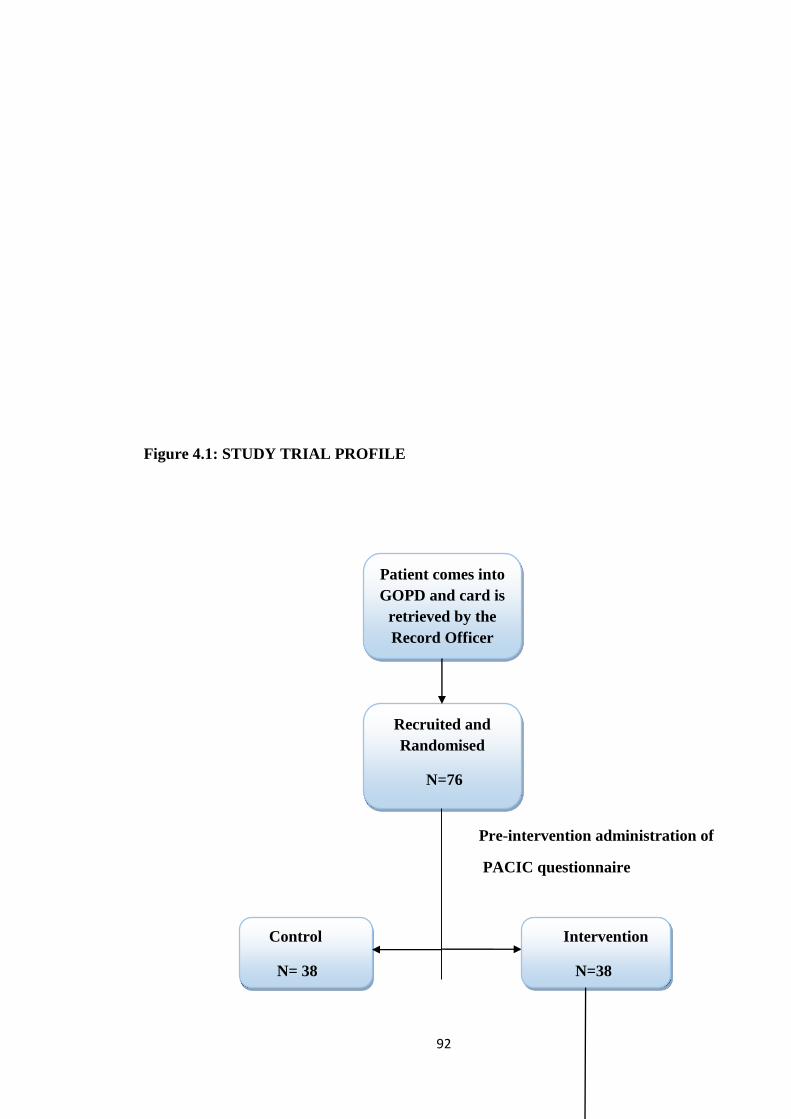
92
Figure 4.1: STUDY TRIAL PROFILE
Pre-intervention administration of
PACIC questionnaire
Recruited and
Randomised
N=76
Intervention
N=38
Control
N= 38
Patient comes into
GOPD and card is
retrieved by the
Record Officer
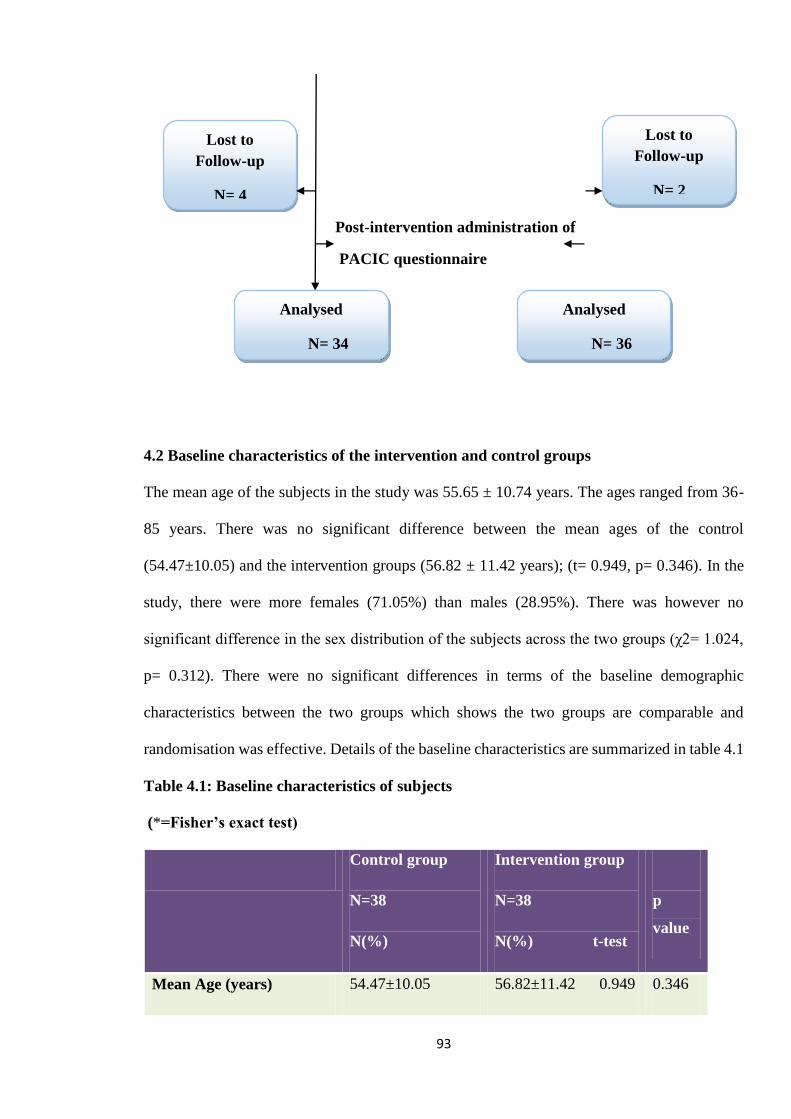
93
Post-intervention administration of
PACIC questionnaire
4.2 Baseline characteristics of the intervention and control groups
The mean age of the subjects in the study was 55.65 ± 10.74 years. The ages ranged from 36-
85 years. There was no significant difference between the mean ages of the control
(54.47±10.05) and the intervention groups (56.82 ± 11.42 years); (t= 0.949, p= 0.346). In the
study, there were more females (71.05%) than males (28.95%). There was however no
significant difference in the sex distribution of the subjects across the two groups (χ2= 1.024,
p= 0.312). There were no significant differences in terms of the baseline demographic
characteristics between the two groups which shows the two groups are comparable and
randomisation was effective. Details of the baseline characteristics are summarized in table 4.1
Table 4.1: Baseline characteristics of subjects
(*=Fisher’s exact test)
Control group
N=38
N(%)
Intervention group
N=38
N(%) t-test
p
value
Mean Age (years) 54.47±10.05 56.82±11.42 0.949 0.346
Lost to
Follow-up
N= 2
Analysed
N= 36
Analysed
N= 34
Lost to
Follow-up
N= 4
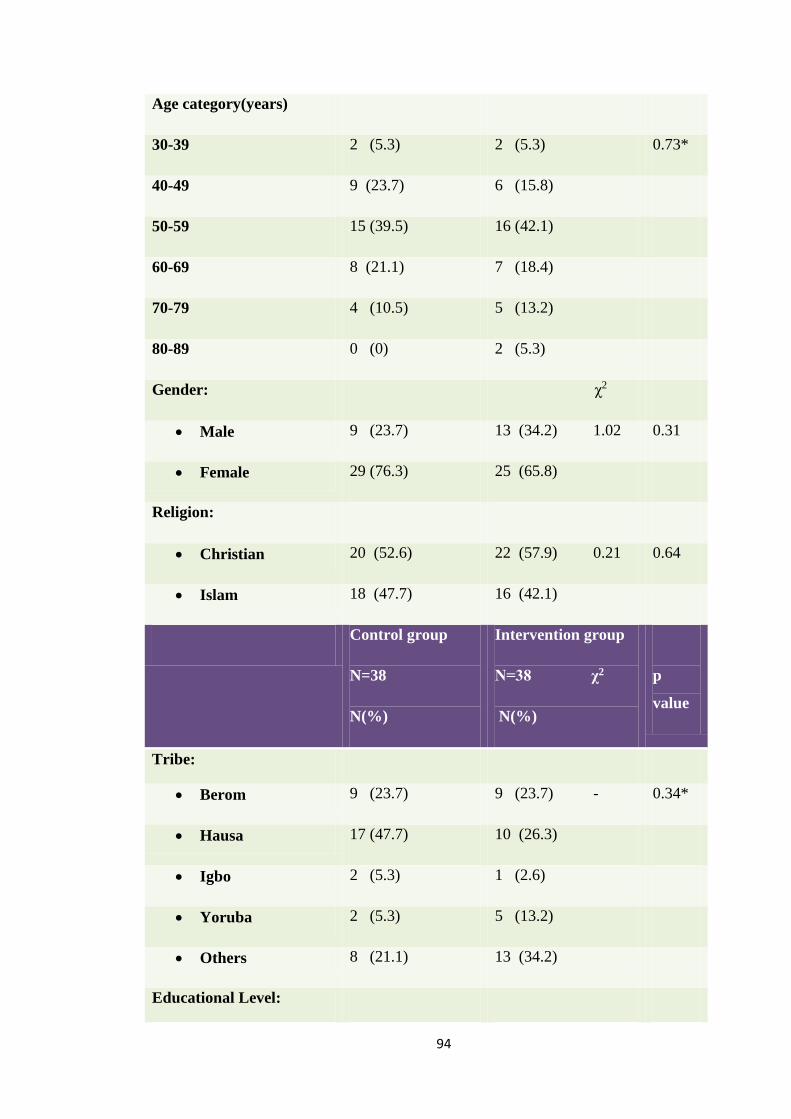
94
Age category(years)
30-39 2 (5.3) 2 (5.3) 0.73*
40-49 9 (23.7) 6 (15.8)
50-59 15 (39.5) 16 (42.1)
60-69 8 (21.1) 7 (18.4)
70-79 4 (10.5) 5 (13.2)
80-89 0 (0) 2 (5.3)
Gender: χ2
Male 9 (23.7) 13 (34.2) 1.02 0.31
Female 29 (76.3) 25 (65.8)
Religion:
Christian 20 (52.6) 22 (57.9) 0.21 0.64
Islam 18 (47.7) 16 (42.1)
Control group
N=38
N(%)
Intervention group
N=38 χ2
N(%)
p
value
Tribe:
Berom 9 (23.7) 9 (23.7) - 0.34*
Hausa 17 (47.7) 10 (26.3)
Igbo 2 (5.3) 1 (2.6)
Yoruba 2 (5.3) 5 (13.2)
Others 8 (21.1) 13 (34.2)
Educational Level:
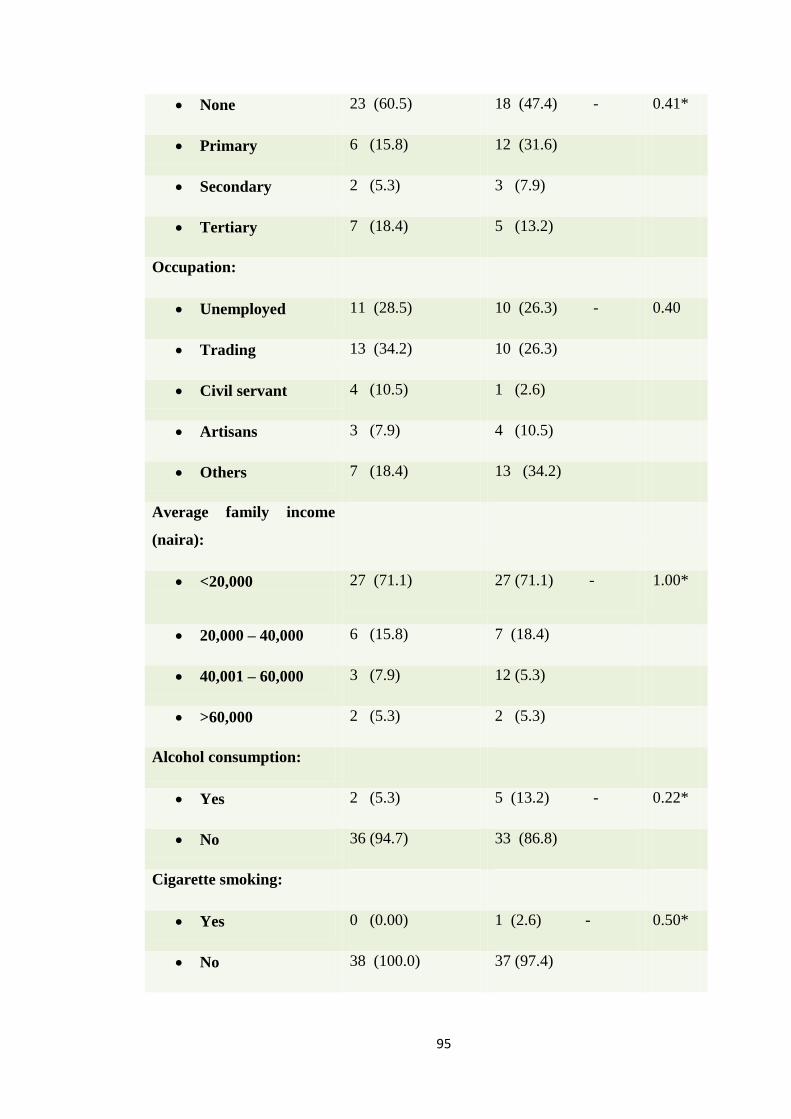
95
None 23 (60.5) 18 (47.4) - 0.41*
Primary 6 (15.8) 12 (31.6)
Secondary 2 (5.3) 3 (7.9)
Tertiary 7 (18.4) 5 (13.2)
Occupation:
Unemployed 11 (28.5) 10 (26.3) - 0.40
Trading 13 (34.2) 10 (26.3)
Civil servant 4 (10.5) 1 (2.6)
Artisans 3 (7.9) 4 (10.5)
Others 7 (18.4) 13 (34.2)
Average family income
(naira):
<20,000
27 (71.1) 27 (71.1) - 1.00*
20,000 – 40,000 6 (15.8) 7 (18.4)
40,001 – 60,000 3 (7.9) 12 (5.3)
>60,000 2 (5.3) 2 (5.3)
Alcohol consumption:
Yes 2 (5.3) 5 (13.2) - 0.22*
No 36 (94.7) 33 (86.8)
Cigarette smoking:
Yes 0 (0.00) 1 (2.6) - 0.50*
No 38 (100.0) 37 (97.4)
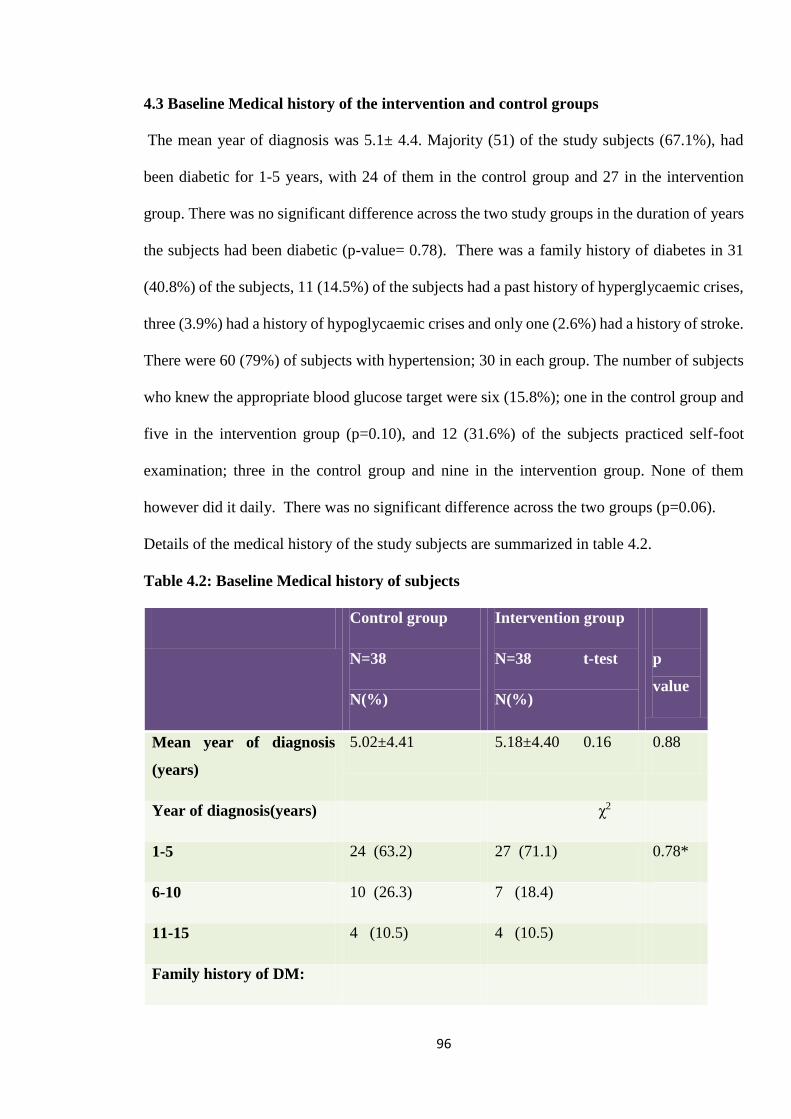
96
4.3 Baseline Medical history of the intervention and control groups
The mean year of diagnosis was 5.1± 4.4. Majority (51) of the study subjects (67.1%), had
been diabetic for 1-5 years, with 24 of them in the control group and 27 in the intervention
group. There was no significant difference across the two study groups in the duration of years
the subjects had been diabetic (p-value= 0.78). There was a family history of diabetes in 31
(40.8%) of the subjects, 11 (14.5%) of the subjects had a past history of hyperglycaemic crises,
three (3.9%) had a history of hypoglycaemic crises and only one (2.6%) had a history of stroke.
There were 60 (79%) of subjects with hypertension; 30 in each group. The number of subjects
who knew the appropriate blood glucose target were six (15.8%); one in the control group and
five in the intervention group (p=0.10), and 12 (31.6%) of the subjects practiced self-foot
examination; three in the control group and nine in the intervention group. None of them
however did it daily. There was no significant difference across the two groups (p=0.06).
Details of the medical history of the study subjects are summarized in table 4.2.
Table 4.2: Baseline Medical history of subjects
Control group
N=38
N(%)
Intervention group
N=38 t-test
N(%)
p
value
Mean year of diagnosis
(years)
5.02±4.41 5.18±4.40 0.16 0.88
Year of diagnosis(years) χ2
1-5 24 (63.2) 27 (71.1) 0.78*
6-10 10 (26.3) 7 (18.4)
11-15 4 (10.5) 4 (10.5)
Family history of DM:
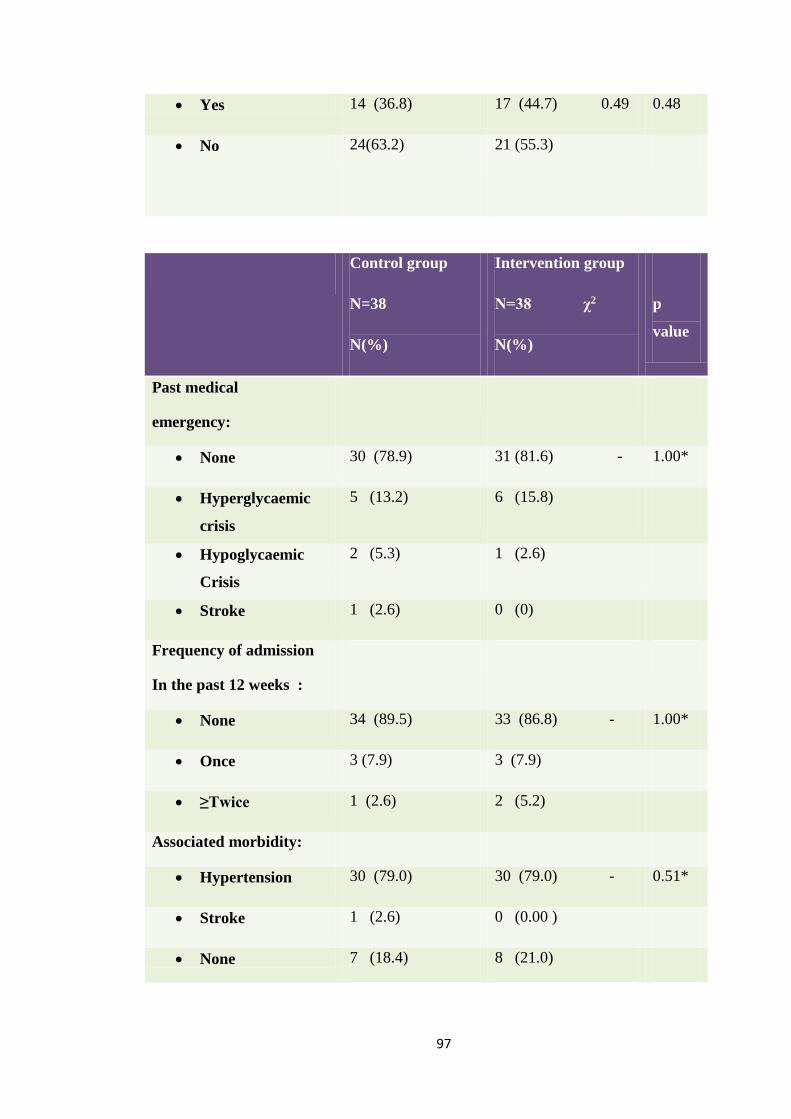
97
Yes 14 (36.8) 17 (44.7) 0.49 0.48
No 24(63.2) 21 (55.3)
Control group
N=38
N(%)
Intervention group
N=38 χ2
N(%)
p
value
Past medical
emergency:
None 30 (78.9) 31 (81.6) - 1.00*
Hyperglycaemic
crisis
5 (13.2) 6 (15.8)
Hypoglycaemic
Crisis
2 (5.3) 1 (2.6)
Stroke 1 (2.6) 0 (0)
Frequency of admission
In the past 12 weeks :
None 34 (89.5) 33 (86.8) - 1.00*
Once 3 (7.9) 3 (7.9)
≥Twice 1 (2.6) 2 (5.2)
Associated morbidity:
Hypertension 30 (79.0) 30 (79.0) - 0.51*
Stroke 1 (2.6) 0 (0.00 )
None 7 (18.4) 8 (21.0)
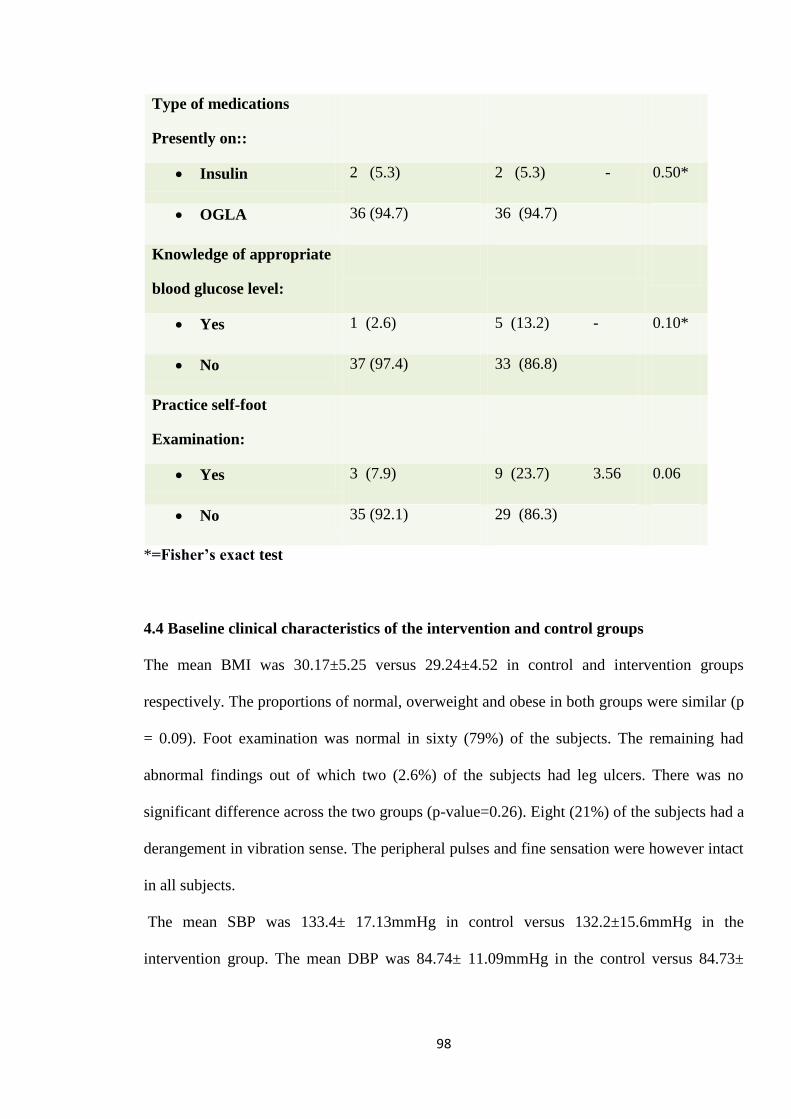
98
Type of medications
Presently on::
Insulin 2 (5.3) 2 (5.3) - 0.50*
OGLA 36 (94.7) 36 (94.7)
Knowledge of appropriate
blood glucose level:
Yes 1 (2.6) 5 (13.2) - 0.10*
No 37 (97.4) 33 (86.8)
Practice self-foot
Examination:
Yes 3 (7.9) 9 (23.7) 3.56 0.06
No 35 (92.1) 29 (86.3)
*=Fisher’s exact test
4.4 Baseline clinical characteristics of the intervention and control groups
The mean BMI was 30.17±5.25 versus 29.24±4.52 in control and intervention groups
respectively. The proportions of normal, overweight and obese in both groups were similar (p
= 0.09). Foot examination was normal in sixty (79%) of the subjects. The remaining had
abnormal findings out of which two (2.6%) of the subjects had leg ulcers. There was no
significant difference across the two groups (p-value=0.26). Eight (21%) of the subjects had a
derangement in vibration sense. The peripheral pulses and fine sensation were however intact
in all subjects.
The mean SBP was 133.4± 17.13mmHg in control versus 132.2±15.6mmHg in the
intervention group. The mean DBP was 84.74± 11.09mmHg in the control versus 84.73±
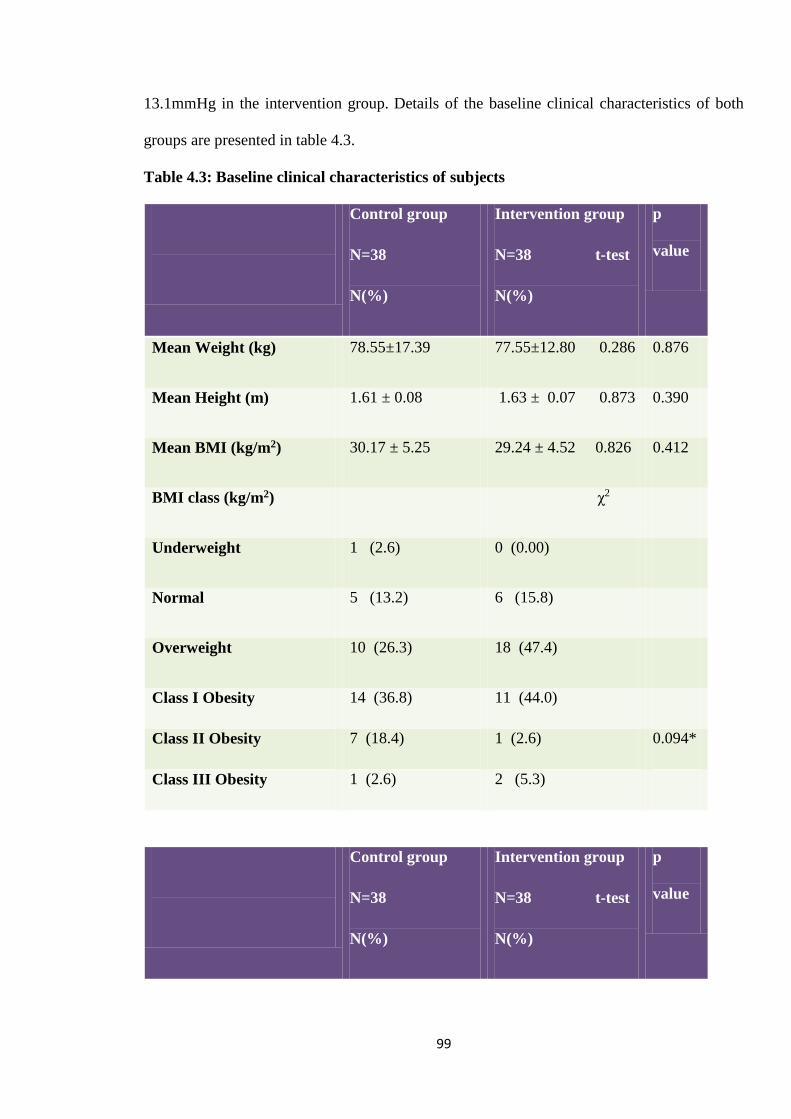
99
13.1mmHg in the intervention group. Details of the baseline clinical characteristics of both
groups are presented in table 4.3.
Table 4.3: Baseline clinical characteristics of subjects
Control group
N=38
N(%)
Intervention group
N=38 t-test
N(%)
p
value
Mean Weight (kg) 78.55±17.39 77.55±12.80 0.286 0.876
Mean Height (m) 1.61 ± 0.08 1.63 ± 0.07 0.873 0.390
Mean BMI (kg/m2) 30.17 ± 5.25 29.24 ± 4.52 0.826 0.412
BMI class (kg/m2) χ2
Underweight 1 (2.6) 0 (0.00)
Normal 5 (13.2) 6 (15.8)
Overweight 10 (26.3) 18 (47.4)
Class I Obesity 14 (36.8) 11 (44.0)
Class II Obesity 7 (18.4) 1 (2.6) 0.094*
Class III Obesity 1 (2.6) 2 (5.3)
Control group
N=38
N(%)
Intervention group
N=38 t-test
N(%)
p
value
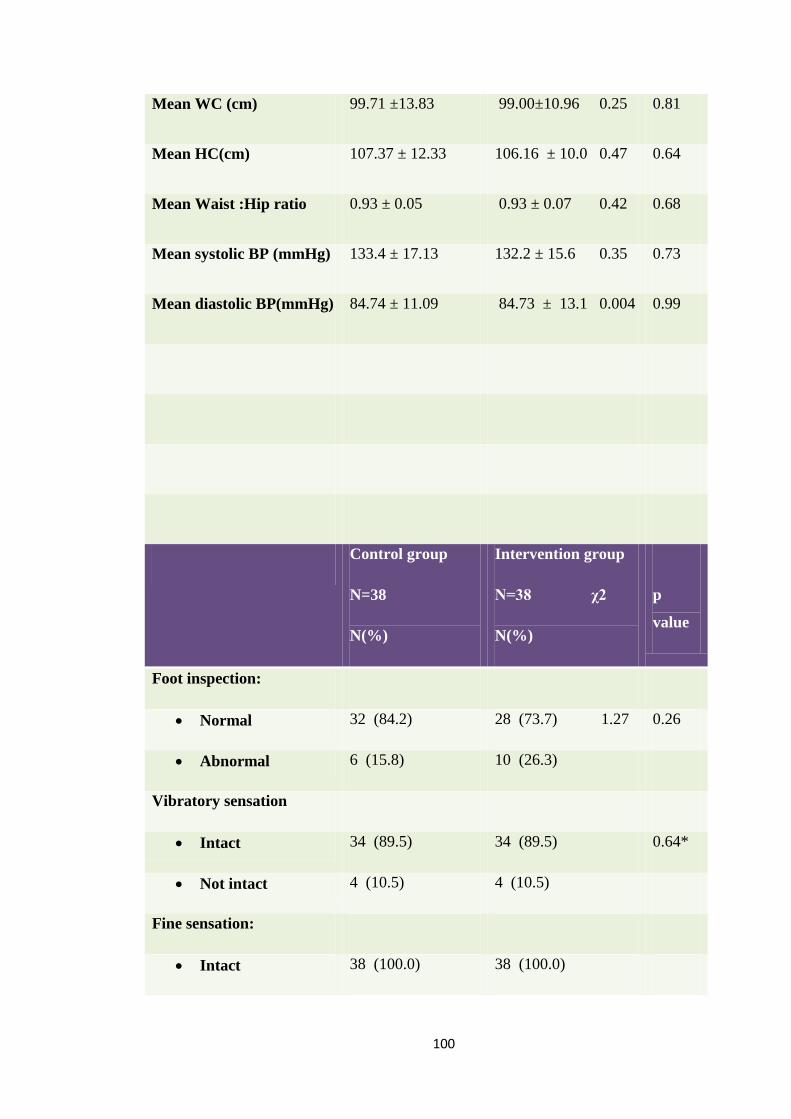
100
Mean WC (cm) 99.71 ±13.83 99.00±10.96 0.25 0.81
Mean HC(cm) 107.37 ± 12.33 106.16 ± 10.0 0.47 0.64
Mean Waist :Hip ratio 0.93 ± 0.05 0.93 ± 0.07 0.42 0.68
Mean systolic BP (mmHg) 133.4 ± 17.13 132.2 ± 15.6 0.35 0.73
Mean diastolic BP(mmHg) 84.74 ± 11.09 84.73 ± 13.1 0.004 0.99
Control group
N=38
N(%)
Intervention group
N=38 χ2
N(%)
p
value
Foot inspection:
Normal 32 (84.2) 28 (73.7) 1.27 0.26
Abnormal 6 (15.8) 10 (26.3)
Vibratory sensation
Intact 34 (89.5) 34 (89.5) 0.64*
Not intact 4 (10.5) 4 (10.5)
Fine sensation:
Intact 38 (100.0) 38 (100.0)
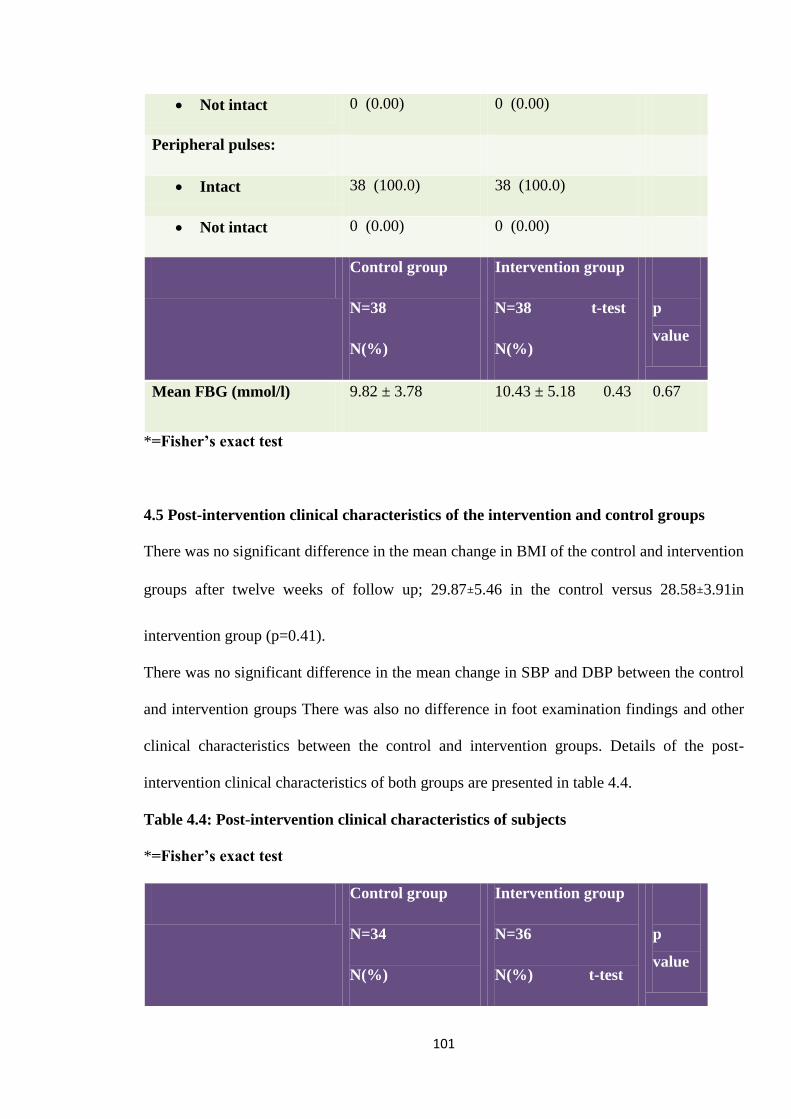
101
Not intact 0 (0.00) 0 (0.00)
Peripheral pulses:
Intact 38 (100.0) 38 (100.0)
Not intact 0 (0.00) 0 (0.00)
Control group
N=38
N(%)
Intervention group
N=38 t-test
N(%)
p
value
Mean FBG (mmol/l) 9.82 ± 3.78 10.43 ± 5.18 0.43 0.67
*=Fisher’s exact test
4.5 Post-intervention clinical characteristics of the intervention and control groups
There was no significant difference in the mean change in BMI of the control and intervention
groups after twelve weeks of follow up; 29.87±5.46 in the control versus 28.58±3.91in
intervention group (p=0.41).
There was no significant difference in the mean change in SBP and DBP between the control
and intervention groups There was also no difference in foot examination findings and other
clinical characteristics between the control and intervention groups. Details of the post-
intervention clinical characteristics of both groups are presented in table 4.4.
Table 4.4: Post-intervention clinical characteristics of subjects
*=Fisher’s exact test
Control group
N=34
N(%)
Intervention group
N=36
N(%) t-test
p
value
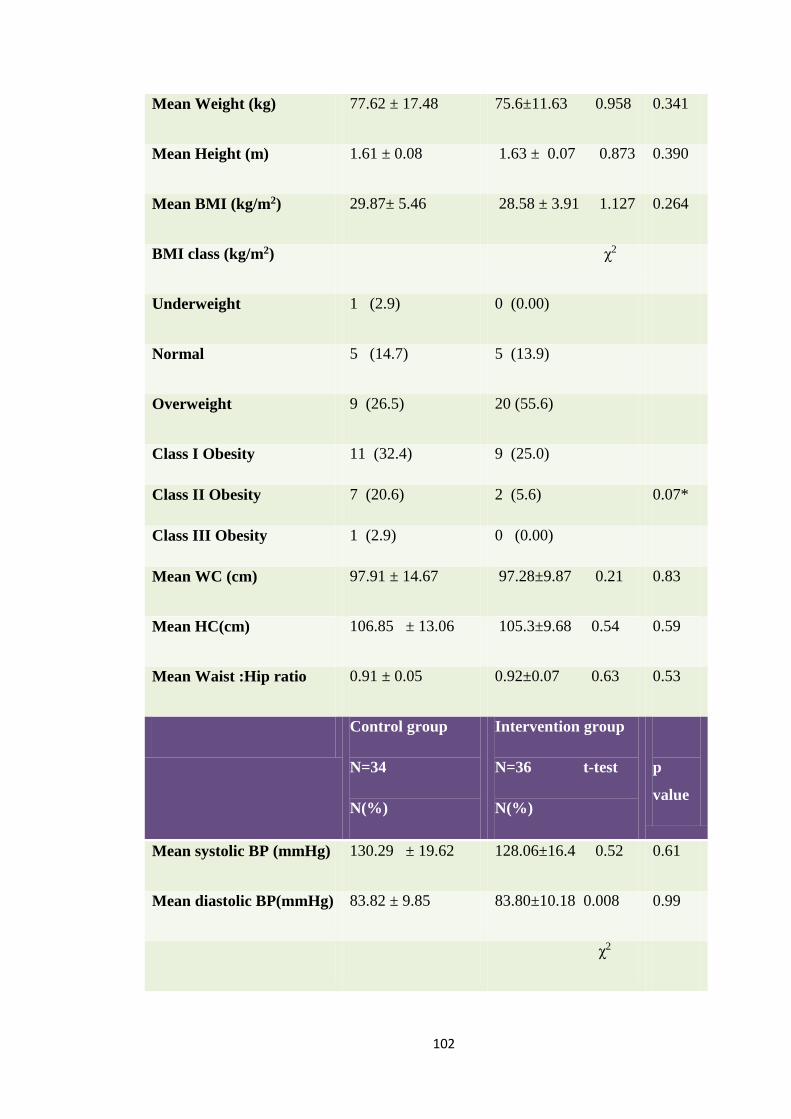
102
Mean Weight (kg) 77.62 ± 17.48 75.6±11.63 0.958 0.341
Mean Height (m) 1.61 ± 0.08 1.63 ± 0.07 0.873 0.390
Mean BMI (kg/m2) 29.87± 5.46 28.58 ± 3.91 1.127 0.264
BMI class (kg/m2) χ2
Underweight 1 (2.9) 0 (0.00)
Normal 5 (14.7) 5 (13.9)
Overweight 9 (26.5) 20 (55.6)
Class I Obesity 11 (32.4) 9 (25.0)
Class II Obesity 7 (20.6) 2 (5.6) 0.07*
Class III Obesity 1 (2.9) 0 (0.00)
Mean WC (cm) 97.91 ± 14.67 97.28±9.87 0.21 0.83
Mean HC(cm) 106.85 ± 13.06 105.3±9.68 0.54 0.59
Mean Waist :Hip ratio 0.91 ± 0.05 0.92±0.07 0.63 0.53
Control group
N=34
N(%)
Intervention group
N=36 t-test
N(%)
p
value
Mean systolic BP (mmHg) 130.29 ± 19.62 128.06±16.4 0.52 0.61
Mean diastolic BP(mmHg) 83.82 ± 9.85 83.80±10.18 0.008 0.99
χ2
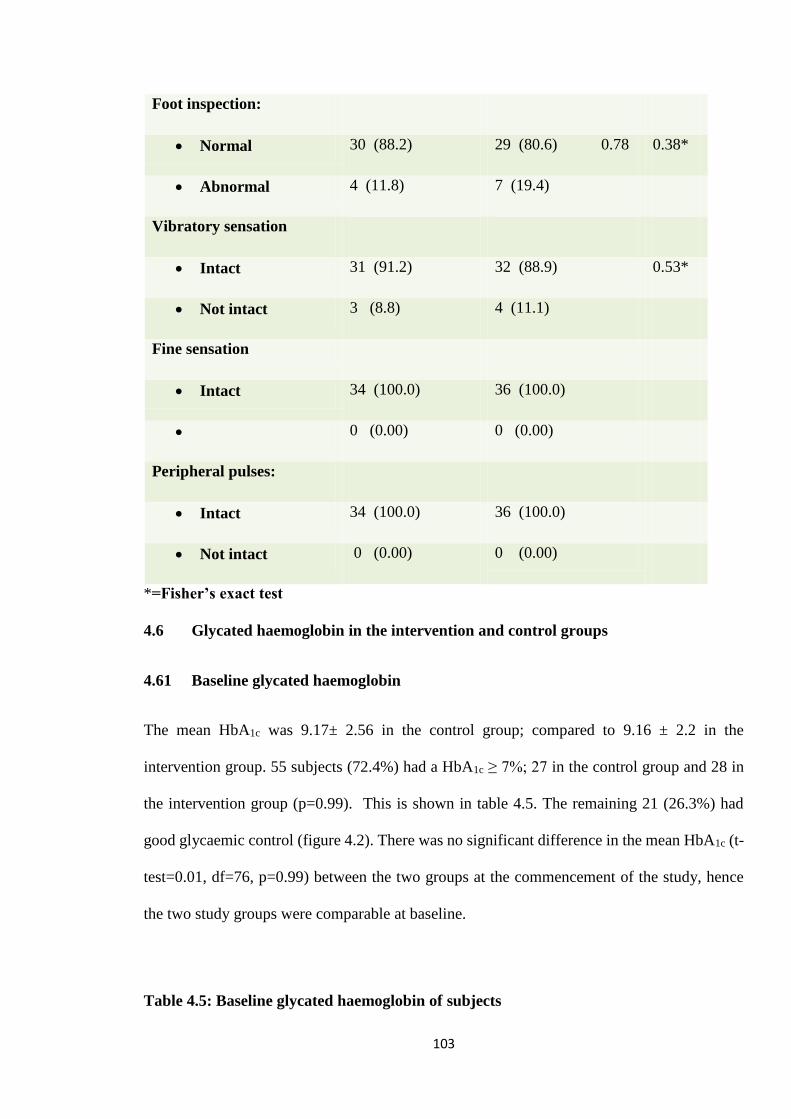
103
Foot inspection:
Normal 30 (88.2) 29 (80.6) 0.78 0.38*
Abnormal 4 (11.8) 7 (19.4)
Vibratory sensation
Intact 31 (91.2) 32 (88.9) 0.53*
Not intact 3 (8.8) 4 (11.1)
Fine sensation
Intact 34 (100.0) 36 (100.0)
0 (0.00) 0 (0.00)
Peripheral pulses:
Intact 34 (100.0) 36 (100.0)
Not intact 0 (0.00) 0 (0.00)
*=Fisher’s exact test
4.6 Glycated haemoglobin in the intervention and control groups
4.61 Baseline glycated haemoglobin
The mean HbA1c was 9.17± 2.56 in the control group; compared to 9.16 ± 2.2 in the
intervention group. 55 subjects (72.4%) had a HbA1c ≥ 7%; 27 in the control group and 28 in
the intervention group (p=0.99). This is shown in table 4.5. The remaining 21 (26.3%) had
good glycaemic control (figure 4.2). There was no significant difference in the mean HbA1c (t-
test=0.01, df=76, p=0.99) between the two groups at the commencement of the study, hence
the two study groups were comparable at baseline.
Table 4.5: Baseline glycated haemoglobin of subjects
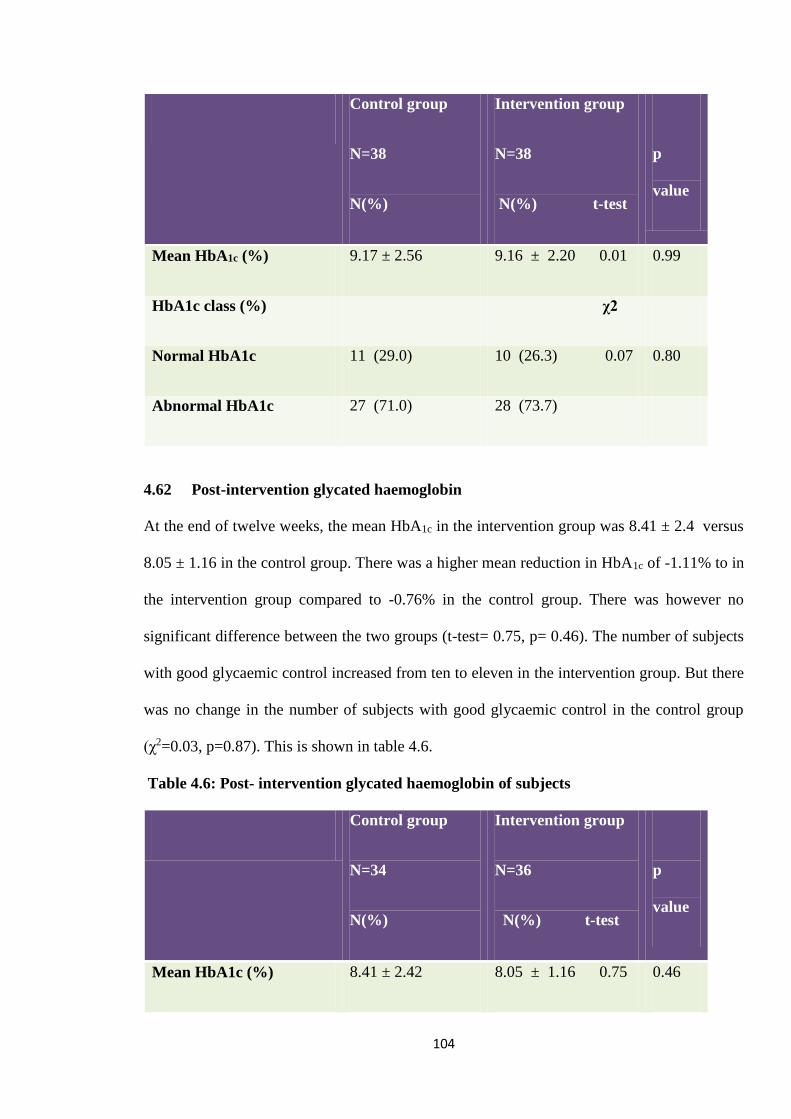
104
Control group
N=38
N(%)
Intervention group
N=38
N(%) t-test
p
value
Mean HbA1c (%) 9.17 ± 2.56 9.16 ± 2.20 0.01 0.99
HbA1c class (%) χ2
Normal HbA1c 11 (29.0) 10 (26.3) 0.07 0.80
Abnormal HbA1c 27 (71.0) 28 (73.7)
4.62 Post-intervention glycated haemoglobin
At the end of twelve weeks, the mean HbA1c in the intervention group was 8.41 ± 2.4 versus
8.05 ± 1.16 in the control group. There was a higher mean reduction in HbA1c of -1.11% to in
the intervention group compared to -0.76% in the control group. There was however no
significant difference between the two groups (t-test= 0.75, p= 0.46). The number of subjects
with good glycaemic control increased from ten to eleven in the intervention group. But there
was no change in the number of subjects with good glycaemic control in the control group
(χ2=0.03, p=0.87). This is shown in table 4.6.
Table 4.6: Post- intervention glycated haemoglobin of subjects
Control group
N=34
N(%)
Intervention group
N=36
N(%) t-test
p
value
Mean HbA1c (%) 8.41 ± 2.42 8.05 ± 1.16 0.75 0.46
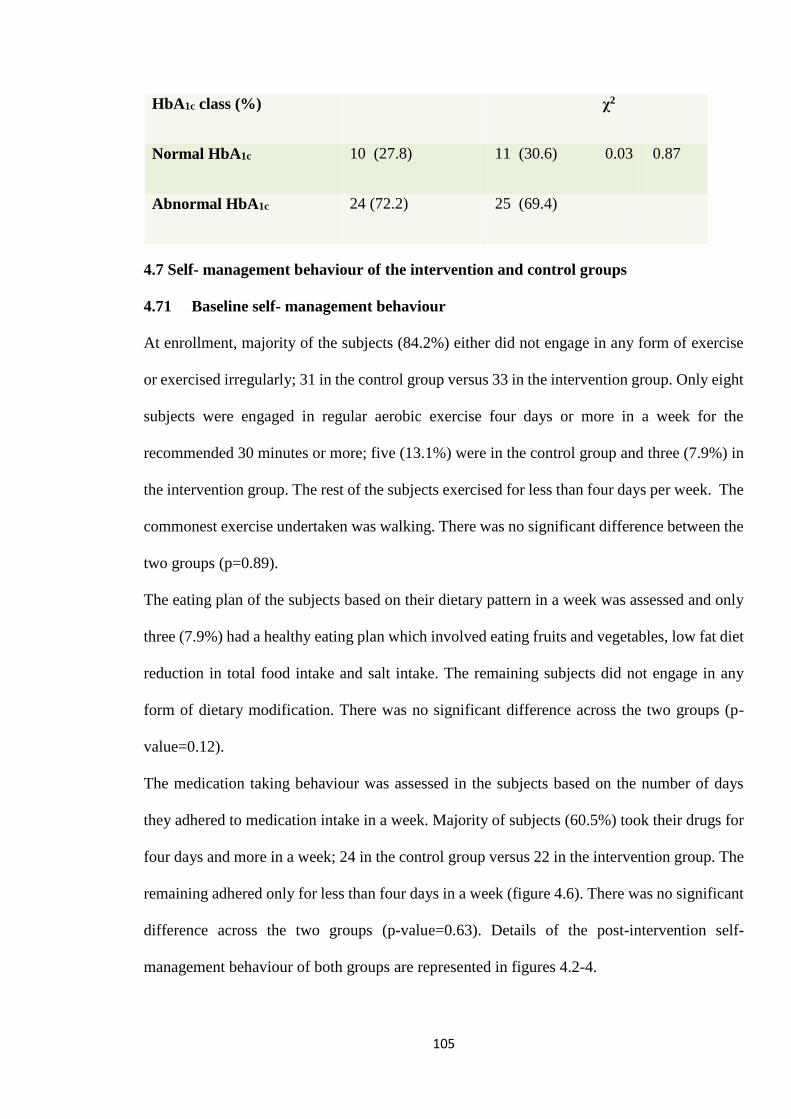
105
HbA1c class (%) χ2
Normal HbA1c 10 (27.8) 11 (30.6) 0.03 0.87
Abnormal HbA1c 24 (72.2) 25 (69.4)
4.7 Self- management behaviour of the intervention and control groups
4.71 Baseline self- management behaviour
At enrollment, majority of the subjects (84.2%) either did not engage in any form of exercise
or exercised irregularly; 31 in the control group versus 33 in the intervention group. Only eight
subjects were engaged in regular aerobic exercise four days or more in a week for the
recommended 30 minutes or more; five (13.1%) were in the control group and three (7.9%) in
the intervention group. The rest of the subjects exercised for less than four days per week. The
commonest exercise undertaken was walking. There was no significant difference between the
two groups (p=0.89).
The eating plan of the subjects based on their dietary pattern in a week was assessed and only
three (7.9%) had a healthy eating plan which involved eating fruits and vegetables, low fat diet
reduction in total food intake and salt intake. The remaining subjects did not engage in any
form of dietary modification. There was no significant difference across the two groups (p-
value=0.12).
The medication taking behaviour was assessed in the subjects based on the number of days
they adhered to medication intake in a week. Majority of subjects (60.5%) took their drugs for
four days and more in a week; 24 in the control group versus 22 in the intervention group. The
remaining adhered only for less than four days in a week (figure 4.6). There was no significant
difference across the two groups (p-value=0.63). Details of the post-intervention self-
management behaviour of both groups are represented in figures 4.2-4.
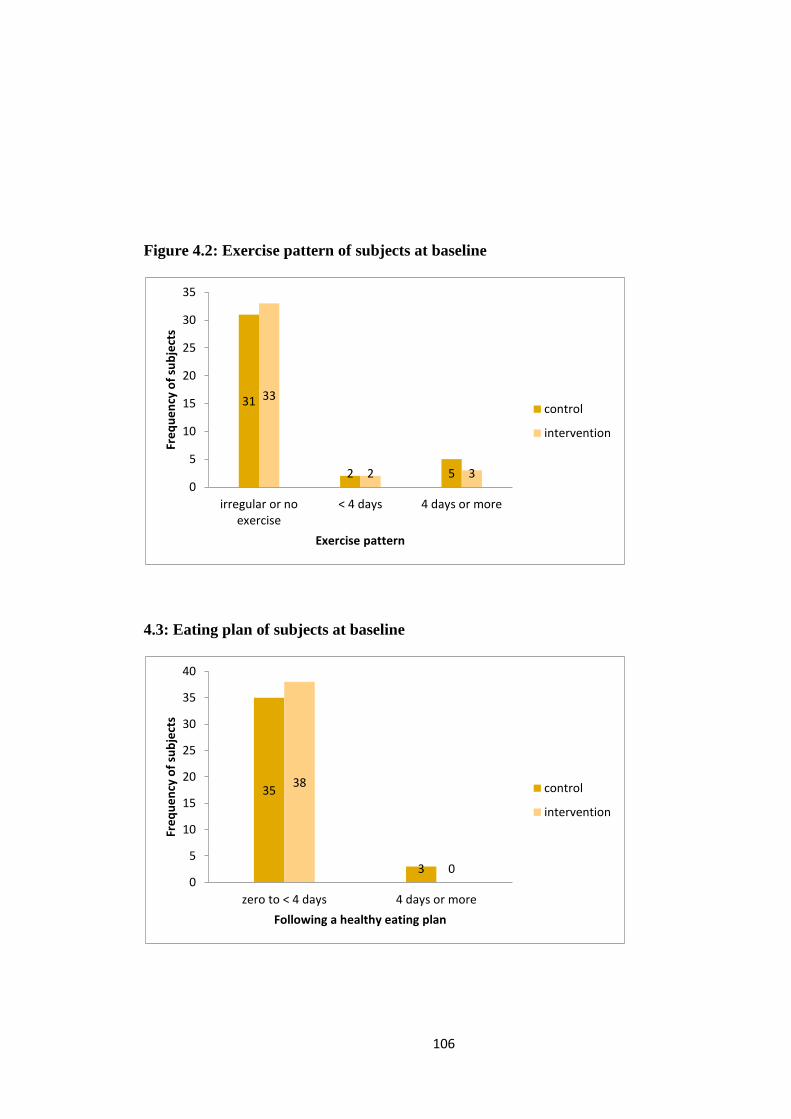
106
Figure 4.2: Exercise pattern of subjects at baseline
4.3: Eating plan of subjects at baseline
31
2 5
33
2 30
5
10
15
20
25
30
35
irregular or noexercise
< 4 days 4 days or more
Fre
qu
en
cy o
f su
bje
cts
Exercise pattern
control
intervention
35
3
38
00
5
10
15
20
25
30
35
40
zero to < 4 days 4 days or more
Fre
qu
en
cy o
f su
bje
cts
Following a healthy eating plan
control
intervention
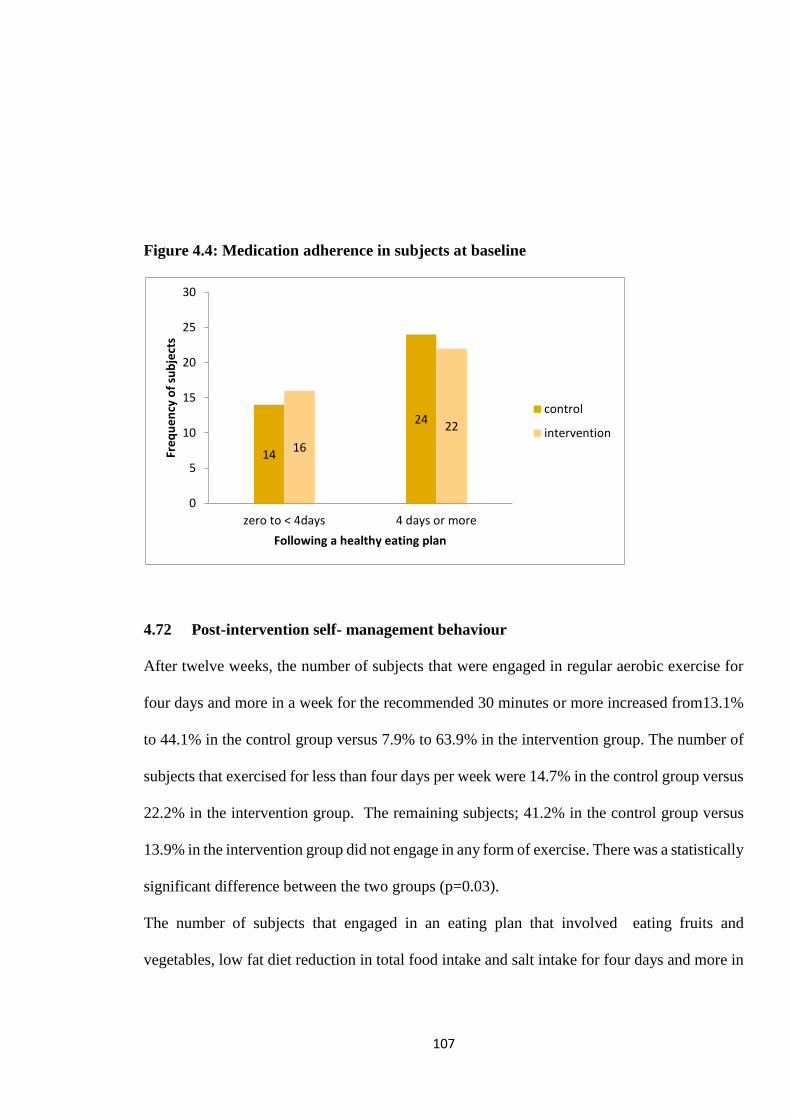
107
Figure 4.4: Medication adherence in subjects at baseline
4.72 Post-intervention self- management behaviour
After twelve weeks, the number of subjects that were engaged in regular aerobic exercise for
four days and more in a week for the recommended 30 minutes or more increased from13.1%
to 44.1% in the control group versus 7.9% to 63.9% in the intervention group. The number of
subjects that exercised for less than four days per week were 14.7% in the control group versus
22.2% in the intervention group. The remaining subjects; 41.2% in the control group versus
13.9% in the intervention group did not engage in any form of exercise. There was a statistically
significant difference between the two groups (p=0.03).
The number of subjects that engaged in an eating plan that involved eating fruits and
vegetables, low fat diet reduction in total food intake and salt intake for four days and more in
14
24
16
22
0
5
10
15
20
25
30
zero to < 4days 4 days or more
Fre
qu
en
cy o
f su
bje
cts
Following a healthy eating plan
control
intervention
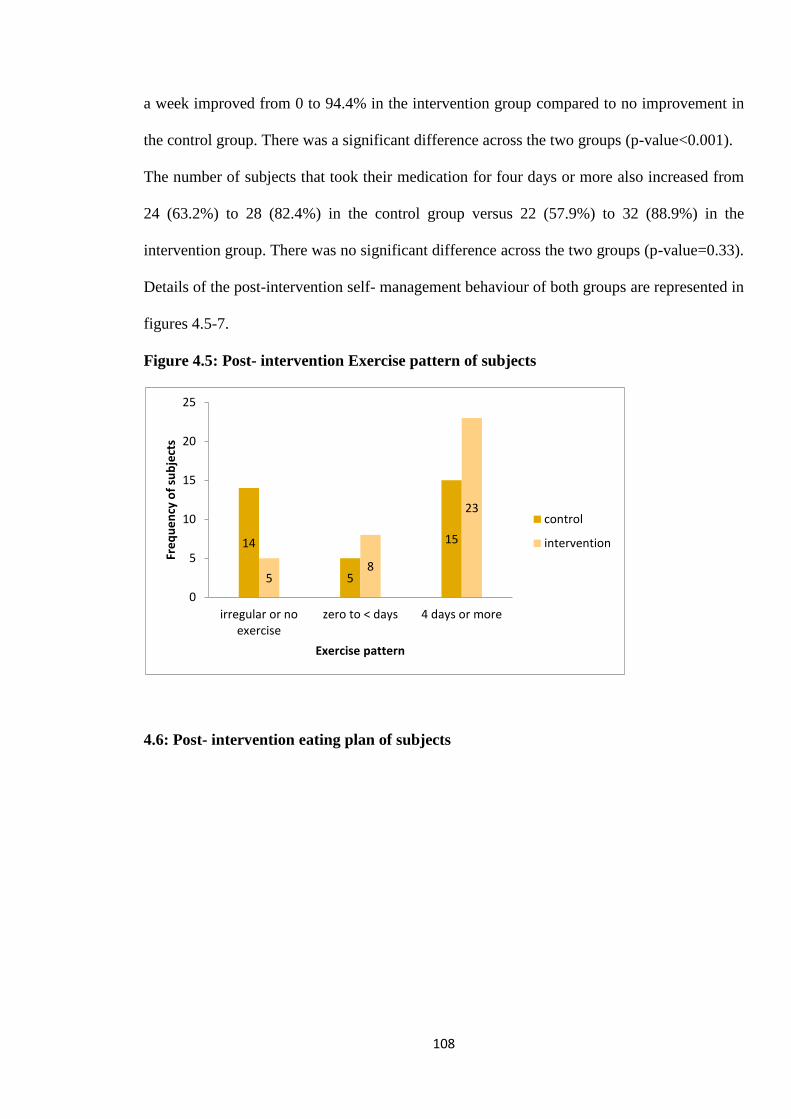
108
a week improved from 0 to 94.4% in the intervention group compared to no improvement in
the control group. There was a significant difference across the two groups (p-value<0.001).
The number of subjects that took their medication for four days or more also increased from
24 (63.2%) to 28 (82.4%) in the control group versus 22 (57.9%) to 32 (88.9%) in the
intervention group. There was no significant difference across the two groups (p-value=0.33).
Details of the post-intervention self- management behaviour of both groups are represented in
figures 4.5-7.
Figure 4.5: Post- intervention Exercise pattern of subjects
4.6: Post- intervention eating plan of subjects
14
5
15
58
23
0
5
10
15
20
25
irregular or noexercise
zero to < days 4 days or more
Fre
qu
en
cy o
f su
bje
cts
Exercise pattern
control
intervention
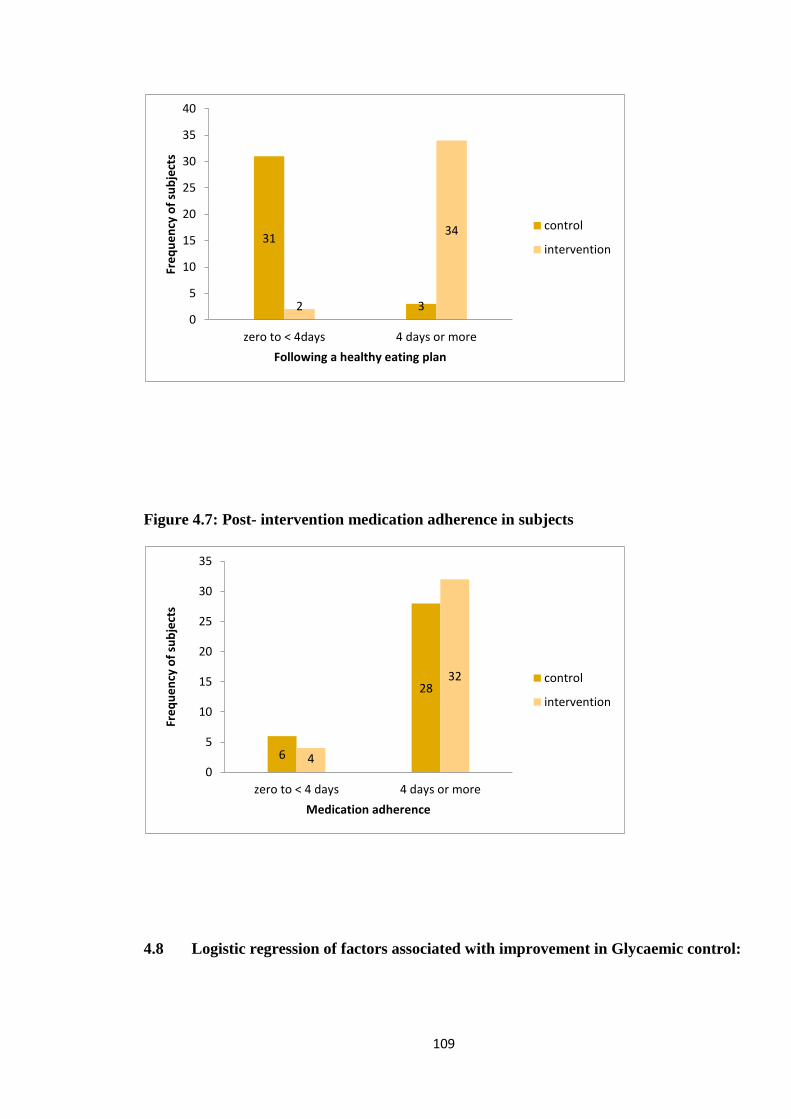
109
Figure 4.7: Post- intervention medication adherence in subjects
4.8 Logistic regression of factors associated with improvement in Glycaemic control:
31
32
34
0
5
10
15
20
25
30
35
40
zero to < 4days 4 days or more
Fre
qu
en
cy o
f su
bje
cts
Following a healthy eating plan
control
intervention
6
28
4
32
0
5
10
15
20
25
30
35
zero to < 4 days 4 days or more
Fre
qu
en
cy o
f su
bje
cts
Medication adherence
control
intervention
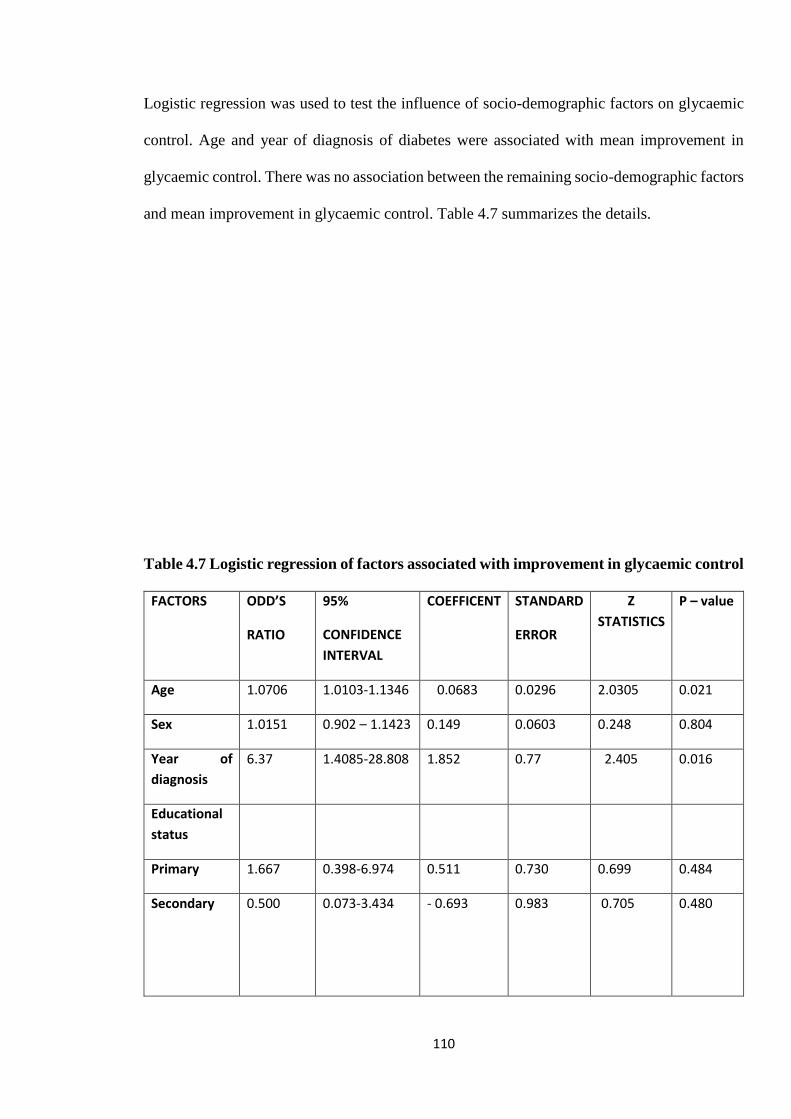
110
Logistic regression was used to test the influence of socio-demographic factors on glycaemic
control. Age and year of diagnosis of diabetes were associated with mean improvement in
glycaemic control. There was no association between the remaining socio-demographic factors
and mean improvement in glycaemic control. Table 4.7 summarizes the details.
Table 4.7 Logistic regression of factors associated with improvement in glycaemic control
FACTORS ODD’S
RATIO
95%
CONFIDENCE
INTERVAL
COEFFICENT STANDARD
ERROR
Z
STATISTICS
P – value
Age 1.0706 1.0103-1.1346 0.0683 0.0296 2.0305 0.021
Sex 1.0151 0.902 – 1.1423 0.149 0.0603 0.248 0.804
Year of
diagnosis
6.37 1.4085-28.808 1.852 0.77 2.405 0.016
Educational
status
Primary 1.667 0.398-6.974 0.511 0.730 0.699 0.484
Secondary 0.500
0.073-3.434 - 0.693 0.983 0.705 0.480
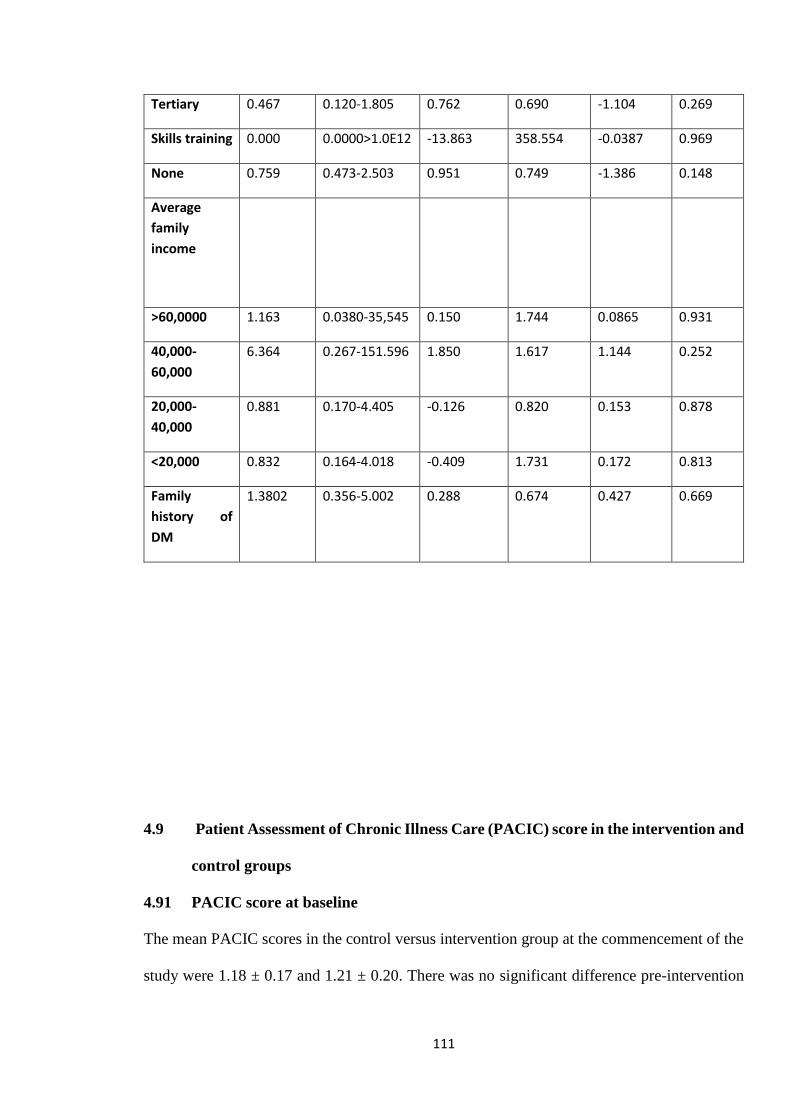
111
Tertiary 0.467 0.120-1.805 0.762 0.690 -1.104 0.269
Skills training 0.000 0.0000>1.0E12 -13.863 358.554 -0.0387 0.969
None 0.759 0.473-2.503 0.951 0.749 -1.386 0.148
Average
family
income
>60,0000 1.163 0.0380-35,545 0.150 1.744 0.0865 0.931
40,000-
60,000
6.364 0.267-151.596 1.850 1.617 1.144 0.252
20,000-
40,000
0.881 0.170-4.405 -0.126 0.820 0.153 0.878
<20,000 0.832 0.164-4.018 -0.409 1.731 0.172 0.813
Family
history of
DM
1.3802 0.356-5.002 0.288 0.674 0.427 0.669
4.9 Patient Assessment of Chronic Illness Care (PACIC) score in the intervention and
control groups
4.91 PACIC score at baseline
The mean PACIC scores in the control versus intervention group at the commencement of the
study were 1.18 ± 0.17 and 1.21 ± 0.20. There was no significant difference pre-intervention
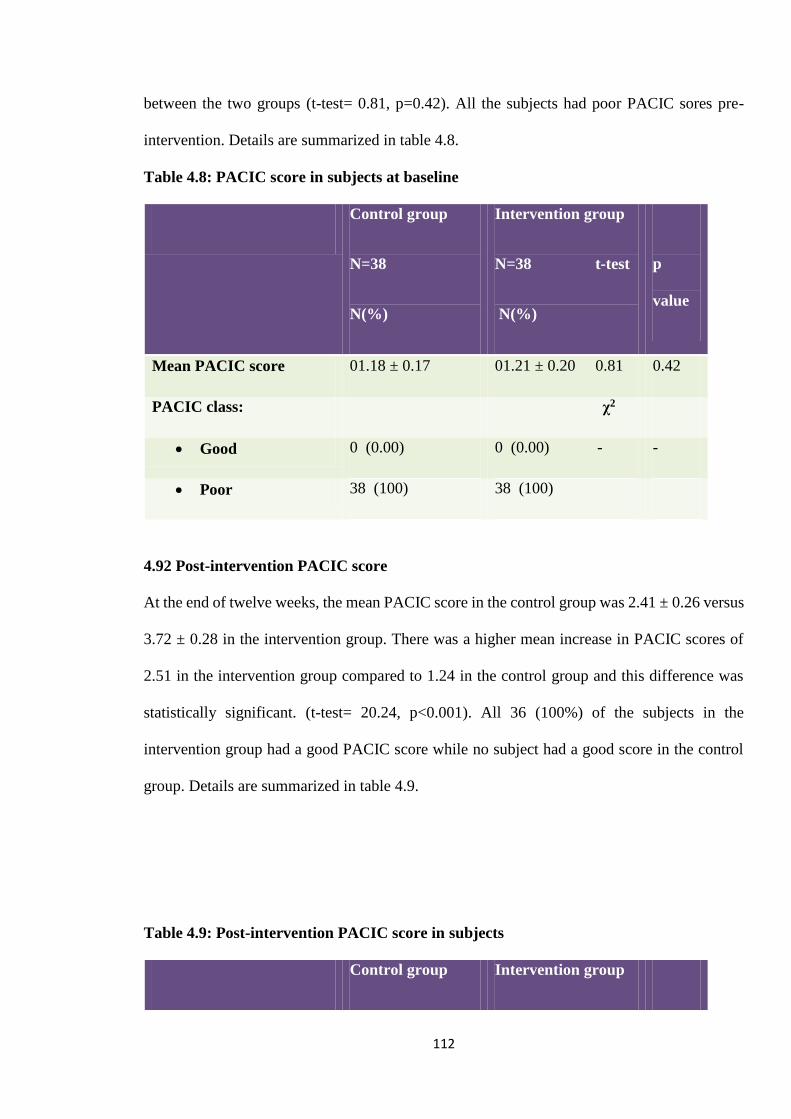
112
between the two groups (t-test= 0.81, p=0.42). All the subjects had poor PACIC sores pre-
intervention. Details are summarized in table 4.8.
Table 4.8: PACIC score in subjects at baseline
Control group
N=38
N(%)
Intervention group
N=38 t-test
N(%)
p
value
Mean PACIC score 01.18 ± 0.17 01.21 ± 0.20 0.81 0.42
PACIC class: χ2
Good 0 (0.00) 0 (0.00) - -
Poor 38 (100) 38 (100)
4.92 Post-intervention PACIC score
At the end of twelve weeks, the mean PACIC score in the control group was 2.41 ± 0.26 versus
3.72 ± 0.28 in the intervention group. There was a higher mean increase in PACIC scores of
2.51 in the intervention group compared to 1.24 in the control group and this difference was
statistically significant. (t-test= 20.24, p<0.001). All 36 (100%) of the subjects in the
intervention group had a good PACIC score while no subject had a good score in the control
group. Details are summarized in table 4.9.
Table 4.9: Post-intervention PACIC score in subjects
Control group Intervention group
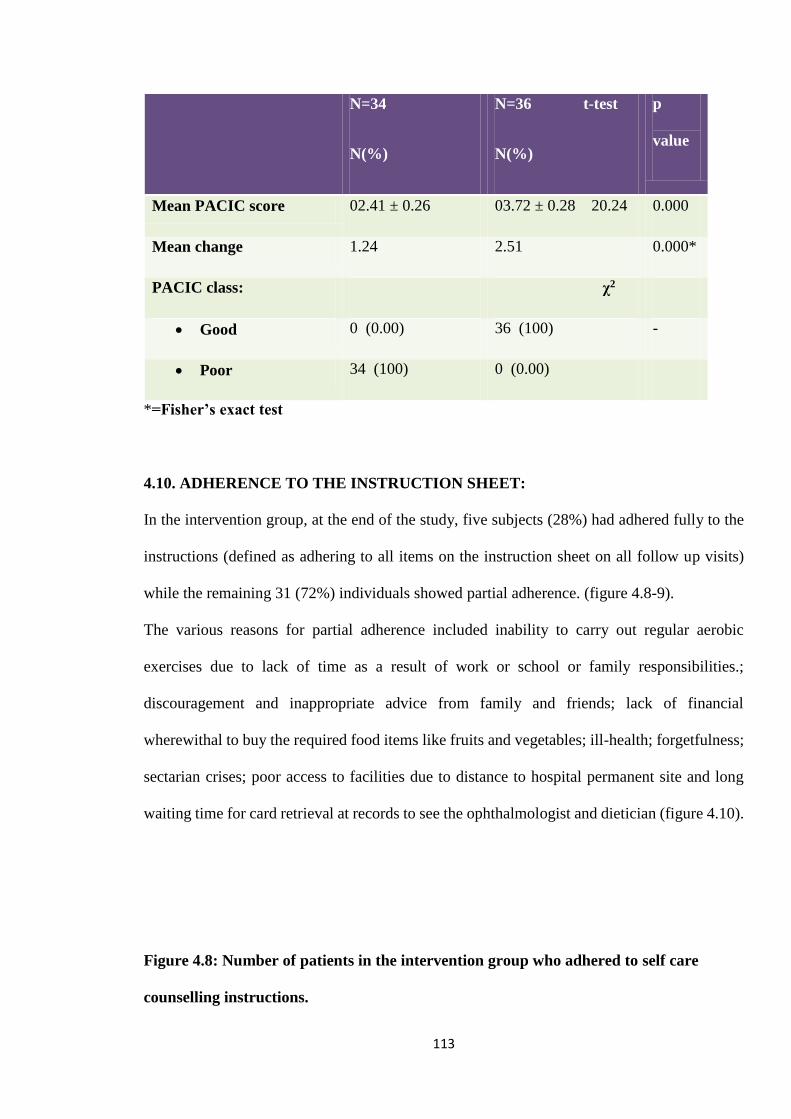
113
N=34
N(%)
N=36 t-test
N(%)
p
value
Mean PACIC score 02.41 ± 0.26 03.72 ± 0.28 20.24 0.000
Mean change 1.24 2.51 0.000*
PACIC class: χ2
Good 0 (0.00) 36 (100) -
Poor 34 (100) 0 (0.00)
*=Fisher’s exact test
4.10. ADHERENCE TO THE INSTRUCTION SHEET:
In the intervention group, at the end of the study, five subjects (28%) had adhered fully to the
instructions (defined as adhering to all items on the instruction sheet on all follow up visits)
while the remaining 31 (72%) individuals showed partial adherence. (figure 4.8-9).
The various reasons for partial adherence included inability to carry out regular aerobic
exercises due to lack of time as a result of work or school or family responsibilities.;
discouragement and inappropriate advice from family and friends; lack of financial
wherewithal to buy the required food items like fruits and vegetables; ill-health; forgetfulness;
sectarian crises; poor access to facilities due to distance to hospital permanent site and long
waiting time for card retrieval at records to see the ophthalmologist and dietician (figure 4.10).
Figure 4.8: Number of patients in the intervention group who adhered to self care
counselling instructions.
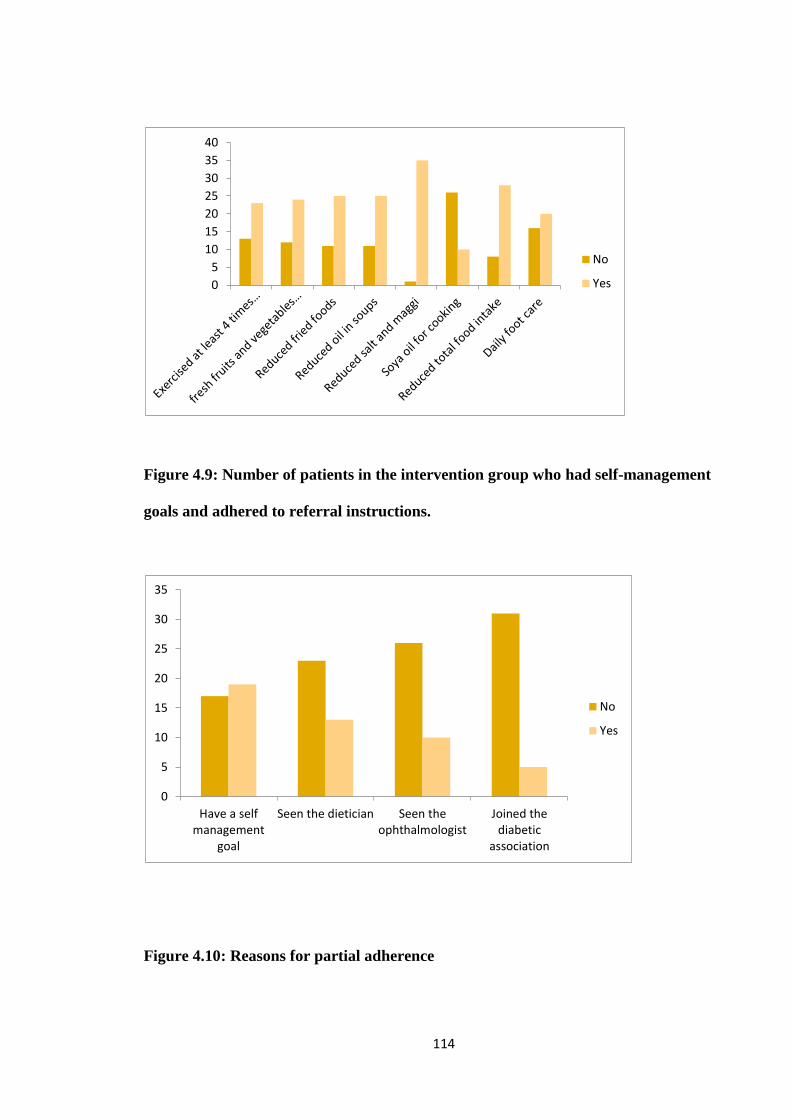
114
Figure 4.9: Number of patients in the intervention group who had self-management
goals and adhered to referral instructions.
Figure 4.10: Reasons for partial adherence
0
5
10
15
20
25
30
35
40
No
Yes
0
5
10
15
20
25
30
35
Have a selfmanagement
goal
Seen the dietician Seen theophthalmologist
Joined thediabetic
association
No
Yes
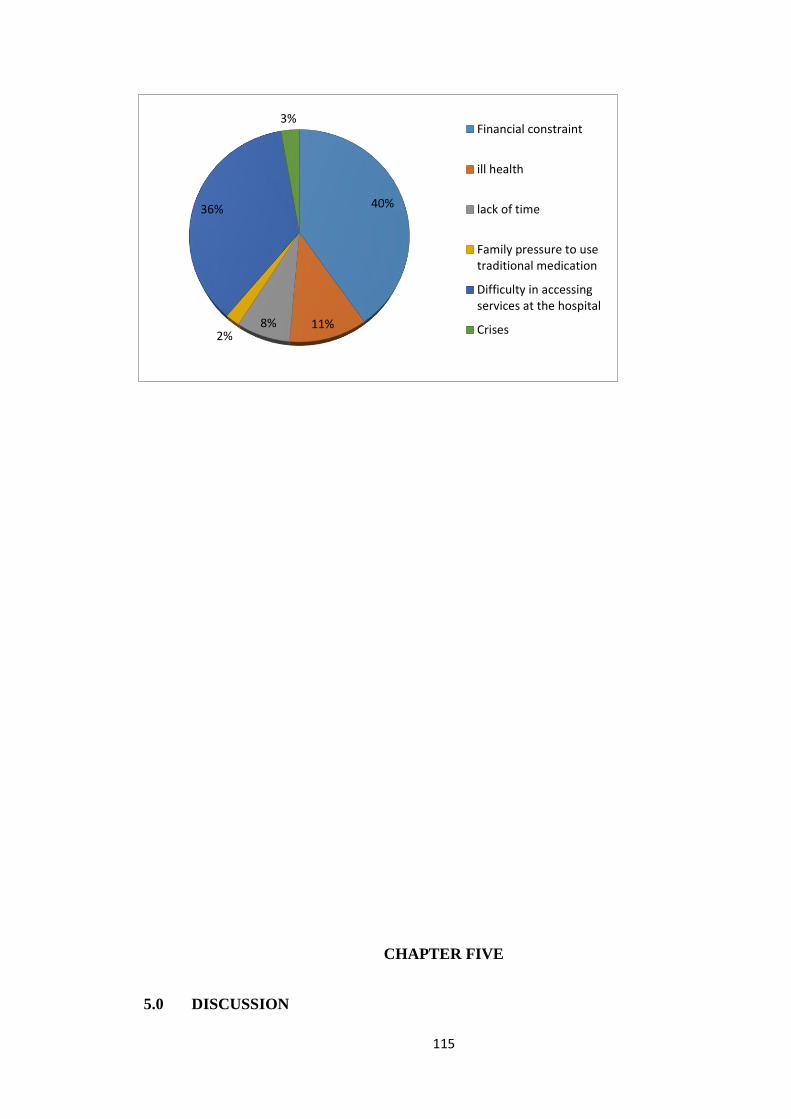
115
CHAPTER FIVE
5.0 DISCUSSION
40%
11%8%2%
36%
3%Financial constraint
ill health
lack of time
Family pressure to usetraditional medication
Difficulty in accessingservices at the hospital
Crises
116
Control of glycaemia is a priority in diabetes management and self-management is the
cornerstone of good diabetes care. Multiple studies have found that chronic care model (CCM)
is associated with increased diabetes knowledge, self-management behavior and improved
clinical outcomes such as lower HbA1c. This study sought to determine the effect of the chronic
care model on self-management behaviour and glycaemic control in adults with type 2 diabetes
with the view to recommending its use in routine care so as to ensure improved diabetes care.
At baseline, there were no significant differences between the control and intervention groups.
This may suggest that randomization was effective with regards to distribution of participants
in the groups. The attrition rate was 7.9%. This was less than the 10% used in calculating the
sample size and lower than that of 10% in a multifaceted randomized control trial by Piatt and
colleagues where the chronic care model was implemented.180
The study participants were between the ages of 36 years to 85 years with the greatest number
between the ages of 40- 69 years (80.3%) with a mean age of 55.5 years. The worsening of
insulin resistance with age, increased inactivity and longevity of diabetes patients due to
improved care are possible reasons for the rising prevalence of type 2 diabetes with age.39 The
figures in this study are similar to global figures which show that the greatest number of people
with diabetes are in the 40-59 age group.39,69 The mean age of 55.5 years found in this study is
similar to observations in Nigeria and other Sub-Saharan African countries where an age range
of 45-64 years was reported.39,69,98 In Nigeria, the risk of diabetes increases 3-4 times after the
age of 44 years.69 It was however low compared to reports from developed countries where
most diabetics were over 64 years of age. The lower mean age of diabetes compared with
patients in the developed world may be a reflection of the lower life expectancy of Nigerians
(average of 51.9 years in 2011) compared with the developed world (67 years to 84years), as
well as the reduced survival of Nigerian diabetic patients.39,69
117
There were more females (71.05%) than males (28.95%) in this study that is, a ratio of 2.5:1.
The sex distribution in this study is similar to the results of a multicentred study in seven centres
across the six geopolitical zones in Nigeria69 but does not reflect the pattern observed in studies
involving diabetic patients outside the tertiary health centres in Nigeria where the female:male
ratio is close to 1:1.43 Overall, diabetes prevalence is higher in men, but there are more women
with diabetes than men. The combined effect of a greater number of elderly women than men
in most populations and the increasing prevalence of diabetes with age is the most likely
explanation for this observation.16,183-4
The higher proportion of females in this study might have been due to the characteristic of the
study population, which consisted of more women presenting with type 2 diabetes mellitus at
the GOPD of JUTH. Unpublished data from the statistical unit of JUTH where this study was
carried out showed that over the last eight years, more women presented to the GOPD on a
daily basis than men with an average of two-thirds of the population being women from which
the study population was recruited.195
5.1 Self- management behaviour of the study group
Despite the increasing prevalence of type 2 diabetes in Nigeria; the self-management practices
of the general population is poor. At commencement of this study, there was no difference in
the self-management behaviour between the two groups with only 22% of subjects engaged in
regular aerobic exercise for four days or more in a week for the recommended 30 minutes.
These findings are consistent with findings from a multicentre study in Nigeria69 which showed
that only 35.9% of patients engaged in regular exercise Also, the findings that only 7.9% had
a healthy eating plan which involved eating fruits and vegetables, low fat diet reduction in
total food intake and salt intake is similar to a study by Okolie and colleagues in a secondary
care setting in Nigeria which showed that only 4.2% of patients knew about the beneficial
118
effects of healthy eating.185 Adherence to intake medication for four days or more in a week
was found in 60.5% of subjects, this is similar to findings by Kayode and colleagues in Ibadan
which reported a medication adherence of 54.8%.40 Poor patient understanding of diabetes is
believed to impede appropriate self-care management.69 This study showed that there was poor
knowledge and attitude about diabetes among type 2 diabetes patients; with only 15.8%
knowing what the blood glucose target was other studies in Nigeria have shown that only 6.4%
of patients had basic knowledge of diabetes management or care.40
After 12 weeks following the intervention; there was a significant improvement in self-
management behaviour. The difference was statistically significant between the two groups
with regard to diet and exercise. The number of subjects that were engaged in regular aerobic
exercise for four days and more in a week for the recommended 30 minutes or more increased
from13.1% to 44.1% in the control group and 7.9% to 63.9% in the intervention group
(p=0.03). The number of subjects that engaged in an eating plan that involved eating fruits and
vegetables, low fat diet, reduction in total food intake and salt intake for four days and more in
a week increased from 7.9% to 8.8% in the control group and 0 to 94.4% in the intervention
group (p<0.001). The medication taking behaviour also improved from 63.2% to 82.4% versus
57.9% to 88.9% in the group but the difference was not statistically significant (p=0.33).
Although there are no local studies to compare with, other studies have shown improvement in
self-management behaviour following interventions that foster patient self-management
behaviour.168,178-80 These findings are similar to those by Vallis and colleagues who examining
the long term effect of diabetes self-management education showed significant improvements
in adherence to most aspects of self-care, including medication use, self-testing, exercise, foot
care and general health behaviours like nutrition, exercise, and weight. Identification of goals
and achieving them increased substantially as a result of these strategies. Importantly, all of
119
these changes, with the exception of medication adherence, were sustained at the 2-year follow-
up.181
A randomized controlled trial by Piatt and colleagues showed that DSME/T, when
implemented within the context of the Chronic Care Model, improved clinical and behavioral
outcomes in an underserved community.180
This indicates that CCM interventions emphasizing self- management support was effective in
improving the self- management behaviour among the subjects.
5.2 Glycaemic control in the study groups
The mean HbA1c was 9.17± 2.56 in the control group; compared to 9.16± 2.20 in the
intervention group. Fifty- five (72.4%) subjects had a HbA1c ≥ 7% implying poor glycaemic
control. The remaining twenty-three (28.6%) had good glycaemic control. There was no
significant difference in the mean HBA1c (p>0.05) between the two groups at the
commencement of the study, implying the two study groups were comparable at baseline.
These findings are consistent with studies by Adebisi and colleagues in Ilorin which showed
that 64% of patients had poor glycaemic control.128-9 This has been attributed to poor self-care
practice and suboptimal management and poor compliance with global standards.16
At the end of 12 weeks there was a higher mean improvement in glycaemic control; though not
statistically significant in the intervention group (reduction of 1.11% in the intervention group
compared to 0.76 in the control group, p=0.46). This is similar to the finding of a study by
McAndrew and colleagues which did not show a significant improvement in glycated
haemoglobin over a short period144 but not consistent with other studies which showed a
statistically significant difference between groups.180-1 There was also a modest increase in the
percentage of those with good glycaemic control from 26.3% to 30.5%. The mean reduction of
120
1.11% is however comparable to that of 0.8- 0.93% observed in a meta-analysis. Vallis and
colleagues reported a reduction of 0.8 percentage point was observed in A1C levels following
interventions that emphasized self-management education.181 This study had a 80% power to
detect a change in HbA1c of 1% with 95% confidence. The inability to detect a difference may
be because the relatively short 12 week duration of the study was inadequate to detect a
difference compared to one year or more in other studies where there was an improvement. A
longer duration of study might show a more significant improvement in HbA1c in the
intervention group. It could also be because though the intervention wasn’t administered to the
control, the fact that they were participating in a study motivated them to make adjustments in
glycaemic control. A randomized controlled trial by Piatt and colleagues have also shown that
DSME/T, when implemented within the context of the Chronic Care Model, resulted in a
marked decline in HbA1c in the CCM group.180
Logistic regression of the influence of socio-demographic factors on glycaemic control showed
an association between improved glycaemic control and age and shorter duration of DM. This
finding is consistent with some studies165-8 but is contradicted by another report.169 The
worsening of glycaemic control over time could be explained by a reduction in pancreatic beta
cell function and an increased fat mass, particularly visceral adiposity, leading to greater insulin
resistance associated with the ageing process.
5.3 Patient Assessment of Chronic Illness Care (PACIC) score in the study group
At baseline, patient assessment of diabetes care using the Patient Assessment of Chronic Illness
Care scale showed low PACIC scores in this study at baseline. Other studies have reported low
121
PACIC scores.188-9 These scores have been determined to be significantly related to the quality
of diabetes care received suggesting that major improvements were required in chronic care.
There was a statistically significant higher mean improvement in PACIC scores post-
intervention in the intervention group of 2.51 compared to 1.24 in the control group (<0.001).
This implied a higher patient assessment of chronic illness care (PACIC) in the intervention
group following an intervention based on the chronic care model compared to the control group
that received usual care. All 36 (100%) subjects in the intervention group had good PACIC
scores post-intervention while none had good score in the control group.
These results indicate patient’s perception of greater involvement in self-management and
receipt of chronic care counselling following the CCM based intervention. It also shows that
CCM among patients with diabetes in JUTH resulted in greater patient motivation and support
by the physician to initiate changes. It also implies greater satisfaction with the organization of
care, adaptation of general instructions and suggestions to patient’s personal situation,
addressing of problems which interfered with achieving predefined goals and frequent follow-
up of the whole process of care.15 This finding is supported by studies by Schmittdiel and
colleagues which have shown that PACIC scores are significantly related to self-management
behaviour change.15,188-9
5. 4 Adherence to the Instruction Sheet:
Several reasons were given for partial adherence to the instruction sheet given to the
interventional group. They included lack of time as a result of work or school or family
responsibilities.; discouragement and inappropriate advice from family and friends; lack of
122
financial wherewithal to buy the required food items like fruits and vegetables; ill-health;
sectarian crises; forgetfulness; poor access to facilities due to distance to hospital permanent
site and long waiting time for card retrieval at records to see the ophthalmologist and dietician.
Financial constraint accounted for 50% of the reasons as source of financing was “out of the
pocket”. Adisa and colleagues in South western Nigeria which show that financial constraint
accounts for 35.5% of unintentional non-adherence and most patients pay for the treatment
“out of the pocket”.174-5 Poor access to facilities due to distance to the hospital permanent site
and protocol involved before specialists are seen accounted for 36% of reasons. This is an
important factor because it makes coordination of care and commitment to management plan
difficult on the part of the patients.
5.5 Strengths of the study
A major strength of this study is its design being a randomised single blinded control trial. Also
assessment of long term glycaemic control with HbA1c, which is not routinely done in our
environment was done at no cost to the patients.
5.6 Limitations of the study
There was a disproportionate male: female ratio in this study. Thus, the results of the study
may less likely be applicable to men. The reason for this may be that women are more likely
to present to the hospital and meet the inclusion criteria (this was a hospital-based study).
Due to the composition of the study groups, findings may not therefore be generalizable to
the wider population.
An important limitation was the short duration. Impact of the chronic care model on
glycaemic control is best seen over a longer period. A longer duration would have shown
if the improvements in self-management behavior and PACIC were sustainable.
123
5.7 CONCLUSION
The study demonstrated that people with type 2 diabetes experience improved self-
management behaviour after following interventions based on the chronic care model. Though
improvement in glycaemic control was observed, longer duration of study might be necessary
to establish the effect of CCM on glycaemic control. The study also showed a higher mean
improvement in patient assessment of chronic illness care (PACIC) in the intervention group
following patient self-management education. Hence indicating patient-centred self-
management support in line with the chronic care model was provided to the patients.
5.8 Recommendations
Patients’ knowledge and self-management practices were found to be poor in JUTH.
Hence provision of culturally appropriate diabetes self-management education is
essential. With structured guidelines, standardized and comprehensive diabetes self-
management education can be effected during a patient’s normal visit in resource poor
settings like the GOPD, JUTH.
Effective self-management and glycaemic control are the key outcomes of diabetic care
and should be measured and monitored as part of care
Re-organisation of the health care delivery system is needed to make patients have more
access to more services. Integrating self-management into routine care can help. Rather
than referring patients to a 30 or 60 minute appointment that would occur at another
time and location, focused encounters can take place during a patient’s normal office
visit. As a result, patients would receive more standardized and comprehensive care.
On-going advocacy, committed leadership and resources is vital for implementation
and sustenance of the CCM
124
Further research: Studies assessing the effect of the CCM based interventions are
needed in Nigeria. This study should be extended beyond the patients in the hospitals
to the communities in order to have a clearer picture of the impact of diabetes and effect
of CCM on self-management practices and glycaemia control on diabetics in Nigeria.
REFERENCES
1. Coleman K, Austin BT, Brach C, Wagner EH. Evidence on The Chronic Care Model
In The New Millennium. Health Affairs 2009;28(1):75-85.
2. Wagner EH, Austin BT, Davis C, Hindmarsh M, Schaefer J, Bonomi A. Improving
Chronic Illness Care: Translating Evidence Into Action. Health Affairs 2001;20(6):64-
77
3. American Diabetes Association. Diagnosis and Classification of Diabetes Mellitus.
Diabetes Care 2011: 34 Suppl 1:S62-69.
4. Wild SW, Roglic G, Green A, Sicree R, King H. Estimates for the year 2000 and
projections for 2030. Diabetes Care 2004;27:1047–1053.
125
5. Shaw JE, J Chisholm DJ. Epidemiology and prevention of type 2 diabetes and the
metabolic syndrome Jonathan E and Donald Med J Aust 2003; 179 (7): 379-383
6. Jamison DTFR, Makgoba MW, Bos ER, et al. Rao C. Causes of death. In: Jamison
DTFR, Makgoba MW, Bos ER, et al., eds. Disease and mortality in sub-Saharan
Africa. 2nd ed. Washington: The International Bank for Reconstruction and
Development/The World Bank, 2006:43–58
7. Levitt NS. Diabetes in Africa: epidemiology, management and healthcare challenges.
Heart 2008;94:1376-1382
8. Gaede P,Vedel P, Larsen N, et al. Multifactorial intervention andcardiovascular disease
in patients with type 2 diabetes. N Engl J Med. 2003;348:383-393
9. American Diabetes Association. Medical Management of Hyperglycemia in Type 2
Diabetes: A Consensus Algorithm for the Initiation and Adjustment of Therapy.
Diabetes Care 2009; 32:193–203.
10. Heisler M, Smith DM, Hayward RA, Krein SL, Kerr EA. How Well Do Patients’
Assessments of Their Diabetes Self-Management Correlate With Actual Glycaemic
Control and Receipt of Recommended Diabetes Services? Diabetes Care 2003; 26(3):
738-743.
11. American Diabetes Association. Standards of Medical Care in Diabetes- 2011.
Diabetes Care 2011; 34 Suppl 1:S11-61.
12. Nutting PA, Dickinson PW, Dickinson ML, Nelson CC, King DK, Crabtree BF et al.
Use of Chronic Care Model Elements Is Associated With Higher-Quality Care for
Diabetes. Ann Fam Med 2007; 5(1): 14–208
13. Fleming BB, Greenfield S, Engelgau MM, et al. The Diabetes Quality Improvement
Project: moving science into health policy to gain an edge on the diabetes epidemic.
Diabetes Care. 2001; 24(10):1815–1820.
126
14. Grace Chen Yu, Robin B .Implementation of a Chronic Illness Model for Diabetes
Care in a Family Medicine Residency Program. J Gen Intern Med 2010 -25(4):615-
619.
15. Glasgow RE, Wagner E, Schaefer J, Mahoney L, Reid , Greene S. Development and
validation of the Patient Assessment of Chronic Illness Care (PACIC). Med Care 2005;
43:436–44.
16. Nwankwo CH, Nandy B Nwankwo BO. Factors Influencing Diabetes Management
Outcome Among Patients Attending Government Health Facilities in South East
Nigeria. International Journal of Tropical Medicine 2010;5(2)28-36.
17. Meltzer S, Leiter L, Daneman D, Gerstein HC, Lau D, Ludwig S et al. 1998 clinical
practice guidelines for the management of diabetes in Canada. CMAJ 1998;159(8
Suppl):S1-29.
18. Centers for Disease Control. National Diabetes Fact Sheet. National Estimates on
Diabetes.Available at: http://www.cdc.gov/diabetes/pubs/estimates.htm.Accessed
1/09/12.
19. Exploring the literature of diabetes in Nigeria: a bibliometrics study Y I Harande
African Journal of Diabetes Medicine 2011;19(2) :8-11
20. World Bank Regional fact sheet from the World Development Indicators 2007 -sub-
Saharan Africa, 2007. Available at http://www.rrojasdatabank.info/wdi2007/region-
sheets.pdf (accessed 28 July 2012).
21. Diabetes Atlas. 4thEdition. International Diabetes Federation, Brussels, Belgium,
2009. WHO, 2009. World Health Organization, African region: Nigeria. Available at:
http://www.who.int/countries/nga/areas/hiv/en/index.htm. Accesed May 2012.
22. Popoola, M.M. Living with diabetes. The holistic experiences of Nigerians and African
Americans. Holistic Nurse pract 2005;19: 10-16.
127
23. Beran D, Yudkin JS. Diabetes care in sub-Saharan Africa. Lancet 2006; 368: 1689–95.
24. Price C, Shandu D, Dedicoat M, Gill G. School education and future glycaemia
control of type 2 diabetes in Africa
25. Gill G, Gebrekidan A, English P, Wile D, Tesfaye S. Diabetic complications and
glycaemic control in remote North Africa. Quarterly Journal of Medicine 2008; 101:
793–798.
26. Lawan UM, Tanimu N, Gadanya MA. Compliance to Diabetic Management amongst
patients with Diabetes Mellitus Attending a Government Hospital in Kano,
Northwestern Nigeria. Kanem Journal Of Medical Sciences 2008:2(1):
27. Sen K, Bonita R. Global h ealth status: two steps forward and one step backwards.
Lancet 2000;350:2195–2000.
28. Okoro, E., 2002. Diabetes care in Nigeria: Report of a self-audit. J. Diabetes
Complications, 16: 159-164.
29. Chijioke A, Adamu AN, Makusidi AM. Mortality pattern among type 2 diabetes
patients in Ilorin, Nigeria. JEMDSA 2010;15(2):1-4.
30. Maina WK, Ndegwa ZM, Njenga EW, Muchemi EW.Knowledge, attitude, and
practices related to diabetes among community members in four provinces in Kenya:
a cross-sectional study.
31. McGlynn EA. An evidence-based national quality measurement and reporting system.
Med Care. 2003; 41:I8–15.
32. Timothy GA. Factors influencing glycaemic control in diabetics at three community
health centres in Johannesburg (Dissertation). Faculty of Health Sciences University
of the Witwatersrand; 2012.
128
33. Family Physicians and Chronic Disease Management. Available at:
http://theconference.ca/family-physicians-and-chronic-disease-management.
Accessed December 2012.
34. Jos University Teaching Hospital Annual Report, Family Medicine Department 2004
pg14.
35. Martin CM. Chronic Disease and Illness Care. Canadian Family Physician
2007;53:2086-2091
36. Alwan A, Maclean DR, Riley LM, Mathers CD, Stevens GA, Bettcher D, et al.
Monitoring and surveillance of chronic non-communicable diseases: Progress and
capacity in high- burden countries. The Lancet, 2010, 376:1861–1868.
37. World Health Organization; 2008. The global burden of disease: 2004 update.
Available
from:www.who.int/healthinfo/global_burden_disease/GBD_report_2004update
(Accessed 2011 October 2).
38. International Diabetes Federation, Diabetes Atlas. 4th ed. 2009, Brussels.
39. International Diabetes Federation. The Diabetes Atlas. Fifth Edition. Brussels:
International Diabetes Federation; 2011.
40. World Health Organization. Prevention of diabetes mellitus. Technical Report
Series no. 844. Geneva: World Health Organization, 1994.
41. Mbanya JN, Motola AA, Sobngwi E, Assah FK, Enoru ST. Diabetes in sub-Saharan
Africa. The Lancet 2010;375(9733):2256-66.
42. The World Bank. Country and Lending Groups
2011. http://data.worldbank.org/about/country-classifications/countr-and-lending-
groups [Accessed 2011-08-23]
129
43. Awah PK, Unwin NC, Phillimore NC Diabetes Mellitus: Indigenous naming,
indigenous diagnosis and self-management in an African setting: the example from
Cameroon. BMC Endocrine Disorders 2009; 9:5-8
44. Nyenwe EA, Odia OJ, Ihekwaba AE, Ojule A, Babatunde S. Type 2 diabetes in adult
Nigerians: a study of its prevalence and risk factors in Port Harcourt, Nigeria. Diabetes
Res Clin Pract. 2003;62(3):177-85.
45. Oladapo OO, Salako L, Sodiq O, Shoyinka K, Adedapo K, Falase AO. A prevalence
of cardiometabolic risk factors among a rural Yoruba south-western Nigerian
population: a population-based survey. Cardiovasc J Afr 2010(1):26-31.
46. Osuntokun BO, Akinkugbe FM, Francic TT. Diabetus Mellitus in Nigeria: A Study of
832 patients. West Afr Med J 1971; 20:295 – 312.
47. Ohwovoriole AE, Kuti JA, Kabiawu SIO. Casual glucose levels and prevalence of
undiscovered diabetes mellitus in Lagos metropolis Nigeria. Diabetes research and
clinical practice; A(2) 1989:153 – 158.
48. Puepet FH. The prevalence of diabetes mellitus and associated risk factors in adults in
Jos (Dissertation) National Postgraduate Medical College of Nigeria; 1996.
49. Bakari AG, Onyemelekwe GC, Sani BG. Prevalence of diabetes mellitus in Sub urban
Northern Nigeria: result of a public screening survey. Diabetes International
1999;9:59- 66.
50. Puepet FH, Ohwovoriole AE. Prevalence of risk factors for diabetes mellitus in a non
diabetic population in Jos, Nigeria. Nigerian Journal of medicine 2008;17(10):71 – 4.
51. International Diabetes Federation; 2010 Jan. Diabetes Prevalence - Country Rankings
2010.
Availablefrom:http://www.allcountries.org/ranks/diabetes_prevalence_country_ranks
.html.html (accessed 2011 Oct. 3).
130
52. American Diabetes Association. Clinical practice recommendations 2002. Diabetes
Care 2004; 27:51.
53. Richard IG, Neil AH. A Text book of Essential Endocrinology and Diabetes. 5th
edition, Blackwell; 2007:219-22.
54. Grill V. A comparison of brain glucose metabolism in diabetes as measured by positron
emission tomography or by arteriovenous techniques. Ann Med 1990;22:171–5.
55. DeFronzo RA. Pathogenesis of type 2 diabetes mellitus. Med Clin N Am 2004;88:787–
835
56. DeFronzo RA. Pathogenesis of type 2 diabetes mellitus: metabolic and molecularimp
lications for identifying diabetes genes. Diabetes 1997;5:177–269
57. Bonner-Weir S.b-cell turnover. Its assessment and implications. Diabetes
2001;50:S20–4
58. Spellman CWPathophysiology of Type 2 Diabetes: Targeting Islet Cell Dysfunction.
J Am Osteopath Assoc 2010;110(3) S2-S7.
59. Bakari AB, Onyemelukwe GC. Pancreatic beta cell function in type 2 diabetic Nigeria
patients. Diabetes International 2006; 5:21-3.
60. Balogun WO, Adeleye JO. Strategies For Prevention Of Hyperglycaemic Emergencies
In Nigeria. Annals of Ibadan Postgraduate Medicine 2008;6(2):27-30
61. Medical Tutors Ltd. Hypertensive emergencies. Available
at:http://www.scribd.com/doc/94636618/Hyperglycaemic-Emergencies. Accessed
December 2012.
62. Centers for Disease Control and Prevention. Diabetes Surveillance System. Atlanta
GA: U.S.Department of Health and Human Services. 2003:Accessed at
www.cdc.gov/diabetes/statistics/
131
63. Okoro EO, Yusuf M, Salawu HO and Oyejola BA. Outcome of diabetic
hyperglycaemic emergencies in a Nigerian cohort. Journal of Chinese Clinical
Medicine.2007; 2(2):77-82.
64. Ogbera AO, Awobusuyi J, Unachukwu C, and Fasanmade O. Clinical features,
predictive factors and outcome of hyperglycaemic emergencies in adeveloping
country. BMC Endocr Disord. 2009;Mar 10;9:9.
65. Fowler MJ. Microvascular and macrovascular complications of Diabetes. Clinical
Diabetes 2008; 26(2):22-82.
66. Tesfaye S and Gill G. Chronic Diabetic Complications In Africa. African Journal of
Diabetes Medicine 2011;19(1):4-8.
67. Davids. H. Bell, MB. Chronic complications of diabetes. South Med J. 2002;95(1)
68. Chinenye S, Uloko AE, Ogbera AO, Ofoegbu EN, Fasanmade OA, Fasanmade AA
and Ogbu OO. Profile of Nigerians with diabetes mellitus - Diabcare Nigeria study
group (2008): Results of a multicenter study. Indian journal of endocrinology and
metabolism 07/2012; 16(4):558-64.
69. Al-Maskari F and El-Sadig M. Prevalence of diabetic retinopathy in the United Arab
Emirates: a cross-sectional survey. BMC Ophthalmology 2007, 7:11
70. Rotimi C, Daniel H, Zhou J, et al. Prevalence and determinants of diabetic retinopathy
and cataracts in West African type 2 diabetes patients. Ethn Dis. 2003;13(2 Suppl
2):S110–7.
71. Ashaye A, Arije A, Kuti M, Olusanya B, Ayeni E, Fasanmade A et al. Retinopathy
among Type 2 diabetic patients seen at a tertiary hospital in Nigeria. Clin Opthalm
2008;2(1):103-108
132
72. Kayode Odukoya O Odeniyi I Fasanmade O Ohwovoriole A.Pattern of chronic
complications among Nigerian patients with DM: the need for focused prevention
initiatives. Endocrine Abstracts 2012;29:624
73. Mbanya JC, Sobngwi E. Diabetes in Africa. Diabetes microvascular and
macrovascular disease in Africa. J Cardiovasc Risk 2003 2: 97–102
74. Adler A.L., Steven R.J., Manley S.E., Bilous R.W, Cull C.A., Holman R.R (2003):
Development and progression of nephropathy in type 2 diabetes. The United Kingdom
prospective study (UKPDS); kidney International: (63); 225-232
75. America Diabetes Association (ADA) (2004): Nephropathy in diabetes (position
statement): Diabetes care: (27); 578-583.
76. Maduka IC, Neboh EE and Kwubri UN. The Prevalence of Diabetic Nephropathy in
Diabetic Patients 2009;26(2):255-259
77. Ayodele OE, Alebiosu CO, Salako BL. Diabetic nephropathy—a review of the natural
history, burden, risk factors and treatment. J Natl Med Assoc. 2004;96:1445-1454.
78. Agaba EI. Characteristics of type 2 diabetics presenting with end stage renal disease at
the Jos University Teaching Hospital , Nigeria. WAJM 2004;23(2):142-145
79. Duby JJ, Campbell KR, Setter SM,White JY and Rasmussen KA. Diabetic
Neuropathy: An Intensive Review. American Journal of Health-System
Pharmacy. 2004;61(2)
80. Ugoya SO, Ugoya TA, Puepet FH, Agaba EI, Ogunniyi AO. Risk determinants of
peripheral neuropathy in Jos, North-central Nigeria. Journal of Chinese clinical
medicine 2008:5(3):5
133
81. Tesfaye S, Gill G. Chronic diabetic complications in Africa. African journal of
diabetes medicine 2011;19(1):4-8
82. Pendsey SP. Understanding diabetic foot. Int J Diabetes Dev Ctries 2010; 30: 75–9.
83. Centers for Disease Control and Prevention. History of foot ulcer among persons with
diabetes—United States, 2000-2002. MMWR Weekly. 2003;52:1098-1102. Available
at:http://www.cdc.gov/mmwr/preview/mmwrhtml/mm5245a3.htm. Accessed March
15, 2005.
84. American Diabetes Association. Peripheral arterial disease in people with
diabetes. Clin Diabetes. 2004;22:181-189.
85. Donaghue KC, Chiarelli F, Trotta D, Allgrove J, Dahl-Jorgensen K. Microvascular and
macrovascularcomplications associated with diabetes in children andadolescents.
Pediatric Diabetes 2009: 10 (Suppl. 12): 195–203.
86. Unadike BC, Eregie A, and Ohwovoriole AE. Association between glycaemic control
and erectile dysfunction amongst Nigerian diabetic patients. Mera: Diabetes
International 2008;15-18.
87. Shaeer KZM, Osegbe DN, Siddiqui CH, Razzaque H, Glasser DB. Jaguste V (2003).
Prevalence of ED and its correlates among men attending primary care clinics in 3
countries: Pakistan, Egypt, and Nigeria. Int. J. Impot. Res 2003; 15(1): 8-14.
88. Olarinoye JK Kuranga SK, Katibi IA, et al. Prevalence and determinant of erectile
dysfunction among people with type 2 diabetes in Ilorin: Niger Postgrad Med J 2006;
13: 291–6.
134
89. National Clinical Guidelines For Management Of Diabetes Mellitus. First edition; july
2010. Available from: www.pubhealth.go.ke. Accessed dec 2011
90. Dokken BB. The Pathophysiology of Cardiovascular Disease and Diabetes: Beyond
Blood Pressure and Lipids. Diabetes Spectrum 2008;21(3):160-5.
91. Muhlestein JB, Anderson JL, Horne BD, Lavasani F, Allen-Maycock CA, Bair TL,
Pearson RR, Carlquist JF: Effect of fasting glucose levels on mortality rate in patients
with and without diabetes mellitus and coronary artery disease undergoing
percutaneous coronary intervention. Am Heart J 2003;146 : 351–8
92. International Diabetes Federation: Diabetes prevalence [article online]. Available
from http://www.idf.org/home/index.cfm?node=264. Accessed 1 August 2008
93. Legato MJ, Gelzer A, Goland R, Ebner SA, Rajan S, Villagra V, Kosowski M: Gender-
specific care of the patient with diabetes: review and recommendations. Gend
Med 3:131 –158, 2006
94. Ogbera AO, Chineneye S, Onyekwere A, and Fasanmade O. Prognostic Indices of DM
mortality. Ethn Dis. 2007;17:721–725.
95. Merz CN, Buse JB, Tuncer D, Twillman GB: Physician attitudes and practices and
patient awareness of the cardiovascular complications of diabetes. J Am Coll
Cardiol 2002;40:1877 –1881, 2002
96. Gæde P. Effect of a multifactorial intervention on mortality in type 2 diabetes. N Engl
J Med. 2008;358:580-591
97. Unachukwu Cn, Uchenna Di, Young E. Mortality among diabetes in-patients in Port-
Harcourt, Nigeria. African Journal of Endocrinology and Metabolism 2008;7(1):1-4.
98. Ekore RI, Ajayi IO Ekore JO. Dietary management of diabetes: a practical approach
for primary care physicians in Nigeria. Mera: Diabetes International 2008;2:13-14
135
99. Amod A, Ascott-Evans BH, Berg GI, Blom DJ, Brown SL, Carrihill MM et al. The
2012 SEMDSA Guideline for the Management of Type 2 Diabetes (Revised).
JEMDSA 2012;17(2)(Supplement 1): S1-S95
100. Boule´ NG, Kenny GP, Haddad E, WellsGA, Sigal RJ. Meta-analysis of the effect of
structured exercise training on cardiorespiratory fitness in Type 2 diabetesmellitus.
Diabetologia 2003;46:1071–1081
101. NHS Scotland. Scottish Diabetes Survey 2009. Scottish Diabetes Survey Monitoring
Group. NHS Scotland; 2009. [cited 14 Jan2010]. Available from url:
http://www.diabetesinscotland.org.uk/Publications/Scottish%20Diabetes%20Survey
%202009.pdf
102. Yusuff, K.B., Obe, O., and Joseph, B.Y., (2008). Adherence to anti-diabetic drug
therapy and self management practices among type-2 diabetics in Nigeria. Pharm
World Sci,. 30(6):876-83.
103. Enwere OO, Salako BL and Falade CO. Prescription and Cost Consideration at a
Diabetic Clinic in Ibadan, Nigeria: A Report Annals of Ibadan Postgraduate Medicine.
2006;4(2):35-9.
104. Polyxeni A, Vassilis JD. Medicinal plants used for the treatment of diabetes and
its long-term complications. Chemistry and Activity 2010;33:69-175
105. UKPDS Study Group. Intensive blood-glucose control with sulphonyl-ureas or insulin
compared with conventional treatment and risk of complications in patients with type-
2 diabetes (UKPDS 33). Lancet1998;352: 837-53
106. Meier C, Kraenzlin ME, Bodmer M, et al.:Use of thiazolidinediones and fracture risk.
Arch Intern Med 168:820–825, 2008
107. Chobanian AV, Bakris GL, Black HR, Cushman WC, Green LA, Izzo JL Jr, Jones
DW, Materson BJ, Oparil S, Wright JT Jr, Roccella EJ, National Heart, Lung, and
136
Blood Institute Joint National Committee on Prevention, Detection, Evaluation, and
Treatment of High Blood Pressure, National High Blood Pressure Education Program
Coordinating Committee. The Seventh Report of the Joint National Committee on
Prevention, Detection, Evaluation, and Treatment of High Blood Pressure: the JNC 7
report. JAMA 2003;289:2560–2572
108. Newman H. Colagiuri S, Chen M, Colagiuri E., Evidence Based Guidelines for Type
2 Diabetes: Macrovascular disease. Canberra: Diabetes Australia & NHMRC, 2004.
http://www.diabetesaustralia.com.au
109. Bax JJ, Young LH, Frye RL, Bonow RO,Steinberg HO, Barrett EJ, ADA. Screening
for coronary artery disease in patients with diabetes. Diabetes Care 2007;30:2729–
2736
110. Riethof M, Flavin PL, Lindvall B, Michels R, O’Connor P, Redmon B, Retzer K,
Roberts J, Smith S, Sperl Hillen J. Institute for Clinical Systems Improvement.
Diagnosis and Management of Type 2 Diabetes Mellitus in Adults.
http://bit.ly/Diabetes0412. Updated April 2012.
111. Evan MB. Self-Monitoring of Blood Glucose: The Basics. Clinical Diabetes
2002;20(1):45-7
112. Karter AJ, Ackerson LM, Darbinian JA, D’Agostino RB Jr, Ferrara A, Liu J, Selby JV.
Self-monitoring of blood glucose levels and glycemic control: the Northern California
Kaiser Permanente Diabetes registry. Am J Med. 2001;111:1-9.
113. Klonoff DC.Benefits and Limitations of Self-Monitoring of Blood Glucose J Diabetes
Sci Technol 2007;1(1):130-132
114. Sarol JN, Nicodemus NA, Tan KM, Grava MB. Self-monitoring of blood glucose as
part of a multi-component therapy among noninsulin requiring type 2 diabetes patients:
a meta-analysis (1966–2004): Curr Med Res Opin. 2005;21:173-83.
137
115. Welschen LM, Bloemendal E, Nijpels G, Dekker JM, Heine RJ, Stalman WA and et
al. Self-monitoring of blood glucose in patients with type 2 diabetes who are not using
insulin: a systematic review. Diabetes Care 2005;28:1510–1517
116. French D, Craven A, Holman R, KinmonthAL, Neil A. Impact of self monitoring of
blood glucose in the management of patients with non-insulintreated diabetes: open
parallel group randomised trial. BMJ 2007;335:13242.
117. O’Kane MJ, Bunting B, Copeland M,Coates VE, ESMON study group. Efficacyof
self monitoring of blood glucosein patients with newly diagnosed type 2 diabetes
(ESMON study): randomisedcontrolled trial. BMJ 2008;336:1174–1177
118. Simon J, Gray A, Clarke P, Wade A, Neil A, Farmer A, Diabetes Glycaemic Education
and Monitoring Trial Group. Cost effectiveness of self monitoring of blood glucose in
patients with non-insulin treated type 2 diabetes: economic evaluationof data from the
DiGEM trial. BMJ 2008;336:1177–80
119. Sacks DB, Bruns DE, Goldstein DE, Maclaren NK, McDonald JM, Parrott M.
Guidelines and recommendations for laboratory analysis in the diagnosis and
management of diabetes mellitus. ClinChem 2002;48:436–72
120. Unachukwu CN, Young EE, Uchenna DI. Self blood glucose monitoring among
diabetic patients in Port Harcourt, Nigeria. African Journal of Diabetes Medicine
2011;19(1):19-20.
121. Syed IAA, Khan WA. Glycated Haemoglobin — a marker and predictor of
cardiovascular disease. J Pak Med Assoc 2011;61(7):690-5
122. Nathan DM, Turgeon H, Reagan S. Relationship between glycated haemoglobin and
mean glucose level over time. Diabetologia 2007;50: 2237-44
138
123. Akinloye OA, Adaramoye OA, Akinlade KS, Odetola AA,Raji AA. Relationship
between Fasting Plasma Glucoseand Glycated Haemoglobin In Adult Diabetic
Nigerians.African Journal of Biomedical Research, 2007; 10:127‐132.
124. Stratton IM, Adler AI, Neil HA, Matthews DR, Manley SE, Cull CA, Hadden D,
Turner RC, Holman RR. Association of glycaemia with macrovascular and
microvascular complications of type 2 diabetes (UKPDS 35): prospective
observational study. BMJ 2000;321:405–412
125. Miller CD, Barnes CS, Phillips LS, Ziemer DC, Gallina DL, Cook CB, Maryman SD,
El-Kebbi IM. Rapid A1c availability improves clinical decision making in an urban
primary care clinic.Diabetes Care 2003;26:1158–1163
126. Edo AE, Akhuemokhan K. Relationships between hemoglobin A 1c and spot glucose
measurements in Nigerians with type 2 diabetes mellitus. Nigerian journal of clinical
practice 2012;15(1):23-6
127. Nathan DM, Buse JB, Davidson MB, Ferrannini E, Holman RR, Sherwin R. Medical
Management of Hyperglycemia in Type 2 Diabetes: A Consensus Algorithm for the
Initiation and Adjusment of Therapy. Diabetes Care 2009;32(1)
128. Idogun ES, Olumese FE. Prevalence of poor glycaemic control in diabetics seen in a
tertiary medical centre Niger Postgrad Med J 2007; 14:34-6.
129. Adebisi SA, Oghagbon EK, Akande TM, Olarinoye JK. Glycated haemoglobin and
glycaemic control of diabetics in Ilorin. Niger J Clin Pract 2009; 12:87-91.
130. ADA Workshop Report; International Expert Committee Report on the Role ofthe
A1C Assay in the diagnosis of Diabetes. Diabetes Care 2009; 32: 1327-34.
131. Matteucci E, Milioni C, Biasci E, Bertoni C, Boldrini E, Giampiero O. With regard to
glycohemoglobin measurement: are we sure that high-performance liquid
139
chromathography currently works in the clinical routine? Acta Diabetologica 1998; 35:
41-7
132. L. Calisti, S. Tognetti. Measure of glycosylated hemoglobin. ACTA BIOMED 2005;
76; Suppl. 3: 59-62
133. Funnell MM, Anderson RM. The problem with compliance in diabetes. JAMA
2000;284(13): 1709.
134. American Association of Diabetes Educators. AADE Guidelines for the Practice of
Diabetes Self-Management Education and Training (DSME/T). 2010.
http://www.diabeteseducator.org/export/sites/aade/_resources/pdf/research/Guideline
s_Final_2_1_11.pdf.
135. Mulcahy K, Maryniuk M, Peeples M, et al. Diabetes self-management education core
outcomes measures. Diabetes Educ. 2003;29:768-764, 787-788.
136. Martin C, Daly A, McWhorter LS, Shwide-Slavin C, Kushion W. The scope of
practice, standards of practice, and standards of professional performance for diabetes
educators. Diabetes Educ. 2005;31:487-488, 490, 492.
137. Bantle JP, Wylie-Rosett J, Albright AL, et al. Nutrition recommendations and
interventions for diabetes: a position statement of the American Diabetes Association.
Diabetes Care. 2008;31:S61-S78. (4)
138. Povey R, Clark-Carter D. Diabetes and Healthy Eating - A Systematic Review of the
Literature The Diabetes Educator. 2007;33(6):931-959. (1)
139. Wing RR, Goldstein MG, Acton KJ, et al. Behavioral science research in diabetes:
lifestyle changes relatedto obesity, eating behavior, and physical activity. Diabetes
Care. 2001;24:117-123.
140
140. Albright A, Chapter 35 Reducing Risks pg 777, 781 Mensing C, ed. The Art and
Science of Diabetes Self-Management Education. A Desk Reference for Healthcare
Professionals. Chicago, IL: AmericanAssociation of Diabetes Educators; 2007.
141. Boule NG, Haddad E, Kenny GP, Wells GA, Sigal RJ. Effects of exercise on glycemic
control and body mass in type 2 diabetes mellitus: a meta-analysis of controlled clinical
trials. JAMA. 2001;286:1218-1227.
142. Harris MD. Psychosocial aspects of diabetes with an emphasis on depression. Curr
Diab Rep. 2003;3:49-55.
143. Boren S, Gunlock TL, Schaefer J, Albright A. Reducing risks in diabetes self-
management. Diabetes Educ.2007;33:1053-1077.
144. McAndrew L, Schneider SH, Burns E, Leventhal H. Does Patient Blood Glucose
Monitoring ImproveDiabetes Control? A Systematic Review of the Literature.
Diabetes Educ., 2007;33(6):991-1010.
145. National Heart Lung and Blood Institute. Questions and Answers Action to Control
Cardiovascular Risk in Diabetes (ACCORD) Study. March 15, 2010.
http://www.nhlbi.nih.gov/health/prof/heart/other/accord/q_a.htm
146. Diabetes Control and Complications Trial (DCCT) Research Group. The effect of
intensive treatment of diabetes on the development and progression of long-term
complications in insulin-dependent diabetes mellitus. N Engl J Med. 1993;329:977-
986.
147. Meece J. Dispelling myths and removing barriers about insulin in type 2 diabetes.
Diabetes Educ.2006;32:9S-18S.
148. Hill-Briggs F, Gemmell L. Problem solving in diabetes self-management and control:
a systematic reviewof the literature. Diabetes Educ. 2007;33:1032-1050.
149. Tomky D. Problem solving. A commentary. Diabetes Educ. 2007;33:1051-1052.
141
150. Furler J, Walker C, Blackberry I, et al. The emotional context of self-management in
chronic illness: aqualitative study of the role of health professional support in the self-
management of type 2 diabetes. BMCHealth Serv Res. 2008;8:214
151. Kent D, Haas L, Randal D, Lin E, Thorpe CT, Boren SA, an et al. Healthy coping:
issues and implications in diabetes education and care. Popul Health Manag. 2010
Oct;13(5):227-33.
152. Grey M, Boland EA, Davidson M, Li J, Tamborlane WV. Coping skills training for
youth with diabetes mellitus has long-lasting effects on metabolic control and quality
of life. J Pediatr. 2000;137:107-113.
153. Fisher EB, Thorpe CT, Devellis BM, Devellis RF. Healthy coping, negative emotions,
and diabetes management: a systematic review and appraisal. Diabetes Educ.
2007;33:1080-1103.
154. Karlsen B, Idsoe T, Dirdal I, Rokne HB, Bru E. Effects of a group-based counseling
programme on diabetes-related stress, coping, psychological well-being and metabolic
control in adults with type 1 or type 2 diabetes. Patient Educ Couns. 2004;53:299-308.
155. Surwit RS, van Tilburg MA, Zucker N, et al. Stress management improves long-term
glycemic control in type 2 diabetes. Diabetes Care. 2002;25:30-34.
156. Boren SA, Gunlock TL, Schaefer J, Albright A. Reducing risks in diabetes self-
management: a systematic review of the literature. Diabetes Educ. 2007;33:1053-1077.
157. Boren SA. AADE7TM Self-Care Behaviors: systematic reviews. Diabetes Educ.
2007;33:866, 871.
158. Saydah SH, Fradkin J, Cowie CC. Poor control of risk factors for vascular disease
among adults with previously diagnosed diabetes. JAMA. 2004;291:335-342.
142
159. Frie A, Chmiel C, Schlapfer H, Birnbaun B, Held U, Steurer J, et al. The Chronic CARe
for diAbeTes study (CARAT): a cluster randomized controlled trial. Cardiovasc
Diabetol. 2010; 9: 23.
160. Holman H. Chronic disease – the need for a new clinical education. JAMA. 2004;
292(9):1057–1059.
161. Anderson RM. Patient empowerment versus traditional model; a case of irreconcilable
differences? Diabetes care 1995;18(3):412-15.
162. Simon C. The consultation. InnovAiT 2009;2(2):113 – 121
163. Haes H. Dilemmas in patient centeredness and shared decision making: A case for
vulnerability. Patient Education and Counseling 62 (2006) 291–298
164. Bodeheimer T, Lorig K, Holman H, Grumbach K. Patient self- management of chronic
disease in primary care. JAMA 2000;288(19):2469-75.
165. Anderson RM and Funnell MM. compliance and adherence are dysfunctional concepts
in diabetic care. Diabetes Educ 2000;26:597-604
166. Saaddine JB, Cadwell B, Gregg EW, Engelgau MM, Vinicor F, Imperatore G, Narayan
KMV. Improvements in Diabetes Processes of Care and Intermediate Outcomes:
United States, 1988–2002. Ann Intern Med. 2006;144:465–474.
167. DiPiero A, Dorr DA, Kelso C, Bowen JL. Integrating Systematic Chronic Care for
Diabetes into an Academic General Internal Medicine Resident-Faculty Practice. J Gen
Intern Med. 2008 November; 23(11): 1749–1756.
168. Saadine JB, Engelgau MM, Beckles GL, Gregg EW, Thompson TJ, Venkat Narayan
KM. A diabetes report card for the United States: quality of care in the 1990’s. Ann
Intern Med. 2002;136(8):565-574.
143
169. Institute of Medicine Committee on Quality of Health Care in America. Crossing the
Quality Chasm: A New Health System for the 21st Century. Washington, DC: National
Academy Press; 2001.
170. Tsai AC, Morton SC, Mangione CM, Keeler EB. A Meta-analysis of interventions to
improve care for chronic illnesses. Am J Manag Care 2005; 11(8):478–488.
171. Simenerio L, Wagner EH, Gabbay R, Zgibor J. Implementing the Chronic Care
Model: A Statewide Focus on Improving Diabetes Care for Pennsylvania. Clinical
Diabetes 2009; 27(4): 153-159.
172. Simenero L, Scott RD, Gabbay RA, Gold K, McLaughlin S, Piatt GA. AADE Position
Statement: Implementing the chronic care model. Diabetes Educator 2008;34(3):451-
6
173. Norris SL, Engelgau MM, Narayan KMV: Effectiveness of self-management training
type 2 diabetes: a systematic review of randomized controlled trials. Diabetes Care
24:561–587, 2001
174. Glasgow RE, Funnell MM, Bonomi AE, Davis C, Beckham V, Wagner EH: Self-
management aspects of the improving chronic illness care breakthrough series:
implementation with diabetes and heart failure teams. Ann Behav Med 24:80–87, 2002
175. Missouri Foundation for Health. Improving diabetes self-management behaviors: a
piece of the puzzle. Better Self Management of Diabetes. Available
from:www.nmrhn.org/betterselfmanagement.asp. Accessed June 8 2012.
176. Pearson J, Mensing C, Anderson R. Medicare reimbursement and diabetes self-
management training: national survey results.Diabetes Educ. 2004;30:914-927.
177. Simenerio L, Zgibor J, Solano FX. Implementing the Chronic Care Model for
Improvements in Diabetes Practice and Outcomes in Primary Care: The University of
Pittsburgh Medical Centre experience. Clinical Diabetes 2004; 20(2):54-58.
144
178. Warsi A, Wang PS, LaValley MP, Avorn J, Solomon DH. Self-management education
programs in chronic disease: a systematic review and methodological critique of the
literature. Arch Intern Med.2004;164:1641-1649.
179. Norris SL, Lau J, Smith SJ, Schmid CH, Engelgau MM: Self-management education
for adults with type 2 diabetes: a meta-analysis of the effect on glycemic
control. Diabetes Care 25:1159 -1171, 2002
180. Piatt GA, Orchard TJ, Emerson S, Simmon D, Songer TJ, Brooks MM, et al.
Translating the Chronic Care Model into the community: results from a randomized
controlled trial of a multifaceted diabetes care interventionDiabetic Care 2006;
29(4):811-817.
181. Vallis MT, Higgins- Browser I, Edwards L, Murrayl, Scott L. The Role Of Diabetes
Education In Maintaining Lifestyle Changes. Canadian journal of diabetes.
2005;29(3):193-202.
182. Garrett DG, Bluml M. Patient Self-Management Program for Diabetes: First-Year
Clinical, Humanistic, and Economic Outcomes. J Am Pharm Assoc. 2005;45:130–137.
183. Brown SA, Garcia AA, Kouzekanani K, Hanis CL. Culturally competent diabetes self-
managementeducation for Mexican Americans: the Starr County border health
initiative. Diabetes Care. 2002;25:259-268.
184. Simenerio L, Piatt G, Zgibor JC. Implementing the Chronic Care Model for
Improvements in Diabetes Care and Education in a Rural Primary Care Practice.
Diabetes Educator 2005;31(2):225-234
185. Sperl-Hillen JM, Solberg LI, Hroscikoski MC, Crain AL, Engebretson KI, O'Connor
PJ. Do all components of the chronic care model contribute equally to quality
improvement? Jt Comm J Qual Saf. 2004 Jun;30(6):303-9.
145
186. World Health Organisation Chronic conditions: current systems of care. 2005.
Available at: http://www.who.int/mediacentre/factsheets/fs172/en/index.html.
accessed december 2012.
187. Adisa R, Alutundu MB, Fakeye TO. Factors contributing to non-adherence to oral
hypoglycemic medications among ambulatory type 2 diabetes patients in South-
western Nigeria. Pharmacy Practice (Internet) 2009;7(3):163-169
188. Schmittdiel J, Mosen DM, Glasgow RE, Hibbard J,Remmers C,Bellows J, Patient
Assessment of Chronic Illness Care (PACIC) and Improved Patient-centered
Outcomes for Chronic Conditions. J Gen Intern Med. January 2008; 23(1): 77–80.
189. Levesque JF, Feldman DE, Lemieux V, Tourigny A, Lavoie JP, Tousignant P.
Variations in Patients’ Assessment of Chronic Illness Care across Organisational
Models of Primary Health Care: A Multilevel Cohort Analysis. Healthcare Policy
2012;8(2):108-23.
190. McGlynn EA. An evidence-based national quality measurement and reporting system.
Med Care. 2003; 41:I8–15.
191. Glasgow RE, Emont S, Miller DC. Assessing delivery of the five ‘As’ for patient-
centered counselling. Health Promot Int. 2006; 21(3):245–55.
192. Roder W. Jos Plateau. In: Redmond WA, editor. Microsoft Corporation. 2007.
Microsoft® Student 2008
193. Nigeria master web. Nigeria 2006 Census Figures. [cited on November 10th 2012].
Available at http://www.nigeriamasterweb.com.
194. Statistical Records Department, Jos University Teaching Hospital. Annual Statistical
Report, 2010.
195. Jekel J. (2007) Epidemiology, Biostatistics and Preventive Medicine, Amsterdam
(3rdEd) Elsevier Health Sciences.
146
196. World Health Organization; Regional Office for the Western Pacific. Health Research
Methodology: A guide for training in research methods. 2nd ed. Manila: World Health
Organization; 2001.
APPENDIX A:
CONSENT FORM
INFLUENCE OF THE CHRONIC CARE MODEL ON SELF MANAGEMENT
BEHAVIOUR AND GLYCAEMIC CONTROL AMONG ADULT TYPE 2 DIABETICS
ATTENDING THE GENERAL OUT – PATIENT DEPARTMENT, JOS UNIVERSITY
TEACHNG HOSPITAL, JOS.
I am Dr Ega Olije Helen, a resident doctor in the department of Family Medicine of the Jos
University Teaching Hospital, Jos.
I am carrying out a study on the influence of the chronic care model on self –management
behaviour and glycaemic control among adults with Diabetes. This is to request for your
participation in the study.
Participation involves asking you some questions about your health condition and family. You
will also be seen at 4 weeks, 8 weeks and 12 weeks. In addition, you will be examined at each
visit and your blood glucose level assessed at each visit. Participation does not pose any risk to
you and is voluntary. Declining to participate does not affect your routine care in anyway.
You are free to withdraw from the study any time you wish. Confidentiality of any information
you give will be maintained.
147
I agree to participate in the study.
……………………………… ………………………………
Initials of consenting patient Initial of witness
……………………… ………………………………
Signature/Thumbprint Signature
………………. ………………………………
Investigator Signature
……………………
Date
APPENDIX B
THE STUDY QUESTIONNAIRE
ID NO…………. Consent Signed Yes ( ) No ( ) Date….. 2012
Subject Type Control….. Intervention……
Follow up date 4weeks ……..2012 8weeks ……..2012
12weeks .……2012
Demographic data
1. Initials: ……..
2. Age: ……… Years
3. Sex: Male ( ) Female ( )
4. Religion: Christianity ( ) Islam ( ) Traditional ( ) Others Specify (
)
5. Nationality: ……..……… State of origin ……………… Tribe……………
6. Contact Address: …………………………………………………………………...
………………………………..……………………………………………………….
7. Telephone Numbers ……………………………………………….
148
8. Educational Qualifications No formal ( ) Primary ( ) Secondary ( ) Tertiary (
) Skills training ( )
Medical History
1. Year of diagnosis
2. Fasting blood glucose ……………………………… (mmol/L)
3. What medications are you presently taking for your Diabetes?
Oral hypoglycaemic agents ( ) Insulin ( ) Both ( )
4. In the past 12months how many times have you been admitted? ………….
5. In the past 12 months, how frequently do you come for follow-up?
Every Month or less ( ) 8weeks ( ) 12weeks ( ) 6months ( )
6. Have you ever had any of the following in the past?
Hyperglycaemic crises ( ) Hypoglycaemic crises ( ) Stroke ( )
7. Do you have?
Hypertension ( ) Stroke ( ) Heart disease ( )
8. Are you taking medications for question 7 above? If yes name them
9. Do you consider the number of your medications plenty and find it difficult to comply?
Yes ( ) No ( )
10. Who pays for your drug treatment?
Yourself ( ) others ………………..
11. Do you know what your blood glucose target should be? Yes ( ) No ( )
12. Do you examine your feet regularly for corns, calluses or sores? Yes ( ) No ( )
Family and Social History
1. Occupation ( )
2. Marital status
Single ( ) Married ( ) Divorced ( ) separated ( ) widowed ( )
3. Number of siblings/children ( )
4. Family history of Diabetes Yes ( ) No ( )
5. Number of relations dead from complications of Diabetes ( )
6. Average family income per month in naira
<20,000 ( ) 20,000-40,000 ( ) 40,000-60,000 ( ) >60,000 ( )
7. Do you drink alcohol? Yes ( ) No ( )
If yes, how much quantity / week ……… (Indicate the number of standard drinks)
8. Do you smoke cigarette Yes ( ) No ( )
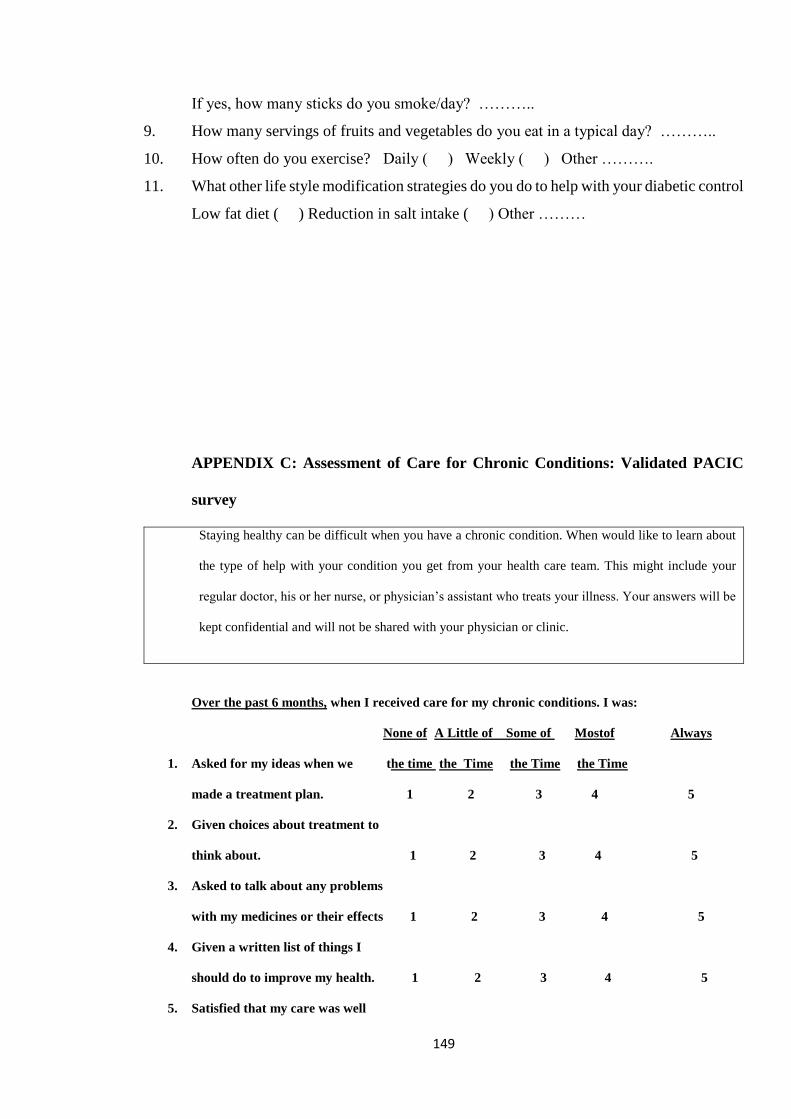
149
If yes, how many sticks do you smoke/day? ………..
9. How many servings of fruits and vegetables do you eat in a typical day? ………..
10. How often do you exercise? Daily ( ) Weekly ( ) Other ……….
11. What other life style modification strategies do you do to help with your diabetic control
Low fat diet ( ) Reduction in salt intake ( ) Other ………
APPENDIX C: Assessment of Care for Chronic Conditions: Validated PACIC
survey
Staying healthy can be difficult when you have a chronic condition. When would like to learn about
the type of help with your condition you get from your health care team. This might include your
regular doctor, his or her nurse, or physician’s assistant who treats your illness. Your answers will be
kept confidential and will not be shared with your physician or clinic.
Over the past 6 months, when I received care for my chronic conditions. I was:
None of A Little of Some of Mostof Always
1. Asked for my ideas when we the time the Time the Time the Time
made a treatment plan. 1 2 3 4 5
2. Given choices about treatment to
think about. 1 2 3 4 5
3. Asked to talk about any problems
with my medicines or their effects 1 2 3 4 5
4. Given a written list of things I
should do to improve my health. 1 2 3 4 5
5. Satisfied that my care was well
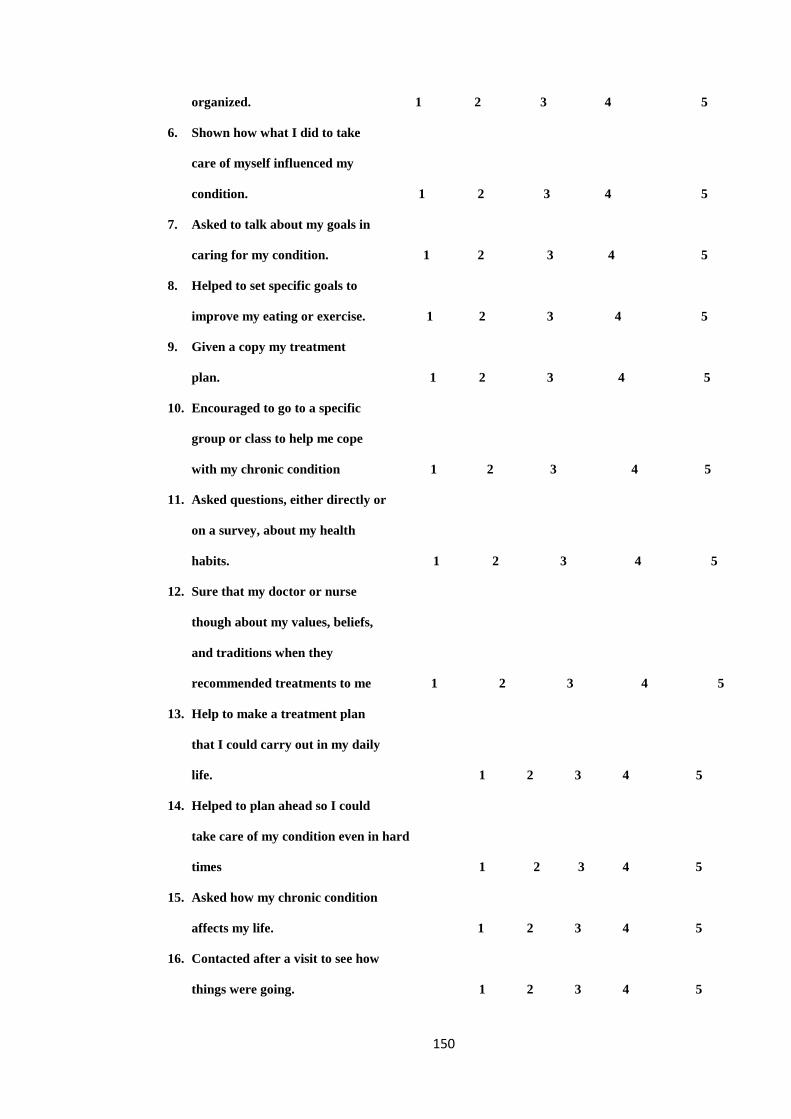
150
organized. 1 2 3 4 5
6. Shown how what I did to take
care of myself influenced my
condition. 1 2 3 4 5
7. Asked to talk about my goals in
caring for my condition. 1 2 3 4 5
8. Helped to set specific goals to
improve my eating or exercise. 1 2 3 4 5
9. Given a copy my treatment
plan. 1 2 3 4 5
10. Encouraged to go to a specific
group or class to help me cope
with my chronic condition 1 2 3 4 5
11. Asked questions, either directly or
on a survey, about my health
habits. 1 2 3 4 5
12. Sure that my doctor or nurse
though about my values, beliefs,
and traditions when they
recommended treatments to me 1 2 3 4 5
13. Help to make a treatment plan
that I could carry out in my daily
life. 1 2 3 4 5
14. Helped to plan ahead so I could
take care of my condition even in hard
times 1 2 3 4 5
15. Asked how my chronic condition
affects my life. 1 2 3 4 5
16. Contacted after a visit to see how
things were going. 1 2 3 4 5
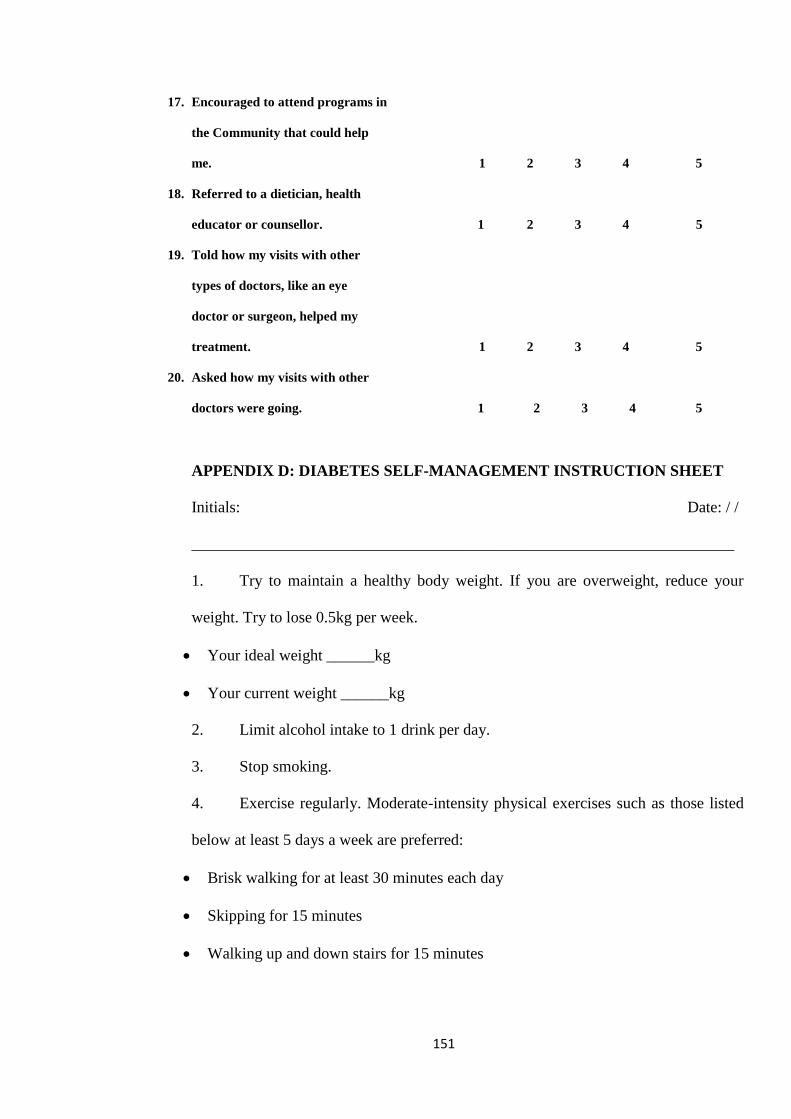
151
17. Encouraged to attend programs in
the Community that could help
me. 1 2 3 4 5
18. Referred to a dietician, health
educator or counsellor. 1 2 3 4 5
19. Told how my visits with other
types of doctors, like an eye
doctor or surgeon, helped my
treatment. 1 2 3 4 5
20. Asked how my visits with other
doctors were going. 1 2 3 4 5
APPENDIX D: DIABETES SELF-MANAGEMENT INSTRUCTION SHEET
Initials: Date: / /
____________________________________________________________________
1. Try to maintain a healthy body weight. If you are overweight, reduce your
weight. Try to lose 0.5kg per week.
Your ideal weight ______kg
Your current weight ______kg
2. Limit alcohol intake to 1 drink per day.
3. Stop smoking.
4. Exercise regularly. Moderate-intensity physical exercises such as those listed
below at least 5 days a week are preferred:
Brisk walking for at least 30 minutes each day
Skipping for 15 minutes
Walking up and down stairs for 15 minutes
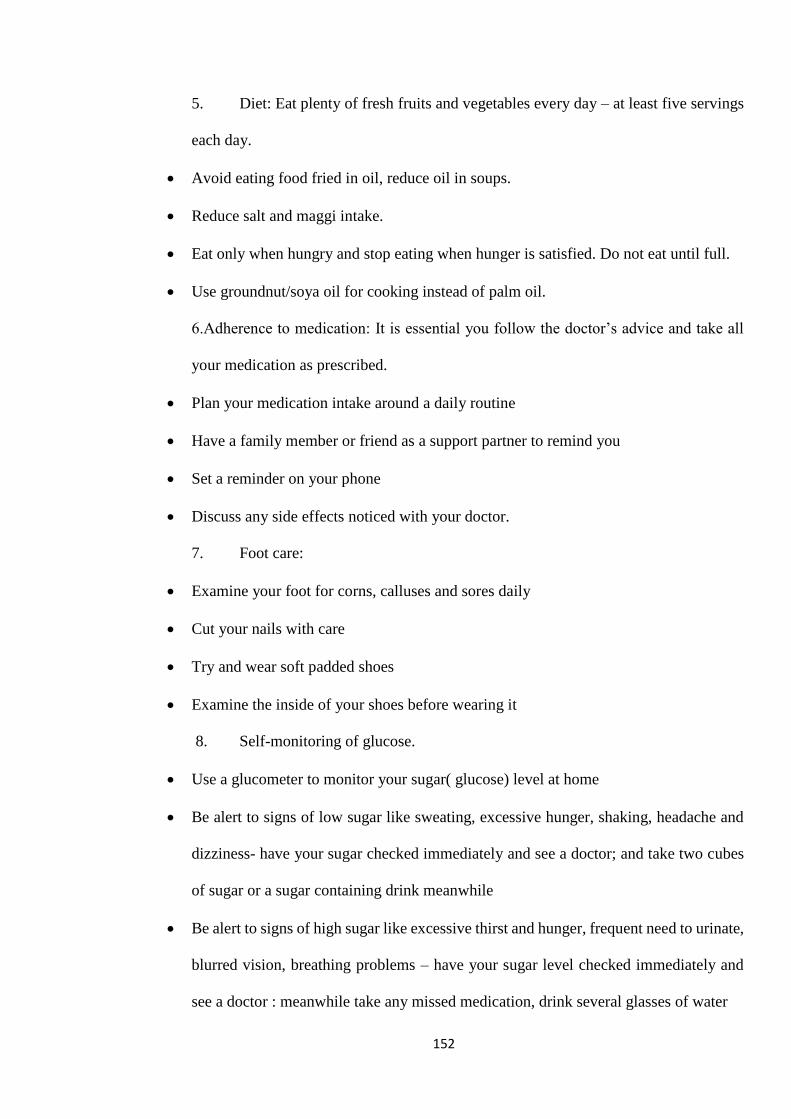
152
5. Diet: Eat plenty of fresh fruits and vegetables every day – at least five servings
each day.
Avoid eating food fried in oil, reduce oil in soups.
Reduce salt and maggi intake.
Eat only when hungry and stop eating when hunger is satisfied. Do not eat until full.
Use groundnut/soya oil for cooking instead of palm oil.
6.Adherence to medication: It is essential you follow the doctor’s advice and take all
your medication as prescribed.
Plan your medication intake around a daily routine
Have a family member or friend as a support partner to remind you
Set a reminder on your phone
Discuss any side effects noticed with your doctor.
7. Foot care:
Examine your foot for corns, calluses and sores daily
Cut your nails with care
Try and wear soft padded shoes
Examine the inside of your shoes before wearing it
8. Self-monitoring of glucose.
Use a glucometer to monitor your sugar( glucose) level at home
Be alert to signs of low sugar like sweating, excessive hunger, shaking, headache and
dizziness- have your sugar checked immediately and see a doctor; and take two cubes
of sugar or a sugar containing drink meanwhile
Be alert to signs of high sugar like excessive thirst and hunger, frequent need to urinate,
blurred vision, breathing problems – have your sugar level checked immediately and
see a doctor : meanwhile take any missed medication, drink several glasses of water
153
9. Referral to dietician: helps you to device a healthy diet plan from locally
available food.
10. Eye examination: it is important that your eyes are examined by an
Ophthalmologist annually; you can remind your doctor if it hasn’t been done.
11. Ensure you keep your appointments with the other doctors and health
professionals taking care of you.
12. Community participation: joining the local association of diabetics would help
you get support in the community.
13. Self -management goal:
It is important to have a goal in terms of what you want to achieve in terms of weight
loss, exercise and diet plans
Review it regularly (e.g. weekly) to see if you are on track
Discuss any perceived obstacles with your doctor
_____________________________________________________________________
Your next appointment is: Date: / / / 4 weeks
Date: / / / 8 weeks
Date: / / / 12 weeks

154
HAUSA TRANSLATION
TAKARDAN SHARUDAN KULA DA CIWO MAI DOGON JINYA
1. Ayi kokari akula da nauyin jiki. Idan nauyin jiki yayi yawa, a yi kokari arage rabin kilo
daya na nauyin jiki kowani sati.
- Nauyin jiki da ya dace ……. Kg
- Nauyin jiki ta yanzu ………. Kg
2. A rage shan giya zuwa sau daya a rana.
3. A dena shan taba.
4. A dinga motsa jiki akai akai. Motsa jiki dai de irin wadan aka lisafa a kasa so biyar a
sati. A ta ka ice aka fison mutum yayi:
- Takawan shan iska ta minti talatin kowace rana
- Tsale tsale ta minti goma sha biyar
- Hawa da sauka daga gidan sama ta minti goma sha biyar
5. Abinci mai gina jiki: a rika cin yayan itatuwa da ganye kowace rana sosai, kamar sau
biyar a rana
- A guje cin soyayyen abinci, arage yawan maiko a miya

155
- A rage cin gishiri da maggi
- A cin abinci da muddin yunwa ya shiga, a kuma tsaya muddin an koshi. Kar a ci
har ciki ya cika so sai
- A yi amfani da man gyada ko man waken soya wajen dahuwa a maimakon man ja
6. Shan magani a daidaice: ka bi ka’idodin likitan ka ta wajen shan magani
- Shan magani ya bi abubuwan da ka saba yi kowace rana
- Ka samu wani a cikin yanuwan ka ko abokanen ka ya zama mai tuna maka da shan
magani
- Ka yi amfani da wayar ka ta wurin tunawa da shan magani
- Ka tattauna da likitanka game da duk illan da ka samu da magani
7. Lura da kafa:
- Duba kafafuwan ka kowace rana domin neman kumburin yatsu ko wani ciwo na
musamman
- A kiyaye wajen yankan farce
- A yi kokari a sa takalma masu laushi
- A duba cikin takalma kafun a sanya
8. Kaluwa da sugar na jini da kan ka:
- A yi amfani da na’uran sanin adadin sugar gida
- Hankaltuwa da alamun karancin sugar Kaman gumi ko zufa , yawan jin yunwa,
girgizan jiki, ciwon kai da jiri. A duba sugar ka nan da nan sai ka tafi wajen likitan
ka. Kafun nan, ka sha kwayoyin sugar guda biyu ko wani ruwan sugar kamar lemun
kwalba
- Ka kula da alamun yawan sugar a cikin jini kaman yawan kishin ruwa, yunwa,
yawan fisari, rashin gani da kyau da kuma damuwa da numfashin ka
- Ka sha ruwa mai yawa

156
- In baka sha maganin ka ba, ka yi kokari ka sha
9. Zuwa ganin ma’aikatan abinci masu gina jiki: zai taimaka wajen hade haden abinci
masu gina jikin dabam dabam da aka fi samu cikin angwa
10. Gwajin idanuwa: yana da muhimmanci likitan ido ya duba idanuwan ka ko wane
shekara. Za ka iya tuna ma likitan ka idan ba”a riga anyi maka gwaji ba
11. Ka yi kokari ka aje alkawarin ka da sauran likitoci da ma’aikatan kiwon lafiya masu
lura da kai
12. Shiga cikin al umma tare da hadin kan kungiya ma su ciwon sugar zai taimaka wurin
samun taimakon al umma
13. Tsara kulawa da kai: yana da muhimmanci a tsara bukata yin nasara wurin rage nauyin
jiki, motsa jiki da tsarin abinci
- A dunga kulawa akai akai misali kowane sati don ka gane ko kana kan hanya
- Ka tattaauna da likitan ka game da duk wani abun da zai hana ka samun bukaturi
ka
Ranar da wo wa: Date: / / / Sati hudu
Date: / / / Sati takwai
Date: / / / Sati goma sha biu

157
APPENDIX E: SELF MANAGEMENT BEHAVIOUR RECORDS
Did you keep to the instruction
sheet?
Yes[ ] No [ ]
Initial 4 weeks 8 weeks 12 weeks
Are you trying to lose weight? Yes [ ] No [
]
Yes [ ] No [
]
Yes [ ] No[
]
Yes [ ]No [
]
Have you reduced your total food
intake?
Yes [ ] No [
]
Yes [ ] No [
]
Yes [ ]No [
]
Yes[ ] No [
]
Do you take fresh fruits and
vegetables each day?
Yes [ ] No [
]
Yes [ ] No [
]
Yes [ ]No [
]
Yes [ ]No [
]
Have you reduced intake of fried
foods?
Yes [ ] No [
]
Yes [ ] No [
]
Yes [ ]No [
]
Yes [ ]No [
]
Have you changed to groundnut oil
for cooking?
Yes [ ] No [
]
Yes [ ] No [
]
Yes [ ]No [
]
Yes [ ]No [
]
Have you reduced the oil in your
food?
Yes [ ] No [
]
Yes [ ] No [
]
Yes [ ]No [
]
Yes [ ]No [
]
Have you reduced salt and maggi
intake?
Yes [ ] No [
]
Yes [ ] No [
]
Yes [ ]No [
]
Yes [ ]No [
]
Do you examine your feet daily? Yes [ ] No [
]
Yes [ ] No [
]
Yes [ ]No [
]
Yes [ ]No [
]
Have you seen the dietician as
referred?
Yes [ ] No [
]
Yes [ ] No [
]
Yes [ ]No [
]
Yes [ ]No [
]

158
Have you seen the Ophthalmologist
as referred
Yes [ ] No [
]
Yes [ ] No [ ] Yes [ ]No [
]
Yes [ ]No [
]
Have you joined the local diabetic
association?
Yes [ ] No [
]
Yes [ ] No [
]
Yes [ ]No [
]
Yes [ ]No [
]
Do you have a self- management
goal?
Yes [ ] No [
]
Yes [ ] No [
]
Yes [ ]No [
]
Yes [ ]No [
]
EXERCISE RECORD
Initial 4 weeks 8 weeks 12 weeks
Brisk walking
Skipping
Jogging
Cycling
Bicycling
Tennis
Football
Other
How many days
did you exercise?
How many
minutes/ day?
What were the major obstacles in keeping to the instruction sheet?
159
1 .……………………………………………………………………………………………
2 ………………………………………………………………………………………………
ADHERENCE TO MEDICATION
Did you take the prescribed medications? Yes ( ) No ( )
How many days did you miss your medication? 0 ( ) 1 ( ) 2 ( ) ≥3 ( )
Reasons for missed medication
……………………………………………………………………………………………
Appendix F: Ethical Clearance
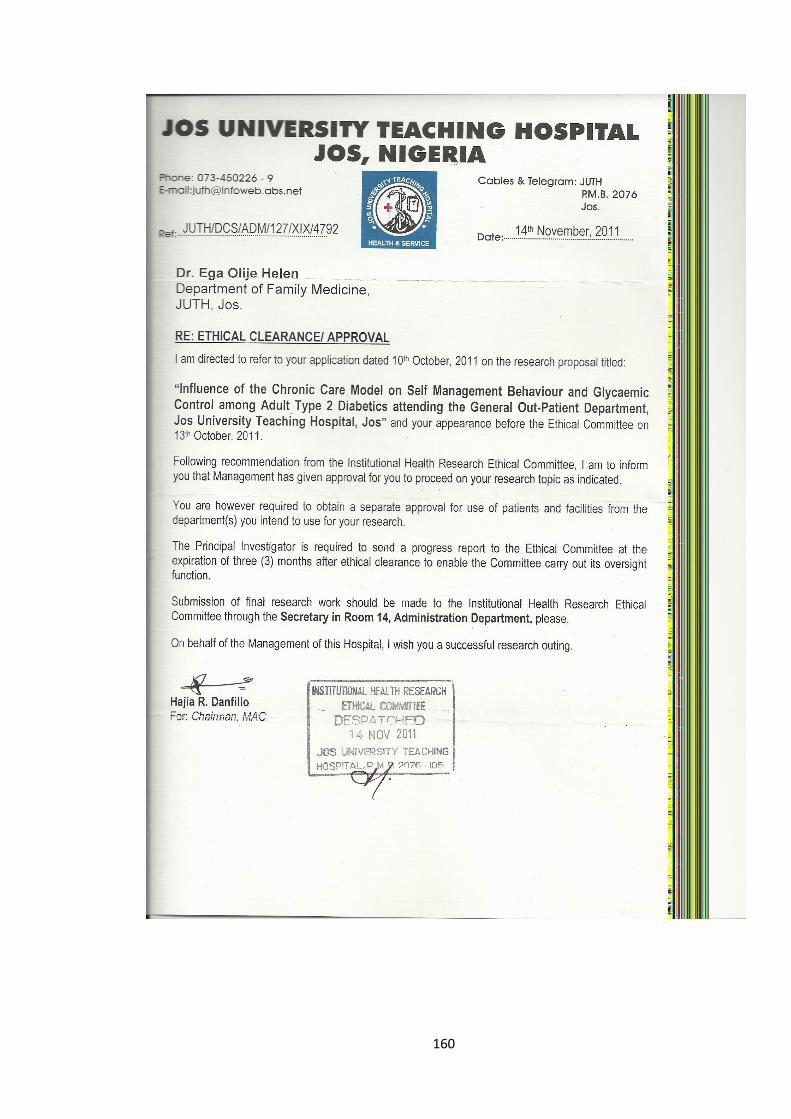
160