Embed Size (px)
Citation preview

THE EFFECT OF INVESTING AND FINANCING DECISIONS ON
FINANCIAL PERFORMANCE OF THE SUGAR FACTORIES IN
KENYA
BY
MUMIA KOROTI
D61/60465/2013
A RESEARCH PROJECT SUBMITTED IN PARTIAL FULFILLMENT OF THE
REQUIREMENTS FOR THE DEGREE OF MASTER OF BUSINESS
ADMINISTRATION, SCHOOL OF BUSINESS, UNIVERSITY OF NAIROBI
OCTOBER, 2014

ii
DECLARATION
I, the undersigned, hereby declare that this is my original work and has not
been presented to any institution or University of Nairobi for academic credit.
I further declare that I followed all applicable ethical guidelines in conducting
the research.
Sign……………………………… Date………………………………
MUMIA KOROTI
D61/60465/2013
This research project has been submitted for examination with my approval
as the University supervisor
Signature ….…………………… Date…………………………………
HERICK ONDIGO
Lecturer,
Department of Finance and Accounting,
School of Business,
University of Nairobi

iii
ACKNOWLEDGEMENTS
God has been faithfully, gracious and his mercies endures forever, it is for his will that I
have been able to complete these project. The Lord be praised and I thank him so much.
I am deeply obliged to my supervisor Mr. Herick Ondigo for his exemplary guidance and
support without whose help; this project would not have been a success.
Mr.Mirie Mwangi who taught me Finance Seminar, offered a lot of knowledge, which I
have applied in these research project, I wish to appreciate his contribution and thank him
so much.
A very special appreciation to my parents, the late Wilson Koroti and my mother
Robai Khayencheli who sacrificed a lot for my upbringing and education.You made me,
to be whom I am and you inspire me to work hard for my family.
iv
DEDICATION
I wish to dedicate this research to my dear wife Christine Khakasa Wekesa for all the moral
support and encouragement accorded by her to me during these period of my study.I cannot
forget my adoring children, Esther Khayencheli, Jeremy Mordecai and Wilrfred Patisi,
you are the main reason for me burning mid night oil to ensure successfully completion of
these research project.

v
TABLE OF CONTENTS
DECLARATION .............................................................................................................. ii
ACKNOWLEDGEMENTS ............................................................................................ iii
DEDICATION ................................................................................................................. iv
LIST OF TABLES .......................................................................................................... vii
ABSTRACT .................................................................................................................... viii
LIST OF ABBREVIATIONS ......................................................................................... ix
CHAPTER ONE: INTRODUCTION ............................................................................. 1
1.1 Background of the Study ........................................................................................ 1
1.1.1 Investing Decisions ............................................................................................ 3
1.1.2 Financing Decisions ........................................................................................... 4
1.1.3 Financial Performance ........................................................................................ 6
1.1.4 The Effect of Investing and Financing Decisions on Financial Performance ... 7
1.1.5 The Sugar Factories in Kenya ............................................................................ 9
1.2 Research Problem ................................................................................................. 11
1.3 Research Objective ............................................................................................... 13
1.4 Value of the Study ................................................................................................ 13
CHAPTER TWO: LITERATURE REVIEW .............................................................. 15
2.1 Introduction ........................................................................................................... 15
2.2 Theoretical Review ............................................................................................... 15
2.2.1 Portfolio Theory ............................................................................................... 15
2.2.2 Capital Asset Pricing Model ............................................................................. 17
2.2.3 Arbitrage Pricing Theory .................................................................................. 18
2.3 Determinants of Financial Performance of Sugar Factories ................................. 19
2.4 Empirical Review.................................................................................................. 21
2.4.1 International Evidence ...................................................................................... 21
2.4.2 Local Evidence ................................................................................................. 23
2.5 Summary of Literature Review ............................................................................. 25
CHAPTER THREE: RESEARCH METHODOLOGY ............................................. 26
3.1 Introduction ........................................................................................................... 26
3.2 Research Design.................................................................................................... 26
3.3 Target Population .................................................................................................. 27

vi
3.4 Sample................................................................................................................... 27
3.5 Data Collection ..................................................................................................... 27
3.6 Data Analysis ........................................................................................................ 28
3.6.1 Analytical Model .............................................................................................. 28
3.6.2 Test of Significance .......................................................................................... 30
CHAPTER FOUR: DATA ANALYSIS, RESULTS AND DISCUSSION ................ 31
4.1 Introduction ........................................................................................................... 31
4.2 Findings................................................................................................................. 31
4.3 Interpretations of Findings .................................................................................... 35
CHAPTER FIVE: SUMMARY, CONCLUSION AND RECOMMENDATIONS .. 37
5.1 Introduction ........................................................................................................... 37
5.2 Summary ............................................................................................................... 37
5.3 Conclusion ............................................................................................................ 38
5.4 Recommendations for Policy ................................................................................ 38
5.5 Limitation of the Study ......................................................................................... 39
5.6 Suggestions for Further Research ......................................................................... 40
REFERENCES ................................................................................................................ 42
APPENDICES ................................................................................................................. 46
Appendix 1: Sugar Factories in Kenya ............................................................................. 46
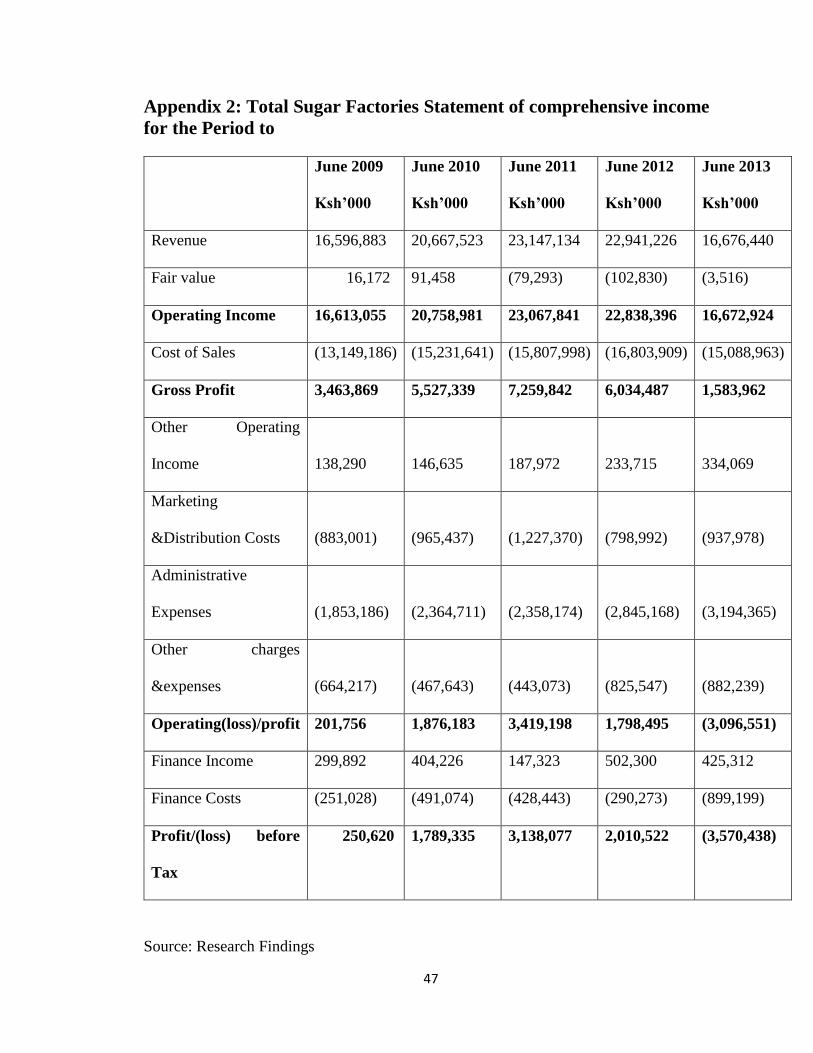
Appendix 2: Total Sugar Factories Statement of comprehensive income for the Period to
........................................................................................................................................... 47
Appendix 3: Consolidated Statement of Financial Position as at ..................................... 48

vii
LIST OF TABLES
Table 4.1: Summary Data on Key Financial Values......................................................... 32
Table 4.2: Summary Statistics .......................................................................................... 33
Table 4.3: Analysis of Variance........................................................................................ 34
viii
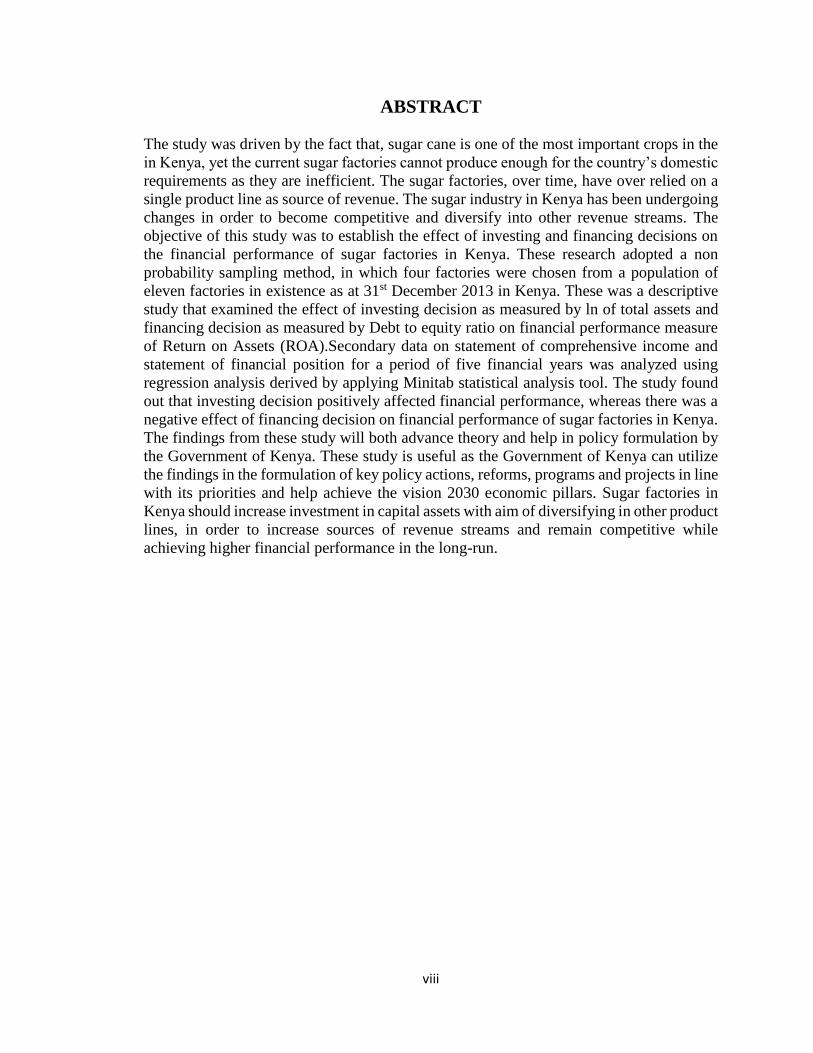
ABSTRACT
The study was driven by the fact that, sugar cane is one of the most important crops in the
in Kenya, yet the current sugar factories cannot produce enough for the country’s domestic
requirements as they are inefficient. The sugar factories, over time, have over relied on a
single product line as source of revenue. The sugar industry in Kenya has been undergoing
changes in order to become competitive and diversify into other revenue streams. The
objective of this study was to establish the effect of investing and financing decisions on
the financial performance of sugar factories in Kenya. These research adopted a non
probability sampling method, in which four factories were chosen from a population of
eleven factories in existence as at 31st December 2013 in Kenya. These was a descriptive
study that examined the effect of investing decision as measured by ln of total assets and
financing decision as measured by Debt to equity ratio on financial performance measure
of Return on Assets (ROA).Secondary data on statement of comprehensive income and
statement of financial position for a period of five financial years was analyzed using
regression analysis derived by applying Minitab statistical analysis tool. The study found
out that investing decision positively affected financial performance, whereas there was a
negative effect of financing decision on financial performance of sugar factories in Kenya.
The findings from these study will both advance theory and help in policy formulation by
the Government of Kenya. These study is useful as the Government of Kenya can utilize
the findings in the formulation of key policy actions, reforms, programs and projects in line
with its priorities and help achieve the vision 2030 economic pillars. Sugar factories in
Kenya should increase investment in capital assets with aim of diversifying in other product
lines, in order to increase sources of revenue streams and remain competitive while
achieving higher financial performance in the long-run.

ix
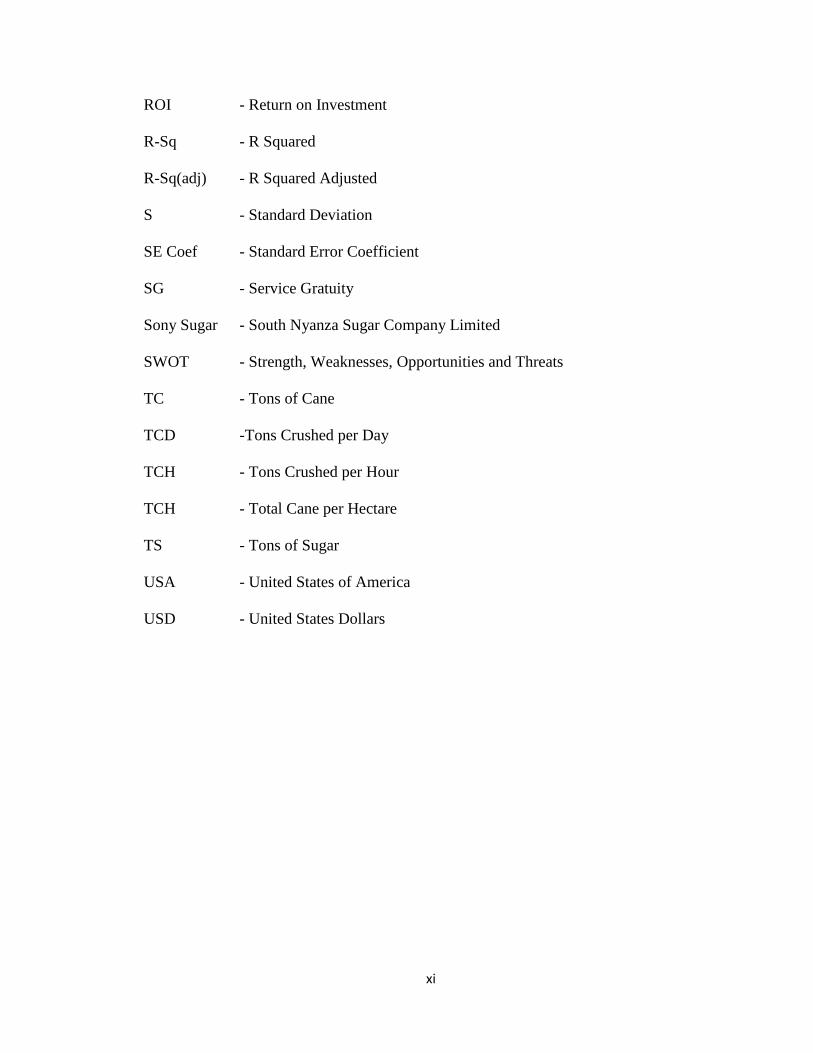
LIST OF ABBREVIATIONS
APT - Arbitrage Pricing Model
CAP - Common Agriculture Policy
CAPEX -Capital Expenditure
CAPM - Capital Asset Pricing Model
Co. - Company
Coef - Coefficient
COMESA - Common Market of Eastern and Southern Africa
DG - Deferred Grant
DI - Development Index
DIT - Deferred Income Taxation
EAC - East African Community
EBIT - Earnings Before Interest and Tax
EPS - Earnings Per Share
GDP - Gross Domestic Product
GoK - Government of Kenya
GSP - Grand Sugar Plan
EU - European Union
FTA - Free Trade Area
IAS 1 - International Accounting Standard no.1
ISO - International Sugar Organization
KECATRA - Kenya Cane Transporters Association
KESGA - Kenya Sugarcane Growers Association

x
KESMA - Kenya Sugar Millers Association
KESREF - Kenya Sugar Research Foundation
KETS - Kenana Engineering and Technical Services
KM - Kilometers
KSB - Kenya Sugar Board
KSI - Kenya Sugar Industry
LT - Long-Term
MoALFD - Ministry of Agriculture, Livestock and Fisheries development
MSC - Mumias Sugar Company Limited
MT - Metric tons
NCA - Non Current Assets
NCL - Non Current Liabilities
NCR - Non Current Receivables
No. - Number
NPM -Net Profit Margin
NSE - Nairobi Stock Exchange
NSMP - National Sugar Master Plan
NPV - Net Present Value
OG - Out Growers
PESTEL - Political, Economic, Social, Technological, Environmental and Legal
PPE - Plant, Property and Equipment
ROA - Return on Assets
ROE - Return on Equity
xi
ROI - Return on Investment
R-Sq - R Squared
R-Sq(adj) - R Squared Adjusted
S - Standard Deviation
SE Coef - Standard Error Coefficient
SG - Service Gratuity
Sony Sugar - South Nyanza Sugar Company Limited
SWOT - Strength, Weaknesses, Opportunities and Threats
TC - Tons of Cane
TCD -Tons Crushed per Day
TCH - Tons Crushed per Hour
TCH - Total Cane per Hectare
TS - Tons of Sugar
USA - United States of America
USD - United States Dollars

1
CHAPTER ONE
INTRODUCTION
1.1 Background of the Study
Sugar as a commodity can be economically derived from two products: Sugar cane and
Sugar beet. Sugar cane is cultivated in the tropical countries while beet is a temperate
product. Seventy per cent of world sugar is produced from cane. The biggest world
producers in year 2003 were, Brazil (20.3 million metric tons), India (19.9 million metric
tons) and the European Union (15.5 million metric tons).Sugar as an ingredient can also be
found in various fruits, milk and maize stem. The key element of sugar is Sucrose and the
aim of sugar cultivation is to derive sucrose. There are various products and by-products
that can be derived from sugar cane, these are; Sugar crystals (i.e. white mill or industrial
sugar), Sugar syrup, Molasses, Bagasse and Filter scums. This various byproducts are key
ingredient in; Beverage, Confectionary, Pharmaceutical, Animal feed, Chemical, Fertilizer,
Wines, Spirit and Power alcohol industries. Bagasse can be used in Electricity generation
(co-generation), sugar crop is environmentally friendly and biodegradable (Odek, Kegode,
and Ochola, 2003).
Sugar firms worldwide have invested in diversification strategies by using sugarcane as
raw material in other various projects alongside sugar production (Deepchand, 2001). The
global sugar market has registered a 4th consecutive surplus in the year 2013/2014 leading
to depressed prices. The reducing prices have had the effect of inducing a slow down on
2
production. Consumption is, however, growing and may surpass production by the year
2015.Consumption of sugar in Africa is 12 million metric tons per annum exceeding
production by 2 million metric tons and still growing at 4% per year, but the continent is
a net importer of sugar (Orive, 2014).
According to the market assessment per KSB (2009) strategic plan, the need for sugar will
continue to grow outstripping supply by 300,000 MT.Kenya’s annual imports of sugar
from COMESA, EAC regions and other producing countries will continue to close the gap.
Currently the sugar industry in Kenya is protected by COMESA FTA safeguards measures.
The safeguards were first granted in 2004 and were to expire in 2008.Despite the
remarkable progress made during the safeguard period, the industry was not ready for an
open trade regime in sugar. Kenya sort and was granted an additional four years of
protection to February 2012,the country was further allowed two more years and now final
one year which elapse in February 2015.After lapse of COMESA safeguards, Kenyan
sugar market will be open to free access of sugar from other least cost producing countries.
Previous studies show that diversification strategies into other sugar products is necessary
if current millers are to remain competitive. The study reviewed the diversification
strategies put in place by sugar factories in Kenya and which entailed huge investment
requirements that could not be financed from their internal sources.
3
1.1.1 Investing Decisions
Vinci(2010)observes that, the term ‘Investing’ could be associated with different activities,
but the common target in this activities is to ‘employ’ the money (funds) during the time
period seeking to enhance investor’s wealth. Funds to be invested come from, assets
already owned, borrowed money or savings. Investment is broadly classified into real and
financial investments. Real investment generally involve some kind of tangible asset, such
as land, machinery factories among others. Whereas, financial investments involve
contracts in paper or electronic form, such as stocks, bonds, debts among others. Sears and
Trennepohl (1993), observed that, when one decides not to spend all current income, then
the person that person is faced with an investment decision.
According to Zvi, Alex and Allan (2004), investment can also be defined as the current
commitment of money or other resources in the expectation of reaping future benefits. The
expectation for instance, of an investor in stock will be anticipation of future proceeds from
the shares and which will justify both the time that the money is tied up as well as the risk
of the investment. Financial assets, can be either bonds or stocks, they are paper securities
and do not contribute directly to the productive capacity of an entity. The financial assets
instead are the means by which entities in well developed economies hold their claims on
real assets, they are claims to the income generated by real assets. The wealth of an entity
is determined by its production capacity, that is the goods and services it can create. The
capacity is a function of the real assets such as land, buildings, machines and knowledge
that can be used to produce goods and services.
4
According to GWM (2013), risk can be measured and managed within an investment
portfolio and it is part of investing. The meaning of risk can vary. For some, risk is the
possibility of losing a portion of their investment due to market movements or a poor
decision. For others, risk may mean, not enough income is produced from investment.
Another measure of risk is the variability of returns over time and known as volatility.
Generally risk can be viewed as chance of failure in achieving objectives or goals. Risk
and return are closely related. In general, the higher the degree of risk associated with an
investment, the higher the return required by investors to accept this risk. Low risk
investments such as cash offer relatively low returns as a reflection of their greater security.
This is called the risk return trade-off that investors always considers depending on their
appetite for risk. All investments and asset classes have different levels of risks and
expected returns. Data on capital investment and profitability were used to measure ROA
as one of the performance indicators of a firm. Expected rate of return and risk of an
investment were some of the key measures of an investment decisions.
1.1.2 Financing Decisions
Households, firms, financial intermediaries, and government all play a role in the financial
system of every developed economy. Financial intermediaries are institutions such as
banks that collect savings of individuals and corporations and funnel them to firms that use
money to finance their investments in plant, equipment, research and development. Firms
can raise investment capital from many variety of financial instruments. The firm’s
financial policy describes the mix of financial instruments to finance the firm, this could

5
take the form of; internal capital, external capital: debt vs. equity (Grinblatt and Titman,
2002).
Formal research on the financing patterns started when Miller and Modigliani (1958)
presented the capital structure irrelevance theory.M&M proof that the value of the firm is
independent from its capital structure. They proof their hypothesis based on different
assumptions. These assumptions are not applicable in the real world, even though, their
work is considered best but it cannot be applicable in the practical life.M&M further
published the correction for their previous work as “A correction” in (1963).In that study,
they described that the value of the firm is independent from its capital structure but the
interest expense on the debt create the difference. They further explained that point by
sayings that as the interest expense are tax deductible due to income tax law prevailing in
different countries so firms working in these countries decrease the tax liability and
increase the after tax cash flows. On the other hand, dividend payments are not tax
deductible; firms have to pay tax on all their incomes and this makes equity a costly source
of financing.
McLaney(2009) pointed out that, businesses operate by raising finance from various
sources, which is then invested in assets usually ‘real ‘assets such as plant and machinery.
Some businesses also invest in ‘financial’ assets, like the shares of another business or
loans to businesses and individuals. Investment involves outflows (payments), usually
there is some time between cash out flows and inflows. Glance at a business balance sheet
would give some idea of the scale of investment and idea of the nature of investment.

6
Selecting which investment opportunities to pursue and which to avoid is a vital matter to
business because: individual projects frequently involve large and irreversible commitment
of finance and they involve this commitment often over long periods of time. Financing
decisions are measured by the level borrowing (debt to equity ratio), capital structure,
operating leverage and financial leverage.
1.1.3 Financial Performance
According to Barringer and Ireland (2006), financial performance is a function of both the
choice of a business model and how effectively a firm uses its model. Having a clearly
articulated business model is important because: it serves as an ongoing feasibility analysis,
focusses attention on how well all the elements of a business fit together and constitute a
working whole, describes why the network of participants needed to make a business idea
viable works together and articulates a company’s core logic to stakeholders.
According to IASB (2012) amendment, IAS 1, is the accounting standard guiding the
reporting structure on measurement of financial performance of an entity and presentation
of financial statements. These standard sets out the overall requirements for financial
statements, including how they should be structured, the minimum requirements. The
standard requires a complete set of financial statements to comprise of a statement of
financial position, a statement of profit or loss and other comprehensive income, a
statement of changes in equity and a statement of cash flows(including comparative
information) at least annually. The objective is to provide information that is useful to a
wide range of users in making economic decisions.
7
1.1.4 The Effect of Investing and Financing Decisions on Financial
Performance
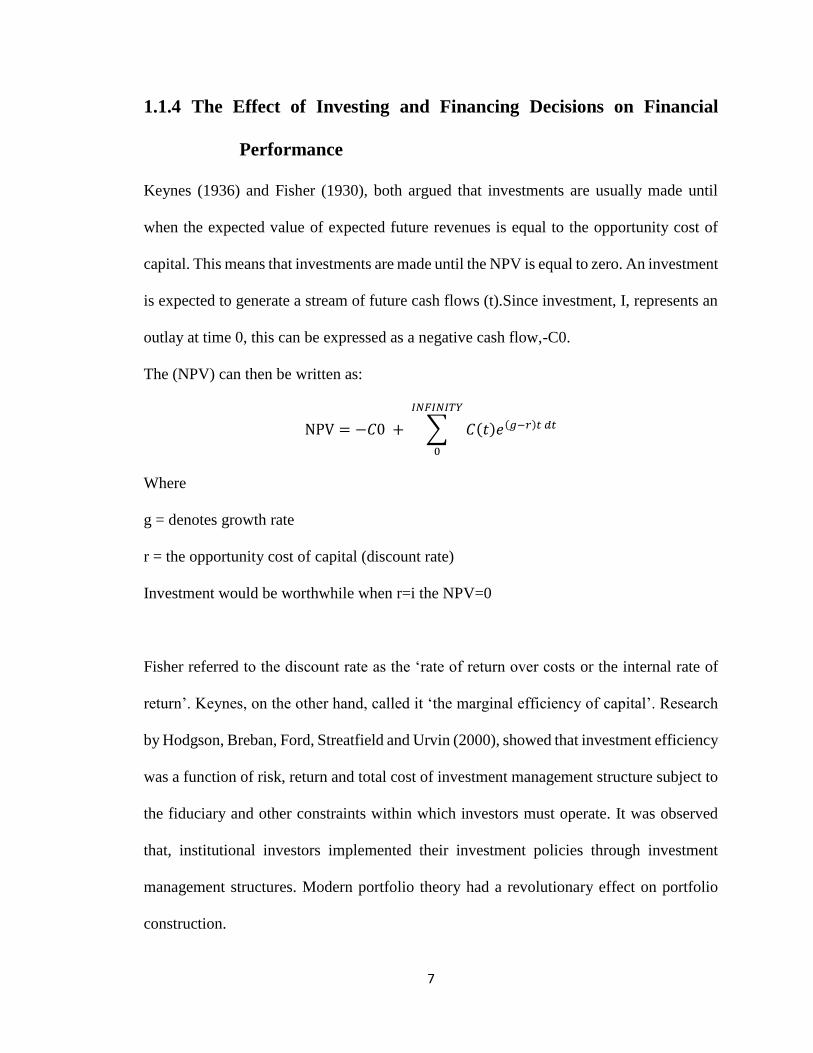
Keynes (1936) and Fisher (1930), both argued that investments are usually made until
when the expected value of expected future revenues is equal to the opportunity cost of
capital. This means that investments are made until the NPV is equal to zero. An investment
is expected to generate a stream of future cash flows (t).Since investment, I, represents an
outlay at time 0, this can be expressed as a negative cash flow,-C0.
The (NPV) can then be written as:
NPV = −𝐶0 + ∑ 𝐶(𝑡)𝑒(𝑔−𝑟)𝑡 𝑑𝑡
𝐼𝑁𝐹𝐼𝑁𝐼𝑇𝑌
0
Where
g = denotes growth rate
r = the opportunity cost of capital (discount rate)
Investment would be worthwhile when r=i the NPV=0
Fisher referred to the discount rate as the ‘rate of return over costs or the internal rate of
return’. Keynes, on the other hand, called it ‘the marginal efficiency of capital’. Research
by Hodgson, Breban, Ford, Streatfield and Urvin (2000), showed that investment efficiency
was a function of risk, return and total cost of investment management structure subject to
the fiduciary and other constraints within which investors must operate. It was observed
that, institutional investors implemented their investment policies through investment
management structures. Modern portfolio theory had a revolutionary effect on portfolio
construction.
8
Jensen and Meckling (1976), in their agency theory, asserted that managers do not always
run the firm they work for to maximize shareholders’ wealth but may instead pursue their
own self-interest. According to agency theory, debt finance acts as a controlling tool to
restrict the tendency towards opportunistic behavior for personal gain by managers. Debt
finance reduces the free cash flows within the firm paying fixed interest payments and in
the process forces managers to avoid negative investments and work in the interest of
shareholders. If the firm takes loans then managers have to act as the agent of owners as
well as of the debt providers. Therefore, agency cost theory of capital structure states that
the optimal capital structure is that point where the agency cost of all the interested parties
is at the minimum level. The static trade-off theory state that the value of the leveraged and
un-leveraged firm is not same. In the case of debt financing the firm can save the amount
of interest payments on the debts from tax purposes. However, at the same time due to debt
finance the cost of financial distress and the agency cost of the debt financing of the firm
increases. This theory further states that the optimal capital structure is that where the tax
benefit on the interest payments for the firm and the financial distress and the agency cost
of the debt financing balanced each other (Baxter,1967 and Altman 1984,2002).This theory
focus on three points these are tax advantage, financial distress costs and the agency cost.
McGuigan, Kretlow and Moyer (2000) observed that, to understand the effect of financial
decision on firm’s performance, one requires to understand financial risk and financial
leverage.).Financial risk is variability in earnings per share and the increased probability
of insolvency that arises when a firm uses fixed-cost sources of funds, such as debt and
preferred stock in its capital structure. A company with higher proportion of fixed costs to

9
variable cost is said to have a higher operating leverage. When a company has a higher
operating leverage then, that company is sensitive to changes in level of sales, a small negative
variation in sales will usually have an adverse effect on financial performance of the company.
Operating leverage measures the sensitivity or vulnerability of operating profit to changes in sales.
Fixed capital costs represent contractual obligations a company must meet regardless of the EBIT
level. The use of fixed-cost financing is referred to as the use of financial leverage. Financial
leverage causes EPS to change at a rate greater than the change in operating income (EBIT).
Sugar factories in Kenya are faced with many challenges, which include; Low production
capacities, poor technology, poor infrastructure, inadequate research, high input costs,
indebtedness, lack of funding and reliance on a single product (Obado, 2006).These
problems have caused the sector to underperform and is riddled with losses and heavy debt
burdens to extend of being in huge arrears on payments for cane delivered by farmers. An
analysis of Sugar factories shows that they rely on KSB soft loans and commercial banks
for financing and investment decisions.
1.1.5 The Sugar Factories in Kenya
According to KSB website, industrial sugarcane farming was introduced in Kenya in
1902.The first sugarcane factory was set-up at Miwani, Kisumu county in 1922 and later
at Ramisi in the coast region province in 1927.After independence, the Government of
Kenya explicitly expanded its vision of the role and importance of sugar industry as set out
in sessional paper no. 10 of 1965.The Sessional paper sought, inter alia to: Accelerate
socio-economic development, redress regional economic imbalances, promote indigenous
entrepreneurships and promote foreign investment through joint ventures .In pursuit of the
above goals, the Government established the following additional sugar factories and
10
which started operations in the 1960’s and 1970’s: Muhoroni (1966), Chemelil (1968),
Mumias (1973), Nzoia (1978), Sony Sugar (1979). The two older factories established in
the 1920’s ceased operations due to mismanagement, Ramisi sugar factory collapsed in
1988 and Miwani factory was leader put under receivership.
The establishment of the publicly owned factories was predicated on the need to: Achieve
self-sufficiency in sugar with surplus for export in a globally competitive market, generate
gainful employment and create wealth, supply raw material for sugar related industries,
such as molasses for ethanol plants, promote economic development in the rural economy
and beyond through activities linked to the sugar industry. In support of these goals, the
Government of Kenya invested heavily in sugar factories. Due to inability to satisfy the
domestic sugar demand, several private investors have set up the following sugar factories:
West Kenya (1981), Soin (2006), Kibos sugar and allied industries (2007), Butali,
Transmara, and Sukari factories have also been set up in the 2010’s KSB (2008-2014).
The Kenyan sugar industry has a wide range of stakeholder, each with a role to play. The
stakeholder are; GoK through the ministry of MoALFD, with the overall responsibility for
industry’s development, these support is offered through regulation, enhancement of
competition and fair play and provision of enabling environment for all stakeholders. The
KSB, is a public body set up by the Sugar Act 2001, under the MoA, the board is mandated
to: regulate and promote the sugar industry, Co-ordinate the activities of individuals and
organizations in the industry and facilitate equitable access to the benefits and resources of
the industry by all interested parties.KESREF established in 2001, is the scientific wing of
11
the industry mandated to develop and appropriate technology in the sugar industry.
KESGA, association of out grower’s institutions and cane growers, to represent farmers’
interests. KECATRA, responsible for facilitating cane transport. KESMA, an association
of millers and jaggeries to represent their interests according to KSB (2009).
The combined installed capacity of the operational sugar companies is 30,000 TCD which
is not sufficient to produce enough sugar for domestic consumption, currently estimated at
800,000 MT.With the current TC/TS ratio and average actual milling time, the country
managed to produce almost 500,000 MT of sugar in year 2008. This was largely owed to
the technical limitations and capacity underutilization with an industry average of
56.63%.However,by improving the capacity utilization to 85% the country will be able to
add additional 140,000MT to its production; almost halving the current sugar deficit, KSB
(2009).
1.2 Research Problem
Sugar is a product consumed in its various forms by almost every household in Kenya, the
product was also used in following industries; beverage, pharmaceutical, confectionary and
distilling. There were other strategic uses of sugar which had not been fully explored in
Kenya. A firm needs to have its business model in place before it can make additional
substantive decisions. Failure to develop a well-designed business model stems from a rush
to get a new product or service idea to the market (Barringer, Ireland, 2006).Matt Ragas, a
marketing expert, said this about neglecting to design a thorough business model: “A killer
new product or service without a well-thought business model is a lot like a sailor without

12
navigational charts”. Companies that create innovative products or services without well-
crafted business models act the same way. The study attempted to investigate whether
Sugar Factories in Kenya could achieve long term competitive sustainability by exploring
a wider range of new product base or not.
The KSB (2009) strategic plan provided a road map of how the industry intended to be ‘a
world class multi-product sugar industry’ through diversification into other sugar by
products. Mumias Sugar Company had already ventured in co-generation of power, ethanol
and water bottling in the addition to her main sugar products. Review of other factories
current strategic plans, revealed that they were also pursuing diversification strategies for
them to remain competitive and in light of elapse of COMESA safeguards in February
2015. More research was necessary in this sector which had been given little attention in
the past. Its unique characteristics and challenges needed to be highlighted in light of the
environment turbulence a rising from liberalization. There was need to know the
investment and financial strategies that were being employed by the Factories and the
challenges facing the attainment of those strategies.
According to data on financial performance of sugar factories in Kenya and information
published from time to time by the regulator (KSB), currently, the public sugar factories
are technically insolvent but at the same time, they were pursuing the multi-billion
diversification projects in order for them to remain in business, the research sought to
confirm whether available financing arrangements were viable given the current balance
sheet positions. Their main source of financing for sugar factories have been funds from

13
KSB.Various researchers carried out in the past concentrated on formulation of competitive
strategies by sugar factories, these study examined the effect of investing and financing
decisions on financial performance of Sugar Factories in Kenya, with aim of addressing
the question: What is the effect of investing and financing decisions on future financial
performance of the sugar factories in Kenya?
1.3 Research Objective
To establish the effect investing and financial decisions on the financial performance of the
sugar factories in Kenya.
1.4 Value of the Study
According to KSB (2009), the Kenyan sugarcane is a major employer and contributor to
the national economy. Farm households and rural businesses depend on the injection of
cash derived from the industry. Besides the socio-economic contributions, the industry also
provided raw materials for other industries such as bagasse for power co-generation and
molasses for a wide range of industrial products including ethanol. The study was of
immense benefit to a significant proportion of population in Kenya who rely on sugarcane
growing as a source of livelihood. The study was to benefit the Government of Kenya in
her planning and poverty eradication effort. Private potential investors in the sugar cane
sector, farmers, service providers and consumers were also to benefit from the
recommendations of the study. These study contributes to academia, as a stimuli for more
study on other significant variables that have an effect of the sugar factories in Kenya.
These study advances knowledge on how the previous investment and financing decisions

14
have impacted on the financial performance within sugar factories in Kenya. Most studies
reviewed in previous projects have focused mostly on the effect capital structure and
financial leverage on financial performance. These study advanced knowledge and new
theory on impact of investment and financing on financial performance. The results of this
study have significant policy implications at the firm, industry, and macro levels.

15
CHAPTER TWO
LITERATURE REVIEW
2.1 Introduction
This chapter reviewed literature under the following thematic topics and subtopics: review
of theories, review of empirical studies. The study incorporated previous literature on
investment, financing and financial performance of the sugar industry in Kenya.
2.2 Theoretical Review
Theoretical definition also referred to us conceptual, gives the meaning of words in terms
of the theories of a specific discipline. For the purpose of these study, various theories in
the past had been formulated and are relevant for the purpose of these study are examined
in these chapter.
2.2.1 Portfolio Theory
Markowitz (1952), derived the expected rate of return for a portfolio of assets and an
expected risk measure. Markowitz showed that the variance of the rate of return was a
meaningful measure of portfolio risk under a reasonable set of assumptions. More
importantly he derived a formula of for computing the variance of a portfolio, which can
be computed from expected rate of security return given as:
E(Ri) = ∑ Wi Ri𝑛𝑖=1

16
Where:
E(Ri) = expected rate of security return
Wi = the weight of an individual asset in the portfolio or the percentage of the portfolio in
Asset i
Ri = the expected rate of return for Asset i
Variance (standard deviation) of returns for an individual investment is a measure of
variation of possible rates of returns Ri from the expected rate of return E(Ri),as follows:
Variance = ∑ (𝑅𝑖 − 𝐸(𝑅𝑖)2𝑃𝑖𝑛
𝑖=0
Where:
Pi = probability of the possible rate of return Ri
Standard deviation is a square root of the variance
Markowitz observed that the construction of an asset portfolio is based on maximizing
return with a given level of risk. The portfolio theory provides a frame work to generate
the optimal portfolio for its investor. The return of a portfolio is equal to weighted average
of the included assets.
To analyze investment in the sugar factories in Kenya, a thorough understanding of
portfolio theory was necessary in order to determine the optimal portfolio of investments
that can result in higher expected return and minimum risk.

17
2.2.2 Capital Asset Pricing Model
Sharpe (1964), Lintner (1965) and Mossin (1966), developed CAPM independently, the
model is based on very simplified assumptions and allows one to determine the required
rate of return for any risky asset. Capital market theory extends portfolio theory by
developing a model of pricing all risky assets.
The covariance between two sets of returns is:
COVij = ∑ (𝑅𝑖 − 𝐸(𝑅𝑖)⌉⟮(𝑅𝑗 − 𝐸(𝑅𝑗)⦌/𝑛𝑛
𝑖=0⟮⟮
Like the expected rate of return for a portfolio of two risky assets, the expected rate of a
portfolio that includes a risk-free asset with a collection of risky assets (portfolio M) is the
weighted average of the two returns, computed as:
E(R) = w RF(RFR) + 1- w RF)E(Rm)
Where:
w RF= the proportion of the portfolio invested in risk-free asset
E(Rm) = the expected rate of return on risky portfolio M
In investment and financing process, there is usually a combination of risky and less risk
assets, the sugar factories in Kenya, needed to clearly appreciate the importance of CAPM
in formulating investment decisions.

18
2.2.3 Arbitrage Pricing Theory
Ross (1976), developed APT, he derived the relations among expected rates of return that
would rule out riskless profits by any investor in a well-functioning capital markets. . An
arbitrage opportunity is an investment that requires no net outflow of cash and carries no
change of losing money, yet has some probability of yielding a positive return (Levy, Post,
2005). Arbitrage opportunity occurs when two assets offer the same return, but trade at
different prices. Faced with this situation, an arbitrageur will buy the cheaper asset and
short sell more expensive one the two key concepts of APT are arbitrage and factor models.
The model is used to identify what many call ‘’mispriced assets’’. This assets are valued
higher than they are, presenting an opportunity for capital appreciation.
APT states, that the expected rate of return of security j is the linear function from the
complex economic factors common to all securities. It is important to note that the arbitrage
in the APT is only approximate, relating diversified portfolios, on assumption that the asset
unsystematic (specific) risks are negligible compared with the factor risks. The Kenyan
investment market was at infancy state, thus the market could not reflect the fundamental
security information, it was possible that arbitrage opportunities existed and which sugar
factories needed to take advantage off.

19
2.3 Determinants of Financial Performance of Sugar Factories
Branch and Gale (1983), observed that, the analysis of corporate financial performance has
a special significance for the management, in their attempt to maintain the company’s
stability and to increase its market share. Brief and Lawson (1992), argue the opposite, that
financial indicators based on accounting information are sufficient in order to determine
the value of shareholders. Investment and financing decision, size, corporate governance
and capacity utilization effect on financial performance are analyzed under determinants
of financial performance.
2.3.1 Investment Decision
Zvi, Alex and Allan (2004), investment is that activity in which a manufacturer buys a
physical asset like stock or production equipment, in expectation that this will help the
business prosper. The sugar factories in Kenya were pursuing diversification strategies in
order to remain competitive in the global sugar market, an understanding of investment
process was key to their future survival.
2.3.2 Financing Decision
Different studies have found out that, financial leverage has a relationship with financial
performance. According to Rehman (2013), financial leverage is the extent to which a
business or investor uses borrowed money, it is a measure of how much a firm uses equity
and debt to finance its assets. As debt increases, financial leverage increases.KSB charged
with regulation of the sugar factories charges SDL at a rate 4% per ton of sugar delivered
to factories, the study found out that, these recoveries were being pooled together and

20
advanced back factories at a cheaper rate of 5% to finance investments in factory
rehabilitation, cane development, roads, bridges and infrastructure developments within
sugar cane catchment. The factories also used their assets as securities to secure loans for
investments from commercial banks and financial institutions in Kenya. The study found
out that, Kenyan sugar factories were heavily indebted, resulting in instability in financial
performance as a small change in sales volumes resulted in huge adverse financial
performance.
2.3.3 Size
According to Elsas, Flannery and Garfinkel (2006), financing proportions varied with firm
size: smaller firms rely more on externally equity funds, which seems inconsistent with the
pecking order theory of capital structure by Frank and Goyal (2003),Fama and
French(2003).There sugar factories in Kenyan have excess capacity that is utilized leading
higher per cost of sugar and these makes the factories to be in inefficient and
noncompetitive.
2.3.4 Corporate Governance
Mugenda, Momanyi and Naibei (2012), observed that, risk management undertaken at firm
level is now considered a key governance and management tool within the public and
private sectors. Managing risk well requires a careful consideration of the key concepts of
minimizing loss and maximizing opportunity (Australia government, 2008). Political
interference in sugar factories in Kenya leads to poor corporate governance causing the
factories experience high risk and danger of failure.

21
2.3.5 Capacity Utilization
Riley (2009) explains that, a firm’s productive capacity is the total level of output or
production that it could produce in a given time period. Capacity utilization is the
percentage of a firm’s total possible production capacity that is actually used. A firm’s
level of capacity utilization determines how much fixed costs should be allocated per unit,
so as a firm’s capacity utilization increases, the fixed costs (and therefore also, total costs)
per unit will decrease. A firm that has just invested in major new facilities in anticipation
of major growth could take some time before reaching a good level of utilization, so it is
important to consider sales trends when discussing capacity utilization.
2.4 Empirical Review
Orodho (2004), observes that during proposal writing, one must be conversant with
appropriate techniques of reviewing and abstracting relevant literature. Six studies with
three from each, international and local will be considered under empirical review.
2.4.1 International Evidence
Rehman (2013), investigation on: relationship between financial leverage and financial
performance: empirical evidence of listed companies of Pakistan. The study sample size
was thirty five food companies listed at Karachi stock exchange. Financial performance
was the dependent variable measured using five indicators of: ROA (%), ROE (%), EPS
after tax (%), NPM (%) and sales growth. Financial leverage was the independent variable
measured using debt to equity ratio. Descriptive and correlation analysis were used in data
analyzing. The results of these study showed a positive relationship of debt equity ratio

22
with ROA and sales growth, and negative relationship of debt equity ratio with EPS, NPM
and ROE. The variation from mean was quite high in debt equity ratio which means there
was massive fluctuations in data during the study period (2006-2011).The researcher
identified gaps that would require further studies in following areas: by extension period
and take all food companies on Karachi stock exchange, consider comparative studies by
taking data from different sectors to check the relationship between the studied variables.
Elsas, Flannery and Garfinkel (2006) study carried out at University of Florida, in USA,
identified firms and studied on their financing decisions and long-run stock-market
performance, the study covered the period 1989-1999.Separate major 128 internal or ‘built’
investments and 129 acquisitions were examined.Compustat flow-of –funds data to infer
how these major investments were financed was used in determining the combination of
equity and debt securities issued to finance large investments, and how various
combinations of investment types and financing sources affected a firm’s long-run equity
performance. The study found out that, major investments were mostly externally financed
with new debt providing at least half the required funds in the year of the investment. Only
about 15-20% of the typical investment were financed by sale of equity, with internal funds
supplying most of the remainder. In the event year, firm financing choices reflected some
pecking order and market timing effects, but they systematically revised their initial
financing decisions in subsequent years.
Ebaid (2009) carried out a study to investigate the impact of choice of capital structure and
financial performance of the listed firms in the Tehran Stock Exchange. Financial

23
performance was measured using ROE, ROA and gross profit margin. Capital structure
was measured by short-term debt to asset ratio, long-term debt to asset ratio, and total debt
to total assets. Multiple regression analysis was applied to estimate the relationship
between leverage level and financial performance. The study indicated that capital
structure had little to no impact on a firm’s financial performance.
2.4.2 Local Evidence
Nyoike (2002), study on, financing capital investments by quoted companies in Kenya,
analyzed data using, correlation between capital investments and new equity, long-term
debt and short-term debt, these revealed varied correlations among the industry sectors in
the study. The study found that many factors influence managers in their financing capital
investment decisions. Among the most important factors were stability of future cash
flows, profitability of the business, level of competition in the industry, stability of future
sales and level of interest rates in the economy. Nyoike concluded that, management of
corporate firms are confronted with many decisions affecting growth, profitability and
survival of their organizations. Inevitably financing capital investments decisions
constitute such important decisions corporate Managers have to make on behalf of their
companies. Managers have to decide how much to finance capital investments and they
usually consider various factors in making financing decisions. Managers have to establish
the relationship between capital investments and financing variables namely, internally
generated funds, new equity capital, long-term debt and short-term debt. Correlation
analysis was used and results revealed that capital investments were significantly positively
collated with internally generated funds within the company.

24
Kemboi (2010), carried out an investigation on, how listed firms in Kenya financed their
investment in capital market. The objective of the study was establish sources of funds for
the firm and find out whether cash flows and debt influence the firm’s investment
decisions. Tests were based on fundamentals 𝑞 investment equations in which cash flow
and debt were added as explanatory variables. All these variables were normalized by
beginning capital stock .The study showed a significant positive relationship between debt
and investment levels in the firm. It was concluded that corporate investments in firms did
not respond to market fundamentals and liquidity position. The findings support corporate
life cycle hypothesis whereas firms become mature, past investments generate higher cash
flows, making present investment rates to slow down and become less attractive, hence the
negative empirical relationship between investment and cash flows.
According to Nyale (2010), a study on the relationship between leverage investment
decisions for companies quoted at the NSE.The study methodology was designed with the
objective of establishing relationship between leverage and investment decisions by use of
multi linear regression analysis method. The study considered, diversification that involved
investments in new products, investments in totally new service lines and venture into new
geographical with different political and economic environments. Findings indicated that
36% of listed companies at the NSE engaged in diversification investment decisions. The
study further found out that, there was a weak relationship between the levels of leverage
of a company and how much money the company can commit to a diversification
investment decision. This insinuates that companies view each diversification investment

25
decision on their own merit and how much money is committed to an investment decision
is not entirely dependent on the level of leverage of the company.
2.5 Summary of Literature Review
Previously, there have been many studies both internationally and locally on the variables
in the current study and their relationships. Some of these studies, have tried to explain the
relationship between financial leverage and financial performance, focusing on sampled
firms within the various economies. Debit Equity ratio has been used as a measure financial
leverage while ROA was used to measure financial performance. Other studies have sought
to establish the effect of financing and capital structure decisions on the long-run market
performance of Companies. There have no concrete conclusions on the same within the
sugar industry in Kenya. This study seeks to bridge any gaps by specifically addressing the
effect of investing and financing decisions on the financial performance of sugar factories
in Kenya.

26
CHAPTER THREE
RESEARCH METHODOLOGY
3.1 Introduction
This chapter explained the methods used in the study. It commenced with an overview of
the research design, target population, sample size, data collection, data analysis, analytical
model and test of significance.
3.2 Research Design
Research design is the ‘blueprint ‘that enables the investigator to come up with solutions
to problems and guides in various stages of the research. The research design helps one to
structure collection, analysis and interpretation of data (Nachmias and David,
1996).Kerlinger (1969) states that descriptive studies are not only restricted in finding, but
may often result in the formulation of important principals of knowledge and solutions to
significant problems. The study that sort to explain the effect of investing and financial
decisions on the financial performance of the sugar industry in Kenya. It was a descriptive
study that examined the both variables of ln of Total assets and Debt to Equity as measures
of investing and financing decisions on the financial performance as measured by ROA of
the sugar factories in Kenya.

27
3.3 Target Population
The target population of this study was all the operational sugar factories in Kenya as at
31st December 2013. There were, eleven sugar factories in Kenya (Appendix 1).
3.4 Sample
Non probability or random sampling method was used, the population elements had no
probabilities attached. The main consideration was to choose a quarter from the target
population with two millers each from the two main areas of sugar producing formerly
western and Nyanza provinces.
The Companies in the study were: Sony, Mumias, Chemelil and Nzioa sugar factories. All
the sampled firms are state corporations with the exception of Mumias which is under
private ownership. It was not possible for the other private millers to share information to
third party and specifically for these study.
3.5 Data Collection
This was a quantitative research in which secondary data was used. Secondary data is data
that have previously been prepared for other purposes. The financial statements for period
of five years (July2008 to June 2013) of sampled sugar factories captured data on Statement
of comprehensive income and Statement of financial position and computed ROA, Log10
of Total assets and Debt/Equity ratio.

28
3.6 Data Analysis
Data on capital expenditure, maintenance costs, level of debt, shareholders value in the
firm and profitability was derived from published financial statements over the period of
the study. Brown and Reilly (2009) observed that, financial statement analysis seeks to
evaluate management performance in several important areas, including profitability,
efficiency and risk. Although historical data is analyzed, the ultimate goal of this analysis
was to provide insights that help project future management performance, including
Statement of comprehensive income and Statement of financial position, were reviewed to
assist in drawing conclusion on future outlook of the sugar industry in Kenya.
3.6.1 Analytical Model
Financial series do not usually follow a normal distribution. Series are usually leptokurtic
(extreme values have a large deviation from the average).Kurtosis normal value index is
3.Multiple linear regression model is used to describe the relationship between a dependent
variable (explained) and several independent variables (explanatory).
Y= β0 + β1X1 + β2X2 + εt,
Where
Y = Financial Performance measured by: ROA (%)
β0 = Constant term
βi = Beta coefficient of variable i that shows the sensitivity of Y to changes in i
X1 = Investing as measured by ln of Total Assets
X2 = Financing as measured by D/E ratio (%)
29
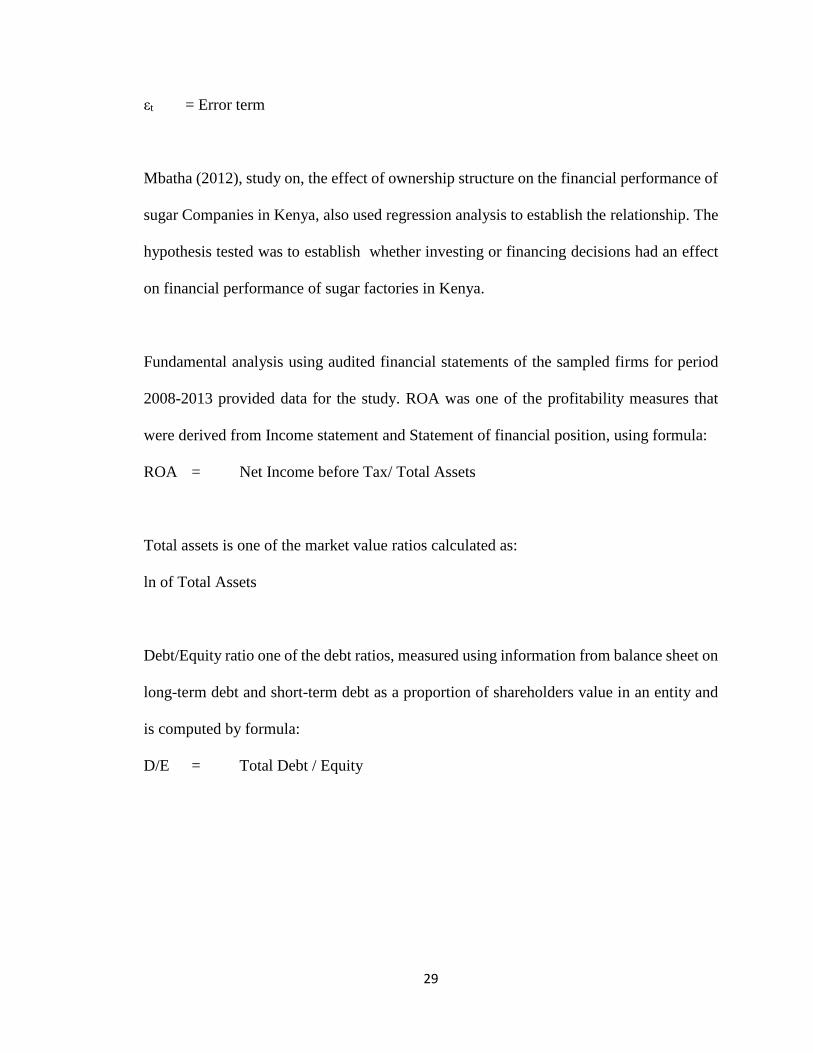
εt = Error term
Mbatha (2012), study on, the effect of ownership structure on the financial performance of
sugar Companies in Kenya, also used regression analysis to establish the relationship. The
hypothesis tested was to establish whether investing or financing decisions had an effect
on financial performance of sugar factories in Kenya.
Fundamental analysis using audited financial statements of the sampled firms for period
2008-2013 provided data for the study. ROA was one of the profitability measures that
were derived from Income statement and Statement of financial position, using formula:
ROA = Net Income before Tax/ Total Assets
Total assets is one of the market value ratios calculated as:
ln of Total Assets
Debt/Equity ratio one of the debt ratios, measured using information from balance sheet on
long-term debt and short-term debt as a proportion of shareholders value in an entity and
is computed by formula:
D/E = Total Debt / Equity

30
3.6.2 Test of Significance
A t-distribution looks similar to the Normal, but its shape depends on the degrees of
freedom, when we take a sample size of n, the degrees of freedom are simply defined as
N-1.When the sample size is 30, the t-distribution is virtually the same as a Normal
distribution (Waters, 2008).Since the sample size is less than 30, and these study used t-
distribution or student t-distribution.

31
CHAPTER FOUR
DATA ANALYSIS, RESULTS AND DISCUSSION
4.1 Introduction
This focus in this chapter is on the presentation of data, analysis, results and discussion of
the findings. Secondary data on the Statement of Profit or Loss and Statement of financial
for the period July 2008-June 2013 was used; regression analysis was used to analyze data.
The study targeted data from four sugar factories, out of these sample, it was not possible
to get information on performance of Nzoia sugar factory despite making several follow
ups,making a response rate of 75% which is an adequate response rate for statistical
reporting. According to Mugenda and Mugenda (1999), a response rate of 50% and above
is good for statistical analysis.
4.2 Findings
Appendices 2 and 3 on Statement of comprehensive income and Statement of financial
position were extracted from the audited five years financial statements of the target sugar
factories, these information was consolidated for the purpose of computing the key
variables of the study. The information was summarized from the financial statements of
the three sugar factories for purpose of establishing the objective of the study.

32
Table 4.1: Summary Data on Key Financial Values
Year ended/
Values
June 2009 June 2010 June 2011 June 2012 June2013
Revenue
16,613,055 20,758,981 23,067,841 22,838,396 16,672,924
Profit/(Loss)
before Tax
250,620
1,789,335
3,138,077
2,010,522
(3,570,438)
Total debt 12,699,775 13,207,806 14,782,358 18,719,226 21,570,227
Total Equity net of
Revaluation
Reserve
8,321,478
9,230,716
11,166,703
12,409,288
8,970,371
Total Equity 12,089,157 12,761,884 17,684,712 18,559.198 16,926,491
Total Assets 24,788,882 25,969,689 32,467,070 37,278,433 38,496,718
Source: Research Findings
The information on key financial values in table 4.1 was used to calculate the financial
ratios in table 4.2 below, that was to derive the analytical model of the form:
Y= β0 + β1X1 + β2X2 + εt,
The above data in table 4.1 was analyzed using Minitab analysis tool resulting in table 4.2,
for establishing a regression analysis explaining the relationship of:

33
Regression Analysis: ROA versus Logarithm to base ten of Total assets, D/E.
Table 4.2: Summary Statistics
Predictor Coef SE Coef t-Stat p-Value
Constant -1.079 1.060 -1.02 0.416
Log10 Total assets 0.1878 0.1448 1.30 0.324
D/E -0.18376 0.02923 -6.29 0.024
S = 0.0214807 R2 = 95.8% R2(adj) = 91.6%
Source: Research Findings
Where
T-Statistics : It measures the difference between an observed statistic and its
hypothesized population parameter in units of standard error.
P-Value : It determines the appropriateness of rejecting the null hypothesis in a
hypothesis test. P-values range from 0 to 1.
Coef : The numbers by which the variables in an equation are multiplied.
SE Coef : It measures how precisely your data can estimate the coefficient's
unknown value. Its value is always positive, and smaller values indicate a
more precise estimate.
34
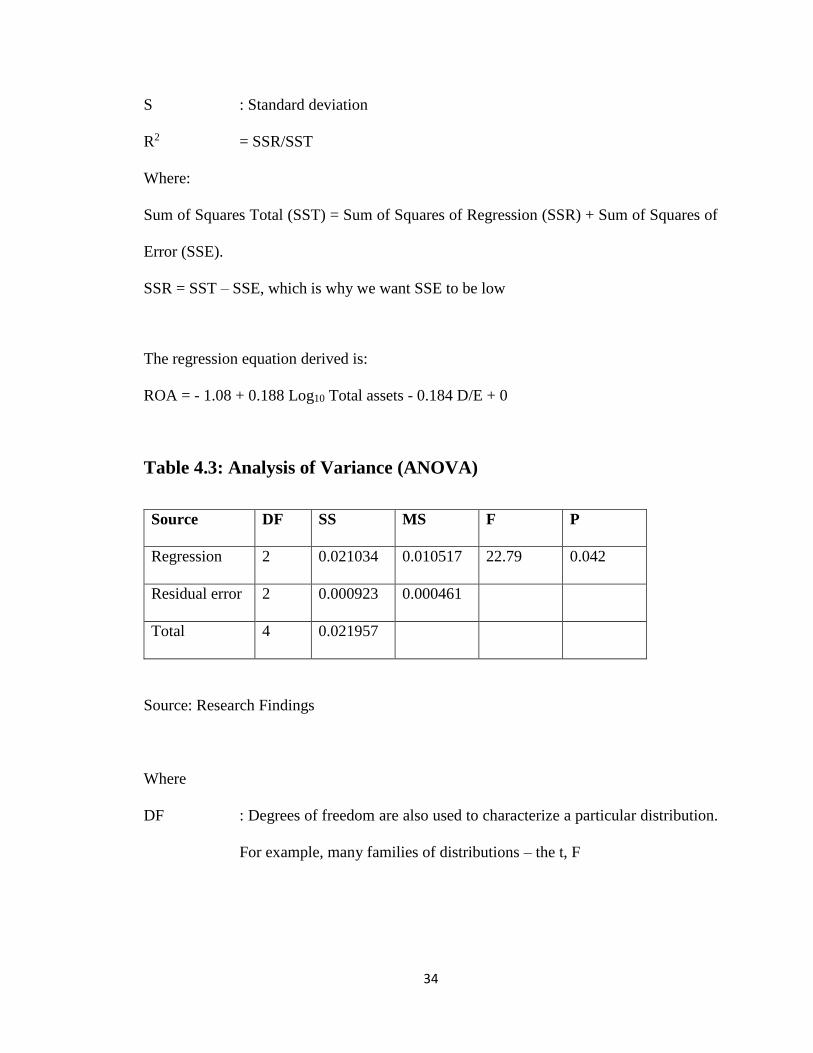
S : Standard deviation
R2 = SSR/SST
Where:
Sum of Squares Total (SST) = Sum of Squares of Regression (SSR) + Sum of Squares of
Error (SSE).
SSR = SST – SSE, which is why we want SSE to be low
The regression equation derived is:
ROA = - 1.08 + 0.188 Log10 Total assets - 0.184 D/E + 0
Table 4.3: Analysis of Variance (ANOVA)
Source DF SS MS F P
Regression 2 0.021034 0.010517 22.79 0.042
Residual error 2 0.000923 0.000461
Total 4 0.021957
Source: Research Findings
Where
DF : Degrees of freedom are also used to characterize a particular distribution.
For example, many families of distributions – the t, F
35
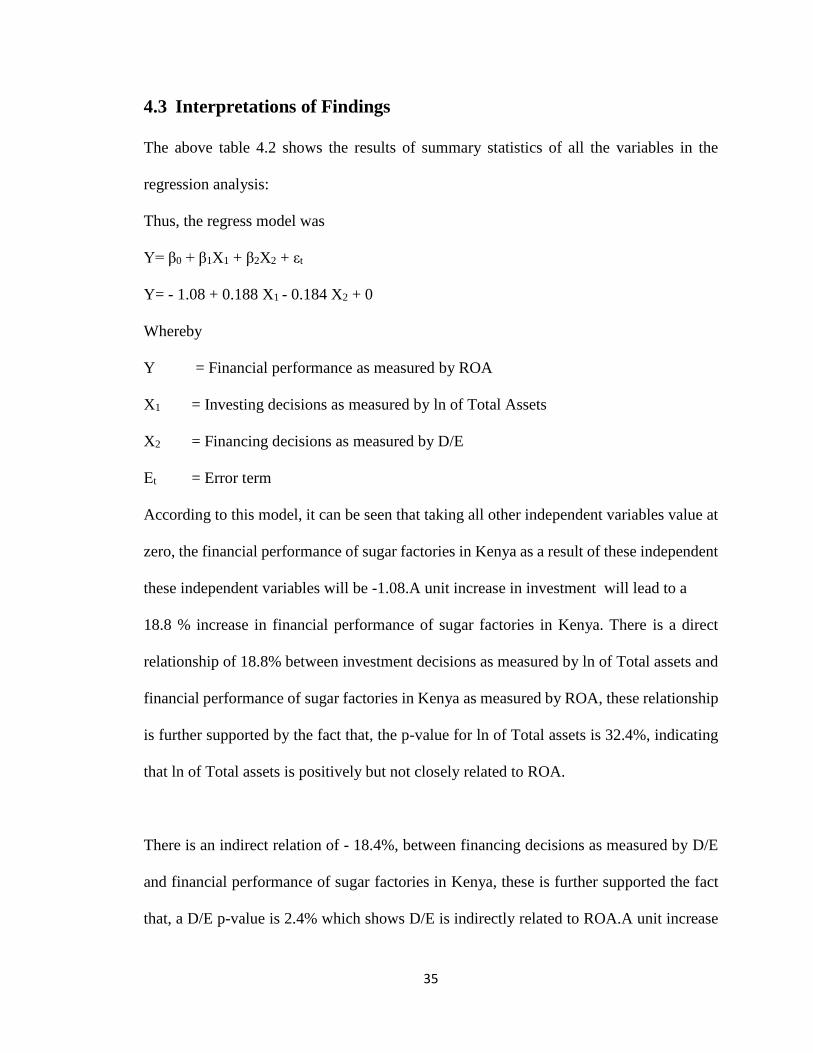
4.3 Interpretations of Findings
The above table 4.2 shows the results of summary statistics of all the variables in the
regression analysis:
Thus, the regress model was
Y= β0 + β1X1 + β2X2 + εt
Y= - 1.08 + 0.188 X1 - 0.184 X2 + 0
Whereby
Y = Financial performance as measured by ROA
X1 = Investing decisions as measured by ln of Total Assets
X2 = Financing decisions as measured by D/E
Εt = Error term
According to this model, it can be seen that taking all other independent variables value at
zero, the financial performance of sugar factories in Kenya as a result of these independent
these independent variables will be -1.08.A unit increase in investment will lead to a
18.8 % increase in financial performance of sugar factories in Kenya. There is a direct
relationship of 18.8% between investment decisions as measured by ln of Total assets and
financial performance of sugar factories in Kenya as measured by ROA, these relationship
is further supported by the fact that, the p-value for ln of Total assets is 32.4%, indicating
that ln of Total assets is positively but not closely related to ROA.
There is an indirect relation of - 18.4%, between financing decisions as measured by D/E
and financial performance of sugar factories in Kenya, these is further supported the fact
that, a D/E p-value is 2.4% which shows D/E is indirectly related to ROA.A unit increase
36
in financing will lead to - 18.4% in financial performance of sugar factories in Kenya.
Further, the sequential sum of squares indicates that the predictor D/E doesn't explain a
substantial amount of unique variance. This suggests that a model with ln of Total assets
may be more appropriate. The R2 value indicates that the predictors explain 95.8% of the
variance in ROA. The adjusted R2 is 91.6%, which accounts for the number of predictors
in the model. Both values indicate that the model fits the data well.

37
CHAPTER FIVE
SUMMARY, CONCLUSION AND RECOMMENDATIONS
5.1 Introduction
This chapter provides a summary of the findings of the study. The first section provides a
summary of the findings. The other sections provide, conclusions of the study,
recommendations for policy, limitations of the study and suggestions for further research
in that order.
5.2 Summary
In determining the effects of investing and financing decisions on the financial
performance of the sugar factories in Kenya, the study first found it necessary to evaluate
the financial performance of the target sugar factories in Kenya. Financial performance
variable under consideration was ROA as the target or dependent variable, investing
decision as measured by ln of Total assets and Financing decision as measured by D/E, as
the two predictors or independent variables.
Their S, SE Coef, Coef, t-Stat, p-Value, R-Sq and R-Sq (adj) were determined. From the
findings, the positive value of the variance indicate they are statistical significant in
influencing financial performance as measured by ROA.

38
5.3 Conclusion
From the findings, the study concludes that sugar factories in Kenya need to adopt sound
investment decisions for their long-term survival. Right investment decisions have the
potential of positively affecting financial performance of sugar factories in Kenya by at
least 18.8%.The shareholders’ value in the sugar factories will be maximized resulting in
high stock values.
From data collected on financial position of sugar factories in Kenya, the factories debt
level has been increasing over time. Debt is more than double the level of equity, these
implies that the sugar factories have service these debts while at same incurring the huge
cost of debt in terms interest rates. The study found out that, the level of financing has an
effect of -18.4% on the financial performance of sugar factories in Kenya.
5.4 Recommendations for Policy
Given the findings from this study there are a number of policy recommendations that can
be adopted by sugar factories in Kenya in order to increase their financial performance.
Sugar factories in Kenya over rely on single product line of milled sugar as a source of
revenue. The expiry of COMESA safeguards if February 2015 will result in the domestic
sugar market being opened to sugar from other cheaper countries. The study recommends
that sugar factories in Kenya, should pursue product diversification investment strategies
in order to broaden their revenue base. Since investment decisions directly affects financial
performance of sugar factories in Kenya.

39
The sugar factories in Kenya have been incurring financial loses as a result of higher cost
of production. Policy on modernization of the sugar factories will result in increased
production efficiency. Government of Kenya should consider subsidizing farm inputs,
agricultural equipment and spares as a policy consideration through the annual budget
proclamations. Regulations governing licensing of new sugar factories should be strictly
enforced to ensure that they have adequate sugar cane raw material base before they are
licensed, to cane poaching of already established factories by new ones.
5.5 Limitation of the Study
According to Mkok (2014), investment in sugar sector in Kenya has broadly been through
GOK and Private investors with a 30% and 70% share respectively as at 31st December
2013.Among the private sugar factories, it was only possible to get information from
Mumias sugar factory with a market share of 28%, other private sugar factories with a total
market share of 42% cannot avail data due confidentiality considerations. These was a
limitation as the study findings cannot accurately be relied upon to establish the intended
objectives.
The other main limitation of this study was the inability to include all sugar factories in
Kenya, a sample of four factories was selected, further it was impossible to obtain data
from Nzoia sugar one the four sampled factories despite various follow ups .A limitation
for the purposes of the study is regarded as a factor that present and contribute to the
researcher either getting inadequate data for the purposes of effectively establishing the
relationships between the study variables.
40
The study focused on fundamental analysis of the Statement of comprehensive and
Statement of position to draw conclusion on the financial performance of sugar factories
in Kenya. These was a major limitation of overlying only on quantitative data to draw
conclusion on financial performance of sugar factories in Kenya, the study would have
been more meaningful if the quantitative data was analyzed together with qualitative data
from the strategic plans of the sugar factories. Strategic plan process would have involved
situational analysis by adopting PESTEL and SWOT to supplement fundamental analysis,
in order give a more conclusive outcome of the study.
5.6 Suggestions for Further Research
The present study should be replicated to include the private sugar factories in Kenya that
were not covered in these study. From information in the media, most of the private
factories were established as integrated millers and are therefore able to diversify into other
sugar byproducts such as cogeneration and ethanol, it would therefore be important to
understand their investment and financing models and effect of financial performance.
The same study could also be replicated using the total population of established sugar
factories in Kenya. These could bring wide variations as a result of a mix of both GOK and
private factories in terms of the business models unique to each sub-sector with the country,
correlation analysis could adopted in order to establish whether findings are in line or not
with current study findings.

41
The GOK of Kenya is currently pursuing vision 2030 economic goals. There is need to
develop, promote and facilitate the implementation of strategic objectives that results in
increase of sugar production and productivity, expand the product base and reduce cost of
production. There is need to carry out a study of the strategic plans that have adopted by
the sugar factories in Kenya and evaluate their success in light of the vision 2030 economic
goals.

42
REFERENCES
Barringer, R. B., & Ireland, R., D. (2006) . Entrepreneurship, successfully launching new
ventures (2nd ed.). Pearson education.
Branch, B., & Gale, B. (1983). Linking corporate stock price performance to strategy
formulation. The journal of business strategy,4, 40-50.
Brief, R., & Lawson, R. (1992). The role of the accounting rate of return in financial
statement analysis. The Accounting Review, 67 (No. 2), 411-426.
Brown, C. K., & Reilly, K., F. (2009) . Analysis of investments and management of
portfolios (9th ed.). South-Western.
Deepchand, K. (2001). Commercial scale cogeneration of bagasse energy in Mauritius.
Energy for sustainable development,5 (No. 1), 15-22.
Ebaid, E.I. (2009). The impact of capital-structure choice on firm performance. Empirical
evidence from Egypt. The Journal of risk finance, 10 (No.5), 477-487.
Elsas, R., Flannery, J. M. & Garfinkel, A. J. (2006). Major investments, firm financing
decisions and long-run performance. Unpublished working paper. Retrieved from
researchgate.net
Frank, M. Z., & Goyal, K.V. (2003).Testing the pecking-order theory of capital
structure. Journal of financial economics,67 (No.2), 217-248.
Gleason, K., Mathur, L., & Mathur, I. (2000). The interrelationship between culture, capital
structure and performance: Evidence from European retailers. Journal of business
research,50 (No. 2), 185-191.
Griblatt, M., & Titman, S,. (2002). Financial markets and corporate strategy
(2nd ed. ). New York: McGraw-Hill.
43
Gupta, S. P. (2012). Statistical methods (42 ed.). New Delhi: Sultan Chand & Sons.
GWM (2013). Understanding investment concepts. Understanding
tax Version 4.2, Retrieved from www.mlc.com.au/understandingseries
IASB. Amended (2012). IAS: Presentation of financial statements.
Jensen, M. C., & Meckling, W. (1976). Theory of the firm: managerial behavior, agency
costs, and capital structure. Journal of financial economics,3, 305-360.
Kemboi, C, K., (2010). How listed firms finance their investment in capital market.
Retrieved from University of Nairobi Digital Repository
KSB. (2009). Kenya Sugar Board Strategic Plan: 2008–2013, 16.
Lintner, J. (1965). Security prices and maximal gains from diversification. Journal of
finance,20, 587-615.
Markowitz, H. (1952). Portfolio selection. The journal of finance, (7)
Mbatha, K,Z., (2012). The effect of ownership structure on the financial performance of
sugar companies in Kenya. Retrieved from University of Nairobi Digital
Repository.
McGuigan, R. J., Kretlow, J. W., & Moyer, R. C. (2000). Contemporary corporate finance
(11th ed.). South-west Cengage learning.
McLaney, E. (2009). Business finance: theory and practice (8th ed.). Pearson education
Ltd.
Mkok, R. (2014). Intra African Sugar market competition: How Kenya is saving the sector.
The 4th Africa sugar conference: Mombasa.
Modiglian, F., & Miller, M. H. (1958). The cost of capital, corporation finance and the
theory of investment. The American economic review,48, (No.3)
44
Modiglian, F., & Miller, M.H., (1963). Corporate income taxes and the cost of capital. The
American economic review, 48, (No.3)
Mossin, J. (1966). Equilibrium in capital asset market, Econometrica,34, 768-783.
Mugenda, N.G., Momanyi, G., & Naibei, K.I. (2012). Implication of risk management
practices on financial performance of sugar manufacturing firms in Kenya. An
international journal of arts and humanities. Ethiopia,1, 14-29.
Myers, S.C., & Majluf, N.S. (1984). Corporate financing and investment decisions when
firms have information investors do not have, Journal of financial economics,
13, 187-221.
Nachmias, F, C. & David, N. (1996). Research methods in the social sciences (5th ed.). St
Martins press, Inc.
Nyale. Y. (2010). The relationship between leverage investment decisions for companies
quoted at the Nairobi stock exchange. Retrieved from University of Nairobi Digital
Repository.
Nyoike, C, M. (2002). Financing capital investments by quoted companies in Kenya.
Retrieved from University of Nairobi Digital Repository.
Obado, Z, O. (2006). Competitive strategies employed by the sugar manufacturing firms
in Kenya. Retrieved from University of Nairobi Digital Repository.
Odek, O., Kegode, P., & Ochola, S. (2003).Way forward for the sugar sub-sector in
Kenya. Friedrich Ebert Stiftfung
Orive, J. (2014). Global sugar market environment and opportunities for Africa. The 4th
Africa sugar conference: Mombasa
45
Orodho, J.A., (2004). Techniques of writing research proposals and reports in education
and social sciences. (1st ed.). Nairobi: Masola publishers.
Rehman, S. F. U. (2013). Relationship between financial leverage and financial
performance: Empirical evidence of listed companies of Pakistan, Journal of
management and business research finance, (13).
Ross, S.A., Westerfield, R. W., Jaffe, J. (1996). Corporate finance (4th ed.).
Boston: McGraw Hill .
Sears, R. S., & Trennepohhl, G. L. (1993). Investment management (1st ed.), Dryden press.
Sharpe, W, F. (1964).Capital asset prices: a theory of market equilibrium. Journal of
finance,19, 425-442.
Waters, D. (2008).Quantitative methods for business (4th ed.). Printice hall.
Zvi, B., Alex, K., & Allan, J, M. (2004). Essentials of investments (5th ed.). New York
:Irwin.

46
APPENDICES
Appendix 1: Sugar Factories in Kenya
1. Butali
2. Chemelil,
3. Kibos
4. Muhoroni
5. Mumias
6. Nzoia,
7. Soin
8. Sony
9. Sukari
10. Transmara,
11. West Kenya
Source: Year Book of Sugar Statistics, KSB, 2013.
47
Appendix 2: Total Sugar Factories Statement of comprehensive income
for the Period to
June 2009
Ksh’000
June 2010
Ksh’000
June 2011
Ksh’000
June 2012
Ksh’000
June 2013
Ksh’000
Revenue 16,596,883 20,667,523 23,147,134 22,941,226 16,676,440
Fair value 16,172 91,458 (79,293) (102,830) (3,516)
Operating Income 16,613,055 20,758,981 23,067,841 22,838,396 16,672,924
Cost of Sales (13,149,186) (15,231,641) (15,807,998) (16,803,909) (15,088,963)
Gross Profit 3,463,869 5,527,339 7,259,842 6,034,487 1,583,962
Other Operating
Income
138,290
146,635
187,972
233,715
334,069
Marketing
&Distribution Costs
(883,001)
(965,437)
(1,227,370)
(798,992)
(937,978)
Administrative
Expenses
(1,853,186)
(2,364,711)
(2,358,174)
(2,845,168)
(3,194,365)
Other charges
&expenses
(664,217)
(467,643)
(443,073)
(825,547)
(882,239)
Operating(loss)/profit 201,756 1,876,183 3,419,198 1,798,495 (3,096,551)
Finance Income 299,892 404,226 147,323 502,300 425,312
Finance Costs (251,028) (491,074) (428,443) (290,273) (899,199)
Profit/(loss) before
Tax
250,620 1,789,335 3,138,077 2,010,522 (3,570,438)
Source: Research Findings

48
Appendix 3: Consolidated Statement of Financial Position as at
June 2009
Ksh’000
June 2010
Ksh’000
June 2011
Ksh’000
June 2012
Ksh’000
June 2013
Ksh’000
ASSETS
Non current assets
PPE
Deferred tax
Intangible assets
Biological assets
NCR
NCA held for sale
16,831,934
-
186,203
40,703
79,128
12,095
16,325,463
32,844
142,879
195,287
98,393
11,051
22,572,150
22,351
156,732
116,903
92,385
-
25,952,715
-
206,603
84,274
150,090
61,500
28,288,480
-
315,676
12,002
157,695
11,576
17,150,063 16,805,917 22,960,521 26,455,183 28,785,430
Current assets
Inventories
Biological assets
Trade receivables
Receivables from
out growers
Current income tax
Collateral deposit
Short-term deposits
Quoted investments
1,717,155
845,012
3,508,805
578,104
495,418
272,892
-
-
1,932,262
864,768
3,655,462
596,320
419,841
286,709
820,376
-
2,147,092
920,002
4,126,907
672,908
265,597
314,524
14,345
25,267
2,692,082
868,117
4,836,416
595,503
215,911
294,817
51,797
35,240
3,317,670
1,008,747
4,019,107
614,324
209,541
301,925
-
44,106
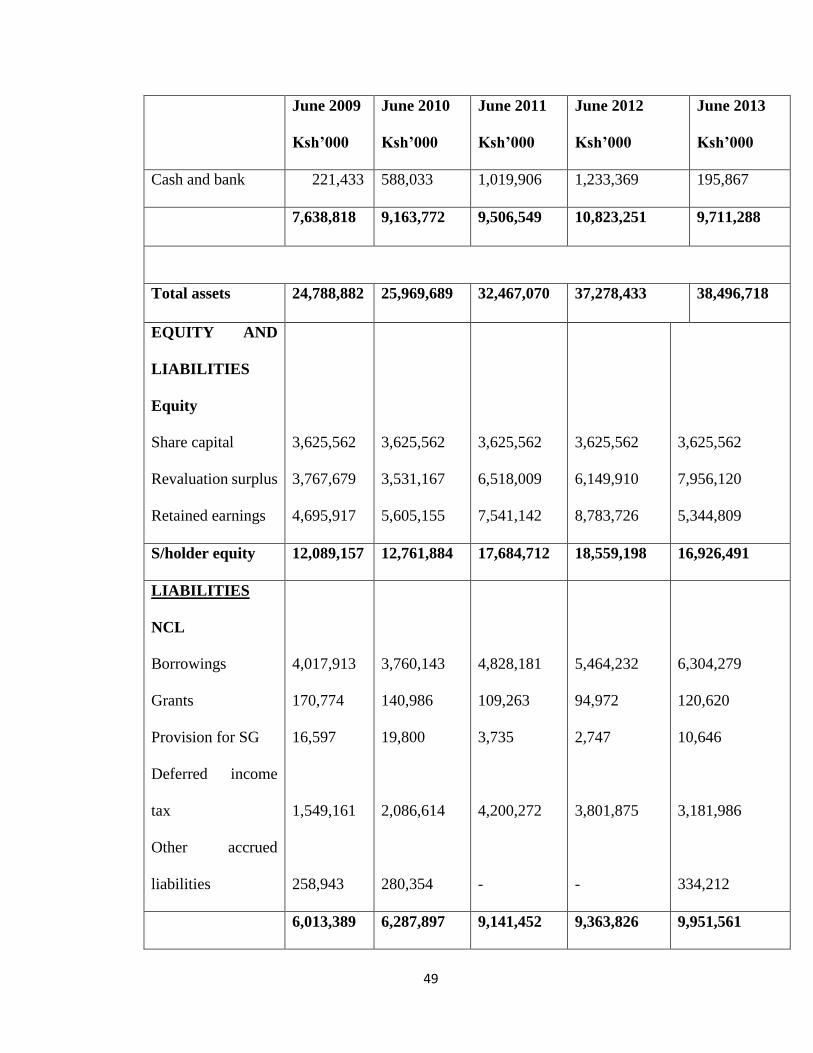
49
June 2009
Ksh’000
June 2010
Ksh’000
June 2011
Ksh’000
June 2012
Ksh’000
June 2013
Ksh’000
Cash and bank 221,433 588,033 1,019,906 1,233,369 195,867
7,638,818 9,163,772 9,506,549 10,823,251 9,711,288
Total assets 24,788,882 25,969,689 32,467,070 37,278,433 38,496,718
EQUITY AND
LIABILITIES
Equity
Share capital
Revaluation surplus
Retained earnings
3,625,562
3,767,679
4,695,917
3,625,562
3,531,167
5,605,155
3,625,562
6,518,009
7,541,142
3,625,562
6,149,910
8,783,726
3,625,562
7,956,120
5,344,809
S/holder equity 12,089,157 12,761,884 17,684,712 18,559,198 16,926,491
LIABILITIES
NCL
Borrowings
Grants
Provision for SG
Deferred income
tax
Other accrued
liabilities
4,017,913
170,774
16,597
1,549,161
258,943
3,760,143
140,986
19,800
2,086,614
280,354
4,828,181
109,263
3,735
4,200,272
-
5,464,232
94,972
2,747
3,801,875
-
6,304,279
120,620
10,646
3,181,986
334,212
6,013,389 6,287,897 9,141,452 9,363,826 9,951,561

50
June 2009
Ksh’000
June 2010
Ksh’000
June 2011
Ksh’000
June 2012
Ksh’000
June 2013
Ksh’000
Current liabilities
Trade payables
Directors current
account
Current income tax
Other accrued
liabilities
Borrowings
Dividend payable
Government grant
Provision for SG
DG income
Bank overdraft
4,498,473
1,313
-
-
1,811,655
330,921
11,362
4,454
28,157
-
4,924,539
1,100
-
-
1,627,983
318,973
11,362
6,474
29,478
-
4,267,529
20,600
40,268
279,450
610,028
292,660
11,362
10,482
33,822
74,705
5,693,786
4,100
322,978
314,189
2,463,448
309,137
11,362
1,201
28,552
206,646
7,970,760
-
-
314,189
3,121,190
466,075
11,362
5,652
43,626
-
6,686,336 6,919,909 5,640,906 9,355,400 11,618,666
Total equity and
liabilities
24,788,882
25,969,689
32,467,070
37,278,423
38,496,718
Source: Research Findings