Embed Size (px)
Citation preview

THE EFFECT OF CORPORATE DIVERSIFICATION ON
THE FINANCIAL PERFORMANCE OF LISTED
MANUFACTURING FIRMS IN KENYA
EDWARD MWANGI
A RESEARCH PROJECT SUBMITTED IN PARTIAL
FULFILLMENT OF THE REQUIREMENTS FOR THE AWARD
OF THE DEGREE OF MASTER OF BUSINESS
ADMINISTRATION, SCHOOL OF BUSINESS, UNIVERSITY OF
NAIROBI
NOVEMBER 2015

ii
DECLARATION
This research project is my original work and has not been presented to any other
institution. No section of this project may be reproduced or transmitted in any form
or by any means, without permission from the author or that of the University of
Nairobi.
Signature ………………………………………… Date………………………
Edward Mwangi
D61/64691/2013
This research project has been submitted for examination with my approval as the
University of Nairobi supervisor.
Signature ………………………………………… Date………………………
Dr. Cyrus Iraya
Lecturer,
Department of Finance and Accounting
Lecture, University of Nairobi

iii
ACKNOWLEDGEMENTS
I wish to thank a number of people and groups whom without them this project could
not have been successful. I sincerely want to thank my supervisor Dr. Cyrus Iraya for
his professional guidance and advice when I was writing my project.
The entire staff of the Nairobi Securities Exchange for the assistance that they
accorded to me during data collection period. Kindly, accept my appreciation.
The entire academic staff of the University of Nairobi, School of Business for their
support in one way or another during my study period.
Finally, to my parents, relatives and friends, I thank you all for your love, support and
encouragement when I was pursuing my studies.

iv
DEDICATION
This project is dedicated to my family for their love, support and understanding when
I was pursuing my project.

v
TABLE OF CONTENTS
DECLARATION.......................................................................................................... ii
ACKNOWLEDGEMENTS ...................................................................................... iii
DEDICATION............................................................................................................. iv
LIST OF TABLES ..................................................................................................... vii
ABBREVIATIONS AND ACRONYMS ................................................................ viii
ABSTRACT ................................................................................................................. ix
CHAPTER ONE: INTRODUCTION ........................................................................ 1
1.1 Background of the Study ......................................................................................... 1
1.1.1 Corporate Diversification .......................................................................... 2
1.1.2 Financial Performance .............................................................................. 3
1.1.3 The Effect of Corporate Diversification on Financial Performance ......... 4
1.1.4 Manufacturing Firms in Kenya ................................................................. 5
1.2 Research Problem .................................................................................................... 6
1.3 Research Objective .................................................................................................. 8
1.4 Value of the Study ................................................................................................... 8
CHAPTER TWO: LITERATURE REVIEW ......................................................... 10
2.1 Introduction ............................................................................................................ 10
2.2 Theoretical Framework .......................................................................................... 10
2.2.1 Capital Asset Pricing Model ................................................................... 10
2.2.2 Portfolio Diversification Model of Alliances ......................................... 11
2.2.3 Resource-Based Theory and Corporate Diversification ......................... 13
2.3 Determinants of Financial Performance ................................................................ 14
2.3.1 Size of the Firm ....................................................................................... 14
2.3.2 Management Efficiency .......................................................................... 15
2.3.3 Use of Leverage ...................................................................................... 16
2.3.4 Corporate Diversification ........................................................................ 17
2.3.5 Growth of the Firm ................................................................................. 18
2.3.6 Product Diversification ........................................................................... 18
2.4 Empirical Review................................................................................................... 19
2.5 Summary of the Literature Review ........................................................................ 23

vi
CHAPTER THREE: RESEARCH METHODOLOGY ........................................ 24
3.1 Introduction ............................................................................................................ 24
3.2 Research Design..................................................................................................... 24
3.3 Population .............................................................................................................. 24
3.4 Data Collection ...................................................................................................... 25
3.5 Data Analysis ......................................................................................................... 25
3.6 Analytical Model ................................................................................................... 25
3.6.1 Tests of Significance ............................................................................... 27
CHAPTER FOUR: DATA ANALYSIS, RESULTS AND DISCUSSION .......... 28
4.1 Introduction ............................................................................................................ 28
4.2 Response Rate ........................................................................................................ 28
4.3 Descriptive Statistics .............................................................................................. 28
4.4 Correlation Analysis .............................................................................................. 29
4.5 Regression Analysis and Hypothesis Testing ........................................................ 30
4.5.1 Analysis of Variance ............................................................................... 31
4.5.2 Model of Coefficients ............................................................................. 32
4.6 Discussion of Research Findings ........................................................................... 33
CHAPTER FIVE: SUMMARY, CONCLUSION AND RECOMMENDATIONS
...................................................................................................................................... 35
5.1 Introduction ............................................................................................................ 35
5.2 Summary of Findings ............................................................................................. 35
5.3 Conclusion ............................................................................................................. 36
5.4 Recommendations .................................................................................................. 37
5.5 Limitations of the Study......................................................................................... 38
5.6 Suggestions for Further Research .......................................................................... 39
REFERENCES ........................................................................................................... 41
APPENDICES ............................................................................................................ 47
APPENDIX I: Listed Manufacturing Firms: Industrial and Allied Sector ......... 47
APPENDIX II: Secondary Data ............................................................................... 48
APPENDIX III: Logarithm of Assets was obtained using Microsoft Excel
Formula for Natural Log........................................................................................... 51
APPENDIX IV: Listed Manufacturing Firms in Kenya ........................................ 52

vii
LIST OF TABLES
Table 4.1: Descriptive Statistics .................................................................................. 29
Table 4.2: Correlation between the Study Variables ................................................... 30
Table 4.3: Model Summary ......................................................................................... 31
Table 4.4: Analysis of Variance................................................................................... 31
Table 4.5: Model of Coefficients ................................................................................. 32

viii
ABBREVIATIONS AND ACRONYMS
CAPM Capital Asset Pricing Model
DTMFI’s Deposit Taking Microfinance Institutions in Kenya
NSE Nairobi Securities Exchange
REM Random Effect Model
ROA Return on Assets
RR Related Ration
RS Specialization Ratio
UK United Kingdom
WMP World Manufacturing Production

ix
ABSTRACT
Diversification is developing as one of the most important growth strategies adopted
by firms to boost performance. Some firms that have adopted diversification strategies
have succeeded while others have failed. The study sought to determine the effect of
corporate diversification on the financial performance of listed manufacturing firms in
Kenya. To achieve this objective the study used a descriptive survey. The population
of the study constituted all the 19 listed manufacturing firms at NSE. A census
approach was used and secondary data was used for five years (2010-2014). The data
was gathered from financial statements and records. Data analysis was done using a
regression model. The study found that corporate diversification was positively
related to financial performance of listed manufacturing firms in Kenya. Growth and
firm size were found to be negatively related to financial performance of listed
manufacturing firms. The correlation results were found to be weak but moderate
between corporate diversification and financial performance of listed manufacturing
firm. The study recommends that firms should offset the risk of doing business.
Through expanding, a firm is not dependent on a limited number of products,
locations, or markets in order to survive. A company may pursue this diversification
in reaction to a change in the market. The study was conducted within a limited time
and scope. The results and the conclusion drawn in this study cannot however; be
used to make generalization of all the manufacturing firms operating in Kenya.

1
CHAPTER ONE
INTRODUCTION
1.1 Background of the Study
Corporate diversification has been significant issue in the modern business world.
This issue has an impact on firm’s financial performance. However, there is no
agreement about the negative, positive or neutral impact due to the turbulent nature of
the external environment. Mansi and Reeb (2002) indicate that firms in emerging
market may be justified to have a wider scope because market failures are more
prevalent in developing economies. Diversification provides benefits to managers that
are unavailable to investors since they stand to gain when the firm accrues better
returns from diversifying (Geringer, Tallman and Olsen, 2000).
Diversification can also lead to the problem of moral hazard, the chance that people
will alter behavior after entering into a contract as in a conflict of interest by providing
insurance for managers who have invested in firm specific skills, and have an interest
in diversifying away a certain amount of firm specific risk and may look upon
diversification as a form of compensation. Rajan, Servaes and Zingales (2000)
elucidate that diversity assists a firm to build stability, when the firm concentrates too
heavily on a single industry or product, it may risk volatility in revenue and resources
as demand rises and falls. When the business stretches across many industries or
categories, it may have more predictability. Ishak and Napier (2004) explains that a
firm that wishes to succeed in diversification may have to spread out its business
investments and costs; this may prevent the firm from putting adequate finances in
products and cash cow-sectors this is because when the firm expands it needs experts
or partners with whom to achieve success in newer, unproven areas.

2
In reference to Lins and Servaes (2001), the significance of diversification of
unrelated businesses is to mitigate the risks involved in investing in one line of
business. Strategic diversification of unrelated businesses provides a strategic fit to
gain competitive advantage, and then use competitive advantage to achieve the
desired shareholder value. The reasons for diversifying into unrelated businesses,
hinge almost exclusively on opportunities for attractive financial gains (Ishak and
Napier, 2006).
1.1.1 Corporate Diversification
Mansi and Reeb (2002) define corporate diversification as the process of a company
expanding into different areas, such as industries and product lines. Companies
typically do this in order to build the business. Delios and Beamish (1999) puts forth
that diversification can involve expanding, revitalizing, or even saving a company.
Most investment professionals agree that, although it does not guarantee against loss,
diversification is the most important component of reaching long-range financial
goals while minimizing risk.
Rajan, Servaes and Zingales (2000) maintain that investors confront two main types
of risk when investing that is systematic and unsystematic risks. Systematic risk is
also called undiversifiable risk or market risk. Undiversifiable risk is associated with
every firm. The causes of this form of risk are for example: things like inflation rates,
exchange rates, political instability, war and interest rates. Geringer and Tallman
(2000) argue that the other form of risk is diversifiable risk, this risk is also known as
unsystematic risk and it is specific to a firm, the industry, market, economy or
country; it can be reduced through diversification. The most common sources of

3
unsystematic risk are business risk and financial risk. Thus, the aim is to invest in
various assets so that they will not all be affected the same way by market events.
Mansi and Reeb (2002) outlined that corporate diversification can be categorized into
four major categories of large companies. These four major categories are namely:
single business, dominant business, related business, and unrelated business. The
categorization can be based first on the specialization ratio (Rs), which expresses the
proportion of a firm’s revenues attributable to its largest single business in a given
year and second on the related ratio (Rr), which expresses the proportion of a firm’s
revenues attributable to its largest group of related business. Specialized business
diversification means that a company is basically committed to a single business
expressed as (Rs ≥ 0.95 and Rr ≥ 0.70).
According to Doaei and Anuar (2012) dominant business diversification refers to
companies that diversified to only a limited extent from the single business (0.70 ≤ Rs
<0.95 and Rr ≥0.70). Related diversification of nonvertically diversified firms
involves expansion into businesses related to the company’s core activities (Rs <0.70
and Rr ≥ 0.70). Unrelated diversification of nonvertically diversified firms includes
entry into businesses and markets unrelated to a company’s previous activity (Rs <
0.70 and Rr < 0.70).
1.1.2 Financial Performance
Penman (2007) defines financial performance as the level of performance of a
business over a specified period of time, expressed in terms of overall profits and
losses during that time. Evaluating the financial performance of a business allows
decision-makers to judge the results of business strategies and activities in objective

4
monetary terms. A subjective measure of how well a firm can use assets from its
primary mode of business and generate revenues.
According to Penman (2007) there are many different ways to measure financial
performance, but all measures should be taken in aggregation. Some of the indicators
of financial performance are return on equity, liquidity ratios, asset management
ratios, profitability ratios, leverage ratios and market value ratios.
Petersen and Kumar (2010) note that the other financial indicators of financial
performance include: sales growth, return on investment, return on sales and earnings
per share. The popular ratios that measure organizational performance can be
summarized as profitability and growth: return on asset, return on investment, return
on equity, return on sale, revenue growth, market shares, stock price, sales growth,
liquidity and operational efficiency (Petersen and Kumar, 2010).
1.1.3 The Effect of Corporate Diversification on Financial
Performance
According to Denis, Denis and Yost (2002), theoretical arguments indicate that
corporate diversification is associated with both costs and benefits to the firm which
leads to financial performance of the firm. Potential costs of diversification include
the use of larger discretionary resources to undertake value-decreasing investments,
cross-subsidies that allow poorly performing segments to drain resources from better-
performing segments, and misalignment of incentives between central and divisional
managers. This highly contributes to financial performance of firms since the
potential benefits of operating different lines of business leads to greater operating
efficiency, fewer incentives to forgo positive net present value projects, greater debt
capacity, and lower taxes (Jensen and Murphy, 1990).

5
In reference to Jensen and Murphy (1990) corporate diversification reduces the cost of
debt; similarly aggregating business segments that have imperfectly correlated cash
flow streams reduces the variability of earnings for the combined firm. Another set of
agency-based theoretical and empirical arguments takes the opposite view: that
corporate diversification increases the agency costs of debt. Diversified firms tend to
increase significantly in size, since the level of managerial compensation is positively
correlated with firm size which enhances firm performance. Berger and Ofek (1995)
argue that larger firms become more complex, thus making monitoring harder. In
addition; cross-subsidization between divisions’ increases the firm risk and the
probability of default.
Chakrabarti et al. (2007) examined the effect of corporate diversification on
performance for some firms acting in stable period and economy shock. They did
their research in six Asian countries between 1988 and 2003. They concluded that
diversification has a negative effect on performance in more developed institutional
environments; although, in least developed environments there is an improving
performance (Brammer and Pavelin, 2006).
1.1.4 Manufacturing Firms in Kenya
Manufacturing sector makes an important contribution to the Kenyan economy and
currently employs 254,000 people, which represents 13 per cent of total employment
with an additional 1.4 million people employed in the informal side of the industry.
To keep up the pace of the changing environmental needs most manufacturing firms
in Kenya have diversified their portfolios in both related and unrelated businesses to
mitigate their financial losses that may negatively impact on their financial
performance (World Manufacturing Production, 2014).

6
Manufacturing firms often diversify into related service activities due to expected
leverage effects of existing technological expertise, customer relationships and brand
identity. Most manufacturing firms in Kenya can easily achieve synergies by
diversifying into product related services. Estrada (2002) outlines that product and
service businesses represent strategic complements that can realize a super-additive
sales synergies and sub-additive cost synergies of a reciprocal nature. Manufacturing
firms invest in service diversification that contributes to overall performance, to the
extent that more traditional economies of scope can be achieved.
Due to uncertainties and risks in the external environment, most manufacturing firms
have invested a lot in diversification in order to increase their commanding market
share. By introducing new products, exploring new regions or targeting new groups of
customers, these firms have succeeded in expanding their customer base (Forbes,
2002).These have exposed the firms to more competition, potential changes in
customer preferences. Adoption of modern technologies for example information
communication technology has made the existing technology obsolete and thus the
firms have shifted to new technologies, this however has exposed the firms to too
much cost whereas there is no guarantee that every strategy is profitable (Brammer
and Pavelin, 2006).
1.2 Research Problem
Most firms globally are now engaging in risk management in order to mitigate
financial losses which may attract huge losses to the manufacturing firms.
Diversification has received a lot of attention as one of the key strategies in risk
reduction. Daud and Salamudin (2009) explained that most firms that have diversified
their portfolios of assets perform better than organizations that invest and only rely in
one line of business. Mansi and Reeb (2002) posit that in diversification, firms are

7
more likely to manage and mitigate their risks because if one investment does not
perform the other invests is more likely to perform since they may not be facing
similar risks; in this case the firm does not suffer total loss.
In Kenya, world manufacturing production report (2014) provides that competition
in manufacturing industries creates pressures on the product margins, manufacturing
firms’ starts to differentiate by complementing and enriching their initial product
offerings with services. This attracts them to invest in unrelated lines of business in
order to mitigate risks. Lins and Servaes (2001) contends that diversification of
portfolio requires lots of plan and good effort in order to succeed in risk reduction,
most firms are diversifying their functions into services, and this has led to additional
growth in terms of revenue and profit.
Caper and Kotabe (2003), conducted a study on the effects of diversification on
financial performance on German firms in the service industry. The results of the
study showed that there was a positive relationship between diversification and
performance of German service firms. A study by Jung and Chan-Olmsted (2005) on
the relationship between related product and international diversification and financial
performance among media firms in United States concluded that, there was a positive
relationship between diversification and financial performance. Bammer et al. (2006)
investigated on the relationship between corporate social performance and
geographical diversification on a sample of UK firms. It was found that there was a
positive relationship between diversification and performance.
Maina (2013), did a study on the effect of product diversification on financial
performance of DTMFI’s. It was found that diversification of products and services
led to financial performance of deposit taking microfinance institutions. Maina (2013)

8
carried out a study on the relationship between product diversification and financial
performance of commercial banks in Kenya. It was concluded that product
diversification led to performance of commercial banks. Ongalo (2014) found that
there was an inverse relationship between diversification and corporate liquidity on
firms listed at Nairobi Securities Exchange.
This study therefore sought to determine the effect of corporate diversification on the
financial performance of listed manufacturing firms in Kenya by attempting to answer
the following question: what is the effect of corporate diversification on the financial
performance of listed manufacturing firms in Kenya?
1.3 Research Objective
To determine the effect of corporate diversification on the financial performance of
listed manufacturing firms in Kenya.
1.4 Value of the Study
The findings of the research study would be of significance to many people including
the following; manufacturing firms especially the listed ones. They will find the
findings of this study very informative in key investments decisions that lead to
diversification of service and unrelated businesses to mitigate their risk portfolio.
Financial consultants will find this research important, as it will provide information
on the significance of diversification to investors. Private practitioners such as
auditors and investment companies may use the study findings to advice firms on the
timings of diversification and how it may contribute to financial performance of the
firm.

9
The findings of this study may inform theory building. Academicians in the field of
finance and investments may find this piece of work a valuable addition to literature
especially in mitigating financial losses through corporate diversification. The study
findings and conclusions could also be used as reference point for further research.

10
CHAPTER TWO
LITERATURE REVIEW
2.1 Introduction
This section provides the theoretical framework of the study, the determinants of
financial performance, the empirical review and the summary of the literature review.
2.2 Theoretical Framework
This part covers theories that support the relationship between corporate
diversification and financial performance. The theories are namely capital asset
pricing model, portfolio diversification model of alliances and resource based theory
and corporate diversification.
2.2.1 Capital Asset Pricing Model
On the basis of mean variance rule, Sharpe (1964), Lintner (1965) developed the
capital asset pricing model (CAPM). Similarly, Treynor (1965), Sharpe (1966) and
Jensen (1968) developed the traditional performance measures based on mean
variance criterion. However, the traditional CAPM and these performance measures
are subjected to some limits, in particular those concerning the asymmetry of returns
and the risk perception of investors. Indeed, this model and these traditional
performance measures become inadequate when the returns are not normally
distributed (Harlow and Rao, 1989).
Moreover, the beta and the variance which are used as risk measures in this model do
not make distinction between the returns superior and those inferior to the mean.
According to Bawa and Lindenberg (1977), these risk measures consider them equally
undesirable, whereas the investors often associate the risk to the obtaining of returns

11
lower than the target return. In order to overcome these drawbacks, some studies
proposed the use of downside risk measures in the CAPM and in the traditional
performance measures to take into account the asymmetry of returns and the risk
perception of investors (Tobin, 1958).
The researches of Hogan and Warren (1974), contributed to the development of the
capital asset pricing models in the downside risk framework. Later Estrada (2002)
developed a new capital asset pricing model in the downside risk framework which
made it possible to overcome the drawbacks of the former models in this framework.
Indeed, Estrada (2002) detected that the cosemivariance determined by Hogan and
Warren (1974) has a limitation by proving that the co-semi variance between asset i
and the market portfolio M is different from that between the market portfolio M and
the asset i.
It was concluded that the downside beta of Estrada (2002) is more plausible than the
other downside betas, developed by Hogan and Warren (1974), Bawa and Lindenberg
(1977) and Harlow and Rao (1989), not only because it makes it possible to take into
account the asymmetry of returns not captured by traditional beta but also because it
makes it possible to overcome the problem of inequality of the co-semi variances
existing in the other downside betas.
2.2.2 Portfolio Diversification Model of Alliances
This theory was put forward by Holsti, Hopman and Sullivan (1973), the theory of
finance demonstrates that diversified investment portfolios produce superior
combinations of risk and return, and that investors may choose a portfolio reflecting
their preferred mix of risk and return. Morrow and James (1991), argue that these

12
techniques may be applied to military alliances. The rate of return and risk of an ally
follows a positive linear relationship, as predicted by capital asset pricing theory.
Morrow and James (1991) puts forth that random diversification of allies will, as with
investment portfolios, reduce the country-unique components of alliance risk toward
that which is inherent in the system as a whole. Some alliances will be more efficient
at producing greater return and lower risk. The most efficient alliances will be those
in which variations in ally effort move in opposite directions. Development of the
demand side of portfolio analysis may predict which alliances are optimal, and
therefore most likely to form. These principles are applied to the Triple Entente and
Triple Alliance between 1879 and 1914. It is suggested that the Entente had superior
efficiency characteristics and that ally choices were consistent with demand patterns.
Bennett and Scott (1997) explain that this theory provides that the basic purpose
behind forming alliances is capacity aggregation. When two or more states work
together, they become a more formidable potential fighting force. In most cases,
alliances do no perfectly coordinate military policy, but pre-war coordination and
planning allow states to fight together more effectively. While theorizing has focused
most often on the improved ability to deter attack with the promise of aid from allies
capability aggregation can be useful for advancing a variety of goals. Alfeld (1984)
and Lalman and Newman (1991) did a statistical analysis that show that most
alliances that states choose to form increase their security and should improve their
ability to deter attacks.
As in models of alliances, the assumption is that the primary benefit of alliances is
capability aggregation to form a strong force and win an attack. Specifying the goal of
an alliance activity is important in setting direction (Gibler, 1997). Gowa et al., (1993)

13
argue that the essence of this theory is the concepts of risk return. These are measured
and shown to follow a positive linear relationship for military allies as they do for
financial assets, a key prediction of the capital pricing model.
2.2.3 Resource-Based Theory and Corporate Diversification
The introduction of resource based theory in the 1980s and 1990s, along with closely
related ideas, such as distinctive competence (Hitt et al., 1997), dominant logic
(Prahalad & Bettis, 1986), and core competence (Prahalad & Hamel, 1990), offered a
unified theoretical framework for the broad corporate diversification research stream
that emphasizes the importance of firm resources.
According to Prahalad & Hamel (1990), from the perspective of resource based
theory, diversification research posits that related diversification can lead to superior
firm performance, compared to that of a focused strategy, because firms can
maximize their resources across several businesses to realize additional returns.
Operational economies of scope as afforded by related diversification facilitate a firm
to assemble a portfolio of businesses that are mutually reinforcing, as critical
resources can be shared among business units (Kor and Mahoney, 2004).
Hitt et al., (1997) argues that when viewing the benefits of diversification from this
perspective, firms with related diversification strategies can outperform those with
unrelated diversification strategies. To the extent that the key to superior performance
from a diversification strategy is contingent on the ability to share resources, a firm
that is diversified into unrelated businesses is unlikely to have resources that can be
useful for all its business units.
At the same time, it becomes challenging for the firm’s top management to manage an
increasingly diverse business portfolio. Taken together, diversification researchers

14
employing resource based theory perspective tend to suggest that levels of
diversification likely exhibit an inverted U-shaped relationship with firm performance
(Kock and Guillen, 2001). In essence, diversification research premised on resource
based theory holds that strategic interrelationships based on resource relatedness
shared by business units within the firm contribute to superior performance and thus
increase firm value to the point where resources become too complex to manage or
business units become unrelated.
One of the studies that support this theory is Kor and Mahoney (2004) who found that
related diversification improves firm performance only when it allows a business to
have preferential access to strategic assets, and any competitive advantage is
dependent on organizational structures that allow the firm’s divisions to share existing
strategic assets and to transfer the competence to build new ones efficiently.
2.3 Determinants of Financial Performance
The determinants for financial performance discussed in this study are: size of the
firm, management efficiency, use of leverage, corporate diversification and growth of
the firm.
2.3.1 Size of the Firm
Size of the firm is a key determinant of financial performance, this is because,
according to Kang and Aage (2001), size of the firm plays an important role in capital
structure, small firms are often managed by very few managers whose main objective
is to minimize the intrusion in their business and that is why internal funds will lie in
the first place of their preference of finance. If internal funds are not enough, small
firms will prefer debt to new equity mainly because debt means lower level of
intrusion and lower risk of losing control.

15
Keister (2001) emphasized that profit interacts with size; large firms are less
susceptible to bankruptcy because they tend to be more diversified than smaller
companies. Therefore, low levels of bankruptcy enable large firms to take on more
debts. The larger firms can reduce the level of information asymmetries in the market
and obtain financial resources more easy which in turns leads to financial
performance of a firm.
With reference to Kang and Aage (2001) in small firms, managers want to remain in
control of their companies because they obtain private benefit over the financial return
on their investment. They need to forgo some growth opportunities if the
opportunities are too extensive to be realized and rely more on debt. The growth of
small firms is more sensitive to internal finance than that of larger firms. Small firms
are more likely to face financial constraints; this prevents them to gain access to
finances from banks. These firms are prepared to pay higher interest rates for
additional loans and thus fail to consider issuing external equity in order to stay in
control (Lin, Ma and Xuan, 2011).
2.3.2 Management Efficiency
According to Khanna (2000) management efficiency is one of the key internal factors
that determine the financial performance of a firm. It is represented by different
financial ratios like total asset growth, loan growth rate and earnings growth rate.
Moreover, operational efficiency in managing the operating expenses is another
dimension for management quality.
Kumar (2001) contend that the performance of management is often expressed
qualitatively through subjective evaluation of management systems, organizational
discipline, control systems and quality of staff. Some financial ratios of the financial

16
statements act as a proxy for management efficiency. Management efficiency will be
measured using asset management ratios for example inventory turnover ratios which
is measured using net sales divided by inventory.
According to Kumar (2001) the capability of the management to deploy its resources
efficiently, income maximization, reducing operating costs can be measured by
financial ratios. One of these ratios used to measure management quality is operating
profit to income ratio. The higher the operating profits to total income the more the
efficient management is in terms of operational efficiency and income generation.
Keister (2001) explains that the other important ratio is expense to asset ratio. The
ratio of operating expenses to total asset is expected to be negatively associated with
profitability. Management quality in this regard, determines the level of operating
expenses and in turn affects profitability.
2.3.3 Use of Leverage
Khanna (2000) notes that leverage of the firm is a determinant of financial
performance of the firm. The firms leverage decisions centers on the allocation
between debt and equity on financing a firm. Leverage affects the level and variability
of the firm's after tax earnings and hence, the firm's overall risk and return. The study
of leverage is significant due to the following reasons: operating risk refers to the risk
of the firm not being able to cover its fixed operating costs. Since operating leverage
depends on fixed operating costs, larger fixed operating costs indicates higher degree
of operating leverage and thus, higher operating risk of the firm. High operating
leverage is good when sales are rising but risky when the sales are falling.
Kumar (2001) puts forward that total assets and sale turnover are commonly used as a
substitute for the size of the firm. Larger firms not only enjoy a higher turnover and

17
but also generate higher income. This is because they have better access to capital
markets and lower cost of borrowing. Large firms are more likely to manage their
working capitals more efficiently than small firms. Most large firms enjoy economies
of scale and thus they are able to minimize their costs and improve on the profitability
of the firm.
2.3.4 Corporate Diversification
Doaei, Anuar and Hamid (2012) argue that corporate diversification is a technique
that reduces risk by allocating investments among various financial instruments,
industries and other categories. It aims to maximize return by investing in different
areas that would each react differently to the same event. There are two primary types
of corporate diversification: related or unrelated. If the company consists of an
overarching structure that supports all of its different businesses, then it is engaging in
related diversification. When a company consists of a series of individual businesses
that do not share things such as customers and distribution channels then it has
unrelated diversification.
According to Daud, Salamudin and Ahmad (2009) the process of corporate
diversification often involves expanding the offerings of a business by entering a new
market. A company may do this because it is nearing market saturation with its
current product line. It may also diversify because public demand for its primary
product has declined.
Some companies will undergo product diversification solely to expand the business.
This process may also be called product diversification. Corporate diversification that
takes place in different locations is also referred to as geographic market
diversification. This is when the company is only expanding locations. It does not

18
involve the service or product the company offers. This kind of diversification is often
used for the growth of a thriving business, and particularly when the company reaches
local market saturation (Dennis et al., 2002).
2.3.5 Growth of the Firm
As the firms grow, their requirement of finance tends to increase. The capacity to
finance the increasing demand depends on internal finance. According to Robert and
Barro (2002) if a firm entirely relies on internal fund, then the growth may be
restricted. Managers may forgo some profitable projects. If a firm goes for external
finance, then chances of risk increases. Levine and Robert (2001) argue that firms
with growth potential will tend to have less capital structure.
Growth opportunities can produce moral hazard effects and push firms to take more
risk. In order to mitigate this problem, growth opportunities should be financed with
equity instead of debt. Levine and Robert (2001) indicated that a negative relationship
exists between debt and growth opportunities. Financing of firms using debt may
inhibit growth and expansion of business due to high interests involved in serving the
loan. The firm might end up using all its resources in financing the loan in the short-
term and thus negatively affect the long term objectives of the firm.
2.3.6 Product Diversification
Qian and Qian (2008) posit that a product diversification strategy is a form of
business development. Small businesses that implement the strategy can diversify
their product range by modifying existing products or adding new products to the
range. The strategy provides opportunities to grow the business by increasing sales to
existing customers or entering new markets.

19
Product diversification is the process of expanding business opportunities through
additional market potential of an existing product. Diversification may be achieved by
entering into additional markets and pricing strategies. Often the product may be
improved, altered or changed, or new marketing activities are developed. The
planning process includes market research, product adaptation analysis and legal
review (Delios and Beamish, 1999).
As observed by Siggelkow (2003) intra-industry product diversification may
positively affect firm performance with additional demands created by providing
assortments that maintain more options and reduce customers’ shopping costs. He
also found that the degree of product concentration positively relates to profitability.
It offers an option for customer to choose from among the products offered. This
minimizes the risks of stock out costs since customers have can have substitute
products. This contributes to improved sales and profitability of the firm.
2.4 Empirical Review
Ongalo (2014) tested the relationship between unrelated diversification and corporate
liquidity of 61 firms listed at NSE. He adopted a descriptive research design to show
the relationship between the variables using secondary data for five years. The data
was analyzed using a regression model and the results of the analysis showed that
there was an inverse relationship between diversification and corporate liquidity of
listed firms at NSE.
Arasa (2014) studied the effect of the diversification strategy on the performance of
Kenya Commercial Bank group. Both primary and secondary data were collected by
the researcher. Primary data was successfully collected from five senior managers of
the bank, whereas secondary data was collected from the audited financial reports of

20
Kenya Commercial Bank group limited. The study took the form of a case study of
KCB group. Trend and content analysis were used to establish the effect of
diversification on performance. The findings revealed that Kenya Commercial Bank
group has adopted three main diversification strategies. It was concluded that as the
income from diversification increases, the total profits of the banks also registered
significant increment.
Maina (2013) determined the relationship between diversification of products and
services and financial performance of Deposit Taking Microfinance institutions. The
population of the study involved all the nine deposit taking microfinance institutions
in Kenya. The study used descriptive research design; secondary data for five years
was used since the nature of the study was quantitative in nature. The data was
analyzed using a multiple regression model and the results of the analysis concluded
that there was a positive relationship between diversification of products and services
and financial performance of deposit taking microfinance institutions.
Maina (2013) established the level of income source diversification of the 43 licensed
commercial banks in Kenya”. The study used a descriptive research design to test the
association between the variables. Secondary data for five years was used and the data
was analyzed using a multiple regression model. The findings revealed that product
diversification among Kenyan commercial banks exhibited a positive relationship
with performance.
Karanja (2013) did a study on the diversification strategy and the performance of
Kenolkobil limited in Kenya. The study was done using a case study design and the
object of the case study was KenolKobil Ltd. Data was collected from both primary
and secondary sources. The primary source was an interview with senior management

21
and secondary source was obtained from published information on Kenol Kobil. The
data was analyzed using content analysis and discussed to determine the
diversification strategy adopted by Kenol Kobil and its performance. The findings
were summarized and presented in this research project. It has been established that
the firm adopted related, unrelated and multinational diversification strategies. The
study also established that this diversification has increased the sales, net profits and
shareholder equity of Kenol Kobil.
Chen and Yu (2011) examined the relationship between corporate diversification and
financial performance 98 firms listed on the Taiwan Stock Exchange. An exploratory
study was used to establish the relationship between the variables. Secondary data
was used from 2001 to 2005. A multiple regression model was adopted for data
analysis and the results of the analysis showed a positive relationship between
corporate diversification and financial performance of the listed firms. It was further
concluded that firms that engaged in unrelated diversification outperformed those that
engaged in related diversification.
Daud, Salamudin and Ahmad (2009) examined diversification and performance of 70
Malaysian firms using secondary data from years 1999 to 2003. The study adopted a
descriptive design to show the association between the variables. The study used a
regression model for data analysis: the independent variable was number of
diversified segments, the dependent variables were ROA and market measure and the
control variables were risk, size, inflation and leverage. The results showed that there
was a positive relationship between corporate diversification and financial
performance of firms.

22
Bammer et al. (2006) investigated between corporate social performance and
geographical diversification on a sample of large UK firms. The sample size consisted
of 50 UK firms from commercial and services sector. An explorative survey was used
to test the relationship between the variables, the results of the study found a positive
correlation between diversification and performance in UK firms.
A study by Jung and Chan-Olmsted (2005) found out a positive relation between
related product and international diversification and financial performance among 100
media firms in United States. The study used a longitudinal study. Secondary data for
10 years was used and a multiple regression model was used for analysis. It was
concluded that the more related product and international diversification, the more the
financial performance.
Caper and Kotabe (2003) conducted a study on the effects of diversification on
financial performance on German firms in the service industry. A descriptive research
design was used and the used random effect model (REM) for generalized least
squares (GLS) estimation model. Secondary data was used from 2001 to 2005 and
analysis was done using a multiple regression model. The results of the study
concluded that there was a positive relationship between a curvilinear relationship
between multinationality and performance in German service firms.

23
2.5 Summary of the Literature Review
From the literature review, the empirical studies and theories show a positive
relationship between diversification and financial performance of firms locally and
internationally. This has been supported by a number of studies: (Chen and Yu, 2011)
and (Daud, Salamudin and Ahmad, 2009). Local studies by Maina (2012) and Maina
(2013) also established that diversification of products and services led to financial
performance in the finance sector in Kenya.
With reference to the above theories: (portfolio diversification model of alliances,
capital asset pricing model and resource-based theory and corporate diversification),
firms diversify their businesses to mitigate the level of risks and boost performance.
This is consistent with both global and local empirical studies: Daud et al., (2009),
Bammer et al., (2006), Arasa (2014) and Maina (2013). This is also coherent with the
hypothesis of this study which predicts a positive relationship between corporate
diversification and financial performance of listed manufacturing firms in Kenya.
From the above review, these studies have not investigated the relationship between
corporate diversification and financial performance of manufacturing firms in Kenya.
Therefore this study seeks to fill this gap by seeking an answer to the following
research question: what is the effect of corporate diversification on financial
performance of listed manufacturing firms in Kenya?

24
CHAPTER THREE
RESEARCH METHODOLOGY
3.1 Introduction
This chapter discusses the methodology that was used for this study. It gives a plan on
how data was collected, the tools and instruments that was used as well as how data
was analyzed.
3.2 Research Design
This study used a descriptive survey. This is because descriptive studies are
conducted to demonstrate associations or relationships between two variables.
According to Mitchell and Jolley (2013) descriptive research is used to obtain
information concerning the current status of the phenomena to describe what exists
with respect to variables or conditions in a situation. The methods involved ranged
from the survey which describes the status quo, the correlation study which
investigates the relationship between variables, to developmental studies which seek
to determine changes over time.
3.3 Population
The population of the study consisted of all the 19 listed manufacturing firms in
Kenya. Kothari (2004) defines a population as a well-defined collection of individuals
or objects known to have similar characteristics. All individuals or objects within a
certain population usually have a common, binding characteristic or trait. With
reference to the Kenya Association of Manufacturers (KAM, 2014) there are 19
manufacturing firms licensed to work and operates in Kenya. A census approach was
used.

25
3.4 Data Collection
The study used secondary data since the nature is quantitative. Data collection is
gathering empirical evidence in order to gain new insights about a situation and
answer questions that prompt undertaking of the research (Kothari, 2004). The
secondary data was collected from consolidated financial statements. Nairobi
Securities Exchange hand books of years 2013-2014 and 2014-2015 were used.
Secondary data for five years (2010-2014) was gathered from financial statements and
records for analysis. The study utilized 75 data points (observations) that were
obtained by multiplying the period of five years with 15 listed manufacturing firms in
Kenya. This period was sufficient for determining the extent to which corporate
diversification affects financial performance of listed manufacturing firms in Kenya.
3.5 Data Analysis
According to Mugenda and Mugenda (2005) data collected should be cleaned, sorted,
coded and analyzed in order to obtain a meaningful report. The data collected was
cleaned, sorted and coded and organized before capturing it in Statistical Packages for
Social Sciences (SPSS) for analysis. The main variables in the study were financial
performance which was the dependent variable; it was measured using net income
divided by total assets. Corporate diversification was measured using diversification
index. This was achieved through adopting Herfindahi Hirschmann Index (HHI)
advanced by (Maina, 2013) as indicated below.
3.6 Analytical Model
To achieve the objective of this study, the researcher used a multiple regression model
to determine the effect of corporate diversification on financial performance of listed
manufacturing firms in Kenya.
26
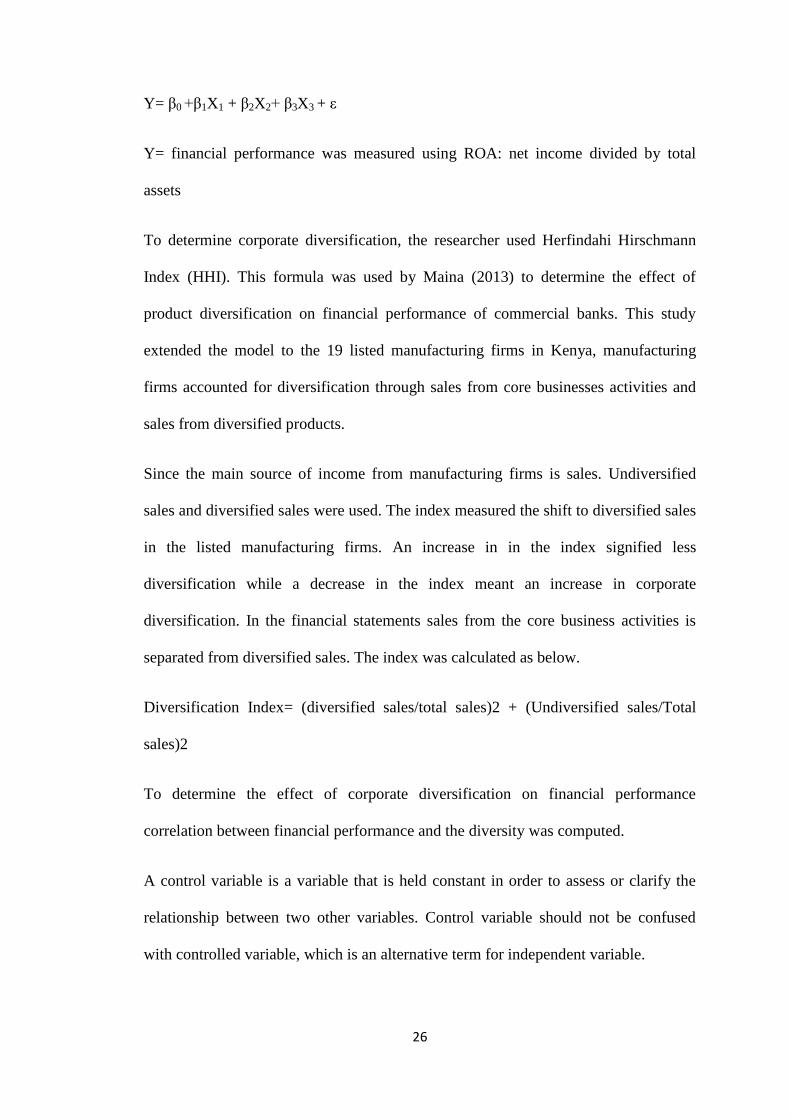
Y= β0 +β1X1 + β2X2+ β3X3 + ε
Y= financial performance was measured using ROA: net income divided by total
assets
To determine corporate diversification, the researcher used Herfindahi Hirschmann
Index (HHI). This formula was used by Maina (2013) to determine the effect of
product diversification on financial performance of commercial banks. This study
extended the model to the 19 listed manufacturing firms in Kenya, manufacturing
firms accounted for diversification through sales from core businesses activities and
sales from diversified products.
Since the main source of income from manufacturing firms is sales. Undiversified
sales and diversified sales were used. The index measured the shift to diversified sales
in the listed manufacturing firms. An increase in in the index signified less
diversification while a decrease in the index meant an increase in corporate
diversification. In the financial statements sales from the core business activities is
separated from diversified sales. The index was calculated as below.
Diversification Index= (diversified sales/total sales)2 + (Undiversified sales/Total
sales)2
To determine the effect of corporate diversification on financial performance
correlation between financial performance and the diversity was computed.
A control variable is a variable that is held constant in order to assess or clarify the
relationship between two other variables. Control variable should not be confused
with controlled variable, which is an alternative term for independent variable.

27
X2 = Size of the firm was measured using natural logarithm of total assets (fixed
assets plus current assets).
X3= Growth of the firm was measured using net assets. This was computed using total
assets minus total liabilities.
b= Slope of the regression, it was used to measure the unit change in Y linked with a
unit change in X
ε =is the error term within a confidence interval of 5%
3.6.1 Tests of Significance
From the empirical evidence and the theories, it is evident that there existed a positive
relationship between corporate diversification and financial performance. Therefore,
the alternative hypothesis was assumed that there existed a relationship between
corporate diversification and financial performance of listed manufacturing firms in
Kenya. The study considered a one-tail test, if the p-value was less than 5% then the
alternative hypothesis was true since this meant that there was a positive relationship
between the variables and the opposite was true. The tests were performed at 95%
degree of confidence.

28
CHAPTER FOUR
DATA ANALYSIS, RESULTS AND DISCUSSION
4.1 Introduction
This chapter consists of data analysis and findings as provided in the research
objective and research methodology. The results are presented in tables. The study
used secondary data that was obtained from financial statements of listed
manufacturing firms in Nairobi Securities Exchange. The study sought to collect data
from 19 listed manufacturing firms at the Nairobi Securities Exchange.
The researcher managed to collect secondary data from all the 19 listed manufacturing
firms in a period of five years between 2010 – 2014 (See Appendix, II and III). With
the help of: Herfindahi Hirschmann Index (HHI) product diversification was based on
split up sales of listed manufacturing companies under the following categories single
business (SB), dominant business (DB), related business (RB) and unrelated business
(UB).
4.2 Response Rate
The researcher managed to collect secondary data from 15 listed manufacturing
companies. This represents an estimated 80% response rate which was considered
sufficient for making generalization on all the listed manufacturing firms in Kenya.
4.3 Descriptive Statistics
Descriptive statistics was used to show the summary of the analyzed data on the
relationship between corporate diversification and financial performance of listed
manufacturing firms in Kenya. The results are presented in table 4.1 below:
29
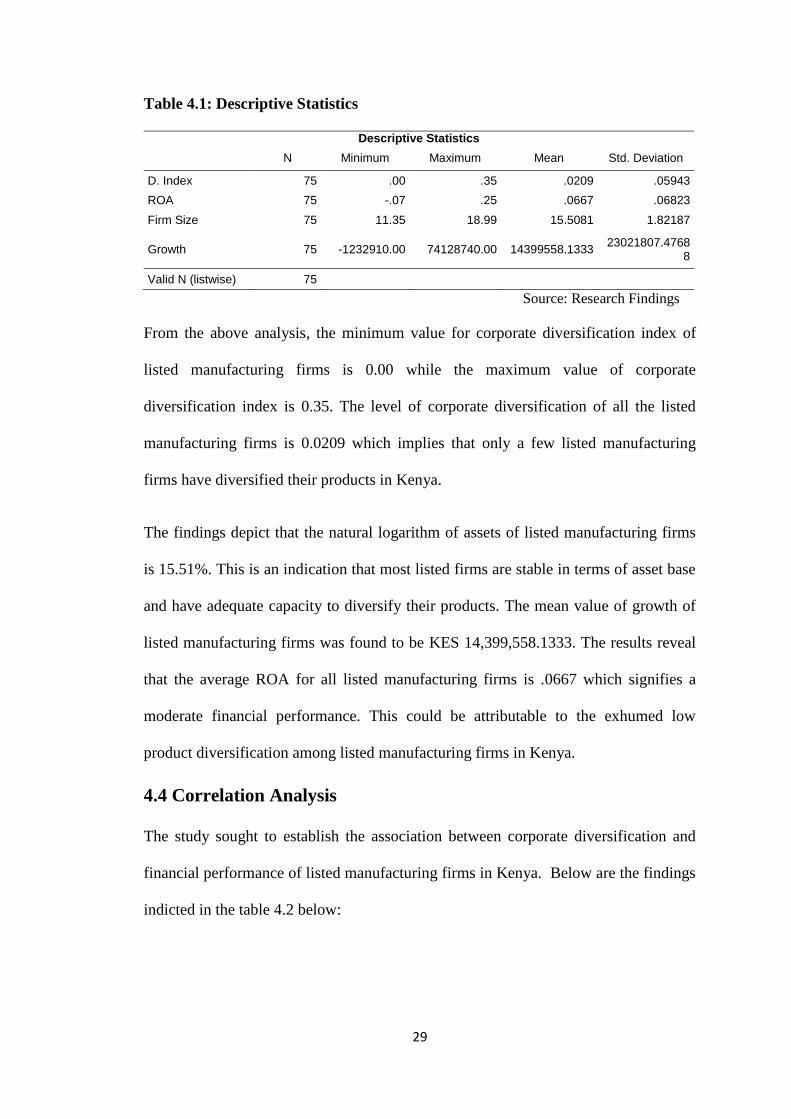
Table 4.1: Descriptive Statistics
Descriptive Statistics
N Minimum Maximum Mean Std. Deviation
D. Index 75 .00 .35 .0209 .05943
ROA 75 -.07 .25 .0667 .06823
Firm Size 75 11.35 18.99 15.5081 1.82187
Growth 75 -1232910.00 74128740.00 14399558.1333 23021807.4768
8
Valid N (listwise) 75
Source: Research Findings
From the above analysis, the minimum value for corporate diversification index of
listed manufacturing firms is 0.00 while the maximum value of corporate
diversification index is 0.35. The level of corporate diversification of all the listed
manufacturing firms is 0.0209 which implies that only a few listed manufacturing
firms have diversified their products in Kenya.
The findings depict that the natural logarithm of assets of listed manufacturing firms
is 15.51%. This is an indication that most listed firms are stable in terms of asset base
and have adequate capacity to diversify their products. The mean value of growth of
listed manufacturing firms was found to be KES 14,399,558.1333. The results reveal
that the average ROA for all listed manufacturing firms is .0667 which signifies a
moderate financial performance. This could be attributable to the exhumed low
product diversification among listed manufacturing firms in Kenya.
4.4 Correlation Analysis
The study sought to establish the association between corporate diversification and
financial performance of listed manufacturing firms in Kenya. Below are the findings
indicted in the table 4.2 below:

30
Table 4.2: Correlation between the Study Variables
ROA Diversification
index
Firm Size Growth
ROA 1
Diversification
index
.366 1
Firm Size -.354 -.109 1
Growth -.239 -.048 .917 1
Source: Research Findings
The strength of the association between the variables was propounded by Pearson
correlation scale where the values between 0.0 to 0.3 indicate that there is no
correlation regardless of the sign, between 0.31 to 0.5 shows a weak correlation,
between 0.51 to 0.7 a moderate correlation and between 0.71 to 1.0 indicates that
there is a strong correlation between the variables. This type of inference has also
been applied by other previous works such as Jayakumar (2002).
From the above findings, the study found a weak positive correlation between
corporate diversification and financial performance of listed manufacturing firm as
follows R=0.366. Similarly, there was a weak positive relationship between firm size
and financial performance of listed manufacturing firms. The correlation was found to
be R=-.354. Further there was no correlation between growth of the firm and financial
performance of manufacturing firms. The result was as follows R=-.239.
4.5 Regression Analysis and Hypothesis Testing
Regression analysis was used to determine the extent to which the independent
variables contributed to the dependent variable. A linear regression model was used
and the results are presented in the table 4.3 below.

31
Table 4.3: Model Summary
Model Summary
Model R R Square Adjusted R
Square
Std. Error of the Estimate
1 .513a .264 .233 .05978
a. Predictors: (Constant), Firm Size, D. Index, Growth
source: research findings
From the above findings, R represents multiple correlation which shows that there is a
moderate correlation between the variables as follows R=.513. The coefficient of
determination which is represented by R 2 is 26.4%. This shows that the extent to
which the variance in the dependent variable which is financial performance can be
explained by the independent variables. This means that the model is partially a
reliable predictor.
4.5.1 Analysis of Variance
To test the goodness of fit for the analysis, a regression model was used for this
purpose and the results are provided in the table 4.4 below.
Table 4.4: Analysis of Variance
ANOVAa
Model Sum of Squares df Mean Square F Sig.
1
Regression .091 3 .030 8.473 .000b
Residual .254 71 .004
Total .345 74
a. Dependent Variable: ROA
b. Predictors: (Constant), Firm Size, D. Index, Growth source: research findings
From the above findings, the p-value of 0.000 is a clear indication that the regression
model is statistically significant in predicting the relationship between corporate
diversification and financial performance of manufacturing firms.
32
4.5.2 Model of Coefficients
The study intended to test the coefficient to define the direction of the relationship
(positive or negative) between the corporate diversification and financial performance
of listed manufacturing firms in Kenya. The results are provided in the table 4.5
below:
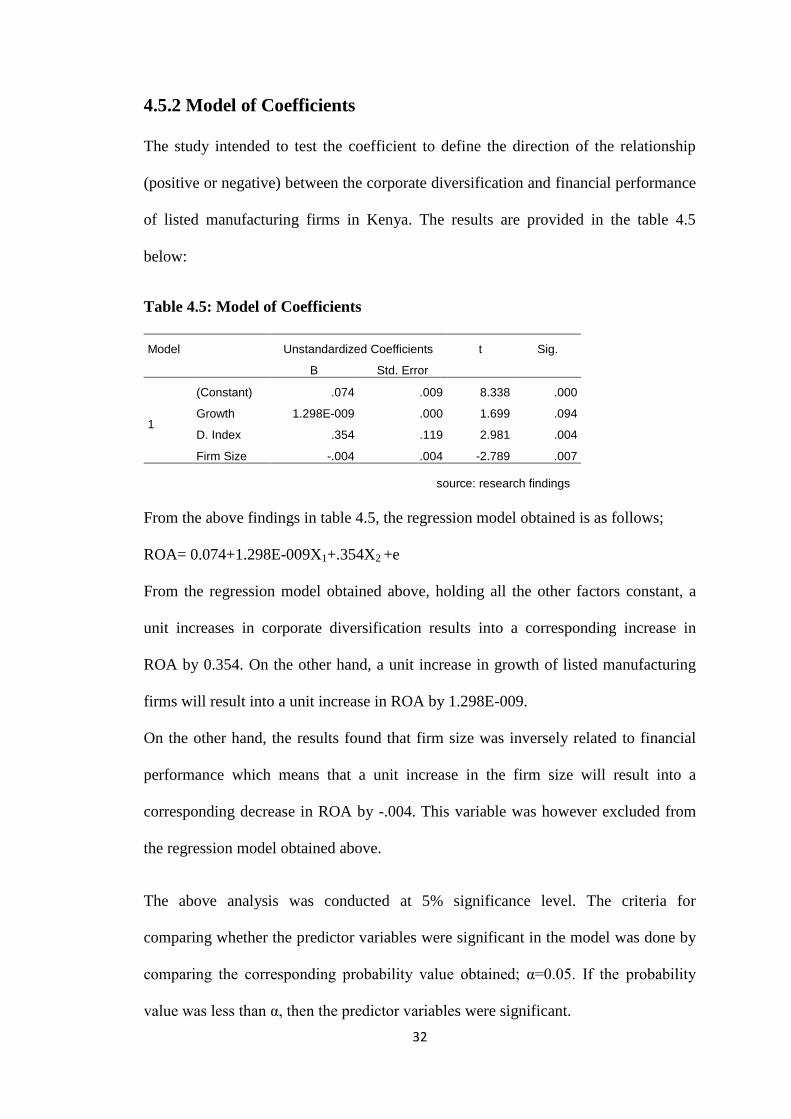
Table 4.5: Model of Coefficients
Model Unstandardized Coefficients t Sig.
B Std. Error
1
(Constant) .074 .009 8.338 .000
Growth 1.298E-009 .000 1.699 .094
D. Index .354 .119 2.981 .004
Firm Size -.004 .004 -2.789 .007
source: research findings
From the above findings in table 4.5, the regression model obtained is as follows;
ROA= 0.074+1.298E-009X1+.354X2 +e
From the regression model obtained above, holding all the other factors constant, a
unit increases in corporate diversification results into a corresponding increase in
ROA by 0.354. On the other hand, a unit increase in growth of listed manufacturing
firms will result into a unit increase in ROA by 1.298E-009.
On the other hand, the results found that firm size was inversely related to financial
performance which means that a unit increase in the firm size will result into a
corresponding decrease in ROA by -.004. This variable was however excluded from
the regression model obtained above.
The above analysis was conducted at 5% significance level. The criteria for
comparing whether the predictor variables were significant in the model was done by
comparing the corresponding probability value obtained; α=0.05. If the probability
value was less than α, then the predictor variables were significant.
33
From the model of coefficients, corporate diversification and firm size were found to
be statistically significant in the model. This is because their probability values were
lower than 5%. The results were as follows p=0.004 and P=0.007 respectively. These
findings are consistent with the hypothesis of the study which predicts a positive
relationship between corporate diversification and financial performance of listed
manufacturing firms in Kenya.
Further, it was observed that growth of listed manufacturing firms was statistically
insignificant this is because its probability value was more than 5%, p=0.094. These
findings contradict with the hypothesis of this study which predicted a statistically
significant relationship between corporate diversification and financial performance
of listed manufacturing firms in Kenya.
4.6 Discussion of Research Findings
From the above findings, descriptive results reveal that a few listed manufacturing
firms have diversified their products in the Kenyan market. This was proved by the
mean value of corporate diversification index which was 0.0209.
The correlation results found that there a moderate correlation between corporate
diversification and financial performance of listed manufacturing firms. These
findings are consistent to the findings by Daud, Salamudin and Ahmad (2009) who
found that there was a positive and moderate relationship between corporate
diversification and financial performance of Malaysian firms.
The regression results in table 4.5 above have concluded that there exists a positive
relationship between corporate diversification and financial performance of listed
manufacturing firms in Kenya. These findings are consistent with the findings by

34
Maina (2013), who examined the relationship between diversification of products and
services and financial performance of Deposit Taking Microfinance institutions. The
results concluded that there was a positive relationship between diversification of
products and services and financial performance of deposit taking microfinance
institutions. These findings are also supported by Maina (2013) who did a study on
the relationship between product diversification and financial performance of
commercial banks in Kenya; he found that there was positive relationship between
product diversification and financial performance of commercial banks in Kenya.

35
CHAPTER FIVE
SUMMARY, CONCLUSION AND RECOMMENDATIONS
5.1 Introduction
This chapter gives the results and discussions drawn from the analysis presented in
chapter four. The chapter is structured into summary of findings, conclusions,
limitations, recommendations and areas for further research.
5.2 Summary of Findings
The analysis has been done in line with the objective of the study which was to
establish the relationship between corporate diversification and financial performance
of listed manufacturing firms in Kenya. From the descriptive results, it was found that
a few listed manufacturing firms had diversified their products. The mean value of
listed manufacturing firms that had diversified their products was 0.0209. This mean
value shows that the level of corporate diversification is moderate. The findings
revealed that the average size of listed manufacturing firms was 15.51%. This was an
indication that most listed manufacturing firms are stable in terms of asset base and
had adequate capacity to diversify their products and mitigate risks. The financial
performance of listed manufacturing firms was found to 6.7% which is a moderate
performance.
The results found that that there was a weak positive correlation between corporate
diversification and financial performance of listed manufacturing firm as follows
R=0.366. These findings are consistent with a study by Bammer et al. (2006) who
found a positive correlation between diversification and performance in UK firms.

36
Firm size and financial performance was found to have a weak positive relationship
which was represented by R= -.354. There was no relationship between growth of the
firm and financial performance of manufacturing firms. The result was as follows R=-
.239. These findings conform to a study Karanja (2013) on the diversification strategy
and the performance of Kenolkobil limited in Kenya. Although he found a positive
relationship between diversification strategy and the performance of Kenolkobil
limited in Kenya, there was no statistical relationship between growth and financial
performance.
From the model of coefficients, corporate diversification was found to be statistically
significant in the model. This is because its p-value was lower than 5%. The results
were as follows p=0.004. These finding are consistent with the hypothesis of the study
which predicts a positive relationship between corporate diversification and financial
performance of listed manufacturing firms in Kenya. These findings are consistent
with Chen and Yu (2011) who found a positive relationship between corporate
diversification and financial performance of the listed firms. Further, it was observed
that firm size and growth of listed manufacturing firms were statistically insignificant.
The results obtained were as follows p=0.007 and p=0.094. These findings contradict
with the hypothesis of this study which predicted a statistically significant relationship
between corporate diversification and financial performance of listed manufacturing
firms in Kenya.
5.3 Conclusion
The results of the descriptive statistics shows that listed firms have the potential and
the capacity to diversify their products although the uptake for product
diversifications among the listed manufacturing firms is still low.

37
The correlation findings concluded that corporate diversification is weak but
positively related to financial performance of listed manufacturing firms in Kenya.
The study therefore puts more emphasis on corporate diversification to boost financial
performance of listed manufacturing firms.
The regression results conclude also concludes that that there is a statistically
significant relationship between corporate diversification and financial performance
of listed manufacturing firms in Kenya. This was proved by the probability value of
corporate diversification which was found to be less than 5%. Even though firm size
and growth variables showed an insignificant relationship with financial performance,
corporate diversification and financial performance were considered because they are
the two main variables of this study.
5.4 Recommendations
From the above findings in table 4.5, the regression results have found that firm size
and growth of the firm were statistically insignificant. This could have been as a result
of low product diversification among listed manufacturing firms. The study therefore
recommends that policy makers like capital markets authority to promote policies that
encourage listed firms to practice product diversification to mitigate their financial
losses and boost their profitability.
From the above findings in table 4.2, the results concluded that there was a positive
moderate correlation between corporate diversification and financial performance.
The study recommends that listed manufacturing firms should increase their level of
corporate diversification to build stability other than concentrating on a single
industry or product. This will enhance their predictability about the future and thus
boost their financial strengths through making profitable investments decisions.

38
The study recommends the need for corporate diversification by most firms to offset
the risk of doing business. Through expanding, a firm is not dependent on a limited
number of products, locations, or markets in order to survive. A company may pursue
corporate diversification in reaction to a change in the market to create a buffer for
uncontrollable risks.
The study recommends that when choosing diversification strategies; firms should
look at their current customer base to determine if they can sell them different items
or if you can add new customers by selling them a similar product at a different price
or under a different name. Review your current suppliers, sales reps and distribution
partners to determine if you can use them to sell different products, reducing your
start-up costs.
5.5 Limitations of the Study
One of the limitations that the researcher faced during data collection was accessing
the secondary data from Nairobi Securities Exchange. Obtaining the values of
corporate diversification index was not easy; some listed manufacturing firms
practiced product diversification while others did not. The researcher had to look for
someone who works with NSE to assist in data collection.
The study was conducted within a limited time and scope. This forced the researcher
to study 19 listed manufacturing firms in Kenya in order to have adequate time to
produce quality research work that is more accurate. The results and the conclusion
drawn in this study cannot however; be used to make generalization of all the
manufacturing firms operating in Kenya.
The other limitation faced by the researcher was lack of adequate time to do the
project. The researcher had to work through the night to beat the deadline for defense
39
and project submission date for review by external examiners. This however was not
easy balancing school, family and employment. I had to go out of my way to create
extra time to learn and perfect my skills on APA style of writing and researching
using electronic journals.
The study utilized secondary sources of data for a period of five years (2010-2014).
This data is historical in nature and might not necessary reflect the actual needs of the
researcher this might have affected the validity and reliability of data and thus impact
negatively on the findings obtained.
The study was limited to four variables only. These variables are corporate
diversification, financial performance, firm size and growth. There are other macro-
economic variables that could affect the relationship between corporate diversification
and financial performance of listed manufacturing firms in Kenya. It is advisable for
future researchers to consider incorporating other variables and determine whether the
results are consistent.
5.6 Suggestions for Further Research
A study should be carried out on the effect of corporate diversification on the
financial performance in other lines other than product diversification. Examples
would be investments in terms of percentage of shareholding or even assets. This
would provide a wide range of parameters to investigate and establish relationships.
Areas of commonalities or unique factors can then be identified.
The study limited itself to a sample of 19 listed manufacturing firms, therefore the
findings, conclusions and recommendations drawn from this study cannot be used to
make generalizations for all the manufacturing firms in Kenya Therefore, future

40
researchers should conduct a study on the effect of corporate diversification on the
financial performance of manufacturing firms in Kenya other than the listed ones.
A similar study can be carried out to establish whether corporate diversification
impacts on financial performance of manufacturing firms in the East Africa region.
This will enable the researcher to do a comparison of the findings and provide
concrete facts upon which reliable conclusions can be drawn.

41
REFERENCES
Arasa, O. (2014). Diversification strategy and performance of Kenya commercial
bank group, Unpublished Project, University of Nairobi
Bawa, V. & E. Lindenberg (1977). Capital market equilibrium in a mean-lower partial
moment framework, Journal of Financial Economics, 5, 2, 189–200.
Bennett, D. & Scott, M. (1997). Testing alternative models of alliance duration, 1816-
1984, American Journal of Political Science, 41, 846-878.
Brammer, J. & Pavelin, S. (2006). Corporate social performance and geographical
diversification, Journal of Business Research, 59, 9, 1025-1034
Capar, N. & Kotabe, M. (2003). The relationship between international
diversification and performance in service firms. Journal of International
Business Studies, 34, 4, 345-355.
Chakrabarti, A., Singh, K. & Mahmood, I. (2007). Diversification and performance:
evidence from East Asian firms, Strategic Management Journal, 28, 2, 101-
120.
Chen, J. & Yu, J. (2011). Managerial ownership, diversification, and firm
performance: evidence from an emerging market. International Business
Review, 2, 1-4
Daud, W., Salamudin, N. & Ahmad, I. (2009). Corporate diversification performance,
Strategic Management Journal, 2, 1, 01-18.
Delios, A. & Beamish, W. (1999). Geographic scope, product diversification and the
corporate performance of Japanese firms. Strategic Management Journal,
20,8,711-727.
Denis, D., Denis, D. & Yost, K. (2002). Global diversification, industrial
diversification, and firm value. The Journal of Finance, 57, 5, 51-79.
Doaei, M., Anuar, A. & Hamid, A. (2012). Corporate diversification and financial
performance: A review of literature, Asian Journal of Finance and
Accounting, 4, 2, 56-74.

42
Estrada, J. (2002). Systematic Risk in Emerging Markets, Emerging Markets Review,
3(4), 365–79.
Forbes, K.J. (2002). How do large depreciations affect firm performance, Palgrave
Macmillan Review, 49, 1, 214-238
Geringer, J., Tallman, S. & Olsen, D. (2000). Product and international diversification
among Japanese multinational firms, Strategic Management Journal, 21,1, 51-
80.
Gibler, M. (1997). Control the issues, control the conflict: the effects of alliances that
settle territorial issues on interstate rivalries. International Interactions 22,
341-368.
Gowa, J. Edward, D. & Mansfield. (1993). Power politics and international trade,
American Political Science Review, 8, 7, 408-420.
Harlow, V. & Rao, R. (1989). Asset pricing in a generalized mean-lower partial
moment framework: theory and evidence, Journal of Financial and
Quantitative Analysis, 24, 3, 285–311.
Hitt, A., Hoskisson, R. & Kim, H. (1997). International diversification: effects on
innovation and firm performance in product-diversified firms, Academy of
Management Journal, 40, 767-798.
Hogan, W. & Warren, J. (1974). Toward the development of an equilibrium capital
market model based on semi-variances, Journal of Financial and Quantitative
Analysis, 9(1), 1–11
Holsti, P. Hopman, T. & Sullivan, D. (1973). Unity and disintegration in
international alliances: comparative studies. New York: John Wiley and
Sons.
Hugo, W. (2013). Effects of income source diversification on financial performance
of commercial banks in Kenya, Unpublished MBA Project, University of
Nairobi
43
Ishak, Z. & Napier, C. (2004). Corporate ultimate ownership and corporate
diversification in Malaysia. The Fourth Asia Pacific Interdisciplinary
Research in Accounting Conference, Singapore.
Ishak, Z. & Napier, C. (2006). Expropriation of minority interests and corporate
diversification in Malaysia. Asian Academy of Management Journal of
Accounting and Finance, 2, 1, 85-113.
Jayakumar, D.S . (2002). Sampling Distribution of Sample coefficient, Bi-variate
sample correlation coefficient, Journal of International Research, 1, 21-4
Jensen, M. (1968). The performance of mutual funds in the period 1945–1964,
Journal of Finance, 23, 2, 389–416.
KAM. (2014). Kenya association of manufacturers, accessed from
http://www.kam.co.ke/
Kang, D. L. & Aage, B. S. (2001). Ownership organization and firm performance;
Annual Review of Sociology; 25,121-144.
Karanja, G. (2013). Diversification Strategy and the Performance of Kenolkobil
Limited in Kenya, Unpublished Project, University of Nairobi
Keister, L. A. (2001). Engineering growth: business group structure and firm
performance in China’s transition economy; American Journal of Sociology;
104, 2, 404-440.
Khanna, S. (2000). Financial reforms and industrial sector in India; Economic and
Political Weekly, November 6, 3231-3241.
Kock, C. J. & Guillen, M. F. (2001). Strategy and structure in developing countries:
Business groups as an evolutionary response to opportunities for unrelated
diversification, Industrial and Corporate Change, 10, 77-113.
Kor, Y. & Mahoney, J. (2004). Edith Penrose’s contributions to the resource-based
view of strategic management, Journal of Management Studies, 41,183-191.
Kothari, R. (2004). Research Methodology: Methods and techniques. New Delhi: Age
publishers.

44
Kumar, K. R. (2001). Diversified groups failed in generating value in India too;
Paper presented at the 4th strategic management forum, Indian Institute of
Management Ahmedabad,24-26.
Kumar, K.R. (2001). Financial performance and diversification strategy of Indian
business groups; Indian institute of management Calcutta; Unpublished
Doctoral Dissertation; March 2001.
Levine, R. & Robert, J. B. (2001). Determinants of economic growth: a cross-country
empirical study, Journal of Comparative Economics, Elsevier, 26, 4, 822-824
Lin, C. Ma, Y. & Xuan, Y (2011). Ownership structure and financial constraints:
Evidence from a Structural Estimation, Finance and Economics Journal,
102,416-431.
Lins, K. & Servaes, H. (2001). International evidence on the value of corporate
diversification, Journal of Finance 54, 2215–2239.
Lins, K. & Servaes, H. (2002). Corporate diversification beneficial in emerging
markets, Financial Management 31, 5–31.
Lintner, J. (1965). The valuation of risk assets and the selection of risky investments
in stock portfolios and capital budgets, Review of Economics and Statistics,
47, 13-37.
Maina, K. (2013). The effect of product diversification on the financial performance
of micro finance companies in Kenya, Unpublished MBA Project, University
of Nairobi
Maina, W. (2013). The relationship between product diversification and financial
performance of commercial banks in Kenya, Unpublished MBA Project,
University of Nairobi
Mansi, S.A. & Reeb, D.M. (2002). Corporate diversification: Journal of Finance, 57,
2167–2183.
Mitchell, M. L., & Jolley, J. M. (2013). Research design explained. Australia:
Wadsworth Cengage Learning, 752

45
Morrow, J. D. (1993). Arms versus allies: trade-offs in the search for security,
International Organization, 47, 207-233
Morrow, K & James D. (1991). Alliances and asymmetry: an alternative to the
capability aggregation model of alliances, American Journal of Political
Science, 35, 904-933.
Mugenda, O. & Mugenda, A. (2005). Research methods: Quantitative and qualitative
approaches.2nd. Rev. Ed. Nairobi: Act press.
Ngui, D.M. (2008). On the Efficiency of the Kenyan Manufacturing Sector: An
Empirical Analysis, Shaker, Aachen.
Ongalo, S. M. (2014). The effect of the level of diversification on corporate liquidity
at NSE, Unpublished MBA Project, University of Nairobi
Pandy, I.M. (2005). Financial Management, New Delhi, India, Vikas Publishing
House. Pass.
Pearson, K., & University of London. (1985). On further methods of determining
correlation. London: Cambridge University Press.
Penman, S. H. (2007). Financial Statement Analysis. 3rd international edition,
McGraw Hill, Singapore.
Petersen, A. & V. Kumar (2010). Can product returns make you money, MIT Sloan
Management Review, Spring, 51,3,8
Prahalad, C. K. & Bettis, R. A. (1986). The dominant logic: a new linkage between
diversity and performance, Strategic Management Journal, 7, 485-501.
Prahalad, C. K. & Hamel, G. (1990). The core competence of the organization.
Harvard Business Review, 68, 79-91.
Qian, G. & Qian, Z. (2008). Regional diversification and firm performance, Journal
of International Business Studies, 39, 2,197-214
Rajan, R. Servaes, H. & Zingales, L (2000). The cost of diversity: the diversification
discount and inefficient investment, Journal of Finance 55, 35–80.

46
Robert, J. & Barro, M. (2002). Determinants of economic growth: a cross-country
empirical study, MIT Press Books, The MIT Press, 1(1), 4-3
Sharpe, W. F. (1964). Capital asset prices: A theory of market equilibrium under
conditions of risk, Journal of Finance, 19, 3, 425-442.
Sharpe, W. F. (1966). Capital asset prices: a theory of market equilibrium under
conditions of risk, Journal of Finance, 19,3, 425-442.
Siggelkow, N. (2003). A study of intra-industry focus effects. The Journal of
Industrial Economics, 51,2, 121–150.
Tobin, J. (1958). Liquidity preference as behavior towards risk, The Review of
Economic Studies, 25, 65-86.
Treynor, J. (1965). Management of investment funds, Harvard Business Review,
43(1), 63–75.
WMP (2014). The manufacturing industry in the developing economies, Journal of
Business Management, 2, 1, 3-5

47
APPENDICES
APPENDIX I: LISTED MANUFACTURING FIRMS:
INDUSTRIAL AND ALLIED SECTOR
1. Athi-River Mining Limited
2. Bamburi Cement Company Limited
3. British American Tobacco Kenya Limited
4. Crown-Berger Kenya Limited
5. East African Cables Limited
6. East African Portland Cement Company
7. East African Breweries Limited
8. Car and General
9. Kenya Oil Company Limited
10. BOC Kenya Limited
11. The Kenya Power & Lighting Co. Limited
12. Kenya Electricity Generating Company (Kengen)
13. Total Kenya Limited
14. Mumias Sugar Company Limited
15. Marshalls. E.A
16. Unga Group Limited
17. Carbacid Investment Limited
18. Kenya Orchards Limited
19. A Baumann Company Limited
NSE (2015)

48
APPENDIX II: SECONDARY DATA
Athi River Net Assets (Total Assets -Total Liabilities )
ROA (net income/total assets)
Diversification Index
Firm Size (Total Assets)
2010 6,102,252 0.151 0 12,035,963
2011 5,701,201 -0.02 0 12,037,565
2012 5,613,180 0 0.001 13,441,193
2013 4,601,423 -0.07 0.013 13,976,795
2014 7,090,257 0.15 0.112 16,133,703
Bamburi
2010 14,010,000 0 0.004 25,690,000
2011 17,038,000 0.222218008 0.015 26,366,000
2012 30,861,000 0.113434639 0.015 43,038,000
2013 31,510,000 0.085386833 0.201 43,016,000
2014 29,119,000 0.095216023 0.135 40,991,000
British American Tobacco
2010 4,672,076 0.140093067 0.023 10,553,206
2011 5,114,312 0.158901794 0.052 11,121,561
2012 6,412,067 0.225282343 0.015 13,750,545
2013 7,097,917 0.246160263 0.202 15,176,495
2014 7,571,608 0.219222176 0.351 16,985,923
Crown Berger Kenya Limited
2010 1,858,452 0.046440801 0 1,858,452
2011 1,972,337 0.046349584 0 1,972,337
2012 2,215,352 0.058230927 0 2,215,352
2013 2,258,263 0.059135273 0 2,258,263
2014 2,945,434 0.072601525 0 2,945,434
E.A Cables
2010 1,660,780 0.083545301 0.013 3,543,383
2011 2,246,309 0.040688777 0.107 4,518,445
2012 2,273,832 0.063033844 0.012 4,993,032
2013 2,925,029 0.083547994 0.004 6,248,642
2014 3,066,538 0 0.013 6,809,265
East Africa Portland Cement Company
Net Assets (Total Assets -Total Liabilities )
ROA= (net income/total assets)
Diversification Index Assets
2010 6,102,252 0.15238116 0.013 12,035,963
2011 5,701,201 0.032655358 0.159 12,037,565
2012 5,613,180 0.017843436 0.064 13,441,133
2013 4,601,423 0 0.73 13,976,795
2014 7,090,257 0.065922 0.064 16,133,703

49
Car and General
2010 1,307,802 0.061667691 0 3,210,498
2011 1,555,906 0.061538613 0.204 3,871,293
2012 1,920,322 0.051904638 0.004 5,562,239
2013 2,143,154 0.04671995 0.025 5,705,400
2014 2,504,178 0.045757184 0.003 6,901,430
KenolKobil
2010 9,818,411 0.043977925 0 29,435,336
2011 11,209,204 0.063051089 0 30,372,909
2012 11,650,461 0.071210018 0.192 45,974,304
2013 6,463,725 -0.192281945 0.573 32,684,166
2014 6,666,294 0.019857247 0.051 28,121,673
Net Assets (Total Assets -Total Liabilities )
ROA= (net income/total assets)
Diversification Index Assets
BOC Kenya Limited
2010 1,533,794 0.077402395 0 1,988,401
2011 1,521,385 0.039279437 0 2,019,810
2012 1,328,551 0.082895063 0 1,816,803
2013 1,454,811 0.099205797 0 1,989,541
2014 2,076,060 0.076957403 0 2,633,093
The Kenya Power And Lighting Co
2010 66,980,112 0.018335553 0 112,945,160
2011 70,530,841 0.021827426 0 150,566,859
2012 69,418,520 0.01292055 0 160,993,223
2013 70,179,555 0.017301187 0 163,144,873
2014 74,128,740 0.0278266 0 188,673,282
Kengen
2010 66,980,112 0.018335553 0 112,945,160
2011 70,530,841 0.021827426 0 150,566,859
2012 69,418,520 0.01292055 0 160,993,223
2013 70,179,555 0.017301187 0 163,144,873
2014 74,128,740 0.0278266 0 188,673,282
Total Kenya Limited
2010 8,962,191 0.015306458 0 31,528,196
2011 9,437,540 0.030304435 0 30,233,364
2012 9,143,398 -0.002032507 0 35,146,746
2013 14,151,097 -0.006136854 0.012 32,939,025
2014 15,346,392 0.032846754 0.023 39,951,497
Unga Group Limited
2010 3,146,387 0.033274753 0 5,565,541
2011 3,364,703 0.046633771 0 5,064,420
2012 3,744,951 0.077255379 0 5,708,897

50
2013 3,989,218 0.054318398 0 6,410,259
2014 4,503,915 0.061082657 0.012 8,316,927
Net Assets (Total Assets -Total Liabilities )
ROA= (net income/total assets)
Diversification Index Assets
Carbacid Investment Limited
2010 1,309,831 0.186269054 0 1,376,380
2011 1,445,608 0.20327927 0 1,512,166
2012 1,694,287 0.173676785 0 1,739,985
2013 1,862,650 0.193404166 0 2,012,816
2014 2,115,982 0.215723651 0 2,204,399
Kenya Orchards Limited
2010 -1,232,910 -0.036537971 0 78,703,987
2011 -726,112 0.007541811 0 74,491,123
2012 -68,846 0.01012137 0 70,372,491
2013 121,111 0.003553383 0 68,936,272
2014 2,481,451 0.034212923 0 70,597,300
Crown Paints Kenya Limited
2010 836,943 0.046440801 0 1,858,452
2011 902,345 0.046349584 0 1,972,337
2012 1,052,420 0.058230927 0 2,215,352
2013 1,176,202 0.059135273 0 2,258,263
2014 1,361,714 0.072601525 0 2,945,434

51
APPENDIX III: LOGARITHM OF ASSETS WAS OBTAINED
USING MICROSOFT EXCEL FORMULA FOR NATURAL LOG
39. 17.30
40. 17.15
41. 14.92
42. 14.86
43. 14.95
44. 15.04
45. 15.12
46. 18.09
47. 18.20
48. 18.60
49. 18.71
50. 18.99
51. 17.27
52. 17.23
53. 17.38
54. 17.31
55. 17.50
56. 14.08
57. 14.11
58. 13.55
59. 13.11
60. 13.08
61. 14.18
62. 13.93
63. 13.89
64. 13.25
65. 13.15
66. 12.47
67. 12.53
68. 12.78
69. 13.26
70. 13.12
71. 11.35
72. 11.97
73. 12.16
74. 12.68
75. 13.61
1. 16.31
2. 16.62
3. 16.84
4. 17.11
5. 17.21
6. 17.28
7. 17.32
8. 17.33
9. 17.58
10. 17.58
11. 15.70
12. 15.89
13. 15.99
14. 16.18
15. 16.25
16. 14.44
17. 14.49
18. 14.61
19. 14.63
20. 14.90
21. 15.08
22. 15.32
23. 15.42
24. 15.65
25. 15.73
26. 16.30
27. 16.30
28. 16.41
29. 16.45
30. 16.60
31. 14.98
32. 15.17
33. 15.53
34. 15.56
35. 15.75
36. 17.20
37. 17.23
38. 17.64

52
APPENDIX IV: LISTED MANUFACTURING FIRMS IN KENYA
-.2
0.2
.4-.2
0.2
.4-.2
0.2
.4-.2
0.2
.4
2010 2011 2012 2013 2014
2010 2011 2012 2013 2014 2010 2011 2012 2013 2014 2010 2011 2012 2013 2014 2010 2011 2012 2013 2014
eabl athi river bamburi boc bat
c&g carbacid crown crownp eac
eapc kengen kenol kenya_orch marshalls
mumias kplc total_k unga_g
roa
yearGraphs by company_