Embed Size (px)
Citation preview

ACCOUNTING WORKSHOP
“Corporate Acquisitions, Diversification, and the Firm’s Lifecycle”
By
Asli M. Arikan Ohio State University
and
René M. Stulz*
Ohio State University
Thursday, May 3rd, 2012 1:20 – 2:50 p.m.
Room C06 *Speaker Paper Available in Room 447

Corporate Acquisitions, Diversification, and the Firm’s Lifecycle
Asli M. Arikan and René M. Stulz*
April 2012
Abstract
Lifecycle theories of mergers and diversification predict that firms make acquisitions and diversify when their internal growth opportunities become exhausted. Free cash flow theories make similar predictions. In contrast to these theories, we find that the acquisition rate of firms (defined as the number of acquisitions in an IPO cohort-year divided by the number of firms in that cohort-year) follows a u-shape through their lifecycle as public firms, with young and mature firms being equally acquisitive but more so than middle-aged firms. Firms that go public during the merger/IPO wave of the 1990s are significantly more acquisitive early in their public life than firms that go public at other times. Young public firms have a lower acquisition rate of public firms than mature firms, but the opposite is true for acquisitions of private firms and subsidiaries. Strikingly, firms diversify early in their life and there is a 41% chance that a firm’s first acquisition is a diversifying acquisition into an industry with a different 2-digit SIC code. The stock market reacts more favorably to acquisitions by young firms than to acquisitions by mature firms except for acquisitions of public firms paid for with stock. There is no evidence that the market reacts more adversely to diversifying acquisitions by young firms than to other acquisitions.
* Respectively, visiting assistant professor, Ohio State University, and Reese Chair of Banking and Monetary Economics, Ohio State University, NBER, and ECGI. We are grateful for comments from Jim Hsieh, John Matsusaka, Max Maksimovic, Gordon Phillips, Jay Ritter, and Mike Weisbach. We thank Yeejin Jang and Robert Prilmeier for research assistance. E-mail address: [email protected] (R.M. Stulz).
1
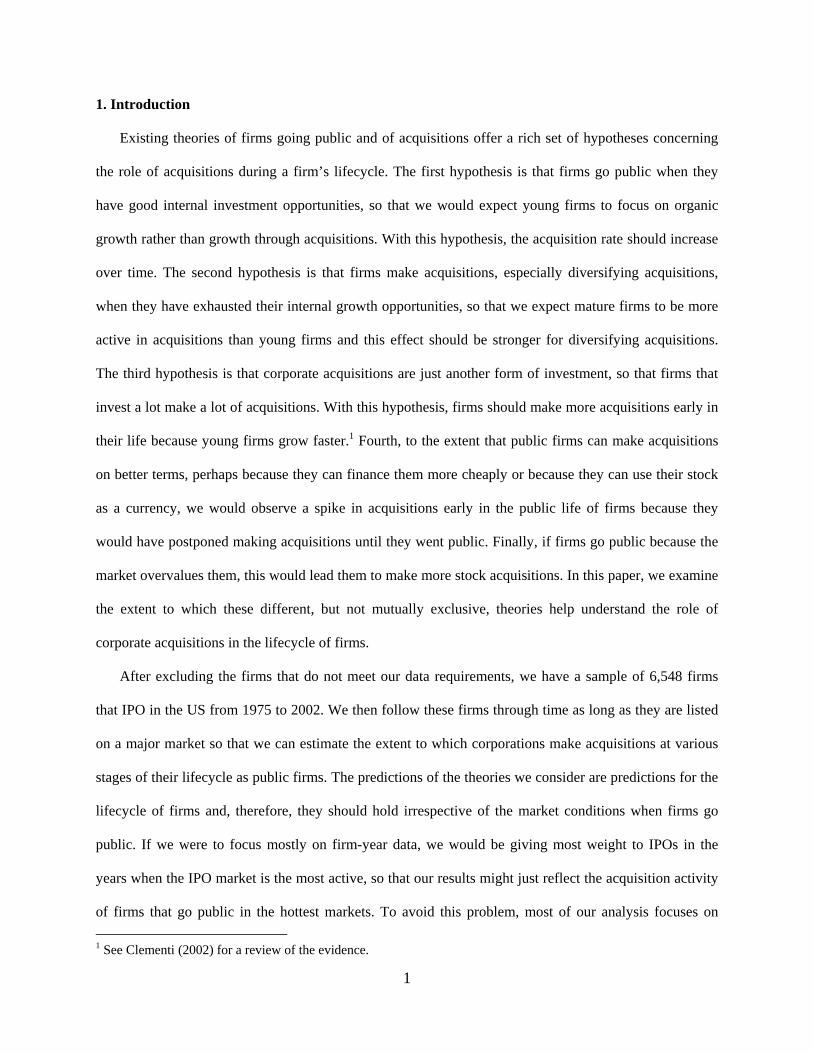
1. Introduction
Existing theories of firms going public and of acquisitions offer a rich set of hypotheses concerning
the role of acquisitions during a firm’s lifecycle. The first hypothesis is that firms go public when they
have good internal investment opportunities, so that we would expect young firms to focus on organic
growth rather than growth through acquisitions. With this hypothesis, the acquisition rate should increase
over time. The second hypothesis is that firms make acquisitions, especially diversifying acquisitions,
when they have exhausted their internal growth opportunities, so that we expect mature firms to be more
active in acquisitions than young firms and this effect should be stronger for diversifying acquisitions.
The third hypothesis is that corporate acquisitions are just another form of investment, so that firms that
invest a lot make a lot of acquisitions. With this hypothesis, firms should make more acquisitions early in
their life because young firms grow faster.1 Fourth, to the extent that public firms can make acquisitions
on better terms, perhaps because they can finance them more cheaply or because they can use their stock
as a currency, we would observe a spike in acquisitions early in the public life of firms because they
would have postponed making acquisitions until they went public. Finally, if firms go public because the
market overvalues them, this would lead them to make more stock acquisitions. In this paper, we examine
the extent to which these different, but not mutually exclusive, theories help understand the role of
corporate acquisitions in the lifecycle of firms.
After excluding the firms that do not meet our data requirements, we have a sample of 6,548 firms
that IPO in the US from 1975 to 2002. We then follow these firms through time as long as they are listed
on a major market so that we can estimate the extent to which corporations make acquisitions at various
stages of their lifecycle as public firms. The predictions of the theories we consider are predictions for the
lifecycle of firms and, therefore, they should hold irrespective of the market conditions when firms go
public. If we were to focus mostly on firm-year data, we would be giving most weight to IPOs in the
years when the IPO market is the most active, so that our results might just reflect the acquisition activity
of firms that go public in the hottest markets. To avoid this problem, most of our analysis focuses on
1 See Clementi (2002) for a review of the evidence.

2
event years, where we define an event year as the year from the IPO, and average event-years across IPO
cohorts.
When we measure acquisition activity by the conditional acquisition rate for an event year, which we
define as the ratio of the number of acquisitions for the firms in a cohort’s event year divided by the
number of firms from that cohort alive at the beginning of the event year averaged across IPO cohorts, we
find that firms are most active in the corporate acquisition market in the year following their IPO. From
the IPO onward, the conditional acquisition rate follows a u-shape, so that it is higher when firms are
young (first three years after the IPO) and when they are mature (more than ten years since the IPO).
While the conditional acquisition rate of young firms does not differ from the conditional acquisition rate
of mature firms, young firms acquire fewer public firms than mature firms. However, irrespective of a
firm’s age, acquisitions of public firms represent a small minority of the acquisitions. Our evidence is
consistent with the hypothesis that acquisitions and internal investment are complementary for young
public firms. It is not supportive of the hypothesis that firms are most active in the market for acquisitions
when they are mature because their internal growth opportunities have been exhausted. Further, there is
no difference between young and mature firms in the extent to which they engage in diversifying
acquisitions. It follows that theories that predict that firm diversification occurs when mature firms have
exhausted their internal growth opportunities cannot explain the lifecycle pattern of diversification of
firms.
There is a considerable literature that emphasizes the role of market conditions on a firm’s decision to
go public (for a review, see Ritter and Welch (2002)). According to that literature, firms are more likely
to go public when valuations are high. As a result, there is clustering in going public decisions. We find
that whether a firm goes public in a hot or a cold IPO market has no implications for how its propensity to
make acquisitions changes as it ages. However, young firms are more acquisitive than mature firms
during the hot merger market of the 1990s. It is therefore not surprising that firms that IPOed in the 1980s
typically have their highest acquisition rate later in life in contrast to firms that IPOed in the 1990s that
have their highest acquisition rate in the first full calendar year of their life.

3
We examine more directly the spike in acquisitions that takes place in the first year after the IPO. We
find that it is a spike in acquisitions of private firms, not public firms. Further, the spike in acquisitions is
driven by cash acquisitions rather than stock acquisitions. There is no significant spike in equity-financed
acquisitions, so that the hypothesis that firms go public because of overvaluation and use their overvalued
equity to make acquisitions is not supported. The acquisition spike is not concentrated in acquisitions
within the acquirer’s industry as there is a similar spike across diversifying and non-diversifying
acquisitions.
With our approach, we focus on the conditional acquisition rate of firms of a given age as public
firms. We examine, however, whether our results also hold if we use a different measure of the
conditional acquisition rate, namely the total value of deals by firms of a given age divided by the assets
held by firms of that age. This measure, which we call the conditional dollar acquisition rate, suffers from
the problem that the value of the deal is unavailable for a large fraction of the deals. We find that firms
spend more on acquisitions early in life, but this result is driven by the merger wave of the 1990s. If we
exclude firms that are young during that merger wave, there is no difference between the spending on
acquisitions for young and mature firms. When we compare the conditional dollar acquisition rate for
young and mature firms, we find that young firms make more acquisitions of private firms and more
related acquisitions than mature firms. Strikingly, the conditional dollar acquisition rate for diversifying
acquisitions is not significantly different from the conditional dollar acquisition rate of related
acquisitions for young or for mature firms. Finally, we also find that IPO firms with poor first-day returns
experience more of a drop in acquisitions later in life than other IPO firms.
Throughout the paper we study the lifecycle of firms as public firms. An obvious issue with this
approach is that our results might be due to firms that are young relative to their founding and young
firms make more acquisitions. With this view, it would not make sense to start our analysis at the IPO and
the role of the IPO in our analysis would be spurious. We examine this possibility by dividing firms at
the IPO into age quintiles relative to their founding date. The spike at year one we document holds
irrespective of the age relative to founding at the IPO. Similarly, we also find that young and mature firms

4
have similar acquisition rates irrespective of the age since incorporation of firms when they go public.
While the IPO firms that belong to the lowest quintile of age since incorporation acquire more when
young than when mature, this result is completely driven by the IPO cohorts from 1995 to 2000.
Our evidence seems inconsistent with the view that firms make acquisitions when they have
exhausted internal growth opportunities. However, it could still be the case that mature firms make
acquisitions for that motive while young firms do not. To the extent that an acquisition announcement
conveys information about a firm’s growth opportunities when the firm is older but not when it is
younger, we would expect a more adverse reaction to acquisitions by older firms. The literature has used
this argument to explain the adverse stock-price reaction for the announcement of acquisitions of public
firms paid for with equity (e.g., Moeller, Schlingemann, and Stulz (2004)). We find that, except for
acquisitions of public firms paid for with equity, the stock-price reaction is more positive for younger
firms. Lastly, the worst stock-price reaction occurs for acquisitions of public firms in the same industry
paid for with stock. There is no difference in the stock-price reaction between such acquisitions made by
young firms and made by mature firms.
The existing evidence shows that it is plausible that a reason for firms to go public is that it gives
them an advantage in making corporate acquisitions as suggested by Hsieh, Lyandres, and Zhdanov
(2011). However, the precise nature of this advantage is unclear. While the literature has focused on the
acquisition rate, the post-IPO spike exists only for acquisitions of private firms and subsidiaries. The
absence of a post-IPO spike for acquisitions of public firms requires a theory of the post-IPO acquisition
spike that explains why young public firms have an advantage in acquiring private firms but not public
firms. Further, as already discussed, IPO firms use cash to pay for acquisitions more than they use equity.
The neo-classical view of acquisitions is that they reallocate corporate assets to more productive uses.
In this vein, Jovanovic and Rousseau (2002) develop a q-theory of investment. In their theory, investment
can take place through capital expenditures as well as through acquisitions. High q firms make
acquisitions because they have greater productivity that they can transfer to the acquired firm. Younger
firms have higher qs as they go public. With this theory, we would therefore expect IPO firms to be active

5
in the acquisition market. This theory does not explain, however, why the acquisition rate does not appear
to differ between young and mature firms on average, why there is an initial IPO spike, and why this
spike is focused on acquisitions of private companies.
A different literature focuses on the role of misvaluation in acquisition decisions by firms. With this
literature, firms with high qs are more likely to be overvalued. Firms could time their IPOs to when the
market is likely to overvalue them and engage in acquisitions using their overvalued equity. In particular,
Shleifer and Vishny (2003) provide a model of acquisitions made by overvalued firms and empirical
papers find evidence for a role of overvaluation in acquisition decisions and outcomes (e.g., Dong,
Hirshleifer, Richardson, and Teoh (2006), Rhodes-Kropf, Robinson, and Viswanathan (2005)). However,
we find that, for the acquisitions where the method of payment is known, more acquisitions are paid for
with cash than with stock for both young and mature firms.
There is a large literature on the benefits and costs of corporate diversification. In neo-classical
models, firms diversify when they have unique resources that can be applied to projects in different
industries and when their prospects in their industry are no better than in another industry that they
diversify into (see, for instance, Gomes and Livdan (2004), Maksimovic and Phillips (2001), Matsusaka
(2001)). Maksimovic and Phillips (2001) provide tests that are supportive of this perspective. In their
model, more efficient firms acquire assets and conglomerates sell their less productive assets following
demand shocks in the industry of these assets. Maksimovic and Phillips (2002) find support for these
ideas in a study of the market for corporate assets. If firms that undergo an IPO are more efficient firms,
the existence of a spike in acquisitions would be consistent with their model. Their data source includes
both private and public firms. For their approach to explain our results, public firms should have a
productivity advantage over private firms since we find that young public firms have a much higher
acquisition rate for private firms than they do for public firms. Maksimovic, Philips, and Yang (2010)
find evidence that public firms are more productive than private firms. They also find that public firms are
more active in acquisitions and that they transfer their superior productivity to plants they acquire. The
model of Clementi (2002) could also help explain such an outcome. In that model, firms are capital-

6
constrained and go public following a favorable productivity shock to raise more capital. In Gomes and
Livdan (2004), firms diversify to take advantage of economies of scope and because “diversification
allows a mature, slow-growing firm to explore attractive new productive opportunities.” Their model
predicts that firms whose activities have a lower rate of return diversify. Such firms are not generally
viewed to be firms that just had an IPO.
Alternatively, agency models also suggest that firms make diversifying acquisitions to maximize
managerial rents when they have poor prospects in their industry (see, for instance, Jensen (1993)), but
for such firms, acquisitions are not efficient. With these types of explanations for diversification, we
would expect firms to make diversifying acquisitions later in their life since we would expect firms that
go public to have good prospects. The evidence we uncover that firms make diversifying acquisitions
throughout their life and that the rate at which they make such acquisitions does not appear to change
much through their life seems to create a challenge for such models.
Other papers examine the extent to which young firms make acquisitions and find that young firms
are extremely active and, even though our focus and approaches differ, our paper builds on these earlier
contributions. In an important contribution, Celikyurt, Sevilir, and Shivdasani (2010) show that firms are
very active acquirers immediately after their IPO using a sample of IPOs from 1985 to 2004. They find
young firms to be more active in acquisitions than firms that are more than 5 years from their IPO. In
contrast to them, we focus on the whole lifecycle of firms and investigate theories that pertain more to
mature firms. Consequently, our focus is on a comparison of young firms to firms that are more than 10
years from their IPO. This focus leads us to have a different sample from theirs. First, we have IPOs since
1975. Such a sample allows us to track acquisitions for firms that are more than ten years from their IPO
for twenty-one years. Second, we include all IPOs while they use IPOs with proceeds greater than $100
million in 2004 dollars. A sample restricted to IPOs with proceeds greater than $100 million would be a
much smaller sample, so that earlier cohorts would be too thin when the firms reach maturity. More
fundamentally, our approach differs from theirs in that we focus on cohort evidence rather than firm-level
evidence. This is because our focus is on lifecycle predictions and these predictions should hold

7
irrespective of when a firm IPOs, so that they should hold across cohorts. We can then test separately
whether IPO and merger market conditions at the time of a cohort goes public affect the behavior of firms
in that cohort over their lifecycle.
A number of recent papers focus on acquisitions of firms shortly after their IPO. These papers differ
in their interest from our paper as we are focused on acquisitions and diversification through a firm’s
lifecycle. Hsieh, Lyandres, and Zhdanov (2011) use a much longer sample to show the rate of acquisition
of IPOs and how it relates to merger waves. The fact that they find that high IPO intensity precedes
merger waves suggests that the high acquisition intensity of IPO firms may be related to the degree of
activity in the M&A merger market. Our evidence shows that this is the case. Hovakimian and Hutton
(2010) explore how being public helps a firm undertake acquisitions within three years of the IPO. They
focus on acquisitions of public firms and find that IPO firms benefit from having highly valued public
stock as a means of acquisition currency. Brau, Couch, and Sutton (2011) find that IPO firms that make
acquisitions underperform in the long-run in contrast to firms that do not. Wiggenhorn, Gleason, and
Madura (2007) examine acquisitions made during the first year following an IPO. They find that firms
that make such an acquisition do not have poorer long-term performance that other IPO firms and that the
stock market reacts positively to such acquisitions. Gao, Ritter, and Zhu (2012) argue that in recent years
it has been important for firms to grow fast and that as a consequence IPO firms are more likely to be
acquired and more likely to acquire. They find evidence supportive of their prediction. Alimov and
Mikkelson (2008) examine the investment behavior of firms that go public in favorable market conditions
(defined as conditions where there is a high rate of firms going public and high valuations). They find that
firms that IPO in these conditions tend to spend more on acquisitions.
The paper proceeds as follows. In Section 2, we describe the construction of our sample of IPOs and
of the acquisitions made by these firms. In Section 3, we show evidence on the rate of acquisition of firms
as a function of their age. In Section 4, we examine in more detail the acquisition rate of young firms and
contrast the acquisition behavior of firms immediately after their IPO to the acquisition behavior of more

8
mature firms. In Section 5, we analyze the abnormal returns associated with acquisitions for young and
mature firms. We conclude in Section 6.
2. Sample construction and description
In this section, we describe how we construct our sample of IPOs and then how we obtain our sample
of acquisitions made by the IPO firms. The population of firms and their deals are obtained using the
SDC database maintained by Thompson Financial Database. The IPO sample includes 6,816 original US
common stock offerings from 1975 to 2002, excluding unit issues, spinoffs, privatizations, reverse LBOs,
rights issues, ADRs, closed funds and trusts, and REITs. In addition IPO firms with trade data available in
CRSP before their IPO announcement date are excluded. 6,548 firms out of the 6,816 IPOs have unique
PERM numbers, which allow us to get the data on stock prices from the CRSP database. By way of
comparison, Celikyurt, Sevilir, and Shivdasani (2010) have 1,250 IPOs in their dataset from 1985 to 2004
that have proceeds greater than $100 million in 2004 dollars. Our sample of IPOs is mostly the same as
the Field-Ritter dataset (Loughran and Ritter, 2004; Field and Karpoff, 2002) made available by Professor
Ritter on his website. The major exception is that we want to be inclusive in our IPO sample, so that we
include all industries, penny stocks, and rollups in the sample used for the results reported in the tables,
while the Field-Ritter dataset excludes banks, savings and loan companies, penny stocks and rollups.
Penny stocks account for 7% of the IPOs; they account for 3% of the acquisitions made by IPO firms.
Rollups account for 2% of the IPOs but 8% of the acquisitions. Penny stocks take place in the 1980s,
while almost all rollups take place from 1996 to 1999. When appropriate, we point out how penny stocks
and rollups differ from other IPO firms.
Table 1 shows our sample of 6,548 IPO firms. It is not surprising in light of the existing evidence on
IPOs that the number of IPOs varies substantially over time. As expected, we have a large number of
IPOs in the second half of the 1990s. The period from January 1995 to December 2000 has 38.58% of our
IPOs. Further, underpricing is highest in 1999 and 2000. There is a high attrition rate for the firms in our
sample. Except for the IPOs since 1997, there is no IPO cohort that has a survival rate greater than 30% to
9
the end of the sample period. For the IPO cohorts in the first ten years of the sample, all of them have a
survival rate equal to or lower than 20%.
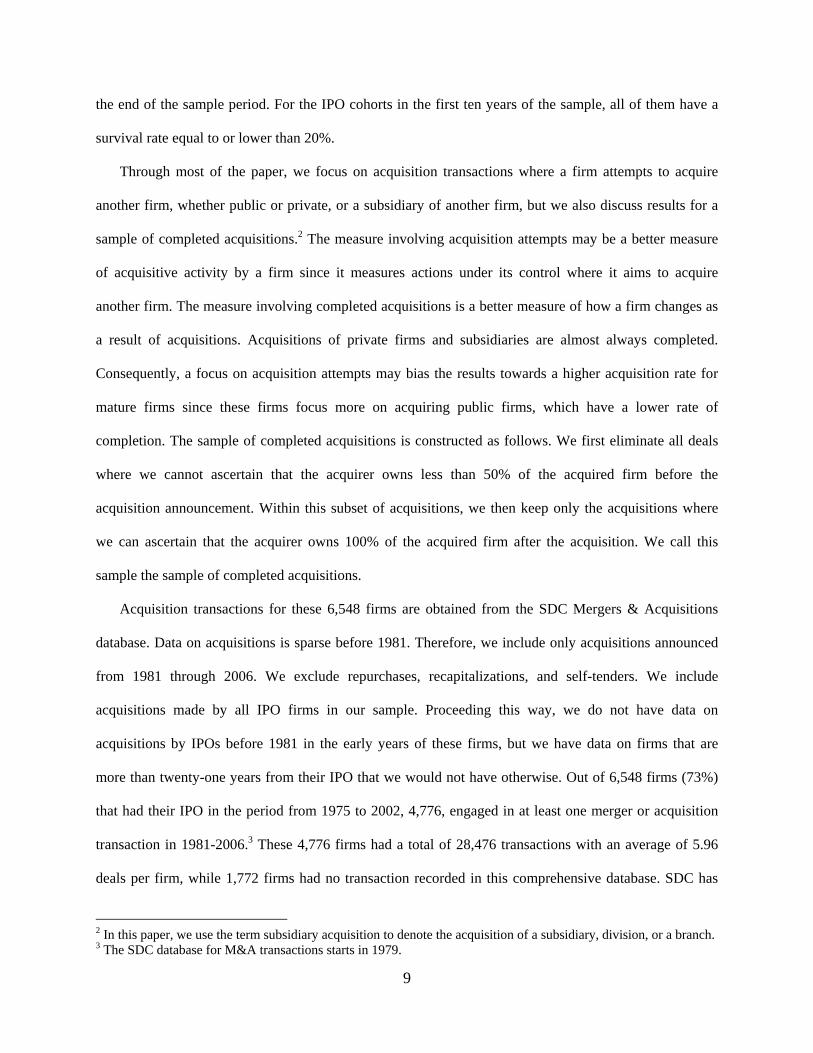
Through most of the paper, we focus on acquisition transactions where a firm attempts to acquire
another firm, whether public or private, or a subsidiary of another firm, but we also discuss results for a
sample of completed acquisitions.2 The measure involving acquisition attempts may be a better measure
of acquisitive activity by a firm since it measures actions under its control where it aims to acquire
another firm. The measure involving completed acquisitions is a better measure of how a firm changes as
a result of acquisitions. Acquisitions of private firms and subsidiaries are almost always completed.
Consequently, a focus on acquisition attempts may bias the results towards a higher acquisition rate for
mature firms since these firms focus more on acquiring public firms, which have a lower rate of
completion. The sample of completed acquisitions is constructed as follows. We first eliminate all deals
where we cannot ascertain that the acquirer owns less than 50% of the acquired firm before the
acquisition announcement. Within this subset of acquisitions, we then keep only the acquisitions where
we can ascertain that the acquirer owns 100% of the acquired firm after the acquisition. We call this
sample the sample of completed acquisitions.
Acquisition transactions for these 6,548 firms are obtained from the SDC Mergers & Acquisitions
database. Data on acquisitions is sparse before 1981. Therefore, we include only acquisitions announced
from 1981 through 2006. We exclude repurchases, recapitalizations, and self-tenders. We include
acquisitions made by all IPO firms in our sample. Proceeding this way, we do not have data on
acquisitions by IPOs before 1981 in the early years of these firms, but we have data on firms that are
more than twenty-one years from their IPO that we would not have otherwise. Out of 6,548 firms (73%)
that had their IPO in the period from 1975 to 2002, 4,776, engaged in at least one merger or acquisition
transaction in 1981-2006.3 These 4,776 firms had a total of 28,476 transactions with an average of 5.96
deals per firm, while 1,772 firms had no transaction recorded in this comprehensive database. SDC has
2 In this paper, we use the term subsidiary acquisition to denote the acquisition of a subsidiary, division, or a branch. 3 The SDC database for M&A transactions starts in 1979.

10
information about acquisitions by the IPO firms that took place before these firms went public. We do not
use that information in the following because it is not comprehensive. However, 1% of firms announced
an acquisition on the same day as their IPO and we use that information.
3. The acquisition rate through the firm’s lifecycle
In this section, we investigate the conditional acquisition rate of firms through their lifecycle. Table 2
reports the conditional acquisition rate for each IPO cohort in event years, where the IPO is year 0. The
conditional acquisition rate is defined as the number of acquisitions by firms from a cohort in an event
year divided by the number of firms in that cohort that have survived until the beginning of that event
year. It is therefore the average number of acquisitions per firm in a cohort in a calendar year. We call this
statistic the conditional acquisition rate in the remainder of the paper. In the table, year 0 is a partial year.
Table 2 shows the mean and median conditional acquisition rates for each year in the lifetime of a
firm from year 0 to year 25. We cut off the early cohorts at year 25 because there are too few firms in
each cohort after that year. Firms make acquisitions steadily through their life. No cohort with an IPO
after 1978 has a year without acquisitions. The peak mean conditional acquisition rate is in year 1, the
first full calendar year that a firm is public. The two highest median conditional acquisition rates are 0.58
in year 1 and 0.59 in year 22. The highest year 1 conditional acquisition rate is 1.87 for the 1997 cohort.
Five cohorts have an average conditional acquisition rate that exceeds one in year 1. All these cohorts are
in the second half of the 1990s when the M&A market was extremely active.
In Table 2, we show the year for each cohort when it has its highest conditional acquisition rate. The
table shows a striking change in the peak year of the conditional acquisition rate. The cohorts in the 1970s
and the 1980s have a peak acquisition rate in later years of their life. Until 1990, all peak year conditional
acquisition rates are after year 5. All but two are in year 10 or later. After 1991, all cohorts have a peak
conditional acquisition year before year 4 and almost all (9 out of 11) have a peak conditional acquisition
rate year in year 1. The phenomenon of unusually high acquisitive activity by new firms is therefore one
that holds for the 1990s but not earlier. It is well-known, however, that characteristics of IPO firms

11
changed in the 1990s, in that new public firms were less well-established than they were earlier (see Fama
and French (2004)). In particular, firms that went public before the 1990s were more likely to be
profitable when they went public. Another important consideration is that the firms that went public in the
1990s faced a hot M&A market in their youth. We investigate the relevance of this last consideration in
the next sub-section.
Looking at the evolution of the mean conditional acquisition rate after year 1, we see that it falls after
year 1, reaching a minimum of 0.34 in year 5, and then increases again, so that the conditional acquisition
rate of firms after year ten is more like the conditional acquisition rate of young firms than the conditional
acquisition rate of firms in years 5 to 10. This pattern holds as well when we consider the median
conditional acquisition rate. It follows from these observations that the conditional acquisition rate of
firms through their lifecycle follows a u-shape pattern. It is high in a firm’s youth, lower in its middle age,
and high again when it reaches maturity. Our regression analysis in the next section finds that the
conditional acquisition rate is significantly lower during these event years. Figure 1 shows the conditional
acquisition rates in each event year for each IPO cohort. Though we do not reproduce the results in a
table, we reach similar conclusions when we consider the sample of completed acquisitions.
A concern with the results of Table 2 is that they might be excessively affected by serial acquirers. To
make sure that this is not the case, we replicated Table 2 capping the number of acquisitions by a firm at
5. When we do that, the u-shape pattern that we document is unchanged. A similar result holds when we
exclude firms with more than five acquisitions in a year.
So far, we have focused on the number of acquisitions made by IPO firms. The same number of
acquisitions at different stages of a firm’s life could have very different implications if in one event year
the acquisitions are small and in the other they are large. Ideally, therefore, we would also examine the
amounts spent on acquisitions by firms during their lifecycle. As already explained, however, SDC does
not report the consideration paid for a large fraction of acquisitions. For the acquisitions used in Table 2,
the acquisition consideration is not available for 48.32% of the acquisitions. Nevertheless, we report
results for the amount spent on acquisitions as a fraction of the assets owned by firms in a cohort at the

12
beginning of the year in Table 3. To account for deals with no information, we construct the ratio using
only the firms for which information on acquisition consideration is available for each acquisition they
make and for which total assets is available at the beginning of the year. We call this statistic the
conditional dollar acquisition rate. The rate is unbiased if the rate for the firms with incomplete or no
information is the same as the rate for the firms with full information. Because we exclude firms that
make acquisitions for which we do not have deal size information, some cohort years drop out in Table 3,
so that the average for some event years involves fewer cohorts than in Table 2.
In Table 3, the mean conditional dollar acquisition rate is highest in year 2. The median conditional
dollar acquisition rate is highest in year 1 and never reaches again a rate half as a high as that rate after
year 8. The mean conditional dollar acquisition rate is higher for young firms, but there are some years
where older firms have a conditional dollar acquisition rate that is close to the mean of year 1. It is useful
to note, however, that the high values of the dollar acquisition rate in years 1 and 2 are driven by
extremely high conditional dollar acquisition rates in the second half of the 1990s. For instance, when we
consider year 1, the peak conditional dollar acquisition rate is in 1999 and is more than three times the
average. Similar results hold when we analyze the sample of completed acquisitions.
Though we do not report the results in a table, we also investigate the dollar amount spent by firms in
a cohort at the firm level. Given that a firm makes acquisitions for which the consideration is known, the
lifecycle pattern is similar for the median to the pattern for the cohort results of Table 3. The mean of the
cohort medians exhibits more volatility, but it has more a u-shape pattern than the monotone declining
pattern of the median.
Tables 2 and 3 show that no case can be made that mature firms are more acquisitive than young
firms. Both tables show that firms on average have peak conditional acquisition rates early in life, but the
exact timing of the peak is slightly different between the two tables. However, while there is a clear u-
shape pattern for the acquisition rate, the dollar acquisition rate, although more variable, is more
consistent with a monotone decreasing rate through the firm’s lifecycle. Though we do not reproduce the

13
results in a table, all the conclusions we reach from the data in Tables 2 and 3 hold up if we restrict the
sample to exclude financial firms and utilities.
Another way to investigate the acquisitive behavior of new firms is to look at the time that they make
their first acquisition. We compute (but do not report in a table) the fraction of firms in a cohort that have
their first acquisition in a given event year. We call this ratio the first-deal acquisition ratio. We find that
the peak year of the first-deal acquisition ratio has changed over time. In the earlier years of our sample,
the peak year of first deal acquisitions is later in the life of firms. After 1988, for all years but one, the
peak year is year 1. On average, 27% of IPO firms have their first acquisition in year 1 and 58% of IPO
firms have made an acquisition by the end of year 2. Surprisingly, 42% of first acquisitions are
diversifying acquisitions when an acquisition outside the main 2-digit SIC code of a firm is viewed as a
diversifying acquisition.
4. An examination of the acquisition rate of young and mature firms
In this section, we first compare the acquisition behavior of young and mature firms. Throughout the
paper we call young firms those firms that are in the first three complete calendar years after their IPO,
and mature firms those that are in years 10 to 20 from their IPO. We also estimate multiple regression
models that investigate the determinants of the conditional acquisition rate of young, middle-aged, and
mature firms. In the second part of this section, we explore in greater detail the nature of the acquisition
spike in year one. Finally, we investigate whether the results are explained by differences in the age since
incorporation of firms that go public. Though we primarily focus on the conditional acquisition rate, we
also report results for the conditional dollar acquisition rate as well. Throughout the section, we discuss
results for the whole sample as well as for the completed acquisitions sample.
4.1. Comparing the conditional acquisition rate of young and mature firms
We now compare in Table 4 the conditional acquisition rate of young firms and mature firms. We
construct the average conditional acquisition rate for young and mature firms by averaging across cohorts

14
for an event year and then averaging across event years. Table 4 has results for the whole sample as well
as for the sample of completed acquisitions.
There is no significant difference in the average conditional acquisition rate of young firms and the
average conditional acquisition rate of mature firms. It is common in the IPO literature to distinguish
between hot and cold IPO markets. The literature has a number of different ways to make that distinction.
We use the approach of Helwege and Liang (2004). To define hot and cold IPO markets, they use the
three-month moving average of the number of IPOs scaled by new business formations for each month.
They define the top tercile of that measure to correspond to hot IPO months and the bottom tercile to
correspond to cold IPO months. There is no difference in the acquisition activity between firms that go
public in hot IPO markets versus firms that go public in cold IPO markets.
We consider next the relation between underpricing and the acquisition rate. If greater underpricing
means that firms are more favored by the market, firms with more underpricing should command more
resources and hence be able to carry out more acquisitions. Alternatively, if greater underpricing means
that a firm received too little cash for its IPO, then we should see the opposite result. We show results for
the conditional acquisition rate for quintiles of first-day returns, where the quintiles are computed within
cohorts. We see that for both samples there is no difference in the acquisition rate between the various
quintiles of first-day returns for young firms. However, there is some evidence that firms that have the
lowest IPO first-day returns are less acquisitive when they become mature. Further, the conditional
acquisition rate falls significantly for the firms in the lowest quintile of first-day returns, but not for the
firms in the other quintiles. We also re-calculated the quintiles without dividing the sample into IPO
cohorts and the results are qualitatively the same. To evaluate the relation between the level of mergers
and acquisitions activity in the economy and the conditional acquisition rate of the IPO cohorts, we
consider separately the merger/IPO wave years of the 1990s and the other years. We date the merger/IPO
wave from 1995, the year of the Netscape IPO, to 2000, the year of the collapse of the internet boom. We
see that the difference between the conditional acquisition rate of young firms and mature firms is
dramatic for the 1990s merger/IPO wave years. However, there is no difference between these conditional

15
acquisition rates when these years are excluded. Further, the rate of acquisition activity of young firms is
much higher during the 1990s merger/IPO wave years than in other years. There is no difference in these
results between the sample of all acquisitions and the sample of completed acquisitions.
Figures 2 and 3 provide further importance on the importance of merger activity for the acquisitive
behavior of IPO firms. In Figure 2, we plot the mean conditional acquisition rate per event year for the
whole sample, for the event years during the merger/IPO wave of the 1990s, for the other years, as well as
for whether a firm goes public in a hot or cold IPO market. Figure 3 shows the medians instead. It is
extremely clear from these plots that there is a sharp difference in the acquisitive behavior of firms early
in their public life if the market for acquisitions is very active or not.
Turning to the characteristics of the acquisitions, we first estimate a conditional acquisition rate for
acquisitions in the firm’s main two-digit SIC code industry, which we call related acquisitions, as well as
a conditional acquisition rate for other acquisitions, which we call diversifying acquisitions.4 We find that
there is no difference in the extent to which mature firms make diversifying acquisitions compared to
young firms. These acquisitions are diversifying acquisitions in that they occur outside of the main two-
digit SIC code industry of the firm, but they could take place in an industry in which the firm is already
active. Therefore, we also investigate a stricter definition of diversification. With this definition, an
acquisition is a diversifying acquisition if it is in a 2-digit SIC code in which the firm has no existing
activity according to Compustat. With this stricter definition of diversification, the rate at which firms
make diversification acquisitions drops in half and is significantly lower than the rate at which they make
related acquisitions. However, it is still the case that younger firms do not make fewer diversifying
acquisitions than mature firms.
We find there is a significant difference in the extent to which mature firms make public acquisitions
as mature firms make more public acquisitions than young firms. The fraction of acquisitions that are
private firm acquisitions is lower for mature firms than for young firms. In contrast, mature firms acquire
4 With this definition, a firm that decides to integrate vertically is treated as a diversifying firm. An alternative approach left for further research would be to identify vertical integration using the input-output tables (Fan and Lang (2000), Matsusaka (1993), and Ozbas and Scharfstein (2011)).

16
more subsidiaries than young firms. It is clear from the data presented about the organizational form of
the target that acquisitions of public firms are a small minority of all acquisitions. Lastly, we consider
how the acquisition is paid for. Young firms have a higher rate of acquisitions paid for with stock than
mature firms. Not surprisingly, therefore, the fraction of acquisitions that are in cash is significantly
higher for mature firms. It is important, however, not to forget that data on how acquisitions are paid for
is missing for a majority of acquisitions. We investigate, but do not report in the table, whether the results
for how acquisitions are paid for differ depending on whether a firm goes public in a hot IPO market or a
cold IPO market. We find that the proportion of acquisitions that are paid for with stock is significantly
higher for firms that go public in a hot IPO market than for firms that go public in a cold IPO market.
We turn next to a comparison of the conditional dollar acquisition rate. We show the results in Table
5. The sample used for this table excludes all deals of firms with at least one missing transaction value. As
for Table 4, we show results for all acquisitions and then for completed acquisitions only. There is no
significant difference in the conditional dollar acquisition rate between young and mature firms for the
whole sample, but there is a significant difference for the sample of completed acquisitions. Using the
sample of completed acquisitions, mature firms spend less on acquisitions than young firms. However,
this result is entirely due to the merger wave of the 1990s. While young firms that go public in a hot
market have a higher conditional acquisition rate than young firms that go public in a cold market for the
whole sample, the difference in expenditures on acquisitions between young firms that go public in a hot
market and those that go public in a cold market becomes statistically insignificant for the sample of
completed acquisitions. We consider next the conditional dollar acquisition rate for the quintiles of first-
day returns. As with the results for the conditional acquisition rate, we see that firms that have the lowest
first-day return experience a stark drop in their conditional dollar acquisition rate when they mature.
Looking at the extent to which firms undertake diversifying acquisitions, we find that young firms
spend more than old firms on related acquisitions, but not on diversifying acquisitions, when we use the
broad diversification measure. With the stricter definition of diversification, young firms do not spend
differently from old firms on diversifying acquisitions or on related acquisitions. Young firms spend

17
much more on acquisitions of private firms than mature firms. There is no difference in the spending on
acquisitions of public firms between young and mature firms. The conditional dollar acquisition rate is
not significantly different for young and mature firms for different means of payments; however, the
fraction of acquisitions financed with cash is significantly higher for mature firms than for young firms.
We investigate whether the results discussed so far in this section differ if we restrict the sample to
exclude financial firms and utilities. There are no meaningful differences between the results.
We now use multiple regressions to understand how market characteristics as well as cohort
characteristics affect cohort event-year conditional acquisition rates and dollar acquisition rates. The
advantage of the regression framework is that we can evaluate the relation between conditional
acquisition rates accounting for the correlations among explanatory variables of interest and that we can
use continuous explanatory variables.
Table 6 shows regression estimates using cohort-event-year conditional acquisition rates as the
dependent variable. We report results for the whole sample. Results for the completed acquisitions
subsample are similar. We eliminate all cohort years with less than 20 firms. The first regression has a
constant and two indicator variables. The indicator variables are one variable for whether the firms in the
cohort are in the period of 4-9 years (middle-aged firms) after the IPO and one variable for whether the
firms are more than ten years from their IPO. We use robust standard errors with clustering on IPO
cohorts. We confirm that the conditional acquisition rate in event time follows a u-shape pattern. The
intercept, corresponding to the conditional acquisition rate of young firms, is 0.5. The coefficient for
mature firms is an insignificant -0.04, so that mature firms and young firms have the same conditional
acquisition rate. However, the coefficient on middle-aged firms is -0.13 and is significant at the 5% level.
Middle-aged firms are therefore less acquisitive than young and mature firms. We test explicitly for the u-
shape pattern by comparing the acquisition rate of young versus middle-aged firms and middle-aged firms
versus mature firms. We find significant differences at the 5% consistent with a u-shape.
The next regression adds an indicator for the hot merger/IPO market of 1995-2000 to regression (1).
We find that the indicator variable is significant and positive in regression (2), but it does not change the

18
inferences from regression (1). Instead of using the indicator variable for the hot merger/IPO market, we
construct an index of M&A activity. The index is constructed by dividing the total number of acquisitions
in SDC by the number of active firms in Compustat. That variable, in regression (3), is significant as well.
However, adding that variable has no impact on the other coefficient estimates. In regression (4), we add
indicator variables for whether the firm went public in a hot or cold IPO market to regression (2). These
indicator variables are not significant. In regression (5), we add to regression (2) the lagged M&A index
and the mean first-day IPO return for the cohort. Neither of these variables is significant. However, these
variables affect the coefficients of the first two indicator variables as their absolute value increases and
the coefficient on mature firms becomes negative and significant. In regression (6), we add to regression
(2) the variables we introduced in regressions (4) and (5). None of these variables are significant. For
regression (7), we create an indicator variable for whether the index of M&A activity is above its sample
average. In the regression, we add that index and interact it with the index for the age of the firm. While
the index is not significant, there is now evidence that the higher conditional acquisition rate of young
firms is due to the periods of intense M&A activity. In periods where M&A activity is below average,
mature firms acquire more. Regression (7) has marginal evidence that multicollinearity might be a
problem using the VIF index. Regression (8) is similar to regression (7) except we use an indicator
variable for the merger/IPO boom of the second half of the 1990s instead of an indicator variable for the
M&A index being above average. With this specification, multicollinearity is not a problem, but the
inferences are the same as for regression (7).
We also estimated regressions like those of Table 6 for the dollar acquisition rate. These results are
reproduced in Table 7. We find that middle-aged firms and mature firms spend less on acquisitions than
young firms in regression (1). Not surprisingly, spending on acquisitions is much higher during the
merger wave of the 1990s. Outside of high merger activity periods, young firms do not spend more on
mergers than more mature firms.
4.2. The conditional acquisition rate of firms up to year 4

19
As discussed in Section 3, firms that go public in the 1990s have a spike in the conditional acquisition
rate in the first year after the IPO. We examine the conditional acquisition rate by year for young firms.
The intent is to understand how the conditional acquisition rate evolves for young firms as their IPO
becomes more distant and whether this evolution differs depending on the state of the IPO market and of
the M&A market.
Table 8 reports estimates of the conditional acquisition rate for years 0 to 4 for various subsamples.
As in Tables 4 and 5, we report results for the whole sample as well as for the sample of completed
acquisitions. The conditional acquisition rate in year 4 is 56.52% of the year 1 rate. A similar result holds
for the completed acquisition sample. There is no significant difference in conditional acquisition rates
between firms that go public in hot and cold markets in any of the first four years of their public life. The
conditional acquisition rate in year 4 is 51.29% of the year 1 rate for hot market IPOs and 55.95% for cold
market IPOs. However, the conditional acquisition rate falls significantly from year 1 to year 4 for
acquisitions by firms that had their IPO in a hot market, but not by firms that had an IPO in a cold market.
The spike in year 1 holds for all quintiles of underpricing for the whole sample, but it is not
significant for the first quintile. However, there is no significant difference in acquisition rates between
the first and fifth quintile. Though we do not report the results in the table, we also investigate conditional
acquisition rates for quintile of first-day returns computed across all acquisitions. We find similar results.
Since underpricing varies across hot and cold markets, we investigate (but do not report in the table) the
relation between underpricing and acquisition activity separately for hot and cold markets. We find no
statistically significant difference in conditional acquisition rates across underpricing quintiles between
firms that IPO in hot and cold markets.
In both samples, the year one spike is dramatic for the merger/IPO wave of the 1990s. The rate of
acquisition in year one is more than three times higher during the merger/IPO wave. Not surprisingly, the
rate of acquisition is significantly higher each year during the merger wave than in other years. Finally,
the year one acquisition rate is significantly higher during the merger wave but not for the sample that
excludes the years from the merger wave.

20
We turn next to the characteristics of the acquisitions of young firms. We discussed in the
introduction the literature which suggests that firms make diversifying acquisitions as their investment
opportunities disappear in their industry. We first consider results using the broad definition of
diversification. There is a spike in the acquisition rate of diversifying acquisitions in year 1 as well. In
year 1, firms have a conditional acquisition rate of 0.25 outside their industry. This rate falls over time so
that the acquisition rate outside the industry is 0.16 in year 4. As a proportion of the acquisitions, the
fraction of diversifying acquisitions increases from year 1 to year 4, but not significantly. 39% of the
acquisitions in year 1 are diversifying acquisitions when we use the whole sample of acquisitions; by year
4, 44% of the acquisitions are diversifying acquisitions. A similar result holds for the sample of
completed acquisitions. To further buttress the point that firms make diversifying acquisitions early in
life, it is striking that 40% of the acquisitions in the year of the IPO are diversifying acquisitions. Turning
to the narrower definition of diversification, we find similar results except, not surprisingly, for the fact
that using this stricter definition of diversification there are fewer diversifying acquisitions.
We saw earlier that young firms mostly acquire private firms and subsidiaries. For the sample as a
whole, there is no evidence of a spike in year 1 for acquisitions of public firms. When we compare IPOs
in hot and cold markets, we find similar results, though there is evidence of a spike in year 1 in the
acquisition of public firms for IPOs in hot markets (not reported). Over time, acquisitions of public firms
become more important as a fraction of all acquisitions because the acquisition rate falls for acquisitions
of private firms and subsidiaries. It follows from this that the year 1 spike in acquisitions is driven by
acquisitions of private firms and subsidiaries.
Lastly, we investigate the method of payment. When the data is available, cash is used more often
than equity. However, the stock acquisition rate is not significantly higher in year one than it is in year 4.
In contrast, the cash acquisition rate is. There is no evidence, therefore, that firms use their stock to pay
for acquisitions more intensely early on in their life. The acquisition rate for stock acquisitions is 0.09 for
hot market IPOs in year 1 and is 0.05 for cold market IPOs in the same year. However, the acquisition

21
spike is not significant for stock acquisitions whether the firm went public in a hot market or a cold
market.
We reproduce our analysis for the acquisition rate using the dollar acquisition rate, but do not show
the results in a table. The sample is notably smaller, so that our statistical tests have limited power when
we consider subsamples. There is no evidence of a year one spike with the sample of all acquisitions. In
fact, the conditional dollar acquisition rate is the same for year 1 and year 4, 0.04. For the same sample,
we find that the conditional dollar acquisition rate is significantly higher in years 2 and 3 for firms that
IPO in a hot market than for firms that IPO in a cold market. Further, young firms spend significantly
more on acquisitions during the merger/IPO wave of the 1990s than in other years. Though firms make
diversifying acquisitions early in their life, we find that they spend significantly more on acquisitions in
their 2-digit SIC code. Finally, the fraction of the amount spent on acquisitions that is spent on private
firms acquisitions falls significantly from year 1 to year 4, while the fraction of the amount spent on
public acquisitions increases significantly. Though firms spend more on private firm acquisitions in year
1 than on public firm acquisitions, the ranking flips already in year 2. However, the differences in these
fractions are never significant. The results are similar using the sample of completed acquisitions, but the
significance is typically less as that sample is smaller.
4.3. The influence of the age since incorporation`
Throughout the paper so far, we have ignored the fact that firms that go public vary in age since
incorporation. We now divide our IPO firms for which we have the year of incorporation into quintiles
according to their age since incorporation at the IPO. Panel a of Table 9 shows the median age since
incorporation for each of the quintiles. There is a surprisingly wide range of age since incorporation for
the IPO firms. We turn next to an investigation of whether the conditional acquisition rate of firms since
the IPO depends on the age of incorporation of firms. For that purpose, we show in Panel b of Table 9 the
conditional rate of young and mature firms relative to their IPO for each of the quintiles of age since
incorporation. We saw for the sample as a whole in Table 4 that there is no significant difference in the

22
conditional acquisition rate of young and mature firms. This result (not tabulated) holds as well for each
age since incorporation quintile except for the firms in the first quintile. We find evidence significant at
the 10% level that young firms acquire more than mature firms if they are in the youngest quintile.
However, this evidence is due entirely to the merger/IPO wave years. The last panel of the table looks at
the spike in year 1. We find that the spike is significant for all age quintiles since incorporation except for
the fourth quintile. However, once more, this result (not tabulated) is driven by the merger wave of the
1990s.
5. The market’s reaction to acquisitions by young and mature firms
In this section, we investigate the stock-price reaction to acquisition announcements by young and
mature firms. If firms make acquisitions because of an unexpected lack of growth opportunities, we
expect an especially poor reaction to acquisitions by young firms since they just went public partly based
on their investment opportunities. If young firms make acquisitions to exploit their growth opportunities
because acquisitions are complementary to capital expenditures or to take advantage of newly developed
capabilities, there would be no reason for the market to react adversely to acquisitions and it might react
more positively than to acquisitions made later in the lifecycle as the acquisitions might convey favorable
information about the capabilities developed by the firm. Matsusaka (2003) predicts a positive reaction to
acquisitions made by young firms that have developed new capabilities.
We estimate abnormal returns as net-of-market returns over the window [-1,+1] around the first
announcement date. Such an approach is especially appropriate for young firms since we do not have
much data to estimate a market model. It is well-known from the literature that announcement returns
differ by the type of target and by the method of payment.5 In Table 10, we therefore provide
announcement return estimates for acquisitions by young and mature firms across all combinations of
type of target and method of payment. However, only a subset of acquisitions has information on the
method of payment.
5 See, for instance, Fuller, Netter, and Stegemoller (2002).

23
The first panel of the Table reports abnormal returns for all acquisitions. We see that for all
acquisitions, young firms have higher abnormal returns than mature firms. When we consider different
types of targets, we see that young firms have higher abnormal returns than mature firms for both
acquisitions of private targets and acquisitions of subsidiaries. There is no difference in abnormal returns
between young and mature firms for acquisitions of public firms. When we turn to acquisitions for which
the method of payment information is available, we have a much smaller sample. The results are provided
in the next panel of the Table. The results are similar to those of the first panel, but significance is lower.
We consider separately acquisitions paid for with cash and acquisitions paid for with equity. The
results are provided in Table 11. Young firms experience higher abnormal returns than mature firms for
acquisitions paid for with cash. Strikingly, young firms have higher abnormal returns than mature firms
when they acquire public firms for cash. The same result holds for subsidiaries. However, there is no
significant difference for acquisitions of private firms. When we turn to acquisitions paid for with stock,
we find that for the whole sample of such acquisitions, young firms earn higher abnormal returns than
mature firms. However, this result does not hold for acquisitions of public firms with stock. For these
acquisitions, there is no difference for the mean abnormal return and for median young firms have lower
abnormal returns than mature firms.
In Table 11, we separate acquisitions into diversifying and related acquisitions using our broader
definition of diversification. To the extent that firms diversify when they have poor internal growth
opportunities, we would expect diversifying acquisitions to signal to the market that a firm does not have
good internal growth opportunities. We saw that the only acquisitions by young firms to which the market
reacts negatively are acquisitions of public firms paid for with stock. Strikingly, this result is due to
related acquisitions. The market reacts more favorably to diversifying acquisitions by young firms paid
for with stock than to related acquisitions. Further, the market reacts more adversely to related
acquisitions of public firms paid for with stock than it does to diversifying acquisitions. We also
investigated the returns of acquisitions using our narrow measure of diversification (not tabulated). With
that measure, the results are largely similar to those using the broader measure.

24
6. Conclusion
In this paper, we investigate the acquisition behavior of IPO cohorts through their lifecycle. We find
that the acquisition rate of IPO cohorts follows a u-shape: the acquisition rate is higher when firms are
young (their first three complete calendar years) and when they are mature (years ten to twenty) than
when they are middle-aged (years four to ten). This pattern is heavily influenced by the intensity of
activity in the acquisition market. During the merger/IPO of 1995 to 2000, young firms were dramatically
more acquisitive than mature firms. In contrast, in other periods, mature firms are at least as acquisitive as
young firms. However, young and mature firms differ in the type of acquisitions they make. Young firms
make more acquisitions of private firms and fewer acquisitions of public firms relative to mature firms.
Consequently, if one were to focus only on acquisitions of public firms, one would conclude that mature
firms are more acquisitive than young firms. Any theory that explains why young firms are more
acquisitive has to explain why this greater acquisition rate translates itself into more acquisitions of
private firms than of public firms.
Theories of acquisitions in the lifecycle of firms that argue that firms become acquisitive and
diversify because they run out of internal growth opportunities cannot explain the evidence we present.
Not only do firms acquire intensely just after they go public but they make diversifying acquisitions at
roughly the same rate early in their life as they do when they mature. Further, if acquisitions are made
because a firm has run out of internal growth opportunities and has to acquire growth opportunities for
which it has no clear advantage, we would expect the market to react adversely to acquisitions by young
firms and especially diversifying ones. However, we show that the market generally reacts more
positively to acquisitions by young firms. Such a finding is consistent with younger firms having acquired
capabilities that enable them to make value-creating acquisitions to complement internal growth and to
expand their scope. The exception to this result is that the market reacts poorly to acquisitions of public
firms for equity irrespective of whether a firm is young or mature and reacts worst of all to the acquisition
of related public firms paid for with equity.

25
Table 1. IPO sample and rate of survival IPOs are identified using the SDC Global Issues Database. The IPO sample includes all initial public offerings in 1975-2002, and excludes reverse LBOs, spinoffs, rights and unit offerings, ADRs, closed-end funds, and REITs. In addition IPO firms with trade data available in CRSP before their IPO announcement date are excluded. Acquisition deals of the IPO firms include all acquisitions in the SDC’s M&A database for 1981-2006. Event Year refers to the deal year with respect to the IPO year, event year 0. The first three columns provide the IPO year, total number of IPOs in each IPO year, and the percentage of new IPOs in each IPO year compared to the total number of IPOs in the sample. IPO proceeds are reported by the SDC Global Issues Database and calculated as the total number of shares issued multiplied by the offer price. IPO underpricing is calculated as the percentage initial return (P1-P0)*100/P0, where P1 is the first-day closing stock price or bid-ask average (from CRSP) and P0 is the IPO offer price. Total Assets ($M) are reported by SDC and are measured before the IPO. All dollar values are reported in 2004 dollars using the CPI as a deflator. IPO total assets are available for 4,244 (63%). IPO underpricing is calculated for the 6,518 IPOs (out of 6,548) for which data are available. The post-IPO survival rate is calculated as the number of firms alive as of January 1st of the 5th, 10th, and 20th event year over the total number of IPO firms. The last two columns report the total number and percentage of IPO firms that survived until the end of the sample period, January 1st, 2007.
1975 5 0.08% 57.93 4.38 4 80% 3 60% 3 60% 1 20%1976 32 0.49% 18.43 0.56 27 84% 12 38% 9 28% 4 13%
1977 22 0.34% 12.62 6.63 15 68% 7 32% 5 23% 2 9%
1978 28 0.43% 15.79 19.17 22 79% 16 57% 7 25% 2 7%
1979 52 0.79% 17.43 6.25 48 92% 29 56% 14 27% 8 15%
1980 99 1.51% 11.46 12.50 85 86% 58 59% 21 21% 13 13%
1981 236 3.60% 12.47 3.71 195 83% 119 50% 49 21% 36 15%
1982 82 1.25% 9.79 5.77 59 72% 37 45% 18 22% 13 16%
1983 477 7.28% 18.97 4.03 1.71 387 81% 224 47% 80 17% 59 12%
1984 218 3.33% 10.73 1.47 162 74% 94 43% 36 17% 30 14%
1985 212 3.24% 15.10 3.96 23.70 165 78% 98 46% 31 15% 24 11%
1986 451 6.89% 18.61 2.88 41.62 364 81% 243 54% 86 19% 79 18%
1987 315 4.81% 16.63 2.50 24.44 231 73% 157 50% 51 16% 51 16%
1988 134 2.05% 19.16 2.73 63.07 103 77% 66 49% 31 23%
1989 117 1.79% 24.07 5.00 29.40 96 82% 60 51% 28 24%
1990 103 1.57% 24.28 7.69 24.14 86 83% 54 52% 25 24%
1991 225 3.44% 34.95 9.82 28.85 196 87% 110 49% 66 29%
1992 295 4.51% 30.29 4.84 24.91 236 80% 138 47% 86 29%
1993 434 6.63% 32.29 6.93 35.56 348 80% 177 41% 125 29%
1994 359 5.48% 28.04 4.69 25.24 281 78% 125 35% 86 24%
1995 431 6.58% 37.93 14.88 25.04 283 66% 143 33% 120 28%
1996 641 9.79% 37.56 10.00 19.62 383 60% 179 28% 164 26%
1997 426 6.51% 37.07 9.74 23.24 261 61% 131 31% 131 31%
1998 269 4.11% 40.68 9.09 32.45 165 61% 98 36%
1999 432 6.60% 68.03 38.54 31.29 239 55% 160 37%
2000 327 4.99% 43.88 26.61 64.39 199 61% 155 47%
2001 63 0.96% 67.30 13.00 158.07 50 79% 44 70%
2002 63 0.96% 89.25 6.33 172.94 42 67% 42 67%
Total 6,548 100.00% 4732 72% 2280 35% 410 6% 1683 26%
24.18 6.29 28.85 165 78% 98 47% 21 21% 43 24%
IPO Year
Total # of IPOsMedian IPO
Proceeds ($M)Median IPO
Underpricing (%)
Median IPO Total Assets
($M)
Survival Rate
January 1st of Event YearEnd of Sample Period
in Calendar Year
Year 5 Year 10 Year 20 (January 1st, 2007)
Median Values Across IPO cohorts

26
Table 2. Conditional acquisition rate by cohort IPOs are identified using the SDC Global Issues Database. The IPO sample includes all initial public offerings in 1975-2002, and excludes reverse LBOs, spinoffs, rights and unit offerings, ADRs, closed-end funds, and REITs. In addition IPO firms with trade data available in CRSP before their IPO announcement date are excluded. Acquisition deals of the IPO firms include all acquisitions in the SDC M&A database for 1981-2006. Event year refers to the deal year with respect to the IPO year, event year 0. The conditional acquisition rate is the ratio of acquisitions in a year divided by the number of firms alive and public at the beginning of that year. Firms' delisting information is obtained from the CRSP database. The highest conditional acquisition rate for a cohort is in bold.
0 1 2 3 4 5 6 7 8 9 10 11 12 13 14 15 16 17 18 19 20 21 22 23 24 25
1975 5 18 0.00 0.00 0.50 0.00 0.00 0.00 0.00 0.33 0.33 1.00 0.00 0.33 0.33 0.33 0.00 0.00 0.00 0.67 0.50 0.00 0.217 0.000
1976 32 68 0.04 0.04 0.19 0.20 0.00 0.33 0.00 0.10 0.10 0.22 0.67 0.11 0.33 0.67 0.22 0.67 0.44 1.13 0.57 0.60 0.00 0.316 0.222
1977 22 80 0.12 0.00 0.00 0.11 0.00 0.25 0.43 0.83 1.17 0.40 1.20 0.20 0.60 1.20 0.40 2.00 1.20 0.80 1.00 0.50 0.25 0.33 0.590 0.414
1978 28 81 0.00 0.08 0.18 0.55 0.16 0.11 0.28 0.50 0.53 0.57 0.00 0.33 0.44 0.11 0.33 0.75 0.25 0.57 0.00 0.83 0.00 0.00 0.00 0.286 0.250
1979 52 200 0.06 0.20 0.22 0.25 0.14 0.08 0.34 0.23 0.24 0.38 0.46 0.52 0.55 0.50 0.55 0.67 0.44 0.69 0.93 0.38 0.08 0.40 0.60 0.40 0.388 0.392
1980 99 286 0.06 0.12 0.22 0.13 0.06 0.12 0.09 0.11 0.23 0.21 0.22 0.29 0.43 0.23 0.26 0.47 0.33 0.59 0.63 0.43 0.56 0.56 0.41 0.63 0.50 0.315 0.257
1981 236 750 0.02 0.18 0.31 0.20 0.04 0.09 0.10 0.08 0.25 0.22 0.25 0.19 0.25 0.43 0.43 0.38 0.60 0.59 0.63 0.50 0.33 0.36 0.62 0.68 0.83 0.72 0.357 0.319
1982 82 225 0.04 0.35 0.27 0.08 0.16 0.19 0.09 0.15 0.31 0.32 0.38 0.24 0.31 0.23 0.19 0.32 0.33 0.27 0.16 0.16 0.28 0.50 0.44 0.53 0.14 0.257 0.266
1983 477 1,383 0.13 0.26 0.13 0.15 0.09 0.12 0.18 0.21 0.23 0.30 0.38 0.35 0.42 0.41 0.60 0.55 0.41 0.28 0.26 0.20 0.33 0.41 0.47 0.30 0.298 0.289
1984 218 769 0.17 0.06 0.13 0.14 0.11 0.20 0.15 0.26 0.31 0.43 0.41 0.51 0.70 0.49 0.78 0.73 0.75 0.65 0.53 0.70 1.06 0.66 0.82 0.467 0.486
1985 212 564 0.03 0.15 0.13 0.14 0.23 0.31 0.21 0.29 0.20 0.23 0.30 0.37 0.39 0.49 0.33 0.29 0.21 0.32 0.32 0.63 0.58 0.72 0.312 0.294
1986 451 2,228 0.06 0.23 0.25 0.33 0.29 0.28 0.35 0.45 0.49 0.55 0.57 0.62 0.57 0.89 0.67 0.46 0.43 0.64 0.55 0.99 1.20 0.517 0.491
1987 315 1,186 0.06 0.19 0.26 0.26 0.37 0.33 0.36 0.53 0.48 0.54 0.52 0.69 0.34 0.53 0.37 0.32 0.46 0.36 0.27 0.36 0.379 0.363
1988 134 557 0.06 0.42 0.32 0.32 0.45 0.45 0.49 0.62 0.46 0.58 0.27 0.39 0.36 0.49 0.33 0.32 0.31 0.21 0.26 0.375 0.364
1989 117 685 0.13 0.58 0.52 0.45 0.55 0.61 0.69 0.51 0.51 0.52 0.47 0.59 0.54 0.50 0.62 0.67 0.66 0.83 0.552 0.544
1990 103 678 0.51 0.88 0.76 0.40 0.46 0.47 0.65 0.54 0.63 0.81 1.02 0.28 0.36 0.32 0.80 0.73 1.00 0.624 0.625
1991 225 1,250 0.18 0.71 0.64 0.75 0.72 0.50 0.55 0.53 0.42 0.44 0.36 0.33 0.27 0.45 0.47 0.49 0.488 0.483
1992 295 1,834 0.37 0.79 0.73 0.62 0.785 0.70 0.63 0.73 0.47 0.46 0.40 0.47 0.52 0.71 0.55 0.596 0.619
1993 434 2,082 0.29 0.72 0.60 0.60 0.67 0.56 0.51 0.49 0.33 0.38 0.33 0.30 0.36 0.60 0.481 0.501
1994 359 1,991 0.35 0.96 1.02 0.88 0.87 0.55 0.47 0.38 0.34 0.38 0.50 0.36 0.59 0.589 0.496
1995 431 2,006 0.39 1.27 1.02 0.74 0.47 0.37 0.25 0.24 0.30 0.30 0.40 0.49 0.518 0.392
1996 641 3,093 0.58 1.41 1.06 0.68 0.41 0.33 0.32 0.42 0.48 0.55 0.45 0.609 0.484
1997 426 2,226 0.71 1.87 1.03 0.49 0.32 0.34 0.45 0.48 0.66 0.57 0.691 0.530
1998 269 1,535 1.13 1.62 0.83 0.49 0.58 0.59 0.76 0.61 0.73 0.816 0.731
1999 432 1,615 0.68 1.35 0.46 0.32 0.35 0.48 0.62 0.65 0.613 0.549
2000 327 707 0.48 0.52 0.39 0.31 0.31 0.32 0.28 0.371 0.317
2001 63 202 0.25 0.79 0.77 0.66 0.54 0.44 0.575 0.596
2002 63 177 0.30 0.54 0.66 0.94 0.76 0.641 0.655
Total 6,548 28,476
0.31 0.69 0.52 0.41 0.39 0.34 0.35 0.35 0.37 0.37 0.40 0.39 0.43 0.44 0.50 0.49 0.44 0.49 0.44 0.59 0.63 0.44 0.59 0.45 0.44 0.28
0.27 0.58 0.49 0.33 0.36 0.33 0.33 0.38 0.34 0.38 0.39 0.37 0.38 0.45 0.45 0.46 0.44 0.33 0.42 0.50 0.58 0.44 0.59 0.50 0.55 0.33
22 23 24 25 26 26 26 25 24 23 22 21 20 19 18 17 16 15 14 13 12 11 10 9 8 7
Median conditional acquisition rate for event year
Mean conditional acquisition rate for event year
Number of IPO cohorts
Event yearMedian conditional acquisition rate of
cohort
Mean conditional acquisition rate of
cohortIPO Year
Total # of IPOs
Total # of deals

27
Table 3. Conditional dollar acquisition rate IPOs are identified using the SDC Global Issues Database. The IPO sample includes all initial public offerings in 1975-2002 and excludes reverse LBOs, spinoffs, rights and unit offerings, ADRs, closed-end funds, and REITs. In addition IPO firms with trade data available in CRSP before their IPO announcement date are excluded. Acquisitions of the IPO firms include all acquisitions in the SDC M&A database for 1981-2006. Event year refers to the year with respect to the IPO year, event year 0. The conditional dollar acquisition rate is the ratio of the total consideration paid by all firms in an IPO cohort for all their deals during the event year divided the total assets of the firms in that cohort at the beginning of the event year. Firms with missing transaction values are excluded from both the numerator and the denominator. Deal size is reported by SDC as the transaction value, and the total asset value is obtained from the COMPUSTAT/CRSP merged database maintained by WRDS.
0 1 2 3 4 5 6 7 8 9 10 11 12 13 14 15 16 17 18 19 20 21 22 23 24 251975 2.06 23.26 19.01 2.28 0.54 9.43 2.281976 0.09 0.65 0.32 0.61 0.61 0.56 0.36 1.79 6.08 1.16 0.08 1.12 0.611977 1.91 1.07 0.18 12.58 4.37 1.55 4.24 0.50 0.16 2.26 2.88 1.731978 0.38 0.12 6.25 0.36 0.02 7.61 0.11 0.01 24.22 0.35 3.94 0.361979 1.04 0.05 0.29 1.29 0.31 0.74 1.40 0.06 0.09 0.44 0.21 0.42 0.25 0.03 10.56 0.20 1.99 0.01 0.03 0.74 1.01 0.301980 0.72 2.19 0.95 1.70 0.28 7.03 0.44 1.20 1.88 0.16 1.85 0.30 0.85 2.22 0.92 0.52 8.08 26.40 6.77 0.02 3.14 0.08 1.69 5.36 1.80 3.06 1.691981 1.05 3.33 5.39 8.34 1.40 1.69 9.46 3.64 5.45 2.96 0.85 0.83 0.36 1.96 0.64 1.75 4.31 4.95 0.31 2.61 0.75 0.19 0.87 0.18 0.63 0.72 2.49 1.551982 16.61 1.97 8.55 8.58 5.15 0.07 0.08 0.71 1.03 1.55 1.18 4.41 0.51 0.09 0.17 4.36 2.65 0.02 0.70 1.11 2.94 2.74 7.18 3.15 1.551983 3.60 0.71 2.08 0.86 0.45 0.99 0.91 0.10 0.05 0.22 0.49 0.39 1.25 1.35 0.28 0.35 0.22 3.36 4.60 0.41 0.41 0.42 1.20 0.99 1.07 0.601984 7.26 2.33 3.68 3.53 4.03 0.79 0.72 0.38 0.85 1.95 0.77 0.72 0.96 16.64 4.86 1.52 1.37 0.49 0.13 0.05 1.12 2.24 2.67 2.57 1.371985 0.22 0.92 0.73 1.18 0.42 0.63 0.15 0.11 3.22 0.32 0.66 0.60 0.92 0.62 0.95 0.72 1.08 0.44 0.23 3.74 0.00 1.19 0.87 0.651986 1.02 1.62 1.79 1.49 0.80 1.08 0.43 1.52 1.62 0.71 0.84 0.79 1.46 0.60 0.54 0.29 0.10 0.16 0.10 1.59 0.53 0.91 0.801987 3.30 0.80 1.06 0.96 4.11 0.80 0.53 2.40 1.65 1.20 3.43 1.99 4.12 5.77 9.75 1.85 1.33 0.28 0.18 0.32 2.29 1.491988 0.82 7.61 2.33 1.28 3.92 1.91 6.35 2.06 4.24 9.84 15.77 1.09 0.35 3.54 0.74 0.79 0.55 0.42 6.43 3.69 2.061989 2.12 1.53 7.36 1.48 1.79 3.86 6.71 5.21 2.93 19.05 0.40 2.46 0.76 4.57 1.29 4.20 0.81 2.90 3.86 2.681990 6.45 2.63 4.23 0.47 3.21 2.85 1.20 0.72 1.59 3.54 2.01 1.45 2.86 1.57 0.35 0.44 0.73 2.14 1.591991 0.29 3.39 2.90 4.98 5.17 3.65 1.13 2.74 0.83 1.85 3.05 0.61 5.04 2.12 1.73 0.71 2.51 2.431992 0.33 1.42 1.25 4.53 2.60 2.31 0.84 0.66 0.48 0.91 0.38 4.72 0.62 1.18 1.83 1.60 1.181993 1.85 3.79 4.70 4.81 8.95 11.03 5.29 4.23 2.52 2.68 1.34 3.20 0.84 3.90 4.22 3.851994 1.25 4.84 7.32 8.13 4.25 3.98 4.35 2.37 3.21 1.99 1.88 1.80 24.11 5.34 3.981995 2.84 5.58 11.92 3.80 1.78 4.34 22.98 0.74 1.66 0.76 1.21 2.13 4.98 2.491996 1.50 5.54 6.89 6.41 6.15 3.14 3.21 1.77 2.79 1.17 2.01 3.69 3.141997 0.92 10.23 24.17 4.83 3.22 3.21 1.37 1.30 7.34 1.28 5.79 3.221998 3.48 7.74 17.52 5.53 5.24 2.05 2.55 2.36 7.41 5.99 5.241999 7.31 14.48 2.23 0.66 0.35 0.92 0.31 0.76 3.38 0.842000 2.48 3.37 1.21 2.14 0.69 0.62 0.82 1.62 1.212001 0.01 0.33 0.65 0.26 0.90 0.28 0.40 0.312002 3.29 2.68 5.31 4.53 23.21 7.80 4.53
Mean percentage conditional dollar
acquisition rate for event year
2.45 4.44 5.00 3.32 3.67 2.28 3.48 1.68 2.42 2.67 2.05 1.86 3.03 2.84 2.91 2.12 1.20 2.78 4.27 4.44 1.36 1.65 1.69 0.68 2.68 1.38
Median percentage conditional dollar
acquisition rate for event year
1.85 3.33 2.62 2.84 2.26 1.69 1.17 1.41 1.65 1.28 1.03 1.32 0.94 1.57 0.74 0.72 0.73 1.39 0.23 1.69 0.53 1.55 1.20 0.50 0.63 1.27
Event year Mean percentage conditional dollar acquisition rate of cohort
Median percentage conditional dollar acquisition rate of cohortIPO Year

28
Table 4. Conditional acquisition rate of young versus mature firms. IPO data and acquisition deals are obtained from SDC Platinum. The IPO sample includes all initial public offerings in 1975-2002, excluding reverse LBOs, spinoffs, rights and unit offerings, ADRs, closed-end funds, and REITs. In addition IPO firms with trade data available in CRSP before their IPO announcement date is excluded. Acquisitions of the IPO firms are identified using the SDC M&A database and include all acquisitions announced in 1981-2006. Event year refers to the year relative to the IPO year, which is event year 0. The conditional acquisition rate is the ratio of acquisitions of a given type in a year divided by the number of firms alive and public at the beginning of that year. The IPO market is classified as hot, cold, or neutral following Helwege and Liang (2004). The merger/IPO boom denotes the period from 1995 to 2000. IPO underpricing is calculated as the percentage initial return (P1-P0)*100/P0, where P1 is the first-day closing stock price or bid-ask average (from CRSP) and P0 is the IPO offer price . The IPO underpricing quintiles are obtained using the sub-sample of 6,518 IPOs (out of 6,548) for which we have data. The method of payment is reported by SDC for deals that are classified as having disclosed the details of the transactions. The target’s organizational form is classified using the data available in SDC into private, public, subsidiary, and unknown. The superscripts a,b,c denote statistical significance at the 1%, 5%, and 10% level, respectively. The tests of means use a t-statistic and the tests of proportions use a z-statistic.
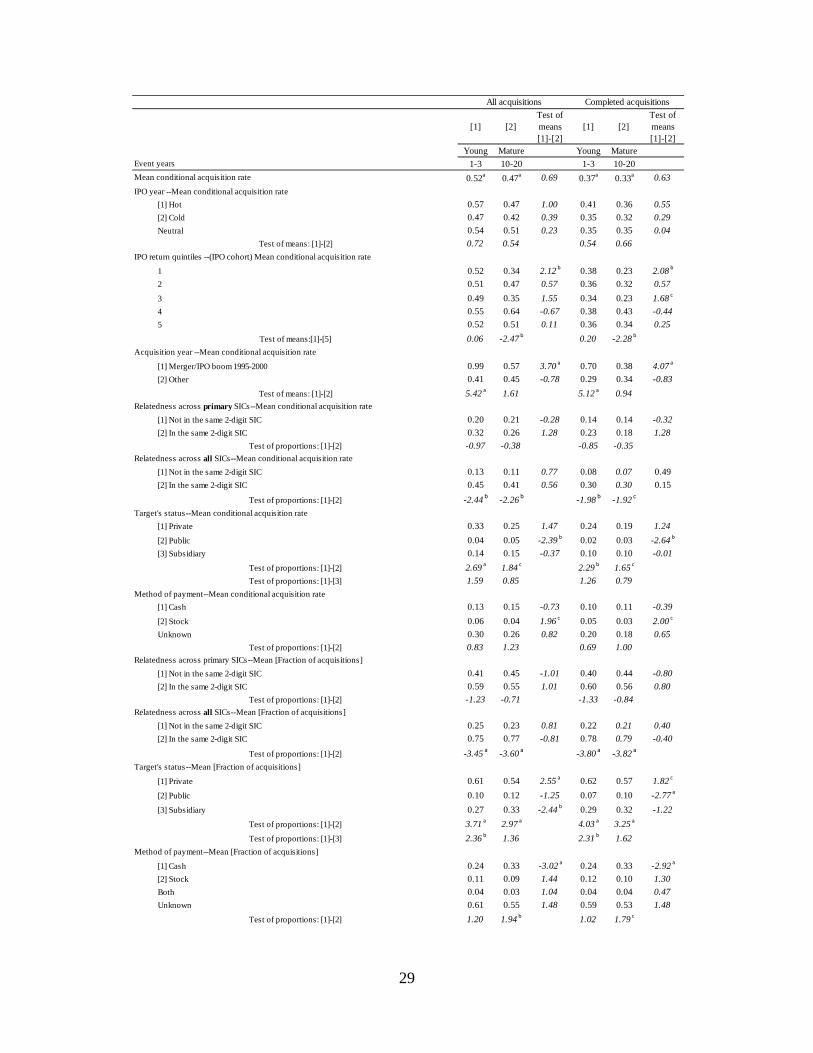
29
[1] [2]Test of means [1]-[2]
[1] [2]Test of means [1]-[2]
Young Mature Young MatureEvent years 1-3 10-20 1-3 10-20
Mean conditional acquisition rate 0.52a 0.47a 0.69 0.37a 0.33a 0.63
IPO year --Mean conditional acquisition rate
[1] Hot 0.57 0.47 1.00 0.41 0.36 0.55
[2] Cold 0.47 0.42 0.39 0.35 0.32 0.29
Neutral 0.54 0.51 0.23 0.35 0.35 0.04
Test of means: [1]-[2] 0.72 0.54 0.54 0.66
IPO return quintiles --(IPO cohort) Mean conditional acquisition rate
1 0.52 0.34 2.12 b 0.38 0.23 2.08 b
2 0.51 0.47 0.57 0.36 0.32 0.57
3 0.49 0.35 1.55 0.34 0.23 1.68 c
4 0.55 0.64 -0.67 0.38 0.43 -0.44
5 0.52 0.51 0.11 0.36 0.34 0.25
Test of means:[1]-[5] 0.06 -2.47 b 0.20 -2.28 b
Acquisition year --Mean conditional acquisition rate
[1] Merger/IPO boom 1995-2000 0.99 0.57 3.70 a 0.70 0.38 4.07 a
[2] Other 0.41 0.45 -0.78 0.29 0.34 -0.83
Test of means: [1]-[2] 5.42 a 1.61 5.12 a 0.94Relatedness across primary SICs--Mean conditional acquisition rate
[1] Not in the same 2-digit SIC 0.20 0.21 -0.28 0.14 0.14 -0.32
[2] In the same 2-digit SIC 0.32 0.26 1.28 0.23 0.18 1.28
Test of proportions: [1]-[2] -0.97 -0.38 -0.85 -0.35Relatedness across all SICs--Mean conditional acquisition rate
[1] Not in the same 2-digit SIC 0.13 0.11 0.77 0.08 0.07 0.49
[2] In the same 2-digit SIC 0.45 0.41 0.56 0.30 0.30 0.15
Test of proportions: [1]-[2] -2.44 b -2.26 b -1.98 b -1.92 c
Target's status--Mean conditional acquisition rate
[1] Private 0.33 0.25 1.47 0.24 0.19 1.24
[2] Public 0.04 0.05 -2.39 b 0.02 0.03 -2.64 b
[3] Subsidiary 0.14 0.15 -0.37 0.10 0.10 -0.01
Test of proportions: [1]-[2] 2.69 a 1.84 c 2.29 b 1.65 c
Test of proportions: [1]-[3] 1.59 0.85 1.26 0.79
Method of payment--Mean conditional acquisition rate
[1] Cash 0.13 0.15 -0.73 0.10 0.11 -0.39
[2] Stock 0.06 0.04 1.96 c 0.05 0.03 2.00 c
Unknown 0.30 0.26 0.82 0.20 0.18 0.65
Test of proportions: [1]-[2] 0.83 1.23 0.69 1.00Relatedness across primary SICs--Mean [Fraction of acquisitions]
[1] Not in the same 2-digit SIC 0.41 0.45 -1.01 0.40 0.44 -0.80
[2] In the same 2-digit SIC 0.59 0.55 1.01 0.60 0.56 0.80
Test of proportions: [1]-[2] -1.23 -0.71 -1.33 -0.84Relatedness across all SICs--Mean [Fraction of acquisitions]
[1] Not in the same 2-digit SIC 0.25 0.23 0.81 0.22 0.21 0.40
[2] In the same 2-digit SIC 0.75 0.77 -0.81 0.78 0.79 -0.40
Test of proportions: [1]-[2] -3.45 a -3.60 a -3.80 a -3.82 a
Target's status--Mean [Fraction of acquisitions]
[1] Private 0.61 0.54 2.55 a 0.62 0.57 1.82 c
[2] Public 0.10 0.12 -1.25 0.07 0.10 -2.77 a
[3] Subsidiary 0.27 0.33 -2.44 b 0.29 0.32 -1.22
Test of proportions: [1]-[2] 3.71 a 2.97 a 4.03 a 3.25 a
Test of proportions: [1]-[3] 2.36 b 1.36 2.31 b 1.62
Method of payment--Mean [Fraction of acquisitions]
[1] Cash 0.24 0.33 -3.02 a 0.24 0.33 -2.92 a
[2] Stock 0.11 0.09 1.44 0.12 0.10 1.30
Both 0.04 0.03 1.04 0.04 0.04 0.47
Unknown 0.61 0.55 1.48 0.59 0.53 1.48
Test of proportions: [1]-[2] 1.20 1.94 b 1.02 1.79 c
All acquisitions Completed acquisitions

30
Table 5. Conditional dollar acquisition rates of young versus mature firms. IPO data and acquisition deals are obtained from SDC Platinum. The IPO sample includes all initial public offerings in 1975-2002, excluding reverse LBOs, spinoffs, rights and unit offerings, ADRs, closed-end funds, and REITs. In addition IPO firms with trade data available in CRSP before their IPO announcement date is excluded. Acquisitions of the IPO firms are identified using the SDC M&A database and include all acquisition deals announced in 1981-2006. Event year refers to year with respect to the IPO year, event year 0. The conditional dollar acquisition rate is the ratio of all considerations paid for acquisitions of a given type in a year divided by the total assets of the firms alive and public at the beginning of that year. The transaction size ratio is the dollar value of acquisitions with a given characteristics divided by the dollar amount of acquisitions. Acquisition size is reported by SDC as the transaction value, and the total asset value is obtained from the COMPUSTAT/CRSP merged database maintained by WRDS. The IPO market is classified as hot, cold, or neutral following Helwege and Liang (2004). The merger/IPO boom denotes the period from 1995 to 2000. IPO underpricing is calculated as the percentage initial return (P1-P0)*100/P0, where P1 is the first-day closing stock price or bid-ask average (from CRSP) and P0 is the IPO offer price. The IPO underpricing quintiles are obtained using the sub-sample of 6,518 IPOs (out of 6,548) for which we have data. The method of payment is reported by SDC for deals that are classified as having disclosed the details of the transactions. The target’s organizational form is classified using the data available in SDC into private, public, subsidiary, and unknown. The superscripts a,b,c denote statistical significance at the 1%, 5%, and 10% level, respectively. The tests of means use a t-statistic and the tests of proportions use a z-statistic.

31
[1] [2]Test of means [1]-[2]
[1] [2]Test of means [1]-[2]
Young Mature Young Mature1-3 10-20 1-3 10-20
Mean conditional dollar acquisition rate 0.04 0.03 1.44 0.03 0.02 1.72 c
IPO year--Mean conditional dollar acquisition rate
[1] Hot 0.06 0.04 1.26 0.04 0.02 2.00 b
[2] Cold 0.03 0.03 -0.07 0.02 0.02 0.00
Neutral 0.03 0.02 2.15 b 0.02 0.01 1.80 c
Test of means: [1]-[2] 2.10 b 1.00 1.63 -0.25IPO return quintiles (IPO cohort)--Mean conditional dollar acquisition rate
1 0.05 0.02 3.62 a 0.03 0.02 3.00 a
2 0.04 0.03 0.92 0.03 0.01 2.31 b
3 0.03 0.02 1.37 0.01 0.01 0.43
4 0.05 0.03 1.76 c 0.04 0.02 1.98 c
5 0.08 0.16 -0.61 0.06 0.15 -0.71
Test of means: [1]-[5] -1.56 -1.02 -1.85 c -1.07Acquisition year--Mean conditional dollar acquisition rate
[1] Merger/IPO boom 1995-2000 0.08 0.03 3.25 a 0.06d 0.02 2.84 b
[2] Other 0.03 0.02 1.02 0.02 0.01 1.19
Test of means: [1]-[2] 3.83 a 1.31 3.89 a 1.42Relatedness across primary SICs--Mean conditional dollar acquisition rate
[1] Not in the same 2-digit SIC 0.01 0.01 -0.72 0.01 0.01 -0.64
[2] In the same 2-digit SIC 0.03 0.02 2.19 b 0.02 0.01 2.35 b
Test of proportions: [1]-[2] -0.49 -0.04 -0.46 -0.06Relatedness across all SICs--Mean conditional dollar acquisition rate
[1] Not in the same 2-digit SIC 0.01 0.01 -0.01 0.002 0.002 -0.24
[2] In the same 2-digit SIC 0.04 0.03 1.19 0.03 0.01 2.44 b
Test of proportions: [1]-[2] -0.75 -0.56 -0.73 -0.45Target's status--Mean conditional dollar acquisition rate
[1] Private 0.01 0.003 4.00 a 0.01 0.003 3.37 a
[2] Public 0.02 0.02 0.80 0.01 0.01 1.08[3] Subsidiary 0.01 0.01 -0.27 0.01 0.01 -0.24
Test of proportions: [1]-[2] -0.24 -0.41 -0.15 -0.27Test of proportions: [1]-[3] 0.05 -0.32 0.04 -0.27
Method of payment--Mean conditional dollar acquisition rate[1] Cash 0.01 0.02 -0.48 0.01 0.01 0.01[2] Stock 0.01 0.01 -1.12 0.01 0.01 0.77
Unknown 0.02 0.003 2.94 a 0.01 0.002 2.58 b
Test of proportions: [1]-[2] -1.13 0.20 -0.05 0.05Relatedness across primary SICs--Mean [Fraction of acquisitions]
[1] Not in the same 2-Digit SIC 0.34 0.39 -0.76 0.35 0.40 -0.74[2] In the same 2-Digit SIC 0.66 0.61 0.76 0.65 0.60 0.74
Test of proportions: [1]-[2] -2.21 b -1.51 -2.10 b -1.35Relatedness across all SICs--Mean [Fraction of acquisitions]
[1] Not in the same 2-Digit SIC 0.18 0.13 1.00 0.22 0.16 0.87[2] In the same 2-Digit SIC 0.82 0.87 -1.00 0.78 0.84 -0.87
Test of proportions: [1]-[2] -4.43 a -4.90 a -3.94 a -4.48 a
Target's status--Mean [Fraction of acquisitions][1] Private 0.33 0.27 1.64 0.37 0.31 1.18
[2] Public 0.32 0.39 -1.22 0.28 0.37 -1.70 c
[3] Subsidiary 0.33 0.32 0.22 0.33 0.31 0.38Test of proportions: [1]-[2] 0.04 -0.82 0.61 -0.42Test of proportions: [1]-[3] 0.02 -0.32 0.26 0.01
Method of payment--Mean [Fraction of acquisitions]
[1] Cash 0.33 0.54 -3.55 a 0.36 0.51 -2.39 b
[2] Stock 0.28 0.23 0.89 0.25 0.24 0.23Both 0.33 0.13 -1.54 0.06 0.10 -1.59
Unknown 0.07 0.10 3.18 a 0.33 0.15 2.73 a
Test of proportions: [1]-[2] 0.41 1.96 b 0.86 1.87 c
All acquisitions Completed acquisitions

32
Table 6. OLS regressions for conditional acquisition rate of IPO cohorts during 1975-2002 This table presents the regression coefficients for OLS regression models where the dependent variable is the conditional acquisition rate for IPO cohorts in an event year. Observations where there are less than 20 firms alive for the IPO cohort are excluded. The merger/IPO boom denotes the period from 1995 to 2000. M&A index is constructed by dividing the total number of acquisitions in SDC by the number of active firms in Compustat. The IPO market is classified as hot, cold, or neutral following Helwege and Liang (2004). IPO underpricing is calculated as the percentage initial return (P1-P0)*100/P0, where P1 is the first-day closing stock price or bid-ask average (from CRSP) and P0 is the IPO offer price. Robust standard errors with clustering on IPO-cohort are reported below the coefficient estimates. The superscripts a,b,c denote statistical significance at the 1%, 5%, and 10% level, respectively.
Dependent variable is conditional acquisition rate (1) (2) (3) (4) (5) (6) (7) (8)
Deal is within 4-9 years after IPO (Yes=1) -0.13b -0.13b -0.12
a -0.12b -0.19a -0.19a 0.02 -0.04
0.05 0.04 0.04 0.04 0.05 0.05 0.08 0.05
Deal is more than 9 years from IPO (Yes=1) -0.04 -0.05 -0.02 -0.05 -0.11c -0.10c 0.20b 0.10c
0.07 0.05 0.06 0.05 0.06 0.06 0.08 0.05
Merger/IPO boomt (Yes=1 if deals are in 1995-
2000) 0.22a 0.22a 0.18a 0.18a 0.31a
0.03 0.03 0.03 0.03 0.11
M&A indext 0.22a
0.05
Above average M&A indext (Yes=1) 0.15 0.09
Merger/IPO boomt-1 0.04 0.03
0.03 0.02IPO cohort went public in HOT periods (Yes=1) 0.05 0.04 0.07 0.07IPO cohort went public in COLD periods (Yes=1) 0.003 -0.005 0.07 0.07Mean (IPO cohort's first day return) 0.001 0.001
0.002 0.001
Above average M&A indext (Yes=1) * Deal is
within 1-3 years after IPO (Yes=1) 0.27a
0.07
Above average M&A Indext (Yes=1) * Deal is
within 4-9 years after IPO (Yes=1) -0.030.13
Above average M&A indext (Yes=1) * Deal is more
than 9 years from IPO (Yes=1) -0.20c
0.1
Merger/IPO boomt (Yes=1 if deals are in 1995-
2000) * Deal is within 1-3 years after IPO (Yes=1) 0.34a
0.1
Merger/IPO boomt (Yes=1 if deals are in 1995-
2000)* Deal is within 4-9 years after IPO (Yes=1) -0.050.12
Merger/IPO boomt (Yes=1 if deals are in 1995-
2000)* Deal is more than 9 years from IPO (Yes=1)-0.28a
0.11
Constant 0.50a
0.44a
0.34a 0.42a 0.49a 0.47a 0.29
a 0.35a
0.06 0.04 0.06 0.09 0.06 0.09 0.07 0.05R-squared 0.03 0.19 0.09 0.19 0.20 0.21 0.18 0.34Number of groups 27 27 27 27 27 27 27 27Number of observations 391 391 391 391 369 369 391 391

33
Table 7. OLS regressions for conditional dollar acquisition rate of IPO cohorts during 1975-2002 This table presents the regression coefficients for OLS regression models where the dependent variable is the conditional dollar acquisition rate for IPO cohorts in an event year. Observations where there are less than 20 firms alive for the IPO cohort are excluded. The merger/IPO boom denotes the period from 1995 to 2000. M&A index is constructed by dividing the total number of acquisitions in SDC by the number of active firms in Compustat. The IPO market is classified as hot, cold, or neutral following Helwege and Liang (2004). IPO underpricing is calculated as the percentage initial return (P1-P0)*100/P0, where P1 is the first-day closing stock price or bid-ask average (from CRSP) and P0 is the IPO offer price. Robust standard errors with clustering on IPO-cohort are reported below the coefficient estimates. The superscripts a,b,c denote statistical significance at the 1%, 5%, and 10% level, respectively.
Dependent variable is conditional dollar acquisition rate (1) (2) (3) (4) (5) (6) (7) (8)
Deal is within 4-9 years after IPO (Yes=1) -0.013b
-0.013a
-0.012b
-0.013a
-0.015a
-0.016a
0.005 -0.005 0.006 0.004 0.005 0.004 0.005 0.005 0.005 0.004
Deal is more than 9 years from IPO (Yes=1) -0.018a
-0.019a
-0.015b
-0.020a
-0.022a
-0.023a
-0.001 0.004c
0.006 0.005 0.006 0.005 0.006 0.006 0.005 0.010
Merger/IPO boomt (Yes=1 if deal is in 1995-2000) 0.020a
0.020a
0.007 0.006 0.004
0.005 0.005 0.007 0.006 0.010
M&A indext 0.026a
0.008
Above average M&A indext (Yes=1) 0.009 0.008
Merger/IPO boomt-1 0.019b
0.019b
0.007 0.007IPO cohort went public in HOT periods (Yes=1) -0.005 -0.005 0.005 0.006
IPO cohort went public in COLD periods (Yes=1) -0.006 -0.007c
0.004 0.004Mean (IPO cohort's first day return) 0.0001 0.0001 0.0002 0.0002
Above average M&A indext (Yes=1) * Deal is within 1-3 years
after IPO (Yes=1) 0.030b
0.010
Above average M&A indext (Yes=1) * Deal is within 4-9 years
after IPO (Yes=1) -0.0100.010
Above average M&A indext (Yes=1) * Deal is more than 9
years from IPO (Yes=1) -0.0100.010
Merger/IPO boomt (Yes=1 if deals are in 1995-2000) * Deal is
within 1-3 years after IPO (Yes=1) 0.050a
0.010
Merger/IPO boomt (Yes=1 if deals are in 1995-2000)* Deal is
within 4-9 years after IPO (Yes=1) 0.0100.010
Merger/IPO boomt (Yes=1 if deals are in 1995-2000)* Deal is
more than 9 years from IPO (Yes=1) 0.0070.010
Constant 0.039a
0.034a
0.020b
0.037a
0.033a
0.038a
0.020a 0.030a
0.005 0.005 0.008 0.005 0.006 0.007 0.004 0.004R-squared 0.03 0.09 0.07 0.09 0.13 0.13 0.07 0.14Number of groups 27 27 27 27 26 26 27 27Number of observations 382 382 382 382 357 357 382 382

34
Table 8. Conditional acquisition rate for the first four years after the IPO and for the IPO year IPO and acquisition data are obtained from SDC Platinum. The IPO sample includes all initial public offerings in 1975-2002, excluding reverse LBOs, spinoffs, rights and unit offerings, ADRs, closed-end funds, and REITs. In addition IPO firms with trade data available in CRSP before their IPO announcement date is excluded. Acquisitions of the IPO firms are identified using the SDC M&A database and include all acquisitions announced in 1981-2006. Event year refers to the year with respect to the IPO year, event year 0. The conditional acquisition rate is the ratio of acquisitions of a given type in a year divided by the number of firms alive and public at the beginning of that year. The acquisition frequency is the fraction of acquisitions that have some characteristic. The IPO market is classified as hot, cold, or neutral following Helwege and Liang (2004). The merger/IPO boom denotes the period from 1995 to 2000. IPO underpricing is calculated as the percentage initial return (P1-P0)*100/P0, where P1 is the first-day closing stock price or bid-ask average (from CRSP) and P0 is the IPO offer price. The IPO underpricing quintiles are obtained using the sub-sample of 6,518 IPOs (out of 6,548) for which we have data. The method of payment is reported by SDC for deals that are classified as having disclosed the details of the transactions. We also provide data on acquisitions for which SDC provides no details on the method of payment. The target’s organizational form is classified using the data available in SDC into private, public, subsidiary, and unknown. We use t-statistics to test for differences in mean acquisition rates and a z-statistic for differences in fractions. The superscripts a,b,c denote statistical significance at the 1%, 5%, and 10% level, respectively. The superscript d denotes subsamples with less than 10 IPO cohorts.

35
Test of means
Test of means
0 1 2 3 4 1-4 0 1 2 3 4 1-4
Mean conditional acquisition rate 0.31 0.69 0.52 0.41 0.39 2.58 b 0.22 0.48 0.36 0.30 0.28 2.46 b
IPO year--Mean conditional acquisition rate
[1] Hot 0.33 0.77 0.54 0.41 0.40 2.08 b 0.24 0.54 0.38 0.30 0.29 1.95 c
[2] Cold 0.21 0.63 0.47 0.36 0.35 1.43 0.18d 0.47 0.34 0.27 0.24 1.54
Neutral 0.36 0.64 0.54 0.42 0.42 1.74 c 0.26 0.42 0.35 0.29 0.30 1.31Test of means: [1]-[2] 1.44 0.58 0.56 0.48 0.41 0.76 0.41 0.38 0.39 0.59
IPO return quintiles (IPO cohort)--Mean conditional acquisition rate1 0.31 0.63 0.52 0.49 0.45 1.51 0.21 0.46 0.37 0.35 0.32 1.39
2 0.32 0.71 0.50 0.40 0.36 2.78 a 0.23 0.50 0.35 0.29 0.26 2.50 b
3 0.31 0.68 0.46 0.39 0.33 2.79 a 0.20 0.49 0.32 0.27 0.22 2.90 a
4 0.35 0.71 0.60 0.40 0.42 2.02 b 0.26 0.48 0.41 0.32 0.33 1.66
5 0.28 0.73 0.51 0.39 0.37 2.34 b 0.21 0.50 0.36 0.27 0.25 2.15 b
Test of means: [1]-[5] 0.34 -0.60 0.10 0.87 0.73 0.01 -0.30 0.18 0.80 0.77Acquisition year--Mean conditional acquisition rate
[1] Merger/IPO boom 1995-2000 0.66 1.41 0.93 0.67 0.65 8.02 a 0.48 0.98 0.63 0.49 0.46 6.23 a
[2] Other 0.19 0.44 0.38 0.35 0.31 1.61 0.13 0.31 0.27 0.25 0.22 1.33
Test of means: [1]-[2] 4.22 a 6.81 a 5.88 a 4.08 a 4.01 a 4.88 a 8.01 a 5.37 a 3.61 a 3.63 a
Relatedness across primary SICs--Mean conditional acquisition rate
[1] Not in the same 2-digit SIC 0.10 0.25 0.21 0.16 0.16 2.12 b 0.07 0.17 0.14 0.12 0.11 2.15 b
[2] In the same 2-digit SIC 0.21 0.44 0.31 0.25 0.23 2.76 a 0.15 0.31 0.22 0.18 0.17 2.55 b
Test of proportions: [1]-[2] -0.96 -1.37 -0.85 -0.74 -0.60 -0.81 -1.11 -0.77 -0.67 -0.68Relatedness across all SICs--Mean conditional acquisition rate
[1] Not in the same 2-digit SIC 0.07 0.15 0.13 0.10 0.10 2.05 b 0.05 0.10 0.08 0.06 0.06 1.92 c
[2] In the same 2-digit SIC 0.26 0.58 0.42 0.35 0.32 2.66 a 0.18 0.39 0.30 0.26 0.22 2.61 b
Test of proportions: [1]-[2] -1.70 c -3.01 a -2.56 b -2.11 b -1.93 c -1.33 -2.34 b -1.87 c -1.81 c -1.61Target's status--Mean conditional acquisition rate
[1] Private 0.21 0.46 0.33 0.25 0.22 2.72 a 0.15 0.33 0.23 0.18 0.16 2.64 b
[2] Public 0.01 0.04 0.04 0.03 0.04 -0.38 0.01 0.02 0.02 0.02 0.03 -0.67
[3] Subsidiary 0.08 0.18 0.14 0.12 0.12 2.05 b 0.06 0.13 0.10 0.09 0.09 1.98 c
Test of proportions: [1]-[2] 2.07 b 3.28 a 2.60 a 2.19 b 1.86 c 1.75 c 2.72 a 2.21 b 1.92 c 1.68 c
Test of proportions: [1]-[3] 1.88 2.06 b 1.53 1.16 0.94 0.99 1.62 1.20 0.93 0.84Method of payment--Mean conditional acquisition rate
[1] Cash 0.07 0.17 0.13 0.11 0.11 2.09 b 0.06 0.13 0.10 0.09 0.08 2.22 b
[2] Stock 0.03 0.08 0.06 0.05 0.05 1.38 0.02 0.06 0.05 0.04 0.04 1.23
Unknown 0.19 0.40 0.30 0.24 0.22 2.65 a 0.12 0.26 0.20 0.16 0.15 2.53 b
Test of proportions: [1]-[2] 0.66 0.95 0.78 0.75 0.77 0.53 0.78 0.62 0.65 0.57Relatedness--Mean [Fraction of acquisitions]
[1] Not in the same 2-digit SIC 0.40 0.39 0.42 0.41 0.44 -1.42 0.38 0.37 0.41 0.40 0.37 0.00[2] In the same 2-digit SIC 0.60 0.61 0.58 0.59 0.56 1.42 0.62 0.63 0.59 0.60 0.63 0.00
Test of proportions: [1]-[2] -1.39 -1.47 -1.07 -1.31 -0.83 -1.53 -1.75 c -1.19 -1.36 -1.86 c
Relatedness across all SICs--Mean [Fraction of acquisitions][1] Not in the same 2-digit SIC 0.23 0.24 0.27 0.23 0.26 -0.50 0.21 0.21 0.23 0.22 0.24 -0.61[2] In the same 2-digit SIC 0.77 0.76 0.73 0.77 0.74 0.50 0.79 0.79 0.77 0.78 0.76 0.61
Test of proportions: [1]-[2] -2.73 a -3.17 a -2.59 a -3.17 a -2.83 a -3.78 a -3.92 a -3.73 a -3.76 a -3.79 a
Target's status--Mean [Fraction of acquisitions]
[1] Private 0.61 0.61 0.61 0.59 0.51 2.88 a 0.62 0.62 0.62 0.62 0.51 2.35 b
[2] Public 0.08 0.08 0.10 0.12 0.15 -2.80 a 0.05 0.06 0.07 0.08 0.16 -2.41 b
[3] Subsidiary 0.28 0.27 0.26 0.28 0.32 -1.51 0.29 0.29 0.29 0.30 0.32 -0.70
Test of proportions: [1]-[2] 3.54 a 3.79 a 3.67 a 3.25 a 2.72 a 3.94 a 3.99 a 4.01 a 3.88 a 2.68 a
Test of proportions: [1]-[3] 2.10 b 2.30 b 2.40 b 2.07 b 1.43 2.16 b 2.20 b 2.28 b 2.21 b 1.37Method of payment--Mean [Fraction of acquisitions]
[1] Cash 0.24 0.24 0.24 0.24 0.26 -0.45 0.26 0.25 0.24 0.23 0.25 0.22[2] Stock 0.07 0.09 0.10 0.13 0.12 -1.10 0.08 0.10 0.11 0.17 0.14 -1.17Both 0.04 0.04 0.04 0.03 0.04 0.62 0.05 0.05 0.04 0.04 0.04 0.63Unknown 0.65 0.62 0.61 0.59 0.58 0.73 0.62 0.59 0.61 0.56 0.57 0.34
Test of proportions: [1]-[2] 1.57 1.34 1.20 0.95 1.20 1.59 1.37 1.18 0.55 0.92
All acquisitions Completed acquisitions
Event year Event year

36
Table 9. Conditional acquisition rate of firms relative to their IPO for each of the quintiles of age since incorporation IPO and acquisition data are obtained from SDC Platinum. IPO founding dates are compiled from SDC Platinum and Field-Ritter dataset of company founding dates (Field and Kappa, 2002; Loughran and Ritter, 2004).. The IPO sample includes all initial public offerings in 1975-2002 with founding dates, excluding reverse LBOs, spinoffs, rights and unit offerings, ADRs, closed-end funds, and REITs. In addition IPO firms with trade data available in CRSP before their IPO announcement date is excluded. Acquisitions of the IPO firms are identified using the SDC M&A database and include all acquisitions announced in 1981-2006. Event year refers to the year with respect to the IPO year, event year 0. The conditional acquisition rate is the ratio of acquisitions of a given type in a year divided by the number of firms alive at the beginning of that year. The acquisition frequency is the fraction of acquisitions that have some characteristic. The IPO market is classified as hot, cold, or neutral following Helwege and Liang (2004). The merger/IPO boom denotes the period from 1995 to 2000. IPO age is calculated as the number of years passed from the founding date relative to the IPO year. he IPO age quintiles are obtained using the sub-sample of 6,301 IPOs (out of 6,518) for which we have data. We use t-statistics to test for differences in mean acquisition rates and a z-statistic for differences in fractions. The superscripts a,b,c denote statistical significance at the 1%, 5%, and 10% level, respectively. The superscript d denotes subsamples with less than 10 IPO cohorts.
dIPO cohort if 1975 is excluded because it has 5 firms with outlier ages ranging between 10 to 74.
Panel A. IPO age statisticsd
IPO age quintiles
1 1,262 1.71 2 1.16 0 7 27 1.90 2 0.92 0 32 1,211 4.33 4 1.17 2 9 27 4.55 4 0.76 3 63 1,217 7.46 7 1.84 4 16 27 7.66 8 1.14 6 104 1,213 14.34 13 6.22 5 60 27 15.16 13 2.93 10 205 1,167 46.75 39 26.58 11 151 27 46.15 38 21.44 20 90
Total 6,070 14.58 7 20.14 0 151
Median values across IPO cohorts
MaxMax
All IPOsTotal # of IPO cohorts
Mean Median Std. dev. MinTotal # of IPOs
Mean Median Std. dev. Min
1 2Test of means [1]-[2]
Young Mature
Event years 1-3 10-20 0 1 2 3 4 1-4Total number of acquisitions 10,820 5,258 2,151 4,768 3,487 2,565 2,110Total number of completed acquisitions for which the buyer had less than 50% of the target before and more than 50% after the deal
7,627 3,509 1,562 3,342 2,412 1,873 1,529
Firms alive as of January 1st 6,075 5,907 5,883 5,611 5,010Mean [Firms alive as of January 1st of event year] 5,800 1,011
Mean conditional acquisition rate 0.41 0.40 0.22 0.25 0.52 0.39 0.33 0.30 2.58b
IPO age quintiles --(IPO cohort) Mean conditional acquisition rate
1 0.41 0.28 1.74c 0.29 0.53 0.39 0.32 0.27 2.22
b
2 0.39 0.40 -0.07 0.22 0.46 0.40 0.31 0.28 2.06b
3 0.37 0.38 -0.16 0.19 0.48 0.34 0.30 0.30 1.95c
4 0.37 0.33 0.58 0.22 0.44 0.36 0.32 0.31 1.52
5 0.44 0.36 0.88 0.24 0.53 0.42 0.37 0.23 2.79a
Test of means: [1]-[5] -0.28 -1.18 0.56 0.00 -0.41 -0.54 0.66
Completed acquisitions
Event yearTest of means
Panel B. Conditional acquisition rate of young versus mature firms.
Completed acquisitions
Panel C. Conditional acquisition rate for the first four years after the IPO and for the IPO year

37
Table 10. Cumulative abnormal returns around acquisition announcements by young and mature firms conditional on the method of payment and organizational form of the target IPO and acquisition data are obtained from SDC Platinum. The IPO sample includes all initial public offerings in 1975-2002, excluding reverse LBOs, spinoffs, rights and unit offerings, ADRs, closed-end funds, and REITs. In addition IPO firms with trade data available in CRSP before their IPO announcement date is excluded. Acquisitions of the IPO firms are identified using the SDC M&A database and include all acquisitions announced in 1981-2006. Event year refers to the deal year with respect to the IPO year, event year 0. Method of payment is reported by SDC for deals that are classified as having disclosed the details of the transactions. We also provide data on acquisition and deals rates for deals which SDC classified as ‘undisclosed’ and provided no details of the method of payment. Target’s organizational form is classified using the data available in SDC into private, public, subsidiary, and unknown. Cumulative abnormal returns (CARs) are calculated using the event window of [-1,+1]. Abnormal returns are calculated net of equally-weighted market portfolio. Rows have mean, median, standard deviation, and number of observations respectively. We use t-statistics to test for differences in mean CARs and a z-statistic for the Wilcoxon rank-sum (Mann-Whitney) test of differences in median CARs. We use superscripts a, b, c to denote statistical significance at the 1%, 5%, and 10% level, respectively.
Difference testsDifference
testsDifference
testsDifference
testsYoung Mature t-statistic Young Mature t-statistic Young Mature t-statistic Young Mature t-statistic
1-3 10-20 [z-statistic] 1-3 10-20 [z-statistic] 1-3 10-20 [z-statistic] 1-3 10-20 [z-statistic]
1.4%a 0.92%a 2.00b 1.7%a 1.23%a 1.29 1.09%a 0.88%a 0.56 2.5%a 1.56%c 0.99
0.5%a 0.24%a [2.68]a 0.68%a 0.35%a [1.57] 0.51%a 0.35%a [0.92] 1.06%a 0.10% [1.82]c
12% 8% 12% 9% 9% 7% 15% 13%7,659 2,775 2,739 962 1,320 651 989 228
-0.55%a -0.68%b 0.25 -1.05%b -0.7%b -0.60 1.27%b 0.12% 1.81c -2.95%a -1.85%a -1.07
-0.42%a -0.58%a [-0.16] -0.71%a -0.45%a [-1.12] 0.69%b -0.04% [1.66]c -3.73%a -1.07%a [-1.66]c
12% 7% 12% 7% 8% 5% 13% 10%809 658 566 534 203 303 314 189
2.13%a 1.18%a 3.13a 2.44%a 1.28%a 2.84a 1.9%a 1.00%a 2.51a 6%a 2.50% 1.25
0.97%a 0.37%a [3.27]a 1.19%a 0.71%a [1.95]b 1.16%a 0.48%a [2.63]a 1.55%b 1.71%c [-0.25]11% 7% 12% 7% 8% 6% 26% 10%2,943 1,471 1,364 646 1,118 580 136 33
4.54a 4.93a 5.14a 4.38a -0.29 1.91c 6.19a 3.12a
6.25a [5.37]a [5.97]a [4.31]a [-0.13] [1.40] [7.30]a [3.16]a
-5.95a -5.49a -6.01a -4.78a -1.02 -2.30b -3.84a -2.35b
[-7.49]a [-5.76]a [-7.09]a [-5.19]a [-1.26] [-1.88]c [-5.30]a [-2.84]a
-3.10a -1.13 -1.91b -0.14 -2.29b -0.33 -1.55 -0.49
[-3.22]a [-1.24] [-2.09]b [-1.32] [-2.56]a [-0.56] [-0.45] [-1.38]
1.45%a 0.79%a 3.75a 1.59%a 0.76%a 2.94a 1.45%a 0.78%a 2.62a 1.64%a 0.20% 1.79c
0.55%a 0.21%a [4.57]a 0.64%a 0.26%a [3.12]a 0.73%a 0.32%a [3.21] 0.47%a -0.29% [2.06]b
11% 10% 12% 8% 9% 6% 16% 11%11,411 4,904 4,669 2,142 2,641 1,534 1,439 450
Total Total Total Total
[2]-[3][2]-[3] [2]-[3] [2]-[3]
[1]-[3][1]-[3] [1]-[3] [1]-[3]
[z-statistic] [z-statistic] [z-statistic] [z-statistic][1]-[2]
[1]-[2] [1]-[2] [1]-[2]
Difference tests Difference tests Difference tests Difference testst-statistic t-statistic t-statistic t-statistic
[2] Public target
[2] Public target
[2] Public target
[2] Public target
[3] Subsidiary target
[3] Subsidiary target
[3] Subsidiary target
[3] Subsidiary target
Target's organizational
form
Event years
[1] Private target
[1] Private target
[1] Private target
[1] Private target
Target's organizational
formEvent years
Target's organizational
form
Event yearsTarget's
organizational form
Event years
All acquisitions All disclosed acquisitions with data on the
method of paymentSorted by the method of payment: Purely cash Sorted by the method of payment: Purely stock

38
Table 11. Cumulative abnormal returns around acquisition announcements by young and mature firms conditional on the primary 2-digit SIC code relatedness, the method of payment and organizational form of the target IPO and acquisition data are obtained from SDC Platinum. The IPO sample includes all initial public offerings in 1975-2002, excluding reverse LBOs, spinoffs, rights and unit offerings, ADRs, closed-end funds, and REITs. In addition IPO firms with trade data available in CRSP before their IPO announcement date is excluded. Acquisitions of the IPO firms are identified using the SDC M&A database and include all acquisitions announced in 1981-2006. Event year refers to the year with respect to the IPO year, event year 0. Method of payment is reported by SDC for acquisitions that are classified as having disclosed the details of the transactions. We also provide data on acquisitions for which SDC provides no details on the method of payment. The target’s organizational form is classified using the data available in SDC into private, public, subsidiary, and unknown. Cumulative abnormal returns (CARs) are calculated using the event window of [-1,0,+1]. Abnormal returns are calculated net of equally-weighted market portfolio. Rows have mean, median, standard deviation, and number of observations respectively. We use t-statistics to test for differences in mean CARs and a z-statistic for the Wilcoxon rank-sum (Mann-Whitney) test of differences in median CARs. We use superscripts a, b, c to denote statistical significance at the 1%, 5%, and 10% level, respectively.
[a]-[b] [c]-[d] [c]-[a] [d]-[b] [e]-[f] [g]-[h] [g]-[e] [h]-[f]1-3 10-20 1-3 10-20 t-statistic t-statistic t-statistic t-statistic 1-3 10-20 1-3 10-20 t-statistic t-statistic t-statistic t-statistic[a] [b] [c] [d] [z-statistic] [z-statistic] [z-statistic] [z-statistic] [e] [f] [g] [h] [z-statistic] [z-statistic] [z-statistic] [z-statistic]
0.91%a 0.65%c 1.39%a 1.17%a 0.50 0.33 0.89 0.91 2.17%a 0.65% 3.07%a 2.38%c 1.05 0.44 0.93 1.07
0.32%a 0.13% 0.82%a 0.46%b [0.57] [0.90] [1.46] [0.89] 1.05%a -0.53% 1.25%a 0.63% [1.45] [1.32] [1.02] [0.94]0.09 0.07 0.10 0.08 0.15 0.08 0.14 0.16827 362 493 289 624 108 365 120
0.69% 0.12% 2.03%b 0.14% 0.79 1.96b 1.16 0.03 -3.79%a -2.82%a -1.16% 0.19% -0.73 -0.69 1.65c 1.94c
0.22% -0.24% 1.01%a 0.29% [0.35] [1.92]c [1.52] [0.79] -4.13%a -1.91%a -2.13%c 0.22% [-1.36] [-1.13] [1.90]c [2.07]b
0.08 0.05 0.08 0.05 0.13 0.09 0.13 0.10115 195 88 108 213 128 101 61
1.84%a 0.86%a 2.02%a 1.27%a 2.01b 1.16 0.33 0.75 4.06%c 5.69%b 9.43%c -2.41% -0.35 1.26 1.02 -2.58b
1%a 0.33%b 1.54%a 0.75%a [2.50]b [1.1] [0.16] [1.00] 1.11% 2.97%a 1.67%c 0.34% [-1.49] [1.38] [0.73] [-1.95]b
0.08 0.06 0.08 0.06 0.20 0.10 0.34 0.08755 380 363 200 87 20 49 13
0.28 1.08 -0.64 1.57 5.51a 3.16a 2.80a 1.12
[0.56] [1.11] [-0.66] [0.73] [6.50]a [2.91]a [3.36]a [0.92]
-1.45 -1.57 0.01 -1.76c -3.38a -3.68a -2.13b 0.99
[-1.87]c [-1.44] 0.12 [-1.14] [-4.56]a [-3.86]a [-2.61]a [0.42]
-2.15b -0.45 -1.04 -0.16 -0.85 -2.21b -1.31 1.78c
[-2.62]a [-0.46] [-0.88] [-0.49] [-0.19] [-2.57]a [-0.55] [0.87]
1.31%a 0.62%a 1.69%a 1.01%a 2.14b 1.59 1.06 1.15 0.98%b -0.69% 2.84%a 1.37% 1.68c 1.07 2.06b 1.80c
0.61%a 0.15%b 1.17%a 0.54%a [2.58]a [2.02]b [1.45] [1.53] 0.22% -0.95%b 0.59%a 0.50% [1.76]c [1.29] [2.12]b [1.95]b
0.09 0.06 0.09 0.08 0.15 0.09 0.17 0.141,697 937 944 597 924 256 515 194
Related Deals Unrelated Deals Difference testsPurely Stock
Difference testst-statistic
[z-statistic]
Difference testst-statistic
[z-statistic]
Related DealsPurely Cash
Unrelated Difference testsEvent Year Event Year
Total
Event Year Event Year
[1]-[2]
[2]-[3]
[1]-[3]
[1] Private Targets
[2] Public Targets
[3] Subsidiary Targets
Target's organizational
form

39
Table 12. Cumulative abnormal returns around acquisition announcements by young and mature firms conditional on all the 2-digit SIC codes relatedness, the method of payment and organizational form of the target IPO and acquisition data are obtained from SDC Platinum. The IPO sample includes all initial public offerings in 1975-2002, excluding reverse LBOs, spinoffs, rights and unit offerings, ADRs, closed-end funds, and REITs. In addition IPO firms with trade data available in CRSP before their IPO announcement date is excluded. Acquisitions of the IPO firms are identified using the SDC M&A database and include all acquisitions announced in 1981-2006. Event year refers to the year with respect to the IPO year, event year 0. Method of payment is reported by SDC for acquisitions that are classified as having disclosed the details of the transactions. We also provide data on acquisitions for which SDC provides no details on the method of payment. The target’s organizational form is classified using the data available in SDC into private, public, subsidiary, and unknown. Cumulative abnormal returns (CARs) are calculated using the event window of [-1,0,+1]. Abnormal returns are calculated net of equally-weighted market portfolio. Rows have mean, median, standard deviation, and number of observations respectively. We use t-statistics to test for differences in mean CARs and a z-statistic for the Wilcoxon rank-sum (Mann-Whitney) test of differences in median CARs. We use superscripts a, b, c to denote statistical significance at the 1%, 5%, and 10% level, respectively.
[a]-[b] [c]-[d] [c]-[a] [d]-[b] [e]-[f] [g]-[h] [g]-[e] [h]-[f]1-3 10-20 1-3 10-20 t-statistic t-statistic t-statistic t-statistic 1-3 10-20 1-3 10-20 t-statistic t-statistic t-statistic t-statistic[a] [b] [c] [d] [z-statistic] [z-statistic] [z-statistic] [z-statistic] [e] [f] [g] [h] [z-statistic] [z-statistic] [z-statistic] [z-statistic]
1.01%a 0.62%b 1.31%b 1.89%b 0.99 -0.59 0.46 1.54 1.67%a 1.03% 5.24%a 2.98% 0.64 1.00 3.15a 0.89
0.43%a 0.22% 0.68%a 0.92%b [1.03] [-0.19] [0.74] [1.36] 0.93%a -0.29% 1.97%a 1.54% [0.2] [1.49] [2.93]a [1.15]0.09 0.07 0.11 0.09 0.14 0.11 0.15 0.16990 519 330 132 758 166 231 62
0.67% 0.22% 2.72%b -0.25% 0.63 2.27b 1.61 -0.59 -4.01%a -2.98%a 1.31% 3.95%b -0.93 -1.07 3.05a 3.35a
0.23% 0.23% 1.21%a -0.50% [0.31] [2.62]a [1.76]c [-0.66] -4.15%a -1.69%a -0.40% 1.49%c [-1.42] [-1.63] [2.68]a [3.44]a
0.08 0.05 0.08 0.06 0.13 0.09 0.12 0.11144 243 59 60 251 158 63 31
1.98%a 1.04%a 1.6%a 0.82% 2.34b 0.98 -0.62 -0.35 6.6%b 3.06% 3.56%c 0.73% 1.02 0.30 -0.92 -0.81
1.2%a 0.47%a 0.9%b 0.55% [2.81]a [0.41] [-1.19] [0.19] 1.53%b 2.59% 1.57% 1.33% [-0.43] [0.2] [0.22] [-0.46]0.08 0.06 0.09 0.06 0.28 0.11 0.10 0.05880 476 238 104 109 25 27 8
0.47 0.97 -1.14 2.01b 5.75a 3.57a 2.15b -0.31
[0.65] [0.68] [-1.14] [1.67]c [6.82]a [3.52]a [2.44]b -0.57
[-1.83]a [-1.97]b 0.92 -1.17 -3.74a -2.63a -0.93 1.20
[-2.13]b [-1.42] [1.1] [-1.28] [-5.27]a [-3.07]a -1.20 0.42
-2.50a -1.03 -0.35 1.12 -1.79a -0.86 0.79 0.82
[-2.90]a [-0.90] [-0.03] [0.55] [-0.80] [-1.62] [0.46] [0.15]
1.41%a 0.7%a 1.55%a 1.08%a 2.58a 0.74 0.32 0.82 0.87%c -0.64% 4.32%a 3.1%b 1.64 0.75 3.67a 2.52b
0.71%a 0.3%a 0.82%a 0.51%b [3.04]a [1.02] [0.22] [0.74] 0.16% -0.85%a 1.4%a 1.51%b [1.88]c [0.73] [0.22] [3.12]a
0.08 0.06 0.10 0.07 0.16 0.10 0.14 0.142,014 1,238 627 296 1,118 349 321 101
[z-statistic] [z-statistic][1]-[2]
[2]-[3]
[1]-[3]
Total
[2] Public Targets
[3] Subsidiary Targets
Difference tests Difference testst-statistic t-statistic
Target's organizational
form
Event Year Event Year Event Year Event Year
[1] Private Targets
Purely Cash Purely StockRelated Deals Unrelated Deals Difference tests Related Deals Unrelated Deals Difference tests

40
Figure 1. Post-IPO conditional acquisition rate per event-year by IPO-cohort IPO and acquisition data are obtained from SDC Platinum. The IPO sample includes all initial public offerings in 1975-2002, excluding reverse LBOs, spinoffs, rights and unit offerings, ADRs, closed-end funds, and REITs. In addition IPO firms with trade data available in CRSP before their IPO announcement date is excluded. Acquisitions of the IPO firms are identified using the SDC M&A database and include all acquisition deals announced in 1981-2006. Event year refers to the year with respect to the IPO year, event year 0. The conditional acquisition rate is the ratio of acquisitions of a given type in a year divided by the number of firms alive at the beginning of that year.
1975
1978
1981
1984
1987
1990
1993
19961999
2002
0.00
0.20
0.40
0.60
0.80
1.00
1.20
1.40
1.60
1.80
2.00
0 1 2 3 4 5 6 7 8 9 10 11 12 13 14 15 16 17 18 19 20 21 22 23 24 25
Con
diti
onal
acq
uisi
tion
rat
e
1975
1976
1977
1978
1979
1980
1981
1982
1983
1984
1985
1986
1987
1988
1989
1990
1991
1992
1993
1994
1995
1996
1997
1998
1999
2000
2001
2002
IPO year
Event year

41
Figure 2. Post-IPO median value of the event-year conditional acquisition rate by the state of the IPO market and of the M&A market IPO and acquisition data are obtained from SDC Platinum. The IPO sample includes all initial public offerings in 1975-2002, excluding reverse LBOs, spinoffs, rights and unit offerings, ADRs, closed-end funds, and REITs. In addition IPO firms with trade data available in CRSP before their IPO announcement date is excluded. Acquisitions of the IPO firms are identified using the SDC M&A database and include all acquisition deals announced in 1981-2006. Event year refers to the year with respect to the IPO year, event year 0. The conditional acquisition rate is the ratio of acquisitions of a given type in a year divided by the number of firms alive at the beginning of that year. The IPO market is classified as hot, cold, or neutral following Helwege and Liang (2004). The merger/IPO boom period is during 1995-2000. IPO underpricing is calculated as the percentage initial return (P1-P0)*100/P0, where P1 is the first-day closing stock price or bid-ask average (from CRSP) and P0 is the IPO offer price. The IPO underpricing quintiles are obtained using the 6,518 IPOs (out of 6,548) for which we have data.
0.00.10.20.30.40.50.60.70.80.91.01.11.21.31.4
Con
ditio
nal a
cqui
sitio
n ra
te
Event year
All firms
Hot IPOs
Cold IPOs
Merger/IPO boom
Not in the merger/IPO boom

42
Figure 3. Post-IPO mean value of the event-year conditional acquisition rate by the state of the IPO market and of the M&A market IPO and acquisition data are obtained from the SDC Platinum. The IPO sample includes all initial public offerings in 1975-2002, excluding reverse LBOs, spinoffs, rights and unit offerings, ADRs, closed-end funds, and REITs. In addition IPO firms with trade data available in CRSP before their IPO announcement date is excluded. Acquisitions of the IPO firms are identified using the SDC M&A database and include all acquisition deals announced in 1981-2006. Event year refers to the year with respect to the IPO year, event year 0. The conditional acquisition rate is the ratio of acquisitions of a given type in a year divided by the number of firms alive at the beginning of that year. The IPO market is classified as hot, cold, or neutral following Helwege and Liang (2004). The merger/IPO boom period is during 1995-2000. IPO underpricing is calculated as the percentage initial return (P1-P0)*100/P0, where P1 is the first-day closing stock price or bid-ask average (from CRSP) and P0 is the IPO offer price. The IPO underpricing quintiles are obtained using the 6,518 IPOs (out of 6,548) for which we have data.
0.0
0.1
0.2
0.3
0.4
0.5
0.6
0.7
0.8
0.9
1.0
1.1
1.2
1.3
1.4
Con
ditio
nal a
cqui
sitio
n ra
te
Event year
All firms
Hot IPOs
Cold IPOs
Merger/IPO boom
Not in the merger/IPO boom

43
References Alimov, Azizjon and Wayne H. Mikkelson, 2008, Do favorable market conditions lead to costly decisions
to go public?, unpublished working paper, City University of Hong Kong. Brau, James C., Robert B. Couch, and Ninon K. Sutton, 2011, The desire to acquire and IPO long-run
underperformance, forthcoming, Journal of Financial and Quantitative Analysis. Celikyurt, Ugur, Merih Sevilir and Anil Shivdasani, 2010, Going public to acquire? The acquisition
motive in IPOs, Journal of Financial Economics 96, 345-363. Clementi, Gian Luca, 2002, IPOs and the growth of firms, unpublished working paper, New York
University. Dong, Ming, David Hirshleifer, Scott Richardson and Siew Hong Teoh, 2006, Does investor misvaluation
drive the takeover market?, Journal of Finance 61, 725-762. Fama, Eugene F. and Kenneth R. French, 2004, New lists: Fundamentals and survival rates, Journal of
Financial Economics 73, 229-269. Fan, J., and L. Lang, 2000, The measurement of relatedness: An application to corporate diversification,
Journal of Business 73, 629-660. Field, Laura C. and Jonathan Karpoff, 2002, Takeover defenses of IPO firms, Journal of Finance, 57,
1857-1889. Fuller, Kathleen, Jeffrey Netter, and Mike Stegemoller, 2002, What do returns to acquiring firms tell us?
Evidence from firms that make many acquisitions, Journal of Finance 57, 1763-1794. Gao, Xiahoui, Jay R. Ritter, and Zhongyan Zhu, 2012, Where have all the IPOs gone?, unpublished
working paper, University of Florida. Gomes, Joao, and Dmitry Livdan, 2004, Optimal diversification: Reconciling theory and evidence,
Journal of Finance, 507-535. Helwege, J., Liang, N., 2004. Initial public offerings in hot and cold markets, Journal of Financial
and Quantitative Analysis 39, 541-569.
Hsieh, Jim, Evgeny Lyandres, and Alexei Zdanov, A theory of merger-driven IPOs, Journal of Financial and Quantitative Analysis,
Jensen, Michael C., 1993, The modern industrial revolution, exit, and the failure of internal control
systems, Journal of Finance 48, 831-880. Jovanovic, Boyan and Peter L. Rousseau, 2002, The Q-theory of mergers, American Economic Review
92, 198-204. Loughran, Tim and Jay R. Ritter, 2004, Why has IPO underpricing changed over time?, Financial
Management, 33, 5-37.

44
Lyandres, Evgeny, Alexei Zhdanov and Jim Hsieh, April 2011, A theory of merger-driven IPOs, forthcoming, Journal of Financial and Quantitative Analysis.
Maksimovic, Vojislav, and Gordon Phillips, 2001, The market for corporate assets: Who engages in
mergers and asset sales and are there efficiency gains?, Journal of Finance 56, 2019-2065. Maksimovic, Vojislav, and Gordon Phillips, 2002, Do conglomerate firms allocate resources inefficiently
across industries? Theory and evidence, Journal of Finance 57, 721-767. Maksimovic, Vojislav, Gordon Phillips, and Liu Yang, Private and public merger waves, unpublished
working paper, University of Maryland. Matsusaka, John G., 2003, Takeover motives during the conglomerate merger wave, RAND Journal of
Economics 24, 357-379. Matsusaka, John G., 2001, Corporate diversification, value maximization, and organizational capabilities,
Journal of Business 74, 409-431. Moeller, Sara B., Frederik P. Schlingemann, and René M. Stulz, 2004, Firm size and the gains from
acquisitions, Journal of Financial Economics 73, 201–228. Oz, Oguzhan, and David S. Scharfstein, 2009, Evidence on the dark side of internal capital markets,
Review of Financial Studies, 581-599. Ritter, Jay R., and Ivo Welch, 2002, A review of IPO activity, pricing, and allocations, Journal of Finance
57, 1795-1828. Rhodes-Kropf, Matthew, David T. Robinson and S. Viswanathan, 2005, Valuation waves and merger
activity: The empirical evidence, Journal of Financial Economics 77, 561-603. Shleifer, Andrei and Robert W. Vishny, 2003, Stock market driven acquisitions, Journal of Financial
Economics 70, 295-311. Wiggenhorn, Joan, Kimberly C. Gleason, and Jeff Madura, 2007, Going public to pursue acquisitions,
The Quarterly Review of Economics and Finance 47, 331-351.