Embed Size (px)
Citation preview
95
The effect of air inlet system features on automotive turbocharger compressor performance
Geoff Capon, Tim Morris
Ford Motor Company Limited ABSTRACT Studies have demonstrated that the performance of automotive turbocharger compressors can be significantly influenced by the design of associated airpath components. From this work parameters describing the flow field at the compressor inlet have been developed and used to optimise the design of inlet system components. The flow parameters of primary concern are inlet prewhirl, flow uniformity and eccentricity at the compressor impeller eye. The design of the inlet system influences these parameters and unfavourable flow conditions can lead to flow instability of the compressor with subsequent loss of performance. Flow modification devices, such as grills and guide vanes, can improve the inlet flow field. Compressor performance is usually represented by characteristics obtained by steady-state gas-stand testing. These characteristics are subsequently used for matching the turbocharger to the engine and to predict the full-load, part-load and transient performance of the turbocharged engine system; accurate data is critical to obtaining satisfactory results. The air inlet system can influence the compressor performance and can modify the surge line, speed lines and efficiency contours. The effect of inlet systems on compressor performance is demonstrated, suggesting interaction between inlet system and impeller. The application of CFD analysis to the total inlet system together with the compressor is described and recommendations given for future treatment of the airpath system for gas-stand compressor mapping, matching, performance prediction and calibration.
10.1243/17547164C0012010007
96
1. INTRODUCTION The prediction of engine performance and determination of acceptable turbocharger matches using one-dimensional CAE techniques is well known [1], [2]. Accurate turbocharger aerodynamic data is a pre-requisite for the results from such analysis to be meaningful. Also turbocharger performance characteristics are being increasingly used in engine control system strategies to predict parameters not directly measured. In these applications compressor performance data inaccuracies impact robustness of engine calibrations and applied error margins. Compressor performance is heavily influenced by the integration with other components in the airpath system. In the automotive sector the ability to provide the turbocharger compressor with optimal inlet conditions is usually compromised by packaging constraints with boundary conditions dictated by crash planes, pedestrian protection areas, vehicle styling, powerpack components and vehicle chassis components. These constraints influence the design and routing of the air inlet ducting, the position of the turbocharger and the design and routing of the hot end exhaust system. The performance of a turbocharger compressor is significantly influenced by the flow conditions at the compressor inlet, and has been demonstrated in [3], [4] and [5]. The interaction between the air inlet system and the turbocharger compressor will be demonstrated .and further shown that there is a flow interaction between inlet systems and compressor designs. 2. NOMENCLATURE iA flow area of cell
totA total flow area of cross-section B swirl meter reference bore m mass flow rate MPWR mean pre-whirl ratio NDSR non-dimensional swirl ratio cR compressor pressure ratio (t-t)
mS swirl meter reading
constSM swirl meter constant
10.1243/17547164C0012010007
97
corrSM swirl meter correction factor
1T compressor inlet temperature
2T compressor outlet temperature U mean gas velocity of cross-section iU gas flow velocity at cell i
maxU max. velocity at cross-section
minU min. velocity at cross-section
tanV tangential velocity component
0V velocity through reference bore
axialV axial velocity component ρ flow density γ flow uniformity index γ ratio of specific heats
cη compressor adiabatic efficiency
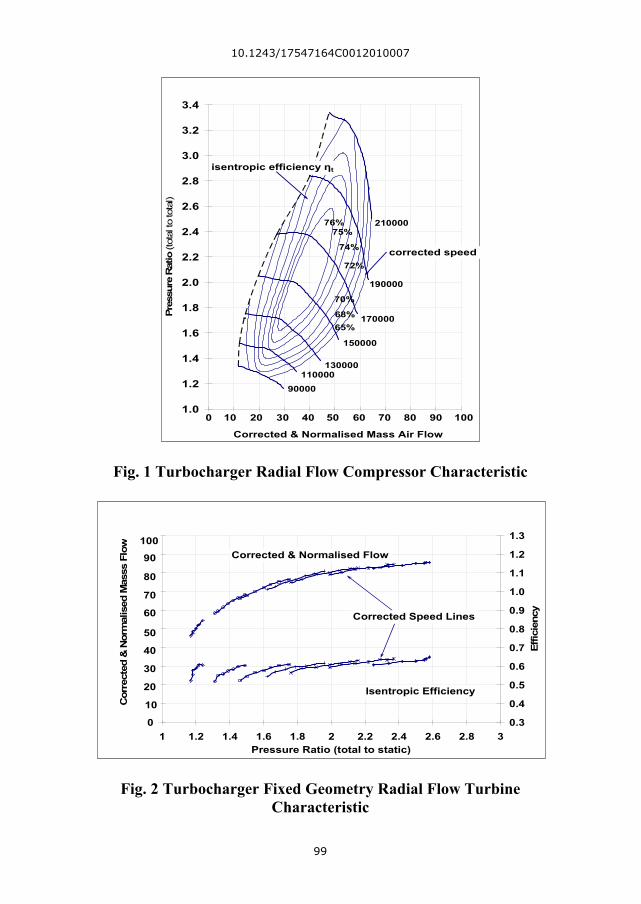
3. TURBOCHARGER PERFORMANCE DATA The performance of the aerodynamic components of an automotive turbocharger, namely the compressor and turbine, are invariably described by test data collected during steady-state performance tests, usually as prescribed by the SAE Turbocharger Gas Stand Test Code [6]. The data is usually made available in digital form for use with CAE tools and in the form of compressor or turbine characteristics, Figs. 1 and 2. This data is used in CAE tools such as Ricardo Wave and Gamma Technologies GT Power to predict engine performance, turbocharger performance and to determine suitable turbocharger compressor and turbine specifications to match the engine operating envelope. From such CAE studies further data regarding mechanical and thermal loading is often obtained for use in the design of components such as piston, cylinder heads, charge air coolers etc. These CAE tools use fully integrated treatment of time-dependent fluid dynamics and thermodynamics by means of a one-dimensional finite-difference formulation incorporating a general thermodynamic treatment of working fluids. To achieve an acceptable converged solution energy and mass flow balances through the modeled system must be achieved.
10.1243/17547164C0012010007
98
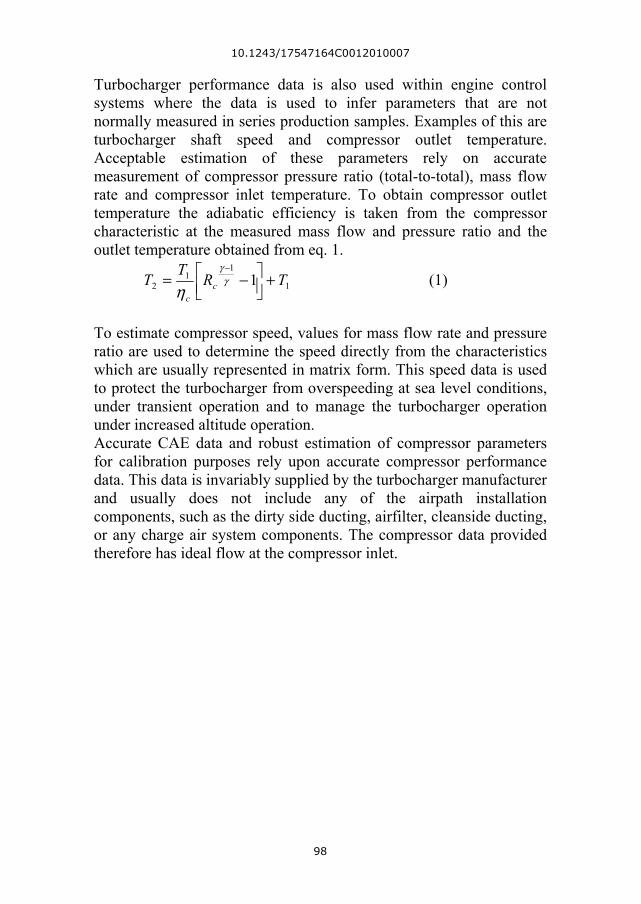
Turbocharger performance data is also used within engine control systems where the data is used to infer parameters that are not normally measured in series production samples. Examples of this are turbocharger shaft speed and compressor outlet temperature. Acceptable estimation of these parameters rely on accurate measurement of compressor pressure ratio (total-to-total), mass flow rate and compressor inlet temperature. To obtain compressor outlet temperature the adiabatic efficiency is taken from the compressor characteristic at the measured mass flow and pressure ratio and the outlet temperature obtained from eq. 1.
1
11
2 1 TRT
T cc
+⎥⎦⎤
⎢⎣⎡ −=
−γ
γ
η (1)
To estimate compressor speed, values for mass flow rate and pressure ratio are used to determine the speed directly from the characteristics which are usually represented in matrix form. This speed data is used to protect the turbocharger from overspeeding at sea level conditions, under transient operation and to manage the turbocharger operation under increased altitude operation. Accurate CAE data and robust estimation of compressor parameters for calibration purposes rely upon accurate compressor performance data. This data is invariably supplied by the turbocharger manufacturer and usually does not include any of the airpath installation components, such as the dirty side ducting, airfilter, cleanside ducting, or any charge air system components. The compressor data provided therefore has ideal flow at the compressor inlet.
10.1243/17547164C0012010007
99
210000
190000
170000
150000
130000110000
90000
75%76%
74%
72%
70%
68%65%
1.0
1.2
1.4
1.6
1.8
2.0
2.2
2.4
2.6
2.8
3.0
3.2
3.4
0 0.02 0.04 0.06 0.08 0.1 0.12 0.14 0.16 0.18 0.2
Corrected & Normalised Mass Air Flow
Pres
sure
Rat
io (t
otal
to to
tal)
corrected speed
isentropic efficiency ηt
10 10090807060504030200
Fig. 1 Turbocharger Radial Flow Compressor Characteristic
0
0.007
0.014
0.021
0.028
0.035
0.042
0.049
0.056
0.063
0.07
1 1.2 1.4 1.6 1.8 2 2.2 2.4 2.6 2.8 3Pressure Ratio (total to static)
0.3
0.4
0.5
0.6
0.7
0.8
0.9
1.0
1.1
1.2
1.3Ef
ficie
ncy
Corrected & Normalised Flow
Isentropic Efficiency 10
100
90
80
70
60
50
40
30
20
Corrected Speed Lines
Cor
rect
ed &
Nor
mal
ised
Mas
ss F
low
Fig. 2 Turbocharger Fixed Geometry Radial Flow Turbine Characteristic
10.1243/17547164C0012010007
100
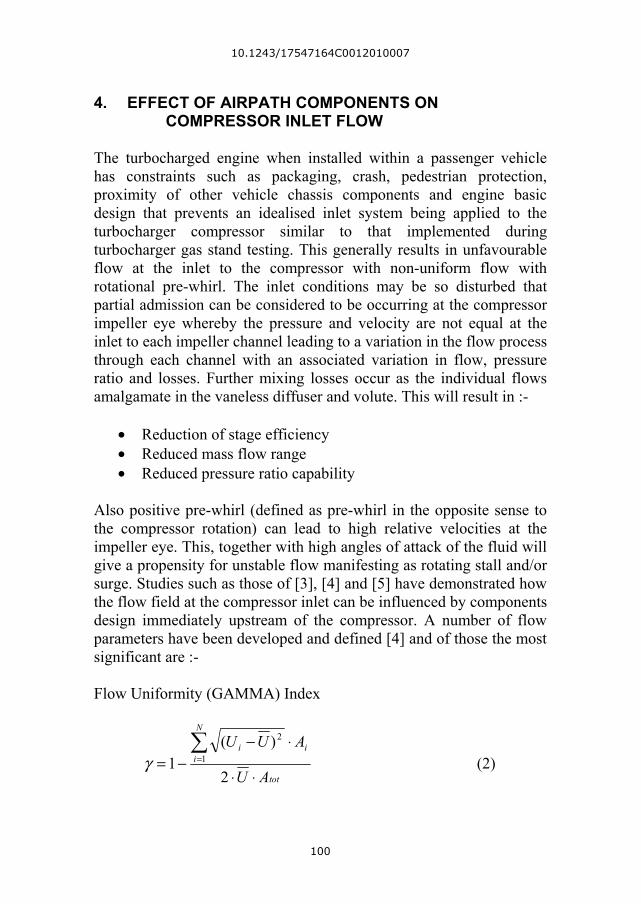
4. EFFECT OF AIRPATH COMPONENTS ON
COMPRESSOR INLET FLOW The turbocharged engine when installed within a passenger vehicle has constraints such as packaging, crash, pedestrian protection, proximity of other vehicle chassis components and engine basic design that prevents an idealised inlet system being applied to the turbocharger compressor similar to that implemented during turbocharger gas stand testing. This generally results in unfavourable flow at the inlet to the compressor with non-uniform flow with rotational pre-whirl. The inlet conditions may be so disturbed that partial admission can be considered to be occurring at the compressor impeller eye whereby the pressure and velocity are not equal at the inlet to each impeller channel leading to a variation in the flow process through each channel with an associated variation in flow, pressure ratio and losses. Further mixing losses occur as the individual flows amalgamate in the vaneless diffuser and volute. This will result in :-
• Reduction of stage efficiency • Reduced mass flow range • Reduced pressure ratio capability
Also positive pre-whirl (defined as pre-whirl in the opposite sense to the compressor rotation) can lead to high relative velocities at the impeller eye. This, together with high angles of attack of the fluid will give a propensity for unstable flow manifesting as rotating stall and/or surge. Studies such as those of [3], [4] and [5] have demonstrated how the flow field at the compressor inlet can be influenced by components design immediately upstream of the compressor. A number of flow parameters have been developed and defined [4] and of those the most significant are :- Flow Uniformity (GAMMA) Index
tot
N
iii
AU
AUU
⋅⋅
⋅−−=∑
=
2
)(1 1
2
γ (2)
10.1243/17547164C0012010007
101
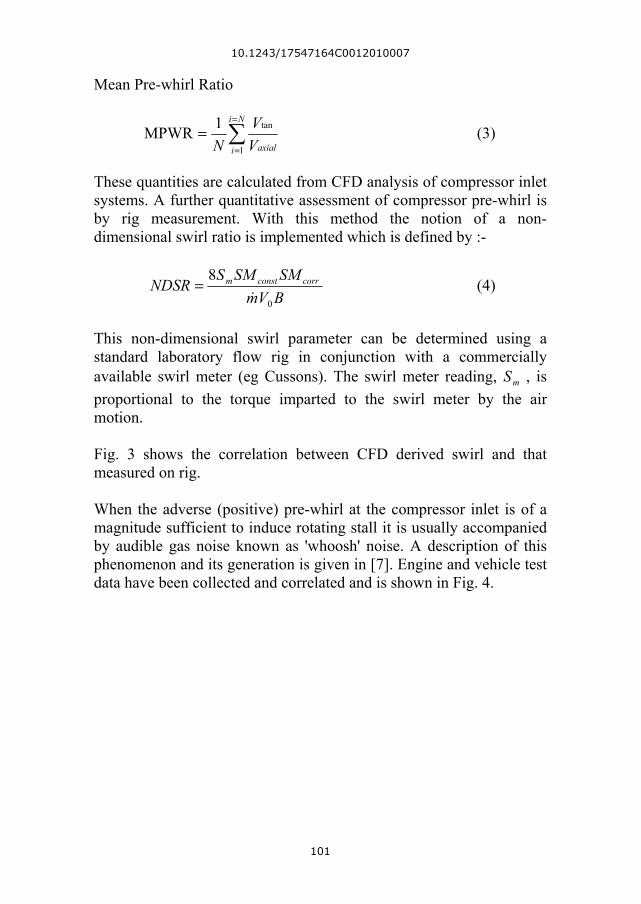
Mean Pre-whirl Ratio
∑=
=
=Ni
i axialVV
N 1
tan1MPWR (3)
These quantities are calculated from CFD analysis of compressor inlet systems. A further quantitative assessment of compressor pre-whirl is by rig measurement. With this method the notion of a non-dimensional swirl ratio is implemented which is defined by :-
BVmSMSMS
NDSR corrconstm
0
8= (4)
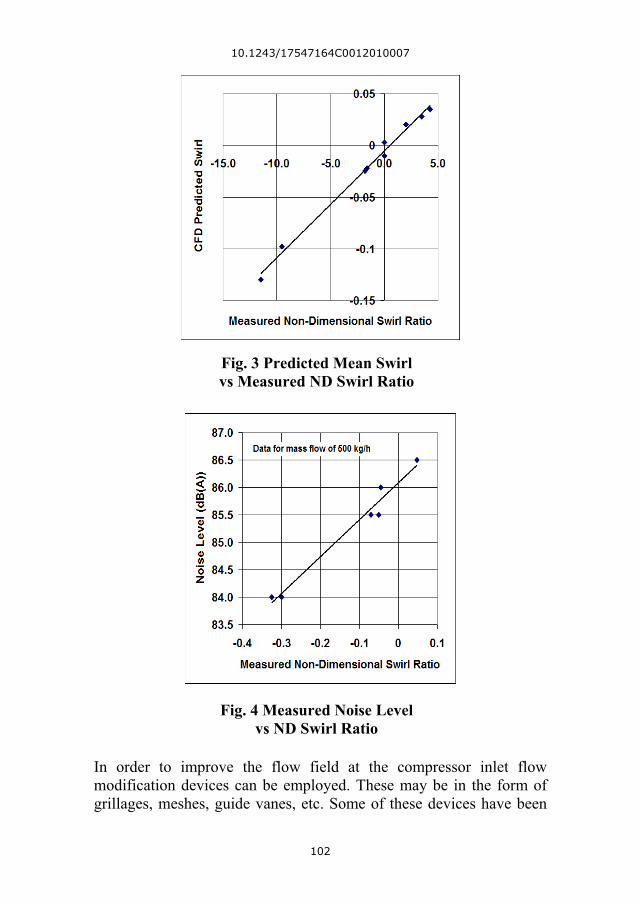
This non-dimensional swirl parameter can be determined using a standard laboratory flow rig in conjunction with a commercially available swirl meter (eg Cussons). The swirl meter reading, mS , is proportional to the torque imparted to the swirl meter by the air motion. Fig. 3 shows the correlation between CFD derived swirl and that measured on rig. When the adverse (positive) pre-whirl at the compressor inlet is of a magnitude sufficient to induce rotating stall it is usually accompanied by audible gas noise known as 'whoosh' noise. A description of this phenomenon and its generation is given in [7]. Engine and vehicle test data have been collected and correlated and is shown in Fig. 4.
10.1243/17547164C0012010007
102
In order to improve the flow field at the compressor inlet flow modification devices can be employed. These may be in the form of grillages, meshes, guide vanes, etc. Some of these devices have been
Fig. 3 Predicted Mean Swirl vs Measured ND Swirl Ratio
Fig. 4 Measured Noise Level vs ND Swirl Ratio
10.1243/17547164C0012010007
103
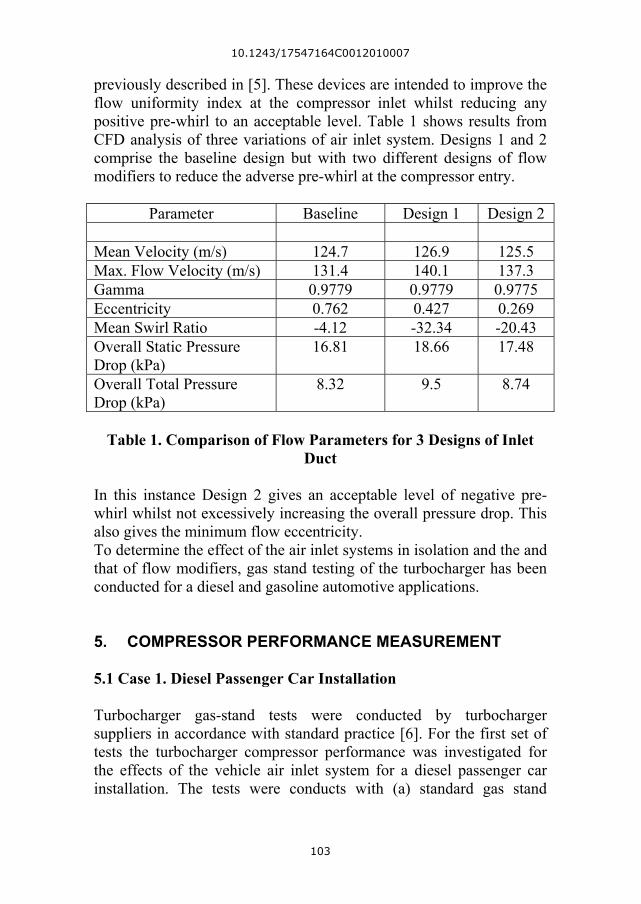
previously described in [5]. These devices are intended to improve the flow uniformity index at the compressor inlet whilst reducing any positive pre-whirl to an acceptable level. Table 1 shows results from CFD analysis of three variations of air inlet system. Designs 1 and 2 comprise the baseline design but with two different designs of flow modifiers to reduce the adverse pre-whirl at the compressor entry.
Parameter Baseline Design 1 Design 2
Mean Velocity (m/s) 124.7 126.9 125.5 Max. Flow Velocity (m/s) 131.4 140.1 137.3 Gamma 0.9779 0.9779 0.9775 Eccentricity 0.762 0.427 0.269 Mean Swirl Ratio -4.12 -32.34 -20.43 Overall Static Pressure Drop (kPa)
16.81 18.66 17.48
Overall Total Pressure Drop (kPa)
8.32 9.5 8.74
Table 1. Comparison of Flow Parameters for 3 Designs of Inlet
Duct
In this instance Design 2 gives an acceptable level of negative pre-whirl whilst not excessively increasing the overall pressure drop. This also gives the minimum flow eccentricity. To determine the effect of the air inlet systems in isolation and the and that of flow modifiers, gas stand testing of the turbocharger has been conducted for a diesel and gasoline automotive applications. 5. COMPRESSOR PERFORMANCE MEASUREMENT 5.1 Case 1. Diesel Passenger Car Installation Turbocharger gas-stand tests were conducted by turbocharger suppliers in accordance with standard practice [6]. For the first set of tests the turbocharger compressor performance was investigated for the effects of the vehicle air inlet system for a diesel passenger car installation. The tests were conducts with (a) standard gas stand
10.1243/17547164C0012010007
104
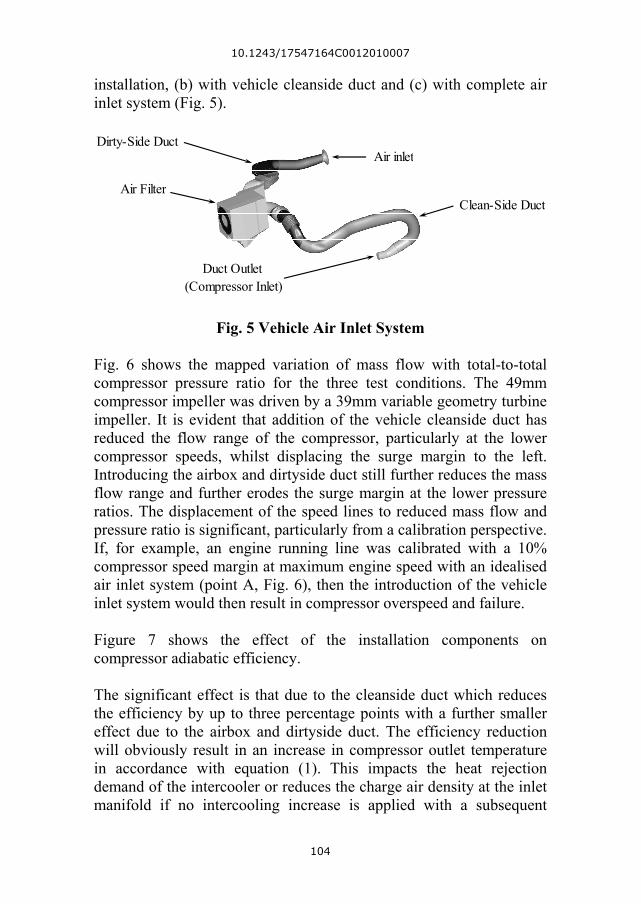
installation, (b) with vehicle cleanside duct and (c) with complete air inlet system (Fig. 5).
Air Filter
Air inletDirty-Side Duct
Clean-Side Duct
Duct Outlet(Compressor Inlet)
Fig. 5 Vehicle Air Inlet System
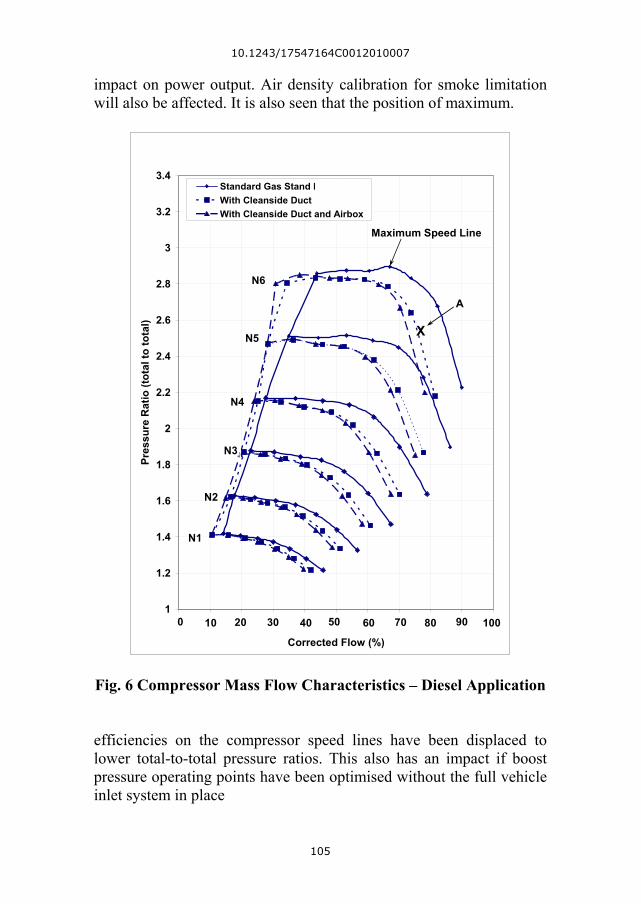
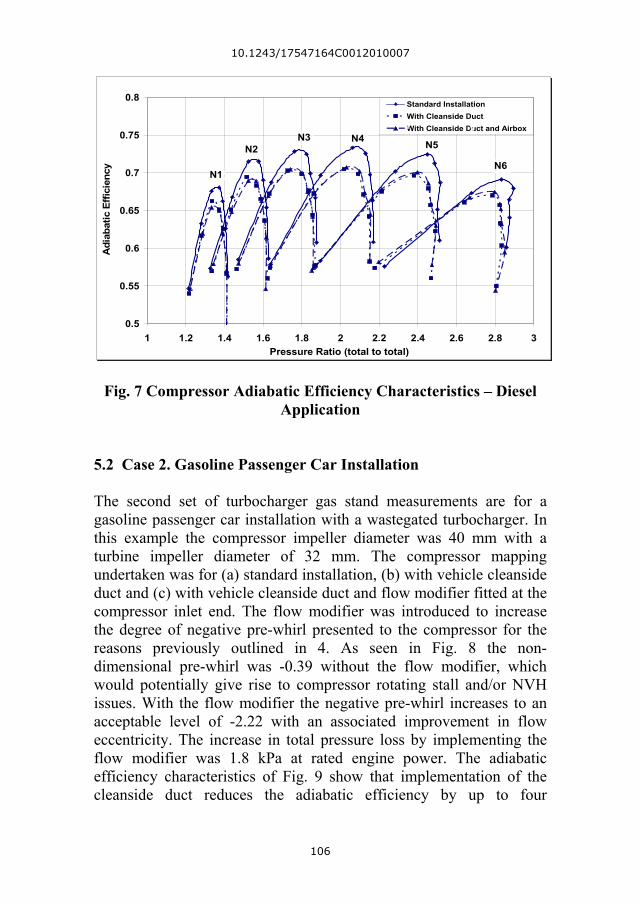
Fig. 6 shows the mapped variation of mass flow with total-to-total compressor pressure ratio for the three test conditions. The 49mm compressor impeller was driven by a 39mm variable geometry turbine impeller. It is evident that addition of the vehicle cleanside duct has reduced the flow range of the compressor, particularly at the lower compressor speeds, whilst displacing the surge margin to the left. Introducing the airbox and dirtyside duct still further reduces the mass flow range and further erodes the surge margin at the lower pressure ratios. The displacement of the speed lines to reduced mass flow and pressure ratio is significant, particularly from a calibration perspective. If, for example, an engine running line was calibrated with a 10% compressor speed margin at maximum engine speed with an idealised air inlet system (point A, Fig. 6), then the introduction of the vehicle inlet system would then result in compressor overspeed and failure. Figure 7 shows the effect of the installation components on compressor adiabatic efficiency. The significant effect is that due to the cleanside duct which reduces the efficiency by up to three percentage points with a further smaller effect due to the airbox and dirtyside duct. The efficiency reduction will obviously result in an increase in compressor outlet temperature in accordance with equation (1). This impacts the heat rejection demand of the intercooler or reduces the charge air density at the inlet manifold if no intercooling increase is applied with a subsequent
10.1243/17547164C0012010007
105
impact on power output. Air density calibration for smoke limitation will also be affected. It is also seen that the position of maximum.
1
1.2
1.4
1.6
1.8
2
2.2
2.4
2.6
2.8
3
3.2
3.4
0 0 0 0 0 0 0 0 0 0 0Corrected Flow (%)
Pres
sure
Rat
io (t
otal
to to
tal)
Standard Gas Stand InstalltionWith Cleanside DuctWith Cleanside Duct and Airbox
N1
N2
N3
N4
N5
N6
0 100908070605040302010
A
Maximum Speed Line
X
Fig. 6 Compressor Mass Flow Characteristics – Diesel Application
efficiencies on the compressor speed lines have been displaced to lower total-to-total pressure ratios. This also has an impact if boost pressure operating points have been optimised without the full vehicle inlet system in place
10.1243/17547164C0012010007
106
0.5
0.55
0.6
0.65
0.7
0.75
0.8
1 1.2 1.4 1.6 1.8 2 2.2 2.4 2.6 2.8 3Pressure Ratio (total to total)
Adi
abat
ic E
ffici
ency
Standard InstallationWith Cleanside DuctWith Cleanside Duct and Airbox
N1
N2N3 N4 N5
N6
Fig. 7 Compressor Adiabatic Efficiency Characteristics – Diesel Application
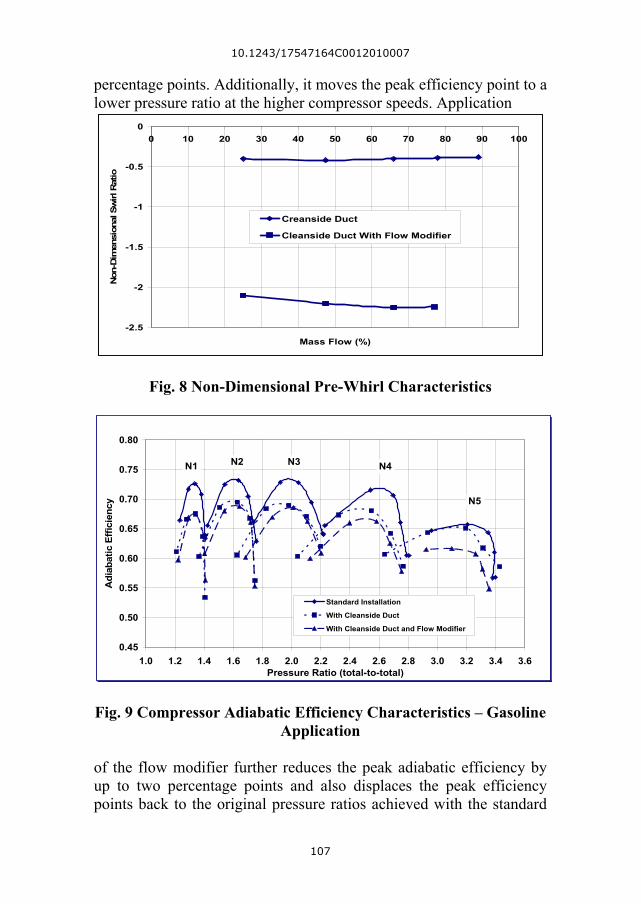
5.2 Case 2. Gasoline Passenger Car Installation The second set of turbocharger gas stand measurements are for a gasoline passenger car installation with a wastegated turbocharger. In this example the compressor impeller diameter was 40 mm with a turbine impeller diameter of 32 mm. The compressor mapping undertaken was for (a) standard installation, (b) with vehicle cleanside duct and (c) with vehicle cleanside duct and flow modifier fitted at the compressor inlet end. The flow modifier was introduced to increase the degree of negative pre-whirl presented to the compressor for the reasons previously outlined in 4. As seen in Fig. 8 the non-dimensional pre-whirl was -0.39 without the flow modifier, which would potentially give rise to compressor rotating stall and/or NVH issues. With the flow modifier the negative pre-whirl increases to an acceptable level of -2.22 with an associated improvement in flow eccentricity. The increase in total pressure loss by implementing the flow modifier was 1.8 kPa at rated engine power. The adiabatic efficiency characteristics of Fig. 9 show that implementation of the cleanside duct reduces the adiabatic efficiency by up to four
10.1243/17547164C0012010007
107
percentage points. Additionally, it moves the peak efficiency point to a lower pressure ratio at the higher compressor speeds. Application
-2.5
-2
-1.5
-1
-0.5
00 10 20 30 40 50 60 70 80 90 100
Mass Flow (%)
Non
-Dim
ensi
onal
Sw
irl R
atio
Creanside Duct
Cleanside Duct With Flow Modifier
Fig. 8 Non-Dimensional Pre-Whirl Characteristics
0.45
0.50
0.55
0.60
0.65
0.70
0.75
0.80
1.0 1.2 1.4 1.6 1.8 2.0 2.2 2.4 2.6 2.8 3.0 3.2 3.4 3.6Pressure Ratio (total-to-total)
Adi
abat
ic E
ffici
ency
Standard Installation
With Cleanside Duct
With Cleanside Duct and Flow Modifier
N1 N2 N3 N4
N5
Fig. 9 Compressor Adiabatic Efficiency Characteristics – Gasoline Application
of the flow modifier further reduces the peak adiabatic efficiency by up to two percentage points and also displaces the peak efficiency points back to the original pressure ratios achieved with the standard
10.1243/17547164C0012010007
108
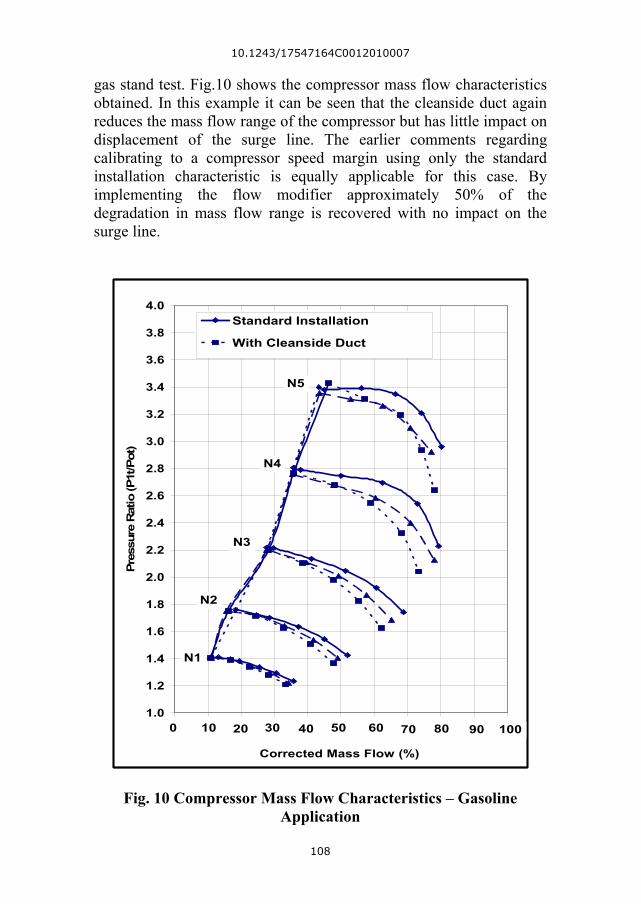
gas stand test. Fig.10 shows the compressor mass flow characteristics obtained. In this example it can be seen that the cleanside duct again reduces the mass flow range of the compressor but has little impact on displacement of the surge line. The earlier comments regarding calibrating to a compressor speed margin using only the standard installation characteristic is equally applicable for this case. By implementing the flow modifier approximately 50% of the degradation in mass flow range is recovered with no impact on the surge line.
1.0
1.2
1.4
1.6
1.8
2.0
2.2
2.4
2.6
2.8
3.0
3.2
3.4
3.6
3.8
4.0
0 0 0 0 0 0 0 0 0 0 0
Corrected Mass Flow (%)
Pres
sure
Rat
io (P
1t/P
ot)
Standard Installation
With Cleanside Duct
N1
N5
N4
N3
N2
0 100908070605040302010
Fig. 10 Compressor Mass Flow Characteristics – Gasoline Application
10.1243/17547164C0012010007
109
5.4 Case 3. Gasoline Passenger Car Installation – Alternative
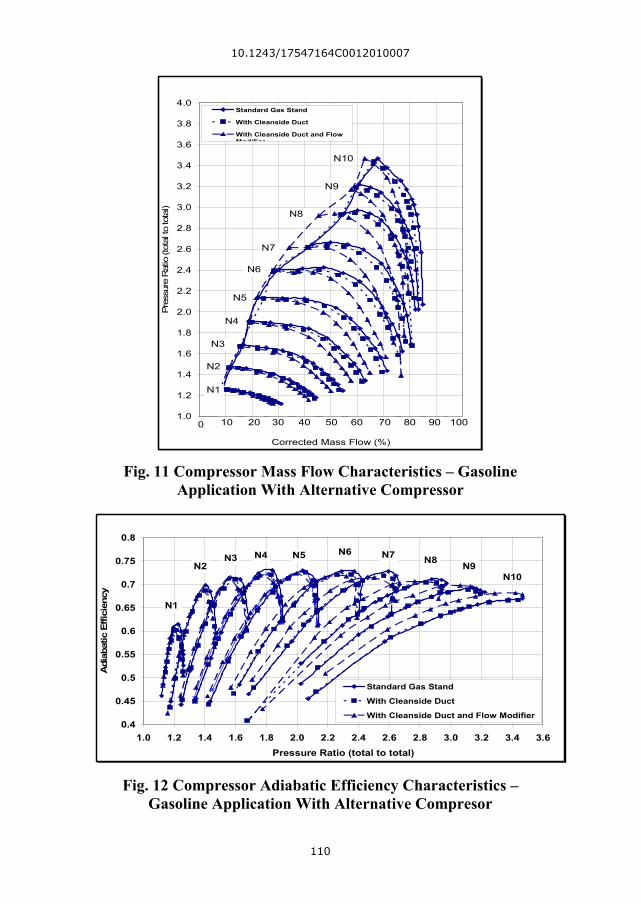
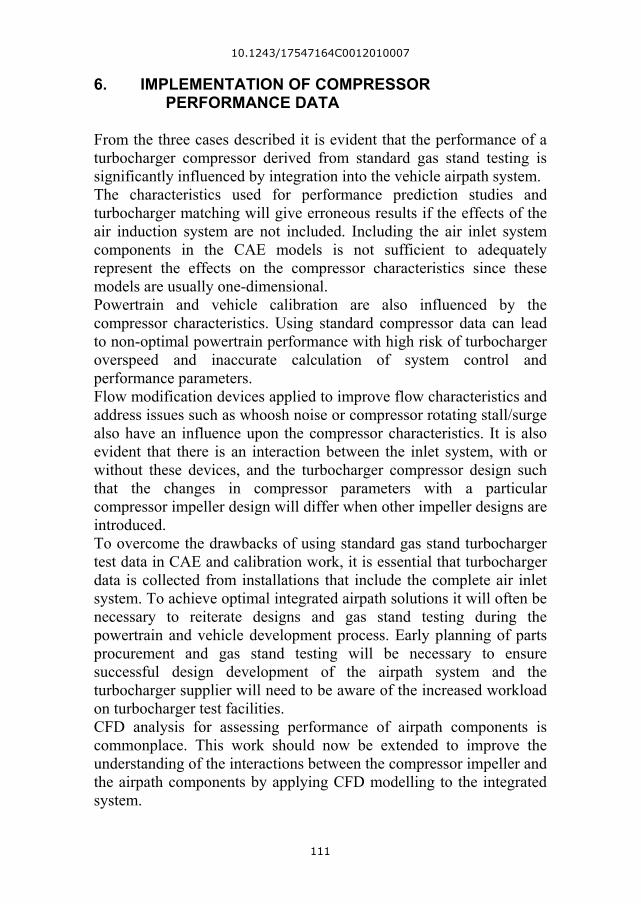
Turbocharger In this case the cleanside duct of Case 2 was tested with an alternative turbocharger. The compressor of this turbocharger had a compressor impeller diameter of 43 mm and a turbine impeller diameter of 38 mm and was from a different supplier to the first turbocharger. Fig. 11 shows the displacement of the mass flow characteristics by application of the cleanside duct and with the addition of the flow modifier. Whilst the mass flow range has been reduced, the degree of reduction was significantly less than that seen with the first turbocharger (Fig. 9); the surge line appears to be unaffected. However in this case the addition of the flow modifier further reduces the mass flow range, contrary to the effect with the initial compressor. The surge line is seen to be displaced to a lower flow regime at higher compressor speeds, but unaffected at the lower speeds. Adiabatic efficiency of the second compressor is almost uninfluenced by the cleanside duct at higher compressor speeds (Fig. 12) but reduces at the lower speeds. However the reduction is less than that seen with the original compressor (Fig. 10). By introducing the flow modifier, the adiabatic efficiency is reduced and the position of the peak efficiency shifted to lower pressure ratios at the low to mid speed ranges of the compressor. At the higher compressor speeds the adiabatic efficiency is seen to improve by up to two percentage points over the standard installation. Earlier comments with regard to increased compressor outlet temperature and turbocharger overspeed are also applicable to the alternative turbocharger compressor, but to a different degree. The differences seen between the responses of the two turbocharger compressors to the common cleanside duct and flow modifier is potentially due to the difference in impeller design of the two compressors which would result in variation of relative inlet gas angles and hence giving a performance variation.
10.1243/17547164C0012010007
110
1.0
1.2
1.4
1.6
1.8
2.0
2.2
2.4
2.6
2.8
3.0
3.2
3.4
3.6
3.8
4.0
0 0 0 0 0 0 0 0 0 0 0Corrected Mass Flow (%)
Pre
ssur
e R
atio
(tot
al to
tota
l)
Standard Gas Stand
With Cleanside Duct
With Cleanside Duct and FlowModifier
N1
N2
N3
N4
N5
N6
N7
N8
N9
N10
0 100908070605040302010
Fig. 11 Compressor Mass Flow Characteristics – Gasoline Application With Alternative Compressor
0.4
0.45
0.5
0.55
0.6
0.65
0.7
0.75
0.8
1.0 1.2 1.4 1.6 1.8 2.0 2.2 2.4 2.6 2.8 3.0 3.2 3.4 3.6Pressure Ratio (total to total)
Adi
abat
ic E
ffici
ency
Standard Gas Stand
With Cleanside Duct
With Cleanside Duct and Flow Modifier
N1
N2N3 N4 N5 N6 N7 N8
N9N10
Fig. 12 Compressor Adiabatic Efficiency Characteristics – Gasoline Application With Alternative Compresor
10.1243/17547164C0012010007
111
6. IMPLEMENTATION OF COMPRESSOR PERFORMANCE DATA
From the three cases described it is evident that the performance of a turbocharger compressor derived from standard gas stand testing is significantly influenced by integration into the vehicle airpath system. The characteristics used for performance prediction studies and turbocharger matching will give erroneous results if the effects of the air induction system are not included. Including the air inlet system components in the CAE models is not sufficient to adequately represent the effects on the compressor characteristics since these models are usually one-dimensional. Powertrain and vehicle calibration are also influenced by the compressor characteristics. Using standard compressor data can lead to non-optimal powertrain performance with high risk of turbocharger overspeed and inaccurate calculation of system control and performance parameters. Flow modification devices applied to improve flow characteristics and address issues such as whoosh noise or compressor rotating stall/surge also have an influence upon the compressor characteristics. It is also evident that there is an interaction between the inlet system, with or without these devices, and the turbocharger compressor design such that the changes in compressor parameters with a particular compressor impeller design will differ when other impeller designs are introduced. To overcome the drawbacks of using standard gas stand turbocharger test data in CAE and calibration work, it is essential that turbocharger data is collected from installations that include the complete air inlet system. To achieve optimal integrated airpath solutions it will often be necessary to reiterate designs and gas stand testing during the powertrain and vehicle development process. Early planning of parts procurement and gas stand testing will be necessary to ensure successful design development of the airpath system and the turbocharger supplier will need to be aware of the increased workload on turbocharger test facilities. CFD analysis for assessing performance of airpath components is commonplace. This work should now be extended to improve the understanding of the interactions between the compressor impeller and the airpath components by applying CFD modelling to the integrated system.
10.1243/17547164C0012010007
112
7. CONCLUSIONS
• Standard performance characteristics of automotive
turbocharger compressors are significantly influence by the air inlet system to which they are connected.
• Flow modification devices at compressor inlets can be applied to improve the flow field at the compressor inlet and be used to address airflow NVH issues.
• Flow modification devices further influence turbocharger compressor performance.
• Compressors of differing designs will not necessarily behave in the same manner with a common air inlet system.
• CAE performance analysis and turbocharger matching calculations will yield erroneous results if standard gas stand turbocharger data is used.
• Vehicle and powertrain calibration using standard gas stand data will result in non-optimal performance with compressor outlet temperature, air density and compressor speed calculations being incorrectly calculated leading to a risk of turbocharger overspeed.
• Gas stand testing of turbochargers should include the complete air inlet system, the results from which should be used in any CAE and calibration work.
• CAE analysis should include the airpath components and the compressor impeller.
© Authors 2010 8. REFERENCES [1] Ricardo plc, Wave Simulation Tool User Manual – V7.2, 2006. [2] Gamma Technologies Inc, GT-Power Simulation Software User Manual, 2007. [3] H. Kindl, N. Schorn, , H. Schulte, J.R. Serrano, X., Margot, and J.C. Donayre, ‘Influence of Various Compressor Inlet Designs on Compressor Performance’, THIESEL 2004 Conference on Thermo- and Fluid Dynamics Processes in Diesel Engines, 2004.
10.1243/17547164C0012010007
113
[4] G. Capon, A. Leong, T. Morris,. 'The Influence of Installation Parameters on Turbocharged Automotive Engine Performance'. 8th International Conference on Turbochargers and Turbocharging, IMechE London 2006.
[5] T. Nakato, and M. Krütten, ‘Experimental Studies of Flow-Staightening Devices to Improve Approach-Flow Distributions at Pump Intake under Cross Flows’, Iowa Institute of Hydraulic Research, The University of Iowa, Iowa City, Iowa, 1998. [6] SAE, Turbocharger Gas Stand Test Code J1826, March 1995. [7] Evans, D., Ward., A. 'the Reduction of Turbocharger Whoosh Noise for Diesel Powertrains'. Turbocharged Automotive Engine Performance'. 8th International Conference on Turbochargers and Turbocharging, IMechE London 2006.