Embed Size (px)
Citation preview
The Economic Impact of the Child Care Industry
in Orange County
2002
Contributors The Economic Impact of the Child Care Industry in Orange County
Advisory Board
Joel Ayala Hispanic Chamber of Commerce of Orange County Anne Broussard Orange County Child Care Coordinator Dr. Victoria Basolo University of California – Irvine William Fogarty United Labor Agency of Orange County Nedra Kunisch Children’s Home Society of California Scott Kutner City of Santa Ana Elda Lavinbuk Community Care Licensing
Marsha Link Spectra Consultants Rama Meka Children’s Home Society of California Dr. John Nelson Orange County Department of Education Joseph Pak Pacific Bell Julie Puentes Orange County Business Council Carol Tagayun South Orange County Chamber of Commerce
Project Consultants Dr. Radha Bhattacharya California State University – Fullerton Alex Hildebrand National Economic Development and Law Center Jennifer Wohl National Economic Development and Law Center
Dr. James Head National Economic Development and Law Center Shelley Waters Boots California Child Care Resource and Referral Network
Success By 6® Staff Mary Ellington Castorena Director
Laura Long Cunningham Program Manager, Child Care Strategy
This work is based upon support from the Bank of America Foundation/UWA Success By 6® Enhancement Initiative.
The information in this report does not necessarily reflect the views of the Bank of America Foundation.
Table of Contents The Economic Impact of the Child Care Industry in Orange County Executive Summary ....................................................................................................... i -v Section 1: Introduction ......................................................................................................1 Defining Child Care.............................................................................................................2 About the Local Investment in Child Care Project ..............................................................3 Outline of the Report ...........................................................................................................4 Section 2: Economic Profile of Orange County ..............................................................5 Employment and Industry Outlook......................................................................................6 Demographics ....................................................................................................................10 Housing Affordability and Poverty....................................................................................12 Other Economic Indicators ................................................................................................14 Implications for Child Care ...............................................................................................17 Section 3: Economic Impact of the Child Care Industry .............................................19 Traditional Methods of Accounting for the Child Care Industry ......................................20 Accounting for the Child Care Industry Using Local Data ...............................................21 Measuring Child Care Industry Output or Gross Receipts ................................................21 Measuring Direct Employment..........................................................................................23 Indirect Employment .........................................................................................................24 Capture of Federal and State Subsidies .............................................................................25 Federal and State Tax Deductions for Child Care .............................................................27 Measuring the Size of the License Exempt Child Care Field............................................28 Multiplier Effects of Child Care Capital Investments .......................................................29 Section Summary...............................................................................................................30 Section 4: Child Care and Economic Development ......................................................31 The Impact of Child Care on Economic Competitiveness.................................................31 The Effect of Child Care on Productivity ..........................................................................32 Improving the Quality of Life............................................................................................35 Section 5: Measuring Child Care Supply and Demand in Orange County ...............38 Factors Affecting the Supply of Licensed Child Care .......................................................38 Historical Trends in Licensed Child Care Supply .............................................................39 Child Care Staffing Shortage .............................................................................................40 Land Use Barriers ..............................................................................................................41 Welfare Reform and the Shortage of Affordable Child Care ............................................43 Factors Affecting Demand.................................................................................................44 Where are the Children Now?............................................................................................44 Population Growth .............................................................................................................45 Labor Force Participation Rates.........................................................................................45 Occupational Industry Growth...........................................................................................45 Child Care Affordability ....................................................................................................46

Mapping the Need for Child Care......................................................................................48 Section Summary...............................................................................................................52
Section 6: Conclusion.......................................................................................................53 Local Constraints on Child Care Growth in Orange County.............................................53 Economic Benefits of Local Investment in the Child Care Industry .................................54 Strategies for Supporting the Local Child Care Industry...................................................54
List of Figures and Tables The Economic Impact of the Child Care Industry in Orange County Figure 1: Orange County Employment by Industry, 1999 ..................................................8 Figure 2: Population Growth and Employment Growth (%) in Orange County ..............10 Figure 3: Orange County Population by Age, Census 2000..............................................11 Figure 4: Total Orange County Population by Race, Census 2000 ...................................11 Figure 5: Orange County Population by Ethnicity, Census 2000......................................12 Figure 6: Revenue Comparisons by Industry, Orange County..........................................22 Figure 7: Direct Employment Comparisons By Industry, Orange County........................24 Figure 8: The High/Scope Perry Preschool Study, Major Findings at Age 27..................36 Figure 9: Licensed Child Care Capacity in Orange County, 1998 – 2001 ........................39 Figure 10: Average Weekly Child Care Cost for Family with Preschool-Aged Child .....47 Figure 11: Map of Employment Growth vs. Child Care Capacity by City .......................50 Figure 12: Map of Population Growth vs. Child Care Capacity by City...........................51 Table 1: Industry Employment in Orange County, 2000-2005 ..........................................9 Table 2: Orange County Recipients of CalWORKs (1999, 2000) or AFDC (1998)........14 Table 3: Orange County PMSA Civilian Labor Force Participation Rates and
Employment to Population ratios........................................................................15 Table 4: Orange County PMSA Percent Distribution by Industry of Employed Women,
Excluding Private Household Workers (1999) and Projected Industry Growth (1997-2004) 16
Table 5: Comparison of Licensed Child Care Industry Estimates, Orange County 2001 .23 Table 6: Sources of Subsidies for Child Care in Orange County, 2001 ............................27 Table 7: Projected Taxes and Direct, Indirect, and Induced Productivity Effects of
Licensed Child Care............................................................................................35 Table 8: Percent Of Children In Organized Child Care By Family Characteristic ...........45 Table 9: 10 Fastest Growing Occupations in Orange County by Percentage....................46
List of Appendices The Economic Impact of the Child Care Industry in Orange County Appendix A: Methodology for Calculating Gross Receipts and Employment for
Licensed Child Care Appendix B: Explanation of IMPLAN Input-Output Model Appendix C: Land Use Requirements by City and Unincorporated Areas for Child
Care Centers in Orange County
i
Executive Summary The Economic Impact of the Child Care Industry in Orange County
Child care is an income-generating, job-creating industry that is critical to Orange County’s economic vitality and quality of life. The child care industry helps sustain and stimulate other industries by enabling parents to enter and remain in the workforce and be productive on the job. This support of labor force participation also serves to increase output, personal income, and business formation. Child care contributes to the county’s economic productivity by employing workers, paying taxes, purchasing goods and services from other industry sectors, and reducing social service expenditures. Moreover, it provides an early, yet critical, investment in the development of Orange County’s future workforce.
However, the need for child care continues to expand at a rate which far exceeds the supply. During the past three years, child care supply has expanded at a rate of just one-half of 1 per cent each year. Orange County has only 1 licensed child care space for every 6 children ages 0 to 13 with working parents. In particular, there is a severe shortage of licensed child care for infants and toddlers and for families that need care during evenings or weekends. Some areas of the county where population is increasing and job growth is expanding show particularly low levels of child care supply. The licensed child care industry’s inability to meet increasing demand is attributable to a variety of factors, including the high cost of providing care, the shortage of qualified staff, high land and development costs, the lack of affordable financing products, and inadequate business skills of child care operators. This combination of factors makes it difficult to develop new facilities or to retain and expand existing ones. This Economic Impact of the Child Care Industry report measures the extent of the child care industry’s integration with the local economy and demonstrates why investing in child care makes good business sense. Critical to the development of new strategies to address the child care shortage is a better understanding of the dynamics of the child care industry, particularly in light of the changing needs of working families and the economy. With a clearer sense of the characteristics of the child care field and its importance to the economy, policymakers, planners, and civic leaders will be able to create partnerships and identify resources necessary to optimize the provision of child care services in a way that promotes both economic vitality and positive outcomes for children, families, and communities. Without policies and investments to strengthen and expand the child care infrastructure, economic growth in Orange County will be constrained. KEY FINDINGS The licensed child care industry generates approximately $412 million annually in Orange County, with centers accounting for $340 million and family child care homes an
ii
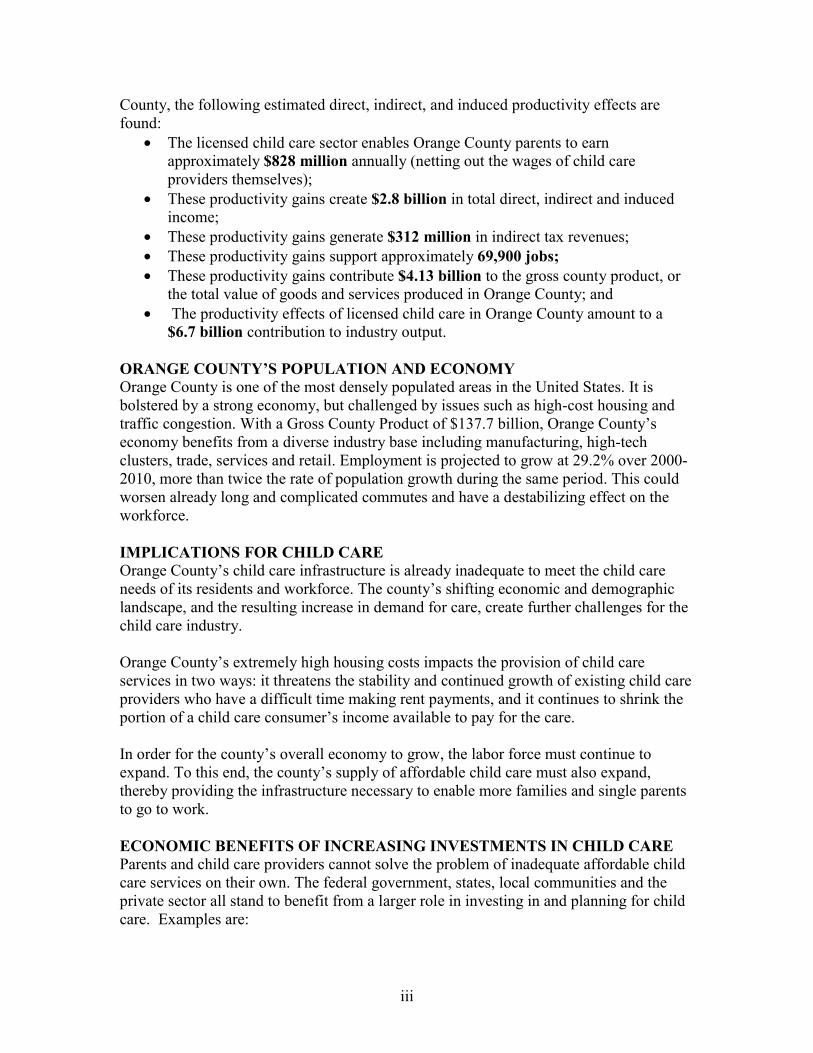
additional $72 million. Licensed child care businesses contribute approximately $29 million in direct taxes to state and local governments. The child care industry also supports 13,902 local jobs, including 10,694 in the child care industry itself and 3,208 in other industry sectors. Countywide, direct child care employment is comparable to the “computers, peripherals and software” industry grouping as well as the “apparel and other textile products” industry grouping. The federal estimates differ from this report’s estimates in that the federal estimates of the county’s child care infrastructure undercount gross receipts by 30% and employment by 60%. In addition to the gross receipts generated on its own, the licensed child care industry supports a measurable amount of gross receipts in other industries that sell goods and services to child care providers. Other industries sell an estimated $161 million to the child care sector per year, and households of employees of the child care sector and its suppliers in other industries spend $146.5 million annually on consumer goods and services. Adding these figures to its annual gross receipts, the licensed child care sector accounts for $719.5 million per year in the Orange County economy. The report focuses on licensed child care, as data on licensed providers is maintained and is appropriate for conducting an economic analysis. While most license exempt care providers cannot be tracked, they also contribute significantly to the local economy. Two types of license exempt child care can be measured: license exempt after-school programs run by school districts generate nearly $20 million annually in gross receipts, and home-based license exempt providers offering services to families on welfare (CalWORKs) receive nearly $27 million annually in subsidies from the state and federal governments.
Direct Employment Comparisons By Industry, Orange County
20,923
15,063 14,77912,135
10,694 10,0058,404
0
5,000
10,000
15,000
20,000
25,000
Hotels andother lodging
places
Amusementparks
Computers,peripherals and
software
Apparel andother textile
products
Licensed childcare
Radio,television and
computer stores
Nursing andpersonal care
facilities
Source for Non-Child Care Industries: Estimated for 2001 based on US Bureau of Labor Statistics ES-202 Survey, 1997-2000.
The child care industry also has a tremendous effect on productivity in the Orange County economy. The earnings of parents who are able to work because their children are in reliable child care arrangements can be traced as they ripple through the economy in the form of indirect and induced earnings and other productivity effects. For Orange
iii
County, the following estimated direct, indirect, and induced productivity effects are found:
• The licensed child care sector enables Orange County parents to earn approximately $828 million annually (netting out the wages of child care providers themselves);
• These productivity gains create $2.8 billion in total direct, indirect and induced income;
• These productivity gains generate $312 million in indirect tax revenues; • These productivity gains support approximately 69,900 jobs; • These productivity gains contribute $4.13 billion to the gross county product, or
the total value of goods and services produced in Orange County; and • The productivity effects of licensed child care in Orange County amount to a
$6.7 billion contribution to industry output. ORANGE COUNTY’S POPULATION AND ECONOMY Orange County is one of the most densely populated areas in the United States. It is bolstered by a strong economy, but challenged by issues such as high-cost housing and traffic congestion. With a Gross County Product of $137.7 billion, Orange County’s economy benefits from a diverse industry base including manufacturing, high-tech clusters, trade, services and retail. Employment is projected to grow at 29.2% over 2000-2010, more than twice the rate of population growth during the same period. This could worsen already long and complicated commutes and have a destabilizing effect on the workforce. IMPLICATIONS FOR CHILD CARE Orange County’s child care infrastructure is already inadequate to meet the child care needs of its residents and workforce. The county’s shifting economic and demographic landscape, and the resulting increase in demand for care, create further challenges for the child care industry. Orange County’s extremely high housing costs impacts the provision of child care services in two ways: it threatens the stability and continued growth of existing child care providers who have a difficult time making rent payments, and it continues to shrink the portion of a child care consumer’s income available to pay for the care. In order for the county’s overall economy to grow, the labor force must continue to expand. To this end, the county’s supply of affordable child care must also expand, thereby providing the infrastructure necessary to enable more families and single parents to go to work. ECONOMIC BENEFITS OF INCREASING INVESTMENTS IN CHILD CARE Parents and child care providers cannot solve the problem of inadequate affordable child care services on their own. The federal government, states, local communities and the private sector all stand to benefit from a larger role in investing in and planning for child care. Examples are:
iv
• Local policies and investments that support the child care industry’s ability to improve Orange County’s overall productivity and economic competitiveness. Worker absenteeism because of child care problems is estimated to cost U.S. businesses $3 billion per year).
• Investments in child care supply-building that contribute to labor force participation gains among lower- and middle-income families in Orange County. Such gains directly increase output, personal income, business formation, and property and sales tax revenues in the county.
• The capture of more than $120 million per year in federal and state child care subsidies for low-income working households in Orange County. Federal and state expenditures for child care are growing, but remain well below the amount needed to serve all eligible families. The county’s capture of these subsidies directly relates to its ability to expand the infrastructure of subsidized child care centers and programs.
• Increased utilization of non-parental child care. This helps Orange County residents capture increased levels of federal and state tax credits and deductions for child care expenditures.
• Investments in high quality child care services increases the quality of life for Orange County residents by preventing crime, and reducing social service expenditures. A study on the benefits of quality child care found that one dollar spent on early child care saves $7.16 in public sector expenditures later in the individual’s life.
STRATEGIES FOR SUPPORTING THE CARE INDUSTRY Many jurisdictions across the country realize the value of child care to their economy and community well-being, and bring new partners to the table to tackle the child care shortage. While every community faces different obstacles in the delivery of child care services, there are a number of strategies that prove effective in more deeply integrating child care and the economic development planning process. The following are examples of efforts in other California communities that strengthen the child care infrastructure:
• The City of Bakersfield (Kern County) incorporated meaningful child care language into the City’s Consolidated Plan 2005. Child care is rated as a high priority and the City has committed to use Community Development Block Grant and other public funds to develop at least 10 licensed child care centers and/or family child care homes accommodating 1,500 children.
• Child care, for the first time, is a traffic mitigation measure in San Mateo County. The City/County Association of Governments for San Mateo County (C/CAG) adopted child care as a mitigation measure and incentive in the C/CAG Transportation Demand Management Program. The measure applies to all new large developments throughout the county.
• Ventura County changed their zoning ordinance to exempt large family child care facilities from permits and included the Commercial Office zone as allowable for child care centers. Child care has also been included in Ventura County’s Consolidated Plan for 2000
• The Child Care Fund of Alameda County, created in 1999, offers loans, grants, technical assistance, and training to child care providers in the realm of both
v
facilities development and business practices. The Child Care Fund optimizes existing resources and fills the gaps in services with resources and expertise of its own to bolster child care capacity in Alameda County.
• The Santa Cruz Community Credit Union tripled the size of its loan fund for child care providers over the past two years. The Credit Union now has $150,000 in loan funds, continues operating with an extremely low default rate, and is pursuing new funding sources in the amount of $300,000 -$500,000.
• The Kern County Local Investment in Child Care Project provides training workshops in both Spanish and English that assist child care providers in understanding fundamental business principles. To date, over 400 participants have been trained in bookkeeping, understanding taxes, and marketing a child care business. These trainings are held in collaboration with the Small Business Development Center.
These local efforts strengthen the child care infrastructure and benefit the child care industry, financing institutions, local government, and the business community alike. The collaborations developed between entities previously disengaged from child care issues serve to educate all of the stakeholders about the importance of a healthy child care infrastructure, and, at the same time, help to develop cost-effective solutions to local shortages in the supply of child care. The lack of accurate data available on the child care industry makes it difficult to assess its size and contribution to the economy. As a result, child care’s significance to the health of local economy is largely unrecognized. The methodologies developed in this report represent the first serious effort at making such economic assessments of the child care field. Although more and better data on child care is needed, the analysis presented here demonstrates that child care is an essential part of the Orange County economic infrastructure, and efforts to strengthen the child care industry will contribute to a strengthening of the economy as a whole
1
Section 1 Introduction The nature of working America has changed and child care has changed with it. Record high percentages of parents are joining the labor force and parents are returning to work more quickly following the birth of children. The child care industry is straining to meet the increasing demand for affordable child care services, but faces a number of barriers including high land and development costs, low reimbursement rates for publicly subsidized services, the high cost of providing quality child care, and an unstable child care workforce is characterized by low wages and high turnover. Historically, child care has been perceived primarily as a social service or at best an educational service for parents who want to (and can afford to) provide their children with early learning experiences. Recent research on early brain development demonstrates that far from being a luxury, child care is a vital service to children in improving their health, school readiness, and contribution to society. Changing economic circumstances also turn the child care industry into a cornerstone for the economy; without available and affordable child care services, parents are unable to effectively participate in the workforce. Research presented in this report portrays licensed child care services as a significant income-generating, job-creating industry sector in its own right. Orange County’s licensed child care industry supports 13,902 local jobs and generates approximately $412 million per year in gross receipts.1 The purpose of this report is to provide a comprehensive analysis of the relationship between child care and the Orange County economy, and to begin bridging the gap between economic development planning and child care advocacy. Policymakers, business leaders, economic development planners, transportation planners, and other community leaders stand to benefit from an increased dialogue around child care’s importance to the healthy functioning of an economy. This report presents a wide range of compelling evidence to demonstrate that investments in the child care infrastructure have direct, positive effects on the ability of a local economy to experience growth and vitality. The report also argues that an intimate understanding of the interaction between child care supply and economic growth improves the efficiency of investments in child care, and therefore saves both private and public expenditures, both directly and indirectly. To cast additional light on the nexus between child care and economic development, this report:
• Quantifies the licensed child care industry in Orange County using traditional economic measurements;
1 See Section 3 for further discussion of results and methodology.

2
• Assesses the extent to which child care currently supports the economic performance of Orange County; and
• Evaluates issues in the supply and demand for child care in Orange County that could affect the future performance of the Orange County economy.
Defining Child Care Child care, broadly defined, refers to the care of children on a regular basis during non-school hours by someone other than the child’s parents. It encompasses a wide range of services, provides supervision of, nurtures, and educates young children, while simultaneously enables parents to work or attend school. Child care programs may be licensed or unlicensed. The State of California requires that “Every person must obtain a license before providing care and supervision to children, with the exception of an individual caring for their own relative's children or the children of only one unrelated family in his or her home.”2 Other arrangements that do not require licenses include:
• Any care and supervision of persons by a relative or guardian; • Certain public and private schools that operate a program before and/or after
school for school age children; • Certain public and private recreation programs; • Cooperative arrangements between parents that involve no payment; and • Child care on federal lands.
Licensed child care meets minimum health and safety standards and staff-child ratios set by the state legislature and regulated by the Community Care Licensing Division of the California Department of Social Services. Licensed establishments include most child care centers and many home-based providers, or “family child care homes.” Family child care homes are licensed as small or large, depending on the number and ages of children served (small and large family child care homes can serve a maximum of eight and fourteen children, respectively, of varying ages).3 In contrast, non-licensed child care is not regulated by the state and generally not governed by any official standards, except those maintained by an administering agency (if any). Non-licensed child care services include nannies, parent cooperatives, relative care, some home based care arrangements (where care for no more than one other person’s children is taking place), some after-school programs, and babysitters. It is difficult to determine how many Orange County children are in which kind of child care arrangements, because only licensed child care facilities are regulated and monitored. A recent survey conducted for the Orange County Children and Families Commission suggests that 35% of Orange County children in child care are enrolled in a licensed center, while 12% are enrolled with a “home day care provider” (it did not 2 California Department of Social Services, Community Care Licensing Division, http://ccld.ca.gov/docs/child care/Provider/fcclp.htm. 3 Ibid.
3
specify whether or not it was a licensed arrangement).4 Another 23% of these children are being cared for by a “friend or family in a caregiver’s house,” and 18% are being cared for by a “friend or family in the child’s house” (this latter category includes care by a parent, which does not fit the above definition of child care which excludes parental care).5 Seven percent of these children are being cared for by a nanny or babysitter in the child’s house, and another 7% are being cared for by a sibling in the child’s house. Another way of estimating usage of licensed versus non-licensed care is to compare the number of children enrolled in licensed child care in Orange County with data from the US Census on the number of children living in households where “all parents present are in the labor force” (which indicates the need for some type of child care, even if it is self-care by the child). With 78,000 children enrolled in licensed care,6 and approximately 307,000 children 0-13 years old living in households with all parents present in the labor force,7 229,000 children (or 75%) are getting their child care needs met in non-licensed settings (if at all). This is consistent with statewide estimates by the California Child Care Resource and Referral Network that there is approximately one licensed child care space for every 7.1 Orange County children with working parents.8 Because licensed child care is a formal part of the economy (i.e., the sector consistently charges fees and is subject to taxes, state regulations, etc.), its economic impact is easily quantified. Although unlicensed child care arrangements are widely used and also add much to the economy, it is difficult to ascertain their impact. Therefore, this report focuses primarily on licensed care for children 0-13 years of age. The Local Investment in Child Care Project This report is based on a series of reports originally produced by the Local Investment in Child Care (LINCC) Project, launched in 1997 with support from the David and Lucile Packard Foundation. The project is designed to incorporate child care into local economic development planning. It is currently operating in Alameda, Kern, Los Angeles, Monterey, San Mateo, Santa Clara, Santa Cruz, and Ventura Counties. The Economic Impact Reports developed for each of these counties articulate child care in economic development terms and facilitates dialogue between the child care sector and local policymakers, business leaders, and private lenders. In addition, the reports help to build local partnerships aimed at increasing the child care industry’s capacity to respond to the shifting child care needs of California families.
4 Early Care and Education Needs Assessment for Orange County, conducted by Sharon Milburn, Ph.D., Sid Gardner, M.P.A., Barbara Glaser, Ph.D., and Nina Dreyer, M.S.W., in October 2001. Participating entities included the Center for Collaboration for Children at the College of Human Development and Community Service, Cal State Fullerton, and the Children and Families Commission of Orange County. Percentages may exceed 100% because some children in the survey were enrolled in multiple forms of care. 5 Ibid. 6 According to licensed capacity and child care vacancy data maintained by the Children’s Home Society of California. 7 Calculated using data from the US Census Bureau, Census 2000 Supplemental Survey. 8 California Child Care Resource and Referral Network, 1999 Child Care Portfolio.
4
Outline of the Report Following the introduction presented in Section 1, Section 2 reviews recent economic and demographic trends in Orange County, then suggests the implications these trends have on for the child care industry. Section 3 measures the size of the child care industry in terms of both output and employment, discusses the methodology behind the measurement, and assesses several other features of the child care industry that impact its size and performance. The ways in which the child care industry interacts with the Orange County economy are detailed in Section 4. This section analyzes the impact child care has on economic competitiveness and worker productivity. It discusses other economic benefits of child care, including public sector savings that can result from investments in quality child care, the impact of child care on school academic success and the development of the future workforce. Section 5 explores the child care industry’s recent expansion and examines factors affecting both supply of and demand for child care, including the shortage of qualified child care staff, Orange County’s high cost of living, and economic trends affecting child care demand. It also identifies local constraints on the child care industry’s ability to develop adequate supply for chronic, consumer-identified shortages. The report concludes with Section 6, which provides recommendations based upon the concepts articulated in this report. It suggests key areas for Orange County’s policymakers, business and civic leaders, economic development planners, and child care advocates to consider when planning for local urban and economic development activities.
5
Section 2 Economic Profile of Orange County
If Orange County, California, were an independent country, its economy would rank among the top 35 in the world, making it larger than Greece, the Philippines, or New Zealand. 9 Orange County is one of the most densely populated areas in the United States.10 It is bolstered by a relatively strong, diversified economy, but challenged by issues such as high-cost housing and traffic congestion.11 Since the recession of the early 1990s, Orange County’s economic growth has been phenomenal. Despite some short-term economic setbacks expected in the near future, Orange County will continue to be a dominant economic force in California as well as in the nation. With a Gross County Product of $137.7 billion, Orange County’s economy benefits from a diverse industry base including manufacturing, high-tech clusters, trade, services, and retail. Factoring in multiplier effects, more than one third of the local economy and two thirds of exports are related to high tech industries.12 Orange County is home to a great number of small businesses, which account for most of the jobs created over the past few years. Orange County is a highly attractive business destination; it was ranked the third best region for entrepreneurship in the west, and nineteenth in the nation.13 It was ranked first in quality of life among all U.S. cities.14 However, a number of significant potential barriers to economic growth are cited by the Orange County Business Council, including: an excessive shift from high value added manufacturing to lower-wage service sector job growth; a shortage of affordable housing; uneven economic development; a mismatch between workforce skills and industry needs; slow growth of total payroll and per capita income when compared to economic peers; and presence of infrastructure deficiencies (such as roads and public transportation) which are likely to impede economic growth and quality of life.15 Shifts in demographics and employment patterns are likely to further complicate economic development efforts. Most significantly, employment is projected to grow at 29.2% over 2000-2010, which is more than twice the projected population growth for the same period. This dynamic could worsen already long and complicated commutes and
9 http://www.locate.ca.gov/. 10 Source: Orange County Community Indicators, 2001. 11 These were cited by CEO’s as the two most significant barriers to business development in “Business Sentiment,” an Orange County Executive Survey. 12 Orange County Business Council: Orange County Economic Indicators (a presentation). 13 Best Cities, Dun and Bradstreet and Entrepreneur Magazine, cited in Orange County Community Indicators 2001; based on number of young businesses, small company employment growth, overall employment growth, and rate of business failures. 14 California Department of Education, cited by the Orange County Business Council in Orange County Economic Indicators (a presentation). 15 Orange County Business Council, Orange County Economic Indicators (a presentation).
6
have a destabilizing effect on the workforce.16 Seniors (over 65), who currently make up 9.8% of the county’s population, are expected to comprise 11% of the population in 2010 and 14% by 2020. 17 These changes place additional demands on the service sector.18 The share of the population in the age group 20-64 will decline from 60.5% to 57.5% during the period 2000-2010, and will further decline to 55.8% in 2020, thereby reducing slightly the proportion of Orange County residents in the local labor force.19 Understanding these crucial interactions between demographic and economic forces provides an important context for examining the impact of the child care industry on the local economy. Child care, like transportation and affordable housing, is an essential piece of the local infrastructure, helping to ensure sustained labor force participation and economic development. This section explores in detail the employment statistics, key industry trends, demographics, and other economic indicators with a view to understanding the implications for child care services in Orange County. Employment And Industry Outlook National Context After growing at a robust rate of 4.1% in the year 2000, U.S. GDP growth decreased in 2001 because of a national slowdown in manufacturing and corporate spending. U.S., the world’s largest economy, sank into a recession in March 2001, ending the longest economic expansion of more than10 years.20 The terrorist attacks of September 11 sharply reduced economic activity in the airlines, transportation, and tourism industries. Gross Domestic Product (GDP) growth was -1.1% in the third quarter of 2001, but rebounded to 1.4% in the fourth quarter of 2001. Several economic indicators now point to an imminent economic recovery, which is much sooner than what most analysts had predicted.21 Impact of September 11 Attacks on Orange County The impact of the terrorist attacks on the Orange County economy vary across industries. 22 The total share of Hotels, Motels, Theme Parks, and Eating & Drinking is 10.6% of the Orange County economy. Therefore, even though this sector will experience a substantial number of job losses, the overall impact on the economy will not be large.23
16 Interim County Population Projections, June 2001, California Department of Finance, and SCAG. 17 U.S. Census Bureau, Census 2000 and California Department of Finance (Demographic Research Unit). 18 According to EDD, the demand for personal and home care aides over 1997-2004 is projected to increase by 36.1%. 19 Source: County Population Projections with Age, Sex and race/Ethnic Detail. California Department of Finance (December 1998). 20 National Bureau of Economic Research. 21 Manufacturing grew in February, 2002 for the first time in 18 months, consumer spending and personal income posted solid gains, and businesses added jobs for the first time since July, 2001. 22 Anil Puri, IEES Economic Forecast for Southern California and Orange County, November 2001. 23 Anil Puri, IEES Economic Forecast for Southern California and Orange County, November 2001.
7
The share of exports from Orange County in 2000 was 11.8% of the $137.7 billion Gross County Product.24 Export-related jobs (both direct and indirect employment) numbered 278,000, about 20% of Orange County’s non-agricultural employment. In line with the reduced freight transportation and higher transport costs as a consequence of the September 11 terrorist attacks, it is estimated that exports will decrease by 9.4% in 2001. Assuming that the world economy recovers in 2002, and the effects of the terrorist attacks on trade are temporary, exports are expected to grow at 1.9% in 2002 and at 9.4% in 2003.25 These immediate negative impacts on the local economy are somewhat mitigated by a renewed stimulus to the defense industry, which was once a core component of the Orange County economy.26 Orange County is more diversified today than it was a decade ago, when defense cutbacks caused the recession of the early 1990s to be deeper and more prolonged than it was in the rest of California and the US. The historically low interest rates and the pent-up demand for housing are preventing the real estate and construction sector from experiencing the major slump that they witnessed in the recession of the early 1990s. 27 On the whole, Orange County is expected to face less of a setback than the U.S., and the slowdown is expected to be mild by historical standards. Overview of Orange County Industry Trends Orange County is the fifth largest county in the U.S. and a dominant economic force in its own right.28,29 However, from 1993 to 1999, the Orange County economy grew at a rate of only 2.7% compared to California (4.1%) and the United States (5.3%). This lag occurred despite the fact that employment growth kept up with state and national trends.30 This is partially explained by the fact that the services industry grew by 88,100 jobs during this period, while the higher revenue-generating manufacturing industry grew by only 32,800 jobs. Figure 1 indicates the share of employment by industry for Orange County. Services are by far the largest component of the local economy, followed by retail trade and manufacturing, which are comparable in size.
24 Source: Vincent Dropsy, Orange County Exports: Rebound in 2000 and Risks in 2001-02, Institute for Economic and Environmental Studies (IEES), Economic Forecast for Southern California and Orange County, November 2001. 25 Source: Vincent Dropsy, Orange County Exports. 26 After the terrorist attacks of September 11, President Bush has indicated his commitment to increase spending on defense. 27 The 30-year conventional mortgage rate was 10.17% in September, 1990 and 6.81% in September, 2001. 28 US Census Bureau, Current Population Report. 29 Some noteworthy economic characteristics of Orange County, as highlighted by the Orange County Business Council, are: Orange County ranks 1st nationally in retails sales per household, Orange County ranks 4th nationally in percentage employed in manufacturing amongst top 50 US metro areas, and Orange County ranks 14th nationally in export and trade. 30 Orange County Business Council: Orange County Economic Indicators (a presentation).
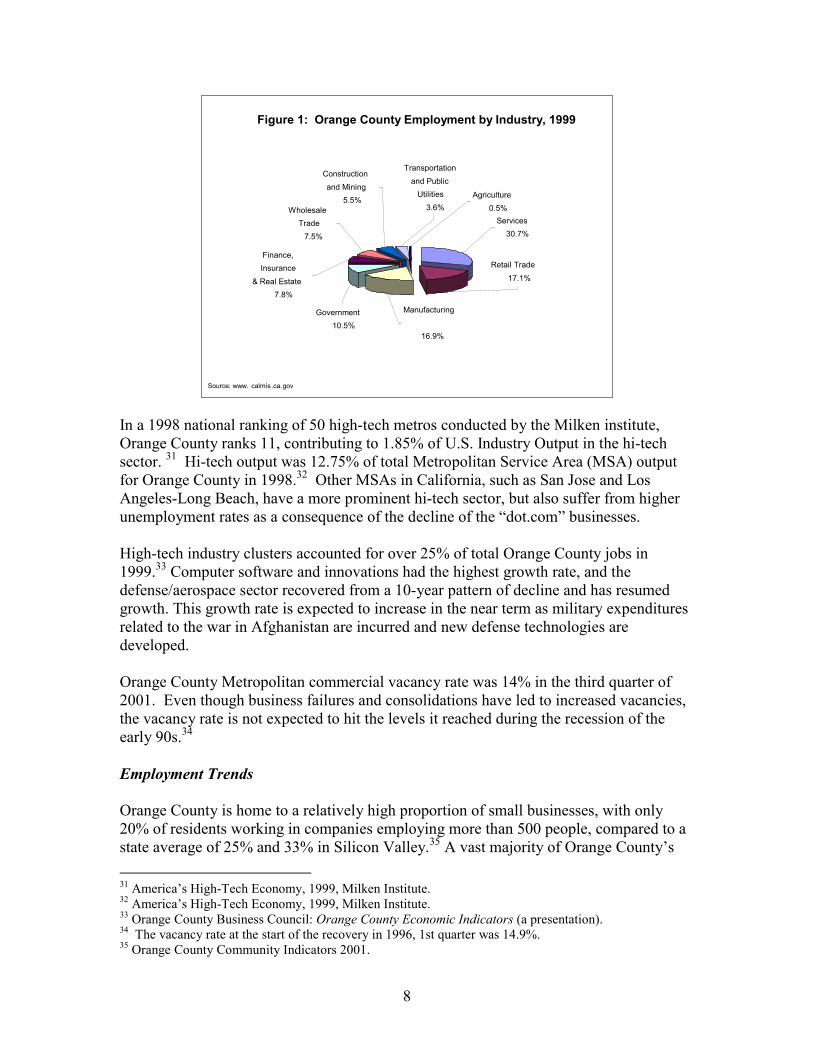
8
Figure 1: Orange County Employment by Industry, 1999
Transportation and Public
Utilities 3.6% Wholesale
Trade 7.5%
Finance, Insurance
& Real Estate 7.8%
Government 10.5%
Manufacturing
16.9%
Services 30.7%
Retail Trade 17.1%
Construction and Mining
5.5% Agriculture 0.5%
Source: www. calmis .ca. gov In a 1998 national ranking of 50 high-tech metros conducted by the Milken institute, Orange County ranks 11, contributing to 1.85% of U.S. Industry Output in the hi-tech sector. 31 Hi-tech output was 12.75% of total Metropolitan Service Area (MSA) output for Orange County in 1998.32 Other MSAs in California, such as San Jose and Los Angeles-Long Beach, have a more prominent hi-tech sector, but also suffer from higher unemployment rates as a consequence of the decline of the “dot.com” businesses. High-tech industry clusters accounted for over 25% of total Orange County jobs in 1999.33 Computer software and innovations had the highest growth rate, and the defense/aerospace sector recovered from a 10-year pattern of decline and has resumed growth. This growth rate is expected to increase in the near term as military expenditures related to the war in Afghanistan are incurred and new defense technologies are developed. Orange County Metropolitan commercial vacancy rate was 14% in the third quarter of 2001. Even though business failures and consolidations have led to increased vacancies, the vacancy rate is not expected to hit the levels it reached during the recession of the early 90s.34 Employment Trends Orange County is home to a relatively high proportion of small businesses, with only 20% of residents working in companies employing more than 500 people, compared to a state average of 25% and 33% in Silicon Valley.35 A vast majority of Orange County’s 31 America’s High-Tech Economy, 1999, Milken Institute. 32 America’s High-Tech Economy, 1999, Milken Institute. 33 Orange County Business Council: Orange County Economic Indicators (a presentation). 34 The vacancy rate at the start of the recovery in 1996, 1st quarter was 14.9%. 35 Orange County Community Indicators 2001.
9
job growth in the last 10 years has come from small businesses (businesses with less than 500 employees).36 Orange County’s unemployment rate, which increased from 2.0% in December 2000 to 3.2% in December 2001, is still lower than unemployment rate of California (5.7%) and the U.S. (5.4%).37 According to a Cal State Fullerton/ Institute for Economic and Environmental Studies (IEES), total county payroll employment increased at a rate of approximately 3.4% in 2000, almost matching its growth in 1999. However, growth slowed to 2.4% during the first nine months of 2001. 38 The retail trade sector has been particularly weak, increasing jobs at only a 0.8% rate through September 2001, compared to an increase of 3.1% in 2000. The only sector to grow at a faster rate in 2001 than the previous year is finance, insurance and real estate, where the gains in the financial services sector were the greatest.39 According to the IEES forecast for Orange County, total payroll jobs will grow at a rate of 2.3% in 2001. However, following national and regional trends, the rate will moderate to 1.6% in 2002. Table 1 indicates changes in employment over the 5 year period, 2000-2005. Total payroll employment is expected to increase by 13.02% from 1,390,700 jobs to 1,571,800 jobs. The largest growth in employment will be in construction, at 27.10%, followed by services at 17.07%.
Table 1: Industry Employment in Orange County, 2000-2005
Industry Employment in thousands
2000 2005 Change (00-05) Percentage Change
(00-05) Total Payroll Employment 1390.7 1571.8 181.1 13.02% Mining 0.6 0.6 0 0% Construction 79.7 101.3 21.6 27.10% Manufacturing 231 241.3 10.3 4.45% Transportation and Public Utilities 51.6 59.3 7.7 14.92% Wholesale and Retail Trade 339.7 373.2 33.5 9.86% Finance, Real Estate & Insurance 105.2 120 14.8 14.06% Services 436.3 510.8 74.5 17.07% Total Government 146.6 165.3 18.7 12.75%
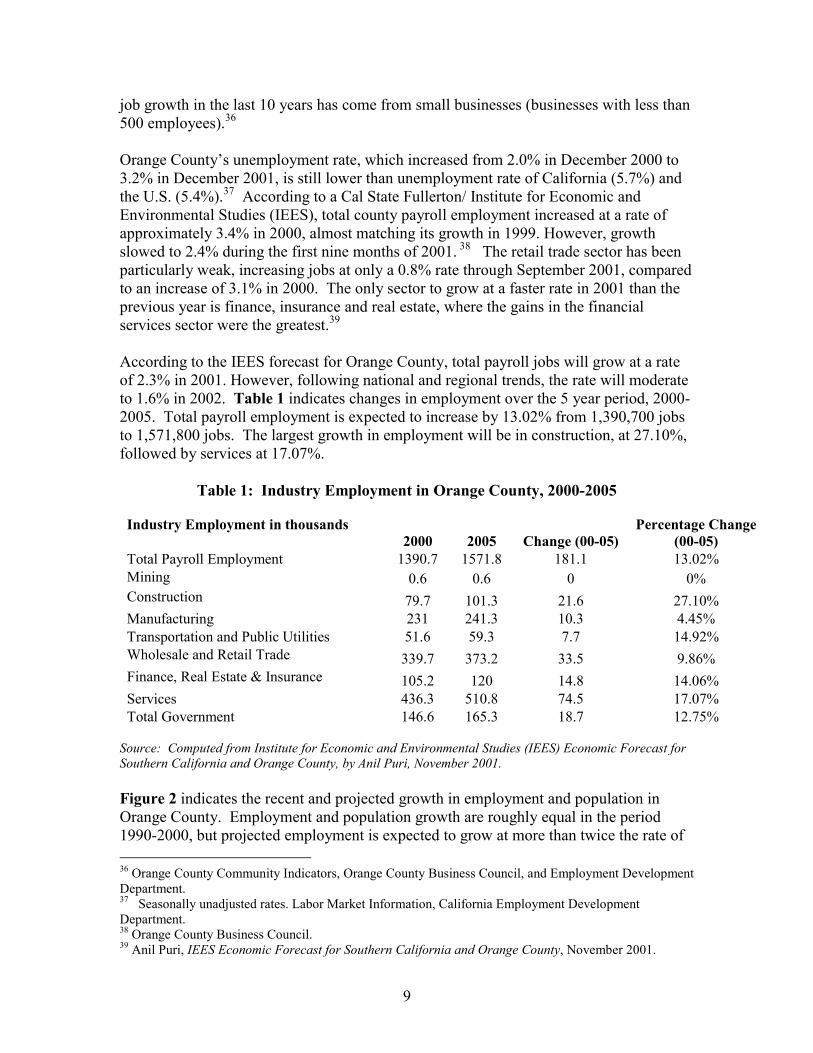
Source: Computed from Institute for Economic and Environmental Studies (IEES) Economic Forecast for Southern California and Orange County, by Anil Puri, November 2001. Figure 2 indicates the recent and projected growth in employment and population in Orange County. Employment and population growth are roughly equal in the period 1990-2000, but projected employment is expected to grow at more than twice the rate of 36 Orange County Community Indicators, Orange County Business Council, and Employment Development Department. 37 Seasonally unadjusted rates. Labor Market Information, California Employment Development Department. 38 Orange County Business Council. 39 Anil Puri, IEES Economic Forecast for Southern California and Orange County, November 2001.
10
projected population in the period 2000-2010. This means that neighboring counties, primarily Riverside-San Bernardino counties, will feed employment growth in Orange County. This points to the need to alleviate traffic congestion in general, but more so in the commute from Riverside-San Bernardino to Orange County. According to the South County Association of Governments (SCAG), cities that are experiencing (will experience) tremendous growth rates in employment over the 1997-2005 period are: Dana Point (114%), Laguna Beach (70%), Laguna Niguel (78%), San Clemente (220%), Villa Park (162%), and Unincorporated Portions of the County (132%). Figure 2: Population Growth and Employment Growth (%) in Orange County
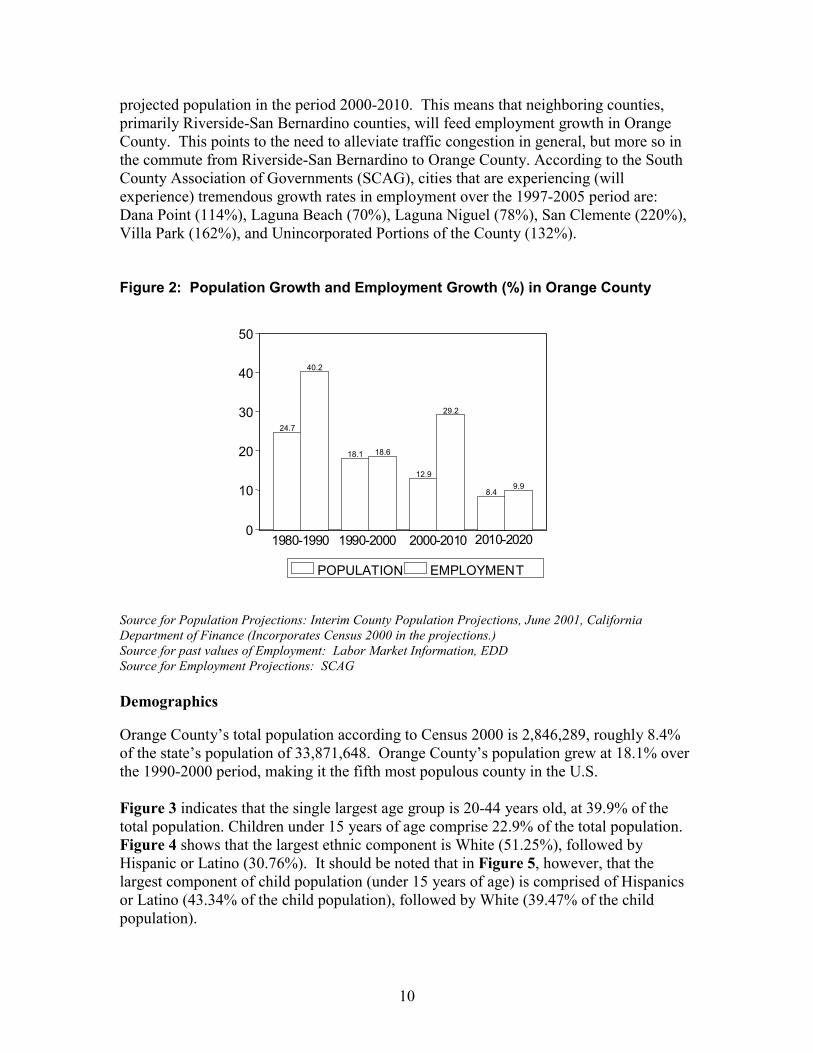
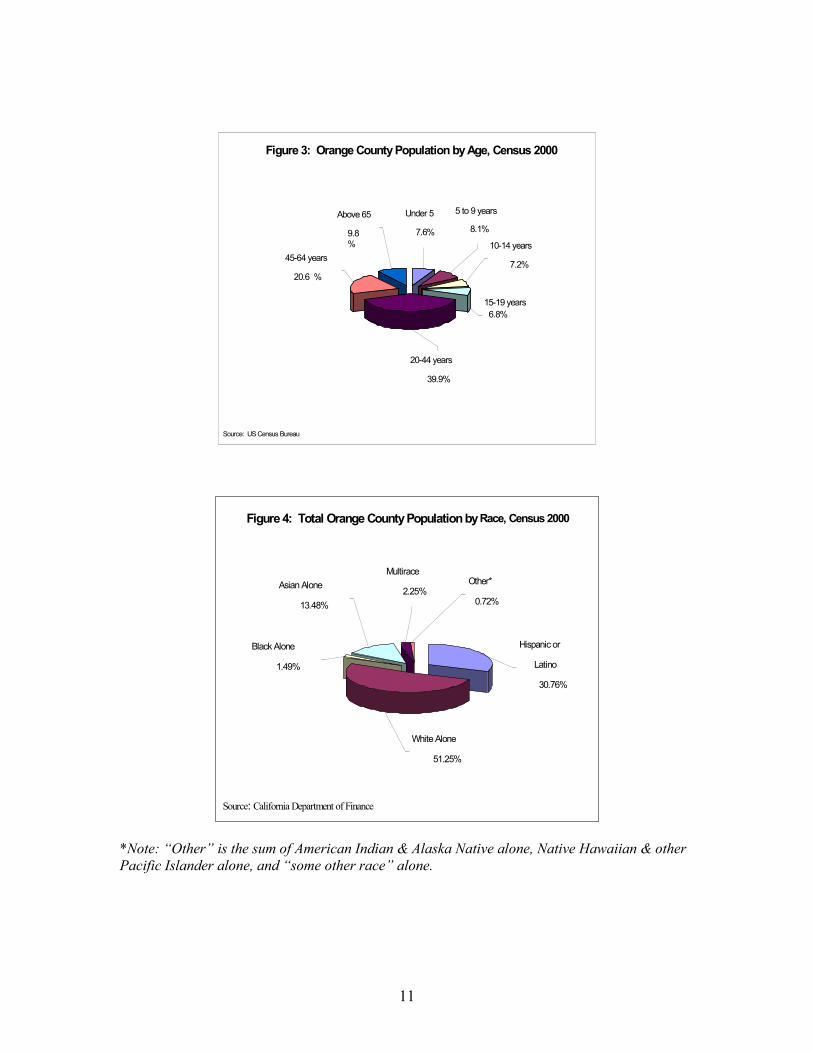
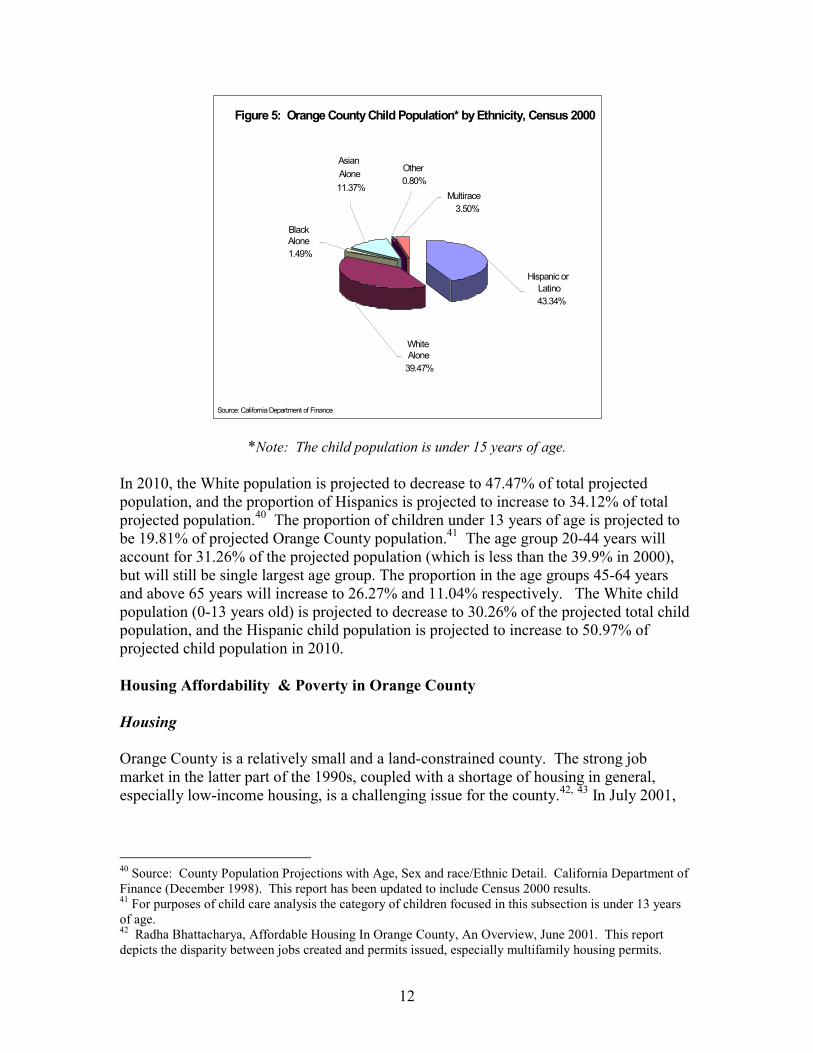
Source for Population Projections: Interim County Population Projections, June 2001, California Department of Finance (Incorporates Census 2000 in the projections.) Source for past values of Employment: Labor Market Information, EDD Source for Employment Projections: SCAG Demographics Orange County’s total population according to Census 2000 is 2,846,289, roughly 8.4% of the state’s population of 33,871,648. Orange County’s population grew at 18.1% over the 1990-2000 period, making it the fifth most populous county in the U.S. Figure 3 indicates that the single largest age group is 20-44 years old, at 39.9% of the total population. Children under 15 years of age comprise 22.9% of the total population. Figure 4 shows that the largest ethnic component is White (51.25%), followed by Hispanic or Latino (30.76%). It should be noted that in Figure 5, however, that the largest component of child population (under 15 years of age) is comprised of Hispanics or Latino (43.34% of the child population), followed by White (39.47% of the child population).
0
10
20
30
40
50
24.7
40.2
18.1 18.6
12.9
29.2
8.49.9
POPULATION EMPLOYMENT
1980-1990 1990-2000 2000-2010 2010-20200
10
20
30
40
50
24.7
40.2
18.1 18.6
12.9
29.2
8.49.9
POPULATION EMPLOYMENT
1980-1990 1990-2000 2000-2010 2010-2020
11
Figure 3: Orange County Population by Age, Census 2000
Above 65 9.8 %
45-64 years 20.6 %
20-44 years 39.9%
15-19 years 6.8%
10-14 years 7.2%
5 to 9 years 8.1%
Under 5 7.6%
Source: US Census Bureau
Figure 4: Total Orange County Population by Race, Census 2000
Multirace 2.25% Asian Alone
13.48%
Black Alone 1.49%
Other* 0.72%
White Alone 51.25%
Hispanic or Latino 30.76%
Source: California Department of Finance
*Note: “Other” is the sum of American Indian & Alaska Native alone, Native Hawaiian & other Pacific Islander alone, and “some other race” alone.
12
Figure 5: Orange County Child Population* by Ethnicity, Census 2000
Other 0.80%
Asian Alone 11.37%
Black Alone 1.49%
Multirace 3.50%
White Alone
39.47%
Hispanic or Latino 43.34%
Source: California Department of Finance
*Note: The child population is under 15 years of age. In 2010, the White population is projected to decrease to 47.47% of total projected population, and the proportion of Hispanics is projected to increase to 34.12% of total projected population.40 The proportion of children under 13 years of age is projected to be 19.81% of projected Orange County population.41 The age group 20-44 years will account for 31.26% of the projected population (which is less than the 39.9% in 2000), but will still be single largest age group. The proportion in the age groups 45-64 years and above 65 years will increase to 26.27% and 11.04% respectively. The White child population (0-13 years old) is projected to decrease to 30.26% of the projected total child population, and the Hispanic child population is projected to increase to 50.97% of projected child population in 2010. Housing Affordability & Poverty in Orange County Housing Orange County is a relatively small and a land-constrained county. The strong job market in the latter part of the 1990s, coupled with a shortage of housing in general, especially low-income housing, is a challenging issue for the county.42, 43 In July 2001,
40 Source: County Population Projections with Age, Sex and race/Ethnic Detail. California Department of Finance (December 1998). This report has been updated to include Census 2000 results. 41 For purposes of child care analysis the category of children focused in this subsection is under 13 years of age. 42 Radha Bhattacharya, Affordable Housing In Orange County, An Overview, June 2001. This report depicts the disparity between jobs created and permits issued, especially multifamily housing permits.
13
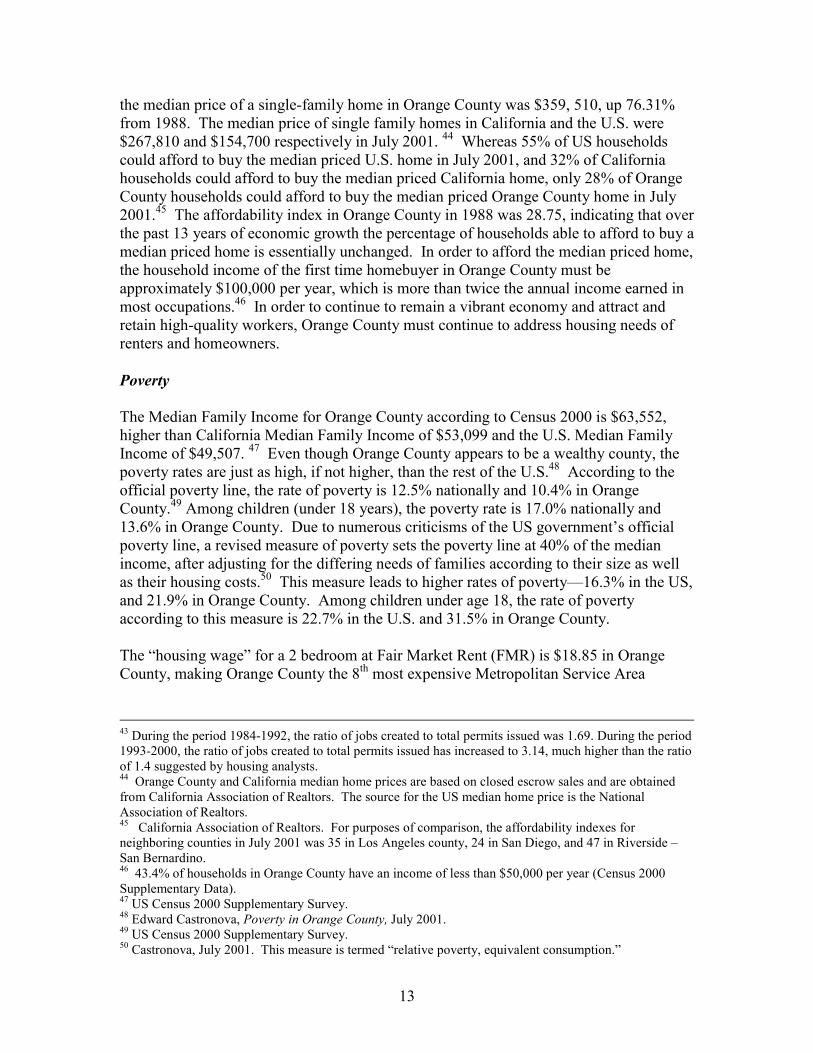
the median price of a single-family home in Orange County was $359, 510, up 76.31% from 1988. The median price of single family homes in California and the U.S. were $267,810 and $154,700 respectively in July 2001. 44 Whereas 55% of US households could afford to buy the median priced U.S. home in July 2001, and 32% of California households could afford to buy the median priced California home, only 28% of Orange County households could afford to buy the median priced Orange County home in July 2001.45 The affordability index in Orange County in 1988 was 28.75, indicating that over the past 13 years of economic growth the percentage of households able to afford to buy a median priced home is essentially unchanged. In order to afford the median priced home, the household income of the first time homebuyer in Orange County must be approximately $100,000 per year, which is more than twice the annual income earned in most occupations.46 In order to continue to remain a vibrant economy and attract and retain high-quality workers, Orange County must continue to address housing needs of renters and homeowners. Poverty The Median Family Income for Orange County according to Census 2000 is $63,552, higher than California Median Family Income of $53,099 and the U.S. Median Family Income of $49,507. 47 Even though Orange County appears to be a wealthy county, the poverty rates are just as high, if not higher, than the rest of the U.S.48 According to the official poverty line, the rate of poverty is 12.5% nationally and 10.4% in Orange County.49 Among children (under 18 years), the poverty rate is 17.0% nationally and 13.6% in Orange County. Due to numerous criticisms of the US government’s official poverty line, a revised measure of poverty sets the poverty line at 40% of the median income, after adjusting for the differing needs of families according to their size as well as their housing costs.50 This measure leads to higher rates of poverty—16.3% in the US, and 21.9% in Orange County. Among children under age 18, the rate of poverty according to this measure is 22.7% in the U.S. and 31.5% in Orange County. The “housing wage” for a 2 bedroom at Fair Market Rent (FMR) is $18.85 in Orange County, making Orange County the 8th most expensive Metropolitan Service Area
43 During the period 1984-1992, the ratio of jobs created to total permits issued was 1.69. During the period 1993-2000, the ratio of jobs created to total permits issued has increased to 3.14, much higher than the ratio of 1.4 suggested by housing analysts. 44 Orange County and California median home prices are based on closed escrow sales and are obtained from California Association of Realtors. The source for the US median home price is the National Association of Realtors. 45 California Association of Realtors. For purposes of comparison, the affordability indexes for neighboring counties in July 2001 was 35 in Los Angeles county, 24 in San Diego, and 47 in Riverside –San Bernardino. 46 43.4% of households in Orange County have an income of less than $50,000 per year (Census 2000 Supplementary Data). 47 US Census 2000 Supplementary Survey. 48 Edward Castronova, Poverty in Orange County, July 2001. 49 US Census 2000 Supplementary Survey. 50 Castronova, July 2001. This measure is termed “relative poverty, equivalent consumption.”
14
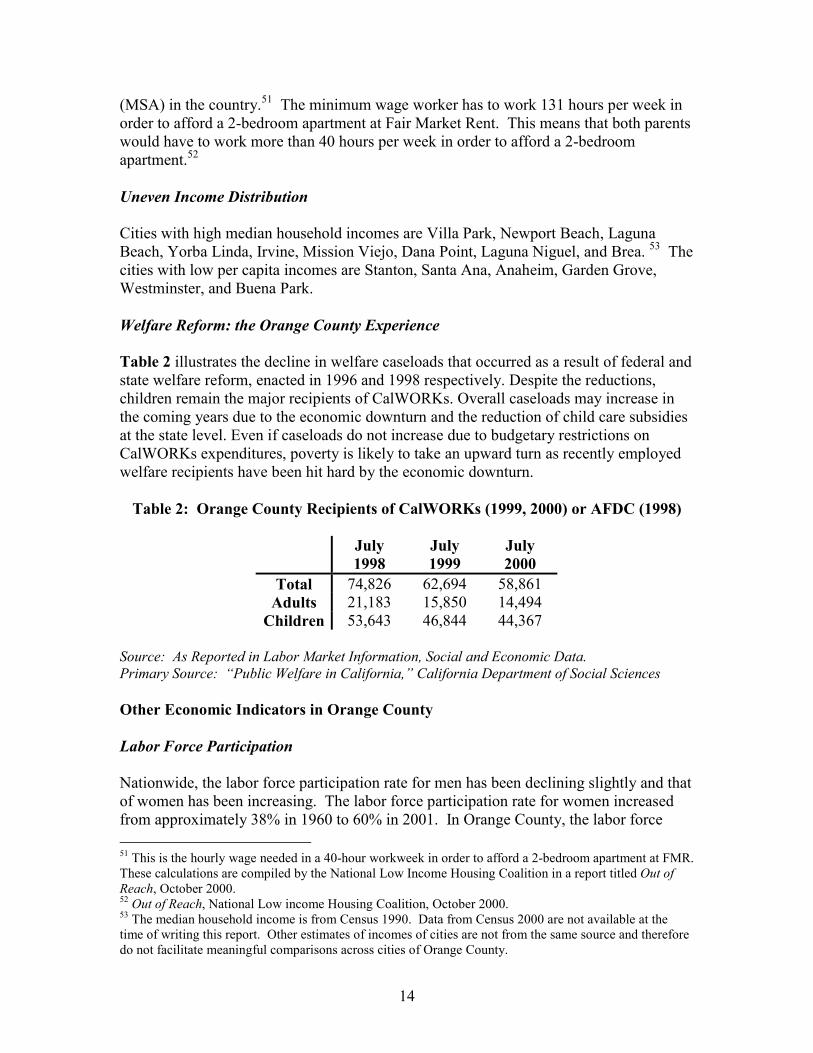
(MSA) in the country.51 The minimum wage worker has to work 131 hours per week in order to afford a 2-bedroom apartment at Fair Market Rent. This means that both parents would have to work more than 40 hours per week in order to afford a 2-bedroom apartment.52 Uneven Income Distribution Cities with high median household incomes are Villa Park, Newport Beach, Laguna Beach, Yorba Linda, Irvine, Mission Viejo, Dana Point, Laguna Niguel, and Brea. 53 The cities with low per capita incomes are Stanton, Santa Ana, Anaheim, Garden Grove, Westminster, and Buena Park. Welfare Reform: the Orange County Experience Table 2 illustrates the decline in welfare caseloads that occurred as a result of federal and state welfare reform, enacted in 1996 and 1998 respectively. Despite the reductions, children remain the major recipients of CalWORKs. Overall caseloads may increase in the coming years due to the economic downturn and the reduction of child care subsidies at the state level. Even if caseloads do not increase due to budgetary restrictions on CalWORKs expenditures, poverty is likely to take an upward turn as recently employed welfare recipients have been hit hard by the economic downturn.
Table 2: Orange County Recipients of CalWORKs (1999, 2000) or AFDC (1998)
July 1998
July 1999
July 2000
Total 74,826 62,694 58,861 Adults 21,183 15,850 14,494
Children 53,643 46,844 44,367 Source: As Reported in Labor Market Information, Social and Economic Data. Primary Source: “Public Welfare in California,” California Department of Social Sciences Other Economic Indicators in Orange County Labor Force Participation
Nationwide, the labor force participation rate for men has been declining slightly and that of women has been increasing. The labor force participation rate for women increased from approximately 38% in 1960 to 60% in 2001. In Orange County, the labor force 51 This is the hourly wage needed in a 40-hour workweek in order to afford a 2-bedroom apartment at FMR. These calculations are compiled by the National Low Income Housing Coalition in a report titled Out of Reach, October 2000. 52 Out of Reach, National Low income Housing Coalition, October 2000. 53 The median household income is from Census 1990. Data from Census 2000 are not available at the time of writing this report. Other estimates of incomes of cities are not from the same source and therefore do not facilitate meaningful comparisons across cities of Orange County.
15
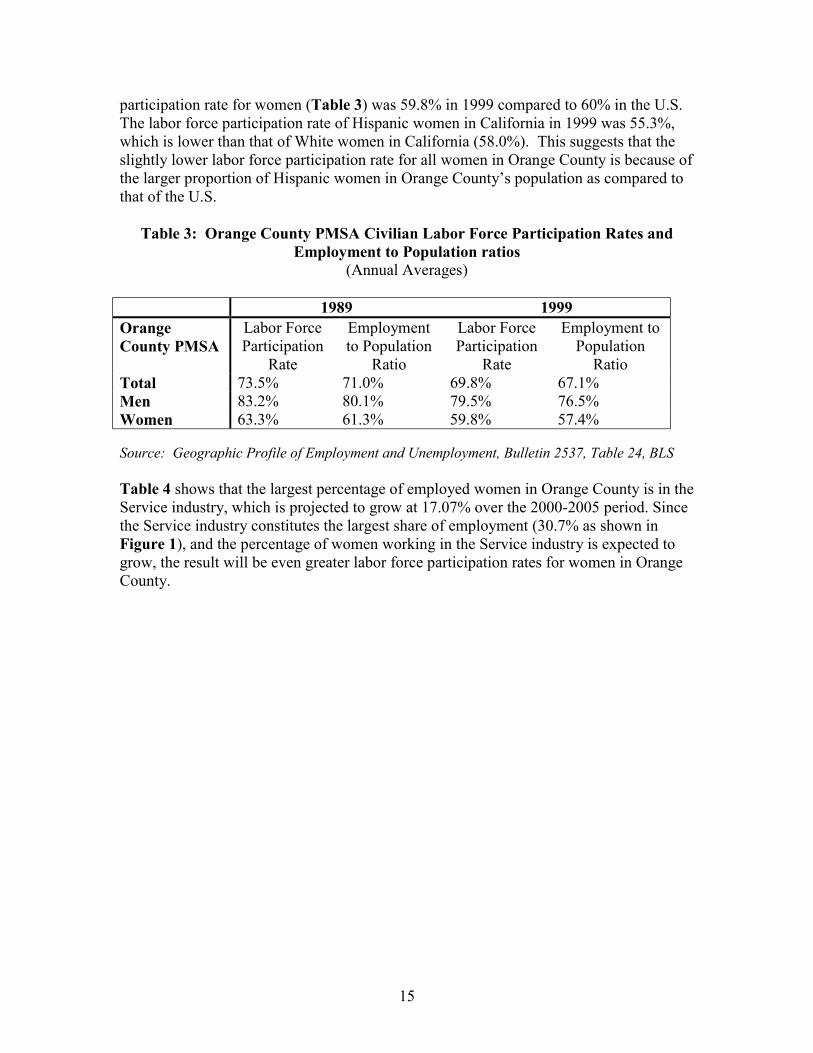
participation rate for women (Table 3) was 59.8% in 1999 compared to 60% in the U.S. The labor force participation rate of Hispanic women in California in 1999 was 55.3%, which is lower than that of White women in California (58.0%). This suggests that the slightly lower labor force participation rate for all women in Orange County is because of the larger proportion of Hispanic women in Orange County’s population as compared to that of the U.S.
Table 3: Orange County PMSA Civilian Labor Force Participation Rates and
Employment to Population ratios (Annual Averages)
1989 1999 Orange County PMSA
Labor Force Participation
Rate
Employment to Population
Ratio
Labor Force Participation
Rate
Employment to Population
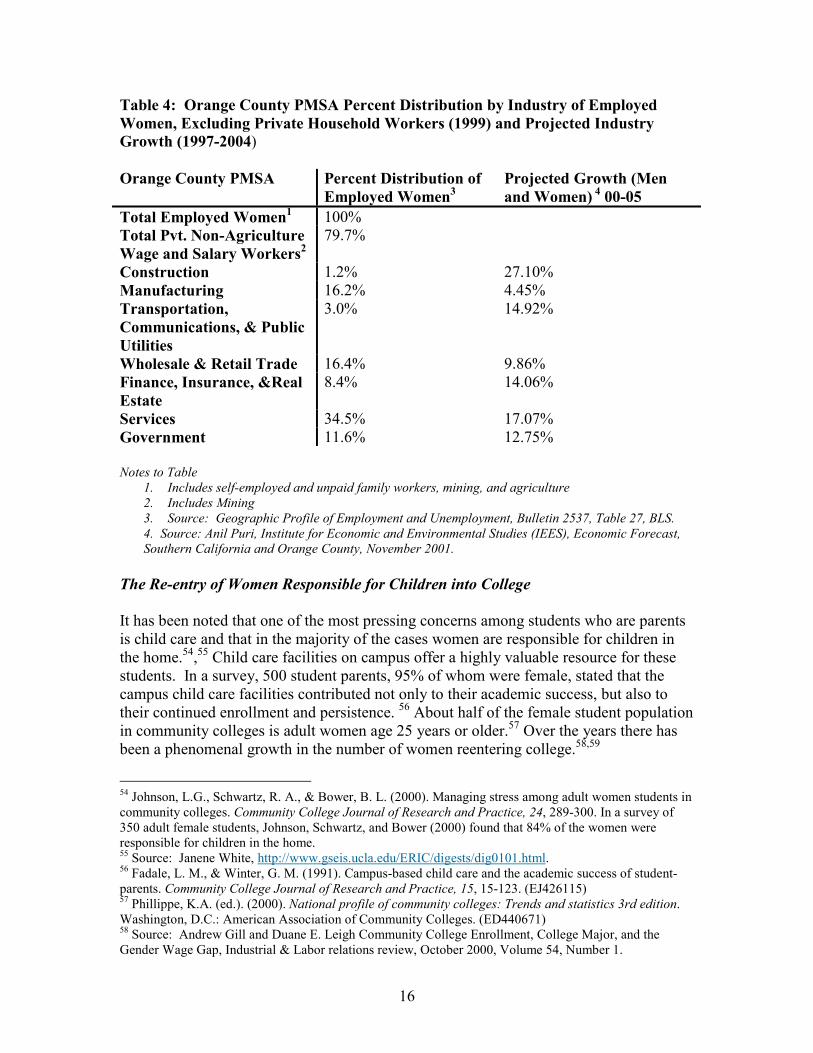
Ratio Total 73.5% 71.0% 69.8% 67.1% Men 83.2% 80.1% 79.5% 76.5% Women 63.3% 61.3% 59.8% 57.4% Source: Geographic Profile of Employment and Unemployment, Bulletin 2537, Table 24, BLS Table 4 shows that the largest percentage of employed women in Orange County is in the Service industry, which is projected to grow at 17.07% over the 2000-2005 period. Since the Service industry constitutes the largest share of employment (30.7% as shown in Figure 1), and the percentage of women working in the Service industry is expected to grow, the result will be even greater labor force participation rates for women in Orange County.
16
Table 4: Orange County PMSA Percent Distribution by Industry of Employed Women, Excluding Private Household Workers (1999) and Projected Industry Growth (1997-2004) Orange County PMSA Percent Distribution of
Employed Women3 Projected Growth (Men and Women) 4 00-05
Total Employed Women1 100% Total Pvt. Non-Agriculture Wage and Salary Workers2
79.7%
Construction 1.2% 27.10% Manufacturing 16.2% 4.45% Transportation, Communications, & Public Utilities
3.0% 14.92%
Wholesale & Retail Trade 16.4% 9.86% Finance, Insurance, &Real Estate
8.4% 14.06%
Services 34.5% 17.07% Government 11.6% 12.75% Notes to Table
1. Includes self-employed and unpaid family workers, mining, and agriculture 2. Includes Mining 3. Source: Geographic Profile of Employment and Unemployment, Bulletin 2537, Table 27, BLS. 4. Source: Anil Puri, Institute for Economic and Environmental Studies (IEES), Economic Forecast, Southern California and Orange County, November 2001.
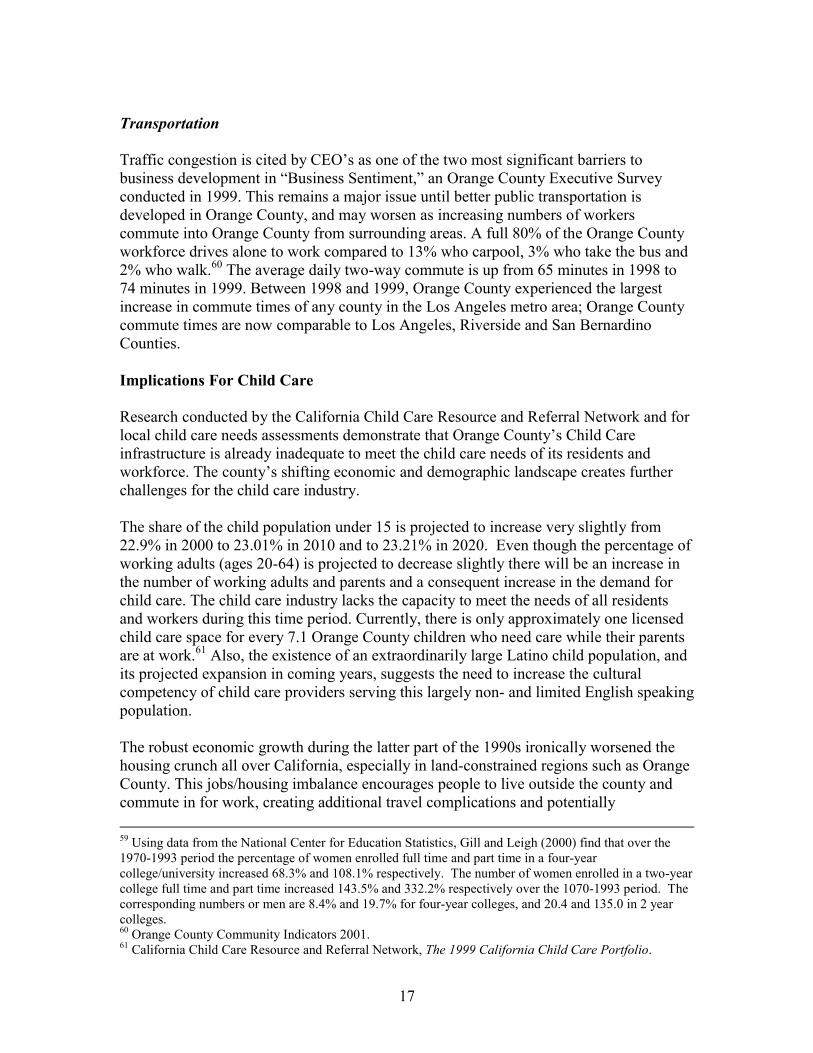
The Re-entry of Women Responsible for Children into College It has been noted that one of the most pressing concerns among students who are parents is child care and that in the majority of the cases women are responsible for children in the home.54,55 Child care facilities on campus offer a highly valuable resource for these students. In a survey, 500 student parents, 95% of whom were female, stated that the campus child care facilities contributed not only to their academic success, but also to their continued enrollment and persistence. 56 About half of the female student population in community colleges is adult women age 25 years or older.57 Over the years there has been a phenomenal growth in the number of women reentering college.58,59
54 Johnson, L.G., Schwartz, R. A., & Bower, B. L. (2000). Managing stress among adult women students in community colleges. Community College Journal of Research and Practice, 24, 289-300. In a survey of 350 adult female students, Johnson, Schwartz, and Bower (2000) found that 84% of the women were responsible for children in the home. 55 Source: Janene White, http://www.gseis.ucla.edu/ERIC/digests/dig0101.html. 56 Fadale, L. M., & Winter, G. M. (1991). Campus-based child care and the academic success of student-parents. Community College Journal of Research and Practice, 15, 15-123. (EJ426115) 57 Phillippe, K.A. (ed.). (2000). National profile of community colleges: Trends and statistics 3rd edition. Washington, D.C.: American Association of Community Colleges. (ED440671) 58 Source: Andrew Gill and Duane E. Leigh Community College Enrollment, College Major, and the Gender Wage Gap, Industrial & Labor relations review, October 2000, Volume 54, Number 1.
17
Transportation Traffic congestion is cited by CEO’s as one of the two most significant barriers to business development in “Business Sentiment,” an Orange County Executive Survey conducted in 1999. This remains a major issue until better public transportation is developed in Orange County, and may worsen as increasing numbers of workers commute into Orange County from surrounding areas. A full 80% of the Orange County workforce drives alone to work compared to 13% who carpool, 3% who take the bus and 2% who walk.60 The average daily two-way commute is up from 65 minutes in 1998 to 74 minutes in 1999. Between 1998 and 1999, Orange County experienced the largest increase in commute times of any county in the Los Angeles metro area; Orange County commute times are now comparable to Los Angeles, Riverside and San Bernardino Counties. Implications For Child Care Research conducted by the California Child Care Resource and Referral Network and for local child care needs assessments demonstrate that Orange County’s Child Care infrastructure is already inadequate to meet the child care needs of its residents and workforce. The county’s shifting economic and demographic landscape creates further challenges for the child care industry. The share of the child population under 15 is projected to increase very slightly from 22.9% in 2000 to 23.01% in 2010 and to 23.21% in 2020. Even though the percentage of working adults (ages 20-64) is projected to decrease slightly there will be an increase in the number of working adults and parents and a consequent increase in the demand for child care. The child care industry lacks the capacity to meet the needs of all residents and workers during this time period. Currently, there is only approximately one licensed child care space for every 7.1 Orange County children who need care while their parents are at work.61 Also, the existence of an extraordinarily large Latino child population, and its projected expansion in coming years, suggests the need to increase the cultural competency of child care providers serving this largely non- and limited English speaking population. The robust economic growth during the latter part of the 1990s ironically worsened the housing crunch all over California, especially in land-constrained regions such as Orange County. This jobs/housing imbalance encourages people to live outside the county and commute in for work, creating additional travel complications and potentially 59 Using data from the National Center for Education Statistics, Gill and Leigh (2000) find that over the 1970-1993 period the percentage of women enrolled full time and part time in a four-year college/university increased 68.3% and 108.1% respectively. The number of women enrolled in a two-year college full time and part time increased 143.5% and 332.2% respectively over the 1070-1993 period. The corresponding numbers or men are 8.4% and 19.7% for four-year colleges, and 20.4 and 135.0 in 2 year colleges. 60 Orange County Community Indicators 2001. 61 California Child Care Resource and Referral Network, The 1999 California Child Care Portfolio.
18
lengthening commute times for employees requiring child care. There is a need to integrate future construction of child care facilities into development plans, particularly “smart growth” policies such as transit-oriented development. The extremely high cost of housing impacts the provision of child care services in two ways: it threatens the stability and continued growth of existing child care providers who have a difficult time making rent payments, and it continues to shrink the portion of a child care consumer’s income available to pay for the care. Adequate child care is essential to sustain the increasing numbers of men and women participating in the labor force. The presence of a large licensed child care sector contributes to the phenomenal increase in labor force participation rates of women. Furthermore, the number of women reentering college to obtain a degree is increasing. Since Orange County is home to several universities and community colleges, there is a need to provide child care that meets needs of the older student population. The unusually high proportion of small businesses in Orange County presents a unique challenge for involving the private sector in child care planning. Employer-sponsored child care programs and policies are more affordable for larger businesses because of the up-front costs associated with, for example, an on-site child care center. The smaller the business, the less the return on the investment to provide child care. Meeting the child care needs of employees of small businesses requires a higher degree of collaboration between small business leaders around collective programs and facilities to meet the needs of participating businesses. The high cost of child care imposes financial hardship on families whose incomes range from very low to moderate. When housing costs are considered, Orange County has more poverty than what is suggested by official poverty rate estimates. The cycle of poverty cannot be broken without labor force participation of both parents, which is virtually impossible without access to affordable child care. In order for the county’s overall economy to grow, the labor force must continue to expand. To this end, the county’s supply of affordable child care must also expand, and the county must provide the social infrastructure necessary to enable more families and single parents to go to work.
19
Section 3 The Economic Impact of the Child Care Industry Child care is seldom measured or discussed as the industry sector that it is. Historical perceptions of child care as a babysitting service, or at best child development, relegate it to the sphere of social services rather than an important component of the local economy. This notion is reinforced by child care providers themselves, whose mission of serving children often overrides their identity as businesspersons, sometimes to the detriment of their financial well-being. However, as the proportion of parents in the workforce rose steeply over the last thirty years, child care grew tremendously as an industry sector. The expansion of child care strengthens the development of businesses, as it enables more people to work and purchase more services from other sectors and generate greater levels of income to cycle through the local economy. The building of new child care facilities results in new employment and revenue in construction and other supportive services, and provides jobs for many individuals committed to caring for children. While economists at the federal Department of Commerce and Bureau of Economic Analysis note significant expansion in the child care sector over the last thirty years, their failure to capture the entire licensed child care field results in an underestimation of its total contribution to the economy. This section introduces a new method for assessing the quantitative impact of the licensed child care industry in Orange County, expressed in terms of:
• The size of the industry as reflected in output or gross receipts;62 • The size of the industry as reflected in direct employment;63 • The extent of the industry’s local economic integration, as reflected in indirect
employment;64 and • The capture of federal and state subsidies and tax credits.
It analyzes the shortfalls of traditional economic accounting tools in measuring the industry, and outlines the methodology for deriving local estimates of gross receipts and employment. Current federal, state and local data are analyzed to provide a picture of the overall effects of child care in the local economy. Local industries are examined and compared to the child care industry. It should be emphasized that this analysis covers the licensed child care industry, which excludes a significant portion and variety of child care services are utilized for both child
62 Gross receipts measure the size of the industry in terms of its overall sales. 63 Direct employment refers to jobs created in the child care industry itself (e.g., teachers, center directors, cooks, accountants, etc.). 64 Indirect employment refers to jobs that are generated in supporting and related industries through the child care industry’s purchase of goods and services (e.g., construction employment due to refurbishing a child care facility; retail employment due to supply purchases made by the child care program; etc.).
20
development and to support parental employment (as discussed in Section 1). At the end of this section, a brief discussion of the economic contribution of license exempt caregivers who participate in California’s child care subsidy program is included. Traditional Methods of Accounting for the Child Care Industry Economists frequently use the North American Industry Classification System (NAICS) to analyze industries and their local, state and national impacts. Developed in the 1990s to replace the outdated Standard Industrial Classification (SIC) system, NAICS provides a classification structure based on a “production-oriented, or supply-based conceptual framework”65 with compatibility throughout North America. As such, economic activity is monitored through NAICS’ coding system. NAICS assigns six-digit codes to specific industries and then aggregates these industries into industry groups, larger industry sub-sectors, and still larger industry sectors. The U.S. Department of Commerce (DOC), through the 1997 Economic Census, provided the first economy-wide assessment using the NAICS system. In recent years the DOC’s County Business Patterns, another survey of a region’s formal establishments, is also organized under the NAICS system. In addition to NAICS, economists utilize survey results developed by the U.S. Department of Labor’s (DOL) Covered Employment and Wages Program, commonly referred to as the ES-202 program. The methodology utilized by the DOL is similar to the DOC approach, but focuses primarily on employment and wages, rather than industry output or gross receipts. The DOL methodology also continues to use the SIC system, rather than NAICS. These economic analysis tools include a category called “Child Day Care Services” (SIC 8351). However, the child care sector’s economic output based on available DOC or DOL data is less than complete; survey and identification methods underlying these traditional economic accounting tools typically undercount the licensed child care industry in several ways. First, the “Child Day Care Services” category includes privately operated child centers, nursery schools, and preschool centers but does not include centers operated by public schools. This omission is significant since one survey shows that 40% of state-subsidized child development centers, State Preschools, and Head Start programs in California are operated by school districts and County Offices of Education.66 Second, licensed family child care homes are not explicitly included as a category of service in any SIC codes. In Orange County, 20% of the licensed child care slots are in family child care homes.67 The DOL’s Covered Employment and Wages Program (ES-202) approach is also inadequate because it excludes self-employed persons and small establishment (which represent a major portion of the child care industry, including almost all family child care homes and many proprietary centers).
65 NAICS Association website, www.naics.com/info.htm 66 National Economic Development and Law Center, “Child Care and Head Start Facilities in California,” Financing Early Childhood Facilities, January 1996. 67 Derived using licensed capacity data from the Children’s Home Society of California and the Department of Community Care Licensing.
21
Accounting for the Child Care Industry Using Local Data A more accurate method of measuring the size of the child care industry relies upon the synthesis of data from Orange County’s local child care resource and referral (R&R) agency, Children’s Home Society of California (CHS), and the Community Care Licensing Division (CCL) of the California Department of Social Services. These locally derived estimates are much more reliable than the DOC- or DOL-generated estimates because they utilize current data on cost and enrollment and capture the entire universe of licensed child care services. Like all local R&R agencies in the state, CHS is funded by the California Department of Education to maintain a database, called Carefinder, which contains a wide range of information on all licensed child care providers who wish to receive referrals for child care services. The child care providers on this database represent approximately 75% of the licensed child care capacity in Orange County. The remaining 25% are not on the database because they do not wish to receive referrals for a variety of reasons, including a desire for privacy, a marketing strategy that relies upon word of mouth or local advertising, or eligibility criteria that restrict access to a limited group of children and/or families. The data maintained on Carefinder includes licensed capacity, vacancy rates, and average weekly costs of child care. All of this information is broken down by type of care, part-time and full-time programs, and age groups of children served. Carefinder is refined and updated quarterly to reflect the most current state of the child care field. The role CCL is to ensure that community care facilities, such as those that provide child care, comply with state laws that apply to the operation of the facilities (such as staff-child ratios and health and safety requirements). To facilitate this effort, CCL maintains a database of all licensed child care providers, including their licensed capacity broken down by age group and type of care. CCL does not maintain data on vacancy rates or average weekly costs, so the vacancy rates and average costs from the R&R’s Carefinder database are applied to the remaining providers in the CCL database. This report calculates gross receipts and direct employment of the county’s licensed child care industry using composite information from these two databases. Measuring Child Care Industry Output or Gross Receipts Output, also known as gross receipts, measures the size of an industry in terms of the overall value of the goods and services produced by that industry over the course of a given year. For child care services, gross receipts are equal to the total amount of dollars flowing into the sector in the form of payments for care, including both parent fees and private and public subsidies. This is calculated in Orange County by multiplying the number of children enrolled in each type of care (i.e. infant care, part-time, state-subsidized) by the average rate for that type of care (please see Appendix A for detailed methodology). There are approximately 2,792 licensed child care facilities in Orange County (2,052 family child care homes and approximately 740 centers) that care for approximately 67,919 children. Based on the methodology briefly described above, the estimated annual
22
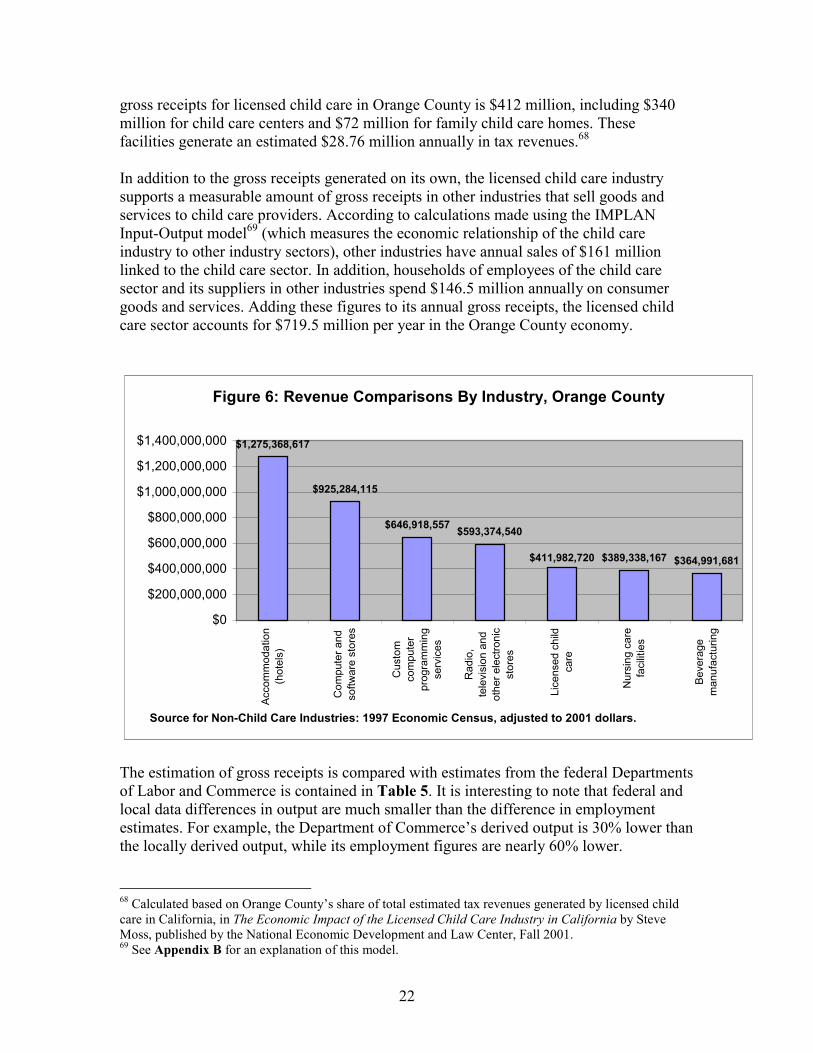
gross receipts for licensed child care in Orange County is $412 million, including $340 million for child care centers and $72 million for family child care homes. These facilities generate an estimated $28.76 million annually in tax revenues.68 In addition to the gross receipts generated on its own, the licensed child care industry supports a measurable amount of gross receipts in other industries that sell goods and services to child care providers. According to calculations made using the IMPLAN Input-Output model69 (which measures the economic relationship of the child care industry to other industry sectors), other industries have annual sales of $161 million linked to the child care sector. In addition, households of employees of the child care sector and its suppliers in other industries spend $146.5 million annually on consumer goods and services. Adding these figures to its annual gross receipts, the licensed child care sector accounts for $719.5 million per year in the Orange County economy.
Figure 6: Revenue Comparisons By Industry, Orange County
$1,275,368,617
$925,284,115
$646,918,557 $593,374,540
$389,338,167 $364,991,681$411,982,720
$0
$200,000,000
$400,000,000
$600,000,000
$800,000,000
$1,000,000,000
$1,200,000,000
$1,400,000,000
Acco
mm
odat
ion
(hot
els)
Com
pute
r and
softw
are
stor
es
Cus
tom
com
pute
rpr
ogra
mm
ing
serv
ices
Rad
io,
tele
visi
on a
ndot
her e
lect
roni
cst
ores
Lice
nsed
chi
ldca
re
Nur
sing
car
efa
cilit
ies
Beve
rage
man
ufac
turin
gSource for Non-Child Care Industries: 1997 Economic Census, adjusted to 2001 dollars.
The estimation of gross receipts is compared with estimates from the federal Departments of Labor and Commerce is contained in Table 5. It is interesting to note that federal and local data differences in output are much smaller than the difference in employment estimates. For example, the Department of Commerce’s derived output is 30% lower than the locally derived output, while its employment figures are nearly 60% lower. 68 Calculated based on Orange County’s share of total estimated tax revenues generated by licensed child care in California, in The Economic Impact of the Licensed Child Care Industry in California by Steve Moss, published by the National Economic Development and Law Center, Fall 2001. 69 See Appendix B for an explanation of this model.
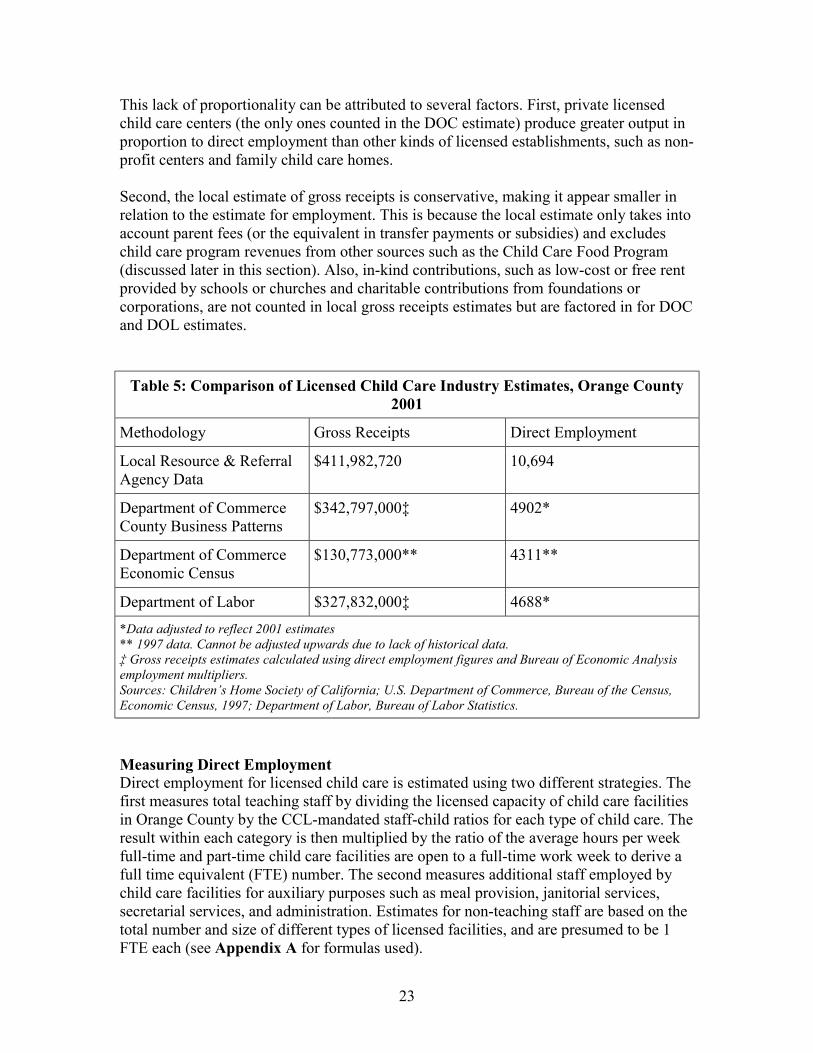
23
This lack of proportionality can be attributed to several factors. First, private licensed child care centers (the only ones counted in the DOC estimate) produce greater output in proportion to direct employment than other kinds of licensed establishments, such as non-profit centers and family child care homes. Second, the local estimate of gross receipts is conservative, making it appear smaller in relation to the estimate for employment. This is because the local estimate only takes into account parent fees (or the equivalent in transfer payments or subsidies) and excludes child care program revenues from other sources such as the Child Care Food Program (discussed later in this section). Also, in-kind contributions, such as low-cost or free rent provided by schools or churches and charitable contributions from foundations or corporations, are not counted in local gross receipts estimates but are factored in for DOC and DOL estimates.
Table 5: Comparison of Licensed Child Care Industry Estimates, Orange County 2001
Methodology Gross Receipts Direct Employment
Local Resource & Referral Agency Data
$411,982,720 10,694
Department of Commerce County Business Patterns
$342,797,000‡ 4902*
Department of Commerce Economic Census
$130,773,000** 4311**
Department of Labor $327,832,000‡ 4688* *Data adjusted to reflect 2001 estimates ** 1997 data. Cannot be adjusted upwards due to lack of historical data. ‡ Gross receipts estimates calculated using direct employment figures and Bureau of Economic Analysis employment multipliers. Sources: Children’s Home Society of California; U.S. Department of Commerce, Bureau of the Census, Economic Census, 1997; Department of Labor, Bureau of Labor Statistics.
Measuring Direct Employment Direct employment for licensed child care is estimated using two different strategies. The first measures total teaching staff by dividing the licensed capacity of child care facilities in Orange County by the CCL-mandated staff-child ratios for each type of child care. The result within each category is then multiplied by the ratio of the average hours per week full-time and part-time child care facilities are open to a full-time work week to derive a full time equivalent (FTE) number. The second measures additional staff employed by child care facilities for auxiliary purposes such as meal provision, janitorial services, secretarial services, and administration. Estimates for non-teaching staff are based on the total number and size of different types of licensed facilities, and are presumed to be 1 FTE each (see Appendix A for formulas used).
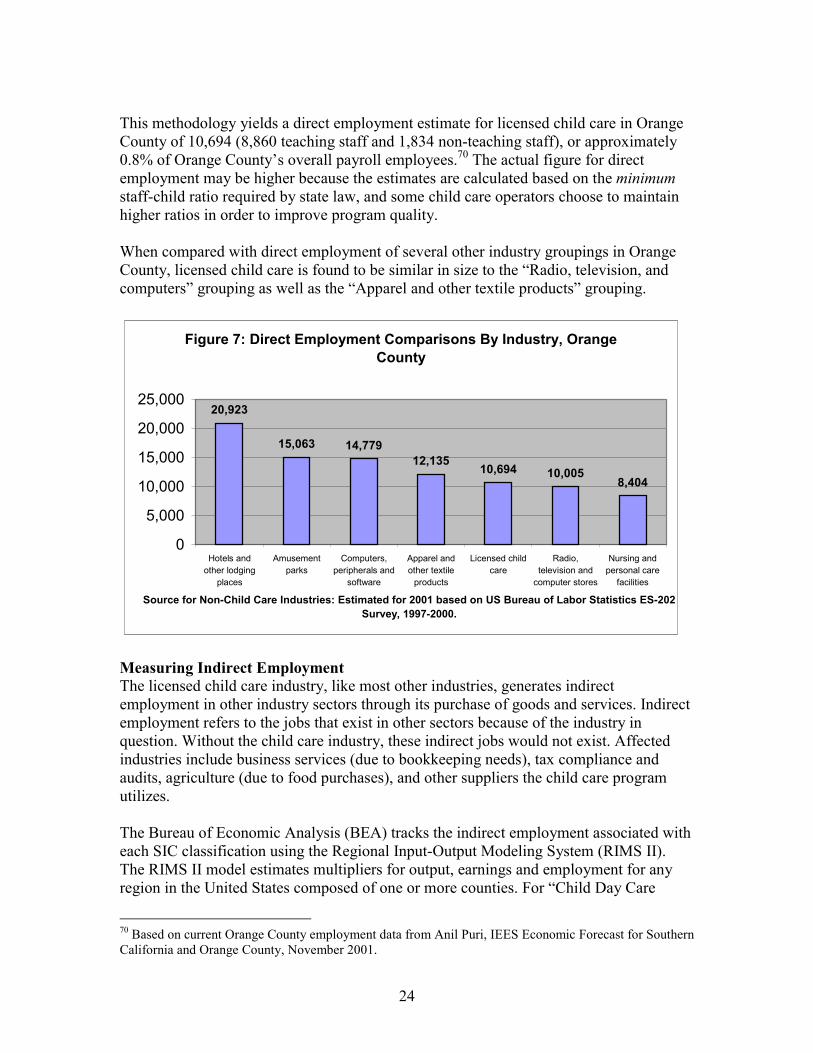
24
This methodology yields a direct employment estimate for licensed child care in Orange County of 10,694 (8,860 teaching staff and 1,834 non-teaching staff), or approximately 0.8% of Orange County’s overall payroll employees.70 The actual figure for direct employment may be higher because the estimates are calculated based on the minimum staff-child ratio required by state law, and some child care operators choose to maintain higher ratios in order to improve program quality. When compared with direct employment of several other industry groupings in Orange County, licensed child care is found to be similar in size to the “Radio, television, and computers” grouping as well as the “Apparel and other textile products” grouping.
Figure 7: Direct Employment Comparisons By Industry, Orange County
20,923
15,063 14,77912,135 10,694 10,005
8,404
0
5,000
10,000
15,000
20,000
25,000
Hotels andother lodging
places
Amusementparks
Computers,peripherals and
software
Apparel andother textile
products
Licensed childcare
Radio,television and
computer stores
Nursing andpersonal care
facilities
Source for Non-Child Care Industries: Estimated for 2001 based on US Bureau of Labor Statistics ES-202 Survey, 1997-2000.
Measuring Indirect Employment The licensed child care industry, like most other industries, generates indirect employment in other industry sectors through its purchase of goods and services. Indirect employment refers to the jobs that exist in other sectors because of the industry in question. Without the child care industry, these indirect jobs would not exist. Affected industries include business services (due to bookkeeping needs), tax compliance and audits, agriculture (due to food purchases), and other suppliers the child care program utilizes. The Bureau of Economic Analysis (BEA) tracks the indirect employment associated with each SIC classification using the Regional Input-Output Modeling System (RIMS II). The RIMS II model estimates multipliers for output, earnings and employment for any region in the United States composed of one or more counties. For “Child Day Care
70 Based on current Orange County employment data from Anil Puri, IEES Economic Forecast for Southern California and Orange County, November 2001.

25
Services” in Orange County, the RIMS II “direct-effect multiplier” is 1.297; this number refers to the total change in number of jobs in all industries that results from a change of one job in the child care sector. In other words, for every one job in the “Child Day Care Services” classification, there are 0.297 jobs that are associated with it in other industries.71 This indirect employment multiplier provides a tool to measure the number of jobs in other industries that are sustained by the licensed child care field. Based on a direct employment estimate of 10,694 jobs in licensed child care, an additional 3,208 indirect jobs are sustained by the licensed child care sector in Orange County. In total, Orange County licensed child care industry supports approximately 13,902 jobs. This indirect employment estimate is low due to the fact that the BEA undercounts both child care and gross receipts for child care, and thus the impact it has on the local economy. Capture of Federal and State Subsidies
The federal and state governments provide subsidies for child care primarily to aid poor families in paying for child care so they can participate in the workforce or in training or educational activities. These subsidies are provided in two basic forms: direct contracts with child care centers based on the number of low-income children they serve and the number of days of care provided, and an “Alternative Payment” (AP) program which enables families to choose their own licensed or license exempt child care provider.
Another significant portion of child care subsidies are awarded via the federally-funded Head Start and Early Head Start programs, “comprehensive child development programs which serve children from birth to age 5, pregnant women, and their families…(t)hey are child-focused programs and have the overall goal of increasing the school readiness of young children in low-income families.”72
The California Department of Education also administers the U.S. Department of Agriculture’s Child Care Food Program, whose mission is to “improve the diets of children under 13 years of age by providing the children with nutritious, well-balanced meals” and to “develop good eating habits in children that will last through later years.”73 Also, a limited amount of federal and state resources are available to support child care facility construction such as low-interest rate loans for capital costs. Finally, child care facility construction is an eligible activity for certain federal funds aimed at community development such as the Community Development Block Grant (CDBG) and Empowerment Zones. 71 This direct effect multiplier is significantly lower than direct effect multipliers reported for the child care field for other counties for whom the National Economic Development and Law Center has conducted research. The average direct effect multiplier for Alameda, San Mateo, Santa Cruz, Santa Clara, Monterey, Kern, and Los Angeles Counties was 1.794. Since raw data was not available for these other counties, a comparison could not be made, and it must be assumed that the lower direct effect multiplier for Orange County is due to factors specific to the functioning of the local economy. 72 U.S. Department of Health and Human Services, Administration for Children, Youth and Families; Head Start website at http://www2.acf.dhhs.gov/programs/hsb/about/index.htm. 73 California Department of Education, Nutrition Services Division website at www.cde.ca.gov/nsd/.
26
Child care subsidies, both at the federal and state levels, increased substantially following sweeping reforms to the federal welfare system in 1996 (the Personal Responsibility and Work Opportunities Act). California created its own version of welfare to comply with the new federal system, called CalWORKs (California Work Opportunity and Responsibility to Kids). Under CalWORKs, child care assistance was expanded. This expansion was mainly because welfare recipients were required to engage in work activities within a specific time frame. However, most child care services were not affordable. It became immediately apparent to policymakers that without providing affordable child care, they would be unable to meet stringent federal requirements to move welfare recipients off their caseloads and into self-sufficiency.
CalWORKs replaced separate welfare-related child care systems with an integrated three-stage child care system, coordinated by two state agencies. “Stage One” child care services are administered by the California Department of Social Services (CDSS) through county welfare departments. Stages Two and Three child care services are administered by local agencies under contract with the California Department of Education (CDE). Funding for each of the three stages of child care assistance is determined annually through the budget process. CDSS and CDE are required to submit quarterly data on child care usage and demand to the Department of Finance and the Joint Legislative Budget Committee. Child care subsidies benefit Orange County in several ways. First, since they are tied to participation in job training and work activities, they are an
important part of workforce development, and enable many people (who would otherwise have to look after their own children or leave them in an unsafe setting such as self-care) to join the labor force. Second, they bring in new dollars to the local economy, which then circulate through various service sectors and stimulate other economic activity. In 2001, Orange County drew down over $122 million in child care-related subsidies (see Table 6 for breakdown). Most of these funds were distributed through licensed child care facilities; however, a significant proportion of child care vouchers were redeemed by license-exempt child care providers (see explanation of license-exempt care later in this section).
CalWORKs Child Care at a Glance Stage One: Child care assistance begins automatically with a family’s entry into CalWORKs. Job seekers are eligible for up to 6 months of child care subsidies, during which they can utilize drop-in child care at or near “One-Stop Job and Career Centers.” Stage Two: Begins after 6 months, or after the recipient’s work or work activity has stabilized, or when a family is transitioning off welfare. Child care subsidies are provided for up to two years to parents who are engaged in training programs, who are working but still receiving aid, and those who are transitioning off assistance. Stage Three: Begins when a funded space is available for current or former CalWORKs recipients and families who have received diversion services, and whose family income is at or below 75% of state median income. Child care assistance is provided for CalWORKs recipients who are no longer receiving cash aid, and are at risk of falling back into dependency on cash aid.
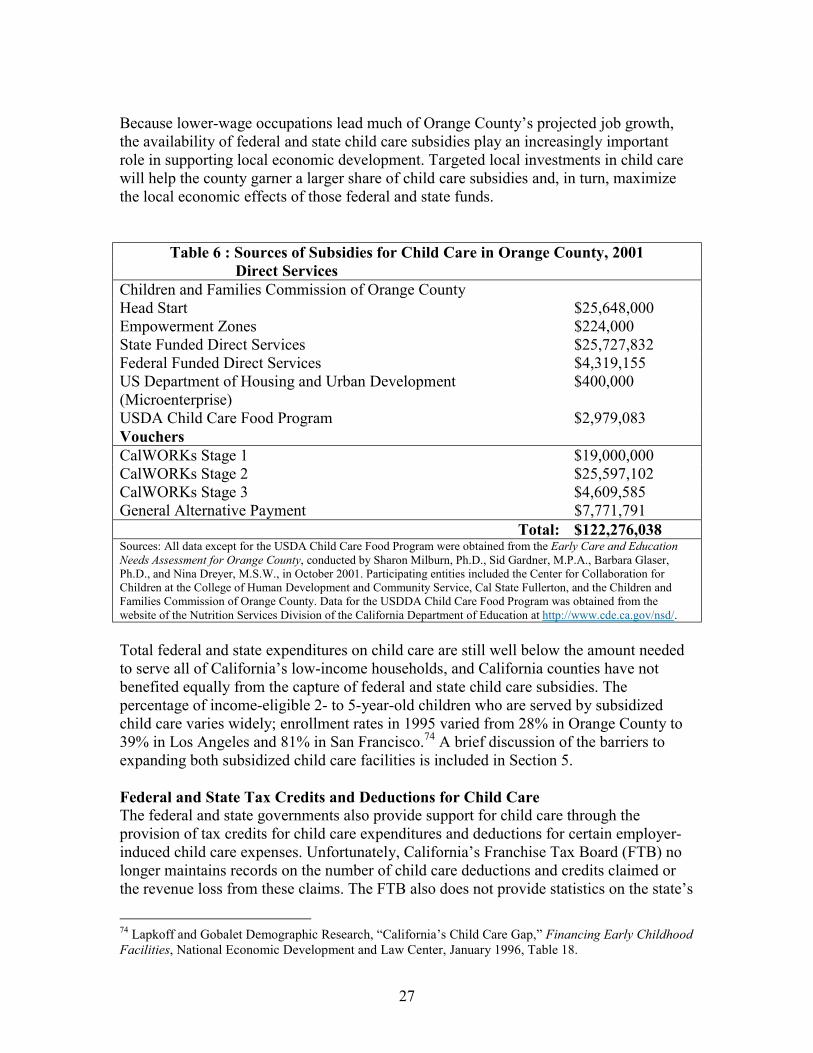
27
Because lower-wage occupations lead much of Orange County’s projected job growth, the availability of federal and state child care subsidies play an increasingly important role in supporting local economic development. Targeted local investments in child care will help the county garner a larger share of child care subsidies and, in turn, maximize the local economic effects of those federal and state funds.
Table 6 : Sources of Subsidies for Child Care in Orange County, 2001 Direct Services Children and Families Commission of Orange County Head Start $25,648,000 Empowerment Zones $224,000 State Funded Direct Services $25,727,832 Federal Funded Direct Services $4,319,155 US Department of Housing and Urban Development (Microenterprise)
$400,000
USDA Child Care Food Program $2,979,083 Vouchers CalWORKs Stage 1 $19,000,000 CalWORKs Stage 2 $25,597,102 CalWORKs Stage 3 $4,609,585 General Alternative Payment $7,771,791
Total: $122,276,038 Sources: All data except for the USDA Child Care Food Program were obtained from the Early Care and Education Needs Assessment for Orange County, conducted by Sharon Milburn, Ph.D., Sid Gardner, M.P.A., Barbara Glaser, Ph.D., and Nina Dreyer, M.S.W., in October 2001. Participating entities included the Center for Collaboration for Children at the College of Human Development and Community Service, Cal State Fullerton, and the Children and Families Commission of Orange County. Data for the USDDA Child Care Food Program was obtained from the website of the Nutrition Services Division of the California Department of Education at http://www.cde.ca.gov/nsd/. Total federal and state expenditures on child care are still well below the amount needed to serve all of California’s low-income households, and California counties have not benefited equally from the capture of federal and state child care subsidies. The percentage of income-eligible 2- to 5-year-old children who are served by subsidized child care varies widely; enrollment rates in 1995 varied from 28% in Orange County to 39% in Los Angeles and 81% in San Francisco.74 A brief discussion of the barriers to expanding both subsidized child care facilities is included in Section 5. Federal and State Tax Credits and Deductions for Child Care The federal and state governments also provide support for child care through the provision of tax credits for child care expenditures and deductions for certain employer-induced child care expenses. Unfortunately, California’s Franchise Tax Board (FTB) no longer maintains records on the number of child care deductions and credits claimed or the revenue loss from these claims. The FTB also does not provide statistics on the state’s
74 Lapkoff and Gobalet Demographic Research, “California’s Child Care Gap,” Financing Early Childhood Facilities, National Economic Development and Law Center, January 1996, Table 18.
28
Employer Tax Credit, which allows an employer to claim a corporate tax credit up to 50% of the cost of the employee child care benefit. The IRS, on the other hand, maintains statistics on both total credits and revenue loss to the federal government resulting from tax filers claiming child care tax credits. The U.S. Child and Dependent Care Tax Credit allows filers to claim as much as 30% of expenditures up to $2,400 for one child, and up to $4,800 for two children. The maximum credit per child is $720 annually. By design, the tax credit should help low-income parents, but in practice the gains are limited, partially because the credit provides a reduction in tax liability and not overall costs. California taxpayers received an estimated $310 million in credits through the Dependent Care Tax Credit in 2000.75 Assuming that Orange County parents claimed this credit at a rate proportional to Orange County’s share of children enrolled in licensed child care, this translates to approximately $22.9 million in credits for Orange County. Measuring the Size of the License Exempt Child Care Field As discussed in Section 1, a significant portion of all child care services provided to Orange County families are non-licensed. While this report primarily discusses and assesses the licensed child care field, it is worth exploring certain aspects of non-licensed child care, particularly in addressing the overall contribution of child care to the local economy. While many types of child care services, such as care by a relative, are informal and involve little or no financial transactions, there are two types of non-licensed child care that play a more formal role in the local economy: license exempt caregivers that receive reimbursements through the Child Care Alternative Payment (AP) program and license exempt school-age programs that are operated in conjunction with local school districts. Because data on the AP Program and school-age programs are available and can be tracked, these two types of non-licensed care can be measured with some degree of accuracy. The AP program, and particularly AP payments going to license exempt providers, expanded significantly during the last five years with the advent of CalWORKs. This expansion occurred because policymakers realized first that welfare families now required to engage in work activities would need assistance in paying for child care,76 and second that the existing licensed child care infrastructure was far too small to meet their child care needs. The AP program is a voucher system by which low-income families receive assistance in paying for child care of their own choosing, including facilities exempt from licensing requirements (see Section 1 for definition). Vouchers are provide to eligible parents through local agencies approved to administer the program. In Orange County, these agencies are the Orange County Department of Social Services (OCDSS), Children’s Home Society of California (CHS) and the Orange County Department of Education (OCDE). Parents redeem the vouchers at child care facilities of their choice,
75 Steven Moss, M.P.P., Partner, M. Cubed Consulting. The Economic Impact of the Child Care Industry in California, sponsored by the National Economic Development and Law Center, p. 16. 76 See Section 5 for a discussion of child care affordability for low-income families.
29
and the vouchers are then submitted back to the administering agencies by the child care provider for payment. In the first two years of CalWORKs, the vast majority of clients chose license exempt caregivers (for example by relatives or neighbors) instead of slots in regulated centers or licensed homes.77 There are a variety of reasons for preferring license exempt care, ranging from the unavailability of slots in licensed child care facilities to parental preference based on either cost, trust, convenience, or the desire to have their children in a more informal, home-based environment. Each local agency that administers the AP program is required by the state government to track payments to license-exempt providers; for 2001, these payments in Orange County totaled $26,963,433. This represents approximately 47% of the nearly $57 million in AP payments made to all licensed and license exempt providers in Orange County. After-school programs operated in conjunction with school districts are not required to be licensed, because health and safety requirements are governed by school district regulations. However, license exempt after-school programs represent a significant portion of school-age child care services; there are 11,911 children enrolled in licensed school-age programs, and another 5,161 enrolled in license-exempt school-age programs.78 Based on this enrollment data and average costs for school-age care, the gross receipts generated by license exempt school-age programs amount to $19,671,668 per year. Dollars from license exempt programs, when added to the gross receipts for licensed child care, make an expanded statement about the measurable impact of child care services (not necessarily licensed) in Orange County: that it contributes $459 million dollars to the local economy. Because no staffing requirements are in place for license exempt care settings, no projections or measurements can be made for the number of additional employees in license exempt child care services nor the number of indirect jobs that may be supported by license exempt care. Furthermore, it should be noted that because license exempt care is by definition less formalized, it is likely that the ripple effects of dollars flowing through licensed exempt care do not reach as far into the local economy as do dollars flowing through licensed establishments. For example, license exempt caregivers are less likely to pay additional property taxes or payroll taxes (as a licensed center would), and may not even report their income from child care for tax purposes. Multiplier Effects of Child Care Capital Investments The analysis of gross receipts and employment for the licensed child care field previously discussed in this section considers only the effects of child care operations, and excludes any economic effects from the construction of new facilities or the renovation of existing facilities.
77 Jan Ferris Heenan, Working Families and the High Cost of Child Care: Navigating a Choppy Child Care System, California Journal, October 2001, p. 12. 78 Derived from capacity and enrollment data from Children’s Home Society of California.
30
Child care facility construction also has a stimulating effect on the local economy. A one-time investment of $1 million for the construction of a child care building creates 23 jobs for one year, including more than nine in the construction industry itself.79 Other areas impacted include business services and retail trade (two jobs each), eating and drinking establishments, miscellaneous services, and wholesale trade (about one job each). Because these multipliers apply to the construction of an average facility, it may understate the extent of economic effects of child care facility development. Child care centers are specialized, highly regulated facilities that must conform to a number of safety, health, and other state licensing guidelines; therefore, construction costs to meet these regulations and demands involve categories of expenditures not found in typical office or commercial construction. Section Summary The diversity of the child care system is a vital feature in its ability to meet the demand of working parents, but makes it very difficult to analyze and measure. However, using data maintained by organizations charged by the State of California with tracking the supply, cost and licensure of child care facilities, an estimate of its composite size can be derived. This overall size, measured in terms of gross receipts and employment, is comparable to many other major industry groupings in Orange County such as radio, television, and electronics stores and computers, peripherals, and software. The substantial size of the child care industry means that it not only supports the economy by allowing parents to work, but also contributes to its vitality by employing significant numbers of workers, increasing tax revenue, and purchasing goods and services of many other industry sectors. The child care field also supports the local economy by drawing down significant levels of federal and state subsidies available to poor families. These families represent a substantial portion of the existing and potential workforce, and are vital to the continued growth of the retail and services sector, which in turn supports the growth of more sophisticated sectors of the economy. Federal and state child care subsidies represent new dollars flowing into the local economy, and can help fuel Orange County’s continued economic growth.
79 United States Department of Labor, Bureau of Economic Analysis, 1997.
31
Section 4 Child Care and Economic Development Over the next 20 years, approximately 543,000 new jobs will be added to Orange County’s economy, and its population will grow by 606,000 new residents.80 This dramatic growth poses a challenge for Orange County’s already strained child care infrastructure, and consequently inhibit the ability of the local economy to continue to grow. Local policies and investments aimed at bolstering the child care infrastructure contribute to Orange County’s overall productivity and economic competitiveness by:
• Expanding local labor force participation, which contributes to increased output, personal income, business formation, and revenues from local property sales taxes;
• Reducing local expenditures on social needs by lowering drop-out and crime rates, and decreasing special education and welfare costs;
• Cultivating Orange County’s future workforce by improving the cognitive skills and emotional well-being of children and ensuring that they enter school ready to learn; and
• Increasing federal and state child care subsidies, which in addition to bringing new dollars into the local economy, make child care more affordable for Orange County workers.
The purpose of this section is twofold; to provide a general framework for the discussion of child care capacity as an economic development activity, and to describe some of the specific ways the local economy is affected by the health of the child care infrastructure. The Impact of Child Care on Economic Competitiveness Investing in the child care infrastructure of Orange County will have direct positive benefits for the County’s overall economic competitiveness. Like transportation, education, public works, and affordable housing, child care is a necessary and vital part of the economic infrastructure. For example, without a sophisticated highway system, Orange County’s robust manufacturing sector would be unable to effectively transport their raw materials nor bring in a skilled workforce from surrounding areas. Likewise, without a healthy child care industry, businesses face substantial obstacles in attracting and retaining workers. Increasing the supply of affordable child care services helps Orange County become a more attractive destination for businesses and residents alike – especially if the county is able to market itself as having a healthy child care infrastructure. Particularly because traffic congestion and the high cost of housing negatively impact the quality of life, convenient and affordable child care services can deter current residences or businesses 80 These figures were calculated utilizing population growth projections provided by the California Department of Finance and employment growth projections provided by the Southern California Association of Governments.
32
from leaving in addition to attracting new ones. Just as local government and the private sector collaborate to increase the availability of affordable housing in order to attract a skilled workforce, so should they invest in the child care infrastructure. In fact, in light of current economic trends and changing workforce demographics, businesses are more concerned about child care. A 1998 study by the Families and Work Institute81 found that:
• Two-thirds of employers report that benefits of child care programs exceed costs or that the programs are cost-neutral;
• Three-quarters of employers who offer flexible work schedules find that benefits exceed costs or that the programs are cost-neutral; and
• Of those employers with family leave policies, three-quarters find that benefits exceed costs or that the programs are cost-neutral.
Such policies have become increasingly popular in recent years due to the growing crisis in available, affordable child care. Nationwide, it is estimated that worker absenteeism due directly to child care problems cost U.S. businesses $3 billion per year. The Effect of Child Care on Productivity The licensed child care industry supports Orange County’s productivity, which refers to increased output given the same level of inputs. Productivity is influenced by a wide variety of variables, including the quality of infrastructure components such as roads and power lines. Licensed child care contributes to productivity by increasing labor force participation, permitting parents to advance in their positions and achieve higher wages, and by lowering absenteeism and turnover rates. Child care enables parents to participate in the labor force. By the year 2010, it is estimated that 85 percent of the labor force will consist of parents.82 Based on estimates that three-fourths of the demand for child care is work-related,83 there are currently 59,017 children in Orange County whose parents are able to work because their children are in licensed child care.84 In a 1998 survey of the child care needs of working parents, 43% of parents indicated that a lack of acceptable child care had prevented either them or their spouse from taking a job they wanted.85 Many other Orange County parents are able to work because they are using unlicensed child care, a nanny, or a relative to care for their children. Choosing child care is a complicated process for many working parents, and involves factors such as availability and affordability. In some cases child care is used because a parent chooses to pursue a 81 Ellen Galinsky and James T. Bond, The 1998 Business Work-Life Study: A Sourcebook, New York, NY: Work and Families Institute, 1998. 82 US Census Bureau, Current Population Reports, P20-514, 1999. 83 California Child Care Resource and Referral Network, 1997 California Child Care Portfolio, cited in Summary. 84 This figure represents three-fourths of the number of children 0-13 currently enrolled in licensed child care in Orange County. 85 The Harris Poll survey, January 14-18 1998, cited in Polls Indicate Widespread Support for Investments in Child Care, the Children’s Defense Fund, www.childrensdefense.org/cc_polls.htm.
33
profession or supplement the household income; in many other cases it is an economic necessity. In the latter case, affordable child care is vital for a family’s economic self-sufficiency. In either case, the provision of child care services increases the available labor pool. While licensed child care is not necessary for all parents who choose to work, it is the only answer for some; and the supply of licensed child care is a crucial variable in the capacity of a local area to experience economic growth. Child care is also a critical component of workforce development, which was identified by business leaders as their top priority during the Orange County Business Council’s Strategic Planning process with McKinsey & Co. in 1999.86 Child care services are needed during various activities, such as education and training, necessary to prepare individuals to enter the workforce. In recognition of this, many universities have developed on-site child care facilities to accommodate parents pursuing both undergraduate and graduate degrees. Businesses and communities interested in taking advantages of federal subsidies available for hiring former welfare recipients have a special stake in ensuring the availability of affordable child care. In numerous studies tracking the success of welfare-to-work programs, child care and transportation were identified as the top two barriers for welfare clients in obtaining and maintaining jobs. In a survey of 800 welfare recipients polled by the Orange County Social Services Agency, 32% cited child care problems as a major barrier to employment.87
There is evidence that high quality child care supports workforce development more substantially than average quality child care. One particular study of the effect of high quality child care programs tracked the performance of parents in addition to the children themselves. The study found that mothers whose children participated in the high-quality program achieved higher educational and employment status than mothers whose children were not in the program.88 Child care is a crucial component of developing the future workforce as well. Schools and universities receive many public investments because their role in developing the future workforce is clear. While recent research demonstrates the importance of child care for school readiness, the concept of cultivating the future workforce in the child care classrooms of America has not yet been well-established. High quality child care programs improve children’s readiness to learn once they enter the public school system, but they are not widely available; and consequently, many children enter school with various barriers to learning. Polls administered in early childhood research journals document this; forty-six percent of kindergarten teachers report that half of their class or more have specific problems with entry into kindergarten
86 Orange County Business Council, cited on http://www.ocbc.org/workforcef.htm. 87 Grad, Poll Sheds Light on Welfare Issues, Los Angeles Times, November 4, 1997, B-1. 88 Discussion of results of The Abecedarian Study, as cited on www.fpg.unc.edu/~abc/.

34
(such as lack of academic skills and difficulty following directions).89 Conversely, a University of North Carolina study found that children in high quality child care demonstrate greater language development, mathematical ability, greater thinking and attention skills, and fewer behavioral problems in school.90 Another well-known preschool study, known as the Abecedarian Project, concluded that children who participated in the early intervention program had higher cognitive test scores from toddler years through age 21.91 In addition, intervention children completed more years of education and were more likely to attend a four-year college. This collection of research establishes a demonstrable link between quality child care and the preparation of qualified, skilled individuals entering the labor force. Finally, licensed child care contributes to a stable and productive workforce by lowering absenteeism and turnover rates. In a survey conducted by Parents Magazine in 1997, working mothers reported missing two full days and six partial days every six months due to child care problems; working fathers reported missing one full day and 4 partial days every 6 months.92 The same survey highlights the lack of security many parents have in their child care arrangements: only 40% of families surveyed were confident that their current child care arrangements would be in place six months from the date of the survey. This instability translates directly to reduced productivity in the workplace. Fifty-two percent of parents surveyed in 1998 by the Harris Poll reported that the problems of finding child care affected their ability to do their job well.93 Numerous other studies point to the importance of child care in retaining employees and improving productivity. Employees using a Nationsbank child care subsidy program had one third the turnover of non-participants in similar jobs.94 American Express Financial Advisors found that a newly created back-up child care service recovered 105 days of productivity.95 Estimating the impact of child care on productivity in the Orange County economy is a difficult task because of the complicated nature of unraveling all the other contributors to productivity, such as technology. One strategy for estimating the contribution of child care to productivity is to calculate the amount of wages parents are able to earn when their children are in licensed child care. This measures the dollar value of licensed child care in terms of the extra wages parents earn after the cost of care is netted out. Using the 89 S.E. Rimm-Kaufman, R.C. Pianta, and M.J. Cox, Kindergarten Teachers Perceive Difficulties in Transitions to School, Early Childhood Research Quarterly, Vol. 15. no. 2, November 2000. 90 Ellen S. Peisner-Feinberg, et al, The Children of the Cost, Quality and Outcomes Study Go To School, Chapel Hill, NC: University of North Carolina, June 1999. 91 www.fpg.unc.edu/~abc/. 92 Parents Magazine survey, August 1997, cited by the Children’s Defense Fund, Polls Indicate Widespread Support For Investments In Child Care, www.childrensdefense.org/cc_polls.htm. 93 The Harris Poll Survey, January 14-18, 1998, cited by the Children’s Defense Fund, Polls Indicate Widespread Support For Investments In Child Care, www.childrensdefense.org/cc_polls.htm. 94 Sandra Burud, citing Rodgers and Associates study in Evidence That Child Care and Work-Life Initiatives Will Impact Business Goals, Claremont Graduate University, 1999. 95 Sandra Burud, Evidence That Child Care and Work-Life Initiatives Will Impact Business Goals, Claremont Graduate University, 1999.

35
IMPLAN economic modeling tool (see Appendix B), these dollars can be traced as they ripple through the economy in the form of indirect and induced earnings and other productivity effects. This analysis was done by economist Steven Moss for the entire state of California in “The Economic Impact of the Child Care Industry In California.”96 When these numbers are calculated for Orange County based on its share of enrollment and gross receipts compared to the licensed child care system of the entire state of California, the following estimated direct, indirect, and induced productivity effects are found:
• The licensed child care sector enables Orange County parents to earn approximately $828 million annually (after netting out the wages of child care providers themselves);
• These productivity gains create $2.8 billion in total direct, indirect and induced income;
• These productivity gains generate $312 million in indirect tax revenues;97 • These productivity gains support approximately 69,900 jobs; • These productivity gains contribute $4.13 billion to the gross county product, or
the total value of goods and services produced in Orange County; and • The productivity effects of licensed child care in Orange County amount to a
$6.7 billion contribution to industry output.
Table 7: Projected Direct, Indirect, and Induced Productivity Effects of Licensed Child Care
Economic variable Contribution to CA Economy
Contribution to Orange County Economy
Enables workers to earn $13 billion $828 million Labor Income $44 billion $2.8 billion Contribution to Gross State/County Product $65 billion $4.13 billion Industry Output $105.3 billion $6.7 billion Indirect Business Taxes $4.9 billion $312 million Employment 1.1 million 69,900 Source: Steven Moss, The Economic Impact of the Child Care Industry in California, sponsored by the National Economic Development and Law Center, Fall 1999. Improving the Overall Quality of Life High quality child care services reduce long–term public sector costs across a number of categories, and serve to improve the overall quality of life (and thus business climate) by reducing crime. All of the major studies on the effects of high quality child care have, to date, been conducted in other cities and states, and are thus not specific to Orange County children. Because the implications of these studies are so great for long-term outcomes for children, community well-being, and social services spending, a study specific to Orange County would be a valuable endeavor. 96 Steven Moss, MPP, Partner, M. Cubed Consulting, The Economic Impact of the Child Care Industry in California, sponsored by the National Economic Development and Law Center, Fall 2001. 97 Indirect Business Taxes, as reported by IMPLAN, which exclude taxes on profit and income and include taxes such as excise taxes, property taxes, sales taxes paid by businesses, and sales and use taxes paid by individuals to enterprises in the normal course of business.
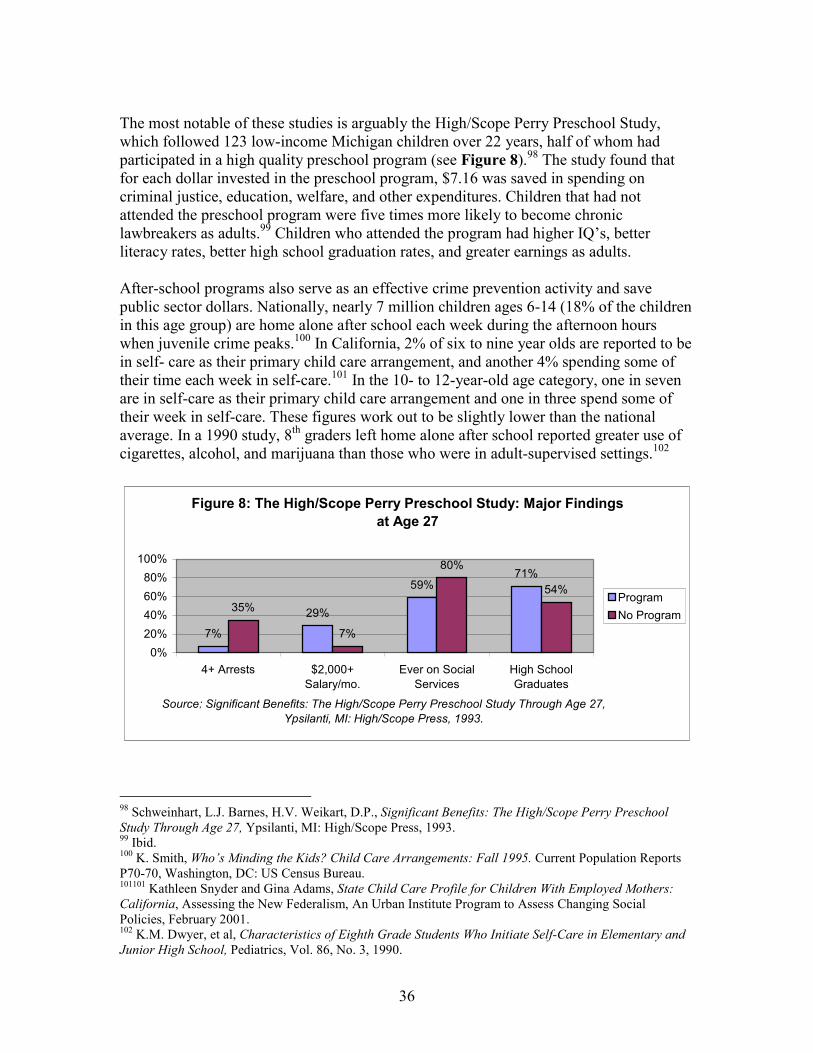
36
The most notable of these studies is arguably the High/Scope Perry Preschool Study, which followed 123 low-income Michigan children over 22 years, half of whom had participated in a high quality preschool program (see Figure 8).98 The study found that for each dollar invested in the preschool program, $7.16 was saved in spending on criminal justice, education, welfare, and other expenditures. Children that had not attended the preschool program were five times more likely to become chronic lawbreakers as adults.99 Children who attended the program had higher IQ’s, better literacy rates, better high school graduation rates, and greater earnings as adults. After-school programs also serve as an effective crime prevention activity and save public sector dollars. Nationally, nearly 7 million children ages 6-14 (18% of the children in this age group) are home alone after school each week during the afternoon hours when juvenile crime peaks.100 In California, 2% of six to nine year olds are reported to be in self- care as their primary child care arrangement, and another 4% spending some of their time each week in self-care.101 In the 10- to 12-year-old age category, one in seven are in self-care as their primary child care arrangement and one in three spend some of their week in self-care. These figures work out to be slightly lower than the national average. In a 1990 study, 8th graders left home alone after school reported greater use of cigarettes, alcohol, and marijuana than those who were in adult-supervised settings.102
Figure 8: The High/Scope Perry Preschool Study: Major Findings at Age 27
7%
29%
59%71%
35%
7%
80%
54%
0%20%40%60%80%
100%
4+ Arrests $2,000+Salary/mo.
Ever on SocialServices
High SchoolGraduates
Source: Significant Benefits: The High/Scope Perry Preschool Study Through Age 27, Ypsilanti, MI: High/Scope Press, 1993.
ProgramNo Program
98 Schweinhart, L.J. Barnes, H.V. Weikart, D.P., Significant Benefits: The High/Scope Perry Preschool Study Through Age 27, Ypsilanti, MI: High/Scope Press, 1993. 99 Ibid. 100 K. Smith, Who’s Minding the Kids? Child Care Arrangements: Fall 1995. Current Population Reports P70-70, Washington, DC: US Census Bureau. 101101 Kathleen Snyder and Gina Adams, State Child Care Profile for Children With Employed Mothers: California, Assessing the New Federalism, An Urban Institute Program to Assess Changing Social Policies, February 2001. 102 K.M. Dwyer, et al, Characteristics of Eighth Grade Students Who Initiate Self-Care in Elementary and Junior High School, Pediatrics, Vol. 86, No. 3, 1990.

37
Chicago’s government-funded “Child Parent Centers” tracked 989 of its children for 15 years and compared results to 550 children not in program; children NOT participating were 70% more likely to be arrested for a violent crime by age 18.103 This means that of the 100,000 children served in the Center’s history, it has prevented an estimated 13,000 violent juvenile crimes. This reduction in crime translates to a savings of $7 to taxpayers, victims and participants for every $1 invested, and $3 for every $1 invested by taxpayers alone. In a George Mason University study, 91% of Police Chiefs surveyed agreed that “If America does not make greater investments in after-school and educational child care programs to help children and youth now, we will pay more later in crime, welfare, and other costs.” 104
103 Reynolds, A.J. et al, Long-Term Effects of an Early Childhood Intervention on Educational Achievement and Juvenile Arrest: A 15-year Follow Up of Low-Income Children in Public Schools. JAMA, May 19, 2001, v. 285, no. 18. 104 Fight Crime, Invest in Kids, Poll of Police Chiefs conducted by George Mason University Professors Stephen D. Mastrofski and Scott Keeter. Washington, DC, November 1, 1999.
38
Section 5 Child Care Supply and Demand in Orange County Child care providers face a tremendous challenge in identifying demand for their services and, more importantly, in compiling the financial resources and business and development expertise to meet that demand. Overall, child care is an extremely expensive service to provide and the child care field lacks adequate capital to expand quickly enough to keep up with demand. Conversely, child care is an expensive service to purchase and families must carefully choose a care provider based on competing factors such as affordability, location, perceived appropriateness, and quality of care. All of these factors conspire to make child care a very difficult business to evaluate in terms of supply and demand. Nevertheless, this section attempts to break down licensed child care supply and demand for both licensed and license exempt child care into its most essential components in order to establish guidelines upon which child care investments should be made. Factors Affecting the Supply of Licensed Child Care Overall, there is a shortage of licensed child care facilities to meet the child care needs of working families in Orange County. Unlike other businesses, such as clothing companies, that can easily track demand for their product and adjust production levels such that resources and profits are maximized, child care providers are often unable to accurately assess demand or expand supply in a way that increases profits (or in the case of a non-profit, increase income to be re-invested in services). A typical child care provider runs on an extremely tight budget and barely has the time to carryout basic business functions, much less put time and resources into expansion and development. There are of course exceptions to this rule, with the emergence of some larger for-profit child care corporations that have the capital and the business expertise to go about serving children in a more entrepreneurial manner. This dilemma is rooted in the fact that child care providers historically see themselves as social workers more than businesspeople. This dynamic results in the proliferation of child-friendly staff and care environments, but leaves the industry in a very vulnerable position when it comes to finances and business development. This is an important consideration for policymakers and planners, because it reinforces the assertion that the child care industry requires outside investment and assistance in order to adequately respond to the needs spawned by changing economic conditions. Furthermore, efficiently designed business development policies for the child care sector will, by definition, be phased out over time. Once child care providers receive the training necessary to become more business-savvy, and once more loan products and other business development resources avail themselves to child care providers, the child care industry will become more self-sufficient and successful in meeting the needs of both children and the economy.
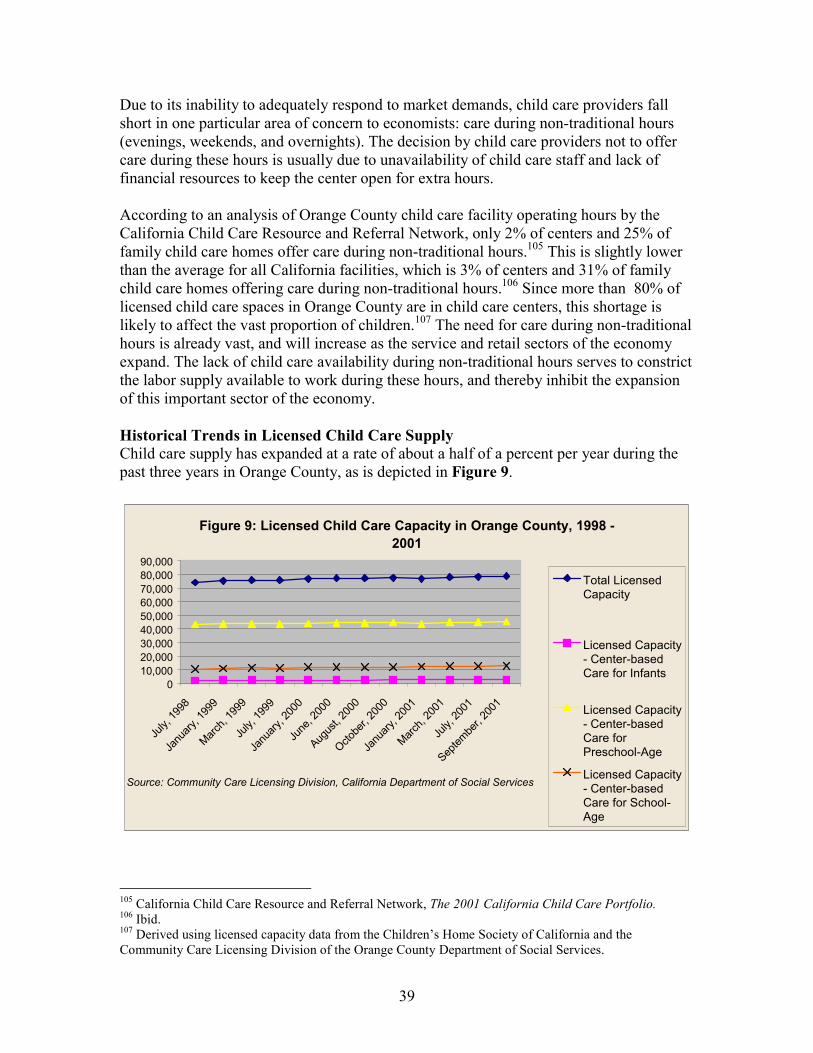
39
Due to its inability to adequately respond to market demands, child care providers fall short in one particular area of concern to economists: care during non-traditional hours (evenings, weekends, and overnights). The decision by child care providers not to offer care during these hours is usually due to unavailability of child care staff and lack of financial resources to keep the center open for extra hours. According to an analysis of Orange County child care facility operating hours by the California Child Care Resource and Referral Network, only 2% of centers and 25% of family child care homes offer care during non-traditional hours.105 This is slightly lower than the average for all California facilities, which is 3% of centers and 31% of family child care homes offering care during non-traditional hours.106 Since more than 80% of licensed child care spaces in Orange County are in child care centers, this shortage is likely to affect the vast proportion of children.107 The need for care during non-traditional hours is already vast, and will increase as the service and retail sectors of the economy expand. The lack of child care availability during non-traditional hours serves to constrict the labor supply available to work during these hours, and thereby inhibit the expansion of this important sector of the economy. Historical Trends in Licensed Child Care Supply Child care supply has expanded at a rate of about a half of a percent per year during the past three years in Orange County, as is depicted in Figure 9.
Figure 9: Licensed Child Care Capacity in Orange County, 1998 - 2001
010,00020,00030,00040,00050,00060,00070,00080,00090,000
July,
1998
Janu
ary, 1
999
March,
1999
July,
1999
Janu
ary, 2
000
June
, 200
0
Augus
t, 200
0
Octobe
r, 200
0
Janu
ary, 2
001
March,
2001
July,
2001
Septem
ber, 2
001
Source: Community Care Licensing Division, California Department of Social Services
Total LicensedCapacity
Licensed Capacity- Center-basedCare for Infants
Licensed Capacity- Center-basedCare forPreschool-Age
Licensed Capacity- Center-basedCare for School-Age
105 California Child Care Resource and Referral Network, The 2001 California Child Care Portfolio. 106 Ibid. 107 Derived using licensed capacity data from the Children’s Home Society of California and the Community Care Licensing Division of the Orange County Department of Social Services.

40
Child Care Staffing Shortage Another critical shortage that Orange County child care providers face is in the available labor pool for the industry. A major factor is the low wages received by child care workers; their average salary in California is $17,420 per year.108 In Orange County, the normative hourly wage is $12 per hour for child care teachers and $8 per hour for child care aides.109 It comes as no surprise that quality caregivers are hard to find in a marketplace where being a bus driver ($20,150 per year) or garbage collector ($18,100 per year) would make it easier to support one’s family than being a child care worker.110 Additionally, most child care jobs do not come with typical benefits such as health insurance or paid leave; in a survey of child care centers in Orange County, 25.6% provided no assistance with medical insurance to teachers, and 20.4% provided no assistance to directors.111 Child care providers also typically have such tight budgets that they can rarely afford professional development activities (such as trainings and conferences) for their staff. In Orange County, as in the rest of the state, low wages and minimal benefits are closely linked to rapid turnover among child care providers. Nationwide, about one third of child care staff leave their current employer each year.112 In 1996, about three out of every 10 child care teachers in California left their job, compared with a turnover rate of 6.6% for public school teachers.113 In Orange County, the average turnover rate for full-time teachers at for-profit centers was 25.1%, and at publicly funded non-profits was 21.8%.114 It should be noted that turnover is as much a result of low wages as it is high occupational growth in other, higher paying industries. The state median hourly wage for an experienced child care worker is $7.24 an hour. Within business services--one of the state’s fastest growing industries—median wages for the same or lesser training requirement range from $10.68/hour for general office clerks to $13.29/hour for secretaries. Child care staff have also exited the field for the slightly more lucrative public education system (following California laws mandating class size reduction in public schools, which resulted in a significant number of teacher openings for individuals with experience working with children). Both public and private child care providers report losing their most highly qualified staff to public schools. In addition, smaller
108 California Child Care Resource and Referral Network, The 2001 California Child Care Portfolio. 109 United Way of Orange County, Early Care and Education Salary and Working Conditions Survey, 2002, p. 7. 110 Gina Adams and Karen Schulman, California: Child Care Challenges, Washington, DC: Children’s Defense Fund, May 1998. 111 United Way of Orange County, Early Care and Education Salary and Working Conditions Survey, 2002, p. 14. 112 Marcy Whitebook, Carrollee Howes, and Deborah Philips, Worthy Work, Unlivable Wages: The National Child Care Staffing Study, 1988-1997. Washington, DC: Center for the Child Care Workforce, 1998. 113 California Child Care and Development Compensation Study: Towards Promising Policy and Practice. Prepared by the American Institute for Research and the Center for the Child Care Workforce for the California Department of Education, Sacramento, CA; Washington, DC: March, 1998. 114 United Way of Orange County, Early Care and Education Salary and Working Conditions Survey, 2002, p. 32.
41
classes in public schools have created the need for more classroom facilities, squeezing out some child care programs.115 High rates of staff turnover negatively impact program quality and therefore the lives of the children they serve. A study on child care quality by the Institute for Research on Poverty suggests that staff salaries and retention are excellent predictors of staff education, which in turn predicts the quality of classroom interactions.116 In addition, California child care teachers participating in a focus group study by the U.S. Department of Health and Human Services attribute challenging and aggressive behavior of children in part to multiple and inconsistent care providers.117 They also cited poor compensation, high staff turnover, and a shortage of qualified child development professionals as contributors to a work environment they feel it is impossible to succeed in. All of these factors impact their ability to appropriately address the challenging behavior of children in their care. Despite these difficulties, some positive aspects to the industry’s occupational characteristics remain. Child care industry wages statewide kept pace with inflation since 1987.118 This trend is superior to many other service industries, where wages have fallen statewide at about one percent annually, when adjusted for inflation. With a concerted advocacy effort, and as child care demand increases, child care wages may continue to increase. Land Use Barriers Local jurisdictions utilize the land use regulation and permitting process to control the appropriate location and conditions under which the operation of a family child care home or child care center can occur. Good traffic and circulation conditions (the drop-off and pick-up of children), availability of parking (for employees and parents picking children up), and the control of excess noise are the primary concerns of neighbors and the local Planning Department. While the permitting process is intended to improve the environment in which child care service is delivered, it can also deter child care professionals from operating if the regulations and conditions are burdensome, illegal, or not sensitive to the true operational characteristics of the industry. In fact, this has become such a problem nationwide that the American Planning Association issued a policy statement in 1993 encouraging communities to consider amending local zoning ordinances to remove obstacles to the provision of regulated group and family child care in all zoning districts that are appropriate and safe for children.
115 Gina Adams and Karen Schulman, California: Child Care Challenges, Washington, DC: Children’s Defense Fund, May 1998. 116 Vandell, L. and Wolfe, B. Child Care Quality: Does it Matter and Does it Need to be Improved? Institute for Research on Poverty, http://aspe.hhs.gov/hsp/ccquality00/ccqual.htm#econ. 117 Mark-Wilson, Priscilla; Hopewell, Anne; and Gallagher, Judith. Perceptions of Child Care Professionals in California Regarding Challenging Behaviors Exhibited by Young Children in Care: Findings and Recommendations of Focus Group Study. Health Systems Research, Inc., prepared for Healthy Child Care California, January 2002, pp. 1-2. 118 1997/1998 Occupational Employment and Wage Data, Survey Results, U.S. Bureau of Labor Statistics.

42
Local land use policies can discourage child care providers from establishing, expanding, or moving their facilities in the following ways:
• Making permit application fees are too expensive for child care providers; • Creating an application process for use permits is too lengthy and cumbersome,
resulting in revenue losses for child care providers; and • Not allowing child care use in zones that are otherwise appropriate locations for
child care services. Appendix C presents information on permit application fees, average length of time to complete the review process, and allowable zones for child care centers for each city in Orange County. Permit fees range from zero (Tustin) to $2,000 (unincorporated Orange County), and obtaining a use permit usually involves the payment of additional fees such as environmental review (up to $2,000) and Negative Declarations (up to $250). Average length of time for the permit review process begins at 3-5 weeks (Mission Viejo) and extends to 12-24 weeks (Brea). Allowable zones for child care can be restrictive (Mission Viejo, Laguna Beach, Tustin and Garden Grove allow it only in Commercial zones) or expansive (Laguna Hills allows it in Residential, Commercial, Industrial, Office Professional, Mixed Use, and Institutional). A combination of overly expensive and restrictive requirements can conspire to prevent the establishment or expansion of child care facilities in the jurisdiction. In addition, zoning policies are frequently out of compliance with current state law regarding the regulation of child care services; for example, some jurisdictions fail to update their land use policies to reflect a recent state law revising regulations to increase the numbers of children allowed in both small and large family child care homes. Also, planning staff or commissioners who review applications are not always aware of the following state Health and Safety Code provisions:
• § 1597.46 limits the discretion of cities and counties to restrict large family child care homes on lots zones for single-family dwellings, and requires that zoning restrictions be based on four factors only: provider density, traffic control, parking, and noise control.
• § 1597.45 requires that the use of a single-family home as a small family child care home be considered as a residential use, providers need not apply for a use permit. The provision also states that local jurisdictions may not impose a business license, fee, or tax for the privilege of operating a small family child care home.
Given Orange County’s need to expand its child care infrastructure, policymakers, land use planners, and civic leaders all stand to benefit from the re-design of land use policies that accommodate the provision of affordable, quality child care services. Revising land use policy is a desirable strategy for supporting the child care industry and working parents who need child care because of the low cost associated with it. Specific steps a local jurisdiction could take to reduce barriers to child care facility development include: Ensuring the application is straightforward and as concise as possible; Ensuring the time to process applications is as short as possible;
43
Designating and training a single planner responsible for processing child care applications; Reducing or eliminating Administrative and Conditional Use Permit Fees for child
care providers; and Reducing or eliminating business license fees for some or all types of child care
providers. Welfare Reform and the Shortage of Affordable Child Care The requirement under welfare reform for recipients to engage in work within a specific time frame has created a significant strain on child care providers who offer services to low-income families. Both the federal and state governments attempted to address the anticipated increase in need for child care services that welfare reform would present. California budgeted $3.01 billion for child care and related services in FY 2000-1, more than triple the 1996-7 funding level.119 The 2000-1 budget also included a new refundable tax credit to help working parents offset child care expenses. The expansion of child care funding at the federal level fueled much of the growth of California’s child care budget. In fact, in addition to increases in the overall amount of funding for child care related services, the proportion of California’s child care budget that was federal in origin increased from 31% in 1996-7 to 48% in 2000-1.120 California’s general funds also contribute to the growth in the child care system recently, increasing from $642 million in 1996-7 to $1.58 billion in 2000-1. However, these funding increases for child care services are inadequate in meeting increases in demand. In the four years following federal welfare reform, the parents of 600,000 California children went off the welfare caseloads, presumably into a work arrangement, in order to support their family in the absence of cash aid.121 During that same period, licensed child care spaces in California increased by only 119,325. Many of these children may have gone into care with license exempt providers; however, many former welfare clients are likely unable to work due to the absence of reliable child care services. Nationally, state and federal resources for child care subsidies are so insufficient that only one in 10 children from low-income families who are eligible under federal law receives child care assistance.122 This has an immediate impact of the ability of welfare participants to achieve self-sufficiency; according to a North Carolina survey, one in four low-income families on waiting lists for child care lost or had to quit their job while waiting.123 119 California Budget Project, California’s Child Care and Development System: Strengthening a Critical Investment in Children and Families, Sacramento, CA: May, 2001. 120 Ibid. 121 Ibid. 122 US Department of Health and Human Services, Administration for Children and Families, Access to Child Care for Low-Income Working Families. Washington, DC: US Dept. of Health and Human Services, 1999: i. 123 Jeffrey Lyons, Susan Russell, Christina Golgor and Amy Staples, Child Care Subsidy: the Cost of Waiting. Chapel Hill, NC: Day Care Services Association, September 1998.
44
Factors Affecting Demand There are a wide variety of factors that affect both need and demand for child care. In economic terms, need refers to the actual need for a service, i.e. a working parent who, by virtue of being committed to a work activity 8-10 hours a day, needs child care services. Demand, on the other hand, refers to the ability of parents to access a child care service, which means they must have the means to transport their child to the location and the financial resources to pay for it. This section will refer to both need and demand for child care services. Where are the children now? The first step in understanding how the demand for child care will develop over the years is to look at current utilization of services. Every day in America, three out of five children age 0-5 are in child care.124 Many of these children are being cared for in multiple arrangements. Among California children under age 5 with employed mothers, 66% have only one nonparental child care arrangement, 29% have two nonparental child care arrangements, and 6% have three or more.125 California children under age 5 are less likely to be in center-based care than their counterparts nationwide (19% versus 32 %), and more likely to be in parent care than in the U.S. as a whole (34% versus 24%).126 California’s infants and toddlers are less likely to be in center-based care than in the U.S. (9% versus 22 %). There are deficits in child care availability for certain age groups; 70% of respondents in a recent national survey of resource and referral agencies report shortages in care for infants and toddlers and mildly ill children.127 In Orange County, despite the fact that slots for infants grew by 18% between 1998 and 2000, the percent of requests for infant/toddler care increased from 38% in 1998 to 42% in 2000.128 There are also a variety of demographic factors nationwide that affect the demand for child care in an organized facility. Table 8 provides information on the percent of children in organized care, according to a variety of family characteristics, and suggests that certain factors such as income and education levels can be predictors of child care utilization.
124 National Center for Education Statistics, Child Care and Early Education Program Participation of Infants, Toddlers and Preschoolers, Washington, DC: NCES, October 1996. 125 Kathleen Snyder and Gina Adams, State Child Care Profile for Children With Employed Mothers: California, Assessing the New Federalism, An Urban Institute Program to Assess Changing Social Policies, February 2001. 126 Ibid. 127 General Accounting Office, Education and Care: Early Childhood Education Programs and Services for Low-Income Families, GAO/HEHS-00-11, November 1999, p. 66-68. 128 California Child Care Resource and Referral Network, The 2001 California Child Care Portfolio.
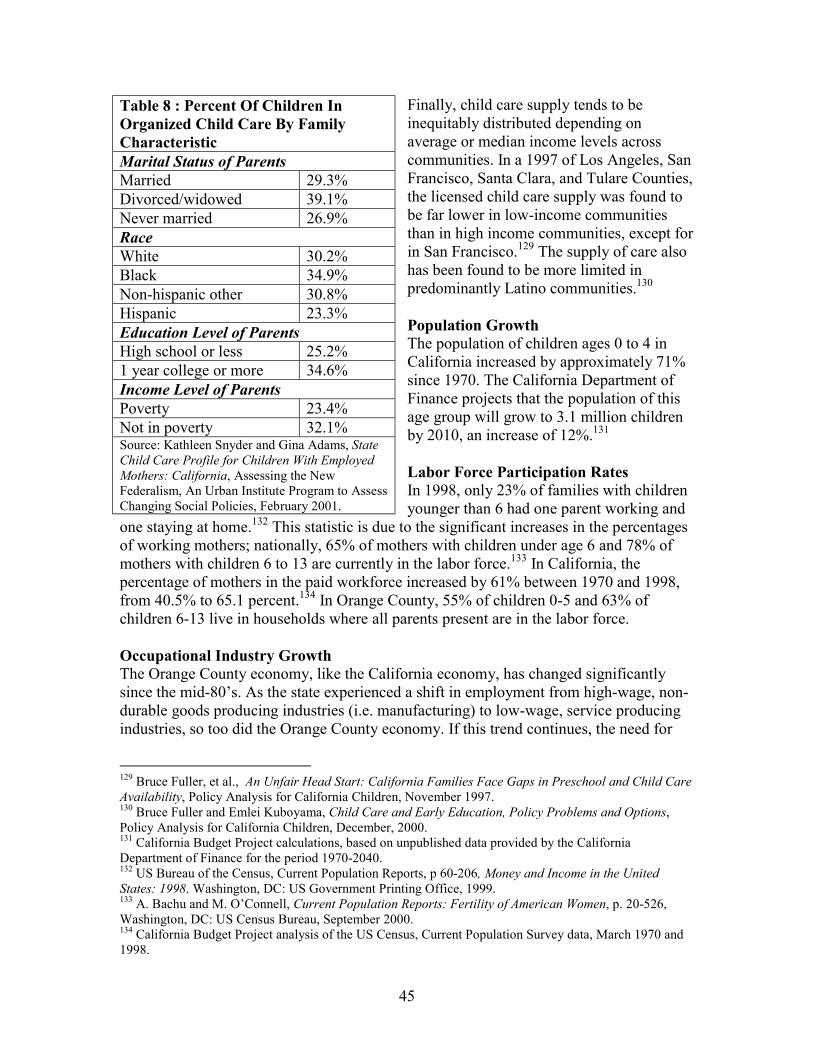
45
Finally, child care supply tends to be inequitably distributed depending on average or median income levels across communities. In a 1997 of Los Angeles, San Francisco, Santa Clara, and Tulare Counties, the licensed child care supply was found to be far lower in low-income communities than in high income communities, except for in San Francisco.129 The supply of care also has been found to be more limited in predominantly Latino communities.130 Population Growth The population of children ages 0 to 4 in California increased by approximately 71% since 1970. The California Department of Finance projects that the population of this age group will grow to 3.1 million children by 2010, an increase of 12%.131 Labor Force Participation Rates In 1998, only 23% of families with children younger than 6 had one parent working and
one staying at home.132 This statistic is due to the significant increases in the percentages of working mothers; nationally, 65% of mothers with children under age 6 and 78% of mothers with children 6 to 13 are currently in the labor force.133 In California, the percentage of mothers in the paid workforce increased by 61% between 1970 and 1998, from 40.5% to 65.1 percent.134 In Orange County, 55% of children 0-5 and 63% of children 6-13 live in households where all parents present are in the labor force. Occupational Industry Growth The Orange County economy, like the California economy, has changed significantly since the mid-80’s. As the state experienced a shift in employment from high-wage, non-durable goods producing industries (i.e. manufacturing) to low-wage, service producing industries, so too did the Orange County economy. If this trend continues, the need for
129 Bruce Fuller, et al., An Unfair Head Start: California Families Face Gaps in Preschool and Child Care Availability, Policy Analysis for California Children, November 1997. 130 Bruce Fuller and Emlei Kuboyama, Child Care and Early Education, Policy Problems and Options, Policy Analysis for California Children, December, 2000. 131 California Budget Project calculations, based on unpublished data provided by the California Department of Finance for the period 1970-2040. 132 US Bureau of the Census, Current Population Reports, p 60-206, Money and Income in the United States: 1998. Washington, DC: US Government Printing Office, 1999. 133 A. Bachu and M. O’Connell, Current Population Reports: Fertility of American Women, p. 20-526, Washington, DC: US Census Bureau, September 2000. 134 California Budget Project analysis of the US Census, Current Population Survey data, March 1970 and 1998.
Table 8 : Percent Of Children In Organized Child Care By Family Characteristic Marital Status of Parents Married 29.3% Divorced/widowed 39.1% Never married 26.9% Race White 30.2% Black 34.9% Non-hispanic other 30.8% Hispanic 23.3% Education Level of Parents High school or less 25.2% 1 year college or more 34.6% Income Level of Parents Poverty 23.4% Not in poverty 32.1% Source: Kathleen Snyder and Gina Adams, State Child Care Profile for Children With Employed Mothers: California, Assessing the New Federalism, An Urban Institute Program to Assess Changing Social Policies, February 2001.
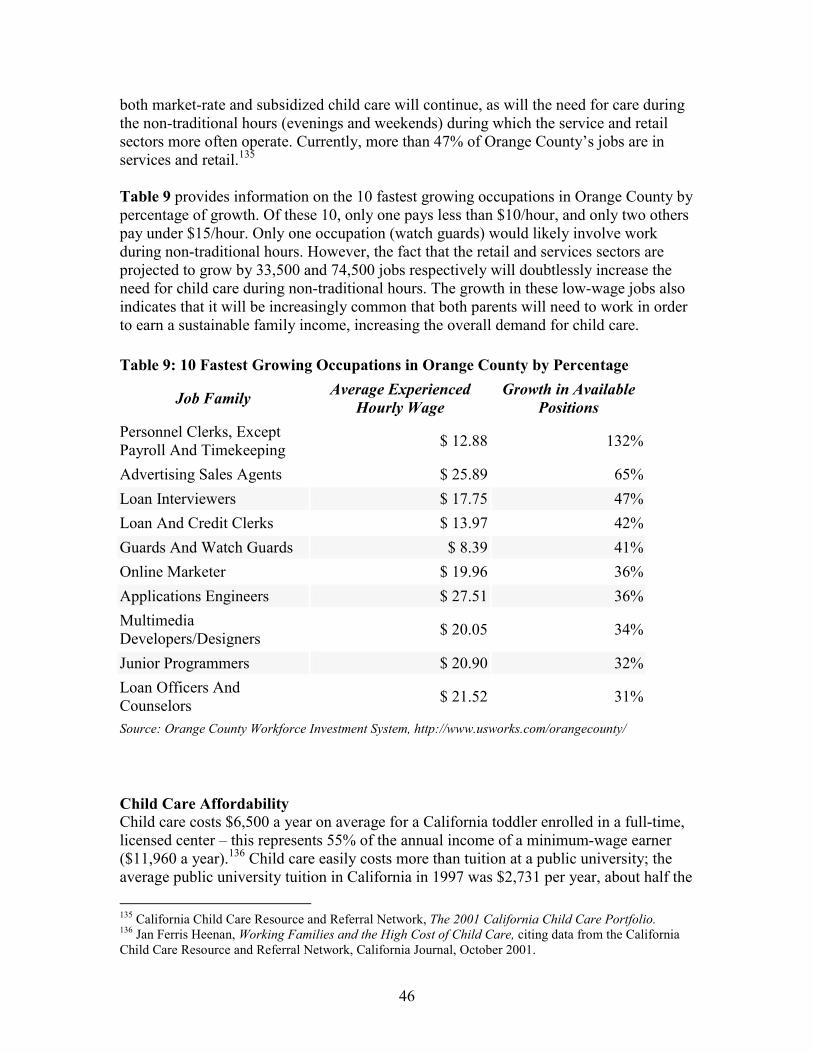
46
both market-rate and subsidized child care will continue, as will the need for care during the non-traditional hours (evenings and weekends) during which the service and retail sectors more often operate. Currently, more than 47% of Orange County’s jobs are in services and retail.135 Table 9 provides information on the 10 fastest growing occupations in Orange County by percentage of growth. Of these 10, only one pays less than $10/hour, and only two others pay under $15/hour. Only one occupation (watch guards) would likely involve work during non-traditional hours. However, the fact that the retail and services sectors are projected to grow by 33,500 and 74,500 jobs respectively will doubtlessly increase the need for child care during non-traditional hours. The growth in these low-wage jobs also indicates that it will be increasingly common that both parents will need to work in order to earn a sustainable family income, increasing the overall demand for child care. Table 9: 10 Fastest Growing Occupations in Orange County by Percentage
Job Family Average Experienced Hourly Wage
Growth in Available Positions
Personnel Clerks, Except Payroll And Timekeeping $ 12.88 132%
Advertising Sales Agents $ 25.89 65% Loan Interviewers $ 17.75 47% Loan And Credit Clerks $ 13.97 42% Guards And Watch Guards $ 8.39 41% Online Marketer $ 19.96 36% Applications Engineers $ 27.51 36% Multimedia Developers/Designers $ 20.05 34%
Junior Programmers $ 20.90 32% Loan Officers And Counselors $ 21.52 31%
Source: Orange County Workforce Investment System, http://www.usworks.com/orangecounty/ Child Care Affordability Child care costs $6,500 a year on average for a California toddler enrolled in a full-time, licensed center – this represents 55% of the annual income of a minimum-wage earner ($11,960 a year).136 Child care easily costs more than tuition at a public university; the average public university tuition in California in 1997 was $2,731 per year, about half the 135 California Child Care Resource and Referral Network, The 2001 California Child Care Portfolio. 136 Jan Ferris Heenan, Working Families and the High Cost of Child Care, citing data from the California Child Care Resource and Referral Network, California Journal, October 2001.
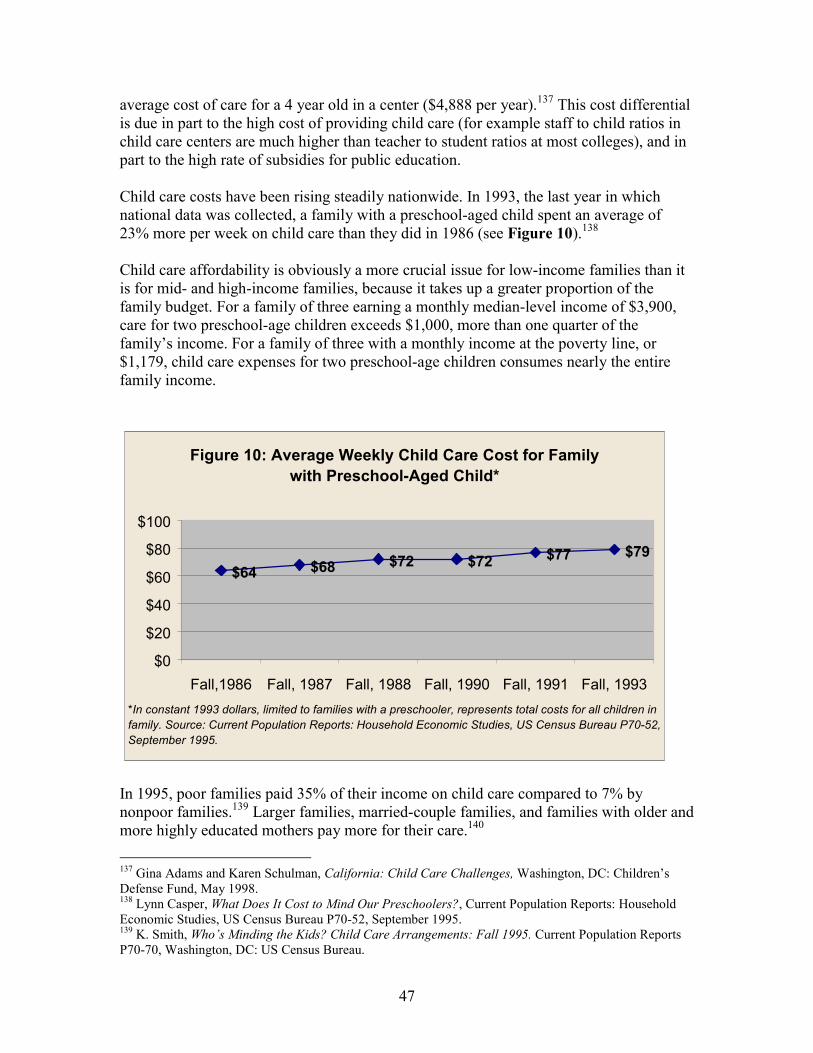
47
average cost of care for a 4 year old in a center ($4,888 per year).137 This cost differential is due in part to the high cost of providing child care (for example staff to child ratios in child care centers are much higher than teacher to student ratios at most colleges), and in part to the high rate of subsidies for public education. Child care costs have been rising steadily nationwide. In 1993, the last year in which national data was collected, a family with a preschool-aged child spent an average of 23% more per week on child care than they did in 1986 (see Figure 10).138 Child care affordability is obviously a more crucial issue for low-income families than it is for mid- and high-income families, because it takes up a greater proportion of the family budget. For a family of three earning a monthly median-level income of $3,900, care for two preschool-age children exceeds $1,000, more than one quarter of the family’s income. For a family of three with a monthly income at the poverty line, or $1,179, child care expenses for two preschool-age children consumes nearly the entire family income.
Figure 10: Average Weekly Child Care Cost for Family with Preschool-Aged Child*
$64 $68 $72 $72 $77 $79
$0
$20
$40
$60
$80
$100
Fall,1986 Fall, 1987 Fall, 1988 Fall, 1990 Fall, 1991 Fall, 1993*In constant 1993 dollars, limited to families with a preschooler, represents total costs for all children in family. Source: Current Population Reports: Household Economic Studies, US Census Bureau P70-52, September 1995.
In 1995, poor families paid 35% of their income on child care compared to 7% by nonpoor families.139 Larger families, married-couple families, and families with older and more highly educated mothers pay more for their care.140 137 Gina Adams and Karen Schulman, California: Child Care Challenges, Washington, DC: Children’s Defense Fund, May 1998. 138 Lynn Casper, What Does It Cost to Mind Our Preschoolers?, Current Population Reports: Household Economic Studies, US Census Bureau P70-52, September 1995. 139 K. Smith, Who’s Minding the Kids? Child Care Arrangements: Fall 1995. Current Population Reports P70-70, Washington, DC: US Census Bureau.
48
Mapping the Most Urgent Child Care Needs Another strategy for determining the most urgent need for child care services is to compare child care supply with employment and population growth in different regions of Orange County. In areas where population and employment growth are high, but child care capacity is low, there exists the greatest need for developing the child care infrastructure to meet increasing need for services. Figures 11 and 12 provide an illustration of the projected level of need for cities in Orange County to develop the child care infrastructure. These maps use employment and population growth projections from the Southern California Association of Governments for the time period 1997 to 2010, and current child care capacity data provided by the California Child Care Resource and Referral Network. Categories are created for each indicator based on median employment and population growth and median child care capacity. For employment growth, the following categories are designated for each city: Low employment growth = (negative) to 25% Medium employment growth = 25% – 50% High employment growth = 50% – 259% For population growth, the following categories are designated for each city: Low population growth = 0 – 10% Medium population growth = 10 – 20% High population growth = 20 – 28% For child care capacity, the following categories are designated for each city (figures indicate number of licensed child care spaces per 100 children ages 0-13): Very low child care capacity = 0 – 4.9 spaces Low child care capacity = 5 – 10.9 spaces Medium child care capacity = 11 – 16.9 spaces High child care capacity = 17 – 45 spaces Based on these categories, each city is colored according to child care supply (red is very low supply, purple is low supply, green is medium supply, and blue is high supply), then shaded according to level of employment or population growth (dark is high, regular is medium, and light is low). Please refer to the key on the lower left hand corner of the maps for a comprehensive guide to interpreting the color and shading scheme. Please note that unincorporated regions of Orange County are not included in these maps because projections are not available for employment and population growth for specific unincorporated areas. Projections on employment and population growth for all unincorporated areas suggest that this is where the bulk of growth will occur; unfortunately the lack of geographical specificity of the projections preclude mapping as 140 Ibid.

49
a way to visualize the areas of highest growth. However, it is worth noting that SCAG projections for employment growth for all unincorporated areas is 175%, and the projection for population growth for unincorporated areas is 41.8%.
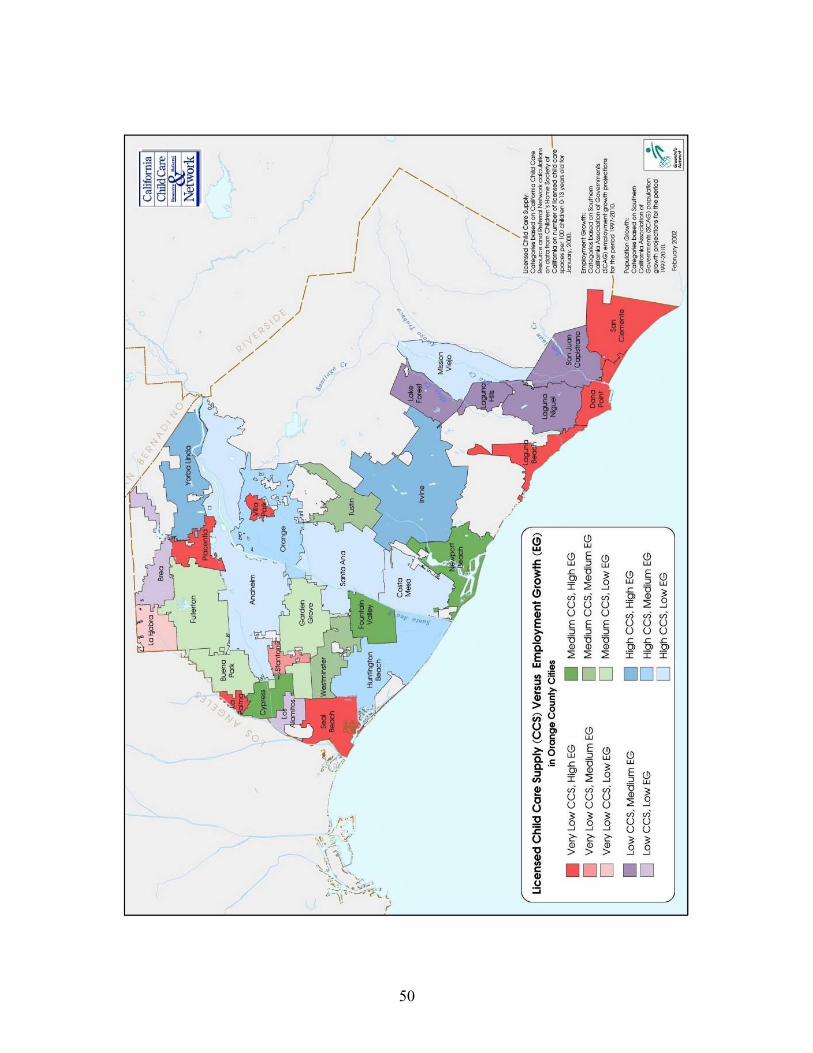
50
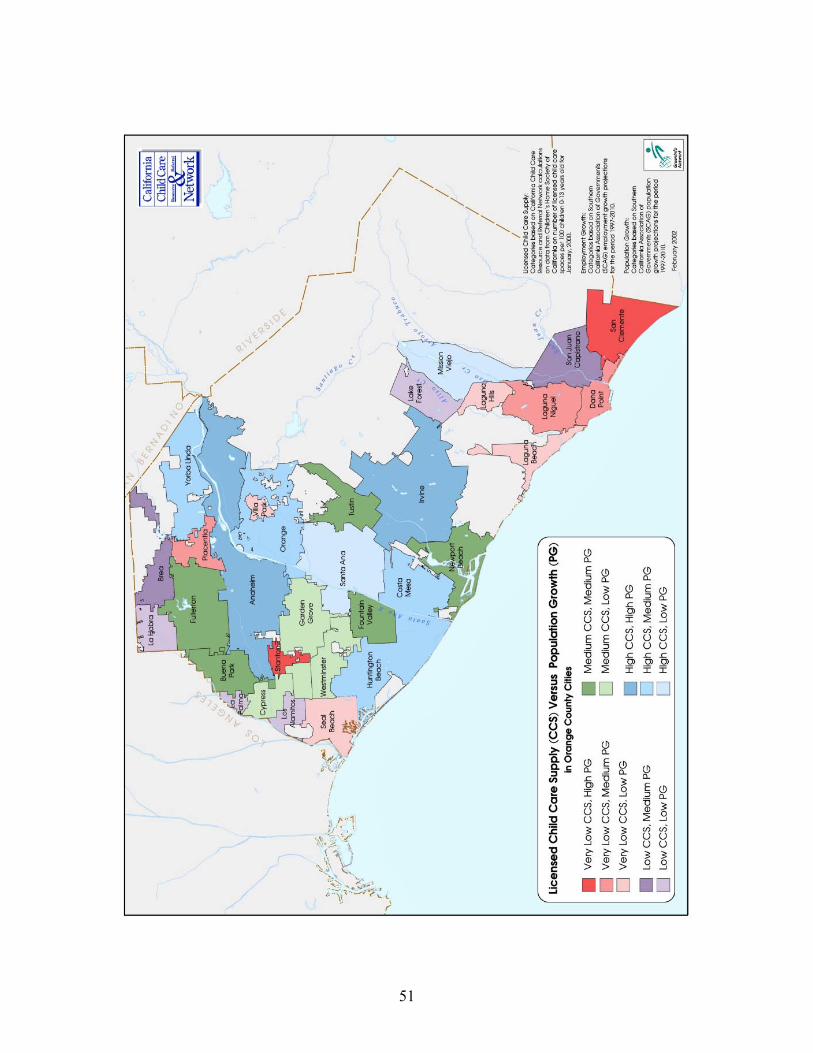
51
52
Section Summary The child care infrastructure faces many barriers in expanding to meet the need and demand for care. The field as a whole has very limited resources, and, in many cases, limited expertise, for the type of program and facility expansion that is necessary to meet the child care needs of Orange County families. These weaknesses are compounded by a national crisis in the child care workforce, which has witnessed extraordinarily high rates of staff turnover due to low wages and minimal benefits. However, child care resources in the form of state and federal subsidies have expanded with welfare reform and are helping meet the needs of the hundreds of thousands of California families exiting welfare rolls and joining the labor force. Also, child care providers are gaining business expertise and fundraising savvy in an effort to improve and expand services. The need for child care is expanding at a faster rate than the demand for care. Increases in child population as well as in numbers of parents joining the labor force create the need for additional child care facilities. However, child care services are expensive to purchase and not always accessible, particularly for low-income families. The expansion of the service and retail sectors of the Orange County economy will create the need for more affordable child care offered during non-traditional hours.
53
Section 6 Conclusion Orange County’s child care industry is critical to the county’s overall economic vitality and quality of life. The licensed child care industry supports 13,902 local jobs and generates about $412 million dollars per year in gross receipts. An additional $47 million annually is generated by a measurable portion of license exempt providers. Moreover, the child care industry helps sustain the county’s growing workforce by enabling parents to enter the workforce or return to it sooner, thereby increasing overall productivity and improving the ability of parents to advance in their careers and earnings. However, on its own, the child care industry is unable to expand at a rate adequate to meet the growing demand for child care services. Without local investments and intervention to address barriers to child care supply-building, the child care industry and the economy as a whole will suffer a setback. Local Constraints on Child Care Growth in Orange County Despite record growth of the child care industry in recent years, there remain significant barriers to meeting the child care need. The following factors should be considered in assessing the need to invest more in the child care system:
• Both children and parents suffer from inadequate investments in child care. Parents cannot be reliable, productive workers without dependable child care. And if children do not receive quality child care, they face increased difficulty succeeding in school and are more likely to become involved in criminal activities or end up on public assistance.
• Neither parents nor child care providers can solve the challenge of high child care costs on their own. The federal government, states, local communities, and the private sector must all play a larger role in helping families afford quality child care and creating enough child care to support economic growth.
• Welfare reform is forcing tens of thousands of Orange County parents back to work, yet the child care infrastructure, particularly the portion offering subsidized child care, is incapable of meeting their needs.
• Child care is becoming less affordable in relation to the cost of living in Orange County, as escalating housing costs consume a more and more disproportionate share of the household income of low- and moderate-income families.
• Orange County’s strong job growth in other low paying industries, albeit higher paying than child care, makes it difficult for child care programs to retain qualified child care workers or recruit new ones for expansion.
• Child care workforce retention and growth are threatened by the increasing gulf between the low wages of the child care industry and Orange County’s cost of living. Child care wages are not adequate to encourage long commutes from more affordable housing markets to child care centers in more affluent communities.
• The county’s low real estate vacancy rates and high land and development costs threaten the retention of existing licensed supply and create barriers to the continued growth of the industry.
54
Economic Benefits of Local Investment in the Child Care Industry To best address these factors, both child care advocates and economic development planners must be equipped with a firm understanding of the countywide benefits of investing in Orange County’s child care infrastructure:
• As with transportation policies and investments that relieve traffic congestion, local policies and investments that support the child care industry affect Orange County’s overall productivity and economic competitiveness.
• Appropriate, targeted investments in child care supply-building contributes to labor force participation gains among lower- and middle-income families in Orange County. Such gains directly increase output, personal income, business formation, and property and sales tax revenues in the county.
• The child care industry captures more than $120 million per year in federal and state child care subsidies for low-income working households in Orange County. Federal and state expenditures for child care are growing, but remain well below the amount needed to serve all eligible families. The county’s capture of these subsidies is directly related to its ability to expand the infrastructure of subsidized child care centers and programs.
• Increased utilization of non-parental child care helps Orange County residents capture increased levels of federal and state tax credits and deductions for child care expenditures.
• Investments in high quality child care services reduce local public sector expenditures on other service categories, and increase the quality of life for Orange County residents.
Strategies for Supporting the Care Industry Incorporating child care into economic development planning and investment takes concerted time and effort on the part of child care advocates and local leaders. Many jurisdictions across the country realize the value of child care to their economy and community well-being, and bring new partners to the table to tackle the child care shortage. While every community faces different obstacles in the delivery of child care services, a number of strategies have proven effective in more deeply integrating child care and the economic development planning process. The following are examples of efforts in other California communities to strengthen the child care infrastructure:
• The City of Bakersfield (Kern County) incorporated meaningful child care language into the city’s Consolidated Plan 2005. Child care is rated as a high priority and the city has committed to use Community Development Block Grant and other public funds to develop at least 10 licensed child care centers and/or family child care homes accommodating 1,500 children.
• Child care, for the first time, is a traffic mitigation measure in San Mateo County. The City/County Association of Governments for San Mateo County (C/CAG) adopted child care as a mitigation measure and incentive in the C/CAG Transportation Demand Management Program. The measure applies to all new large developments throughout the county.
• Ventura County changed their zoning ordinance to exempt large family child care facilities from permits and included the Commercial Office zone as allowable for
55
child care centers. Child care has also been included in Ventura County’s Consolidated Plan for 2000
• The Child Care Fund of Alameda County, created in 1999, offers loans, grants, technical assistance, and training to child care providers in the realm of both facilities development and business practices. The Child Care Fund optimizes existing resources and fills the gaps in services with resources and expertise of its own to bolster child care capacity in Alameda County.
• The Santa Cruz Community Credit Union tripled the size of its loan fund for child care providers during the past two years. The Credit Union now has $150,000 in loan funds, continues operating with an extremely low default rate, and is pursuing new funding sources in the amount of $300,000 -$500,000.
• The Kern County Local Investment in Child Care Project provides training workshops in both Spanish and English that assist child care providers in understanding fundamental business principles. To date, more than 400 participants have been trained in bookkeeping, understanding taxes, and marketing a child care business. These trainings are held in collaboration with the Small Business Development Center.
These efforts to strengthen the child care infrastructure benefit the child care industry, financing institutions, local government, and the business community alike. The collaborations developed between entities previously disengaged from child care issues serve to educate all of the stakeholders about the importance of a healthy child care infrastructure, and help to develop cost-effective solutions to local shortages in the supply of child care. The lack of accurate data available on the child care industry makes it difficult to assess its size and contribution to the economy. As a result, its significance to the health of local economy is largely unrecognized. The methodologies in this report represent the first serious effort at making such economic assessments of the child care field. Although more and better data on child care is needed, the analysis presented here demonstrates that child care is an essential part of the Orange County economic infrastructure, and efforts to strengthen the child care industry will result in a strengthening of the economy as a whole.
56
Appendix A Methodology for Calculating Gross Receipts and Employment for Licensed Child Care Because of the inaccuracy of traditional economic accounting tools that apply to child care, NEDLC and the four original LINCC counties created a sound methodology for measuring direct employment and gross receipts for the licensed child care field. This methodology utilizes up-to-date statistics on licensed child care facilities maintained by local Resource and Referral (R&R) Agencies. R&R’s are required by California law to maintain data on licensed child care capacity, and most record data on vacancy rates, from which enrollment can be derived. The NEDLC methodology outlined below generates the most accurate estimates of employment and gross receipts because it utilizes up-to-date information representing all forms of licensed child care. The data is derived from local child care resource and referral agency data on capacity, enrollment, and average tuition rates, based on age group and full- and part-time care. Gross Receipts For both family and center-based care, the estimates of gross receipts represent a “snapshot” of the industry taken at a particular time. It is important to note that counties capture gross receipts for licensed care only; adding unlicensed care would significantly increase the gross receipts figures. Family Child Care Homes Licensed Capacity x Vacancy Rate141 = Vacant Slots Licensed Capacity - Vacant Slots = Enrollment142 Enrollment x Average Cost/Child/Year = Gross Receipts Centers For centers, there are three separate calculations—for infant care, preschool care, and school-aged care. “Center-based care” in this case includes Head Start and State Preschool, nonprofit, school-affiliated, and proprietary centers. 141 Providers may be licensed for more children than they are actually willing to take; the number of vacancies refers to the actual number of slots that the provider would like to fill. For example, a provider licensed for 12 who cares for 8 children and would care for no more than 9 has 1 vacancy, not 4. 142 Actual enrollment may be different from the number of licensed slots due to children sharing slots. For example, in Santa Cruz County, there are 8,213 licensed slots serving 9,064 children. Because most counties do not have access to actual enrollment figures, this methodology was developed to approximate them.

57
Centers (cont’d) Licensed Capacity x Vacancy Rate = Vacant Slots Licensed Capacity - Vacant Slots = Enrollment Enrollment x Average Cost/Child/Year = Gross Receipts Direct Employment in Licensed Child Care Family Child Care Homes Family Child Care Homes licensed for 6 = 1 Employee Family Child Care Homes licensed for 12 = 2 Employees Centers Teaching Staff: These figures are calculated based on the number of hours a center is open, the number and ages of children for which a center is licensed, and the state-required ratio of staff to children under that license. In general, younger children require a lower staff-to-child ratio, so a center that cares for 12 infants will require 3-4 adults to care for those infants, whereas a center that cares for 12 school-aged children will require only one adult to care for those children. Multiply the average “FTE for Staff” by the number of staff required by licensing: # hours open/8 hours = FTE for Staff 1. Center-based infant care:
Accredited or Title V = (1 employee for every 3 children) x (FTE for staff) Title 22 = (1 employee for every 4 children) x (FTE for staff)
2. Center-based preschool care: Title V = (1 employee for every 8 children) x (FTE for staff) Title 22 = (1 employee for every 12 children) x (FTE for staff)
3. Center-based school-age: Title V/Title 22 = (1 employee for every 14 children) x (FTE for staff)
Non-Teaching Staff: Custodians/Cooks/Receptionists: Many centers fill these positions with teaching staff. Larger centers tend to have separate employees in these roles. Counties are the best judges of the general practices in their area. The following are suggested guidelines counties can utilize to maintain consistent estimates. Each slot except “Family Worker” can be considered full time.

58
Custodians: Typical practice is to have one custodian for every center over 80 children. Therefore, the formula is: # of centers with slots for more than 80 children = # of custodians Cooks: Typical practice is that state- funded centers and larger centers have cooks: # of state-funded centers + number of non-state funded centers with over 80 children = # of cooks Receptionists: Typical practice is to have one receptionist for every center over 80 Children: # of centers with slots for more than 80 children = # of receptionists Non-teaching supervisory staff (directors): Typical practice is to have one director for every 80 children: # of licensed slots / 80 = # of supervisory staff Family workers: Typical practice is that they are employed part-time (average 50% time) at state- funded centers: # of state-funded centers / 2 = # of family workers Administrative (off site): Typical practice is for larger centers to have off-site as well as on-site administrators: # of centers with slots for over 80 children = # of administrators.
59
Appendix B Explanation of IMPLAN Input-Output Model Estimates for the impact of child care services on indirect and induced earnings and other productivity effects are based on application of the California module of the IMPLAN Input-Output (I-O) model. This model was utilized by economist Steve Moss in The Economic Impact of the Child Care Industry In California, and the results obtained for the child care industry statewide were applied to Orange County in this report based on its share of children enrolled in licensed child care services and annual gross receipts. Initially developed for use by the U.S. Forest Service, IMPLAN is now used in many fields. It relies on the same basic model structure and underlying economic data as the U.S. Department of Commerce Bureau of Economic Analysis Regional Impact Modeling System (RIMS), the model that was used in the LINCC counties’ analyses. I-O models use area-specific data on industrial and commercial activity to trace how a dollar of investment moves through a specified economy. IMPLAN is based on a table of direct requirement coefficients which indicates the inputs of goods and services required to produce a dollar’s worth of output. Standard economic “production functions”—the capital, labor, and technology—needed to purchase a given set of goods determine how changes in demand for goods and services ultimately affect the demand for the inputs to these services. For example, producing a ton of steel may require three workers and a particular set of equipment, which would not be required if the steel were no longer needed. Likewise, child care programs must purchase educational materials, facilities, and professional staff services.
IMPLAN contains more than 500 economic sectors, and uses economic census data to compile county-level wage and salary information at the four-digit standard industrial code (SIC) level. National data are adjusted for the industrial and trading patterns for the subject region—in this case, California. Based on this structure, IMPLAN estimates the regional economic impact that would result from a dollar change in the output of local industries delivered to final demand (that is, to ultimate purchasers, such as consumers outside the region). Estimates for the impact of child care on the economy are based on three primary “multipliers,” as follows: • Direct effects: Effects introduced into the state’s economy as a result of spending on
child care services. • Indirect effects: Effects reflecting spending by workers and local vendors generated
by the direct effects. These effects result from a change (for example, an increase) in money spent by individuals or firms that incur direct impacts.
• Induced effects: Effects of consumption of primarily retail goods and services consumed by households directly and indirectly earning income from the project.

60
These effects reflect changes in the state’s economy caused by changes (for instance, increases) in spending patterns as a result of the direct and indirect activity.
The multiplier effect, identified as “Type II” in the IMPLAN model, estimates how many times a given dollar of investment will be spent as it works its way through the economy. Multipliers can be applied to various categories. For example, income multipliers—additional spending associated with every dollar of income—tend to be less than one. This is because not all income is spent; some is saved, or used to pay debt. Employment multipliers—the number of jobs created per million dollars of investment—can range from five to 65, depending on the activity. Alternatively, employment multipliers can relate to the number of indirect and induced jobs engendered by a dollar of investment in direct employment.
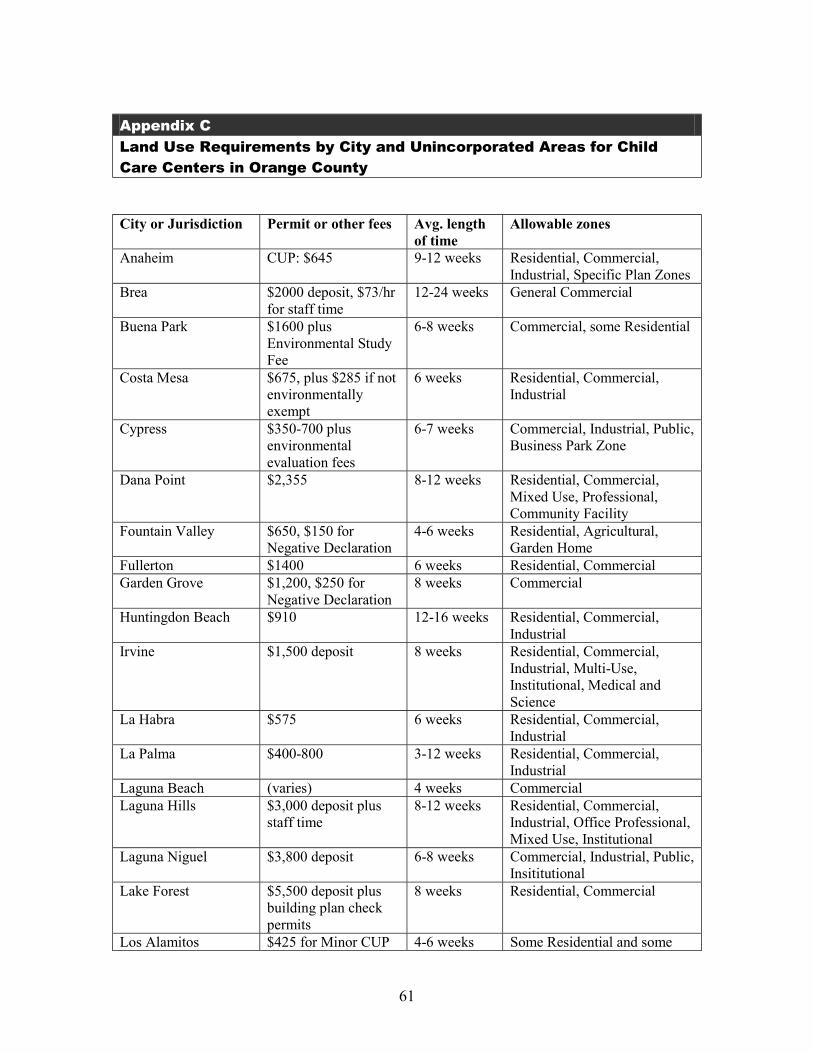
61
Appendix C Land Use Requirements by City and Unincorporated Areas for Child Care Centers in Orange County City or Jurisdiction Permit or other fees Avg. length
of time Allowable zones
Anaheim CUP: $645 9-12 weeks Residential, Commercial, Industrial, Specific Plan Zones
Brea $2000 deposit, $73/hr for staff time
12-24 weeks General Commercial
Buena Park $1600 plus Environmental Study Fee
6-8 weeks Commercial, some Residential
Costa Mesa $675, plus $285 if not environmentally exempt
6 weeks Residential, Commercial, Industrial
Cypress $350-700 plus environmental evaluation fees
6-7 weeks Commercial, Industrial, Public, Business Park Zone
Dana Point $2,355 8-12 weeks Residential, Commercial, Mixed Use, Professional, Community Facility
Fountain Valley $650, $150 for Negative Declaration
4-6 weeks Residential, Agricultural, Garden Home
Fullerton $1400 6 weeks Residential, Commercial Garden Grove $1,200, $250 for
Negative Declaration 8 weeks Commercial
Huntingdon Beach $910 12-16 weeks Residential, Commercial, Industrial
Irvine $1,500 deposit 8 weeks Residential, Commercial, Industrial, Multi-Use, Institutional, Medical and Science
La Habra $575 6 weeks Residential, Commercial, Industrial
La Palma $400-800 3-12 weeks Residential, Commercial, Industrial
Laguna Beach (varies) 4 weeks Commercial Laguna Hills $3,000 deposit plus
staff time 8-12 weeks Residential, Commercial,
Industrial, Office Professional, Mixed Use, Institutional
Laguna Niguel $3,800 deposit 6-8 weeks Commercial, Industrial, Public, Insititutional
Lake Forest $5,500 deposit plus building plan check permits
8 weeks Residential, Commercial
Los Alamitos $425 for Minor CUP 4-6 weeks Some Residential and some
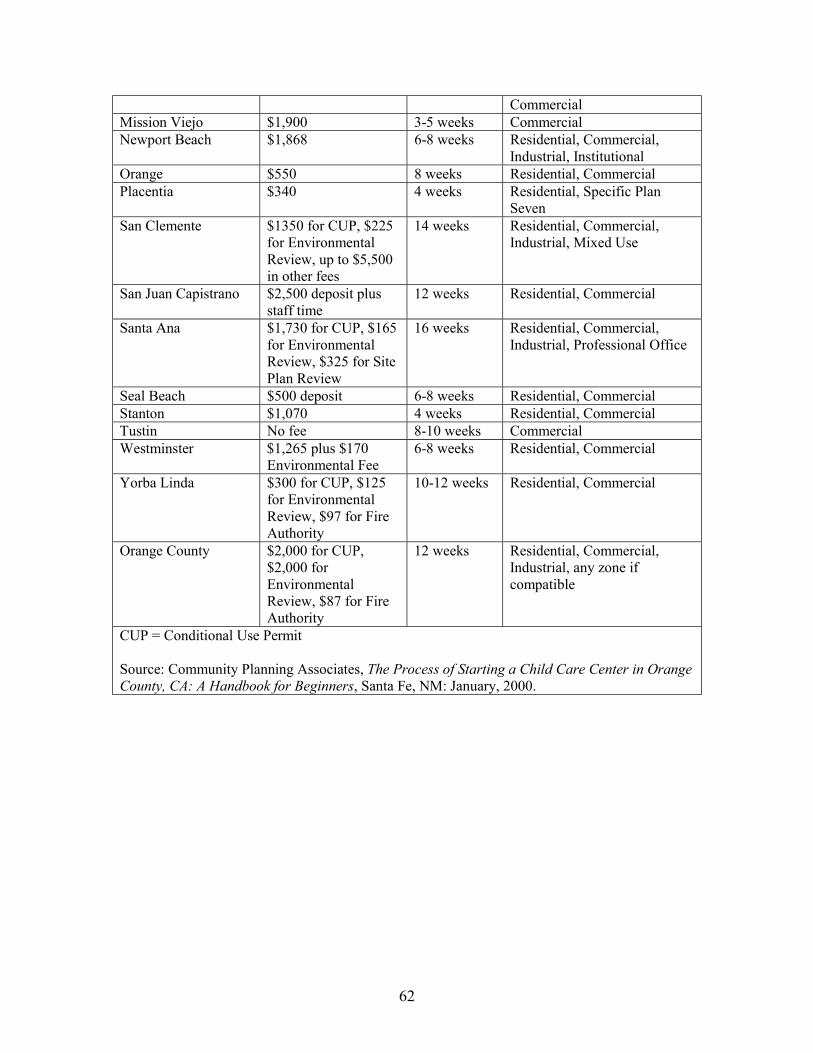
62
Commercial Mission Viejo $1,900 3-5 weeks Commercial Newport Beach $1,868 6-8 weeks Residential, Commercial,
Industrial, Institutional Orange $550 8 weeks Residential, Commercial Placentia $340 4 weeks Residential, Specific Plan
Seven San Clemente $1350 for CUP, $225
for Environmental Review, up to $5,500 in other fees
14 weeks Residential, Commercial, Industrial, Mixed Use
San Juan Capistrano $2,500 deposit plus staff time
12 weeks Residential, Commercial
Santa Ana $1,730 for CUP, $165 for Environmental Review, $325 for Site Plan Review
16 weeks Residential, Commercial, Industrial, Professional Office
Seal Beach $500 deposit 6-8 weeks Residential, Commercial Stanton $1,070 4 weeks Residential, Commercial Tustin No fee 8-10 weeks Commercial Westminster $1,265 plus $170
Environmental Fee 6-8 weeks Residential, Commercial
Yorba Linda $300 for CUP, $125 for Environmental Review, $97 for Fire Authority
10-12 weeks Residential, Commercial
Orange County $2,000 for CUP, $2,000 for Environmental Review, $87 for Fire Authority
12 weeks Residential, Commercial, Industrial, any zone if compatible
CUP = Conditional Use Permit Source: Community Planning Associates, The Process of Starting a Child Care Center in Orange County, CA: A Handbook for Beginners, Santa Fe, NM: January, 2000.