Embed Size (px)
Citation preview
The Economic Impact of Post-Secondary Education in Canada.
REPORT NOVEMBER 2014
Centre for Skills and Post-Secondary Education

To cite this report:Grant, Michael. The Economic Impact of Post-Secondary Education in Canada. Ottawa: The
Conference Board of Canada, 2014.
© 2014 The Conference Board of Canada* Published in Canada | All rights reserved | Agreement No. 40063028 | *Incorporated as AERIC Inc.
® The Conference Board of Canada and the torch logo are registered trademarks of The Conference Board, Inc. Forecasts and research often involve numerous assumptions and data sources, and are subject to inherent risks and uncertainties. This information is not intended as specific investment, accounting, legal, or tax advice.
Preface
This report analyzes the economic impact of post-secondary education (PSE) in Canada. It is one of three foundational studies by The Conference Board of Canada’s Centre for Skills and Post-Secondary Education. The report considers three kinds of economic impact: spending in the economy (either directly by PSE institutions or indirectly through tourism and other channels), human capital formation, and intellectual capital formation. The report develops a bottom-up approach to understanding impacts, from the PSE institutions to the broader economy.
The Economic Impact of Post-Secondary Education in Canada Michael Grant
For the exclusive use of Joseph Mior, [email protected], Fleming College.

AcknowledgementsThis report has been prepared by The Conference Board of Canada under the direction of Dr. Michael Bloom, Vice-President, Industry and Business Strategy, and Diana MacKay, Executive Director, Centre for Skills and Post-Secondary Education. The report was researched and written by Michael Grant, Director of Research, Industry and Business Strategy.
The author would like to thank Carl Amrhein, Michael Bloom, Diana MacKay, and Doug Watt for their advice and guidance. The author would also like to thank Mark Liew, Erin Butler, and Jessica Britcha for their assistance with the research. Thanks go, as well, to Pedro Antunes, Director of National and Provincial Forecasting, and Doris Chu, Senior Economist, for their work on the economic simulations. The author also thanks Gregory Hermus, Associate Director, and Silvia Kyomi Nishiguchi, Economist, with The Conference Board of Canada’s Canadian Tourism Research Institute (CTRI) for their contribution to the tourism impact research.
The report was reviewed internally by Dan Munro and Alison Howard. Thanks also go to the many supporters of the Centre for Skills and Post-Secondary Education for their comments. Dr. John Chant, Professor Emeritus, Economics, Simon Fraser University, also made helpful comments.
The report was prepared with financial support from the Centre for Skills and Post-Secondary Education, The Conference Board of Canada. Thanks are also due to the many stakeholders in the Centre’s work who read and commented on drafts of this report. Their helpful insights and feedback greatly contributed to it.
The findings and conclusions of this report are entirely those of The Conference Board of Canada. Any errors and omissions in fact or interpretation remain the sole responsibility of The Conference Board of Canada.
For more information about the Centre for Skills and Post-Secondary Education, please visit our website at www.conferenceboard.ca/spse.
© The Conference Board of Canada. All rights reserved. Please contact cboc.ca/ip with questions or concerns about the use of this material.

For the exclusive use of Joseph Mior, [email protected], Fleming College.
CONTENTS
i EXECUTIVE SUMMARY
1
4
5
Chapter 1 Introduction MethodAbout This Report
7
8
13
19
27
Chapter 2Understanding Post-Secondary Education Incentives The PSE Sector as Provincial Franchises Institutional Governance and ManagementStrategic ChoicesConclusion
29
31
41
48
Chapter 3Economic Footprint of Post-Secondary Institutions Direct Spending EffectsIndirect Spending ImpactsConclusion
50
52
57
62
65
Chapter 4PSE as a Human Capital Developer Evidence on Returns on Education The Educational Experience Employment and Returns on Education Conclusion
67
69
69
71
73
80
81
Chapter 5Universities as Intellectual Capital Developers Innovation and ImpactFrom Patent to PerformanceAssessing Canada’s PerformanceIncentives or Predisposition?The Multifactor Productivity ArgumentConclusion
Chapter 6 83 Conclusion
Appendix A 87 Bibliography
© The Conference Board of Canada. All rights reserved. Please contact cboc.ca/ip with questions or concerns about the use of this material.

For the exclusive use of Joseph Mior, [email protected], Fleming College.
Find this report and other Conference Board research at www.e-library.ca
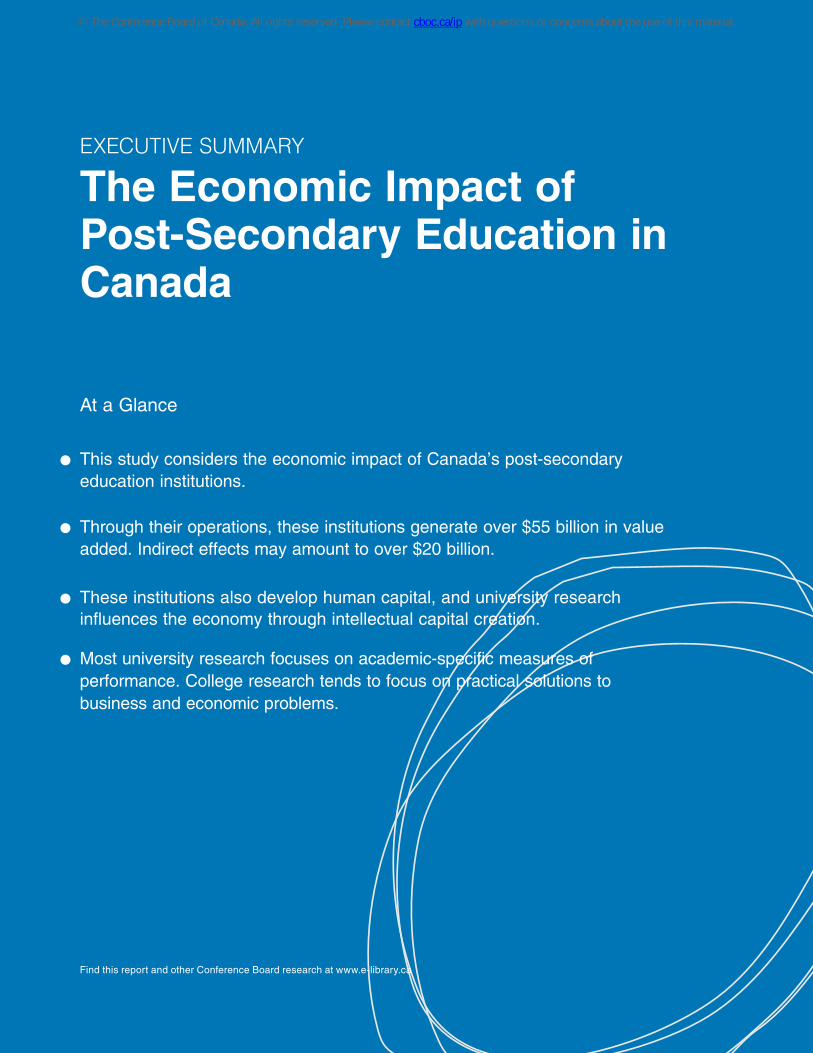
• This study considers the economic impact of Canada’s post-secondaryeducation institutions.
• Through their operations, these institutions generate over $55 billion in valueadded. Indirect effects may amount to over $20 billion.
• These institutions also develop human capital, and university researchinfluences the economy through intellectual capital creation.
• Most university research focuses on academic-specific measures ofperformance. College research tends to focus on practical solutions tobusiness and economic problems.
EXECUTIVE SUMMARY
The Economic Impact of Post-Secondary Education in Canada
At a Glance
© The Conference Board of Canada. All rights reserved. Please contact cboc.ca/ip with questions or concerns about the use of this material.
The Economic Impact of Post-Secondary Education in Canada
Find this report and other Conference Board research at www.e-library.ca ii
Canadian studies of the economic impact of post-secondary education (PSE) institutions face a common challenge: establishing a causal link between a post-secondary institution’s activities and value added in the broader economy. A national economy is highly complex and many factors determine why some economies do better than others. Those two factors make it very difficult to determine where the value of the PSE institution ends and value in the economy begins.
Strategic Choices Facing Canadian PSE Institutions
Although there is a broad-based consensus that Canada needs a
relatively large PSE sector, policy-makers are asking strategic questions
about how to maximize PSE institutions’ contribution to Canada’s
economy and society. These questions focus on how large the PSE
sector should be, how it should develop, what its operating models
should be, and how its effectiveness can be assessed.
PSE is a growth industry in Canada. The real GDP of Canada’s
universities and colleges grew by over 17 per cent between September
2007 and September 2013, and now stands at over $40 billion.1 Full-
time equivalent (FTE) enrolments in university increased from 665,098
in 1999–2000 to over 1 million in 2010–11 (including 660,723 full-time
Canadian bachelor’s students), while college FTE enrolments went from
436,035 to 576,919 over the same period.2 These increases far outpaced
growth in the Canadian population.
1 Statistics Canada, CANSIM table 379-0031.
2 Canadian Association of University Teachers, CAUT Almanac 2012–2013, 39; Statistics Canada, CANSIM table 477-0019.
For the exclusive use of Joseph Mior, [email protected], Fleming College.
Find this report and other Conference Board research at www.e-library.ca iii
Executive Summary | The Conference Board of Canada
Provincial governments have tended to limit operating grant funding
increases to the rate of inflation. Meanwhile, most collective bargaining
agreements have built-in annual cost increases well above inflation. For
instance, a recent report by the Ontario government noted that operating
grant funding would increase by 1.1 per cent “in the near future,” while
institutions’ costs were set to increase by 5 to 8 per cent per annum.3
PSE administrators have had to be innovative to make the numbers
work. Operating grant funding is unlikely to increase much in the short
to medium term. One way that PSE institutions have responded to
demographic change and operational grants limits is by enrolling more
international students. Over 10 per cent of the PSE student body is now
composed of international students and recent immigrants to Canada.
Economic Footprint
This report assesses the economic impact of PSE institutions, in terms
of both direct spending by the institutions and indirect spending that
occurs in the economy because of the institutions.
Over $40 billion in spending flows through Canada’s colleges and
universities each year, which generates over $55 billion in economic
activity—after multiplier effects. Almost 700,000 direct and indirect jobs
are attributable to spending by PSE institutions.
The Conference Board of Canada estimates that off-campus student
spending may generate a direct benefit to surrounding communities of
up to $17.5 billion—and perhaps as much as $20 billion, after multiplier
effects. Visitor spending associated with PSE institutions adds about $2
billion in economic impact.
3 Ontario Ministry of Training, Colleges and Universities, Ontario’s Proposed Differentiation Policy Framework, 3.
© The Conference Board of Canada. All rights reserved. Please contact cboc.ca/ip with questions or concerns about the use of this material.
The Economic Impact of Post-Secondary Education in Canada
Find this report and other Conference Board research at www.e-library.ca iv
Human Capital Impact
PSE institutions make a major contribution to developing people (“human
capital development”). The data show good returns for PSE. The net
present value of combined private and social returns for a Canadian
male who completes tertiary education is $220,365 over a lifetime
(consisting of $153,520 in private returns and $66,845 in social returns).
Meanwhile, Canadian females realize a total lifetime return of $158,026
($111,487 private return and $46,539 in social returns).4
However, Moussaly-Sergieh and Vaillancourt point out that obtaining a
degree is not always so rewarding. When PSE graduates are grouped
together, they clearly demonstrate good overall returns on investments in
education. Moussaly-Sergieh and Vaillancourt found that males investing
in an undergraduate degree can expect to see an annual return, in after-
tax earnings, of roughly 12 cents on the dollar, while female students
realize 14 cents per dollar. However, their disaggregated results show
much lower returns, especially for males who pursue bachelor’s degrees
in the humanities or master’s or PhD programs.5 Other studies point to
gains for graduates of college programs.
Intellectual Property Impact
In 2012, Canadian governments spent over $4.5 billion on PSE research,
primarily through major federal granting councils.
Canada’s PSE system performs well on generating ideas, publishing
ideas in academic journals, and having research cited. However, Canada
is weak in converting new ideas into new or better products and services
that improve Canadians’ lives. Part of the problem is that Canadian
universities have tended not to embrace the notion of applied research.
Doing so could help speed up and improve the outcomes of our
commercialization efforts. Here, business also has a major role to play.
4 The Conference Board of Canada, How Canada Performs: Return on Investment.
5 Moussaly-Sergieh and Vaillancourt, Extra Earning Power.
For the exclusive use of Joseph Mior, [email protected], Fleming College.
Find this report and other Conference Board research at www.e-library.ca v
Executive Summary | The Conference Board of Canada
Some economic impact studies of PSE institutions have argued that
university research spending generates multifactor productivity gains.
However, these studies assign multifactor productivity gains to research
without explaining the specific mechanisms by which research affects
productivity. This is not a convincing or reliable way to demonstrate the
economic value of research.
© The Conference Board of Canada. All rights reserved. Please contact cboc.ca/ip with questions or concerns about the use of this material.

For the exclusive use of Joseph Mior, [email protected], Fleming College.
Find this report and other Conference Board research at www.e-library.ca
• Researchers studying the economic impact of post-secondary education (PSE)institutions face challenges in disentangling the institutions’ effects from otherfactors that determine return on investment in PSE institutions.
• The studies often confuse average and marginal impacts.
• This study takes a comprehensive approach to understanding the economiccontribution of Canada’s PSE institutions.
CHAPTER 1
Introduction
Chapter Summary
© The Conference Board of Canada. All rights reserved. Please contact cboc.ca/ip with questions or concerns about the use of this material.
The Economic Impact of Post-Secondary Education in Canada
Find this report and other Conference Board research at www.e-library.ca 2
Canada’s post-secondary education (PSE) institutions make major contributions to Canada’s economy. For instance, recent studies have estimated the following annual economic impacts: over $4 billion by the University of Ottawa;1 $816 million by Camosun College in Victoria, B.C.;2 over $5 billion by McGill University;3 and $10 billion by the University of British Columbia (UBC).4 The study of UBC estimated a government expenditure multiplier of 10, meaning that British Columbia taxpayers receive a $10 benefit for every dollar of investment.
These impacts suggest a very large aggregated economic benefit,
since Canada currently has 333 recognized PSE institutions (excluding
theological schools and distance education institutes). These include
the following:
• just under 100 public universities and university colleges;5
• a much smaller mix of private non-profit universities and private
for-profit universities;
• 133 public colleges and institutes;6
• a much smaller mix of private non-profit colleges;
• a large number of private for-profit career colleges.
1 Díaz, Mercier, and Duarte, 2012 Economic Impact Study, 2.
2 Robison and Christophersen, Economic Contribution of Camosun College, 2.
3 SECOR, McGill University, 4.
4 Sudmant, The Economic Impact of the University of British Columbia, 3.
5 Canadian Information Centre for International Credentials.
6 Colleges and Institutes Canada.
For the exclusive use of Joseph Mior, [email protected], Fleming College.
Chapter 1 | The Conference Board of Canada
Find this report and other Conference Board research at www.e-library.ca 3
Canada has over 2 million full-time and part-time students. In 2009–10,
there were 1.2 million university students and 700,000 college students.7
However, researchers conducting PSE economic impact studies face
challenges. One is to establish a causal link between a PSE institution’s
activities and value added in the broader economy. Our national
economy is highly complex and it is difficult to determine where the value
of the PSE institution ends and value in the economy begins. In some
ways, Canada’s PSE institutions certainly contribute to economic growth;
at the same time, they are situated in an economy with many other
sources of wealth creation, including resources, stable governments, and
an enterprise culture. How do they interact and where are the economic
impacts generated?
Large impacts may stem from placing PSE institutions at the centre of
national economic wealth creation. If so, we would expect countries with
larger PSE sectors to have more per capita income—yet many countries
with equal or higher levels of per capita income than Canada actually
have smaller PSE sectors. According to the Organisation for Economic
Co-operation and Development (OECD), Canada had the 12th-highest
per capita income in the OECD in 2012, while its per student tertiary
spending was the third highest.8
It is well established that Canada faces fundamental challenges with
labour and multifactor productivity. Around the mid-1980s, a gap
developed between Canada and U.S. labour productivity growth rates.9
The gap widened up to the year 2000 and persists to this day. Likewise,
Canada has a weak track record on innovation. As explored in this
report, Canada does well on PSE-based metrics of innovation (such as
publications and citations) but poorly on innovation commercialization.
How might PSE contribute more to innovation and commercialization?
7 Canadian Association of University Teachers, CAUT Almanac 2012–13, 39.
8 OECD, Country Report.
9 The Conference Board of Canada, How Canada Performs.
© The Conference Board of Canada. All rights reserved. Please contact cboc.ca/ip with questions or concerns about the use of this material.
The Economic Impact of Post-Secondary Education in Canada
Find this report and other Conference Board research at www.e-library.ca 4
Economic impact studies tend to focus on average impacts as opposed
to incremental impacts (or marginal impacts), which may be more
relevant to determining strategies for optimal PSE growth. Thus, while on
average university graduates earn more than high school graduates, do
incremental enrollees do as well as the average enrollee? If innate ability
and ambition are normally distributed in the population, then at some
point further expansions in PSE enrolment face diminishing returns.10
Although there is a broad-based consensus that Canada needs a
relatively large PSE sector, policy-makers are asking strategic questions
about how to maximize PSE institutions’ contribution to Canada’s
economy and society. They are debating how large the PSE sector
should be, how it should develop, what its operating models should be,
and how its effectiveness can be assessed.
Economics as a social science deals with choice in a world of
constraints. Given Canada’s very high rate of PSE participation and
budgetary limitations, the current system may be pushing up against
its constraints. Increasingly, the discussion in Canada is evolving from
one about how to expand the system to one about its quality and
efficiency. For the most part, the higher education policies of Canadian
provinces and territories, the practices of individual PSE institutions, and
student choice combine to manage constraints. It is those policies and
practices that shape the direction of PSE institutions and, ultimately, their
economic impact.
Method
This study takes a bottom-up approach to understanding the economic
impacts of PSE and PSE institutions. It seeks to understand the
constraints and incentives at the institutional level, analyze how
decisions are made, and then project economic impacts.
10 Carneiro, Heckman, and Vytlacil, Understanding What Instrumental Variables.
For the exclusive use of Joseph Mior, [email protected], Fleming College.
Chapter 1 | The Conference Board of Canada
Find this report and other Conference Board research at www.e-library.ca 5
Given this approach, a key research method was structured interviews.
We conducted 25 structured interviews with senior executives of PSE
institutions across Canada, both colleges and universities. Additionally,
we incorporated insights from consultations and conversations with many
others in the PSE world. These helped us identify the key issues that
institutions face, and how they plan to maintain viability and relevance in
a world of constraints. These decisions affect a wide variety of policies
and practices, including enrolments, tuition pricing, financing, and
allocation of capital. We conducted a literature review to gain a better
understanding of these managerial choices.
Using The Conference Board of Canada’s proprietary economic models
and surveys, we generated estimates of economic impacts that flow
from PSE institutions as socio-economic enterprises. We conducted
supplementary analysis, based on the literature and secondary data
sources, to assess the human and intellectual capital impacts.
The analysis focuses on two major components of the PSE system—
universities and colleges. Due to data limitations, it does not
include analysis of the economic impact of private career colleges,
apprenticeship systems, and workplace training and development.
Subsequent studies will seek to identify the impacts of these parts of the
PSE system.
About This Report
This report is one of three foundational studies for the Centre on Skills
and Post-Secondary Education. (Companion reports deal with the issues
of policies, laws, and regulations governing PSE; and the state of skill
formation throughout PSE.)
Chapter 2 presents a conceptual overview of the PSE sector in Canada.
It outlines some of the challenges and incentives facing the individual
institutions, and develops a typology for understanding institutions’
strategic choices and a framework for understanding how they generate
economic impacts. Chapter 3 assesses the economic impacts of the
PSE sector as a socio-economic enterprise. Most of these impacts
© The Conference Board of Canada. All rights reserved. Please contact cboc.ca/ip with questions or concerns about the use of this material.
The Economic Impact of Post-Secondary Education in Canada
Find this report and other Conference Board research at www.e-library.ca 6
flow from direct and indirect spending. However, PSE institutions also
generate impacts and create economic value through the formation of
human capital (i.e., people) and intellectual capital, discussed in chapters
4 and 5. The study concludes with a discussion of some implications for
the direction of PSE policy at both the provincial and institutional levels.
For the exclusive use of Joseph Mior, [email protected], Fleming College.
Find this report and other Conference Board research at www.e-library.ca
• PSE is a growth industry in Canada.
• The real GDP of Canada’s universities and colleges grew by over 17 per centbetween 2007 and 2013.
• Most PSE institutions in Canada operate like franchises of the provincialgovernments, which license them and play a key role in funding them.
• Many PSE institutions face strategic challenges resulting from slow-growingrevenues and increasing costs.
CHAPTER 2
Understanding Post-Secondary Education Incentives
Chapter Summary
© The Conference Board of Canada. All rights reserved. Please contact cboc.ca/ip with questions or concerns about the use of this material.
The Economic Impact of Post-Secondary Education in Canada
Find this report and other Conference Board research at www.e-library.ca 8
PSE is a growth industry in Canada. The real GDP of Canada’s universities and colleges grew by over 17 per cent between September 2007 and September 2013 and now stands at over $40 billion.1 Full-time equivalent (FTE) enrolments in university increased from 665,098 in 1999–2000 to over 1 million in 2010–11 (including 660,723 full-time Canadian bachelor’s students), while college FTE enrolments went from 436,035 to 576,919 during the same period.2 These increases far outpaced growth in the Canadian population.
Canada’s universities and colleges face a number of constraints that
shape their capacity to educate and to conduct research. Individual
institutions are constrained by their history and their current operating
realities. Government policies, laws, and regulations (PLRs) also provide
a context for the decisions of Canada’s PSE institutions. This chapter
explores the strategic positioning of Canada’s PSE institutions and
their constraints. The strategic positioning of individual institutions and
their management within their constraints ultimately determine their
economic impact.
The PSE Sector as Provincial Franchises
Canada’s PSE sector functions much like a “franchise” business, with
the provincial government acting as franchisor and the institutions as
franchisees. Public and private PSE institutions are created by provincial
governments through charters and/or specific legislation. These founding
1 Statistics Canada, CANSIM table 379-0031.
2 Canadian Association of University Teachers, CAUT Almanac 2012–13, 39;Statistics Canada, CANSIM table 477-0019.
For the exclusive use of Joseph Mior, [email protected], Fleming College.
Chapter 2 | The Conference Board of Canada
Find this report and other Conference Board research at www.e-library.ca 9
documents set out the core mission of the institutions. Institutional
franchisees then work within provincial PLRs to devise strategies to
achieve their mission. Some of them also plan for growth.
Provinces and territories set up new PSE franchises in response to their
assessment of demand, specifically the demand for teaching services.
Most students are drawn from regional or local areas, so the franchise
operates in a kind of catchment area. For instance, the University of
Toronto attracts about 80 per cent of its undergraduate class from the
Greater Toronto Area.3 (This percentage may vary somewhat for PSE
institutions in less populated areas.) Provinces and territories award
franchises exclusive licences to confer diplomas and degrees, which are
key to marketing their educational services.
Provincial governments carefully manage the number of franchisees. On
one hand, this restricts competition. On the other hand, it may actually
introduce new competition. For instance, an Alberta-based university
administrator told us how the conversion of colleges to universities
significantly reduced the number of college transfers into universities.4
Another administrator, in Nova Scotia, argued that the province had too
many universities for the anticipated number of students emerging from
high school.
Provincial governments typically start with a logical organization of the
marketplace, assigning specific roles to institutes (specialized applied
learning), colleges (a broader range of applied learning), teaching
universities (focus on academic teaching), and research universities
(academic instruction and research). Over time, individual PSE
institutions evolve in response to market demand or strategic leadership.
Colleges seek to offer degrees like universities do. Universities develop
applied programs in, for example, business administration. The provincial
3 Author’s notes from the meeting of the National Vice-Presidents’ Academic Council, the Canadian Association of University Business Officers (CAUBO), and The Conference Board of Canada’s Quality Network for Universities at Kwantlen Polytechnic University, October 18, 2013.
4 Telephone interview by Michael Grant, December 13, 2013.
© The Conference Board of Canada. All rights reserved. Please contact cboc.ca/ip with questions or concerns about the use of this material.
The Economic Impact of Post-Secondary Education in Canada
Find this report and other Conference Board research at www.e-library.ca 10
government franchisor is constantly faced with requests from the
institutions to change their mandate as they seek to remain relevant to
the market.
Provincial governments typically fund the construction of new campuses.
They then provide significant ongoing operating grant income and
occasional capital grants. At the federal level, the three major research
granting councils (the Natural Sciences and Engineering Research
Council, the Canadian Institutes of Health Research, and the Social
Sciences and Humanities Research Council) fund the lion’s share of
university research activity. In addition, federal programs help pay some
of the added infrastructure costs associated with expanded research
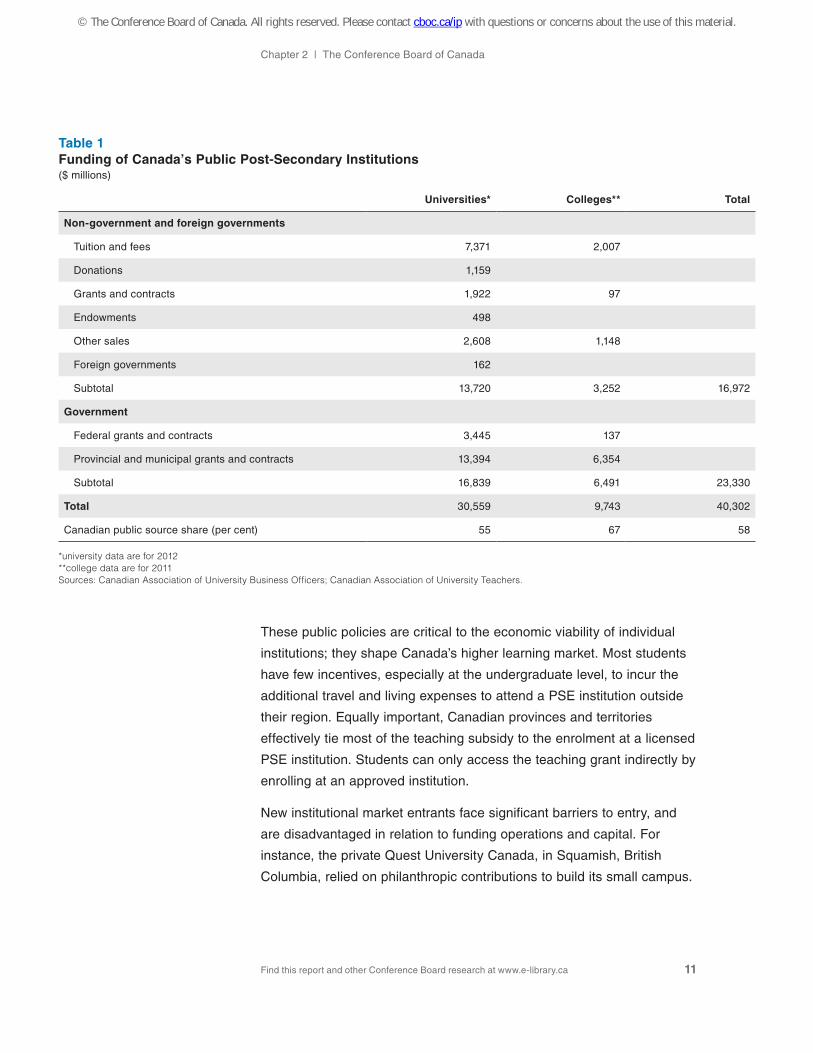
activities. All told, governments account for between 55 and 67 per cent
of the funding for universities and colleges. (See Table 1.)
Colleges’ and universities’ enrolment-based operating grants dwarf
research funding by a factor of 15 to 1. (Ratios vary among institutions.)
However, provinces and territories differ markedly in their approach to
operating grant funding, as seen in funding formulae. Funding formulae
translate enrolments into revenue streams, and they vary the teaching
subsidy by discipline and year of study. PSE institutions partly base
their adjustments to programs and admission requirements on funding
formulae. Depending on its funding formula, an institution may be
encouraged to either restrict or expand enrolment.
The funding formulae also reflect the provincial approach to ensuring
the appropriate mix between private and public funding. For instance,
in 2011, Ontario’s universities received about 46 per cent of their
operating revenue in the form of tuition, while those in neighbouring
Quebec received just over 24 per cent that way. This is pertinent to
PSE institutions’ incentives to be creative in finding funding sources and
pricing their teaching services.
For the exclusive use of Joseph Mior, [email protected], Fleming College.
Chapter 2 | The Conference Board of Canada
Find this report and other Conference Board research at www.e-library.ca 11
Table 1Funding of Canada’s Public Post-Secondary Institutions ($ millions)
Universities* Colleges** Total
Non-government and foreign governments
Tuition and fees 7,371 2,007
Donations 1,159
Grants and contracts 1,922 97
Endowments 498
Other sales 2,608 1,148
Foreign governments 162
Subtotal 13,720 3,252 16,972
Government
Federal grants and contracts 3,445 137
Provincial and municipal grants and contracts 13,394 6,354
Subtotal 16,839 6,491 23,330
Total 30,559 9,743 40,302
Canadian public source share (per cent) 55 67 58
*university data are for 2012 **college data are for 2011 Sources: Canadian Association of University Business Officers; Canadian Association of University Teachers.
These public policies are critical to the economic viability of individual
institutions; they shape Canada’s higher learning market. Most students
have few incentives, especially at the undergraduate level, to incur the
additional travel and living expenses to attend a PSE institution outside
their region. Equally important, Canadian provinces and territories
effectively tie most of the teaching subsidy to the enrolment at a licensed
PSE institution. Students can only access the teaching grant indirectly by
enrolling at an approved institution.
New institutional market entrants face significant barriers to entry, and
are disadvantaged in relation to funding operations and capital. For
instance, the private Quest University Canada, in Squamish, British
Columbia, relied on philanthropic contributions to build its small campus.
© The Conference Board of Canada. All rights reserved. Please contact cboc.ca/ip with questions or concerns about the use of this material.
The Economic Impact of Post-Secondary Education in Canada
Find this report and other Conference Board research at www.e-library.ca 12
It receives no operating or capital grants from the province. Privately
funded degree-granting institutions are still very rare in Canada, although
they are much more common in the United States.
Although incumbent PSE institutions benefit considerably from
their exclusive franchisee relationship to the provincial government,
this relationship comes with a level of governmental oversight and
involvement that some PSE senior administrators find challenging.
Provincial governments attempt to influence PSE institutional choices
through funding policies and the direct regulation of programs
and practices.
For instance, the interviews for this study revealed a wide variety
of provincial policies, laws, and regulations that shape institutional
incentives. Thus, in British Columbia, institutions require prior ministerial
approval to borrow and cannot run an operating deficit. Meanwhile, in
Quebec, institutions are allowed to borrow but face severe restrictions
on the tuition they can charge students. Other PSE institutions noted
that product innovation (in terms of new programs) required ministerial
approval. The process of introducing new degree programs is especially
arduous. These policies tend to restrict the incentives for institutions
to innovate.
Since the 2008–09 credit crisis and subsequent recession, governments
have faced a difficult fiscal environment. These circumstances
encourage them to rationalize their franchise structure to improve
its financial sustainability. For instance, in September 2013, Ontario
proposed a Differentiation Policy Framework. The framework requires
PSE institutions to submit data that will allow the Ministry of Training,
Colleges and Universities to assess “how institutions see themselves,
what makes them distinctive, where they are headed (e.g., planned
areas of focus), how they will get there (e.g., strategic enrolment plans,
program prioritization and resource re-allocations), and metrics relevant
For the exclusive use of Joseph Mior, [email protected], Fleming College.
Chapter 2 | The Conference Board of Canada
Find this report and other Conference Board research at www.e-library.ca 13
to holding themselves accountable.”5 This assessment will feed into
strategic mandate agreements (SMAs) between the Ministry and the
PSE institutions.
Institutional Governance and Management
Despite a high degree of provincial governmental funding, Canada
still maintains a tradition of higher education autonomy, particularly at
the university level. Provincial governments may lay out their priorities
through annual letters to the institutions. In Ontario, the Minister of
Training, Colleges and Universities requires universities and colleges
to submit their strategic mandates, with an eye toward negotiating
these with each institution. However, the legislation that creates PSE
institutions usually establishes their autonomy from government.
Ministerial influence depends on the nature of the governing legislation
and the relative size and influence of the institution in question, as
well as the degree of its dependence on government funding. Some
institutions develop non-governmental revenue sources (through
endowments and corporate or foundation funding for research), which
reduce their dependence on provincial government funding and control.
Moreover, operating grant funding is rarely cut because governments
want to be seen to be committed to higher learning. Governmental
control of the higher learning market protects some institutions from
competition, which further bolsters their position. Many of Canada’s
PSE institutions have more applicants than spaces for some of
their programs.
PSE institutions in Canada are usually non-profit organizations.
This means that institutional governance need not concern itself
with generating a return to the provider of equity capital (effectively,
the provincial government). This leaves PSE boards and senior
administrators free to allocate resources without shareholder
5 Ontario Ministry of Training, Colleges and Universities, Ontario’s Proposed Differentiation Policy Framework, 6.
© The Conference Board of Canada. All rights reserved. Please contact cboc.ca/ip with questions or concerns about the use of this material.
The Economic Impact of Post-Secondary Education in Canada
Find this report and other Conference Board research at www.e-library.ca 14
interference. In publically listed companies, there is a tension between
shareholders (as represented by the board) and senior management.
However, in a typical Canadian PSE institution, provincial regulators,
governing boards, senior administrators, faculty and students play a role
in deciding resource allocations, which can be a highly political process.
Institutional governance is central to the choices that PSE institutions
make, which is the essence of their economics. Depending on the
province or territory, governance has varying degrees of political,
academic, and community influence on institutional strategies. Bicameral
governance, with separate bodies for institutional and academic
governance (typically through a senate), is common among Canada’s
universities. Colleges tend toward a unicameral board of governors,
often with appointees coming directly from the relevant provincial or
territorial ministry. Faculty committees play a role in quality management
and program development, but are not part of the formal governance
structure of the institution.
At the managerial level, the role of central administration versus
academic faculties differs across PSE institutions. In the U.S. context,
Lombardi and others have distinguished between a university’s
administrative shell and the academic core.6 The administrative shell
exists to present the university to the outside world, and to market
the university to both public and private funders. Moreover, the shell
operates as a shared service organization that provides registration,
marketing, accounting, computing, publishing, and library services to the
academic core.
The academic core is largely responsible for teaching and research
quality. Academics are organized into departments and faculties with
shared notions of academic excellence. They reinforce these shared
notions through their control of faculty recruitment and promotion, course
offerings, teaching, and research. The degree of influence of academics
versus administrators varies among PSE institutions. Departments that
are more successful at fundraising are more likely to be given latitude to
6 Lombardi and others. University Organization, Governance, and Competitiveness.
For the exclusive use of Joseph Mior, [email protected], Fleming College.
Chapter 2 | The Conference Board of Canada
Find this report and other Conference Board research at www.e-library.ca 15
control their teaching and research. This speaks to the incentives within
PSE institutions to pursue certain kinds of strategies that generate an
economic impact.
Internal budgeting also creates different incentives. At some PSE
institutions, administrators make most of the internal resource allocation
decisions, sometimes based on historical precedent. Other institutions
have moved toward decentralized funding models, which give faculties
and departments direct incentives to attract their own students and
research funding. An Ontario university administrator told us that they
allocate 50 per cent of new program revenue directly to the innovating
department.7 These internal resource allocation systems help explain the
market or internal focus of the institutions and their faculties.
A Western-based senior PSE administrator noted that academic
governance resulted in conservative approaches to institutional decision-
making.8 She argued that academic culture was naturally sceptical
and that that skepticism often results in institutional inertia. Although
academics are generally in favour of adding new programs, they are
reluctant to cut under-subscribed courses. She further noted that a
tenured faculty had relatively few incentives to engage in institutional
innovation. Most of the innovation effort is focused on specific research
problems. All this acts as a brake on institutional innovation. In addition,
governmental market management further encourages a gradualist
approach to institutional change.
That is not to suggest that Canada’s PSE institutions do not innovate
their product offering. Some enterprising deans and faculty members
take an interest in the relevance and growth of their departments. It is
common for institutions to acknowledge product innovation, at least in
an indirect way, through departmental funding. Depending on the nature
of internal accounting, innovative departments are in a better position to
hire faculty and support staff, conduct supplementary teaching activities
(such as off-campus experiential learning and research missions),
7 Telephone interview by Michael Grant, January 8, 2014.
8 Telephone interview by Michael Grant, December 6, 2013.
© The Conference Board of Canada. All rights reserved. Please contact cboc.ca/ip with questions or concerns about the use of this material.
The Economic Impact of Post-Secondary Education in Canada
Find this report and other Conference Board research at www.e-library.ca 16
improve office space, and the like. Academic departments do, therefore,
have some indirect incentive to increase enrolment through product
innovation and quality delivery.
New program development at Ontario colleges provides evidence of
innovation. From January 2012 to October 2013, the Ontario Ministry
of Training, Colleges and Universities approved 164 new college-level
programs.9 These programs focus on applied education and training,
and cover everything from digital film production (Sault College) and
retirement residence management (Fanshawe College) to aquaculture
trades (Fleming College).
An Ontario-based university administrator suggested that, at the
university level, the funding formula favours expansion of relatively
low-cost programs.10 She cited a creative industry managerial program
that would be costly to deliver because of the need for specialized
equipment. The economics of such new programs is difficult to justify
when the university cannot recoup the higher cost in either greater tuition
or higher operating grants.
However, provincial governments’ restrictions on competition may
reduce incentives to innovate in programs or pedagogy, as students
have few choices. This is especially true in growing urban centres.
For instance, a college administrator told us that in large urban areas
such as Vancouver, there is always excess demand for college places
and therefore little need to engage in competitive behaviour.11 College
administrators, in this case, did not see themselves as participating in a
competitive market.
It is also worthwhile noting that the PSE sector, like the public sector,
is highly unionized and therefore constrained by collective bargaining
agreements. As such, faculty constrain senior administrators through
two mechanisms. First, bicameral governance ensures faculty have a
9 Cambrian College, Strategic Enrolment Report 2013–14, 6–9.
10 Telephone interview by Michael Grant, January 8, 2014.
11 Telephone interview by Michael Grant, December 18, 2013.
For the exclusive use of Joseph Mior, [email protected], Fleming College.
Chapter 2 | The Conference Board of Canada
Find this report and other Conference Board research at www.e-library.ca 17
powerful influence over the pace and direction of growth and existing
resource allocations. Second, collective bargaining imposes costs on the
PSE institution that it must fund through internal resources. When asked
why PSE institutions don’t take a more aggressive stance in collective
bargaining, a number of interviewees responded that the reputational risk
was far too high to justify the pursuit of risky negotiating tactics.
Within the funding structure, each institution commits to a strategy.
One way to differentiate these strategies is by the extent to which the
institution seeks to directly affect the surrounding economy. Institutions
can be mapped on two planes, one that gauges the extent to which
they define their mission in terms of the application of knowledge
and a second that does so in terms of the concrete demonstration of
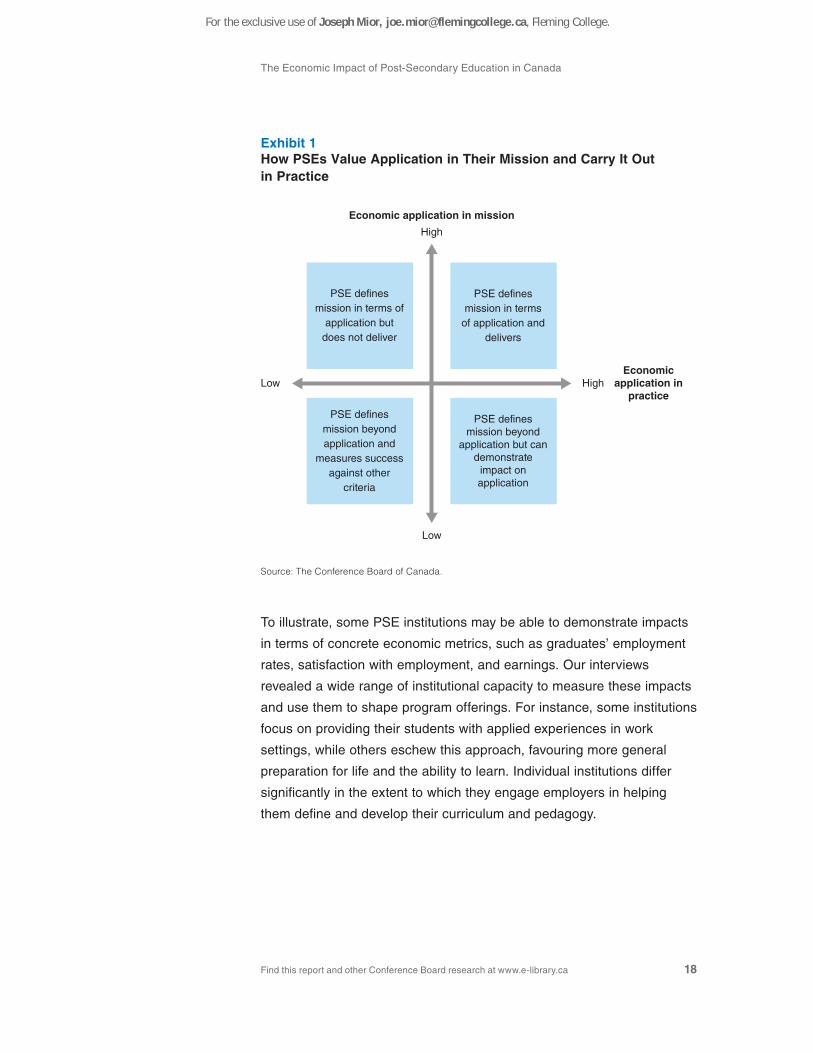
application. (See Exhibit 1.) Clearly, colleges, polytechnic institutes,
career colleges, and the like are strategically positioned in the upper part
of Exhibit 1, yet may differ in their effectiveness.
Meanwhile, universities tend to see themselves in the bottom half
of the exhibit. Universities generally define their mission in terms of
advanced—often primary or theoretical—research and high-level
skill development (e.g., critical thinking skills that are not specific to
a particular job). Yet individual universities, and even faculties within
universities, differ in this regard because some act as training grounds
for professions, such as physicians, lawyers, engineers, accountants,
computer scientists, teachers, and business managers, and therefore are
highly applied. Some institutions have very tight working relationships
with the professional licensing bodies that allow graduates to practise.
These same licensing bodies act as gatekeepers to the professions and
constrain labour market competition.
A minority of universities focus their research on applied solutions.
Thus, in practice, some universities may be almost as applied as
community colleges, albeit at an advanced level. The demonstration of
the application of knowledge through skills development and research
makes it easier to show the wider economic impact of PSE institutions
beyond the flow of funds through the institution.
© The Conference Board of Canada. All rights reserved. Please contact cboc.ca/ip with questions or concerns about the use of this material.
The Economic Impact of Post-Secondary Education in Canada
Find this report and other Conference Board research at www.e-library.ca 18
To illustrate, some PSE institutions may be able to demonstrate impacts
in terms of concrete economic metrics, such as graduates’ employment
rates, satisfaction with employment, and earnings. Our interviews
revealed a wide range of institutional capacity to measure these impacts
and use them to shape program offerings. For instance, some institutions
focus on providing their students with applied experiences in work
settings, while others eschew this approach, favouring more general
preparation for life and the ability to learn. Individual institutions differ
significantly in the extent to which they engage employers in helping
them define and develop their curriculum and pedagogy.
Exhibit 1How PSEs Value Application in Their Mission and Carry It Outin Practice
Economic application in mission
Economic application in
practice
PSE defines mission beyond
application but can demonstrate
impact on application
PSE defines mission beyond application and
measures success against other
criteria
PSE defines mission in terms
of application and delivers
PSE defines mission in terms of
application but does not deliver
High
Low
Low High
Source: The Conference Board of Canada.
For the exclusive use of Joseph Mior, [email protected], Fleming College.
Chapter 2 | The Conference Board of Canada
Find this report and other Conference Board research at www.e-library.ca 19
On the research side, institutions sometimes point to licensing revenue
and patents as evidence of economic impact. However, institutions that
see themselves in the knowledge generation and dissemination business
may prefer to measure success by academic gauges that may or may
not produce a direct economic impact, such as academic citations or
enrolments. Of necessity, these institutions tend to make a more general
case for public support, either on social grounds or complex economic
grounds (like contribution to multifactor productivity).
These links are important because of public and student support for
PSEs. If these stakeholders define outcomes in terms of concrete
economic metrics, such as employment and commercialized innovation,
then PSE institutions may evolve in the direction desired by their funders.
However, some institutions may have problems adjusting if they define
their mission differently, hence the debate on the “corporatization” of
higher education. In this context, it is worth noting that PSE institutions
have only recently become a large, widespread service, after centuries
as relatively small, elite institutions. This mass/elitist dichotomy is
one core aspect of the debate, both within PSE institutions and in the
public arena.
Much of the strategy discussion in Canada is about the degree to which
PSE institutions should be assessed according to concrete economic
impacts or their role in generating knowledge, or both.
Strategic Choices
Several PSE senior administrators interviewed for this study pointed
to a key financial challenge resulting from limits to government
funding coupled with rising costs associated with collective bargaining
agreements. Most provincial governments have limited their operating
grant funding increases to the rate of inflation. Meanwhile, collective
bargaining agreements have built-in annual cost increases well above
inflation. For instance, a recent report by the Ontario government noted
that “in the near future,” operating grant funding would increase by
© The Conference Board of Canada. All rights reserved. Please contact cboc.ca/ip with questions or concerns about the use of this material.
The Economic Impact of Post-Secondary Education in Canada
Find this report and other Conference Board research at www.e-library.ca 20
1.1 per cent, while institutions’ costs were set to increase by 5 to 8 per
cent per annum.12 This means that PSE administrators have had to be
innovative to make the numbers work.
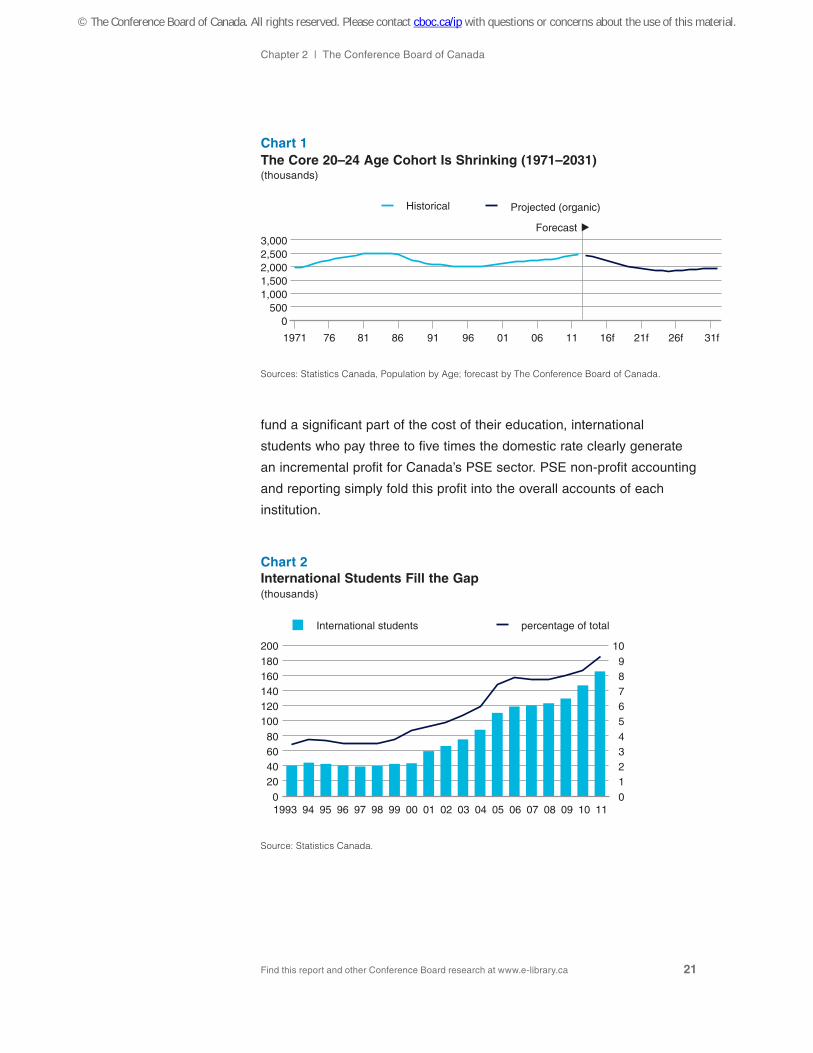
Operating grant funding is unlikely to increase much in the short to
medium term, because the baby boom echo cohort has largely moved
through the system. The size of the core 20 to 24 age cohort, from
which most PSE students are drawn, is about to decline. (See Chart
1.) There are two important exceptions, however. First, the Aboriginal
youth population is increasing, and it is experiencing greater success in
moving from high school to PSE. To improve outcomes further, additional
efforts to support Aboriginal student enrolment and success will be
required. Second, new immigrants to Canada represent a growing share
of the 20 to 24 age cohort. In 1977, recent immigrants (those who had
immigrated within the last five years) accounted for around 3 per cent
of the 20 to 24 year age cohort, but today that figure is closer to 10 per
cent.13 This creates a challenge for colleges and universities, which
may need to incur higher costs to accommodate this age cohort by, for
instance, offering English as a second language (ESL) courses or other
supplementary services to ensure that new Canadians can function well
at the PSE level.
One of the main ways that PSE institutions have responded to
demographic change and operational grants limits is by enrolling more
international students. (See Chart 2.) Not only does this address the
demographic reality of limited domestic student head count but, equally
important, it partly frees institutions from their government-imposed
tuition constraints.14 Where allowed by government, PSE institutions
typically charge two to five times domestic tuition rates to international
students. (See Table 2.) Given that, on average, Canadian PSE students
12 Ontario Ministry of Training, Colleges and Universities, Ontario’s Proposed Differentiation Policy Framework, 3.
13 Statistics Canada, Population by Sex and Age Group.
14 Our interviews revealed that provincial policies on international student tuition differ. Some provinces place no constraints on it, some regulate the level of it, and others regulate the percentage increase in it. All told, however, international student tuition is less regulated than tuition for Canadian-born and landed immigrant students.
For the exclusive use of Joseph Mior, [email protected], Fleming College.
Chapter 2 | The Conference Board of Canada
Find this report and other Conference Board research at www.e-library.ca 21
fund a significant part of the cost of their education, international
students who pay three to five times the domestic rate clearly generate
an incremental profit for Canada’s PSE sector. PSE non-profit accounting
and reporting simply fold this profit into the overall accounts of each
institution.
Chart 1The Core 20–24 Age Cohort Is Shrinking (1971–2031)(thousands)
1971 76 81 86 91 96 01 06 11 16f 21f 26f 31f
0500
1,0001,5002,0002,5003,000
Historical Projected (organic)
Forecast
Sources: Statistics Canada, Population by Age; forecast by The Conference Board of Canada.
Chart 2International Students Fill the Gap (thousands)
1993 95 97 99 01 03 05 07 09 1194 96 98 00 02 04 06 08 100
20406080
100120140160180200
0123456789
10
International students percentage of total
Source: Statistics Canada.
© The Conference Board of Canada. All rights reserved. Please contact cboc.ca/ip with questions or concerns about the use of this material.
The Economic Impact of Post-Secondary Education in Canada
Find this report and other Conference Board research at www.e-library.ca 22
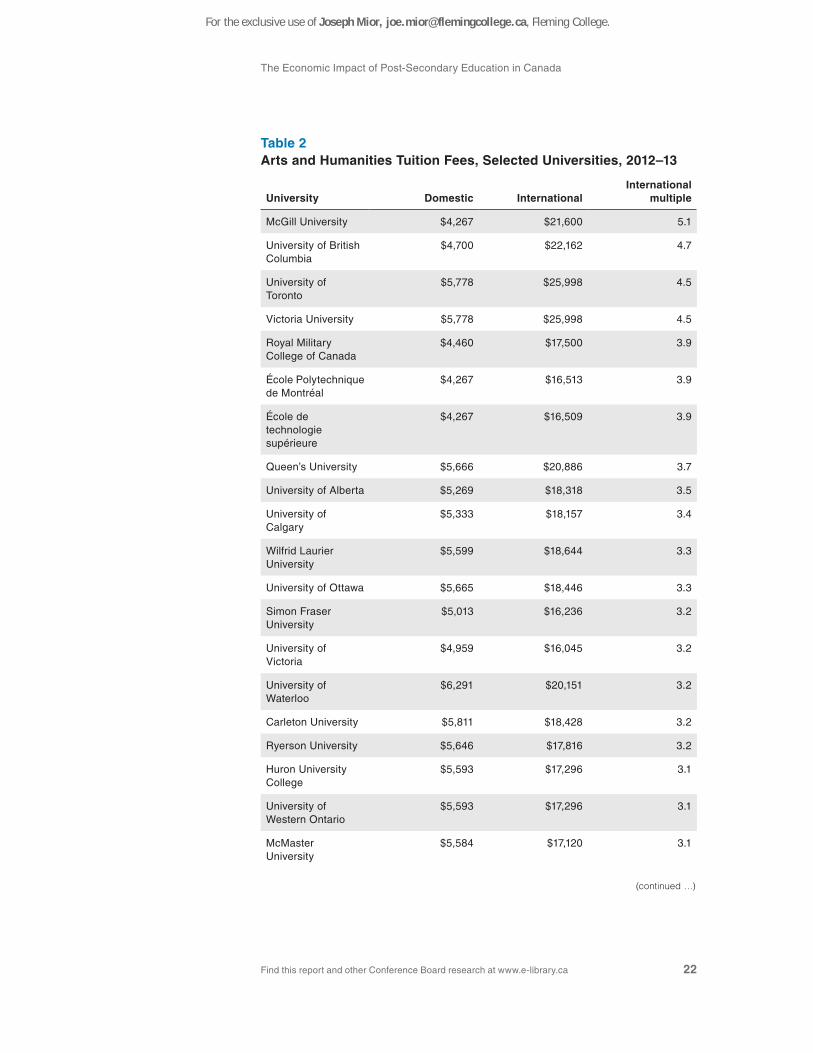
Table 2Arts and Humanities Tuition Fees, Selected Universities, 2012–13
University Domestic International International
multiple
McGill University $4,267 $21,600 5.1
University of British Columbia
$4,700 $22,162 4.7
University of Toronto
$5,778 $25,998 4.5
Victoria University $5,778 $25,998 4.5
Royal Military College of Canada
$4,460 $17,500 3.9
École Polytechnique de Montréal
$4,267 $16,513 3.9
École de technologie supérieure
$4,267 $16,509 3.9
Queen’s University $5,666 $20,886 3.7
University of Alberta $5,269 $18,318 3.5
University of Calgary
$5,333 $18,157 3.4
Wilfrid Laurier University
$5,599 $18,644 3.3
University of Ottawa $5,665 $18,446 3.3
Simon Fraser University
$5,013 $16,236 3.2
University of Victoria
$4,959 $16,045 3.2
University of Waterloo
$6,291 $20,151 3.2
Carleton University $5,811 $18,428 3.2
Ryerson University $5,646 $17,816 3.2
Huron University College
$5,593 $17,296 3.1
University of Western Ontario
$5,593 $17,296 3.1
McMaster University
$5,584 $17,120 3.1
(continued …)
For the exclusive use of Joseph Mior, [email protected], Fleming College.
Chapter 2 | The Conference Board of Canada
Find this report and other Conference Board research at www.e-library.ca 23
University Domestic International International
multiple
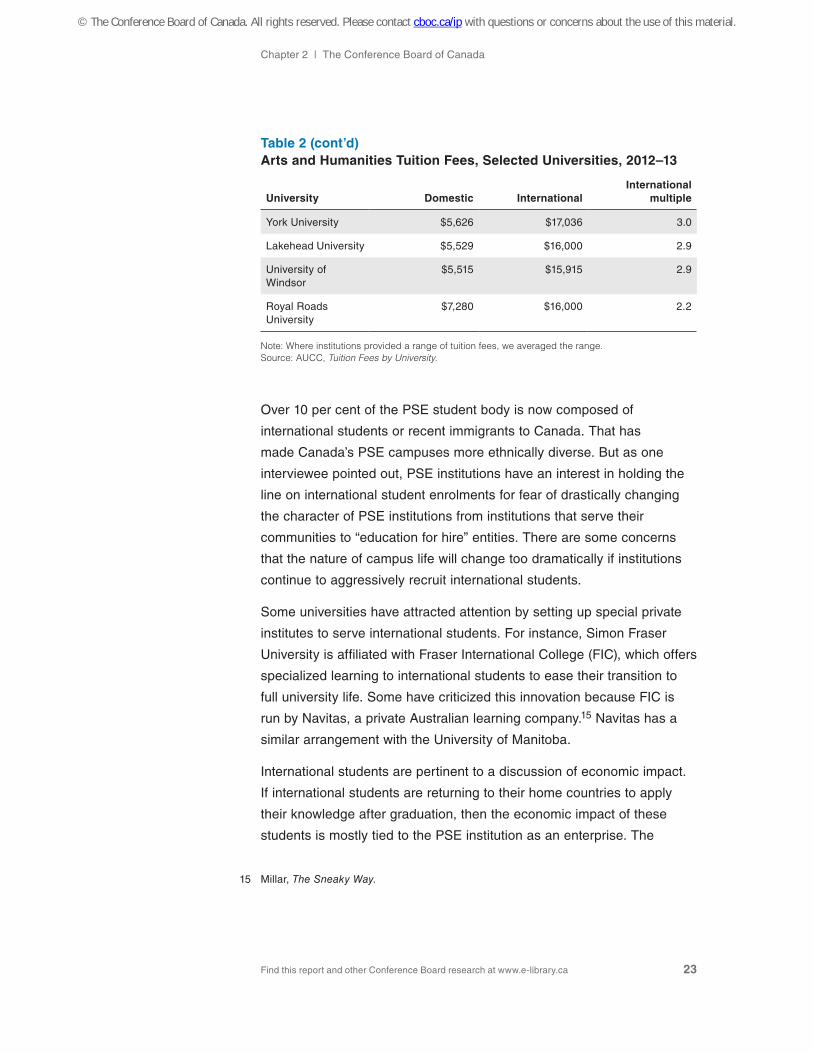
York University $5,626 $17,036 3.0
Lakehead University $5,529 $16,000 2.9
University of Windsor
$5,515 $15,915 2.9
Royal Roads University
$7,280 $16,000 2.2
Note: Where institutions provided a range of tuition fees, we averaged the range. Source: AUCC, Tuition Fees by University.
Over 10 per cent of the PSE student body is now composed of
international students or recent immigrants to Canada. That has
made Canada’s PSE campuses more ethnically diverse. But as one
interviewee pointed out, PSE institutions have an interest in holding the
line on international student enrolments for fear of drastically changing
the character of PSE institutions from institutions that serve their
communities to “education for hire” entities. There are some concerns
that the nature of campus life will change too dramatically if institutions
continue to aggressively recruit international students.
Some universities have attracted attention by setting up special private
institutes to serve international students. For instance, Simon Fraser
University is affiliated with Fraser International College (FIC), which offers
specialized learning to international students to ease their transition to
full university life. Some have criticized this innovation because FIC is
run by Navitas, a private Australian learning company.15 Navitas has a
similar arrangement with the University of Manitoba.
International students are pertinent to a discussion of economic impact.
If international students are returning to their home countries to apply
their knowledge after graduation, then the economic impact of these
students is mostly tied to the PSE institution as an enterprise. The
15 Millar, The Sneaky Way.
Table 2 (cont’d)Arts and Humanities Tuition Fees, Selected Universities, 2012–13
© The Conference Board of Canada. All rights reserved. Please contact cboc.ca/ip with questions or concerns about the use of this material.
The Economic Impact of Post-Secondary Education in Canada
Find this report and other Conference Board research at www.e-library.ca 24
economic impact is gauged by the spending associated with the students
(and the visitors they attract). However, if the international students
stay in Canada or otherwise maintain a connection to Canada following
graduation, because of their educational experience, then the economic
impact is broader.
Some question why Canadian institutions are being opened to
international students while some Canadian communities–such as
Aboriginal Canadians and Canadians from disadvantaged socio-
economic backgrounds—face lower-than-average levels of academic
attainment. This debate reflects the hybrid nature of higher learning
institutions—part research centre, part public service organization, and
part learning services vendor.
Individual institutions have found other ways to work around tuition
constraints. For instance, provincial governments free certain programs
from these constraints, particularly in areas where there are high private
returns on education, reflecting high demand in the economy, such as
engineering and business administration. This explains why average
undergraduate tuition costs have risen over two and a half times as fast
as consumer prices.16 In addition, other student fees and charges are
sometimes freed from tuition constraints. So although administrators
often point to tuition constraints, some have been rather creative in
overcoming them.
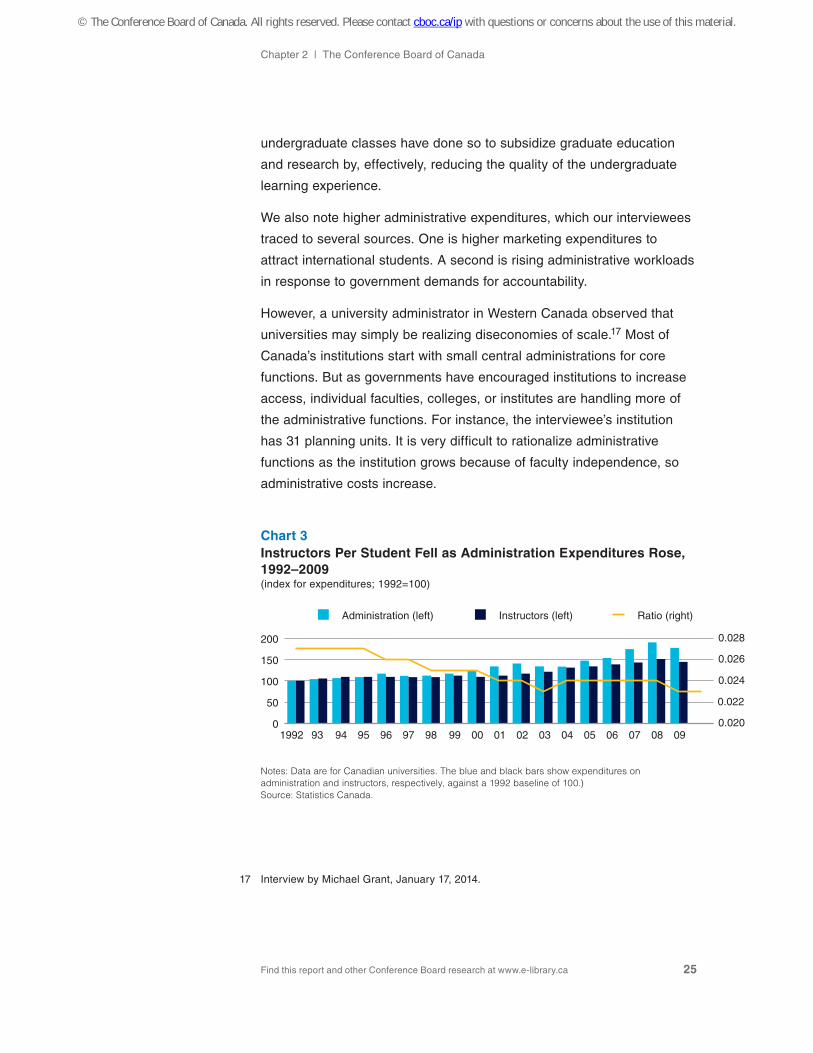
Another way for institutions to manage constraints is to do more with
less. For example, there has been a marked trend toward larger class
sizes, with fewer instructors per FTE, at the university level. (See Chart
3.) An interviewee pointed out that this trend toward larger class sizes
has developed over the last 25 years and coincides with the emergence
of large universities that focus on research and teaching. However,
provinces do not use different funding formulae for those institutions
that focus on teaching and those that focus on both research and
teaching. This suggests that those institutions that have moved to larger
16 Tal and Enenajor, Degrees of Success, 1.
For the exclusive use of Joseph Mior, [email protected], Fleming College.
Chapter 2 | The Conference Board of Canada
Find this report and other Conference Board research at www.e-library.ca 25
undergraduate classes have done so to subsidize graduate education
and research by, effectively, reducing the quality of the undergraduate
learning experience.
We also note higher administrative expenditures, which our interviewees
traced to several sources. One is higher marketing expenditures to
attract international students. A second is rising administrative workloads
in response to government demands for accountability.
However, a university administrator in Western Canada observed that
universities may simply be realizing diseconomies of scale.17 Most of
Canada’s institutions start with small central administrations for core
functions. But as governments have encouraged institutions to increase
access, individual faculties, colleges, or institutes are handling more of
the administrative functions. For instance, the interviewee’s institution
has 31 planning units. It is very difficult to rationalize administrative
functions as the institution grows because of faculty independence, so
administrative costs increase.
17 Interview by Michael Grant, January 17, 2014.
Chart 3Instructors Per Student Fell as Administration Expenditures Rose, 1992–2009(index for expenditures; 1992=100)
1992 94 96 98 00 02 04 06 089593 97 99 01 03 05 07 090
50
100
150
200
0.020
0.022
0.024
0.026
0.028
Administration (left) Instructors (left) Ratio (right)
Notes: Data are for Canadian universities. The blue and black bars show expenditures on administration and instructors, respectively, against a 1992 baseline of 100.) Source: Statistics Canada.
© The Conference Board of Canada. All rights reserved. Please contact cboc.ca/ip with questions or concerns about the use of this material.
The Economic Impact of Post-Secondary Education in Canada
Find this report and other Conference Board research at www.e-library.ca 26
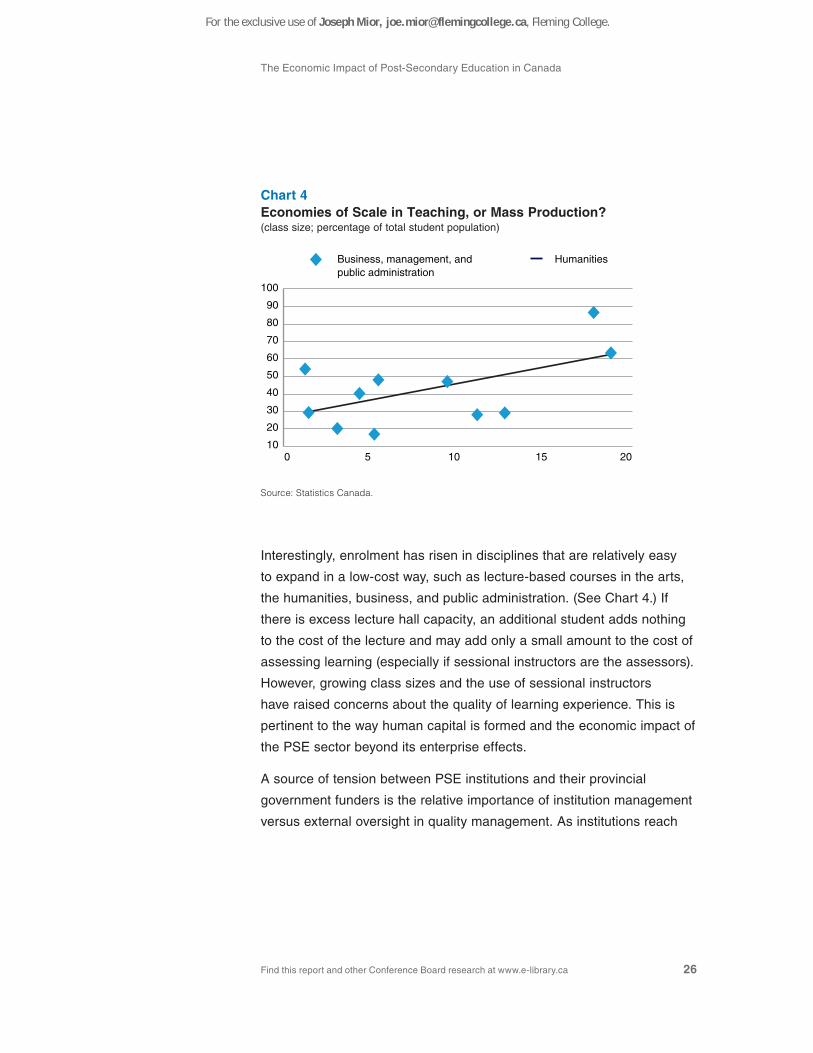
Interestingly, enrolment has risen in disciplines that are relatively easy
to expand in a low-cost way, such as lecture-based courses in the arts,
the humanities, business, and public administration. (See Chart 4.) If
there is excess lecture hall capacity, an additional student adds nothing
to the cost of the lecture and may add only a small amount to the cost of
assessing learning (especially if sessional instructors are the assessors).
However, growing class sizes and the use of sessional instructors
have raised concerns about the quality of learning experience. This is
pertinent to the way human capital is formed and the economic impact of
the PSE sector beyond its enterprise effects.
A source of tension between PSE institutions and their provincial
government funders is the relative importance of institution management
versus external oversight in quality management. As institutions reach
Chart 4Economies of Scale in Teaching, or Mass Production?(class size; percentage of total student population)
10
20
30
40
50
60
70
80
90
100
0 5 10 15 20
Business, management, andpublic administration
Humanities
Source: Statistics Canada.
For the exclusive use of Joseph Mior, [email protected], Fleming College.
Chapter 2 | The Conference Board of Canada
Find this report and other Conference Board research at www.e-library.ca 27
out to international students, accreditation becomes more important,
because international students and their governments may not be
familiar with the reputation of individual institutions.
Institutions usually manage quality themselves, with varying degrees
of provincial oversight. For instance, British Columbia has a formal
system of higher education quality accreditation called Education Quality
Assurance (EQA) that it promotes as “Canada’s first and only provincial
brand of quality for post-secondary education (PSE).”18
For marketing purposes, some PSE institutions have sought third-party
accreditation, although this practice is still relatively rare. For instance,
Simon Fraser University has applied for accreditation by the Washington-
based Northwest Commission on Colleges and Universities (NWCCU),
which is recognized by the U.S. Department of Education. Other
institutions, such as Saint Mary’s University in Halifax, have focused their
accreditation efforts on specific programs of greatest interest to foreign
students. For instance, the Sobey School of Business is accredited by
the Association to Advance Collegiate Schools of Business (AACSB).
Conclusion
Most of Canada’s PSE institutions are operating as hybrid institutions—
part public institution, part commercial enterprise. On the one hand,
the institutions are marketing to students, an activity that brings in
tuition, fees, and sometimes operating grant funding. In this sense,
the institutions themselves are commercial, much like Canadian
private enterprises.
Yet their governing PLRs and government funding make them equally
or more reliant on government. In this sense, Canada’s PSE institutions
are extensions of the provincial and territorial governments, which partly
control them by financial means and set their incentives. Some of these
incentives are counterproductive, as they discourage institutions from
responding to market demands.
18 British Columbia Ministry of Advanced Education, Education Quality Assurance—EQA.
© The Conference Board of Canada. All rights reserved. Please contact cboc.ca/ip with questions or concerns about the use of this material.

The Economic Impact of Post-Secondary Education in Canada
Find this report and other Conference Board research at www.e-library.ca 28
With this background, the report now turns to an evaluation of the
economic impact of PSE as an enterprise, and as a developer of human
and intellectual capital.
For the exclusive use of Joseph Mior, [email protected], Fleming College.
Find this report and other Conference Board research at www.e-library.ca
• This chapter assesses the economic impact of PSE institutions as enterprisesand their associated economic footprint.
• The two principal types of impact relate to direct spending at the individualinstitutions and indirect spending that occurs in the economy because of theinstitutions.
• Over $40 billion of spending flows through Canada’s colleges and universitieseach year, which generates over $55 billion of economic activity, includingmultiplier effects.
• Almost 700,000 direct and indirect jobs are attributable to spending on PSEinstitutions.
• Off-campus student spending may generate a direct benefit to the surroundingcommunities of as much as $20 billion, including multiplier effects.
• Visitor spending associated with PSE institutions adds about $2 billion inadditional economic impact.
CHAPTER 3
Economic Footprint of Post-Secondary Institutions
Chapter Summary
© The Conference Board of Canada. All rights reserved. Please contact cboc.ca/ip with questions or concerns about the use of this material.
The Economic Impact of Post-Secondary Education in Canada
Find this report and other Conference Board research at www.e-library.ca 30
PSE institutions are unique organizations. They are usually organized as non-profit organizations, indicating that they exist to pursue social objectives beyond commercial performance. Governments channel billions of tax dollars to PSE institutions to support their teaching and research mandates in recognition of their socio-economic contribution. This is based on the premise that the higher education market, if left to its own devices, would fail to provide an adequate amount of higher education and research. Even so, to remain financially viable, PSE institutions must actively compete for enrolments and additional research funding. Many of them pursue aggressive marketing campaigns, much like for-profit companies.
Individual PSE institutions are among Canada’s largest employers.
For example, the University of British Columbia (UBC) employs over
10,000 people, making it Vancouver’s largest single employer.1 Large
employers, in the Canadian context, are those with over 500 employees,
and most universities and many colleges employ more than 500
people.2 Well-known companies such as WestJet and TransCanada
Corp. employ fewer people than the University of Toronto. Retail banks,
Canada’s largest national employers, employ fewer people in the Greater
Vancouver Area than does UBC.
This chapter assesses the economic impact of PSE institutions as
enterprises. There are two impacts of interest.
1 Sudmant, The Economic Impact of the University of British Columbia, 6.
2 Statistics Canada, Employment by Enterprise Size.
For the exclusive use of Joseph Mior, [email protected], Fleming College.
Chapter 3 | The Conference Board of Canada
Find this report and other Conference Board research at www.e-library.ca 31
First, there are the impacts that flow from direct spending on the
individual institutions. These include first-round effects (spending at the
institutions themselves) and second-round effects that emerge as those
who have been paid for services in the first round spend that money in
the surrounding economy (the “multiplier effect”).
Second, there are the indirect spending effects. These are related to the
presence of PSE institutions but do not relate directly to the institutions’
spending. They take two forms. One is off-campus spending by students
and the other is spending by visitors who are attracted to communities by
PSE institutions and the students attending them.
Direct Spending Effects
To assess the direct spending effects, we conducted an analysis of
PSE institutions. We used expenditure and cost data from the Canadian
Association of University Business Officers (CAUBO) for fiscal 2011–12,
Statistics Canada data, and our own estimates.3 From these sources,
we calculated that $41.3 billion in expenditures flowed through Canada’s
colleges and universities in 2011–12. This includes $31.5 billion in
expenditures at universities and $9.7 billion at colleges.
Exhibits 2 and 3 summarize the main categories of expenditures for
universities and colleges. The largest category is general operations,
and most of these expenditures are for staff salaries and benefits. For
instance, CAUBO has reported that this item accounts for 75.5 per cent
of universities’ operating expenditures.4
We ran these spending estimates through The Conference Board of
Canada’s economic forecasting model of the Canadian economy. The
model incorporates an input/output structure of the Canadian economy.
3 CAUBO, Financial Information.
4 CAUBO, Financial Information, 13.
© The Conference Board of Canada. All rights reserved. Please contact cboc.ca/ip with questions or concerns about the use of this material.

The Economic Impact of Post-Secondary Education in Canada
Find this report and other Conference Board research at www.e-library.ca 32
Therefore, when we flow these expenditures through the model, it tells
us how spending by colleges and universities affects other sectors of the
economy and the overall Canadian economy.
The model found that the initial $41.3 billion generated a total economic
impact of $55.7 billion in first- and second-round spending. Every
dollar spent on PSE creates $1.36 of economic value added (or output)
in the Canadian economy. This multiplier is relatively high, primarily
because PSE is a labour-intensive local service industry. The teaching
and research “products” of PSE institutions have relatively low import
Exhibit 2Expenditures at Canada’s Universities, 2011–12
Includes $959 million in miscellaneous income. Total expenditures
($31.5 billion)
Includes salaries, benefits, and other general operating expenses.
General operating($18.9 billion)
Includes scholarships, bursaries, and prizes.Special purpose and trust
($1.5 billion)
Based on historical data (CANSIM table 478-0007, University Education Expenditures), the federal and provincial governments account for approximately 70 per cent of expenditures on sponsored research; businesses account for the remaining 30 per cent.
Sponsored research ($6.6 billion)
Assumed to be part of investment in intellectual property products.
Ancillary($1.7 billion)
According to Statistics Canada (CANSIM table 032-0001, Public and Private Investment), approximately 30 per cent of university capital expenditures relate to machinery and equipment, while 70 per cent relate to construction.
Capital ($2.8 billion)
Sources: CAUBO; Statistics Canada; The Conference Board of Canada.
For the exclusive use of Joseph Mior, [email protected], Fleming College.
Chapter 3 | The Conference Board of Canada
Find this report and other Conference Board research at www.e-library.ca 33
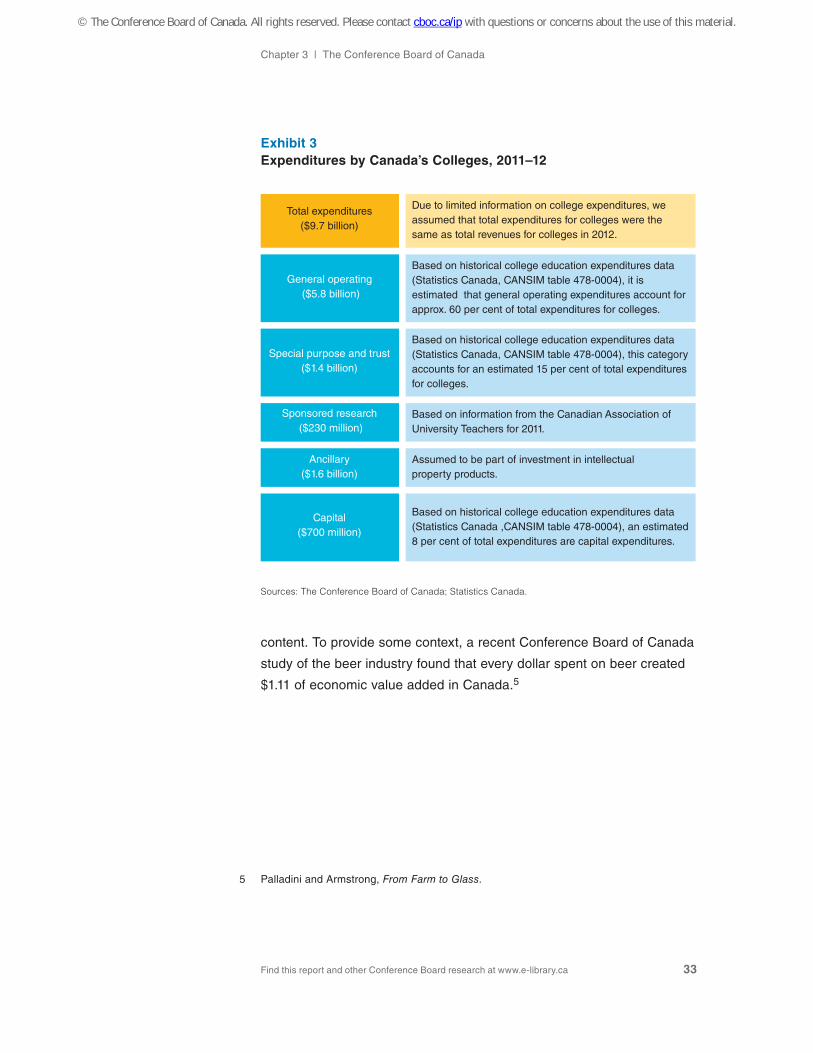
content. To provide some context, a recent Conference Board of Canada
study of the beer industry found that every dollar spent on beer created
$1.11 of economic value added in Canada.5
5 Palladini and Armstrong, From Farm to Glass.
Exhibit 3Expenditures by Canada’s Colleges, 2011–12
Due to limited information on college expenditures, we assumed that total expenditures for colleges were the same as total revenues for colleges in 2012.
Total expenditures ($9.7 billion)
Based on historical college education expenditures data (Statistics Canada, CANSIM table 478-0004), it is estimated that general operating expenditures account for approx. 60 per cent of total expenditures for colleges.
General operating ($5.8 billion)
Based on historical college education expenditures data (Statistics Canada, CANSIM table 478-0004), this category accounts for an estimated 15 per cent of total expenditures for colleges.
Special purpose and trust ($1.4 billion)
Based on information from the Canadian Association of University Teachers for 2011.
Sponsored research ($230 million)
Assumed to be part of investment in intellectual property products.
Ancillary ($1.6 billion)
Based on historical college education expenditures data (Statistics Canada ,CANSIM table 478-0004), an estimated 8 per cent of total expenditures are capital expenditures.
Capital ($700 million)
Sources: The Conference Board of Canada; Statistics Canada.
© The Conference Board of Canada. All rights reserved. Please contact cboc.ca/ip with questions or concerns about the use of this material.
The Economic Impact of Post-Secondary Education in Canada
Find this report and other Conference Board research at www.e-library.ca 34
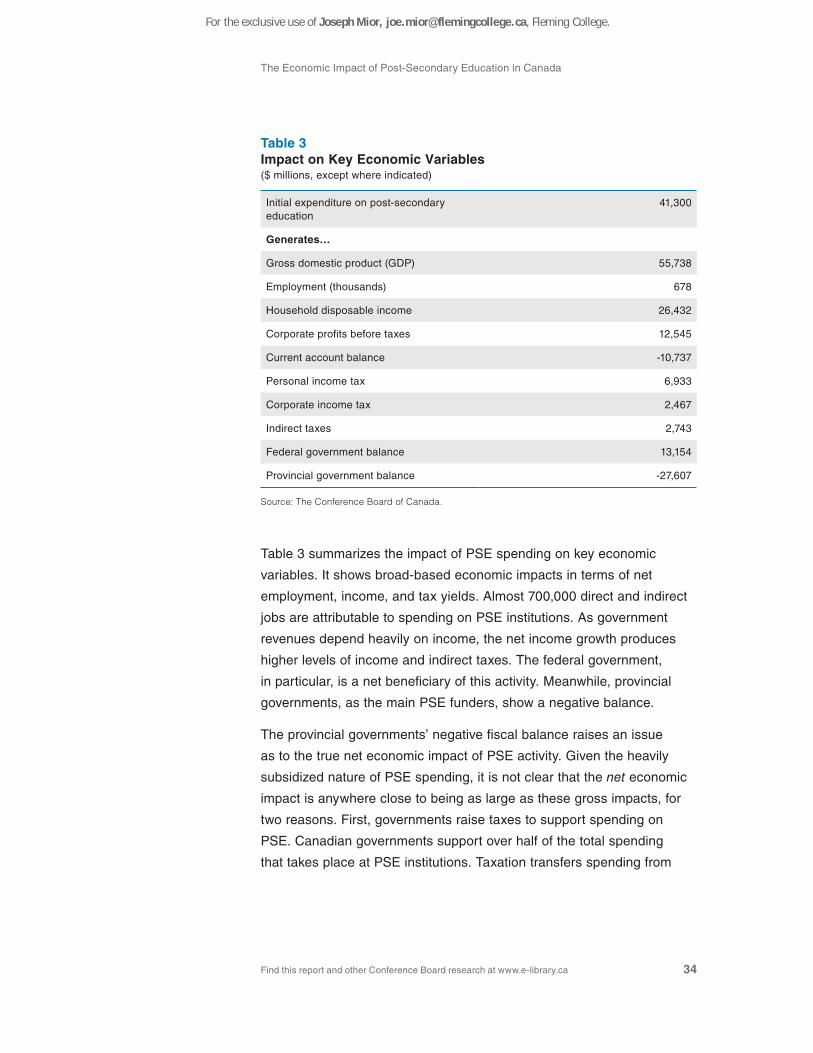
Table 3Impact on Key Economic Variables ($ millions, except where indicated)
Initial expenditure on post-secondary education
41,300
Generates…
Gross domestic product (GDP) 55,738
Employment (thousands) 678
Household disposable income 26,432
Corporate profits before taxes 12,545
Current account balance -10,737
Personal income tax 6,933
Corporate income tax 2,467
Indirect taxes 2,743
Federal government balance 13,154
Provincial government balance -27,607
Source: The Conference Board of Canada.
Table 3 summarizes the impact of PSE spending on key economic
variables. It shows broad-based economic impacts in terms of net
employment, income, and tax yields. Almost 700,000 direct and indirect
jobs are attributable to spending on PSE institutions. As government
revenues depend heavily on income, the net income growth produces
higher levels of income and indirect taxes. The federal government,
in particular, is a net beneficiary of this activity. Meanwhile, provincial
governments, as the main PSE funders, show a negative balance.
The provincial governments’ negative fiscal balance raises an issue
as to the true net economic impact of PSE activity. Given the heavily
subsidized nature of PSE spending, it is not clear that the net economic
impact is anywhere close to being as large as these gross impacts, for
two reasons. First, governments raise taxes to support spending on
PSE. Canadian governments support over half of the total spending
that takes place at PSE institutions. Taxation transfers spending from
For the exclusive use of Joseph Mior, [email protected], Fleming College.
Chapter 3 | The Conference Board of Canada
Find this report and other Conference Board research at www.e-library.ca 35
taxpayers to PSE institutions with no net change in total spending in the
economy. If the impact calculation were limited to the private funding of
PSE institutions, the results would be about half as large.
Second, funding PSE spending through taxation creates other impacts
on the microeconomic functioning of the economy through the allocation
of resources. Taxes create a wedge between the prices facing buyers
(of goods, labour, or whatever else is being taxed) and sellers. They
encourage some tax avoidance activities and discourage increased
production. For instance, Dahlby and Ferede estimated (for 2006) that
the marginal cost of raising a dollar of public funds varied from $1 (for
Alberta sales tax revenue) to $40.83 (for Alberta corporate income
tax).6 Most economic impact studies for PSE institutions ignore these
tax effects when calculating total economic impact, which leads them to
exaggerate the net economic impacts somewhat.
That explains why PSE institutions need to make the investment
case for public support based on an inherent market failure. From an
economist’s perspective, taxation is a form of forced savings to the
taxpayer who, understandably, wants to see those savings well used.
If PSE cannot make a solid investment case, then the transfer of
resources from taxpayers to PSE institutions just takes consumption
away from taxpayers to support consumption by students, faculty, and
administrators. There may be well-founded social reasons for making
this transfer. But from a purely economic perspective, the case has
to be made based on the formation of human and intellectual capital,
and their ultimate use in the economy. These points are addressed in
later chapters.
6 Dahlby and Ferede, What Does It Cost Society?
© The Conference Board of Canada. All rights reserved. Please contact cboc.ca/ip with questions or concerns about the use of this material.
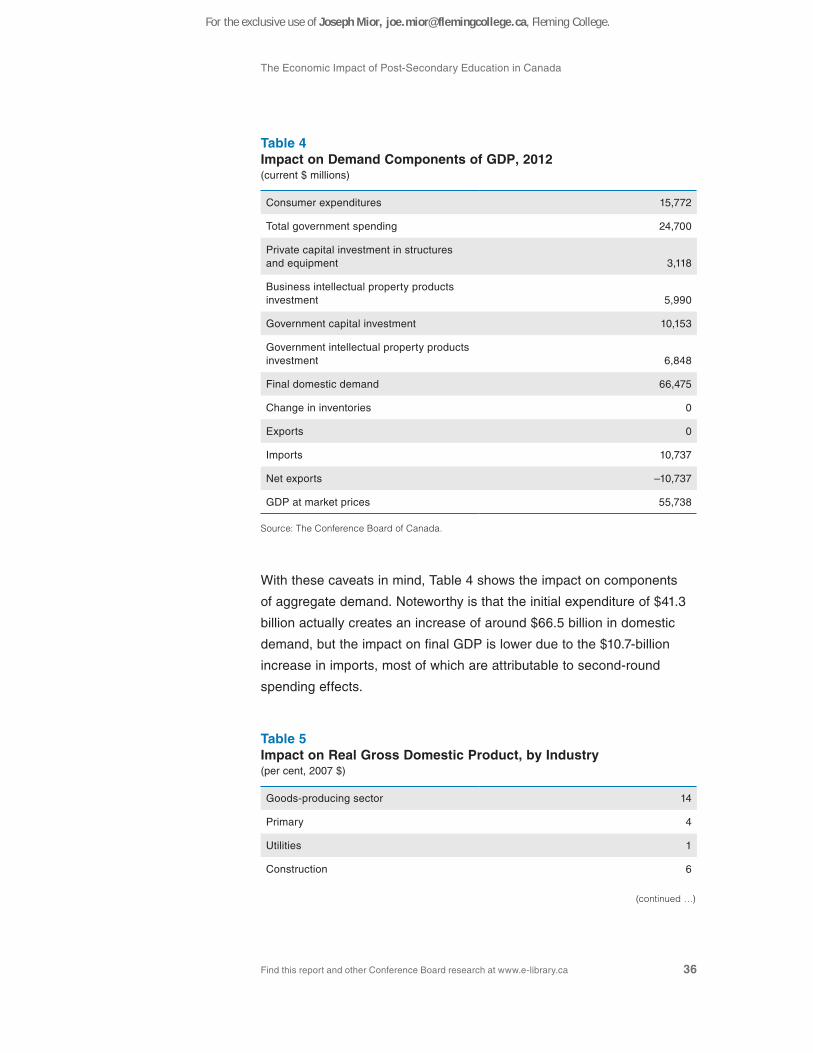
The Economic Impact of Post-Secondary Education in Canada
Find this report and other Conference Board research at www.e-library.ca 36
Table 4Impact on Demand Components of GDP, 2012 (current $ millions)
Consumer expenditures 15,772
Total government spending 24,700
Private capital investment in structures and equipment 3,118
Business intellectual property products investment 5,990
Government capital investment 10,153
Government intellectual property products investment 6,848
Final domestic demand 66,475
Change in inventories 0
Exports 0
Imports 10,737
Net exports –10,737
GDP at market prices 55,738
Source: The Conference Board of Canada.
With these caveats in mind, Table 4 shows the impact on components
of aggregate demand. Noteworthy is that the initial expenditure of $41.3
billion actually creates an increase of around $66.5 billion in domestic
demand, but the impact on final GDP is lower due to the $10.7-billion
increase in imports, most of which are attributable to second-round
spending effects.
Table 5Impact on Real Gross Domestic Product, by Industry (per cent, 2007 $)
Goods-producing sector 14
Primary 4
Utilities 1
Construction 6
(continued …)
For the exclusive use of Joseph Mior, [email protected], Fleming College.
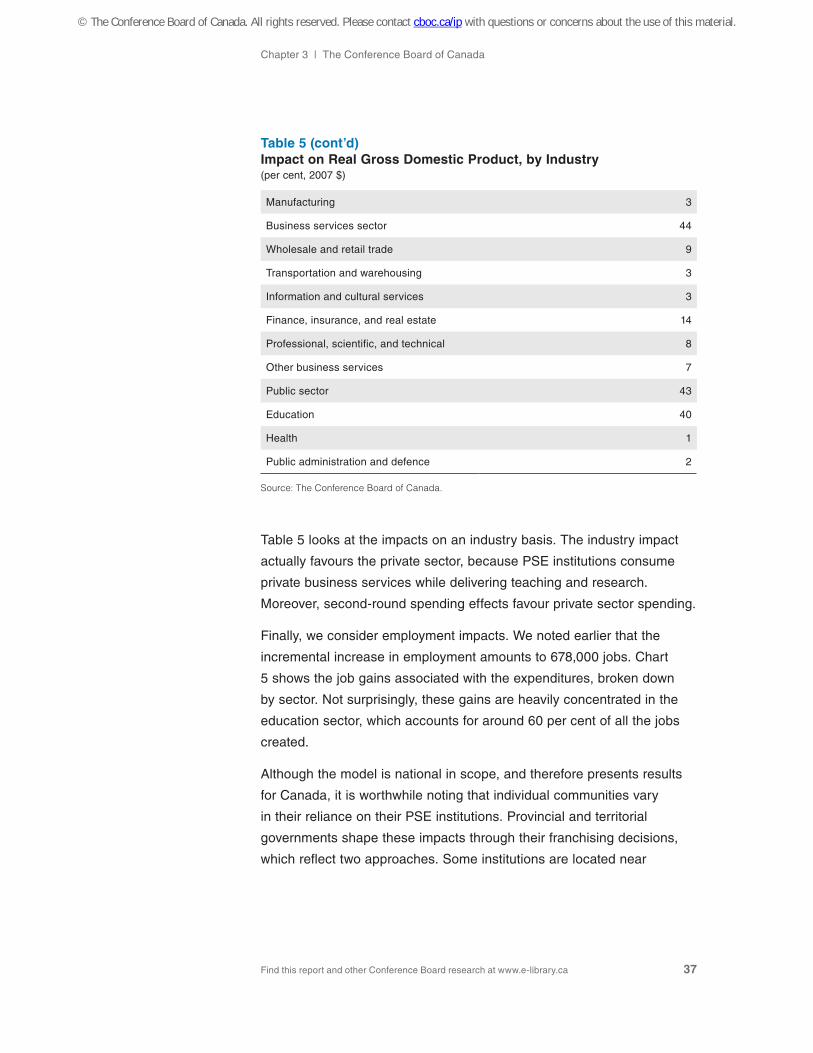
Chapter 3 | The Conference Board of Canada
Find this report and other Conference Board research at www.e-library.ca 37
Manufacturing 3
Business services sector 44
Wholesale and retail trade 9
Transportation and warehousing 3
Information and cultural services 3
Finance, insurance, and real estate 14
Professional, scientific, and technical 8
Other business services 7
Public sector 43
Education 40
Health 1
Public administration and defence 2
Source: The Conference Board of Canada.
Table 5 looks at the impacts on an industry basis. The industry impact
actually favours the private sector, because PSE institutions consume
private business services while delivering teaching and research.
Moreover, second-round spending effects favour private sector spending.
Finally, we consider employment impacts. We noted earlier that the
incremental increase in employment amounts to 678,000 jobs. Chart
5 shows the job gains associated with the expenditures, broken down
by sector. Not surprisingly, these gains are heavily concentrated in the
education sector, which accounts for around 60 per cent of all the jobs
created.
Although the model is national in scope, and therefore presents results
for Canada, it is worthwhile noting that individual communities vary
in their reliance on their PSE institutions. Provincial and territorial
governments shape these impacts through their franchising decisions,
which reflect two approaches. Some institutions are located near
Table 5 (cont’d)Impact on Real Gross Domestic Product, by Industry (per cent, 2007 $)
© The Conference Board of Canada. All rights reserved. Please contact cboc.ca/ip with questions or concerns about the use of this material.

The Economic Impact of Post-Secondary Education in Canada
Find this report and other Conference Board research at www.e-library.ca 38
population centres to provide ease of access to students. Others are
located in less densely populated areas, in part as a form of regional
economic development.
Exhibits 4 and 5 show the location of Canada’s universities and leading
colleges, polytechnics, institutes, and centres. Clearly, the relative local
economic impact of a PSE institution depends on three things. First is its
size (as an enterprise) in relation to the surrounding economy. Second is
the extent to which it draws students from other jurisdictions. Third is the
extent to which it produces graduates and intellectual property that local
employers use.
To illustrate, St. Francis Xavier University has a relatively large impact on
the economy of Antigonish, Nova Scotia. According to the 2011 Census,
the population of Antigonish was 19,589.7 Enrolment at the university is
5,291.8 Total employment at the university is around 500 people, half of
whom are academic employees.
7 Statistics Canada, Census Profile: Antigonish.
8 Association of Atlantic Universities, 2012–2013 Survey.
Chart 5Distribution of Employment Gains, by Sector, 2012
1% 4% 0%2%
15%
9%
2%4%
3%
60%
Primary
Construction
Utilities
Manufacturing
Other commercial services
Wholesale and retail trade
Transportation and storage
Finance, insurance, and real estate
Public sector
Education
Source: The Conference Board of Canada.
For the exclusive use of Joseph Mior, [email protected], Fleming College.
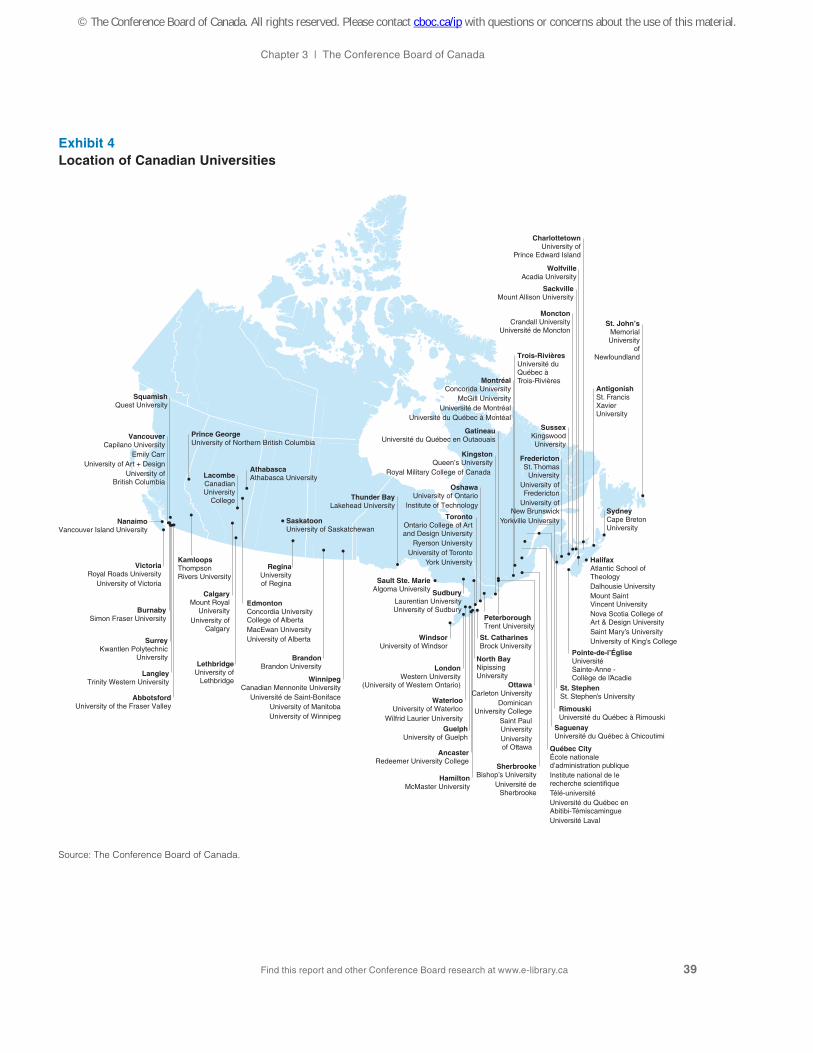
Chapter 3 | The Conference Board of Canada
Find this report and other Conference Board research at www.e-library.ca 39
Exhibit 4Location of Canadian Universities
St. CatharinesBrock University
PeterboroughTrent University
KingstonQueen’s University
Royal Military College of Canada
GatineauUniversité du Québec en Outaouais
HamiltonMcMaster University
GuelphUniversity of Guelph
WaterlooUniversity of Waterloo
Wilfrid Laurier University
OttawaCarleton University
DominicanUniversity College
Saint PaulUniversityUniversityof Ottawa
MontréalConcorida University
McGill UniversityUniversité de Montréal
Université du Québec à Montéal
St. John’sMemorialUniversity
ofNewfoundland
VictoriaRoyal Roads University
University of Victoria
NanaimoVancouver Island University
BurnabySimon Fraser University
TorontoOntario College of Artand Design University
Ryerson UniversityUniversity of Toronto
York University
Sault Ste. MarieAlgoma University
Thunder BayLakehead University
SudburyLaurentian UniversityUniversity of Sudbury
North Bay NipissingUniversity
HalifaxAtlantic School ofTheologyDalhousie UniversityMount SaintVincent University Nova Scotia College ofArt & Design UniversitySaint Mary’s UniversityUniversity of King’s College
WolfvilleAcadia University
SackvilleMount Allison University
MonctonCrandall University
Université de Moncton
SussexKingswoodUniversity
Pointe-de-l’ÉgliseUniversitéSainte-Anne -Collège de l’Acadie
St. StephenSt. Stephen’s University
Québec CityÉcole nationaled’administration publiqueInstitute national de le recherche scientifiqueTélé-universitéUniversité du Québec enAbitibi-TémiscamingueUniversité Laval
AntigonishSt. FrancisXavierUniversity
SydneyCape BretonUniversity
VancouverCapilano University
Emily CarrUniversity of Art + Design
University ofBritish Columbia
SquamishQuest University
WinnipegCanadian Mennonite University
Université de Saint-BonifaceUniversity of ManitobaUniversity of Winnipeg
KamloopsThompsonRivers University
EdmontonConcordia UniversityCollege of Alberta MacEwan UniversityUniversity of Alberta
CalgaryMount Royal
UniversityUniversity of
Calgary
LethbridgeUniversity of
Lethbridge
AthabascaAthabasca UniversityLacombe
CanadianUniversity
College
ReginaUniversityof Regina
SaskatoonUniversity of Saskatchewan
OshawaUniversity of Ontario
Institute of Technology
WindsorUniversity of Windsor
LondonWestern University
(University of Western Ontario)
SurreyKwantlen Polytechnic
University
AbbotsfordUniversity of the Fraser Valley
Prince GeorgeUniversity of Northern British Columbia
BrandonBrandon University
FrederictonSt. Thomas
UniversityUniversity ofFredericton
University ofNew Brunswick
Yorkville University
CharlottetownUniversity of
Prince Edward Island
Trois-RivièresUniversité duQuébec àTrois-Rivières
SaguenayUniversité du Québec à Chicoutimi
SherbrookeBishop’s University
Université deSherbrooke
RimouskiUniversité du Québec à Rimouski
LangleyTrinity Western University
AncasterRedeemer University College
Source: The Conference Board of Canada.
© The Conference Board of Canada. All rights reserved. Please contact cboc.ca/ip with questions or concerns about the use of this material.

The Economic Impact of Post-Secondary Education in Canada
Find this report and other Conference Board research at www.e-library.ca 40
Exhibit 5Location of Canada’s Largest Colleges, Polytechnics, Institutes, and Centres
Peterborough� Fleming College
Kingston� St. Lawrence College
Gatineau� Cégep de l’Outaouais
Hamilton� Mohawk College
Montréal� Collège Ahuntsic
� Cégep du Vieux Montréal� Collège de Bois-de-Boulogne
� Collège de Maisonneuve� Dawson College
� École de technologie supérieure� École Polytechnique de Montréal
� HEC Montréal� John Abbott College
� Vanier College
Victoria� Camosun College
Sault Ste. MarieSault College
Thunder Bay� Confederation College
Sudbury� Collège Boréal
� Cambrian College
Halifax� Nova Scotia
Community College
Québec City� Cégep de Sainte-Foy� Cégep Limoilou� Collège François-Xavier-Garneau
Vancouver� Vancouver Community College
� Langara College
Edmonton� NorQuest College� Northern Alberta
Institute of Technology
Lethbridge� Lethbridge College
Red Deer � Red Deer College
Oshawa� Durham College
Windsor� St. Clair College
London� Fanshawe College
New Westminster� Douglas College
� Justice Institute of British Columbia
Fredericton� New
BrunswickCommunity
College
Barrie� Georgian College
Sherbrooke� Champlain Regional College� Cégep de Sherbrooke
Slave Lake� Northern Lakes College
Lloydminster� Lakeland College
Comox Valley� North Island College
Dawson Creek� Northern Lights College
Terrace� Northwest Community College
Kelowna� Okanagan
College
Stephenville� College of the North
Atlantic
Port Coquitlam� Sprott Shaw College
Sarnia� Lambton College
Timmins� Northern College
Welland� Niagara College
La Pocatière� Cégep de La Pocatière
Laval� Collège Montmorency
Longueuil� Cégep Édouard-Montpetit
Sainte-Thérèse� Collège Lionel-Groulx
CollegesInstitutes and CentresPolytechnics
Ottawa� Algonquin College� La Cité collégiale
Burnaby� British Columbia Institute
of Technology
Toronto� Centennial College
� George Brown College� Humber College� Seneca College
Winnipeg� Red River College
Calgary� Southern Alberta
Institute ofTechnology
Regina� Gabriel Dumont Institute
of Native Studiesand Applied Research
Kitchener� Conestoga College
Oakville� Sheridan College
Saskatoon� Saskatchewan Institute of
Applied Science and Technology� Lutheran Theological Seminary
Merritt� Nicola Valley Institute of Technology
Banff National Park� The Banff Centre
(The Banff Schoolof Fine Arts)
Source: The Conference Board of Canada.
For the exclusive use of Joseph Mior, [email protected], Fleming College.
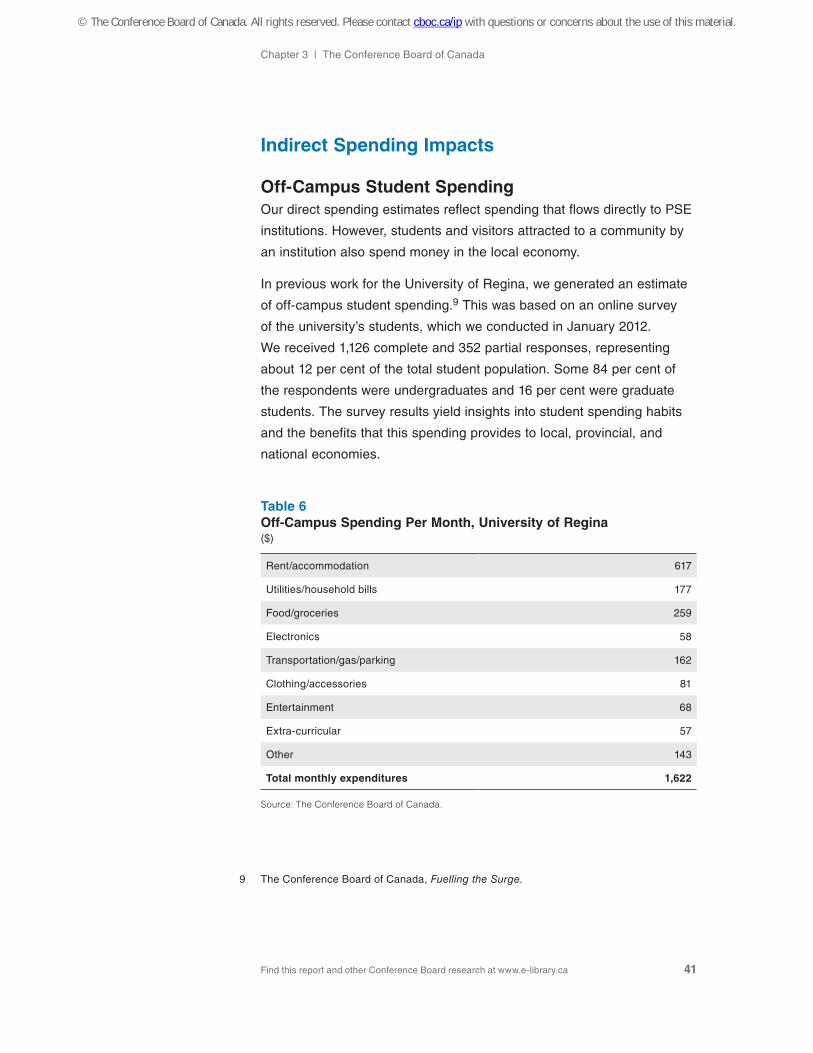
Chapter 3 | The Conference Board of Canada
Find this report and other Conference Board research at www.e-library.ca 41
Indirect Spending Impacts
Off-Campus Student SpendingOur direct spending estimates reflect spending that flows directly to PSE
institutions. However, students and visitors attracted to a community by
an institution also spend money in the local economy.
In previous work for the University of Regina, we generated an estimate
of off-campus student spending.9 This was based on an online survey
of the university’s students, which we conducted in January 2012.
We received 1,126 complete and 352 partial responses, representing
about 12 per cent of the total student population. Some 84 per cent of
the respondents were undergraduates and 16 per cent were graduate
students. The survey results yield insights into student spending habits
and the benefits that this spending provides to local, provincial, and
national economies.
Table 6Off-Campus Spending Per Month, University of Regina ($)
Rent/accommodation 617
Utilities/household bills 177
Food/groceries 259
Electronics 58
Transportation/gas/parking 162
Clothing/accessories 81
Entertainment 68
Extra-curricular 57
Other 143
Total monthly expenditures 1,622
Source: The Conference Board of Canada.
9 The Conference Board of Canada, Fuelling the Surge.
© The Conference Board of Canada. All rights reserved. Please contact cboc.ca/ip with questions or concerns about the use of this material.
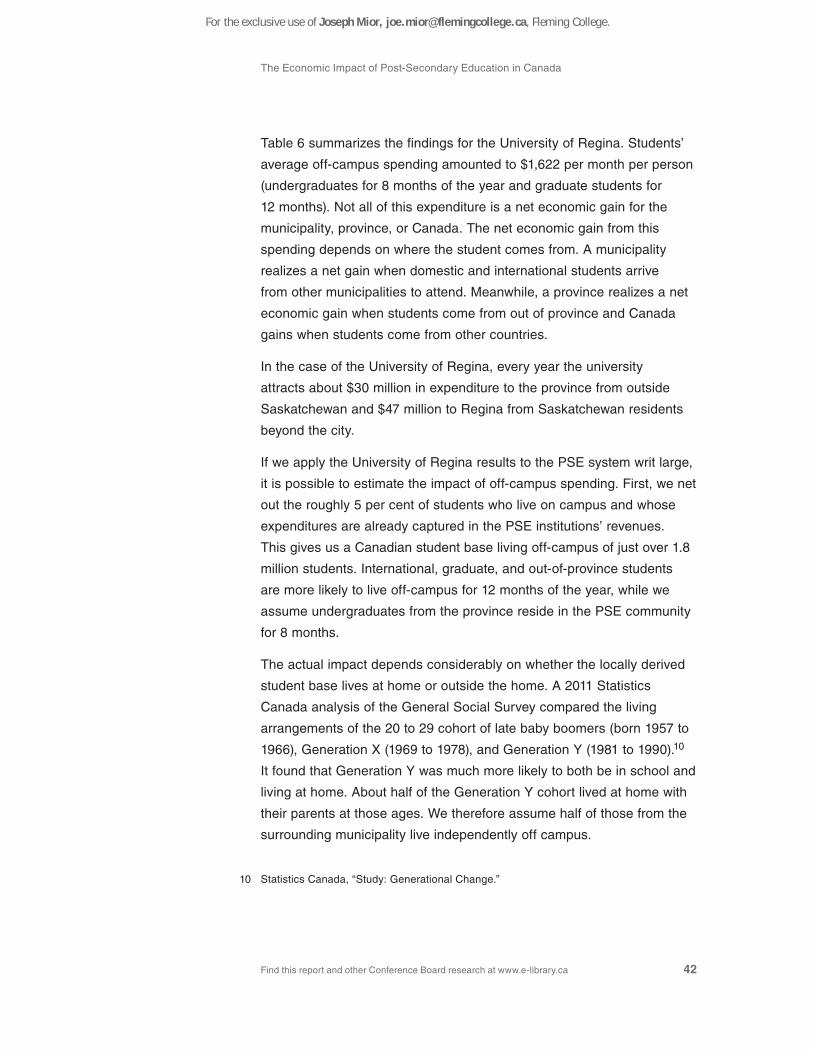
The Economic Impact of Post-Secondary Education in Canada
Find this report and other Conference Board research at www.e-library.ca 42
Table 6 summarizes the findings for the University of Regina. Students’
average off-campus spending amounted to $1,622 per month per person
(undergraduates for 8 months of the year and graduate students for
12 months). Not all of this expenditure is a net economic gain for the
municipality, province, or Canada. The net economic gain from this
spending depends on where the student comes from. A municipality
realizes a net gain when domestic and international students arrive
from other municipalities to attend. Meanwhile, a province realizes a net
economic gain when students come from out of province and Canada
gains when students come from other countries.
In the case of the University of Regina, every year the university
attracts about $30 million in expenditure to the province from outside
Saskatchewan and $47 million to Regina from Saskatchewan residents
beyond the city.
If we apply the University of Regina results to the PSE system writ large,
it is possible to estimate the impact of off-campus spending. First, we net
out the roughly 5 per cent of students who live on campus and whose
expenditures are already captured in the PSE institutions’ revenues.
This gives us a Canadian student base living off-campus of just over 1.8
million students. International, graduate, and out-of-province students
are more likely to live off-campus for 12 months of the year, while we
assume undergraduates from the province reside in the PSE community
for 8 months.
The actual impact depends considerably on whether the locally derived
student base lives at home or outside the home. A 2011 Statistics
Canada analysis of the General Social Survey compared the living
arrangements of the 20 to 29 cohort of late baby boomers (born 1957 to
1966), Generation X (1969 to 1978), and Generation Y (1981 to 1990).10
It found that Generation Y was much more likely to both be in school and
living at home. About half of the Generation Y cohort lived at home with
their parents at those ages. We therefore assume half of those from the
surrounding municipality live independently off campus.
10 Statistics Canada, “Study: Generational Change.”
For the exclusive use of Joseph Mior, [email protected], Fleming College.
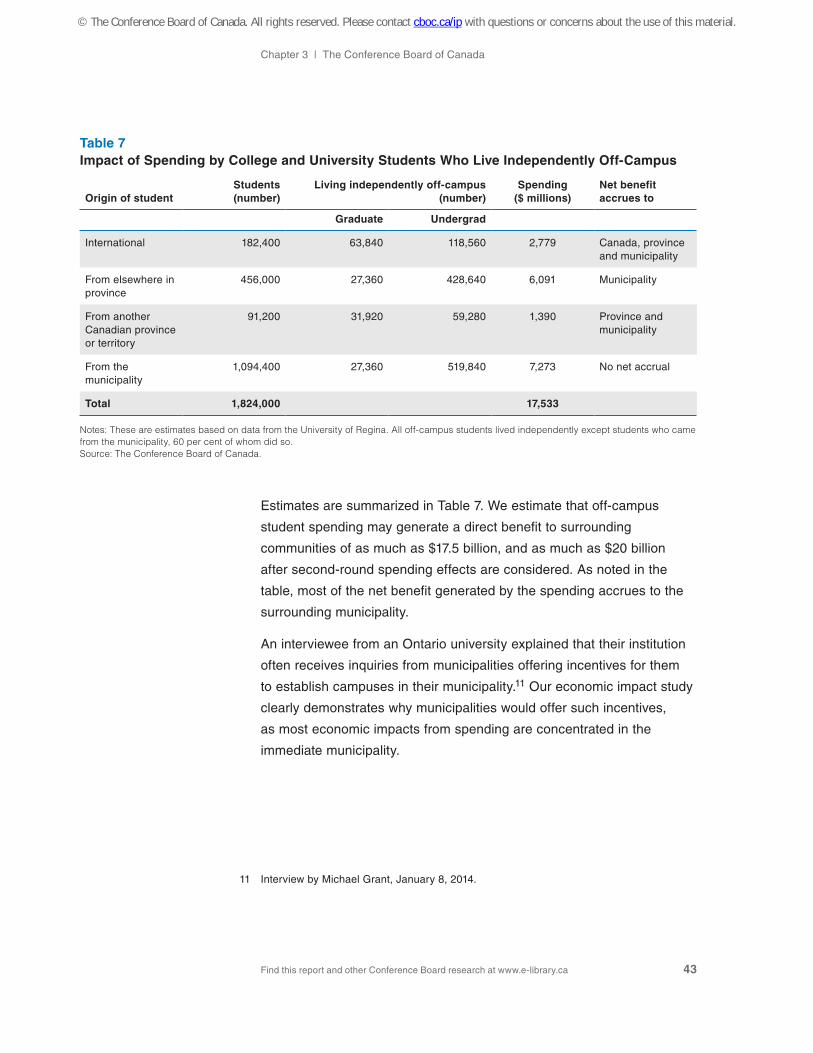
Chapter 3 | The Conference Board of Canada
Find this report and other Conference Board research at www.e-library.ca 43
Table 7Impact of Spending by College and University Students Who Live Independently Off-Campus
Origin of studentStudents (number)
Living independently off-campus (number)
Spending ($ millions)
Net benefit accrues to
Graduate Undergrad
International 182,400 63,840 118,560 2,779 Canada, province and municipality
From elsewhere in province
456,000 27,360 428,640 6,091 Municipality
From another Canadian province or territory
91,200 31,920 59,280 1,390 Province and municipality
From the municipality
1,094,400 27,360 519,840 7,273 No net accrual
Total 1,824,000 17,533
Notes: These are estimates based on data from the University of Regina. All off-campus students lived independently except students who came from the municipality, 60 per cent of whom did so. Source: The Conference Board of Canada.
Estimates are summarized in Table 7. We estimate that off-campus
student spending may generate a direct benefit to surrounding
communities of as much as $17.5 billion, and as much as $20 billion
after second-round spending effects are considered. As noted in the
table, most of the net benefit generated by the spending accrues to the
surrounding municipality.
An interviewee from an Ontario university explained that their institution
often receives inquiries from municipalities offering incentives for them
to establish campuses in their municipality.11 Our economic impact study
clearly demonstrates why municipalities would offer such incentives,
as most economic impacts from spending are concentrated in the
immediate municipality.
11 Interview by Michael Grant, January 8, 2014.
© The Conference Board of Canada. All rights reserved. Please contact cboc.ca/ip with questions or concerns about the use of this material.

The Economic Impact of Post-Secondary Education in Canada
Find this report and other Conference Board research at www.e-library.ca 44
Visitor SpendingPSE institutions are centres for social interaction and, therefore, attract
travellers who visit the campus and students at the campus. To shed
light on this area of impact, we conducted an original survey of 1,500
Canadian adults on the role that colleges and universities played in their
out-of-town trips over the previous 12 months.
Table 8Post-Secondary-Related Visits to a Different City in the Past 12 Months, 2013 (per cent)
Age
To visit family or friends enrolled at a college or
universityTo attend an event at a
college or university Both Total
18–24 29.4 9.1 8.6 47.2
25–34 25.3 5.2 8.4 38.9
35–44 19.9 3.8 3.8 27.5
45–54 16.8 2.1 6.6 25.4
55–64 16.8 0.8 2.9 20.5
65+ 16.8 2.3 1.6 20.7
Total 18+
20.3 3.6 5.1 29.1
Source: The Conference Board of Canada.
Overall, the survey results revealed that just over 29 per cent of
respondents reported making one or more post-secondary-related visits
(PSVs) over the past 12 months to a city other than the one they lived in.
Regarding the purpose of the trip, 20.3 per cent of respondents visited
family or friends enrolled at a college or university, 3.6 per cent attended
an event at a college or university, and 5.1 per cent did both. (See Table
8.) The survey results show that visits are most common among younger
adults and decline with age. In fact, 47.2 per cent of respondents aged
18 to 24 reported having made at least one PSV over the past 12
months, while the percentage declined to just under 21 per cent among
Canadians over 55 years of age.
For the exclusive use of Joseph Mior, [email protected], Fleming College.
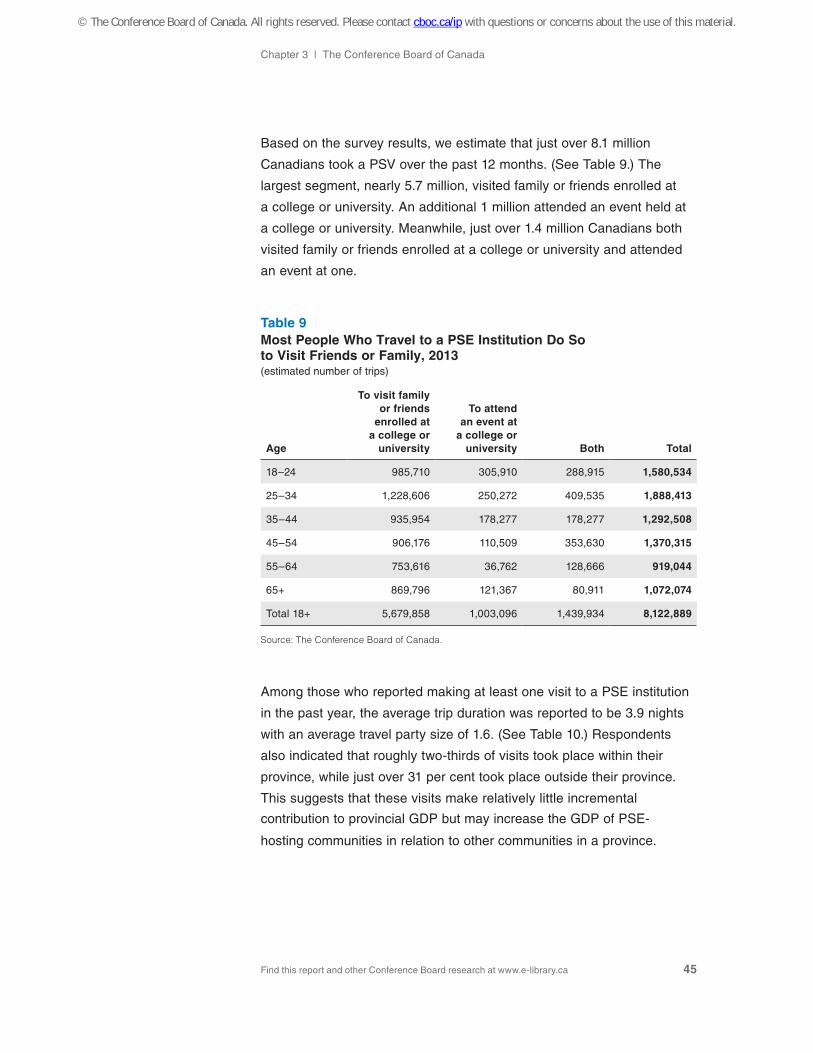
Chapter 3 | The Conference Board of Canada
Find this report and other Conference Board research at www.e-library.ca 45
Based on the survey results, we estimate that just over 8.1 million
Canadians took a PSV over the past 12 months. (See Table 9.) The
largest segment, nearly 5.7 million, visited family or friends enrolled at
a college or university. An additional 1 million attended an event held at
a college or university. Meanwhile, just over 1.4 million Canadians both
visited family or friends enrolled at a college or university and attended
an event at one.
Table 9Most People Who Travel to a PSE Institution Do Soto Visit Friends or Family, 2013(estimated number of trips)
Age
To visit family or friends
enrolled at a college or
university
To attend an event at
a college or university Both Total
18–24 985,710 305,910 288,915 1,580,534
25–34 1,228,606 250,272 409,535 1,888,413
35–44 935,954 178,277 178,277 1,292,508
45–54 906,176 110,509 353,630 1,370,315
55–64 753,616 36,762 128,666 919,044
65+ 869,796 121,367 80,911 1,072,074
Total 18+ 5,679,858 1,003,096 1,439,934 8,122,889
Source: The Conference Board of Canada.
Among those who reported making at least one visit to a PSE institution
in the past year, the average trip duration was reported to be 3.9 nights
with an average travel party size of 1.6. (See Table 10.) Respondents
also indicated that roughly two-thirds of visits took place within their
province, while just over 31 per cent took place outside their province.
This suggests that these visits make relatively little incremental
contribution to provincial GDP but may increase the GDP of PSE-
hosting communities in relation to other communities in a province.
© The Conference Board of Canada. All rights reserved. Please contact cboc.ca/ip with questions or concerns about the use of this material.
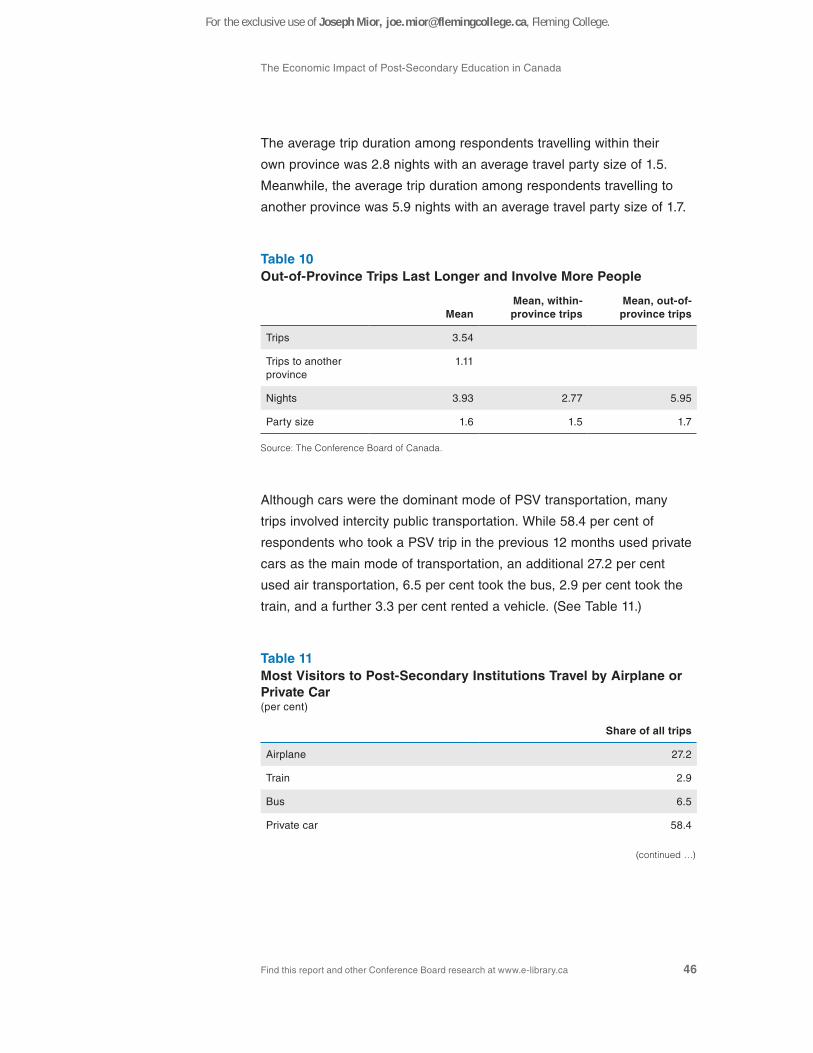
The Economic Impact of Post-Secondary Education in Canada
Find this report and other Conference Board research at www.e-library.ca 46
The average trip duration among respondents travelling within their
own province was 2.8 nights with an average travel party size of 1.5.
Meanwhile, the average trip duration among respondents travelling to
another province was 5.9 nights with an average travel party size of 1.7.
Table 10Out-of-Province Trips Last Longer and Involve More People
MeanMean, within-province trips
Mean, out-of-province trips
Trips 3.54
Trips to another province
1.11
Nights 3.93 2.77 5.95
Party size 1.6 1.5 1.7
Source: The Conference Board of Canada.
Although cars were the dominant mode of PSV transportation, many
trips involved intercity public transportation. While 58.4 per cent of
respondents who took a PSV trip in the previous 12 months used private
cars as the main mode of transportation, an additional 27.2 per cent
used air transportation, 6.5 per cent took the bus, 2.9 per cent took the
train, and a further 3.3 per cent rented a vehicle. (See Table 11.)
Table 11Most Visitors to Post-Secondary Institutions Travel by Airplane or Private Car(per cent)
Share of all trips
Airplane 27.2
Train 2.9
Bus 6.5
Private car 58.4
(continued …)
For the exclusive use of Joseph Mior, [email protected], Fleming College.
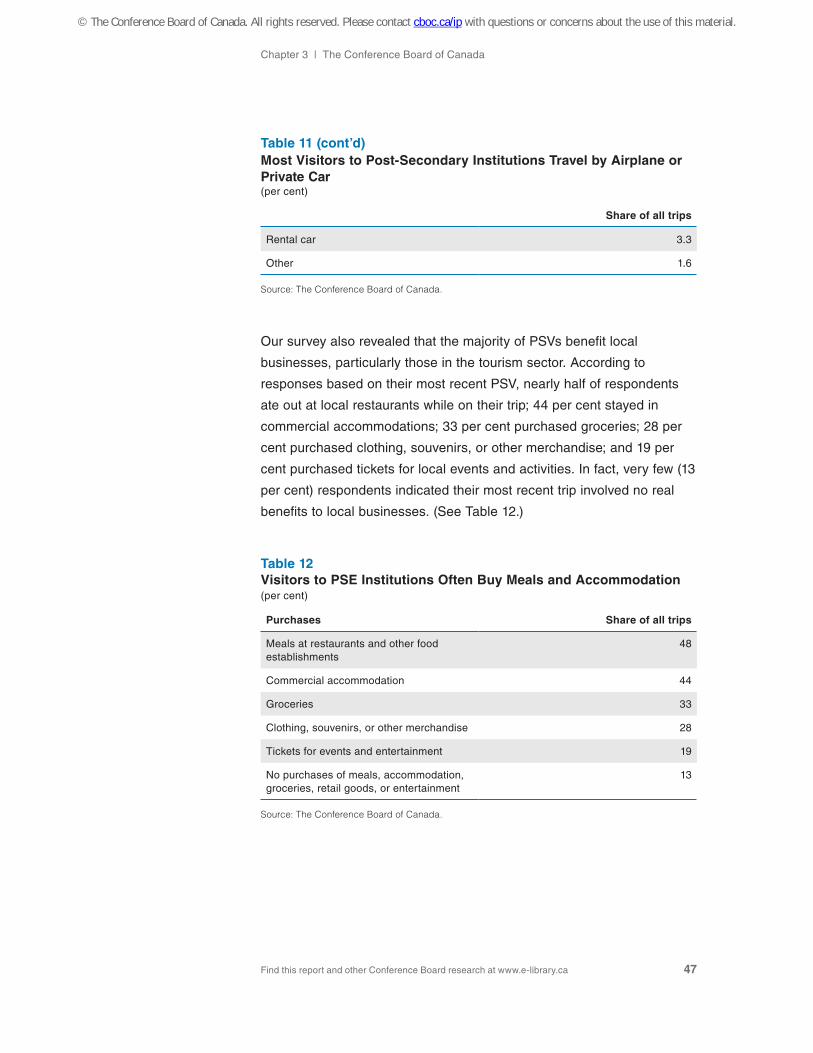
Chapter 3 | The Conference Board of Canada
Find this report and other Conference Board research at www.e-library.ca 47
Share of all trips
Rental car 3.3
Other 1.6
Source: The Conference Board of Canada.
Our survey also revealed that the majority of PSVs benefit local
businesses, particularly those in the tourism sector. According to
responses based on their most recent PSV, nearly half of respondents
ate out at local restaurants while on their trip; 44 per cent stayed in
commercial accommodations; 33 per cent purchased groceries; 28 per
cent purchased clothing, souvenirs, or other merchandise; and 19 per
cent purchased tickets for local events and activities. In fact, very few (13
per cent) respondents indicated their most recent trip involved no real
benefits to local businesses. (See Table 12.)
Table 12Visitors to PSE Institutions Often Buy Meals and Accommodation (per cent)
Purchases Share of all trips
Meals at restaurants and other food establishments
48
Commercial accommodation 44
Groceries 33
Clothing, souvenirs, or other merchandise 28
Tickets for events and entertainment 19
No purchases of meals, accommodation, groceries, retail goods, or entertainment
13
Source: The Conference Board of Canada.
Table 11 (cont’d)Most Visitors to Post-Secondary Institutions Travel by Airplane or Private Car(per cent)
© The Conference Board of Canada. All rights reserved. Please contact cboc.ca/ip with questions or concerns about the use of this material.
The Economic Impact of Post-Secondary Education in Canada
Find this report and other Conference Board research at www.e-library.ca 48
Based on the average spending of Canadian travellers who visit family or
friends, we conservatively estimate that trips to Canada’s PSE institutions
resulted in nearly $1.9 billion in spending during the past year.12 Apart
from a sizable share attributed to transportation costs, most of the $1.9
billion spent benefited local businesses near colleges and universities.
Our survey results reveal that PSE institutions contribute significantly
to tourism activity in Canada and that visits to them result in significant
benefits to transportation providers and local businesses.
Conclusion
PSE is big business. Annually, about $41 billion in spending flows
through Canada’s PSE system. Through second-round spending effects,
the gross economic impact on Canada from the PSE system is $55.7
billion, for a spending multiplier of 1.36. In addition to these direct
spending effects, PSE students spend an estimated $17.5 billion off
campus and have a gross economic impact of about $20 billion, after
second-round spending effects are considered. Moreover, we estimate
about $1.9 billion in PSE-related tourism spending.
The net economic impact is lower than these gross estimates for two
reasons. About 60 per cent of the spending at Canada’s universities and
colleges is funded by provincial governments. Provincial governments
must raise taxes to support this spending. So a large part of the
spending is, in effect, a transfer from taxpayers to PSE institutions.
Taxation at this level has some distorting effects on microeconomic
functioning. The net direct economic impact may be less than half of the
gross direct impact.
12 Based on data from Statistics Canada’s 2011 Travel Survey of Residents of Canada (TSRC), the average spending of Canadians visiting family and friends within the country was $57.64 per person, per night for overnight trips and $52.24 per trip for same-day trips. The reported figure of $1.9 billion for PSVs was calculated using only 50 per cent of the average spending for both overnight and same-day trips from the TSRC. We decided to use only 50 per cent of the average spending to account for the fact that, for many trips, a PSV is not the primary purpose of the trip.
For the exclusive use of Joseph Mior, [email protected], Fleming College.
Chapter 3 | The Conference Board of Canada
Find this report and other Conference Board research at www.e-library.ca 49
In addition to their direct and indirect impacts on the economy, colleges
and universities have an investment case to make to justify the
government financial support they receive. They can point to their role
in developing human and intellectual capital that raises the productive
capacity of the economy. The next two chapters critically assess PSE
institutions’ capacity as developers of human and intellectual capital.
© The Conference Board of Canada. All rights reserved. Please contact cboc.ca/ip with questions or concerns about the use of this material.
Find this report and other Conference Board research at www.e-library.ca
• Human capital theory attempts to explain why people invest in education beyondthe secondary level, where education is fully subsidized.
• University degree holders generate a 36 to 46 per cent annual return over highschool graduates.
• Between 2000 and 2010, the earnings premium for a university degree inCanada fell from $142 to $138 for every $100 earned by a person with a highschool diploma.
• Although a higher level of education clearly generates good labour marketreturns, disaggregation of results reveals wide variations between disciplines.
CHAPTER 4
PSE as a Human Capital Developer
Chapter Summary
For the exclusive use of Joseph Mior, [email protected], Fleming College.

Chapter 4 | The Conference Board of Canada
Find this report and other Conference Board research at www.e-library.ca 51
Over the last 50 years, economists have made significant strides in the conceptualization and measurement of private and public returns on investments in education. Gary Becker, winner of the Nobel Prize in Economic Sciences, conducted seminal work on “human capital” that is instrumental to the way economists think about and measure these investments.1 In Becker’s formulation, individuals invest in education based on an expected future stream of income and other benefits—very much like other types of investments. In Canada, society (through governments) underwrites PSE investments to capture the societal and economic benefits beyond those realized by the individual.
Although relatively simple in theory, in practice, human capital
investments at the post-secondary level are complex. Until they finish
secondary school in Canada’s public system, students receive a fully
subsidized education. After they graduate, however, they face tuition
and other costs in the PSE system today, without a guaranteed return
tomorrow. Moreover, investing in PSE is not like purchasing securities
like stocks or bonds. Security purchases are contracts between providers
and users of capital. Securities have large and liquid secondary markets
that allow investors to divest from their investment as circumstances
change. These markets also allow for “hedging” of risk. For human
capital investments, the provider of the capital is also the user, there is
no secondary market to liquidate the investment, and financial hedging is
largely absent.
1 Becker, Human Capital.
© The Conference Board of Canada. All rights reserved. Please contact cboc.ca/ip with questions or concerns about the use of this material.
The Economic Impact of Post-Secondary Education in Canada
Find this report and other Conference Board research at www.e-library.ca 52
Unlike other capital investments, the actual return that individuals
realize on PSE depends partly on their own ability and drive; partly on
the institution’s capacity to deliver a valuable educational experience
and facilitate the transition from school to employment; and partly on
the condition and functioning of the economy and labour market. The
educational system does more than educate people; it also shapes
labour market supply. PSE institutions may effectively create excess
supply or supply shortfalls that are reflected in labour market earnings.
In practice, the return individuals realize on their education investment
varies, even for people with the same level of education, because that
return depends on many other factors besides education. Aggregating
returns by level of education tends to smooth out this variability.
In practice, the actual return involves three factors:
• the educational experience (how capital is paid for and accumulated);
• school-to-work transition (linking the capital formation to its employment);
• employment experience (which leads to the ongoing accumulation of
capital through work).
Evidence on Returns on Education
A vast literature clearly shows significant and positive returns on
investments in education. Psacharopoulos and Patrinos reviewed
evidence for a sample of 42 countries.2 They found that every
additional year of education produces a 10 per cent return on the
investment. Interestingly, these returns are directly related to a country’s
development. The returns in less developed countries are significantly
higher than in developed countries. Psacharopoulos and Patrinos found
some evidence of diminishing returns on education beyond a certain
level. Disaggregating the data by country or occupation reveals where
such diminishing returns are most prevalent.
2 Psacharopoulos and Patrinos, “Returns to Investment.”
For the exclusive use of Joseph Mior, [email protected], Fleming College.

Chapter 4 | The Conference Board of Canada
Find this report and other Conference Board research at www.e-library.ca 53
These findings are pertinent to Canada, a developed country with a very
high rate of post-secondary enrolment. A number of Canadian studies
have focused specifically on the returns on higher education over the
long term. For example, Owram pointed out that university enrolments
took off around 1960. He noted, for instance, that enrolments grew as
much between 1963 and 1968 as they had from 1913 to 1963.3 Emery
picked up this point and attempted to explain the phenomenon.4 One
explanation is that rising enrolments reflected the change from blue
collar to white collar jobs. The earnings data clearly show that the labour
market demanded higher skills and the university system expanded to fill
this need.
A number of Canadian studies show how the job market values
education over time. For instance, Bourbeau, Lefebvre, and Merrigan
looked at returns from 1991 to 2006 based on census data.5 They found
that in the 1980–95 period, the labour market valued work experience
relatively highly, as returns on experience increased while returns on
education remained stable. However, since 1995, youth workers have
done better, especially those with higher education credentials. Their
work shows that the returns on university education are substantially
higher than those for college or CEGEP. It is also noteworthy that the
returns on education are very different depending on the province or
territory in question, which suggests that the actual return is partly about
the education but equally (or more) about the health of the labour market
that accepts graduates. Returns are especially high in Western Canada,
and particularly in Alberta, which generates the highest returns for those
with trade credentials.
Boothby and Drewes confirmed this hierarchy of returns.6 They used
census data for 1981, 1991, and 2001 to estimate returns and found
that the returns on non-university post-secondary diplomas (including
3 Owram, Born at the Right Time.
4 Emery, Total and Private Returns.
5 Bourbeau, Lefebvre, and Merrigan, Returns to Education.
6 Boothby and Drewes, “Post-Secondary Education in Canada.”
© The Conference Board of Canada. All rights reserved. Please contact cboc.ca/ip with questions or concerns about the use of this material.
The Economic Impact of Post-Secondary Education in Canada
Find this report and other Conference Board research at www.e-library.ca 54
community college, trade institution, and other vocational education
credentials) were small when compared with a high school diploma and
significantly less than a university degree. Ferrer and Riddell supported
this finding. They found that a community college or trade diploma
generated an 8 per cent annual return when compared with a high
school diploma.7 However, university degree holders generated a 36 to
46 per cent return over high school graduates.
Gunderson agreed that the overall evidence supports higher returns for
academic streams of higher education over technical and vocational
streams. However, he cautioned these studies may inflate the returns
because they have difficulty controlling for individual ability and drive,
as well as the shorter duration of vocational programs when compared
with university programs. In work with Krashinsky, Gunderson found that
apprentices generated a wage premium of 9.2 per cent over high school
dropouts but that these gains were exclusively concentrated in males,
as females actually experienced a negative return on investments in
apprenticeships.8
This evidence may explain the push toward expanding degree-granting
institutions (including conversions of colleges to degree-granting
institutions) and the expansion of college transfer programs. However,
Moussaly-Sergieh and Vaillancourt pointed out that degree granting is
not a panacea. When university graduates are grouped together, they
clearly demonstrate good overall returns on investments in university
education. Moussaly-Sergieh and Vaillancourt found that males investing
in an undergraduate degree could expect to see an annual return,
in after-tax earnings, of roughly 12 cents on the dollar, while female
students realized 14 cents per dollar. However, their disaggregated
7 Ferrer and Riddell, “The Role of Credentials.”
8 Gunderson and Krashinsky, Returns to Education. The negative economic returns for women, on average, are in large part a consequence of women’s proportionally higher enrolment in low-return fields, such as aesthetics and hairdressing. To be sure, women (and men) may experience other non-economic benefits from participation in apprenticeships in these fields—such as higher self-esteem, development of life skills, and better health outcomes—but on a purely economic analysis, the return raises some important issues.
For the exclusive use of Joseph Mior, [email protected], Fleming College.
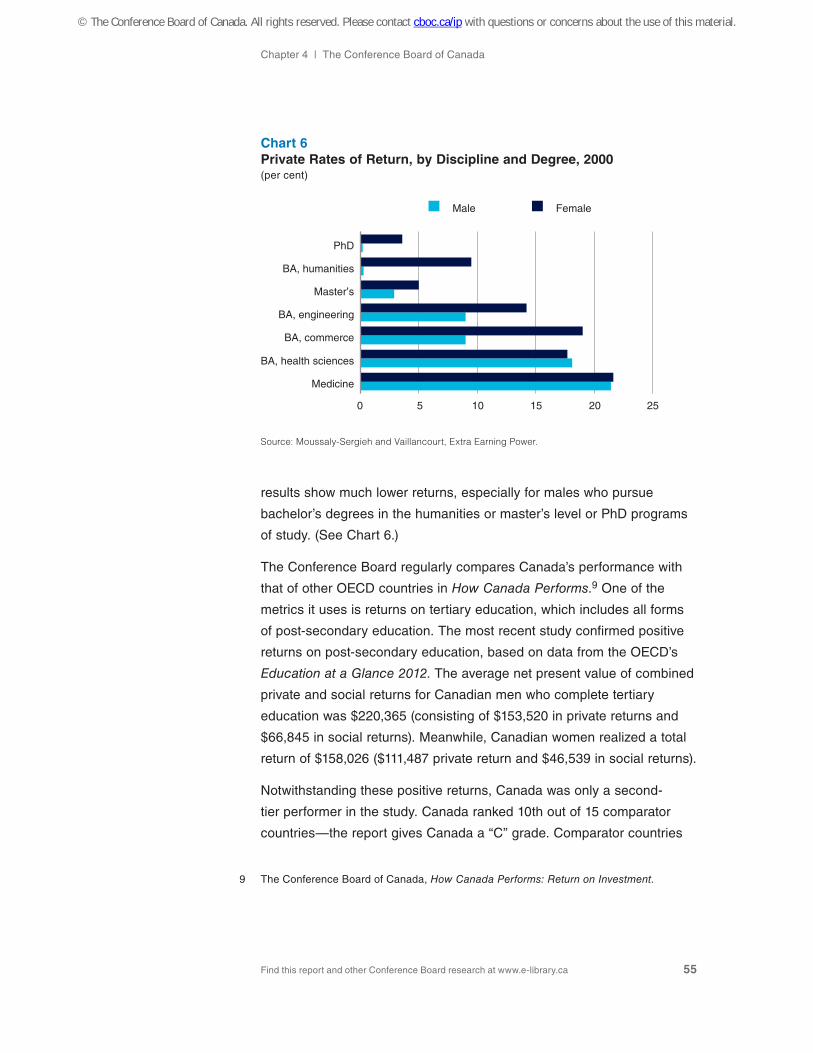
Chapter 4 | The Conference Board of Canada
Find this report and other Conference Board research at www.e-library.ca 55
results show much lower returns, especially for males who pursue
bachelor’s degrees in the humanities or master’s level or PhD programs
of study. (See Chart 6.)
The Conference Board regularly compares Canada’s performance with
that of other OECD countries in How Canada Performs.9 One of the
metrics it uses is returns on tertiary education, which includes all forms
of post-secondary education. The most recent study confirmed positive
returns on post-secondary education, based on data from the OECD’s
Education at a Glance 2012. The average net present value of combined
private and social returns for Canadian men who complete tertiary
education was $220,365 (consisting of $153,520 in private returns and
$66,845 in social returns). Meanwhile, Canadian women realized a total
return of $158,026 ($111,487 private return and $46,539 in social returns).
Notwithstanding these positive returns, Canada was only a second-
tier performer in the study. Canada ranked 10th out of 15 comparator
countries—the report gives Canada a “C” grade. Comparator countries
9 The Conference Board of Canada, How Canada Performs: Return on Investment.
Chart 6Private Rates of Return, by Discipline and Degree, 2000 (per cent)
Medicine
BA, health sciences
BA, commerce
BA, engineering
Master’s
BA, humanities
PhD
5 100 15 20 25
Male Female
Source: Moussaly-Sergieh and Vaillancourt, Extra Earning Power.
© The Conference Board of Canada. All rights reserved. Please contact cboc.ca/ip with questions or concerns about the use of this material.
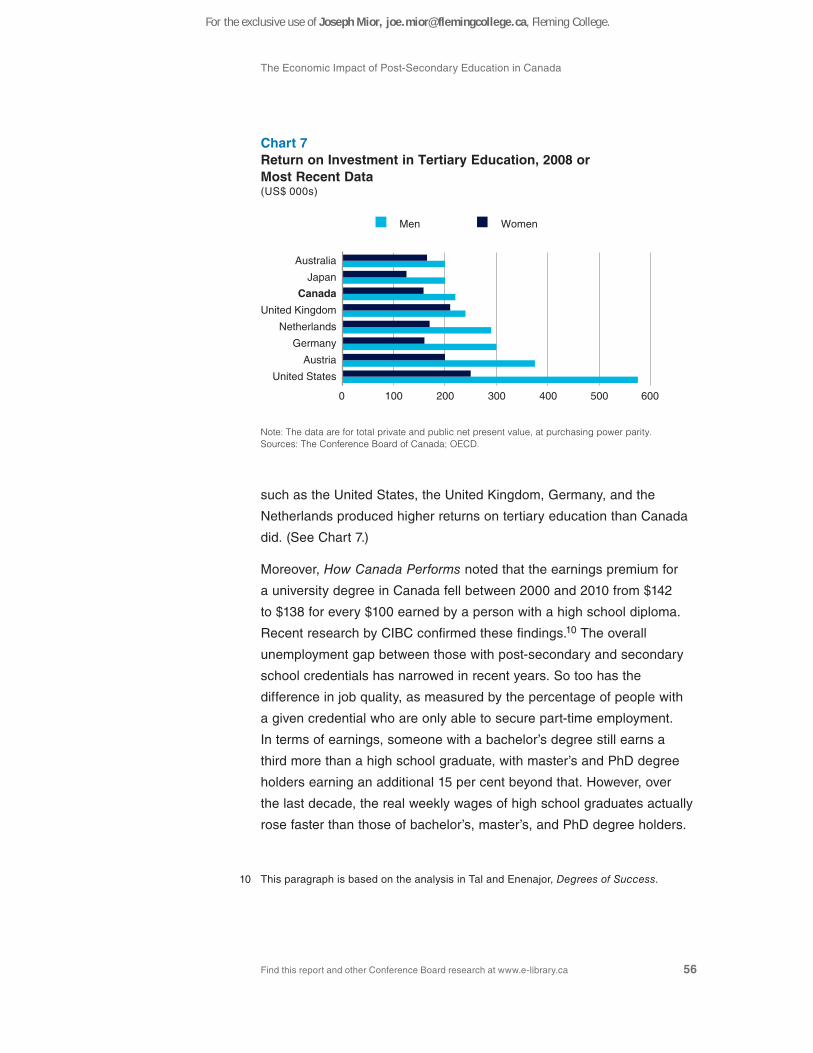
The Economic Impact of Post-Secondary Education in Canada
Find this report and other Conference Board research at www.e-library.ca 56
such as the United States, the United Kingdom, Germany, and the
Netherlands produced higher returns on tertiary education than Canada
did. (See Chart 7.)
Moreover, How Canada Performs noted that the earnings premium for
a university degree in Canada fell between 2000 and 2010 from $142
to $138 for every $100 earned by a person with a high school diploma.
Recent research by CIBC confirmed these findings.10 The overall
unemployment gap between those with post-secondary and secondary
school credentials has narrowed in recent years. So too has the
difference in job quality, as measured by the percentage of people with
a given credential who are only able to secure part-time employment.
In terms of earnings, someone with a bachelor’s degree still earns a
third more than a high school graduate, with master’s and PhD degree
holders earning an additional 15 per cent beyond that. However, over
the last decade, the real weekly wages of high school graduates actually
rose faster than those of bachelor’s, master’s, and PhD degree holders.
10 This paragraph is based on the analysis in Tal and Enenajor, Degrees of Success.
Chart 7Return on Investment in Tertiary Education, 2008 orMost Recent Data(US$ 000s)
United States
Austria
Germany
Netherlands
United Kingdom
Canada
Japan
Australia
0 100 200 300 400 500 600
Men Women
Note: The data are for total private and public net present value, at purchasing power parity. Sources: The Conference Board of Canada; OECD.
For the exclusive use of Joseph Mior, [email protected], Fleming College.
Chapter 4 | The Conference Board of Canada
Find this report and other Conference Board research at www.e-library.ca 57
The Educational Experience
The literature on returns on education distinguishes between years
of schooling and educational attainment. The distinction is important
because of so-called sheepskin effects —an educational credential
is a signal to employers of acquired skill. Achieving a full credential is
especially important in post-secondary education. For instance, when
Ferrer and Riddell compared the earnings of completers with those of
non-completers, they found completers earned 4 to 6 per cent more
for a high school diploma; 6 per cent more than that for completion of
a community college or trade school program without a high school
diploma; and 3 to 5 per cent more than that for completion of a
community college or trade school program with a high school diploma.
However, the greatest earnings effect was at the bachelor’s degree level,
where completers earned over 20 per cent more than non-completers.
These results explain why completion rates are especially important in
PSE. For example, British Columbia has more than 309,000 students
enrolled at any one time. In 2010–11, 103,934 exited the system, but only
55,877 did so with a credential.11 In 2010 –11, roughly 19,000 students
went back to the same institution after stopping out, 15,000 moved to
a new institution after stopping out, and 3,600 returned to an institution
they attended previously from another institution after stopping out.
Other work from BCStats found that those stopping out generally
had a favourable opinion of the institutions they attended.12 However,
they differed from completers in that their studies tended to be more
academically oriented than employment oriented. Moreover, leavers
found these studies more challenging than did completers. Interestingly,
leavers were more motivated by the pursuit of a credential, usually in
the arts, than were completers, who were driven more by specific skill
acquisition. Their employment experience showed that the pursuit of a
general credential did not pay dividends in the labour market.
11 British Columbia Ministry of Advanced Education, Student Pathways.
12 BCStats, Completers Versus Leavers.
© The Conference Board of Canada. All rights reserved. Please contact cboc.ca/ip with questions or concerns about the use of this material.
The Economic Impact of Post-Secondary Education in Canada
Find this report and other Conference Board research at www.e-library.ca 58
As the economy and society place more emphasis on longer school
stays, more flexibility may be required in the system. The elongation of
school stays is resulting in greater variation in individual patterns of study
and work. Canadians are more likely to interrupt their education, return
to school later in life, and explore non-PSE avenues of higher learning
as they sort through career options. So, although they may still wish to
pursue advanced education, they are much more likely to want flexible
learning options as they do so. This argues for more flexible learning
options among different types of PSE institutions.
Another issue relates to the quality of the learning experience and the
acquisition of skills. Individual institutions differ significantly in the way
they engage students in the learning experience. The National Survey
on Student Engagement (NSSE), a survey of post-secondary students
in Canada and the United States, provides some idea of how students
rank their educational experience. For example, one metric considers
the degree of engagement with faculty in teaching and research. (See
Table 13.) The 2012 results are based on a sample of 570 colleges
and universities in Canada and the United States. The data show that
engagement improves as students proceed from freshman studies to
their senior year.
We alluded to the trend toward larger classes in some disciplines.
This trend may partially explain student disengagement and high rates
of stopping or dropping out. A lack of engagement may be jarring for
students used to a high level of engagement in high school. Some of
Canada’s largest universities score well below the average on this metric,
but Canada’s smaller undergraduate universities score extremely well.
(See box “What Is Unique About Quest University Canada?”) However,
these small public undergraduate teaching universities operate under the
same funding model as much larger universities.
For the exclusive use of Joseph Mior, [email protected], Fleming College.

Chapter 4 | The Conference Board of Canada
Find this report and other Conference Board research at www.e-library.ca 59
Table 13Level of Faculty Interaction, Selected Universitiesand Colleges, 2012(mean score)
First year Senior year
Quest University Canada 56.3 69.6
Acadia University 34.0 44.9
Bishop’s University 32.9 47.5
Trinity Western University 32.2 43.1
NSSE Average 35.2 42.5
Sheridan College 34.0 42.0
Wilfrid Laurier University 24.4 33.4
University of Guelph 20.1 32.2
University of Toronto 23.0 32.2
University of Alberta 23.1 31.5
University of British Columbia
23.1 31.2
University of Regina 24.7 31.0
York University 23.5 31.0
University of Ottawa 20.0 28.9
Université Laval 16.4 27.4
Note: Interaction was scored on a scale from 1 to 100, with 100 being the best. Source: National Survey of Student Engagement (NSSE).
Although PSE institutions often claim to develop advanced skills, the
evidence of acquired learning is still very much the same as it has
always has been—namely, certificates, diplomas, and degrees related to
a specific discipline, awarded largely on the basis of academic activities
such as essays and exams. However, the development of critical thinking
skills is only indirectly related to this pedagogical approach.
In the U.S. context, authors Richard Arum and Josipa Roksa attempted
to independently verify the acquisition of critical thinking skills by using
the OECD’s Collegiate Learning Assessment tool. The OECD uses this
statistical instrument to carry out its 17-country Assessment of Higher
© The Conference Board of Canada. All rights reserved. Please contact cboc.ca/ip with questions or concerns about the use of this material.
The Economic Impact of Post-Secondary Education in Canada
Find this report and other Conference Board research at www.e-library.ca 60
Education Learning Outcomes (AHELO) Project.13 Arum and Roksa
found that 45 per cent of 2,300 U.S. college students who used the tool
showed no statistically significant improvement in critical thinking skills
after their first two years in college. (It would be helpful to replicate this
study for Canada.)
What Is Unique About Quest University Canada?
Quest University Canada is a small liberal arts and sciences university
in Squamish, British Columbia. It has attracted attention because of its
extremely high scores on various indicators of the National Survey on Student
Engagement. It is the top-scoring Canadian university on student-faculty
interaction, enriching educational experiences, and active and collaborative
learning.14
Much has been made of Quest’s unique block learning model. In the typical
semester system, students take multiple courses per term, spending three
hours of lecture time per week per course. Students then complete outside
assignments, which may consume about the same time as lectures. This
pedagogy requires students to be good time managers and to focus while
shifting between different subjects.
By contrast, the block system focuses students on one subject at a time. Each
course is taught for three hours a day every weekday in three-and-a-half-week
stretches. In addition, students spend roughly five hours on classwork outside of
class each day. This approach naturally focuses students. They are encouraged
to identify broad questions and to design innovative ways to explore answers
during the block. Moreover, the block system allows the university to attract
adjunct faculty. It is much easier for adjunct faculty to make a three-and-a-half-
week commitment to teach at Quest than a 12-week part-time commitment at a
typical university. As a result, Quest is able to attract top adjunct talent for short
stretches of teaching.
13 Arum and Roksa, Academically Adrift.
14 National Survey on Student Engagement, NSSE Annual Results 2012.
For the exclusive use of Joseph Mior, [email protected], Fleming College.
Chapter 4 | The Conference Board of Canada
Find this report and other Conference Board research at www.e-library.ca 61
The economics of the Quest business model is also unique. Quest is modelled
on private liberal arts and sciences colleges, which are common in other
jurisdictions (most notably the United States) but foreign to Canada. The
criticism is that private universities are elitist because they charge students
full tuition, room, and board that can amount to $40,000 per year. However,
Quest explicitly manages the social mix through a blend of merit-based and
need-based scholarships.
The merit-based scholarships take the form of institutional scholarships. For
instance, the David W. Strangway Scholarship covers full tuition for four years
(worth $125,000). Six of these are awarded every year. Meanwhile, the Quest
University Canada Scholarships provide between $2,000 and $24,000 based
on merit and other factors that Quest deems important to the social mix and
learning environment at Quest.
The need-based grants are allocated to students based on family income
(as determined by tax filings). The first $1,320 of each need-based award is
in the form of a guaranteed work-study job on campus ($11 per hour for 120
hours). Jobs range from library assistant and peer tutor to groundskeeper and
maintenance worker, and amount to either four hours per week or a full-time
job for one month (May or August). This component of the grant is optional. In
addition, the student may be eligible for need-based grants up to the amount of
tuition. Fifty per cent of students receive a need-based grant, and over 25 per
of all Quest students are from families with an annual household income of less
than $70,000. All students are also eligible for government financial aid.
Quest’s classes are capped at 20, with an average class size of 16 students.
However, its production costs are in line with those of major universities. It does
not receive government operating grants, so tuition costs reflect production costs
more directly here than at most other Canadian PSE institutions. Quest focuses
on the learning experience. It cross-subsidizes tuition to improve access and to
create a diverse student population. It does not cross-subsidize from teaching
to research activities. This model clearly produces highly engaged learners who
rank their learning experiences extremely highly.
© The Conference Board of Canada. All rights reserved. Please contact cboc.ca/ip with questions or concerns about the use of this material.
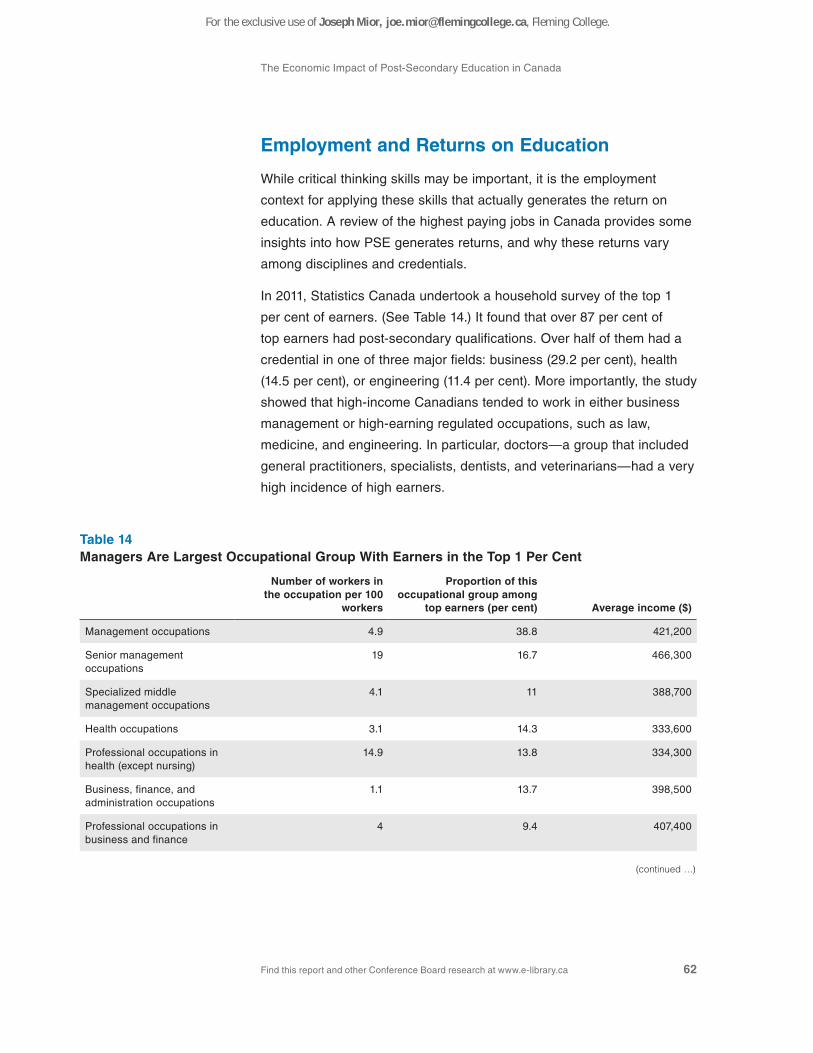
The Economic Impact of Post-Secondary Education in Canada
Find this report and other Conference Board research at www.e-library.ca 62
Employment and Returns on Education
While critical thinking skills may be important, it is the employment
context for applying these skills that actually generates the return on
education. A review of the highest paying jobs in Canada provides some
insights into how PSE generates returns, and why these returns vary
among disciplines and credentials.
In 2011, Statistics Canada undertook a household survey of the top 1
per cent of earners. (See Table 14.) It found that over 87 per cent of
top earners had post-secondary qualifications. Over half of them had a
credential in one of three major fields: business (29.2 per cent), health
(14.5 per cent), or engineering (11.4 per cent). More importantly, the study
showed that high-income Canadians tended to work in either business
management or high-earning regulated occupations, such as law,
medicine, and engineering. In particular, doctors—a group that included
general practitioners, specialists, dentists, and veterinarians—had a very
high incidence of high earners.
Table 14Managers Are Largest Occupational Group With Earners in the Top 1 Per Cent
Number of workers in the occupation per 100
workers
Proportion of this occupational group among
top earners (per cent) Average income ($)
Management occupations 4.9 38.8 421,200
Senior management occupations
19 16.7 466,300
Specialized middle management occupations
4.1 11 388,700
Health occupations 3.1 14.3 333,600
Professional occupations in health (except nursing)
14.9 13.8 334,300
Business, finance, and administration occupations
1.1 13.7 398,500
Professional occupations in business and finance
4 9.4 407,400
(continued …)
For the exclusive use of Joseph Mior, [email protected], Fleming College.
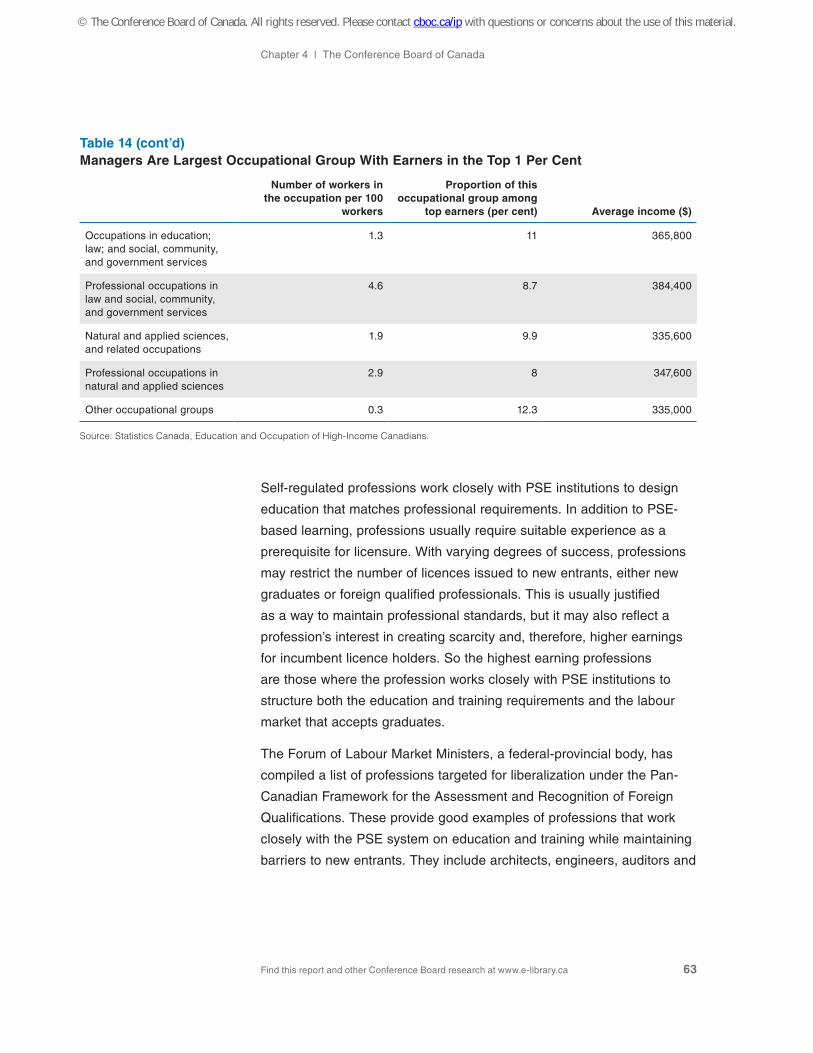
Chapter 4 | The Conference Board of Canada
Find this report and other Conference Board research at www.e-library.ca 63
Number of workers in the occupation per 100
workers
Proportion of this occupational group among
top earners (per cent) Average income ($)
Occupations in education; law; and social, community, and government services
1.3 11 365,800
Professional occupations in law and social, community, and government services
4.6 8.7 384,400
Natural and applied sciences, and related occupations
1.9 9.9 335,600
Professional occupations in natural and applied sciences
2.9 8 347,600
Other occupational groups 0.3 12.3 335,000
Source: Statistics Canada, Education and Occupation of High-Income Canadians.
Self-regulated professions work closely with PSE institutions to design
education that matches professional requirements. In addition to PSE-
based learning, professions usually require suitable experience as a
prerequisite for licensure. With varying degrees of success, professions
may restrict the number of licences issued to new entrants, either new
graduates or foreign qualified professionals. This is usually justified
as a way to maintain professional standards, but it may also reflect a
profession’s interest in creating scarcity and, therefore, higher earnings
for incumbent licence holders. So the highest earning professions
are those where the profession works closely with PSE institutions to
structure both the education and training requirements and the labour
market that accepts graduates.
The Forum of Labour Market Ministers, a federal-provincial body, has
compiled a list of professions targeted for liberalization under the Pan-
Canadian Framework for the Assessment and Recognition of Foreign
Qualifications. These provide good examples of professions that work
closely with the PSE system on education and training while maintaining
barriers to new entrants. They include architects, engineers, auditors and
Table 14 (cont’d)Managers Are Largest Occupational Group With Earners in the Top 1 Per Cent
© The Conference Board of Canada. All rights reserved. Please contact cboc.ca/ip with questions or concerns about the use of this material.
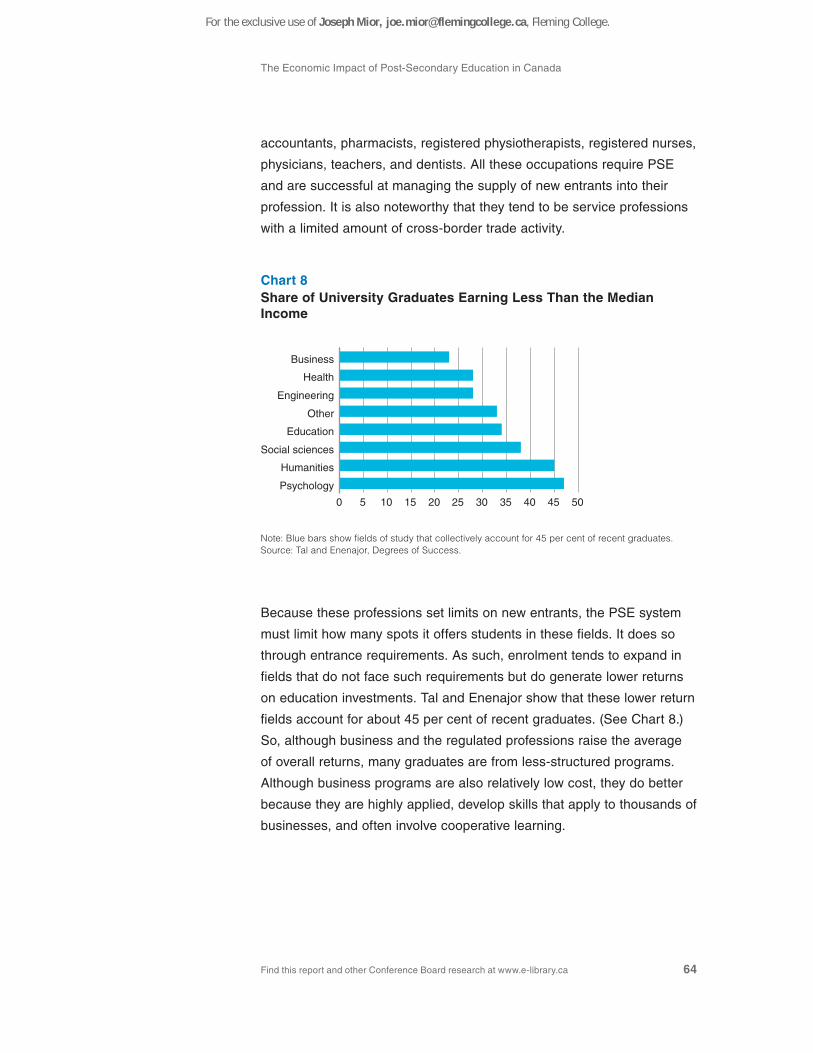
The Economic Impact of Post-Secondary Education in Canada
Find this report and other Conference Board research at www.e-library.ca 64
accountants, pharmacists, registered physiotherapists, registered nurses,
physicians, teachers, and dentists. All these occupations require PSE
and are successful at managing the supply of new entrants into their
profession. It is also noteworthy that they tend to be service professions
with a limited amount of cross-border trade activity.
Because these professions set limits on new entrants, the PSE system
must limit how many spots it offers students in these fields. It does so
through entrance requirements. As such, enrolment tends to expand in
fields that do not face such requirements but do generate lower returns
on education investments. Tal and Enenajor show that these lower return
fields account for about 45 per cent of recent graduates. (See Chart 8.)
So, although business and the regulated professions raise the average
of overall returns, many graduates are from less-structured programs.
Although business programs are also relatively low cost, they do better
because they are highly applied, develop skills that apply to thousands of
businesses, and often involve cooperative learning.
Chart 8Share of University Graduates Earning Less Than the Median Income
Psychology
Humanities
Social sciences
Education
Other
Engineering
Health
Business
1050 15 20 25 30 35 40 45 50
Note: Blue bars show fields of study that collectively account for 45 per cent of recent graduates. Source: Tal and Enenajor, Degrees of Success.
For the exclusive use of Joseph Mior, [email protected], Fleming College.

Chapter 4 | The Conference Board of Canada
Find this report and other Conference Board research at www.e-library.ca 65
Humanities and arts programs are much more likely to rely on the
development of general critical thinking skills not specific to any
occupation. As Arum and Roksa’s work showed, it is unclear that
graduates actually acquire these skills. Professional occupation
programs develop critical thinking skills but also show students how
to apply them to specific types of occupational issues. In arts and
humanities programs, it is up to the employer—largely through trial and
error—to determine whether students have truly acquired these skills
and know how to apply them in a particular work setting. In the future,
employers are likely to see more and more graduates with these types
of credentials.
Clearly, investments in education have very different risks and returns,
depending on the school-to-work pathways. Some pathways are likely
to guarantee high returns, while others are much riskier. On average,
post-secondary graduates do well, but the areas where enrolment is
expanding tend to be riskier in terms of earnings potential.
Conclusion
As a general principle, education is a good investment. It generates
significant private and social returns. However, there is evidence of
decreasing returns as institutions grow larger. The earnings of PSE
graduates are clearly not evenly distributed. The highest returns
are concentrated in business and self-regulated professions. When
colleges and universities develop people for these professions, they are
successful at generating good returns.
Under current funding models, there is little incentive for PSE institutions
to expand enrolments in higher cost programs that may actually generate
higher returns by developing job-specific skills. Enrolment incentives
encourage colleges and universities to expand offerings into areas where
they can lower costs and use existing excess capacity. However, more
enrolments in such general programs, often in the arts and humanities,
are only indirectly related to labour market needs. While arts and
humanities graduates often achieved good returns in the past because
© The Conference Board of Canada. All rights reserved. Please contact cboc.ca/ip with questions or concerns about the use of this material.

The Economic Impact of Post-Secondary Education in Canada
Find this report and other Conference Board research at www.e-library.ca 66
the economy required a certain number of people with critical thinking
skills, there are signs that the demand for general skills may be reaching
a limit and that new graduates in general programs are not doing as well
as previous graduates.
For the exclusive use of Joseph Mior, [email protected], Fleming College.
Find this report and other Conference Board research at www.e-library.ca
• In 2012, Canadian governments spent over $4.5 billion on university research,primarily through major federal granting councils.
• As a result of funding, Canada performs well in generating ideas, publishingideas in academic journals, and having research cited.
• However, Canada is very weak in converting new ideas into better products,services, and processes that improve Canadians’ lives and contribute toeconomic performance.
• Canada’s universities could do more to embrace the opportunities for appliedresearch. Embracing such a mandate is probably more important than PSEintellectual property policy in determining the level of commercialization.
• Assigning multifactor productivity gains to university research without explainingthe specific mechanism by which research affects productivity is not aconvincing or reliable way to demonstrate the value of university research.
CHAPTER 5
Universities as Intellectual Capital Developers
Chapter Summary
© The Conference Board of Canada. All rights reserved. Please contact cboc.ca/ip with questions or concerns about the use of this material.
The Economic Impact of Post-Secondary Education in Canada
Find this report and other Conference Board research at www.e-library.ca 68
In 2012, Canadian governments spent over $4.5 billion on university research, primarily through major federal granting councils.1 The federal financial commitment to higher education research more than doubled, in real (inflation-adjusted) terms, between 2000 and 2012.2 This additional funding has affected both the size and the functioning of Canada’s university sector. As a university administrator told us, tenured faculty members are drawn more into research activities, which often means fewer teaching hours. This has resulted in either larger class sizes per tenured faculty member or increased use of non-faculty teachers.3
The transfer of resources from Canadians to universities is tangible and
measured. What tangible results are obtained from this investment in
university research? This is not a straightforward question. To begin,
there may not be a direct relationship between basic research and
tangible results. Research may proceed for many years and through
multiple channels before ideas are translated into products, services,
and processes that improve Canadians’ lives and contribute to economic
performance. Nevertheless, governments and others are asking
universities to justify research investment in terms of the applicability of
findings to the broader economy and society.
This chapter considers universities’ activities as intellectual capital
developers. It explores aspects of the current approach to university
research funding and the outcomes of these activities.
1 CAUBO, Financial Information.
2 Statistics Canada, CANSIM table 358-0001.
3 Interview by Michael Grant, January 17, 2014.
For the exclusive use of Joseph Mior, [email protected], Fleming College.
Chapter 5 | The Conference Board of Canada
Find this report and other Conference Board research at www.e-library.ca 69
Innovation and Impact
From an economic perspective, intellectual capital generates a return
when it is incorporated into tangible products, services, and processes
that businesses and consumers want to buy. New ideas change the
way things are produced and the nature of products, services, and
processes. This change is called innovation.
The Conference Board of Canada defines innovation “as the process
through which economic and social value is extracted from knowledge
by generating, developing, and implementing ideas to produce new or
improved strategies, capabilities, products, services, or processes.”4
We distinguish between radical and incremental innovation. Successful
radical innovators do more than just innovate; they also fundamentally
change markets by sweeping away old ways of doing things. Meanwhile,
incremental innovation gradually improves products, services, and
processes. When innovations are incorporated into products, services,
and processes that people value and pay for, innovation is said to be
commercialized.
From Patent to Performance
It is important to understand how the innovation commercialization
process unfolds. Some innovators may protect their ideas from copying
through copyright, trademarks, patents, and trade secrets. Intellectual
property (IP) protection is a signal that the innovator may choose to
commercialize her or his ideas. However, it is not necessarily evidence
of actual commercialization. For instance, if an academic is motivated
by academic advancement, then the important thing is to copyright
publications and to have other academics cite the work in their
papers. Academic advancement is related to publication and citation
performance. If academic advancement is the researcher’s goal, then
there is little need to commercialize ideas.
4 The Conference Board of Canada, Centre for Business Innovation: Innovation Defined.
© The Conference Board of Canada. All rights reserved. Please contact cboc.ca/ip with questions or concerns about the use of this material.

The Economic Impact of Post-Secondary Education in Canada
Find this report and other Conference Board research at www.e-library.ca 70
IP protection is a form of market protection. It protects the holder by
preventing others from profiting from the ideas. However, the economic
value of IP is not determined by the protection per se, but rather by
the commercialization process. IP simply structures the market for
commercializing ideas by shaping competition. Although firms are funded
by capital markets partly on their ownership of IP, their ability to reach
paying customers is equally or more important. It is not enough to have a
good idea; firms need to commercialize the ideas to attract capital.
As one moves away from basic research toward commercialization,
many business capabilities come into play. As an indication, in
2013, Apple Inc. spent over twice as much on selling, general, and
administrative expenses (US$10.8 billion) as it did on research and
development (R&D; US$4.4 billion).5 Indeed, a Booz and Company study
found little direct relationship between innovation success and R&D
spending.6 Companies like Apple, Google, 3M, and General Electric are
regarded as leading innovators yet rank well down the list of top R&D
spenders. These companies are excellent at thinking up products and
services that people want, focusing their research efforts on areas where
they can establish a unique value proposition, and attracting paying
customers to their products. They also acquire promising technologies
from entrepreneurial companies.
IP, especially patents, is a rather broad indicator of intent to
commercialize. More significant than IP itself is its use by companies.
When IP is created at a university, university researchers may license
their ideas to companies, or the researchers or others associated with
the university may start and grow companies based on ideas developed
at the university. It is these companies that create enterprise value
and employment; it is through commercialization that economic value
is created.
5 Apple Inc., 10K Filing, 33.
6 Booz and Company, Global Innovation.
For the exclusive use of Joseph Mior, [email protected], Fleming College.
Chapter 5 | The Conference Board of Canada
Find this report and other Conference Board research at www.e-library.ca 71
Assessing Canada’s Performance
Canada lags behind major competitors in innovation performance.
The innovation section of a Conference Board of Canada report, How
Canada Performs, gives Canada a “D” grade.7 How Canada Performs
divides innovation metrics into three areas: creation of ideas, diffusion
of ideas, and transformation as companies apply ideas. Canada
performs relatively well on idea creation, as measured by academic-
specific metrics, such as number of scientific articles, public spending
on R&D (much of which is performed in universities), and cited papers.
However, we are weak in the commercialization stages that establish
property rights to ideas (IP) and the use of IP to create unique company
value propositions. Canadians are good at starting companies but
not very good at using innovation value propositions to grow them to
significant size. The performance of academic-specific metrics suggests
that academics are mostly concerned with academic advancement
through publication.
Canada performs relatively poorly in comparison with other advanced
countries on the overall number of patents and the patent/population
ratio. Other advanced countries also do better than Canada in using
scientific articles to develop or enhance manufacturing or service
industries. Countries such as Japan and Germany perform very well in
terms of using scientific publications to improve industry performance,
whereas countries such as the United States, the United Kingdom, and
Australia perform better than Canada in high-end services.
(See Chart 9.)
The Council of Canadian Academies formed an expert panel to look
at the incongruity between Canada’s academic research performance
and its lack of innovation commercialization.8 The panel concluded that
Canadian businesses chose not to pursue innovation as a business
strategy. The panel puts this down to structural features of the Canadian
7 The Conference Board of Canada, How Canada Performs: Innovation. The next paragraph on performance also draws from this source.
8 The Expert Panel on Business Innovation, Innovation and Business Strategy, 8–9.
© The Conference Board of Canada. All rights reserved. Please contact cboc.ca/ip with questions or concerns about the use of this material.
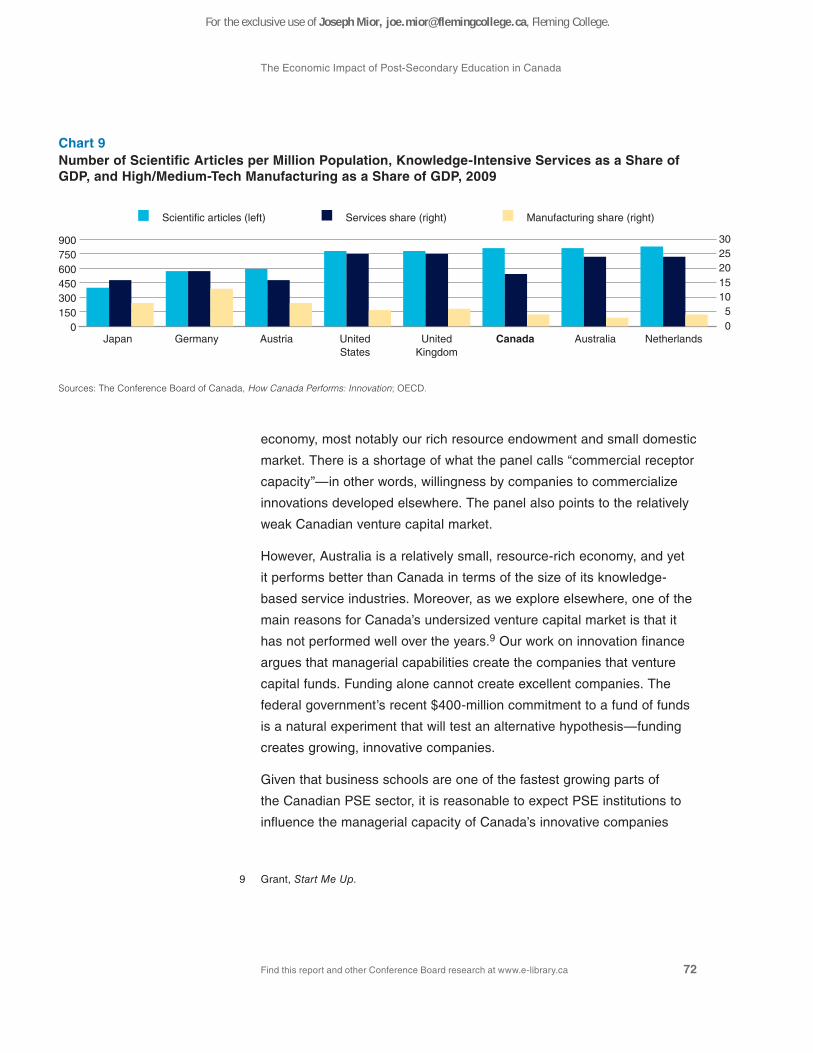
The Economic Impact of Post-Secondary Education in Canada
Find this report and other Conference Board research at www.e-library.ca 72
economy, most notably our rich resource endowment and small domestic
market. There is a shortage of what the panel calls “commercial receptor
capacity”—in other words, willingness by companies to commercialize
innovations developed elsewhere. The panel also points to the relatively
weak Canadian venture capital market.
However, Australia is a relatively small, resource-rich economy, and yet
it performs better than Canada in terms of the size of its knowledge-
based service industries. Moreover, as we explore elsewhere, one of the
main reasons for Canada’s undersized venture capital market is that it
has not performed well over the years.9 Our work on innovation finance
argues that managerial capabilities create the companies that venture
capital funds. Funding alone cannot create excellent companies. The
federal government’s recent $400-million commitment to a fund of funds
is a natural experiment that will test an alternative hypothesis—funding
creates growing, innovative companies.
Given that business schools are one of the fastest growing parts of
the Canadian PSE sector, it is reasonable to expect PSE institutions to
influence the managerial capacity of Canada’s innovative companies
9 Grant, Start Me Up.
Chart 9Number of Scientific Articles per Million Population, Knowledge-Intensive Services as a Share of GDP, and High/Medium-Tech Manufacturing as a Share of GDP, 2009
Japan Germany Austria UnitedStates
UnitedKingdom
Canada Australia Netherlands0
150300450600750900
05
1015202530
Scientific articles (left) Services share (right) Manufacturing share (right)
Sources: The Conference Board of Canada, How Canada Performs: Innovation; OECD.
For the exclusive use of Joseph Mior, [email protected], Fleming College.
Chapter 5 | The Conference Board of Canada
Find this report and other Conference Board research at www.e-library.ca 73
and to improve the links between companies and university research.
The Council of Canadian Academies is right to point out that this is
all about the approach to business. It is not merely business strategy
but also strategy execution. Thousands of business people are trained
at Canada’s PSE institutions and they are the ones Canada needs to
commercialize ideas.
Incentives or Predisposition?
Canada’s PSE institutions can help improve the weak links between
university research and commercialization in two ways. They can
educate people who go on to commercialize ideas or they can form
links with companies (either established companies or start-ups) to
commercialize ideas.
Regarding the first strategy, entrepreneurial drive and skill are probably
as important as technical skill in forming and growing innovative
companies. Clearly, the data show that successful people tend to
have university degrees (despite the impressive list of innovative,
entrepreneurial university dropouts who have formed highly successful
companies, including Bill Gates, Steve Jobs, Mark Zuckerberg, Richard
Branson, Michael Dell, and Ralph Lauren). However, entrepreneurship is
a unique way to succeed because it involves a combination of technical
skill, risk-taking, and business acumen.
It is unclear how PSE develops skills like risk-taking and business
acumen. Startup Genome, the entrepreneurial mapping initiative, found
that Silicon Valley had a higher ratio of graduate degree holders among
its entrepreneurial base than did major Canadian centres like Toronto or
Vancouver (which scored especially low on this metric). This suggests
that individual PSE institutions vary in the way they prepare graduates for
entrepreneurism. (See Table 15.)
© The Conference Board of Canada. All rights reserved. Please contact cboc.ca/ip with questions or concerns about the use of this material.

The Economic Impact of Post-Secondary Education in Canada
Find this report and other Conference Board research at www.e-library.ca 74
Table 15Top Start-Up Regions, by Start-Up Entrepreneurs’Level of Education(ratio of entrepreneurs with graduate degree to all other entrepreneurs)
Education
Toronto 1.4 : 1
Vancouver 0.6 : 1
Waterloo 2.3 : 1
Silicon Valley 2.5 : 1
Source: Startup Genome.
The Southern Ontario city of Waterloo looks more like Silicon Valley in
the ratio of graduate degree holders to non-holders in the entrepreneurial
base. Waterloo attracts a lot of attention because of its relatively high
number of successful start-ups. By one estimate,10 there were 575
companies in the Waterloo technology cluster, several started by
graduates of the University of Waterloo, including BlackBerry, OpenText
Corporation, MKS, Descartes Systems Group, Desire2Learn, and
NexJ Systems. However, the University of Waterloo ranks only 15th in
research funding among Canada’s universities.11
Some have pointed to the University of Waterloo’s IP regime as a factor
in the relatively high number of companies emerging from the institution.
Individual institutions differ in the way they treat academic IP. At one
extreme, some universities take the position that the academic is an
employee of the institution. As such, the university effectively owns the
IP produced by the academic. At the other extreme, some universities
are interested in creating incentives to commercialize ideas, and
therefore empower the academic to commercialize through relatively
liberalized approaches to IP ownership and cash flow rights flowing
10 Council of Ministers of Education Canada, Imagine Studying in Canada.
11 Research Infosource Inc., Canada’s Top 50 Research Universities List.
For the exclusive use of Joseph Mior, [email protected], Fleming College.
Chapter 5 | The Conference Board of Canada
Find this report and other Conference Board research at www.e-library.ca 75
from IP. Table 16 summarizes the different kinds of policies. Waterloo
is among the more liberalized environments for academics who wish to
commercialize ideas.
However, a representative of the University of Waterloo’s technology
transfer office told us that its IP policy is probably not as important as
the mandate and culture of the university.12 When the University of
Waterloo was established, it sought to distinguish itself from existing
universities. It did so by drawing on the German engineering traditions
that accompanied the region’s high level of German immigration, first
from the United States (Pennsylvania Dutch) and later from Europe.
In Chapter 2, we noted the importance of the PSE mission in defining
the culture and approach of individual institutions. In the case of the
University of Waterloo, the mission was defined as an applied university
along the lines of a German engineering university. The approach to IP is
more a reflection of that mission than a determinant of technology spin-
offs from the university.
The evidence suggests that most of Canada’s research universities have
not embraced this kind of applied mission. Canada’s largest research
universities (in order, in terms of the amount of sponsored research)
are the University of Toronto, the University of British Columbia, the
University of Montréal, McGill University, and the University of Alberta.
However, a report by the Milken Institute ranking North American cities
based on their high technology employment ranked Toronto 15th,
Montréal 19th, and Vancouver 36th.13 Meanwhile, Seattle, a two-and-
a-half-hour drive south of Vancouver, is ranked second. Toronto is the
fourth most populous city in North America and yet ranked lower than
San Diego.
12 Interview by Erin Butler, January 8, 2014.
13 DeVol and others, North America’s High-Technology Economy.
© The Conference Board of Canada. All rights reserved. Please contact cboc.ca/ip with questions or concerns about the use of this material.
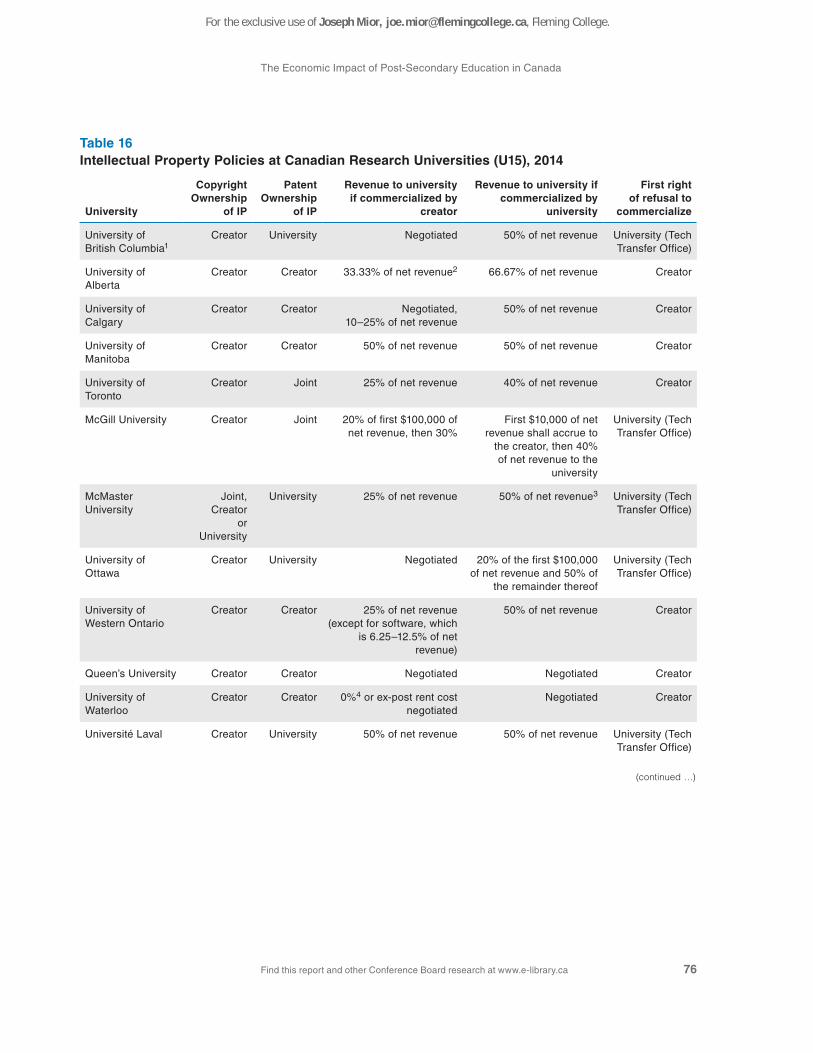
The Economic Impact of Post-Secondary Education in Canada
Find this report and other Conference Board research at www.e-library.ca 76
Table 16Intellectual Property Policies at Canadian Research Universities (U15), 2014
University
Copyright Ownership
of IP
Patent Ownership
of IP
Revenue to university if commercialized by
creator
Revenue to university if commercialized by
university
First right of refusal to
commercialize
University of British Columbia1
Creator University Negotiated 50% of net revenue University (Tech Transfer Office)
University of Alberta
Creator Creator 33.33% of net revenue2 66.67% of net revenue Creator
University of Calgary
Creator Creator Negotiated, 10–25% of net revenue
50% of net revenue Creator
University of Manitoba
Creator Creator 50% of net revenue 50% of net revenue Creator
University of Toronto
Creator Joint 25% of net revenue 40% of net revenue Creator
McGill University Creator Joint 20% of first $100,000 of net revenue, then 30%
First $10,000 of net revenue shall accrue to
the creator, then 40% of net revenue to the
university
University (Tech Transfer Office)
McMaster University
Joint, Creator
or University
University 25% of net revenue 50% of net revenue3 University (Tech Transfer Office)
University of Ottawa
Creator University Negotiated 20% of the first $100,000 of net revenue and 50% of
the remainder thereof
University (Tech Transfer Office)
University of Western Ontario
Creator Creator 25% of net revenue (except for software, which
is 6.25–12.5% of net revenue)
50% of net revenue Creator
Queen’s University Creator Creator Negotiated Negotiated Creator
University of Waterloo
Creator Creator 0%4 or ex-post rent cost negotiated
Negotiated Creator
Université Laval Creator University 50% of net revenue 50% of net revenue University (Tech Transfer Office)
(continued …)
For the exclusive use of Joseph Mior, [email protected], Fleming College.
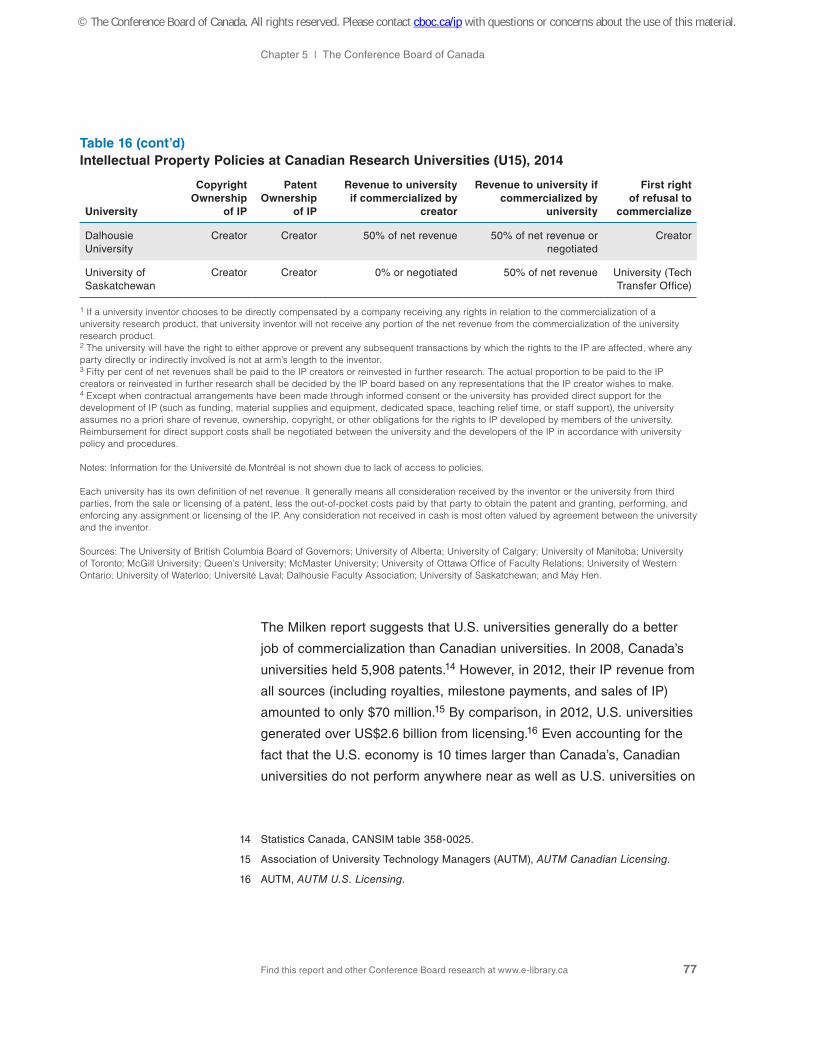
Chapter 5 | The Conference Board of Canada
Find this report and other Conference Board research at www.e-library.ca 77
University
Copyright Ownership
of IP
Patent Ownership
of IP
Revenue to university if commercialized by
creator
Revenue to university if commercialized by
university
First right of refusal to
commercialize
Dalhousie University
Creator Creator 50% of net revenue 50% of net revenue or negotiated
Creator
University of Saskatchewan
Creator Creator 0% or negotiated 50% of net revenue University (Tech Transfer Office)
1 If a university inventor chooses to be directly compensated by a company receiving any rights in relation to the commercialization of a university research product, that university inventor will not receive any portion of the net revenue from the commercialization of the university research product. 2 The university will have the right to either approve or prevent any subsequent transactions by which the rights to the IP are affected, where any party directly or indirectly involved is not at arm’s length to the inventor. 3 Fifty per cent of net revenues shall be paid to the IP creators or reinvested in further research. The actual proportion to be paid to the IP creators or reinvested in further research shall be decided by the IP board based on any representations that the IP creator wishes to make. 4 Except when contractual arrangements have been made through informed consent or the university has provided direct support for the development of IP (such as funding, material supplies and equipment, dedicated space, teaching relief time, or staff support), the university assumes no a priori share of revenue, ownership, copyright, or other obligations for the rights to IP developed by members of the university. Reimbursement for direct support costs shall be negotiated between the university and the developers of the IP in accordance with university policy and procedures.
Notes: Information for the Université de Montréal is not shown due to lack of access to policies.
Each university has its own definition of net revenue. It generally means all consideration received by the inventor or the university from third parties, from the sale or licensing of a patent, less the out-of-pocket costs paid by that party to obtain the patent and granting, performing, and enforcing any assignment or licensing of the IP. Any consideration not received in cash is most often valued by agreement between the university and the inventor.
Sources: The University of British Columbia Board of Governors; University of Alberta; University of Calgary; University of Manitoba; University of Toronto; McGill University; Queen’s University; McMaster University; University of Ottawa Office of Faculty Relations; University of Western Ontario; University of Waterloo; Université Laval; Dalhousie Faculty Association; University of Saskatchewan; and May Hen.
The Milken report suggests that U.S. universities generally do a better
job of commercialization than Canadian universities. In 2008, Canada’s
universities held 5,908 patents.14 However, in 2012, their IP revenue from
all sources (including royalties, milestone payments, and sales of IP)
amounted to only $70 million.15 By comparison, in 2012, U.S. universities
generated over US$2.6 billion from licensing.16 Even accounting for the
fact that the U.S. economy is 10 times larger than Canada’s, Canadian
universities do not perform anywhere near as well as U.S. universities on
14 Statistics Canada, CANSIM table 358-0025.
15 Association of University Technology Managers (AUTM), AUTM Canadian Licensing.
16 AUTM, AUTM U.S. Licensing.
Table 16 (cont’d)Intellectual Property Policies at Canadian Research Universities (U15), 2014
© The Conference Board of Canada. All rights reserved. Please contact cboc.ca/ip with questions or concerns about the use of this material.
The Economic Impact of Post-Secondary Education in Canada
Find this report and other Conference Board research at www.e-library.ca 78
this metric. Notably, German and Japanese companies patent in Canada
almost as much as Canadian companies do and much more than
Canadian universities do.17
However, the impact of university research is greater than patent income
suggests. To begin, the university share of patent income may only be
25 per cent of the total income, based on our assessment of universities’
IP policies. Moreover, universities do not always hold a patent on
ideas generated at the university. Individual faculty may hold patents
themselves and sell or lease them, or use them to commercialize an
invention on their own (although few of our interviewees could point to
examples where this had happened).
It seems that university research is more likely to be commercialized
by companies paying universities to conduct research. According to
CAUBO, in 2011–12, universities and polytechnics received $825 million
to conduct research on industry’s behalf. Companies such as IBM
Canada and Bombardier Transport have framework agreements with
PSE researchers that define research procedures, ownership of property
rights, residual royalties, and the like. This research, by definition, feeds
into commercial value creation.
However, this private funding pales in comparison with the multi-billion-
dollar commitment by governments to university research. In fiscal
2012, the federal research funding organizations spent $3.4 billion
on university research that may generate patents.18 However, annual
patent revenue is based on the stock of patentable knowledge. Patents
typically last 20 years. As such, the federal research funding councils
have spent tens of billions of dollars over time to realize over $70 million
in annual university patent income. Such returns are considerably lower
than the government’s cost of capital. Government funding of university
research, therefore, needs to be justified on some other basis than direct
commercialization.
17 Canadian Intellectual Property Office, Annual Report 2010 –11.
18 CAUBO, Financial Information, 7.
For the exclusive use of Joseph Mior, [email protected], Fleming College.
Chapter 5 | The Conference Board of Canada
Find this report and other Conference Board research at www.e-library.ca 79
Universities can rightly point to start-up companies that have “spun off”
from a university. One report set the number of these companies at
1,242 in the 10-year period to 2008.19 However, the issue in Canada is
not starting companies as much as starting fast-growing companies.20
Canadians start around 140,000 new businesses every year.21 However,
venture capital is only interested in a small subset of these businesses
that are capable of growing very quickly, usually generating triple-digit
sales growth. In financial circles, rapid growth is what distinguishes
a true start-up from other new businesses. However, our interviews
suggest that very few rapid-growth companies emerge directly from
Canada’s PSE sector.
Today, about a third of new businesses are started by people with
university degrees.22 As recently as 1990, more businesses were started
by those with less than a high school education than with university
degrees. Today, most new businesses are started by people over the
age of 50. The typical path to a new business start-up in Canada would
appear to be a university degree leading to a secure career leading to a
post-career business.
A university administrator put poor commercialization performance
down to the academic mindset.23 She said academics see their mission
as discovery of fundamental truths. Some are hostile to the university
seeking to commercialize research. Academics tend to be problem-
solvers. They define a research question, seek the answer, and then
move on to the next problem, often with little interest in the commercial
possibilities of their solutions. Moreover, their training focuses on deep
but narrow specialization. They are not predisposed to commercialize
ideas, and they do not typically have the general entrepreneurial and
business skills necessary to do so.
19 Statistics Canada, CANSIM table 358-0025.
20 Grant, Start Me Up.
21 Statistics Canada, CANSIM table 527-0001.
22 Tal, Startups, 2
23 Interview by Michael Grant, December 13, 2013.
© The Conference Board of Canada. All rights reserved. Please contact cboc.ca/ip with questions or concerns about the use of this material.
The Economic Impact of Post-Secondary Education in Canada
Find this report and other Conference Board research at www.e-library.ca 80
The Multifactor Productivity Argument
As Canada’s PSE system is found wanting in terms of direct innovation
impact, universities often make arguments for indirect impact, to
encourage ongoing funding of their research mandate. This involves
linking the university to macroeconomic metrics like multifactor (or total
factor) productivity. Multifactor productivity is a measure of the output
garnered from all inputs. It speaks to an economy’s value creation
efficiency. Multifactor productivity is sometimes interpreted as innovation
or technological progress, because it measures residual output that
cannot be explicitly linked to production inputs, such as capital and
labour. Typically, econometric techniques are used to derive estimates
of multifactor productivity. In fact, as measurement techniques for labour
and capital have improved, the output assigned to multifactor productivity
has declined.
In many studies of the impact of universities, multifactor productivity
effects account for a very significant share of total effects. For instance,
in the aforementioned study of the University of British Columbia, half
of the $10-billion annual impact related to the multifactor productivity
estimates, which essentially assigned multifactor productivity gains
based on share of total R&D spending.24 Likewise, the University
of Ottawa study claimed a $1.26-billion annual impact based on the
university’s share of R&D spending.25
The technique of assigning multifactor productivity gains to the higher
education sector based on share of R&D spending was suggested by
Fernand Martin in a 1998 paper.26 Although easily calculated, it lacks
theoretical and empirical substance. As Griliches pointed out in his
comprehensive review of the evidence on the relationship between R&D
and productivity, “Serious difficulties in econometric inference result
from the fact that most of the variables of interest tend to move together
over time and space, making it hard to untangle their separate effects.
24 Sudmant, The Economic Impact of the University of British Columbia, 30.
25 Díaz, Mercier, and Duarte, 2012 Economic Impact.
26 Martin, “The Economic Impact of Canadian University Research and Development.”
For the exclusive use of Joseph Mior, [email protected], Fleming College.
Chapter 5 | The Conference Board of Canada
Find this report and other Conference Board research at www.e-library.ca 81
Moreover, it is not easy to establish causality.”27 Assigning multifactor
productivity gains to university research without explaining the specific
mechanism by which research affects productivity is not a convincing
or reliable way to demonstrate the value of university research.
Governments have made increasing investments in higher education
research over the years, thereby increasing the ratio of higher education
R&D (HERD) to business expenditure on R&D (BERD). That policy has
had an unknown impact at this time.
Using the Martin method, this policy would result in a greater share of
multifactor productivity being assigned to Canada’s universities, even
if they have little to do with productivity improvements. The evidence
suggests that recent multifactor productivity improvements are due to
the replication of existing technologies, primarily through information
technology investments by businesses.28 This is not to suggest that
universities have no impact on multifactor productivity, merely that
it is difficult to generate precise estimates of this impact. Assigning
multifactor productivity gains based solely on share of R&D likely
overstates the impact of university research on the economy.
Conclusion
Canadian governments have made a multi-billion-dollar commitment to
university research. However, the measured links between university
research and value creation in the economy are weak. Direct measures
of the impact of university research, such as patent performance and
the number of fast-growing start-up companies, show a very low impact
in relation to the scale of the investment. Meanwhile, general metrics,
such as links to multifactor productivity, show very large impacts but
lack credibility.
27 Griliches, “Issues in Assessing the Contribution,” 19.
28 Baldwin and Gu, Multifactor Productivity in Canada.
© The Conference Board of Canada. All rights reserved. Please contact cboc.ca/ip with questions or concerns about the use of this material.

The Economic Impact of Post-Secondary Education in Canada
Find this report and other Conference Board research at www.e-library.ca 82
Universities need to do a better job of explaining the value proposition
of investments in university research. This value may, in fact, be related
to the discovery of basic truths. As such, university research impact is
rightly judged by metrics such as publications and citations.
However, if the objective of university research is to improve the
broader economy, then universities need to explain more clearly how
research activities do this. One way is to link research to the quality of
graduates—in other words, the human capital effect—based on the case
that university research leads to better prepared graduates. Another way
is to improve the entrepreneurial and management skills of graduates,
which may affect the number and quality of start-ups they establish.
Finally, universities can directly affect innovation through collaborations
with business enterprises, through contract research, patents, and faculty
start-ups.
For the exclusive use of Joseph Mior, [email protected], Fleming College.
Find this report and other Conference Board research at www.e-library.ca
• This report has considered a variety of economic impacts flowing from Canada’sPSE sector.
• Canada’s PSE institutions have done a good job of expanding in response todemand for greater skills.
• PSE institutions have benefited from what economists call “skill-biasedtechnological change.”
• The highest returns on education are realized in applied fields at the universitylevel.
• Humanities, social sciences, arts, and education programs are less likely togenerate high returns.
• Standardized tests would help Canadians understand the relationship betweenhigher education and skill development.
• There will continue to be pressure on Canada’s universities and colleges todemonstrate their impact on Canada’s innovation performance.
CHAPTER 6
Conclusion
Chapter Summary
© The Conference Board of Canada. All rights reserved. Please contact cboc.ca/ip with questions or concerns about the use of this material.
The Economic Impact of Post-Secondary Education in Canada
Find this report and other Conference Board research at www.e-library.ca 84
This report has considered a variety of economic impacts flowing from Canada’s PSE sector. Canada’s PSE institutions have done a good job of expanding in response to demands for greater skill. As such, they are growing enterprises that generate significant spin-off benefits to their immediate communities and provinces. We estimate this “enterprise” effect exceeds $50 billion per annum. In addition, higher education, as a social institution, attracts visitors to communities. Roughly $2 billion per annum in additional economic benefit flows to communities that host PSE institutions.
PSE institutions have benefited from what economists call “skill-biased
technological change.” Simply put, technology does more of the
mundane work that humans used to do. Therefore, humans have to
be more skilled to do the jobs that technology does not do well. That
means more jobs require unique human skills, such as the ability to
repair machines, the ability to run advanced equipment, creative problem
solving, conceptual thinking, teamwork, and communication.
This trend is driving high returns on education and more demand for
PSE. On average, Canadians who acquire higher education can expect
a double-digit annual return on their investment. However, these returns
are variable, depending on the level of education and the field of study.
The highest returns are realized in applied fields at the university level.
These are areas in which there is a direct relationship between acquiring
skills and applying them in either highly paid professional occupations or
business. Indeed, regulated occupations are very good at both working
with PSE institutions on skills acquisition and in limiting competition in
the labour market. The highest paying occupations are almost invariably
in areas with highly structured labour markets with significant barriers
to entry.
For the exclusive use of Joseph Mior, [email protected], Fleming College.
Chapter 6 | The Conference Board of Canada
Find this report and other Conference Board research at www.e-library.ca 85
In other fields of study, there is a less direct relationship between skills
acquisition and application in the labour market. Humanities, social
sciences, arts, and education programs are less likely to generate high
returns. The economic returns in these fields are more dependent on the
acquisition of general skills, such as critical thinking skills, that may be
applied in a variety of circumstances. As the school-to-work transition
is less structured, it can be more difficult for graduates in these areas to
find high-paying, full-time employment. As such, we are starting to see
a narrowing of the wage gap between graduates in these fields and high
school graduates.
This development is leading to a debate about education quantity
over quality. Government funding policies encourage PSE institutions
to expand international student intake, and to create larger classes in
disciplines where it is easy to expand capacity but returns on investment
are low. Colleges and universities that wish to offer programs in higher
cost areas, even when they have greater relevance to the labour market
and economy, face fiscal constraints. The result is larger classes.
Independent measures of learning quality often favour liberal arts
universities that have made a commitment to smaller classes. These
are the same institutions that have chosen to differentiate themselves by
focusing on their teaching mandates.
Unlike primary and secondary schools, PSE institutions have little
comparable, independent data on education quality to verify whether
students are acquiring critical thinking skills. Standardized tests of
primary and high school students’ skills are done through regimes
such as the Progress in International Reading Literacy Study (PIRLS)
and the Programme for International Student Assessment (PISA). The
OECD is developing an Assessment of Higher Learning Education
Outcomes (AHELO) tool, and Ontario has participated in a feasibility
study of it. Such standardized tests would help Canadians gain a better
understanding of the relationship between PSE and skills development.
Over the last decade, Canada has made a commitment to significantly
higher levels of funding for PSE research, especially in universities.
Given that Canada continues to struggle with innovation performance, it
© The Conference Board of Canada. All rights reserved. Please contact cboc.ca/ip with questions or concerns about the use of this material.
The Economic Impact of Post-Secondary Education in Canada
Find this report and other Conference Board research at www.e-library.ca 86
is not clear how this financial commitment could translate into heightened
economic performance. Canada’s universities perform well on academic-
specific metrics, such as citations and publications. This suggests that
Canadian universities make a valuable contribution to the body of world
knowledge, which may be drawn upon in many ways. However, that may
not be sufficient for Canadian governments that face poor productivity
performance, a slow-growing economy, and fiscal deficits. In order
to sustain or increase their funding levels, Canada’s universities and
colleges will continue to face pressure to demonstrate their impact on
Canada’s innovation and overall economic performance.
For the exclusive use of Joseph Mior, [email protected], Fleming College.

Appendix A | The Conference Board of Canada
Find this report and other Conference Board research at www.e-library.ca 87
Apple Inc. 10K Filing with Securities and Exchange Commission. Annual
report, New York: EDGAR, 2013.
Arum, Richard and Josipa Roksa. Academically Adrift: Limited Learning
on College Campuses. Chicago: University of Chicago Press, 2011.
Association of Atlantic Universities. 2012 –2013 Survey of Preliminary
Enrolments. Halifax: Association of Atlantic Universities, 2013. www.
atlanticuniversities.ca/statistics/aau-survey-preliminary-enrolments
(accessed December 20, 2013).
Association of Universities and Colleges Canada. Investment in
University Infrastructure Will Contribute to Canada’s Economic Recovery.
News release, Ottawa: AUCC, January 27, 2009. www.aucc.ca/media-
room/news-and-commentary/investment-in-university-infrastructure-will-
contribute-to-canada-s-economic-recovery/ (accessed December 10,
2013).
—. Tuition Fees by University. www.aucc.ca/canadian-universities/facts-
and-stats/tuition-fees-by-university/ (accessed December 16, 2013).
Association of University Technology Managers. AUTM Canadian
Licensing Activity Survey FY2012. Deerfield, Illinois: AUTM, 2012. www.
autm.net/Licensing_Surveys_AUTM.htm (accessed October 24, 2014).
—. AUTM U.S. Licensing Activity Survey FY2012 Highlights. Deerfield,
Illinois: AUTM, 2012. www.autm.net/Licensing_Surveys_AUTM.htm
(accessed October 24, 2014).
APPENDIX A
Bibliography
© The Conference Board of Canada. All rights reserved. Please contact cboc.ca/ip with questions or concerns about the use of this material.
The Economic Impact of Post-Secondary Education in Canada
Find this report and other Conference Board research at www.e-library.ca 88
Baldwin, John R., and Wulong Gu. Multifactor Productivity in Canada:
An Evaluation of Alternative Methods of Estimating Capital Services. Cat.
no. 15-206-X. Ottawa: Statistics Canada, 2007.
BCStats. Completers Versus Leavers: Beyond the Simplistic “Drop-Out”
Label. Information paper, Victoria: BCStats, Summer 2011.
Becker, Gary. Human Capital: A Theoretical and Empirical Analysis. New
York: National Bureau of Economic Research, 1964.
Boothby, D., and T. Drewes. “Post-Secondary Education in Canada:
Returns to University, College and Trades Education.” Canadian Public
Policy 32, no. 1 (2006): 1 –22.
Booz and Company. Global Innovation 2012 Results Summary. New
York: Booz & Company. www.booz.com/media/file/BoozCo_The-2012-
Global-Innovation-1000-Results-Summary.pdf (accessed May 22, 2013).
Bourbeau, Emmanuelle, Pierre Lefebvre, and Phillip Merrigan. Returns
to Education for 21-to 35-Year-Olds Across Canada: Results From
the 1991–2006 Canadian Analytica Census Files. Discussion paper,
Montréal: Université du Québec à Montréal, January 2010.
Breitzman, J. “University Patent Powerhouses.” The Scientist 19,
no. 12 (2005): 39–47.
British Columbia Ministry of Advanced Education. Education Quality
Assurance—EQA. www.aved.gov.bc.ca/education_quality_assurance/
welcome.htm (accessed October 24, 2014).
—. Student Pathways to BC Public Post‐Secondary Education. Victoria:
British Columbia Ministry of Advanced Education, 2012.
Cambrian College. Strategic Enrolment Report 2013–2014. Sudbury:
Cambrian College, 2013.
Canadian Association of University Business Officers. Financial
Information of Universities and Colleges 2011–2012.
Ottawa: CAUBO, 2012.
For the exclusive use of Joseph Mior, [email protected], Fleming College.
Find this report and other Conference Board research at www.e-library.ca 89
Appendix A | The Conference Board of Canada
Canadian Association of University Teachers. CAUT Almanac 2012–13.
Ottawa: CAUT, 2012.
Canadian Intellectual Property Office. Annual Report 2010–2011:
Patents. Ottawa: CIPO, 2011.
Carneiro, Pedro, James J. Heckman, and Edward Vytlacil.
Understanding What Instrumental Variables Estimate: Estimating
Marginal and Average Returns to Education. Discussion paper, Chicago:
University of Chicago, 2003.
Council of Ministers of Education Canada. Imagine Studying in Canada.
Ottawa: CMEC, 2013.
Dahlby, Bev, and Ergete Ferede. What Does It Cost Society to Raise
a Dollar of Tax Revenue? The Marginal Cost of Public Funds. Toronto:
C.D. Howe Institute, 2011.
Dalhousie Faculty Association. Collective Agreement 2011–2014.
http://dfa.ns.ca/collective-agreement-2011-14
(accessed February 4, 2014).
DeVol, Ross C., Kevin Klowden, Armen Bedroussian, and Benjamin
Yeo. North America’s High-Technology Economy: The Geography of
Knowledge-Based Industries. Los Angeles: Milken Institute, 2009.
Díaz, V., P. Mercier, and S. Duarte. 2012 Economic Impact Study.
Ottawa: University of Ottawa, 2012.
Emery, Herb. Total and Private Returns to University Education in
Canada: 1960–2030 and in Comparison to Other Post-Secondary
Training. Conference paper, Calgary: University of Calgary, 2004.
Ferrer, A., and W.C. Riddell. “The Role of Credentials in the Canadian
Labour Market.” Canadian Journal of Economics 35 (2002): 879–905.
Grant, Michael. Start Me Up: Funding Canada’s Emerging Innovators.
Ottawa: The Conference Board of Canada, 2014.
© The Conference Board of Canada. All rights reserved. Please contact cboc.ca/ip with questions or concerns about the use of this material.
The Economic Impact of Post-Secondary Education in Canada
Find this report and other Conference Board research at www.e-library.ca 90
Griliches, Zvi. “Issues in Assessing the Contribution of Research and
Development to Productivity Growth.” In R&D and Productivity: The
Econometric Evidence, ed. Zvi Griliches, 17–45. Chicago: University of
Chicago Press, 1998.
Gu, Wulong, and John R. Baldwin. Multifactor Productivity Measurement
at Statistics Canada. Ottawa: Statistics Canada, 2013.
Gunderson, Morley, and Harry Krashinsky. Returns to Education and
Apprenticeship Training. Toronto: Ontario Ministry of Training Colleges
and Universities, 2005.
Institute of Electrical and Electronic Engineers. IEEE Spectrum Patent
Powerhouses 2013. http://spectrum.ieee.org/at-work/innovation/patent-
power-2013/constructing-the-patent-power-scorecard
(accessed January 19, 2014).
Lombardi, John V., Diane D. Craig, Elizabeth D. Capaldi, and Denise S.
Gater. University Organization, Governance, and Competitiveness. The
Lombardi Program on Measuring University Performance, August 2002.
Martin, Fernand. “The Economic Impact of Canadian University
Research and Development.” Research Policy 27, no. 7
(November 1998): 677–687.
Millar, Erin. The Sneaky Way Universities Are Privatizing Teaching.
February 19, 2010. www.macleans.ca/education/uniandcollege/the-
sneaky-way-universities-are-privatizing-their-teaching/
(accessed December 24, 2013).
McGill University. Policy on Intellectual Property. www.mcgill.ca/files///
secretariat/PolicyonIntellectualProperty.pdf (accessed February 5, 2014).
McMaster University. Joint Intellectual Property Policy. www.mcmaster.
ca/mufa/handbook/ippolicyJoint.html (accessed February 5, 2014).
Moussaly-Sergieh, Karim, and François Vaillancourt. Extra Earning
Power: The Financial Returns to University Education in Canada.
Toronto: C.D. Howe Institute, 2009.
For the exclusive use of Joseph Mior, [email protected], Fleming College.

Find this report and other Conference Board research at www.e-library.ca 91
Appendix A | The Conference Board of Canada
National Survey on Student Engagement. NSSE Annual Results 2012.
http://nsse.iub.edu/html/annual_results.cfm
(accessed December 15, 2013).
Office of Faculty Relations, University of Western Ontario. UWOFA
Collective Agreement 2012–2014. www.uwo.ca/facultyrelations/pdf/
collective_agreements/faculty.pdf (accessed February 5, 2014).
Ontario Ministry of Training, Colleges and Universities. Ontario’s
Proposed Differentiation Policy Framework. Draft discussion paper,
Toronto: Ontario Ministry of Training, Colleges and Universities, 2013.
Organisation for Economic Co-operation and Development. Country
Report: Education at a Glance, Canada. Paris: OECD, 2013.
—. OECD.Stat Extracts: Per Capita Income. http://stats.oecd.org/
(accessed December 5, 2013).
Owram, Doug. Born at the Right Time: A History of the Baby Boom
Generation. Toronto: University of Toronto Press, 1996.
Palladini, Jacqueline, and Maxim Armstrong. From Farm to Glass: The
Value of Beer in Canada. Ottawa: The Conference Board of Canada,
2013.
Psacharopoulos, George, and Harry Anthony Patrinos. “Returns to
Investment in Education: A Further Update.” Education Economics 12,
no. 2 (August 2004): 111–33.
Queen’s University. Report of the Senate Ad Hoc Committee on
Intellectual Property. May 8/9, 1992. www.queensu.ca/secretariat/
policies/senateandtrustees/intellectualproperty.html
(accessed February 5, 2014).
Research Infosource Inc. Canada’s Top 50 Research Universities List.
2014. www.researchinfosource.com/top50_univ.php.
Robison, M. Henry, and Kjell A. Christophersen. Economic Contribution
of Camosun College. Victoria: Camosun College, 2013.
© The Conference Board of Canada. All rights reserved. Please contact cboc.ca/ip with questions or concerns about the use of this material.
The Economic Impact of Post-Secondary Education in Canada
Find this report and other Conference Board research at www.e-library.ca 92
SECOR. McGill University: Driving Excellence and Prosperity in
Quebec. Montréal: McGill University, 2010.
Statistics Canada. CANSIM table 032-0001. Public and Private
Investment, Summary by Sector. www5.statcan.gc.ca/cansim/a26?lang=
eng&retrLang=eng&id=0320001 (accessed October 22, 2014).
—. CANSIM table 358-0001. Gross Domestic Expenditures on Research
and Development, by Science Type and by Funder and Performer
Sector. www5.statcan.gc.ca/cansim/a26?lang=eng&retrLang=eng
&id=3580001 (accessed October 22, 2014).
—. CANSIM table 358-0025. Survey of Intellectual Property
Commercialization, by Higher Education Sector Indicators. www5.
statcan.gc.ca/cansim/a26?lang=eng&retrLang=eng&id=3580025
(accessed January 20, 2014).
—. CANSIM table 379-0031. Gross Domestic Product (GDP) at Basic
Prices, by North American Industry Classification System (NAICS).
www5.statcan.gc.ca/cansim/a26?lang=eng&retrLang=eng&id=3790031
(accessed December 10, 2013).
—. CANSIM table 477-0019. Postsecondary Enrolments, by Registration
Status, Pan-Canadian Standard Classification of Education (PCSCE),
Classification of Instructional Programs, Primary Grouping (CIP_PG),
Sex and Immigration Status. www5.statcan.gc.ca/cansim/a26?lang=eng
&retrLang=eng&id=4770019
(accessed October 22, 2014).
—. CANSIM table 478-0004. Postsecondary Non-University (College)
Education Expenditure, by Direct Source of Funds, Type of College, and
Type of Expenditures. www5.statcan.gc.ca/cansim/a26?lang=eng&retrLa
ng=eng&id=4780004 (accessed October 22, 2014).
—. CANSIM table 478-0007. University Education Expenditures, by
Direct Source of Funds and Type of Expenditures. www5.statcan.gc.ca/
cansim/a26?lang=eng&retrLang=eng&id=4780007 (accessed October
22, 2014).
For the exclusive use of Joseph Mior, [email protected], Fleming College.
Find this report and other Conference Board research at www.e-library.ca 93
Appendix A | The Conference Board of Canada
—. CANSIM table 527-0001. Business Dynamics Measures, by North
American Industry Classification System (NAICS). www5.statcan.gc.ca/
cansim/a26?lang=eng&retrLang=eng&id=5270001 (accessed October
22, 2014).
—. Census Profile: Antigonish. 2011. www12.statcan.gc.ca/census-
recensement/2011/dp-pd/prof/details/page.cfm?Lang=E&Geo1=CSD&C
ode1=1214002&Geo2=CD&Code2=1214&Data=Count&SearchText=Anti
gonish&SearchType=Begins&SearchPR=01&B1=All&Custom=&TABID=1
(accessed December 23, 2013).
—. Education and Occupation of High-Income Canadians. National
Household Survey (NHS), 2011. Cat. no. 99-014-X2011003. Ottawa:
Statistics Canada, 2011.
—. Employment, by Enterprise Size. www.statcan.gc.ca/tables-tableaux/
sum-som/l01/cst01/labr75h-eng.htm (accessed October 17, 2013).
—. Population by Sex and Age Group. www.statcan.gc.ca/tables-
tableaux/sum-som/l01/cst01/demo10a-eng.htm
(accessed December 15, 2013).
—. “Study: Generational Change in Paid and Unpaid Work.” The Daily,
July 21, 2011. www.statcan.gc.ca/daily-quotidien/110712/dq110712c-eng.
htm (accessed December 15, 2013).
Sudmant, Walter. The Economic Impact of the University of British
Columbia. Vancouver: University of British Columbia, 2009.
Tal, Benjamin. Startups: Present and Future. Toronto: CIBC World
Markets, 2012.
Tal, Benjamin, and Emanuella Enenajor. Degrees of Success: The Payoff
to Higher Education in Canada. Toronto: CIBC, 2013.
The Conference Board of Canada. Centre for Business Innovation:
Innovation Defined. www.conferenceboard.ca/cbi/innovation.aspx
(accessed January 22, 2014).
© The Conference Board of Canada. All rights reserved. Please contact cboc.ca/ip with questions or concerns about the use of this material.
The Economic Impact of Post-Secondary Education in Canada
Find this report and other Conference Board research at www.e-library.ca 94
—. Fuelling the Surge: The Role of the University of Regina in
Saskatchewan’s Growth. Ottawa: The Conference Board of Canada,
2012.
—. How Canada Performs: Innovation. 2013. www.conferenceboard.ca/
hcp/details/innovation.aspx (accessed October 23, 2014).
—. How Canada Performs: Return on Investment in Tertiary Education.
2013. www.conferenceboard.ca/hcp/details/education/tertiary.aspx
(accessed October 22, 2013).
The Expert Panel on Business Innovation. Innovation and Business
Strategy: Why Canada Falls Short. Ottawa: Council of Canadian
Academies, 2009.
Université Laval. Les brevets d’invention à l’Université Laval. Regulation,
Quebec City: Université Laval, June 11, 1974. www.vrr.ulaval.ca/rech/
Brevets_1974.html (accessed February 5, 2014).
—. La propriété intellectuelle à l’Université Laval. Policy, Quebec City:
Université Laval, April 22, 1980. www.vrr.ulaval.ca/rech/Reglement_1980.
html (accessed February 5, 2014).
University of Alberta. Patent Policy. Edmonton: University of Alberta.
University of British Columbia Board of Governors. Inventions and
Discoveries. Policy, Vancouver: UBC Board of Governors, June 2013.
www.universitycounsel.ubc.ca/files/2013/06/policy88.pdf
(accessed February 5, 2014).
University of Calgary. Intellectual Property Policy. Calgary: University
of Calgary, April 29, 1994. www.ucalgary.ca/policies/files/policies/
Intellectual%20Property%20Policy.pdf (accessed February 5, 2014).
University of Manitoba. Intellectual Property. Policy, Winnipeg: University
of Manitoba, March 16, 2010. umanitoba.ca/admin/governance/media/
Intellectual_Property_Policy_-_2013_10_01.pdf
(accessed February 5, 2014).
For the exclusive use of Joseph Mior, [email protected], Fleming College.
Find this report and other Conference Board research at www.e-library.ca 95
Appendix A | The Conference Board of Canada
University of Ottawa. Association of Professors of the University of
Ottawa Collective Agreement (Article 35). Ottawa: University of Ottawa,
May 1, 2011. www.apuo.ca/wp-content/uploads/2012/07/APUO_CA_2011-
2012_Final.pdf (accessed February 5, 2014).
University of Saskatchewan. University of Saskatchewan Principles
and Policies Regarding Intellectual Property and Commercialization.
Saskatoon: University of Saskatchewan. research.sheridanc.on.ca/DB/IP/
Documents/University%20of%20Saskatchewan.php.html
(accessed February 5, 2014).
University of Toronto Governing Council. Inventions Policy. Toronto:
University of Toronto, October 30, 2013.
www.governingcouncil.utoronto.ca/policies/invent.htm.
University of Waterloo. Policy 73–Intellectual Property Rights. Waterloo:
University of Waterloo, October 28, 1997. www.adm.uwaterloo.ca/infosec/
Policies/policy73.htm (accessed February 5, 2014).
© The Conference Board of Canada. All rights reserved. Please contact cboc.ca/ip with questions or concerns about the use of this material.

For the exclusive use of Joseph Mior, [email protected], Fleming College.
About The Conference Board of Canada
We are:
• The foremost independent, not-for-profit, applied research organizationin Canada.
• Objective and non-partisan. We do not lobby for specific interests.• Funded exclusively through the fees we charge for services to the
private and public sectors.• Experts in running conferences but also at conducting, publishing,
and disseminating research; helping people network; developing individualleadership skills; and building organizational capacity.
• Specialists in economic trends, as well as organizational performance andpublic policy issues.
• Not a government department or agency, although we are often hired to provideservices for all levels of government.
• Independent from, but affiliated with, The Conference Board, Inc. of New York,which serves nearly 2,000 companies in 60 nations and has offices in Brusselsand Hong Kong.
© The Conference Board of Canada. All rights reserved. Please contact cboc.ca/ip with questions or concerns about the use of this material.
255 Smyth Road, Ottawa ON
K1H 8M7 Canada
Tel. 613-526-3280
Fax 613-526-4857
Inquiries 1-866-711-2262
conferenceboard.ca
Insights. Understanding. Impact.
PUBLICATION: 6607
PRICE: Complimentary
For the exclusive use of Joseph Mior, [email protected], Fleming College.