Embed Size (px)
Citation preview
The Economic Impact of Fort Lee
0
The Economic Impact of Fort Lee on the Petersburg Region Research and Technical Assistance Project August, 2012
Contact: Lauren Nolan
Nathalie P. Voorhees Center
University of Illinois at Chicago
400 S. Peoria St. #2100
Chicago, IL 60607
(312) 413‐0215
This publication was prepared under cooperative agreement with the University of Illinois, with financial support from the Office of Economic Adjustment, Department of Defense. The content reflects the views of the University of Illinois at Chicago and does not necessarily reflect the views of the Office of Economic Adjustment.
The Economic Impact of Fort Lee
1
Every year, Fort Lee channels billions of dollars of Federal Spending into the Petersburg Area and the
surrounding region. Defense spending of this volume impacts the region in ways that will often be
difficult to measure. Accordingly, this report provides a comprehensive picture of the ways in which
spending at Fort Lee impacts both the overall size of the Petersburg‐area, as well as the economy’s
structure and composition – specifically, the region’s distinctive skew of employment and spending
towards activities tied to Fort Lee.
To make these estimates, we rely on economic impact analysis. Economic impact models provide
detailed information on the flows of economic activity between industries and counties. As a result,
economic impact analysis allows us to trace the ways in which spending ripples through a local
economy. It is especially useful for cases of federal contracting and procurement such as this one. Using
the detailed economic impact model from the Minnesota Implan Group (MIG), we were able to trace
spending at Fort Lee as it flowed from the Department of Defense to contractors, subcontractors and
the goods and services they purchased; to military and civilian employees and their families; and to the
subdivisions, retailers and service providers where Fort Lee employees and workers at defense
contractors spent their hard‐earned paychecks.
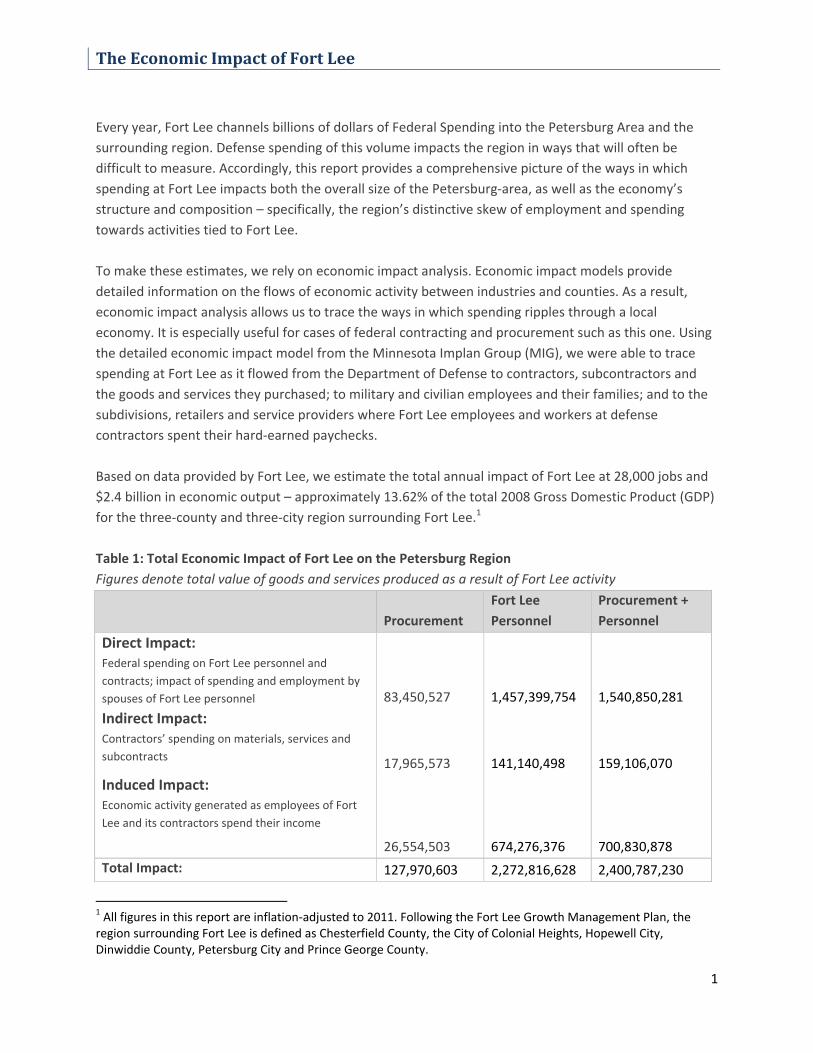
Based on data provided by Fort Lee, we estimate the total annual impact of Fort Lee at 28,000 jobs and
$2.4 billion in economic output – approximately 13.62% of the total 2008 Gross Domestic Product (GDP)
for the three‐county and three‐city region surrounding Fort Lee.1
Table 1: Total Economic Impact of Fort Lee on the Petersburg Region
Figures denote total value of goods and services produced as a result of Fort Lee activity
Procurement
Fort Lee
Personnel
Procurement +
Personnel
Direct Impact: Federal spending on Fort Lee personnel and
contracts; impact of spending and employment by
spouses of Fort Lee personnel 83,450,527 1,457,399,754 1,540,850,281
Indirect Impact: Contractors’ spending on materials, services and
subcontracts 17,965,573 141,140,498 159,106,070
Induced Impact: Economic activity generated as employees of Fort
Lee and its contractors spend their income
26,554,503 674,276,376 700,830,878
Total Impact: 127,970,603 2,272,816,628 2,400,787,230
1 All figures in this report are inflation‐adjusted to 2011. Following the Fort Lee Growth Management Plan, the region surrounding Fort Lee is defined as Chesterfield County, the City of Colonial Heights, Hopewell City, Dinwiddie County, Petersburg City and Prince George County.
The Economic Impact of Fort Lee
2
Table 1 shows the cumulative economic impact of the main economic ‘levers’ at Fort Lee: procurement
of goods and services, and pay to military personnel, Department of Defense civilians and on‐post
contractors.2
Direct Impact denotes the dollar value of spending steered into the local economy from the
outside. For contracting and procurement, this is the dollar value of the contracts exacted
through Fort Lee. For personnel, this figure marks the total estimated value of employee
compensation.
Indirect Impact denotes the subsequent growth in economic activity at local firms that supply
goods and services necessary to the day‐to‐day operation of Fort Lee. We estimate that the $83
million in local contracts for garrison support, construction, and mission support generates an
additional $17 million of economic activity through these purchases. Please note that our
estimates here are confined to maintenance, repairs, electricity generation and other services
necessary to operating Fort Lee. We were not able to include the value of computer, aerospace,
manufacturing and other contracts let through Fort Lee.
Induced Impact denotes the business activity that occurs when Fort Lee personnel and
employees of firms supplying goods to the post spend their paychecks. While direct and indirect
impacts vary based on the types of goods and services being produced, induced impacts
typically vary much less. Regardless of total pay levels, workers spend their income on the same
bundle of goods: housing, transportation, consumer purchases, education, entertainment, etc.
Fort Lee personnel are numerous and generally well compensated. The $674 million they
generate in induced economic activity in the region exceeds the induced impact from employees
of off‐post contractors.
Table 2: Economic Impact Multipliers
Type of Impact
Military Personnel
DoD Civilians
Mission Support
Contracting Students
Garrison Support
Contracting Average
Employment 1.41 1.30 1.30 1.29 1.46 1.35
Income 1.26 1.25 1.25 1.53 1.45 1.27
Output 1.51 1.62 1.62 1.57 1.53 1.55
One way to effectively compare the relative economic importance of different components of post
activities to the region is to look at economic impact multipliers. A multiplier summarizes the total
impact that can be expected from change in a given economic activity. For example, a new
manufacturing facility or an increase in exports by a local firm is economic changes which can spur ripple
2 We separate mission support contractors– individuals who work alongside uniformed and DoD civilian personnel at Fort Lee – from the garrison support contractors who provide services and goods generated off‐post. This allows us to trace the industry‐specific economic impacts of the various goods contractors produce.
The Economic Impact of Fort Lee
3
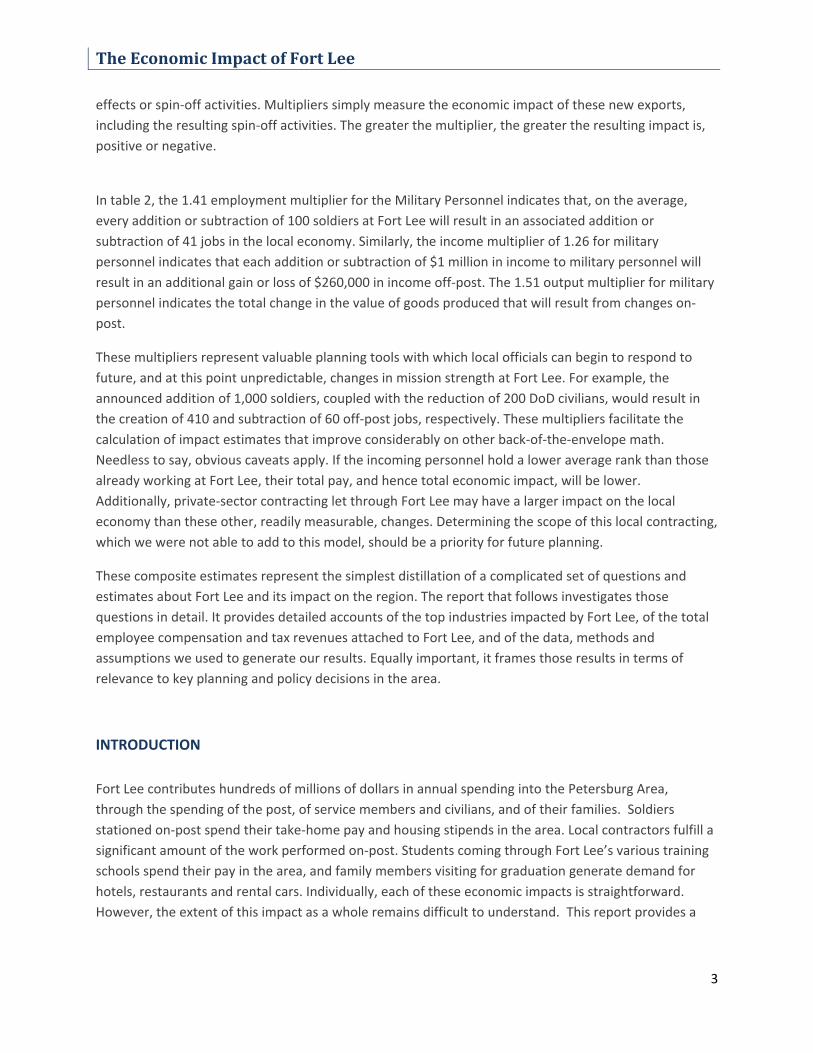
effects or spin‐off activities. Multipliers simply measure the economic impact of these new exports,
including the resulting spin‐off activities. The greater the multiplier, the greater the resulting impact is,
positive or negative.
In table 2, the 1.41 employment multiplier for the Military Personnel indicates that, on the average,
every addition or subtraction of 100 soldiers at Fort Lee will result in an associated addition or
subtraction of 41 jobs in the local economy. Similarly, the income multiplier of 1.26 for military
personnel indicates that each addition or subtraction of $1 million in income to military personnel will
result in an additional gain or loss of $260,000 in income off‐post. The 1.51 output multiplier for military
personnel indicates the total change in the value of goods produced that will result from changes on‐
post.
These multipliers represent valuable planning tools with which local officials can begin to respond to
future, and at this point unpredictable, changes in mission strength at Fort Lee. For example, the
announced addition of 1,000 soldiers, coupled with the reduction of 200 DoD civilians, would result in
the creation of 410 and subtraction of 60 off‐post jobs, respectively. These multipliers facilitate the
calculation of impact estimates that improve considerably on other back‐of‐the‐envelope math.
Needless to say, obvious caveats apply. If the incoming personnel hold a lower average rank than those
already working at Fort Lee, their total pay, and hence total economic impact, will be lower.
Additionally, private‐sector contracting let through Fort Lee may have a larger impact on the local
economy than these other, readily measurable, changes. Determining the scope of this local contracting,
which we were not able to add to this model, should be a priority for future planning.
These composite estimates represent the simplest distillation of a complicated set of questions and
estimates about Fort Lee and its impact on the region. The report that follows investigates those
questions in detail. It provides detailed accounts of the top industries impacted by Fort Lee, of the total
employee compensation and tax revenues attached to Fort Lee, and of the data, methods and
assumptions we used to generate our results. Equally important, it frames those results in terms of
relevance to key planning and policy decisions in the area.
INTRODUCTION
Fort Lee contributes hundreds of millions of dollars in annual spending into the Petersburg Area,
through the spending of the post, of service members and civilians, and of their families. Soldiers
stationed on‐post spend their take‐home pay and housing stipends in the area. Local contractors fulfill a
significant amount of the work performed on‐post. Students coming through Fort Lee’s various training
schools spend their pay in the area, and family members visiting for graduation generate demand for
hotels, restaurants and rental cars. Individually, each of these economic impacts is straightforward.
However, the extent of this impact as a whole remains difficult to understand. This report provides a
The Economic Impact of Fort Lee
4
comprehensive assessment of the total economic impact of all known Fort Lee activities on the
Petersburg region as of 2011.
Understanding the total impact of Fort Lee assists in the assessment of local economic development
activities by documenting which functions at Fort Lee are most crucial to the region, and by identifying
the industries that are most likely to be impacted (positively or negatively) by future mission changes.
The current defense situation remains dynamic, and will likely result in unexpected changes to the
forecast for Fort Lee in the wake of the last military post consolidation. The 2005 Base Realignment and
Closure (BRAC) Commission designated Fort Lee a major recipient of growth. The construction, troop
increases and civil servant population increases that came with that growth have already delivered a
significant impact to the region. The economic contribution of each of these groups varies depending on
its unique characteristics. Students, for example, will attend the training school for a number of weeks.
Some will stay on post (where their lodging expenditures will not be captured by the local economy);
others will stay in hotels. Permanently assigned military members (staff and cadre, not students) are
likely to bring spouses and dependents who will themselves find employment locally. And the presence
of these personnel will bring an undetermined number of defense contractors to the region.3
However, the recent growth on Fort Lee carries no guarantee of permanence. In addition to changes in
the international combat posture of the armed forces, the complicated and ever‐changing negotiation
around federal budgeting, and prospective cuts to the Department of Defense budget suggest that the
Petersburg region, like any region that hosts a major military installation, will need to respond to
additional defense adjustments of unforeseeable size and composition in the near future. The impact of
these adjustments – both the overall magnitude and the affected industries – will vary in accordance
with the specific functions on Fort Lee targeted for adjustment.
Accordingly, this report provides economic impact multipliers that can be used to quickly assess the
total scope and sectoral impact of future mission changes. We take a two‐part approach to estimating
economic growth in the Petersburg area. The first part of the study maps all of the Fort Lee activities
that impact the area's economic output, and the second part of the study itemizes the expected impact
of each one. To facilitate easy analysis and future adaptation, we use a “modular” approach that
separates the marginal economic impact of each factor.4 This approach should assist the post
community in understanding the relative impact and distinct economic footprint of each post activity.
Rather than measuring the impact of mission growth after BRAC 2005, we simply measure the total
3 The build‐up at Fort Lee entails two types of contractors: "base" contractors stationed on‐post whose pay is pegged to the levels set in the General Schedule for federal employees and "defense" contractors who operate as private firms outside the gate. This report includes estimates for post contractors, but data for off‐post defense contractors were unavailable. Estimates of the economic impact of those defense contractors will be added to the study when sufficient data are obtained. 4 At this point in time, detailed data on defense contractor activity in the area are unavailable. However, "base" contractors who perform basic functions in the day‐to‐day operation of Ft. Lee are included in the study. The 'modular' organization of this study will allow estimates of defense contractor impacts to be added quickly when they become available.
The Economic Impact of Fort Lee
5
estimated impact of Fort Lee on the region during the calendar year 2011. This approach provides an
easily understood baseline for evaluating the impact of future changes on‐post.
After estimating Fort Lee’s total economic impact, we provide measures of anticipated industry‐by‐
industry impacts. These figures should be useful for answering basic questions about market size and
composition, occupational demand, and permitting needs and restrictions for different types of business
activities.
To make these estimates, we employed the input‐output model Implan, produced by the Minnesota
IMPLAN Group (MIG). MIG assembles data from national sources and modifies them with regional
information, enabling analysts to model business and household interactions and estimate economic
impacts in a given study area.
MEASURING ECONOMIC ACTIVITY AT FORT LEE: Key Figures and Assumptions
Our approach to modeling the economic impact of activity at Fort Lee treats each type of post activity
as a triggering event that will create subsequent rounds of activity in the local economy. Each dollar
spent by a military member or Department of Defense employee will circulate through the local
economy multiple times. For example, the developer hired to build a home for an incoming officer will
hire workers, purchase lumber, and pay architects to design the home. The lumber distributor,
construction workers and architects in turn purchase a variety of locally produced inputs in order to
deliver their work products, and spend their personal compensation on a variety of consumer items.
Economic impact analysis of the kind we undertake in this report traces the cumulative impact of each
dollar as it circulates from industry to industry within the local economy.5 The core measure of this
spending is the economic impact multiplier, a simple measure of the total expected economic output
triggered by a single dollar in new spending. Depending on the type of activity, multipliers typically fall
between 1.25 and 2.
The economic models used in this kind of analysis are static, rather than dynamic.6 Once the basic
model has been determined, it is the inputs into the model – the specific assumptions about who will
be moving to the Fort Lee area, where they will live, what kind of family members they will bring, and
the employment benefits they will receive – that determine the overall economic impact. Static
models of this type are more reliable with small economic impacts. Large impacts, such as the impact
from Fort Lee, are more likely to change the very structure of the economy on which the model is
based. On the other hand, while static models somewhat limit the analysis, they are much more
5 Following the Fort Lee Growth Management Plan, we define the local area as Chesterfield County, the City of Colonial Heights, Hopewell City, Dinwiddie County, Petersburg City and Prince George County. This region includes Chesterfield County’s “Brandermill” corridor, where significant post‐2005 development has occurred. 6 With a few minor, technical exceptions. Please see Appendix A for details on the technical components of the models.
The Economic Impact of Fort Lee
6
straightforward, and the assumptions behind them should be transparent to all. In all cases, reports of
this type should be supplemented with local, on‐the‐ground knowledge of current economic events.
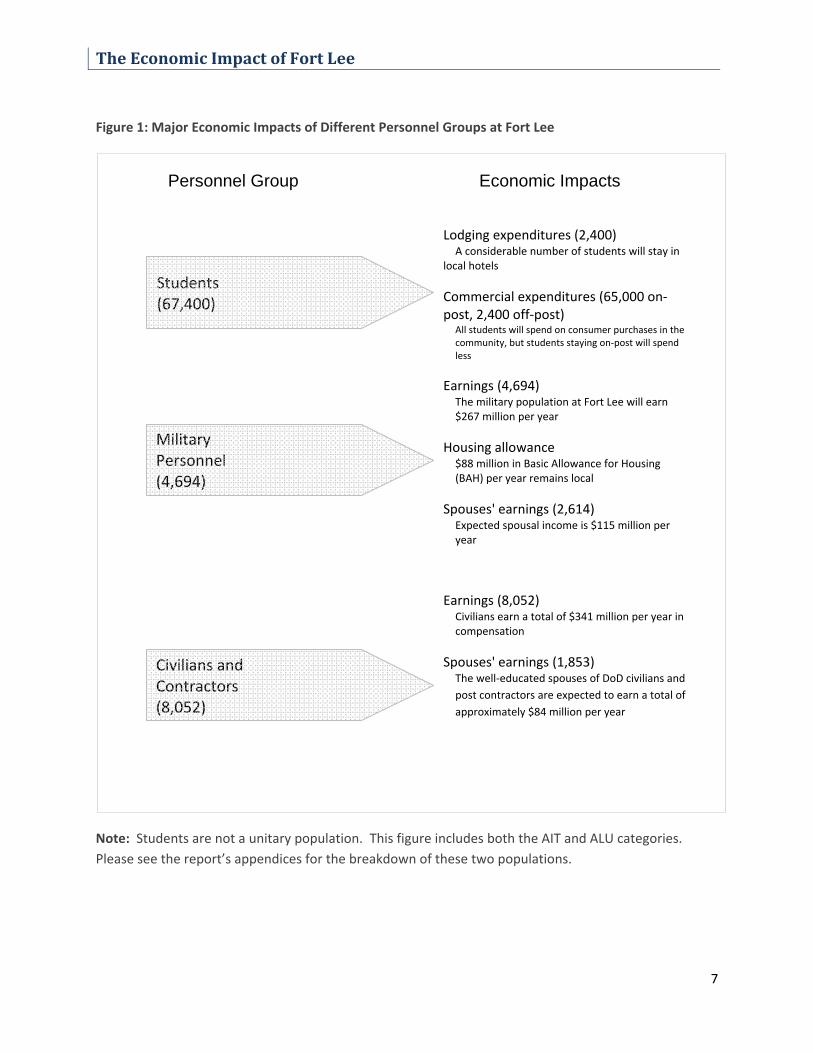
As of March 2012, BRAC coordinators at Ft. Lee identify four core groups of personnel on‐post
67,400 students
4,694 military personnel
5,253 Department of Defense and other civilians
2,799 on‐post contractors
Figure 1 below details the basic sets of economic impacts we track for each of these groups at Fort Lee.
The rest of this section discusses the major analytical steps we used to determine the magnitude of
initial change for these sources of impact.
The expected economic impact of each of these groups depends on several characteristics, such as rank
(which determines salary) and support of dependents, (which determines Basic Allowance for Housing),
on‐post versus off‐post residence (which determines the extent to which spending on housing is
captured by the real estate industry) and propensity to spend locally. Figure 1 outlines the most
important of these characteristics, as they influence our economic impact estimates.
The Economic Impact of Fort Lee
7
Figure 1: Major Economic Impacts of Different Personnel Groups at Fort Lee
Note: Students are not a unitary population. This figure includes both the AIT and ALU categories.
Please see the report’s appendices for the breakdown of these two populations.
Lodging expenditures (2,400) A considerable number of students will stay in
local hotels
Commercial expenditures (65,000 on‐post, 2,400 off‐post)
All students will spend on consumer purchases in the community, but students staying on‐post will spend less
Earnings (4,694) The military population at Fort Lee will earn $267 million per year
Housing allowance $88 million in Basic Allowance for Housing (BAH) per year remains local
Spouses' earnings (2,614) Expected spousal income is $115 million per year
Earnings (8,052) Civilians earn a total of $341 million per year in compensation
Spouses' earnings (1,853) The well‐educated spouses of DoD civilians and
post contractors are expected to earn a total of
approximately $84 million per year
Students (67,400)
Military Personnel (4,694)
Civilians and Contractors (8,052)
Personnel Group Economic Impacts
The Economic Impact of Fort Lee
8
Students:
As a training‐focused installation, Fort Lee brings in tens of thousands of armed forces students annually
for Advanced Individual Training (AIT) courses and the Army Logistics University (ALU) training courses.
Each set of students pumps money into the local economy through a combination of consumer
spending, off‐post hotel stays and, in the case of AIT students, by drawing family members to the region
to attend graduation ceremonies. Because Fort Lee’s training activities differ in terms of the students
they draw and the amount of off‐post spending, we enter them separately into the economic impact
model.
Advanced Individual Training: Over the course of a 50‐week training year, a total of 65,000 students
attend several weeks of Advanced Individual Training. For the great majority of time, they eat, sleep,
learn and recreate on post, and as a result do not engage in spending that impacts the local economy.
But weekend leave is part of the program. Fort Lee estimates that 25‐30% of AIT students receive two‐
day leaves per week. Splitting the difference, we estimate that 27.5%, or 17,875 students take leave on
any weekend. Over the course of a 50‐week session, this equates to 893,750 individual soldier‐days of
leave.
Infrequent as it is, that leave delivers a significant economic impact in the aggregate. Beginning with
estimated spending of $200 per day,7 we subtracted the mid‐point estimate of local hotel rates ($79), to
determine that students spent $121 per day on a mix of entertainment and local services, and the
remainder on lodging.
Additionally, AIT students often draw family members to the region to attend graduation ceremonies.
Based on input from the Fort Lee region, we estimate that family members of one‐quarter of the
students (16,250) attend graduation ceremonies in a given year. Working from an estimate of $150
spent per visiting family, we entered a mix of $2,437,500 in lodging local services and eating and
drinking establishments into Implan.
Army Logistics University: As of 2011, the Army Logistics University had an average daily student load of
2,400. The main impact of these students comes from off‐post lodging.8 Over the course of 50 weeks,
those students book a total of 840,000 nights of lodging in area hotels. Under the Lodging Success
Program, each of those stays costs $64.43 per night. This leads to an annual total of $54.12 million spent
on lodging. Additionally, a survey of the students showed that they spend $245 (2010 dollars) weekly on
various consumer industries.9 This spending totals nearly $31.5 million per year, a figure we entered into
Implan in the respective industries.
7 Please see pp. 45 and 47 in Fort Lee Growth Management Plan by RKG Associates, Inc. While those students are not directly comparable to AIT students, the survey provides the best available starting point for estimates of spending. Please see Appendix B for further details. 8 The planned construction of on‐post lodging facilities in the near future will significantly reduce the impact from this baseline estimate. 9 Please see pp. 45 and 47 in Fort Lee Growth Management Plan by RKG Associates, Inc.
The Economic Impact of Fort Lee
9
Government Sectors (Federal Military and Civilian Employment):
To estimate the impact of military presence on‐post, we used the employment figures provided by Fort
Lee and military personnel pay levels data.10 We utilized RKG Associates’ survey of military personnel
ranks to estimate rank distribution of total military personnel on the base. This finely grained pay data
provided great detail on overall compensation. But paycheck totals only represent the most readily
measureable economic impact military and civilian personnel have on the local economy. Military
members contribute significant additional economic activity through the use and expenditure of non‐
wage income:
Basic Allowance for Housing (BAH). BAH expenditures function as an income supplement,
allowing military members to spend their paychecks on other goods and services. To
incorporate these expenditures into the model, we started with the total number of military
personnel provided by Fort Lee. We then imputed information on rank, and family structure
by rank, to develop a full list of household size for each class of enlisted soldier and officer.
This allows us to add monthly BAH estimates, which ranged from $1,030 to $2,404. The total
amount of BAH for Fort Lee was estimated to be $88 million.
Basic Allowance for Subsistence (BAS). BAS is meant to offset costs for a member's meals.
Because BAS is intended to provide meals for the service member, its level is linked to the
price of food. Therefore, each year it is adjusted based upon the increase of the price of
food as measured by the USDA food cost index. In order to incorporate spending resulting
from BAS into our model, we used 2011 BAS rates, which are approximately $223 for
officers and $325 for enlisted military personnel per month. The total amount of BAS for
Fort Lee was estimated to be $17 million.
Healthcare spending. Formally, military personnel receive all health care through the Armed
Forces, effectively removing this significant source of spending from the private‐sector
economy. However, limited availability of some services on‐post, as well as the convenience
of off‐post access, especially for family members, pushes many of these services into the
private sector. According to the U.S. Office of Personnel management (OPM), the typical
federal worker received healthcare benefits worth $1,464 per quarter.11 That figure equates
to $5,856 annually, approximately 15% of the typical DoD civilian’s pay, and approximately
12% of the pay of a typical soldier stationed at Fort Lee. For military members, we enter
$2,928 in healthcare spending into Implan. This figure reflects the assumption that military
personnel consume half of their healthcare on‐post, where their spending is not captured by
the local economy.
10 Available at www.militaryfactory.com 11 See http://www.opm.gov/retire/pubs/bals/2012/12‐306.pdf
The Economic Impact of Fort Lee
10
Spouses. Person per person, the military spouses in the Fort Lee area contribute significantly
to the local economy. In particular, those employed in the private sector work for
businesses that contribute significant “indirect” economic impacts through purchases (of
real estate, office supplies, computers, utilities, legal and business services, etc.) from other
local businesses. This stands in contrast to military and DoD activities, many of which
operate through nationwide procurement networks that steer purchasing outside of the
local economy.12 We combined data on spousal employment (sorted by industry) from the
2009 American Community Survey with estimates of rank for Fort Lee soldiers to determine
the total number of jobs held by military spouses. We entered these employment totals
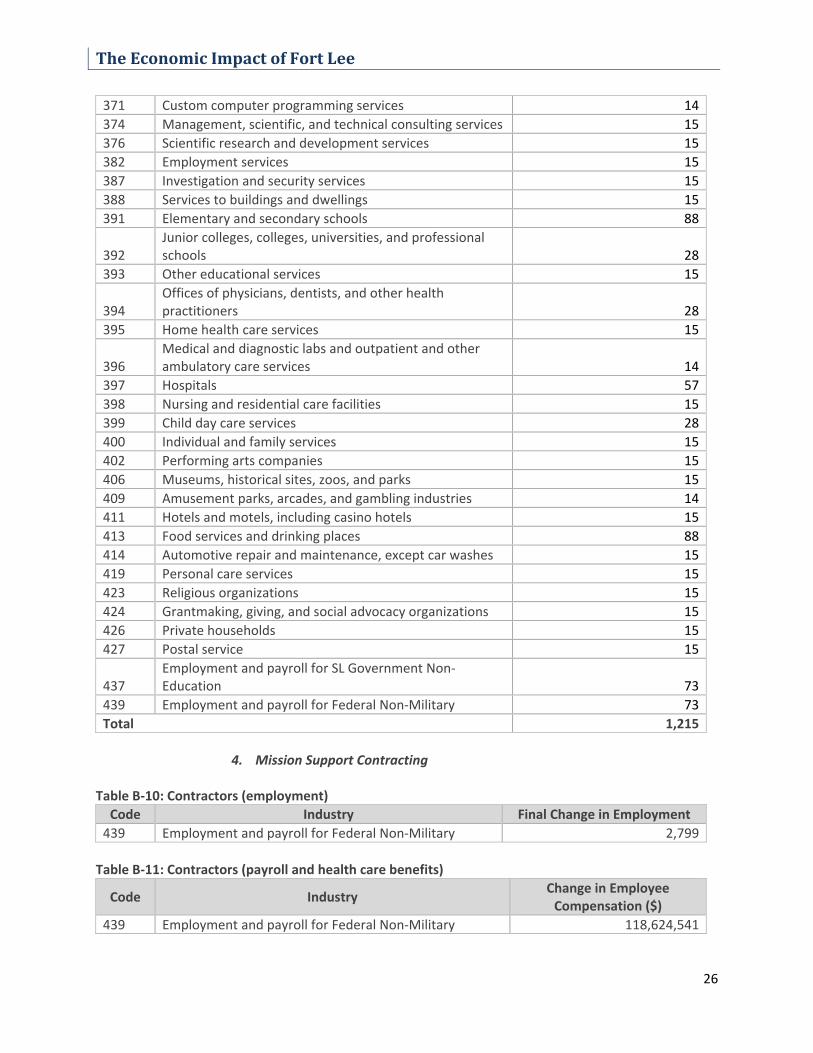
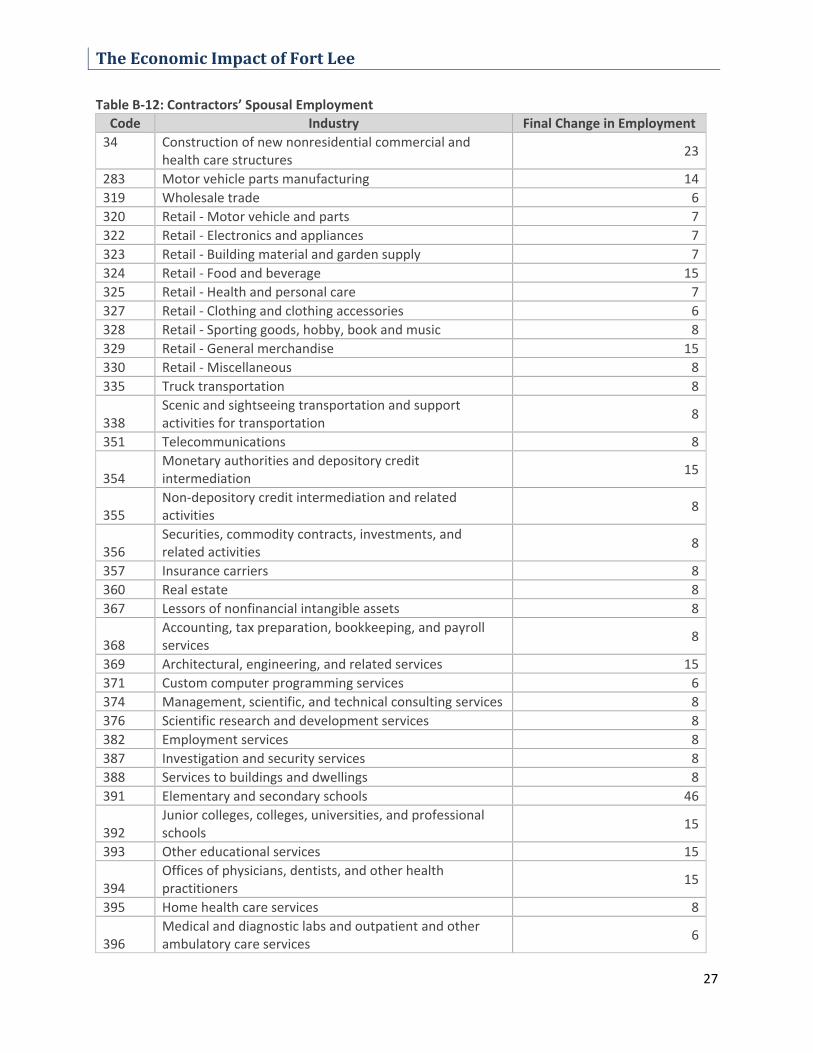
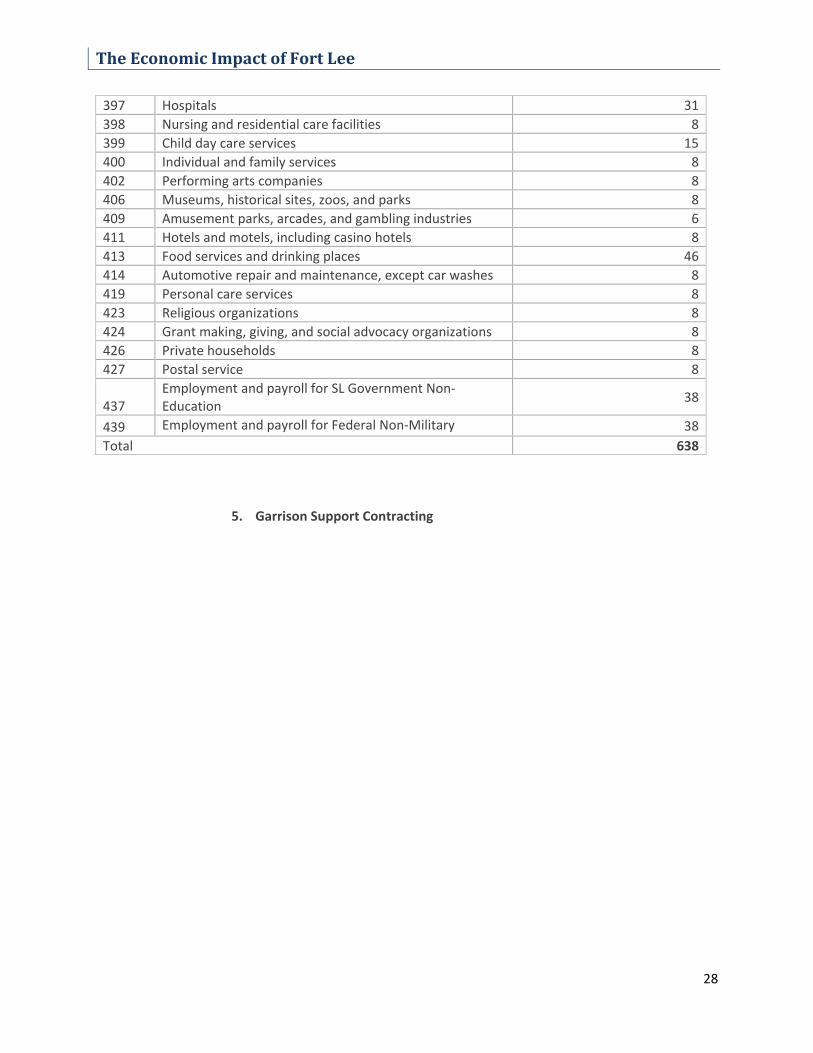
(2,614 military spousal employees, 1,215 civilian spouse employees, and 638 contractor
spouse employees) into Implan in the relevant industries.
The process for determining the economic impact of Department of Defense civilians was more
straightforward. The Crater Planning District provided total personnel counts and information on payroll
figures for the Defense civilians employed on‐post as of 2011. We augmented payroll information with
two additional sources of local economic impact:
Healthcare spending. According to the U.S. Office of Personnel Management (OPM), the
typical payroll employee in the United States receives healthcare benefits worth on average
15% of total salary. OPM estimates the cost for health coverage for federal workers in
February at $1,464 per quarter in 2012.13 That equates to $5,856 per year. We apply the
15% figure uniformly for civilians working at Fort Lee.
Based on a civilian payroll total of $194 million, we applied this figure to derive an estimate
of health benefits spending of $29 million. Because Department of Defense civilians are
insured through private carriers, we anticipate all of this spending falling within the local
economy.
Spouses. As is the case with military spouses, the spouses of Department of Defense civilians
can be expected to contribute significantly to the local economy, especially when
considering the propensity of highly educated workers to marry other highly educated (and
comparatively well‐paid) workers.14 But a number of factors limit the propensity of those
spouses to migrate to the area. In particular, the proximity of the relocated Defense
Contract Management Agency command to the Washington, D.C. area from which many
civilian personnel have transferred should lead a substantial number of employees to
12 Many Army helmets, for example, are made in North Dakota, while Modular Lightweight Load Carrying
Equipment (MOLLE) gear is manufactured in Missouri and Massachusetts. By contrast, military and DoD civilian spouses employed in the private sector work for businesses that pay rent to local landlords, service fees to local vendors, etc. 13 See http://www.opm.gov/retire/pubs/bals/2012/12‐306.pdf 14 Data from the 2009 American Community Survey show that median educational attainment of federal civilian workers’ spouses rises with civilian workers’ pay level and educational attainment.
The Economic Impact of Fort Lee
11
commute (either daily or weekly) rather than relocate, especially in the short term. While
figures from the American Community Survey suggest that current DoD civilian employees
at Fort Lee should have 2,650 employed spouses in the area, we added the assumption that
10% of those jobs were filled locally, and that 50% of the remaining DoD Civilian personnel
commute weekly from the Washington area. This results in an estimate of 1,215 locally
employed spouses. We entered this total into Implan, once again using American
Community Survey data to estimate the number of spouses employed in particular sectors.
Contracting:
Contracting at Fort Lee impacts the local economy in two significant ways. First, Fort Lee employs a
significant number of “on‐post” private‐sector contractors who work alongside military personnel and
DoD civilians. Second, Fort Lee contracts with a number of local firms for goods and services essential to
the day‐to‐day operation of the base. Each of these types of contracting generates substantial activity in
the local economy.
In Fiscal Year 2011, Fort Lee employed approximately 2,799 on‐post contractors in mission and mission
support organizations. Roughly 500 of these contractors worked as instructors, and the rest worked in
maintenance, IT support and logistics (280 each) or programming (792), with pay scales that roughly
matched those of Department of Defense Civilians.15 Through interviews with Fort Lee personnel, we
matched these individuals’ job descriptions to descriptions of the qualifications for each General
Schedule grade for federal civilians. This resulted in an estimated distribution of total pay ranges. The
job descriptions for maintenance personnel, for example, required minimal education and few formal
skills, leading us to assign these workers grades between GS‐2 and GS‐4 (on a scale ranging from GS‐1 to
GS‐12). By contrast, the educational requirements for programmers ranged from a college education to
a Ph.D., leading us to assign grades between GS‐5 and GS‐11. These estimates led to the following
distribution (Table 3):
15 Source: Private data request from Fort Lee, June 2011.
The Economic Impact of Fort Lee
12
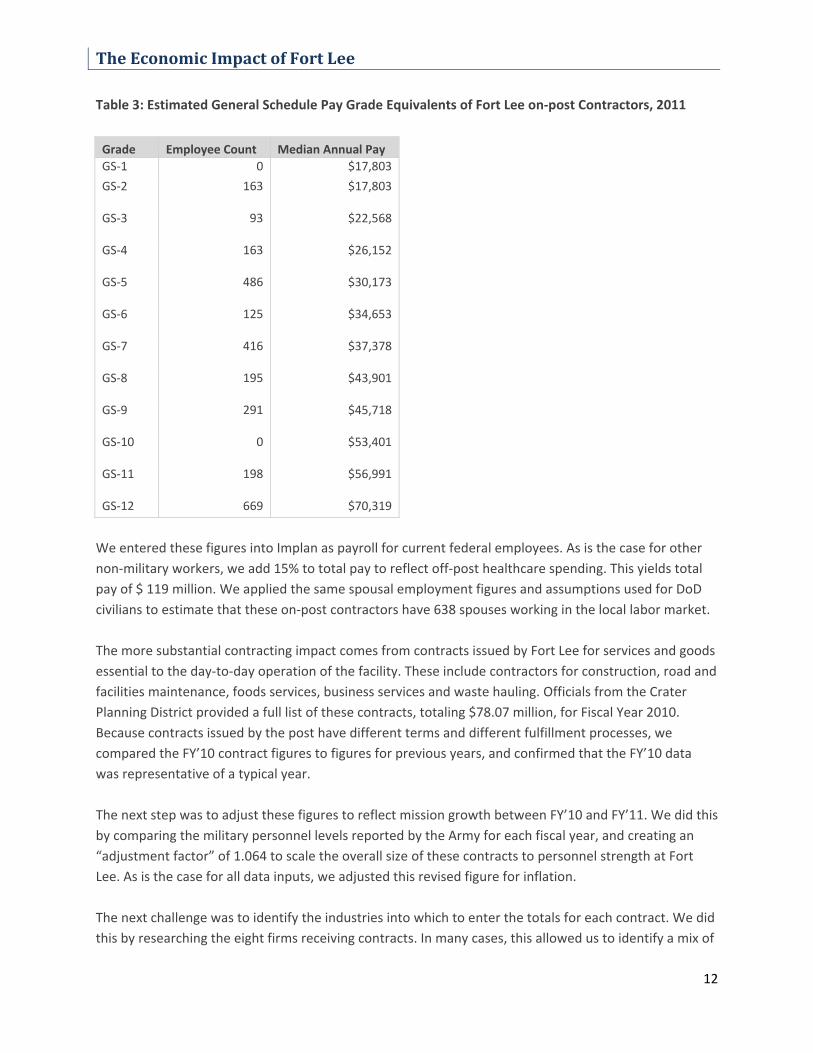
Table 3: Estimated General Schedule Pay Grade Equivalents of Fort Lee on‐post Contractors, 2011
Grade Employee Count Median Annual Pay
GS‐1 0 $17,803
GS‐2 163 $17,803
GS‐3 93 $22,568
GS‐4 163 $26,152
GS‐5 486 $30,173
GS‐6 125 $34,653
GS‐7 416 $37,378
GS‐8 195 $43,901
GS‐9 291 $45,718
GS‐10 0 $53,401
GS‐11 198 $56,991
GS‐12 669 $70,319
We entered these figures into Implan as payroll for current federal employees. As is the case for other
non‐military workers, we add 15% to total pay to reflect off‐post healthcare spending. This yields total
pay of $ 119 million. We applied the same spousal employment figures and assumptions used for DoD
civilians to estimate that these on‐post contractors have 638 spouses working in the local labor market.
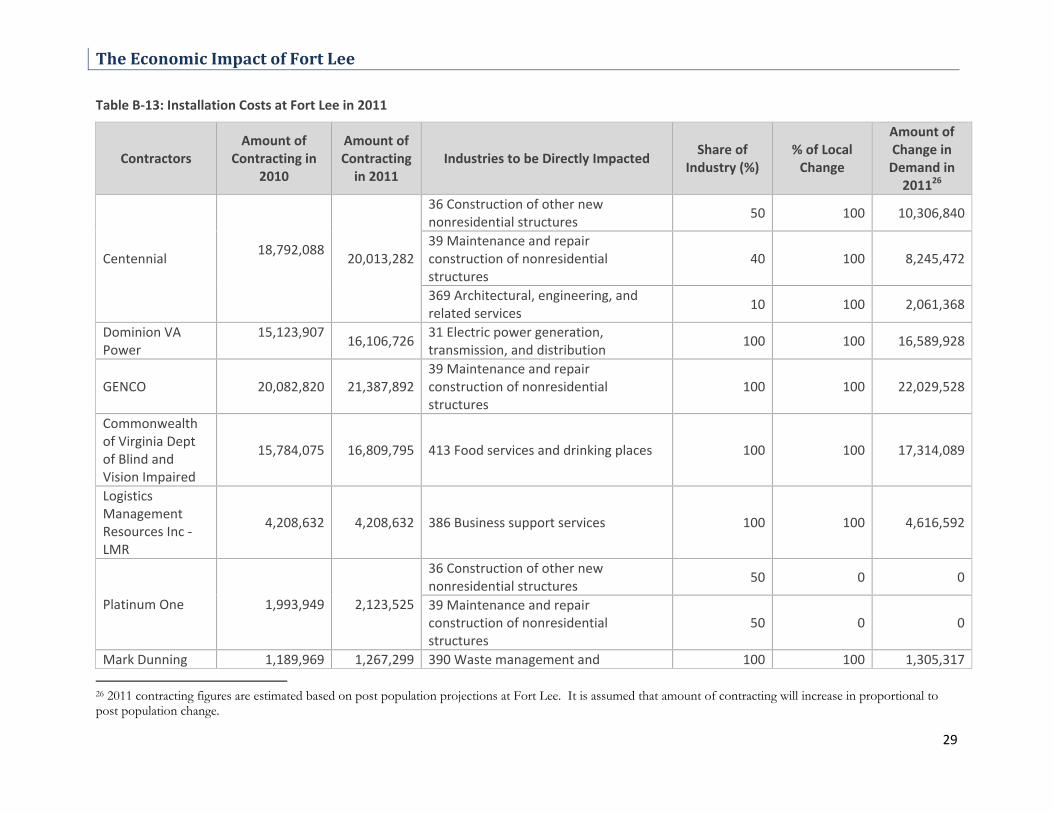
The more substantial contracting impact comes from contracts issued by Fort Lee for services and goods
essential to the day‐to‐day operation of the facility. These include contractors for construction, road and
facilities maintenance, foods services, business services and waste hauling. Officials from the Crater
Planning District provided a full list of these contracts, totaling $78.07 million, for Fiscal Year 2010.
Because contracts issued by the post have different terms and different fulfillment processes, we
compared the FY’10 contract figures to figures for previous years, and confirmed that the FY’10 data
was representative of a typical year.
The next step was to adjust these figures to reflect mission growth between FY’10 and FY’11. We did this
by comparing the military personnel levels reported by the Army for each fiscal year, and creating an
“adjustment factor” of 1.064 to scale the overall size of these contracts to personnel strength at Fort
Lee. As is the case for all data inputs, we adjusted this revised figure for inflation.
The next challenge was to identify the industries into which to enter the totals for each contract. We did
this by researching the eight firms receiving contracts. In many cases, this allowed us to identify a mix of
The Economic Impact of Fort Lee
13
representative industry codes that more faithfully matched the work performed by these contractors
than does a single, self‐reported North American Industrial Classification System (NAICS) Code. For
example, we were able to identify that the contractor Centennial, a construction firm, provided a mix of
nonresidential construction work, maintenance and architectural and engineering services. Spreading its
contract out over these industrial categories yielded a mix of projected activity that closely fits the
actual work performed.
ANALYSIS AND RESULTS
An initial change or triggering event, also referred to as the direct impact, spurs subsequent indirect
and induced activities resulting from interconnected economic relationships:
The direct impact is the projected change in the local economy under consideration. In this case,
the direct impact being modeled is Fiscal Year 2011 troop and personnel levels at Fort Lee.
Because we measure the total impact of the installation, rather than the impact of growth
authorized by BRAC 2005, this number represents the impact to the region of having Fort Lee. It
also includes the economic impact of spouses who live in the region due to an individual stationed
at, assigned to, or employed at Fort Lee.
Indirect effects result from business‐to‐business interactions altered by the direct impact. An
example of an indirect effect is job creation at a local building services company due to the
additional work generated by the expansion of an area hotel.
Induced effects represent the impacts caused by adjustments in the consumption expenditures of
households in response to changes in income resulting from the direct and indirect impacts. An
example of an induced effect is an increase in area retail employment due to increased retail
shopping volume after job creation in government military and government non‐military sectors.
Economic impacts are measured in terms of changes in economic activity and associated changes in
employment and wages. They are reported as follows:
Output is the total value of goods and services produced in an industry or industry sector across
all stages of production.
Employment is calculated as the number of jobs needed to support a given amount of economic
activity in an industry or industry sector. It includes all wage and salary employees, both part‐ and
full‐time, as well as self‐employed workers. Employment is measured in terms of the number of
annual (one‐year full‐time equivalent) jobs.
The Economic Impact of Fort Lee
14
Tax represents the total local and state taxes paid by corporations, businesses, and households. In
this case, we measure increased tax payments due to growth in overall economic activity.
IMPACT RESULTS AND ANALYSIS
Military personnel and their spouses are predicted to have the largest cumulative economic impact on
the region. Our model indicates that post military personnel with their spouses and allowances for
housing have an impact of $1.19 billion and account for the largest share of the total impact of $2.4
billion by a significant margin. Civilian personnel with their spouses account for $592 million in total
output. At $168 million, students are anticipated to have a large overall economic impact, but not nearly
as large as that of civilian or permanent military personnel. Table 4 itemizes total economic,
employment and tax impacts by origin.
Military personnel are expected to have the largest cumulative economic impact on the region. The
average military personnel salary is more than $56,000, while average annual pay for civilian personnel
is around $42,000.
As a result of the commuting patterns discussed earlier and various demographic factors, the number of
military spouses (2,614) moving to the area is expected to significantly exceed the number of civilian
spouses (1,215). Notably, spouses tend to have a larger economic impact than people who work on
post. Indirect economic impacts are the reason. As discussed above, the Army and DoD purchase most
of the supplies and services needed to run Fort Lee through federal procurement plans that steer
minimal economic activity into the Fort Lee area. But spouses employed in the private economy behave
like other private sector employees, using a large portion of local goods and services to do their jobs.
Person for person, these workers have a larger economic impact than do DoD civilians or military
personnel. Thus, the anticipated high rate of spousal accompaniment for DoD civilians is a crucial
component of the expected economic gains to the area.
Income is another important component of the story. The jobs that are estimated to exist as a result of
activities in the area at Fort Lee comprise approximately 12.28%% of the area's 2008 employment. But
they are estimated to contribute 13.62% of regional gross product. In other words, jobs at Fort Lee pay
more on the average and contribute more to local economic activity than do jobs off‐post.16
Table 5, 6, and Table 7 itemize the anticipated direct, indirect and induced impacts for employment,
income, and for total economic output, respectively.
16 Implan's output‐to‐employment ratios, which measure the amount of employment needed to produce a certain level of economic output, confirm this finding. While the current output‐to‐employee ratio is $77,348, the comparable ratio for new jobs is $87,679.
The Economic Impact of Fort Lee
15
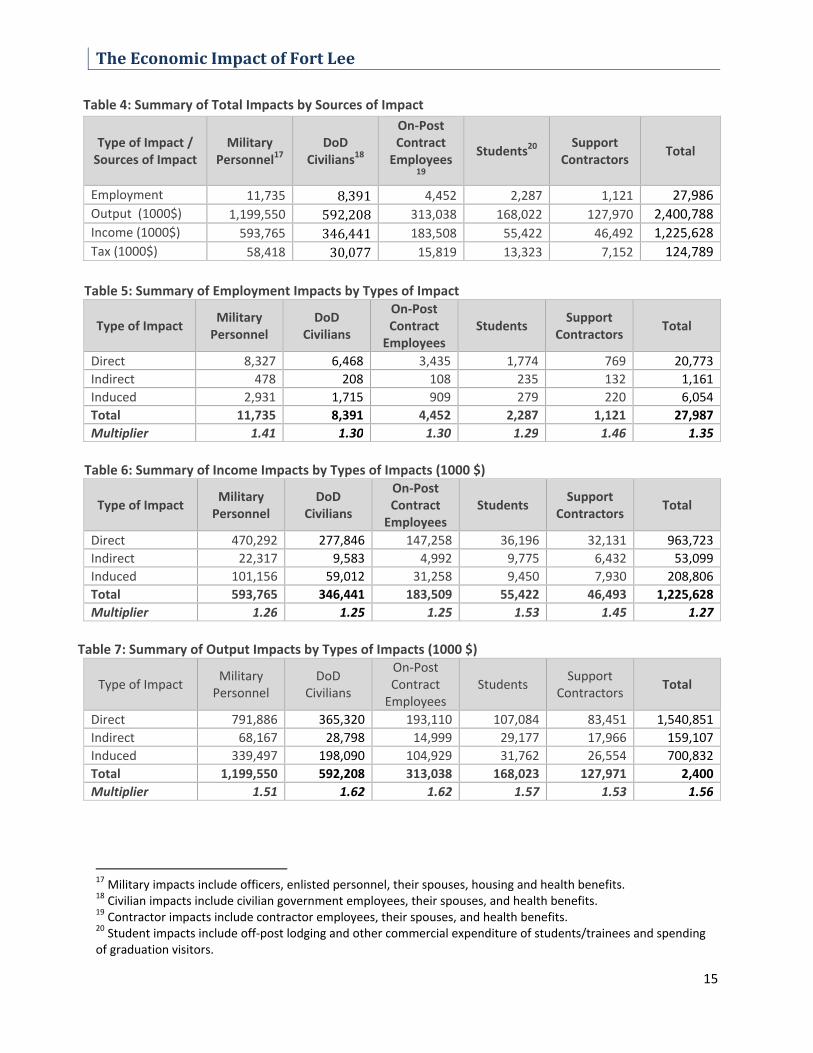
Table 4: Summary of Total Impacts by Sources of Impact
Type of Impact / Sources of Impact
Military Personnel17
DoD Civilians18
On‐Post Contract Employees
19
Students20 Support
Contractors Total
Employment 11,735 8,391 4,452 2,287 1,121 27,986Output (1000$) 1,199,550 592,208 313,038 168,022 127,970 2,400,788Income (1000$) 593,765 346,441 183,508 55,422 46,492 1,225,628
Tax (1000$) 58,418 30,077 15,819 13,323 7,152 124,789
Table 5: Summary of Employment Impacts by Types of Impact
Type of Impact Military Personnel
DoD Civilians
On‐Post Contract Employees
Students Support
Contractors Total
Direct 8,327 6,468 3,435 1,774 769 20,773
Indirect 478 208 108 235 132 1,161
Induced 2,931 1,715 909 279 220 6,054
Total 11,735 8,391 4,452 2,287 1,121 27,987
Multiplier 1.41 1.30 1.30 1.29 1.46 1.35
Table 6: Summary of Income Impacts by Types of Impacts (1000 $)
Type of Impact Military Personnel
DoD Civilians
On‐Post Contract Employees
Students Support
Contractors Total
Direct 470,292 277,846 147,258 36,196 32,131 963,723
Indirect 22,317 9,583 4,992 9,775 6,432 53,099
Induced 101,156 59,012 31,258 9,450 7,930 208,806
Total 593,765 346,441 183,509 55,422 46,493 1,225,628
Multiplier 1.26 1.25 1.25 1.53 1.45 1.27
Table 7: Summary of Output Impacts by Types of Impacts (1000 $)
Type of Impact Military Personnel
DoD Civilians
On‐Post Contract Employees
Students Support
Contractors Total
Direct 791,886 365,320 193,110 107,084 83,451 1,540,851
Indirect 68,167 28,798 14,999 29,177 17,966 159,107
Induced 339,497 198,090 104,929 31,762 26,554 700,832
Total 1,199,550 592,208 313,038 168,023 127,971 2,400
Multiplier 1.51 1.62 1.62 1.57 1.53 1.56
17 Military impacts include officers, enlisted personnel, their spouses, housing and health benefits. 18 Civilian impacts include civilian government employees, their spouses, and health benefits. 19 Contractor impacts include contractor employees, their spouses, and health benefits. 20 Student impacts include off‐post lodging and other commercial expenditure of students/trainees and spending of graduation visitors.
The Economic Impact of Fort Lee
16
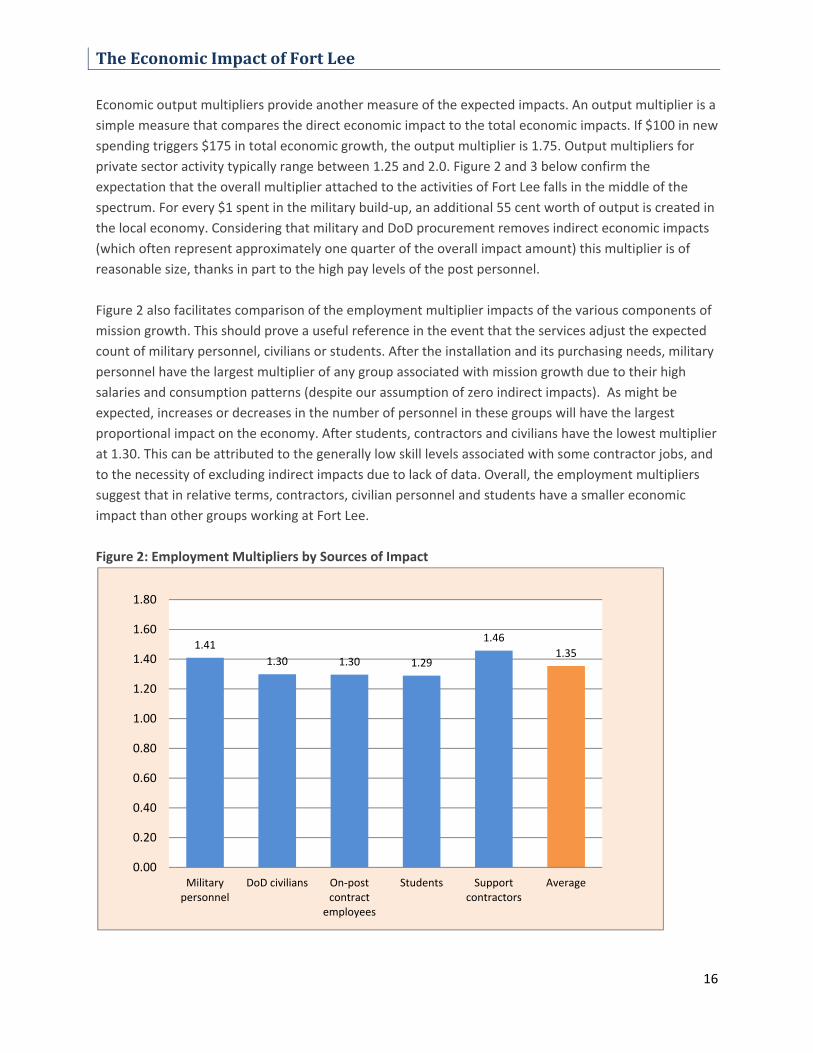
Economic output multipliers provide another measure of the expected impacts. An output multiplier is a
simple measure that compares the direct economic impact to the total economic impacts. If $100 in new
spending triggers $175 in total economic growth, the output multiplier is 1.75. Output multipliers for
private sector activity typically range between 1.25 and 2.0. Figure 2 and 3 below confirm the
expectation that the overall multiplier attached to the activities of Fort Lee falls in the middle of the
spectrum. For every $1 spent in the military build‐up, an additional 55 cent worth of output is created in
the local economy. Considering that military and DoD procurement removes indirect economic impacts
(which often represent approximately one quarter of the overall impact amount) this multiplier is of
reasonable size, thanks in part to the high pay levels of the post personnel.
Figure 2 also facilitates comparison of the employment multiplier impacts of the various components of
mission growth. This should prove a useful reference in the event that the services adjust the expected
count of military personnel, civilians or students. After the installation and its purchasing needs, military
personnel have the largest multiplier of any group associated with mission growth due to their high
salaries and consumption patterns (despite our assumption of zero indirect impacts). As might be
expected, increases or decreases in the number of personnel in these groups will have the largest
proportional impact on the economy. After students, contractors and civilians have the lowest multiplier
at 1.30. This can be attributed to the generally low skill levels associated with some contractor jobs, and
to the necessity of excluding indirect impacts due to lack of data. Overall, the employment multipliers
suggest that in relative terms, contractors, civilian personnel and students have a smaller economic
impact than other groups working at Fort Lee.
Figure 2: Employment Multipliers by Sources of Impact
1.41
1.30 1.30 1.29
1.46
1.35
0.00
0.20
0.40
0.60
0.80
1.00
1.20
1.40
1.60
1.80
Military personnel
DoD civilians On‐post contract
employees
Students Support contractors
Average
The Economic Impact of Fort Lee
17
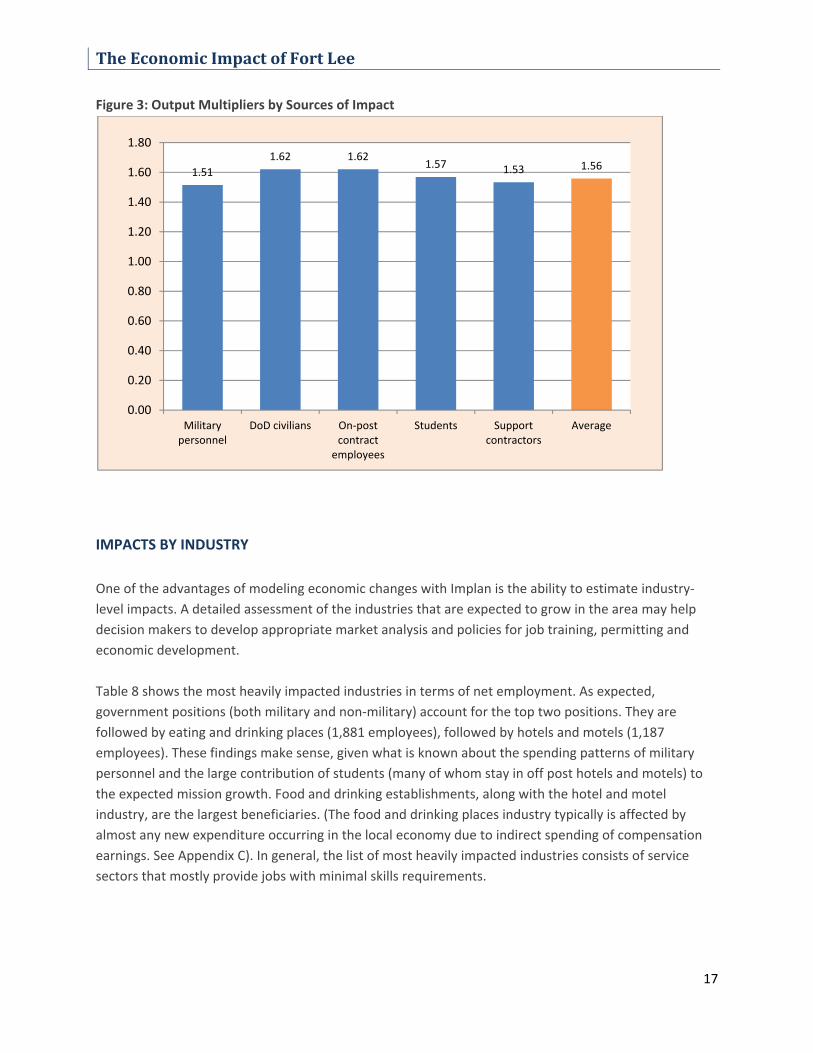
Figure 3: Output Multipliers by Sources of Impact
IMPACTS BY INDUSTRY
One of the advantages of modeling economic changes with Implan is the ability to estimate industry‐
level impacts. A detailed assessment of the industries that are expected to grow in the area may help
decision makers to develop appropriate market analysis and policies for job training, permitting and
economic development.
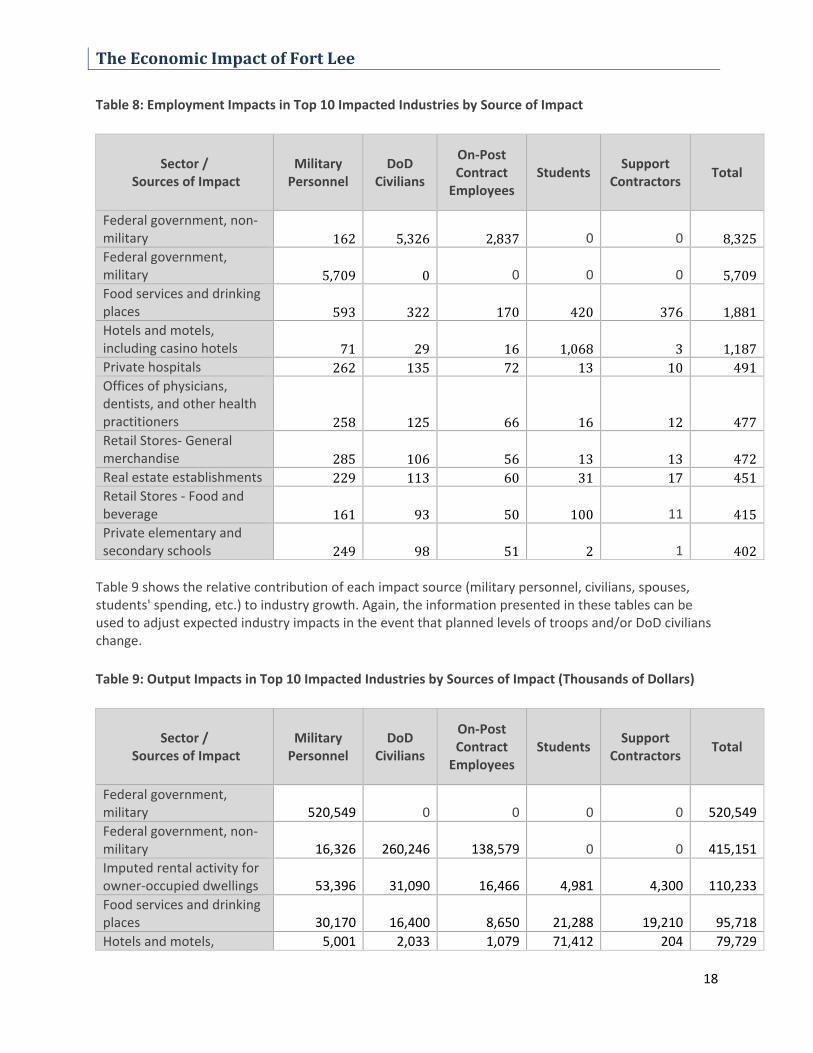
Table 8 shows the most heavily impacted industries in terms of net employment. As expected,
government positions (both military and non‐military) account for the top two positions. They are
followed by eating and drinking places (1,881 employees), followed by hotels and motels (1,187
employees). These findings make sense, given what is known about the spending patterns of military
personnel and the large contribution of students (many of whom stay in off post hotels and motels) to
the expected mission growth. Food and drinking establishments, along with the hotel and motel
industry, are the largest beneficiaries. (The food and drinking places industry typically is affected by
almost any new expenditure occurring in the local economy due to indirect spending of compensation
earnings. See Appendix C). In general, the list of most heavily impacted industries consists of service
sectors that mostly provide jobs with minimal skills requirements.
1.51
1.62 1.621.57 1.53 1.56
0.00
0.20
0.40
0.60
0.80
1.00
1.20
1.40
1.60
1.80
Military personnel
DoD civilians On‐post contract
employees
Students Support contractors
Average
The Economic Impact of Fort Lee
18
Table 8: Employment Impacts in Top 10 Impacted Industries by Source of Impact
Sector / Sources of Impact
Military Personnel
DoD Civilians
On‐Post Contract Employees
Students Support
Contractors Total
Federal government, non‐military 162 5,326 2,837 0 0 8,325Federal government, military 5,709 0 0 0 0 5,709Food services and drinking places 593 322 170 420 376 1,881Hotels and motels, including casino hotels 71 29 16 1,068 3 1,187Private hospitals 262 135 72 13 10 491Offices of physicians, dentists, and other health practitioners 258 125 66 16 12 477Retail Stores‐ General merchandise 285 106 56 13 13 472Real estate establishments 229 113 60 31 17 451Retail Stores ‐ Food and beverage 161 93 50 100 11 415Private elementary and secondary schools 249 98 51 2 1 402
Table 9 shows the relative contribution of each impact source (military personnel, civilians, spouses, students' spending, etc.) to industry growth. Again, the information presented in these tables can be used to adjust expected industry impacts in the event that planned levels of troops and/or DoD civilians change.
Table 9: Output Impacts in Top 10 Impacted Industries by Sources of Impact (Thousands of Dollars)
Sector / Sources of Impact
Military Personnel
DoD Civilians
On‐Post Contract Employees
Students Support
Contractors Total
Federal government, military 520,549 0 0 0 0 520,549
Federal government, non‐military 16,326 260,246 138,579 0 0 415,151
Imputed rental activity for owner‐occupied dwellings 53,396 31,090 16,466 4,981 4,300 110,233
Food services and drinking places 30,170 16,400 8,650 21,288 19,210 95,718
Hotels and motels, 5,001 2,033 1,079 71,412 204 79,729
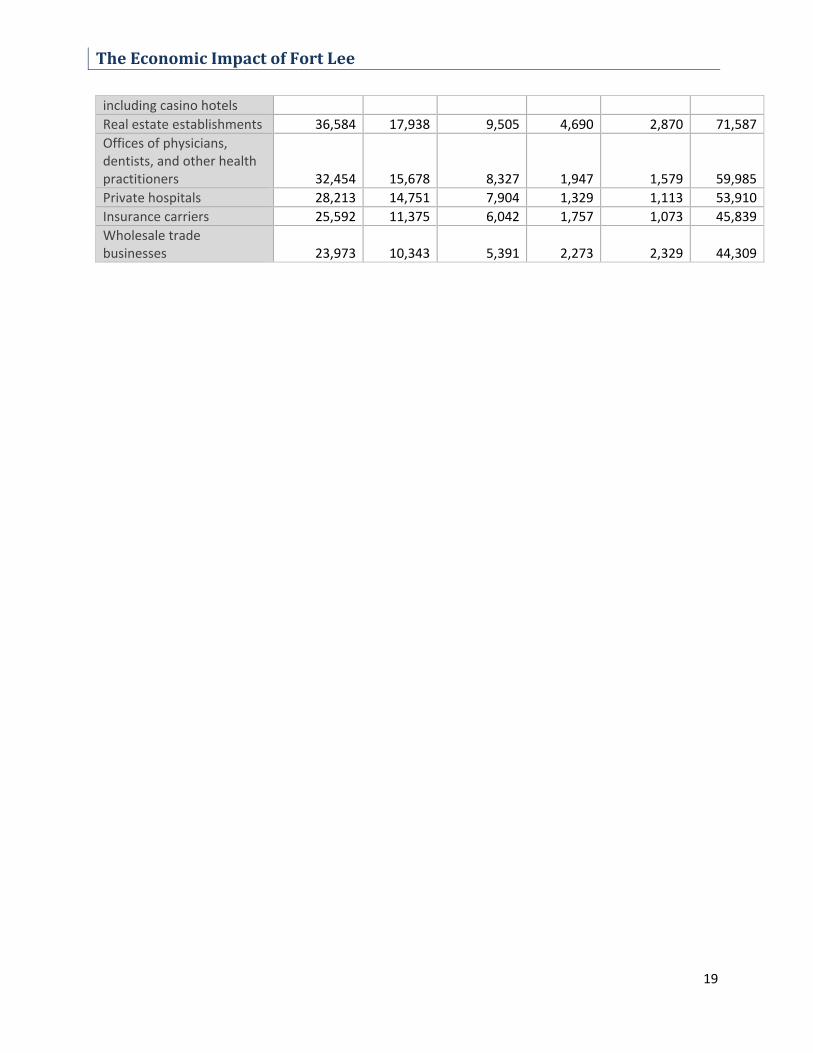
The Economic Impact of Fort Lee
19
including casino hotels
Real estate establishments 36,584 17,938 9,505 4,690 2,870 71,587
Offices of physicians, dentists, and other health practitioners 32,454 15,678 8,327 1,947 1,579 59,985
Private hospitals 28,213 14,751 7,904 1,329 1,113 53,910
Insurance carriers 25,592 11,375 6,042 1,757 1,073 45,839
Wholesale trade businesses 23,973 10,343 5,391 2,273 2,329 44,309
The Economic Impact of Fort Lee
20
APPENDIX
APPENDIX A: ASSUMPTIONS
This economic impact study was conducted using input‐output modeling. Input‐output models trace the
purchasing relationships among businesses, government, and consumers to provide a full accounting of
the way spending flows through a regional economy. By accounting for linkages across industries and
other economic sectors, input‐output analysis documents the multiple ways in which a change in one
industry impacts other industries and consumers.
Like any other economic model, an input‐output model is a simplification of the complex world. It is
important to be aware of assumptions incorporated into the model when interpreting economic impact
estimates and developing policy responses. A first key assumption made in the input‐output model is
that a one dollar increase or decrease in industry output will always have the same effect on the
economy. In mathematical terms, this means that input‐output analysis treats industry production as
“linear”, with “constant returns to scale.” This is a simplification. For example, a plant that is already
operating at full capacity may need to undertake larger‐than‐average expenditures in order to generate
additional production. At the other end of the spectrum, a plant that ceases production may have
already eliminated many critical functions, and the reduction in spending may be less than predicted in
the model.
A second key assumption is that supplies are unconstrained. Industries have unfettered access to raw
materials and their output is limited only by the demand for their products. Input scarcities are not
considered.
A third key assumption is that firms do not substitute inputs. Input‐output analysis will not be as
accurate in cases in which a long‐term spike in costs or a shortage in supply causes businesses to
develop new suppliers or make their products differently.
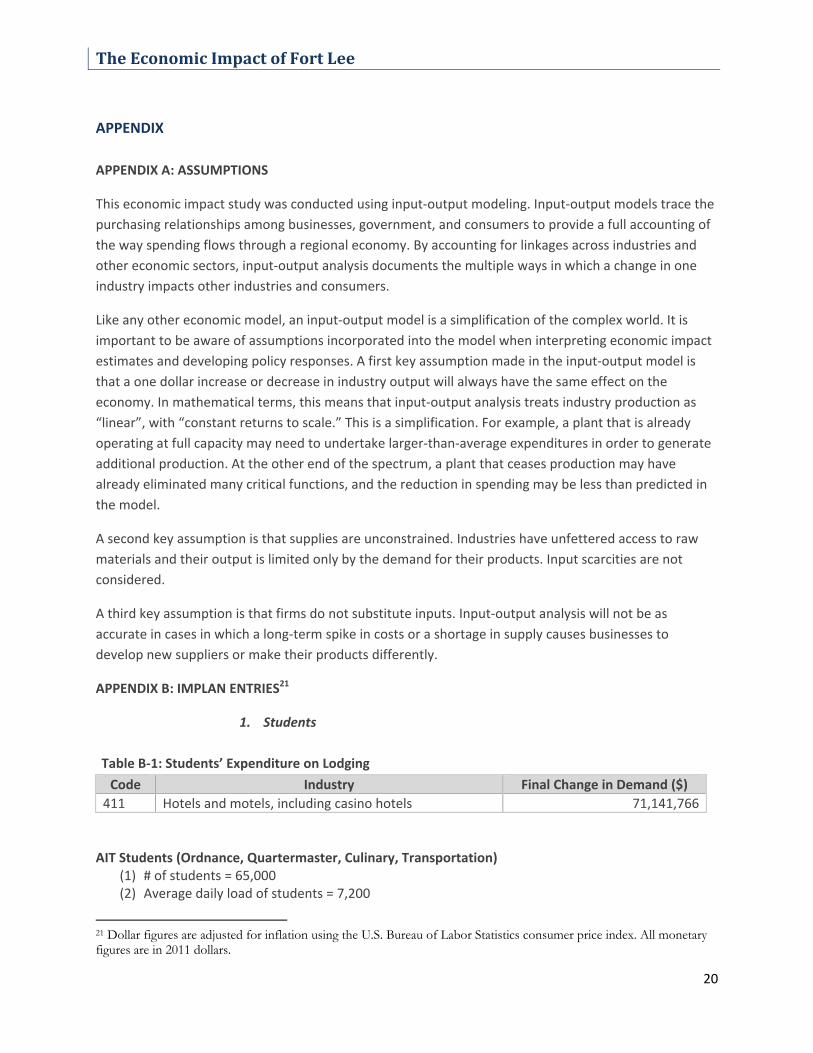
APPENDIX B: IMPLAN ENTRIES21
1. Students
Table B‐1: Students’ Expenditure on Lodging
Code Industry Final Change in Demand ($)
411 Hotels and motels, including casino hotels 71,141,766
AIT Students (Ordnance, Quartermaster, Culinary, Transportation)
(1) # of students = 65,000 (2) Average daily load of students = 7,200
21 Dollar figures are adjusted for inflation using the U.S. Bureau of Labor Statistics consumer price index. All monetary figures are in 2011 dollars.
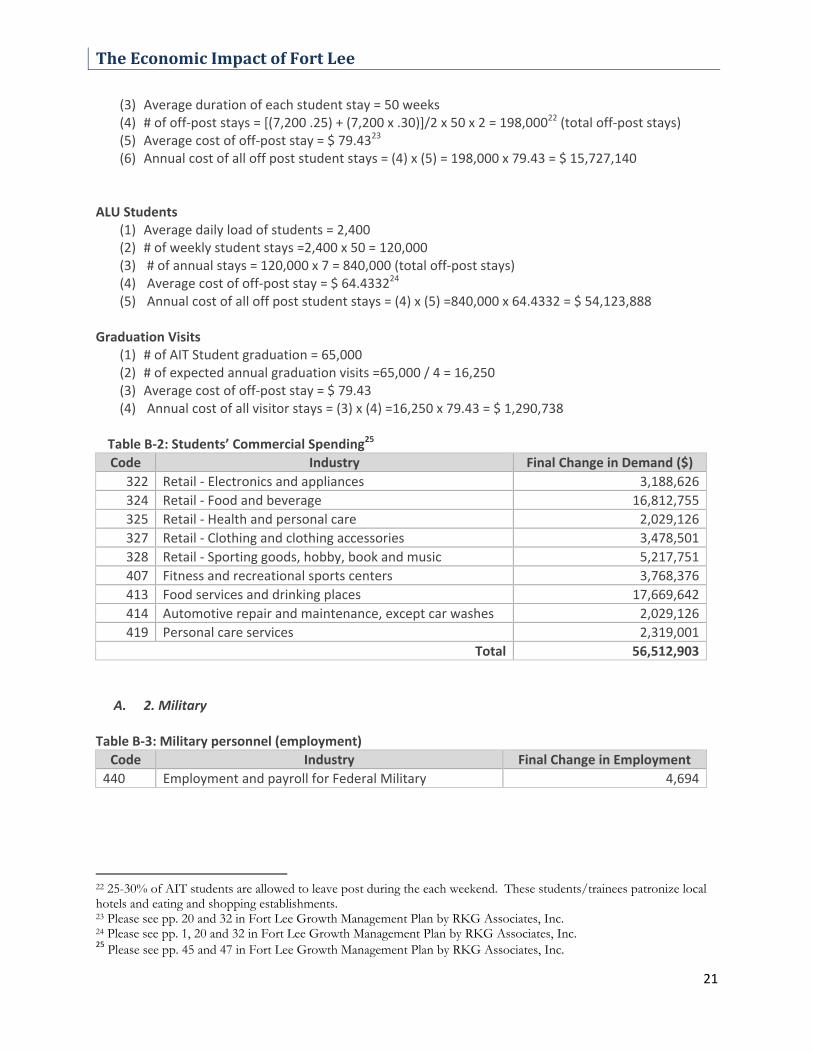
The Economic Impact of Fort Lee
21
(3) Average duration of each student stay = 50 weeks (4) # of off‐post stays = [(7,200 .25) + (7,200 x .30)]/2 x 50 x 2 = 198,00022 (total off‐post stays) (5) Average cost of off‐post stay = $ 79.4323 (6) Annual cost of all off post student stays = (4) x (5) = 198,000 x 79.43 = $ 15,727,140
ALU Students
(1) Average daily load of students = 2,400 (2) # of weekly student stays =2,400 x 50 = 120,000 (3) # of annual stays = 120,000 x 7 = 840,000 (total off‐post stays) (4) Average cost of off‐post stay = $ 64.433224 (5) Annual cost of all off post student stays = (4) x (5) =840,000 x 64.4332 = $ 54,123,888
Graduation Visits
(1) # of AIT Student graduation = 65,000 (2) # of expected annual graduation visits =65,000 / 4 = 16,250 (3) Average cost of off‐post stay = $ 79.43 (4) Annual cost of all visitor stays = (3) x (4) =16,250 x 79.43 = $ 1,290,738
Table B‐2: Students’ Commercial Spending25
Code Industry Final Change in Demand ($)
322 Retail ‐ Electronics and appliances 3,188,626
324 Retail ‐ Food and beverage 16,812,755
325 Retail ‐ Health and personal care 2,029,126
327 Retail ‐ Clothing and clothing accessories 3,478,501
328 Retail ‐ Sporting goods, hobby, book and music 5,217,751
407 Fitness and recreational sports centers 3,768,376
413 Food services and drinking places 17,669,642
414 Automotive repair and maintenance, except car washes 2,029,126
419 Personal care services 2,319,001
Total 56,512,903
A. 2. Military Table B‐3: Military personnel (employment)
Code Industry Final Change in Employment
440 Employment and payroll for Federal Military 4,694
22 25-30% of AIT students are allowed to leave post during the each weekend. These students/trainees patronize local hotels and eating and shopping establishments. 23 Please see pp. 20 and 32 in Fort Lee Growth Management Plan by RKG Associates, Inc. 24 Please see pp. 1, 20 and 32 in Fort Lee Growth Management Plan by RKG Associates, Inc. 25 Please see pp. 45 and 47 in Fort Lee Growth Management Plan by RKG Associates, Inc.

The Economic Impact of Fort Lee
22
Table B‐4: Military personnel (payroll)
Code Industry Change in Employee Compensation ($)
440 Employment and payroll for Federal Military 267,236,631
Table B‐5: Housing Allowances for Military Personnel
Code Industry Change in Employee Compensation ($)
440 Employment and payroll for Federal Military 88,113,567
Table B‐6: Military Spousal Employment
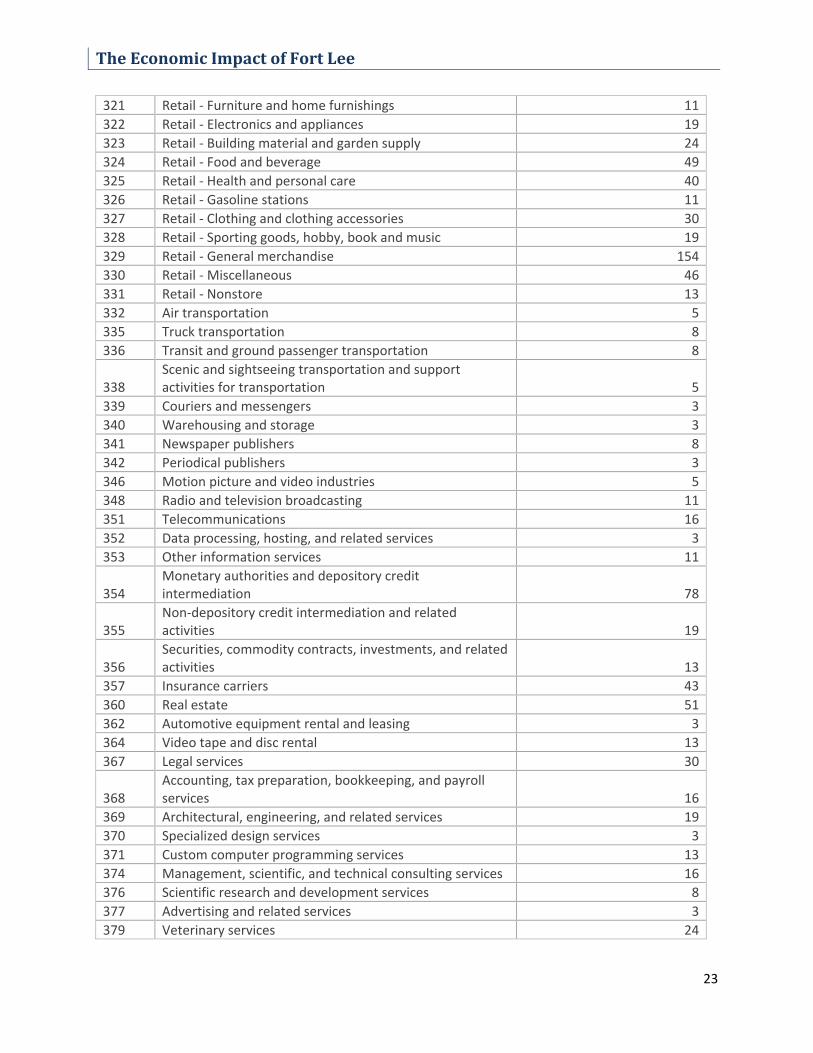
Code Industry Final Change in Employment
2 Grain farming 3
11 Cattle ranching and farming 3
20 Oil and gas extraction 3
31 Electric power generation, transmission, and distribution 3
33 Water, sewage and other systems 3
34 Construction of new nonresidential commercial and health care structures 46
59 Animal (except poultry) slaughtering, rendering, and processing 3
62 Bread and bakery product manufacturing 3
69 All other food manufacturing 3
70 Soft drink and ice manufacturing 3
78 Broad‐woven fabric mills 8
85 All other textile product mills 3
99 Other cut and sew apparel manufacturing 3
113 Printing 5
122 Synthetic dye and pigment manufacturing 3
133 Pharmaceutical preparation manufacturing 3
154 Brick, tile, and other structural clay product manufacturing 3
170 Iron and steel mills and ferroalloy manufacturing 3
234 Electronic computer manufacturing 3
239 Other communications equipment manufacturing 3
246 Printed circuit assembly (electronic assembly) manufacturing 3
249 Search, detection, and navigation instruments manufacturing 3
272 Communication and energy wire and cable manufacturing 3
283 Motor vehicle parts manufacturing 19
298 Wood kitchen cabinet and countertop manufacturing 3
305 Surgical and medical instrument manufacturing 3
313 Office supplies (except paper) manufacturing 8
319 Wholesale trade 27
320 Retail ‐ Motor vehicle and parts 19
The Economic Impact of Fort Lee
23
321 Retail ‐ Furniture and home furnishings 11
322 Retail ‐ Electronics and appliances 19
323 Retail ‐ Building material and garden supply 24
324 Retail ‐ Food and beverage 49
325 Retail ‐ Health and personal care 40
326 Retail ‐ Gasoline stations 11
327 Retail ‐ Clothing and clothing accessories 30
328 Retail ‐ Sporting goods, hobby, book and music 19
329 Retail ‐ General merchandise 154
330 Retail ‐ Miscellaneous 46
331 Retail ‐ Nonstore 13
332 Air transportation 5
335 Truck transportation 8
336 Transit and ground passenger transportation 8
338 Scenic and sightseeing transportation and support activities for transportation 5
339 Couriers and messengers 3
340 Warehousing and storage 3
341 Newspaper publishers 8
342 Periodical publishers 3
346 Motion picture and video industries 5
348 Radio and television broadcasting 11
351 Telecommunications 16
352 Data processing, hosting, and related services 3
353 Other information services 11
354 Monetary authorities and depository credit intermediation 78
355 Non‐depository credit intermediation and related activities 19
356 Securities, commodity contracts, investments, and related activities 13
357 Insurance carriers 43
360 Real estate 51
362 Automotive equipment rental and leasing 3
364 Video tape and disc rental 13
367 Legal services 30
368 Accounting, tax preparation, bookkeeping, and payroll services 16
369 Architectural, engineering, and related services 19
370 Specialized design services 3
371 Custom computer programming services 13
374 Management, scientific, and technical consulting services 16
376 Scientific research and development services 8
377 Advertising and related services 3
379 Veterinary services 24
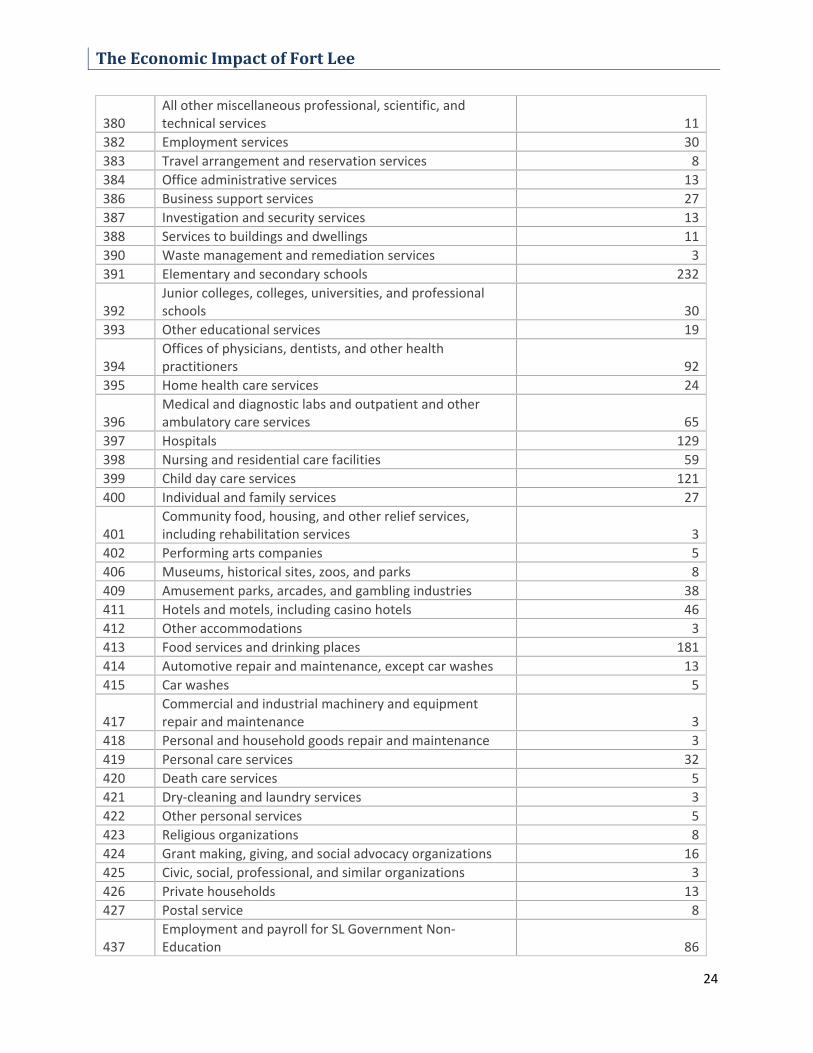
The Economic Impact of Fort Lee
24
380 All other miscellaneous professional, scientific, and technical services 11
382 Employment services 30
383 Travel arrangement and reservation services 8
384 Office administrative services 13
386 Business support services 27
387 Investigation and security services 13
388 Services to buildings and dwellings 11
390 Waste management and remediation services 3
391 Elementary and secondary schools 232
392 Junior colleges, colleges, universities, and professional schools 30
393 Other educational services 19
394 Offices of physicians, dentists, and other health practitioners 92
395 Home health care services 24
396 Medical and diagnostic labs and outpatient and other ambulatory care services 65
397 Hospitals 129
398 Nursing and residential care facilities 59
399 Child day care services 121
400 Individual and family services 27
401 Community food, housing, and other relief services, including rehabilitation services 3
402 Performing arts companies 5
406 Museums, historical sites, zoos, and parks 8
409 Amusement parks, arcades, and gambling industries 38
411 Hotels and motels, including casino hotels 46
412 Other accommodations 3
413 Food services and drinking places 181
414 Automotive repair and maintenance, except car washes 13
415 Car washes 5
417 Commercial and industrial machinery and equipment repair and maintenance 3
418 Personal and household goods repair and maintenance 3
419 Personal care services 32
420 Death care services 5
421 Dry‐cleaning and laundry services 3
422 Other personal services 5
423 Religious organizations 8
424 Grant making, giving, and social advocacy organizations 16
425 Civic, social, professional, and similar organizations 3
426 Private households 13
427 Postal service 8
437 Employment and payroll for SL Government Non‐Education 86

The Economic Impact of Fort Lee
25
439 Employment and payroll for Federal Non‐Military 162
Total 2,614
3. Civilian
Table B‐7: Civilians (employment)
Code Industry Final Change in Employment
439 Employment and payroll for Federal Non‐Military 5,253
Table B‐8: Civilians (payroll and health care benefits)
Code Industry Change in Employee Compensation ($)
439 Employment and payroll for Federal Non‐Military 222,627,621
Table B‐9: Civilian Spousal Employment
Code Industry Final Change in Employment
34 Construction of new nonresidential commercial and health care structures 44
283 Motor vehicle parts manufacturing 30
319 Wholesale trade 14
320 Retail ‐ Motor vehicle and parts 15
322 Retail ‐ Electronics and appliances 15
323 Retail ‐ Building material and garden supply 15
324 Retail ‐ Food and beverage 28
325 Retail ‐ Health and personal care 15
327 Retail ‐ Clothing and clothing accessories 14
328 Retail ‐ Sporting goods, hobby, book and music 15
329 Retail ‐ General merchandise 29
330 Retail ‐ Miscellaneous 15
335 Truck transportation 15
338 Scenic and sightseeing transportation and support activities for transportation 15
351 Telecommunications 15
354 Monetary authorities and depository credit intermediation 28
355 Non‐depository credit intermediation and related activities 15
356 Securities, commodity contracts, investments, and related activities 15
357 Insurance carriers 15
360 Real estate 15
367 Lessors of nonfinancial intangible assets 15
368 Accounting, tax preparation, bookkeeping, and payroll services 15
369 Architectural, engineering, and related services 28
The Economic Impact of Fort Lee
26
371 Custom computer programming services 14
374 Management, scientific, and technical consulting services 15
376 Scientific research and development services 15
382 Employment services 15
387 Investigation and security services 15
388 Services to buildings and dwellings 15
391 Elementary and secondary schools 88
392 Junior colleges, colleges, universities, and professional schools 28
393 Other educational services 15
394 Offices of physicians, dentists, and other health practitioners 28
395 Home health care services 15
396 Medical and diagnostic labs and outpatient and other ambulatory care services 14
397 Hospitals 57
398 Nursing and residential care facilities 15
399 Child day care services 28
400 Individual and family services 15
402 Performing arts companies 15
406 Museums, historical sites, zoos, and parks 15
409 Amusement parks, arcades, and gambling industries 14
411 Hotels and motels, including casino hotels 15
413 Food services and drinking places 88
414 Automotive repair and maintenance, except car washes 15
419 Personal care services 15
423 Religious organizations 15
424 Grantmaking, giving, and social advocacy organizations 15
426 Private households 15
427 Postal service 15
437 Employment and payroll for SL Government Non‐Education 73
439 Employment and payroll for Federal Non‐Military 73
Total 1,215
4. Mission Support Contracting
Table B‐10: Contractors (employment)
Code Industry Final Change in Employment
439 Employment and payroll for Federal Non‐Military 2,799
Table B‐11: Contractors (payroll and health care benefits)
Code Industry Change in Employee Compensation ($)
439 Employment and payroll for Federal Non‐Military 118,624,541
The Economic Impact of Fort Lee
27
Table B‐12: Contractors’ Spousal Employment
Code Industry Final Change in Employment
34 Construction of new nonresidential commercial and health care structures
23
283 Motor vehicle parts manufacturing 14
319 Wholesale trade 6
320 Retail ‐ Motor vehicle and parts 7
322 Retail ‐ Electronics and appliances 7
323 Retail ‐ Building material and garden supply 7
324 Retail ‐ Food and beverage 15
325 Retail ‐ Health and personal care 7
327 Retail ‐ Clothing and clothing accessories 6
328 Retail ‐ Sporting goods, hobby, book and music 8
329 Retail ‐ General merchandise 15
330 Retail ‐ Miscellaneous 8
335 Truck transportation 8
338 Scenic and sightseeing transportation and support activities for transportation
8
351 Telecommunications 8
354 Monetary authorities and depository credit intermediation
15
355 Non‐depository credit intermediation and related activities
8
356 Securities, commodity contracts, investments, and related activities
8
357 Insurance carriers 8
360 Real estate 8
367 Lessors of nonfinancial intangible assets 8
368 Accounting, tax preparation, bookkeeping, and payroll services
8
369 Architectural, engineering, and related services 15
371 Custom computer programming services 6
374 Management, scientific, and technical consulting services 8
376 Scientific research and development services 8
382 Employment services 8
387 Investigation and security services 8
388 Services to buildings and dwellings 8
391 Elementary and secondary schools 46
392 Junior colleges, colleges, universities, and professional schools
15
393 Other educational services 15
394 Offices of physicians, dentists, and other health practitioners
15
395 Home health care services 8
396 Medical and diagnostic labs and outpatient and other ambulatory care services
6
The Economic Impact of Fort Lee
28
397 Hospitals 31
398 Nursing and residential care facilities 8
399 Child day care services 15
400 Individual and family services 8
402 Performing arts companies 8
406 Museums, historical sites, zoos, and parks 8
409 Amusement parks, arcades, and gambling industries 6
411 Hotels and motels, including casino hotels 8
413 Food services and drinking places 46
414 Automotive repair and maintenance, except car washes 8
419 Personal care services 8
423 Religious organizations 8
424 Grant making, giving, and social advocacy organizations 8
426 Private households 8
427 Postal service 8
437 Employment and payroll for SL Government Non‐Education
38
439 Employment and payroll for Federal Non‐Military 38
Total 638
5. Garrison Support Contracting
The Economic Impact of Fort Lee
29
Table B‐13: Installation Costs at Fort Lee in 2011
26 2011 contracting figures are estimated based on post population projections at Fort Lee. It is assumed that amount of contracting will increase in proportional to post population change.
Contractors Amount of
Contracting in 2010
Amount of Contracting in 2011
Industries to be Directly Impacted Share of
Industry (%) % of Local Change
Amount of Change in Demand in 201126
Centennial 18,792,088
20,013,282
36 Construction of other new nonresidential structures
50 100 10,306,840
39 Maintenance and repair construction of nonresidential structures
40 100 8,245,472
369 Architectural, engineering, and related services
10 100 2,061,368
Dominion VA Power
15,123,907
16,106,72631 Electric power generation, transmission, and distribution
100 100 16,589,928
GENCO 20,082,820 21,387,89239 Maintenance and repair construction of nonresidential structures
100 100 22,029,528
Commonwealth of Virginia Dept of Blind and Vision Impaired
15,784,075 16,809,795 413 Food services and drinking places 100 100 17,314,089
Logistics Management Resources Inc ‐LMR
4,208,632 4,208,632 386 Business support services 100 100 4,616,592
Platinum One
1,993,949
2,123,525
36 Construction of other new nonresidential structures
50 0 0
39 Maintenance and repair construction of nonresidential structures
50 0 0
Mark Dunning 1,189,969 1,267,299 390 Waste management and 100 100 1,305,317
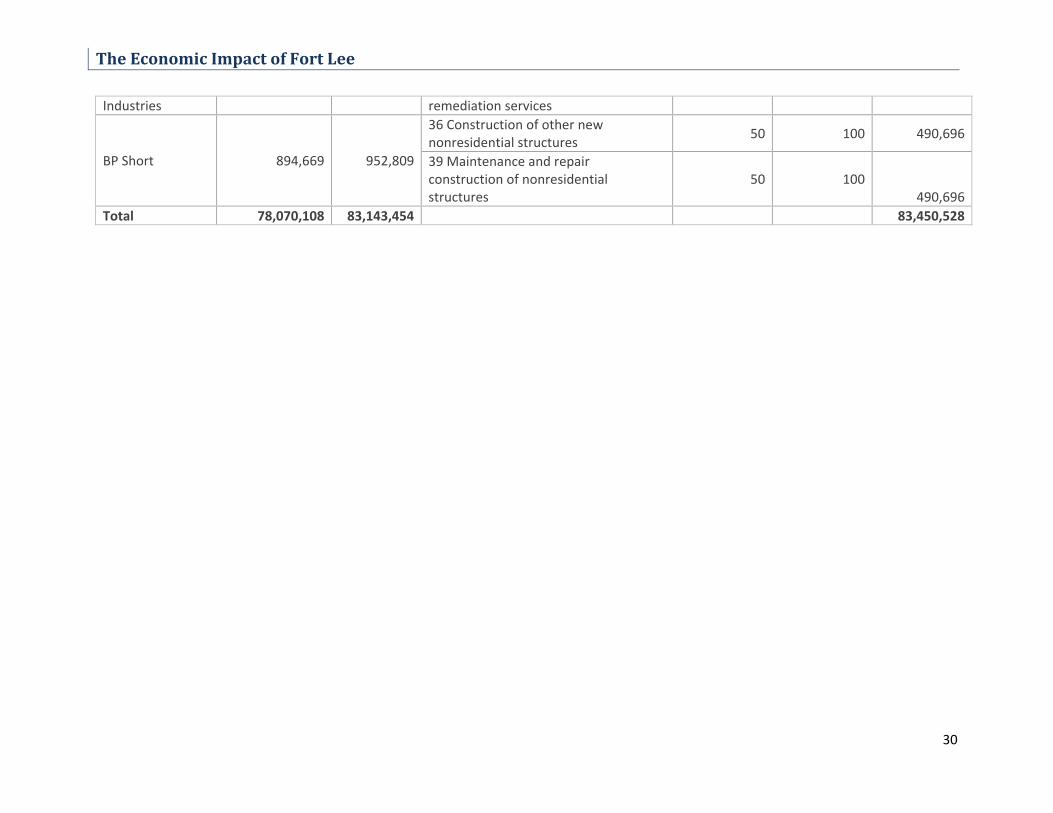
The Economic Impact of Fort Lee
30
Industries remediation services
BP Short 894,669 952,809
36 Construction of other new nonresidential structures
50 100 490,696
39 Maintenance and repair construction of nonresidential structures
50 100490,696
Total 78,070,108 83,143,454 83,450,528
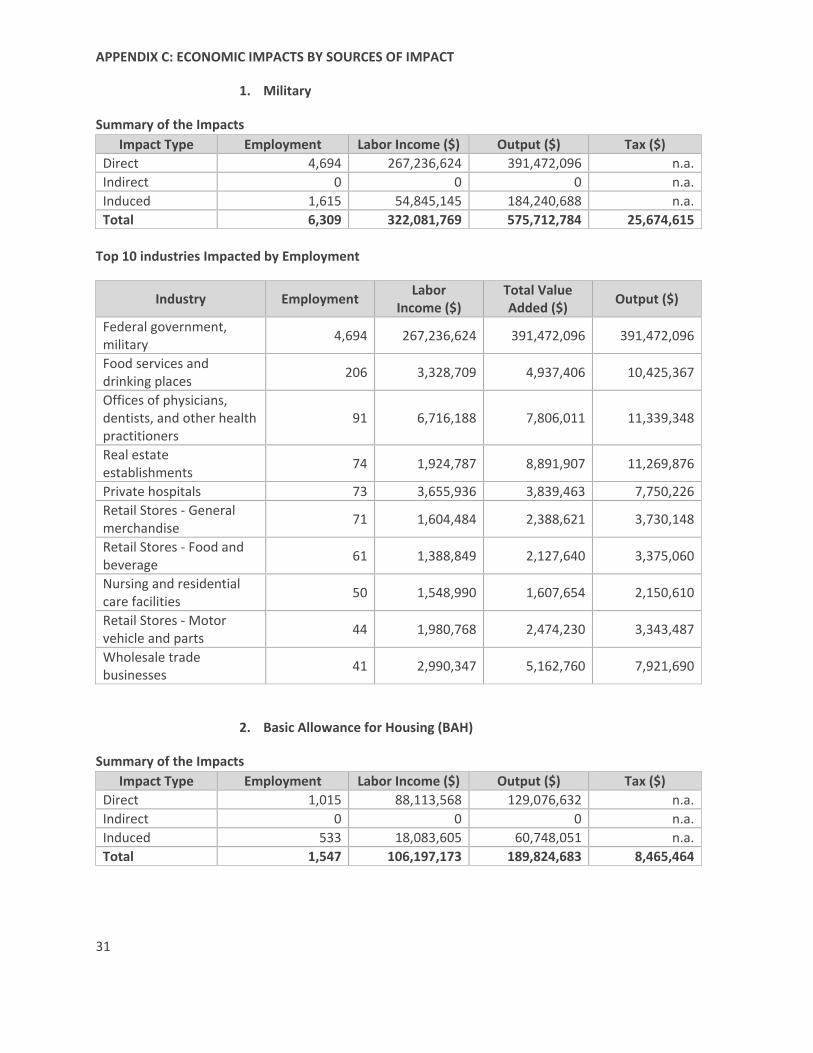
APPENDIX C: ECONOMIC IMPACTS BY SOURCES OF IMPACT
1. Military
Summary of the Impacts
Top 10 industries Impacted by Employment
2. Basic Allowance for Housing (BAH)
Summary of the Impacts
31
Impact Type Employment Labor Income ($) Output ($) Tax ($)
Direct 4,694 267,236,624 391,472,096 n.a.
Indirect 0 0 0 n.a.
Induced 1,615 54,845,145 184,240,688 n.a.
Total 6,309 322,081,769 575,712,784 25,674,615
Industry Employment Labor
Income ($) Total Value Added ($)
Output ($)
Federal government, military
4,694 267,236,624 391,472,096 391,472,096
Food services and drinking places
206 3,328,709 4,937,406 10,425,367
Offices of physicians, dentists, and other health practitioners
91 6,716,188 7,806,011 11,339,348
Real estate establishments
74 1,924,787 8,891,907 11,269,876
Private hospitals 73 3,655,936 3,839,463 7,750,226
Retail Stores ‐ General merchandise
71 1,604,484 2,388,621 3,730,148
Retail Stores ‐ Food and beverage
61 1,388,849 2,127,640 3,375,060
Nursing and residential care facilities
50 1,548,990 1,607,654 2,150,610
Retail Stores ‐ Motor vehicle and parts
44 1,980,768 2,474,230 3,343,487
Wholesale trade businesses
41 2,990,347 5,162,760 7,921,690
Impact Type Employment Labor Income ($) Output ($) Tax ($)
Direct 1,015 88,113,568 129,076,632 n.a.
Indirect 0 0 0 n.a.
Induced 533 18,083,605 60,748,051 n.a.
Total 1,547 106,197,173 189,824,683 8,465,464
The Economic Impact of Fort Lee
Nathalie P. Voorhees Center
32
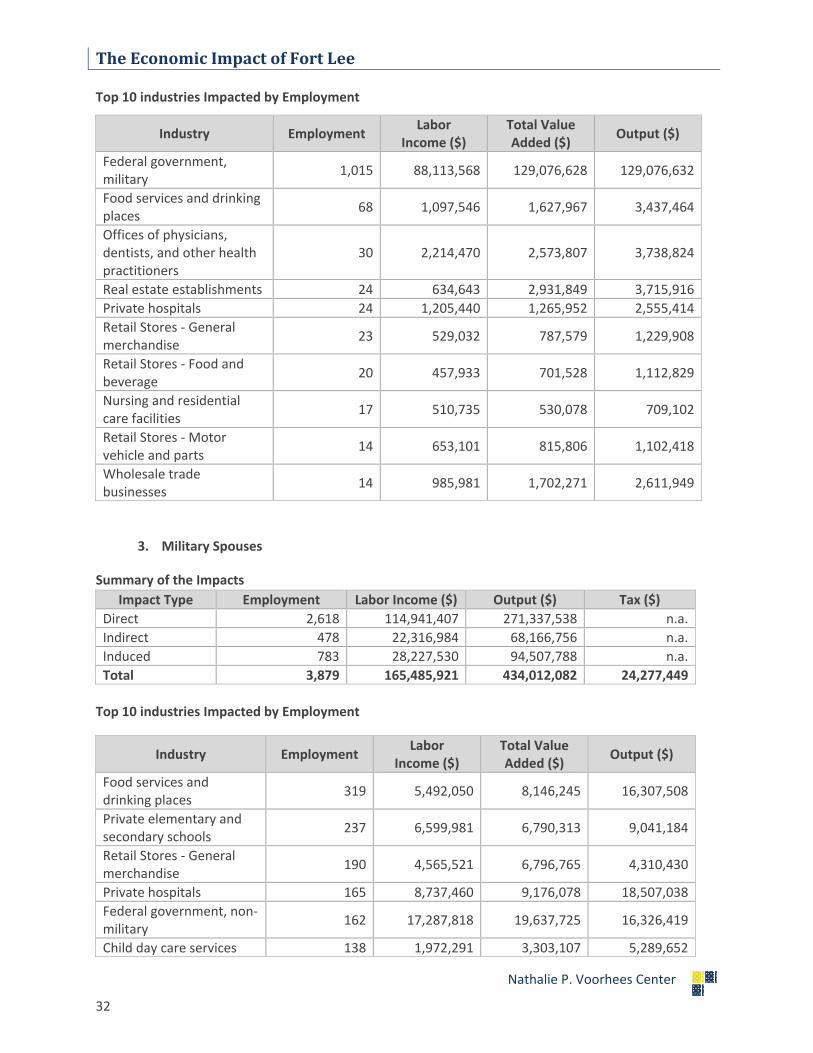
Top 10 industries Impacted by Employment
3. Military Spouses
Summary of the Impacts
Top 10 industries Impacted by Employment
Industry Employment Labor
Income ($) Total Value Added ($)
Output ($)
Federal government, military
1,015 88,113,568 129,076,628 129,076,632
Food services and drinking places
68 1,097,546 1,627,967 3,437,464
Offices of physicians, dentists, and other health practitioners
30 2,214,470 2,573,807 3,738,824
Real estate establishments 24 634,643 2,931,849 3,715,916
Private hospitals 24 1,205,440 1,265,952 2,555,414
Retail Stores ‐ General merchandise
23 529,032 787,579 1,229,908
Retail Stores ‐ Food and beverage
20 457,933 701,528 1,112,829
Nursing and residential care facilities
17 510,735 530,078 709,102
Retail Stores ‐ Motor vehicle and parts
14 653,101 815,806 1,102,418
Wholesale trade businesses
14 985,981 1,702,271 2,611,949
Impact Type Employment Labor Income ($) Output ($) Tax ($)
Direct 2,618 114,941,407 271,337,538 n.a.
Indirect 478 22,316,984 68,166,756 n.a.
Induced 783 28,227,530 94,507,788 n.a.
Total 3,879 165,485,921 434,012,082 24,277,449
Industry Employment Labor
Income ($) Total Value Added ($)
Output ($)
Food services and drinking places
319 5,492,050 8,146,245 16,307,508
Private elementary and secondary schools
237 6,599,981 6,790,313 9,041,184
Retail Stores ‐ General merchandise
190 4,565,521 6,796,765 4,310,430
Private hospitals 165 8,737,460 9,176,078 18,507,038
Federal government, non‐military
162 17,287,818 19,637,725 16,326,419
Child day care services 138 1,972,291 3,303,107 5,289,652
The Economic Impact of Fort Lee
Nathalie P. Voorhees Center
33
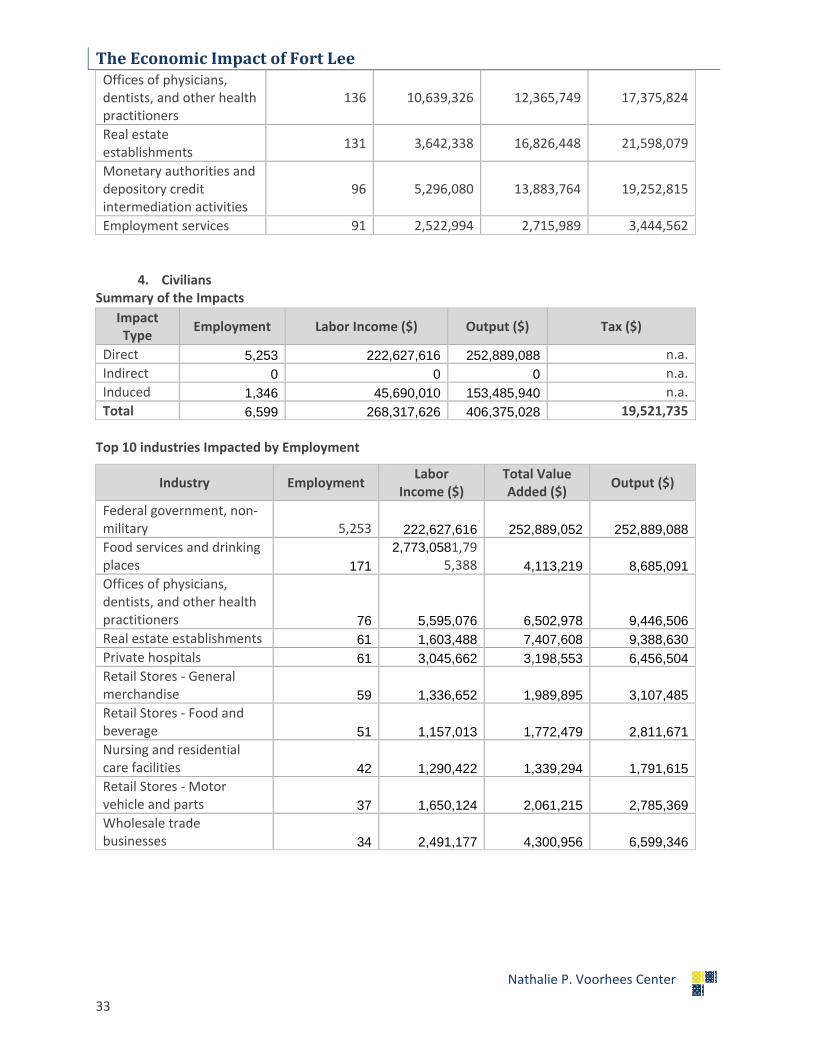
4. Civilians Summary of the Impacts
Top 10 industries Impacted by Employment
Offices of physicians, dentists, and other health practitioners
136 10,639,326 12,365,749 17,375,824
Real estate establishments
131 3,642,338 16,826,448 21,598,079
Monetary authorities and depository credit intermediation activities
96 5,296,080 13,883,764 19,252,815
Employment services 91 2,522,994 2,715,989 3,444,562
Impact Type
Employment Labor Income ($) Output ($) Tax ($)
Direct 5,253 222,627,616 252,889,088 n.a.
Indirect 0 0 0 n.a.
Induced 1,346 45,690,010 153,485,940 n.a.
Total 6,599 268,317,626 406,375,028 19,521,735
Industry Employment Labor
Income ($) Total Value Added ($)
Output ($)
Federal government, non‐military 5,253 222,627,616 252,889,052 252,889,088Food services and drinking places 171
2,773,0581,795,388 4,113,219 8,685,091
Offices of physicians, dentists, and other health practitioners 76 5,595,076 6,502,978 9,446,506Real estate establishments 61 1,603,488 7,407,608 9,388,630Private hospitals 61 3,045,662 3,198,553 6,456,504Retail Stores ‐ General merchandise 59 1,336,652 1,989,895 3,107,485Retail Stores ‐ Food and beverage 51 1,157,013 1,772,479 2,811,671Nursing and residential care facilities 42 1,290,422 1,339,294 1,791,615Retail Stores ‐ Motor vehicle and parts 37 1,650,124 2,061,215 2,785,369Wholesale trade businesses 34 2,491,177 4,300,956 6,599,346
The Economic Impact of Fort Lee
Nathalie P. Voorhees Center
34
5. Civilian Spouses
Summary of the Impacts
Top 10 industries Impacted by Employment
6. Contractors Summary of the Impacts
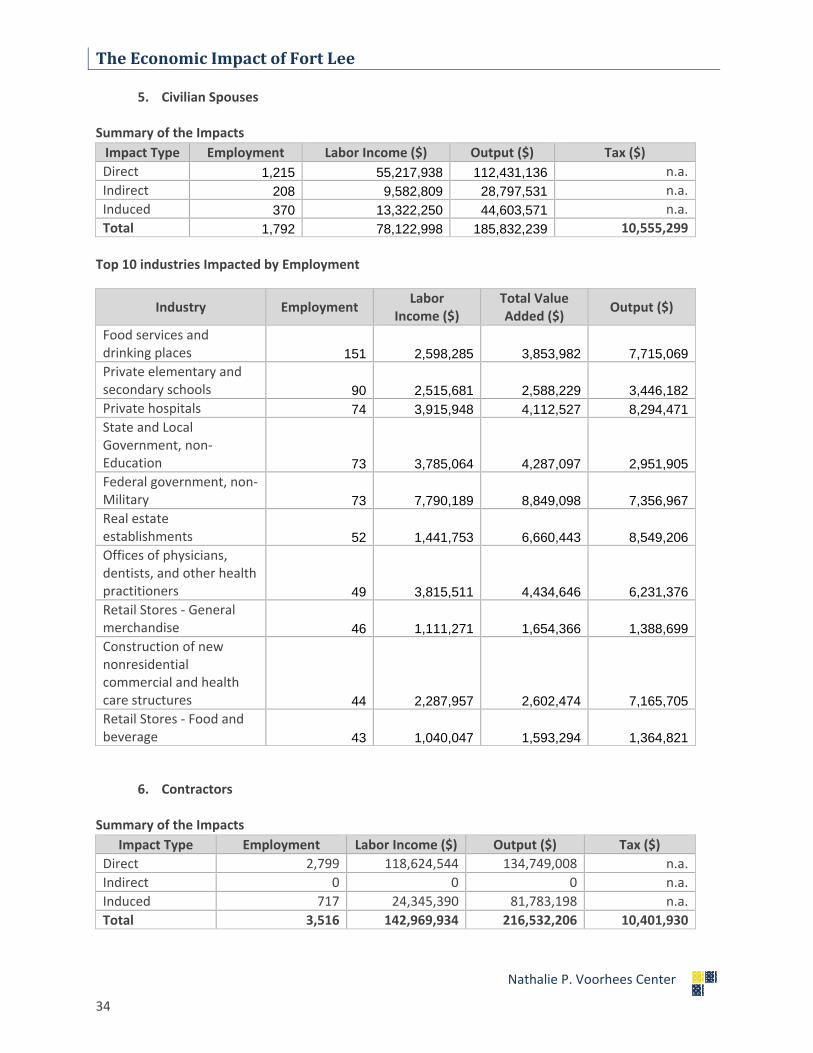
Impact Type Employment Labor Income ($) Output ($) Tax ($)
Direct 1,215 55,217,938 112,431,136 n.a.
Indirect 208 9,582,809 28,797,531 n.a.
Induced 370 13,322,250 44,603,571 n.a.
Total 1,792 78,122,998 185,832,239 10,555,299
Industry Employment Labor
Income ($) Total Value Added ($)
Output ($)
Food services and drinking places 151 2,598,285 3,853,982 7,715,069Private elementary and secondary schools 90 2,515,681 2,588,229 3,446,182Private hospitals 74 3,915,948 4,112,527 8,294,471State and Local Government, non‐Education 73 3,785,064 4,287,097 2,951,905Federal government, non‐Military 73 7,790,189 8,849,098 7,356,967Real estate establishments 52 1,441,753 6,660,443 8,549,206Offices of physicians, dentists, and other health practitioners 49 3,815,511 4,434,646 6,231,376Retail Stores ‐ General merchandise 46 1,111,271 1,654,366 1,388,699Construction of new nonresidential commercial and health care structures 44 2,287,957 2,602,474 7,165,705Retail Stores ‐ Food and beverage 43 1,040,047 1,593,294 1,364,821
Impact Type Employment Labor Income ($) Output ($) Tax ($)
Direct 2,799 118,624,544 134,749,008 n.a.
Indirect 0 0 0 n.a.
Induced 717 24,345,390 81,783,198 n.a.
Total 3,516 142,969,934 216,532,206 10,401,930
The Economic Impact of Fort Lee
Nathalie P. Voorhees Center
35
Top 10 industries Impacted by Employment
7. Contractors’ Spouses Summary of the Impacts
Top 10 industries Impacted by Employment
Industry Employment Labor
Income ($) Total Value Added ($)
Output ($)
Federal government, non‐military
2,799 118,624,544 134,748,999 134,749,008
Food services and drinking places
91 1,477,591 2,191,681 4,627,749
Offices of physicians, dentists, and other health practitioners
41 2,981,271 3,465,036 5,033,461
Real estate establishments
33 854,400 3,947,057 5,002,622
Private hospitals 33 1,622,845 1,704,312 3,440,273
Retail Stores ‐ General merchandise
32 712,220 1,060,293 1,655,787
Retail Stores ‐ Food and beverage
27 616,501 944,445 1,498,166
Nursing and residential care facilities
22 687,587 713,627 954,642
Retail Stores ‐ Motor vehicle and parts
20 879,249 1,098,294 1,484,151
Wholesale trade businesses
18 1,327,395 2,291,715 3,516,385
Impact Type Employment Labor Income ($) Output ($) Tax ($)
Direct 636 28,633,041 58,360,571 n.a.
Indirect 108 4,992,338 14,999,454 n.a.
Induced 192 6,913,056 23,145,366 n.a.
Total 936 40,538,435 96,505,391 5,417,253
Industry Employment Labor
Income ($) Total Value Added ($)
Output ($)
Food services and drinking places 79 1,354,694 2,009,390 4,022,485
Private elementary and secondary schools 47 1,314,785 1,352,701 1,801,098
Private hospitals 40 2,107,562 2,213,361 4,464,081
State and Local Government, non‐education 38 1,970,307 2,231,640 1,536,608
Federal government, non‐ 38 4,055,167 4,606,380 3,829,654
The Economic Impact of Fort Lee
Nathalie P. Voorhees Center
36
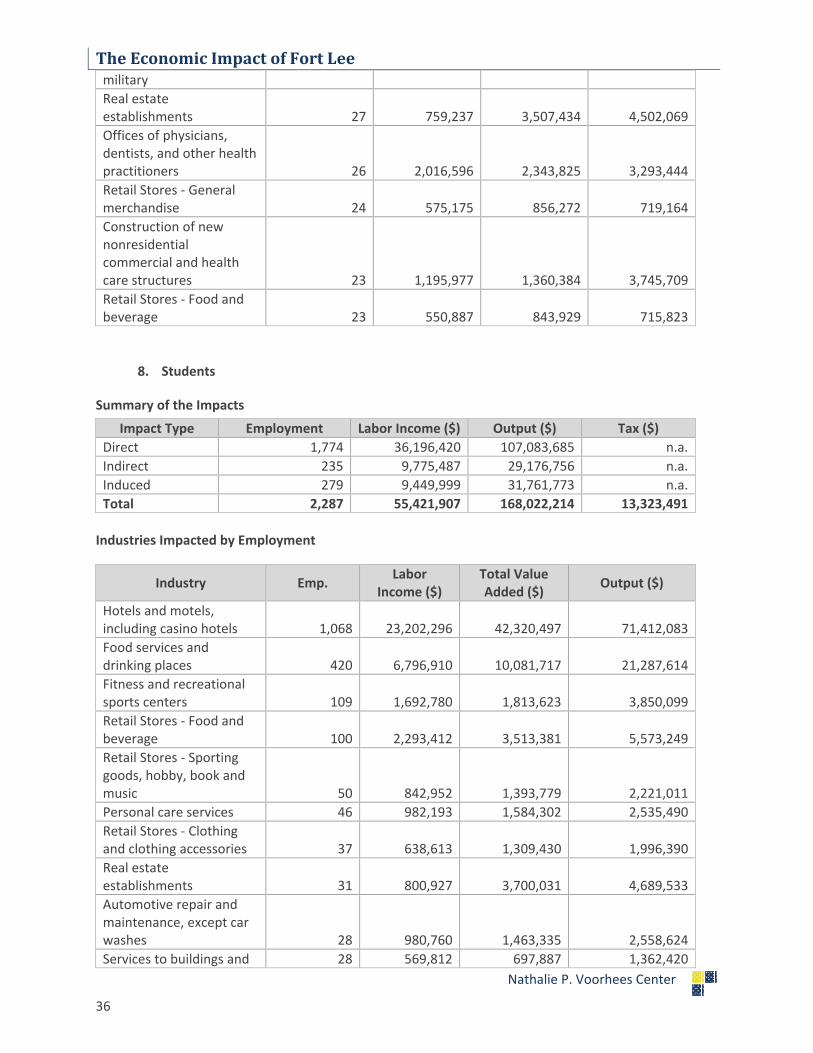
8. Students
Summary of the Impacts
Industries Impacted by Employment
military
Real estate establishments 27 759,237 3,507,434 4,502,069
Offices of physicians, dentists, and other health practitioners 26 2,016,596 2,343,825 3,293,444
Retail Stores ‐ General merchandise 24 575,175 856,272 719,164
Construction of new nonresidential commercial and health care structures 23 1,195,977 1,360,384 3,745,709
Retail Stores ‐ Food and beverage 23 550,887 843,929 715,823
Impact Type Employment Labor Income ($) Output ($) Tax ($)
Direct 1,774 36,196,420 107,083,685 n.a.
Indirect 235 9,775,487 29,176,756 n.a.
Induced 279 9,449,999 31,761,773 n.a.
Total 2,287 55,421,907 168,022,214 13,323,491
Industry Emp. Labor
Income ($) Total Value Added ($)
Output ($)
Hotels and motels, including casino hotels 1,068 23,202,296 42,320,497 71,412,083
Food services and drinking places 420 6,796,910 10,081,717 21,287,614
Fitness and recreational sports centers 109 1,692,780 1,813,623 3,850,099
Retail Stores ‐ Food and beverage 100 2,293,412 3,513,381 5,573,249
Retail Stores ‐ Sporting goods, hobby, book and music 50 842,952 1,393,779 2,221,011
Personal care services 46 982,193 1,584,302 2,535,490
Retail Stores ‐ Clothing and clothing accessories 37 638,613 1,309,430 1,996,390
Real estate establishments 31 800,927 3,700,031 4,689,533
Automotive repair and maintenance, except car washes 28 980,760 1,463,335 2,558,624
Services to buildings and 28 569,812 697,887 1,362,420
The Economic Impact of Fort Lee
Nathalie P. Voorhees Center
37
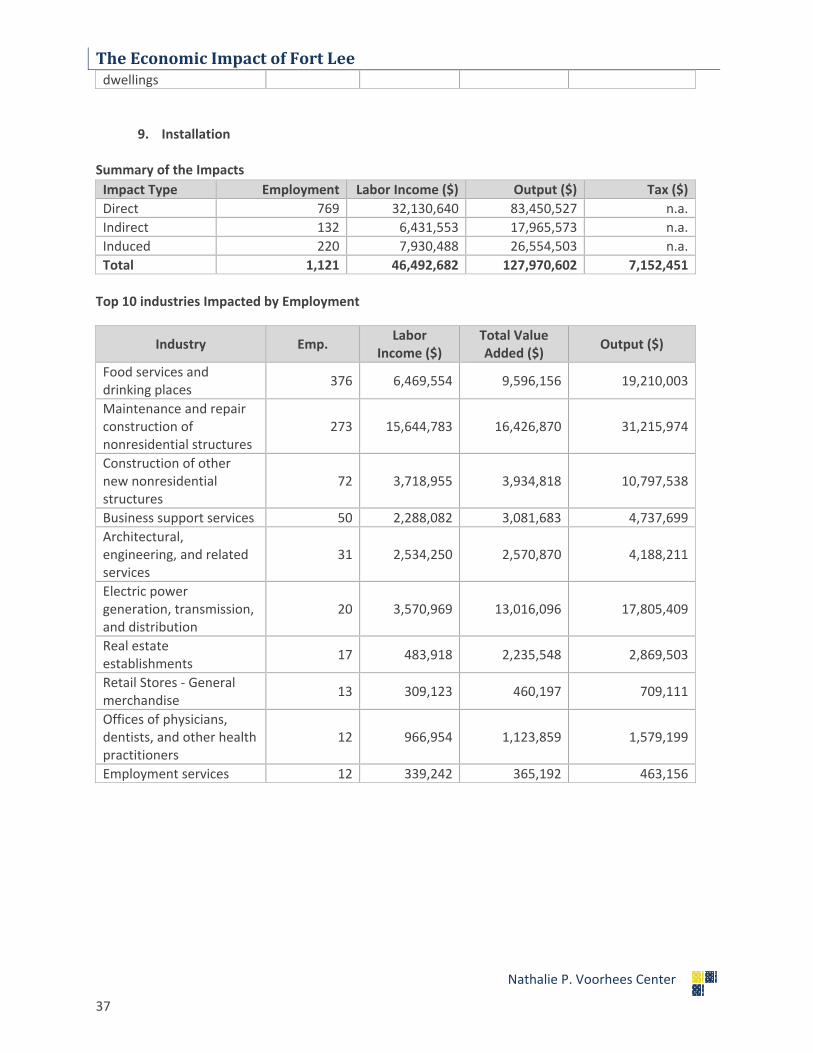
9. Installation
Summary of the Impacts
Top 10 industries Impacted by Employment
dwellings
Impact Type Employment Labor Income ($) Output ($) Tax ($)
Direct 769 32,130,640 83,450,527 n.a.
Indirect 132 6,431,553 17,965,573 n.a.
Induced 220 7,930,488 26,554,503 n.a.
Total 1,121 46,492,682 127,970,602 7,152,451
Industry Emp. Labor
Income ($) Total Value Added ($)
Output ($)
Food services and drinking places
376 6,469,554 9,596,156 19,210,003
Maintenance and repair construction of nonresidential structures
273 15,644,783 16,426,870 31,215,974
Construction of other new nonresidential structures
72 3,718,955 3,934,818 10,797,538
Business support services 50 2,288,082 3,081,683 4,737,699
Architectural, engineering, and related services
31 2,534,250 2,570,870 4,188,211
Electric power generation, transmission, and distribution
20 3,570,969 13,016,096 17,805,409
Real estate establishments
17 483,918 2,235,548 2,869,503
Retail Stores ‐ General merchandise
13 309,123 460,197 709,111
Offices of physicians, dentists, and other health practitioners
12 966,954 1,123,859 1,579,199
Employment services 12 339,242 365,192 463,156