Embed Size (px)
Citation preview

JAMES CITYCOUNTY
WILLIAMSBURG
COUNTY
NEWPORT NEWS
HAMPTON
YORK
POQUOSON
The Impact ofMilitary Base Adjustmentson the Peninsula Economy
November 2006
Fort Monroe
YorktownNaval Weapons Station
Fort Eustis
LangleyAir Force Base
COUNTY
GLOUCESTER
E06-04
HAMPTON ROADS PLANNING DISTRICT COMMISSION
CHESAPEAKE POQUOSON REBECCA C.W. ADAMS * CHARLES W. BURGESS, JR. AMAR DWARKANATH GORDON C. HELSEL, JR. * CLIFTON E. HAYES, JR. ANNE F. ODELL PORTSMOUTH ELLA P. WARD JAMES B. OLIVER, JR. * DOUGLAS L. SMITH FRANKLIN JOSEPH J. SCISLOWICZ SOUTHAMPTON COUNTY * ROWLAND L. TAYLOR ANITA T. FELTS * MICHAEL W. JOHNSON GLOUCESTER COUNTY JOHN J. ADAMS, SR. SUFFOLK * WILLIAM H. WHITLEY LINDA T. JOHNSON * JAMES G. VACALIS HAMPTON * RANDALL A. GILLILAND SURRY COUNTY ROSS A. KEARNEY, II * TYRONE W. FRANKLIN JESSE T. WALLACE, JR. JUDY S. LYTTLE ISLE OF WIGHT COUNTY VIRGINIA BEACH W. DOUGLAS CASKEY HARRY E. DIEZEL * STAN D. CLARK ROBERT M. DYER BARBARA M. HENLEY JAMES CITY COUNTY * LOUIS R. JONES * BRUCE C. GOODSON MEYERA E. OBERNDORF SANFORD B. WANNER JAMES K. SPORE JOHN E. UHRIN NEWPORT NEWS CHARLES C. ALLEN WILLIAMSBURG * JOE S. FRANK * JACKSON C. TUTTLE, II RANDY W. HILDEBRANDT JEANNE ZEIDLER NORFOLK YORK COUNTY ANTHONY L. BURFOOT * JAMES O. McREYNOLDS * PAUL D. FRAIM THOMAS G. SHEPPERD, JR. DR. THERESA W. WHIBLEY REGINA V.K. WILLIAMS BARCLAY C. WINN * EXECUTIVE COMMITTEE MEMBER
PROJECT STAFF
ARTHUR L. COLLINS EXECUTIVE DIRECTOR/SECRETARY JOHN W. WHALEY DEPUTY EXECUTIVE DIRECTOR, ECONOMICS GREG GROOTENDORST SENIOR ECONOMIST MARLA K. FRYE ADMINISTRATIVE ASSISTANT ROBERT C. JACOBS DIRECTOR, COMPUTER GRAPHICS & REPROGRAPHIC SERVICES MICHAEL R. LONG GRAPHIC ARTIST/ILLUSTRATOR TECHNICIAN BRIAN MILLER GRAPHIC TECHNICIAN RACHAEL V. PATCHETT REPROGRAPHIC SUPERVISOR

Acknowledgements This economic impact report was the result of a collaborative effort between the
Greater Peninsula Workforce Investment Board and Consortium of Elected Officials and the Hampton Roads Planning District Commission.
Special thanks are extended to the following organizations that provided staff to
help direct and guide this initiative: the City of Hampton, Thomas Nelson Community College/Peninsula Worklink, and the Peninsula Council for Workforce
Development.
Special appreciation is extended to the local military commands at Fort Monroe, Langley Air Force Base, Fort Eustis, and the Naval Weapons Station, Yorktown,
without whose help and input this study would not have been possible.
The cost of this study and report was paid with funds made available under a National Emergency Planning Grant from the Department of Labor, Employment
and Training Administration, through the Commonwealth of Virginia to the Greater Peninsula Workforce Investment Board (Local Workforce Investment
Area 14).
For more information contact:
William H. Mann, Jr, Executive Director, Greater Peninsula Workforce Development Consortium
11834 Canon Blvd., Suite M Newport News, VA 23606
Phone: (757) 240-4000, E-mail: [email protected]
Cover art courtesy of the Hampton Roads Planning District Commission.
TABLE OF CONTENTS
LIST OF FIGURES ............................................................................................... ii LIST OF TABLES................................................................................................. iv INTRODUCTION ..................................................................................................1 RESEARCH DESIGN ...........................................................................................2 THE DIRECT EFFECT .........................................................................................3 THE TOTAL EFFECT ...........................................................................................6 THE IMPACT CONCEPT...........................................................................7 IMPACT ON ECONOMIC AGGREGATES.................................................7 IMPACT ON SECTOR EMPLOYMENT .................................................11 IMPACT ON OCCUPATIONS..................................................................13 IMPACT ON POPULATION .....................................................................13 THE IMPACT ON GOVERNMENT REVENUES AND EXPENDITURES.............................................................................14 THE IMPACT OF INDIVIDUAL BASES ..............................................................14 CONCLUSIONS..................................................................................................19 APPENDICES.....................................................................................................21
i
LIST OF FIGURES Figure 1: Cumulative Change in Military, Federal Civilian, and Contractor Employment Resulting from BRAC and Other Base Adjustments ............................ 4 Figure 2: Cumulative Change in Peninsula Employment as a Result of BRAC and Other Base Adjustments ......................................................................4 Figure 3: Change in Local Expenditures Resulting from BRAC and Other Base Adjustments.................................................................................5 Figure 4: Change in Study Area Base Employment .............................................6 Figure 5: A Comparison of Gross Regional Product on the Peninsula – With and Without BRAC and Other Base Adjustments ...............................................7 Figure 6: BRAC Impacts as a Percent of the No-BRAC Scenario .........................9 Figure 7: Impact of BRAC and Other Base Adjustments on the Peninsula Economy ......................................................................................................10 Figure 8: Change in Gross City/County Product Due to BRAC and Other Base Adjustments......................................................................................10 Figure 9: Percent Change in Gross City/County Product Due to BRAC and Other Base Adjustments...............................................................................11 Figure 10: Change in Employment Due to BRAC and Other Base Adjustments ...............................................................................................12 Figure 11: The Fiscal Impact of BRAC and Other Base Adjustments .................15 Figure 12: The Impact on the Peninsula Economy of Changes at Area Bases: Employment ....................................................................................15 Figure 13: The Impact on the Peninsula Economy of Changes at Area Bases: Gross Regional Product ..................................................................16 Figure 14: The Impact of Projected Changes at Area Bases on Peninsula Communities: Employment .................................................................................17
ii
LIST OF FIGURES CONTINUED Figure 15: The Impact on Area Bases on Peninsula Communities .....................17 Figure 16: BRAC Employment Impacts as a Percent of the No-BRAC Scenario ..............................................................................................18 Figure 17: BRAC Population Impacts as a Percent of the No-BRAC Scenario ..............................................................................................19
iii
LIST OF TABLES Table 1: The Projected Impact of BRAC and Related Military Changes: Economic Aggregates ..........................................................................8 Table 2: The Projected Impact of BRAC and Related Military Changes: Employment ........................................................................................................12 Table 3: The Projected Impact of BRAC and Related Military Changes: Population by Age ...............................................................................................14
iv
THE IMPACT OF MILITARY BASE REALIGNMENTS ON THE VIRGINIA PENESULA ECONOMY
INTRODUCTION
With its nearly 112 thousand military, Hampton Roads has the second largest concentration of military personnel in the nation.1 This large federal presence provides the region with a steady flow of government expenditures. These expenditures underpin much of the local economy making it more stable than those found in most of the nation’s other metropolitan areas. Unfortunately, from time to time, the region’s dependency on the military causes it to suffer from a variety of economic hardships such as those which occur when bases are closed, forces are realigned, or military personnel are deployed.
Unfortunately, the Virginia Peninsula is about to enter a period of increased economic stress since the President and Congress have accepted the recommendation of the 2005 Base Realignment and Closure Commission (BRAC) to close Ft. Monroe.2 Other adjustments to area military installations on the Peninsula will also occur over the next several years. These changes to the Peninsula’s military economy will be made between 2007 and 2012 with the largest change in base activity occurring in 2010 and 2011.
This report outlines the impact which those changes will have on the seven
communities comprising the Greater Peninsula Local Workforce Investment Area (state designated LWIA #14). Those communities, Gloucester County, Hampton, James City County, Newport News, Poquoson, Williamsburg, and York County, collectively constitute the study area covered by this report. The communities comprising south Hampton Roads were not included in the analysis since preliminary work done at the Hampton Roads Planning District Commission (HRPDC) indicated that the impact of changes anticipated to occur on Peninsula bases will be largely confined to the study area localities.
Work on this project was done by the staff of HRPDC at the request of the
Greater Peninsula Workforce Investment Board and Consortium of Local Elected Officials. All work was done on a collaborative basis between the two staffs of the Commission and the Consortium. Funding for the regional economic impact
1 In 2004, the U.S. Bureau of Economic Analysis reported that there were 111,867 active duty military personnel and reservists working in Hampton Roads as compared to 114,009 in San Diego. At the time, the area’s military accounted for over eleven percent of all jobs in Hampton Roads. 2 The 2005 BRAC Commission was a nine-member independent entity that was appointed by the President and Congress to provide an objective and non-partisan review and analysis of the base adjustment recommendations developed by the Department of Defense. The Commission was required to assess each recommendation to ensure that it met the eight selection criteria set forth by Congress. The recommendations of the BRAC Commission became law on November 9, 2005.
1
THE IMPACT OF MILITARY BASE REALIGNMENTS ON THE VIRGINIA PENESULA ECONOMY
model, which was used to execute this study, was provided through a National Emergency Planning Grant from the U.S. Department of Labor, Employment and Training Administration.
RESEARCH DESIGN
In order to gather data on the closure of Ft. Monroe along with additional base realignments at other Peninsula bases, a survey was conducted of officials at Ft. Monroe (Hampton), Ft. Eustis (Newport News), Langley Air Force Base (Hampton), and Naval Weapons Station, Yorktown (York County). The survey gathered information on a variety of subjects including anticipated changes in the number of military personnel, federal civilians, and contractors working on base. Changes in base spending in the local economy, changes in charitable contributions made by persons working on each base, and changes in on-base purchasing by military personnel were also included in the survey. The data collected from the survey supplied information on the direct effect of Department of Defense (DoD) actions on the economy of the seven cities and counties in the study area. 3 Because an initial change in expenditures, or the direct effect, will set off further “rounds” of spending, it was necessary to model the impact of BRAC and other base realignments in order to estimate the full impact on the Peninsula economy. REMI Policy Insight was selected as the best model for estimating the full impact of projected DoD actions. The REMI Model
Founded in 1980, Regional Economic Models, Inc. (REMI) is generally
regarded as the “Cadillac” model for local and regional economic analysis. REMI models are widely used by national, state, regional, city/county governments, colleges and universities, consulting firms, public utilities, and non-profit organizations.
The REMI model uses widely accepted causal relationships from regional
economics. Of these, perhaps the two most important assumptions underlying the structure of the model are that households maximize their “utility” (they take actions that give them the greatest benefit) and that producers maximize their profits (they produce their goods and services in locations and with techniques which will provide them with the greatest profit). In other words, households and producers make decisions that are in their best economic interest.
A feature that distinguishes REMI from all other commercially available
models is that it is dynamic which means that it forecasts how, on a year-by-year
3 This report will use the terms “effect” and “impact” interchangeably. Both indicate a change in the economy.
2
THE IMPACT OF MILITARY BASE REALIGNMENTS ON THE VIRGINIA PENESULA ECONOMY
basis, the economy will change as a result of an initial “shock” to the economy caused by internal or external events or forces. Much of the analytical power of the model comes from its sensitivity to a wide range of policy and project alternatives as well as to interactions between the national and regional economies. Because of its design, the model is particularly adept at answering “What if…” questions about national, state, regional, and local economies.
In the case of the current study, the model was customized by REMI to
reflect the economies of the communities comprising the Greater Peninsula LWIA. The model was calibrated for the Peninsula study area using data from the Bureau of Economic Analysis (BEA), the Bureau of Labor Statistics, the Department of Energy, the Department of Transportation, the Census Bureau, as well as a variety of other public entities. The model was created for the study area as well as for its five sub-regions. Those sub-regions were Gloucester County, Hampton, Newport News, along with two combined communities (James City County and Williamsburg, Poquoson and York County).4
THE DIRECT EFFECT
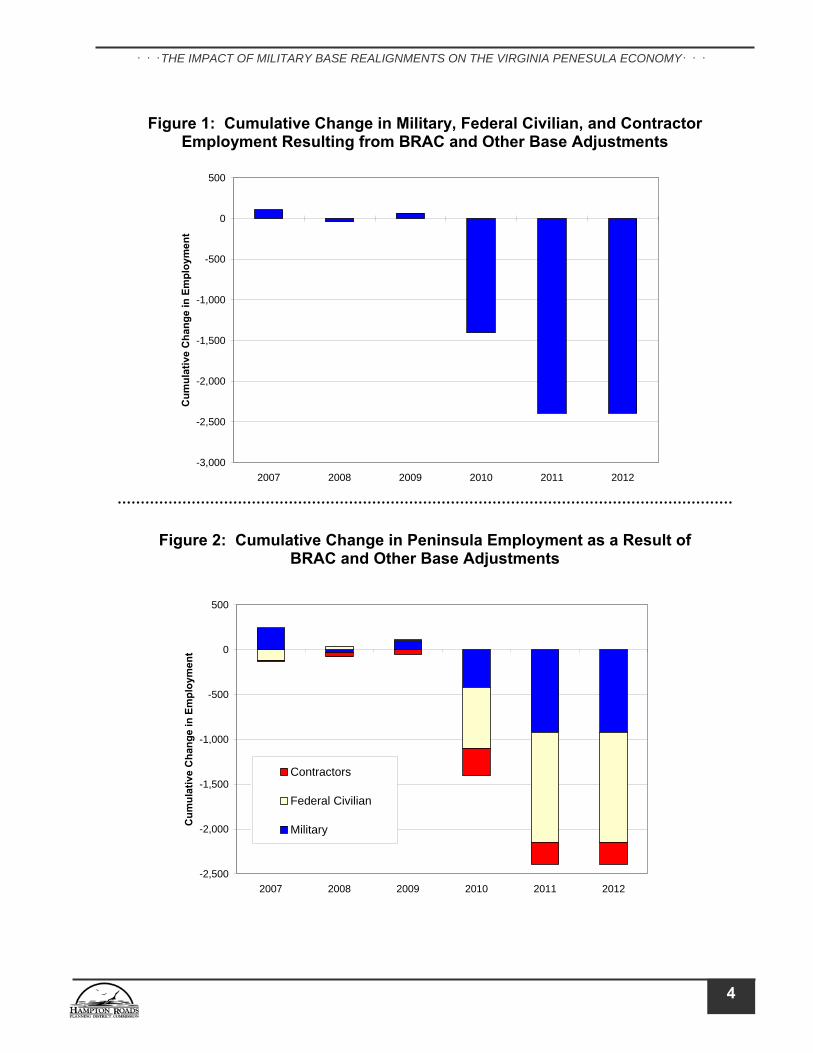
As mentioned above, projected changes in activity levels at Peninsula military facilities is the direct effect resulting from DoD actions. This effect, among others, includes changes in base employment along with associated changes in payrolls and consumer spending, base purchasing of goods and services in the study area, and contributions to regional charities. Of these, the first two are by far the most important since they are the primary drivers of the total impact on the economy. These direct effects are important since they set in motion a series of adjustments in the economy which will eventually lead to other, indirect impacts. The total effect on the economy is the sum of the direct and indirect or spin-off effects. The single most important element in the direct effect is employment. Cumulative changes in employment, as reported by the four military installations under investigation, are shown in Figure 1. As can be seen in the figure, by 2012, study area on-base employment is projected to decline by over twenty-seven hundred jobs. Most of that decline will occur between 2009 and 2011. The composition of those on-base job changes is shown in Figure 2. As can be seen in the figure, by 2011, area bases are projected to lose 1,223 federal civilian jobs, 921 military jobs, and 248 contractor jobs. 4 Communities were combined in the construction of the model since BEA data used by REMI to create its models is only available on a combined basis for selected political jurisdictions. At present, the Bureau is not able to generate deep data sets on each of the combined communities so that they can be reported separately. In the construction of the model, James City County was joined with Williamsburg to become one analytical unit as were Poquoson and York County to become another.
3
THE IMPACT OF MILITARY BASE REALIGNMENTS ON THE VIRGINIA PENESULA ECONOMY
Figure 1: Cumulative Change in Military, Federal Civilian, and Contractor
Employment Resulting from BRAC and Other Base Adjustments
-3,000
-2,500
-2,000
-1,500
-1,000
-500
0
500
2007 2008 2009 2010 2011 2012
Cum
ulat
ive
Cha
nge
in E
mpl
oym
ent
Figure 2: Cumulative Change in Peninsula Employment as a Result of BRAC and Other Base Adjustments
-2,500
-2,000
-1,500
-1,000
-500
0
500
2007 2008 2009 2010 2011 2012
Cum
ulat
ive
Cha
nge
in E
mpl
oym
ent
Contractors
Federal Civilian
Military
4
THE IMPACT OF MILITARY BASE REALIGNMENTS ON THE VIRGINIA PENESULA ECONOMY
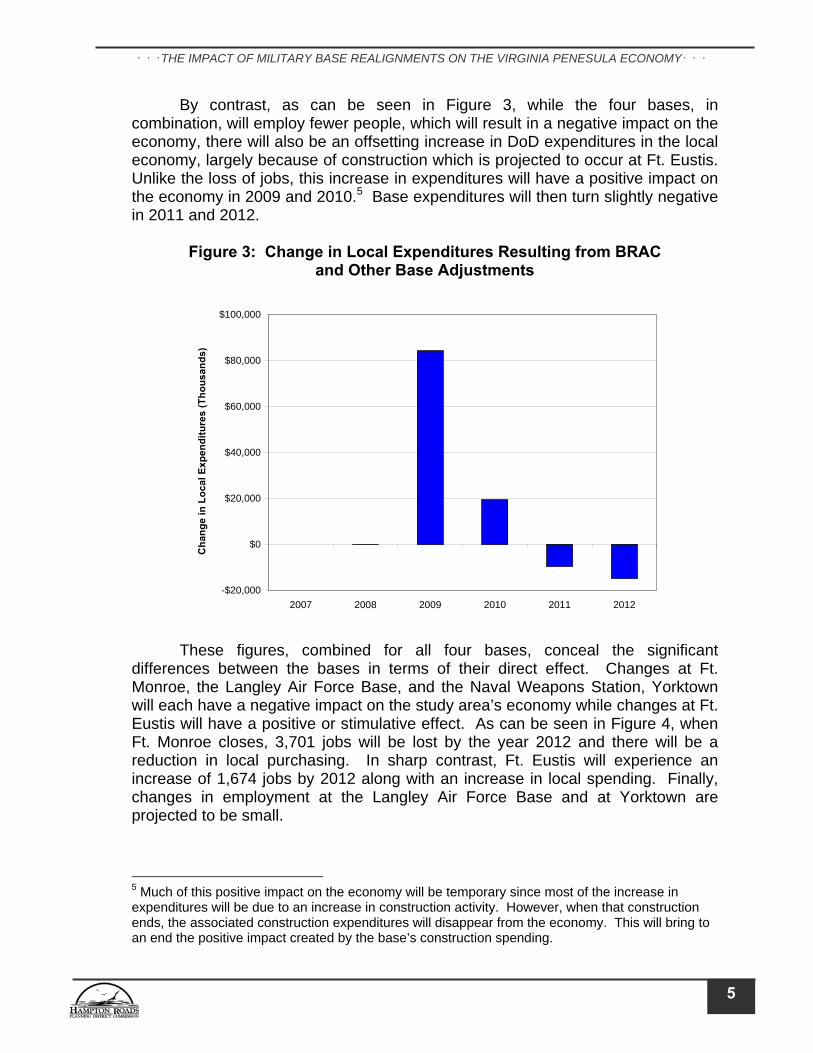
By contrast, as can be seen in Figure 3, while the four bases, in combination, will employ fewer people, which will result in a negative impact on the economy, there will also be an offsetting increase in DoD expenditures in the local economy, largely because of construction which is projected to occur at Ft. Eustis. Unlike the loss of jobs, this increase in expenditures will have a positive impact on the economy in 2009 and 2010.5 Base expenditures will then turn slightly negative in 2011 and 2012.
Figure 3: Change in Local Expenditures Resulting from BRAC and Other Base Adjustments
-$20,000
$0
$20,000
$40,000
$60,000
$80,000
$100,000
2007 2008 2009 2010 2011 2012
Cha
nge
in L
ocal
Exp
endi
ture
s (T
hous
ands
)
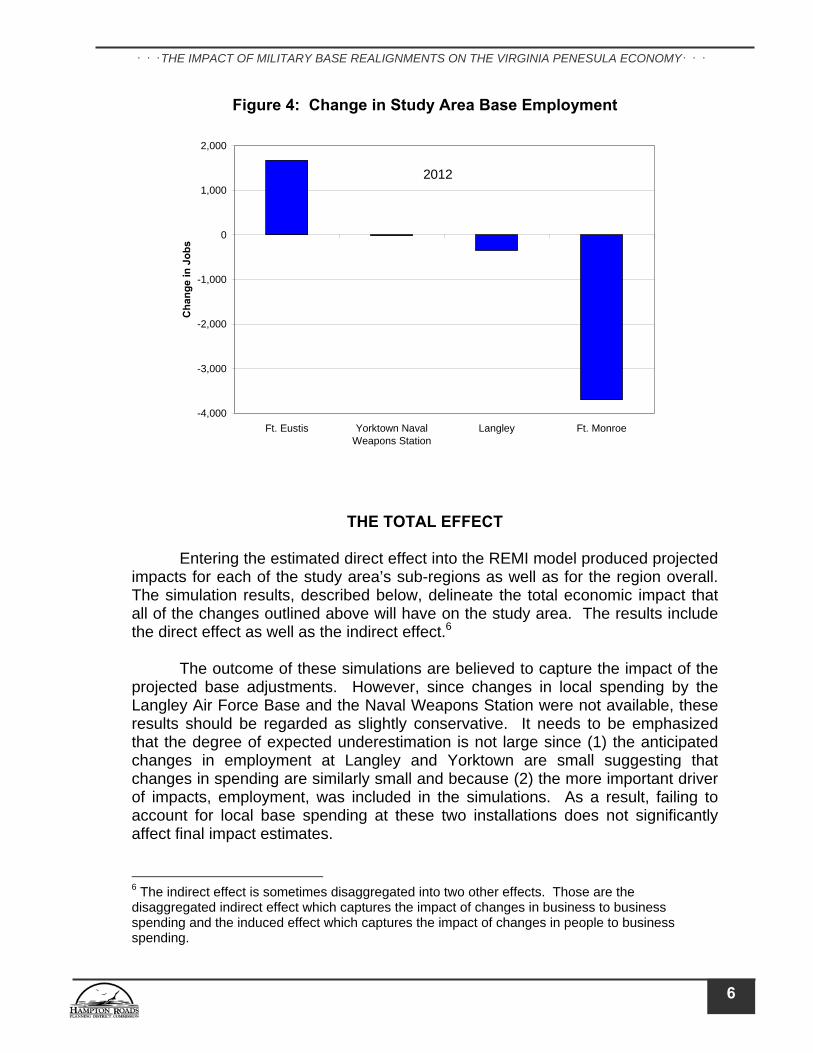
These figures, combined for all four bases, conceal the significant
differences between the bases in terms of their direct effect. Changes at Ft. Monroe, the Langley Air Force Base, and the Naval Weapons Station, Yorktown will each have a negative impact on the study area’s economy while changes at Ft. Eustis will have a positive or stimulative effect. As can be seen in Figure 4, when Ft. Monroe closes, 3,701 jobs will be lost by the year 2012 and there will be a reduction in local purchasing. In sharp contrast, Ft. Eustis will experience an increase of 1,674 jobs by 2012 along with an increase in local spending. Finally, changes in employment at the Langley Air Force Base and at Yorktown are projected to be small. 5 Much of this positive impact on the economy will be temporary since most of the increase in expenditures will be due to an increase in construction activity. However, when that construction ends, the associated construction expenditures will disappear from the economy. This will bring to an end the positive impact created by the base’s construction spending.
5
THE IMPACT OF MILITARY BASE REALIGNMENTS ON THE VIRGINIA PENESULA ECONOMY
Figure 4: Change in Study Area Base Employment
-4,000
-3,000
-2,000
-1,000
0
1,000
2,000
Ft. Eustis Yorktown NavalWeapons Station
Langley Ft. Monroe
Cha
nge
in J
obs
2012
THE TOTAL EFFECT Entering the estimated direct effect into the REMI model produced projected impacts for each of the study area’s sub-regions as well as for the region overall. The simulation results, described below, delineate the total economic impact that all of the changes outlined above will have on the study area. The results include the direct effect as well as the indirect effect.6
The outcome of these simulations are believed to capture the impact of the projected base adjustments. However, since changes in local spending by the Langley Air Force Base and the Naval Weapons Station were not available, these results should be regarded as slightly conservative. It needs to be emphasized that the degree of expected underestimation is not large since (1) the anticipated changes in employment at Langley and Yorktown are small suggesting that changes in spending are similarly small and because (2) the more important driver of impacts, employment, was included in the simulations. As a result, failing to account for local base spending at these two installations does not significantly affect final impact estimates. 6 The indirect effect is sometimes disaggregated into two other effects. Those are the disaggregated indirect effect which captures the impact of changes in business to business spending and the induced effect which captures the impact of changes in people to business spending.
6
THE IMPACT OF MILITARY BASE REALIGNMENTS ON THE VIRGINIA PENESULA ECONOMY
The Impact Concept
Final impact estimates are outlined below. All impacts are expressed as deviations or differences between the baseline projection of the economy without any changes in military activity and the projection of the economy including the impact of BRAC and other base adjustments. The difference between the two projections, one including the anticipated changes at area bases and the other excluding those changes, is the impact of the projected DoD actions on the study area. These differences for each of the projection years are the impacts contained in this report.7
All of the estimates which appear in this report reflect the impact of
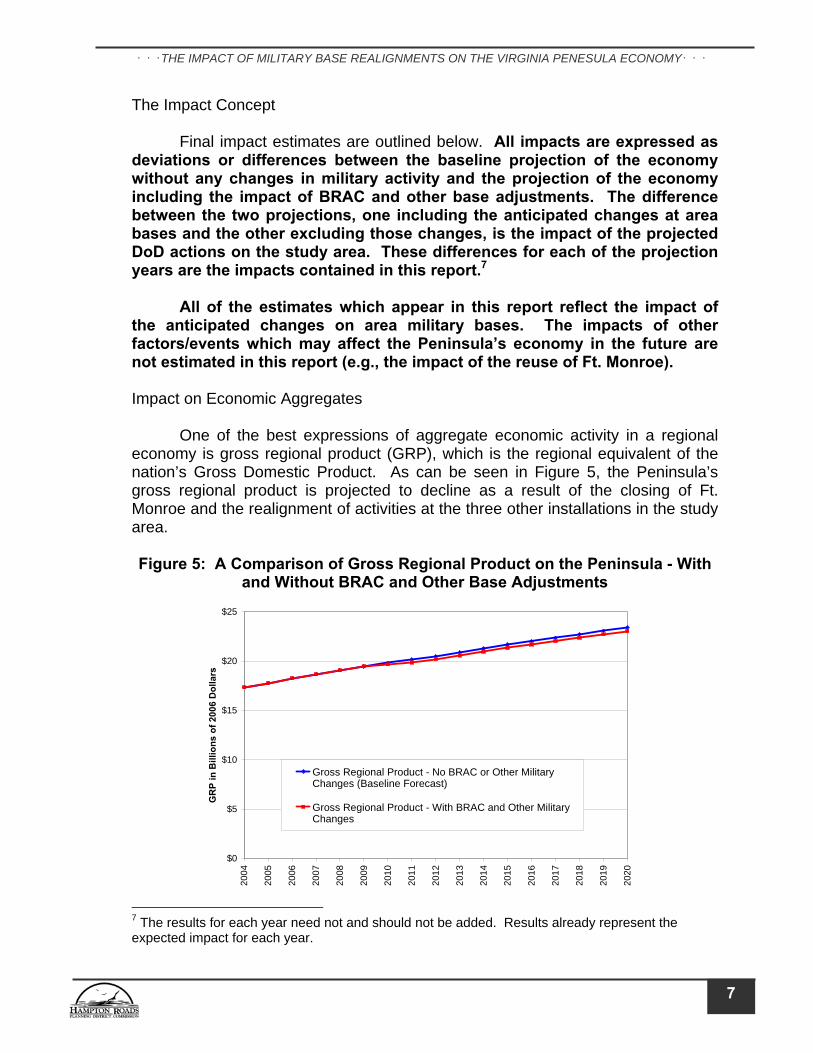
the anticipated changes on area military bases. The impacts of other factors/events which may affect the Peninsula’s economy in the future are not estimated in this report (e.g., the impact of the reuse of Ft. Monroe). Impact on Economic Aggregates One of the best expressions of aggregate economic activity in a regional economy is gross regional product (GRP), which is the regional equivalent of the nation’s Gross Domestic Product. As can be seen in Figure 5, the Peninsula’s gross regional product is projected to decline as a result of the closing of Ft. Monroe and the realignment of activities at the three other installations in the study area. Figure 5: A Comparison of Gross Regional Product on the Peninsula - With
and Without BRAC and Other Base Adjustments
$0
$5
$10
$15
$20
$25
2004
2005
2006
2007
2008
2009
2010
2011
2012
2013
2014
2015
2016
2017
2018
2019
2020
GR
P in
Bill
ions
of 2
006
Dol
lars
Gross Regional Product - No BRAC or Other MilitaryChanges (Baseline Forecast)
Gross Regional Product - With BRAC and Other MilitaryChanges
7 The results for each year need not and should not be added. Results already represent the expected impact for each year.
7
THE IMPACT OF MILITARY BASE REALIGNMENTS ON THE VIRGINIA PENESULA ECONOMY
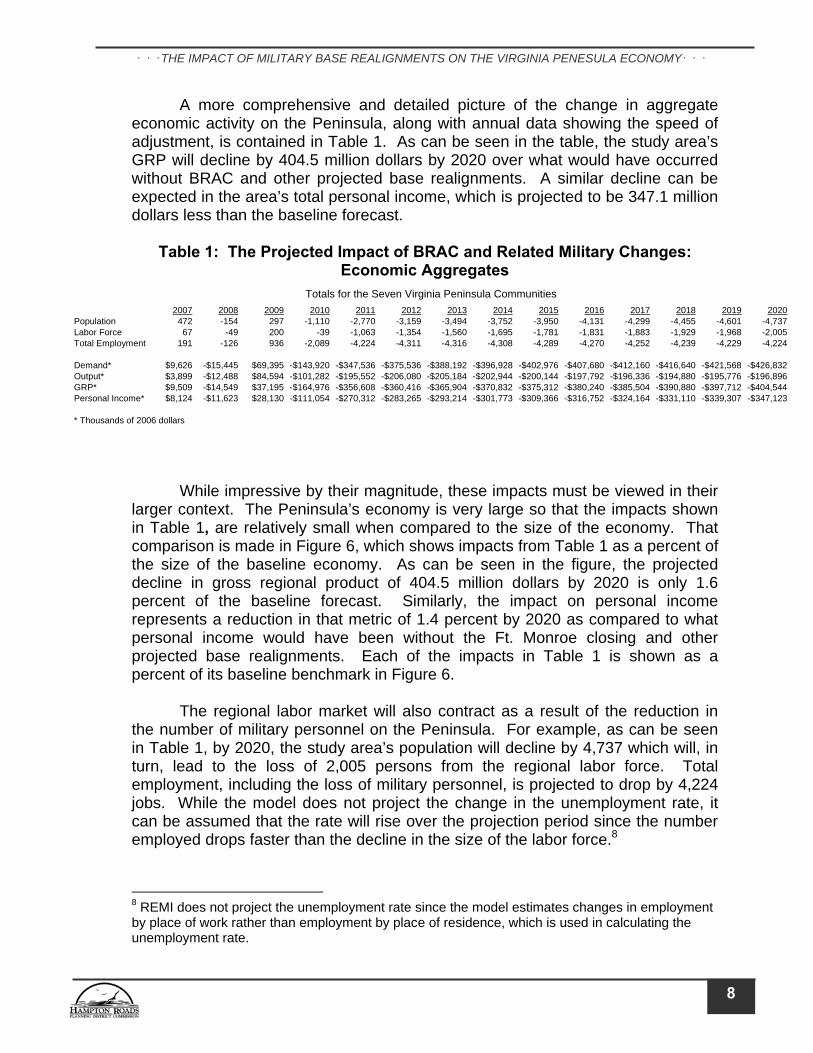
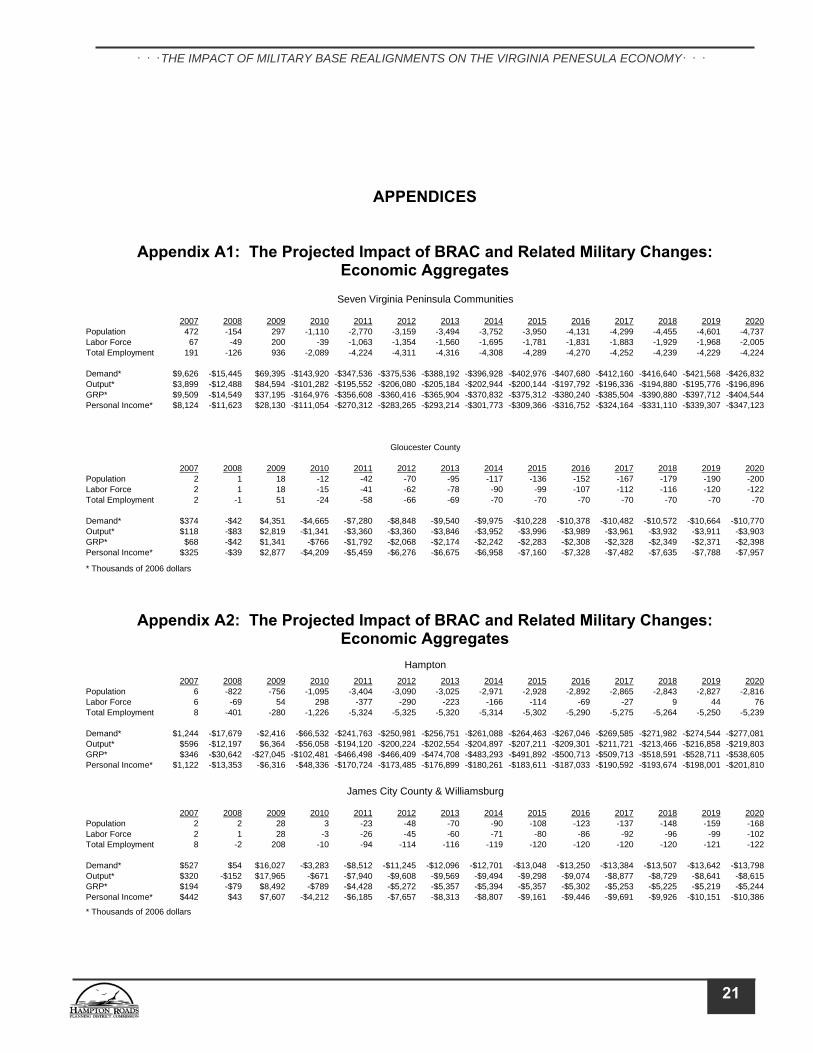
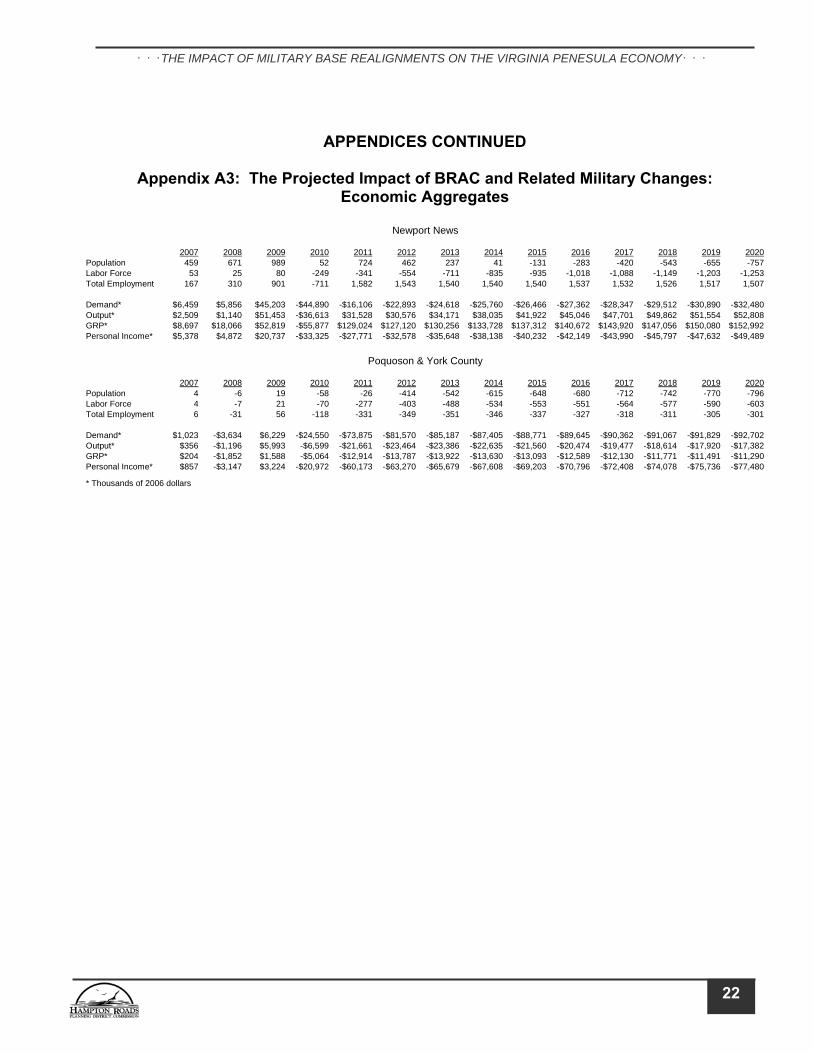
A more comprehensive and detailed picture of the change in aggregate economic activity on the Peninsula, along with annual data showing the speed of adjustment, is contained in Table 1. As can be seen in the table, the study area’s GRP will decline by 404.5 million dollars by 2020 over what would have occurred without BRAC and other projected base realignments. A similar decline can be expected in the area’s total personal income, which is projected to be 347.1 million dollars less than the baseline forecast.
Table 1: The Projected Impact of BRAC and Related Military Changes: Economic Aggregates
2007 2008 2009 2010 2011 2012 2013 2014 2015 2016 2017 2018 2019 2020Population 472 -154 297 -1,110 -2,770 -3,159 -3,494 -3,752 -3,950 -4,131 -4,299 -4,455 -4,601 -4,737Labor Force 67 -49 200 -39 -1,063 -1,354 -1,560 -1,695 -1,781 -1,831 -1,883 -1,929 -1,968 -2,005Total Employment 191 -126 936 -2,089 -4,224 -4,311 -4,316 -4,308 -4,289 -4,270 -4,252 -4,239 -4,229 -4,224
Demand* $9,626 -$15,445 $69,395 -$143,920 -$347,536 -$375,536 -$388,192 -$396,928 -$402,976 -$407,680 -$412,160 -$416,640 -$421,568 -$426,832Output* $3,899 -$12,488 $84,594 -$101,282 -$195,552 -$206,080 -$205,184 -$202,944 -$200,144 -$197,792 -$196,336 -$194,880 -$195,776 -$196,896GRP* $9,509 -$14,549 $37,195 -$164,976 -$356,608 -$360,416 -$365,904 -$370,832 -$375,312 -$380,240 -$385,504 -$390,880 -$397,712 -$404,544Personal Income* $8,124 -$11,623 $28,130 -$111,054 -$270,312 -$283,265 -$293,214 -$301,773 -$309,366 -$316,752 -$324,164 -$331,110 -$339,307 -$347,123
* Thousands of 2006 dollars
Totals for the Seven Virginia Peninsula Communities
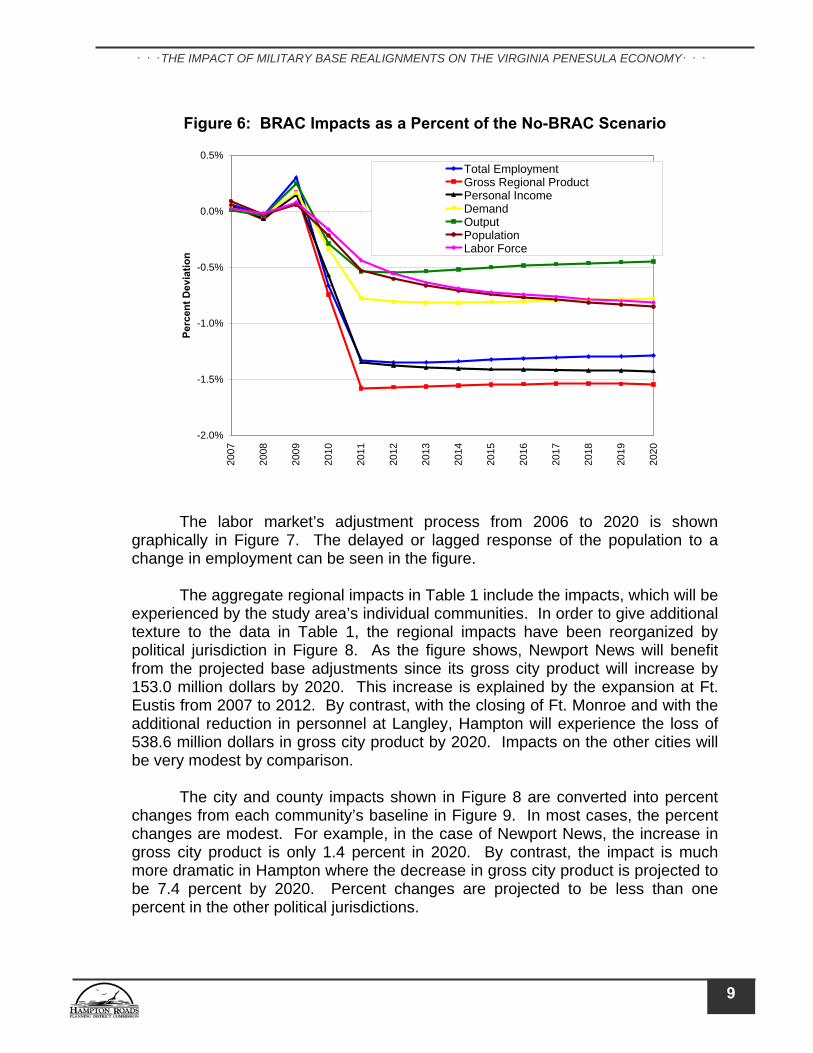
While impressive by their magnitude, these impacts must be viewed in their larger context. The Peninsula’s economy is very large so that the impacts shown in Table 1, are relatively small when compared to the size of the economy. That comparison is made in Figure 6, which shows impacts from Table 1 as a percent of the size of the baseline economy. As can be seen in the figure, the projected decline in gross regional product of 404.5 million dollars by 2020 is only 1.6 percent of the baseline forecast. Similarly, the impact on personal income represents a reduction in that metric of 1.4 percent by 2020 as compared to what personal income would have been without the Ft. Monroe closing and other projected base realignments. Each of the impacts in Table 1 is shown as a percent of its baseline benchmark in Figure 6. The regional labor market will also contract as a result of the reduction in the number of military personnel on the Peninsula. For example, as can be seen in Table 1, by 2020, the study area’s population will decline by 4,737 which will, in turn, lead to the loss of 2,005 persons from the regional labor force. Total employment, including the loss of military personnel, is projected to drop by 4,224 jobs. While the model does not project the change in the unemployment rate, it can be assumed that the rate will rise over the projection period since the number employed drops faster than the decline in the size of the labor force.8
8 REMI does not project the unemployment rate since the model estimates changes in employment by place of work rather than employment by place of residence, which is used in calculating the unemployment rate.
8
THE IMPACT OF MILITARY BASE REALIGNMENTS ON THE VIRGINIA PENESULA ECONOMY
Figure 6: BRAC Impacts as a Percent of the No-BRAC Scenario
-2.0%
-1.5%
-1.0%
-0.5%
0.0%
0.5%
2007
2008
2009
2010
2011
2012
2013
2014
2015
2016
2017
2018
2019
2020
Perc
ent D
evia
tion
Total EmploymentGross Regional ProductPersonal IncomeDemandOutputPopulationLabor Force
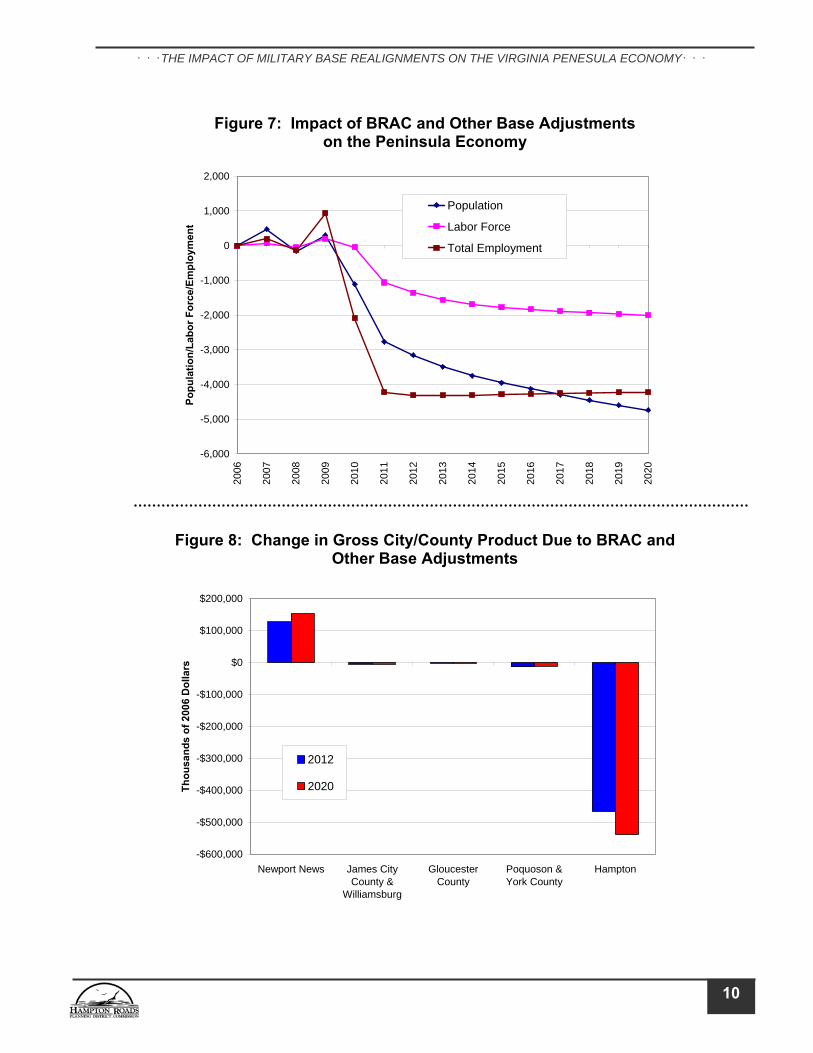
The labor market’s adjustment process from 2006 to 2020 is shown
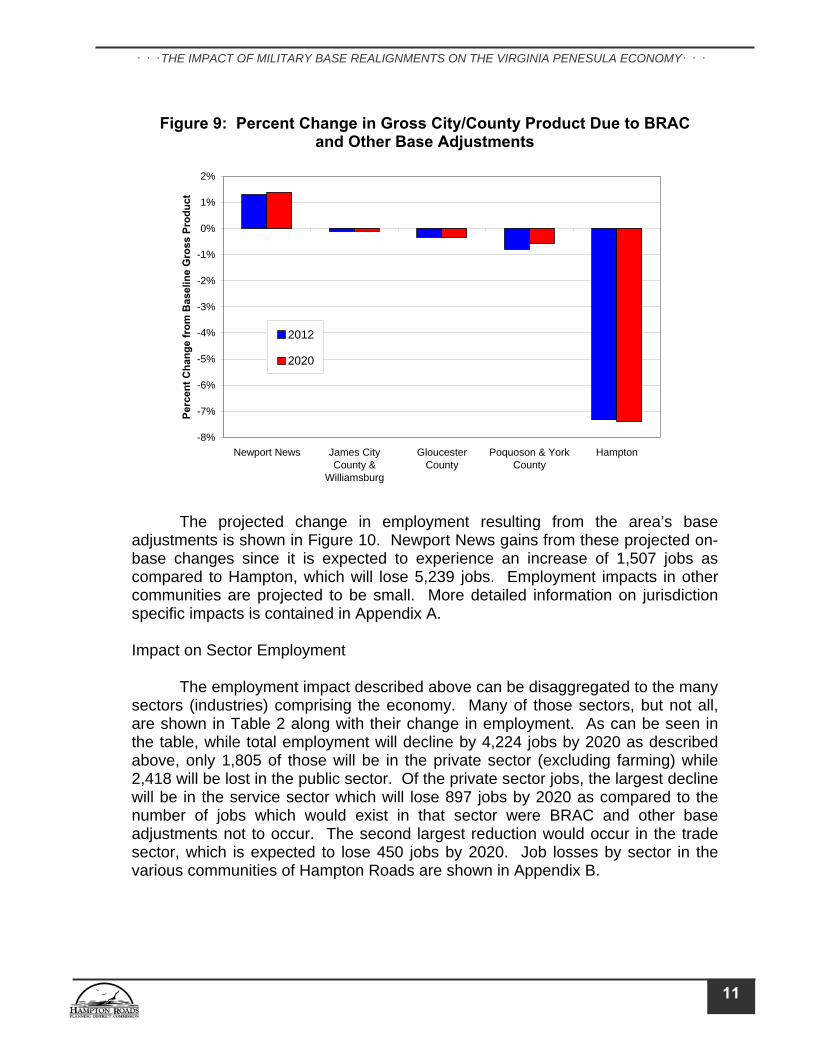
graphically in Figure 7. The delayed or lagged response of the population to a change in employment can be seen in the figure. The aggregate regional impacts in Table 1 include the impacts, which will be experienced by the study area’s individual communities. In order to give additional texture to the data in Table 1, the regional impacts have been reorganized by political jurisdiction in Figure 8. As the figure shows, Newport News will benefit from the projected base adjustments since its gross city product will increase by 153.0 million dollars by 2020. This increase is explained by the expansion at Ft. Eustis from 2007 to 2012. By contrast, with the closing of Ft. Monroe and with the additional reduction in personnel at Langley, Hampton will experience the loss of 538.6 million dollars in gross city product by 2020. Impacts on the other cities will be very modest by comparison. The city and county impacts shown in Figure 8 are converted into percent changes from each community’s baseline in Figure 9. In most cases, the percent changes are modest. For example, in the case of Newport News, the increase in gross city product is only 1.4 percent in 2020. By contrast, the impact is much more dramatic in Hampton where the decrease in gross city product is projected to be 7.4 percent by 2020. Percent changes are projected to be less than one percent in the other political jurisdictions.
9
THE IMPACT OF MILITARY BASE REALIGNMENTS ON THE VIRGINIA PENESULA ECONOMY
Figure 7: Impact of BRAC and Other Base Adjustments
on the Peninsula Economy
-6,000
-5,000
-4,000
-3,000
-2,000
-1,000
0
1,000
2,000
2006
2007
2008
2009
2010
2011
2012
2013
2014
2015
2016
2017
2018
2019
2020
Popu
latio
n/La
bor F
orce
/Em
ploy
men
tPopulation
Labor Force
Total Employment
Figure 8: Change in Gross City/County Product Due to BRAC and Other Base Adjustments
-$600,000
-$500,000
-$400,000
-$300,000
-$200,000
-$100,000
$0
$100,000
$200,000
Newport News James CityCounty &
Williamsburg
GloucesterCounty
Poquoson &York County
Hampton
Thou
sand
s of
200
6 D
olla
rs
2012
2020
10
THE IMPACT OF MILITARY BASE REALIGNMENTS ON THE VIRGINIA PENESULA ECONOMY
Figure 9: Percent Change in Gross City/County Product Due to BRAC
and Other Base Adjustments
-8%
-7%
-6%
-5%
-4%
-3%
-2%
-1%
0%
1%
2%
Newport News James CityCounty &
Williamsburg
GloucesterCounty
Poquoson & YorkCounty
Hampton
Perc
ent C
hang
e fr
om B
asel
ine
Gro
ss P
rodu
ct
2012
2020
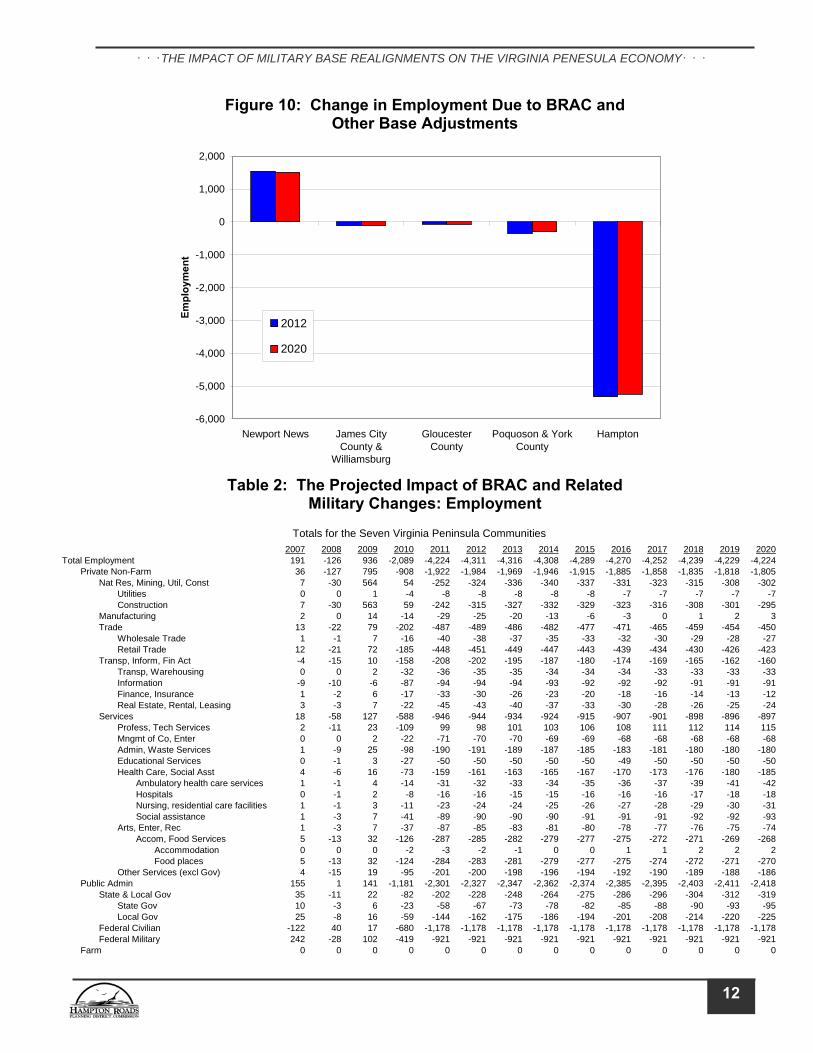
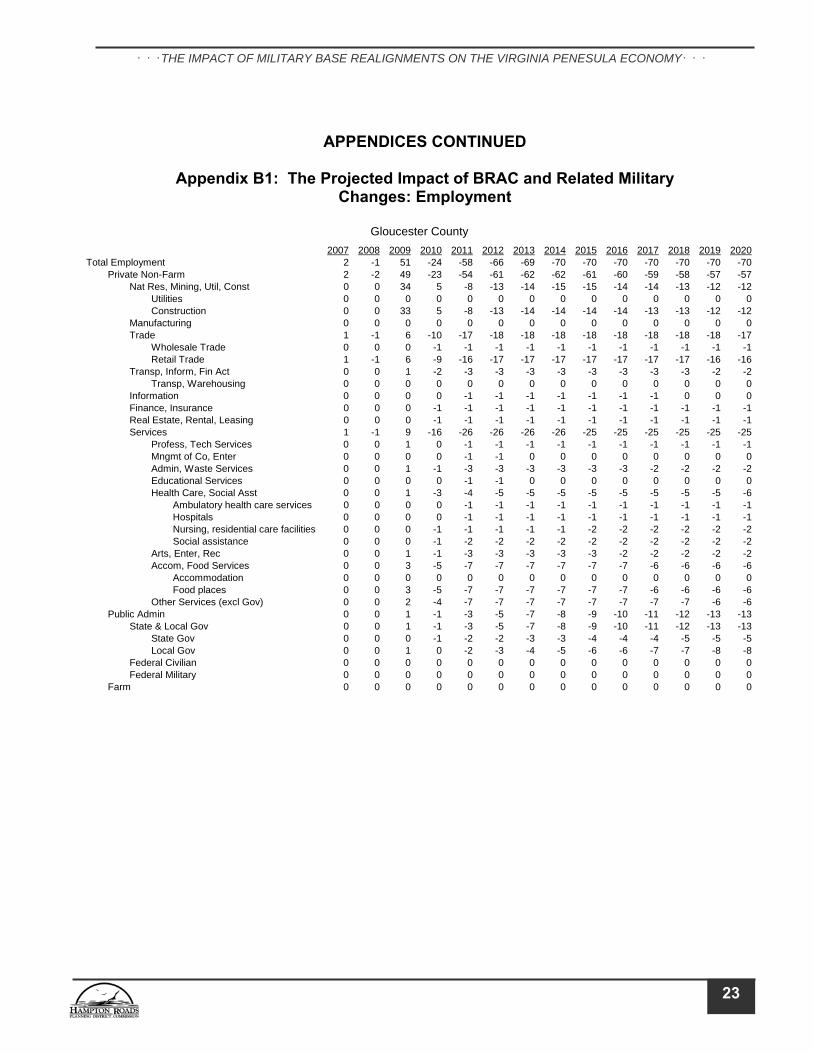
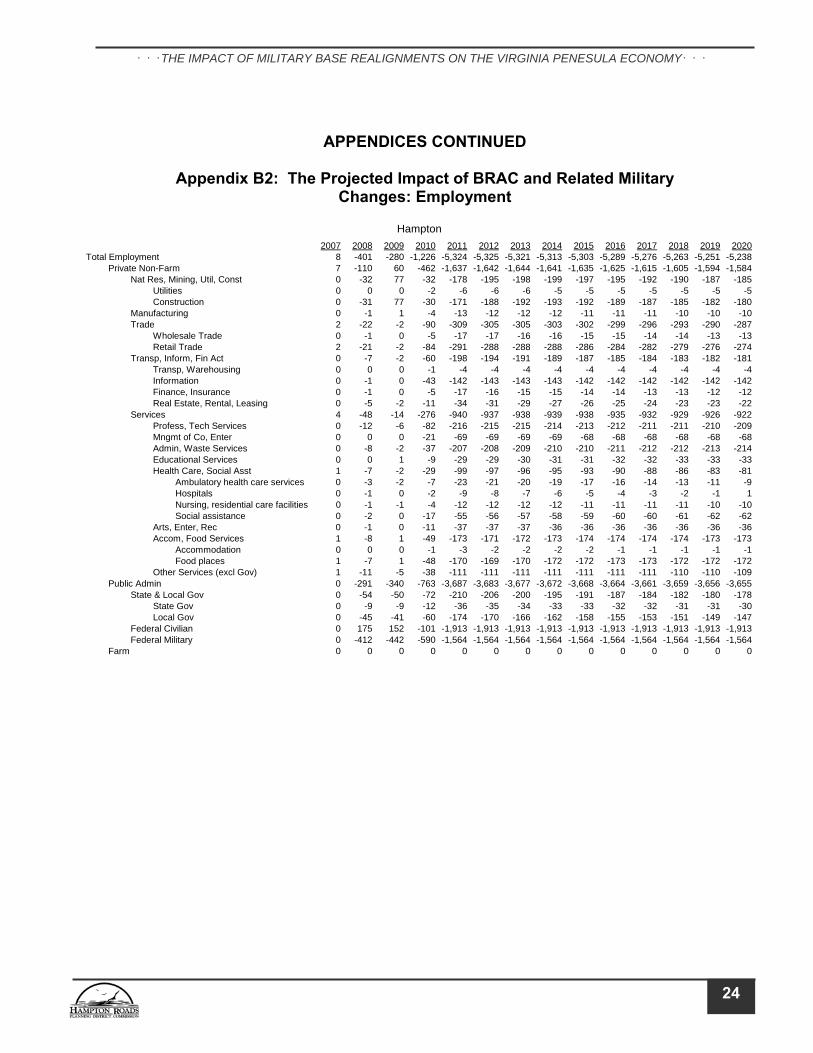
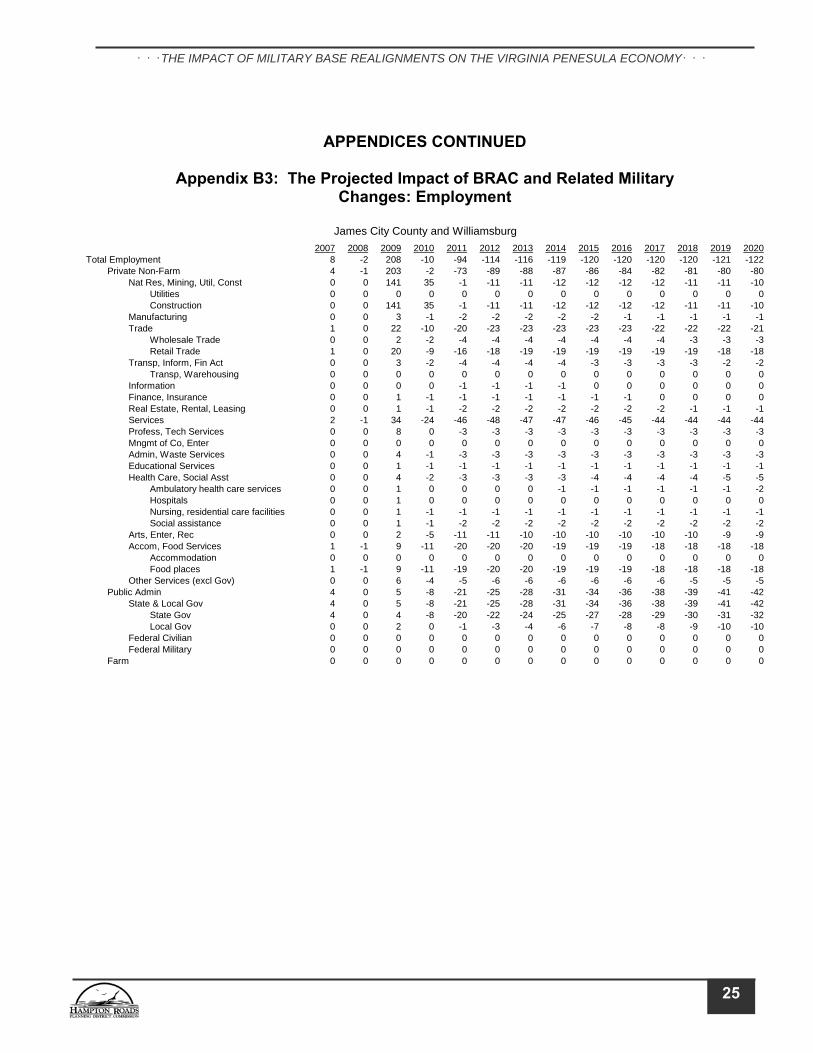
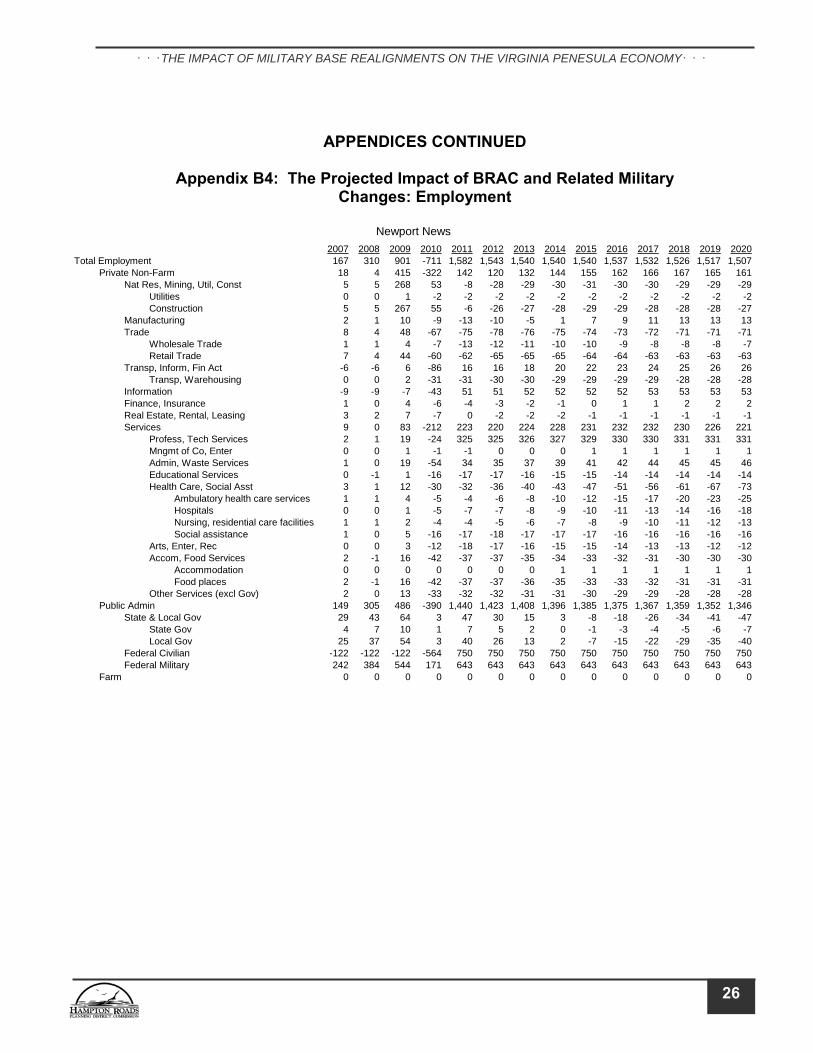
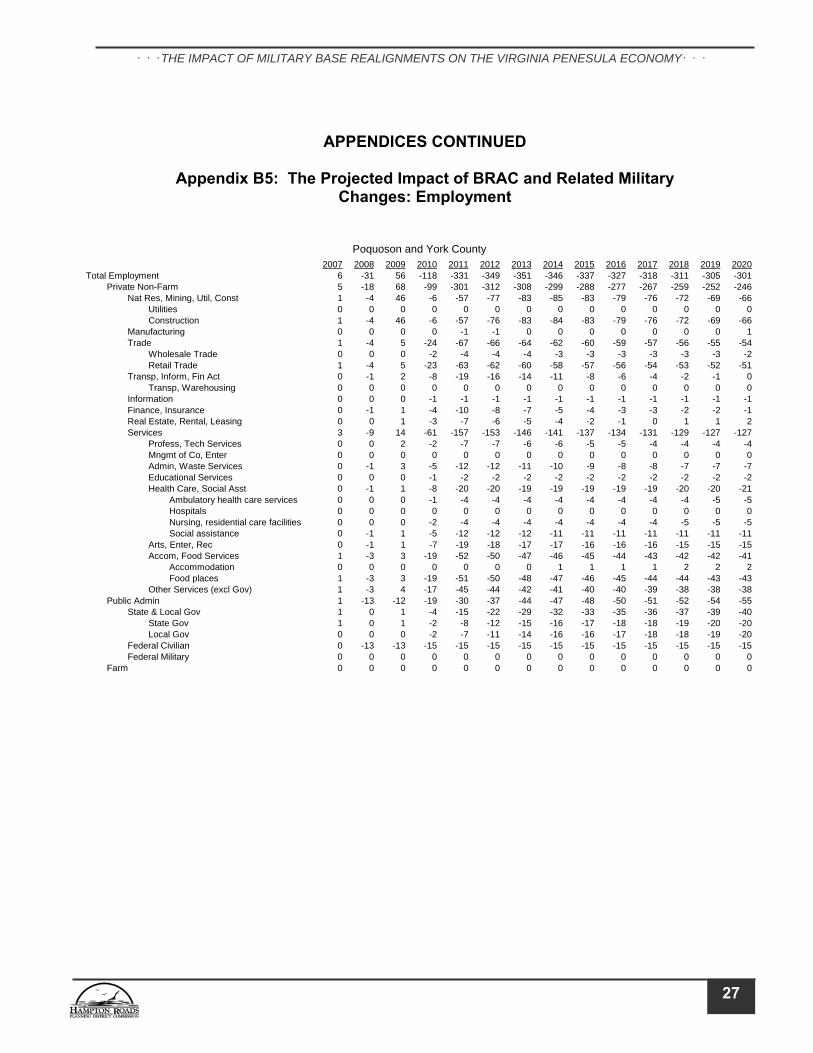
The projected change in employment resulting from the area’s base adjustments is shown in Figure 10. Newport News gains from these projected on-base changes since it is expected to experience an increase of 1,507 jobs as compared to Hampton, which will lose 5,239 jobs. Employment impacts in other communities are projected to be small. More detailed information on jurisdiction specific impacts is contained in Appendix A. Impact on Sector Employment The employment impact described above can be disaggregated to the many sectors (industries) comprising the economy. Many of those sectors, but not all, are shown in Table 2 along with their change in employment. As can be seen in the table, while total employment will decline by 4,224 jobs by 2020 as described above, only 1,805 of those will be in the private sector (excluding farming) while 2,418 will be lost in the public sector. Of the private sector jobs, the largest decline will be in the service sector which will lose 897 jobs by 2020 as compared to the number of jobs which would exist in that sector were BRAC and other base adjustments not to occur. The second largest reduction would occur in the trade sector, which is expected to lose 450 jobs by 2020. Job losses by sector in the various communities of Hampton Roads are shown in Appendix B.
11
THE IMPACT OF MILITARY BASE REALIGNMENTS ON THE VIRGINIA PENESULA ECONOMY
Figure 10: Change in Employment Due to BRAC and Other Base Adjustments
-6,000
-5,000
-4,000
-3,000
-2,000
-1,000
0
1,000
2,000
Newport News James CityCounty &
Williamsburg
GloucesterCounty
Poquoson & YorkCounty
Hampton
Empl
oym
ent
2012
2020
Table 2: The Projected Impact of BRAC and Related
Military Changes: Employment
2007 2008 2009 2010 2011 2012 2013 2014 2015 2016 2017 2018 2019 2020Total Employment 191 -126 936 -2,089 -4,224 -4,311 -4,316 -4,308 -4,289 -4,270 -4,252 -4,239 -4,229 -4,224
Private Non-Farm 36 -127 795 -908 -1,922 -1,984 -1,969 -1,946 -1,915 -1,885 -1,858 -1,835 -1,818 -1,805Nat Res, Mining, Util, Const 7 -30 564 54 -252 -324 -336 -340 -337 -331 -323 -315 -308 -302
Utilities 0 0 1 -4 -8 -8 -8 -8 -8 -7 -7 -7 -7 -7Construction 7 -30 563 59 -242 -315 -327 -332 -329 -323 -316 -308 -301 -295
Manufacturing 2 0 14 -14 -29 -25 -20 -13 -6 -3 0 1 2 3Trade 13 -22 79 -202 -487 -489 -486 -482 -477 -471 -465 -459 -454 -450
Wholesale Trade 1 -1 7 -16 -40 -38 -37 -35 -33 -32 -30 -29 -28 -27Retail Trade 12 -21 72 -185 -448 -451 -449 -447 -443 -439 -434 -430 -426 -423
Transp, Inform, Fin Act -4 -15 10 -158 -208 -202 -195 -187 -180 -174 -169 -165 -162 -160Transp, Warehousing 0 0 2 -32 -36 -35 -35 -34 -34 -34 -33 -33 -33 -33Information -9 -10 -6 -87 -94 -94 -94 -93 -92 -92 -92 -91 -91 -91Finance, Insurance 1 -2 6 -17 -33 -30 -26 -23 -20 -18 -16 -14 -13 -12Real Estate, Rental, Leasing 3 -3 7 -22 -45 -43 -40 -37 -33 -30 -28 -26 -25 -24
Services 18 -58 127 -588 -946 -944 -934 -924 -915 -907 -901 -898 -896 -897Profess, Tech Services 2 -11 23 -109 99 98 101 103 106 108 111 112 114 115Mngmt of Co, Enter 0 0 2 -22 -71 -70 -70 -69 -69 -68 -68 -68 -68 -68Admin, Waste Services 1 -9 25 -98 -190 -191 -189 -187 -185 -183 -181 -180 -180 -180Educational Services 0 -1 3 -27 -50 -50 -50 -50 -50 -49 -50 -50 -50 -50Health Care, Social Asst 4 -6 16 -73 -159 -161 -163 -165 -167 -170 -173 -176 -180 -185
Ambulatory health care services 1 -1 4 -14 -31 -32 -33 -34 -35 -36 -37 -39 -41 -42Hospitals 0 -1 2 -8 -16 -16 -15 -15 -16 -16 -16 -17 -18 -18Nursing, residential care facilities 1 -1 3 -11 -23 -24 -24 -25 -26 -27 -28 -29 -30 -31Social assistance 1 -3 7 -41 -89 -90 -90 -90 -91 -91 -91 -92 -92 -93
Arts, Enter, Rec 1 -3 7 -37 -87 -85 -83 -81 -80 -78 -77 -76 -75 -74Accom, Food Services 5 -13 32 -126 -287 -285 -282 -279 -277 -275 -272 -271 -269 -268
Accommodation 0 0 0 -2 -3 -2 -1 0 0 1 1 2 2 2Food places 5 -13 32 -124 -284 -283 -281 -279 -277 -275 -274 -272 -271 -270
Other Services (excl Gov) 4 -15 19 -95 -201 -200 -198 -196 -194 -192 -190 -189 -188 -186Public Admin 155 1 141 -1,181 -2,301 -2,327 -2,347 -2,362 -2,374 -2,385 -2,395 -2,403 -2,411 -2,418
State & Local Gov 35 -11 22 -82 -202 -228 -248 -264 -275 -286 -296 -304 -312 -319State Gov 10 -3 6 -23 -58 -67 -73 -78 -82 -85 -88 -90 -93 -95Local Gov 25 -8 16 -59 -144 -162 -175 -186 -194 -201 -208 -214 -220 -225
Federal Civilian -122 40 17 -680 -1,178 -1,178 -1,178 -1,178 -1,178 -1,178 -1,178 -1,178 -1,178 -1,178Federal Military 242 -28 102 -419 -921 -921 -921 -921 -921 -921 -921 -921 -921 -921
Farm 0 0 0 0 0 0 0 0 0 0 0 0 0 0
Totals for the Seven Virginia Peninsula Communities
12
THE IMPACT OF MILITARY BASE REALIGNMENTS ON THE VIRGINIA PENESULA ECONOMY
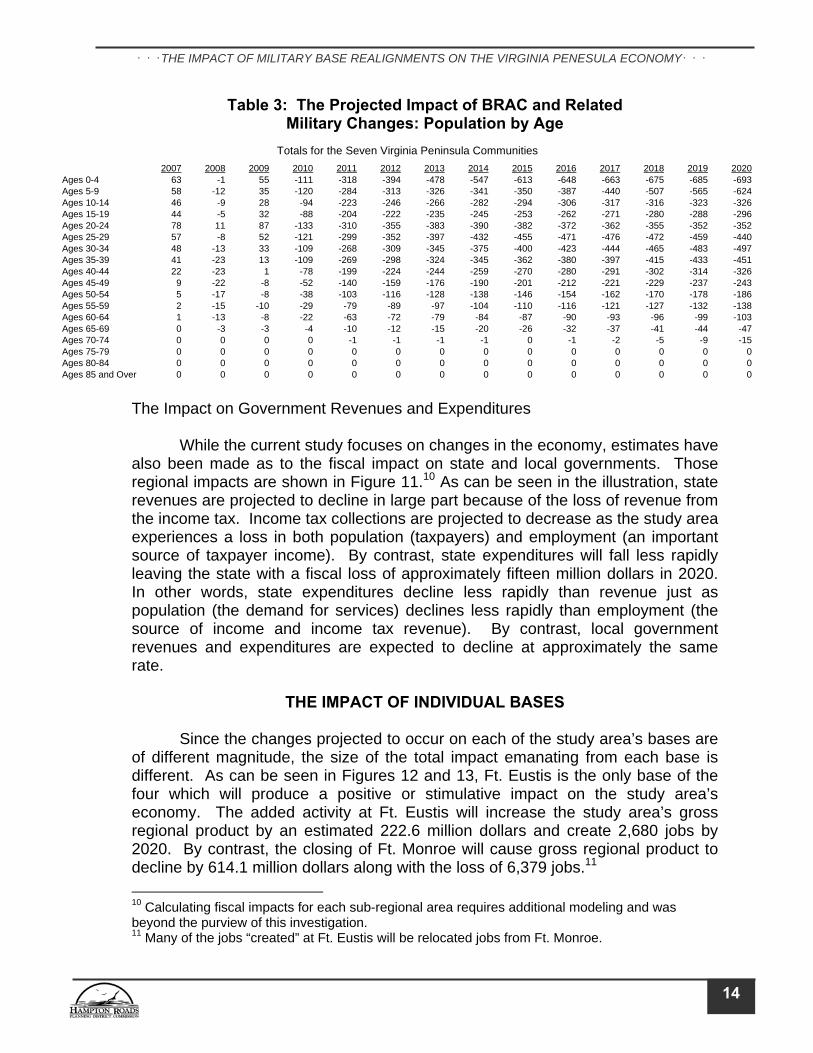
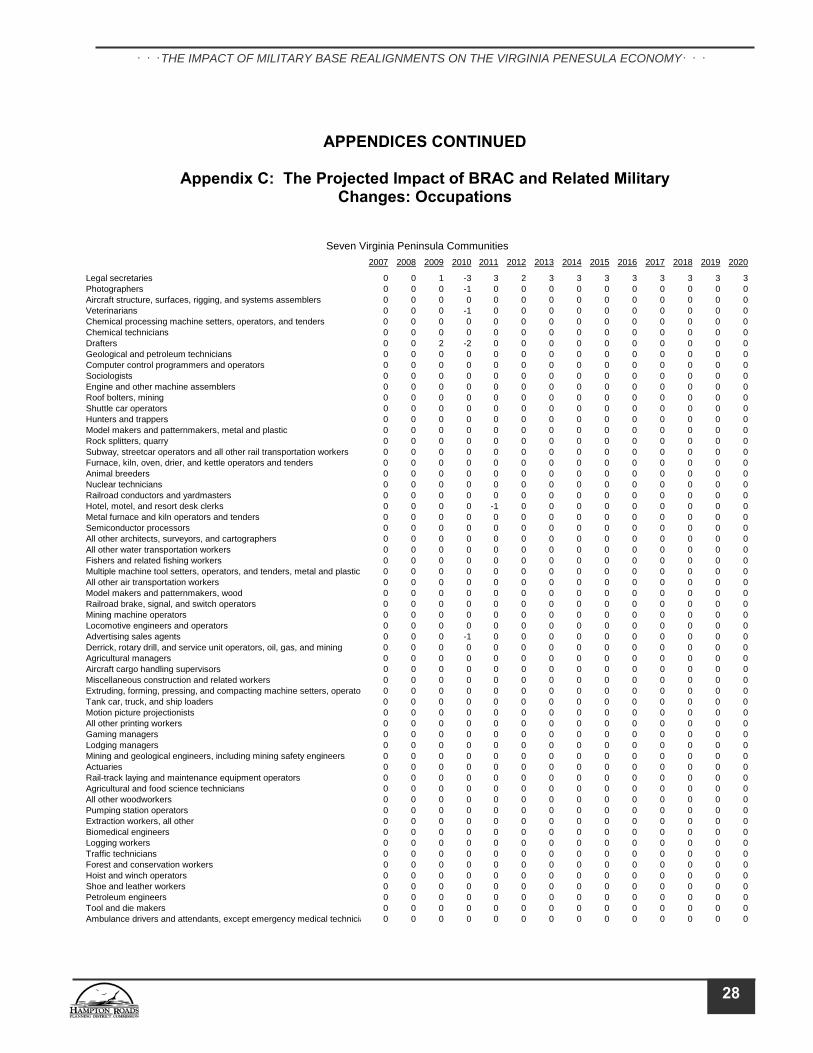
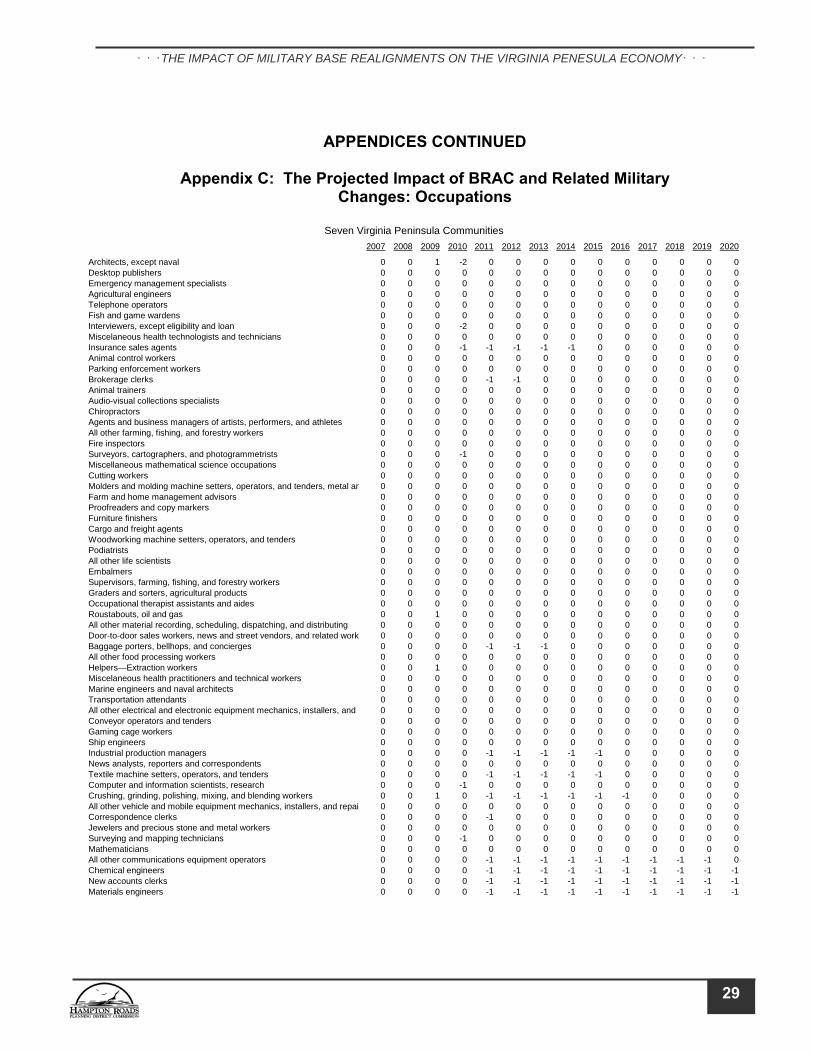
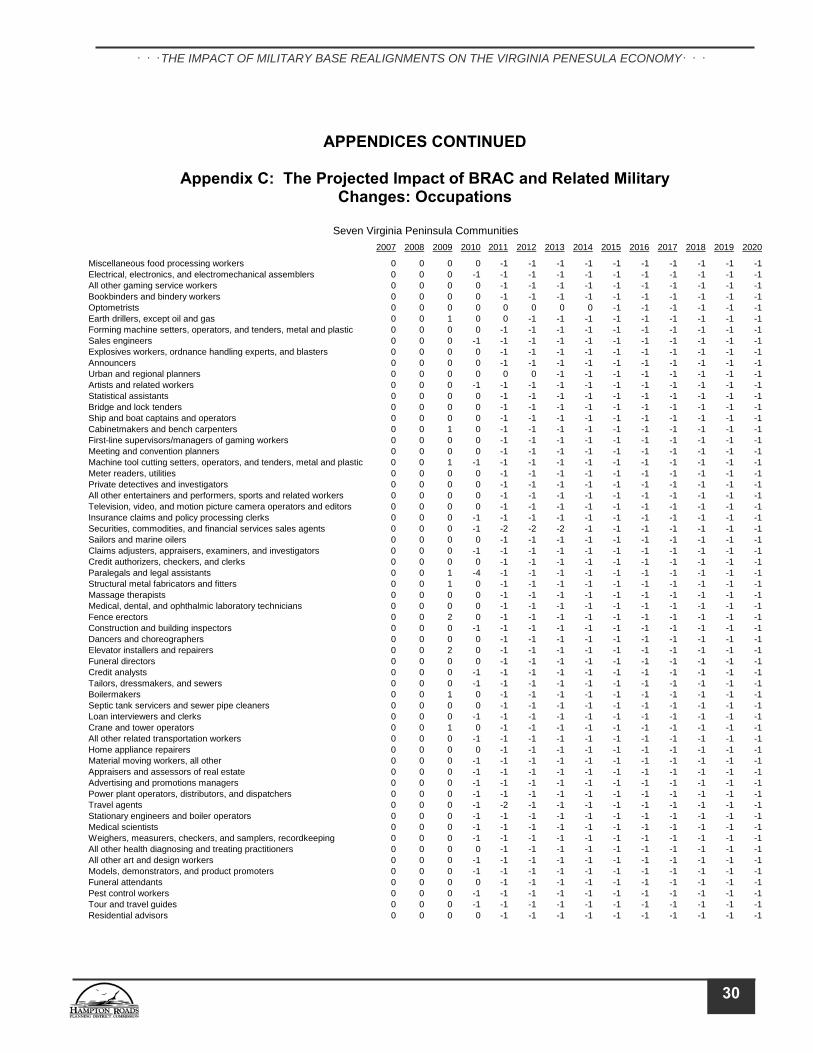
Impact on Occupations Employment is commonly classified by both sector and occupation. Classification by sector organizes employment data into the types of businesses that people work in while classification by occupation organizes employment data by the type of work people do. The projected change in employment by occupation is shown in Appendix C. Nearly five hundred occupational categories are listed in the table along with the projected employment change in each of the years from 2007 to 2020. As can be seen in the appendix, far more occupations will lose employment than will gain employment. In fact, because of the large loss in employment projected for the study area, legal secretaries are the only occupation which will experience an increase in employment. However, during the period when Ft. Eustis engages in construction activities, there will be a small, short-term increase in construction employment. In sharp contrast will be the loss of employment in the population-serving and business-serving occupations such as postal workers, retail salespersons, cashiers, fast food and counter workers, waiters and waitresses, and building cleaning workers. Impact on Population Changes in employment invariably produce a change in population, largely through changes in the direction and magnitude of migration – not through changes in birth and death rates. The migration caused by changes in activity at area military installations is expected to be selective since many of the workers on those facilities are of working age with many, especially those who are members of the armed forces, being less than forty years of age. As a result, the change in population experienced by the study area communities is likely to be concentrated among the cohorts in early middle age (largely those employed on bases) as well as among the very young (the children of those employed on bases). This pattern is clearly evident in Table 3. As can be seen in the table, the distribution of the loss of population is bi-modal (two peaks) with the first peak occurring among the very young, especially those aged 0-4 and 5-9 (the young children of young workers) and with a second peak occurring in ages 25-29, 30-34, and 35-39 (young adults working on area bases). Since a large proportion of those over 60 years of age are retired, their employment status will not change so that migration rates and the resulting change in population will be slight in the older age groups. Changes in population by age are contained in Appendix D.9
9 It’s important to note that the results reported here reflect only the population impacts from anticipated military base adjustments analyzed in this report and should not be interpreted to be the net change in population that will result from all factors (including BRAC) which will produce population changes within each of the study area communities. In other words, the net change in each community’s population will be the impacts estimated in this report as well as any other population impacts, which may occur from non-BRAC causes.
13
THE IMPACT OF MILITARY BASE REALIGNMENTS ON THE VIRGINIA PENESULA ECONOMY
Table 3: The Projected Impact of BRAC and Related Military Changes: Population by Age
2007 2008 2009 2010 2011 2012 2013 2014 2015 2016 2017 2018 2019 2020Ages 0-4 63 -1 55 -111 -318 -394 -478 -547 -613 -648 -663 -675 -685 -693Ages 5-9 58 -12 35 -120 -284 -313 -326 -341 -350 -387 -440 -507 -565 -624Ages 10-14 46 -9 28 -94 -223 -246 -266 -282 -294 -306 -317 -316 -323 -326Ages 15-19 44 -5 32 -88 -204 -222 -235 -245 -253 -262 -271 -280 -288 -296Ages 20-24 78 11 87 -133 -310 -355 -383 -390 -382 -372 -362 -355 -352 -352Ages 25-29 57 -8 52 -121 -299 -352 -397 -432 -455 -471 -476 -472 -459 -440Ages 30-34 48 -13 33 -109 -268 -309 -345 -375 -400 -423 -444 -465 -483 -497Ages 35-39 41 -23 13 -109 -269 -298 -324 -345 -362 -380 -397 -415 -433 -451Ages 40-44 22 -23 1 -78 -199 -224 -244 -259 -270 -280 -291 -302 -314 -326Ages 45-49 9 -22 -8 -52 -140 -159 -176 -190 -201 -212 -221 -229 -237 -243Ages 50-54 5 -17 -8 -38 -103 -116 -128 -138 -146 -154 -162 -170 -178 -186Ages 55-59 2 -15 -10 -29 -79 -89 -97 -104 -110 -116 -121 -127 -132 -138Ages 60-64 1 -13 -8 -22 -63 -72 -79 -84 -87 -90 -93 -96 -99 -103Ages 65-69 0 -3 -3 -4 -10 -12 -15 -20 -26 -32 -37 -41 -44 -47Ages 70-74 0 0 0 0 -1 -1 -1 -1 0 -1 -2 -5 -9 -15Ages 75-79 0 0 0 0 0 0 0 0 0 0 0 0 0 0Ages 80-84 0 0 0 0 0 0 0 0 0 0 0 0 0 0Ages 85 and Over 0 0 0 0 0 0 0 0 0 0 0 0 0 0
Totals for the Seven Virginia Peninsula Communities
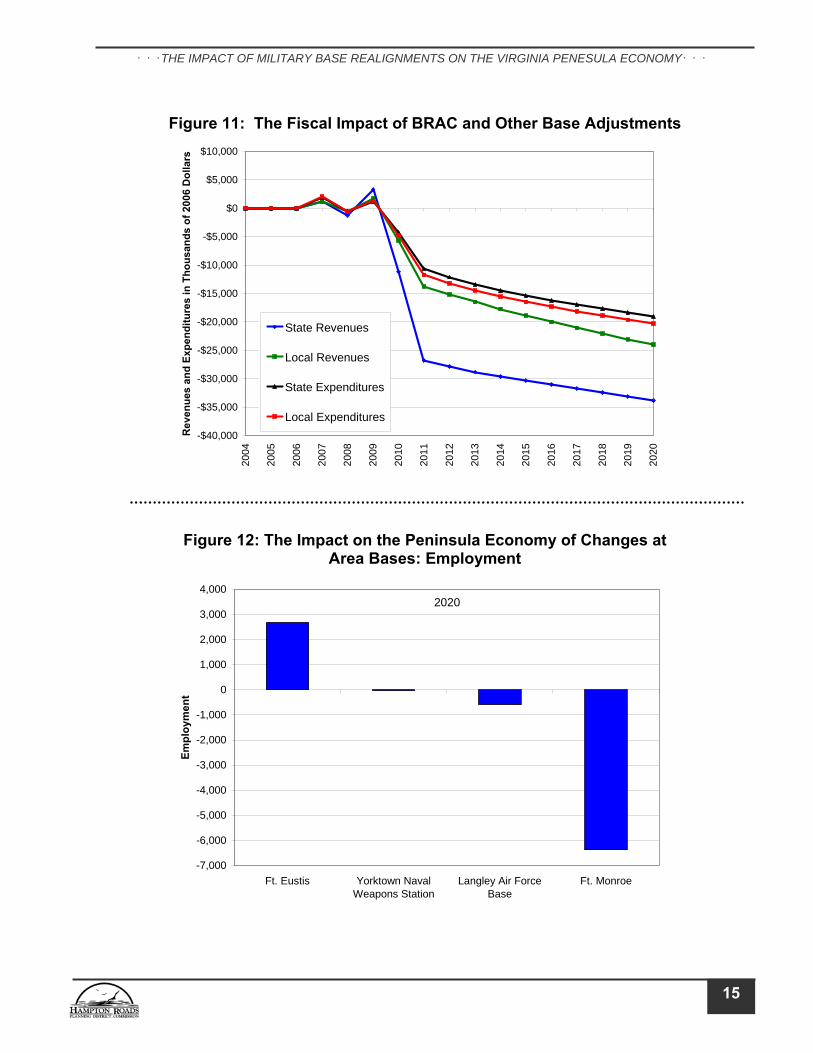
The Impact on Government Revenues and Expenditures While the current study focuses on changes in the economy, estimates have also been made as to the fiscal impact on state and local governments. Those regional impacts are shown in Figure 11.10 As can be seen in the illustration, state revenues are projected to decline in large part because of the loss of revenue from the income tax. Income tax collections are projected to decrease as the study area experiences a loss in both population (taxpayers) and employment (an important source of taxpayer income). By contrast, state expenditures will fall less rapidly leaving the state with a fiscal loss of approximately fifteen million dollars in 2020. In other words, state expenditures decline less rapidly than revenue just as population (the demand for services) declines less rapidly than employment (the source of income and income tax revenue). By contrast, local government revenues and expenditures are expected to decline at approximately the same rate.
THE IMPACT OF INDIVIDUAL BASES
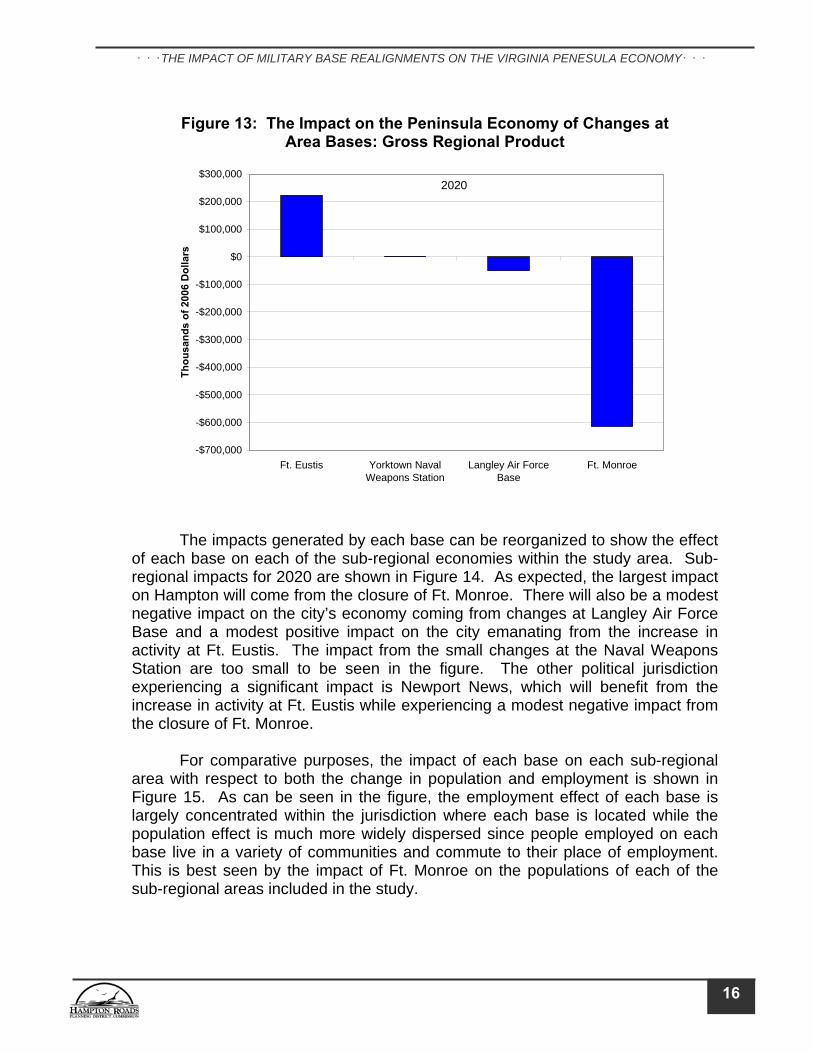
Since the changes projected to occur on each of the study area’s bases are of different magnitude, the size of the total impact emanating from each base is different. As can be seen in Figures 12 and 13, Ft. Eustis is the only base of the four which will produce a positive or stimulative impact on the study area’s economy. The added activity at Ft. Eustis will increase the study area’s gross regional product by an estimated 222.6 million dollars and create 2,680 jobs by 2020. By contrast, the closing of Ft. Monroe will cause gross regional product to decline by 614.1 million dollars along with the loss of 6,379 jobs.11 10 Calculating fiscal impacts for each sub-regional area requires additional modeling and was beyond the purview of this investigation. 11 Many of the jobs “created” at Ft. Eustis will be relocated jobs from Ft. Monroe.
14
THE IMPACT OF MILITARY BASE REALIGNMENTS ON THE VIRGINIA PENESULA ECONOMY
Figure 11: The Fiscal Impact of BRAC and Other Base Adjustments
-$40,000
-$35,000
-$30,000
-$25,000
-$20,000
-$15,000
-$10,000
-$5,000
$0
$5,000
$10,000
2004
2005
2006
2007
2008
2009
2010
2011
2012
2013
2014
2015
2016
2017
2018
2019
2020
Rev
enue
s an
d Ex
pend
iture
s in
Tho
usan
ds o
f 200
6 D
olla
rs
State Revenues
Local Revenues
State Expenditures
Local Expenditures
Figure 12: The Impact on the Peninsula Economy of Changes at Area Bases: Employment
-7,000
-6,000
-5,000
-4,000
-3,000
-2,000
-1,000
0
1,000
2,000
3,000
4,000
Ft. Eustis Yorktown NavalWeapons Station
Langley Air ForceBase
Ft. Monroe
Empl
oym
ent
2020
15
THE IMPACT OF MILITARY BASE REALIGNMENTS ON THE VIRGINIA PENESULA ECONOMY
Figure 13: The Impact on the Peninsula Economy of Changes at
Area Bases: Gross Regional Product
-$700,000
-$600,000
-$500,000
-$400,000
-$300,000
-$200,000
-$100,000
$0
$100,000
$200,000
$300,000
Ft. Eustis Yorktown NavalWeapons Station
Langley Air ForceBase
Ft. Monroe
Thou
sand
s of
200
6 D
olla
rs2020
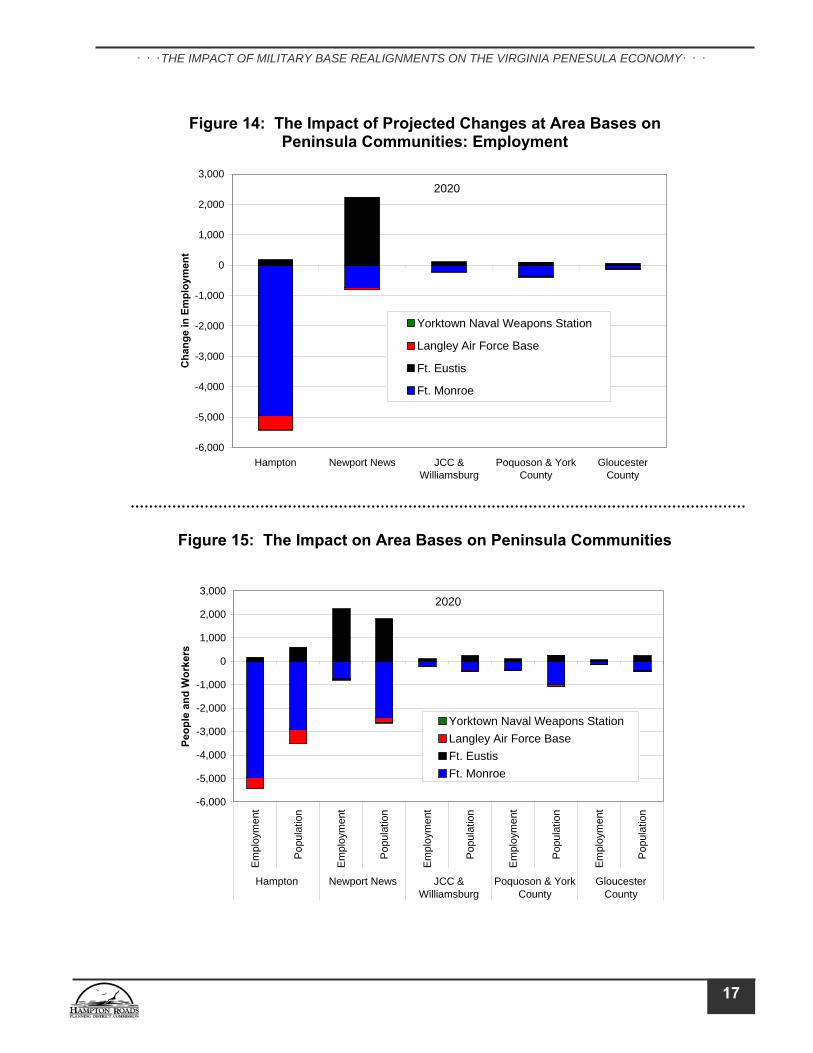
The impacts generated by each base can be reorganized to show the effect of each base on each of the sub-regional economies within the study area. Sub-regional impacts for 2020 are shown in Figure 14. As expected, the largest impact on Hampton will come from the closure of Ft. Monroe. There will also be a modest negative impact on the city’s economy coming from changes at Langley Air Force Base and a modest positive impact on the city emanating from the increase in activity at Ft. Eustis. The impact from the small changes at the Naval Weapons Station are too small to be seen in the figure. The other political jurisdiction experiencing a significant impact is Newport News, which will benefit from the increase in activity at Ft. Eustis while experiencing a modest negative impact from the closure of Ft. Monroe. For comparative purposes, the impact of each base on each sub-regional area with respect to both the change in population and employment is shown in Figure 15. As can be seen in the figure, the employment effect of each base is largely concentrated within the jurisdiction where each base is located while the population effect is much more widely dispersed since people employed on each base live in a variety of communities and commute to their place of employment. This is best seen by the impact of Ft. Monroe on the populations of each of the sub-regional areas included in the study.
16
THE IMPACT OF MILITARY BASE REALIGNMENTS ON THE VIRGINIA PENESULA ECONOMY
Figure 14: The Impact of Projected Changes at Area Bases on
Peninsula Communities: Employment
-6,000
-5,000
-4,000
-3,000
-2,000
-1,000
0
1,000
2,000
3,000
Hampton Newport News JCC &Williamsburg
Poquoson & YorkCounty
GloucesterCounty
Cha
nge
in E
mpl
oym
ent
Yorktown Naval Weapons Station
Langley Air Force Base
Ft. Eustis
Ft. Monroe
2020
Figure 15: The Impact on Area Bases on Peninsula Communities
-6,000
-5,000
-4,000
-3,000
-2,000
-1,000
0
1,000
2,000
3,000
Em
ploy
men
t
Popu
latio
n
Em
ploy
men
t
Popu
latio
n
Em
ploy
men
t
Popu
latio
n
Em
ploy
men
t
Popu
latio
n
Em
ploy
men
t
Popu
latio
n
Hampton Newport News JCC &Williamsburg
Poquoson & YorkCounty
GloucesterCounty
Peop
le a
nd W
orke
rs
Yorktown Naval Weapons StationLangley Air Force BaseFt. EustisFt. Monroe
2020
17
THE IMPACT OF MILITARY BASE REALIGNMENTS ON THE VIRGINIA PENESULA ECONOMY
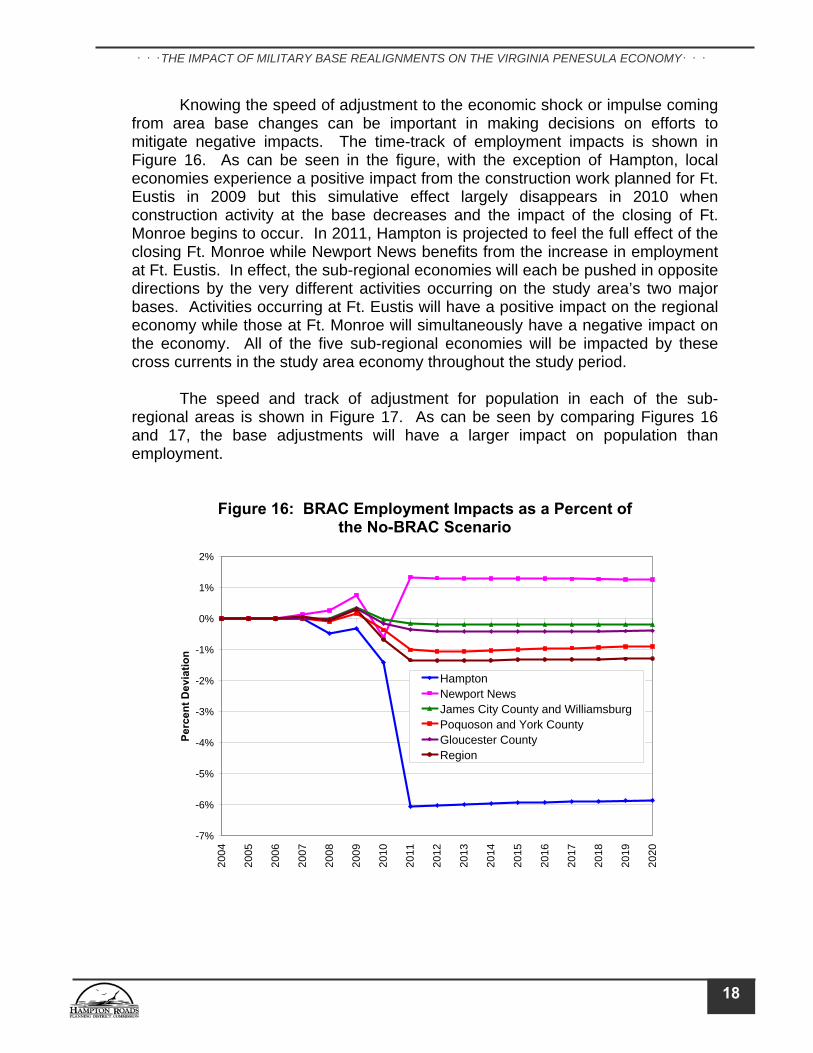
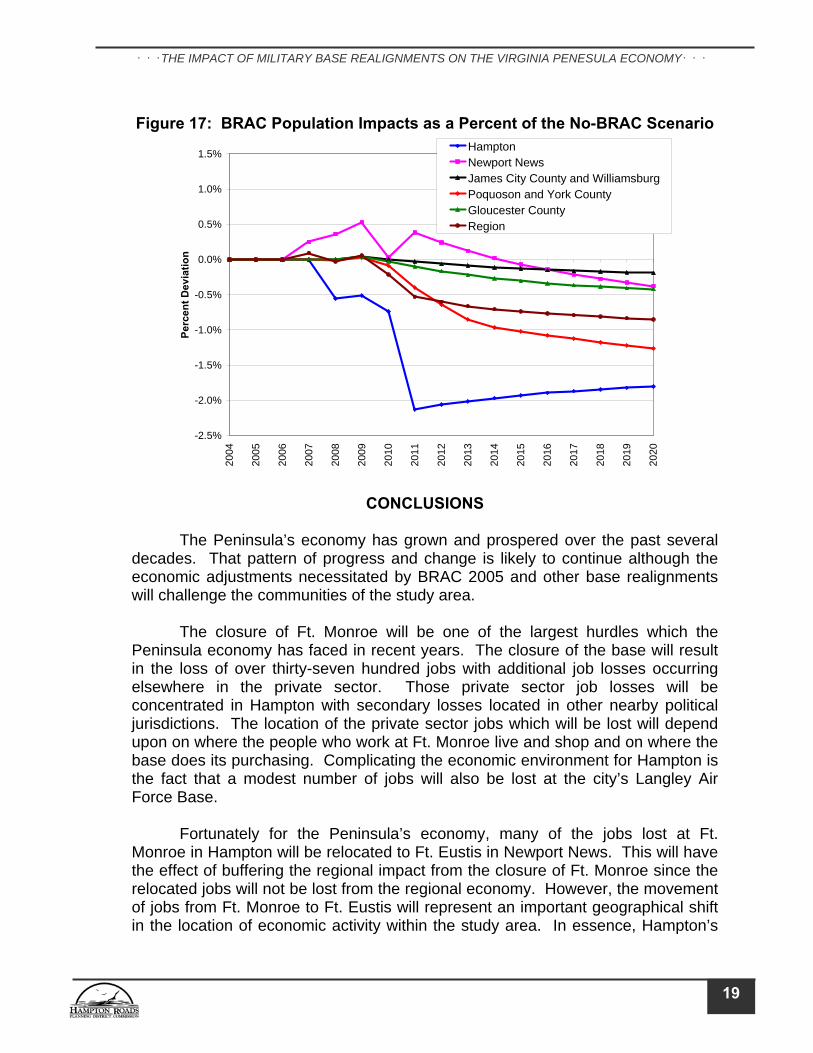
Knowing the speed of adjustment to the economic shock or impulse coming from area base changes can be important in making decisions on efforts to mitigate negative impacts. The time-track of employment impacts is shown in Figure 16. As can be seen in the figure, with the exception of Hampton, local economies experience a positive impact from the construction work planned for Ft. Eustis in 2009 but this simulative effect largely disappears in 2010 when construction activity at the base decreases and the impact of the closing of Ft. Monroe begins to occur. In 2011, Hampton is projected to feel the full effect of the closing Ft. Monroe while Newport News benefits from the increase in employment at Ft. Eustis. In effect, the sub-regional economies will each be pushed in opposite directions by the very different activities occurring on the study area’s two major bases. Activities occurring at Ft. Eustis will have a positive impact on the regional economy while those at Ft. Monroe will simultaneously have a negative impact on the economy. All of the five sub-regional economies will be impacted by these cross currents in the study area economy throughout the study period. The speed and track of adjustment for population in each of the sub-regional areas is shown in Figure 17. As can be seen by comparing Figures 16 and 17, the base adjustments will have a larger impact on population than employment.
Figure 16: BRAC Employment Impacts as a Percent of the No-BRAC Scenario
-7%
-6%
-5%
-4%
-3%
-2%
-1%
0%
1%
2%
2004
2005
2006
2007
2008
2009
2010
2011
2012
2013
2014
2015
2016
2017
2018
2019
2020
Perc
ent D
evia
tion
HamptonNewport NewsJames City County and WilliamsburgPoquoson and York CountyGloucester CountyRegion
18
THE IMPACT OF MILITARY BASE REALIGNMENTS ON THE VIRGINIA PENESULA ECONOMY
Figure 17: BRAC Population Impacts as a Percent of the No-BRAC Scenario
-2.5%
-2.0%
-1.5%
-1.0%
-0.5%
0.0%
0.5%
1.0%
1.5%
2004
2005
2006
2007
2008
2009
2010
2011
2012
2013
2014
2015
2016
2017
2018
2019
2020
Perc
ent D
evia
tion
HamptonNewport NewsJames City County and WilliamsburgPoquoson and York CountyGloucester CountyRegion
CONCLUSIONS
The Peninsula’s economy has grown and prospered over the past several decades. That pattern of progress and change is likely to continue although the economic adjustments necessitated by BRAC 2005 and other base realignments will challenge the communities of the study area. The closure of Ft. Monroe will be one of the largest hurdles which the Peninsula economy has faced in recent years. The closure of the base will result in the loss of over thirty-seven hundred jobs with additional job losses occurring elsewhere in the private sector. Those private sector job losses will be concentrated in Hampton with secondary losses located in other nearby political jurisdictions. The location of the private sector jobs which will be lost will depend upon on where the people who work at Ft. Monroe live and shop and on where the base does its purchasing. Complicating the economic environment for Hampton is the fact that a modest number of jobs will also be lost at the city’s Langley Air Force Base. Fortunately for the Peninsula’s economy, many of the jobs lost at Ft. Monroe in Hampton will be relocated to Ft. Eustis in Newport News. This will have the effect of buffering the regional impact from the closure of Ft. Monroe since the relocated jobs will not be lost from the regional economy. However, the movement of jobs from Ft. Monroe to Ft. Eustis will represent an important geographical shift in the location of economic activity within the study area. In essence, Hampton’s
19

THE IMPACT OF MILITARY BASE REALIGNMENTS ON THE VIRGINIA PENESULA ECONOMY
loss will become Newport News’ gain as jobs move from the former to the latter community. Finally, because the economic “shock” to the Peninsula communities will be small relative to the large size of the study area’s economy, the Peninsula can expect to overcome the challenge which will result from the closure of Ft. Monroe and the other base adjustments described in this report. With the reuse of Ft. Monroe and the enhancements now planned for Ft. Eustis along with the retraining of displaced workers, the economy will come through its projected change and emerge with a stronger and more diversified economy.
20
THE IMPACT OF MILITARY BASE REALIGNMENTS ON THE VIRGINIA PENESULA ECONOMY
APPENDICES
Appendix A1: The Projected Impact of BRAC and Related Military Changes: Economic Aggregates
2007 2008 2009 2010 2011 2012 2013 2014 2015 2016 2017 2018 2019 2020Population 472 -154 297 -1,110 -2,770 -3,159 -3,494 -3,752 -3,950 -4,131 -4,299 -4,455 -4,601 -4,737Labor Force 67 -49 200 -39 -1,063 -1,354 -1,560 -1,695 -1,781 -1,831 -1,883 -1,929 -1,968 -2,005Total Employment 191 -126 936 -2,089 -4,224 -4,311 -4,316 -4,308 -4,289 -4,270 -4,252 -4,239 -4,229 -4,224
Demand* $9,626 -$15,445 $69,395 -$143,920 -$347,536 -$375,536 -$388,192 -$396,928 -$402,976 -$407,680 -$412,160 -$416,640 -$421,568 -$426,832Output* $3,899 -$12,488 $84,594 -$101,282 -$195,552 -$206,080 -$205,184 -$202,944 -$200,144 -$197,792 -$196,336 -$194,880 -$195,776 -$196,896GRP* $9,509 -$14,549 $37,195 -$164,976 -$356,608 -$360,416 -$365,904 -$370,832 -$375,312 -$380,240 -$385,504 -$390,880 -$397,712 -$404,544Personal Income* $8,124 -$11,623 $28,130 -$111,054 -$270,312 -$283,265 -$293,214 -$301,773 -$309,366 -$316,752 -$324,164 -$331,110 -$339,307 -$347,123
2007 2008 2009 2010 2011 2012 2013 2014 2015 2016 2017 2018 2019 2020Population 2 1 18 -12 -42 -70 -95 -117 -136 -152 -167 -179 -190 -200Labor Force 2 1 18 -15 -41 -62 -78 -90 -99 -107 -112 -116 -120 -122Total Employment 2 -1 51 -24 -58 -66 -69 -70 -70 -70 -70 -70 -70 -70
Demand* $374 -$42 $4,351 -$4,665 -$7,280 -$8,848 -$9,540 -$9,975 -$10,228 -$10,378 -$10,482 -$10,572 -$10,664 -$10,770Output* $118 -$83 $2,819 -$1,341 -$3,360 -$3,360 -$3,846 -$3,952 -$3,996 -$3,989 -$3,961 -$3,932 -$3,911 -$3,903GRP* $68 -$42 $1,341 -$766 -$1,792 -$2,068 -$2,174 -$2,242 -$2,283 -$2,308 -$2,328 -$2,349 -$2,371 -$2,398Personal Income* $325 -$39 $2,877 -$4,209 -$5,459 -$6,276 -$6,675 -$6,958 -$7,160 -$7,328 -$7,482 -$7,635 -$7,788 -$7,957
* Thousands of 2006 dollars
Seven Virginia Peninsula Communities
Gloucester County
Appendix A2: The Projected Impact of BRAC and Related Military Changes: Economic Aggregates
2007 2008 2009 2010 2011 2012 2013 2014 2015 2016 2017 2018 2019 2020Population 6 -822 -756 -1,095 -3,404 -3,090 -3,025 -2,971 -2,928 -2,892 -2,865 -2,843 -2,827 -2,816Labor Force 6 -69 54 298 -377 -290 -223 -166 -114 -69 -27 9 44 76Total Employment 8 -401 -280 -1,226 -5,324 -5,325 -5,320 -5,314 -5,302 -5,290 -5,275 -5,264 -5,250 -5,239
Demand* $1,244 -$17,679 -$2,416 -$66,532 -$241,763 -$250,981 -$256,751 -$261,088 -$264,463 -$267,046 -$269,585 -$271,982 -$274,544 -$277,081Output* $596 -$12,197 $6,364 -$56,058 -$194,120 -$200,224 -$202,554 -$204,897 -$207,211 -$209,301 -$211,721 -$213,466 -$216,858 -$219,803GRP* $346 -$30,642 -$27,045 -$102,481 -$466,498 -$466,409 -$474,708 -$483,293 -$491,892 -$500,713 -$509,713 -$518,591 -$528,711 -$538,605Personal Income* $1,122 -$13,353 -$6,316 -$48,336 -$170,724 -$173,485 -$176,899 -$180,261 -$183,611 -$187,033 -$190,592 -$193,674 -$198,001 -$201,810
2007 2008 2009 2010 2011 2012 2013 2014 2015 2016 2017 2018 2019 2020Population 2 2 28 3 -23 -48 -70 -90 -108 -123 -137 -148 -159 -168Labor Force 2 1 28 -3 -26 -45 -60 -71 -80 -86 -92 -96 -99 -102Total Employment 8 -2 208 -10 -94 -114 -116 -119 -120 -120 -120 -120 -121 -122
Demand* $527 $54 $16,027 -$3,283 -$8,512 -$11,245 -$12,096 -$12,701 -$13,048 -$13,250 -$13,384 -$13,507 -$13,642 -$13,798Output* $320 -$152 $17,965 -$671 -$7,940 -$9,608 -$9,569 -$9,494 -$9,298 -$9,074 -$8,877 -$8,729 -$8,641 -$8,615GRP* $194 -$79 $8,492 -$789 -$4,428 -$5,272 -$5,357 -$5,394 -$5,357 -$5,302 -$5,253 -$5,225 -$5,219 -$5,244Personal Income* $442 $43 $7,607 -$4,212 -$6,185 -$7,657 -$8,313 -$8,807 -$9,161 -$9,446 -$9,691 -$9,926 -$10,151 -$10,386
* Thousands of 2006 dollars
Hampton
James City County & Williamsburg
21
THE IMPACT OF MILITARY BASE REALIGNMENTS ON THE VIRGINIA PENESULA ECONOMY
APPENDICES CONTINUED
Appendix A3: The Projected Impact of BRAC and Related Military Changes: Economic Aggregates
2007 2008 2009 2010 2011 2012 2013 2014 2015 2016 2017 2018 2019 2020Population 459 671 989 52 724 462 237 41 -131 -283 -420 -543 -655 -757Labor Force 53 25 80 -249 -341 -554 -711 -835 -935 -1,018 -1,088 -1,149 -1,203 -1,253Total Employment 167 310 901 -711 1,582 1,543 1,540 1,540 1,540 1,537 1,532 1,526 1,517 1,507
Demand* $6,459 $5,856 $45,203 -$44,890 -$16,106 -$22,893 -$24,618 -$25,760 -$26,466 -$27,362 -$28,347 -$29,512 -$30,890 -$32,480Output* $2,509 $1,140 $51,453 -$36,613 $31,528 $30,576 $34,171 $38,035 $41,922 $45,046 $47,701 $49,862 $51,554 $52,808GRP* $8,697 $18,066 $52,819 -$55,877 $129,024 $127,120 $130,256 $133,728 $137,312 $140,672 $143,920 $147,056 $150,080 $152,992Personal Income* $5,378 $4,872 $20,737 -$33,325 -$27,771 -$32,578 -$35,648 -$38,138 -$40,232 -$42,149 -$43,990 -$45,797 -$47,632 -$49,489
2007 2008 2009 2010 2011 2012 2013 2014 2015 2016 2017 2018 2019 2020Population 4 -6 19 -58 -26 -414 -542 -615 -648 -680 -712 -742 -770 -796Labor Force 4 -7 21 -70 -277 -403 -488 -534 -553 -551 -564 -577 -590 -603Total Employment 6 -31 56 -118 -331 -349 -351 -346 -337 -327 -318 -311 -305 -301
Demand* $1,023 -$3,634 $6,229 -$24,550 -$73,875 -$81,570 -$85,187 -$87,405 -$88,771 -$89,645 -$90,362 -$91,067 -$91,829 -$92,702Output* $356 -$1,196 $5,993 -$6,599 -$21,661 -$23,464 -$23,386 -$22,635 -$21,560 -$20,474 -$19,477 -$18,614 -$17,920 -$17,382GRP* $204 -$1,852 $1,588 -$5,064 -$12,914 -$13,787 -$13,922 -$13,630 -$13,093 -$12,589 -$12,130 -$11,771 -$11,491 -$11,290Personal Income* $857 -$3,147 $3,224 -$20,972 -$60,173 -$63,270 -$65,679 -$67,608 -$69,203 -$70,796 -$72,408 -$74,078 -$75,736 -$77,480
* Thousands of 2006 dollars
Newport News
Poquoson & York County
22
THE IMPACT OF MILITARY BASE REALIGNMENTS ON THE VIRGINIA PENESULA ECONOMY
APPENDICES CONTINUED
Appendix B1: The Projected Impact of BRAC and Related Military Changes: Employment
2007 2008 2009 2010 2011 2012 2013 2014 2015 2016 2017 2018 2019 2020Total Employment 2 -1 51 -24 -58 -66 -69 -70 -70 -70 -70 -70 -70 -70
Private Non-Farm 2 -2 49 -23 -54 -61 -62 -62 -61 -60 -59 -58 -57 -57Nat Res, Mining, Util, Const 0 0 34 5 -8 -13 -14 -15 -15 -14 -14 -13 -12 -12
Utilities 0 0 0 0 0 0 0 0 0 0 0 0 0Construction 0 0 33 5 -8 -13 -14 -14 -14 -14 -13 -13 -12 -12
Manufacturing 0 0 0 0 0 0 0 0 0 0 0 0 0 0Trade 1 -1 6 -10 -17 -18 -18 -18 -18 -18 -18 -18 -18 -17
Wholesale Trade 0 0 0 -1 -1 -1 -1 -1 -1 -1 -1 -1 -1 -Retail Trade 1 -1 6 -9 -16 -17 -17 -17 -17 -17 -17 -17 -16 -16
Transp, Inform, Fin Act 0 0 1 -2 -3 -3 -3 -3 -3 -3 -3 -3 -2 -2Transp, Warehousing 0 0 0 0 0 0 0 0 0 0 0 0 0 0
Information 0 0 0 0 -1 -1 -1 -1 -1 -1 -1 0 0Finance, Insurance 0 0 0 -1 -1 -1 -1 -1 -1 -1 -1 -1 -1 -1Real Estate, Rental, Leasing 0 0 0 -1 -1 -1 -1 -1 -1 -1 -1 -1 -1 -1Services 1 -1 9 -16 -26 -26 -26 -26 -25 -25 -25 -25 -25 -25
Profess, Tech Services 0 0 1 0 -1 -1 -1 -1 -1 -1 -1 -1 -1 -1Mngmt of Co, Enter 0 0 0 0 -1 -1 0 0 0 0 0 0 0 0Admin, Waste Services 0 0 1 -1 -3 -3 -3 -3 -3 -3 -2 -2 -2 -Educational Services 0 0 0 0 -1 -1 0 0 0 0 0 0 0 0Health Care, Social Asst 0 0 1 -3 -4 -5 -5 -5 -5 -5 -5 -5 -5 -
Ambulatory health care services 0 0 0 0 -1 -1 -1 -1 -1 -1 -1 -1 -1 -1Hospitals 0 0 0 0 -1 -1 -1 -1 -1 -1 -1 -1 -1 -Nursing, residential care facilities 0 0 0 -1 -1 -1 -1 -1 -2 -2 -2 -2 -2 -Social assistance 0 0 0 -1 -2 -2 -2 -2 -2 -2 -2 -2 -2 -2
Arts, Enter, Rec 0 0 1 -1 -3 -3 -3 -3 -3 -2 -2 -2 -2 -2Accom, Food Services 0 0 3 -5 -7 -7 -7 -7 -7 -7 -6 -6 -6 -6
Accommodation 0 0 0 0 0 0 0 0 0 0 0 0 0 0Food places 0 0 3 -5 -7 -7 -7 -7 -7 -7 -6 -6 -6 -6
Other Services (excl Gov) 0 0 2 -4 -7 -7 -7 -7 -7 -7 -7 -7 -6 -Public Admin 0 0 1 -1 -3 -5 -7 -8 -9 -10 -11 -12 -13 -13
State & Local Gov 0 0 1 -1 -3 -5 -7 -8 -9 -10 -11 -12 -13 -13State Gov 0 0 0 -1 -2 -2 -3 -3 -4 -4 -4 -5 -5 -5Local Gov 0 0 1 0 -2 -3 -4 -5 -6 -6 -7 -7 -8 -
Federal Civilian 0 0 0 0 0 0 0 0 0 0 0 0 0 0Federal Military 0 0 0 0 0 0 0 0 0 0 0 0 0 0
Farm 0 0 0 0 0 0 0 0 0 0 0 0 0
Gloucester County
0
1
0
2
6
12
6
8
0
23
THE IMPACT OF MILITARY BASE REALIGNMENTS ON THE VIRGINIA PENESULA ECONOMY
APPENDICES CONTINUED
Appendix B2: The Projected Impact of BRAC and Related Military Changes: Employment
2007 2008 2009 2010 2011 2012 2013 2014 2015 2016 2017 2018 2019 2020Total Employment 8 -401 -280 -1,226 -5,324 -5,325 -5,321 -5,313 -5,303 -5,289 -5,276 -5,263 -5,251 -5,238
Private Non-Farm 7 -110 60 -462 -1,637 -1,642 -1,644 -1,641 -1,635 -1,625 -1,615 -1,605 -1,594 -1,584Nat Res, Mining, Util, Const 0 -32 77 -32 -178 -195 -198 -199 -197 -195 -192 -190 -187 -185
Utilities 0 0 0 -2 -6 -6 -6 -5 -5 -5 -5 -5 -5 -5Construction 0 -31 77 -30 -171 -188 -192 -193 -192 -189 -187 -185 -182 -180
Manufacturing 0 -1 1 -4 -13 -12 -12 -12 -11 -11 -11 -10 -10 -10Trade 2 -22 -2 -90 -309 -305 -305 -303 -302 -299 -296 -293 -290 -287
Wholesale Trade 0 -1 0 -5 -17 -17 -16 -16 -15 -15 -14 -14 -13 -13Retail Trade 2 -21 -2 -84 -291 -288 -288 -288 -286 -284 -282 -279 -276 -274
Transp, Inform, Fin Act 0 -7 -2 -60 -198 -194 -191 -189 -187 -185 -184 -183 -182 -181Transp, Warehousing 0 0 0 -1 -4 -4 -4 -4 -4 -4 -4 -4 -4 -4Information 0 -1 0 -43 -142 -143 -143 -143 -142 -142 -142 -142 -142 -142Finance, Insurance 0 -1 0 -5 -17 -16 -15 -15 -14 -14 -13 -13 -12 -12Real Estate, Rental, Leasing 0 -5 -2 -11 -34 -31 -29 -27 -26 -25 -24 -23 -23 -22
Services 4 -48 -14 -276 -940 -937 -938 -939 -938 -935 -932 -929 -926 -922Profess, Tech Services 0 -12 -6 -82 -216 -215 -215 -214 -213 -212 -211 -211 -210 -209Mngmt of Co, Enter 0 0 0 -21 -69 -69 -69 -69 -68 -68 -68 -68 -68 -6Admin, Waste Services 0 -8 -2 -37 -207 -208 -209 -210 -210 -211 -212 -212 -213 -214Educational Services 0 0 1 -9 -29 -29 -30 -31 -31 -32 -32 -33 -33 -33Health Care, Social Asst 1 -7 -2 -29 -99 -97 -96 -95 -93 -90 -88 -86 -83 -81
Ambulatory health care services 0 -3 -2 -7 -23 -21 -20 -19 -17 -16 -14 -13 -11 -9Hospitals 0 -1 0 -2 -9 -8 -7 -6 -5 -4 -3 -2 -1Nursing, residential care facilities 0 -1 -1 -4 -12 -12 -12 -12 -11 -11 -11 -11 -10 -10Social assistance 0 -2 0 -17 -55 -56 -57 -58 -59 -60 -60 -61 -62 -62
Arts, Enter, Rec 0 -1 0 -11 -37 -37 -37 -36 -36 -36 -36 -36 -36 -36Accom, Food Services 1 -8 1 -49 -173 -171 -172 -173 -174 -174 -174 -174 -173 -173
Accommodation 0 0 0 -1 -3 -2 -2 -2 -2 -1 -1 -1 -1 -1Food places 1 -7 1 -48 -170 -169 -170 -172 -172 -173 -173 -172 -172 -172
Other Services (excl Gov) 1 -11 -5 -38 -111 -111 -111 -111 -111 -111 -111 -110 -110 -109Public Admin 0 -291 -340 -763 -3,687 -3,683 -3,677 -3,672 -3,668 -3,664 -3,661 -3,659 -3,656 -3,655
State & Local Gov 0 -54 -50 -72 -210 -206 -200 -195 -191 -187 -184 -182 -180 -178State Gov 0 -9 -9 -12 -36 -35 -34 -33 -33 -32 -32 -31 -31 -30Local Gov 0 -45 -41 -60 -174 -170 -166 -162 -158 -155 -153 -151 -149 -147
Federal Civilian 0 175 152 -101 -1,913 -1,913 -1,913 -1,913 -1,913 -1,913 -1,913 -1,913 -1,913 -1,913Federal Military 0 -412 -442 -590 -1,564 -1,564 -1,564 -1,564 -1,564 -1,564 -1,564 -1,564 -1,564 -1,564
Farm 0 0 0 0 0 0 0 0 0 0 0 0 0
Hampton
8
1
0
24
THE IMPACT OF MILITARY BASE REALIGNMENTS ON THE VIRGINIA PENESULA ECONOMY
APPENDICES CONTINUED
Appendix B3: The Projected Impact of BRAC and Related Military Changes: Employment
2007 2008 2009 2010 2011 2012 2013 2014 2015 2016 2017 2018 2019 2020Total Employment 8 -2 208 -10 -94 -114 -116 -119 -120 -120 -120 -120 -121 -122
Private Non-Farm 4 -1 203 -2 -73 -89 -88 -87 -86 -84 -82 -81 -80 -80Nat Res, Mining, Util, Const 0 0 141 35 -1 -11 -11 -12 -12 -12 -12 -11 -11 -10
Utilities 0 0 0 0 0 0 0 0 0 0 0 0 0 0Construction 0 0 141 35 -1 -11 -11 -12 -12 -12 -12 -11 -11 -10
Manufacturing 0 0 3 -1 -2 -2 -2 -2 -2 -1 -1 -1 -1 -1Trade 1 0 22 -10 -20 -23 -23 -23 -23 -23 -22 -22 -22 -21
Wholesale Trade 0 0 2 -2 -4 -4 -4 -4 -4 -4 -4 -3 -3 -3Retail Trade 1 0 20 -9 -16 -18 -19 -19 -19 -19 -19 -19 -18 -1
Transp, Inform, Fin Act 0 0 3 -2 -4 -4 -4 -4 -3 -3 -3 -3 -2 -2Transp, Warehousing 0 0 0 0 0 0 0 0 0 0 0 0 0 0
Information 0 0 0 0 -1 -1 -1 -1 0 0 0 0 0 0Finance, Insurance 0 0 1 -1 -1 -1 -1 -1 -1 -1 0 0 0 0Real Estate, Rental, Leasing 0 0 1 -1 -2 -2 -2 -2 -2 -2 -2 -1 -1 -1Services 2 -1 34 -24 -46 -48 -47 -47 -46 -45 -44 -44 -44 -44Profess, Tech Services 0 0 8 0 -3 -3 -3 -3 -3 -3 -3 -3 -3 -3Mngmt of Co, Enter 0 0 0 0 0 0 0 0 0 0 0 0 0 0Admin, Waste Services 0 0 4 -1 -3 -3 -3 -3 -3 -3 -3 -3 -3 -Educational Services 0 0 1 -1 -1 -1 -1 -1 -1 -1 -1 -1 -1 -Health Care, Social Asst 0 0 4 -2 -3 -3 -3 -3 -4 -4 -4 -4 -5 -
Ambulatory health care services 0 0 1 0 0 0 0 -1 -1 -1 -1 -1 -1Hospitals 0 0 1 0 0 0 0 0 0 0 0 0 0 0Nursing, residential care facilities 0 0 1 -1 -1 -1 -1 -1 -1 -1 -1 -1 -1 -Social assistance 0 0 1 -1 -2 -2 -2 -2 -2 -2 -2 -2 -2 -
Arts, Enter, Rec 0 0 2 -5 -11 -11 -10 -10 -10 -10 -10 -10 -9 -9Accom, Food Services 1 -1 9 -11 -20 -20 -20 -19 -19 -19 -18 -18 -18 -18
Accommodation 0 0 0 0 0 0 0 0 0 0 0 0 0 0Food places 1 -1 9 -11 -19 -20 -20 -19 -19 -19 -18 -18 -18 -18
Other Services (excl Gov) 0 0 6 -4 -5 -6 -6 -6 -6 -6 -6 -5 -5 -Public Admin 4 0 5 -8 -21 -25 -28 -31 -34 -36 -38 -39 -41 -42
State & Local Gov 4 0 5 -8 -21 -25 -28 -31 -34 -36 -38 -39 -41 -42State Gov 4 0 4 -8 -20 -22 -24 -25 -27 -28 -29 -30 -31 -32Local Gov 0 0 2 0 -1 -3 -4 -6 -7 -8 -8 -9 -10 -10
Federal Civilian 0 0 0 0 0 0 0 0 0 0 0 0 0 0Federal Military 0 0 0 0 0 0 0 0 0 0 0 0 0 0
Farm 0 0 0 0 0 0 0 0 0 0 0 0 0 0
James City County and Williamsburg
8
315
-2
12
5
25
THE IMPACT OF MILITARY BASE REALIGNMENTS ON THE VIRGINIA PENESULA ECONOMY
APPENDICES CONTINUED
Appendix B4: The Projected Impact of BRAC and Related Military Changes: Employment
2007 2008 2009 2010 2011 2012 2013 2014 2015 2016 2017 2018 2019 2020Total Employment 167 310 901 -711 1,582 1,543 1,540 1,540 1,540 1,537 1,532 1,526 1,517 1,507
Private Non-Farm 18 4 415 -322 142 120 132 144 155 162 166 167 165 161Nat Res, Mining, Util, Const 5 5 268 53 -8 -28 -29 -30 -31 -30 -30 -29 -29 -29
Utilities 0 0 1 -2 -2 -2 -2 -2 -2 -2 -2 -2 -2 -2Construction 5 5 267 55 -6 -26 -27 -28 -29 -29 -28 -28 -28 -27
Manufacturing 2 1 10 -9 -13 -10 -5 1 7 9 11 13 13 13Trade 8 4 48 -67 -75 -78 -76 -75 -74 -73 -72 -71 -71 -71
Wholesale Trade 1 1 4 -7 -13 -12 -11 -10 -10 -9 -8 -8 -8 -7Retail Trade 7 4 44 -60 -62 -65 -65 -65 -64 -64 -63 -63 -63 -63
Transp, Inform, Fin Act -6 -6 6 -86 16 16 18 20 22 23 24 25 26 2Transp, Warehousing 0 0 2 -31 -31 -30 -30 -29 -29 -29 -29 -28 -28 -28
Information -9 -9 -7 -43 51 51 52 52 52 52 53 53 53 53Finance, Insurance 1 0 4 -6 -4 -3 -2 -1 0 1 1 2 2 2Real Estate, Rental, Leasing 3 2 7 -7 0 -2 -2 -2 -1 -1 -1 -1 -1 -Services 9 0 83 -212 223 220 224 228 231 232 232 230 226 221
Profess, Tech Services 2 1 19 -24 325 325 326 327 329 330 330 331 331 331Mngmt of Co, Enter 0 0 1 -1 -1 0 0 0 1 1 1 1 1 1Admin, Waste Services 1 0 19 -54 34 35 37 39 41 42 44 45 45 4Educational Services 0 -1 1 -16 -17 -17 -16 -15 -15 -14 -14 -14 -14 -14Health Care, Social Asst 3 1 12 -30 -32 -36 -40 -43 -47 -51 -56 -61 -67 -73
Ambulatory health care services 1 1 4 -5 -4 -6 -8 -10 -12 -15 -17 -20 -23 -25Hospitals 0 0 1 -5 -7 -7 -8 -9 -10 -11 -13 -14 -16 -18Nursing, residential care facilities 1 1 2 -4 -4 -5 -6 -7 -8 -9 -10 -11 -12 -13Social assistance 1 0 5 -16 -17 -18 -17 -17 -17 -16 -16 -16 -16 -16
Arts, Enter, Rec 0 0 3 -12 -18 -17 -16 -15 -15 -14 -13 -13 -12 -12Accom, Food Services 2 -1 16 -42 -37 -37 -35 -34 -33 -32 -31 -30 -30 -30
Accommodation 0 0 0 0 0 0 0 1 1 1 1 1 1 1Food places 2 -1 16 -42 -37 -37 -36 -35 -33 -33 -32 -31 -31 -31
Other Services (excl Gov) 2 0 13 -33 -32 -32 -31 -31 -30 -29 -29 -28 -28 -28Public Admin 149 305 486 -390 1,440 1,423 1,408 1,396 1,385 1,375 1,367 1,359 1,352 1,346
State & Local Gov 29 43 64 3 47 30 15 3 -8 -18 -26 -34 -41 -47State Gov 4 7 10 1 7 5 2 0 -1 -3 -4 -5 -6 -Local Gov 25 37 54 3 40 26 13 2 -7 -15 -22 -29 -35 -40
Federal Civilian -122 -122 -122 -564 750 750 750 750 750 750 750 750 750 750Federal Military 242 384 544 171 643 643 643 643 643 643 643 643 643 643
Farm 0 0 0 0 0 0 0 0 0 0 0 0 0 0
Newport News
6
1
6
7
26
THE IMPACT OF MILITARY BASE REALIGNMENTS ON THE VIRGINIA PENESULA ECONOMY
APPENDICES CONTINUED
Appendix B5: The Projected Impact of BRAC and Related Military Changes: Employment
2007 2008 2009 2010 2011 2012 2013 2014 2015 2016 2017 2018 2019 2020Total Employment 6 -31 56 -118 -331 -349 -351 -346 -337 -327 -318 -311 -305 -301
Private Non-Farm 5 -18 68 -99 -301 -312 -308 -299 -288 -277 -267 -259 -252 -246Nat Res, Mining, Util, Const 1 -4 46 -6 -57 -77 -83 -85 -83 -79 -76 -72 -69 -66
Utilities 0 0 0 0 0 0 0 0 0 0 0 0 0 0Construction 1 -4 46 -6 -57 -76 -83 -84 -83 -79 -76 -72 -69 -66
Manufacturing 0 0 0 0 -1 -1 0 0 0 0 0 0 0 1Trade 1 -4 5 -24 -67 -66 -64 -62 -60 -59 -57 -56 -55 -54
Wholesale Trade 0 0 0 -2 -4 -4 -4 -3 -3 -3 -3 -3 -3 -2Retail Trade 1 -4 5 -23 -63 -62 -60 -58 -57 -56 -54 -53 -52 -51
Transp, Inform, Fin Act 0 -1 2 -8 -19 -16 -14 -11 -8 -6 -4 -2 -1 0Transp, Warehousing 0 0 0 0 0 0 0 0 0 0 0 0 0 0
Information 0 0 0 -1 -1 -1 -1 -1 -1 -1 -1 -1 -1 -1Finance, Insurance 0 -1 1 -4 -10 -8 -7 -5 -4 -3 -3 -2 -2 -1Real Estate, Rental, Leasing 0 0 1 -3 -7 -6 -5 -4 -2 -1 0 1 1 2Services 3 -9 14 -61 -157 -153 -146 -141 -137 -134 -131 -129 -127 -127
Profess, Tech Services 0 0 2 -2 -7 -7 -6 -6 -5 -5 -4 -4 -4 -Mngmt of Co, Enter 0 0 0 0 0 0 0 0 0 0 0 0 0 0Admin, Waste Services 0 -1 3 -5 -12 -12 -11 -10 -9 -8 -8 -7 -7 -7Educational Services 0 0 0 -1 -2 -2 -2 -2 -2 -2 -2 -2 -2 -Health Care, Social Asst 0 -1 1 -8 -20 -20 -19 -19 -19 -19 -19 -20 -20 -21
Ambulatory health care services 0 0 0 -1 -4 -4 -4 -4 -4 -4 -4 -4 -5 -Hospitals 0 0 0 0 0 0 0 0 0 0 0 0 0 0Nursing, residential care facilities 0 0 0 -2 -4 -4 -4 -4 -4 -4 -4 -5 -5 -Social assistance 0 -1 1 -5 -12 -12 -12 -11 -11 -11 -11 -11 -11 -11
Arts, Enter, Rec 0 -1 1 -7 -19 -18 -17 -17 -16 -16 -16 -15 -15 -15Accom, Food Services 1 -3 3 -19 -52 -50 -47 -46 -45 -44 -43 -42 -42 -41
Accommodation 0 0 0 0 0 0 0 1 1 1 1 2 2 2Food places 1 -3 3 -19 -51 -50 -48 -47 -46 -45 -44 -44 -43 -43
Other Services (excl Gov) 1 -3 4 -17 -45 -44 -42 -41 -40 -40 -39 -38 -38 -38Public Admin 1 -13 -12 -19 -30 -37 -44 -47 -48 -50 -51 -52 -54 -55
State & Local Gov 1 0 1 -4 -15 -22 -29 -32 -33 -35 -36 -37 -39 -40State Gov 1 0 1 -2 -8 -12 -15 -16 -17 -18 -18 -19 -20 -20Local Gov 0 0 0 -2 -7 -11 -14 -16 -16 -17 -18 -18 -19 -20
Federal Civilian 0 -13 -13 -15 -15 -15 -15 -15 -15 -15 -15 -15 -15 -15Federal Military 0 0 0 0 0 0 0 0 0 0 0 0 0 0
Farm 0 0 0 0 0 0 0 0 0 0 0 0 0 0
Poquoson and York County
4
2
5
5
27
THE IMPACT OF MILITARY BASE REALIGNMENTS ON THE VIRGINIA PENESULA ECONOMY
APPENDICES CONTINUED
Appendix C: The Projected Impact of BRAC and Related Military Changes: Occupations
2007 2008 2009 2010 2011 2012 2013 2014 2015 2016 2017 2018 2019 2020
Legal secretaries 0 0 1 -3 3 2 3 3 3 3 3 3 3 3Photographers 0 0 0 -1 0 0 0 0 0 0 0 0 0 0Aircraft structure, surfaces, rigging, and systems assemblers 0 0 0 0 0 0 0 0 0 0 0 0 0 0Veterinarians 0 0 0 -1 0 0 0 0 0 0 0 0 0 0Chemical processing machine setters, operators, and tenders 0 0 0 0 0 0 0 0 0 0 0 0 0 0Chemical technicians 0 0 0 0 0 0 0 0 0 0 0 0 0 0Drafters 0 0 2 -2 0 0 0 0 0 0 0 0 0 0Geological and petroleum technicians 0 0 0 0 0 0 0 0 0 0 0 0 0 0Computer control programmers and operators 0 0 0 0 0 0 0 0 0 0 0 0 0 0Sociologists 0 0 0 0 0 0 0 0 0 0 0 0 0 0Engine and other machine assemblers 0 0 0 0 0 0 0 0 0 0 0 0 0 0Roof bolters, mining 0 0 0 0 0 0 0 0 0 0 0 0 0 0Shuttle car operators 0 0 0 0 0 0 0 0 0 0 0 0 0 0Hunters and trappers 0 0 0 0 0 0 0 0 0 0 0 0 0 0Model makers and patternmakers, metal and plastic 0 0 0 0 0 0 0 0 0 0 0 0 0 0Rock splitters, quarry 0 0 0 0 0 0 0 0 0 0 0 0 0 0Subway, streetcar operators and all other rail transportation workers 0 0 0 0 0 0 0 0 0 0 0 0 0 0Furnace, kiln, oven, drier, and kettle operators and tenders 0 0 0 0 0 0 0 0 0 0 0 0 0 0Animal breeders 0 0 0 0 0 0 0 0 0 0 0 0 0 0Nuclear technicians 0 0 0 0 0 0 0 0 0 0 0 0 0 0Railroad conductors and yardmasters 0 0 0 0 0 0 0 0 0 0 0 0 0 0Hotel, motel, and resort desk clerks 0 0 0 0 -1 0 0 0 0 0 0 0 0 0Metal furnace and kiln operators and tenders 0 0 0 0 0 0 0 0 0 0 0 0 0 0Semiconductor processors 0 0 0 0 0 0 0 0 0 0 0 0 0 0All other architects, surveyors, and cartographers 0 0 0 0 0 0 0 0 0 0 0 0 0 0All other water transportation workers 0 0 0 0 0 0 0 0 0 0 0 0 0 0Fishers and related fishing workers 0 0 0 0 0 0 0 0 0 0 0 0 0 0Multiple machine tool setters, operators, and tenders, metal and plastic 0 0 0 0 0 0 0 0 0 0 0 0 0 0All other air transportation workers 0 0 0 0 0 0 0 0 0 0 0 0 0 0Model makers and patternmakers, wood 0 0 0 0 0 0 0 0 0 0 0 0 0 0Railroad brake, signal, and switch operators 0 0 0 0 0 0 0 0 0 0 0 0 0 0Mining machine operators 0 0 0 0 0 0 0 0 0 0 0 0 0 0Locomotive engineers and operators 0 0 0 0 0 0 0 0 0 0 0 0 0 0Advertising sales agents 0 0 0 -1 0 0 0 0 0 0 0 0 0 0Derrick, rotary drill, and service unit operators, oil, gas, and mining 0 0 0 0 0 0 0 0 0 0 0 0 0 0Agricultural managers 0 0 0 0 0 0 0 0 0 0 0 0 0 0Aircraft cargo handling supervisors 0 0 0 0 0 0 0 0 0 0 0 0 0 0Miscellaneous construction and related workers 0 0 0 0 0 0 0 0 0 0 0 0 0 0Extruding, forming, pressing, and compacting machine setters, operator 0 0 0 0 0 0 0 0 0 0 0 0 0 0Tank car, truck, and ship loaders 0 0 0 0 0 0 0 0 0 0 0 0 0 0Motion picture projectionists 0 0 0 0 0 0 0 0 0 0 0 0 0 0All other printing workers 0 0 0 0 0 0 0 0 0 0 0 0 0 0Gaming managers 0 0 0 0 0 0 0 0 0 0 0 0 0 0Lodging managers 0 0 0 0 0 0 0 0 0 0 0 0 0 0Mining and geological engineers, including mining safety engineers 0 0 0 0 0 0 0 0 0 0 0 0 0 0Actuaries 0 0 0 0 0 0 0 0 0 0 0 0 0 0Rail-track laying and maintenance equipment operators 0 0 0 0 0 0 0 0 0 0 0 0 0 0Agricultural and food science technicians 0 0 0 0 0 0 0 0 0 0 0 0 0 0All other woodworkers 0 0 0 0 0 0 0 0 0 0 0 0 0 0Pumping station operators 0 0 0 0 0 0 0 0 0 0 0 0 0 0Extraction workers, all other 0 0 0 0 0 0 0 0 0 0 0 0 0 0Biomedical engineers 0 0 0 0 0 0 0 0 0 0 0 0 0 0Logging workers 0 0 0 0 0 0 0 0 0 0 0 0 0 0Traffic technicians 0 0 0 0 0 0 0 0 0 0 0 0 0 0Forest and conservation workers 0 0 0 0 0 0 0 0 0 0 0 0 0 0Hoist and winch operators 0 0 0 0 0 0 0 0 0 0 0 0 0 0Shoe and leather workers 0 0 0 0 0 0 0 0 0 0 0 0 0 0Petroleum engineers 0 0 0 0 0 0 0 0 0 0 0 0 0 0Tool and die makers 0 0 0 0 0 0 0 0 0 0 0 0 0 0Ambulance drivers and attendants, except emergency medical technicia 0 0 0 0 0 0 0 0 0 0 0 0 0 0
Seven Virginia Peninsula Communities
28
THE IMPACT OF MILITARY BASE REALIGNMENTS ON THE VIRGINIA PENESULA ECONOMY
APPENDICES CONTINUED
Appendix C: The Projected Impact of BRAC and Related Military Changes: Occupations
2007 2008 2009 2010 2011 2012 2013 2014 2015 2016 2017 2018 2019 2020
Architects, except naval 0 0 1 -2 0 0 0 0 0 0 0 0 0 0Desktop publishers 0 0 0 0 0 0 0 0 0 0 0 0 0Emergency management specialists 0 0 0 0 0 0 0 0 0 0 0 0 0 0Agricultural engineers 0 0 0 0 0 0 0 0 0 0 0 0 0 0Telephone operators 0 0 0 0 0 0 0 0 0 0 0 0 0 0Fish and game wardens 0 0 0 0 0 0 0 0 0 0 0 0 0Interviewers, except eligibility and loan 0 0 0 -2 0 0 0 0 0 0 0 0 0 0Miscelaneous health technologists and technicians 0 0 0 0 0 0 0 0 0 0 0 0 0 0Insurance sales agents 0 0 0 -1 -1 -1 -1 -1 0 0 0 0 0 0Animal control workers 0 0 0 0 0 0 0 0 0 0 0 0 0 0Parking enforcement workers 0 0 0 0 0 0 0 0 0 0 0 0 0 0Brokerage clerks 0 0 0 0 -1 -1 0 0 0 0 0 0 0 0Animal trainers 0 0 0 0 0 0 0 0 0 0 0 0 0Audio-visual collections specialists 0 0 0 0 0 0 0 0 0 0 0 0 0 0Chiropractors 0 0 0 0 0 0 0 0 0 0 0 0 0Agents and business managers of artists, performers, and athletes 0 0 0 0 0 0 0 0 0 0 0 0 0 0All other farming, fishing, and forestry workers 0 0 0 0 0 0 0 0 0 0 0 0 0 0Fire inspectors 0 0 0 0 0 0 0 0 0 0 0 0 0Surveyors, cartographers, and photogrammetrists 0 0 0 -1 0 0 0 0 0 0 0 0 0 0Miscellaneous mathematical science occupations 0 0 0 0 0 0 0 0 0 0 0 0 0 0Cutting workers 0 0 0 0 0 0 0 0 0 0 0 0 0Molders and molding machine setters, operators, and tenders, metal a
0
0
0
0
0
0n 0 0 0 0 0 0 0 0 0 0 0 0 0 0
Farm and home management advisors 0 0 0 0 0 0 0 0 0 0 0 0 0 0Proofreaders and copy markers 0 0 0 0 0 0 0 0 0 0 0 0 0 0Furniture finishers 0 0 0 0 0 0 0 0 0 0 0 0 0Cargo and freight agents 0 0 0 0 0 0 0 0 0 0 0 0 0 0Woodworking machine setters, operators, and tenders 0 0 0 0 0 0 0 0 0 0 0 0 0 0Podiatrists 0 0 0 0 0 0 0 0 0 0 0 0 0 0All other life scientists 0 0 0 0 0 0 0 0 0 0 0 0 0 0Embalmers 0 0 0 0 0 0 0 0 0 0 0 0 0Supervisors, farming, fishing, and forestry workers 0 0 0 0 0 0 0 0 0 0 0 0 0 0Graders and sorters, agricultural products 0 0 0 0 0 0 0 0 0 0 0 0 0 0Occupational therapist assistants and aides 0 0 0 0 0 0 0 0 0 0 0 0 0 0Roustabouts, oil and gas 0 0 1 0 0 0 0 0 0 0 0 0 0 0All other material recording, scheduling, dispatching, and distributing 0 0 0 0 0 0 0 0 0 0 0 0 0 0Door-to-door sales workers, news and street vendors, and related work
0
0
e 0 0 0 0 0 0 0 0 0 0 0 0 0 0Baggage porters, bellhops, and concierges 0 0 0 0 -1 -1 -1 0 0 0 0 0 0 0All other food processing workers 0 0 0 0 0 0 0 0 0 0 0 0 0 0Helpers—Extraction workers 0 0 1 0 0 0 0 0 0 0 0 0 0 0Miscelaneous health practitioners and technical workers 0 0 0 0 0 0 0 0 0 0 0 0 0 0Marine engineers and naval architects 0 0 0 0 0 0 0 0 0 0 0 0 0 0Transportation attendants 0 0 0 0 0 0 0 0 0 0 0 0 0 0All other electrical and electronic equipment mechanics, installers, and 0 0 0 0 0 0 0 0 0 0 0 0 0 0Conveyor operators and tenders 0 0 0 0 0 0 0 0 0 0 0 0 0 0Gaming cage workers 0 0 0 0 0 0 0 0 0 0 0 0 0Ship engineers 0 0 0 0 0 0 0 0 0 0 0 0 0Industrial production managers 0 0 0 0 -1 -1 -1 -1 -1 0 0 0 0 0News analysts, reporters and correspondents 0 0 0 0 0 0 0 0 0 0 0 0 0 0Textile machine setters, operators, and tenders 0 0 0 0 -1 -1 -1 -1 -1 0 0 0 0 0Computer and information scientists, research 0 0 0 -1 0 0 0 0 0 0 0 0 0 0Crushing, grinding, polishing, mixing, and blending workers 0 0 1 0 -1 -1 -1 -1 -1 -1 0 0 0 0All other vehicle and mobile equipment mechanics, installers, and repai
00
r 0 0 0 0 0 0 0 0 0 0 0 0 0 0Correspondence clerks 0 0 0 0 -1 0 0 0 0 0 0 0 0 0Jewelers and precious stone and metal workers 0 0 0 0 0 0 0 0 0 0 0 0 0 0Surveying and mapping technicians 0 0 0 -1 0 0 0 0 0 0 0 0 0 0Mathematicians 0 0 0 0 0 0 0 0 0 0 0 0 0 0All other communications equipment operators 0 0 0 0 -1 -1 -1 -1 -1 -1 -1 -1 -1 0Chemical engineers 0 0 0 0 -1 -1 -1 -1 -1 -1 -1 -1 -1 -1New accounts clerks 0 0 0 0 -1 -1 -1 -1 -1 -1 -1 -1 -1 -1Materials engineers 0 0 0 0 -1 -1 -1 -1 -1 -1 -1 -1 -1 -
Seven Virginia Peninsula Communities
1
29
THE IMPACT OF MILITARY BASE REALIGNMENTS ON THE VIRGINIA PENESULA ECONOMY
APPENDICES CONTINUED
Appendix C: The Projected Impact of BRAC and Related Military Changes: Occupations
2007 2008 2009 2010 2011 2012 2013 2014 2015 2016 2017 2018 2019 2020
Miscellaneous food processing workers 0 0 0 0 -1 -1 -1 -1 -1 -1 -1 -1 -1 -1Electrical, electronics, and electromechanical assemblers 0 0 0 -1 -1 -1 -1 -1 -1 -1 -1 -1 -1 -1All other gaming service workers 0 0 0 0 -1 -1 -1 -1 -1 -1 -1 -1 -1 -Bookbinders and bindery workers 0 0 0 0 -1 -1 -1 -1 -1 -1 -1 -1 -1 -1Optometrists 0 0 0 0 0 0 0 0 -1 -1 -1 -1 -1 -Earth drillers, except oil and gas 0 0 1 0 0 -1 -1 -1 -1 -1 -1 -1 -1 -1Forming machine setters, operators, and tenders, metal and plastic 0 0 0 0 -1 -1 -1 -1 -1 -1 -1 -1 -1 -1Sales engineers 0 0 0 -1 -1 -1 -1 -1 -1 -1 -1 -1 -1 -1Explosives workers, ordnance handling experts, and blasters 0 0 0 0 -1 -1 -1 -1 -1 -1 -1 -1 -1 -1Announcers 0 0 0 0 -1 -1 -1 -1 -1 -1 -1 -1 -1 -Urban and regional planners 0 0 0 0 0 0 -1 -1 -1 -1 -1 -1 -1 -1Artists and related workers 0 0 0 -1 -1 -1 -1 -1 -1 -1 -1 -1 -1 -1Statistical assistants 0 0 0 0 -1 -1 -1 -1 -1 -1 -1 -1 -1 -Bridge and lock tenders 0 0 0 0 -1 -1 -1 -1 -1 -1 -1 -1 -1 -1Ship and boat captains and operators 0 0 0 0 -1 -1 -1 -1 -1 -1 -1 -1 -1 -1Cabinetmakers and bench carpenters 0 0 1 0 -1 -1 -1 -1 -1 -1 -1 -1 -1 -1First-line supervisors/managers of gaming workers 0 0 0 0 -1 -1 -1 -1 -1 -1 -1 -1 -1 -1Meeting and convention planners 0 0 0 0 -1 -1 -1 -1 -1 -1 -1 -1 -1 -1Machine tool cutting setters, operators, and tenders, metal and plastic 0 0 1 -1 -1 -1 -1 -1 -1 -1 -1 -1 -1 -1Meter readers, utilities 0 0 0 0 -1 -1 -1 -1 -1 -1 -1 -1 -1 -1Private detectives and investigators 0 0 0 0 -1 -1 -1 -1 -1 -1 -1 -1 -1 -1All other entertainers and performers, sports and related workers 0 0 0 0 -1 -1 -1 -1 -1 -1 -1 -1 -1 -1Television, video, and motion picture camera operators and editors 0 0 0 0 -1 -1 -1 -1 -1 -1 -1 -1 -1 -1Insurance claims and policy processing clerks 0 0 0 -1 -1 -1 -1 -1 -1 -1 -1 -1 -1 -1Securities, commodities, and financial services sales agents 0 0 0 -1 -2 -2 -2 -1 -1 -1 -1 -1 -1 -1Sailors and marine oilers 0 0 0 0 -1 -1 -1 -1 -1 -1 -1 -1 -1 -1Claims adjusters, appraisers, examiners, and investigators 0 0 0 -1 -1 -1 -1 -1 -1 -1 -1 -1 -1 -1Credit authorizers, checkers, and clerks 0 0 0 0 -1 -1 -1 -1 -1 -1 -1 -1 -1 -1Paralegals and legal assistants 0 0 1 -4 -1 -1 -1 -1 -1 -1 -1 -1 -1 -1Structural metal fabricators and fitters 0 0 1 0 -1 -1 -1 -1 -1 -1 -1 -1 -1 -1Massage therapists 0 0 0 0 -1 -1 -1 -1 -1 -1 -1 -1 -1 -Medical, dental, and ophthalmic laboratory technicians 0 0 0 0 -1 -1 -1 -1 -1 -1 -1 -1 -1 -1Fence erectors 0 0 2 0 -1 -1 -1 -1 -1 -1 -1 -1 -1 -1Construction and building inspectors 0 0 0 -1 -1 -1 -1 -1 -1 -1 -1 -1 -1 -1Dancers and choreographers 0 0 0 0 -1 -1 -1 -1 -1 -1 -1 -1 -1 -1Elevator installers and repairers 0 0 2 0 -1 -1 -1 -1 -1 -1 -1 -1 -1 -1Funeral directors 0 0 0 0 -1 -1 -1 -1 -1 -1 -1 -1 -1 -1Credit analysts 0 0 0 -1 -1 -1 -1 -1 -1 -1 -1 -1 -1 -1Tailors, dressmakers, and sewers 0 0 0 -1 -1 -1 -1 -1 -1 -1 -1 -1 -1 -1Boilermakers 0 0 1 0 -1 -1 -1 -1 -1 -1 -1 -1 -1 -Septic tank servicers and sewer pipe cleaners 0 0 0 0 -1 -1 -1 -1 -1 -1 -1 -1 -1 -1Loan interviewers and clerks 0 0 0 -1 -1 -1 -1 -1 -1 -1 -1 -1 -1 -1Crane and tower operators 0 0 1 0 -1 -1 -1 -1 -1 -1 -1 -1 -1 -1All other related transportation workers 0 0 0 -1 -1 -1 -1 -1 -1 -1 -1 -1 -1 -1Home appliance repairers 0 0 0 0 -1 -1 -1 -1 -1 -1 -1 -1 -1 -1Material moving workers, all other 0 0 0 -1 -1 -1 -1 -1 -1 -1 -1 -1 -1 -Appraisers and assessors of real estate 0 0 0 -1 -1 -1 -1 -1 -1 -1 -1 -1 -1 -1Advertising and promotions managers 0 0 0 -1 -1 -1 -1 -1 -1 -1 -1 -1 -1 -1Power plant operators, distributors, and dispatchers 0 0 0 -1 -1 -1 -1 -1 -1 -1 -1 -1 -1 -1Travel agents 0 0 0 -1 -2 -1 -1 -1 -1 -1 -1 -1 -1 -1Stationary engineers and boiler operators 0 0 0 -1 -1 -1 -1 -1 -1 -1 -1 -1 -1 -1Medical scientists 0 0 0 -1 -1 -1 -1 -1 -1 -1 -1 -1 -1 -Weighers, measurers, checkers, and samplers, recordkeeping 0 0 0 -1 -1 -1 -1 -1 -1 -1 -1 -1 -1 -1All other health diagnosing and treating practitioners 0 0 0 0 -1 -1 -1 -1 -1 -1 -1 -1 -1 -1All other art and design workers 0 0 0 -1 -1 -1 -1 -1 -1 -1 -1 -1 -1 -1Models, demonstrators, and product promoters 0 0 0 -1 -1 -1 -1 -1 -1 -1 -1 -1 -1 -1Funeral attendants 0 0 0 0 -1 -1 -1 -1 -1 -1 -1 -1 -1 -1Pest control workers 0 0 0 -1 -1 -1 -1 -1 -1 -1 -1 -1 -1 -1Tour and travel guides 0 0 0 -1 -1 -1 -1 -1 -1 -1 -1 -1 -1 -1Residential advisors 0 0 0 0 -1 -1 -1 -1 -1 -1 -1 -1 -1 -1
Seven Virginia Peninsula Communities
1
1
1
1
1
1
1
1
30
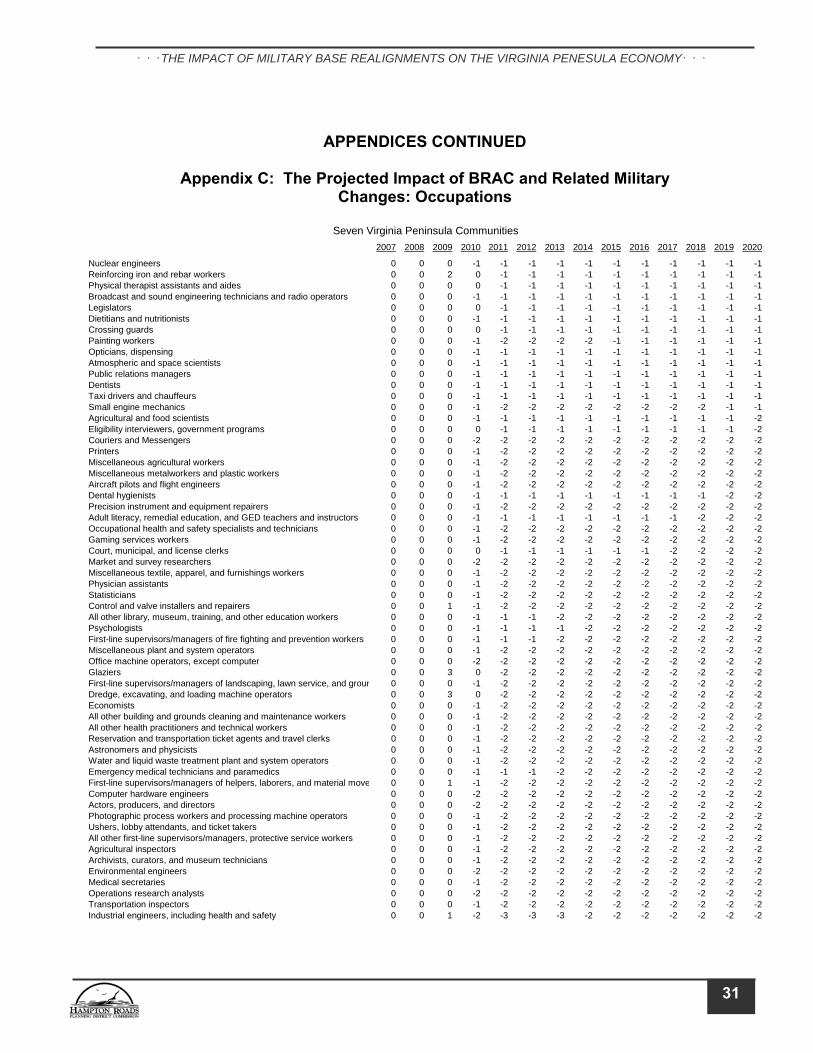
THE IMPACT OF MILITARY BASE REALIGNMENTS ON THE VIRGINIA PENESULA ECONOMY
APPENDICES CONTINUED
Appendix C: The Projected Impact of BRAC and Related Military Changes: Occupations
2007 2008 2009 2010 2011 2012 2013 2014 2015 2016 2017 2018 2019 2020
Nuclear engineers 0 0 0 -1 -1 -1 -1 -1 -1 -1 -1 -1 -1 -1Reinforcing iron and rebar workers 0 0 2 0 -1 -1 -1 -1 -1 -1 -1 -1 -1 -1Physical therapist assistants and aides 0 0 0 0 -1 -1 -1 -1 -1 -1 -1 -1 -1 -1Broadcast and sound engineering technicians and radio operators 0 0 0 -1 -1 -1 -1 -1 -1 -1 -1 -1 -1 -1Legislators 0 0 0 0 -1 -1 -1 -1 -1 -1 -1 -1 -1 -1Dietitians and nutritionists 0 0 0 -1 -1 -1 -1 -1 -1 -1 -1 -1 -1 -1Crossing guards 0 0 0 0 -1 -1 -1 -1 -1 -1 -1 -1 -1 -Painting workers 0 0 0 -1 -2 -2 -2 -2 -1 -1 -1 -1 -1 -1Opticians, dispensing 0 0 0 -1 -1 -1 -1 -1 -1 -1 -1 -1 -1 -1Atmospheric and space scientists 0 0 0 -1 -1 -1 -1 -1 -1 -1 -1 -1 -1 -1Public relations managers 0 0 0 -1 -1 -1 -1 -1 -1 -1 -1 -1 -1 -1Dentists 0 0 0 -1 -1 -1 -1 -1 -1 -1 -1 -1 -1 -Taxi drivers and chauffeurs 0 0 0 -1 -1 -1 -1 -1 -1 -1 -1 -1 -1 -1Small engine mechanics 0 0 0 -1 -2 -2 -2 -2 -2 -2 -2 -2 -1 -1Agricultural and food scientists 0 0 0 -1 -1 -1 -1 -1 -1 -1 -1 -1 -1 -2Eligibility interviewers, government programs 0 0 0 0 -1 -1 -1 -1 -1 -1 -1 -1 -1 -2Couriers and Messengers 0 0 0 -2 -2 -2 -2 -2 -2 -2 -2 -2 -2 -2Printers 0 0 0 -1 -2 -2 -2 -2 -2 -2 -2 -2 -2 -Miscellaneous agricultural workers 0 0 0 -1 -2 -2 -2 -2 -2 -2 -2 -2 -2 -2Miscellaneous metalworkers and plastic workers 0 0 0 -1 -2 -2 -2 -2 -2 -2 -2 -2 -2 -2Aircraft pilots and flight engineers 0 0 0 -1 -2 -2 -2 -2 -2 -2 -2 -2 -2 -2Dental hygienists 0 0 0 -1 -1 -1 -1 -1 -1 -1 -1 -1 -2 -Precision instrument and equipment repairers 0 0 0 -1 -2 -2 -2 -2 -2 -2 -2 -2 -2 -2Adult literacy, remedial education, and GED teachers and instructors 0 0 0 -1 -1 -1 -1 -1 -1 -1 -1 -2 -2 -2Occupational health and safety specialists and technicians 0 0 0 -1 -2 -2 -2 -2 -2 -2 -2 -2 -2 -2Gaming services workers 0 0 0 -1 -2 -2 -2 -2 -2 -2 -2 -2 -2 -2Court, municipal, and license clerks 0 0 0 0 -1 -1 -1 -1 -1 -1 -2 -2 -2 -2Market and survey researchers 0 0 0 -2 -2 -2 -2 -2 -2 -2 -2 -2 -2 -2Miscellaneous textile, apparel, and furnishings workers 0 0 0 -1 -2 -2 -2 -2 -2 -2 -2 -2 -2 -2Physician assistants 0 0 0 -1 -2 -2 -2 -2 -2 -2 -2 -2 -2 -Statisticians 0 0 0 -1 -2 -2 -2 -2 -2 -2 -2 -2 -2 -Control and valve installers and repairers 0 0 1 -1 -2 -2 -2 -2 -2 -2 -2 -2 -2 -2All other library, museum, training, and other education workers 0 0 0 -1 -1 -1 -2 -2 -2 -2 -2 -2 -2 -2Psychologists 0 0 0 -1 -1 -1 -1 -2 -2 -2 -2 -2 -2 -2First-line supervisors/managers of fire fighting and prevention workers 0 0 0 -1 -1 -1 -2 -2 -2 -2 -2 -2 -2 -2Miscellaneous plant and system operators 0 0 0 -1 -2 -2 -2 -2 -2 -2 -2 -2 -2 -2Office machine operators, except computer 0 0 0 -2 -2 -2 -2 -2 -2 -2 -2 -2 -2 -Glaziers 0 0 3 0 -2 -2 -2 -2 -2 -2 -2 -2 -2 -2First-line supervisors/managers of landscaping, lawn service, and grou
1
1
2
2
22
2
n 0 0 0 -1 -2 -2 -2 -2 -2 -2 -2 -2 -2 -Dredge, excavating, and loading machine operators 0 0 3 0 -2 -2 -2 -2 -2 -2 -2 -2 -2 -2Economists 0 0 0 -1 -2 -2 -2 -2 -2 -2 -2 -2 -2 -2All other building and grounds cleaning and maintenance workers 0 0 0 -1 -2 -2 -2 -2 -2 -2 -2 -2 -2 -2All other health practitioners and technical workers 0 0 0 -1 -2 -2 -2 -2 -2 -2 -2 -2 -2 -2Reservation and transportation ticket agents and travel clerks 0 0 0 -1 -2 -2 -2 -2 -2 -2 -2 -2 -2 -2Astronomers and physicists 0 0 0 -1 -2 -2 -2 -2 -2 -2 -2 -2 -2 -2Water and liquid waste treatment plant and system operators 0 0 0 -1 -2 -2 -2 -2 -2 -2 -2 -2 -2 -2Emergency medical technicians and paramedics 0 0 0 -1 -1 -1 -2 -2 -2 -2 -2 -2 -2 -2First-line supervisors/managers of helpers, laborers, and material mov
2
e 0 0 1 -1 -2 -2 -2 -2 -2 -2 -2 -2 -2 -Computer hardware engineers 0 0 0 -2 -2 -2 -2 -2 -2 -2 -2 -2 -2 -Actors, producers, and directors 0 0 0 -2 -2 -2 -2 -2 -2 -2 -2 -2 -2 -2Photographic process workers and processing machine operators 0 0 0 -1 -2 -2 -2 -2 -2 -2 -2 -2 -2 -2Ushers, lobby attendants, and ticket takers 0 0 0 -1 -2 -2 -2 -2 -2 -2 -2 -2 -2 -2All other first-line supervisors/managers, protective service workers 0 0 0 -1 -2 -2 -2 -2 -2 -2 -2 -2 -2 -2Agricultural inspectors 0 0 0 -1 -2 -2 -2 -2 -2 -2 -2 -2 -2 -Archivists, curators, and museum technicians 0 0 0 -1 -2 -2 -2 -2 -2 -2 -2 -2 -2 -2Environmental engineers 0 0 0 -2 -2 -2 -2 -2 -2 -2 -2 -2 -2 -2Medical secretaries 0 0 0 -1 -2 -2 -2 -2 -2 -2 -2 -2 -2 -2Operations research analysts 0 0 0 -2 -2 -2 -2 -2 -2 -2 -2 -2 -2 -2Transportation inspectors 0 0 0 -1 -2 -2 -2 -2 -2 -2 -2 -2 -2 -Industrial engineers, including health and safety 0 0 1 -2 -3 -3 -3 -2 -2 -2 -2 -2 -2 -2
Seven Virginia Peninsula Communities
22
2
2
31
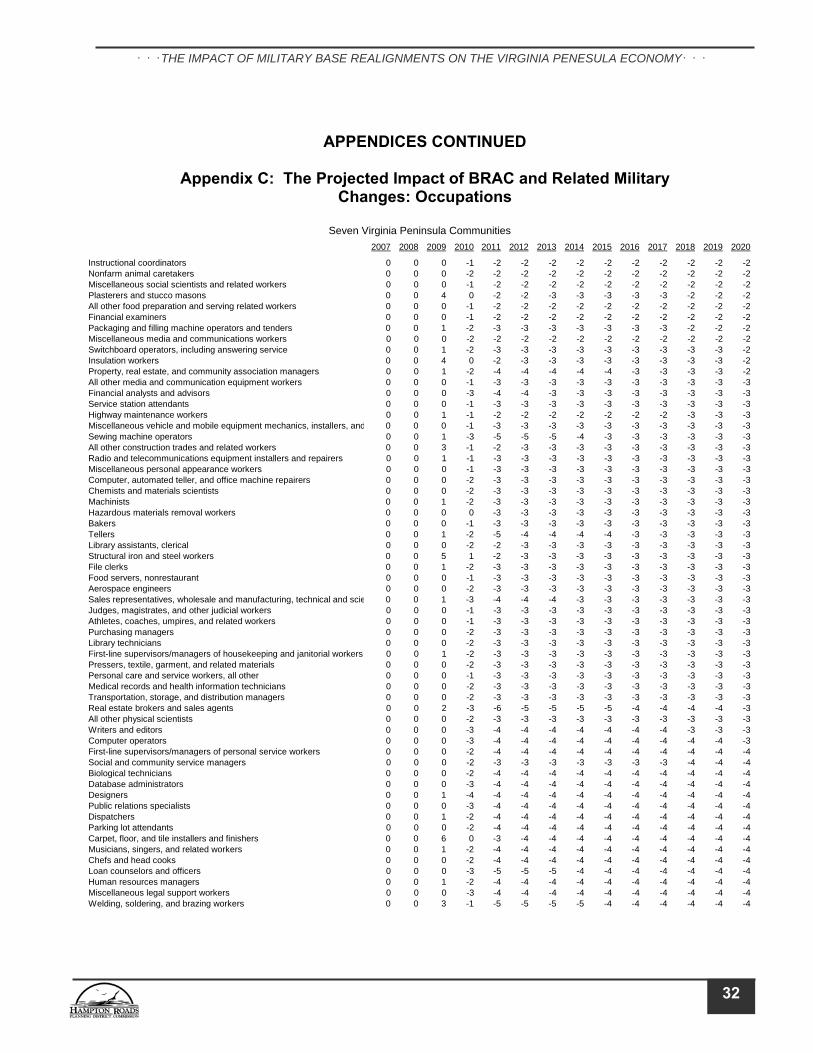
THE IMPACT OF MILITARY BASE REALIGNMENTS ON THE VIRGINIA PENESULA ECONOMY
APPENDICES CONTINUED
Appendix C: The Projected Impact of BRAC and Related Military Changes: Occupations
2007 2008 2009 2010 2011 2012 2013 2014 2015 2016 2017 2018 2019 2020
Instructional coordinators 0 0 0 -1 -2 -2 -2 -2 -2 -2 -2 -2 -2 -2Nonfarm animal caretakers 0 0 0 -2 -2 -2 -2 -2 -2 -2 -2 -2 -2 -2Miscellaneous social scientists and related workers 0 0 0 -1 -2 -2 -2 -2 -2 -2 -2 -2 -2 -2Plasterers and stucco masons 0 0 4 0 -2 -2 -3 -3 -3 -3 -3 -2 -2 -2All other food preparation and serving related workers 0 0 0 -1 -2 -2 -2 -2 -2 -2 -2 -2 -2 -2Financial examiners 0 0 0 -1 -2 -2 -2 -2 -2 -2 -2 -2 -2 -2Packaging and filling machine operators and tenders 0 0 1 -2 -3 -3 -3 -3 -3 -3 -3 -2 -2 -2Miscellaneous media and communications workers 0 0 0 -2 -2 -2 -2 -2 -2 -2 -2 -2 -2 -2Switchboard operators, including answering service 0 0 1 -2 -3 -3 -3 -3 -3 -3 -3 -3 -3 -2Insulation workers 0 0 4 0 -2 -3 -3 -3 -3 -3 -3 -3 -3 -Property, real estate, and community association managers 0 0 1 -2 -4 -4 -4 -4 -4 -3 -3 -3 -3 -2All other media and communication equipment workers 0 0 0 -1 -3 -3 -3 -3 -3 -3 -3 -3 -3 -3Financial analysts and advisors 0 0 0 -3 -4 -4 -3 -3 -3 -3 -3 -3 -3 -3Service station attendants 0 0 0 -1 -3 -3 -3 -3 -3 -3 -3 -3 -3 -3Highway maintenance workers 0 0 1 -1 -2 -2 -2 -2 -2 -2 -2 -3 -3 -3Miscellaneous vehicle and mobile equipment mechanics, installers, an
2
d 0 0 0 -1 -3 -3 -3 -3 -3 -3 -3 -3 -3 -3Sewing machine operators 0 0 1 -3 -5 -5 -5 -4 -3 -3 -3 -3 -3 -3All other construction trades and related workers 0 0 3 -1 -2 -3 -3 -3 -3 -3 -3 -3 -3 -3Radio and telecommunications equipment installers and repairers 0 0 1 -1 -3 -3 -3 -3 -3 -3 -3 -3 -3 -3Miscellaneous personal appearance workers 0 0 0 -1 -3 -3 -3 -3 -3 -3 -3 -3 -3 -3Computer, automated teller, and office machine repairers 0 0 0 -2 -3 -3 -3 -3 -3 -3 -3 -3 -3 -3Chemists and materials scientists 0 0 0 -2 -3 -3 -3 -3 -3 -3 -3 -3 -3 -3Machinists 0 0 1 -2 -3 -3 -3 -3 -3 -3 -3 -3 -3 -3Hazardous materials removal workers 0 0 0 0 -3 -3 -3 -3 -3 -3 -3 -3 -3 -3Bakers 0 0 0 -1 -3 -3 -3 -3 -3 -3 -3 -3 -3 -3Tellers 0 0 1 -2 -5 -4 -4 -4 -4 -3 -3 -3 -3 -3Library assistants, clerical 0 0 0 -2 -2 -3 -3 -3 -3 -3 -3 -3 -3 -3Structural iron and steel workers 0 0 5 1 -2 -3 -3 -3 -3 -3 -3 -3 -3 -3File clerks 0 0 1 -2 -3 -3 -3 -3 -3 -3 -3 -3 -3 -3Food servers, nonrestaurant 0 0 0 -1 -3 -3 -3 -3 -3 -3 -3 -3 -3 -3Aerospace engineers 0 0 0 -2 -3 -3 -3 -3 -3 -3 -3 -3 -3 -3Sales representatives, wholesale and manufacturing, technical and scie 0 0 1 -3 -4 -4 -4 -3 -3 -3 -3 -3 -3 -3Judges, magistrates, and other judicial workers 0 0 0 -1 -3 -3 -3 -3 -3 -3 -3 -3 -3 -3Athletes, coaches, umpires, and related workers 0 0 0 -1 -3 -3 -3 -3 -3 -3 -3 -3 -3 -3Purchasing managers 0 0 0 -2 -3 -3 -3 -3 -3 -3 -3 -3 -3 -3Library technicians 0 0 0 -2 -3 -3 -3 -3 -3 -3 -3 -3 -3 -3First-line supervisors/managers of housekeeping and janitorial workers 0 0 1 -2 -3 -3 -3 -3 -3 -3 -3 -3 -3 -3Pressers, textile, garment, and related materials 0 0 0 -2 -3 -3 -3 -3 -3 -3 -3 -3 -3 -3Personal care and service workers, all other 0 0 0 -1 -3 -3 -3 -3 -3 -3 -3 -3 -3 -3Medical records and health information technicians 0 0 0 -2 -3 -3 -3 -3 -3 -3 -3 -3 -3 -3Transportation, storage, and distribution managers 0 0 0 -2 -3 -3 -3 -3 -3 -3 -3 -3 -3 -3Real estate brokers and sales agents 0 0 2 -3 -6 -5 -5 -5 -5 -4 -4 -4 -4 -3All other physical scientists 0 0 0 -2 -3 -3 -3 -3 -3 -3 -3 -3 -3 -3Writers and editors 0 0 0 -3 -4 -4 -4 -4 -4 -4 -4 -3 -3 -3Computer operators 0 0 0 -3 -4 -4 -4 -4 -4 -4 -4 -4 -4 -3First-line supervisors/managers of personal service workers 0 0 0 -2 -4 -4 -4 -4 -4 -4 -4 -4 -4 -4Social and community service managers 0 0 0 -2 -3 -3 -3 -3 -3 -3 -3 -4 -4 -4Biological technicians 0 0 0 -2 -4 -4 -4 -4 -4 -4 -4 -4 -4 -4Database administrators 0 0 0 -3 -4 -4 -4 -4 -4 -4 -4 -4 -4 -4Designers 0 0 1 -4 -4 -4 -4 -4 -4 -4 -4 -4 -4 -4Public relations specialists 0 0 0 -3 -4 -4 -4 -4 -4 -4 -4 -4 -4 -4Dispatchers 0 0 1 -2 -4 -4 -4 -4 -4 -4 -4 -4 -4 -4Parking lot attendants 0 0 0 -2 -4 -4 -4 -4 -4 -4 -4 -4 -4 -4Carpet, floor, and tile installers and finishers 0 0 6 0 -3 -4 -4 -4 -4 -4 -4 -4 -4 -4Musicians, singers, and related workers 0 0 1 -2 -4 -4 -4 -4 -4 -4 -4 -4 -4 -4Chefs and head cooks 0 0 0 -2 -4 -4 -4 -4 -4 -4 -4 -4 -4 -4Loan counselors and officers 0 0 0 -3 -5 -5 -5 -4 -4 -4 -4 -4 -4 -4Human resources managers 0 0 1 -2 -4 -4 -4 -4 -4 -4 -4 -4 -4 -4Miscellaneous legal support workers 0 0 0 -3 -4 -4 -4 -4 -4 -4 -4 -4 -4 -4Welding, soldering, and brazing workers 0 0 3 -1 -5 -5 -5 -5 -4 -4 -4 -4 -4 -4
Seven Virginia Peninsula Communities
32
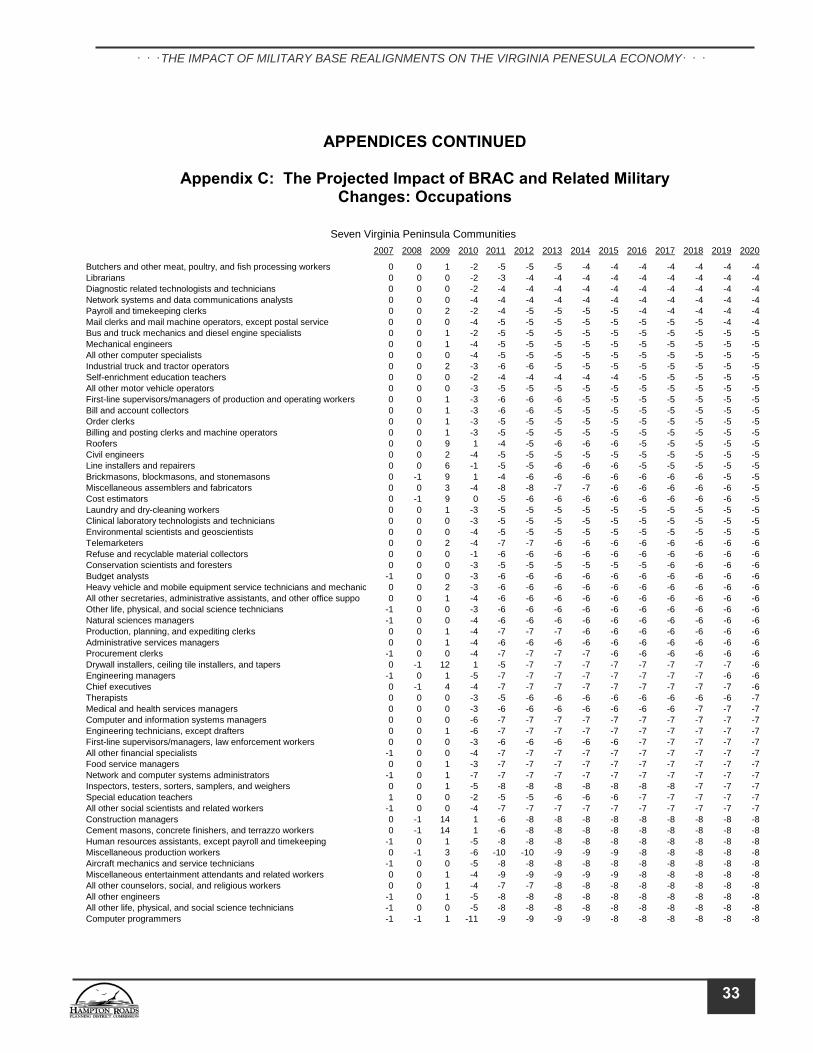
THE IMPACT OF MILITARY BASE REALIGNMENTS ON THE VIRGINIA PENESULA ECONOMY
APPENDICES CONTINUED
Appendix C: The Projected Impact of BRAC and Related Military Changes: Occupations
2007 2008 2009 2010 2011 2012 2013 2014 2015 2016 2017 2018 2019 2020
Butchers and other meat, poultry, and fish processing workers 0 0 1 -2 -5 -5 -5 -4 -4 -4 -4 -4 -4 -4Librarians 0 0 0 -2 -3 -4 -4 -4 -4 -4 -4 -4 -4 -Diagnostic related technologists and technicians 0 0 0 -2 -4 -4 -4 -4 -4 -4 -4 -4 -4 -4Network systems and data communications analysts 0 0 0 -4 -4 -4 -4 -4 -4 -4 -4 -4 -4 -4Payroll and timekeeping clerks 0 0 2 -2 -4 -5 -5 -5 -5 -4 -4 -4 -4 -4Mail clerks and mail machine operators, except postal service 0 0 0 -4 -5 -5 -5 -5 -5 -5 -5 -5 -4 -4Bus and truck mechanics and diesel engine specialists 0 0 1 -2 -5 -5 -5 -5 -5 -5 -5 -5 -5 -5Mechanical engineers 0 0 1 -4 -5 -5 -5 -5 -5 -5 -5 -5 -5 -5All other computer specialists 0 0 0 -4 -5 -5 -5 -5 -5 -5 -5 -5 -5 -Industrial truck and tractor operators 0 0 2 -3 -6 -6 -5 -5 -5 -5 -5 -5 -5 -5Self-enrichment education teachers 0 0 0 -2 -4 -4 -4 -4 -4 -5 -5 -5 -5 -All other motor vehicle operators 0 0 0 -3 -5 -5 -5 -5 -5 -5 -5 -5 -5 -5First-line supervisors/managers of production and operating workers 0 0 1 -3 -6 -6 -6 -5 -5 -5 -5 -5 -5 -5Bill and account collectors 0 0 1 -3 -6 -6 -5 -5 -5 -5 -5 -5 -5 -5Order clerks 0 0 1 -3 -5 -5 -5 -5 -5 -5 -5 -5 -5 -Billing and posting clerks and machine operators 0 0 1 -3 -5 -5 -5 -5 -5 -5 -5 -5 -5 -5Roofers 0 0 9 1 -4 -5 -6 -6 -6 -5 -5 -5 -5 -Civil engineers 0 0 2 -4 -5 -5 -5 -5 -5 -5 -5 -5 -5 -5Line installers and repairers 0 0 6 -1 -5 -5 -6 -6 -6 -5 -5 -5 -5 -5Brickmasons, blockmasons, and stonemasons 0 -1 9 1 -4 -6 -6 -6 -6 -6 -6 -6 -5 -5Miscellaneous assemblers and fabricators 0 0 3 -4 -8 -8 -7 -7 -6 -6 -6 -6 -6 -5Cost estimators 0 -1 9 0 -5 -6 -6 -6 -6 -6 -6 -6 -6 -Laundry and dry-cleaning workers 0 0 1 -3 -5 -5 -5 -5 -5 -5 -5 -5 -5 -5Clinical laboratory technologists and technicians 0 0 0 -3 -5 -5 -5 -5 -5 -5 -5 -5 -5 -5Environmental scientists and geoscientists 0 0 0 -4 -5 -5 -5 -5 -5 -5 -5 -5 -5 -5Telemarketers 0 0 2 -4 -7 -7 -6 -6 -6 -6 -6 -6 -6 -6Refuse and recyclable material collectors 0 0 0 -1 -6 -6 -6 -6 -6 -6 -6 -6 -6 -Conservation scientists and foresters 0 0 0 -3 -5 -5 -5 -5 -5 -5 -6 -6 -6 -6Budget analysts -1 0 0 -3 -6 -6 -6 -6 -6 -6 -6 -6 -6 -6Heavy vehicle and mobile equipment service technicians and mechani
4
5
5
5
5
5
6
c 0 0 2 -3 -6 -6 -6 -6 -6 -6 -6 -6 -6 -All other secretaries, administrative assistants, and other office suppo 0 0 1 -4 -6 -6 -6 -6 -6 -6 -6 -6 -6 -6Other life, physical, and social science technicians -1 0 0 -3 -6 -6 -6 -6 -6 -6 -6 -6 -6 -6Natural sciences managers -1 0 0 -4 -6 -6 -6 -6 -6 -6 -6 -6 -6 -6Production, planning, and expediting clerks 0 0 1 -4 -7 -7 -7 -6 -6 -6 -6 -6 -6 -6Administrative services managers 0 0 1 -4 -6 -6 -6 -6 -6 -6 -6 -6 -6 -6Procurement clerks -1 0 0 -4 -7 -7 -7 -7 -6 -6 -6 -6 -6 -6Drywall installers, ceiling tile installers, and tapers 0 -1 12 1 -5 -7 -7 -7 -7 -7 -7 -7 -7 -6Engineering managers -1 0 1 -5 -7 -7 -7 -7 -7 -7 -7 -7 -6 -6Chief executives 0 -1 4 -4 -7 -7 -7 -7 -7 -7 -7 -7 -7 -6Therapists 0 0 0 -3 -5 -6 -6 -6 -6 -6 -6 -6 -6 -7Medical and health services managers 0 0 0 -3 -6 -6 -6 -6 -6 -6 -6 -7 -7 -7Computer and information systems managers 0 0 0 -6 -7 -7 -7 -7 -7 -7 -7 -7 -7 -7Engineering technicians, except drafters 0 0 1 -6 -7 -7 -7 -7 -7 -7 -7 -7 -7 -7First-line supervisors/managers, law enforcement workers 0 0 0 -3 -6 -6 -6 -6 -6 -7 -7 -7 -7 -7All other financial specialists -1 0 0 -4 -7 -7 -7 -7 -7 -7 -7 -7 -7 -7Food service managers 0 0 1 -3 -7 -7 -7 -7 -7 -7 -7 -7 -7 -7Network and computer systems administrators -1 0 1 -7 -7 -7 -7 -7 -7 -7 -7 -7 -7 -7Inspectors, testers, sorters, samplers, and weighers 0 0 1 -5 -8 -8 -8 -8 -8 -8 -8 -7 -7 -7Special education teachers 1 0 0 -2 -5 -5 -6 -6 -6 -7 -7 -7 -7 -7All other social scientists and related workers -1 0 0 -4 -7 -7 -7 -7 -7 -7 -7 -7 -7 -7Construction managers 0 -1 14 1 -6 -8 -8 -8 -8 -8 -8 -8 -8 -8Cement masons, concrete finishers, and terrazzo workers 0 -1 14 1 -6 -8 -8 -8 -8 -8 -8 -8 -8 -8Human resources assistants, except payroll and timekeeping -1 0 1 -5 -8 -8 -8 -8 -8 -8 -8 -8 -8 -8Miscellaneous production workers 0 -1 3 -6 -10 -10 -9 -9 -9 -8 -8 -8 -8 -8Aircraft mechanics and service technicians -1 0 0 -5 -8 -8 -8 -8 -8 -8 -8 -8 -8 -8Miscellaneous entertainment attendants and related workers 0 0 1 -4 -9 -9 -9 -9 -9 -8 -8 -8 -8 -8All other counselors, social, and religious workers 0 0 1 -4 -7 -7 -8 -8 -8 -8 -8 -8 -8 -8All other engineers -1 0 1 -5 -8 -8 -8 -8 -8 -8 -8 -8 -8 -8All other life, physical, and social science technicians -1 0 0 -5 -8 -8 -8 -8 -8 -8 -8 -8 -8 -8Computer programmers -1 -1 1 -11 -9 -9 -9 -9 -8 -8 -8 -8 -8 -
Seven Virginia Peninsula Communities
6
8
33
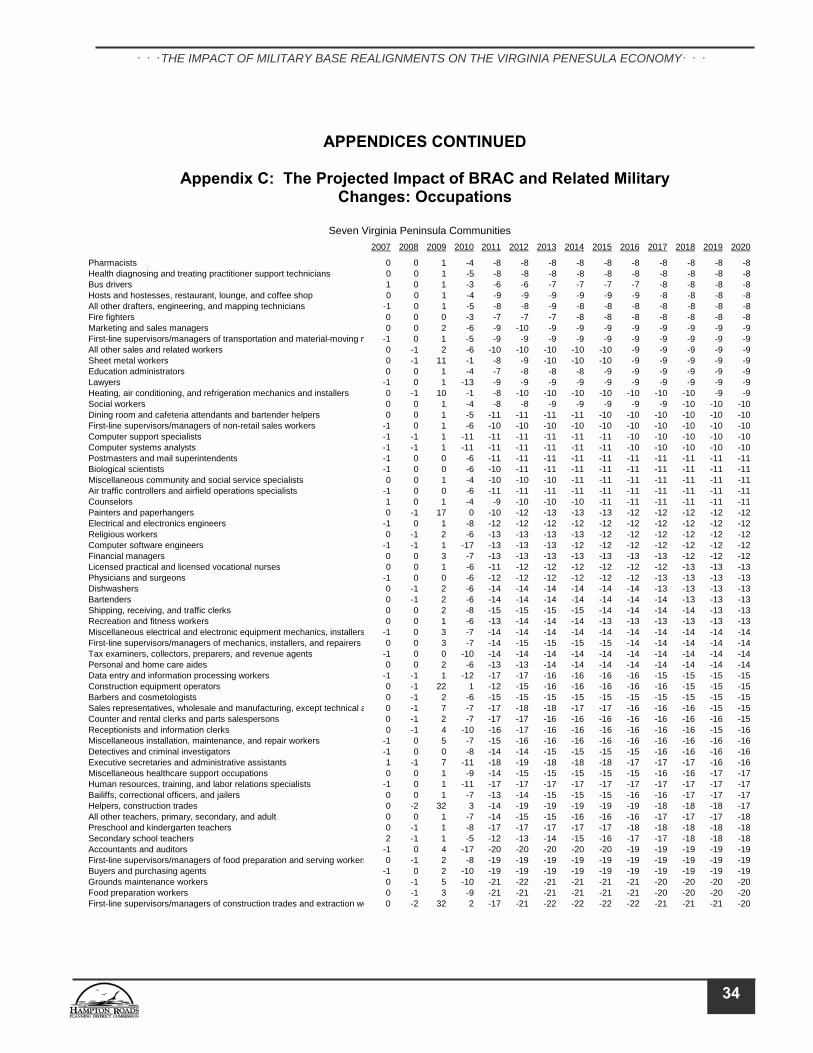
THE IMPACT OF MILITARY BASE REALIGNMENTS ON THE VIRGINIA PENESULA ECONOMY
APPENDICES CONTINUED
Appendix C: The Projected Impact of BRAC and Related Military Changes: Occupations
2007 2008 2009 2010 2011 2012 2013 2014 2015 2016 2017 2018 2019 2020
Pharmacists 0 0 1 -4 -8 -8 -8 -8 -8 -8 -8 -8 -8 -8Health diagnosing and treating practitioner support technicians 0 0 1 -5 -8 -8 -8 -8 -8 -8 -8 -8 -8 -8Bus drivers 1 0 1 -3 -6 -6 -7 -7 -7 -7 -8 -8 -8 -8Hosts and hostesses, restaurant, lounge, and coffee shop 0 0 1 -4 -9 -9 -9 -9 -9 -9 -8 -8 -8 -8All other drafters, engineering, and mapping technicians -1 0 1 -5 -8 -8 -9 -8 -8 -8 -8 -8 -8 -8Fire fighters 0 0 0 -3 -7 -7 -7 -8 -8 -8 -8 -8 -8 -8Marketing and sales managers 0 0 2 -6 -9 -10 -9 -9 -9 -9 -9 -9 -9 -9First-line supervisors/managers of transportation and material-moving m -1 0 1 -5 -9 -9 -9 -9 -9 -9 -9 -9 -9 -9All other sales and related workers 0 -1 2 -6 -10 -10 -10 -10 -10 -9 -9 -9 -9 -9Sheet metal workers 0 -1 11 -1 -8 -9 -10 -10 -10 -9 -9 -9 -9 -9Education administrators 0 0 1 -4 -7 -8 -8 -8 -9 -9 -9 -9 -9 -9Lawyers -1 0 1 -13 -9 -9 -9 -9 -9 -9 -9 -9 -9 -Heating, air conditioning, and refrigeration mechanics and installers 0 -1 10 -1 -8 -10 -10 -10 -10 -10 -10 -10 -9 -9Social workers 0 0 1 -4 -8 -8 -9 -9 -9 -9 -9 -10 -10 -10Dining room and cafeteria attendants and bartender helpers 0 0 1 -5 -11 -11 -11 -11 -10 -10 -10 -10 -10 -10First-line supervisors/managers of non-retail sales workers -1 0 1 -6 -10 -10 -10 -10 -10 -10 -10 -10 -10 -10Computer support specialists -1 -1 1 -11 -11 -11 -11 -11 -11 -10 -10 -10 -10 -10Computer systems analysts -1 -1 1 -11 -11 -11 -11 -11 -11 -10 -10 -10 -10 -10Postmasters and mail superintendents -1 0 0 -6 -11 -11 -11 -11 -11 -11 -11 -11 -11 -11Biological scientists -1 0 0 -6 -10 -11 -11 -11 -11 -11 -11 -11 -11 -11Miscellaneous community and social service specialists 0 0 1 -4 -10 -10 -10 -11 -11 -11 -11 -11 -11 -11Air traffic controllers and airfield operations specialists -1 0 0 -6 -11 -11 -11 -11 -11 -11 -11 -11 -11 -11Counselors 1 0 1 -4 -9 -10 -10 -10 -11 -11 -11 -11 -11 -11Painters and paperhangers 0 -1 17 0 -10 -12 -13 -13 -13 -12 -12 -12 -12 -12Electrical and electronics engineers -1 0 1 -8 -12 -12 -12 -12 -12 -12 -12 -12 -12 -12Religious workers 0 -1 2 -6 -13 -13 -13 -13 -12 -12 -12 -12 -12 -12Computer software engineers -1 -1 1 -17 -13 -13 -13 -12 -12 -12 -12 -12 -12 -12Financial managers 0 0 3 -7 -13 -13 -13 -13 -13 -13 -13 -12 -12 -12Licensed practical and licensed vocational nurses 0 0 1 -6 -11 -12 -12 -12 -12 -12 -12 -13 -13 -13Physicians and surgeons -1 0 0 -6 -12 -12 -12 -12 -12 -12 -13 -13 -13 -13Dishwashers 0 -1 2 -6 -14 -14 -14 -14 -14 -14 -13 -13 -13 -13Bartenders 0 -1 2 -6 -14 -14 -14 -14 -14 -14 -14 -13 -13 -13Shipping, receiving, and traffic clerks 0 0 2 -8 -15 -15 -15 -15 -14 -14 -14 -14 -13 -13Recreation and fitness workers 0 0 1 -6 -13 -14 -14 -14 -13 -13 -13 -13 -13 -13Miscellaneous electrical and electronic equipment mechanics, installer
9
s -1 0 3 -7 -14 -14 -14 -14 -14 -14 -14 -14 -14 -14First-line supervisors/managers of mechanics, installers, and repairers 0 0 3 -7 -14 -15 -15 -15 -15 -14 -14 -14 -14 -14Tax examiners, collectors, preparers, and revenue agents -1 0 0 -10 -14 -14 -14 -14 -14 -14 -14 -14 -14 -14Personal and home care aides 0 0 2 -6 -13 -13 -14 -14 -14 -14 -14 -14 -14 -14Data entry and information processing workers -1 -1 1 -12 -17 -17 -16 -16 -16 -16 -15 -15 -15 -15Construction equipment operators 0 -1 22 1 -12 -15 -16 -16 -16 -16 -16 -15 -15 -15Barbers and cosmetologists 0 -1 2 -6 -15 -15 -15 -15 -15 -15 -15 -15 -15 -15Sales representatives, wholesale and manufacturing, except technical a 0 -1 7 -7 -17 -18 -18 -17 -17 -16 -16 -16 -15 -15Counter and rental clerks and parts salespersons 0 -1 2 -7 -17 -17 -16 -16 -16 -16 -16 -16 -16 -15Receptionists and information clerks 0 -1 4 -10 -16 -17 -16 -16 -16 -16 -16 -16 -15 -16Miscellaneous installation, maintenance, and repair workers -1 0 5 -7 -15 -16 -16 -16 -16 -16 -16 -16 -16 -16Detectives and criminal investigators -1 0 0 -8 -14 -14 -15 -15 -15 -15 -16 -16 -16 -16Executive secretaries and administrative assistants 1 -1 7 -11 -18 -19 -18 -18 -18 -17 -17 -17 -16 -16Miscellaneous healthcare support occupations 0 0 1 -9 -14 -15 -15 -15 -15 -15 -16 -16 -17 -17Human resources, training, and labor relations specialists -1 0 1 -11 -17 -17 -17 -17 -17 -17 -17 -17 -17 -17Bailiffs, correctional officers, and jailers 0 0 1 -7 -13 -14 -15 -15 -15 -16 -16 -17 -17 -17Helpers, construction trades 0 -2 32 3 -14 -19 -19 -19 -19 -19 -18 -18 -18 -17All other teachers, primary, secondary, and adult 0 0 1 -7 -14 -15 -15 -16 -16 -16 -17 -17 -17 -18Preschool and kindergarten teachers 0 -1 1 -8 -17 -17 -17 -17 -17 -18 -18 -18 -18 -18Secondary school teachers 2 -1 1 -5 -12 -13 -14 -15 -16 -17 -17 -18 -18 -18Accountants and auditors -1 0 4 -17 -20 -20 -20 -20 -20 -19 -19 -19 -19 -19First-line supervisors/managers of food preparation and serving workers 0 -1 2 -8 -19 -19 -19 -19 -19 -19 -19 -19 -19 -19Buyers and purchasing agents -1 0 2 -10 -19 -19 -19 -19 -19 -19 -19 -19 -19 -19Grounds maintenance workers 0 -1 5 -10 -21 -22 -21 -21 -21 -21 -20 -20 -20 -20Food preparation workers 0 -1 3 -9 -21 -21 -21 -21 -21 -21 -20 -20 -20 -20First-line supervisors/managers of construction trades and extraction wo 0 -2 32 2 -17 -21 -22 -22 -22 -22 -21 -21 -21 -20
Seven Virginia Peninsula Communities
34
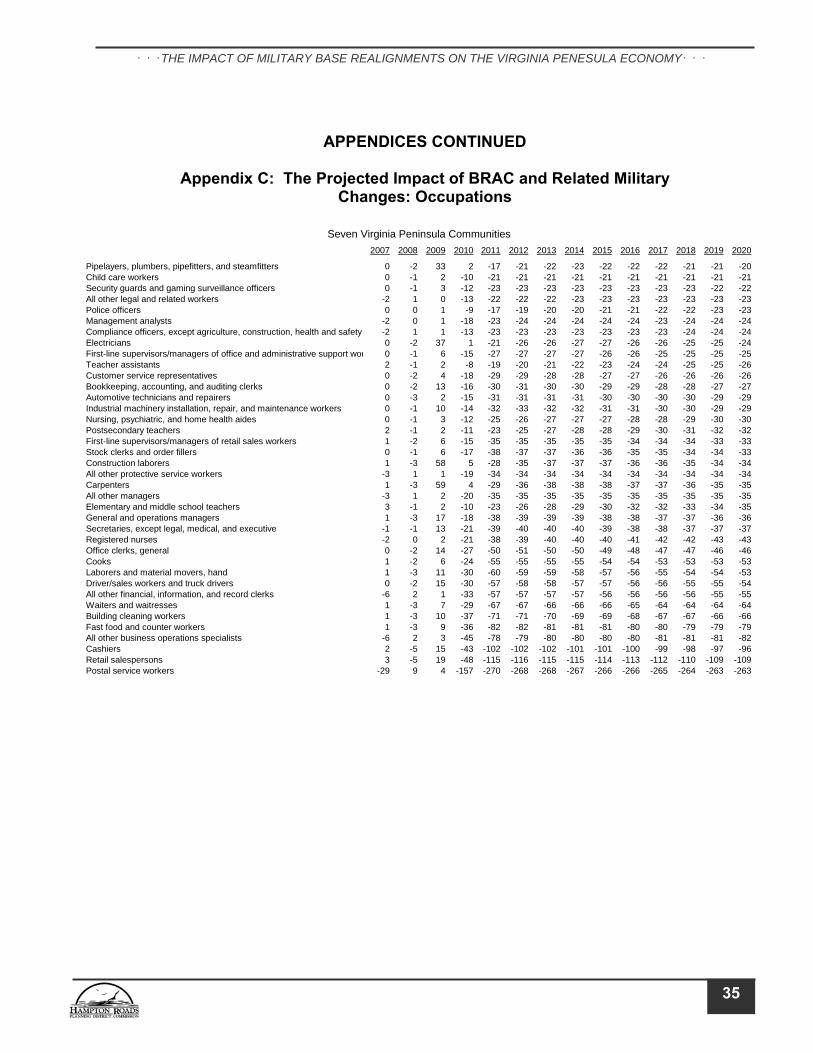
THE IMPACT OF MILITARY BASE REALIGNMENTS ON THE VIRGINIA PENESULA ECONOMY
APPENDICES CONTINUED
Appendix C: The Projected Impact of BRAC and Related Military Changes: Occupations
2007 2008 2009 2010 2011 2012 2013 2014 2015 2016 2017 2018 2019 2020
Pipelayers, plumbers, pipefitters, and steamfitters 0 -2 33 2 -17 -21 -22 -23 -22 -22 -22 -21 -21 -20Child care workers 0 -1 2 -10 -21 -21 -21 -21 -21 -21 -21 -21 -21 -21Security guards and gaming surveillance officers 0 -1 3 -12 -23 -23 -23 -23 -23 -23 -23 -23 -22 -22All other legal and related workers -2 1 0 -13 -22 -22 -22 -23 -23 -23 -23 -23 -23 -23Police officers 0 0 1 -9 -17 -19 -20 -20 -21 -21 -22 -22 -23 -23Management analysts -2 0 1 -18 -23 -24 -24 -24 -24 -24 -23 -24 -24 -24Compliance officers, except agriculture, construction, health and safety -2 1 1 -13 -23 -23 -23 -23 -23 -23 -23 -24 -24 -24Electricians 0 -2 37 1 -21 -26 -26 -27 -27 -26 -26 -25 -25 -24First-line supervisors/managers of office and administrative support wor 0 -1 6 -15 -27 -27 -27 -27 -26 -26 -25 -25 -25 -25Teacher assistants 2 -1 2 -8 -19 -20 -21 -22 -23 -24 -24 -25 -25 -26Customer service representatives 0 -2 4 -18 -29 -29 -28 -28 -27 -27 -26 -26 -26 -26Bookkeeping, accounting, and auditing clerks 0 -2 13 -16 -30 -31 -30 -30 -29 -29 -28 -28 -27 -27Automotive technicians and repairers 0 -3 2 -15 -31 -31 -31 -31 -30 -30 -30 -30 -29 -29Industrial machinery installation, repair, and maintenance workers 0 -1 10 -14 -32 -33 -32 -32 -31 -31 -30 -30 -29 -29Nursing, psychiatric, and home health aides 0 -1 3 -12 -25 -26 -27 -27 -27 -28 -28 -29 -30 -30Postsecondary teachers 2 -1 2 -11 -23 -25 -27 -28 -28 -29 -30 -31 -32 -32First-line supervisors/managers of retail sales workers 1 -2 6 -15 -35 -35 -35 -35 -35 -34 -34 -34 -33 -33Stock clerks and order fillers 0 -1 6 -17 -38 -37 -37 -36 -36 -35 -35 -34 -34 -33Construction laborers 1 -3 58 5 -28 -35 -37 -37 -37 -36 -36 -35 -34 -34All other protective service workers -3 1 1 -19 -34 -34 -34 -34 -34 -34 -34 -34 -34 -34Carpenters 1 -3 59 4 -29 -36 -38 -38 -38 -37 -37 -36 -35 -35All other managers -3 1 2 -20 -35 -35 -35 -35 -35 -35 -35 -35 -35 -35Elementary and middle school teachers 3 -1 2 -10 -23 -26 -28 -29 -30 -32 -32 -33 -34 -35General and operations managers 1 -3 17 -18 -38 -39 -39 -39 -38 -38 -37 -37 -36 -36Secretaries, except legal, medical, and executive -1 -1 13 -21 -39 -40 -40 -40 -39 -38 -38 -37 -37 -37Registered nurses -2 0 2 -21 -38 -39 -40 -40 -40 -41 -42 -42 -43 -43Office clerks, general 0 -2 14 -27 -50 -51 -50 -50 -49 -48 -47 -47 -46 -46Cooks 1 -2 6 -24 -55 -55 -55 -55 -54 -54 -53 -53 -53 -53Laborers and material movers, hand 1 -3 11 -30 -60 -59 -59 -58 -57 -56 -55 -54 -54 -53Driver/sales workers and truck drivers 0 -2 15 -30 -57 -58 -58 -57 -57 -56 -56 -55 -55 -54All other financial, information, and record clerks -6 2 1 -33 -57 -57 -57 -57 -56 -56 -56 -56 -55 -55Waiters and waitresses 1 -3 7 -29 -67 -67 -66 -66 -66 -65 -64 -64 -64 -64Building cleaning workers 1 -3 10 -37 -71 -71 -70 -69 -69 -68 -67 -67 -66 -66Fast food and counter workers 1 -3 9 -36 -82 -82 -81 -81 -81 -80 -80 -79 -79 -79All other business operations specialists -6 2 3 -45 -78 -79 -80 -80 -80 -80 -81 -81 -81 -82Cashiers 2 -5 15 -43 -102 -102 -102 -101 -101 -100 -99 -98 -97 -96Retail salespersons 3 -5 19 -48 -115 -116 -115 -115 -114 -113 -112 -110 -109 -109Postal service workers -29 9 4 -157 -270 -268 -268 -267 -266 -266 -265 -264 -263 -263
Seven Virginia Peninsula Communities
35
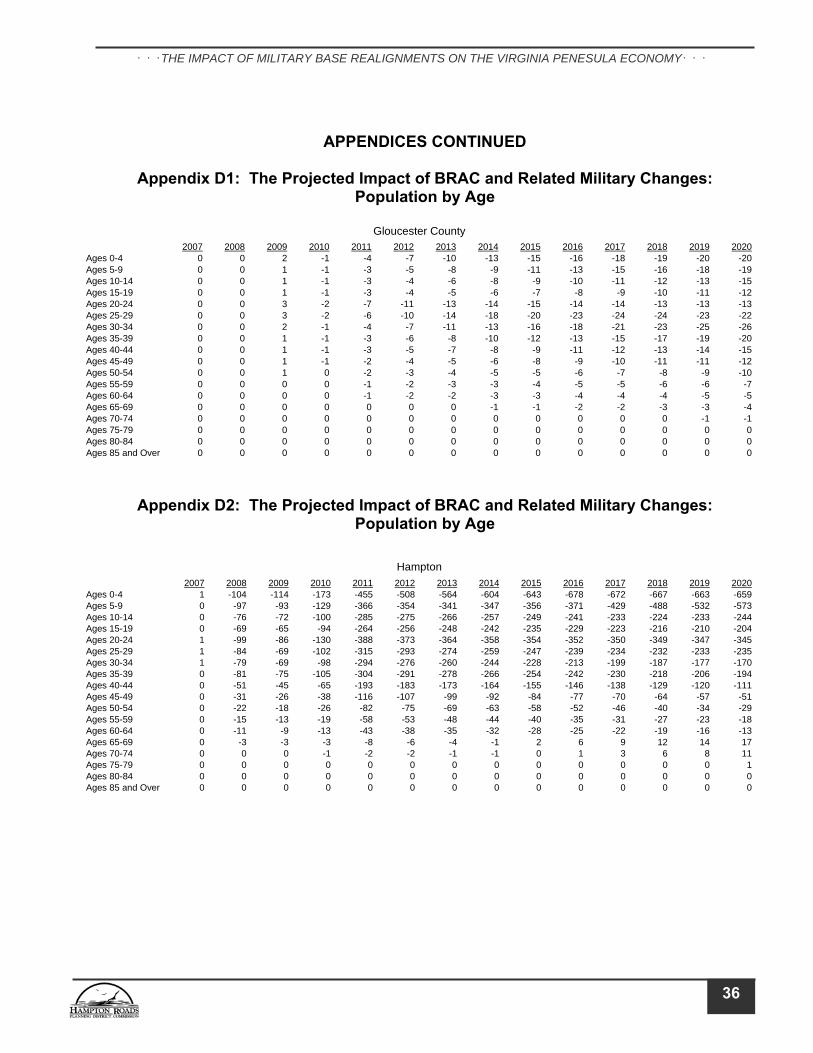
THE IMPACT OF MILITARY BASE REALIGNMENTS ON THE VIRGINIA PENESULA ECONOMY
APPENDICES CONTINUED
Appendix D1: The Projected Impact of BRAC and Related Military Changes: Population by Age
2007 2008 2009 2010 2011 2012 2013 2014 2015 2016 2017 2018 2019 2020Ages 0-4 0 0 2 -1 -4 -7 -10 -13 -15 -16 -18 -19 -20 -20Ages 5-9 0 0 1 -1 -3 -5 -8 -9 -11 -13 -15 -16 -18 -19Ages 10-14 0 0 1 -1 -3 -4 -6 -8 -9 -10 -11 -12 -13 -15Ages 15-19 0 0 1 -1 -3 -4 -5 -6 -7 -8 -9 -10 -11 -12Ages 20-24 0 0 3 -2 -7 -11 -13 -14 -15 -14 -14 -13 -13 -13Ages 25-29 0 0 3 -2 -6 -10 -14 -18 -20 -23 -24 -24 -23 -22Ages 30-34 0 0 2 -1 -4 -7 -11 -13 -16 -18 -21 -23 -25 -26Ages 35-39 0 0 1 -1 -3 -6 -8 -10 -12 -13 -15 -17 -19 -20Ages 40-44 0 0 1 -1 -3 -5 -7 -8 -9 -11 -12 -13 -14 -15Ages 45-49 0 0 1 -1 -2 -4 -5 -6 -8 -9 -10 -11 -11 -12Ages 50-54 0 0 1 0 -2 -3 -4 -5 -5 -6 -7 -8 -9 -10Ages 55-59 0 0 0 0 -1 -2 -3 -3 -4 -5 -5 -6 -6 -7Ages 60-64 0 0 0 0 -1 -2 -2 -3 -3 -4 -4 -4 -5 -5Ages 65-69 0 0 0 0 0 0 0 -1 -1 -2 -2 -3 -3 -4Ages 70-74 0 0 0 0 0 0 0 0 0 0 0 0 -1Ages 75-79 0 0 0 0 0 0 0 0 0 0 0 0 0 0Ages 80-84 0 0 0 0 0 0 0 0 0 0 0 0 0 0Ages 85 and Over 0 0 0 0 0 0 0 0 0 0 0 0 0 0
Gloucester County
-1
Appendix D2: The Projected Impact of BRAC and Related Military Changes: Population by Age
2007 2008 2009 2010 2011 2012 2013 2014 2015 2016 2017 2018 2019 2020Ages 0-4 1 -104 -114 -173 -455 -508 -564 -604 -643 -678 -672 -667 -663 -659Ages 5-9 0 -97 -93 -129 -366 -354 -341 -347 -356 -371 -429 -488 -532 -573Ages 10-14 0 -76 -72 -100 -285 -275 -266 -257 -249 -241 -233 -224 -233 -244Ages 15-19 0 -69 -65 -94 -264 -256 -248 -242 -235 -229 -223 -216 -210 -204Ages 20-24 1 -99 -86 -130 -388 -373 -364 -358 -354 -352 -350 -349 -347 -345Ages 25-29 1 -84 -69 -102 -315 -293 -274 -259 -247 -239 -234 -232 -233 -235Ages 30-34 1 -79 -69 -98 -294 -276 -260 -244 -228 -213 -199 -187 -177 -170Ages 35-39 0 -81 -75 -105 -304 -291 -278 -266 -254 -242 -230 -218 -206 -194Ages 40-44 0 -51 -45 -65 -193 -183 -173 -164 -155 -146 -138 -129 -120 -111Ages 45-49 0 -31 -26 -38 -116 -107 -99 -92 -84 -77 -70 -64 -57 -51Ages 50-54 0 -22 -18 -26 -82 -75 -69 -63 -58 -52 -46 -40 -34 -29Ages 55-59 0 -15 -13 -19 -58 -53 -48 -44 -40 -35 -31 -27 -23 -18Ages 60-64 0 -11 -9 -13 -43 -38 -35 -32 -28 -25 -22 -19 -16 -Ages 65-69 0 -3 -3 -3 -8 -6 -4 -1 2 6 9 12 14Ages 70-74 0 0 0 -1 -2 -2 -1 -1 0 1 3 6 8Ages 75-79 0 0 0 0 0 0 0 0 0 0 0 0 0 1Ages 80-84 0 0 0 0 0 0 0 0 0 0 0 0 0 0Ages 85 and Over 0 0 0 0 0 0 0 0 0 0 0 0 0 0
Hampton
131711
36
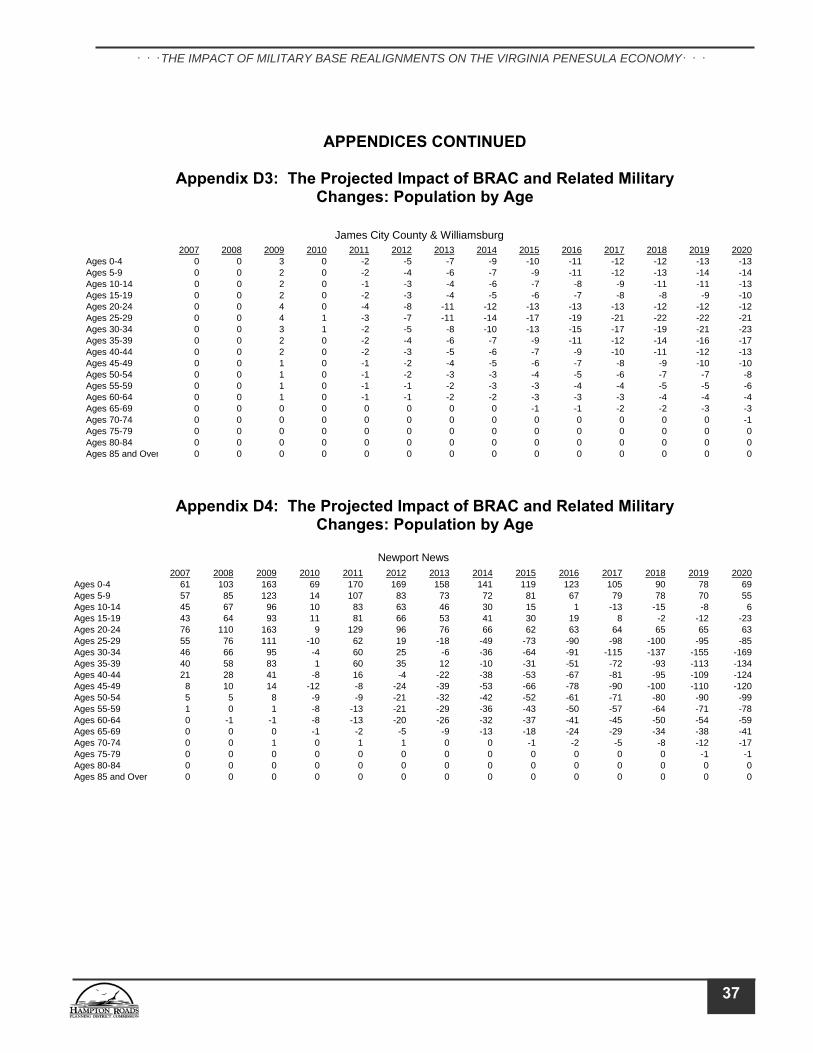
THE IMPACT OF MILITARY BASE REALIGNMENTS ON THE VIRGINIA PENESULA ECONOMY
APPENDICES CONTINUED
Appendix D3: The Projected Impact of BRAC and Related Military Changes: Population by Age
2007 2008 2009 2010 2011 2012 2013 2014 2015 2016 2017 2018 2019 2020Ages 0-4 0 0 3 0 -2 -5 -7 -9 -10 -11 -12 -12 -13 -13Ages 5-9 0 0 2 0 -2 -4 -6 -7 -9 -11 -12 -13 -14 -14Ages 10-14 0 0 2 0 -1 -3 -4 -6 -7 -8 -9 -11 -11 -13Ages 15-19 0 0 2 0 -2 -3 -4 -5 -6 -7 -8 -8 -9 -10Ages 20-24 0 0 4 0 -4 -8 -11 -12 -13 -13 -13 -12 -12 -12Ages 25-29 0 0 4 1 -3 -7 -11 -14 -17 -19 -21 -22 -22 -21Ages 30-34 0 0 3 1 -2 -5 -8 -10 -13 -15 -17 -19 -21 -23Ages 35-39 0 0 2 0 -2 -4 -6 -7 -9 -11 -12 -14 -16 -17Ages 40-44 0 0 2 0 -2 -3 -5 -6 -7 -9 -10 -11 -12 -13Ages 45-49 0 0 1 0 -1 -2 -4 -5 -6 -7 -8 -9 -10 -10Ages 50-54 0 0 1 0 -1 -2 -3 -3 -4 -5 -6 -7 -7 -8Ages 55-59 0 0 1 0 -1 -1 -2 -3 -3 -4 -4 -5 -5 -6Ages 60-64 0 0 1 0 -1 -1 -2 -2 -3 -3 -3 -4 -4 -4Ages 65-69 0 0 0 0 0 0 0 0 -1 -1 -2 -2 -3Ages 70-74 0 0 0 0 0 0 0 0 0 0 0 0 0Ages 75-79 0 0 0 0 0 0 0 0 0 0 0 0 0Ages 80-84 0 0 0 0 0 0 0 0 0 0 0 0 0Ages 85 and Ove
-3-100
r 0 0 0 0 0 0 0 0 0 0 0 0 0
James City County & Williamsburg
0
Appendix D4: The Projected Impact of BRAC and Related Military
Changes: Population by Age
2007 2008 2009 2010 2011 2012 2013 2014 2015 2016 2017 2018 2019 2020Ages 0-4 61 103 163 69 170 169 158 141 119 123 105 90 78 69Ages 5-9 57 85 123 14 107 83 73 72 81 67 79 78 70 5Ages 10-14 45 67 96 10 83 63 46 30 15 1 -13 -15 -8 6Ages 15-19 43 64 93 11 81 66 53 41 30 19 8 -2 -12 -23Ages 20-24 76 110 163 9 129 96 76 66 62 63 64 65 65 63Ages 25-29 55 76 111 -10 62 19 -18 -49 -73 -90 -98 -100 -95 -85Ages 30-34 46 66 95 -4 60 25 -6 -36 -64 -91 -115 -137 -155 -169Ages 35-39 40 58 83 1 60 35 12 -10 -31 -51 -72 -93 -113 -134Ages 40-44 21 28 41 -8 16 -4 -22 -38 -53 -67 -81 -95 -109 -124Ages 45-49 8 10 14 -12 -8 -24 -39 -53 -66 -78 -90 -100 -110 -120Ages 50-54 5 5 8 -9 -9 -21 -32 -42 -52 -61 -71 -80 -90 -99Ages 55-59 1 0 1 -8 -13 -21 -29 -36 -43 -50 -57 -64 -71 -78Ages 60-64 0 -1 -1 -8 -13 -20 -26 -32 -37 -41 -45 -50 -54 -59Ages 65-69 0 0 0 -1 -2 -5 -9 -13 -18 -24 -29 -34 -38 -41Ages 70-74 0 0 1 0 1 1 0 0 -1 -2 -5 -8 -12Ages 75-79 0 0 0 0 0 0 0 0 0 0 0 0 -1Ages 80-84 0 0 0 0 0 0 0 0 0 0 0 0 0 0Ages 85 and Over 0 0 0 0 0 0 0 0 0 0 0 0 0 0
Newport News
5
-17-1
37
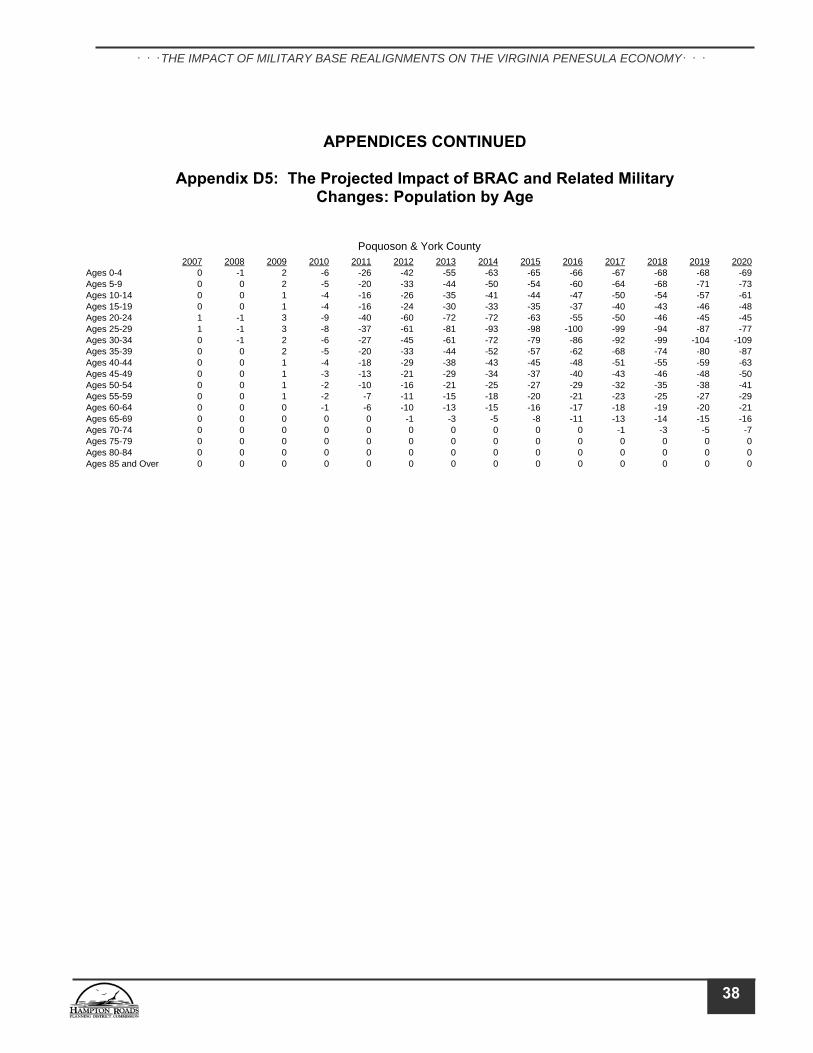
THE IMPACT OF MILITARY BASE REALIGNMENTS ON THE VIRGINIA PENESULA ECONOMY
APPENDICES CONTINUED
Appendix D5: The Projected Impact of BRAC and Related Military Changes: Population by Age
2007 2008 2009 2010 2011 2012 2013 2014 2015 2016 2017 2018 2019 2020Ages 0-4 0 -1 2 -6 -26 -42 -55 -63 -65 -66 -67 -68 -68 -69Ages 5-9 0 0 2 -5 -20 -33 -44 -50 -54 -60 -64 -68 -71 -73Ages 10-14 0 0 1 -4 -16 -26 -35 -41 -44 -47 -50 -54 -57 -61Ages 15-19 0 0 1 -4 -16 -24 -30 -33 -35 -37 -40 -43 -46 -48Ages 20-24 1 -1 3 -9 -40 -60 -72 -72 -63 -55 -50 -46 -45 -45Ages 25-29 1 -1 3 -8 -37 -61 -81 -93 -98 -100 -99 -94 -87 -77Ages 30-34 0 -1 2 -6 -27 -45 -61 -72 -79 -86 -92 -99 -104 -109Ages 35-39 0 0 2 -5 -20 -33 -44 -52 -57 -62 -68 -74 -80 -87Ages 40-44 0 0 1 -4 -18 -29 -38 -43 -45 -48 -51 -55 -59 -63Ages 45-49 0 0 1 -3 -13 -21 -29 -34 -37 -40 -43 -46 -48 -50Ages 50-54 0 0 1 -2 -10 -16 -21 -25 -27 -29 -32 -35 -38 -41Ages 55-59 0 0 1 -2 -7 -11 -15 -18 -20 -21 -23 -25 -27 -29Ages 60-64 0 0 0 -1 -6 -10 -13 -15 -16 -17 -18 -19 -20 -21Ages 65-69 0 0 0 0 0 -1 -3 -5 -8 -11 -13 -14 -15 -16Ages 70-74 0 0 0 0 0 0 0 0 0 0 -1 -3 -5 -7Ages 75-79 0 0 0 0 0 0 0 0 0 0 0 0 0 0Ages 80-84 0 0 0 0 0 0 0 0 0 0 0 0 0 0Ages 85 and Over 0 0 0 0 0 0 0 0 0 0 0 0 0 0
Poquoson & York County
38