Embed Size (px)
Citation preview
Base Realignment and Closure (BRAC) Savings and Acquisition Risk
Peter J. Braxton, Kevin Cincotta, Richard Lee
Technomics, Inc.ICEAA, Risk 2-1
Thursday, June 20th, 2013
1
Thank Tufte for the handout, but don’t blame him for the PowerPoint!
Presented at the 2013 ICEAA Professional Development & Training Workshop - www.iceaaonline.com
[email protected], (703) 944-3114
AbstractThe Government Accountability Office (GAO) recently released the study Military Base Realignments and Closures: Updated Costs and Savings Estimates from BRAC 2005 (GAO-12-709R, June 29, 2012). Its appendices contain a wealth of risk data, with initial estimates (2005 BRAC commission) and final costs (Fiscal year 2011 DOD budget) for 175 distinct BRAC initiatives. Applying an innovative method for modeling within-program risk and uncertainty using cross-program data, this paper derives cost growth factors (CGFs) and coefficients of variation (CVs) for BRAC initiatives. Furthermore, the pattern in these data is astoundingly similar to that found in major defense acquisition program (MDAP) data, a strong confirmation of this modeling approach (meta analysis).
The BRAC initiatives ranged in size from very small (a few million dollars or less) to large (a few billion dollars), and they experienced a very wide range of cost growth, from -100% (i.e., a final cost of zero!) up to more than 1800% (19-fold!). The average CGF was 2.02 (102% growth), but median growth (36%) was much smaller, and dollar-weighted growth (68%) fell in between. These are typical results, especially in view of the well-documented “size effect,” wherein smaller programs have much greater risk and opportunity (and hence uncertainty). While the GAO report examined how the increased one-time cost reduced the net present value (NPV) of the initiatives, which nonetheless remained positive due to real operational savings, our focus was on that up-front cost itself, as a potential analogy for acquisition programs.
Using the method pioneered in “The Perils of Portability: CGFs and CVs” (Braxton, et al., SCEA/ISPA 2011), we modeled the BRAC data using a maximum likelihood estimation (MLE) regression of final cost as a function of initial cost, with a heteroskedastic error term. This models the size effect by allowing the variation around smaller programs to be smaller in absolute (dollar) terms but larger in percent terms. For example, the BRAC data show a 30% CV at about a half billion dollars, with higher CVs for smaller projects, and asymptotically smaller CVs for larger projects (down to about 10% in the observed range). While we fail to reject the null hypothesis that the normalized errors follow a normal distribution, the eerie and unmistakable similarity of the pattern of normalized errors to that produced by the same model for the entirely distinct MDAP data leads us to investigate a different error form.
Drawing from more than 400 Selected Acquisition Report (SAR) baselines from more than 300 MDAPs as reported in “SAR Data Analysis, CV Benchmarks, and the Updated NCCA S-Curve Tool” (Lee, et al., SCEA/ISPA 2012), we updated the same MLE regression analysis and found that, like the BRAC data, the normalized errors showed a clustering below mean growth and other evidence that a skew-right distribution such as lognormal may be more appropriate. It has long been hypothesized that within-program risk is normal, in consonance with the application of the Central Limit Theorem to probabilistic cost estimates, while cross-program risk is lognormal, due to the presence of a few extremely risky programs and many moderately risky programs. This research offers unprecedented insight into within-program risk, and indications are that it too may be lognormal.
2
Presented at the 2013 ICEAA Professional Development & Training Workshop - www.iceaaonline.com
[email protected], (703) 944-3114
Outline• Base Realignment and Closure (BRAC)• Non-Repeatable Experiments and the Pseudo-
IID Thought Process• Maximum Likelihood Estimation (MLE) and Its
Application to Regression• Risk Modeling for BRAC Data• Selected Acquisition Report (SAR) Risk Redux• Meta Analysis: BRAC vs. SAR Risk• Within-Program Risk Based on Cross-Program
Data3
Presented at the 2013 ICEAA Professional Development & Training Workshop - www.iceaaonline.com
[email protected], (703) 944-3114
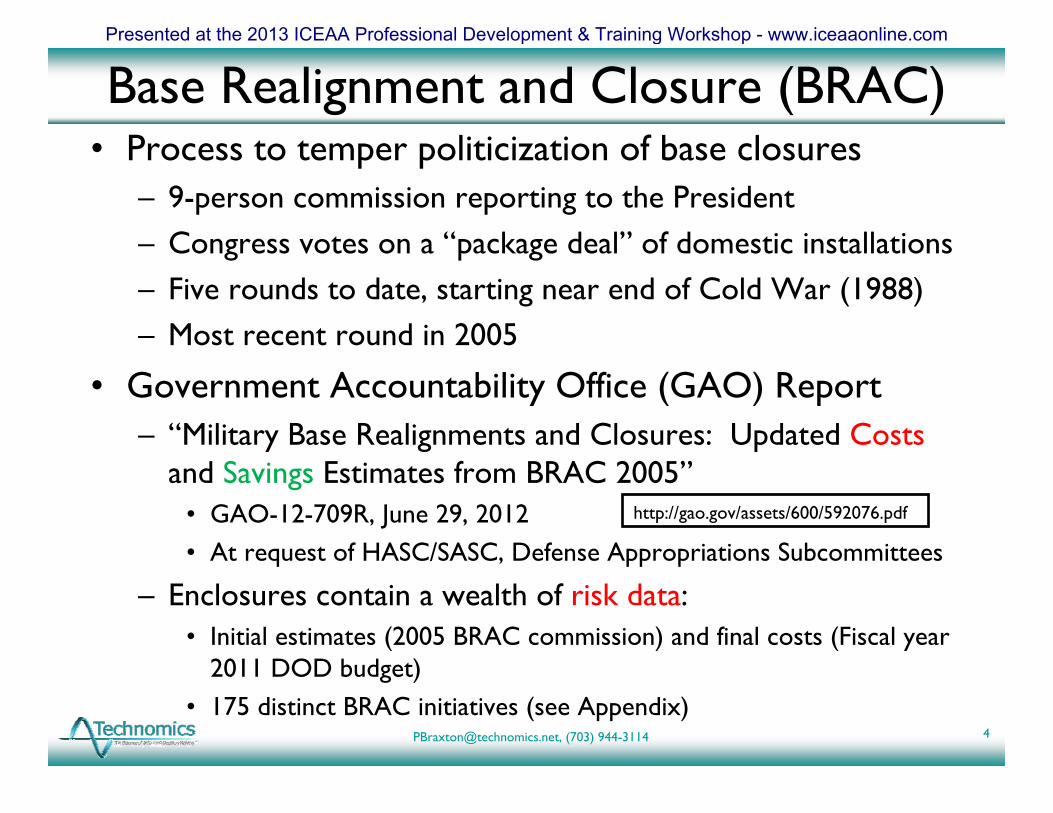
Base Realignment and Closure (BRAC)• Process to temper politicization of base closures
– 9-person commission reporting to the President– Congress votes on a “package deal” of domestic installations– Five rounds to date, starting near end of Cold War (1988)– Most recent round in 2005
• Government Accountability Office (GAO) Report– “Military Base Realignments and Closures: Updated Costs
and Savings Estimates from BRAC 2005”• GAO-12-709R, June 29, 2012• At request of HASC/SASC, Defense Appropriations Subcommittees
– Enclosures contain a wealth of risk data:• Initial estimates (2005 BRAC commission) and final costs (Fiscal year
2011 DOD budget)• 175 distinct BRAC initiatives (see Appendix)
4
http://gao.gov/assets/600/592076.pdf
Presented at the 2013 ICEAA Professional Development & Training Workshop - www.iceaaonline.com
[email protected], (703) 944-3114
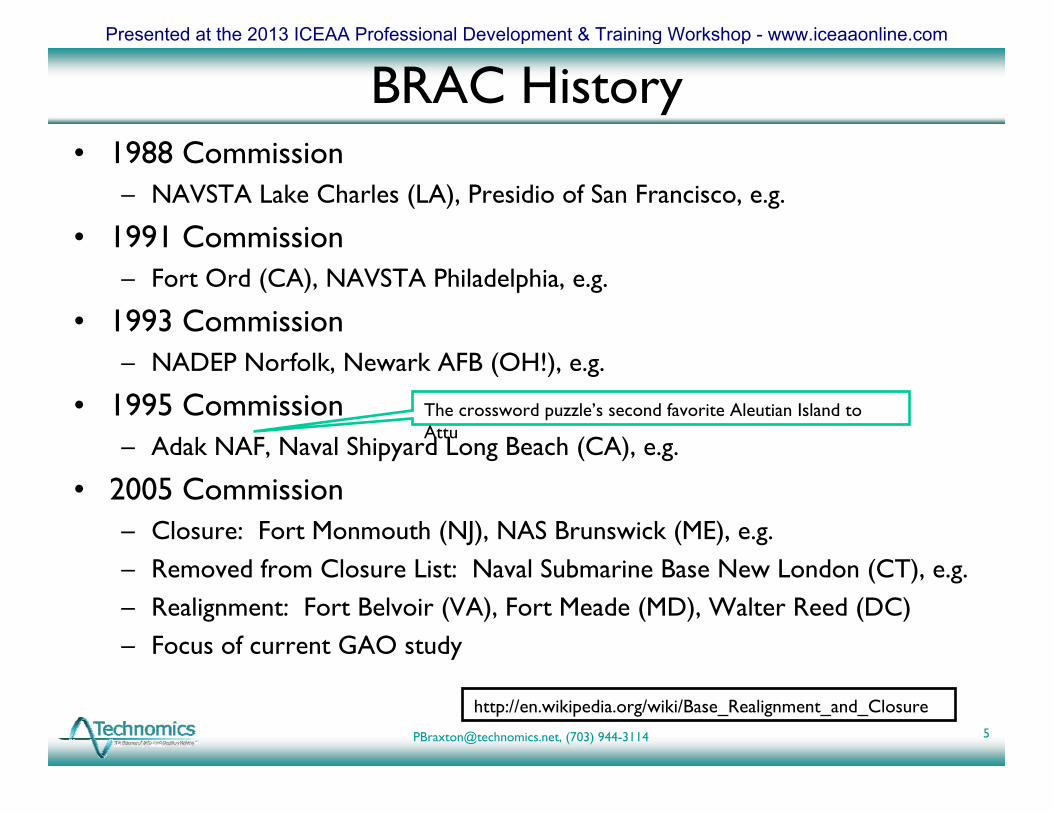
BRAC History• 1988 Commission
– NAVSTA Lake Charles (LA), Presidio of San Francisco, e.g.
• 1991 Commission– Fort Ord (CA), NAVSTA Philadelphia, e.g.
• 1993 Commission– NADEP Norfolk, Newark AFB (OH!), e.g.
• 1995 Commission– Adak NAF, Naval Shipyard Long Beach (CA), e.g.
• 2005 Commission– Closure: Fort Monmouth (NJ), NAS Brunswick (ME), e.g.– Removed from Closure List: Naval Submarine Base New London (CT), e.g.– Realignment: Fort Belvoir (VA), Fort Meade (MD), Walter Reed (DC)– Focus of current GAO study
5
http://en.wikipedia.org/wiki/Base_Realignment_and_Closure
The crossword puzzle’s second favorite Aleutian Island to Attu
Presented at the 2013 ICEAA Professional Development & Training Workshop - www.iceaaonline.com
[email protected], (703) 944-3114
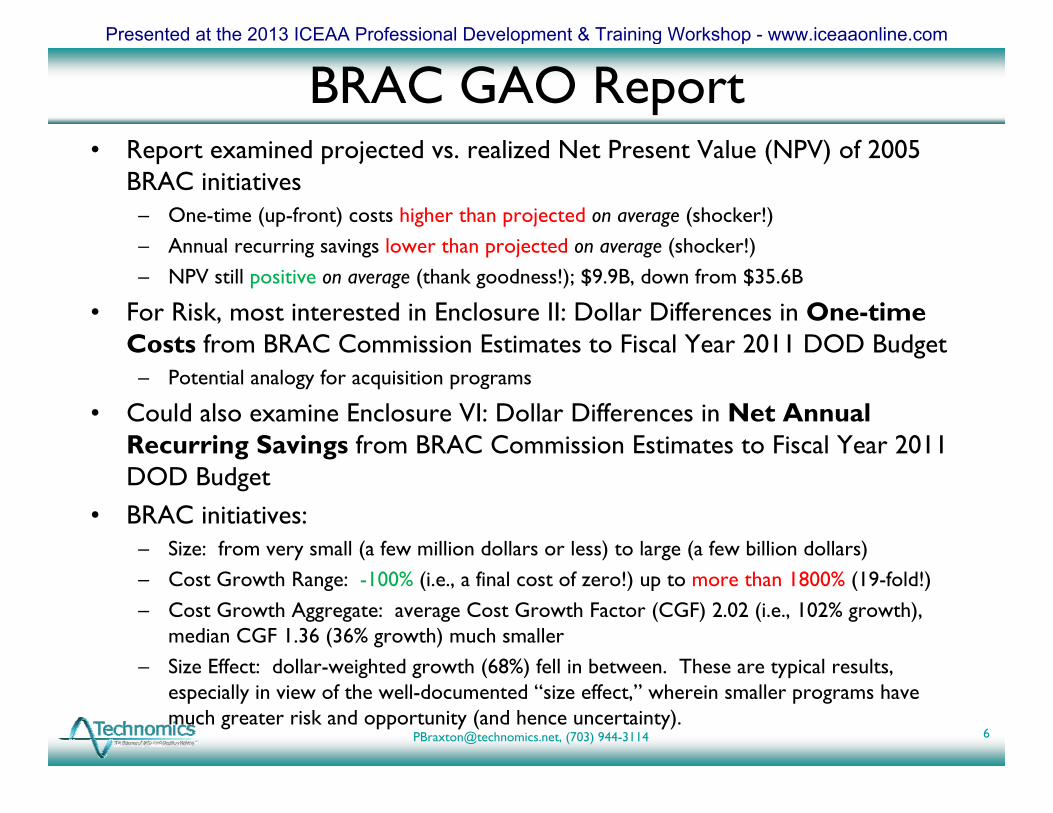
BRAC GAO Report• Report examined projected vs. realized Net Present Value (NPV) of 2005
BRAC initiatives– One-time (up-front) costs higher than projected on average (shocker!)– Annual recurring savings lower than projected on average (shocker!)– NPV still positive on average (thank goodness!); $9.9B, down from $35.6B
• For Risk, most interested in Enclosure II: Dollar Differences in One-time Costs from BRAC Commission Estimates to Fiscal Year 2011 DOD Budget
– Potential analogy for acquisition programs
• Could also examine Enclosure VI: Dollar Differences in Net Annual Recurring Savings from BRAC Commission Estimates to Fiscal Year 2011 DOD Budget
• BRAC initiatives:– Size: from very small (a few million dollars or less) to large (a few billion dollars)– Cost Growth Range: -100% (i.e., a final cost of zero!) up to more than 1800% (19-fold!)– Cost Growth Aggregate: average Cost Growth Factor (CGF) 2.02 (i.e., 102% growth),
median CGF 1.36 (36% growth) much smaller– Size Effect: dollar-weighted growth (68%) fell in between. These are typical results,
especially in view of the well-documented “size effect,” wherein smaller programs have much greater risk and opportunity (and hence uncertainty).
6
Presented at the 2013 ICEAA Professional Development & Training Workshop - www.iceaaonline.com
[email protected], (703) 944-3114
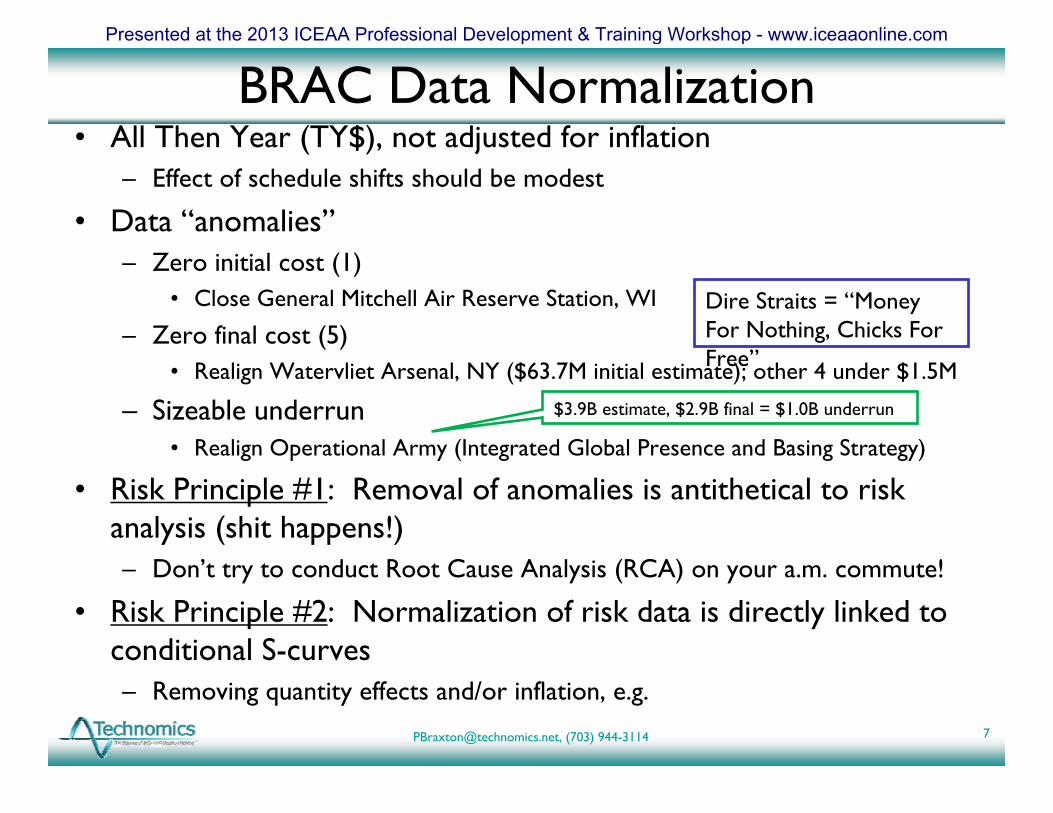
BRAC Data Normalization• All Then Year (TY$), not adjusted for inflation
– Effect of schedule shifts should be modest
• Data “anomalies”– Zero initial cost (1)
• Close General Mitchell Air Reserve Station, WI
– Zero final cost (5)• Realign Watervliet Arsenal, NY ($63.7M initial estimate); other 4 under $1.5M
– Sizeable underrun• Realign Operational Army (Integrated Global Presence and Basing Strategy)
• Risk Principle #1: Removal of anomalies is antithetical to risk analysis (shit happens!)– Don’t try to conduct Root Cause Analysis (RCA) on your a.m. commute!
• Risk Principle #2: Normalization of risk data is directly linked to conditional S-curves– Removing quantity effects and/or inflation, e.g.
7
Dire Straits = “Money For Nothing, Chicks For Free”
$3.9B estimate, $2.9B final = $1.0B underrun
Presented at the 2013 ICEAA Professional Development & Training Workshop - www.iceaaonline.com
[email protected], (703) 944-3114
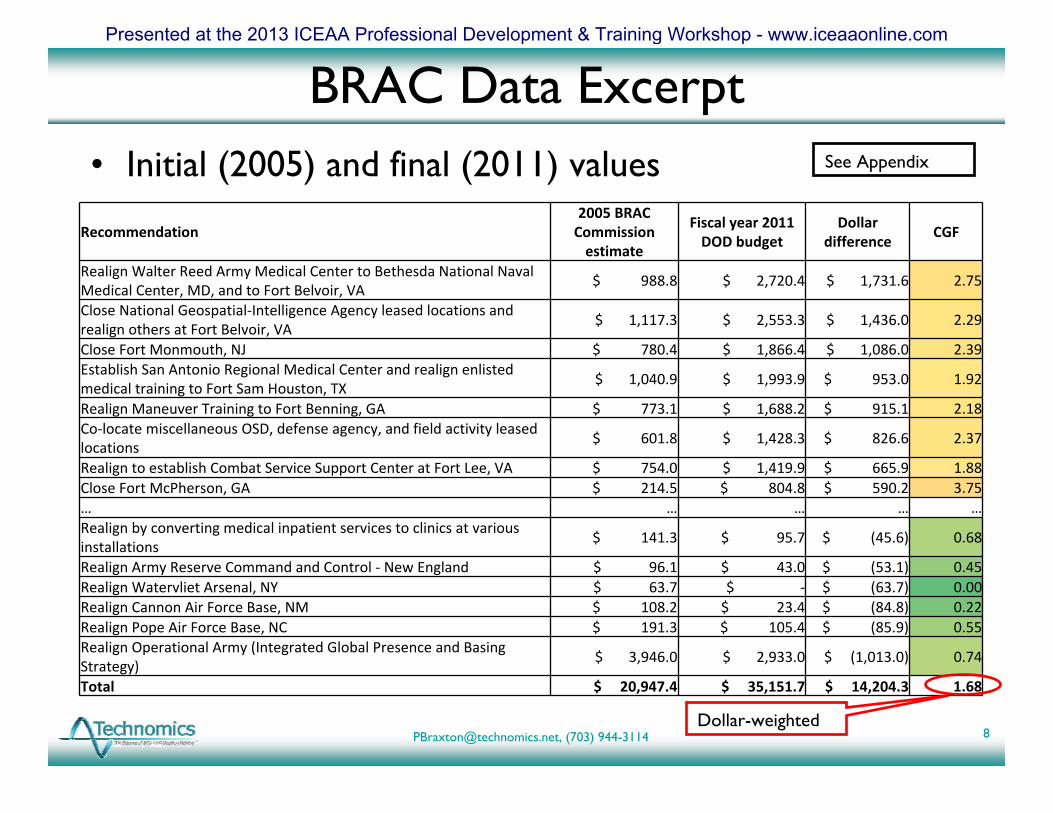
BRAC Data Excerpt• Initial (2005) and final (2011) values
8
Recommendation 2005 BRAC Commission estimate
Fiscal year 2011 DOD budget
Dollar difference
CGF
Realign Walter Reed Army Medical Center to Bethesda National Naval Medical Center, MD, and to Fort Belvoir, VA
$ 988.8 $ 2,720.4 $ 1,731.6 2.75
Close National Geospatial‐Intelligence Agency leased locations and realign others at Fort Belvoir, VA
$ 1,117.3 $ 2,553.3 $ 1,436.0 2.29
Close Fort Monmouth, NJ $ 780.4 $ 1,866.4 $ 1,086.0 2.39Establish San Antonio Regional Medical Center and realign enlisted medical training to Fort Sam Houston, TX
$ 1,040.9 $ 1,993.9 $ 953.0 1.92
Realign Maneuver Training to Fort Benning, GA $ 773.1 $ 1,688.2 $ 915.1 2.18Co‐locate miscellaneous OSD, defense agency, and field activity leased locations
$ 601.8 $ 1,428.3 $ 826.6 2.37
Realign to establish Combat Service Support Center at Fort Lee, VA $ 754.0 $ 1,419.9 $ 665.9 1.88Close Fort McPherson, GA $ 214.5 $ 804.8 $ 590.2 3.75… … … … …Realign by converting medical inpatient services to clinics at various installations
$ 141.3 $ 95.7 $ (45.6) 0.68
Realign Army Reserve Command and Control ‐ New England $ 96.1 $ 43.0 $ (53.1) 0.45Realign Watervliet Arsenal, NY $ 63.7 $ ‐ $ (63.7) 0.00Realign Cannon Air Force Base, NM $ 108.2 $ 23.4 $ (84.8) 0.22Realign Pope Air Force Base, NC $ 191.3 $ 105.4 $ (85.9) 0.55Realign Operational Army (Integrated Global Presence and Basing Strategy)
$ 3,946.0 $ 2,933.0 $ (1,013.0) 0.74
Total $ 20,947.4 $ 35,151.7 $ 14,204.3 1.68
See Appendix
Dollar-weighted
Presented at the 2013 ICEAA Professional Development & Training Workshop - www.iceaaonline.com
[email protected], (703) 944-3114
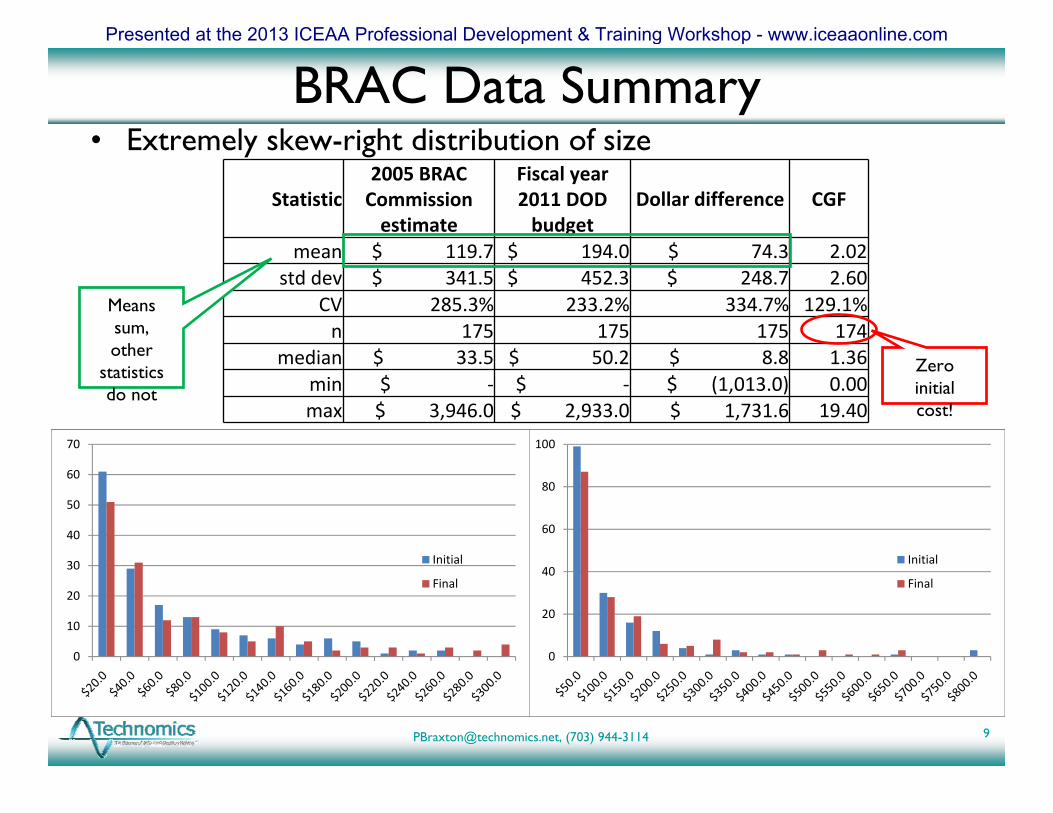
BRAC Data Summary• Extremely skew-right distribution of size
9
Statistic2005 BRAC Commission estimate
Fiscal year 2011 DOD budget
Dollar difference CGF
mean $ 119.7 $ 194.0 $ 74.3 2.02std dev $ 341.5 $ 452.3 $ 248.7 2.60
CV 285.3% 233.2% 334.7% 129.1%n 175 175 175 174
median $ 33.5 $ 50.2 $ 8.8 1.36min $ ‐ $ ‐ $ (1,013.0) 0.00max $ 3,946.0 $ 2,933.0 $ 1,731.6 19.40
Zero initial cost!
Means sum, other
statistics do not
0
20
40
60
80
100
Initial
Final
0
10
20
30
40
50
60
70
Initial
Final
Presented at the 2013 ICEAA Professional Development & Training Workshop - www.iceaaonline.com
[email protected], (703) 944-3114
$‐
$100
$200
$300
$400
$500
$600
$700
$800
$‐ $100 $200 $300 $400 $500 $600 $700 $800FY
2011 Bu
dget (T
Y$M)
2005 BRAC Estimate (TY$M)
$‐
$0.5
$1.0
$1.5
$2.0
$2.5
$3.0
$3.5
$4.0
$‐ $0.5 $1.0 $1.5 $2.0 $2.5 $3.0 $3.5 $4.0
FY 2011 Bu
dget (T
Y$B)
2005 BRAC Estimate (TY$B)
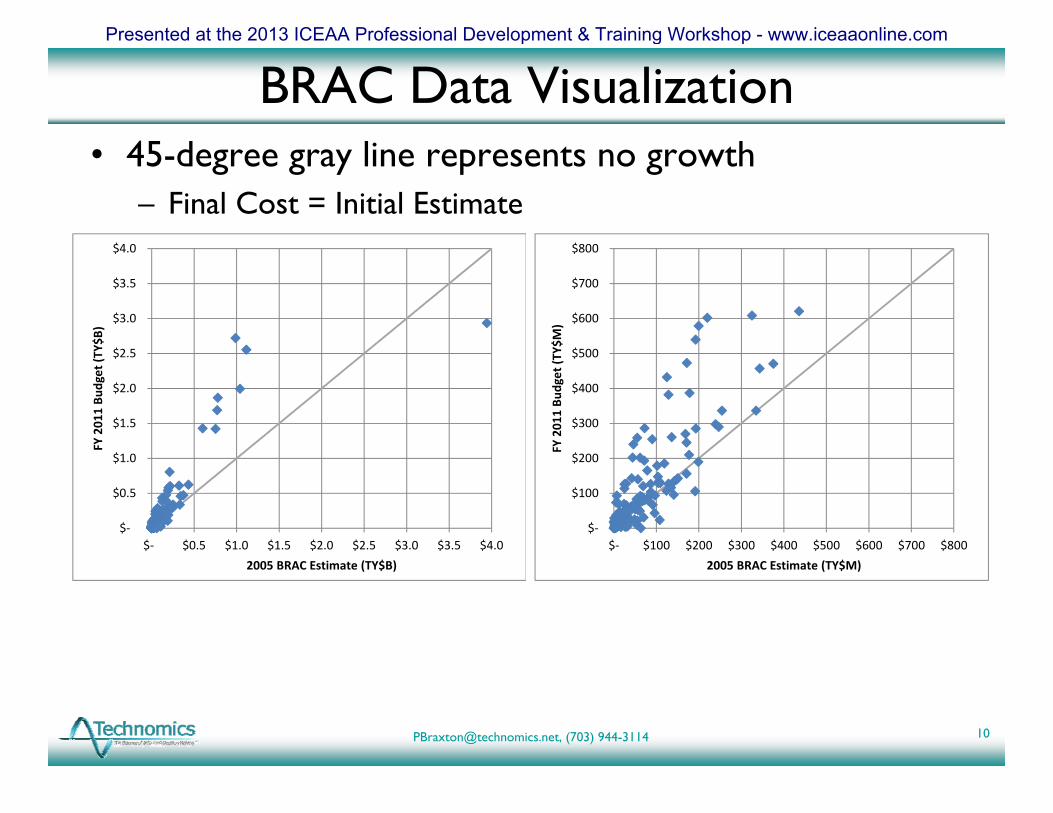
BRAC Data Visualization• 45-degree gray line represents no growth
– Final Cost = Initial Estimate
10
Presented at the 2013 ICEAA Professional Development & Training Workshop - www.iceaaonline.com
[email protected], (703) 944-3114
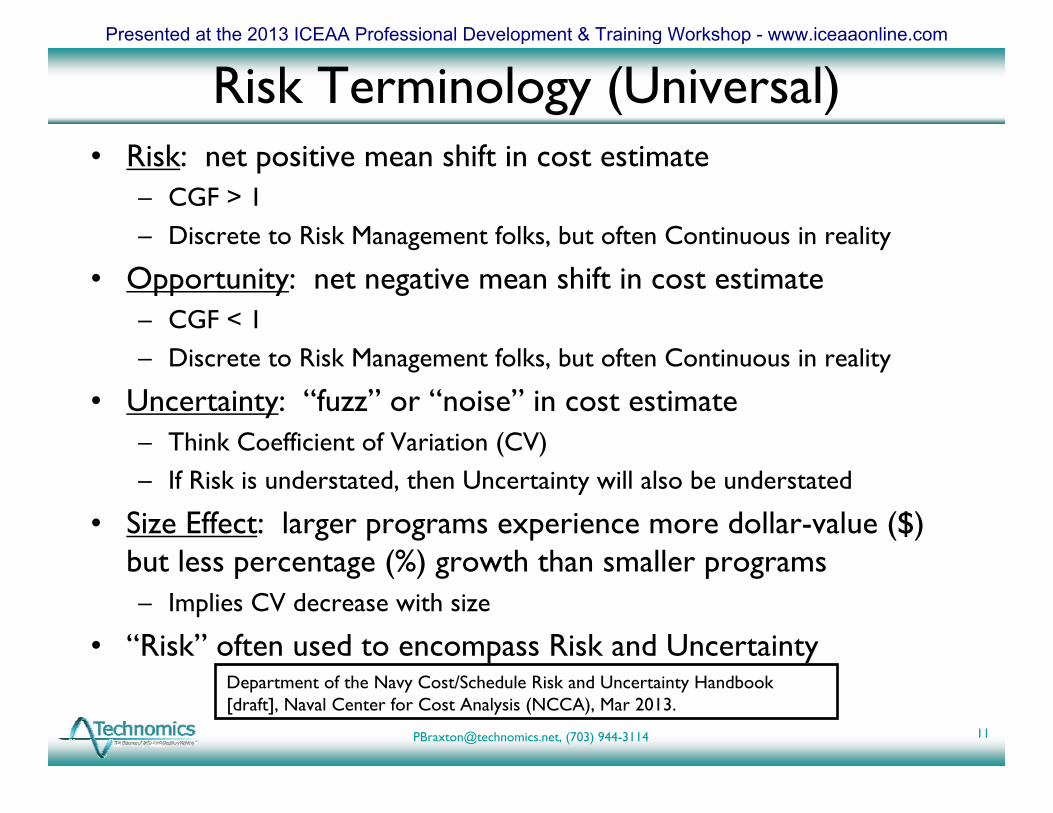
Risk Terminology (Universal)• Risk: net positive mean shift in cost estimate
– CGF > 1– Discrete to Risk Management folks, but often Continuous in reality
• Opportunity: net negative mean shift in cost estimate– CGF < 1– Discrete to Risk Management folks, but often Continuous in reality
• Uncertainty: “fuzz” or “noise” in cost estimate– Think Coefficient of Variation (CV)– If Risk is understated, then Uncertainty will also be understated
• Size Effect: larger programs experience more dollar-value ($) but less percentage (%) growth than smaller programs– Implies CV decrease with size
• “Risk” often used to encompass Risk and Uncertainty
11
Department of the Navy Cost/Schedule Risk and Uncertainty Handbook [draft], Naval Center for Cost Analysis (NCCA), Mar 2013.
Presented at the 2013 ICEAA Professional Development & Training Workshop - www.iceaaonline.com
[email protected], (703) 944-3114
Risk Terminology (Idiosyncratic)• Non-Repeatable Experiment: we only build each system or
execute each program once– Outcome arises from a probability distribution, which we’d like to infer
• Pseudo-IID Thought Process: treating risk data as independent and identically distributed (IID), when we know they ain’t!– IID good for heights of adult male cost estimators, not cost estimates– Problematic even for the same program
• Learning curve for Production, cyclical and age effects for Operating and Support (O&S)
• Perils of Portability: cost factors and CVs, while convenient and intuitive, are often statistically ill-behaved– Good for descriptive, not inferential, statistics!
• The Risk Tail Chase: Catch-22 in which risk is “added” to estimate because historical estimates – many of which include risk! – are biased low– Still preferred to not adjusting…
12
“Our estimate [ICE] is always the highest, and it’s never high enough!”
Presented at the 2013 ICEAA Professional Development & Training Workshop - www.iceaaonline.com
[email protected], (703) 944-3114
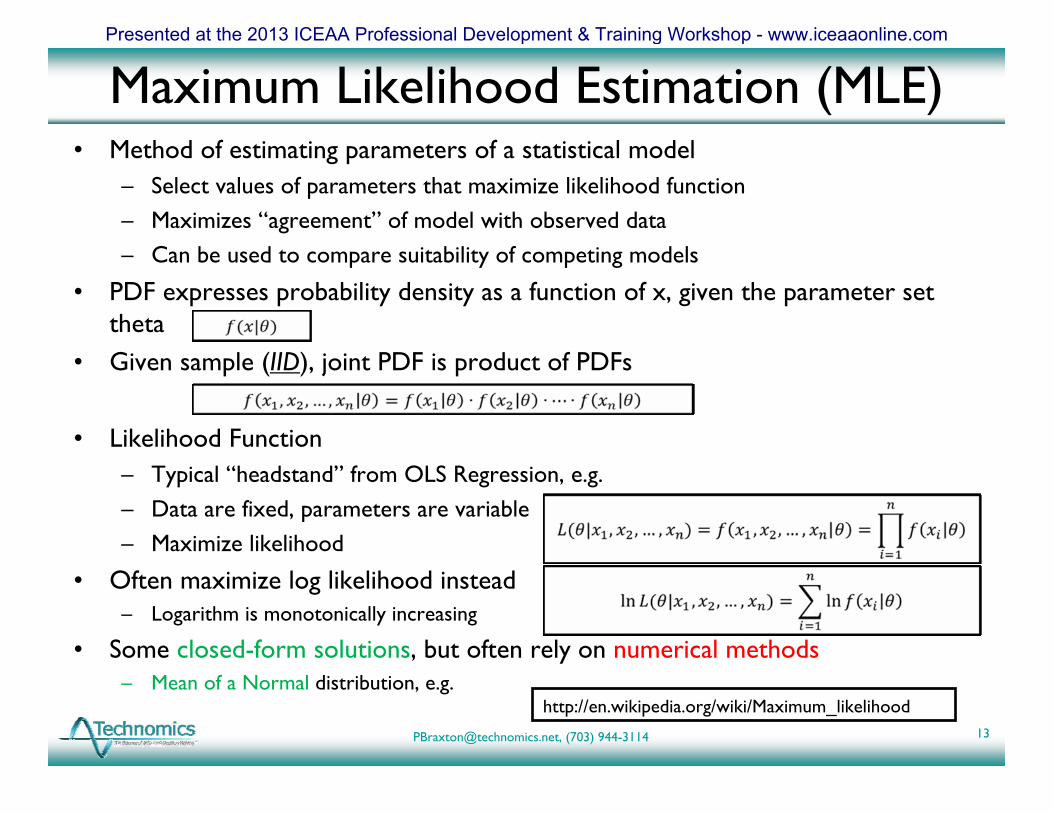
Maximum Likelihood Estimation (MLE)• Method of estimating parameters of a statistical model
– Select values of parameters that maximize likelihood function– Maximizes “agreement” of model with observed data– Can be used to compare suitability of competing models
• PDF expresses probability density as a function of x, given the parameter set theta
• Given sample (IID), joint PDF is product of PDFs
• Likelihood Function– Typical “headstand” from OLS Regression, e.g.– Data are fixed, parameters are variable– Maximize likelihood
• Often maximize log likelihood instead– Logarithm is monotonically increasing
• Some closed-form solutions, but often rely on numerical methods– Mean of a Normal distribution, e.g.
13
http://en.wikipedia.org/wiki/Maximum_likelihood
Presented at the 2013 ICEAA Professional Development & Training Workshop - www.iceaaonline.com
[email protected], (703) 944-3114
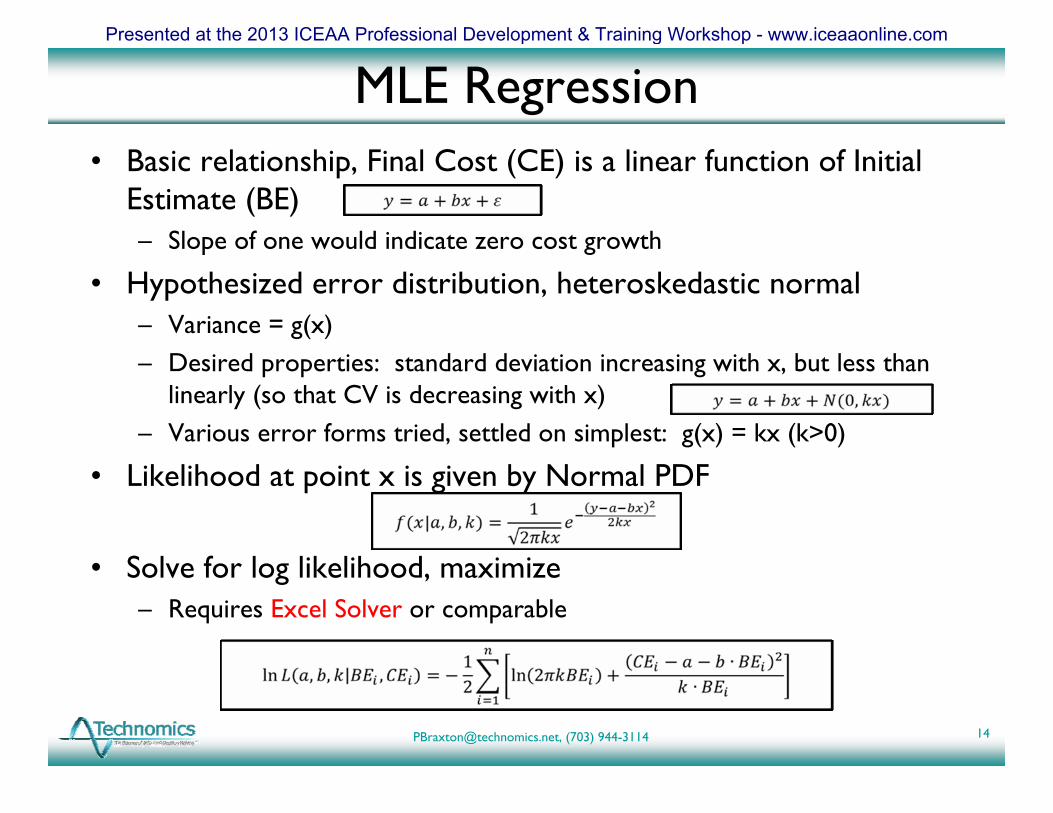
MLE Regression• Basic relationship, Final Cost (CE) is a linear function of Initial
Estimate (BE)– Slope of one would indicate zero cost growth
• Hypothesized error distribution, heteroskedastic normal– Variance = g(x)– Desired properties: standard deviation increasing with x, but less than
linearly (so that CV is decreasing with x)– Various error forms tried, settled on simplest: g(x) = kx (k>0)
• Likelihood at point x is given by Normal PDF
• Solve for log likelihood, maximize– Requires Excel Solver or comparable
14
Presented at the 2013 ICEAA Professional Development & Training Workshop - www.iceaaonline.com
[email protected], (703) 944-3114
BRAC Data Risk Modeling
• Scatter plots– Show Cost Growth and Variability
• CV graphs– Show Size Effect– Cf. CV of CGFs
• Normalized residuals– Test suitability of error term model– Empirical cumulative distribution function (CDF)
and Kolmogorov-Smirnov (K-S) test
15
Presented at the 2013 ICEAA Professional Development & Training Workshop - www.iceaaonline.com
[email protected], (703) 944-3114
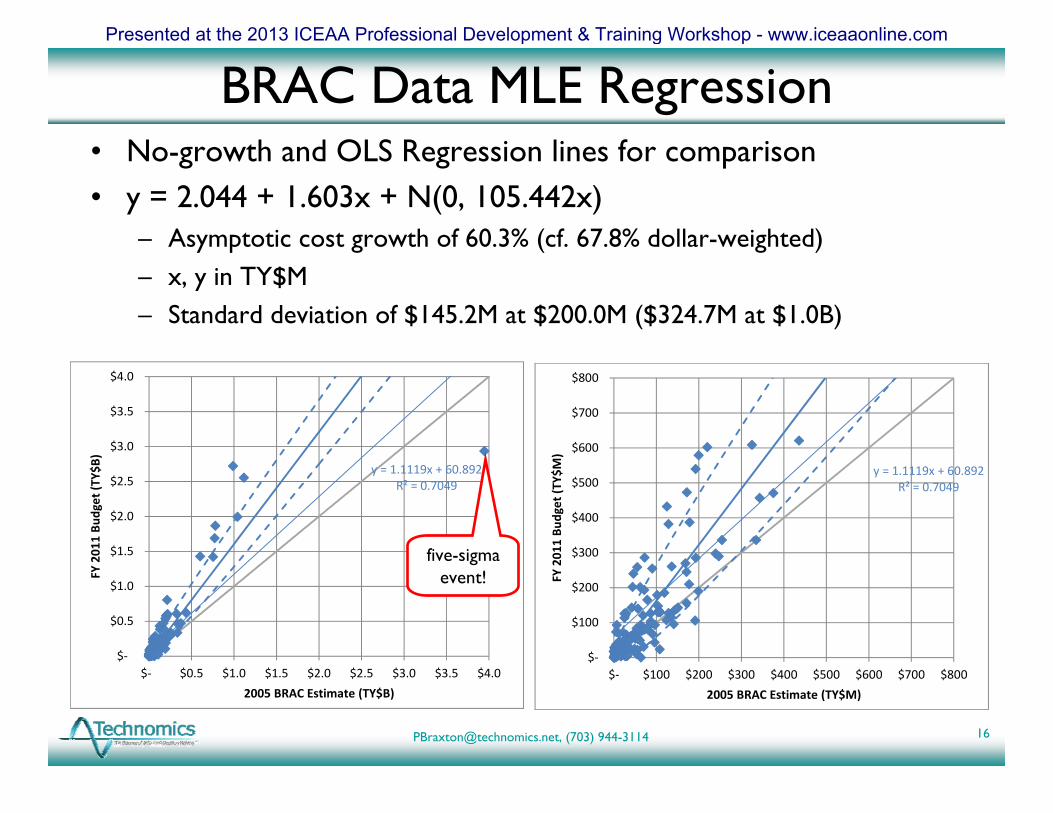
BRAC Data MLE Regression• No-growth and OLS Regression lines for comparison• y = 2.044 + 1.603x + N(0, 105.442x)
– Asymptotic cost growth of 60.3% (cf. 67.8% dollar-weighted)– x, y in TY$M– Standard deviation of $145.2M at $200.0M ($324.7M at $1.0B)
16
y = 1.1119x + 60.892R² = 0.7049
$‐
$100
$200
$300
$400
$500
$600
$700
$800
$‐ $100 $200 $300 $400 $500 $600 $700 $800
FY 2011 Bu
dget (T
Y$M)
2005 BRAC Estimate (TY$M)
y = 1.1119x + 60.892R² = 0.7049
$‐
$0.5
$1.0
$1.5
$2.0
$2.5
$3.0
$3.5
$4.0
$‐ $0.5 $1.0 $1.5 $2.0 $2.5 $3.0 $3.5 $4.0
FY 2011 Bu
dget (T
Y$B)
2005 BRAC Estimate (TY$B)
five-sigma event!
Presented at the 2013 ICEAA Professional Development & Training Workshop - www.iceaaonline.com
[email protected], (703) 944-3114
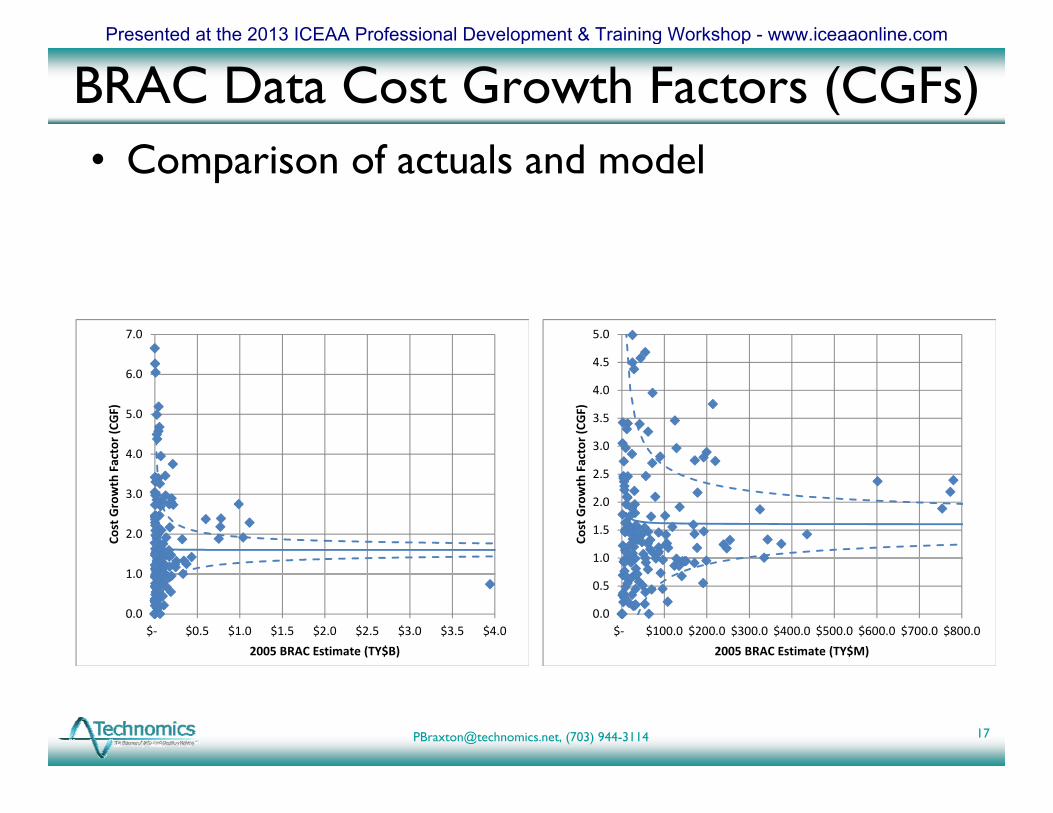
BRAC Data Cost Growth Factors (CGFs)• Comparison of actuals and model
17
0.0
0.5
1.0
1.5
2.0
2.5
3.0
3.5
4.0
4.5
5.0
$‐ $100.0 $200.0 $300.0 $400.0 $500.0 $600.0 $700.0 $800.0
Cost Growth Factor (CGF)
2005 BRAC Estimate (TY$M)
0.0
1.0
2.0
3.0
4.0
5.0
6.0
7.0
$‐ $0.5 $1.0 $1.5 $2.0 $2.5 $3.0 $3.5 $4.0
Cost Growth Factor (CGF)
2005 BRAC Estimate (TY$B)
Presented at the 2013 ICEAA Professional Development & Training Workshop - www.iceaaonline.com
[email protected], (703) 944-3114
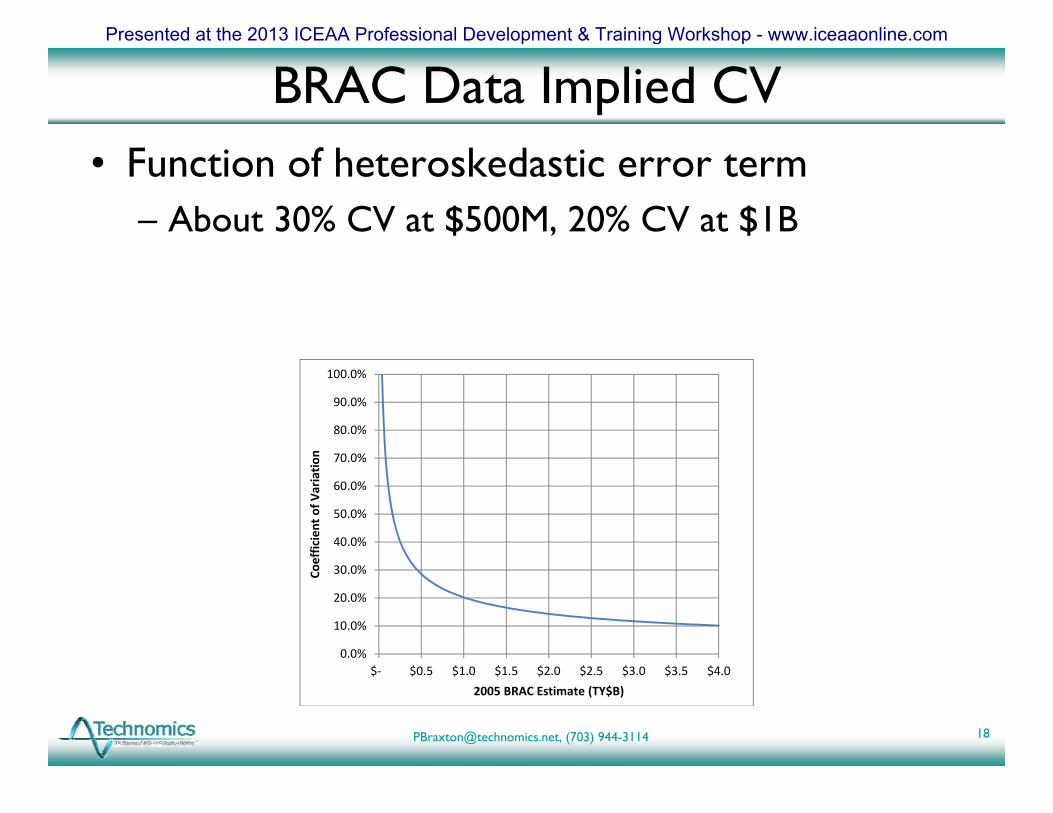
BRAC Data Implied CV• Function of heteroskedastic error term
– About 30% CV at $500M, 20% CV at $1B
18
0.0%
10.0%
20.0%
30.0%
40.0%
50.0%
60.0%
70.0%
80.0%
90.0%
100.0%
$‐ $0.5 $1.0 $1.5 $2.0 $2.5 $3.0 $3.5 $4.0
Coefficient of V
ariation
2005 BRAC Estimate (TY$B)
Presented at the 2013 ICEAA Professional Development & Training Workshop - www.iceaaonline.com
[email protected], (703) 944-3114
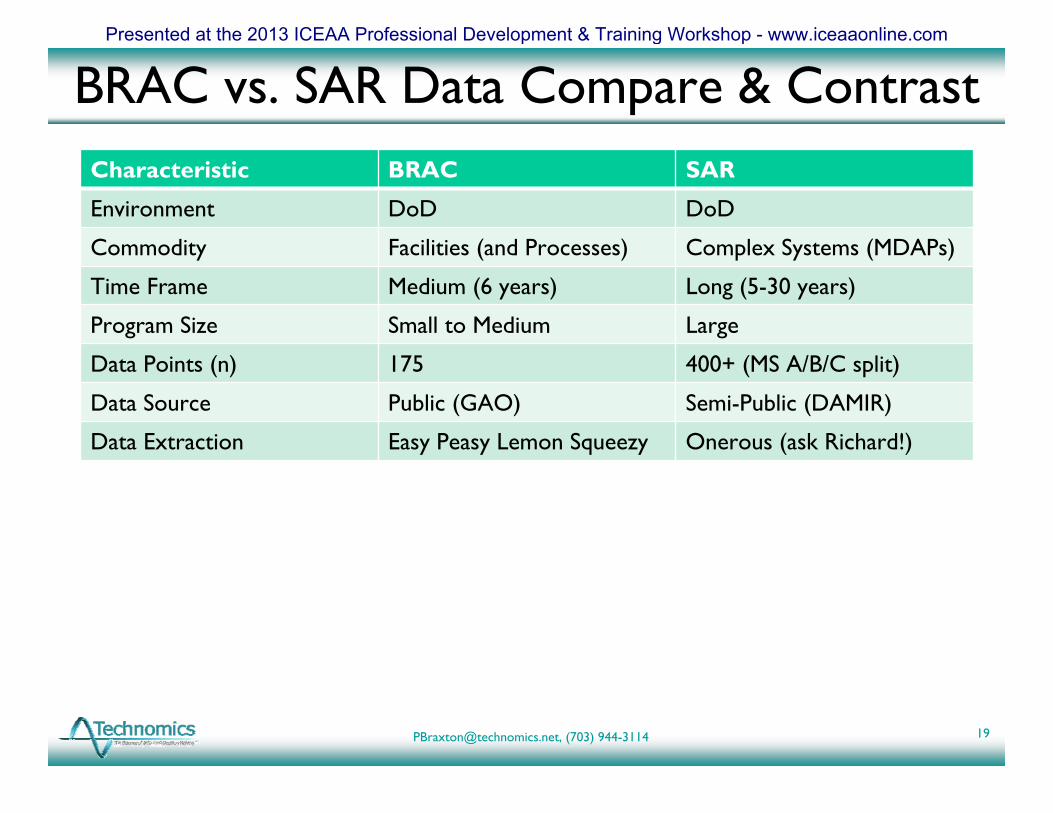
BRAC vs. SAR Data Compare & ContrastCharacteristic BRAC SAR
Environment DoD DoD
Commodity Facilities (and Processes) Complex Systems (MDAPs)
Time Frame Medium (6 years) Long (5-30 years)
Program Size Small to Medium Large
Data Points (n) 175 400+ (MS A/B/C split)
Data Source Public (GAO) Semi-Public (DAMIR)
Data Extraction Easy Peasy Lemon Squeezy Onerous (ask Richard!)
19
Presented at the 2013 ICEAA Professional Development & Training Workshop - www.iceaaonline.com
[email protected], (703) 944-3114
y = 1.0363x + 1995.7R² = 0.8758
$‐
$5.0
$10.0
$15.0
$20.0
$25.0
$30.0
$35.0
$40.0
$45.0
$50.0
$‐ $5.0 $10.0 $15.0 $20.0 $25.0 $30.0 $35.0 $40.0 $45.0 $50.0
Curren
t Estim
ate (CE) ($
B)
Baseline Estimate (BE) ($B)
MS B DON Acq (Fisher TY$)
MS B DON Acq
MLE
MLE‐1s
MLE+1s
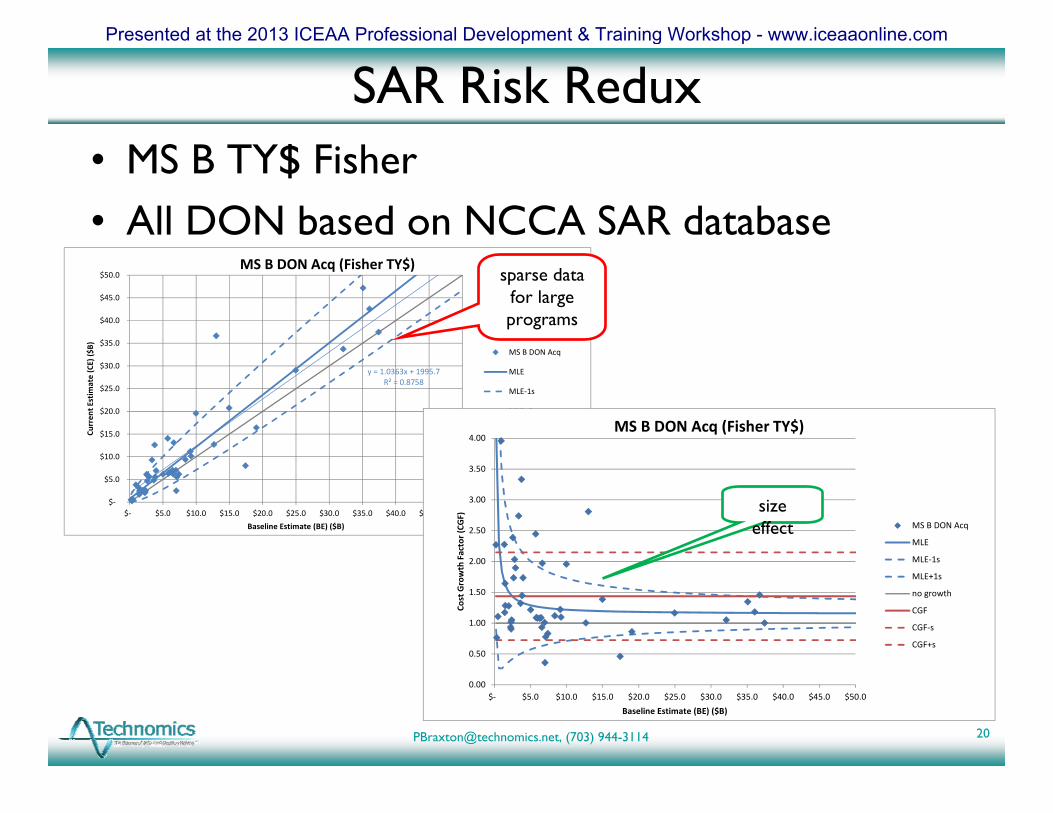
SAR Risk Redux• MS B TY$ Fisher• All DON based on NCCA SAR database
20
sparse data for large programs
0.00
0.50
1.00
1.50
2.00
2.50
3.00
3.50
4.00
$‐ $5.0 $10.0 $15.0 $20.0 $25.0 $30.0 $35.0 $40.0 $45.0 $50.0
Cost Growth Factor (CGF)
Baseline Estimate (BE) ($B)
MS B DON Acq (Fisher TY$)
MS B DON Acq
MLE
MLE‐1s
MLE+1s
no growth
CGF
CGF‐s
CGF+s
size effect
Presented at the 2013 ICEAA Professional Development & Training Workshop - www.iceaaonline.com
[email protected], (703) 944-3114
Aha! Graphics (Patterns R Us)
• Use real-world data• Provide two levels of insight
– What?! Instantaneous gut reaction– Why? Not coincidental, maybe even obvious (in
retrospect)
• May involve (or lead to) a novel conceptual model– Model often takes a different form than the graphic
that provided the original insight and impetus
21
Frida = “I Know There’s Something Going on”
Presented at the 2013 ICEAA Professional Development & Training Workshop - www.iceaaonline.com
[email protected], (703) 944-3114
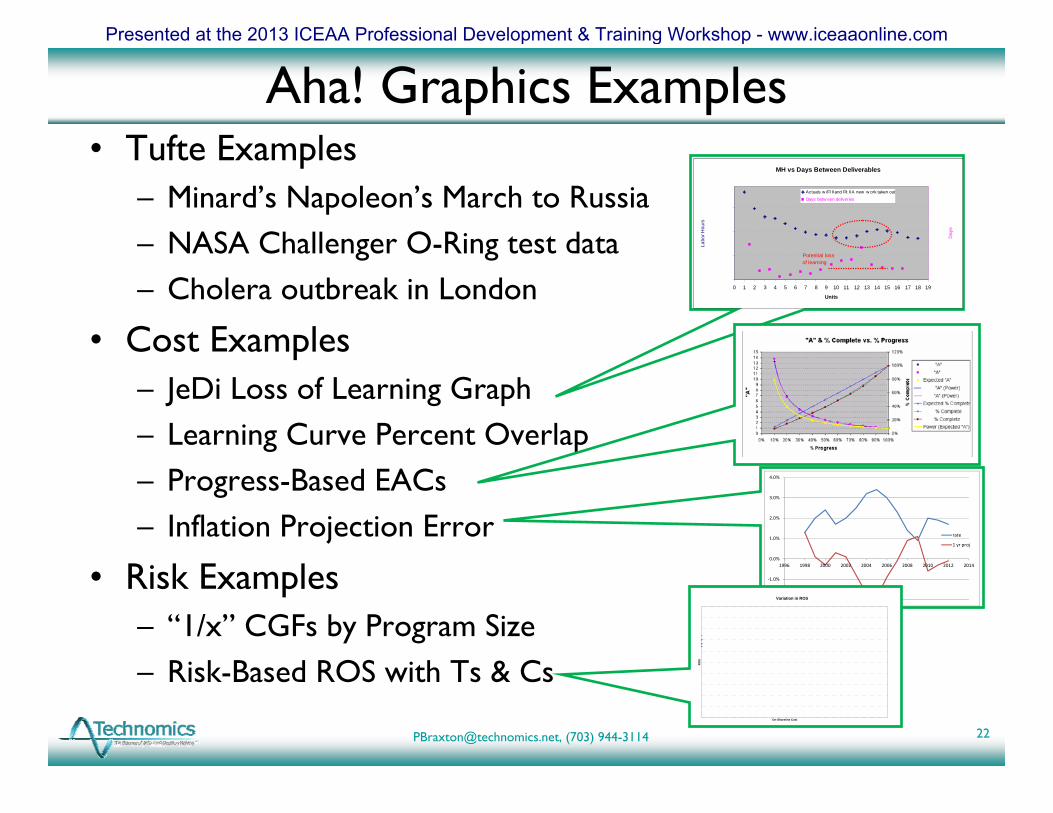
• Tufte Examples– Minard’s Napoleon’s March to Russia– NASA Challenger O-Ring test data– Cholera outbreak in London
• Cost Examples– JeDi Loss of Learning Graph– Learning Curve Percent Overlap– Progress-Based EACs– Inflation Projection Error
• Risk Examples– “1/x” CGFs by Program Size– Risk-Based ROS with Ts & Cs
Aha! Graphics Examples
22
MH vs Days Between Deliverables
1,000,000
2,300,000
3,600,000
4,900,000
0 1 2 3 4 5 6 7 8 9 10 11 12 13 14 15 16 17 18 19
Units
Labo
r Hou
rs
-
210
420
630
840
1,050
1,260
1,470
Day
s
Actuals w /Fl II and Flt II A new w ork taken outDays betw een deliveries
Potential loss of learning
‐2.0%
‐1.0%
0.0%
1.0%
2.0%
3.0%
4.0%
1996 1998 2000 2002 2004 2006 2008 2010 2012 2014
rate
1 yr proj
Variation in ROS
On-Shareline Cost
RO
S
Presented at the 2013 ICEAA Professional Development & Training Workshop - www.iceaaonline.com
[email protected], (703) 944-3114
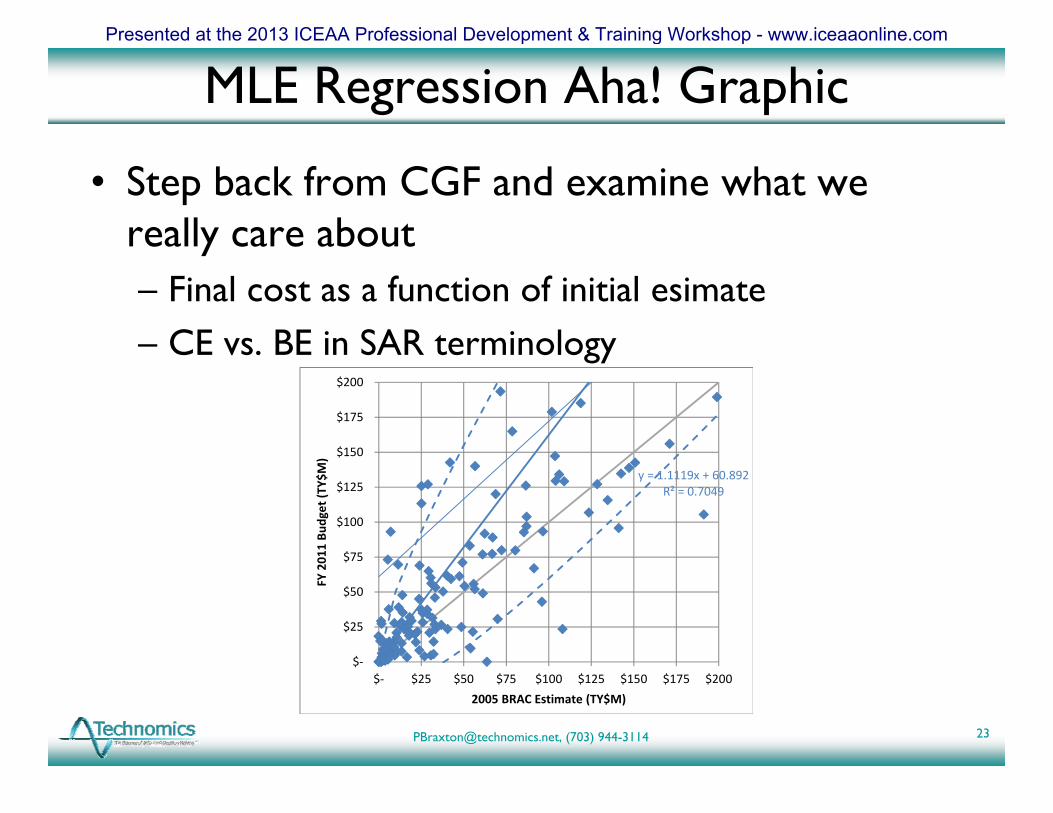
MLE Regression Aha! Graphic
• Step back from CGF and examine what we really care about– Final cost as a function of initial esimate– CE vs. BE in SAR terminology
23
y = 1.1119x + 60.892R² = 0.7049
$‐
$25
$50
$75
$100
$125
$150
$175
$200
$‐ $25 $50 $75 $100 $125 $150 $175 $200
FY 2011 Bu
dget (T
Y$M)
2005 BRAC Estimate (TY$M)
Presented at the 2013 ICEAA Professional Development & Training Workshop - www.iceaaonline.com
[email protected], (703) 944-3114
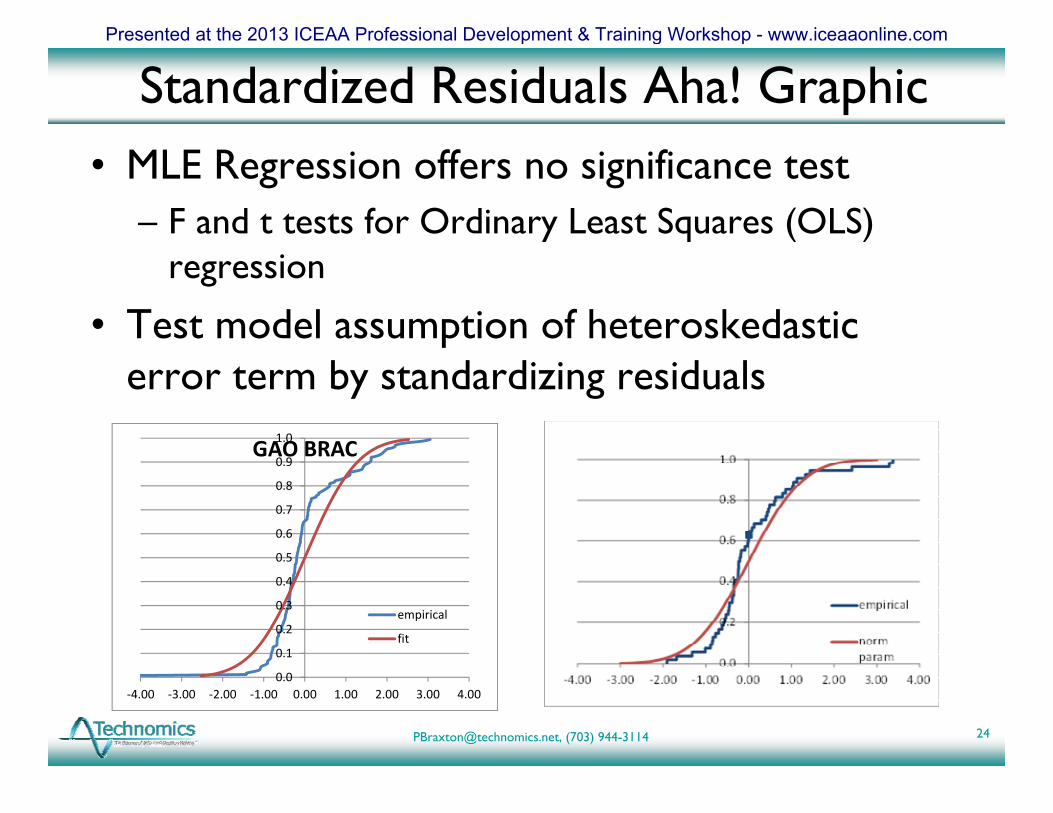
Standardized Residuals Aha! Graphic• MLE Regression offers no significance test
– F and t tests for Ordinary Least Squares (OLS) regression
• Test model assumption of heteroskedastic error term by standardizing residuals
24
0.0
0.1
0.2
0.3
0.4
0.5
0.6
0.7
0.8
0.9
1.0
‐4.00 ‐3.00 ‐2.00 ‐1.00 0.00 1.00 2.00 3.00 4.00
GAO BRAC
empirical
fit
Presented at the 2013 ICEAA Professional Development & Training Workshop - www.iceaaonline.com
[email protected], (703) 944-3114
Meta Analysis
• Scientific Examples– Medical studies (multiple independent trials)– Diminished power of follow-up studies (a meta meta
analysis?!)
• Cost Examples– Advanced Learning Model (ALM) DDG and LHD– Reserving a portion of data for CER validation
25
I never meta analysis I didn’t like!
Presented at the 2013 ICEAA Professional Development & Training Workshop - www.iceaaonline.com
[email protected], (703) 944-3114
Cross-Program Data
• Risk Principle #3: Risk data always represent a collection of non-repeatable experiments
• Risk Principle #4: More so than Cost, in Risk we need to expand our dataset as much as possible– Disparate commodities, similar acquisition process
• One or more risk drivers: risk score (BMDO), program size (NCCA), Technology Readiness Level (TRL)
26
Presented at the 2013 ICEAA Professional Development & Training Workshop - www.iceaaonline.com
[email protected], (703) 944-3114
Within-Program Risk
• Mean (first moment)– CGF = risk dollars
• Standard deviation (second moment)– CV = contingency planning
• Distribution (subsequent moments)– Skew, kurtosis = portfolio management
27
Presented at the 2013 ICEAA Professional Development & Training Workshop - www.iceaaonline.com
[email protected], (703) 944-3114
Conclusions
• BRAC and SAR data are stunningly similar• Pseudo-IID thought process is not appropriate when
clearly violated by the data (e.g., size effect)• MLE Regression model infers within-program risk from cross-
program data• Standardized residuals enable significance test for assumed error
distribution
28
Presented at the 2013 ICEAA Professional Development & Training Workshop - www.iceaaonline.com
[email protected], (703) 944-3114
Road Ahead• Rerun BRAC data with “outlier” removed• MLE Regression for Lognormal error model• Use similar model to examine BRAC operational
savings shrinkage– Cost growth on negative costs!
• Seek similar data from earlier rounds of BRAC• Use size effect model as more of a normalization step,
and seek another primary Risk Driver– Risk Score, e.g.
• Investigate interaction of size and quantity effects for MDAPs
29
Presented at the 2013 ICEAA Professional Development & Training Workshop - www.iceaaonline.com
[email protected], (703) 944-3114
Bibliography• “Development and Application of CV Benchmarks,” Brian J. Flynn, Paul R. Garvey,
Peter J. Braxton, Richard C. Lee, DoDCAS, 2011• “Testing S-Curves for Reasonableness: The NCCA S-Curve Tool,” Richard L.
Coleman, Peter J. Braxton, Richard C. Lee, Brian J. Flynn, Hampton Roads SCEA Chapter, DoDCAS 2011, SCEA/ISPA 2011
• “The Perils of Portability: CGFs and CVs,” Peter J. Braxton, Richard C. Lee, Kevin Cincotta, John S. Smuck, Megan E. Guild, Richard L. Coleman, Brian J. Flynn, SCEA/ISPA 2011
• “Probability Distributions for Risk Analysis,” Peter J. Braxton, Travis C. Manning, Luke H. Sayer, SCEA/ISPA 2011, 2012, ICEAA 2013
• “CV Benchmarks and the NCCA S-Curve Tool: An Update” (poster presentation), Richard C. Lee, Peter J. Braxton, Kevin Cincotta, Brian J. Flynn, Benjamin F. Breaux, DoDCAS 2012
• “SAR Data Analysis, CV Benchmarks, and the Updated NCCA S-Curve Tool,”Richard C. Lee, Peter J. Braxton, Kevin Cincotta, Brian J. Flynn, Benjamin F. Breaux, ISPA/SCEA 2012
• “Enhanced Scenario-Based Method for Cost Risk Analysis: Theory, Application, and Implementation” Paul R. Garvey, Brian J. Flynn, Peter J. Braxton, Richard C. Lee, ISPA/SCEA 2012, Journal of Cost Analysis and Parametrics
30
Presented at the 2013 ICEAA Professional Development & Training Workshop - www.iceaaonline.com
Base Realignment and Closure (BRAC) Savings and Acquisition Risk
BACKUP
31
Presented at the 2013 ICEAA Professional Development & Training Workshop - www.iceaaonline.com
[email protected], (703) 944-3114
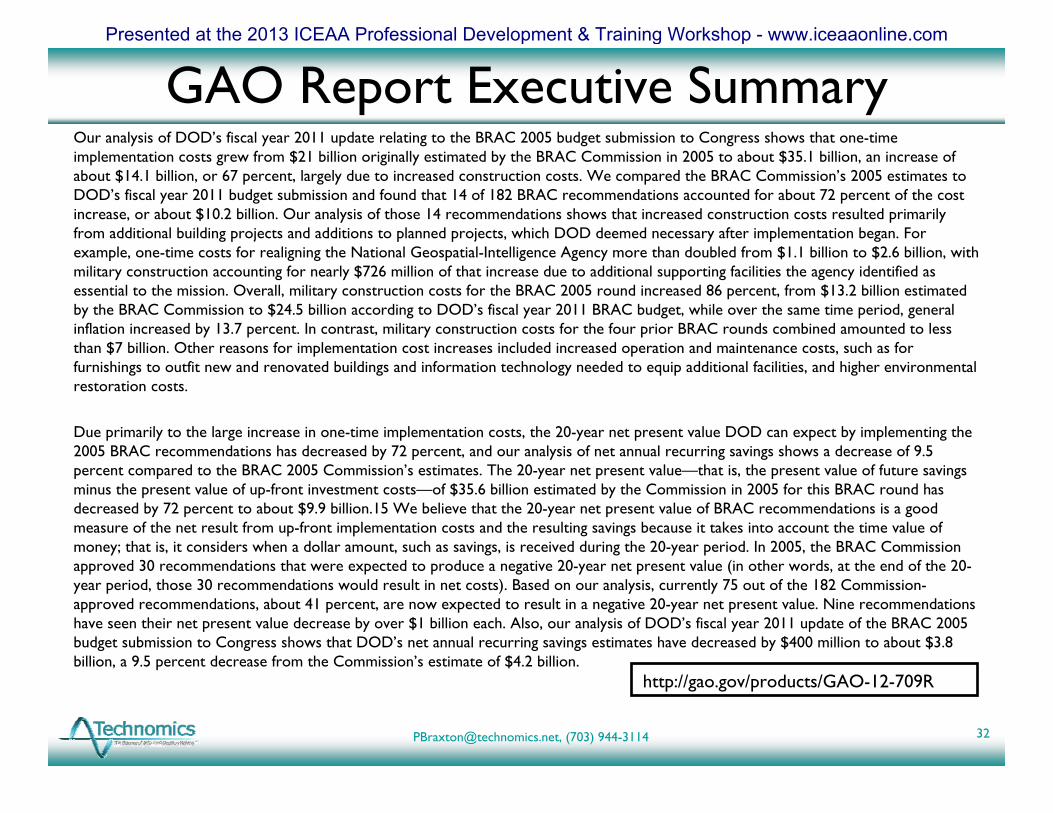
GAO Report Executive SummaryOur analysis of DOD’s fiscal year 2011 update relating to the BRAC 2005 budget submission to Congress shows that one-time implementation costs grew from $21 billion originally estimated by the BRAC Commission in 2005 to about $35.1 billion, an increase of about $14.1 billion, or 67 percent, largely due to increased construction costs. We compared the BRAC Commission’s 2005 estimates to DOD’s fiscal year 2011 budget submission and found that 14 of 182 BRAC recommendations accounted for about 72 percent of the cost increase, or about $10.2 billion. Our analysis of those 14 recommendations shows that increased construction costs resulted primarily from additional building projects and additions to planned projects, which DOD deemed necessary after implementation began. For example, one-time costs for realigning the National Geospatial-Intelligence Agency more than doubled from $1.1 billion to $2.6 billion, with military construction accounting for nearly $726 million of that increase due to additional supporting facilities the agency identified as essential to the mission. Overall, military construction costs for the BRAC 2005 round increased 86 percent, from $13.2 billion estimated by the BRAC Commission to $24.5 billion according to DOD’s fiscal year 2011 BRAC budget, while over the same time period, general inflation increased by 13.7 percent. In contrast, military construction costs for the four prior BRAC rounds combined amounted to less than $7 billion. Other reasons for implementation cost increases included increased operation and maintenance costs, such as forfurnishings to outfit new and renovated buildings and information technology needed to equip additional facilities, and higher environmental restoration costs.
Due primarily to the large increase in one-time implementation costs, the 20-year net present value DOD can expect by implementing the 2005 BRAC recommendations has decreased by 72 percent, and our analysis of net annual recurring savings shows a decrease of 9.5 percent compared to the BRAC 2005 Commission’s estimates. The 20-year net present value—that is, the present value of future savings minus the present value of up-front investment costs—of $35.6 billion estimated by the Commission in 2005 for this BRAC round has decreased by 72 percent to about $9.9 billion.15 We believe that the 20-year net present value of BRAC recommendations is a good measure of the net result from up-front implementation costs and the resulting savings because it takes into account the time value of money; that is, it considers when a dollar amount, such as savings, is received during the 20-year period. In 2005, the BRAC Commission approved 30 recommendations that were expected to produce a negative 20-year net present value (in other words, at the end of the 20-year period, those 30 recommendations would result in net costs). Based on our analysis, currently 75 out of the 182 Commission-approved recommendations, about 41 percent, are now expected to result in a negative 20-year net present value. Nine recommendations have seen their net present value decrease by over $1 billion each. Also, our analysis of DOD’s fiscal year 2011 update of the BRAC 2005 budget submission to Congress shows that DOD’s net annual recurring savings estimates have decreased by $400 million to about $3.8 billion, a 9.5 percent decrease from the Commission’s estimate of $4.2 billion.
32
http://gao.gov/products/GAO-12-709R
Presented at the 2013 ICEAA Professional Development & Training Workshop - www.iceaaonline.com
[email protected], (703) 944-3114
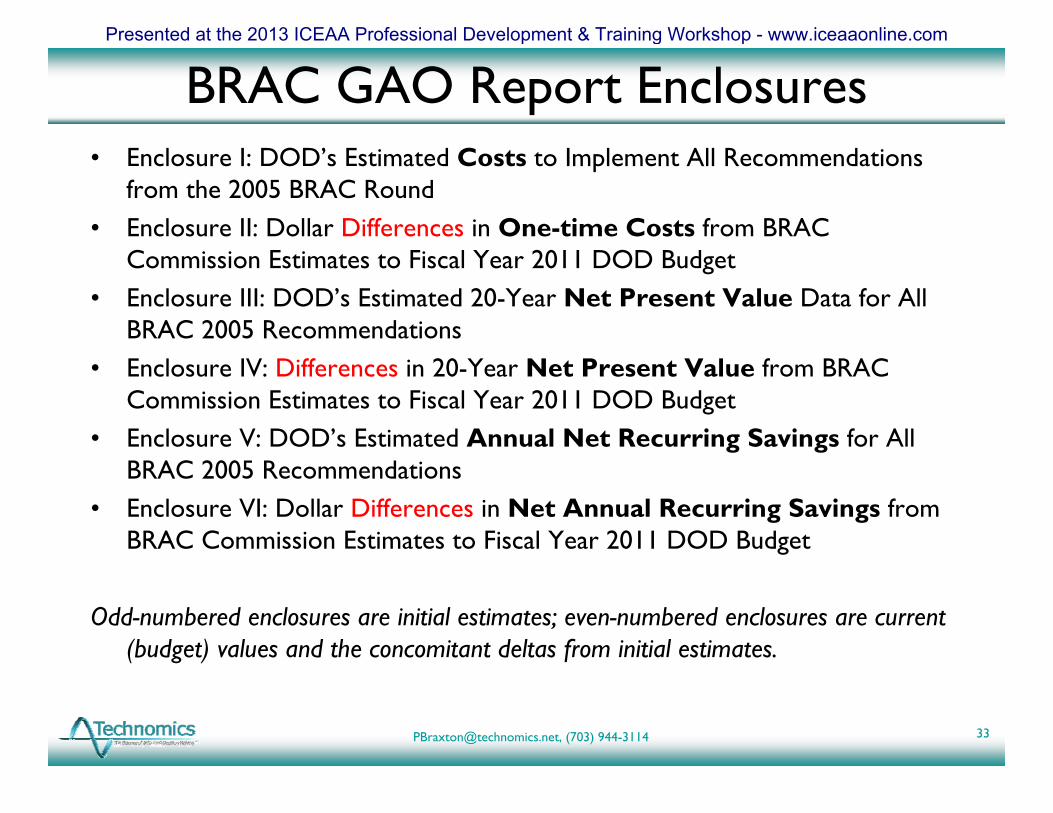
BRAC GAO Report Enclosures• Enclosure I: DOD’s Estimated Costs to Implement All Recommendations
from the 2005 BRAC Round• Enclosure II: Dollar Differences in One-time Costs from BRAC
Commission Estimates to Fiscal Year 2011 DOD Budget• Enclosure III: DOD’s Estimated 20-Year Net Present Value Data for All
BRAC 2005 Recommendations• Enclosure IV: Differences in 20-Year Net Present Value from BRAC
Commission Estimates to Fiscal Year 2011 DOD Budget• Enclosure V: DOD’s Estimated Annual Net Recurring Savings for All
BRAC 2005 Recommendations• Enclosure VI: Dollar Differences in Net Annual Recurring Savings from
BRAC Commission Estimates to Fiscal Year 2011 DOD Budget
Odd-numbered enclosures are initial estimates; even-numbered enclosures are current (budget) values and the concomitant deltas from initial estimates.
33
Presented at the 2013 ICEAA Professional Development & Training Workshop - www.iceaaonline.com