Embed Size (px)
Citation preview
THE DISTANCE-TIME RELATIONSHIP
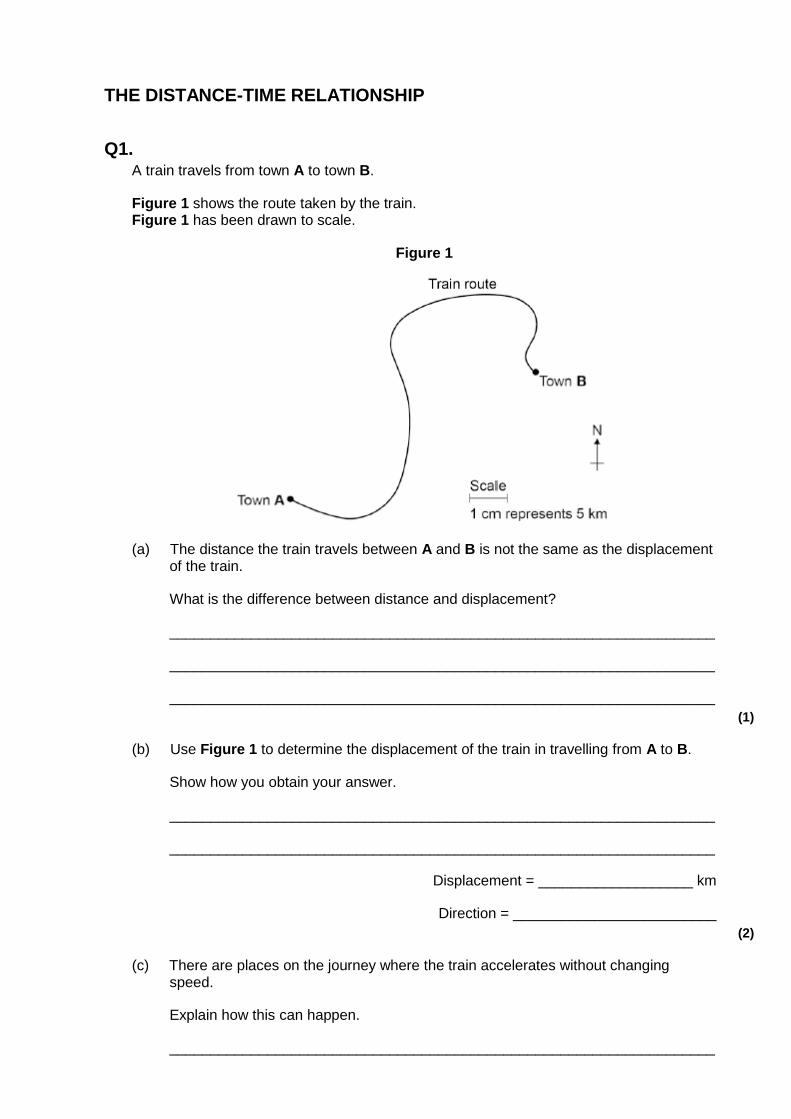
Q1. A train travels from town A to town B.
Figure 1 shows the route taken by the train. Figure 1 has been drawn to scale.
Figure 1
(a) The distance the train travels between A and B is not the same as the displacement of the train.
What is the difference between distance and displacement?
___________________________________________________________________
___________________________________________________________________
___________________________________________________________________
(1)
(b) Use Figure 1 to determine the displacement of the train in travelling from A to B.
Show how you obtain your answer.
___________________________________________________________________
___________________________________________________________________
Displacement = ___________________ km
Direction = _________________________
(2)
(c) There are places on the journey where the train accelerates without changing speed.
Explain how this can happen.
___________________________________________________________________
___________________________________________________________________
___________________________________________________________________
___________________________________________________________________
(2)
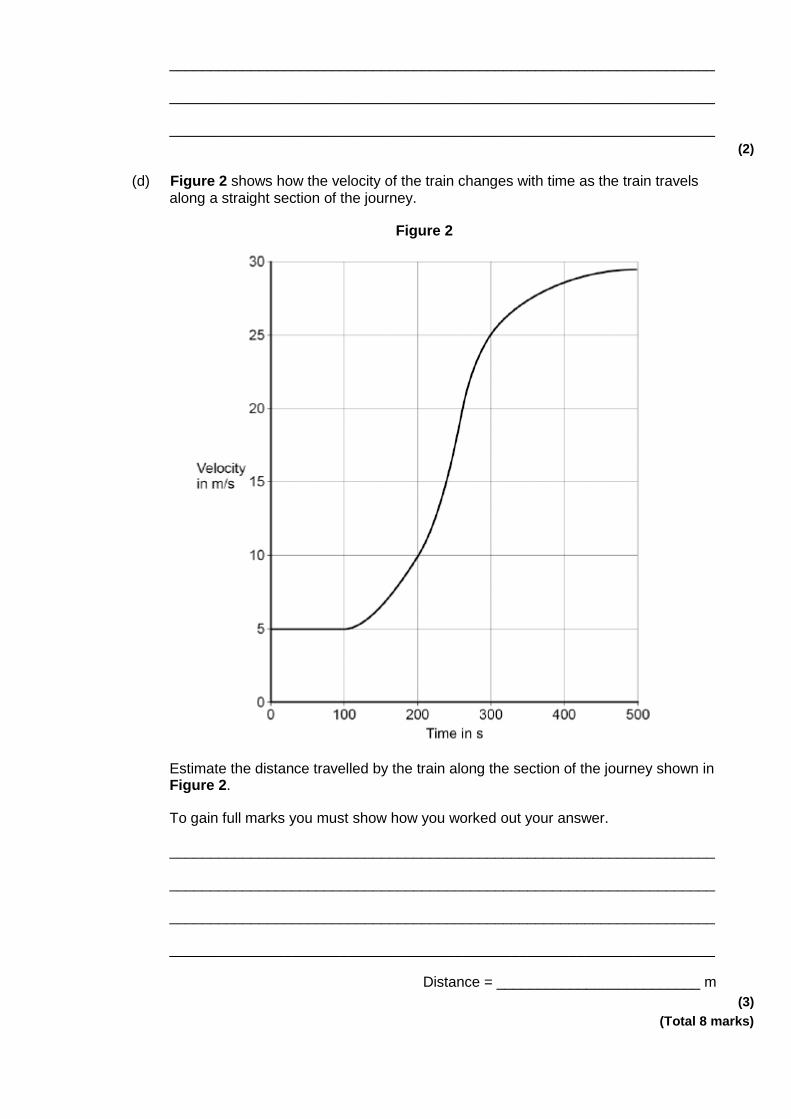
(d) Figure 2 shows how the velocity of the train changes with time as the train travels along a straight section of the journey.
Figure 2
Estimate the distance travelled by the train along the section of the journey shown in Figure 2.
To gain full marks you must show how you worked out your answer.
___________________________________________________________________
___________________________________________________________________
___________________________________________________________________
___________________________________________________________________
Distance = _________________________ m
(3)
(Total 8 marks)
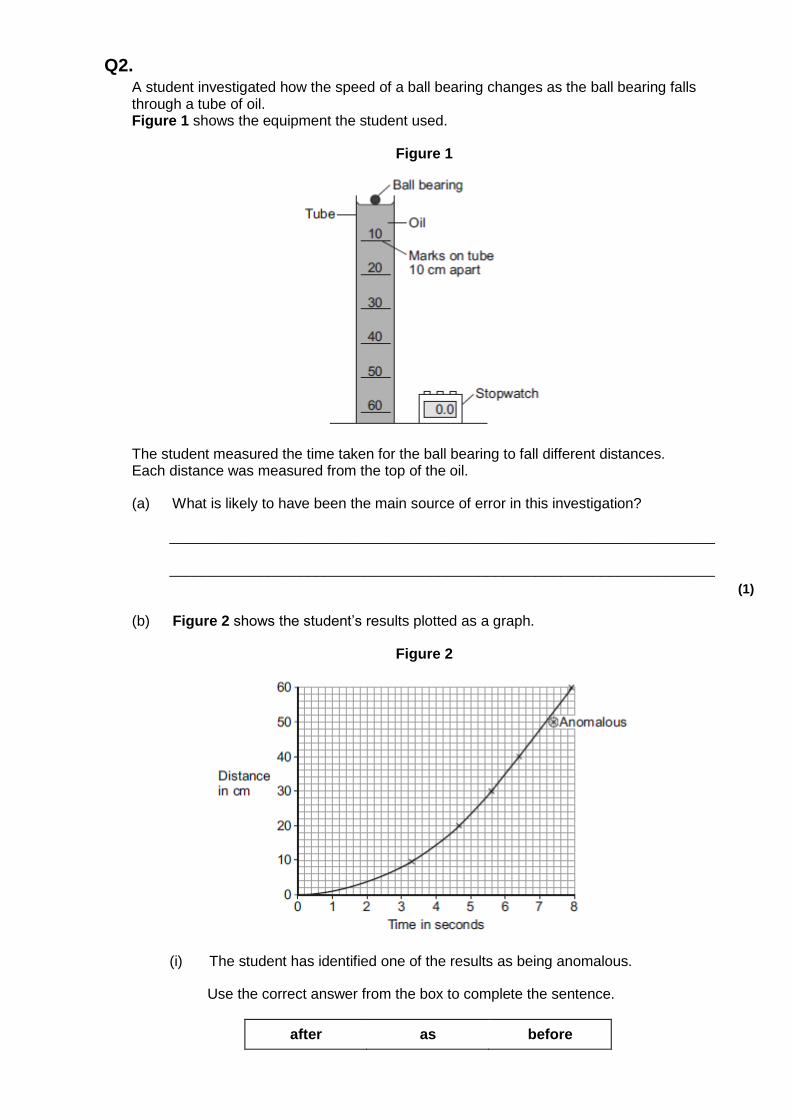
Q2. A student investigated how the speed of a ball bearing changes as the ball bearing falls through a tube of oil. Figure 1 shows the equipment the student used.
Figure 1
The student measured the time taken for the ball bearing to fall different distances. Each distance was measured from the top of the oil.
(a) What is likely to have been the main source of error in this investigation?
___________________________________________________________________
___________________________________________________________________
(1)
(b) Figure 2 shows the student’s results plotted as a graph.
Figure 2
(i) The student has identified one of the results as being anomalous.
Use the correct answer from the box to complete the sentence.
after as before
The anomalous result was caused by the stopwatch being started
___________ the ball bearing was released.
(1)
(ii) What can you conclude from the graph about the speed of the ball bearing during the first four seconds?
______________________________________________________________
______________________________________________________________
(1)
(iii) The graph shows that the ball bearing reached its terminal velocity.
Describe how the graph would be used to calculate the terminal velocity of the ball bearing.
______________________________________________________________
______________________________________________________________
(1)
(iv) The directions of the two forces acting on the ball bearing as it falls through the oil are shown in Figure 3.
Figure 3
Explain, in terms of the forces shown in Figure 3, why the ball bearing reaches its terminal velocity.
______________________________________________________________
______________________________________________________________
______________________________________________________________
______________________________________________________________
(2)
(c) The student repeated the investigation using warmer oil.
Figure 4 shows the set of results using the warmer oil and the set of results using the cooler oil.
Figure 4
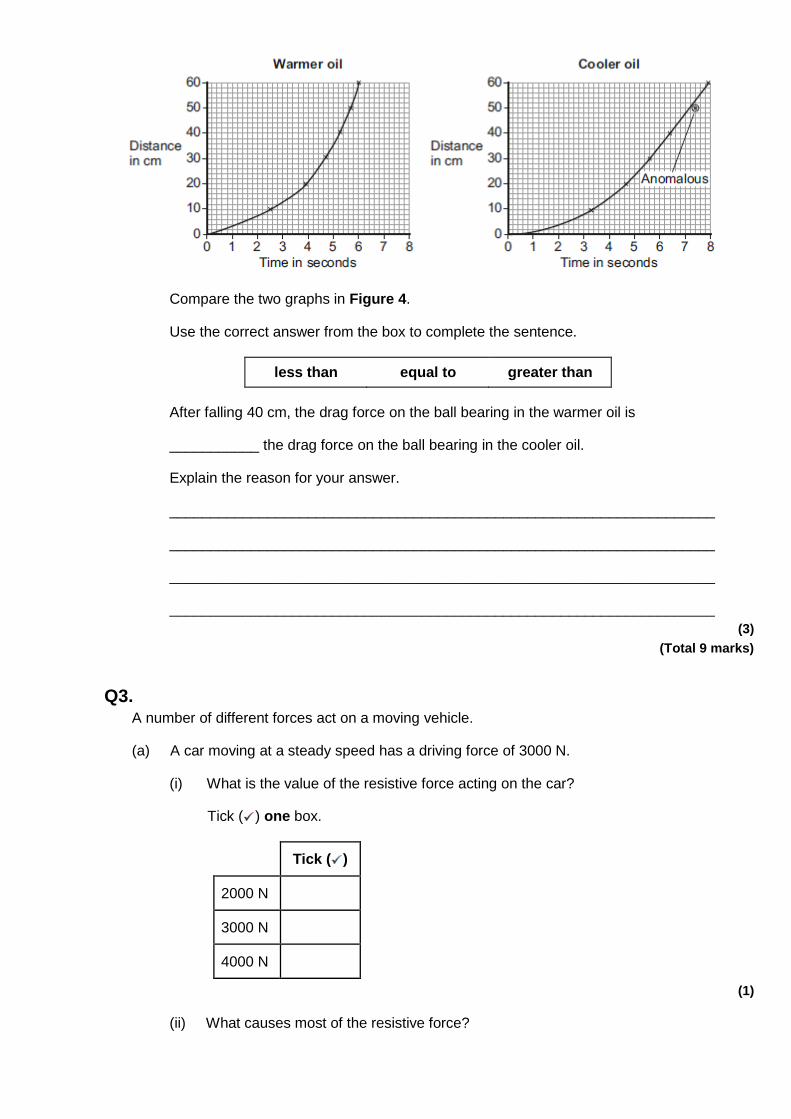
Compare the two graphs in Figure 4.
Use the correct answer from the box to complete the sentence.
less than equal to greater than
After falling 40 cm, the drag force on the ball bearing in the warmer oil is
___________ the drag force on the ball bearing in the cooler oil.
Explain the reason for your answer.
___________________________________________________________________
___________________________________________________________________
___________________________________________________________________
___________________________________________________________________
(3)
(Total 9 marks)
Q3. A number of different forces act on a moving vehicle.
(a) A car moving at a steady speed has a driving force of 3000 N.
(i) What is the value of the resistive force acting on the car?
Tick ( ) one box.
Tick ( )
2000 N
3000 N
4000 N
(1)
(ii) What causes most of the resistive force?
Tick ( ) one box.
Tick ( )
Air resistance
Faulty brakes
Poor condition of tyres
(1)
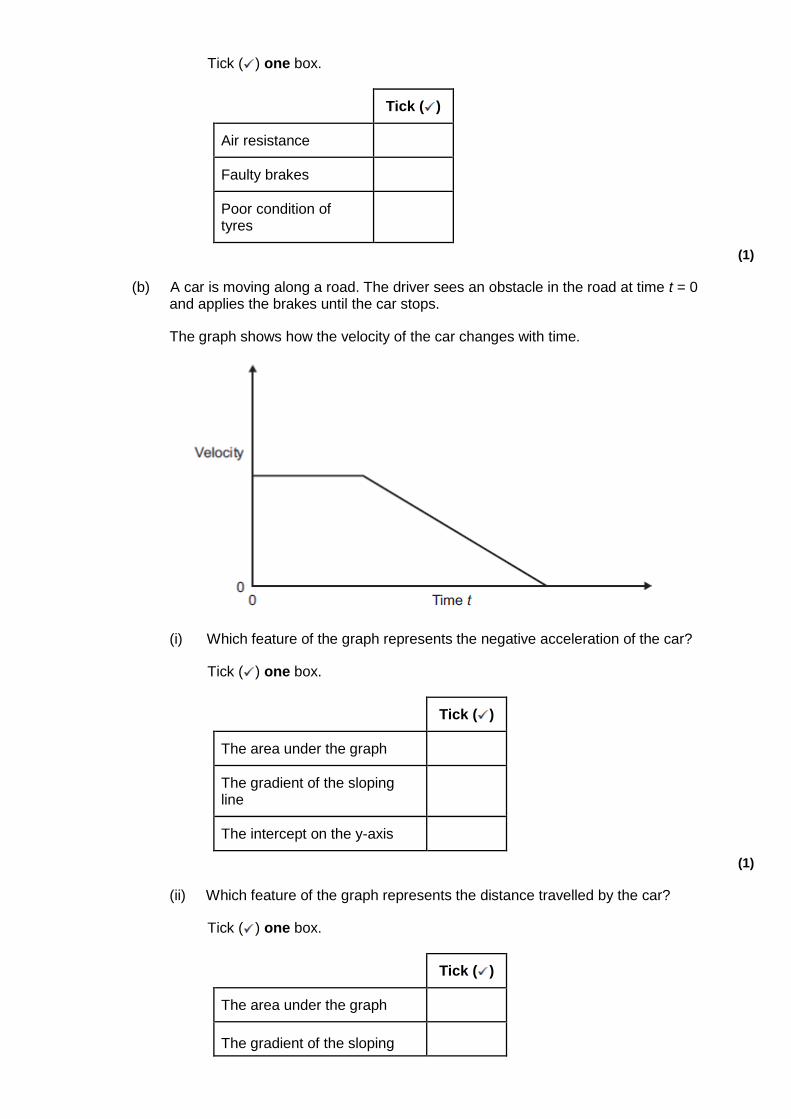
(b) A car is moving along a road. The driver sees an obstacle in the road at time t = 0 and applies the brakes until the car stops.
The graph shows how the velocity of the car changes with time.
(i) Which feature of the graph represents the negative acceleration of the car?
Tick ( ) one box.
Tick ( )
The area under the graph
The gradient of the sloping line
The intercept on the y-axis
(1)
(ii) Which feature of the graph represents the distance travelled by the car?
Tick ( ) one box.
Tick ( )
The area under the graph
The gradient of the sloping
line
The intercept on the y-axis
(1)
(iii) On a different journey, the car is moving at a greater steady speed.
The driver sees an obstacle in the road at time t = 0 and applies the brakes until the car stops.
The driver’s reaction time and the braking distance are the same as shown the graph above.
On the graph above draw another graph to show the motion of the car.
(3)
(c) In this question you will be assessed on using good English, organising information clearly and using specialist terms where appropriate.
Thinking distance and braking distance affect stopping distance.
Explain how the factors that affect thinking distance and braking distance affect stopping distance.
___________________________________________________________________
___________________________________________________________________
___________________________________________________________________
___________________________________________________________________
___________________________________________________________________
___________________________________________________________________
___________________________________________________________________
___________________________________________________________________
___________________________________________________________________
___________________________________________________________________
(6)
(Total 13 marks)
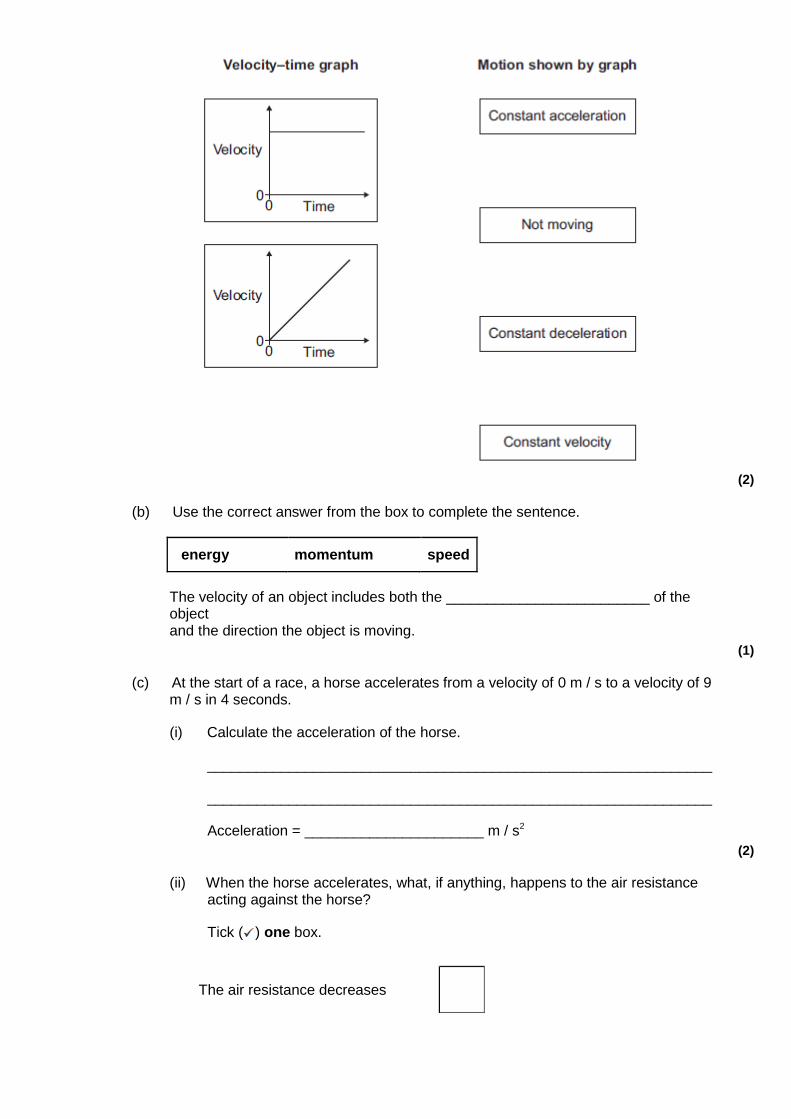
Q4. (a) Draw one line from each velocity−time graph to the statement describing the motion
shown by the graph.
(2)
(b) Use the correct answer from the box to complete the sentence.
energy momentum speed
The velocity of an object includes both the _________________________ of the object and the direction the object is moving.
(1)
(c) At the start of a race, a horse accelerates from a velocity of 0 m / s to a velocity of 9 m / s in 4 seconds.
(i) Calculate the acceleration of the horse.
______________________________________________________________
______________________________________________________________
Acceleration = ______________________ m / s2
(2)
(ii) When the horse accelerates, what, if anything, happens to the air resistance acting against the horse?
Tick ( ) one box.
The air resistance decreases
The air resistance is constant
The air resistance increases
(1)
(d) A horse and a pony walk across a field at the same constant speed.
The horse has 4000 joules of kinetic energy.
The pony is half the mass of the horse.
What is the kinetic energy of the pony?
Draw a ring around the correct answer
2000 J 4000 J 8000 J
Give a reason for your answer.
___________________________________________________________________
___________________________________________________________________
(2)
(Total 8 marks)
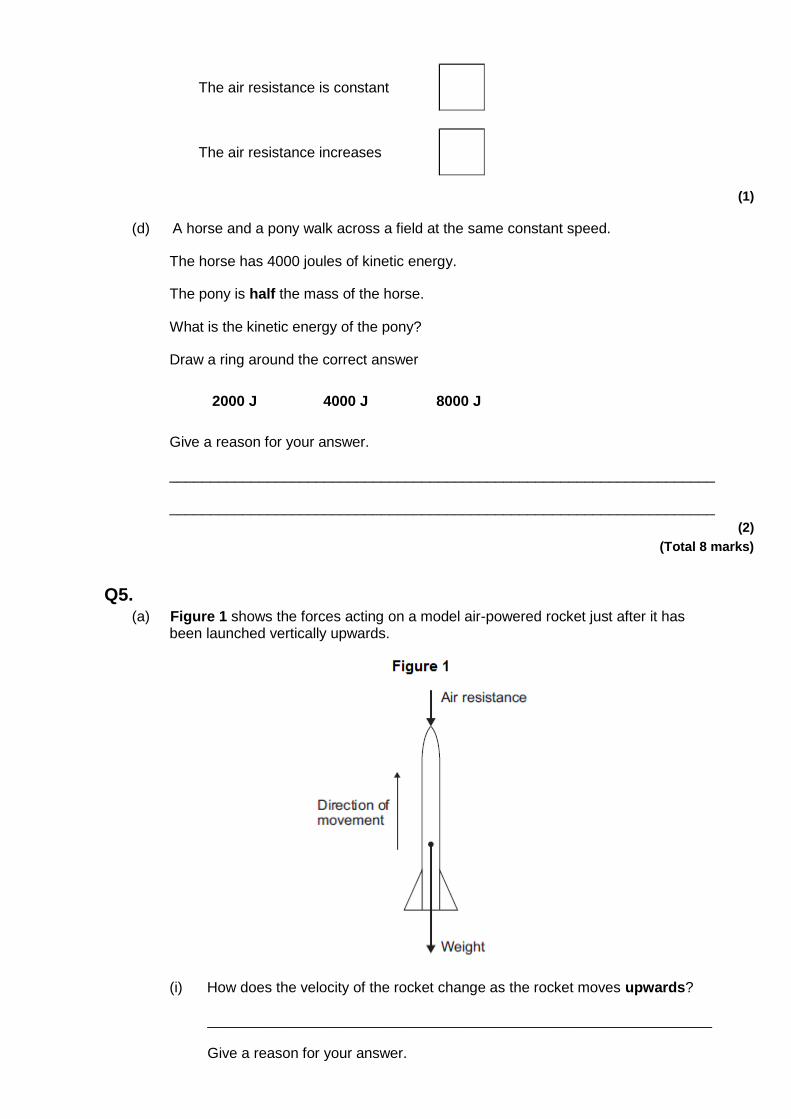
Q5. (a) Figure 1 shows the forces acting on a model air-powered rocket just after it has
been launched vertically upwards.
(i) How does the velocity of the rocket change as the rocket moves upwards?
______________________________________________________________
Give a reason for your answer.
______________________________________________________________
______________________________________________________________
(2)
(ii) The velocity of the rocket is not the same as the speed of the rocket.
What is the difference between the velocity of an object and the speed of an object?
______________________________________________________________
______________________________________________________________
______________________________________________________________
(1)
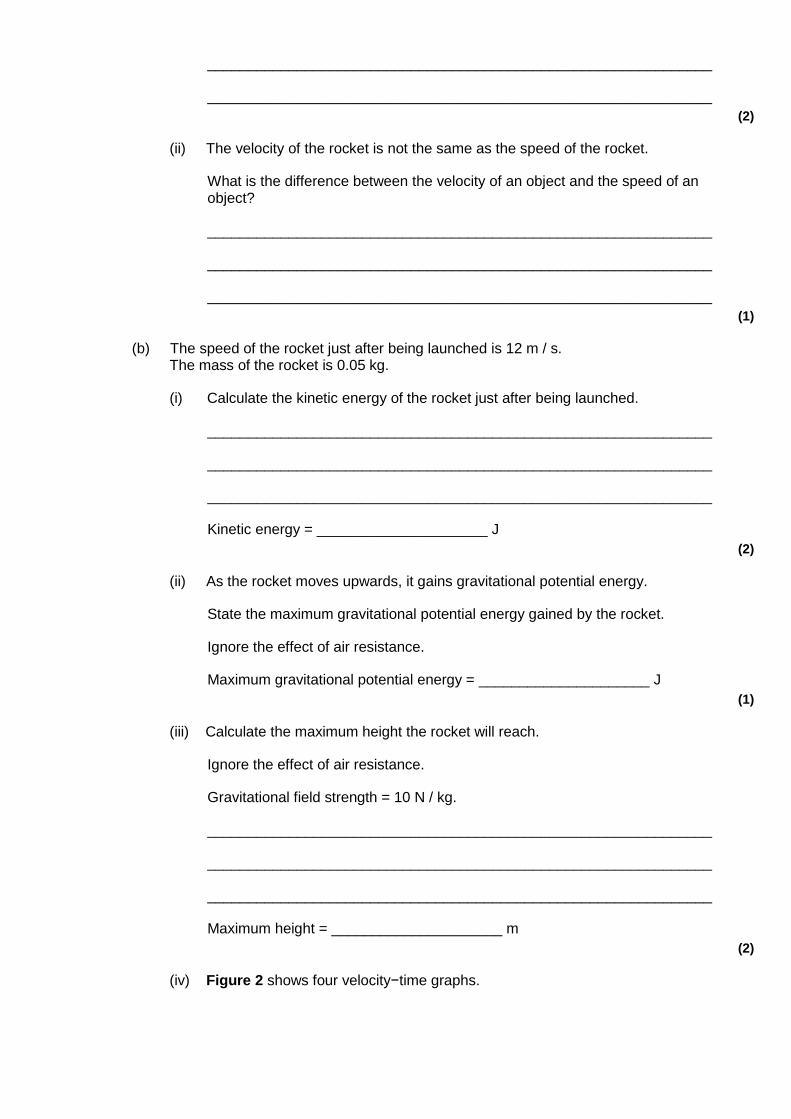
(b) The speed of the rocket just after being launched is 12 m / s. The mass of the rocket is 0.05 kg.
(i) Calculate the kinetic energy of the rocket just after being launched.
______________________________________________________________
______________________________________________________________
______________________________________________________________
Kinetic energy = _____________________ J
(2)
(ii) As the rocket moves upwards, it gains gravitational potential energy.
State the maximum gravitational potential energy gained by the rocket.
Ignore the effect of air resistance.
Maximum gravitational potential energy = _____________________ J
(1)
(iii) Calculate the maximum height the rocket will reach.
Ignore the effect of air resistance.
Gravitational field strength = 10 N / kg.
______________________________________________________________
______________________________________________________________
______________________________________________________________
Maximum height = _____________________ m
(2)
(iv) Figure 2 shows four velocity−time graphs.
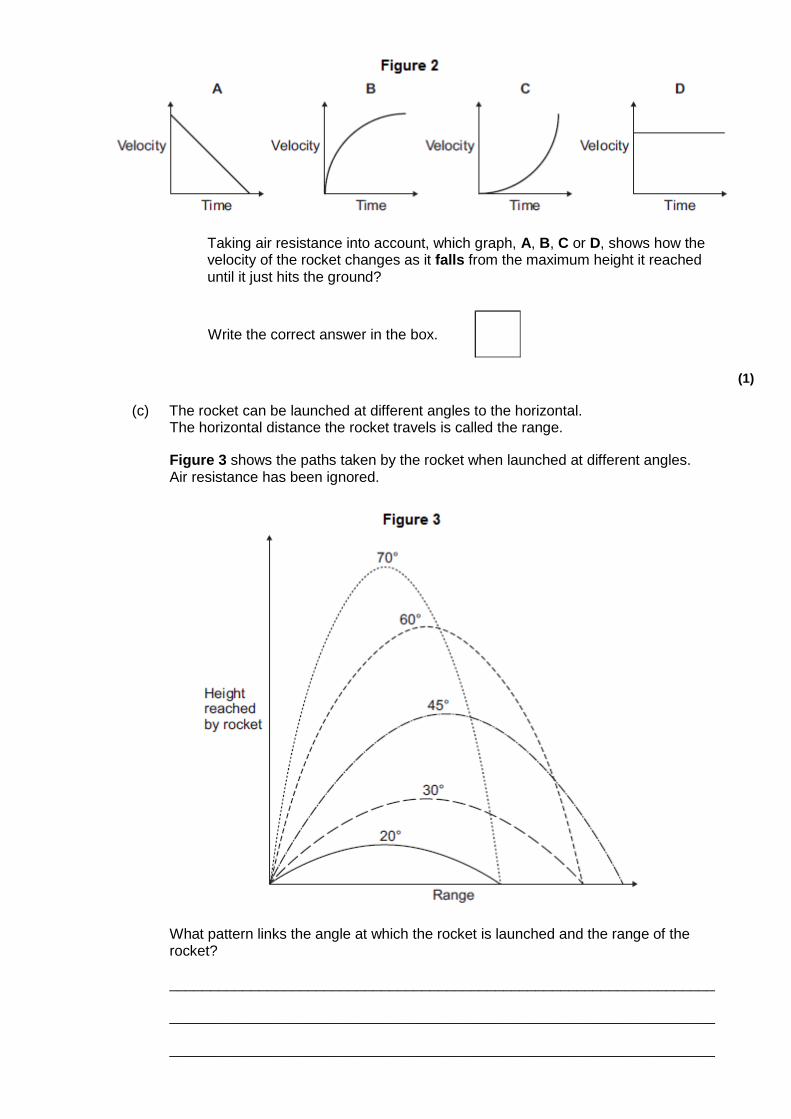
Taking air resistance into account, which graph, A, B, C or D, shows how the velocity of the rocket changes as it falls from the maximum height it reached until it just hits the ground?
Write the correct answer in the box.
(1)
(c) The rocket can be launched at different angles to the horizontal. The horizontal distance the rocket travels is called the range.
Figure 3 shows the paths taken by the rocket when launched at different angles. Air resistance has been ignored.
What pattern links the angle at which the rocket is launched and the range of the rocket?
___________________________________________________________________
___________________________________________________________________
___________________________________________________________________
___________________________________________________________________
(2)
(Total 11 marks)
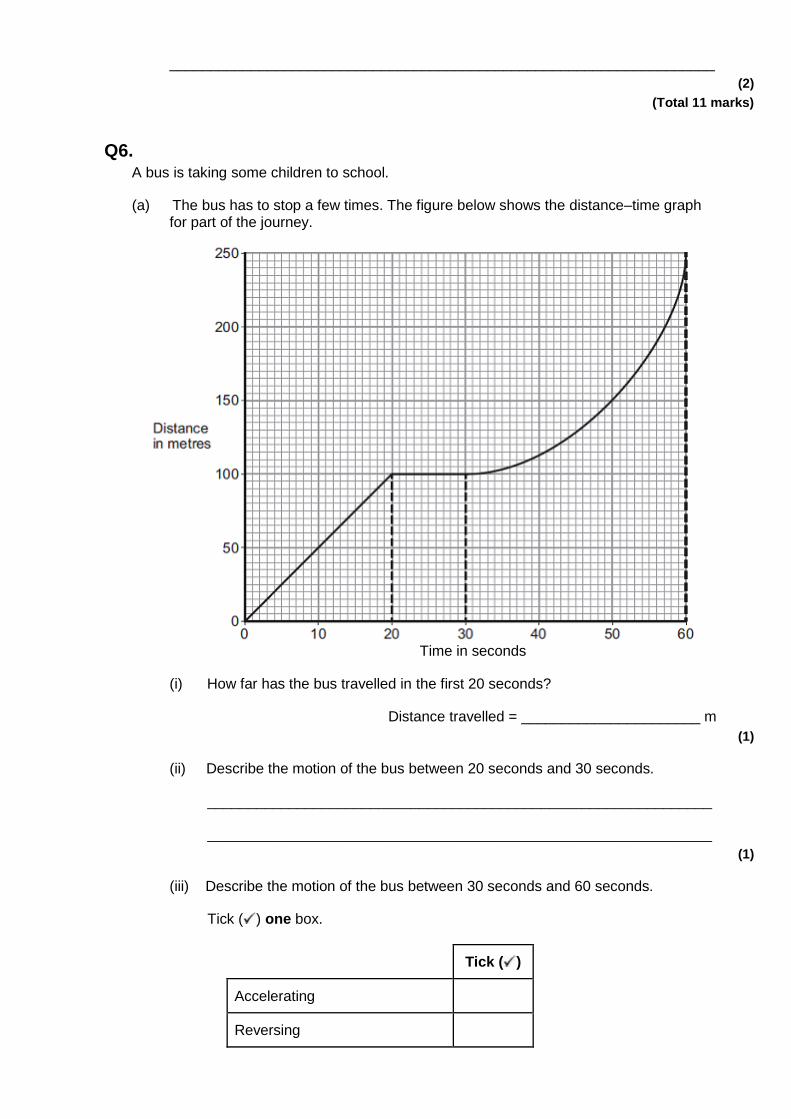
Q6. A bus is taking some children to school.
(a) The bus has to stop a few times. The figure below shows the distance–time graph for part of the journey.
Time in seconds
(i) How far has the bus travelled in the first 20 seconds?
Distance travelled = ______________________ m
(1)
(ii) Describe the motion of the bus between 20 seconds and 30 seconds.
______________________________________________________________
______________________________________________________________
(1)
(iii) Describe the motion of the bus between 30 seconds and 60 seconds.
Tick ( ) one box.
Tick ( )
Accelerating
Reversing
Travelling at constant speed
(1)
(iv) What is the speed of the bus at 45 seconds?
Show clearly on the figure above how you obtained your answer.
______________________________________________________________
______________________________________________________________
______________________________________________________________
Speed = ______________________ m / s
(3)
(b) Later in the journey, the bus is moving and has 500 000 J of kinetic energy.
The brakes are applied and the bus stops.
(i) How much work is needed to stop the bus?
______________________________________________________________
Work = ______________________ J
(1)
(ii) The bus stopped in a distance of 25 m.
Calculate the force that was needed to stop the bus.
______________________________________________________________
______________________________________________________________
Force = ______________________ N
(2)
(iii) What happens to the kinetic energy of the bus as it is braking?
______________________________________________________________
______________________________________________________________
______________________________________________________________
______________________________________________________________
(2)
(Total 11 marks)
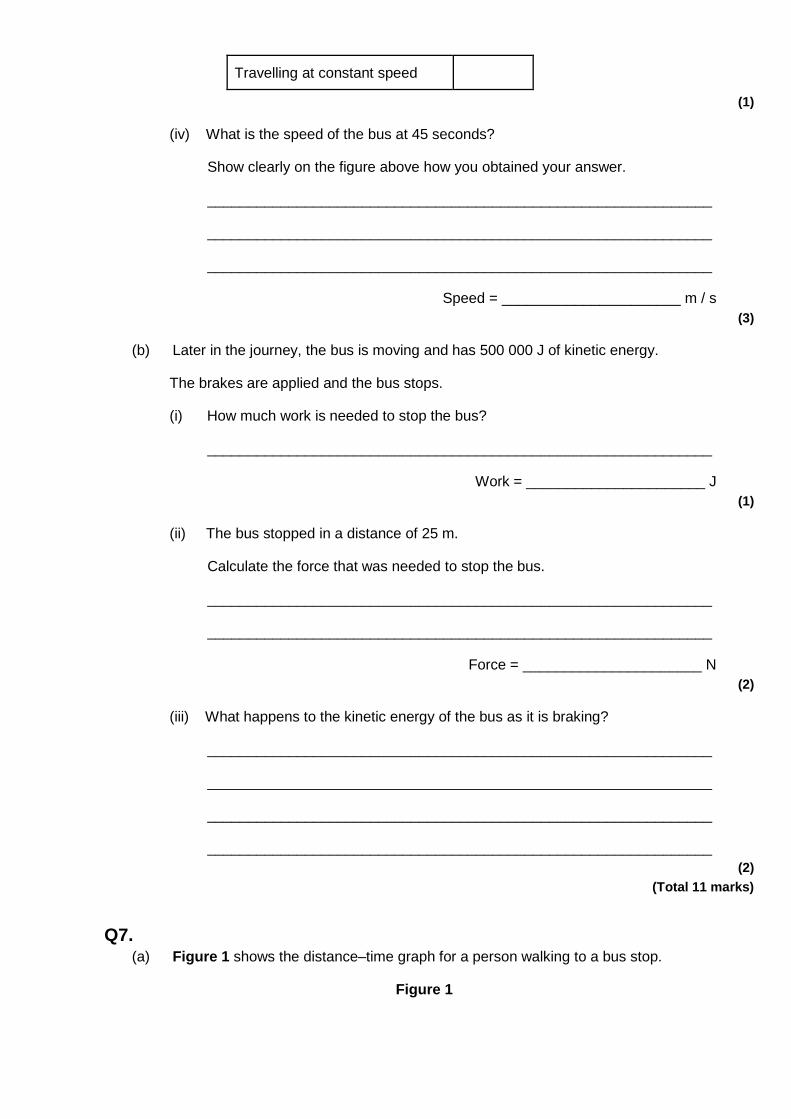
Q7. (a) Figure 1 shows the distance–time graph for a person walking to a bus stop.
Figure 1
Time in seconds
(i) Which one of the following statements describes the motion of the person between points R and S on the graph?
Tick (✓) one box.
Not moving
Moving at constant speed
Moving with increasing speed
(1)
(ii) Another person, walking at constant speed, travels the same distance to the bus stop in 200 seconds.
Complete Figure 2 to show a distance–time graph for this person.
Figure 2
Time in seconds
(1)
(b) A bus accelerates away from the bus stop at 2.5 m/s2.
The total mass of the bus and passengers is 14 000 kg.
Calculate the resultant force needed to accelerate the bus and passengers.
___________________________________________________________________
___________________________________________________________________
___________________________________________________________________
Resultant force = ____________________ N
(2)
(Total 4 marks)
Q8. (a) What is ultrasound?
___________________________________________________________________
___________________________________________________________________
(1)
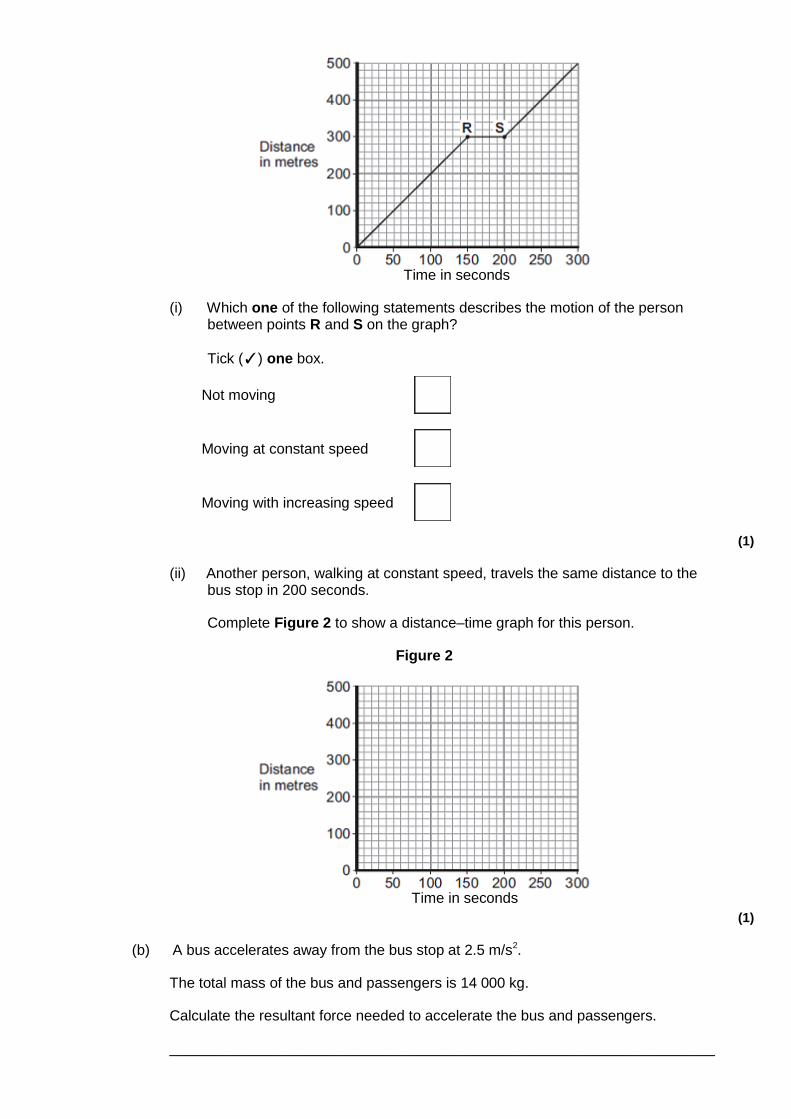
(b) Figure 1 shows how ultrasound is used to measure the depth of water below a ship.
Figure 1
A pulse of ultrasound is sent out from an electronic system on-board the ship.
It takes 0.80 seconds for the emitted ultrasound to be received back at the ship.
Calculate the depth of the water.
Speed of ultrasound in water = 1600 m / s
___________________________________________________________________
___________________________________________________________________
___________________________________________________________________
___________________________________________________________________
Depth of water = _________________________ metres
(3)
(c) Ultrasound can be used in medicine for scanning.
State one medical use of ultrasound scanning.
___________________________________________________________________
(1)
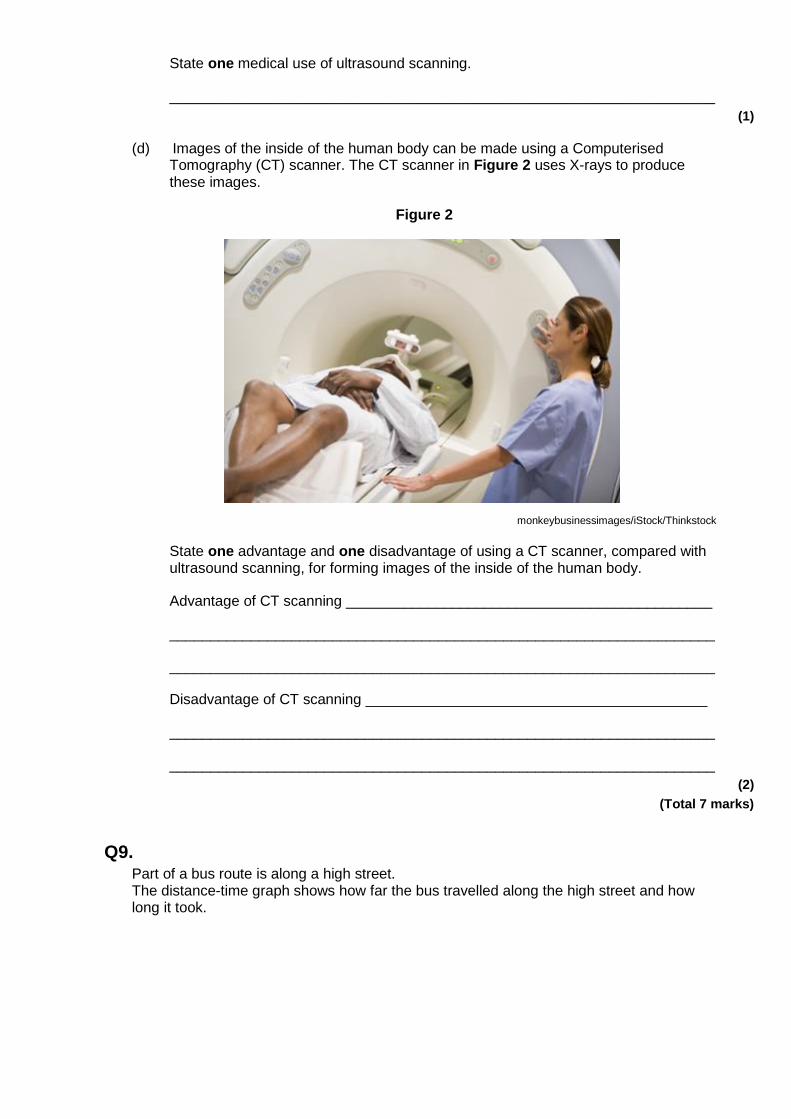
(d) Images of the inside of the human body can be made using a Computerised Tomography (CT) scanner. The CT scanner in Figure 2 uses X-rays to produce these images.
Figure 2
monkeybusinessimages/iStock/Thinkstock
State one advantage and one disadvantage of using a CT scanner, compared with ultrasound scanning, for forming images of the inside of the human body.
Advantage of CT scanning _____________________________________________
___________________________________________________________________
___________________________________________________________________
Disadvantage of CT scanning __________________________________________
___________________________________________________________________
___________________________________________________________________
(2)
(Total 7 marks)
Q9. Part of a bus route is along a high street. The distance-time graph shows how far the bus travelled along the high street and how long it took.
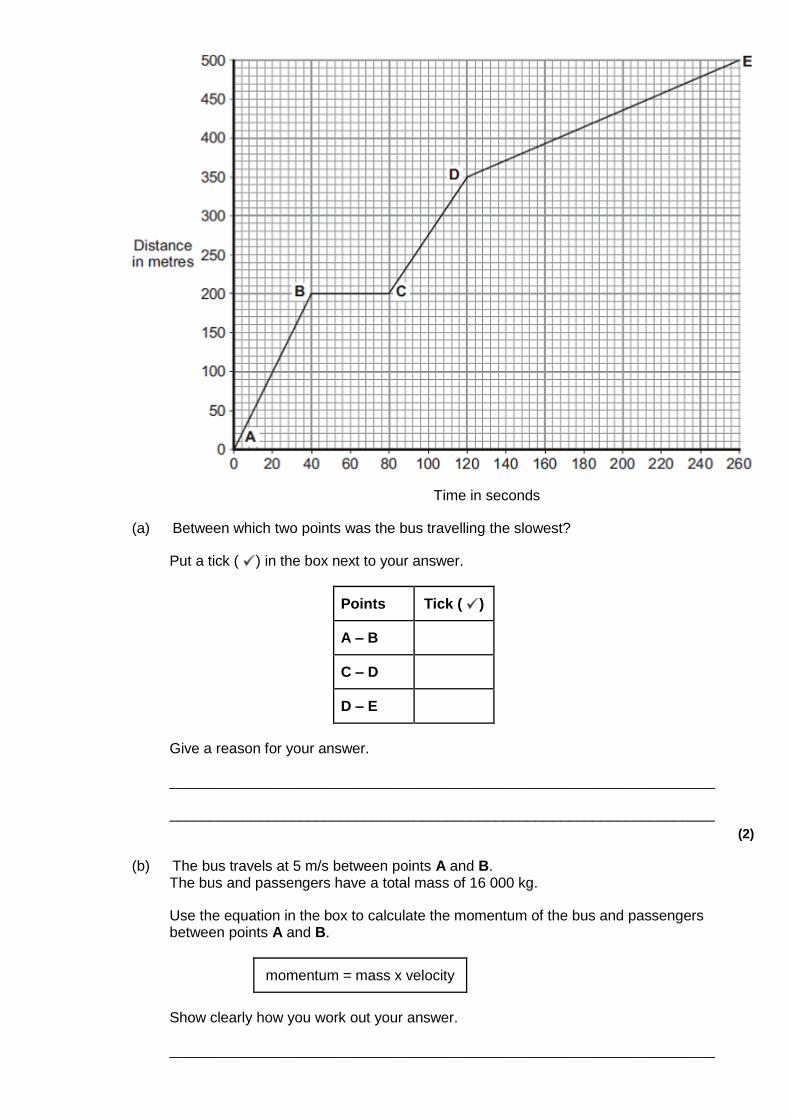
Time in seconds
(a) Between which two points was the bus travelling the slowest?
Put a tick ( ) in the box next to your answer.
Points Tick ( )
A – B
C – D
D – E
Give a reason for your answer.
___________________________________________________________________
___________________________________________________________________
(2)
(b) The bus travels at 5 m/s between points A and B. The bus and passengers have a total mass of 16 000 kg.
Use the equation in the box to calculate the momentum of the bus and passengers between points A and B.
momentum = mass x velocity
Show clearly how you work out your answer.
___________________________________________________________________
___________________________________________________________________
Momentum = _________________________ kg m/s
(2)
(c) A cyclist made the same journey along the high street. The cyclist started at the same time as the bus and completed the journey in 220 seconds. The cyclist travelled the whole distance at a constant speed.
(i) Draw a line on the graph to show the cyclist’s journey.
(2)
(ii) After how many seconds did the cyclist overtake the bus?
The cyclist overtook the bus after _______________________ seconds.
(1)
(Total 7 marks)
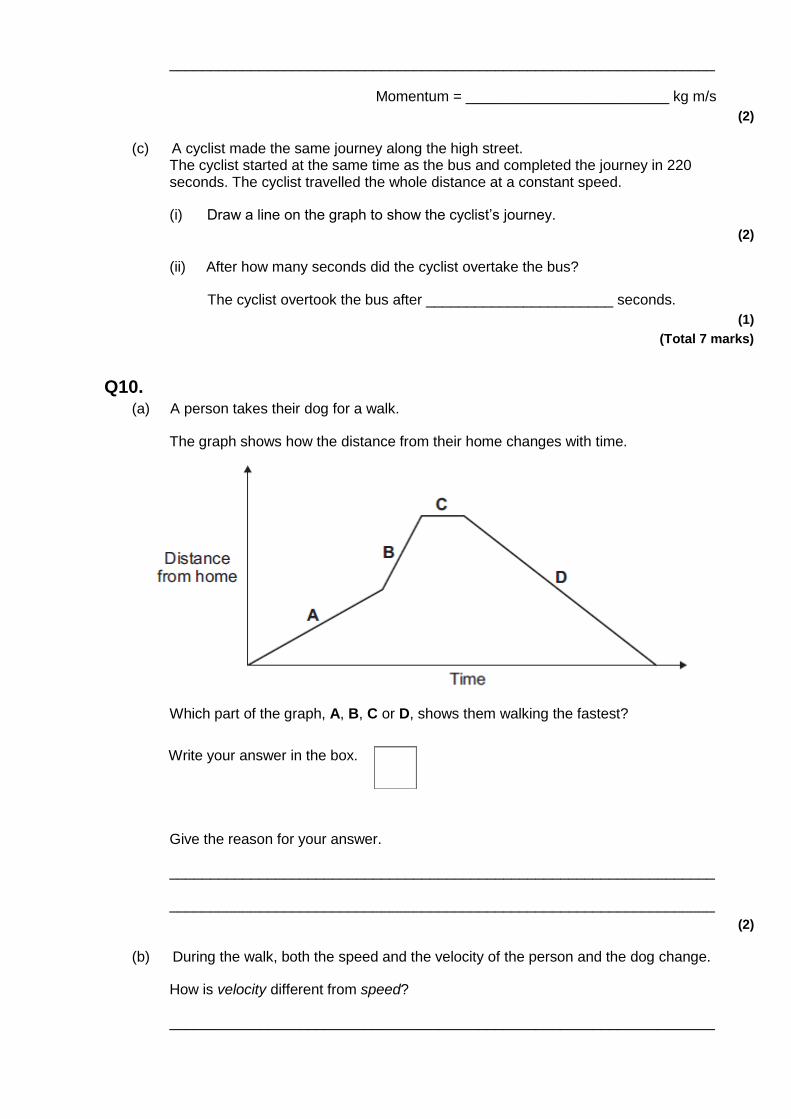
Q10. (a) A person takes their dog for a walk.
The graph shows how the distance from their home changes with time.
Which part of the graph, A, B, C or D, shows them walking the fastest?
Write your answer in the box.
Give the reason for your answer.
___________________________________________________________________
___________________________________________________________________
(2)
(b) During the walk, both the speed and the velocity of the person and the dog change.
How is velocity different from speed?
___________________________________________________________________
___________________________________________________________________
(1)
(Total 3 marks)
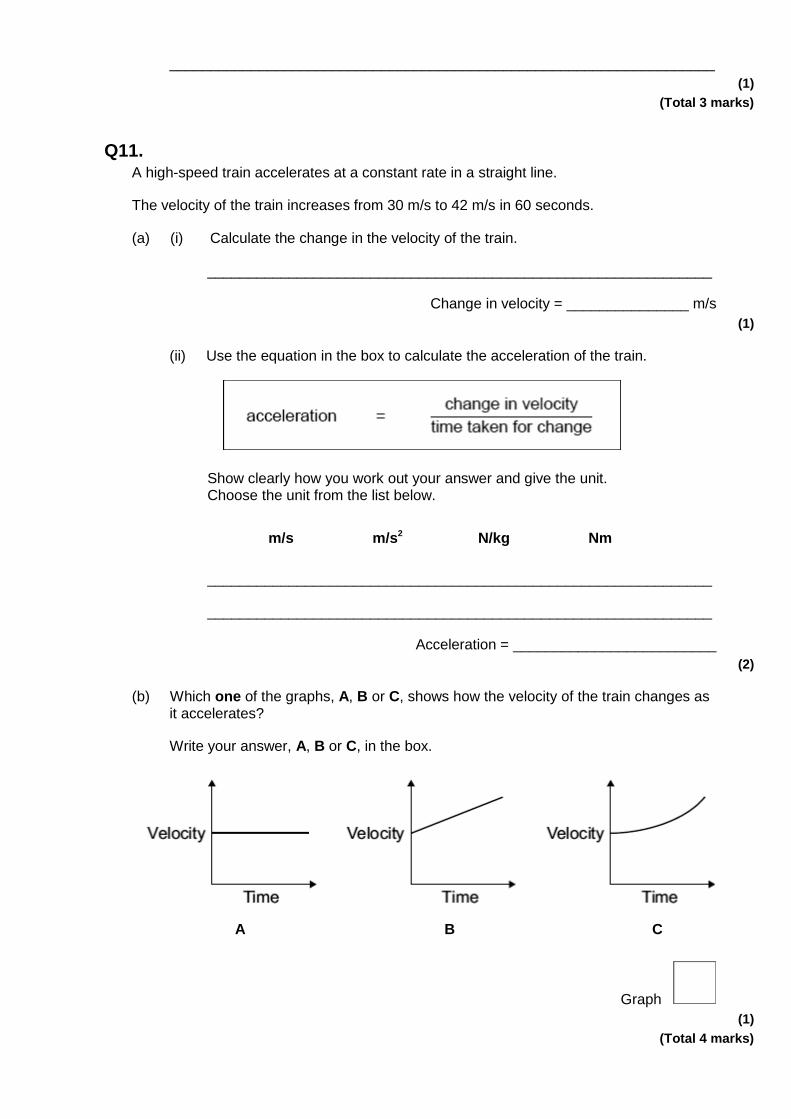
Q11. A high-speed train accelerates at a constant rate in a straight line.
The velocity of the train increases from 30 m/s to 42 m/s in 60 seconds.
(a) (i) Calculate the change in the velocity of the train.
______________________________________________________________
Change in velocity = _______________ m/s
(1)
(ii) Use the equation in the box to calculate the acceleration of the train.
Show clearly how you work out your answer and give the unit. Choose the unit from the list below.
m/s m/s2 N/kg Nm
______________________________________________________________
______________________________________________________________
Acceleration = _________________________
(2)
(b) Which one of the graphs, A, B or C, shows how the velocity of the train changes as it accelerates?
Write your answer, A, B or C, in the box.
A
B
C
Graph
(1)
(Total 4 marks)
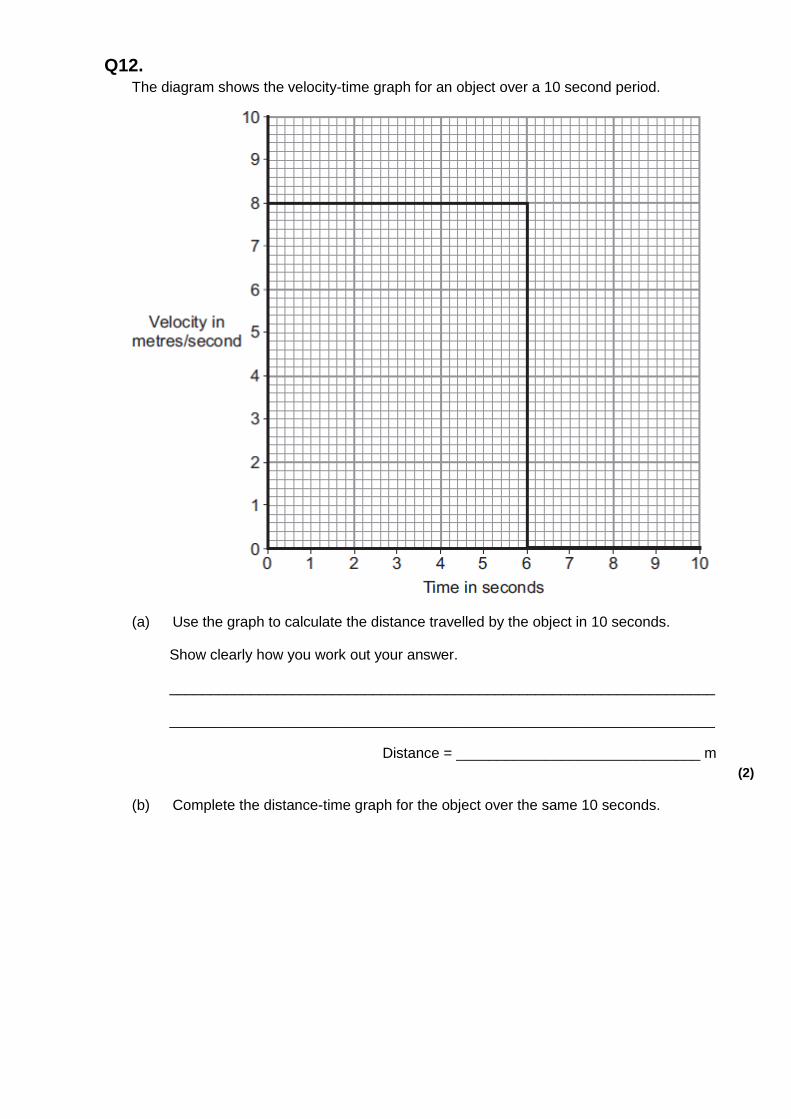
Q12. The diagram shows the velocity-time graph for an object over a 10 second period.
(a) Use the graph to calculate the distance travelled by the object in 10 seconds.
Show clearly how you work out your answer.
___________________________________________________________________
___________________________________________________________________
Distance = ______________________________ m
(2)
(b) Complete the distance-time graph for the object over the same 10 seconds.
(2)
(Total 4 marks)
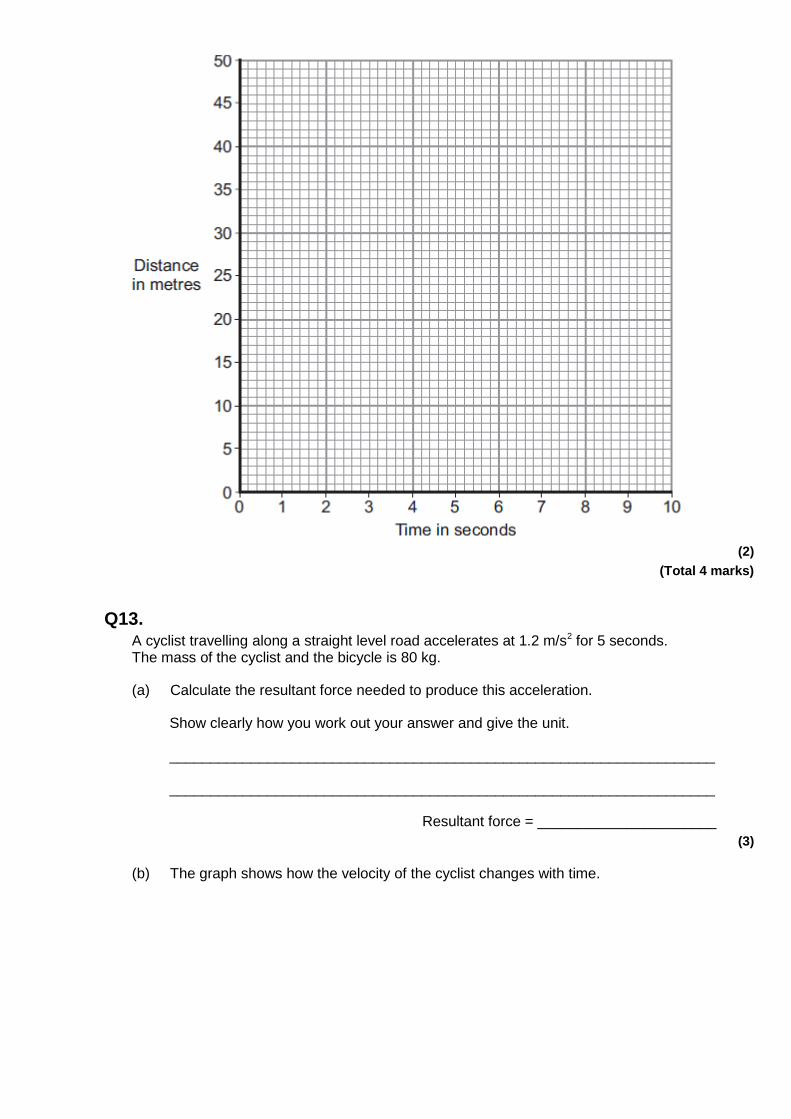
Q13. A cyclist travelling along a straight level road accelerates at 1.2 m/s2 for 5 seconds. The mass of the cyclist and the bicycle is 80 kg.
(a) Calculate the resultant force needed to produce this acceleration.
Show clearly how you work out your answer and give the unit.
___________________________________________________________________
___________________________________________________________________
Resultant force = ______________________
(3)
(b) The graph shows how the velocity of the cyclist changes with time.
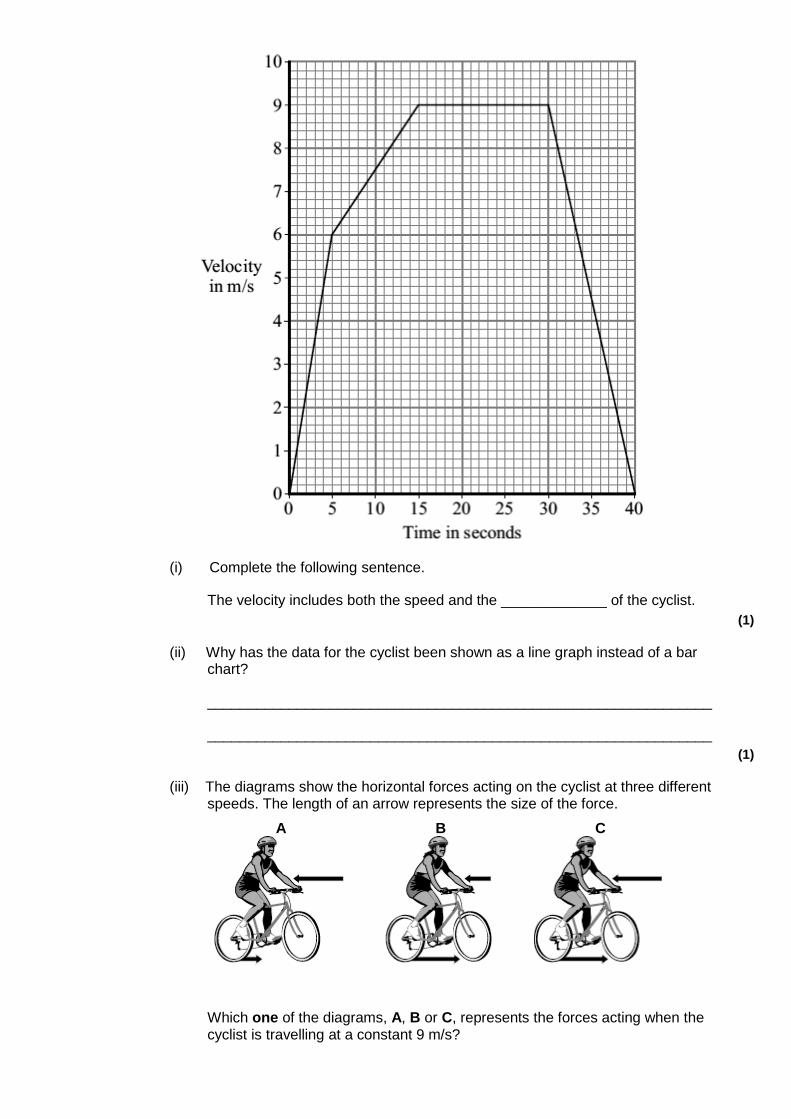
(i) Complete the following sentence.
The velocity includes both the speed and the _____________ of the cyclist.
(1)
(ii) Why has the data for the cyclist been shown as a line graph instead of a bar chart?
______________________________________________________________
______________________________________________________________
(1)
(iii) The diagrams show the horizontal forces acting on the cyclist at three different speeds. The length of an arrow represents the size of the force.
A
B
C
Which one of the diagrams, A, B or C, represents the forces acting when the cyclist is travelling at a constant 9 m/s?
______________________________________________________________
Explain the reason for your choice.
______________________________________________________________
______________________________________________________________
______________________________________________________________
______________________________________________________________
______________________________________________________________
______________________________________________________________
(3)
(Total 8 marks)
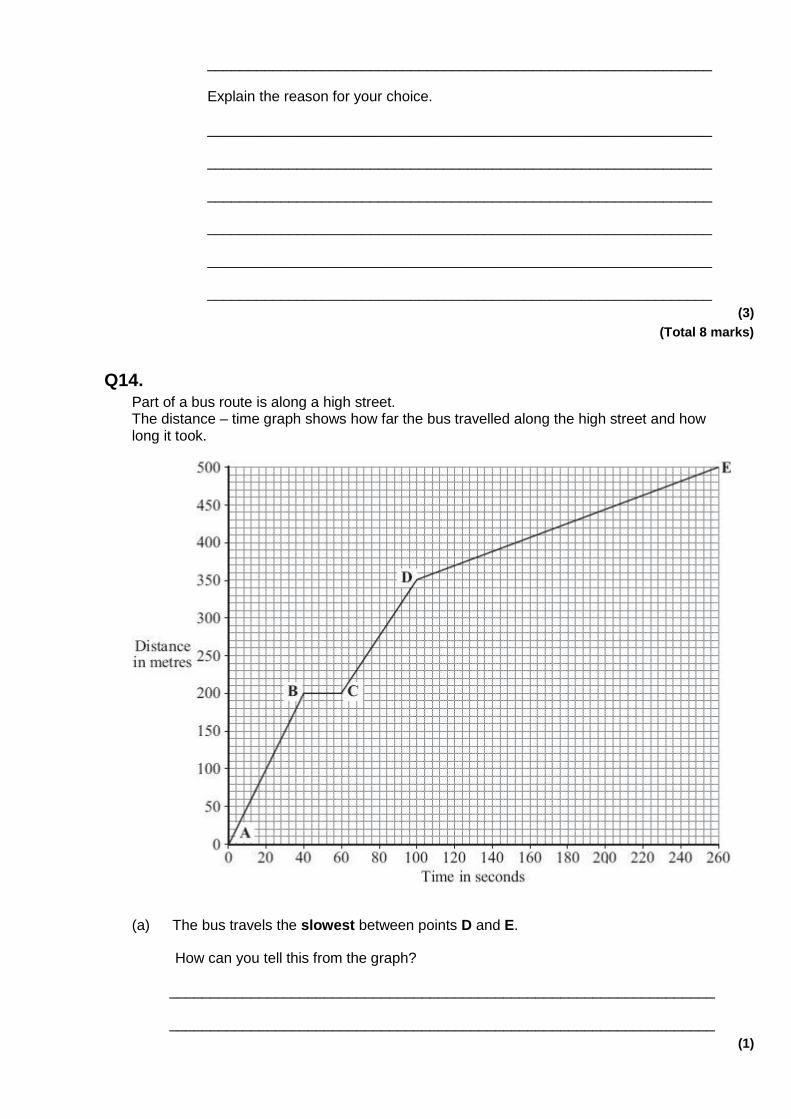
Q14. Part of a bus route is along a high street. The distance – time graph shows how far the bus travelled along the high street and how long it took.
(a) The bus travels the slowest between points D and E.
How can you tell this from the graph?
___________________________________________________________________
___________________________________________________________________
(1)
(b) Between which two points was the bus travelling the fastest?
Put a tick ( ) in the box next to your answer.
Points
A – B
B – C
C – D
(1)
(c) There is a bus stop in the high street. This is marked as point B on the graph.
(i) What is the distance between point A on the graph and the bus stop?
Distance _______________ metres
(1)
(ii) How long did the bus stop at the bus stop? Show clearly how you work out your answer.
______________________________________________________________
Time = _______________ seconds
(2)
(d) A cyclist made the same journey along the high street. The cyclist started at the same time as the bus and completed the journey in 200 seconds. The cyclist travelled the whole distance at a constant speed.
(i) Draw a line on the graph to show the cyclist’s journey.
(2)
(ii) After how many seconds did the cyclist overtake the bus?
The cyclist overtook the bus after _______________ seconds.
(1)
(Total 8 marks)
Q15. A horse and rider take part in a long distance race. The graph shows how far the horse and rider travel during the race.
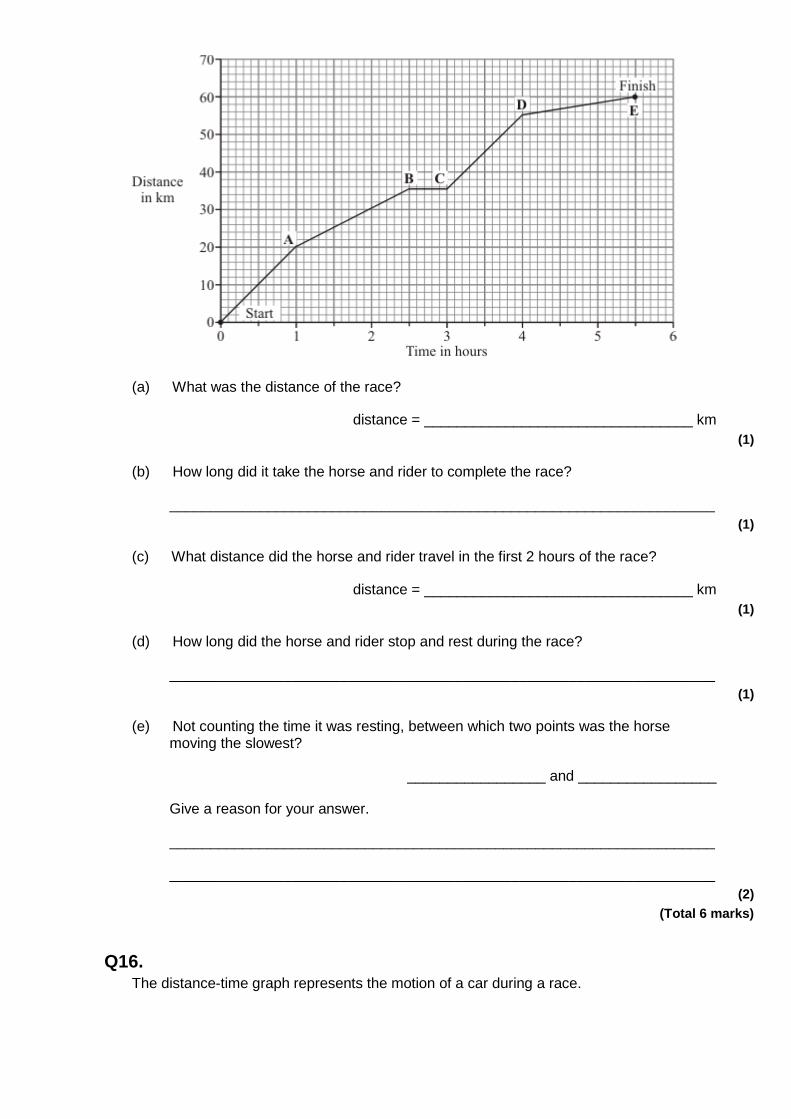
(a) What was the distance of the race?
distance = _________________________________ km
(1)
(b) How long did it take the horse and rider to complete the race?
___________________________________________________________________
(1)
(c) What distance did the horse and rider travel in the first 2 hours of the race?
distance = _________________________________ km
(1)
(d) How long did the horse and rider stop and rest during the race?
___________________________________________________________________
(1)
(e) Not counting the time it was resting, between which two points was the horse moving the slowest?
_________________ and _________________
Give a reason for your answer.
___________________________________________________________________
___________________________________________________________________
(2)
(Total 6 marks)
Q16. The distance-time graph represents the motion of a car during a race.
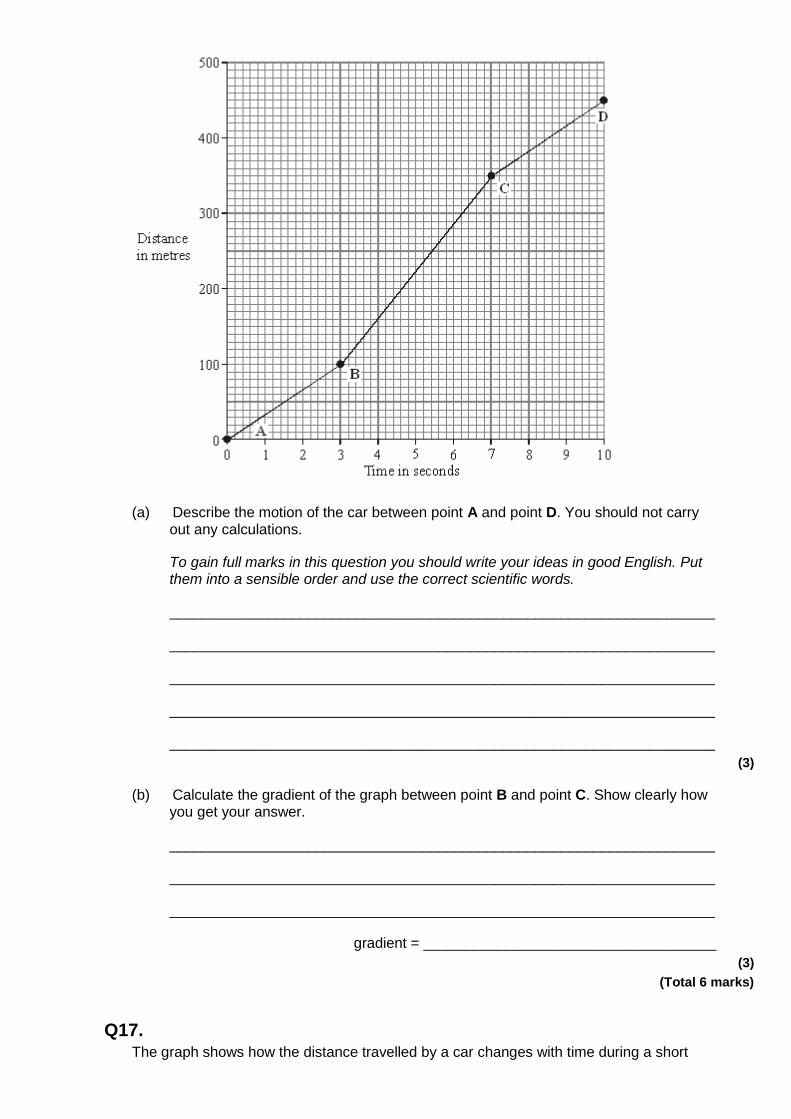
(a) Describe the motion of the car between point A and point D. You should not carry out any calculations.
To gain full marks in this question you should write your ideas in good English. Put them into a sensible order and use the correct scientific words.
___________________________________________________________________
___________________________________________________________________
___________________________________________________________________
___________________________________________________________________
___________________________________________________________________
(3)
(b) Calculate the gradient of the graph between point B and point C. Show clearly how you get your answer.
___________________________________________________________________
___________________________________________________________________
___________________________________________________________________
gradient = ____________________________________
(3)
(Total 6 marks)
Q17. The graph shows how the distance travelled by a car changes with time during a short
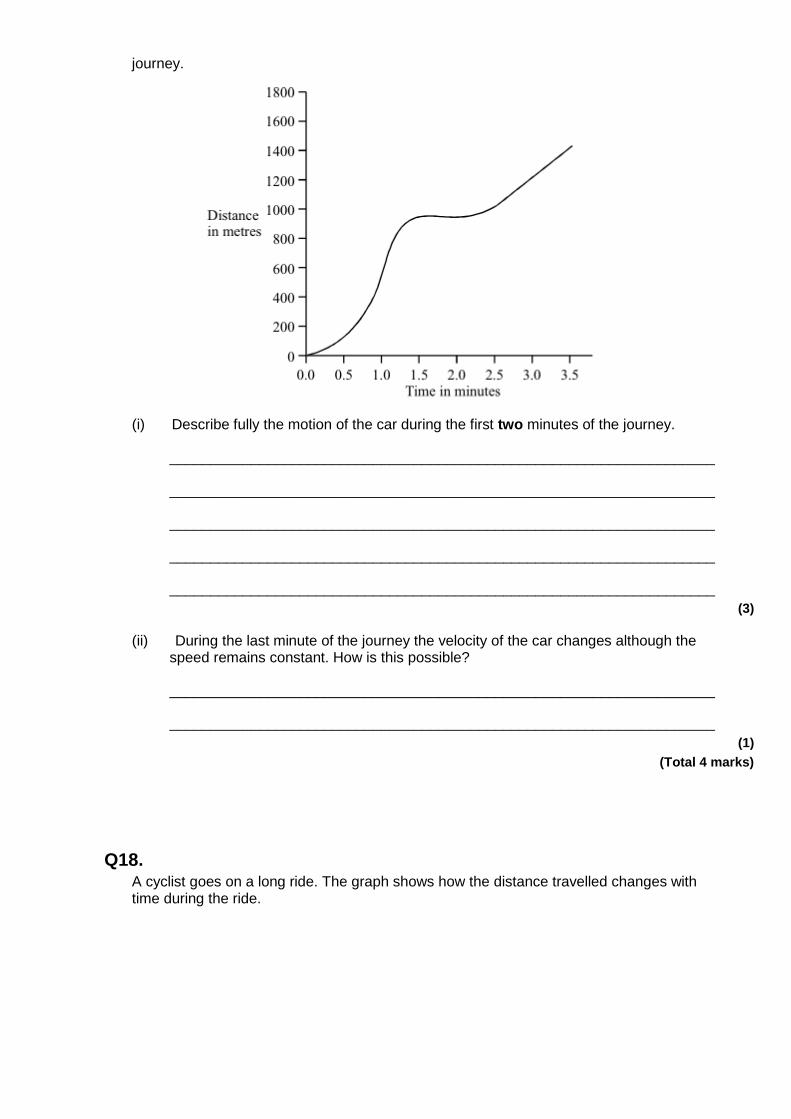
journey.
(i) Describe fully the motion of the car during the first two minutes of the journey.
___________________________________________________________________
___________________________________________________________________
___________________________________________________________________
___________________________________________________________________
___________________________________________________________________
(3)
(ii) During the last minute of the journey the velocity of the car changes although the speed remains constant. How is this possible?
___________________________________________________________________
___________________________________________________________________
(1)
(Total 4 marks)
Q18. A cyclist goes on a long ride. The graph shows how the distance travelled changes with time during the ride.
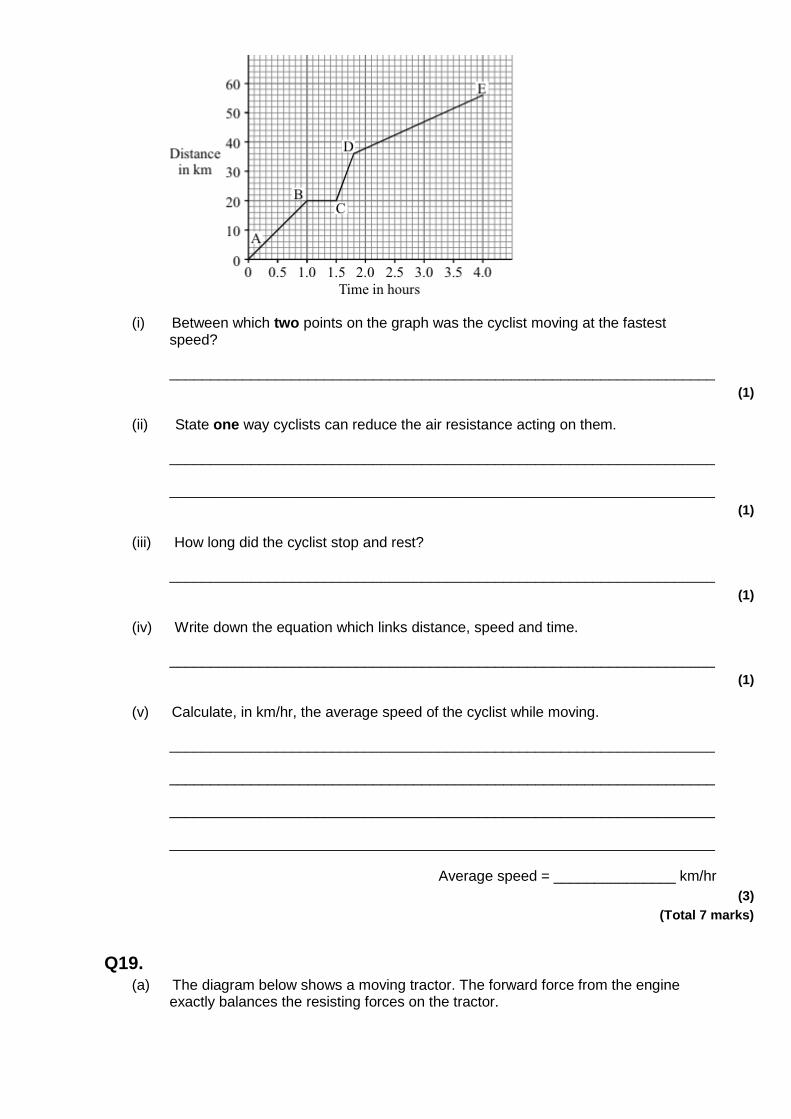
(i) Between which two points on the graph was the cyclist moving at the fastest speed?
___________________________________________________________________
(1)
(ii) State one way cyclists can reduce the air resistance acting on them.
___________________________________________________________________
___________________________________________________________________
(1)
(iii) How long did the cyclist stop and rest?
___________________________________________________________________
(1)
(iv) Write down the equation which links distance, speed and time.
___________________________________________________________________
(1)
(v) Calculate, in km/hr, the average speed of the cyclist while moving.
___________________________________________________________________
___________________________________________________________________
___________________________________________________________________
___________________________________________________________________
Average speed = _______________ km/hr
(3)
(Total 7 marks)
Q19. (a) The diagram below shows a moving tractor. The forward force from the engine
exactly balances the resisting forces on the tractor.
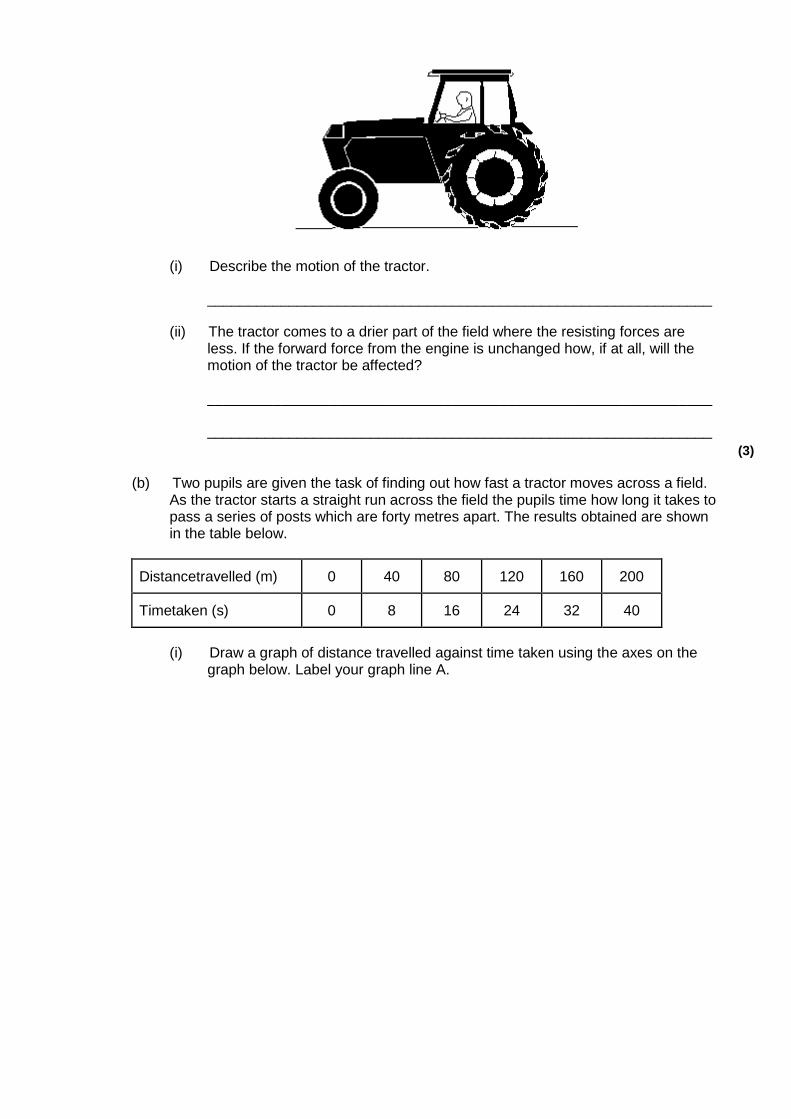
(i) Describe the motion of the tractor.
______________________________________________________________
(ii) The tractor comes to a drier part of the field where the resisting forces are less. If the forward force from the engine is unchanged how, if at all, will the motion of the tractor be affected?
______________________________________________________________
______________________________________________________________
(3)
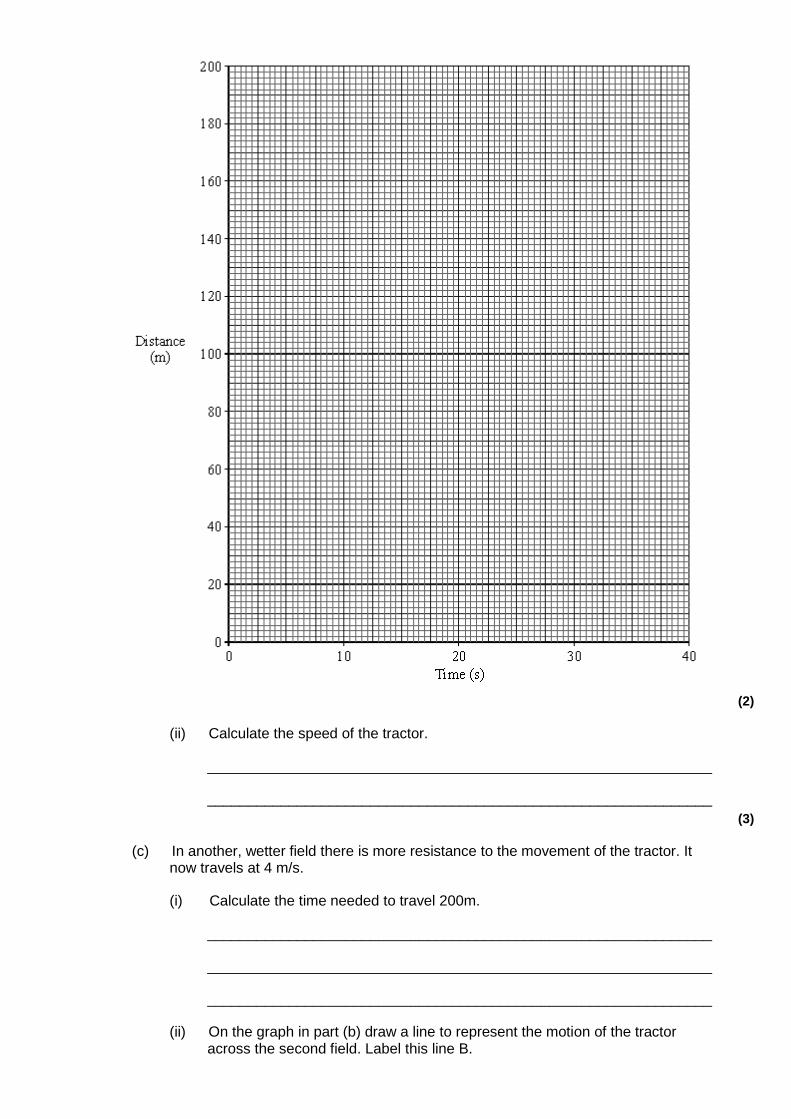
(b) Two pupils are given the task of finding out how fast a tractor moves across a field. As the tractor starts a straight run across the field the pupils time how long it takes to pass a series of posts which are forty metres apart. The results obtained are shown in the table below.
Distancetravelled (m) 0 40 80 120 160 200
Timetaken (s) 0 8 16 24 32 40
(i) Draw a graph of distance travelled against time taken using the axes on the graph below. Label your graph line A.
(2)
(ii) Calculate the speed of the tractor.
______________________________________________________________
______________________________________________________________
(3)
(c) In another, wetter field there is more resistance to the movement of the tractor. It now travels at 4 m/s.
(i) Calculate the time needed to travel 200m.
______________________________________________________________
______________________________________________________________
______________________________________________________________
(ii) On the graph in part (b) draw a line to represent the motion of the tractor across the second field. Label this line B.
(4)
(d) On a road the tractor accelerates from rest up to a speed of 6 m/s in 15 seconds.
Calculate the acceleration of the tractor.
___________________________________________________________________
___________________________________________________________________
___________________________________________________________________
_______________________________________ Acceleration = ___________ m/s2
(3)
(Total 15 marks)
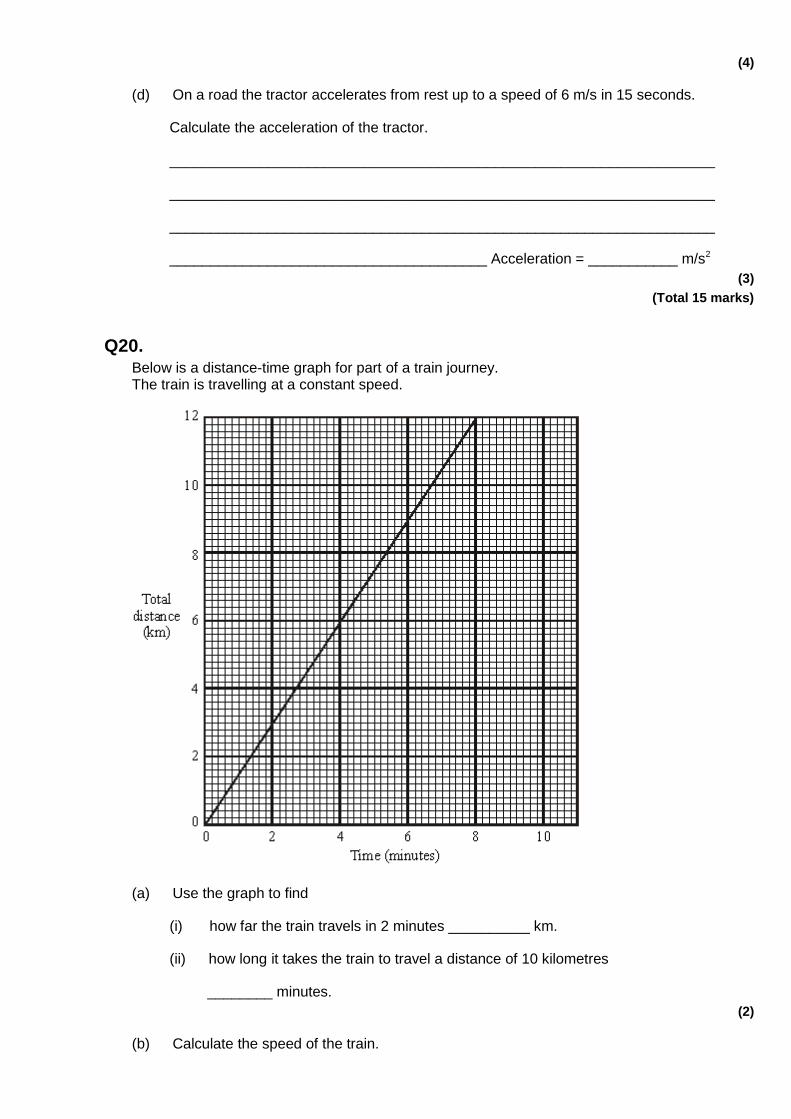
Q20. Below is a distance-time graph for part of a train journey. The train is travelling at a constant speed.
(a) Use the graph to find
(i) how far the train travels in 2 minutes __________ km.
(ii) how long it takes the train to travel a distance of 10 kilometres
________ minutes.
(2)
(b) Calculate the speed of the train.
___________________________________________________________________
___________________________________________________________________
___________________________________________________________________
___________________________________________________________________
___________________________________________________________________
(4)
(Total 6 marks)
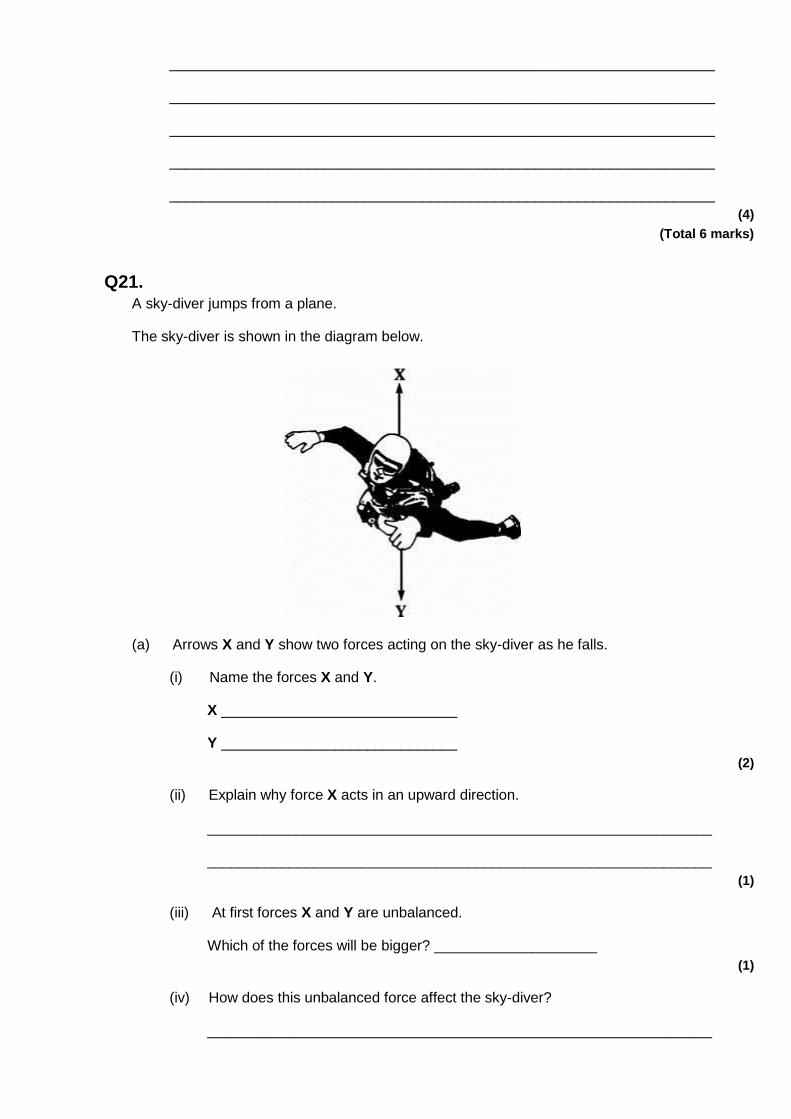
Q21. A sky-diver jumps from a plane.
The sky-diver is shown in the diagram below.
(a) Arrows X and Y show two forces acting on the sky-diver as he falls.
(i) Name the forces X and Y.
X _____________________________
Y _____________________________
(2)
(ii) Explain why force X acts in an upward direction.
______________________________________________________________
______________________________________________________________
(1)
(iii) At first forces X and Y are unbalanced.
Which of the forces will be bigger? ____________________
(1)
(iv) How does this unbalanced force affect the sky-diver?
______________________________________________________________
______________________________________________________________
(2)
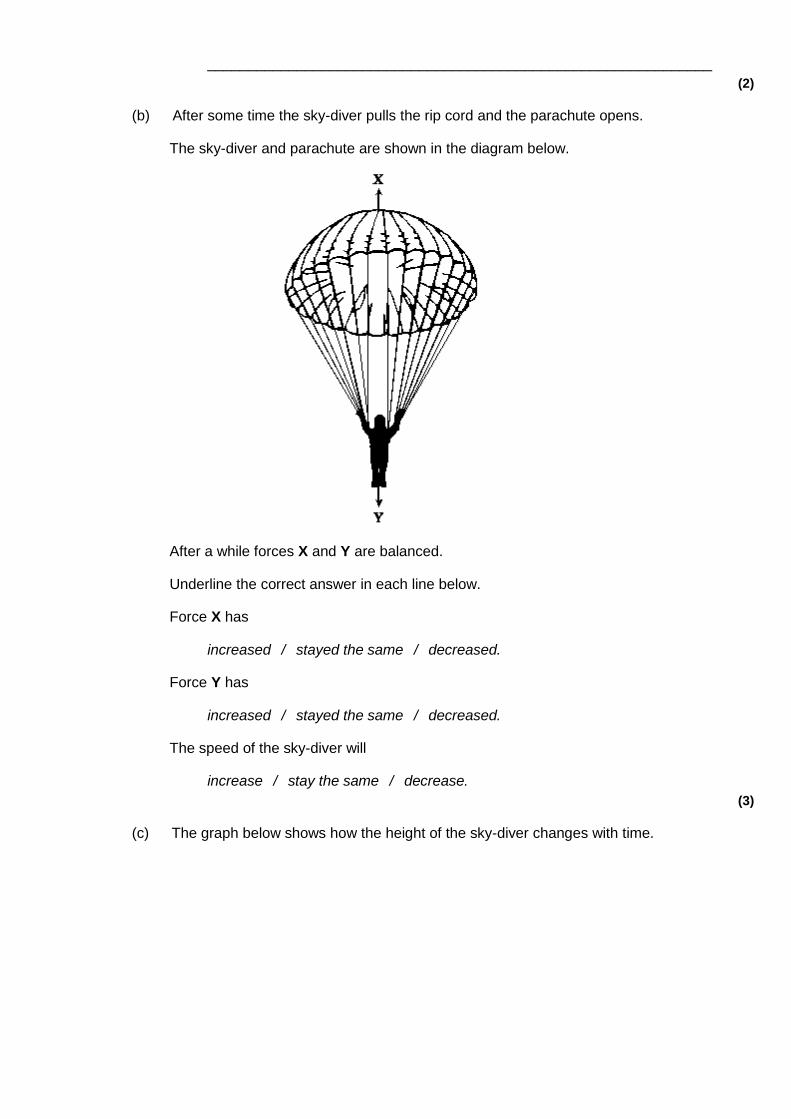
(b) After some time the sky-diver pulls the rip cord and the parachute opens.
The sky-diver and parachute are shown in the diagram below.
After a while forces X and Y are balanced.
Underline the correct answer in each line below.
Force X has
increased / stayed the same / decreased.
Force Y has
increased / stayed the same / decreased.
The speed of the sky-diver will
increase / stay the same / decrease.
(3)
(c) The graph below shows how the height of the sky-diver changes with time.
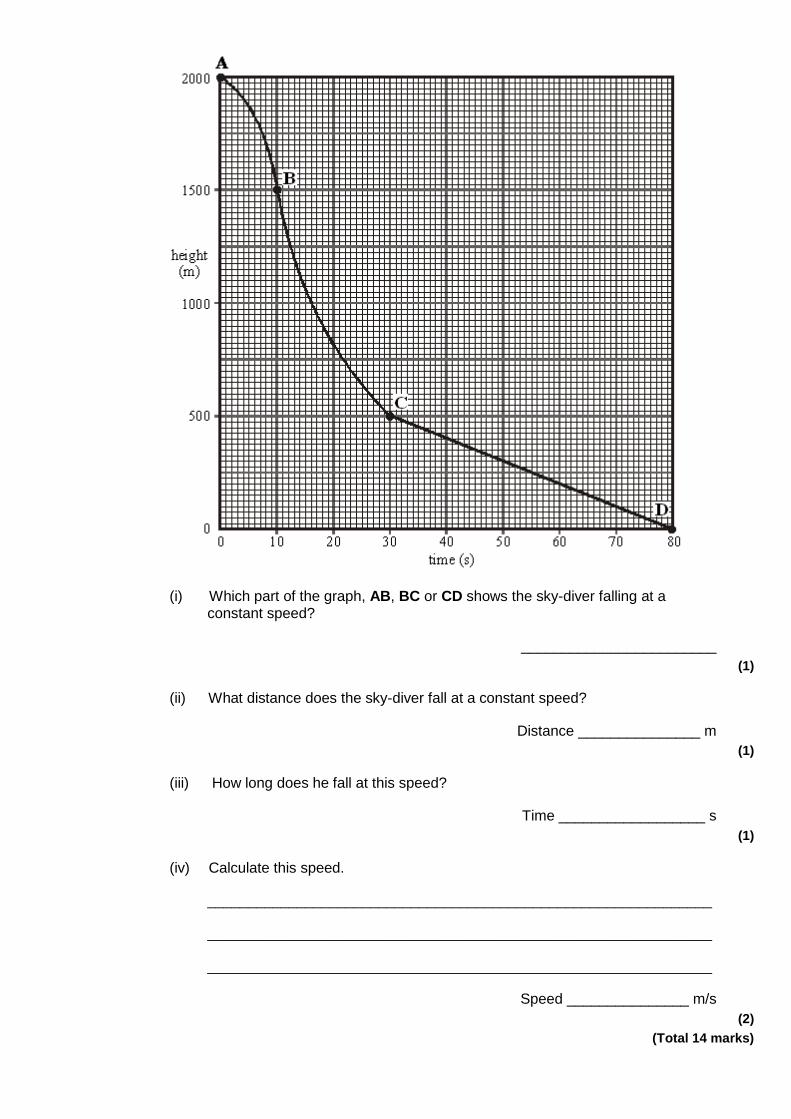
(i) Which part of the graph, AB, BC or CD shows the sky-diver falling at a constant speed?
________________________
(1)
(ii) What distance does the sky-diver fall at a constant speed?
Distance _______________ m
(1)
(iii) How long does he fall at this speed?
Time __________________ s
(1)
(iv) Calculate this speed.
______________________________________________________________
______________________________________________________________
______________________________________________________________
Speed _______________ m/s
(2)
(Total 14 marks)
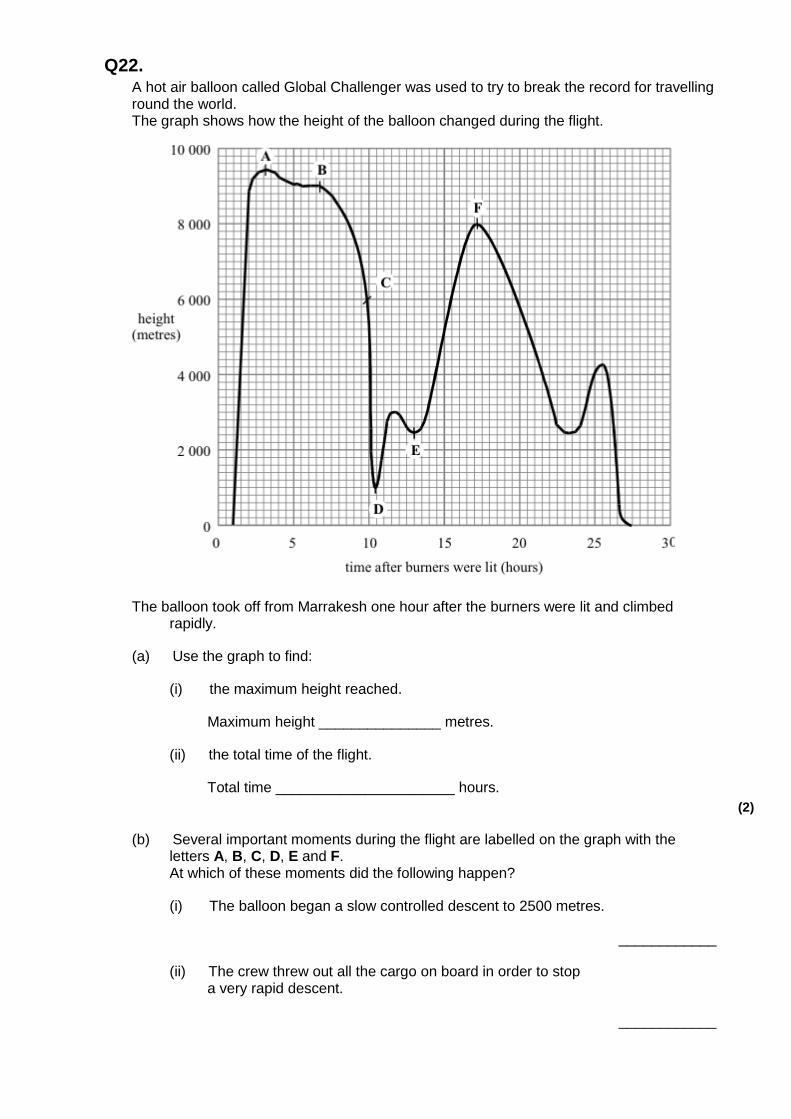
Q22. A hot air balloon called Global Challenger was used to try to break the record for travelling round the world. The graph shows how the height of the balloon changed during the flight.
The balloon took off from Marrakesh one hour after the burners were lit and climbed rapidly.
(a) Use the graph to find:
(i) the maximum height reached.
Maximum height _______________ metres.
(ii) the total time of the flight.
Total time ______________________ hours.
(2)
(b) Several important moments during the flight are labelled on the graph with the letters A, B, C, D, E and F. At which of these moments did the following happen?
(i) The balloon began a slow controlled descent to 2500 metres.
____________
(ii) The crew threw out all the cargo on board in order to stop a very rapid descent.
____________
(iii) The balloon started to descend from 9000 metres.
____________
(3)
(Total 5 marks)
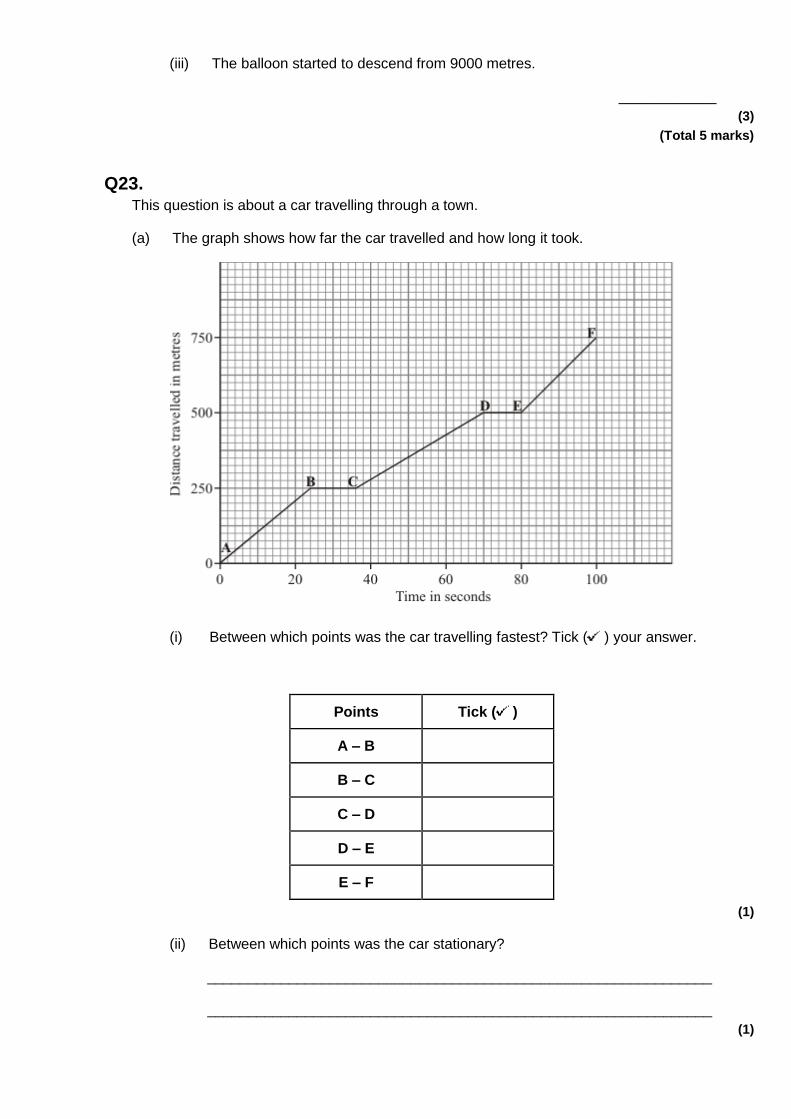
Q23. This question is about a car travelling through a town.
(a) The graph shows how far the car travelled and how long it took.
(i) Between which points was the car travelling fastest? Tick ( ) your answer.
Points Tick ( )
A – B
B – C
C – D
D – E
E – F
(1)
(ii) Between which points was the car stationary?
______________________________________________________________
______________________________________________________________
(1)
(b) Complete the sentences by writing the correct words in the spaces.
When a car has to stop, the overall stopping distance is greater if:
• the car is poorly maintained;
• there are adverse weather conditions;
• the car is travelling ________________ ;
• the driver’s reactions are ________________ .
Also, the greater the speed of the car, then the greater the braking _____________
needed to stop in a certain time.
(3)
(Total 5 marks)
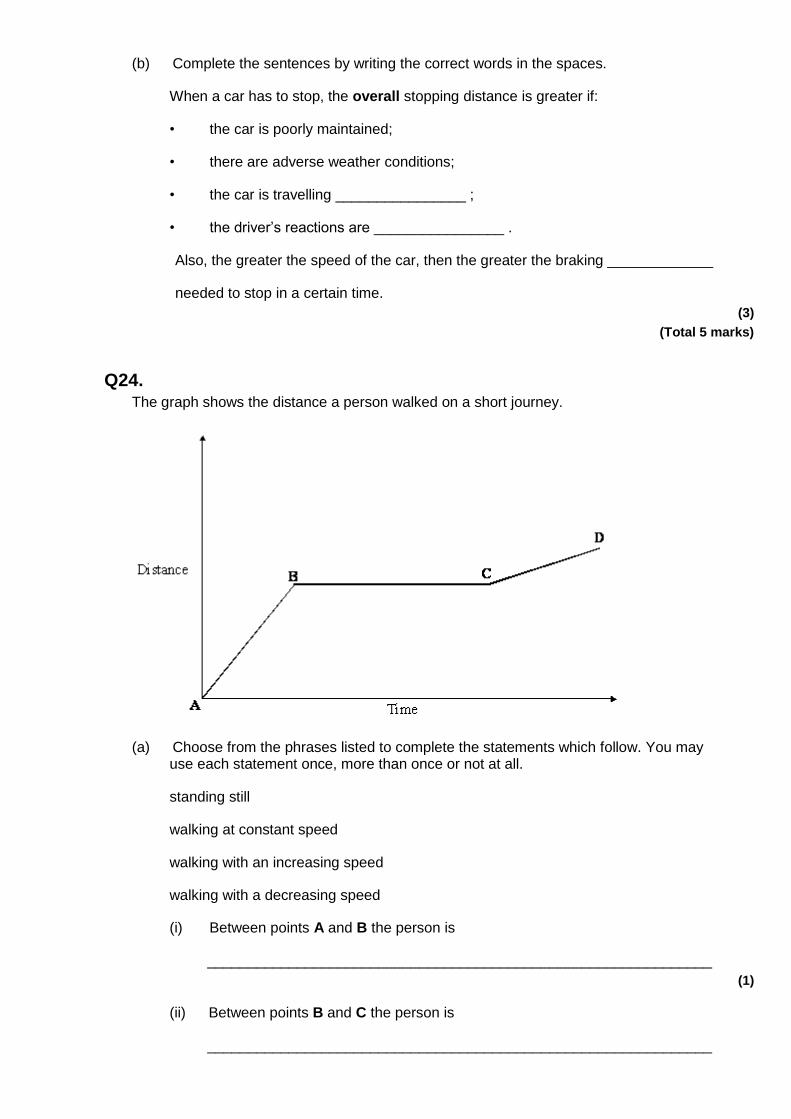
Q24. The graph shows the distance a person walked on a short journey.
(a) Choose from the phrases listed to complete the statements which follow. You may use each statement once, more than once or not at all.
standing still
walking at constant speed
walking with an increasing speed
walking with a decreasing speed
(i) Between points A and B the person is
______________________________________________________________
(1)
(ii) Between points B and C the person is
______________________________________________________________
(1)
(b) Complete the sentence.
You can tell that the speed of the person between points A and B is ____________
than the speed between points C and D because ___________________________
___________________________________________________________________
(2)
(c) Write the equation which relates distance, speed and time.
___________________________________________________________________
(1)
(Total 5 marks)
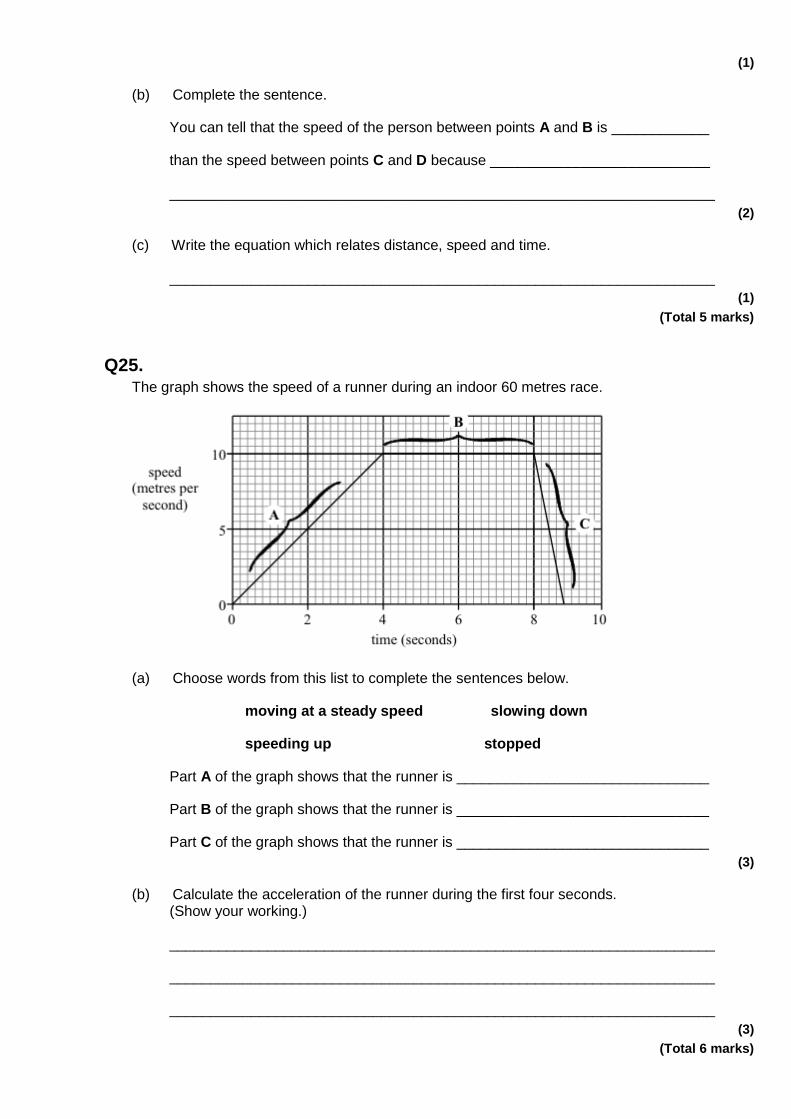
Q25. The graph shows the speed of a runner during an indoor 60 metres race.
(a) Choose words from this list to complete the sentences below.
moving at a steady speed slowing down
speeding up stopped
Part A of the graph shows that the runner is _______________________________
Part B of the graph shows that the runner is _______________________________
Part C of the graph shows that the runner is _______________________________
(3)
(b) Calculate the acceleration of the runner during the first four seconds. (Show your working.)
___________________________________________________________________
___________________________________________________________________
___________________________________________________________________
(3)
(Total 6 marks)
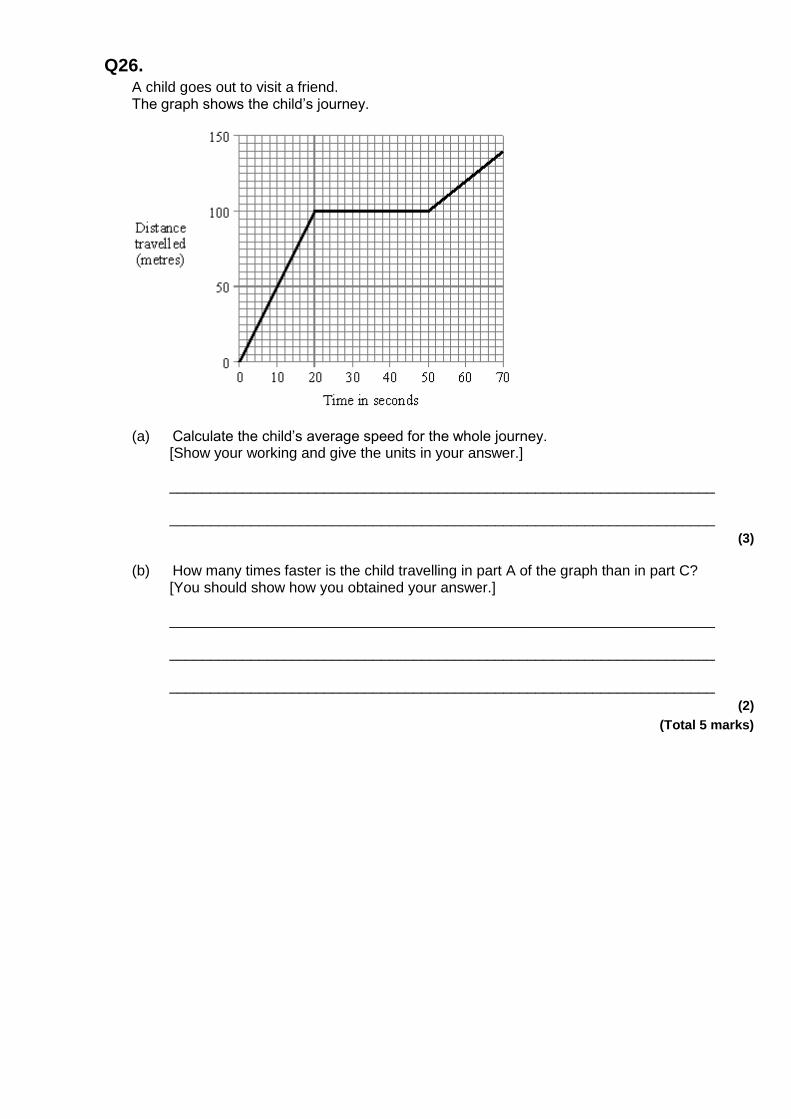
Q26. A child goes out to visit a friend. The graph shows the child’s journey.
(a) Calculate the child’s average speed for the whole journey. [Show your working and give the units in your answer.]
___________________________________________________________________
___________________________________________________________________
(3)
(b) How many times faster is the child travelling in part A of the graph than in part C? [You should show how you obtained your answer.]
___________________________________________________________________
___________________________________________________________________
___________________________________________________________________
(2)
(Total 5 marks)