Embed Size (px)
Citation preview
The Determinants of Consumption and Saving
Charles Yuji Horioka(Institute of Social and Economic Research,
Osaka University, and National Bureau of Economic Research)
Prepared for presentation at the PECC International Workshop on Social Resilience
Project 2011
July 12, 2011, Tokyo, Japan
1
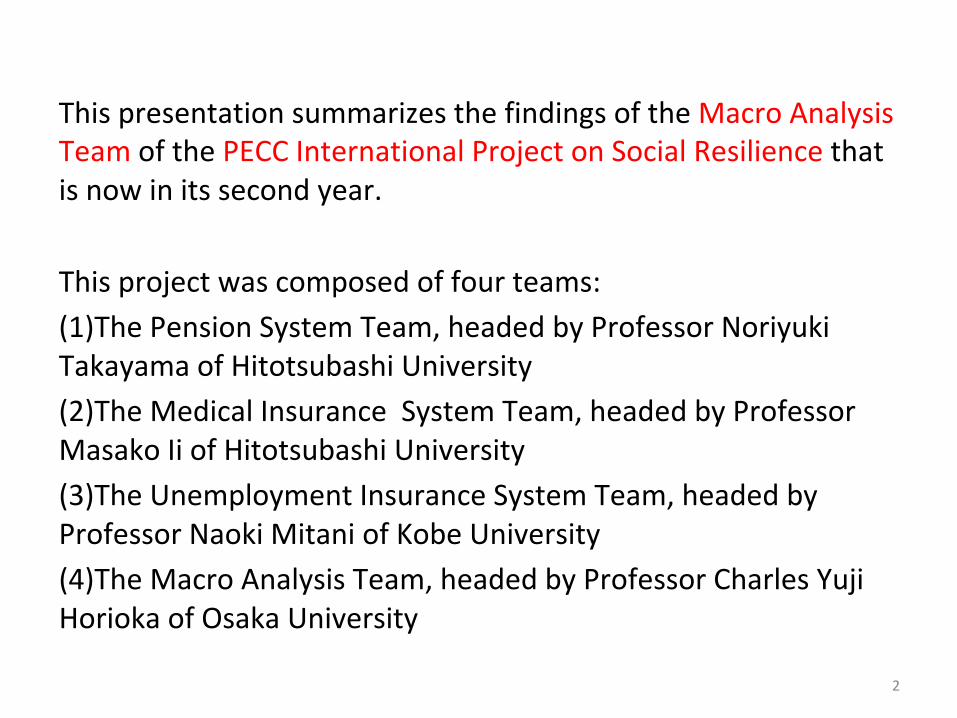
This presentation summarizes the findings of the Macro Analysis Team of the PECC International Project on Social Resilience that
is now in its second year.
This project was composed of four teams:(1)The Pension System Team, headed by Professor Noriyuki
Takayama of Hitotsubashi University(2)The Medical Insurance System Team, headed by Professor
Masako Ii of Hitotsubashi University(3)The Unemployment Insurance System Team, headed by
Professor Naoki Mitani of Kobe University(4)The Macro Analysis Team, headed by Professor Charles Yuji
Horioka of Osaka University
2
The Composition of the Macro Analysis Team
1.
Charles Yuji Horioka (Institute of Social and Economic Research, Osaka University, and
National Bureau of Economic Research)2.
Wataru Suzuki (Gakushuin University)
3.
Yanfei Zhou (Japan Institute for Labor Policy and Training)
3

The Objective of the Macro Analysis Team (1)
Whereas the objective of the other three teams is to analyze the structure of social safety
nets (in particular, medical insurance, pensions, and unemployment insurance), the
objective of this team is to analyze the impact of social safety nets on the
macroeconomy,
especially on consumption and saving.
4
The Objective of the Macro Analysis Team (2)
(1)
Horioka is using cross‐country data on the G7 and Asian economies to analyze the
determinants of trends over time in consumption and saving.
(2)
Suzuki and Zhou are using long‐term time series data on Japan to analyze the
determinants of the recent explosion in the take‐up rate of welfare.
5
The Determinants of Consumption and Saving
(1) Analysis of the determinants of consumption using data on the Group of Seven (G7)
economies(2) Analysis of the determinants of saving using
data on the economies of emerging Asia
6
(1) The Determinants of Consumption in the G7 Economies
• I focus on the G7 countries (Canada, France, Germany, Italy, Japan, the United Kingdom,
and the United States) because of their importance in the world economy.
• I focus on the 2002‐2007 period because it was a relatively prosperous period between the Asian financial crisis and the Lehman
shock.
7
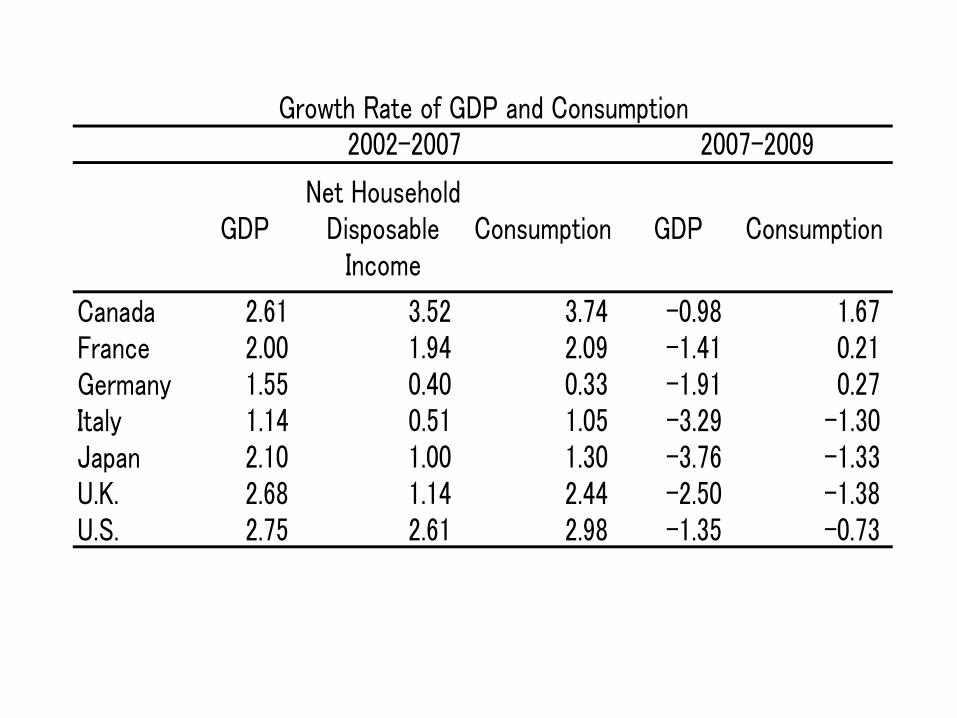
GDPNet Household
DisposableIncome
Consumption GDP Consumption
Canada 2.61 3.52 3.74 -0.98 1.67France 2.00 1.94 2.09 -1.41 0.21Germany 1.55 0.40 0.33 -1.91 0.27Italy 1.14 0.51 1.05 -3.29 -1.30Japan 2.10 1.00 1.30 -3.76 -1.33U.K. 2.68 1.14 2.44 -2.50 -1.38U.S. 2.75 2.61 2.98 -1.35 -0.73
2007-2009Growth Rate of GDP and Consumption
2002-2007
Trends in Consumption
• Consumption increased the fastest in Canada during the 2002‐07 period (3.7%), relatively
fast in the United States (3.0%), the United Kingdom (2.4%), and France (2.1%), and
relatively slowly in Japan (1.3%), Italy (1.1%), and Germany (0.3%).
• What are the reasons for the differences?
9
Determinants of Consumption Growth: GDP Growth• GDP growth is an important determinant of
consumption growth but not the only determinant because consumption growth
and GDP growth are roughly equal in some economies (France, Italy, the United Kingdom,
and the United States), but exceeds GDP in some economies (Canada), and falls short of
GDP growth in some economies (Germany and Japan).
10
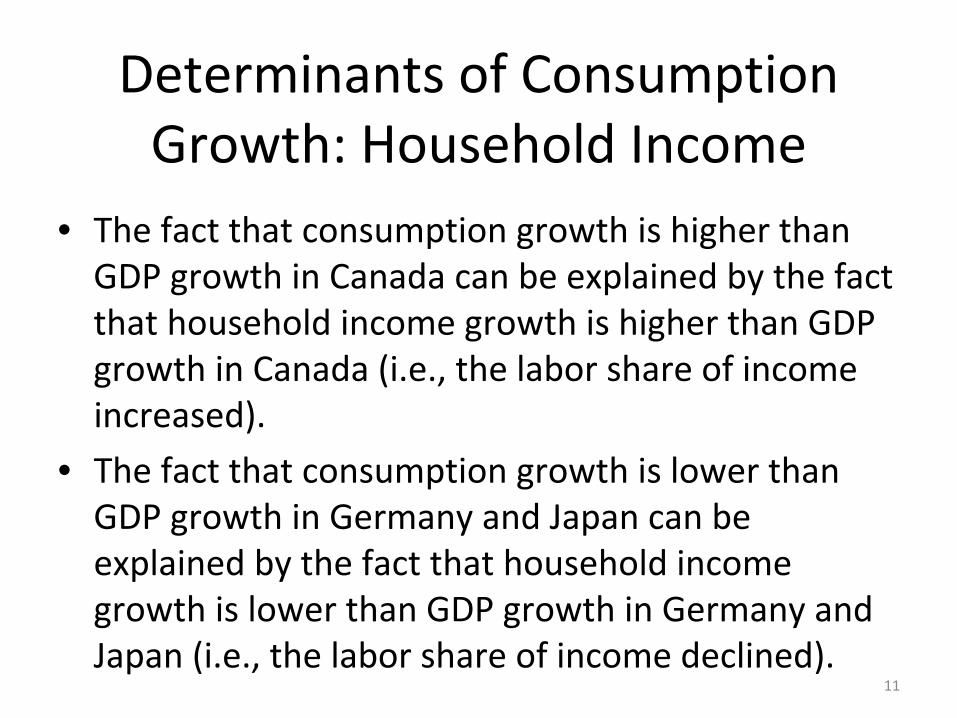
Determinants of Consumption Growth: Household Income• The fact that consumption growth is higher than
GDP growth in Canada can be explained by the fact that household income growth is higher than GDP
growth in Canada (i.e., the labor share of income increased).
• The fact that consumption growth is lower than GDP growth in Germany and Japan can be
explained by the fact that household income growth is lower than GDP growth in Germany and
Japan (i.e., the labor share of income declined).11
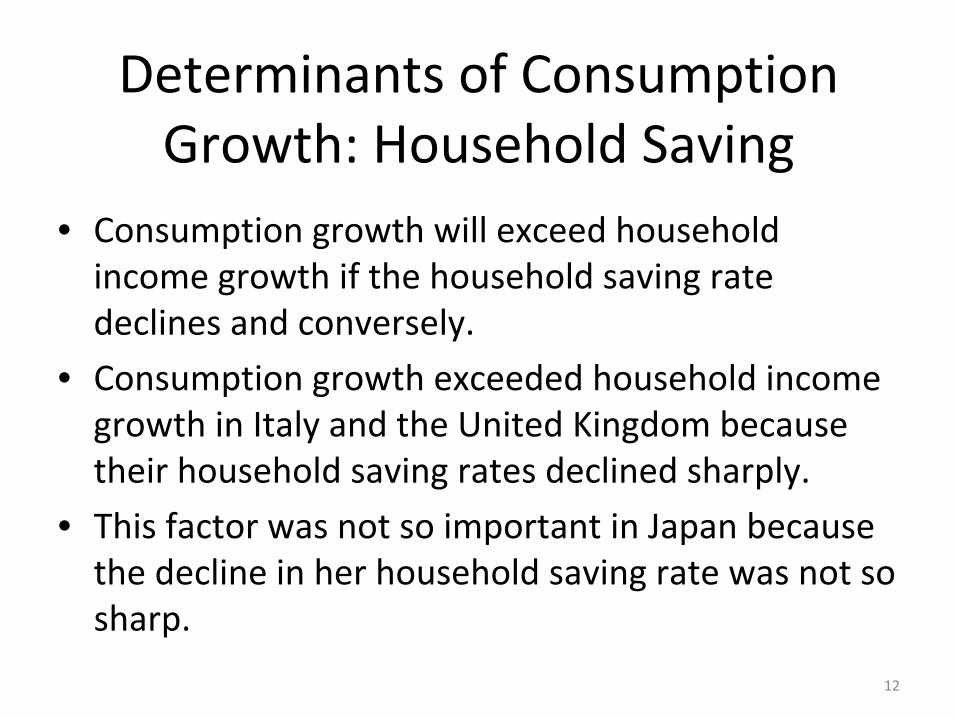
Determinants of Consumption Growth: Household Saving• Consumption growth will exceed household
income growth if the household saving rate declines and conversely.
• Consumption growth exceeded household income growth in Italy and the United Kingdom because
their household saving rates declined sharply.
• This factor was not so important in Japan because the decline in her household saving rate was not so
sharp.
12
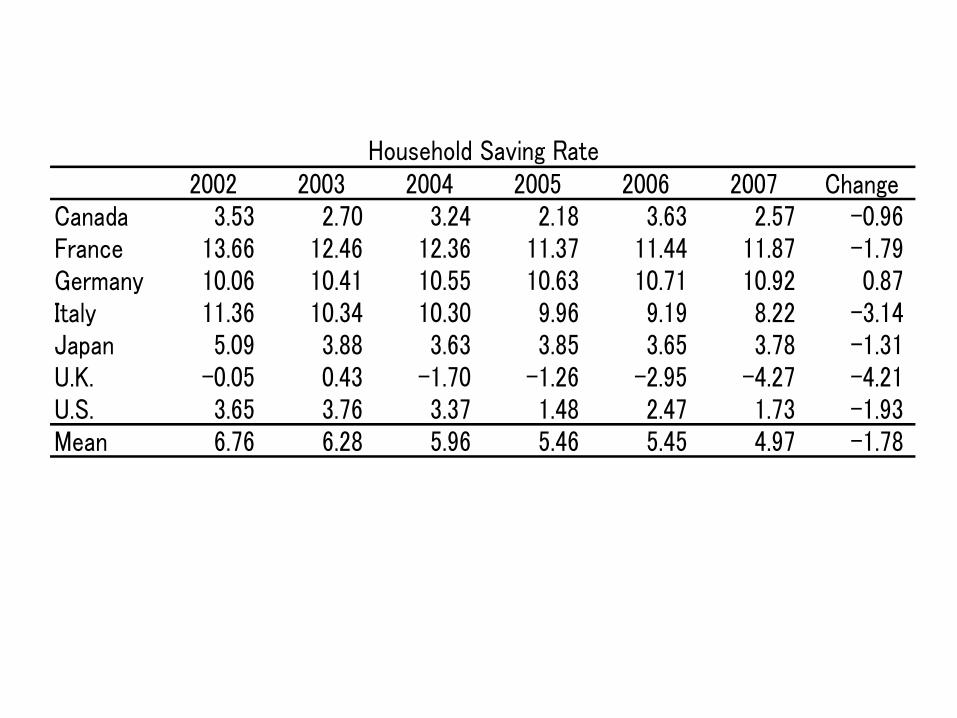
2002 2003 2004 2005 2006 2007 ChangeCanada 3.53 2.70 3.24 2.18 3.63 2.57 -0.96France 13.66 12.46 12.36 11.37 11.44 11.87 -1.79Germany 10.06 10.41 10.55 10.63 10.71 10.92 0.87Italy 11.36 10.34 10.30 9.96 9.19 8.22 -3.14Japan 5.09 3.88 3.63 3.85 3.65 3.78 -1.31U.K. -0.05 0.43 -1.70 -1.26 -2.95 -4.27 -4.21U.S. 3.65 3.76 3.37 1.48 2.47 1.73 -1.93Mean 6.76 6.28 5.96 5.46 5.45 4.97 -1.78
Household Saving Rate
Determinants of Consumption Growth: Conclusion• Consumption growth is determined by GDP
growth, household income growth, and trends in household saving rates.
• The stagnation of consumption in Japan is due primarily to the stagnation of household income
(or to put it another way, the decline in the labor share of income or the stagnation of wages).
• The stagnation of GDP and the decline in the household saving rate are not so important in Japan.
14
(2) The Determinants of Saving in the Economies of Emerging Asia• My co‐author Akiko Terada‐Hagiwara (Asian
Development Bank) and I use cross‐country panel data on 12 economies in emerging Asia (which
together account for 95% of the GDP of non‐Japan Asia) to analyze the determinants of the domestic saving rate in these economies.
• Economies included: People’s Republic of China; Hong Kong; India; Indonesia; Republic of Korea;
Malaysia; Pakistan; Philippines; Singapore; Taipei, China; Thailand; and Viet Nam
15
16
020
4060
020
4060
020
4060
70 75 80 85 90 95 00 07 70 75 80 85 90 95 00 07 70 75 80 85 90 95 00 07 70 75 80 85 90 95 00 07
70 75 80 85 90 95 00 07 70 75 80 85 90 95 00 07 70 75 80 85 90 95 00 07 70 75 80 85 90 95 00 07
70 75 80 85 90 95 00 07 70 75 80 85 90 95 00 07 70 75 80 85 90 95 00 07 70758085 90 95 00 07
Hong Kong, China India Indonesia Korea, Rep. of
Malaysia China, People's Rep. of Pakistan Philippines
Singapore Taipei,China Thailand Viet Nam
Nominal measure Real measure
Ave
rage
Dom
estic
Sav
ing
Rat
e
Graphs by ctry
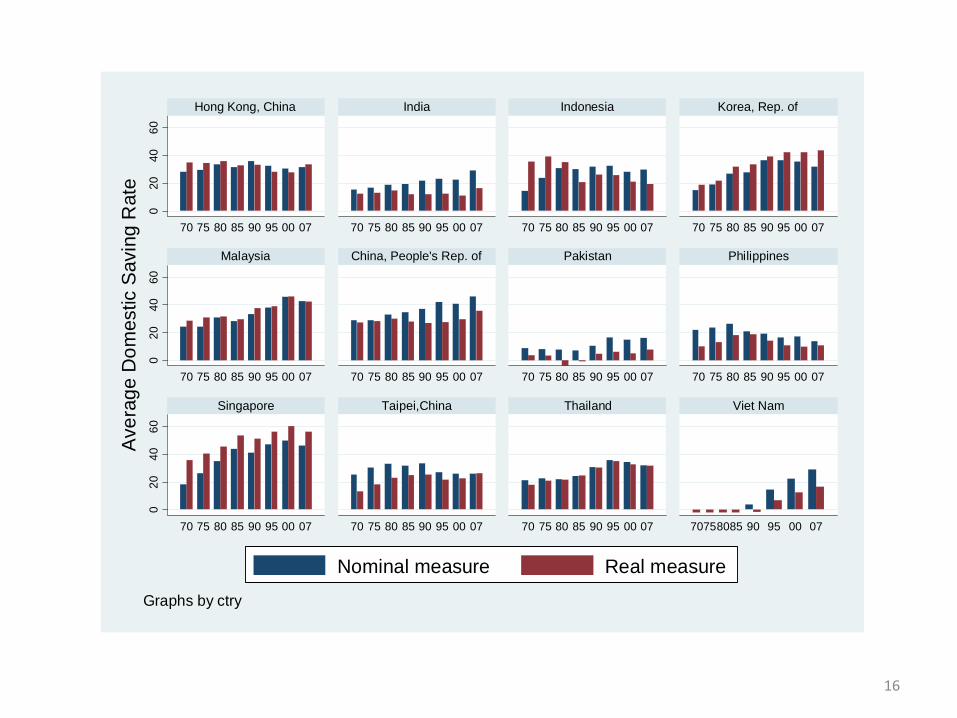
The Level of Saving Rates
There have been enormous variations in the level of saving rates, even within developing
Asia, during the past 50 years, with saving rates tending to be higher in East Asia and Southeast Asia (with the exception of
Philippines and Vietnam) and lower in South Asia, regardless of whether we look at
nominal or real saving rates. (Singapore is at the top and Pakistan and Vietnam are at the bottom of the pile.)
17
Trends in Saving Rates
There have been enormous variations in trends over time in saving rates, even within
developing Asia, during the past 50 years, with saving rates showing upward trends in
developing Asia as a whole and in most individual countries, downward trends in Indonesia (real only) and the Philippines, and no
clear trend in Hong Kong, regardless of whether we look at nominal or real saving rates.
18
Determinants of Saving (1)
• We analyze the determinants of variations over time and among countries in developing
Asia using both random effects and country fixed effects models.
• Following previous studies, the observations are five‐year averages except for the most
recent period (1966‐70, 1971‐75, 1976‐80, 1981‐85, 1986‐90, 1991‐95, 1996‐2000, and
2001‐07).19
Determinants of Saving (2)
(Demographic variables)
• AGE = Aged dependency ratio (population aged 65 and older/population aged 15‐64)
• DEP = Youth dependency ratio (population aged 0‐14/population aged 15‐64)
20
Determinants of Saving (3)
(GDP‐related variables)
• LNGDP = The log of real per capita GDP
• LNGDPSQ = The square of LNGDP
• CHGDP = The growth rate of real per capita GDP
21
Determinants of Saving (4)
(Financial variables)
• CREDIT = The ratio of private credit by deposit money banks and other financial
institutions to GDP
• CREDITSQ = The square of CREDIT
• INT = The nominal interest rate
• INFL = The inflation rate
• RINT = The real interest rate
22
Determinants of Saving (5)
(Other economic variables)
• FISC = The ratio of the fiscal balance of the government to GDP
• SSR = The social security ratio (the ratio of expenditures on social services and pensions
to gross national disposable income)
23
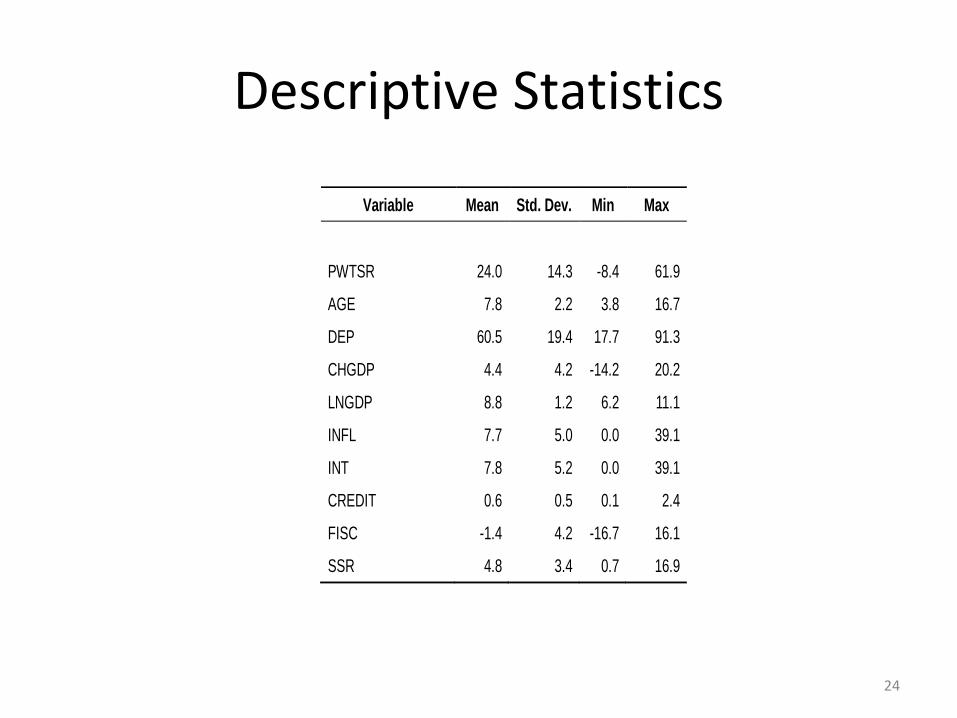
Descriptive Statistics
24
Variable Mean Std. Dev. Min Max
PWTSR 24.0 14.3 -8.4 61.9
AGE 7.8 2.2 3.8 16.7
DEP 60.5 19.4 17.7 91.3
CHGDP 4.4 4.2 -14.2 20.2
LNGDP 8.8 1.2 6.2 11.1
INFL 7.7 5.0 0.0 39.1
INT 7.8 5.2 0.0 39.1
CREDIT 0.6 0.5 0.1 2.4
FISC -1.4 4.2 -16.7 16.1
SSR 4.8 3.4 0.7 16.9
Estimation Results
(1)
The aged dependency ratio (the ratio of the aged population to the working‐age population)
has a negative impact on the household saving rate.
(2)
Income
levels
have
a
positive
but
nonlinear (convex) impact on the household saving rate.
(3)
Credit
availability
has
a
negative
but
nonlinear (concave) impact on the household saving rate.
(4)
The
social
benefit
has
a
negative
impact
on
the household saving rate in some cases.
25
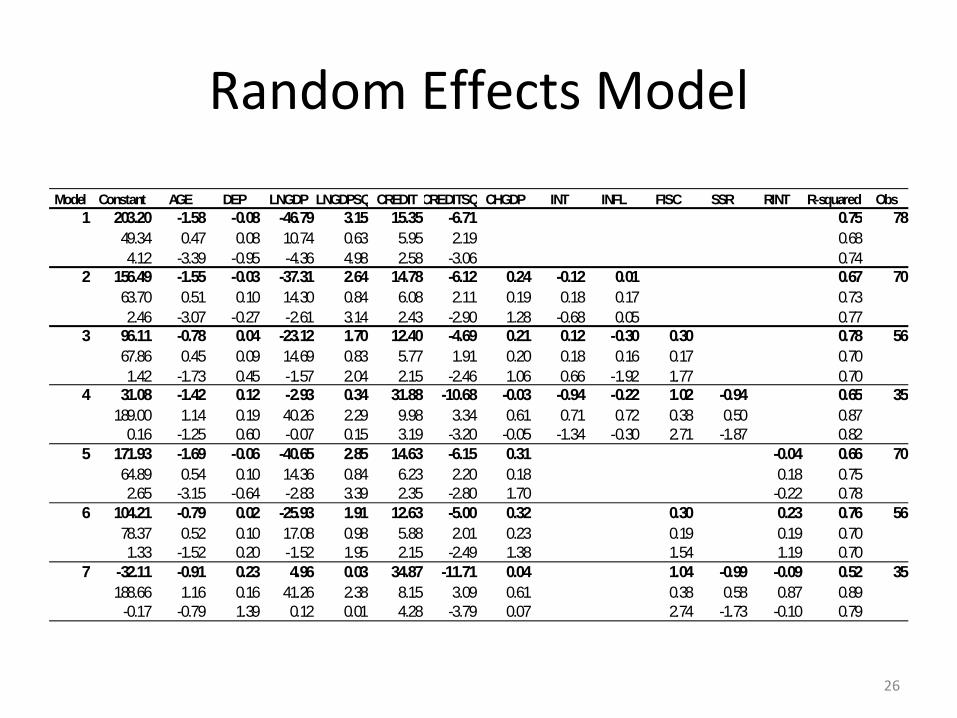
Random Effects Model
26
Model Constant AGE DEP LNGDP LNGDPSQ CREDIT CREDITSQ CHGDP INT INFL FISC SSR RINT R-squared Obs1 203.20 -1.58 -0.08 -46.79 3.15 15.35 -6.71 0.75 78
49.34 0.47 0.08 10.74 0.63 5.95 2.19 0.684.12 -3.39 -0.95 -4.36 4.98 2.58 -3.06 0.74
2 156.49 -1.55 -0.03 -37.31 2.64 14.78 -6.12 0.24 -0.12 0.01 0.67 7063.70 0.51 0.10 14.30 0.84 6.08 2.11 0.19 0.18 0.17 0.732.46 -3.07 -0.27 -2.61 3.14 2.43 -2.90 1.28 -0.68 0.05 0.77
3 96.11 -0.78 0.04 -23.12 1.70 12.40 -4.69 0.21 0.12 -0.30 0.30 0.78 5667.86 0.45 0.09 14.69 0.83 5.77 1.91 0.20 0.18 0.16 0.17 0.701.42 -1.73 0.45 -1.57 2.04 2.15 -2.46 1.06 0.66 -1.92 1.77 0.70
4 31.08 -1.42 0.12 -2.93 0.34 31.88 -10.68 -0.03 -0.94 -0.22 1.02 -0.94 0.65 35189.00 1.14 0.19 40.26 2.29 9.98 3.34 0.61 0.71 0.72 0.38 0.50 0.87
0.16 -1.25 0.60 -0.07 0.15 3.19 -3.20 -0.05 -1.34 -0.30 2.71 -1.87 0.825 171.93 -1.69 -0.06 -40.65 2.85 14.63 -6.15 0.31 -0.04 0.66 70
64.89 0.54 0.10 14.36 0.84 6.23 2.20 0.18 0.18 0.752.65 -3.15 -0.64 -2.83 3.39 2.35 -2.80 1.70 -0.22 0.78
6 104.21 -0.79 0.02 -25.93 1.91 12.63 -5.00 0.32 0.30 0.23 0.76 5678.37 0.52 0.10 17.08 0.98 5.88 2.01 0.23 0.19 0.19 0.701.33 -1.52 0.20 -1.52 1.95 2.15 -2.49 1.38 1.54 1.19 0.70
7 -32.11 -0.91 0.23 4.96 0.03 34.87 -11.71 0.04 1.04 -0.99 -0.09 0.52 35188.66 1.16 0.16 41.26 2.38 8.15 3.09 0.61 0.38 0.58 0.87 0.89
-0.17 -0.79 1.39 0.12 0.01 4.28 -3.79 0.07 2.74 -1.73 -0.10 0.79
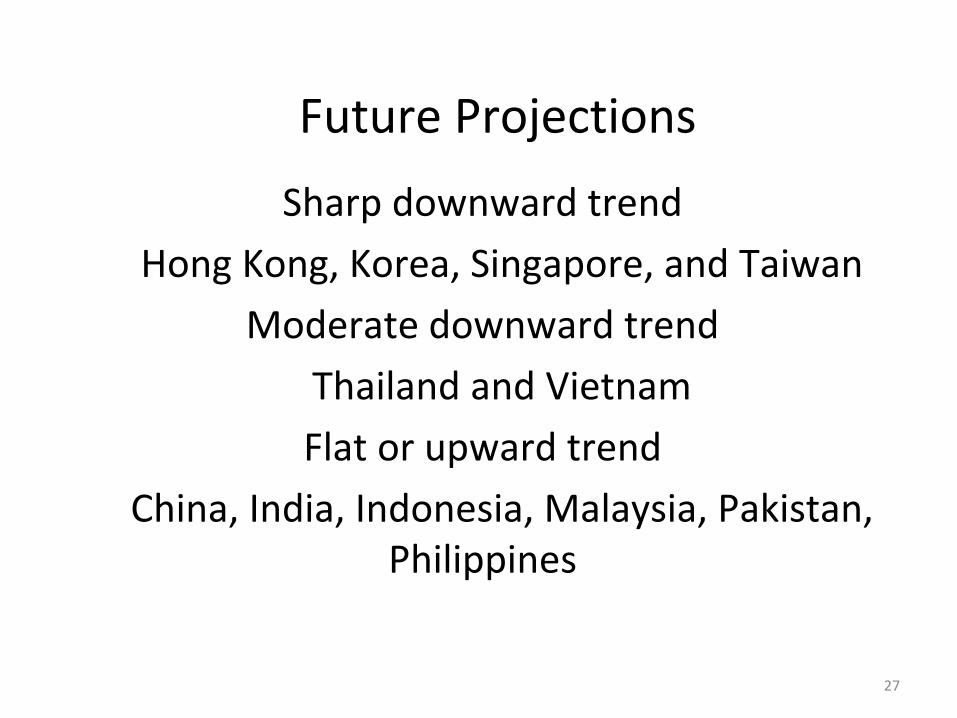
Future Projections
Sharp downward trend
Hong Kong, Korea, Singapore, and Taiwan
Moderate downward trend
Thailand and Vietnam
Flat or upward trend
China, India, Indonesia, Malaysia, Pakistan, Philippines
27
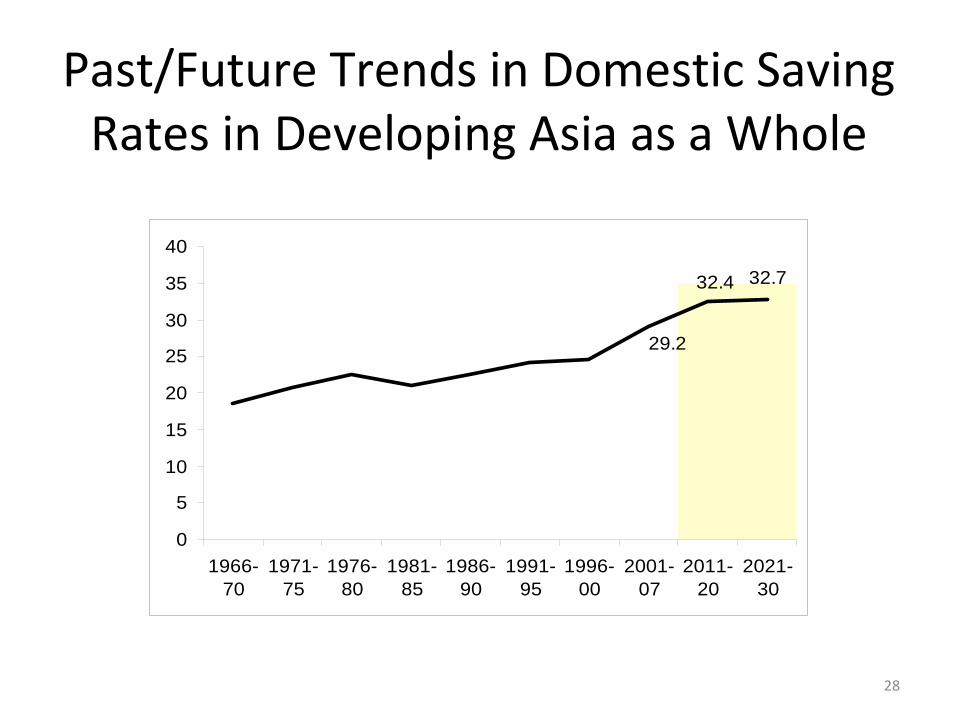
Past/Future Trends in Domestic Saving Rates in Developing Asia as a Whole
28
32.732.4
29.2
0
5
10
15
20
25
30
35
40
1966-70
1971-75
1976-80
1981-85
1986-90
1991-95
1996-00
2001-07
2011-20
2021-30
Extensions of This Research
We plan to extend this research in the following ways:
(1) Do further robustness checks (e.g., trying lags, trying different weights, etc.)
(2) Try including additional explanatory variables (e.g., exchange rate, unemployment rate, corporate saving
rate, etc.)
(3) Try for other samples (economies in other regions, economies at other levels of economic development,
etc.) or for larger samples
29
Policy Implications (1)
(1)
Household income/wages have been stagnant in Japan, and thus increasing household income/ wages (in other words,
increasing the labor share of income) is a highly effective and desirable way of
stimulating consumption. Possible ways: Create jobs, increase the share of regular workers, improve the wages and other
benefits of temporary workers, etc.
30
Policy Implications (2)
(1)
Financial sector development (increasing credit availability) and improving social safety nets are substitutes for one another, with both having
the effect of reducing saving, increasing consumption, and improving household welfare
by shielding them from risk.
(2)
The world economy is slowly recovering and thus now is a golden opportunity to implement
financial sector development and improve social safety nets.
31
Thank you very much for your kind attention.
Please send any questions or comments to [email protected]‐ u.ac.jp
32