Embed Size (px)
Citation preview
Scientific Excellence • Resource Protection & Conservation • Benefits for Canadians Excellence scientifique • Protection et conservation des ressources • B{mefices aux Canadiens
The Density of Capelin (Mallotus villosus MOiler) Eggs on Spawning Beaches in Conception Bay, Newfoundland
Christopher T. Taggart and Brian S. Nakashima
Science Branch Department of Fisheries and Oceans P.O. Box 5667 S1. John's, Newfoundland A1C 5X1
November 1987
Canadian Technical Report of Fisheries and Aquatic Sciences No. 1580
Fisheries Peches and Oceans et Oceans 1+1 Canada
\,
'\111:1,) 1,'111 UI II,) '111,);11: ':tl' I1~J IItllln4!Jl?J .11lIJII.~ 'Ill 111111 Illl'J.
'~"'!Ild.) 'lJ~llhlPoJ ';;ll .~JIIIl\r .,;1I!J Pol P .'JI1II;1\11I " 1:1 Ill" ;lJlla!ll1l<'U ;ll IUI'I' m.'ll": 11l:lIll:l""lll.l"p.1 wJ ....'1!'~' ...!11!.. lU,' I," 'I ItlJ Lll' 1 ;II' ,,~PIlr.lII:lP ,·'1 'Inuo!IPu 11"1.>1[:'.'.1
'? ".'] ..11;11111l1l 'Will ·l'mll!n.)J 11l1pq ;l;l,1 Po "'llll(lll.ll1 Illti' 'Jl1hlll lJ~l '1I11JJ1! I ....'1 ~i:{1 0 J~lIllnl np UIlIIIlJI:U 1:1 :'!l
"11'11[4': p ,'1:1 I! ~ll J?' l!l ,)\' !;lTl 1,1I' 111011 ,)' I . 1I1.'IlI.'1l II I1.1 I \u.l.I ,'f' p "';lIP~d "';11' .'I.~I'I UUII
• l.'lll 1:1 ;lp p ~.1tp~J '.'p ,1.'! \ l;l ..... 111' ','llhIUI( ':11 "'lloJdl~.1 .'1' .lll!1l} '9!14111.] ,'Ij;1 11111 t('1' I.~ S'I L ...,II.'IlJIIII ... :11 .11l.'lll:1t1UllII \Iq.l,lp.'II.'lJ"'11I11l1 ";1111 I:I.'IP p ....,lp~J <::II','.)! ".'IS '11I;lIU
-;luu"I"\?P "l' j;l ;\IF'I,11(.';'I1 "\ "1' :111~1~1I.,;'l1l"1);'!., I!tl l·t "1' ...",h!ll!!;"!;l] q li,dU';1 "11 .'1111
n"IlJI"J llJO~ tiL I~ ~~t'ill:'lllnll",1 I r.pPoUIU "l' ... .:l\I.'IF'~J ,,'\In, ,.'II-"II;lII.','J ';'II' .',''1 In.! .,I' ....,lIhllllj:1:11 .. 1JOJtll:.1 "I' .:11111 ': ....,'1411d :II? 11IlI J11i" ,'1"'.1 Jp tl~I'I: I ...IlJJlIllllI 'i;) I :U\,J"IIl'l'll Ill' ,,'nbllllp:11 I.' ...,nhIIIlU.:I!.,.. "'UIlIII'.'lJqnd "':11' Ipntllll~ '\:lJ't1I.1 '!lI'p ....' .... I~I.'
Ill"., 'II P ',,'"h,m"'/"'f ,.' ,.>"h!,,,",,,, I.' '/1.'1 h, \ "/' ,.'/I/III",,! .'11 \;1J q 'lIt'p '.;111"1';11
11Ip" """hllllj.1J I "lll1\h,h~ I .,J I \II.JJ" 1 ,'Iubt''1.l .'1' ;llllll ....~J n P"U''','11-I1I: IWJl'J 1.,1',\;\ ;11111
YI ";ll?ldl\I".~ 'lIP!lll"'I4I1J ,.'1' .~IIIlI111.' "~II;\ .'11:: 111:1\11:11.1 "'ll)1!IIII.",1 "'II"JJI' I '.' I :lUblll:1l hI' IJ 'i,'lIb11Il;llll:q "";lll.'!;>' "'I .'J! 11-1.:-1"'\,'
',111';1;,\0 ""1' P ,.llj;1.~J ""1' ,'I.'l'11Ilt11 np .,;111 hi 1'1"1.1 "'I' 1.' .1\11::'\111 ,.11' .11111111'il .'I~I·\ 1'1
,ll:,'lLl,'I,'II;'''' 1'['111:1;11' :1,'IIl~ 11I! 11Il'Ill> Il''ll.'! 1I,.,j ;l1ll1.'lll": \.11 II ·1I111:1q·1~ \.';\ ': "'.;>1I41JI""P
lilt''; 'I' P I'lU"!lt:lIl;\llIl ,'IJ'llh1Iln II 11l.lllt;1IJ"I1U,l'9 ... ;lIlIl"'1' Ium -,.1nh!"I1;l;\1 "'IJmIJl'l
;\'1 ·.,nhqlllt.,!.,., (1'11111',1 IIIi '11Il" 1111111:;1114I1d "I IUlId ':~lldtIIUdll 1\I.'IU;ll"lll IIHI ",,'d IU'.... ;Ill IIlh ''''Ill '';;'lIlJnpl' .. ;l,'UI:''''IIHItIt':'! \111~ 11I11I1Iq! 11111'.1 .,un IlPIlIlI'IIi'.' IIlh -.1l1b -11"101;11 p '..:111h11l1U,'!;l' "IU;1UI.'U;;I.hU:l1 ""1' 111.'UlI.'1I11") ....'llhll11I.':11 -ll"Jdl:J ';11
~'lnh!Jr.nhr. 1,1 S,mh!lna!IIHI s;l.lU,lp s~p lI~!PBU~;l ~nh!Ulp;}l Unddr.H
'IU:1;1l' 11~1;1,I;:lllIUhl,'l \1.1 ,':111: 11'11"'111.11.1", :'!tllll\\ "'II'd:11 '1.'PI"'-!I'-1I1() ,';leJ Jill' I'll J.l \p;1II1"11 ,'IPIIII 1',11'1( 111;11 uLJ" 141'1"';' ;;UII1'''' :1111 '\1.1 1'.'11 ~I "1.1 II! 1\ "'llnJ,lI I'm pi \11'111 It 'I I';lnh:l}! '\11';11111 \1~11 p,11"4111nll .111' 1n4 \11 1:1JI'1;1.1I, p.,.~l1l'lllJ ,)JC 'lJl1J:lJ !I'.'III LJ.'.1 1
';~h 1.'<!UII11I IIPJ.'I IP!" r.,flump ~1~\\ .'UIl'U
:I! I," 111,),1111.' .1111 ·"1111J.l}J 1'~.)IUq.1,~1 :'1.'1 \ I:J~ "1I111~1\ 1'111: ':1U;1I1\J.I 'lU;lIlIlIl'lI \!l1 ·'41 PIlI~ ~"ll"'I'I;l 'II 11l.11111 JI'J.~U "n p.'I1 .....1 ., I.H\ til> ~ I L• 1·'41l111 ~ 'IItl,!:lll I'·.~1I11I-';'l1 ,'11:,11' \;'\.1J !(I 111.'1111.11' I~ \;'I(j PIII,' II,' 11'."".' l.I ••~.11 \ 1.1S .'II! J I~ 1'\1 I'll P .. ·1I1,111"'!·1 'llI,'llItH11l\ II:.J
II' I" 111.1l1l1JPtbn ,I~ p;l" ..... ! ,11.'\\ rlL L~t "JJLpUIl,\ '1:1'1:111'.) III pl1:n n lj.1JI:.,.,;'\}j
..;111.,'1":.1 :llli 1" ~lI(\U,1}J 11';lIIlLJ.1;11 .1' 1':111"'1 ;'11;11\ .:111:1'" '1111 Ull)~r I "J,14IUll\l
'~lIl1!ll:"!lqIlJ I':,'"llp.ll pill: .)!1!111:l1.'''' III \;:lpll! 11'1111111, ".lIl"UlJll:d"(j "111111 P;1\.'1'1l1 PUI! 1/ "'lIl'lft UI/"lf"J /'11') I.J '//./1, 1IIl'""~ III pJl"':JI~LII' "I IIUU:l1 q:>I' I II"J.'J 'I.~r:l III 1.~I~Jl~4r. .1111 ;l\f.'41
II:.,dJ,' 111 1111:11.' 11:1110.., ,'ILl "IIl)1l1','114I1tJ 11111 "I' P:ll!.',1t.j \1:111 'lJ"U.'J I!'.'llll!,:ll .1,'1IP!,,' ,'lll:lIhll I'UI1 ",111:1'1"'11 • \!,'IUl'1J
· ... 111··1.10 puP '''11.:111''1:1 111lU,1IIlIJl'd:lU ,1111 In <,'!,"I.,J pun "lql;lllli 1'1:"14 ::>IP")1.'II;)1
~;l!JJ<: Jlp plW ,I;'l \Il:H I 1;l.l!qn" 1111 I'J;'Il'ld "" 11(\1).1111 ....11 oN lIolI1l4111"'1' tP.UI1!lI"lI.1.11111
lll~ .,\m\ ['1111 .l;lU:tl['Ill' ;11'1 \\1'11 .., \\ 1: p 11'\\"1 \IIJI'lIl1IJ 1'.11;1,:lJlp :lln "ll"d.), p:.~llIq.~" I ';lJnIlU;llll ,\II:tlI!JJ III I ,'"nIJ'lJJJ1~ 'll'~IIIIPll hilI '" 4.'!ll\\ lll<.j ;riJp:JI,\\,'U'1 ilUll';\\,'
III 9l1H.JlllUll1 WlIl1h'IIl!IlJ 1''1111 1'!.1111l(:',111'11l: .~1I1111.'1.'" IlIll111Il;l';'U"U;'l.l 11!.'IUli.'" I
sa.H1.1!JS ;lUr.nhV puc SlllJllIIS!.1 JO JJodaH ICJ!UlpJ.L UC!pr.UU,)
i
Canadian Technical Report of
Fisheries and Aquatic Sciences 1580
November 1987
THE DENSITY OF CAPELIN (MALLOTUS VILLOSUS MOLLER)
EGGS ON SPAVNING BEACHES IN CONCEPTION BAY, NEWFOUNDLAND
by
Christopher T. Taggart
Departmenet of Biology
Dalhousie University
Halifax, Nova Scotia
B3H 4Jl
and
Brian S. Nakashima
Science Branch
Department of Fisheries and Oceans
P.O. Box 5667
St. John's, Newfoundland A1C 5Xl
ii
@Minister of Supply and Services Canada 1987
Cat. No. Fs 97-6/1580E ISSN 0706-6457
Correct citation for this publication:
Taggart, C. T., and B. S. Nakashima. 1987. The density of capelin (Mallotus villosus MUller) eggs on spawning beaches in Conception Bay, Newfoundland. Can. Tech. Rep. Fish. Aquat. Sci. 1580: iv + 16 p.
iii
CONTENTS
Abstract/Resume iv
Introduction 1
Methods 1
Results 2
Summary 2
References 3
iv
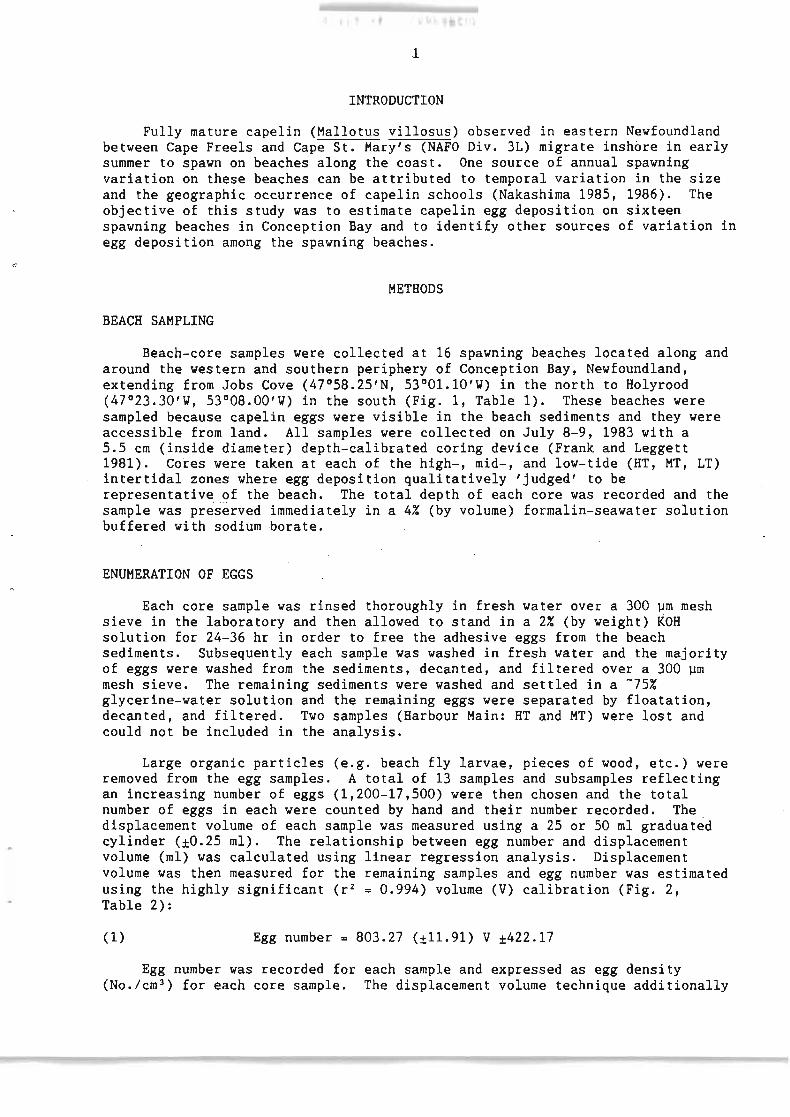
ABSTRACT
Taggart, C. T., and B. S. Nakashima. 1987. The density of capelin (Mallotus villosus MUller) eggs on spawning beaches in Conception Bay, Newfoundland. Can. Tech. Rep. Fish. Aquat. Sci. 1580: iv + 16 p.
Beach-core samples were collected in 1983 at 16 spawning beaches located around and along 75 km of the western and southern periphery of Conception Bay, Newfoundland. Spawning beach area was highly variable, ranging from 389 m2 to 12127 m2 and averaged 3268 m2 • Core depths were normally distributed, ranged from 7 to 16 cm, and averaged 11.9 cm. Analysis of variance showed no significant difference in core depth among three (high, mid, and low) intertidal zones. Egg density averaged 46/cm 3 (3-127/cm 3
) and showed a bimodal distribution (modes at 40 and 110/cm 3 ). Intertidal zone density estimates were not significantly different. Depth standardized areal density estimates were log-normally distributed. Multivariate linear regression analysis revealed no significant relationships between various measures of egg density and beach orientation, latitude and beach ~rea. Total 9gg deposition estimates (eggs/beach) ranged from -1 x 10 to -80 x 10 and were log-normally 9 distributed. The geometric average estimate of deposition was 8.8 x 10 eggs/beach. An apparent dome-shaped relationship between deposition and beach orientation indicates that maximum egg deposition occurs on beaches oriented toward the N/NE. There was an apparent grouping of beaches by latitude, each showing a general decline in deposition with latitude within each group.
RESUME
Taggart, C. T., and B. S. Nakashima. 1987. The density of capelin (Mallotus villosus MUller) eggs on spawning beaches in Conception Bay, Newfoundland. Can. Tech. Rep. Fish. Aquat. Sci. 1580: iv + 19 p.
En 1983, on a effectue un echantillonnage par carottage de 16 plages-frayeres couvrant 75 km du littoral meridional et occidental de la baie de la Conception (Terre-Neuve). La superficie des frayeres variait fortement alant de 389 m2 a 12 127 m2 (moyenne: 3 268 m2 ). La longueur des carottes suivait une distribution normale, variant de 7 a 16 cm (moyenne: 11,9 cm). Une analyse de la variance n'a pas revele de differences significatives entre les longueurs de carottes pre levees dans trois zones intertidales (position elevee, mediane et basse). La densite des oeufs allait de 3 a 127 oeufs/cm 3 (moyenne: 46 oeufs/cm 3 ) et montrait une distribution bimodale (40 et 110 oeufs/cm 3 ). Les densites estimatives n'etaient pas significativement differentes selon les zones intertidales. Les estimations de la densite superficielle normalisees en fonction de la profondeur suivaient une distribution lognormale. Une analyse de la regression lineaire multifactorielle n'a pas revele de relations significatives entre les divers denombrements de la densite des oeufs et l'orientation de la plage, la latitude et la superficie de la plage. Des etimations du nom~re total d'~eufs pondus (nombre d'oeufs/plage) varient d'environ =1 x 10 a =80 x 10 oeufs; ces estimations suivent une distribution lognormale. L'estimation retrocal§ulee de la moyenne geometrique du nombre d'oeufs pondus se situe a 8,8 x 10 oeufs/plage. Une courbe en forme de cloche montrant une relation entre Ie nombre d'oeufs pondus et l'orientation de la plage porte a croire a une ponte maximum sur les plages orientees vers Ie nord-nord-est. II existe un regroupement de plages selon la latitude ou chacun montre une baisse du nombre d'oeufs pondus selon la latitude des plages.
1
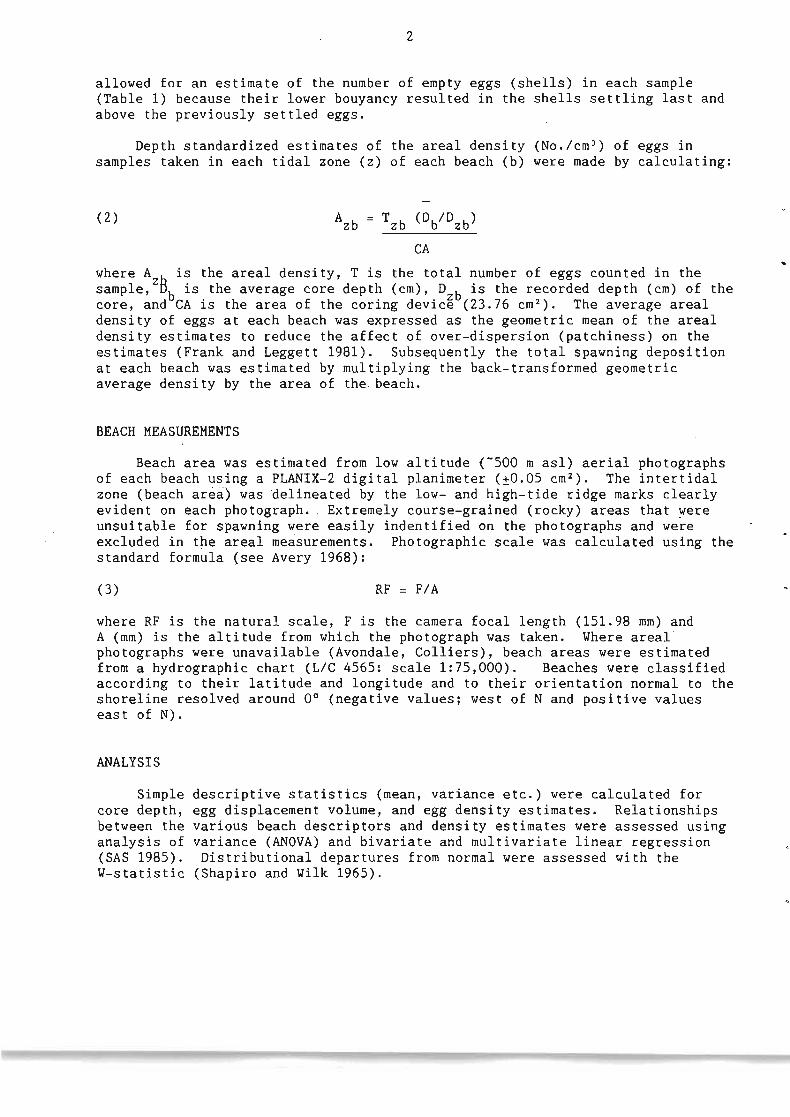
INTRODUCTION
Fully mature capelin (Mallotus villosus) observed in eastern Newfoundland between Cape Freels and Cape St. Mary's (NAFO Div. 3L) migrate inshore in early summer to spawn on beaches along the coast. One source of annual spawning variation on these beaches can be attributed to temporal variation in the size and the geographic occurrence of capel in schools (Nakashima 1985, 1986). The objective of this study was to estimate capel in egg deposition on sixteen spawning beaches in Conception Bay and to identify other sources of variation in egg deposition among the spawning beaches.
METHODS
BEACH SAMPLING
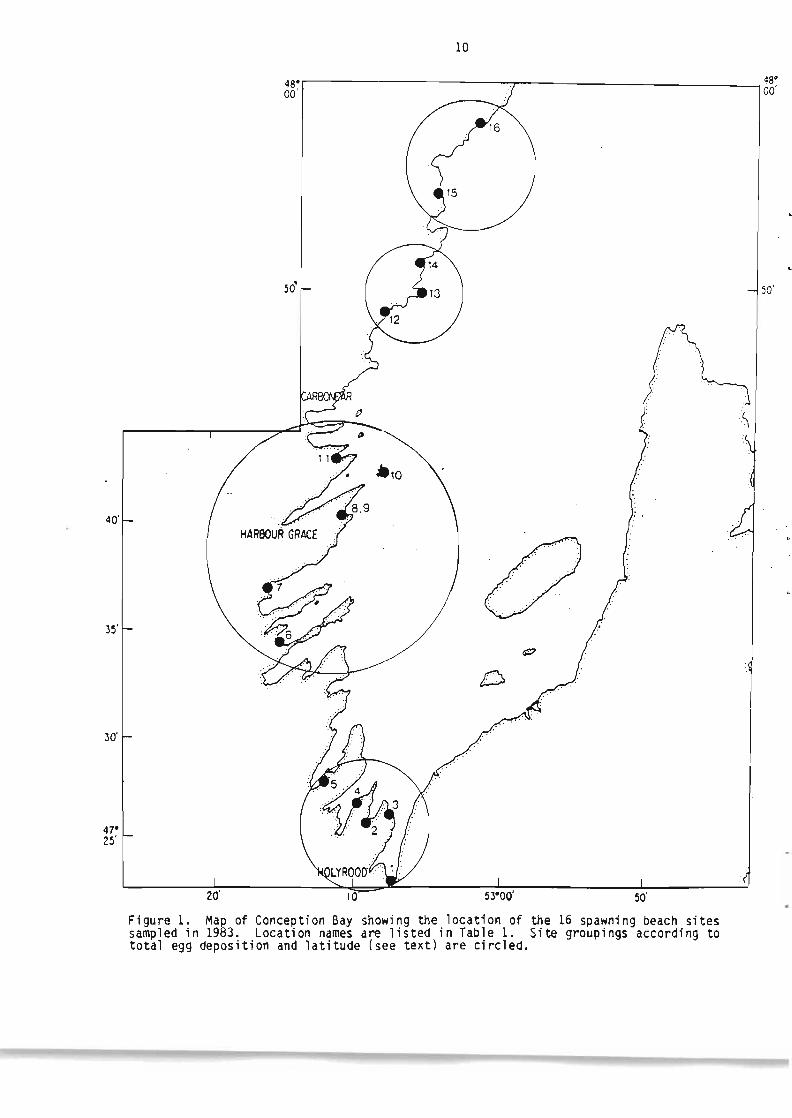
Beach-core samples were collected at 16 spawning beaches located along and around the western and southern periphery of Conception Bay, Newfoundland, extending from Jobs Cove (47°58.25'N, 53°01.10'Y) in the north to Holyrood (47°23.30'Y, 53°08.00'Y) in the south (Fig. 1, Table 1). These beaches were sampled because capel in eggs were visible in the beach sediments and they were accessible from land. All samples were collected on July 8-9, 1983 with a 5.5 cm (inside diameter) depth-calibrated coring device (Frank and Leggett 1981). Cores were taken at each of the high-, mid-, and low-tide (HT, MT, LT) intertidal zones where egg deposition qualitatively 'judged' to be representative of the beach. The total depth of each core was recorded and the sample was preserved immediately in a 4% (by volume) formalin-seawater solution buffered with sodium borate.
ENUMERATION OF EGGS
Each core sample was rinsed thoroughly in fresh water over a 300 ~m mesh sieve in the laboratory and then allowed to stand in a 2% (by weight) KOH solution for 24-36 hr in order to free the adhesive eggs from the beach sediments. Subsequently each sample was washed in fresh water and the majority of eggs were washed from the sediments, decanted, and filtered over a 300 ~m
mesh sieve. The remaining sediments were washed and settled in a -75% glycerine-water solution and the remaining eggs were separated by floatation, decanted, and filtered. Two samples (Harbour Main: HT and MT) were lost and could not be included in the analysis.
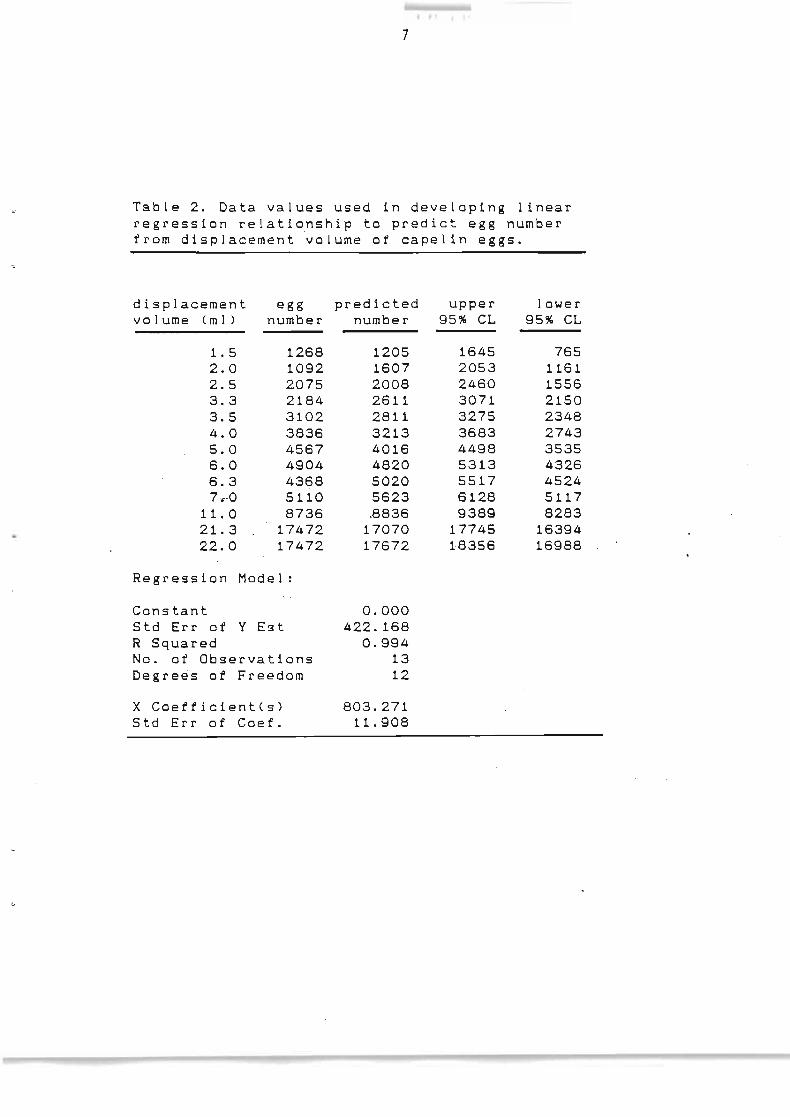
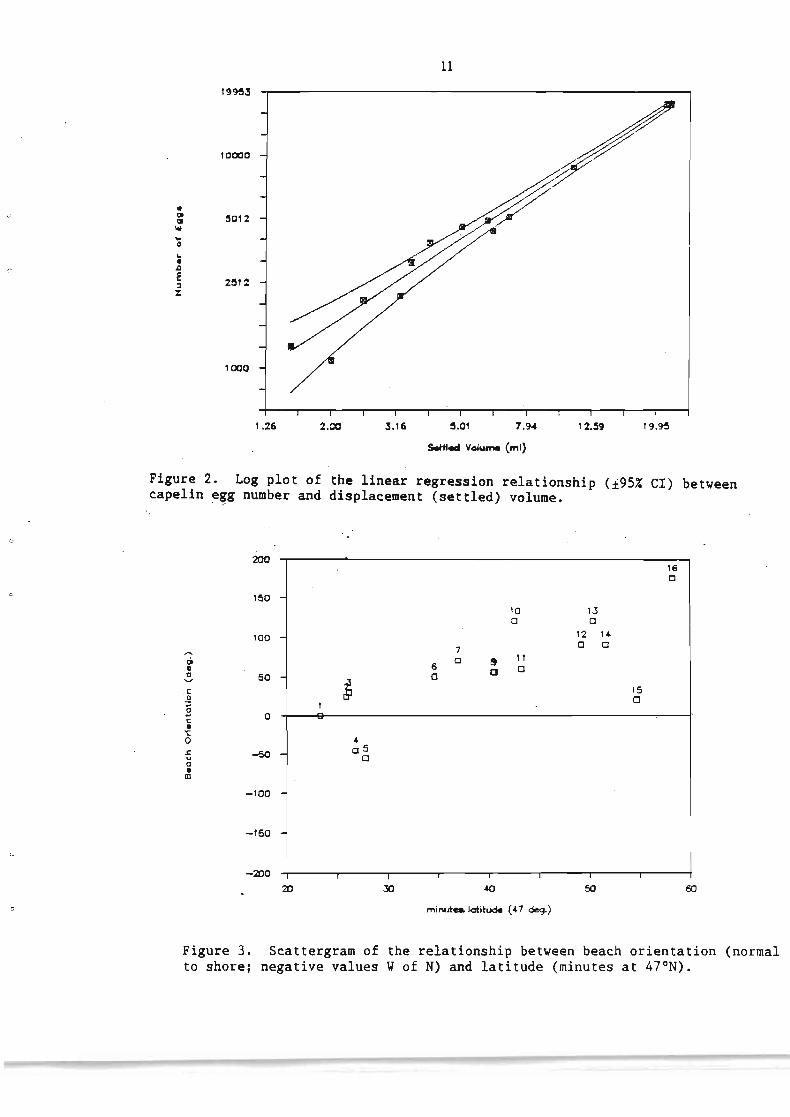
Large organic particles (e.g. beach fly larvae, pieces of wood, etc.) were removed from the egg samples. A total of 13 samples and subsamples reflecting an increasing number of eggs (1,200-17,500) were then chosen and the total number of eggs in each were counted by hand and their number recorded. The displacement volume of each sample was measured using a 25 or 50 ml graduated cylinder (±0.25 ml). The relationship between egg number and displacement volume (ml) was calculated using linear regression analysis. Displacement volume was then measured for the remaining samples and egg number was estimated using the highly significant (r 2 = 0.994) volume (V) calibration (Fig. 2, Table 2):
(1) Egg number = 803.27 (±11.91) V ±422.17
Egg number was recorded for each sample and expressed as egg density (No.fcm 3
) for each core sample. The displacement volume technique additionally
2
allowed for an estimate of the number of empty eggs (shells) in each sample (Table 1) because their lower bouyancy resulted in the shells settling last and above the previously settled eggs.
Depth standardized estimates of the areal density (No./cm 3 ) of eggs in samples taken in each tidal zone (z) of each beach (b) were made by calculating:
(2)
where A is the areal density, T is the total number of eggs counted in the sample,zB is the average core depth (em), D b is the recorded depth (em) of theb core, and CA is the area of the coring devic~ (23.76 cm 2 ). The average areal density of eggs at each beach was expressed as the geometric mean of the areal density estimates to reduce the affect of over-dispersion (patchiness) on the estimates (Frank and Leggett 1981). Subsequently the total spawning deposition at each beach was estimated by multiplying the back-transformed geometric average density by the area of the beach.
BEACH MEASUREMENTS
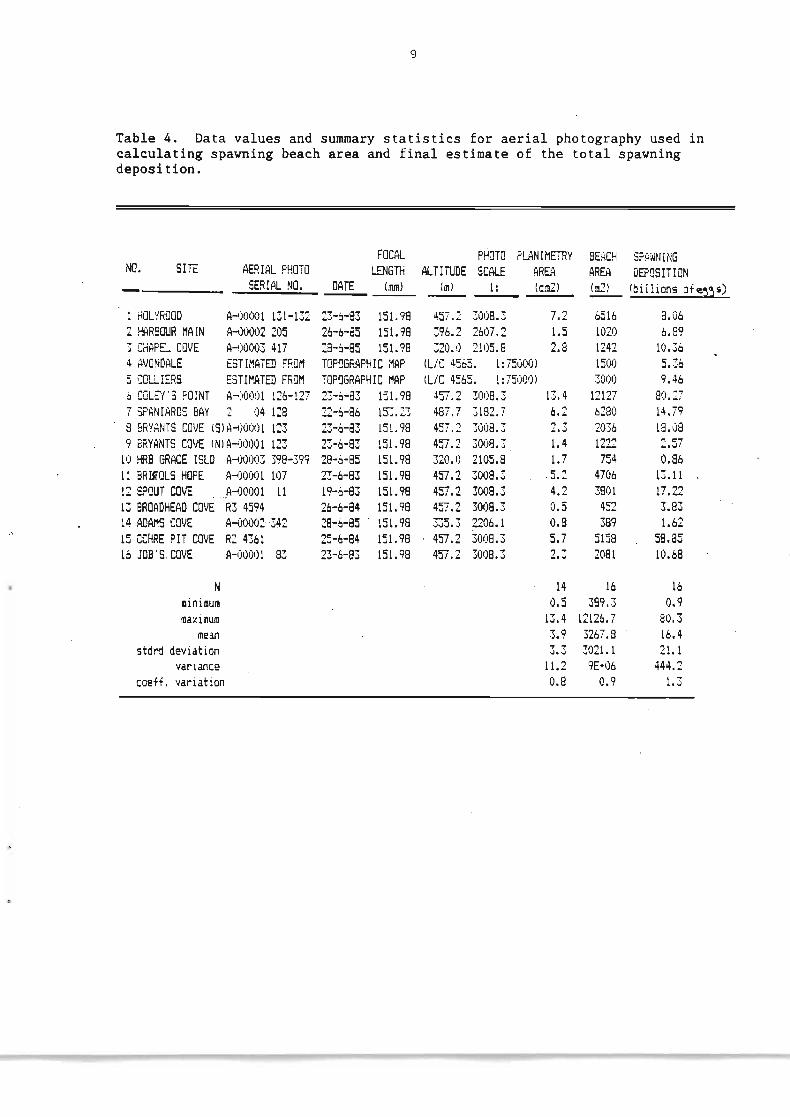
Beach area was estimated from low altitude (-500 m asl) aerial photographs of each beach using a PLANIX-2 digital planimeter (±0.05 cm 2 ). The intertidal zone (beach area) was delineated by the low- and high-tide ridge marks clearly evident on each photograph. Extremely course-grained (rocky) areas that ~ere
unsuitable for spawning were easily indentified on the photographs and were excluded in the areal measurements. Photographic scale was calculated using the standard formula (see Avery 1968):
(3) RF = F/A
where RF is the natural scale, F is the camera focal length (151.98 mm) and A (mm) is the altitude from which the photograph was taken. Where areal" photographs were unavailable (Avondale, Colliers), beach areas were estimated from a hydrographic chart (L/C 4565: scale 1:75,000). Beaches were classified according to their latitude and longitude and to their orientation normal to the shoreline resolved around 0° (negative values; west of N and positive values east of N).
ANALYSIS
Simple descriptive statistics (mean, variance etc.) were calculated for core depth, egg displacement volume, and egg density estimates. Relationships between the various beach descriptors and density estimates were assessed using analysis of variance (ANOVA) and bivariate and multivariate linear regression (SAS 1985). Distributional departures from normal were assessed with the W-statistic (Shapiro and Wilk 1965).
3
RESULTS
SPAVNING BEACHES
The beaches sampled covered a latitudinal range of 74 km along the west and southern coast of Conception Bay and their orientation ranged from _55° (305°) to 175° (Table 2). There was a positive relationship between beach orientation and latitude, reflecting the shape of Conception Bay and illustrating that the more southern beaches had a generally northerly orientation and northern beaches had a more easterly orientation (Fig. 3). Spawning beach area averaged 3268 m2
and was highly variable (Table 4), ranging from 389 m2 (Adams Cove) to 12127 m2
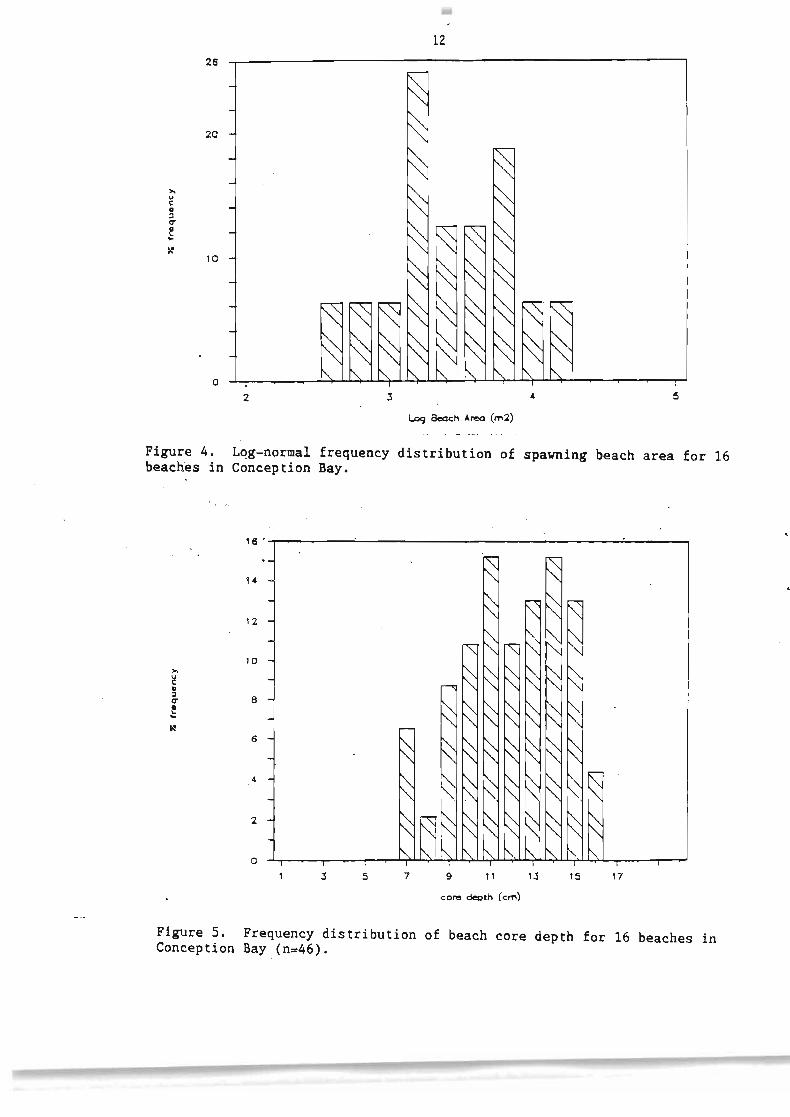
(Coleys Point). The frequency distribution of beach area was log-normal.
CORE DEPTHS
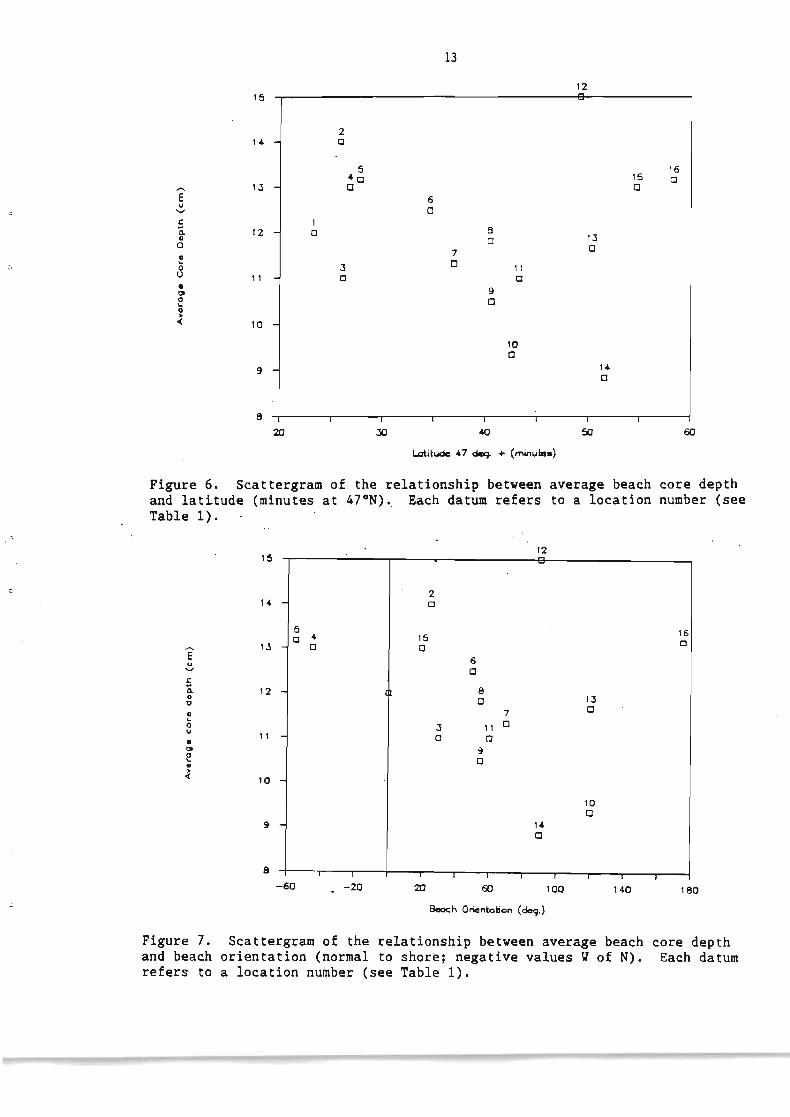
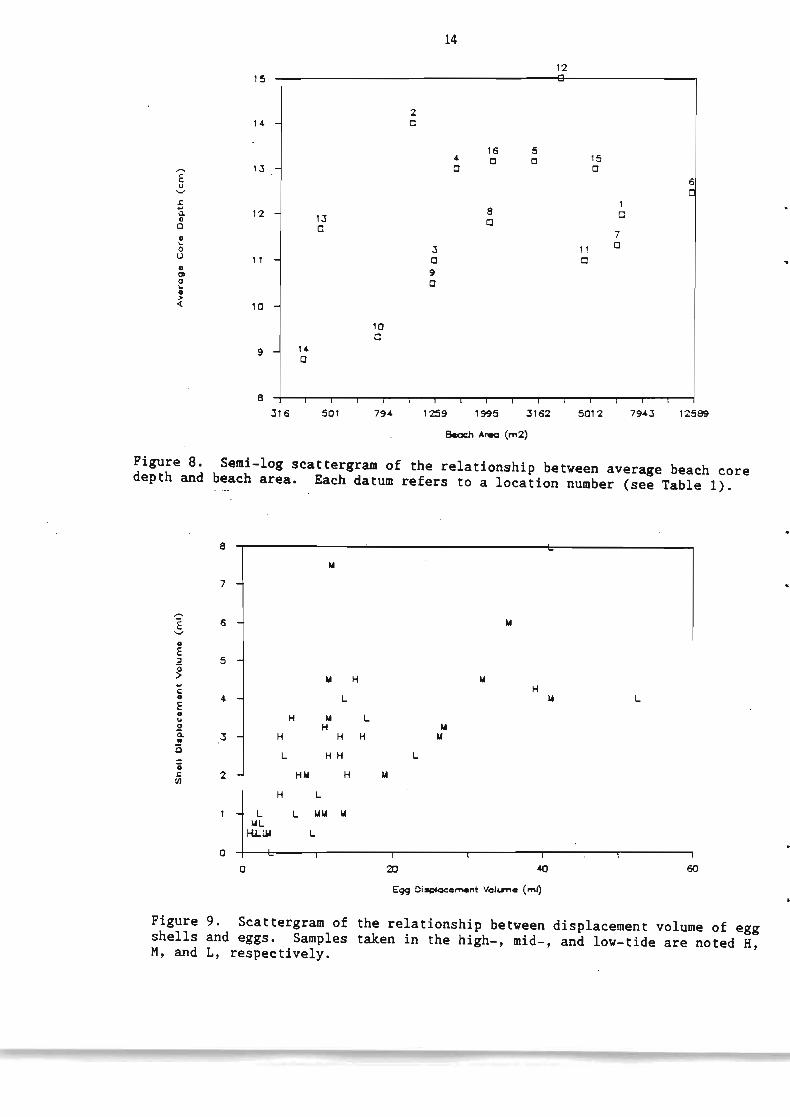
Core depths of the 46 samles ranged from 7 to 16 cm, averaged 11.9 cm (Table 2), and were normally distributed (Fig. 5). Variation in core depth among intertidal zones (HT, MT, LT) was low (Table 2) and an analysis of variance for all beaches combined showed no significant difference in core depth among the three intertidal zones (F = 0.67, p = 0.52). There was an apparent but significant (r 2 = 0.012) decrease in average core depth with increasing latitude (Fig. 6). However, with the removal of three high-latitude beaches (Fig. 6: 12 = Spout Cove, 15 = Ochre Pit Cove, 16 = Jobs Cove) the relationship was significant (r 2 = 0.47, p ~ 0.01). Also, there was an apparent but insignificant (r 2 = 0.07) decreasing relationship between average core depth and beach orientaii6n (Fig. 7). Again, with the removal of the high-latitude beaches the relationship was significant (r 2 = 0.46, p ~ 0.01). Although there was an increasing trend in average core depth with a logarithmic increase in beach area (Fig. 8) the relationship was not-significant (p ~ 0.05).
EGG DENSITY
Eggshells represented an average 15% of the total egg and shell displacement volumes (Tables 2 and 3). The displacement volume of egg shells increased with the displacement volume of eggs in the majority of samples (Fig. 9), although there was a tendency for shells to represent a greater proportion of the total in the HT samples relative to the MT and LT samples. Many shells were collapsed or incomplete and resulted in a greater number of. shells displacing a volume equivalent to fewer eggs. Therefore, total abundance estimates of shells were conservative. .
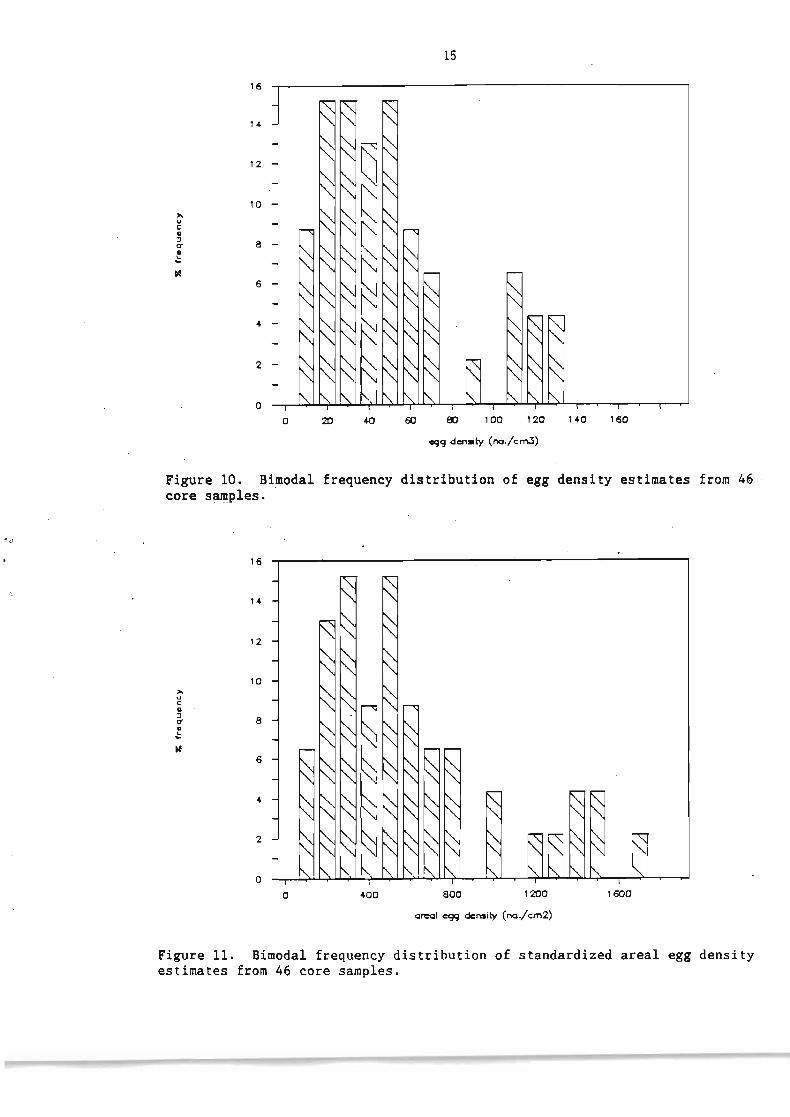
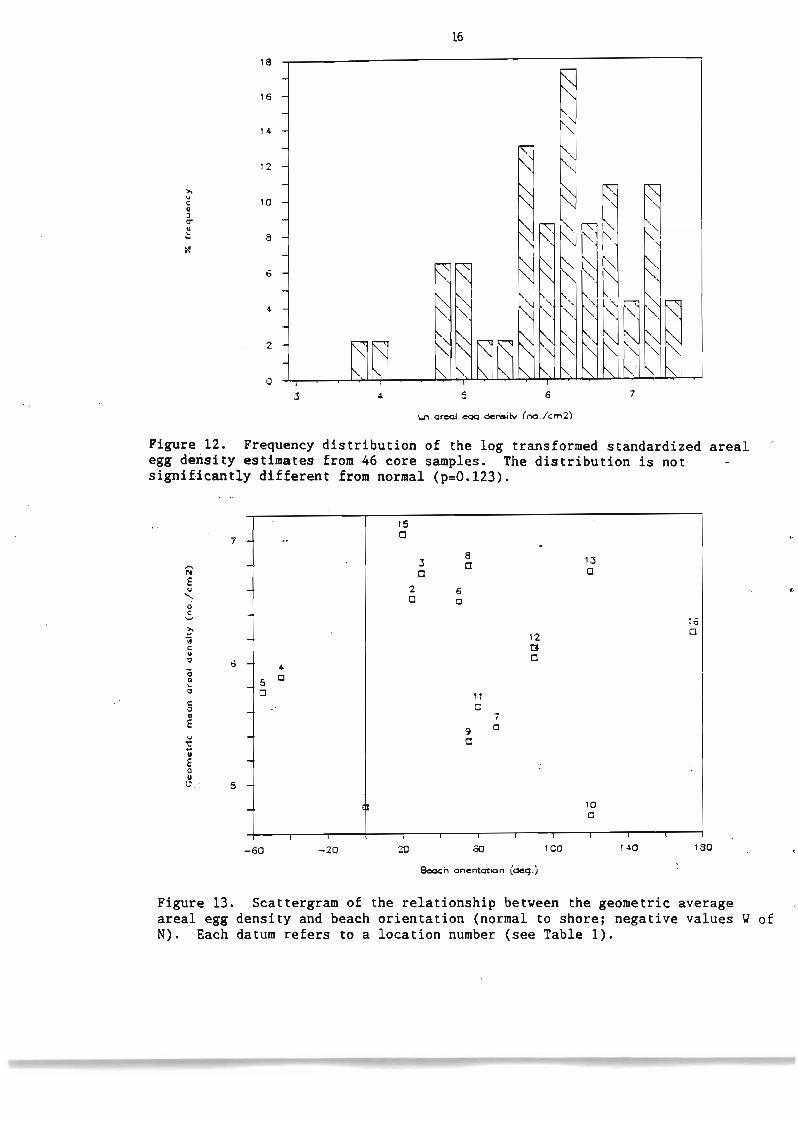
Egg density averaged 46/cm J , ranging between 3 and 127/cm J (Table 3). However, the frequency distribution of density estimates was clearly bimodal (Fig. 10); the first mode near 40/cm J represented the majority of the samples, and the second mode near 110/cmJ represented samples collected at five beaches (Chapel Cove, Coleys Point, Bryants Cove, Broadhead Cove, and Ochre Pit Cove). Intertidal zone density estimates-among beaches were not significantly different (ANOVA: f = 1.68, p = 0.20). The frequency distribution of the standardized areal density estimates (No./cm J ) showed a similar bimodal distribution (Fig. 11) and there was no significant difference in the intertidal zone estimates among beaches (ANOVA: F = 1.64, P = 0.21). The frequency distribution of the logarithmically transformed areal density (Fig. 12) was not significantly different from normal (p = 0.12). Analysis of variance showed no difference in the intertidal zone estimates among beaches (F = 2.13, p = 0.13). However, a
4
least significant difference paired t-test indicated significant differences between MT and LT estimates (p < 0.05).
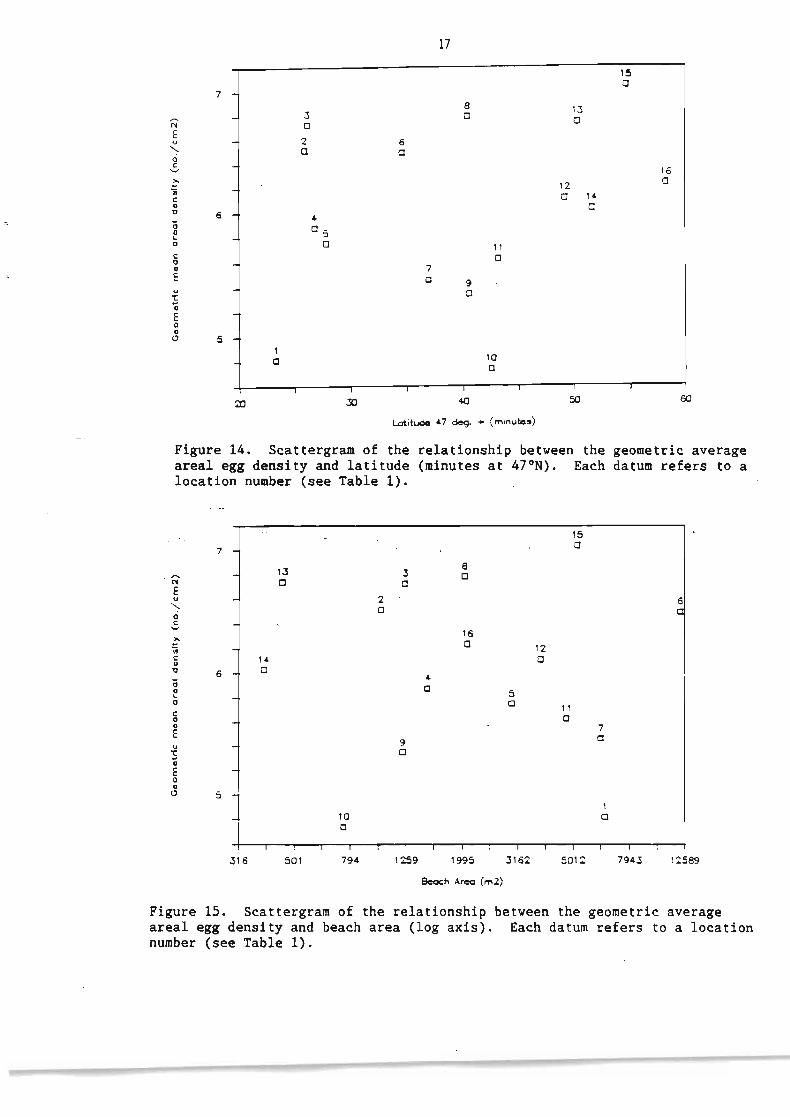
There was no significant relationships between the geometric average of the density estimates and beach orientation (Fig. 13), latitude (Fig. 14), beach area, and the logarithm of beach area (Fig. 15).
Multivariate linear regression analysis revealed no significant empirical relationships between either of mean density, geometric mean areal density, and areal density (dependent variate) and beach orientation, latitude, beach area and the logarithm of beach area (independent variates).
EGG DEPOSITION
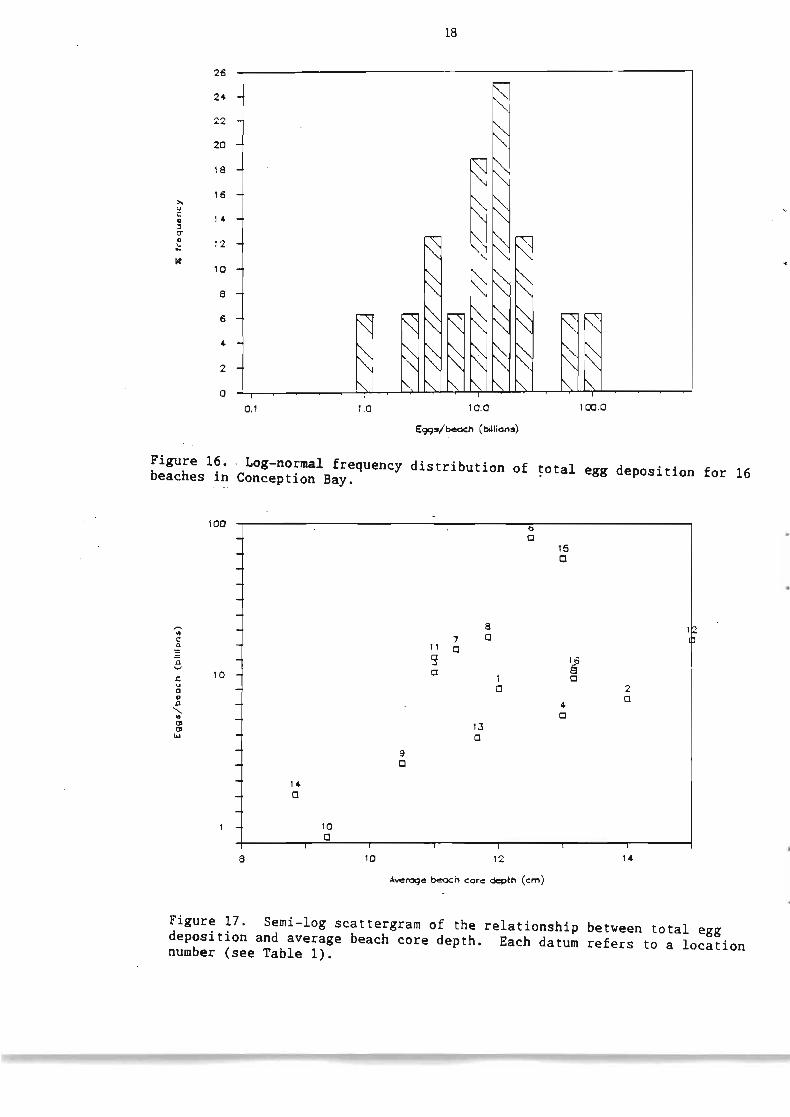
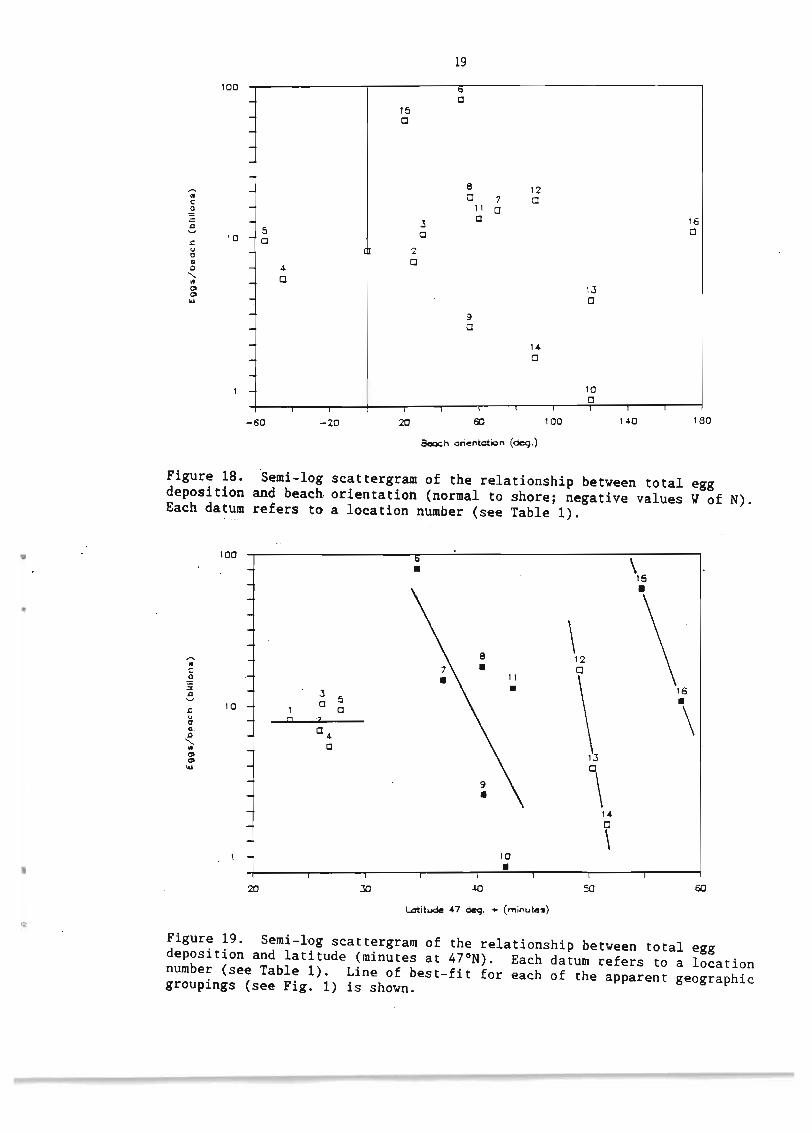
Togal egg deposition (eggs/beach) averaged 1~.4 x 109 and ranged from _1 x 10 eggs at Harbour Grace Island to _80 x 10 eggs at Coleys Point (Table 4). Since the estimates were log-norma~ly distributed (Fig. 16), the back-transformed geometric average of 8.8 x 10 eggs/beach was the best estimate of average egg deposition. As expected there was a significant relationship (r 2 = 0.35) between the logarithm of total egg deposition and average core depth (Fig. 17). There was, however no significant relationship between the logarithm of total deposition and beach orientation (Fig. 18), although the apparent dome-shape of the relationship indicated that deposition reached a maximum on beaches with a N to NE orientation. There was no relationship between the logarithm of total egg deposition and latitude (Fig. 19), but there was an apparent groupirig of beaches within latitudinal zones, each showing a latitudinal decline in deposition within each of the four beaches {site 1-5, 6-10, 11-12, 13-16; see Fig. 1).
SUMMARY
1. There is no simple empirical relationship to predi~t egg density at the various beaches sampled for this study, although egg densities among beaches in Concption Bay appear to be related to beach orientation and to some extent with latitude.
2. Ochre Pit Cove, Job Cove, Bryants Cove, Chapel Cove, and Broadhead Cove had the greatest areal egg density.
3. Coleys Point, Ochre Pit Cove, Bryants Cove,and Spout Cove had the greatest total egg deposition.
4. Eggshells represented at least 15% of the total abundance of eggs and shells combined, and should not be ignored in estimating total spawning deposition. Though the estimates of eggshell abundance are conservative, we believe that the relative differences in abundance among beaches are accurate because of the relationship between egg and eggshell displacement volumes. We further suggest that the higher shell:egg ratio in the HT samples, relative to the MT and LT samples, can be attributed to a shorter hatching period in the HT zone (Frank and Leggett 1981) and to a greater loss of shells to the water column in the MT and LT zones because of their longer exposure to tidal inudation.
5. On the basis of the limited beach-stratified (3 samples/beach) collections made for this study the variation in egg density among beaches is greater
5
than the within beach variation. Therefore, where large-scale sampling is considered for a comparison among several beaches, the intertidal sampling location will not prevent the identification of among beach differences. However, for a single beach (Bryants Cove), an analysis of intertidal-zone samples collected using a random-stratified design with replication showed significant differences in egg density among the zones (Frank and Leggett 1981, Taggart unpub. data) and should be considered in beach sampling designs. Yhen several beaches are to be sampled over a short period logistics will force a trade-off between the number of samples that can be collected on a single beach and the number of beaches sampled. Therefore sampling should be concentrated at one intertidal zone to optimize sampling within the zone and to facilitate among beach comparisons.
6. Log transformed estimates of beach area and of areal egg density should be used in evaluating relationships with other variables (e.g. capel in school area, number, and density, etc.).
7. It is very important to note that beach sediment grain size was not considered in this study. Capelin most frequently spawn on beaches with 0.5 to 2.5 em grain size (Jangaard 1974). Future beach sampling programmes should include a measurement of grain size.
ACKNOYLEDGMENTS
K.Tallon and G. Mailett assisted in sample collections. E. Dalley kindly reviewed the ~anuscript and provided helpful comments: J. Lannon and M. Hynes assisted in the preparation of the manuscript. Analysis of the beach core samples was conducted- by C.T.T. under Department of Fisheries and Oceans Contract 16SC-FPOOl-6-2139/01-SC.
REFERENCES
Avery, T. E. 1968. Interpretation of aerial photographs. Burgess Publ. Co., Minneapolis, Minn. 324 p.
Frank, K. T., and Y. C. Leggett. 1981. Prediction of egg development and mortality rates in capel in (Mallosus villosus) from meteorological, hydrographic, and biological factors. Can. J. Fish. Aquat. Sci. 38: 1327-1338.
Jangaard, P. M. 1974. The capelin (Mallosus villosus). Biology, distribution, exploitation, utilization, and composition. Bull. Fish. Res. Bd. Can. No. 186. 70 p.
Nakashima, B. S. 1985. The design and application of aerial surveys to estimate inshore distribution and relative abundance of capelin. NAFO SCR Doc. 85/84, Ser. No. Nl058. 11 p.
Nakashima, B. S. 1986. School surface area of capelin schools from aerial photographs as an index of relative abundance. NAFO SCR Doc. 86/14, Ser. No. Nl126. 7 p.
SAS 1985. SAS/STAT and SAS procedures, Version 6. SAS Institute Inc., Cary, N.C.
Shapiro, S. S., and M. B. Yilk. 1965. An analysis of variance test for normality (complete samples). Biometrica 52: 591-611.
6
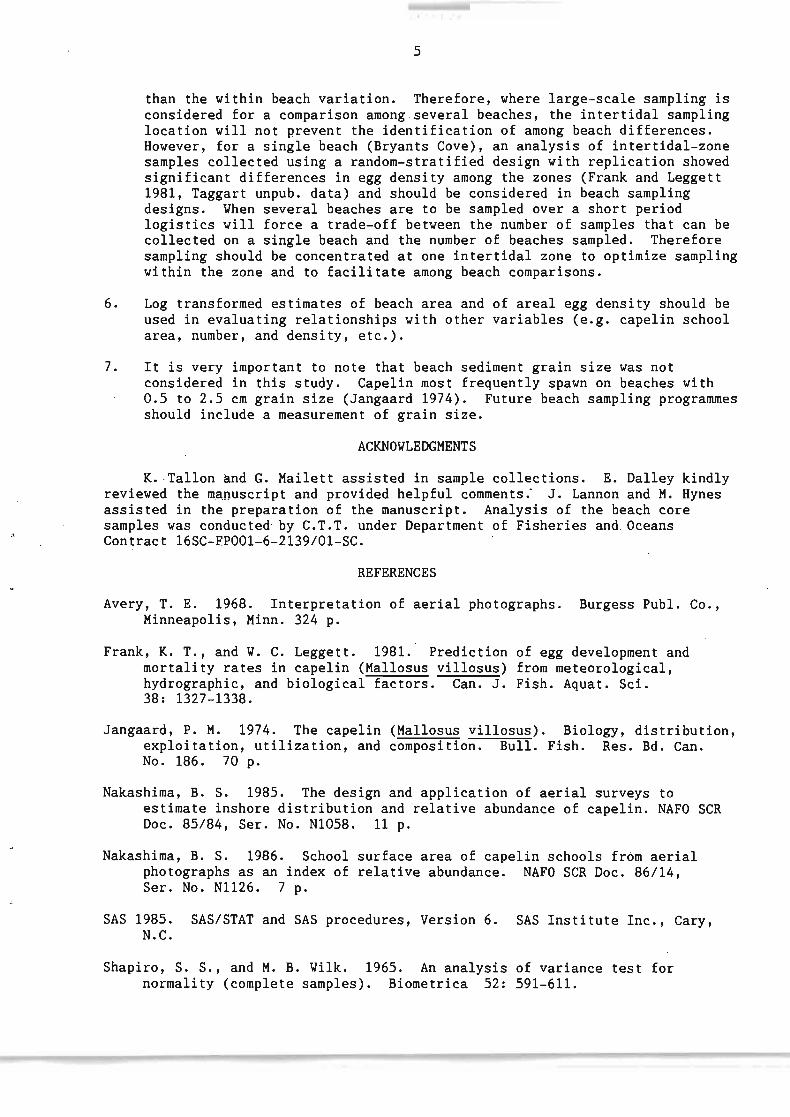
Tacle 1. Data values and summat'Y statistics of orientation. latitude. longitude. cOI'ing depths. and displacement volumes for sixteen beach locations located along the western and southern coast of Conception Bay. Newfoundland.
CORE AVERAGE VOLUME VOLUME VOLUME NO. SITE ORIENT. LATITUDE LONGITUDE DEPTIi (cm) DEPTH EGGS (mll SHELLS (ml) TOTAL (ml)
DEG.- DEG. MIN.-- DEG. MIN.- HT MT- LT (cm) HT MT- LT HT MT LT HT MT LT I HOLYROOD 2 HARBOUR MAIN
0 25
47 23.30 47 25.90
53 53
8.00 9.65
16.0 13.0 7.0 14.0
12.0 14.0
1.1) 10.0 2.0 16.5
0.5 LO 0.5 -:' I:"
" • ..1
1.5 11.lj '"' I:"£.."'". 20.0
3 CHAPEL COVE 30 47 26.15 1:"-:' ..I";' 9.10 13.0 11.0 9.0 11.0 39.0 26.3 10.0 4.3 3.0 1.5 4,) •.) 29.3 11.5
4 ~\JONDALE -45 47 26.80 53 10.40 14.0 13.0 12.0 13.0 11.5 8.5 7.0 " I:".:. • ..1 2.0 1.0 14.0 10.5 8.0 5 COLLIERS -55 47 27.80 53 12.60 9.5 15.0 15.0 13.2 15.0 11.0 " -:'
"' • ..:J 4.5 1.0 1.0 19.5 12.0 ~. oJ
6 COLEY'S POINT 50 47 34.60 53 15.90 14.0 14.5 9.0 12.5 14.0 41.0 9.3 2.0 4.0 0.5 16.0 45.0 9.8 7 SPANIARDS BAY 70 47 36.95 53 16.80 11.5 9.5 13.0 11.3 5.0 13.5 3.0 1.5 1.0 0.5 6.5 14.5 .,. I:"
.,j • ...,j
8 8RYANTS COI)E (S) 55 47 40.45 53 11.35 11. t) 10.5 14.0 11.8 16.0 32.0 23.0 3.0 4.5 2.5 1'1.0 ·:'0.;) 25.5 9 BRYANTS COVE (N) =:
..1..1 47 40.55 53 11. 35 11.0 10.5 10.0 10.5 13.0 3.5 3.8 3.0 0.5 0.0 16.0 4.0 3.8 10 HRB GRACE ISLD 120 47 42.55 53 8.80 9.0 7.0 12.0 9.3 5.0 1.5 1.5 3.0 0.8 0.5 8.0 ., .,.
.:. ...; 2.0 11 BR I5fOLS HOPE 60 47 43.20 53 11. 90 14.0 12.0 7.0 11. 0 7.5 11.5 " I:"~ • ..J 2.0 4.5 0.8 9.5 16.0 .,. -:'
..:J.,';"
12 SPOUT COVE 90 47 49.15 I:"~
..I.J 7.65 16.0 15.0 14.0 15.0 11.0 19.0 7.0 -J,..J 2.0 1.0 14.3 21.0 8.0 13 BROADHEAD COVE 120 47 50.30 53 5.30 12.0 10.0 13.0 11.7 8.5 26.8 41.0 2.0 j.":' 8.0 10.5 30.0 49.0 14 ADAMS COVE 90 47 51.60 53 5.30 9.5 8.0 9.0 8.8 13.0 11.5 5.5 2.5 3.5 2.5 15.5 15.0 8.0 15 OCHRE PIT COVE 20 47. 5!l.65 53 4.10 11. 0 13.0 15.0 13.0 14.0 35.5 52.5 2.0 6.0 4.0 16.0 41.5 56.5 16 JOB'S COVE 175 47 58.25 53 1.10 15.0 11.0 13.5 13.2 6.5 12.0 13.5 3.5 7.5 4.0 10.0 19.5 17.5
N 15 15 16 46 15 15 16 15 15 16 15 15 16ninilllUl1l 9.0 7.0 7.0 7.0 1.0 1.5 1.5 0.5 0.5 0.0 1.5 2.3 2.0 ma:dmum 16.0 15.0 15.0 16.0 39.0 41.0 52.5 4.5 7.5 8.0 43.3 45.0 56.5
mean 12.4 11.5 11. 7 11.9 12.0 17.6 12.5 2.6 3.0 2.0 . 14.6 20.5 14.5 stdrd deviation 2.2 ., '1' .... "" 2.7 " I:"':' • ..1 8.4 11.5 14.3 1.0 2.0 2.0 9.0 12.7 15.9
variance 5.1 5.4 7.1 6.0 69.8 133.4 204.3 1.0 4.0 4.0 81.1 161. 3 253.9 coeff . variation 0.2 0.2 0.2 0.2 0.7 0.7 1.1 0.4 0.7 1.0 0.6 0.6 1.1
7
Table 2. Data values used in developing linear regression relationship to predict egg number tram displacement volume at capelin eggs.
displacement egg predicted upper lower volume CmI ) number number 95% CL 95% CL
1.5 1268 1205 1645 765 2.0 1092 1607 2053 1161 2.5 2075 2008 2460 1556 3.3 2184 2611 3071 2150 3.5 3102 2811 3275 2348 4.0 3836 3213 3683 2743 5.0 4567 4016 4498 3535 6.0 4904 4820 5313 4326 6.3 4368 5020 5517 4524 7,,-0 5110 5623 6128 5117
11. 0 8736 .8836 9389 8283 21. 3 17472 17070 17745 16394 22.0 17472 17672 18356 16988
Regression Mode I:
Constant 0.000 Std Err of Y Est 422.168 R Squared 0.994 No. at Observations 13 Degrees of Freedom 12
X CoefficientCs) 803.271 Std Err of Coef. 11. 908
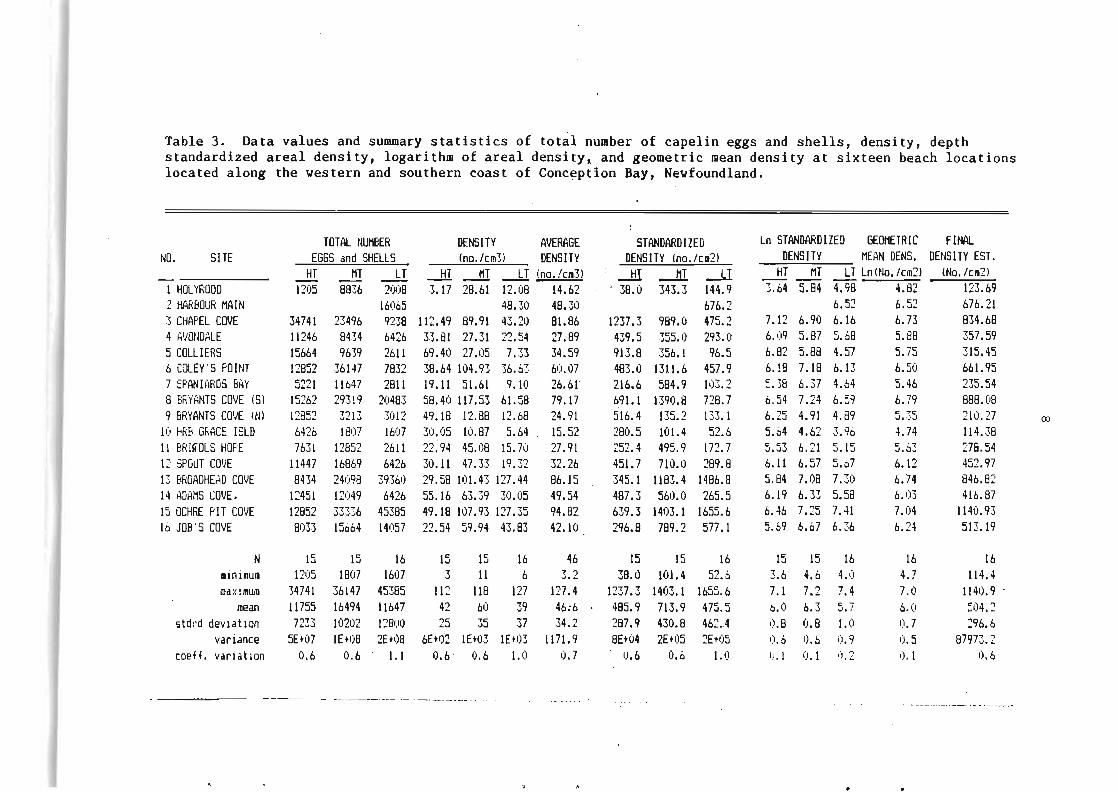
Table 3. Data values and summary statistics of total number of capelin eggs and shells, density, depth standardized areal density, logarithm of areal densitYl and geometric mean density at sixteen beach locations located along the western and southern coast of Conc~ptlon Bay, Newfoundland.
TOTAL NUMBER DENSITY AVERAGE STANDARDIZED Ln STANDARDIZED GEOMETRIC FINAL NO. SITE EGGS and SHELLS (no./cm3) DENSITY DENSITY (no./cI2) DENSITY MEAN DENS. DENSITY EST.
1 HOLYROOD HT
1205 MT
8836 LT
2008 -.!!!. 3.17
.-M -1! (no. !cllI3l 28.61 12.08 14.62
--!!I ' 38.0
--!1l 343.3
--l.l 144.9
HT 3.04
MT 5.84
LT Ln(No./cm2l t98 4.82
(No./em2) 123.69
2 HARBOUR MAIN 16065 48.30 48.30 676.2 6.52 6.52 676.21 3 CHAPEL COVE 34741 23496 9238 112.49 89.91 43.20 81.86 1237.3 989.0 475.2 7.12 6.90 6.16 6.73 834.68 4 AVONDALE 11246 8434 6426 33.81 27.31 22.54 27.89 439.5 355.0 293.0 6.(19 5.87 5.68 5.88 357.59 5 COLLIERS 15664 9639 2611 69.40 27.05 7.33 34.59 913.8 356.1 96.5 6.82 5.88 4.57 5.75 315.45 6 COLEY'S POINT 12852 36147 7832 38.64 104.93 36.63 60.07 483.0 1311.6 457.9 6.18 7.18 6.13 6.50 661. 95 7 SPANIARDS BAY 5221 11647 2811 19.11 51.61 9.10 26.61' 216.6 584.9 103.2 :.38 6.37 4.64 5.46 235.54 8 BRYANTS COVE (S) 15262 29319 20483 58.40 117.53 61.58 79.17 691.1 1390.8 728.7 6.54 7.24 6.59 6.79 888.08 9 BRYANTS COVE INl 12852 3213 3012 49.18 12.88 12.68 24.91 516.4 135.2 133.1 6.25 4.91 4.89 c: ~C'
..J •.•• ..J 210.27 co 1(' f<RB GRACE ISLD 6426 1807 1607 30.05 10.87 5.64 15.52 280.5 101.4 52.6 5.64 4.62 3.96 4.74 114.38 11 BRlfOLS HOPE 7631 12852 2611 22.94 45.08 15.70 27.91 :52.4 495.9 172. 7 5.53 6.21 5.15 10 '"f
..J.tJ" 278.54 12 SPOUT CO'iE 11447 16869 6426 30.11 47.33 19.32 32.26 451.7 710.0 289.8 6.11 6.57 5.67 6.12 452.97 13 BROADHEAD COVE 8434 24098 39360 29.58 101.43 127.44 86.15 345.1 1183.4 1486.8 5.84 7.08 7.30 6.74 846.82 14 ADAMS COVE. 12451 12049 6426 55.16 63.39 30.05 49.54 487.3 560.0 265.5 6.19 6.33 5.58 6.03 416.87 15 OCHRE PIT COVE 12852 33336 45385 49.18 107.93 127.35 94.82 639.3 1403.1 1655.6 6.46 7.25 7.41 7.04 1140.93 16 JOB'S COVE 8033 15664 14057 22.54 59.94 43.83 42.10 296.8 789.2 577.1 5.69 6.67 6.36 6.24 513.19
N 15 15 16 15 15 16 46 15 15 16 15 15 16 16 16 .inillull 1205 1807 1607 3 11 6 ,. ?".. 38.0 101. 4 52.6 3.6 4.6 4.1) 4.7 114.4 ma:dlllUID 34741 36147 45385 112 118 127 127.4 1237.3 1403.1 1655.6 7.1 7.2 7.4 7.0 1140.9 .
mean 11755 16494 11647 42 60 39 46:6 485.9 713.9 475.5 b.O 6.3 5.7 6.0 504.2 5 tdt'd dev iat lOn 7233 10202 12800 25 35 37 34.2 287.9 430.8 462.4 ').8 0.8 1.0 0.7 296.6
variance 5E+07 lE+08 2E+08 6E+02 lE+03 lEt03 1171. 9 8E+04 2E+05 2Et05 0.6 0.6 0.9 0.5 87973.2 coeff. variation 0.6 0.6 1.1 0.6 0.6 1.0 0.7 0.6 0.6 1.0 (I. 1 0.1 1).2 I). 1 0.6
---_._--.-._-.__ ...- .... .__ .... _-
9
Table 4. Data values and summary statistics for aerial photography used in calculating spawning beach area and final estimate of the total spawning deposition .
•
FOCAL PHOTO PLANIMETRY 8(~CH SrAWNING NO. SITE AE.tlIAL F'HOTO LENGTH ALTITUDE SCALE AREA AREA DEPOSITION
SE.tl!AL NO. DATE (mml (ml 1: (cm2) ~ (billions oh.,'3s)
1 HOLYROOD A-')OOOl 131-132 23-6-83 151. 98 457.2 3008.3 7.2 6516 B.06 2 HAR80UR MAIN A-i)0002 205 26-6-B5 151. 98 396.2 2607.2 1.5 1020 6.89 3 CHAPEL COVE A-')0003 417 28-6-85 151. 98 320.0 2105.8 2.8 1242 10.36 4 AVONDALE ESTIMATED FROM TOPOGRAPHIC MAP (L/C 4565. 1: 75000) 1500 5.36 5 COLLIERS ESTIMATED FROM TOPOGRAPHIC MAP (L/C 4565. !: 751))0) 3000 9.46 6 CGL2{' S FO INT A-)OOOl 126-t27 23-6-83 151. 98 457.2 3008.3 13.4 12127 80.27 7 SPANIARDS BAY 2 04 128 22-6-86 153.23 487.7 3182.7 6.2 b280 14.79
"I ~a..J8 SRY;'NTS COVE (SlA-OOOOl 123 23-6-83 151. 98 457.2 3008.3 2036 18.08
9 BRYANTS COVE (Nl A-;)OOOl 123 23-6-83 151.98 457.2 3008.3 1.4 1""-:- 2.57 10 ~B GRACE: ISLD A-oOOll3 398-399 28-6-85 151. 98 320.0 2105.8 1.7 754 0.86 11 3RlfOLS HOPE A-I)OOOl 107 23-6-83 151.98 457.2 3008.3 5.2 4706 13.11
17 .,.,12 SPOUT COVE ...A-DOOOl 11 19-6-83 151. 98 457.2 3008.3 4.2 3801 138ROADHEAD COVE R3 4594 26-6-84 151. 98 457.2 3008.3 0.5 452 ' 3.83 14 P.DAMS COVE A-oOOO2342 28-6-85 151. 98 335.3 2206.1 0.8 389 1.62 15 CCHRE PIT COVE R2 4361 25-6-84 151. 98 457.2 3008.3 5.7 5158 58.85 16 JOB'S COVE A-OOOOl 83 23-6-83 151. 98 457.2 3008.3 ?_.wor 2081 10.68
N 14 16 16 lIinil1lUJI 0.5 389.3 0.9 maximum 13.4 12126.7 80.3
mean 3.9 3267.8 16.4 ., .,. ..l • ..l std~ deviation 3021.1 21.1
variance 11.2 9E+06 444.2 cceff. variation 0.8 0.9 1.3
10
48°r-----------"'T"--------- -,48"
50'
50'
~ ~
53"00'
50'
00' 00'
40'
35'
30'
47" 25'
Figure 1. Map of Conception Bay showing the location of the 16 spawning beach sites sampled in 1983. Location names are listed in Table 1. Site groupings according to total egg deposition and latitude (see text) are circled.
11
19~3
10000 ~ ~
• ~ 5012~
\oj
... 0 ..•~
E 2512::I %
1000
1.26 2.00 3.16 5.01 7.94 19.~
WIled Volu.... (ml)
Figure 2. Log plot of the linear regression relationship (±95% CI) between capelin e~g number and displacement (settled) volume.
Figure 3. Scattergram of the relationship between beach orientation (normal to shore; negative values Y of N) and latitude (minutes at 47°N).
12 26
20
10
0 4 5
l...oq Beack Are<J (m2)
2 3
Figure 4. Lqg-normal frequency distribution of spawning beach area for 16 beaches in Conception Bay.
5 7 9 II 13 15 17
core deQtk (em)
Figure 5. Frequency distribution of beach core depth for 16 beaches in Conception Bay (n=46).
'6 .
,.
12
10
""IJ C 0 ::l
8cr 0.... ~
6
:2
o
13
12 15
14 -2 C
"
'"" E v
'-" .: a... a .... 8 .. co a.... :> «
1.3
12
11
10
-
-
-
-
, 0
5 40 CI
3 0
6 a
7 0
8 0
~
0
11 0
13 0
15 0
16 0
9 -
10 0
14 0
8
20 JO 40 50 60
Lcrtitude 47 deq. + (minutaa)
Figure 6. Scattergram of the relationship between average beach core depth and latitude (minutes at 47 Cl N)._ Each datum refers to a location number (see Table 1).
12 15
2 14 - 0
E v
1.3 -5 C 4
0 15 0
6
16 0
'-" [J
£ Q... 1;1
12 8 a 13
.... a v .. 11 - 3
C 11 [J
7 [J
[J
co e D
9 a
:> « 10 -
10 o
14 o
8
-60 -20 20 100 140 180
Beach Onentaaan (de<:l.)
Figure 7. Scattergram of the relationship between average beach core depth and beach orientation (normal to shore; negative values ~ of N). Each datum refers to a location number (see Table 1).
14
12 15
'4 -2 c
...... E u
'-"
s:.. a. 0 0 0 I0 U 0 ell a I0 > «
103
12
11
10
-
-
-
103 0
03 (J
9 (J
4 (J
16 c
6 CJ
5 C 15
(J
11 CJ
1 a
7 (J
6 C
9 - 14 (J
10 a
6
0316 501 794 1259 1995 3162 5012 794.3 12589
Becxh Area (m2)
Figure 8. Semi-log scattergram of the relationship between average beach core depth and beach area. Each datum refers to a location number (see Table 1).
6
7 -
...... E '-"
s -0
E ::l 5 -~ .. ,; 0
E 0 u
" ii.•Q
;; s: III
4
3
2
-
-
-
H
H
L
Hill
iii H
L
W L H
H H
H H
H W
L
iii iii
L
H L
1 - L WL
I-U.u.
L I.lW
L
I.l
0 -600 20
E99 Disploc:ement Vol...".. (ml)
Figure 9. Scattergram of the relationship between displacement volume of egg shells and eggs. Samples taken in the high-, mid-, and low-tide are noted 8,M, and L, respectively.
15
15
14
12
10
u " c: 0 ~ tT 8 0 ~
• ~
6
4
2
0
0 20 40 &J eo 100 120 140 150
Figure 10. Bimodal frequency distribution of egg density estimates from 46 core saJ!lples.
-. 16
• H
12
10
v " c: 0 ~ r:r 8 0 ~
~
6
4
2 ..
0
0 400 800 1200 1600
areal cqq density (no./cm2)
Figure 11. Bimodal frequency distribution of standardized areal egg density estimates from 46 core samples.
16
18
16
14
12
'" u 10c
u :J ".
~ 8 ~
.;
4
2
0
.3 4 5 6 7
L.n oreol eQQ dcnsil\l (no./cm2)
Figure 12. Frequency distribution of the log transformed standardized areal egg density estimates from 46 core samples. The distribution is not significantly different from normal (p=O.123).
7
..... N
E u -"'o c...., -'" w c u '3 6 - 4Q Q 0 ' 5 a -
Cl C (] Q E
-:s..u
E o.. C) .. 5
15 CJ
.3 0
8 a 13
0
2 6 0 0
15
12 0
13 0
II 0
i
9 0
CI
10 o
-60 -20 lCO 140 180
Beac" orientation (deq.)
Figure 13. Scattergram of the relationship between the geometric average areal egg density and beach orientation (normal to shore; negative values ~ of N). Each datum refers to a location number (see Table 1).
17
'5 a
7 -~
N - 3
a
8 a 13
CJ
e u - 2 6 " a CI 0 c...., - 1<5
"" ;; c
- 12 CJ '4
0
0 l)
0 0
6 - 4
Cl 5
0
'"0 a 11 c 0 - 0
• 0
E -
7 a 9
u
:s a 0
E -0 0
" 5 --
, a 10
CI
4Q 50 6030
l...cItitude 47 deq. -+- (minubos)
Figure 14. Scattergram of the relationship between the geometric average areal egg density and latitude (minutes at 47°N). Each datum refers to a location number (see Table 1).
7
N E
• u "0 c....,
;;'" c u l)
6 0 0
'"a <: 0 0
E
:su
0
E 0 u
"
15 a
13 a
3 c
8 a
2 6 a
16 a 12
14 a a
4 a 5
0
" C 7
9 CI
0
5 1] 10 0
C
316 501 794 1~9 1995 3162 5012 7943 lZ589
Beoc:n Area (m2)
Figure 15. Scattergram of the relationship between the geometric average areal egg density and beach area (log axis). Each datum refers to a location number (see Table 1).
18
2Ei
24
22
20
1a
lEi u" c: 0 14 ~ <T 0 12 ~
~ 10
a
Ei
4
2
0
0.1 1.0 10.0
E99S!beach (billions)
Figure 16 •. Log-normal frequency distribution of ~otal egg deposition for 16 beaches in Conception Bay.
100.0
100 0 c
- 15 CI
-•
--
~
"c: Q - 11
7 a
a a 1~
~ ...."
J: 10 --
9 C
1
16 €I Cl
u a - a 2 0 ~
"•Cll Cll lW
--- 13
a
4 Cl
a
- 9
- CI
- 14 - a -
1 - 10 a
10 12 14
Averoqe beoc:n core depth (cm)
8
Figure 17. Semi-log scattergram of the relationship between total egg deposition and average beach core depth. Each datum refers to a location number (see Table 1).
100
• \15
•
\.. 12II
g ~ J '-' 5C101: C u 0 7c D. a ~ 4"II C Cl Cll \
lo.I
"\ 14 a
\ 10
• 20 so 60
Latitude 47 deq. + (minutes)
Figure 19. Semi-log scattergram of the relationship between total egg deposition and latitude (minutes at 47°N). Each datum refers to a location number (see Table 1). Line of best-fit for each of the apparent geographicgroupings (see Fig. 1) is shown.
..
•
•
100
------
.... -c 0 -
-~ '0..; 5 1:
10 - a u C - (
D Q - 4 "" - a Cll Cll
lo.I
---
-1 -
-60 -20
19
15 a
o C
J a
8 a
II c
7 a
12 CJ
16 CJ
2 CJ
9 a
1.3 a
14 C
10 0
20 60 100 140 180
Beocn orientation (deq.)
Figure 18. Semi-log scattergram of the relationship between total eggdeposition and beach. orientation (normal to shore; negative values TJ of N).Each datum refers to a location number (see Table 1).

c -
,