Embed Size (px)
Citation preview
NATHANBERCERAfghanistanStudiesProject
The Current Political andEconomic Situation in Afghanistan
ByAbdul Aziz Ferogh
Submitted to theOffice of the A.I.D. Representative
for Afghan Affairs
UnderContract No. 306-0205-C-00-9385-00
September 1990
Submitted byNathan Associates Inc. and
Louis Berger International, Inc.A Joint Venture
_ A Joint Venture of Robert R. Nathan Associates, Inc. and Louis Berger International, Inc.1301 Pennsylvania Avenue, NW Washington, DC 20004
Phone: 202-393-2700 Telex: 248482 NATC UR Facsimile: 202-393-4548
TABLE OF CONTENTS
Section
LIST OF TABLES
FOREWORD
INTRODUCTION
The Economy
The Politics
In-Country Population Changes and Refugees
In-Country PopulationRefugee Population
Economic Situation
Agricultural SectorTransportation and CommunicationsPublic Health SectorEducation SectorIndustry, Mining, and Energy
Public Finance and ExpendituresMoney Supply and PricesExternal SectorConclusions and Prospects
Appendix A TABLES
METHODOLOGICAL NOTES TO TABLES A-l-A-8
Appendix B. MEMORANDA
BIBLIOGRAPHY
n
iii
1
1
2
4
46
8
1014161820
24283135
39
49
55
71
LIST OF TABLES
Table Page
1. Population and Rate of Growth 1978-79 - 1989-90 5
2. Gross Domestic Product at 1978-79 Constant Prices 9
3. Estimated Production of Major Crops, 1978-79 - 1989-90 11
4. Estimated Industrial and Mining Production, 1978-79 - 1989-90 21
5. Indicators of Government Budgetary Position, 1978-79 - 1987-88 25
6. Monetary Survey, 1978-87 29
7. Consumer Price Index, 1978-79 - 1989-90 30
8. Indicators of Developments in External Sector, 1978-79 - 1989-90 33
A-l. Gross Domestic Product at 1978-79 Constant Prices,1978-79 - 1989-90 39
A-2. Estimated and Projected Major Agricultural Crops,1978-79 - 1992-93 40
A-3. Estimated and Projected Agricultural GDP, 1978-79 - 1992-93 42
A-4. Estimated and Projected Livestock Production, 1978-79 - 1992-93 43
A-5. Estimated and Projected Livestock GDP, 1978-79 - 1992-93 44
A-6. Estimated and Projected GDP from Mining, Industry, andElectricity 45
A-7. Estimated and Projected Gross Domestic Product at 1978-79Constant Prices, 1989-90 - 1992-93 46
A-8. Projected Food Requirements, 1990-91 - 1992-93 47
FOREWORD
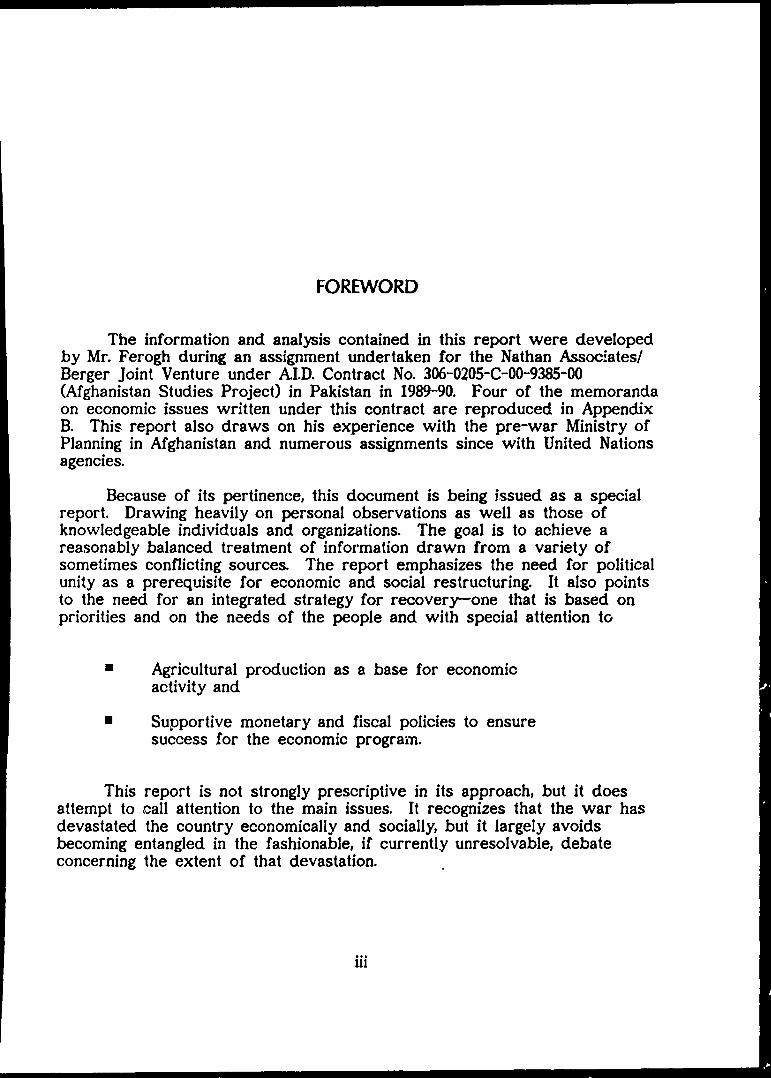
The information and analysis contained in this report were developedby Mr. Ferogh during an assignment undertaken for the Nathan Associates/Berger Joint Venture under AID. Contract No. 306-0205-C-00-9385-00(Afghanistan Studies Project) in Pakistan in 1989-90. Four of the memorandaon economic issues written under this contract are reproduced in AppendixB. This report also draws on his experience with the pre-war Ministry ofPlanning in Afghanistan and numerous assignments since with United Nationsagencies.
Because of its pertinence, this document is being issued as a specialreport. Drawing heavily on personal observations as well as those ofknowledgeable individuals and organizations. The goal is to achieve areasonably balanced treatment of information drawn from a variety ofsometimes conflicting sources. The report emphasizes the need for politicalunity as a prerequisite for economic and social restructuring. It also pointsto the need for an integrated strategy for recovery—one that is based onpriorities and on the needs of the people and with special attention to
Agricultural production as a base for economicactivity and
Supportive monetary and fiscal policies to ensuresuccess for the economic program.
This report is not strongly prescriptive in its approach, but it doesattempt to call attention to the main issues. It recognizes that the war hasdevastated the country economically and socially, but it largely avoidsbecoming entangled in the fashionable, if currently unresolvable, debateconcerning the extent of that devastation.
111
INTRODUCTION
This report reviews the economic situation in Afghanistan over thedecade or more that the country has been at war. It focuses on the factors,in addition to the war, that have contributed to the present economic andsocial crisis. The underlying purpose is to provide a base upon which tobuild a strategy and program for political, social, and economic recovery.
The Economy
The economy of Afghanistan is predominantly agrarian with agriculturalproduction accounting for about 45 percent of gross domestic product. 'Theindustrial sector is still at an early stage of development, and its share ingross domestic product is estimated at less than 13 percent. It is thereforeevident that any strategy for the reconstruction of the economy should takeinto account the predominant role of the rural sector. The country isreportedly well endowed with mineral resources. However, the high costsof mining, the limited and costly transportation network, along with a lack oitechnical skills have failed to attract the financial resources for fullexploitation of known deposits except for natural gas and some oil.
The country has an area of 65.2 million hectares, of which 12 percent isarable. Before the war only about 50 percent of the arable land was actuallycultivated. Only two-thirds of the cultivated land was irrigated because ofthe limited availability of water. Today the total cultivated area is reportedlylower because of abandonment, and the amount of land irrigated is said tobe less as a result of damages to irrigation systems. The magnitude of thissituation will remain in contention until the database can be verified.
Agro-climatic conditions vary greatly. Precipitation is generally low andirregular, and the risk of severe drought is ever present. The growingseason in most areas is comparatively short. This reduces the opportunityfor double cropping, causing the bulk of the country's food production tocome from grains such as wheat, barley, and corn—the main short-seasoncrops. In spite of this, a wide range of long-season crops, primarily rice and
cotton, are produced along with a variety of warm weather crops, includinggrapes, citrus and other fruits, and vegetables.
The rural population is scattered in small villages throughout the valleyswhere water is available and irrigation is possible. The difficult mountainterrain and the dispersed population increase the cost of unifying the country.Outside of the major urban centers the costs for providing and maintainingtransportation services and facilities are unusually high and so are the costsof providing basic education and health services. The majority of ruralpeople in these areas do not have access to safe drinking water and electri-city. For all of these reasons infant mortality remains unusually high (morethan 200 per 1,000 live births), and the literacy rate remains below 20 percent,especially for women.
As a landlocked country, Afghanistan depends on the good will of itsneighboring countries for trade and transit to foreign markets. The lack ofefficient transit facilities in Iran and Pakistan increases transportation costs ofmost imports and exports from areas far beyond the immediate borders.The country has no railways and few major roads.
The roads from Kabul through the Khaiber Pass or through KandaharSpin Boldak provide the main access to the transport system of Pakistan andthe port of Karachi. Access to the sea, by way of Iran, is through the portsof Khorramshahar and Bandar-e-Khomeini. These ports are located deep inthe Gulf, more than 3,200 kilometers from Herat. The northern highwaythrough the Salang Pass to the bridge at Hairatan is the main link to thetransportation network of the Soviet Union.
The Politics
The political situation of the Afghan society has remained fragmented.The forces of fragmentation continue to exist and have hindered economicdevelopment. The difficulties in transportation and communications havemade it difficult for the country to achieve political unity. From 1963 to 1973,Afghanistan experimented with a constitutional monarchy that experiencedfrequent cabinet changes resulting in political and economic instability. In1973, Daoud Khan gained power through a military coup. He suspended theconstitution, deposed his cousin, the King, and proclaimed Afghanistan arepublic. The traditional nonaligned foreign policy was retained, although thegovernment moved closer to the Soviet Union with its commitment to a state-dominated economic policy. In the final days of the Daoud regime there wasa definite cooling of relations between Kabul and Moscow.
In April 1978, Daoud Khan was killed during a coup, and the newregime formed a revolutionary council and adopted a Marxist program ofscientific socialism. The new regime introduced various repressive measures,including the confiscation of certain cultivated lands that gave rise to
widespread resistance. A treaty of friendship, good neighborliness, andcooperation was concluded with the Soviet Union later that year, a treatythat paved the way for the Soviet's military intervention.
Afghan resistance to the marxist regime continued in both urban andrural areas. In December 1979, the Soviet Union invaded Afghanistan andkilled Hafizullah Amin, who had replaced Taraki in September of that year.The Soviet forces assisted Babrak Karmal in becoming the new head of state,but in May 1986 he was replaced by Najibullah. Najibullah tried in vain topacify the resistance, but his policy of national reconciliation was resisted. InFebruary 1988, the Afghan resistance formed the Afghan interim governmentin Pakistan. During this entire period the Afghan resistance to the occupyingforces of the Soviet Union increased markedly.
In April 1988, the United Nations announced that an agreement had beenreached under which the Soviet Union would withdraw its troops fromAfghanistan. The withdrawal began in May 1988. The troop withdrawal soonfollowed the Geneva agreement between the Kabul regime and the Govern-ment of Pakistan. These agreements were intended to bring peace andstability to Afghanistan and to pave the way for the return of refugees totheir homeland. The Afghan Resistance rejected the Geneva agreement onthe ground that it did not provide for the right of self-determination for theAfghan nation and did not guarantee the transfer of power to a representa-tive government. The war went on and on. As a result, the Afghan refugeescontinued to stay in Pakistan, Iran, and elsewhere. The Afghan InterimGovernment recently announced the framework for elections and the formula-tion of a Shura. It is widely believed, however, that the support of all theMujahadeen groups and political elements of the Muslim Afghan society willbe needed if the proposed plan of the Afghan Interim Government is to befully implemented.
After the Geneva agreement, the Secretary General of the UnitedNations launched an appeal for humanitarian and economic assistance forAfghanistan and appointed a coordinator to assist in implementation. Duringthe first year of the appeal more than $980 million of aid was subscribed,about 70 percent of which was contributions in kind and most of it promisedby the Soviet Union.
However, because of the unstable political conditions in the country,the United Nations-sponsored program is being implemented largely throughthe nongovernment organizations operating out of Pakistan rather than by theinterim government. It appears that the program is encountering greatdifficulties because of technical and logistical problems and institutionalbottlenecks.
At present Afghanistan is still in the midst of a deep economic andpolitical crisis:
4
• One-third of the country's pre-war population stilllives in exile,
• The political structure is highly fragmented,
• The productive capacity of the economy has beenshattered by the effects of war, and
• There is no effective administrative structure tocoordinate the reconstruction activities of the country.
In short the factors that led to strife in the past are still present, andthe country is ill-equipped to deal with the problems of returning refugees.
In spite of sharp declines in the rural population over the past decade,Afghanistan remains predominantly rural. This population is dispersed amongan estimated 31,000 villages throughout the country. Most of these villageslack access roads and are therefore isolated. Even before the war, the levelof basic services available to the rural population was seriously inadequateby most world standards; today it is worse.
In-Country Population Changes and Refugees
The total in-country population, adjusted for war-related deaths, iscurrently estimated at 12.4 million (Table 1). This assumes that about 4.8million people are refugees living outside of the country. Those that fled thecountry included a major proportion of the county's cadre of professional andtechnical personnel. In addition, more than 1 million people who remained inthe country have migrated from the countryside to various urban centers,mostly to Kabul. The population of Kabul had reached about 1.8 million in1987, roughly twice what it was a decade earlier.
In-Country Population
In 1976-77 Afghanistan's population was estimated by the World Bank at14.0 million of which 125 million people were settled and 15 million werenomads. The average growth rate of population was then estimated at 2.18percent annually. Today the growth rate is estimated to be only about 2percent. Had the war not occurred, this rate would have increased the totalAfghan population to between 18 and 19 million. However, this level was notachieved; partly because an estimated 1 million persons lost their lives due tothe war, and mostly because of the large numbers that fled to Pakistan, Iran,and other countries.
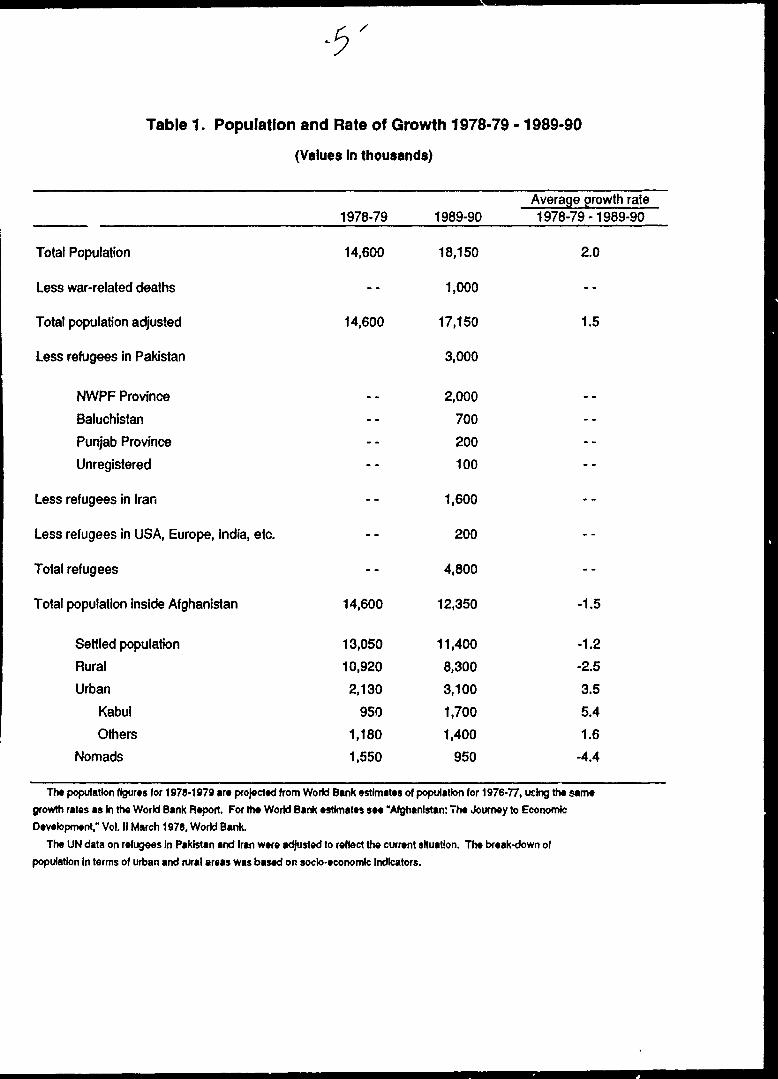
Table 1. Population and Rate of Growth 1978-79 -1989-90
(Values In thousands)
Total Population
Less war-related deaths
Total population adjusted
Less refugees in Pakistan
NWPF Province
Baluchistan
Punjab Province
Unregistered
Less refugees in Iran
Less refugees in USA, Europe, India, etc.
Total refugees
Total population inside Afghanistan
Settled population
Rural
Urban
Kabul
Others
Nomads
1978-79
14,600
--
14,600
--
--
--
--
--
--
14,600
13,050
10,920
2,130
950
1,180
1,550
1989-90
18,150
1,000
17,150
3,000
2,000
700
200
100
1,600
200
4,800
12,350
11,400
8,300
3,100
1,700
1,400
950
Average growth rate1978-79-1989-90
2.0
--
1.5
--
--
--
--
--
--
-1.5
•1.2
-2.5
3.5
5.4
1.6
-4.4
The population figures for 197$-1979 are projected from World Bank estimates of population for 1976-77, uclng the same
growth rates as In the World Bank Report. For the World Bank estimates see "Afghanistan: The Journey to Economic
Development," Vol. II March 1978, Work) Bank.
The UN data on refugees In Pakistan and Iran were adjusted to reflect the current situation. The break-down of
population In terms of urban and rural areas was based on socio-economic Indicators.
Today, Kabul and other urban centers are facing great shortages ofhousing, health services, social amenities, and food. This has led to highprices which, coupled with limited employment opportunities, is bringing greathardship to many of the people. These hardships and a worsening of 'security conditions during the last 2 years have caused people to move awayfrom the urban areas. The population of Kabul, for example, has declinedfrom the peak and is now estimated to be about 1.7 million and falling.
During the past decade the rural population has diminished from about10.9 million to around 8.3 million—a decline of nearly one-fourth. Reflectingon this situation, the United Nations Research Institute for Social Development(UNRISD) estimated that nearly 70 percent of the male refugees in thePakistan-based refugee camps had been farmers.
These numbers have important implications for the current availabilityof farm labor and the productive capacity of agriculture. A survey by theSwedish Committee for Afghanistan (SCA), conducted about a year ago,concluded that the decline of the rural population had created laborshortages that were in part responsible for the decline of agriculture. Yet, ifit can be assumed that the decline in the farm population was about equal tothe decline in the total rural population, that is, 24 percent, it would still beless than the rate of rural unemployment, which had been in excess of 30percent before the war. This raises questions about the.postulated laborshortages and their ?lleged impact on farm production.
Refugee Population
At present, Afghan refugees are estimated at 4.8 million, with 3 millionin Pakistan, 1.6 million in Iran, and the remaining 0.2 million scattered in othercountries such as the United States, Europe, India, and elsewhere. Accordingto UNHCR, 60 percent of the refugees in Iran are settled in the central andsouthern provinces, with a major proportion living in urban areas. Theremaining 40 percent are residing in the border provinces.
It is generally believed that the majority of the Afghan refugees in Iran,particularly in urban areas, have been gainfully employed and are now well-integrated into the local economy. From 1983 to 1988, years for which thedata are available, a total of $75 million was provided by UNHCR for theprograms involving the Afghan refugees in Iran. UNHCR believes thatbecause of the integration into the local economy, the repatriation from thatcountry might be slow and, in the initial phases, might involve mostly thosewho had settled in the border provinces.
The Afghan refugees in Pakistan live in about 350 camps and villages,with 2 million in the Northwest Frontier Province of Pakistan (NWFP), 0.7million in Baluchistan, and 0.2 million in Punjab. In addition, large numbers ofunregistered refugees have spread over the major urban areas. More than 70
percent of refugees have been dependent on foreign assistance from varioussources. According to UNHCR documents, the total cost of relief assistanceaverages about $1 million a day.
From 1979 to 1988, the total expenditure incurred on relief operationsby UNHCR in Pakistan amounted to $800 million, and Pakistan is believed tobe contributing about Rs. 1 million a day. The World Food Programme hasspent more than $85 million annually on its operations, which involve mainlyfood supplies. During 1988, for example, about 382,000 tons of wheat and15,000 tons of edible (cooking) oil were supplied under this program. How-ever, indications are that a cartel is reselling much of the donated wheat inthe markets of NWFP and Baluchistan.
About 80 percent of the refugee population originated from the areasthat are within about 200 kilometers inside Afghanistan. This suggests thatthe repatriation, when it occurs, will be mainly to the nearby borderprovinces from which the refugees originated. This will make the costs of
• assistance for repatriation and the provision of food supplies and essentialinputs less than it would be otherwise.
So far, only a limited number of refugees have returned to their home-land. According to UNHCR and the United Nations monitoring missionsvisiting certain provinces in Afghanistan, some male members of the land-owning refugee families are currently returning to select areas to preparefields for cultivation. However, it is uncertain if and when these isolatedcases will develop into a full-scale repatriation movement of refugees.
Two conditions are frequently stated as prerequisites for the return ofrefugees to their homes in Afghanistan: (1) removal of the Kabul regimefrom power and (2) establishment of a broad-based, representative govern-ment based on Islamic principles. In addition, any increase in the rate ofvoluntary repatriation from Pakistan and Iran will also depend on theassurances of personal, economic, and political security.
The UNRISD survey data mentioned earlier raises some importantquestions about the refugees' possible need for assistance. Before the war,adjusted ADS data reflected a sex ratio of 48 females to 52 males. Amongthe refugee population, that ratio has been reversed. The survey suggests aratio on the order of 51.2 females to 48.8 males. This changing patternsuggests the possible need for establishing special social and economicprograms to assist families headed by widows. It could well be that the in-country ratio has been reversed similarly, thereby increasing the potentialmagnitude of the problem of widows.
The survey also revealed that approximately 60 percent of the Afghanrefugee population in Pakistan was below the age of 18. This is about thesame as it had been during the pre-war period and implies a continuing highdependency rate and low levels of per capita income and personal savings.
8
For the future it suggests that the working age population will increase at afast rate in the next few years, and, unless jobs are created, the unemploy-ment rate will rise dramatically.
Economic Situation
Although the magnitudes may be debatable, there appears little doubtthat the economic trends of the past decade are characterized by fallingproduction, rising trade deficits, and increasing inflation. This is clear fromofficial data and from recent studies undertaken by various internationalorganizations operating inside Afghanistan.
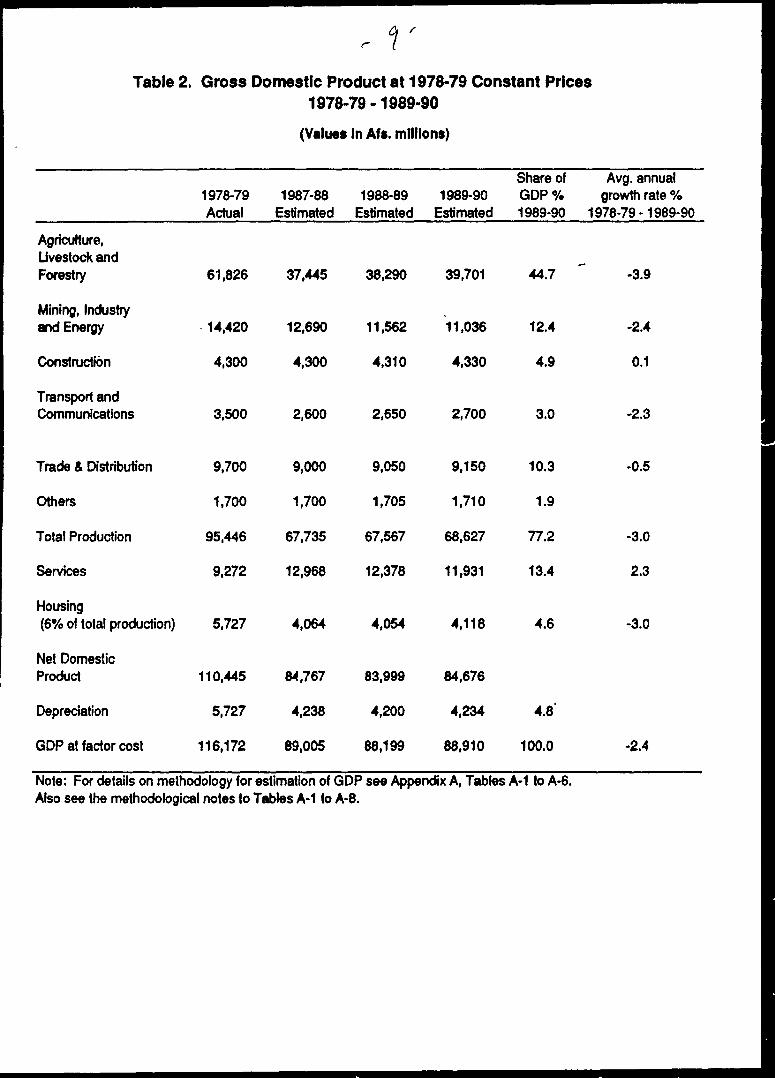
The real gross domestic product has fallen at an average rate of 2.4percent per year—from Afs. 116.2 billion in 1978-79 to Afs. 88.2 billion in 1988-89 (Table 2). There are signs of recovery. The economy grew at a modestreal rate of about 1.0 percent in 1989, yet production in 1989-90 was onlyabout 76 percent of what it had been in 1978-89.
Before the war, the average growth rate of the economy had beenestimated at 3 percent per year. Had this rate persisted, the gross domesticproduct would have reached Afs. 160 billion by 1989-90. The current level isonly 56 percent of that level, leaving little doubt that the economy sufferedsubstantially from the ravages of war and from inappropriate policies.
This sharp decline in aggregate production, relative to potential, wascaused by a marked deterioration in the productive capacity of the variouseconomic sectors. The largest decline during the decade is estimated to havetaken place in agriculture where total production fell from Afs. 61.8 billion toAfs. 39.7 billion, an average rate of 3.9 percent per year. This reducedagriculture's share of total gross domestic product from 53 to 45 percent.This magnitude of loss from a sector that must lead economic developmentis devastating to economic progress. In the past year, some recovery hasoccurred. A growth rate of more than 3 percent has raised agriculturalproduction to nearly 45 percent of gross domestic product mnd to about 64percent of its 1978-89 level in real terms.
Production from the industry, mining, and energy sectors, which contri-buted to more than 12 percent of gross domestic product in 1978-89, fellsteadily from Afs. 14.4 billion to 11.0 billion in 1989-90—a drop of 2.4 percentper year. Even so these sectors still make about the same proportionalcontribution to gross domestic product—• little more than 12 percent. Thisproduction came from a mix of government-owned and private industries.But while private enterprises showed declines ranging from 22 to 2.7 percentper year, public enterprises increased their output on an average of 1.1percent per year.
rTable 2. Gross Domestic Product at 1978-79 Constant Prices
1978-79-1989-90
(Values In Afs. millions)
Agriculture,Livestock andForestry
Mining, Industryand Energy
Construction
Transport andCommunications
Trade & Distribution
Others
Total Production
Services
Housing(6% of total production)
Net DomesticProduct
Depreciation
GDP at factor cost
1978-79Actual
61,826
14,420
4,300
3,500
9,700
1,700
95,446
9,272
5,727
110,445
5,727
116,172
1987-88Estimated
37,445
12,690
4,300
2,600
9,000
1,700
67,735
12,968
4,064
84,767
4,238
89,005
1988-89Estimated
38,290
11,562
4,310
2,650
9,050
1,705
67,567
12,378
4,054
83,999
4,200
88,199
1989-90Estimated
39,701
11,036
4,330
2,700
9,150
1,710
68,627
11,931
4,118
84,676
4,234
88,910
Share of Avg. annualGDP % growth rate %1 989-90 1 978-79 - 1 989-90
44.7
12.4
4.9
3.0
10.3
1.9
77.2
13.4
4.6
4.8"
100.0
-3.9
-2.4
0.1
-2.3
-0.5
-3.0
2.3
-3.0
-2.4
Note: For details on methodology for estimation of GDP see Appendix A, Tables A-1 to A-6.Also see the methodological notes to Tables A-1 to A-8.
10
The mining sector, which never contributed significantly to grossdomestic product, declined even more. From a pre-war level of slightlymore than 1 percent, it now contributes less than 1/5 of 1 percent to thegross domestic product of the country. The decline was apparently due tosharp decreases in the production of natural gas, which had peaked at 2.8billion cubic meters in 1984-85 and fell to 0.2 billion cubic meters in 1989-90.In other areas, construction held its own in real terms; trade and distributiondeclined modestly, and the contribution of transportation and communicationsto the gross domestic product fell at an average annual rate of more than 2.0percent.
The primary growth was contributed by government services, with arate of more than 6 percent per year from the pre-war level, causing thepublic sector to nearly double—from Afs. 45 billion in 1978-79 to Afs. 85billion in 1989-90. This increase reflects the efforts of the government tomaintain employment and to meet its increased needs for defense andnational security. Today the public sector is nearly 10 percent of the grossdomestic product.
Agricultural Sector
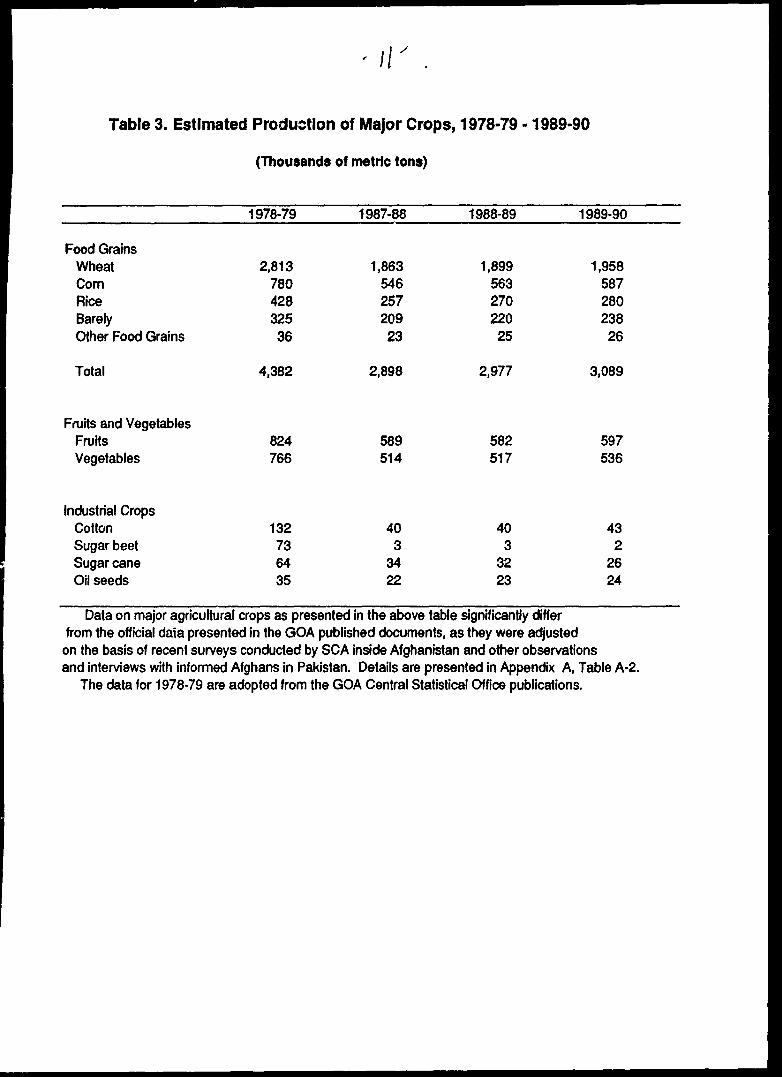
Between 1978-79 and 1987-88, the production of both food and cashcrops fell sharply (Table 3). The estimated output of wheat, the main cerealcrop, declined from 2.8 million tons to 1.86 million tons—a decline of morethan 34 percent during the period. During the last 2 years, wheat output hasrecovered somewhat. With an average rate of increase of 25 percent peryear, production is now about 70 percent of what it was in 1978-79. It hadbeen as low as 66 percent during the pre-war period in 1987-88, a year ofexceptional drought.
Currently, basic foods are still in short supply, and a major portion ofthe food requirements are met through imports. The price of wheat inKabul, where it rose from Afs. 70 per seer in 1987-88 to nearly Afs. 500 perseer in 1989-90, reflects this situation. Annual imports of wheat from allsources are currently estimated at more than 400,000 tons. This is substan-tially above peak-level imports during the pre-war period. The governmenthas imported about 260,000 tons of foodgrains annually, mainly wheat fromthe Soviet Union. Since 1987, the United States has supplied about 180,000tons of wheat under its humanitarian assistance program. This program wasimplemented through cross-border operations from Pakistan.
Hampered by security conditions, lack of financial incentives, andmanpower, production of sugar beets and cotton has declined. Sugar beetproduction has been virtually eliminated, and cotton output is now about one-third of what it was before the war. Because of difficulties in marketingand high incidence of disease and pests, production of vegetables and fruits
liTable 3. Estimated Production of Major Crops, 1978-79 -1989-90
(Thousands of metric tons)
Food GrainsWheatComRiceBarelyOther Food Grains
Total
Fruits and VegetablesFruitsVegetables
Industrial CropsCottonSugar beetSugar caneOil seeds
1978-79
2,81378042832536
4,382
824766
132736435
1987-88
1,86354625720923
2,898
589514
403
3422
1988-89
1,89956327022025
2,977
582517
403
3223
1989-90
1,95858728023826
3,089
597536
432
2624
Data on major agricultural crops as presented in the above table significantly differfrom the official daia presented in the GOA published documents, as they were adjustedon the basis of recent surveys conducted by SCA inside Afghanistan and other observationsand interviews with informed Afghans in Pakistan. Details are presented in Appendix A, Table A-2.
The data for 1978-79 are adopted from the GOA Central Statistical Office publications.
12
had also declined by 30 and 28 percent, respectively from pre-war to 1988-89(Table 3).
These losses in agricultural production are attributable largely to thewar and to the decline of the farm and rural populations. In 1987-88, thearea irrigated had declined by about 21 percent as a result of damages toirrigation systems. At the same time, the rainfed area that was planted hadfallen by some 30 percent. There is some evidence that some of the aban-doned land is being brought back into production.
Almost all of the modern irrigation projects that were under construc-tion with foreign assistance at the start of the war remain unfinished. Thetraditional irrigation systems, upon which 90 percent of Afghanistan's agricul-ture depends, have long been the subject of neglect and inadequate mainten-ance. These systems have sustained further damage as a result of the war.During the past 3 years, several nongovernment organizations, especiallyVolunteers in Technical Assistance (VITA), have undertaken the rehabilitationof Karezes in several districts. Although this contributes commendably to thewelfare of the farmers involved, it contributes very little to the nationalproblem of food shortages.
In the past, efforts to improve irrigation systems were thwarted bysevere shortages of capital, technical inputs, and maintenance and repairs.Inequalities in the distribution of benefits according to traditional water rightsare further impediments to the improvement of traditional irrigation systemsand to the efficient use of water. These problems continue.
In spite of the shortages of water for significant increases inproduction, considerable potential exists for increasing production on irrigatedland. This is mainly through increases in the use of chemical fertilizers,improved seeds, and improved farm and irrigation practices. Although someincrease in the use of fertilizer has been recorded in recent years, no morethan 16 percent of the irrigated area currently receives fertilizer. Totalfertilizer use in 1989-90 amounted to 135,000 tons, representing 52 kilogramsper hectare of irrigated land and roughly the equivalent of 800,000 tons ofwheat.
The official price of fertilizer is currently set at Afs. 12,000 per ton.This reflects a highly subsidized rate compared with free market prices,which are reported to be about Afs. 60,000 per ton. It should be noted thatalmost all of the requirements for urea fertilizer are being met through theMazar-i-Sharif fertilizer factory, which is still managed and operated bySoviet experts.
Domestic production of quality wheat seed, an important input forefficient fertilizer use, has generally been inadequate. The current supplyamounts to less than 2,000 tons or about 10 percent of the need for seedwheat. Experts believe that the indigenous seed has lost its genetic potential
13
and needs to be replaced. In recent years the Kabul government importedabout 10,000 tons of improved wheat seed annually, mainly from the SovietUnion. Several Pakistan-based organizations, with cross-border operations,have provided an additional 2,000 tons of improved seeds during each of thepast 2 years. Although attempts have been made to start seed multiplicationprojects in the country, the lack of communications and unknown effective-ness of the extension services that are provided leaves the effectiveness ofthese projects in doubt. In addition, there are no uniform seed qualitystandards nor are there any coordinating mechanisms to ensure that seedmultiplication activities proceed on a systematic basis.
For security and other reasons the extension service, which wasestablished in the early 1970s, has collapsed. The basic organizationalstructure still exists, but it operates only in Kabul. Some of thenongovernment organizations such as VITA, SCA, and others have developedextension services for implementing agricultural programs, but their numbersare inadequate.
Most farmers have limited access to credit. Merchants and moneylenders who once provided most of the credits to the farmers, although athigh interest rates, have long left the rural areas. The land reform programintroduced by the Kabul regime in early 1979 not only caused hardship forthe people but also hampered the operations of the Agricultural DevelopmentBank of Afghanistan.
According to data from the Agricultural Bank, that organization's lendinghas dropped from Afs. 1.0 billion in 1978-89 to less than Afs. 350 million in1987-88. The working capital now available to the bank is inadequate, andmore than Afs. 35 billion of overdue loans are outstanding. The managementof the bank has suffered because a large number of its technical andmanagerial personnel have left the country. The nongovernment organizationshave not yet been able to organize an agricultural credit program to supportsmall and large farmers in Afghanistan. A proposal from SCA is underconsideration. Because of the lack of credit, small farmers will benefit littlefrom current farm programs. The larger, better-off farmers who have accessto credit and the inputs that can be purchased will benefit.
The total output of livestock has declined at an average rate of 55percent per year, and the livestock contribution to total gross domesticproduct has decreased from 16 percent in 1978-79 to 11 percent in 1989-90. Itis believed that the livestock population of the country may have declined bynearly 50 percent mostly as a result of the war. The existing livestockpopulation continues to suffer even more than before the war, from diseaseand poor management because of the curtailment of veterinary services andvaccination programs. Poor nutrition, resulting from overgrazed pastures andfeed shortages, has always been a major impediment to animal production.With the decline in the number of animals, pastures have regeneratedsomewhat.
14
Some nongovernment organizations are implementing limited veterinaryprograms for the Afghan refugees in the border areas and have trained morethan 100 veterinarians to work inside Afghanistan in the future. Theseprograms, which are still at a rudimentary stage, should focus on trainingselected villagers as veterinary workers as well as providing limited directservices.
According to SCA estimates, the shortage of farm power has con-strained the rehabilitation of agriculture in some areas of the country. It isbelieved that at least 300,000 pairs of oxen or 30 percent of the country'stotal animal traction has been lost over the last decade. So far nongovern-ment organizations have replaced only a small portion of total farm powerrequirements; VITA has sent 500 bullocks, 15 tractors, and about 300 threshersto Afghanistan this past year, and other organizations have supplied 300 pairsof oxen and 50 tractors. Meeting the needs for farm power will be animportant factor in rehabilitating Afghan agriculture. Tractors are likely toplay a much more important role today than before the war.
Transportation and Communications
A modest network of roads is the predominant mode of transportation.In 1978-79 about 21,000 kilometers of road existed with 2,700 kilometers ofpaved primary roads, 4,000 kilometers of gravel roads, and 14,000 kilometersof feeder roads. The development of a formal system of roads was startedin the late 1950s. From 1957 to 1977, about $450 million was spent on themajor roads. But even after the primary road network was in place, theinadequacy and generally poor condition of feeder roads continued to impedenational unification and the development of rural economy.
During the decade of the war, the condition of roads has deterioratedmarkedly. The war prevented regular road maintenance, and some 30percent of the bridges and roads have been destroyed or severely damaged.The primary roads were originally paved with asphalt, but much of thepavement has been destroyed. For example, the overall condition of theKabul-Kandahar highway is so bad that it now takes a truck more than 15hours to travel a distance that took only 6 hours before.
The operations of the agencies that are responsible for the planning,construction, and maintenance of the road network have come to a standstillbecause of a lack of funds and technical capacity. Apparently the Kabulgovernment is unable to implement a road maintenance or constructionproject outside the limits of Kabul City. The United Nations DevelopmentProgramme (UNDP) reports that a few nongovernment organizations havesome capacity to implement road projects, and a few have the capability toplan and develop design standards and to prepare cost estimates.
15
It is widely recognized that VITA also has the engineering capacity tobuild roads to carry low traffic volumes. During the last 3 years VITA hasbuilt a number of bridges and some minor roads. Construction was carriedout with labor-intensive techniques and at relatively low cost. The means ofmaintaining these structures has not yet been worked out.
In 1978-79 there were about 65,000 major vehicles in the countryconsisting of 22,000 trucks, 12,300 buses, and about 31,000 cars. In addition,there were about 10,000 motorcycles and auto-rickshas. Many vehicles arereported to have been damaged and many of them are badly in need ofrepair. Since 1978-79, the total number of vehicles declined by about 10percent, but the number of private trucks is said to have decreased bynearly 30 percent, whereas the number of publicly owned and operatedtrucks increased fourfold. Today, the share of privately owned trucks isonly 65 percent whereas it had been as high as 90 percent before the war.
The capacity of the national trucking fleet was estimated to be 162,000tons in 1987-88. This was a decrease of 6 percent from the 1978-79 level.During the same period, the capacity of the public sector fleet increasedsixfold, from 13,000 tons to 77,000 tons whereas the capacity of the privatesector declined from 159,000 tons to 85,000 tons, a drop of about 47 percent.It has been observed that the private trucking fleet now consists of a largenumber of small and aged trucks. This is believed to be the result of morefavorable import duties on smaller and older trucks than on the newer andlarger ones. During the past decade, many new trucks were imported by thegovernment from the Soviet Union to facilitate its imports of emergencysupplies and materials. Nine separate transport enterprises were formed withtotal assets of about Afs. 8 billion.
Because of poor road conditions and other factors, total freight traffichas apparently declined in recent years. Government statistics indicate a totalof 1,943 million ton-kilometers being carried in 1984-85 and only 1367 millionton-kilometers in 1987-88, an annual rate of decrease of 1.3 percent per yearfor the 3-year period. About 69 percent of the total haulage was carried bythe private sector. These data do not, however, reflect the unofficial cross-border trade that is taking place between Afghanistan and Pakistan. Accord-ing to recent findings, some 100 to 140 trucks cross the border each day onmajor routes carrying food and a variety of other items of trade.
Freight rates have increased sharply because of the poor road condi-tions, smaller size of vehicles, and the risk of detection. Currently, suchrates are estimated to be about six times the level that would prevail undermore normal conditions.
In addition to in-country problems, the cost of transportation for itemsin international trade is also high. The frequent transshipment of goods andthe inadequate port and transport facilities of both Pakistan and Iran severelylimit Afghanistan's free access to the sea. Currently, 70 percent of
16
Afghanistan's official trade is moved through the Soviet Union, and only 20percent is moved through Pakistan. The construction of a road and railwaybridge across the Amu Darya at Hairatan, with financial and technicalassistance from the Soviet Union in 1982, helped to expand trade with theSoviets. Trade through Iran has come to a virtual halt in recent years.
The country has 32,175 telephones. For the in-country population of12.3 million, this represents 1 telephone for every 382 persons. About 60percent of the telephones are in Kabul, about 1 telephone for every 88persons, and most of the remaining telephones are in the provincial capitals,including Kandahar, Herat, and Mazar-i-Sharif. Rural areas have virtually notelephones. An earth satellite station was built with Soviet assistance in theearly 1980s. Telecommunications between Kabul, Moscow, and other countriesare now provided by that system.
It is reported that automatic telephone exchanges are in service in themain cities. However, the exchanges in Kandahar and Kondoz were damagedby recent fighting, thus reducing the total number of telephones in service inthe country from 32,675 to about 30,000. Most of the channel systems equip-ment and ordinary lines outside these provincial capitals have been destroyedor have disappeared. Communication between Kabul and the main urbancenters controlled by the government is maintained through wireless systems.According to government data, about 256 wireless sets are operating through-out the country. All international mail to and from Afghanistan is currentlyrouted through the Soviet Union.
Public Health Sector
The level of health services available to the population, particularly inrural areas, was inadequate even before the war. In 1978-79, there were 56hospitals and 223 basic health centers that provided health services to about25 percent of the population. All the medical facilities and programs wereadministered through the central government and a few nongovernmentorganizations. About 6 percent of the population had access to safe drinkingwater.
The war has disrupted the few and infrequent rural health servicesthat existed, and because of the rural-urban migration, a great strain hasbeen placed on the urban health facilities as well. Some 6 hospitals and 118health centers are reported to have been destroyed, and the remaining facili-ties are in a poor state of repair. In 1987-88 about 2,900 of the nation's 5,400hospitals beds, or 54 percent, were located in Kabul. Similarly, nearly 1,100(63 percent) of the 1,750 doctors operating under the Ministry of PublicHealth served in the Kabul area.
17
As a result of these inadequacies, the health of most of the country'sinhabitants continues to be poor. The main problems appear to be asfollows:
Sanitation is generally poor. Sewage runs in opentrenches, and only about 30 percent of the populationin Kabul and some major provincial cities haveaccess to piped water.
The incidence of malaria is on the rise, particularly inthe eastern and northeastern provinces. Roughly36,000 cases were reported in 1979 whereas 450,000cases were reported in 1988.
Tuberculosis is reported to be widespread.
According to UNICEF, infant mortality continues toaverage about 190 per thousand live births. Themortality rate for children under 5 is estimated at 325per thousand. This means that nearly one-half of thechildren who are born die before they reach the ageof 5 years. Deaths of mothers during childbirth areestimated to be about 9 per thousand births, which isabout 4 to 5 times as high as in most developingcountries.
With continued warfare and the presence of mines inmany rural areas, the number of disabled persons isincreasing and this poses a special problem.
A large number of qualified doctors have left thecountry and most of the country's medical personnelwho remain are poorly trained or lack experience. Itappears that between 500 and 700 doctors have leftthe country over the past decade, and the availabletraining institutions are underequipped, understaffed,and without adequate teaching materials.
During recent years, a large number of nongovernment organizationshave offered medical assistance to the rural areas in Afghanistan. Accordingto the Agency Coordinating Committee for Afghan Relief's (ACBAR) recentreport, SCA is currently supporting about 1300 health workers in all of the 29provinces, including 85 health posts. The Management Sciences for Healthorganization has so far trained 1,400 health workers and established 108health posts in the country, and indications are that an additional 100 healthposts may have been set up by other nongovernment organizations. Most of
18
these health posts are very rudimentary; there are no buildings, they lackbeds and equipment, and few have experienced personnel or access todoctors.
The placement of health facilities is to a large extent based on politicaldecisions with little apparent relationship to population and needs. As aresult, a major portion of the rural population has limited access to thefacilities in place. The nongovernment organizations' training programs forhealth workers are of varying quality and are not well standardized.Substantial retraining is often required to prepare them to handle evenordinary cases.
Some of the nongovernment organizations, including ManagementSciences for Health (MSH) and the Afghan Vaccination and ImmunizationCenter (AVICEN), are currently implementing vaccination and immunizationprograms. However, these efforts have not yet been fully integrated into theprograms of the health centers. Most of the centers do not have sufficientvaccinators and refrigeration facilities.
Education Sector
In 1978-79, more than 1 million children were being taught in primaryand secondary grades by about 40,000 teachers. Enrollment at Kabul andNangarhar Universities had reached 11,300, with women constituting 22 percentof the total.
During the decade of the war, the educational system was seriouslydisrupted, first in the rural areas and later in the cities. More than 2,000school buildings were destroyed and unknown thousands of experiencedteachers and school administrators were allegedly executed or forced toleave the country.
The basic education system now in place is similar to that of theSoviet Union. It involves 11 years of schooling—five primary grades, threelower secondary, and three upper secondary. Unofficial sources suggest thatin 1989-90 primary enrollment had decreased to about one-third of the pre-war level of 830,000 pupils. However, enrollment in secondary grades haddeclined less; in 1989-90 it was about 87 percent of the 92,400 students inthose grades in 1978-79. Much of the decrease is undoubtedly the result ofthe decline in population. The lack of teachers and uncertain security alsocontribute to low school attendance.
In recent years a large number of nongovernment organizations havestarted supporting education activities inside Afghanistan. The EducationSupport Project assisted by USAID has established a substantial network ofprimary schools inside Afghanistan based on 6 years of education. Thisproject currently supports 1,291 primary schools in all the 29 provinces with a
19
total enrollment of 132,000 pupils. The students are taught by about 5,000Afghan teachers.
Similarly, the SCA has provided support to 82,200 students in 484primary schools inside the country. The total number of teaching staff isreported to be 2346. In addition, about 122,000 students are supported at theprimary education level through other nongovernment organizations. Theoverall impression is that nongovernment organizations are supporting about300,000 children at 2,000 primary schools that they have established. Thisrepresents about 15 percent of the population in the 7 to 14 age group.
Although the nongovernment organizations have been able to create asystem of primary education in the rural areas, some aspects of theseprograms need to be improved if the effectiveness of the overall system isto be enhanced. One of the main issues has been the chronic shortage ofqualified teachers at the local level. Yet teacher training and curriculumdevelopment for primary schools have not been standardized. A majority ofthe existing teaching staff do not have the qualifications required to conducta formal teacher training program and so far no workable plan has beensubmitted. Low teacher salaries, relative to the rate of inflation, have notbeen conducive to attracting people into the teaching profession.
Vocational education has been concentrated in Kabul and in a fewurban centers. Total enrollment in these schools has dropped from 20,750students in 1978-79 to 19,690 in 1988-89, a decline of a-^out 6 percent. In spiteof this the total number of graduates from these institutions has increased.It was nearly 4,700 in 1987-88 compared with less than 4300 in 1978-89.
The vocational training system is reported to favor technical andmechanical skills at the expense of management training in crop and livestockhusbandry. This strategy is reflected in the number of Technicoms," thesecondary vocational schools, that have been built and supported by theSoviet Union. In 1978-79 there were only two such schools, but in 1987-88there were seven. This allowed the total enrollment to triple from 1,700 in1978-79 to 4,700 in 1989-90. The students were taught by 470 teachers, ofwhom 72 were from the Soviet Union.
In the Pakistan refugee camps a large number of skilled workers havebeen trained under the training programs supported by various agencies,including UNHCR, ILO, and other nongovernment organizations. In addition,thousands of the graduates of l'*e vocational schools of Afghanistan have alsomigrated to Pakistan and Iran where job opportunities existed. According toa recent study conducted by UNRISD in Pakistan, of the 5,178 male refugeesaged 12 or over, 17.4 percent possessed technical and mechanical skills.
The Kabul government, with assistance from Soviet advisers, introducedsignificant changes in the structure and organization of Kabul University. Theengineering faculty, which had been assisted by the United States for more
20
than 20 years, was abolished in 1982. The faculty of medicine was broughtunder the direct control of the State Medical Institute and supervised by theMinistry of Public Health. The Soviet advisers introduced changes in thecurriculum of several of the faculties with a view to sovietizing them. Anumber of new faculties related to the social sciences were also created toprovide training to members of the ruling party. It is reported that, duringthis period, 36 teachers were executed and 340 teachers had to leave thecountry. This was nearly 44 percent of the total teaching staff.
Enrollment in the institutions of higher learning was 17300 in 1987-88.In spite of the population loss, this was up from 11300 in 1978-79 for anoverall rise of 55 percent. The increase was totally inconsistent with theexpansion of facilities and teaching staff and thus reduced the quality ofeducation. This decline in quality will affect the development of Afghanistanfor a long time.
Industry, Mining, and Energy
During the 2 decades before the war, Afghanistan had accorded a highpriority to the establishment of public enterprises in mining and manu-facturing. In part this reflected the failure of the private sector to take theinitiative. The state-owned enterprises often enjoyed a monopoly position inaddition to being favored by administrative and financial concessions.
Most mining and manufacturing is still carried out largely through publicenterprises. Although several new ones have been set up during the pastdecade, the increase in value-added contributed by such enterprises has notbeen great because in total they had already accounted for 80 percent ofpre-war manufacturing output. In 1989-90, the value-added by all partial andwholly owned state manufacturing enterprises was up to 86 percent. The 30public industrial enterprises in the 'country employ about 23,000 workers.Most of its enterprises are overstaffed and most of the workers are poorlytrained. In 1987-88 the number of registered private enterprises wasestimated at 325, and they employed about 9,000 people.
Manufacturing has advanced very slowly (Table 4). The average annualgrowth rate has been about 1.1 percent over the decade. At present, most ofthe enterprises are operating at between 20 and 30 percent of their capacitybecause of shortages of raw materials and transportation difficulties. It isalso reported that the condition of the existing factories and shops hasdeteriorated through neglect and lack of maintenance. Most of the newindustrial projects that were started before the war have remainedunfinished.
Manufacturing is based largely on the processing of domestic rawmaterials, in particular agricultural raw materials. Thus, manufacturing
-u-
Table 4. Estimated Industrial and Mining Production, 1978-79 -1989-90
Mining and QuarryingNatural GasCoalSalt
Food ProcessingWheat FlourBakery ProductsSugarVegetable Oils
Textiles and LeatherGinned cottonCotton TextilesRayon TextilesWoolen TextilesShoes (Leather)
Chemical ProductsChemical FertilizerPetroleum Products
OtherCementElectricity
Units
Mill.cub.met1000 tons1000 tons
1000 tons1000 tons1000 tons1000 tons
1000 tonsMill, metMill, metMill, met1000 Pairs
1000 tons1000 tons
1000 tonsMill. Kwh.
1978-79
2,461.0218.281.1
97.020.410.810.3
41.688.011.70.4
304.1
105.714.0
126.5845.4
1987-88
1,941.0167.015.4
203.034.00.13.3
8.252.63.40.2
675.0
123.42.4
104.0700.0 (b)
1988-89
1,005.0138.037.0
161.082.00.12.0
7.732.93.00.2
580.0
117.0..
70.0650.0 (b)
1989-90Projection
220.0 (a)100.037.0
160.034.0-
3.0
11. 030.02.80.2
500.0
110.0--
60.0550.0 (b)
Sources: GOA, Central Statistical Office and Ministry of Planning.a. Adopted from the GOA Summary of Annual Plan for 1989-90.b. Based on unofficial estimates, as the official estimates are believed to be biased and inconsistent
with the Government controlled installed capacity.
22
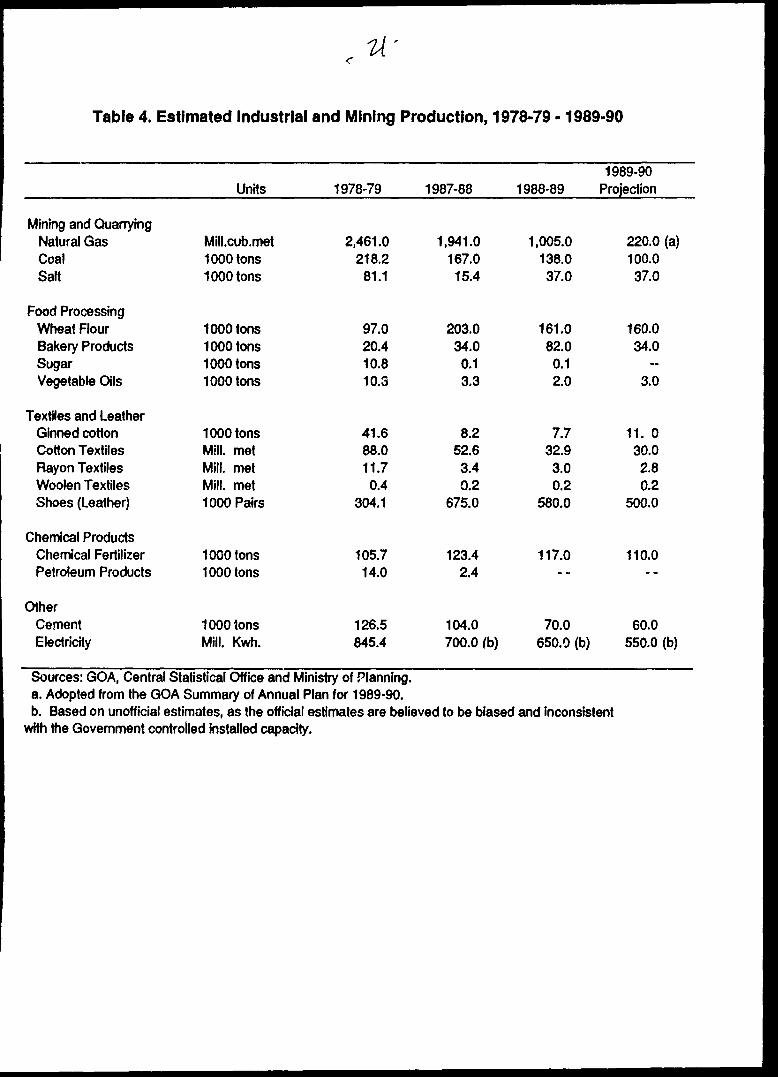
performance has declined with the decline in agriculture. The steadydeclinein cotton production over the last decade has caused the output oftextiles to drop to 34 percent of pre-war levels and ginned cotton to fall to26 percent. The drastic decline in the production of sugar beets has causedthe operation of the Baghlan sugar factory, with a total capacity of 16,000tons, to shut down completely.
The production of cement has also dropped sharply from a level of127,000 tons in 1978-79 to less than 104,000 tons in 1987-88. It dropped furtherto 60,000 tons in 1989-90. The fertilizer plant in Mazar-e-Sharif has, however,maintained full production because of the availability of raw materials andmore favorable security conditions in the area.
Much of the cause for poor industrial performance is not new. Indus-trial development has long been constrained by a number of problems,including inefficient pricing policies, weaknesses in management, inadequacy ofrelated laws, and interference by the central ministries in the day-to-dayoperations of the enterprises. As a result, the contributions of theseenterprises to revenues, capital formation, and even employment has remainedrelatively insignificant.
Afghanistan has a wide range of mineral deposits with modestreserves. Most of these are in the central and northern regions of thecountry. The natural gas reserves have been estimated at about 130 billioncubic meters, and iron ore reserves are estimated at 1.7 billion tons. Thepetroleum reserves that were discovered before the war are, perhaps, 12 to18 million tons, of which 30 percent is believed to be exploitable. Thecountry also has substantial quantities of copper (about 11 million tons) andcoal, possibly as much as 600 million tons.
However, because of the lack of appropriate infrastructure, technicalknow-how, and financial resources and the limited domestic markets a verysmall portion of these reserves has so far been tapped. Mining activities areconcentrated in the production of natural gas, coal, and salt; before the warmining of lapis lazuli in northeastern Badakhashan province had also beenincluded in the programs of the central government.
Production from mining has declined sharply—an average rate of about18 percent per year. This drop has been due mainly to the sharp decline inthe production of natural gas. From 1978 to 1985, the production of gas hadbeen maintained at about 2.6 billion cubic meters per year. Since then,output has dropped steadily to 1.9 billion cubic meters in 1987-88 and furtherdown to 1.0 billion cubic meters in 1988-89. Official estimates suggest thatproduction will be down to 0.2 billion cubic meters in 1989-90, because oftechnical, institutional, and security problems facing these activities. TheKabul government intends to resume gas exports in 1990-91.
23
The production of coal has also declined over the last decade. Coalproduction was down to 46 percent of the pre-war level, which was 218,200tons. The cement plant and the larger textile mills had used roughly 60percent of the coal that was produced. The remaining 40 percent wasconsumed by households and other establishments.
The production of salt, too, has fallen. Last year, it was down to 46percent of the pre-war level of 81,100 tons.
Recently the Soviet Union developed a proposal for building a 50,000-ton oil refinery in Shabarghan province. The refinery was to use the smallreserves of oil that had been discovered in the area before the war. Thereis no indication of when the plant will be built.
Electric generating capacity is currently estimated at about 410 mega-watts of which 254 is produced from hydropower, 48 from gas, 60 fromdiesel-generated power, and 48 from the thermal power plant completed inKabul before the war. Although it is reported that operating conditions ofmost power facilities have deteriorated during the decade because of lack ofmaintenance and spare parts, the contribution of electric power to grossdomestic product has remained about constant.
Several power projects that had been planned before the war have notbeen implemented. The transmission line between Kajakai and Kandahar wasdestroyed early in the war. As a result, the Kajakai hydropower plant,which has a capacity of 33 mega-watts, has been unused for most of thepast decade.
The Kabul government has procured more than 140 small diesel genera-tors, mainly from eastern block countries, to provide electricity to thegarrison towns in the border provinces under its control. In addition, twotransmission lines have been built from the Soviet Union to Mazar-e-Sharif(220 kilovolts) and to Kunduz (110 kilovolts). As a result, electricity is alreadybeing provided to these towns.
Official government statistics show that Afghanistan imported 15 millionkilowatt-hours of electricity in 1986-87 and 37 million kilowatt-hours in 1987-88. The price was set at 0.05 cents per kilowatt-hour. Since 1988-89, thecost of imported electricity has been covered under the Soviet Union'scommodity aid program.
Even before the war the supply of electricity was inadequate to meetdemand. About 5 percent of the people had access to electricity, and 80percent of electricity was generated in and around Kabul. With the heavyinflux of people to that city and the poor condition of the power lines andgenerating facilities, Kabul residents today have access to electricity for only 5hours a day.
24
Public Finance and Expenditures
In recent years the financial condition of the Kabul government hasdeteriorated markedly (Table 5). The growth of domestic revenues has beenslower than that of ordinary expenditures with the result that the surplus,which once financed nearly 30 percent of development expenditures, turnedinto a deficit by the mid-1980s. In addition, development expenditures havegrown, at least in nominal terms, and are now totally dependent on fundingfrom sources other than the revenue base.
The overall budgetary deficit has increased. It was roughly Afs. 9.9billion in 1978-79 and is now well over Afs. 90 billion. External assistancehas been insufficient to finance the growing deficit. Thus, the governmenthas had to resort to heavy borrowing. This has fueled inflation, reduced thevalue of the Afghani, and jeopardized the nation's balance of payments. Inthe past 3 years, net external aid and borrowing from che Central Bank hasfinanced about 65 percent of total development expenditures (Table 5).
Total domestic revenues, after having reached the level of Afs. 425billion in 1987-88, were only Afs. 39.4 million in 1988-89 and were downfurther to Afs. 38 billion in 1989-90. During much of the last 11 years,revenues had increased at an average annual rate of more than 8 percent innominal te..ns. However, given the high rate of inflation, this represents anaverage annual decline of more than 5 percent in real terms.
The country's basic revenue structure has remained essentiallyunchanged although some important shifts in the relative importance ofvarious sources of revenue have occurred. Not unexpectedly, non-taxrevenues increased more than threefold during the past decade—from Afs. 7.0billion in 1978-79 to Afs. 23.2 billion in 1987-88. This change meant that therelative share of non-tax revenues rose from 43 percent to 55 percent.
Most of this increase was attributable to higher revenues from the saleof natural gas to the Soviet Union. Sales rose from a pre-war level of Afs.2.6 billion to Afs. 10.4 billion in 1987-88. In 1988-89, however, revenues fromthe sale of gas to the Soviet Union fell by 55 percent from the previous year.As a result, the relative importance of non-tax revenues fell to 49 percent.No detailed information is available on revenues for 1989-90, but it appearslikely that non-tax revenues will have fallen even further because exports ofgas to the Soviet Union have been virtually halted. The reasons are notknown.
Gross revenues from government enterprises contributed, significantly tothe steady rise in non-tax sources during this period. According to theofficial data, gross income from these enterprises amounted to Afs. 55 billionin 1987-88 compared with only Afs. 1.2 billion in 1978-79. These increasesresulted from the establishment of new enterprises and an upward revision
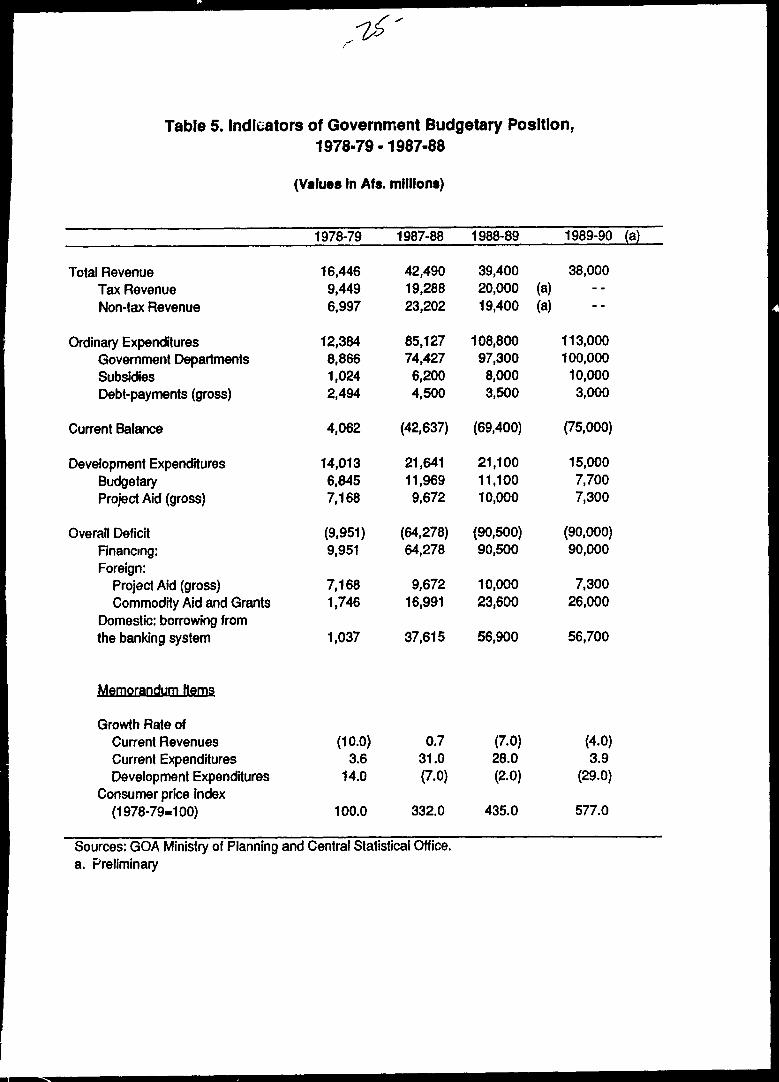
Table 5. Indicators of Government Budgetary Position,1978-79-1987-88
(Values In Afs. millions)
Total RevenueTax RevenueNon-tax Revenue
Ordinary ExpendituresGovernment DepartmentsSubsidiesDebt-payments (gross)
Current Balance
Development ExpendituresBudgetaryProject Aid (gross)
Overall DeficitFinancing:Foreign:
Project Aid (gross)Commodity Aid and Grants
Domestic: borrowing fromthe banking system
Memorandum Items
Growth Rate ofCurrent RevenuesCurrent ExpendituresDevelopment Expenditures
Consumer price Index(1978-79-100)
1978-79
16,4469,4496,997
12,3848,8661,0242,494
4,062
14,0136,8457,168
(9,951)9,951
7,1681,746
1,037
(10.0)3.6
14.0
100.0
1987-88
42,49019,28823,202
85,12774,4276,2004,500
(42,637)
21,64111,9699,672
(64,278)64,278
9,67216,991
37,615
0.731.0(7.0)
332.0
1988-89
39,40020,00019,400
108,80097,3008,0003,500
(69,400)
21,10011,10010,000
(90,500)90,500
10,00023,600
56,900
(7.0)28.0(2-0)
435.0
1989-90 (a)
38,000(a)(a)
113,000100,00010,0003,000
(75,000)
15,0007,7007,300
(90,000)90,000
7,30026,000
56,700
(4.0)3.9
(29.0)
577.0
Sources: GOA Ministry of Planning and Central Statistical Office,a. Preliminary
26
in the prices of commodities that they sold—namely/ sugar, gasoline, textiles,and electricity. Although data on net revenues from government-ownedenterprises is not available, it is believed that this net contribution wasnegligible or even negative.
The tax system is still heavily dependent on indirect taxes. In 1987-88about 69 percent of tax revenues were generated from import duties. Thisresulted from an average rate of increase in duties of 9.2 percent per year aswell as from increases in the value of imports.
Direct taxes amounted to Afs. 5.9 billion in 1987-88, reflecting an annualaverage rate of increase of 9.9 percent from 1978-79, measured in nominalterms. In real terms, direct taxes in 1987-88 were about 70 percent of thepre-war level. As a percent of total tax revenues, direct taxes increasedfrom 27 percent to 31 percent over the same period.
During the period 1978-79 to 1989-90 the government's ordinary expendi-tures, including foreign debt payments, increased ninefold—from Afs. 12.4billion to Afs. 113.0 billion. Most of this rise resulted from increases inmilitary expenditures, government employment, foreign debt payments, andsubsidies paid to government-aided institutions. As in most countries'budgets, the level of military spending is not revealed clearly. However,statements made by several government officials suggests that it may be asmuch as 50 percent of the total budget. Because of the heavy burden ofgovernment operations and military costs, the share of the budget for socialand economic services has generally been low and the maintenance of capitalhas been severely neglected.
The total cost of wages and salaries of government employeesincreased sevenfold, from Afs. 4.5 billion in 1978-79 to Afs. 31.9 billion in 1987-88. Because salaries and wages have risen only modestly, and not at all inrecent years, this sharp rise is attributable mainly to increases in the numberof employees.
To cover the losses of public enterprises for the subsidized sale oftheir products, Afs. 6.2 billion was budgeted in 1987-88 and Afs. 8.0 billion in1988-89. The latter amount was an eightfold increase from 1978-79. Thesesubsidies were provided for fertilizer, fuel, transport, communications, food,and electricity.
Service on external debt went up from Afs. 25 billion in 1978-79 to Afs.45 billion in 1987-88, an increase of about 80 percent. Since then, the foreigndebt service has dropped sharply, mainly because of repeated debtrescheduling by the Soviet Union.
Development expenditures rose from Afs. 14.0 billion in 1978-79 to Afs.21.1 billion in 1988-89. This represents an average growth rate of 4.2 percentper year in nominal terms. In real terms, it represents a decline of about 3
27
percent per year. In 1989-90, preliminary estimates suggest a drop in thedevelopment budget of about 30 percent.
Because the current account of the budget has had no surplus forseveral years, the entire development budget had to be financed. For thelast 3 years, about 30 percent of the development budget has been met byproject aid and 70 percent from bank borrowing.
The development program, prepared with the assistance of Sovietexperts, is highly capital intensive and has a high import content. As in manyother world situations, the development program is often prepared with littleregard for the social and economic priorities of the country. Projects are, toa large extent, determined by the type of projects favored by the donor.Consequently, a large portion of resources are directed to projects andactivities that often compromise the goals and objectives of the nation infavor of the goals and objectives of the donor.
Between 1978-79 and 1989-90 more than 42 percent of total developmentexpenditures were allocated to mining, industry, and energy. The majorprojects in the most recent budget for these sectors included
Extension of two power transmission lines from theSoviet Union to the towns of Mazar-i-Sharif andKunduz and construction of related substations,
Gas and oil exploration,
Construction of a gas station at Hairatan, anda
Expansion of Mazar-i-Sharif Silo with a capacity of40,000 tons.
By contrast, agriculture constituted only 12 percent of the developmentbudget, with investments concentrated in the expansion of state-owned farmsand the establishment of agricultural mechanized stations, mainly in thenorthern provinces.
In the transportation sector, the highest priority was accorded toconstructing a railway station at Torghondi and a port facility at Hairatan,establishing transport compounds, and expanding the Kabul airport.
The highest priority in social services was given to the construction ofprefabricated apartments in Kabul and expansion of that city's water supplysystem. In the past decade, more than 5300 apartment units were built,mainly for the benefit of party members and high ranking governmentofficials. Construction of a large number of structures for military and
28
security purposes also absorbed a major portion of the developmentexpenditures.
From 1978-79 to 1988-89, the 11-year cumulative total of developmentexpenditures for all sectors was about Afs. 186 billion. Still, the real rate ofeconomic growth continues to be negative, suggesting that for whateverreasons, the expenditures were ineffective or insufficient
Money Supply and Prices
The sharp rise in money supply and liquidity during recent yearsclearly reflects a rapid deterioration of the budgetary situation (Table 6).Between 1978 and 1988 the money supply (Ml) has increased sixfold, fromAfs. 28 billion at the end of 1978 to Afs. 179 billion at the end of 1988,resulting in an average growth rate of 20 percent per year.
A major portion of this increase has been attributed to heavygovernment borrowing from the banking system to support both the ordinaryand the development budget. During the same period, net domesticborrowing increased ninefold while claims on the central government andnonfinancial public entities increased nearly twelvefold. This, demand forcredit by the government restricted the availability of credit to the privatesector.
Domestic liquidity grew at an average rate of 20 percent per yearduring the 1978-88 decade. This growth, coupled with falling rates ofproduction and economic activity, has become a major cause of rapidincreases in the general level of prices.
During the decade, the general price level, measured by the nationalconsumer price index, increased at an average rate of more than 17 percentper year—the price of major types of food rose variously in the range of 15to 20 percent with meats, fruits, and vegetables increasing the most (Table 7).By comparison, non-food prices rose an average of only 12 percent per year.
During the past 2 years, however, there has been triple digit inflation.The consumer price index rose 103 points in 1988-89 and another 142 pointsin 1989-90. These sharp increases were caused in part by the earliermentioned revisions in the prices of commodities sold by government-ownedenterprises. For example, the price of gasoline was raised from Afs. 85 toAfs. 30 per liter at the beginning of 1986-87. It was raised again in early1989-90 to Afs. 40 per liter. Over the same period diesel oil prices wereraised from Afs. 8 to Afs. 20 per liter. Sugar prices were raised from Afs. 30to Afs. 100 per kilogram in the same time frame as were prices of textilesand electricity.
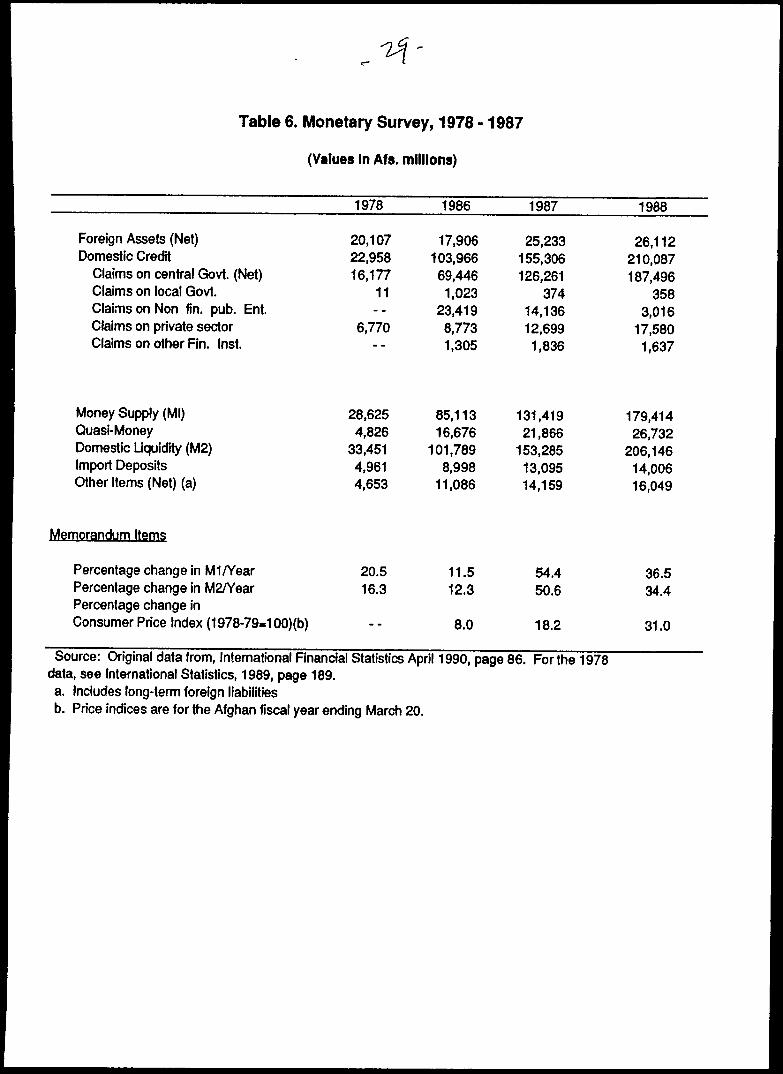
Table 6. Monetary Survey, 1978 -1987
(Values In Afs. millions)
Foreign Assets (Net)Domestic Credit
Claims on central Govt. (Net)Claims on local Govt.Claims on Non fin. pub. Ent.Claims on private sectorClaims on other Fin. Inst.
Money Supply (Ml)Quasi-MoneyDomestic Liquidity (M2)Import DepositsOther Items (Net) (a)
Memorandum Items
Percentage change in Ml/YearPercentage change in M2/YearPercentage change inConsumer Price Index (1 978-79-1 00)(b)
1978
20,10722,95816,177
11--
6,770
28,6254,826
33,4514,9614,653
20.516.3
~ "
1986
17,906103,96669,4461,023
23,4198,7731,305
85,11316,676
101,7898,998
11,086
11.512.3
8.0
1987
25,233155,306126,261
37414,13612,6991,836
131,41921 ,866
153,28513,09514,159
54.450.6
18.2
1988
26,112210,087187,496
3583,016
17,5801,637
179,41426,732
206,14614,00616,049
36.534.4
31.0
Source: Original data from, International Financial Statistics April 1990, page 86. For the 1978data, see International Statistics, 1989, page 189.a. Includes long-term foreign liabilitiesb. Price indices are for the Afghan fiscal year ending March 20.
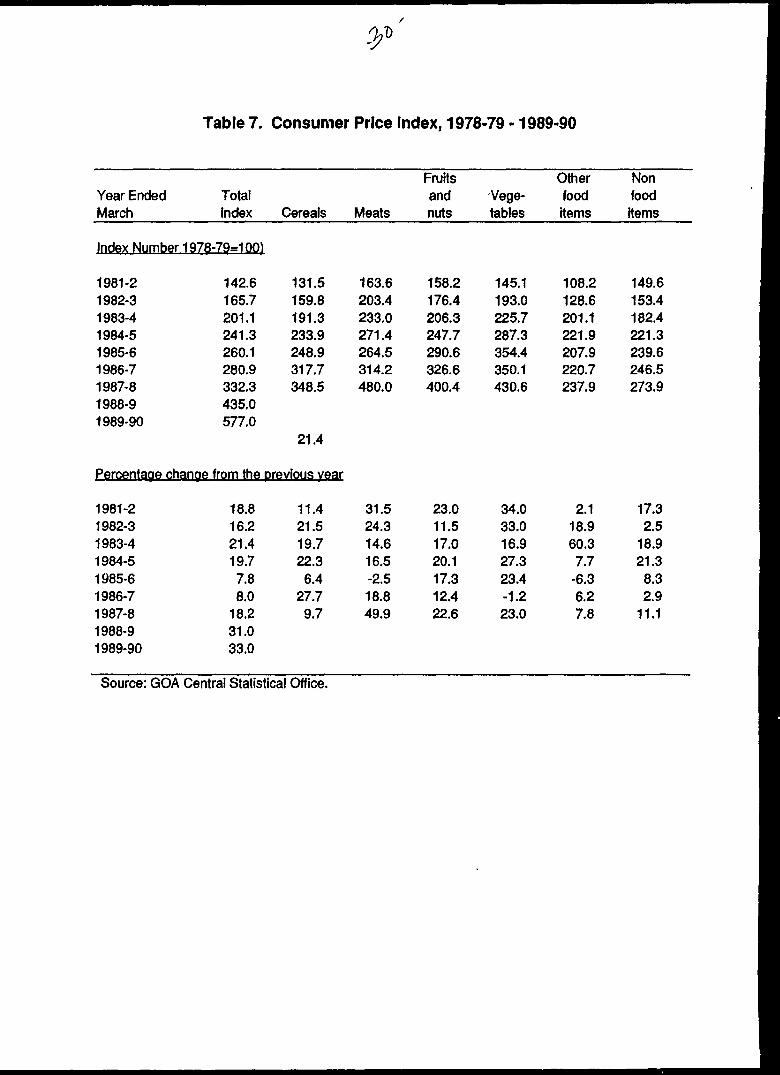
Table 7. Consumer Price Index, 1978-79 -1989-90
Year EndedMarch
Index Number
1981-21982-31983-41984-51985-61986-71987-81988-91989-90
TotalIndex
1978-79=100)
142.6165.7201.1241.3260.1280.9332.3435.0577.0
Percentage chanae from the
1981-21982-31983-41984-51985-61986-71987-81988-91989-90
18.816.221.419.77.88.0
18.231.033.0
Cereals
131.5159.8191.3233.9248.9317.7348.5
21.4
previous year
11.421.519.722.36.4
27.79.7
Meats
163.6203.4233.0271.4264.5314.2480.0
31.524.314.616.5-2.518.849.9
Fruitsandnuts
158.2176.4206.3247.7290.6326.6400.4
23.011.517.020.117.312.422.6
Vege-tables
145.1193.0225.7287.3354.4350.1430.6
34.033.016.927.323.4-1.223.0
Otherfooditems
108.2128.6201.1221.9207.9220.7237.9
2.118.960.37.7
-6.36.27.8
NonfoodHerns
149.6153.4182.4221.3239.6246.5273.9
17.32.5
18.921.38.32.9
11.1
Source: GOA Central Statistical Office.
31
The pricing of agricultural products has been determined largely bymarket forces. However, competition has been restricted by a number offactors, including high transport costs, lack of security, and arbitrary taxesand regulations imposed by local authorities.
The Kabul free market for currencies has reflected the inflationarytrends. Against the U.S. dollar, the value of the Afghani has depreciatedabout 90 percent over the decade. The exchange rate was Afs. 47 per dollarin 1978-79; during 1989-90 it averaged Afs. 420.
Afghanistan's exchange system comprises several officially determinedrates. The basic official exchange rate has remained constant throughout thisperiod at a rate of Afs. 50.6 per dollar. The basic official rate, which isbelow the free market level, is applied in a number of situations. It isapplied to a portion of private export earnings that must be surrendered tothe government so that exporters realize less for their exports than theywould otherwise. The basic official rate is also applied to all governmenttransactions, certain foreign currencies earned in-country, and all transactionsthat are specified in clearing dollar units under bilateral arrangements. Theremaining official rates, which have been altered from time to time butwhich are also below the market rate, are applied to proceeds of exports ofspecific items. This complex and cumbersome system of taxing exports andsubsidizing imports has been carried over from the 1960s.
Four commercial banks are operating in Afghanistan, one is the CentralBank, which controls the money supply. In addition, there are threespecialized lending institutions to provide credit for agriculture, industry, andconstruction, respectively. Most of the credit in agriculture is supplied byprivate lenders.
No organized capital market has ever existed in the country becausethe capacity of domestic households and businesses to save is small.Government policy has been to encourage private savings, but so far there islittle evidence that it is working. Recently, interest on deposits of 1 year ormore were increased from 10 to 11 percent. However, given Afghanistan'shigh rate of inflation the real value of deposits have declined markedly.
External Sector
Afghanistan today is an import-oriented country with an increasinglywidening gap between imports and exports. In order to meet the country'sgrowing needs, the Kabul government has relied more and more on economicaid from the Soviet Union. This situation has enabled the Soviet Union to setthe roots for economic dependence for many years to come.
32
It appears that Afghanistan had a reasonably comfortable balance ofpayments position before the war (Table 8). Total reserves had been risingand had reached $391 million by 1979. Since then they have declined. In1988-89 the total was reported to be $261 million.
A recent IMF report put Afghanistan's current account deficit at $511million in 1986-87. This represents 81 percent of the value of exports.During 1978-79 the deficit had been $225 million or 66 percent of totalexports. These substantial shortfalls have been financed through external aid,capital inflows, and available reserves. No comparable data on the balanceof payments are available for the last 3 years.
The indications are that the situation has deteriorated more rapidlyduring the past 3 years. The gap between exports and imports has beenwidening. From 1987-88 to 1989-90 the country's trade deficit increased from$214 million to $444 million—an average increase of 54 percent per year. Thisrelatively high import dependence with its persistent deficit is causing severestructural imbalances in the economy.
The country's import capacity is quite limited. On average, over thepast 3 years, exports were able to pay for only 55 percent of the commercialimports. The balance had to be financed through non-project assistance,mainly from the Soviet Union. It is obvious, however, that such large tradedeficits are unsustainable even with past levels of external aid.
The immediate causes of the recent crisis in the country's balance ofcommercial trade has been the steady decline in the level of exports.Between 1987-88 and 1989-90 export earnings dropped sharply, from $512million to $316 million, indicating an overall decline of 38 percent over theperiod. This sharp decrease in exports was a result of the fall of both thenatural gas and agricultural exports.
Export earnings from the sale of natural gas to the Soviet Uniondeclined from $204 million in 1987-88 to a low level of $93 million in 1988-89.For lack of security, no gas was exported in 1989-90. With the exception ofwool, most other major commodities registered lower exports. The exportof cotton declined by 10 percent—from $8.9 million in 1987-88 to $8 million in1988-89, while exports of carpets and rugs fell by 21 percent—from $49million to $39 million. Afghanistan's exports have become extremely vulner-able because of the country's high dependence on the markets of the SovietUnion. The Soviet Union's share of the country's exports increased markedlyfrom 35 percent in 1978-89 to more than 63 percent in 1987-88. In 1988-89,however, it dropped to 53 percent, and in 1989-90, it dropped to 36 percent.This was the result of the sharp decline in gas exports, which had consti-tuted about 40 to 50 percent of total exports during this period.
Afghanistan's imports are dominated by essential commodities for directconsumption, some intermediate products, and capital goods. During the past
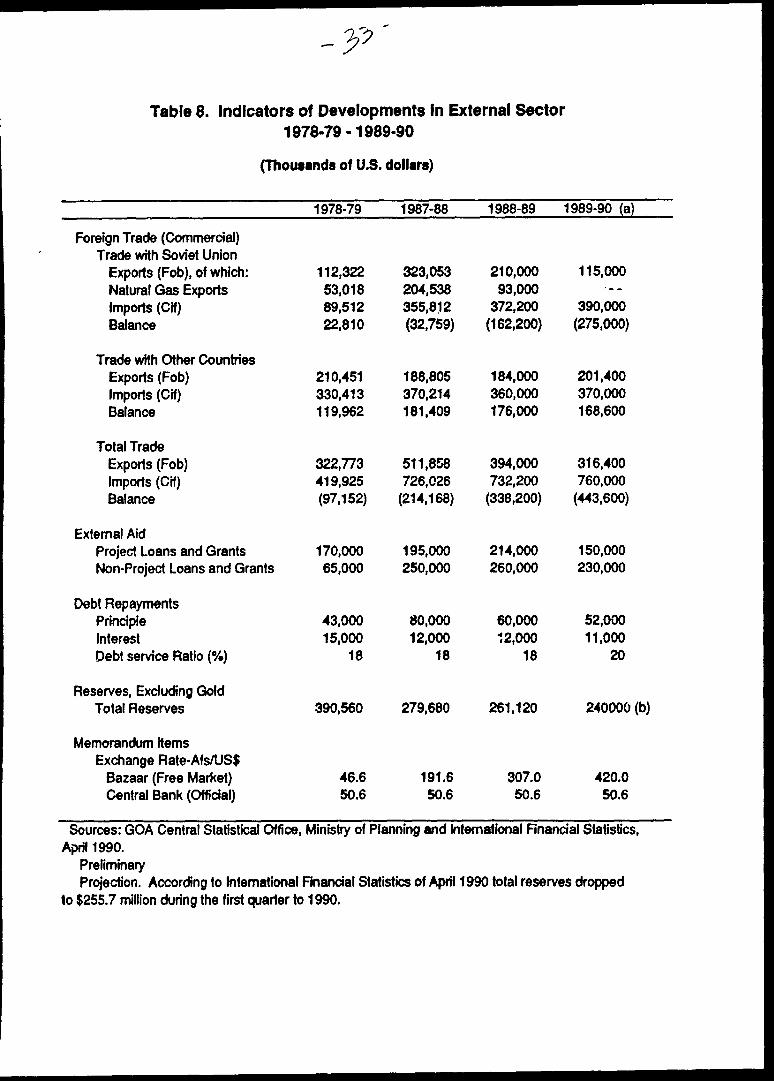
Table 8. Indicators of Developments In External Sector1978-79 -1989-90
(Thousands of U.S. dollars)
Foreign Trade (Commercial)Trade with Soviet Union
Exports (Fob), of which:Natural Gas ExportsImports (Ctf)Balance
Trade with Other CountriesExports (Fob)Imports (CH)Balance
Total TradeExports (Fob)Imports (Cif)Balance
External AidProject Loans and GrantsNon-Project Loans and Grants
Debt RepaymentsPrincipleInterestDebt service Ratio (%)
Reserves, Excluding GoldTotal Reserves
Memorandum HemsExchange Rate-Afs/US$
Bazaar (Free Market)Central Bank (Official)
1978-79
112,32253,01889,51222,810
210,451330,413119,962
322,773419,925(97,152)
170,00065,000
43,00015,000
18
390,560
46.650.6
1987-88
323,053204,538355,812(32,759)
188,805370,214181,409
511,858726,026
(214,168)
195,000250,000
80,00012,000
18
279,680
191.650.6
1988-89
210,00093,000
372,200(162,200)
184,000360,000176,000
394,000732,200
(338,200)
214,000260,000
60,00012,000
18
261,120
307.050.6
1989-90 (a)
115,000• - -
390,000(275,000)
201,400370,000168,600
316,400760,000
(443,600)
150,000230,000
52,00011,000
20
240000 (b)
420.050.6
Sources: GOA Central Statistical Office, Ministry of Planning and International Financial Statistics,AprH 1990.
PreliminaryProjection. According to International Financial Statistics of April 1990 total reserves dropped
to $255.7 million during the first quarter to 1990.
34
2 years, the total value of imports rose from $726 million in 1987-88 to $760million in 1989-90—a rate of about 2.3 percent per year. This reflects thenation's foreign exchange scarcity and its limited import capacity rather thanthe requirements of the economy.
Non-project aid, primarily from the Soviet Union, financed a major partof the requirements for foodstuffs, petroleum, and other essential commodi-ties. These imports for consumption allowed the division of funds forimports of capital foods, particularly vehicles, through commercial channels.In 1987-88 the Soviet Union supplied 250,000 tons of wheat and 430,000 tons ofpetroleum products to the Kabul government under its commodity assistanceprogram. Dependence on the Soviets increased through the decade of the1980s. The Soviet's share of total imports rose from a low level of 21percent in 1978-79 to more than 49 percent in 1987-88. It has remained aboutconstant since then.
In recent years, there has been a considerable shift from imports ofcommodities for direct consumption to imports of capital goods, mainly in theform of transport equipment. As percentage of total imports, the value ofconsumer goods, such as foodstuffs, textiles, medicinal products, and similaritems dropped to 33 percent in 1987-88. The value of consumer goods hadbeen 44 percent in 1978-9. In contrast, the relative share of capital goodsrose from 12 to 42 percent.
Total non-project assistance, mostly in the form of commodities, hasincreased substantially over the past decade. It rose from $65 million in1978-89 to $250 million in 1987-88. In subsequent years, non-project assistanceaveraged $245 million per year. The main objective of commodity assistancewas to contain domestic inflation and provide resources for financing thelocal cost of the Soviet-assisted development projects. It also enabled theKabul government to service Russian loans.
Total project aid increased to $195 million in 1987-88 from $170 millionin 1978-79. However, after reaching a peak of $214 million in 1988-89 itdropped to only $150 million in 1989-90. A major portion of project aid camefrom the communist bloc countries, especially the USSR, which financed 85percent of total project assistance over the period. The major strategicobjective of project aid from the Soviet Union was to foster economicintegration and Afghan economic dependence.
Afghanistan's external debt has been growing rapidly. During the pastdecade, outstanding public debt, including undisbursed funds, was $1.7 billionin 1977. By 1986 it was up to $35 billion. Of this latter total, $2.7 billion wasdisbursed and the remaining $0.8 billion was undisbursed.
As expected, most of the outstanding debt (74 percent) is owed to theSoviet Union. The debt service ratio over the decade has remained manage-able, at about 18 percent, due mainly to the generally soft terms of the loans
35
and repeated rescheduling by the Soviet Union. During the past year, thedebt service ratio rose to 20 percent, mainly because of the sharp decline inthe level of exports.
Conclusions and Prospects
The past 11 years have dashed the immediate hopes of Afghanistan forcontinuing the progress that was on the pre-war horizon. The social andeconomic crises that the nation now faces must be overcome before seriousprogress can resume. The country's productive capacity must be restoredand its economic and social environment must be normalized through politicalstability and policies that are conducive to restructuring and growth. As partof this, the effectiveness of public and private institutions must be improvedeven beyond their pre-war level, and the cadre of professionals that haveleft the country must be encouraged to return or be replaced.
The prospects for political stability and the return of millions of Afghanrefugees to their homeland are no brighter today than they were 15 monthsago. Should the current situation continue for long, even a reversion to thepre-war economy would be unable to provide conditions conducive to thereturn of refugees from Pakistan and Iran.
Some important constraints to restructuring include
• The current political structure of Afghanistan is highlyfragmented. The Kabul government exercises littlecontrol outside of Kabul and a few provincial towns.The Afghan interim government on the other hand,has no presence inside the country and so far hasfailed to set up the necessary administrativestructures needed to coordinate the reconstructioneffort.
• Afghans have become donor dependent. The Kabulgovernment is dependent on the Soviet Union foressential commodities, capital, and technical assistance.The Afghan interim government and the reconstruct-ion program supported by nongovernment organiza-tions is financed by outside assistance. The Afghanrefugees in Pakistan and Iran are largely dependenton external assistance.
• The country has lost many of its experienced admini-strators and technical personnel. A shortage of skills
36
has already constrained the planning and implementa-tion of a rehabilitation strategy.
Statistical information and economic data areextremely poor for making realistic assessments ofthe current economic situation.
Rural economic progress on which the countrydepends as the base for development is hamperedby a harsh environment; uncertain personal security;shortages of animal and tractor power for cultivation;shortages of labor; limited agricultural services; and alack of credit, technology, and husbandry skills
Transportation is perhaps the most critical constraintto the economic and political integration of thecountry and its rehabilitation. The lack of roads andother communications linking many of the settlementsin the country also impede the delivery of adequateeducation and health services.
Given these constraints, the problem of designing and implementing aneffective strategy and program for the rehabilitation of the Afghan economyis formidable. In mid-1988, the United Nations assumed the responsibility forcoordinating the relief and reconstruction activities in the country. Althoughmechanisms for resource mobilization and coordination are now in place,implementation of the proposed programs has been severely constrained by anumber of logistical, financial, and institutional problems. In particular, theresponsible agencies have not yet been able to implement the proposedrelief and rehabilitation programs through direct support. As a result, anumber of nongovernment organizations operating out of Pakistan have playedan increasingly important role.
The activities of the nongovernment organizations are concentrated inthe area of agriculture, public health, education, and rural works. Althoughthe overall priorities are consistent with the needs of the country, thecapacity of the nongovernment organizations for implementation is limited.Furthermore, most of these organizations are operating as providers of freegoods so that their programs are not acting as catalysts for economicrecovery.
The United Nations-supported program is carried out in a piecemealmanner rather than being directed by a well-developed overall strategy. Thenongovernment organizations also lack coordination and direction so that theireffectiveness is markedly reduced. There is clearly a great need to lay outan integrated development strategy for guiding resources to their best andmost effective use.
37
This situation leaves Afghanistan's economic future in considerabledoubt. The prospects for economic recovery depend not only on the returnof peace and personal security but also on a stable representativegovernment to design and implement appropriate policies and strategies forthe return of the refugee population and speedy recovery of the economy.Given the current low level of economic activity, Afghanistan faces a difficulteconomic situation for many years to come.
One plausible but extremely optimistic scenario for the period between1989-90 and 1992-93 suggests that the total gross domestic product could growat a rate of 5.3 percent per year. This would raise aggregate production toabout 90 percent of the pre-war level. The success of this scenariodepends on many favorable occurrences the most important of which is areturn to normal political conditions within a year. It will also requiresubstantial economic assistance to support the restoration of productiveeconomic activity.
To make this a reality, increases in agricultural production would haveto lead the way with an average growth rate of well over 7 percent. In 3years this would put farm output at a level of about 80 percent of what itwas in 1978-79 so that food would still be in short supply and would have tobe supplemented through imports—an equivalent of about 700,000 tons ofwheat. This assumes that the in-country population will grow at a rate ofabout 2 percent per year and that 70 percent of refugee population willreturn to their homes during the 3-year period.
Because the growth of the tax and revenue base tends to lag develop-ment, the large budgetary deficits that have accumulated during the pastdecade are not going to be eliminated even under the postulated optimism ofthis scenario. Thus, much foreign assistance will be required to fund thereconstruction effort and provide essential commodities and inputs.Transportation and communications will also require special attention.
The overall deficit in the country's external trade will undoubtedlywiden. An important factor will be the restoration of high-level gas exportsto the Soviet Union. There is substantial uncertainty surrounding thispotential. The postulated return of 70 percent of the refugees to their homesand the associated requirements for housing, amenities, and job creationwould call for substantial increases in imports of both capital and consumergoods and of agricultural inputs. The prospects for significant increase inexport earnings in the medium term is limited because of supply siderigidities.
The government will be expected to present an integrated developmentstrategy and to carry it out to meet the basic needs of the people. On themacroeconomic side, the government will be expected to adopt measures toimprove the financial and external balances by pursuing prudent fiscal,monetary, and trade policies. On the micro side it will be expected to

38
provide access to capital and technology that will create job opportunitiesand raise the incomes of the people. This will require a reform of the civilservice and improvements in its capacity to carry out the functions ofgovernment efficiently and effectively.
Appendix A
TABLES
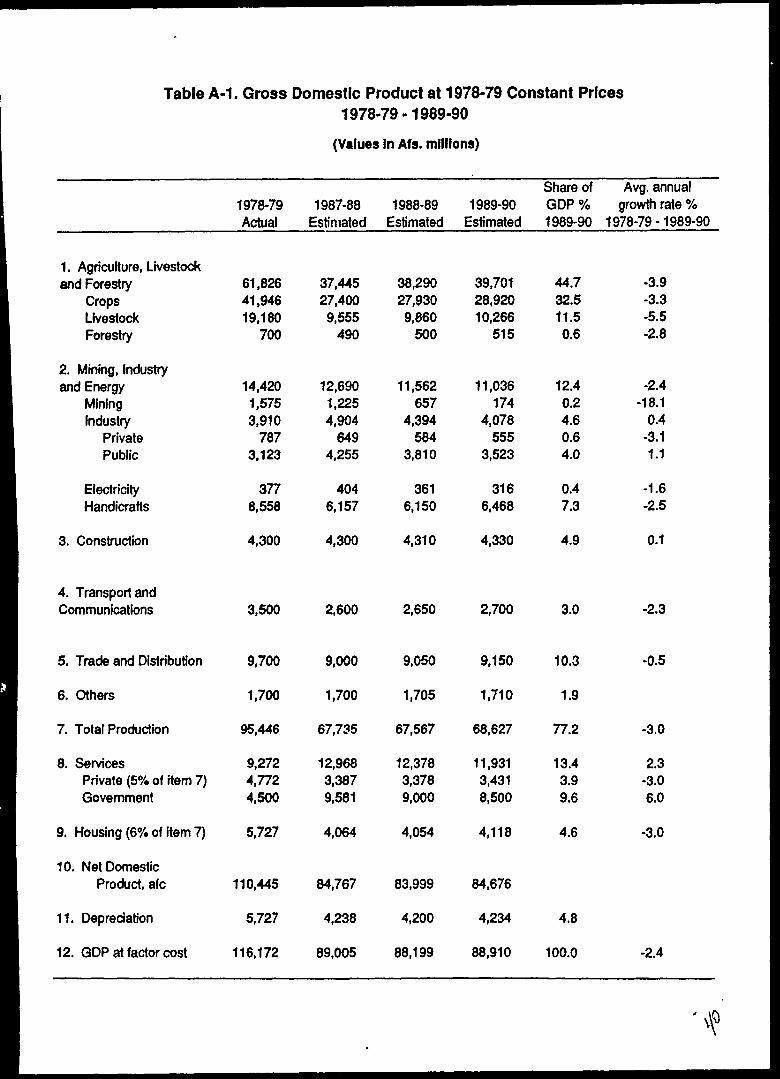
Table A-1. Gross Domestic Product at 1978-79 Constant Prices1978-79-1989-90
(Values In Afs. millions)
1. Agriculture, Livestockand Forestry
CropsLivestockForestry
2. Mining, Industryand Energy
MiningIndustry
PrivatePublic
ElectricityHandicrafts
3. Construction
4. Transport andCommunications
5. Trade and Distribution
6. Others
7. Total Production
8. ServicesPrivate (5% of item 7)Government
9. Housing (6% of item 7)
10. Net DomesticProduct, afc
11. Depreciation
12. GDP at factor cost
1978-79Actual
61,82641,94619,180
700
14,4201,5753,910
7873,123
3778,558
4,300
3,500
9,700
1,700
95,446
9,2724,7724,500
5,727
110,445
5,727
116,172
1987-88Estimated
37,44527,4009,555
490
12,6901,2254,904
6494,255
4046,157
4,300
2,600
9,000
1,700
67,735
12,9683,3879,581
4,064
84,767
4,238
89,005
1988-89Estimated
38,29027,9309,860
500
11,562657
4,394584
3,810
3616,150
4,310
2,650
9,050
1,705
67,567
12,3783,3789,000
4,054
83,999
4,200
88,199
1989-90Estimated
39,70128,92010,266
515
11,036174
4,078555
3,523
3166,468
4,330
2,700
9,150
1,710
68,627
11,9313,4318,500
4,118
84,676
4,234
88,910
Share of Avg. annualGDP % growth rate %1989-90 1978-79-1989-90
44.732.511.50.6
12.40.24.60.64.0
0.47.3
4.9
3.0
10.3
1.9
77.2
13.43.99.6
4.6
4.8
100.0
-3.9-3.3-5.5-2.8
-2.4-18.1
0.4-3.11.1
-1.6-2.5
0.1
-2.3
-0.5
-3.0
2.3-3.06.0
-3.0
-2.4
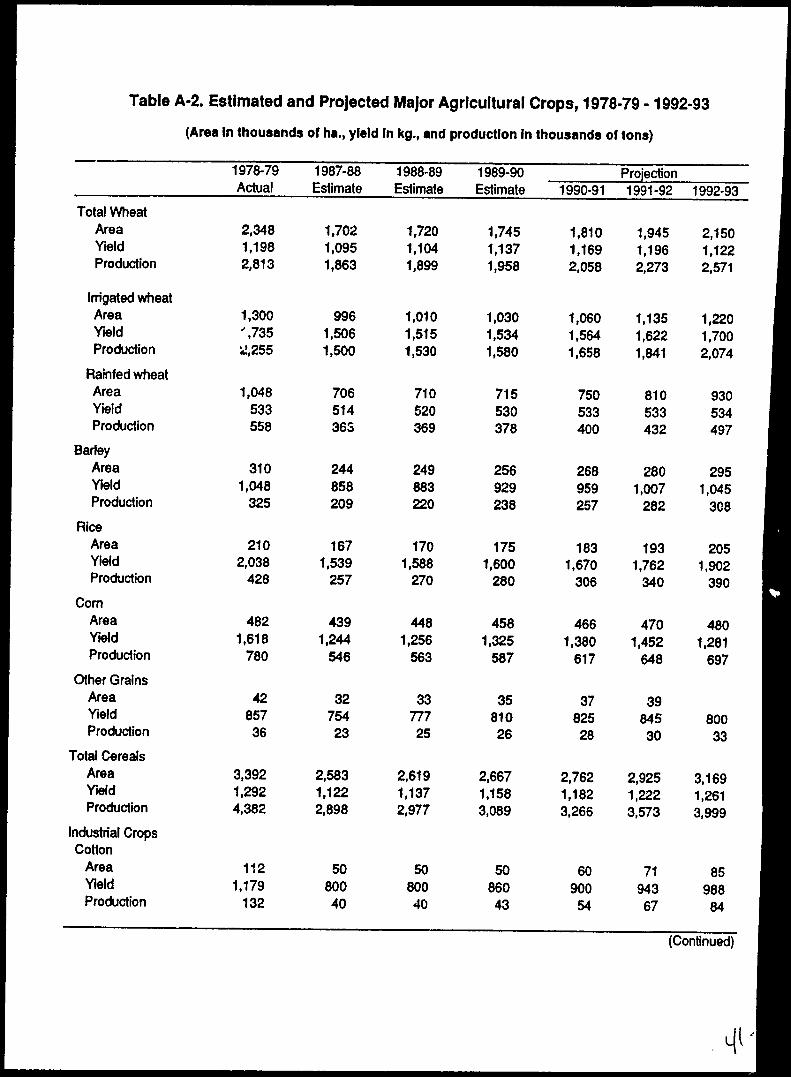
Table A-2. Estimated and Projected Major Agricultural Crops, 1978-79 • 1992-93
(Area In thousands of ha., yield in kg., and production In thousands of tons)
Total WheatAreaYieldProduction
Irrigated wheatAreaYieldProduction
Rainfed wheatAreaYieldProduction
BarleyAreaYieldProduction
RiceAreaYieldProduction
ComAreaYieldProduction
Other GrainsAreaYieldProduction
Total CerealsAreaYieldProduction
Industrial CropsCotton
AreaYieldProduction
1978-79Actual
2,3481,1982,813
1,300',735•«!,255
1,048533558
3101,048
325
2102,038
428
4821,618
780
4285736
3,3921,2924,382
1121,179
132
1987-88Estimate
1,7021,0951,863
9961,5061,500
706514363
244858209
1671,539
257
4391,244
546
3275423
2,5831,1222,898
5080040
1988-89Estimate
1,7201,1041,899
1,0101,5151,530
710520369
249883220
1701,588
270
4481,256
563
3377725
2,6191,1372,977
5080040
1989-90Estimate
1,7451,1371,958
1,0301,5341,580
715530378
256929238
1751,600
280
4581,325
587
3581026
2,6671,1583,089
5086043
1990-91
1,8101,1692,058
1,0601,5641,658
750533400
268959257
1831,670
306
4661,380
617
3782528
2,7621,1823,266
6090054
Projection1991-92
1,9451,1962,273
1,1351,6221,841
810533432
2801,007
282
1931,762
340
4701,452
648
3984530
2,9251,2223,573
7194367
1992-93
2,1501,1222,571
1,2201,7002,074
930534497
2951,045
308
2051,902
390
4801,281
697
80033
3,1691,2613,999
8598884
(Continued)
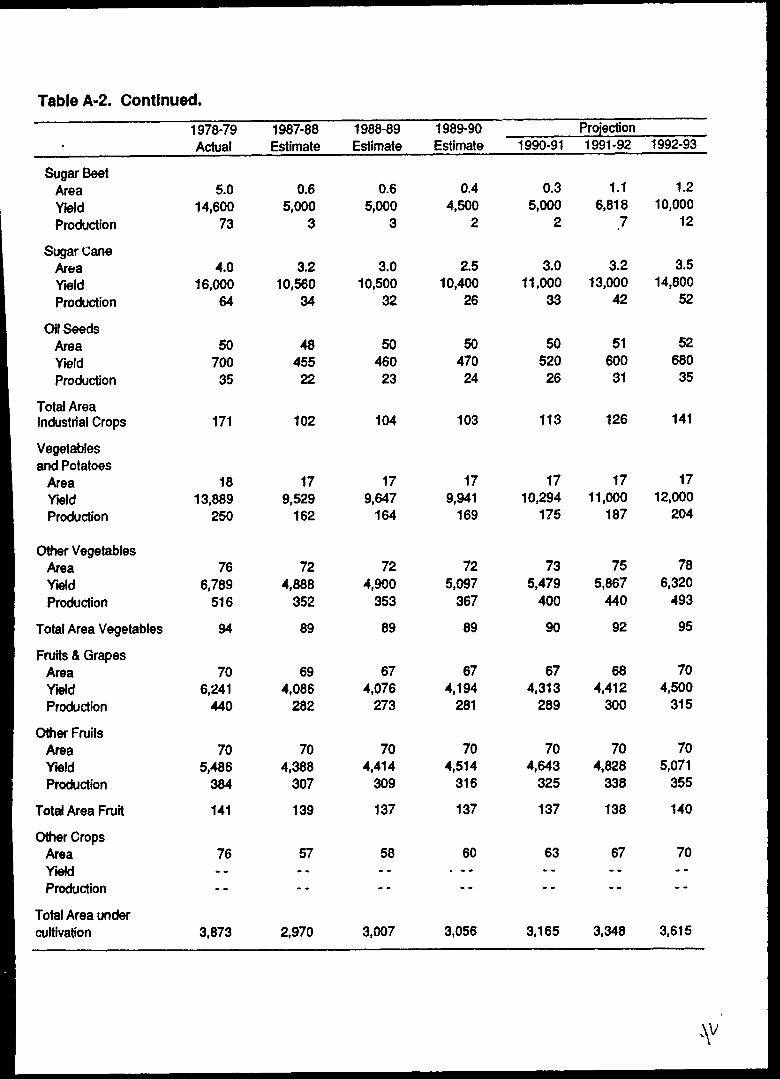
Table A-2. Continued.
Sugar BeetAreaYieldProduction
Sugar CaneAreaYieldProduction
Oil SeedsAreaYieldProduction
Total AreaIndustrial Crops
Vegetablesand Potatoes
AreaYieldProduction
Other VegetablesAreaYieldProduction
Total Area Vegetables
Fruits & GrapesAreaYieldProduction
Other FruitsAreaYieldProduction
Total Area Fruit
Other CropsAreaYieldProduction
Total Area undercultivation
1978-79Actual
5.014,600
73
4.016,000
64
5070035
171
1813,889
250
766,789
516
94
706,241
440
705,486
384
141
76----
3,873
1987-88Estimate
0.65,000
3
3.210,560
34
4845522
102
179,529
162
724,888
352
89
694,086
282
704,388
307
139
57----
2,970
1988-89Estimate
0.65,000
3
3.010,500
32
5046023
104
179,647
164
724,900
353
89
674,076
273
704,414
309
137
58----
3,007
1989-90Estimate
0.44,500
2
2.510,400
26
50470
24
103
179,941
169
725,097
367
89
674,194
281
704,514
316
137
60. ..
--
3,056
1990-91
0.35,000
2
3.011,000
33
5052026
113
1710,294
175
735,479
400
90
674,313
289
704,643
325
137
63--
3,165
Projection1991-92
1.16,818
7
3.213,000
42
5160031
126
1711,000
187
755,867
440
92
684,412
300
704,828
338
138
67----
3,348
1992-93
1.210,000
12
3.514,800
52
52680
35
141
1712,000
204
786,320
493
95
704,500
315
705,071
355
140
70----
3,615
V
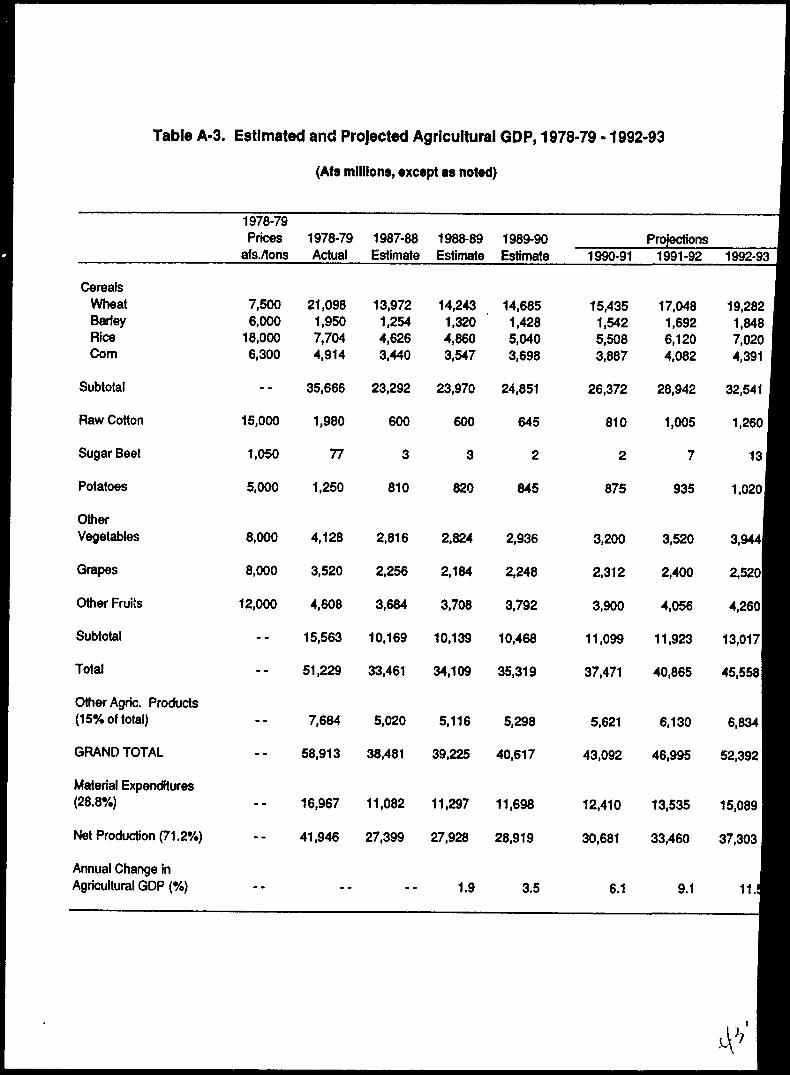
Table A-3. Estimated and Projected Agricultural GDP, 1978-79 -1992-93
(Afs millions, except as noted)
CerealsWheatBarleyRiceCom
Subtotal
Raw Cotton
Sugar Beet
Potatoes
OtherVegetables
Grapes
Other FruiSs
Subtotal
Total
1978-79Prices
afs./tons
7,5006,000
18,0006,300
--
15,000
1,050
5,000
8,000
8,000
12,000
--
--
1978-79Actual
21,0981,9507,7044,914
35,666
1,980
77
1,250
4,128
3,520
4,608
15,563
51,229
1987-88Estimate
13,9721,2544,6263,440
23,292
600
3
810
2,816
2,256
3,684
10,169
33,461
1988-89Estimate
14,2431,3204,8603,547
23,970
600
3
820
2,824
2,184
3,708
10,139
34,109
1989-90Estimate
14,6851,4285,0403,698
24,851
645
2
845
2,936
2,248
3,792
10,468
35,319
1990-91
15,4351,5425,5083,887
26,372
810
2
875
3,200
2,312
3,900
11,099
37,471
Projections1991-92
17,0481,6926,1204,082
28,942
1,005
7
935
3,520
2,400
4,056
11,923
40,865
11992-93 •
19,282 11,848 •7,020 •4,391 •
32,541 H
1,26oH
13|
1,02oH
3.944H
2,520^1
4,260^1
13,017̂ 1
45,558^1
Other Agric. Products(15% of total)
GRAND TOTAL
Material Expenditures(28.8%)
Net Production (71.2%)
Annual Change inAgricultural GDP (%)
7,684 5,020 5,116 5,298
58,913 38,481 39,225 40,617
16,967 11,082 11,297 11,698
41,946 27,399 27,928 28,919
5,621 6,130 6,834
43,092 46,995 52,392
12,410 13,535 15,089
30,681 33,460 37,303
1.9 3.5 6.1 9.1 11.3
4''
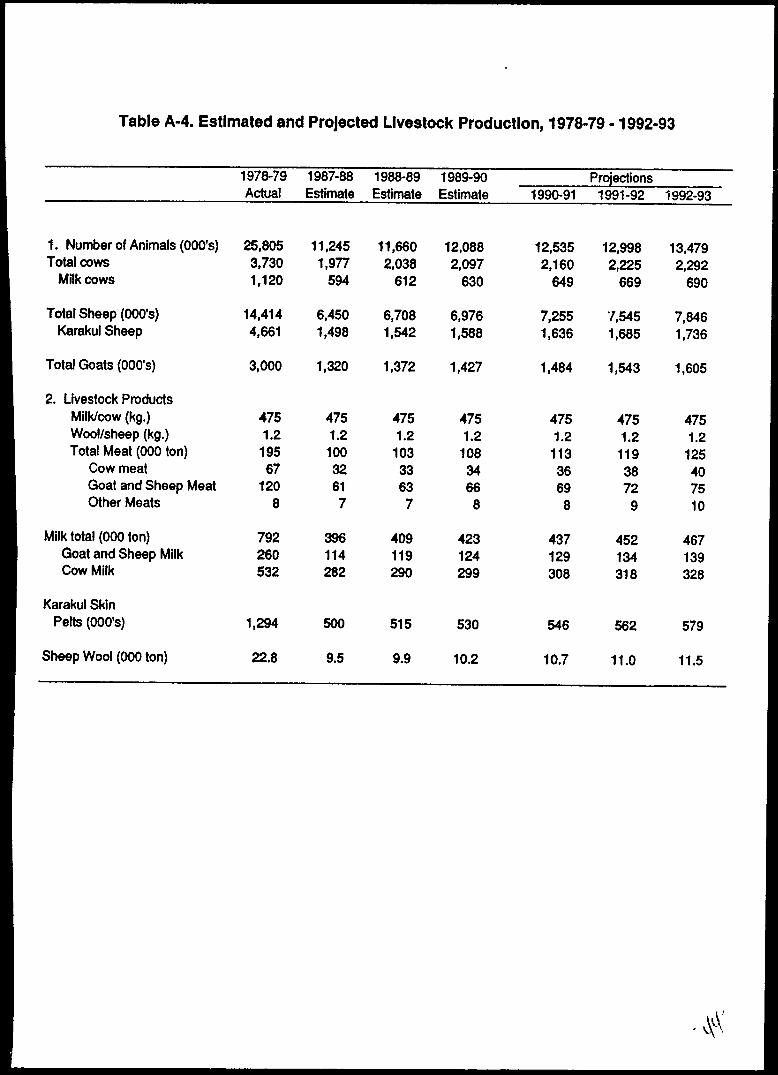
Table A-4. Estimated and Projected Livestock Production, 1978-79 -1992-93
1 . Number of Animals (OOO's)Total cows
Milk cows
Total Sheep (OOO's)Karakul Sheep
Total Goats (OOO's)
2. Livestock ProductsMilk/cow (kg.)Wool/sheep (kg.)Total Meat (000 ton)
Cow meatGoat and Sheep MeatOther Meats
Milk total (000 ton)Goat and Sheep MilkCow Milk
Karakul SkinPelts (OOO's)
1978-79Actual
25,8053,7301,120
14,4144,661
3,000
4751.219567
1208
792260532
1,294
1987-88Estimate
11,2451,977
594
6,4501,498
1,320
4751.210032617
396114282
500
1988-89Estimate
11,6602,038
612
6,7081,542
1,372
4751.210333637
409119290
515
1989-90Estimate
12,0882,097
630
6,9761,588
1,427
4751.210834668
423124299
530
1990-91
12,5352,160
649
7,2551,636
1,484
4751.211336698
437129308
546
Projections1991-92
12,9982,225
669
7,5451,685
1,543
4751.211938729
452134318
562
1992-93
13,4792,292
690
7,8461,736
1,605
4751.2125407510
467139328
579
Sheep Wool (000 ton) 22.8 9.5 9.9 10.2 10.7 11.0 11.5
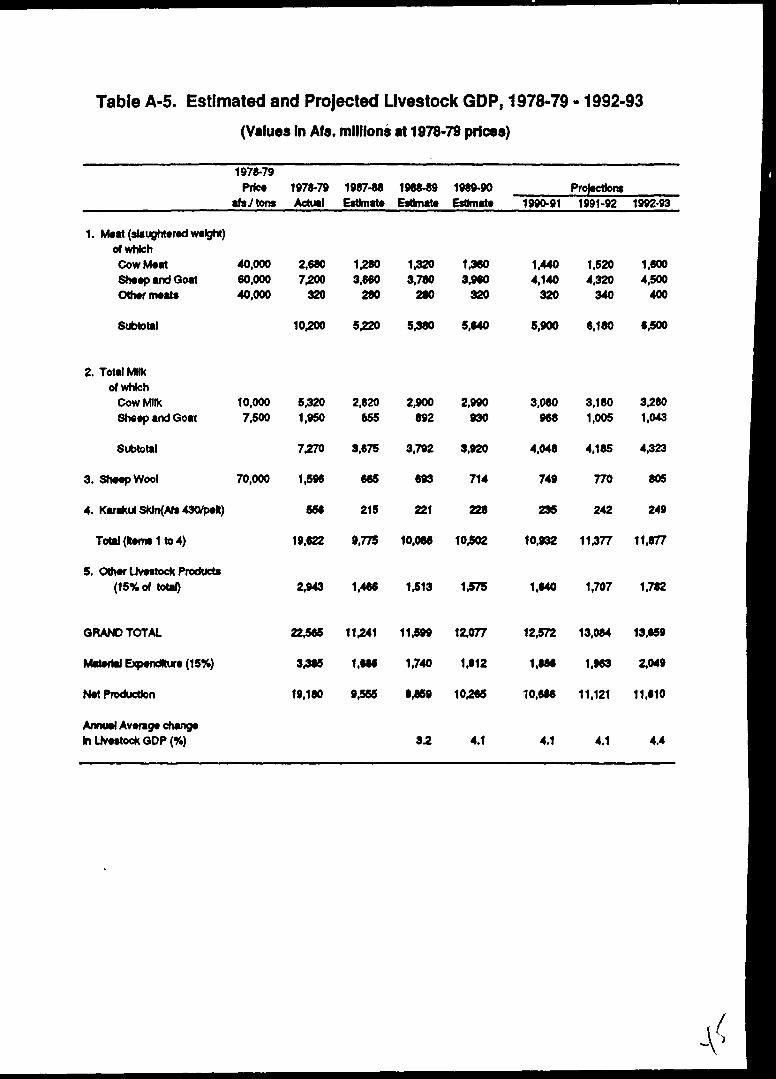
Table A-5. Estimated and Projected Livestock GDP, 1978-79 -1992-93
(Values In Afs. millions at 1978-79 prices)
1978-79Price
afsJtons
1. Meat (slaughtered wefcbt)ofwhtehCow Meat 40,000Sheep and Goat 60,000Other meat* 40,000
Subtotal
2. Total MHkof which
Cow Milk 10,000Sheep and Goat 7,500
Subtotal
3. Sheep Wool 70,000
4. Karakul SWn(Afs 430/pelt)
Total (Items 1 to 4)
5. Olrw Livestock Products(15% of total)
GRAND TOTAL
Maieftal ExMndftire f15S>
Ntt PfOOUCwOn
1978-79Actual
2,6807,200
320
10,200
5,3201,950
7.270
1,59«
556
19,622
2,943
22,5«6
3,385
19,180
1987-88Estimate
1,2803,660
280
5,220
2,820855
3.675
665
215
9,775
1,466
11,241
1.686
9,555
1988-89Estimate
1,3203,780
280
5,380
2,900892
3,792
693
221
10,066
1,513
11,599
1.740
9,869
1989-90Estimate
1,3603.960
320
5,640
2,990930
3.920
714
228
10,502
1,575
12,077
1,612
10,265
1990-91
1,4404,140
320
5,900
3,080968
4,048
749
235
10,932
1,640
12,572
1,886
10,686
Projections1991-92
1,5204420
340
6,180
3,1801.005
4,185
770
242
11477
1,707
13,084
1,963
11,121
1992-93
1,6004,500
400
6,500
3.2801,043
4,323
805
249
11.877
1,782
13,659
2,049
11.610
Annual Average changeIn Livestock GOP (%) 4.1 4.1 4.1 4.4
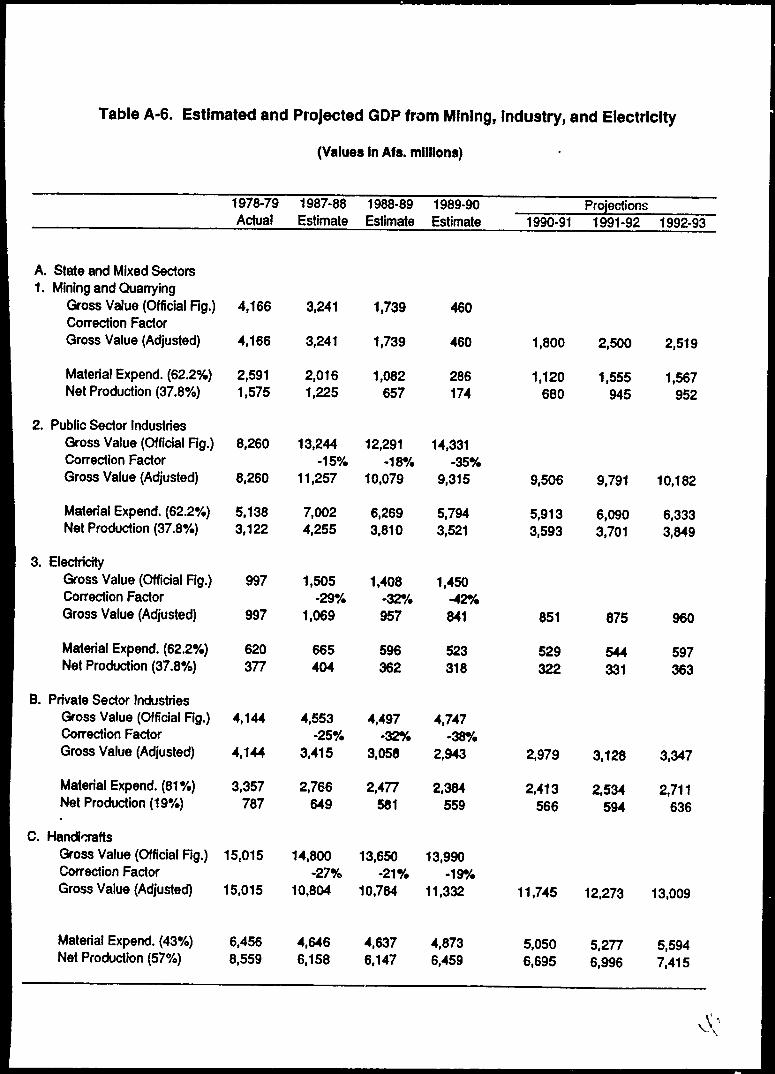
Table A-6. Estimated and Projected GDP from Mining, Industry, and Electricity
(Values In Afs. millions)
A. State and Mixed Sectors1. Mining and Quarrying
Gross Value (Official Rg.)Correction FactorQross Value (Adjusted)
Material Expend. (62.2%)Net Production (37.8%)
2. Public Sector IndustriesGross Value (Official Rg.)Correction FactorGross Value (Adjusted)
Material Expend. (62.2%)Net Production (37.8%)
3. ElectricityGross Value (Official Rg.)Correction FactorGross Value (Adjusted)
Material Expend. (62.2%)Net Production (37.8%)
B. Private Sector IndustriesGross Value (Official Rg.)Correction FactorGross Value (Adjusted)
Material Expend. (81%)Net Production (19%)
C. HandicraftsGross Value (Official Rg.)Correction FactorGross Value (Adjusted)
Material Expend. (43%)Net Production (57%)
1978-79Actual
4,166
4,166
2,5911,575
8,260
8,260
5,1383,122
997
997
620377
4,144
4,144
3,357787
15,015
15,015
6,4568,559
1987-88Estimate
3,241
3,241
2,0161,225
13,244-15%
11,257
7,0024,255
1,505-29%
1,069
665404
4,553-25%
3,415
2,766649
14,800-27%
10,804
4,6466,158
1988-89Estimate
1,739
1,739
1,082657
12,291-18%
10,079
6,2693,810
1,408-32%957
596362
4,497-32%
3,058
2,477581
13,650-21%
10,784
4,6376,147
1989-90Estimate
460
460
286174
14,331-35%
9,315
5,7943,521
1,450-42%841
523318
4,747-38%
2,943
2,384559
13,990-19%
11,332
4,8736,459
Projections1990-91
1,800
1,120680
9,506
5,9133,593
851
529322
2,979
2,413566
11,745
5,0506,695
1991-92
2,500
1,555945
9,791
6,0903,701
875
544331
3,128
2,534594
12,273
5,2776,996
1992-93
2,519
1,567952
10,182
6,3333,849
960
597363
3,347
2,711636
13,009
5,5947,415
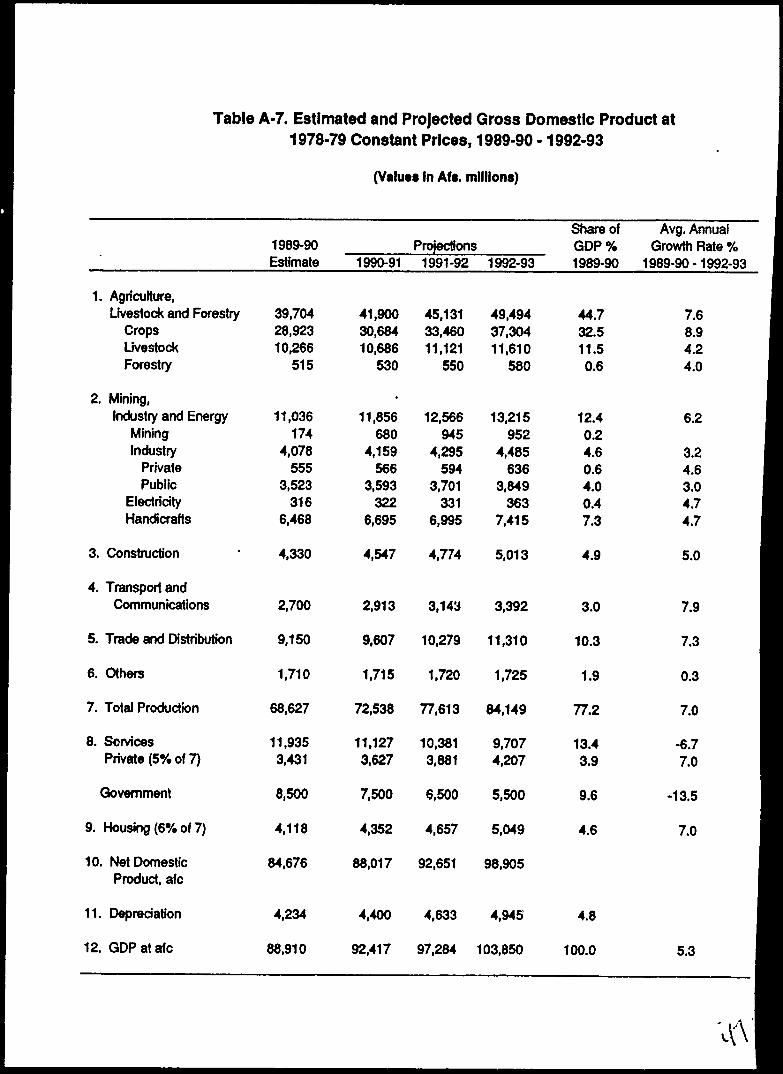
Table A-7. Estimated and Projected Gross Domestic Product at1978-79 Constant Prices, 1989-90 -1992-93
(Value* In Aft. millions)
1. Agriculture,Livestock and Forestry
CropsLivestockForestry
2. Mining,Industry and Energy
MiningIndustry
PrivatePublic
ElectricityHandicrafts
3. Construction
4. Transport andCommunications
5. Trade and Distribution
6. Others
7. Total Production
8. ServicesPrivate (5% of 7)
Government
9. Housing (6% of 7)
10. Net DomesticProduct, afc
11. Depreciation
12. GDP at afc
1989-90Estimate
39,70428,92310,266
515
11,036174
4,078555
3,523316
6,468
4,330
2,700
9,150
1,710
68,627
11,9353,431
8,500
4,118
84,676
4,234
88,910
Projections1990-91
41,90030,68410,686
530
•
11,856680
4,159566
3,593322
6,695
4,547
2,913
9,607
1,715
72,538
11,1273,627
7,500
4,352
88,017
4,400
92,417
1991-92
45,13133,46011,121
550
12,566945
4,295594
3,701331
6,995
4,774
3,143
10,279
1,720
77,613
10,3813,881
6,500
4,657
92,651
4,633
97,284
1992-93
49,49437,30411,610
580
13,215952
4,485636
3,849363
7,415
5,013
3,392
11,310
1,725
84,149
9,7074,207
5,500
5,049
98,905
4,945
103,850
Share ofGDP %1989-90
44.732.511.50.6
12.40.24.60.64.00.47.3
4.9
3.0
10.3
1.9
77.2
13.43.9
9.6
4.6
4.8
100.0
Avg. AnnualGrowth Rate %
1989-90-1992-93
7.68.94.24.0
6.2
3.24.63.04.74.7
5.0
7.9
7.3
0.3
7.0
-6.77.0
-13.5
7.0
I
5.3
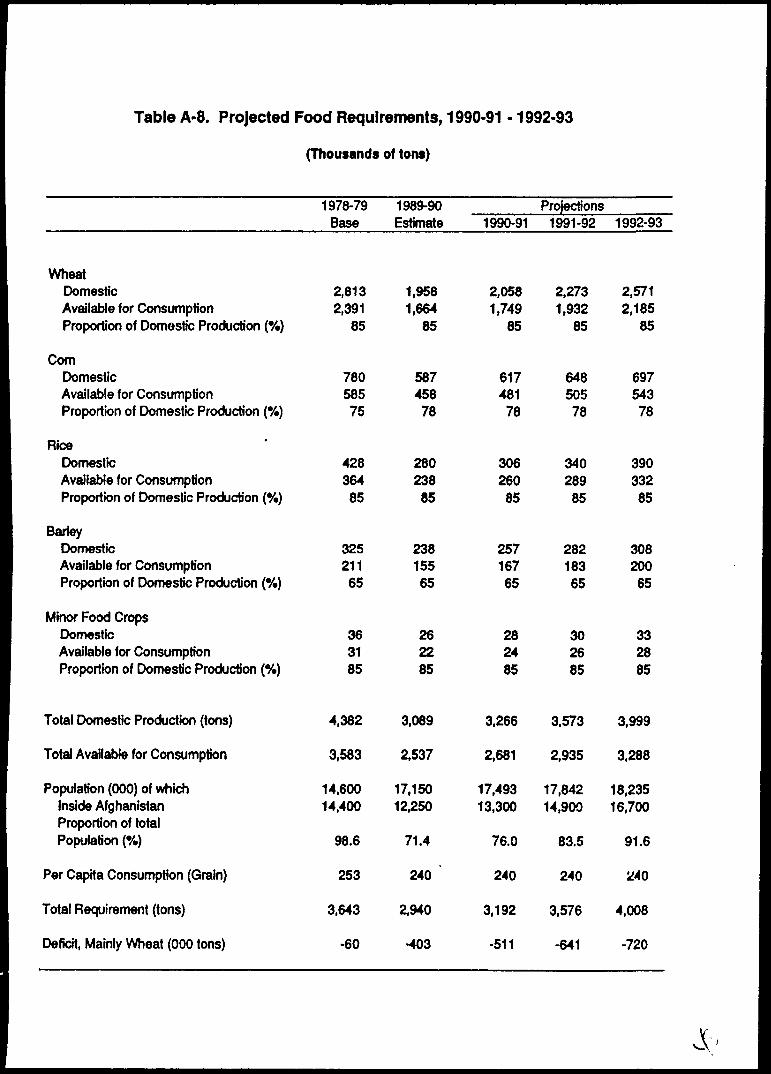
Table A-8. Projected Food Requirements, 1990-91 -1992-93
(Thousands of tons)
WheatDomesticAvailable for ConsumptionProportion of Domestic Production (%)
ComDomesticAvailable for ConsumptionProportion of Domestic Production (%)
RiceDomesticAvailable for ConsumptionProportion of Domestic Production (%)
BarieyDomesticAvailable for ConsumptionProportion of Domestic Production (%)
Minor Food CropsDomesticAvailable for ConsumptionProportion of Domestic Production (%)
Total Domestic Production (tons)
Total Available for Consumption
Population (000) of whichInside AfghanistanProportion of totalPopulation (•/.)
Per Capita Consumption (Grain)
Total Requirement (tons)
Deficit, Mainly Wheat (000 tons)
1978-79Base
2,8132,391
85
78058575
42836485
32521165
363185
4,382
3,583
14,60014,400
98.6
253
3,643
-60
1989-90Estimate
1,9581,664
85
58745878
28023885
23815565
262285
3,069
2,537
17,15012,250
71.4
240
2,940
-403
Projections1990-91
2,0581,749
85
61748178
30626085
25716765
282485
3,266
2,681
17,49313,300
76.0
240
3,192
-511
1991-92
2,2731,932
85
64850578
34028985
28218365
302685
3,573
2,935
17,84214,900
83.5
240
3,576
-641
1992-93
2,5712,185
85
69754378
39033285
30820065
332885
3,999
3,288
18,23516,700
91.6
240
4,008
-720
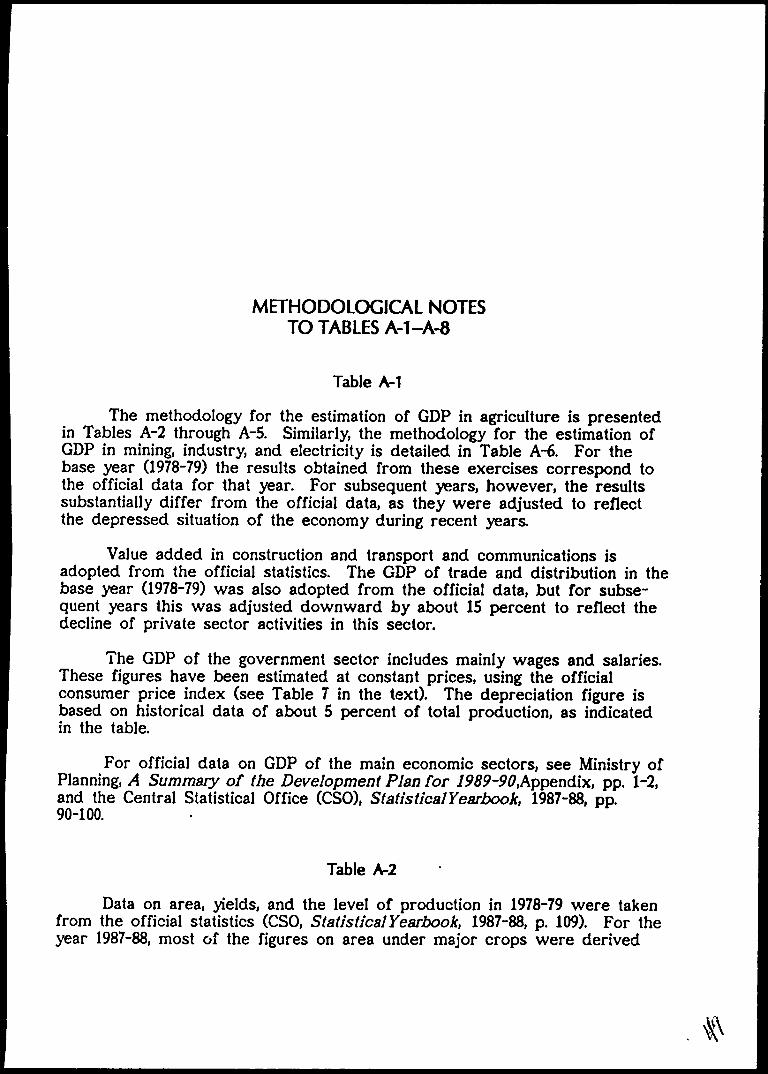
METHODOLOGICAL NOTESTO TABLES A-1-A-8
Table A-1
The methodology for the estimation of GDP in agriculture is presentedin Tables A-2 through A-5. Similarly, the methodology for the estimation ofGDP in mining, industry, and electricity is detailed in Table A-6. For thebase year (1978-79) the results obtained from these exercises correspond tothe official data for that year. For subsequent years, however, the resultssubstantially differ from the official data, as they were adjusted to reflectthe depressed situation of the economy during recent years.
Value added in construction and transport and communications isadopted from the official statistics. The GDP of trade and distribution in thebase year (1978-79) was also adopted from the official data, but for subse-quent years this was adjusted downward by about 15 percent to reflect thedecline of private sector activities in this sector.
The GDP of the government sector includes mainly wages and salaries.These figures have been estimated at constant prices, using the officialconsumer price index (see Table 7 in the text). The depreciation figure isbased on historical data of about 5 percent of total production, as indicatedin the table.
For official data on GDP of the main economic sectors, see Ministry ofPlanning, A Summary of the Development Plan for 1989-90,Appendix, pp. 1-2,and the Central Statistical Office (CSO), Statistical Yearbook, 1987-88, pp.90-100.
Table A-2
Data on area, yields, and the level of production in 1978-79 were takenfrom the official statistics (CSO, Statistical Yearbook, 1987-88, p. 109). For theyear 1987-88, most of the figures on area under major crops were derived
50
from the reports of the Agricultural Survey of Afghanistan prepared by theSCA in 1988 (Third Report, Crops and Yields, Volume 1, August 1988, p. 53).
It is widely believed that the Agricultural Survey data on crop yieldsare sketchy and biased. Thus, for the purposes of this report, we haveadjusted the level of yields in the base year to reflect the depressed level offarming during the war. It should be noted, however, that information oncotton and sugar beet production, area, and yields was obtained throughofficial sources and closely approximates the data received throughindependent local sources.
For 1988-89 and 1989-90, the data on area and yields are estimated onthe basis of recent information about the beginning of the recovery processin certain areas of the country, reported by local authorities and internationalagencies. Some relevant data in foreign trade and the level of per capitaconsumption of major crops reflected in past records were used for crosschecking purposes.
For the purposes of projections in subsequent years, the prospects andpotential of each major crop are evaluated on a yearly basis; thus, no extra-polation techniques are involved. Throughout this exercise the continuedefforts of farmers, nongovernment organizations, and international agencies forthe speedy recovery of the rural sector were taken into account.
Table A-3
To obtain the gross value of major crops, the volume of production ofeach crop, presented in Table A-2, is valued at the 1978-79 constant pricesshown in the table. These prices were also applied to the projected quanti-ties of production during the subsequent years to obtain the projected grossoutput of this subsector in real terms. The methodology for estimating valueadded in this subsector throughout the years covered by the report is shownin Table A-3. To arrive at the GDP value in agriculture, the ratio ofintermediate consumption to gross value was applied. Based on historicalrecords this ratio is estimated at 28.8 percent, as shown in the table. Forthe 1978-79 constant prices see Ministry of Planning, the Socio-EconomicDevelopment Plan for 1985-86, pp. 101-19.
Table A-4
Data on the size of stock in 1978-79 is given. The number of animalsin 1987-88 was estimated from the SCA, Agricultural Survey of Afghanistan(First Report, May 1988, p. 19). From 1989-90 to 1992-93 the size of stock isprojected at assumed rates using the assumptions with respect to fertility andmortality rates as well as off-takes. Throughout this exercise, the possible
51
recovery of the livestock subsector was taken into account. The productioncoefficients for milk, wool, and meat are based on historical records reportedin the official publications (CSO, Statistical Yearbook, 1987-88, p. 115 andMinistry of Planning, Socio-Economic Development Plan for 1986-87, pp.101-10). For the official data on the size of stock in the base year see CSO,Statistical Yearbook, 1985-86, p. 110.
Table A-5
The 1978-79 constant prices for major livestock products are publishedin a recent Ministry of Planning document (Socio-Economic Development Planfor 1986-87, pp. 101-19). These prices were applied to the productionvolumes presented in Table A-4 to derive the gross value of livestockproduction. Estimation of the livestock GDP was carried out on the basis ofthe methodology shown in Table A-5. The ratios of intermediate consump-tions to gross production reflected in the historical accounts were used toobtain the value added figures. For official data on livestock production in1978-79 see CSO, Statistical Yearbook, 1987-88, p. 115.
Table A-6
Data on gross value of mining, industry, electricity, and handicrafts areadopted from the official sources. To eliminate the obvious biases in theofficial data, some correction factors were adopted. These factors weredeveloped on the basis of careful analysis of each activity in the relatingsubsectors. Projections of the value added (net production) take into accountthe impact on outputs of anticipated rehabilitation programs and/orimprovement in the level of operational efficiency.
Moreover, it is assumed that some of the constraints, such as lack oftransport and inadequate power supply, would be somewhat removed.Projections also account for the probable impact of increases in theagricultural output on the use of capacities in the modern and traditionalindustries.
Projections of the mineral products are to some extent based on thelevel of output in the base year and follow from past trends. Electricityoutput is projected in line with the possible improvement in the distributionsystem, as well as repair of existing facilities. Projections of the GDP of thetraditional industries are based on the assumptions of population growth rate,increased agricultural production, and the return and resettlement of Afghanrefugees in rural and urban areas.
To obtain the value added of each subsector, the value of intermediatecosts is deducted from the gross value of each subsector. For this purpose
52
the ratios of intermediate consumptions to gross output as reflected in thehistorical records of the planning ministry were used, and the absolute valuesof intermediate consumptions were deducted from the gross values. Fordata on gross value of mining, industry, electricity, and handicrafts, see thefollowing sources: Ministry of Planning, a Summary of Socio-EconomicDevelopment Plan for 1989-90, Appendix, pp. 1-10; Ministry of Planning, Socio-Economic Situation and Programs for the 1990s, July 1989, p. 9; CSO,Statistical Yearbook, 1987-88, pp. 138-52.
Table A-7
Projections of GDP in agriculture and livestock are based on data andmethodology presented in Tables A-2 through A-5 and their related notes.Similarly, projections of GDP of mining, industry, electricity, and handicraftsare based on data shown in Table A-6 and their related notes.
For the projections of construction sector output, an assumed rate ofgrowth has been considered. Projections take into account possible develop-ments in private sector activities, return of refugees, and implementation ofreconstruction programs in both the public and private sectors.
The projections of GDP of transport and communications are based onthe assumption that in the future the output of these sectors should riseenough to cope with the needs of the productive sectors and foreign tradeflows.
Projections of GDP in trade and distribution follow from recentdevelopments and are based on assumptions concerning the projected levelsof marketable domestic production and prospects of commercial imports.
Projections of GDP of the government sector assume a steady declinein real terms. This is consistent with assumed policy measures to restraingovernment consumption and improve fiscal balances. Projections of GDP ofother services sectors are based on ad hoc measures and indirect methodsindicated in the table. Depreciation is projected at 5 percent of net domesticproduction in line with past trends.
Table A-0
Data on domestic production is adjusted for seed requirements andwastage in storage and transportation to obtain the volumes available forconsumption. The adjustment coefficients for each major food crop areshown in the table.
53
It is assumed that, by the end of 1992-93, about 92 percent of totalpopulation will reside inside the country and an estimated 15 million refugeeswill continue to stay abroad.
Data on domestic food production are taken from Table A-2.
The population figures are adopted from Table 1 in the textPopulation is assumed to grow at an average rate of 2 percent annually.
The total requirement is estimated on the basis of needs of totalpopulation inside the country including the returning refugees. Per capitaconsumption of grains is in line with the historical data used by the Ministryof Planning and some international agencies.
Appendix B
MEMORANDA
Introduction
Services were provided to 0/AID/Rep in Pakistan from November 3,1989 through February 18, 1990. The objective of the assignment was toprovide 0/AID/Rep with the services of an expert with special knowledge ofthe economy of Afghanistan and distinctive insights into requirements forresettlement and rehabilitation of the country. The services consisted of oralcounsel to 0/AID/Rep and written memoranda.
Four memoranda on economic issues were submitted to Mr. LarryCrandall, Mission Director, and are reproduced in this appendix.
Utilizing Professional Skills
Swedish Committee Farm Power Report
Decision to Establish an Enterprise
Commercial Phase of PL-480 Wheat Supply
November 13, 1989
December 17, 1989
January 7, 1990
February 1, 1990
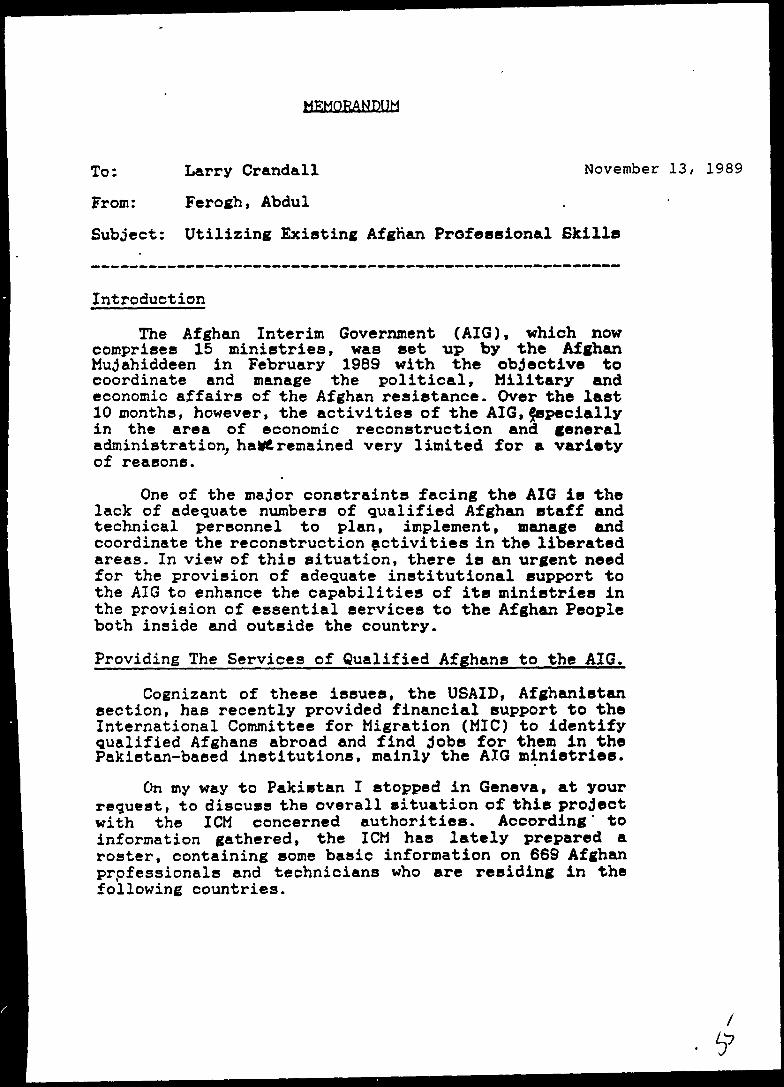
MEMORANDUM
To: Larry Crandall
From: Ferogh, Abdul
Subject: Utilizing Existing Afghan Professional Skills
November 13/ 1989
Introduction
The Afghan Interim Government (AIG), which nowcomprises 15 ministries, was set up by the AfghanMujahiddeen in February 1989 with the objective tocoordinate and manage the political, Military andeconomic affairs of the Afghan resistance. Over the last10 months, however, the activities of the AIG,^speciallyin the area of economic reconstruction and generaladministration, ha¥£remained very limited for a varietyof reasons.
One of the major constraints facing the AIG is thelack of adequate numbers of qualified Afghan staff andtechnical personnel to plan, implement, manage andcoordinate the reconstruction activities in the liberatedareas. In view of this situation, there is an urgent needfor the provision of adequate institutional support tothe AIG to enhance the capabilities of its ministries inthe provision of essential services to the Afghan Peopleboth inside and outside the country.
Providing The Services of Qualified Afghans to the AIG.
Cognizant of these issues, the USAID, Afghanistansection, has recently provided financial support to theInternational Committee for Migration (MIC) to identifyqualified Afghans abroad and find Jobs for them in thePakistan-based institutions, mainly the AIG ministries.
On my way to Pakistan I stopped in Geneva, at yourrequest, to discuss the overall situation of this projectwith the ICM concerned authorities. According' toinformation gathered, the ICM has lately prepared aroster, containing some basic information on 669 Afghanprpfessionals and technicians who are residing in thefollowing countries.
/
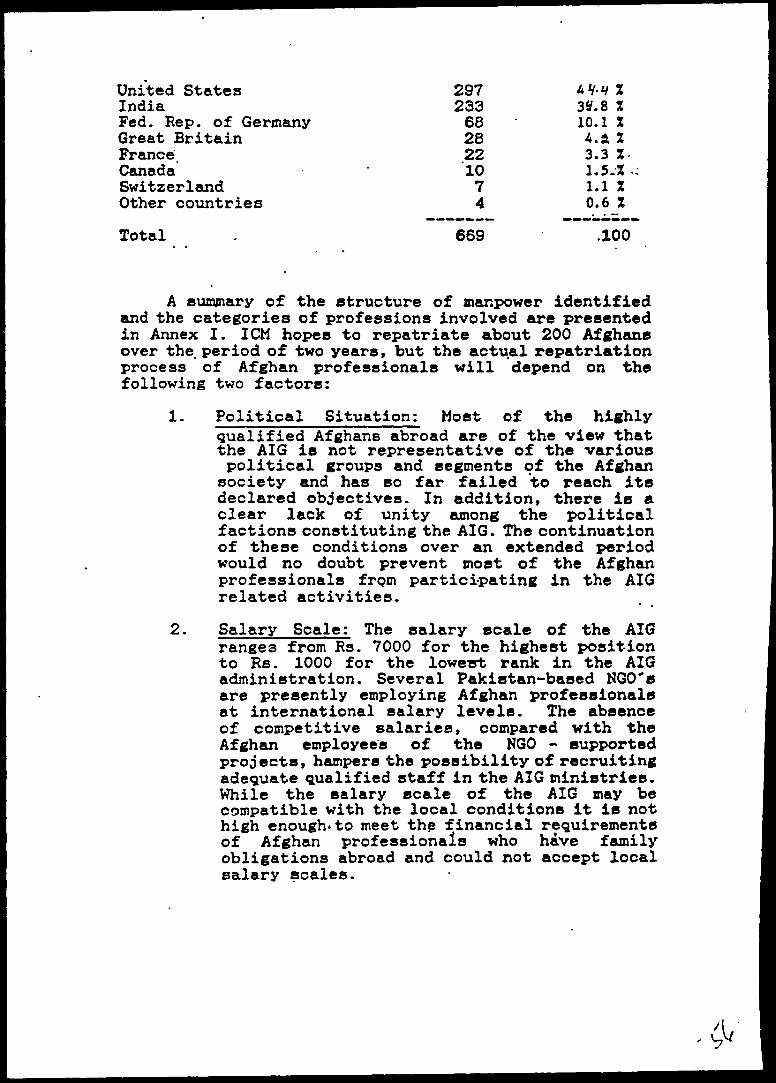
United StatesIndiaFed. Rep. of GermanyGreat BritainFranceCanadaSwitzerlandOther countries
Total
2972336828221074
669
30.8 %10.1 24.1 I3.3 2-1.5.2 •1.1 20.6 Z
.100
A summary of the structure of manpower identifiedand the categories of professions involved are presentedin Annex 1. I CM hopes to repatriate about 200 Afghansover the. period of two years, but the actual repatriationprocess of Afghan professionals will depend on thefollowing two factors:
1. Political Situation: Most of the highlyqualified Afghans abroad are of the view thatthe AIG is not representative of the variouspolitical groups and segments of the Afghansociety and has so far failed to reach itsdeclared objectives. In addition, there is aclear lack of unity among the politicalfactions constituting the AIG. The continuationof these conditions over an extended periodwould no doubt prevent most of the Afghanprofessionals frpm participating in the AIGrelated activities.
2. Salary Scale: The salary scale of the AIGranges from Rs. 7000 for the highest positionto Rs. 1000 for the lowest rank in the AIGadministration. Several Pakistan-based NGO'eare presently employing Afghan professionalsat international salary levels. The absenceof competitive salaries, compared with theAfghan employees of the NGO - supportedprojects, hampers the possibility of recruitingadequate qualified staff in the AIG ministries.While the salary scale of the AIG may becompatible with the local conditions it is nothigh enough, to meet the financial requirementsof Afghan professionals who have familyobligations abroad and could not accept localsalary scales.
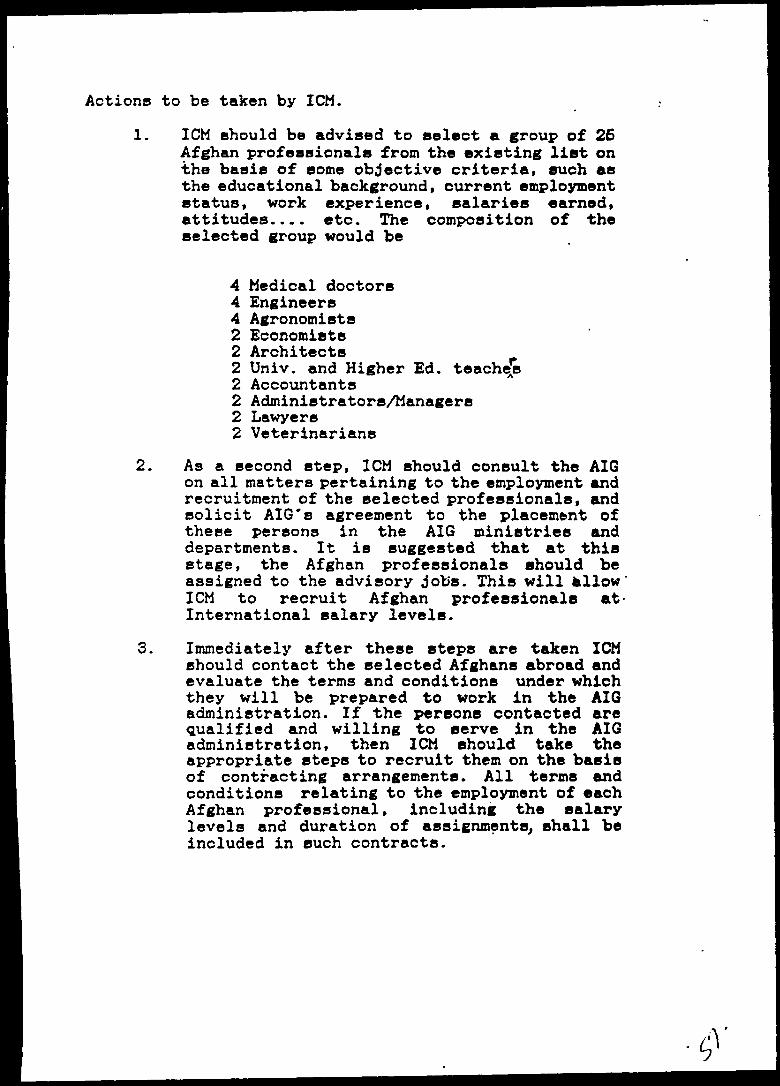
Actions to be taken by ICM.
1. ICM should be advised to select a group of 26Afghan professionals from the existing list onthe basis of some objective criteria, such asthe educational background, current employmentstatus, work experience, salaries earned,attitudes.... etc. The composition of theselected group would be
4 Medical doctors4 Engineers4 Agronomists2 Economists2 Architects2 Univ. and Higher Ed. teachers2 Accountants2 Administrators/Managers2 Lawyers2 Veterinarians
2. As a second step, ICM should consult the AIGon all matters pertaining to the employment andrecruitment of the selected professionals, andsolicit AIG*s agreement to the placement ofthese persons in the AIG ministries anddepartments. It is suggested that at thisstage, the Afghan professionals should beassigned to the advisory jobs. This will allow*ICM to recruit Afghan professionals at-International salary levels.
3. Immediately after these steps are taken ICMshould contact the selected Afghans abroad andevaluate the terms and conditions under whichthey will be prepared to work in the AIGadministration. If the persons contacted arequalified and willing to serve in the AIGadministration, then ICM should take theappropriate steps to recruit them on the basisof contracting arrangements. All terms andconditions relating to the employment of eachAfghan professional, including the salarylevels and duration of assignments, shall beincluded in cuch contracts.
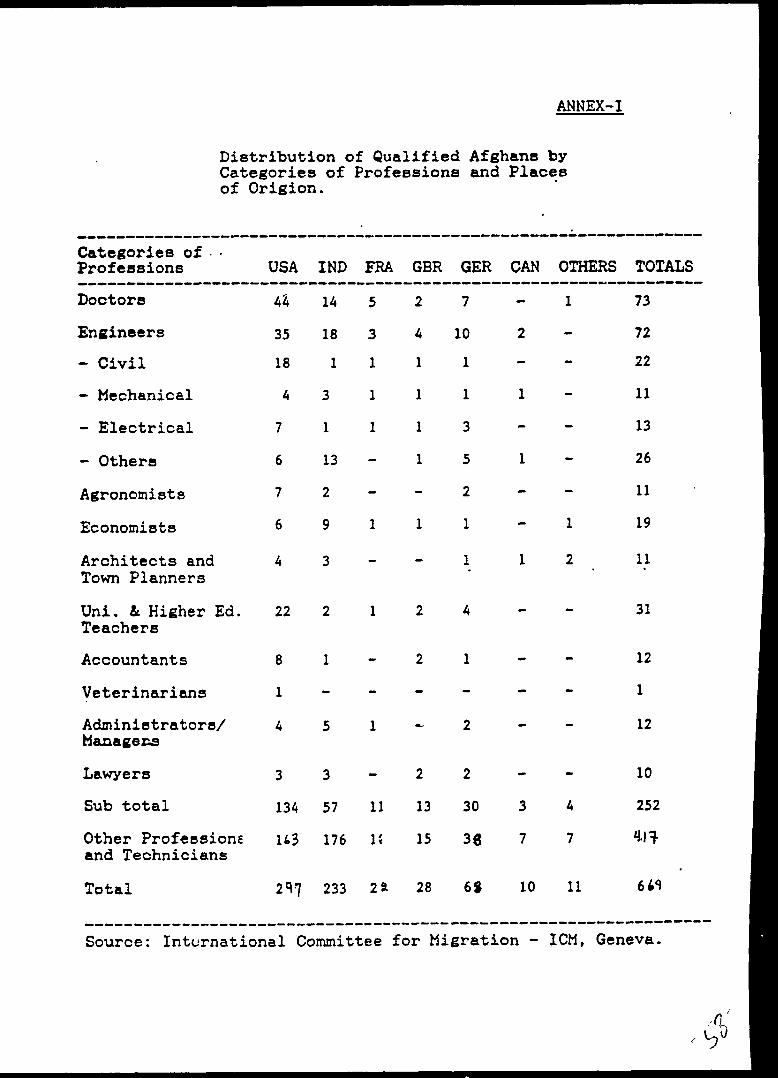
ANNEX-I
Distribution of Qualified Afghans byCategories of Professions and Placesof Origion.
Categories of • •Professions
Doctors
Engineers
- Civil
- Mechanical
- Electrical
- Others
Agronomists
Economists
Architects andTown Planners
Uni. & Higher Ed.Teachers
Accountants
Veterinarians
Administrators/Managers
Lawyers
Sub total
Other Professionsand Technicians
Total
USA
44
35
18
A
7
6
7
6
A
22
8
1
A
3
13A
143
2^7
IND
1A
18
1
3
1
13
2
9
3
2
1
-
5
3
57
176
233
FRA GBR
5 2
3 A
1 1
1 1
1 1
1
-
1 1
-
1 2
2
-
1
2
11 13
15 15
2 a 28
GER CAN
7
10 2
1
1 1
3
5 1
2
1
1 1
4
1
-
2
2
30 3
36 7
68 10
Source: International Committee for Migration -
OTHERS TOTALS
1 73
72
22
11
13
26
11
1 19
2 11
31
12
1
12
10
4 252
7 1\1
11 6̂
I CM, Geneva.
.4-y
Financing Arrangements:
The total cost of expatriating 25 qualified Afghansis estimated at US$ 1,000,000 for a period of one year;detailed cost estimates will be prepared by the I CM whenand as appropriate. A number of donors such as the USAID,Federal Republic of Germany, Japan, and Saudi Arabia maybe interested in financing this project. These sourcesshould be consulted once detailed cost estimates areprepttfgd And name of the preliminary steps havepositively been taken.
November 12, 1989
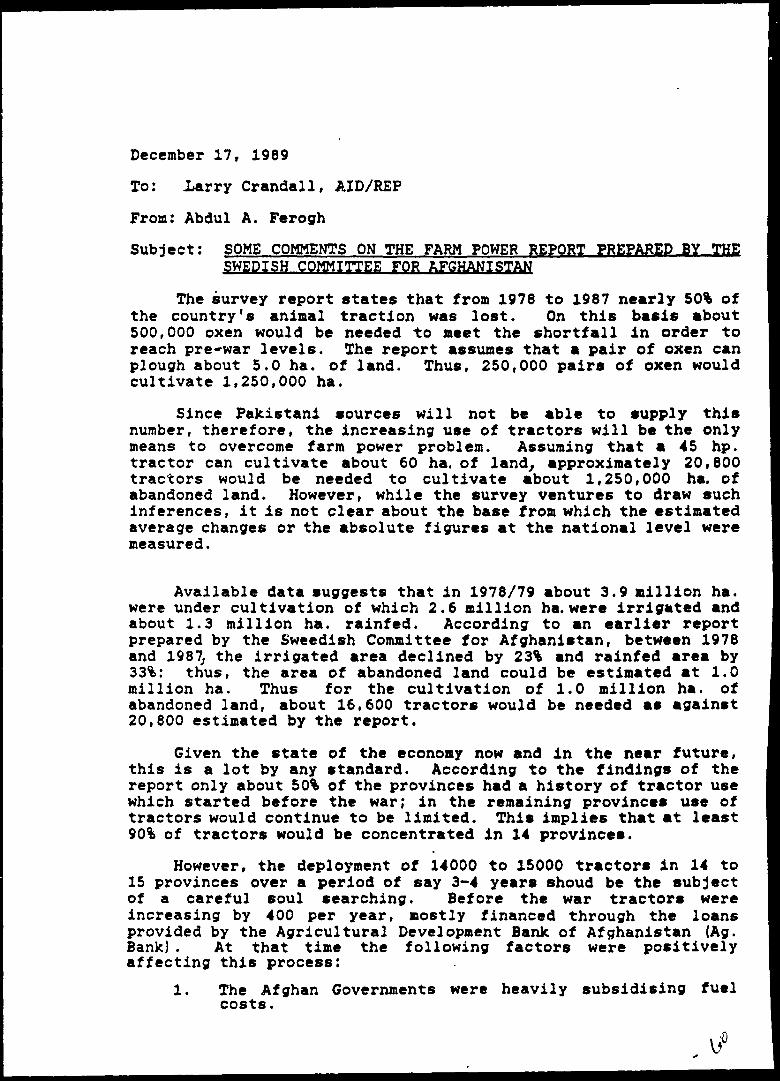
December 17, 1989
To: Xarry Crandall, AID/REP
From: Abdul A. Ferogh
Subject: SOME COMMENTS ON THE FARM POWER REPORT PREPARED BY THESWEDISH COMMITTEE FOR AFGHANISTAN
The survey report states that from 1978 to 1987 nearly 50% ofthe country's animal traction was lost. On this basis about500,000 oxen would be needed to meet the shortfall in order toreach pre-war levels. The report assumes that a pair of oxen canplough about 5.0 ha. of land. Thus, 250,000 pairs of oxen wouldcultivate 1,250,000 ha.
Since Pakistani sources will not be able to supply thisnumber, therefore, the increasing use of tractors will be the onlymeans to overcome farm power problem. Assuming that a 45 hp.tractor can cultivate about 60 ha. of land, approximately 20,800tractors would be needed to cultivate about 1,250,000 ha. ofabandoned land. However, while the survey ventures to draw suchinferences, it is not clear about the base from which the estimatedaverage changes or the absolute figures at the national level weremeasured.
Available data suggests that in 1978/79 about 3.9 million ha.were under cultivation of which 2.6 million ha. were irrigated andabout 1.3 million ha. rainfed. According to an earlier reportprepared by the Sweedish Committee for Afghanistan, between 1978and 1987, the irrigated area declined by 23% and rainfed area by33%: thus, the area of abandoned land could be estimated at 1.0million ha. Thus for the cultivation of 1.0 million ha. ofabandoned land, about 16,600 tractors would be needed as against20,800 estimated by the report.
Given the state of the economy now and in the near future,this is a lot by any standard. According to the findings of thereport only about 50% of the provinces had a history of tractor usewhich started before the war; in the remaining provinces use oftractors would continue to be limited. This implies that at least90% of tractors would be concentrated in 14 provinces.
However, the deployment of 14000 to 15000 tractors in 14 to15 provinces over a period of say 3-4 years shoud be the subjectof a careful soul searching. Before the war tractors wereincreasing by 400 per year, mostly financed through the loansprovided by the Agricultural Development Bank of Afghanistan (Ag.Bank). At that time the following factors were positivelyaffecting this process:
1. The Afghan Governments were heavily subsidising fuelcosts.
\f
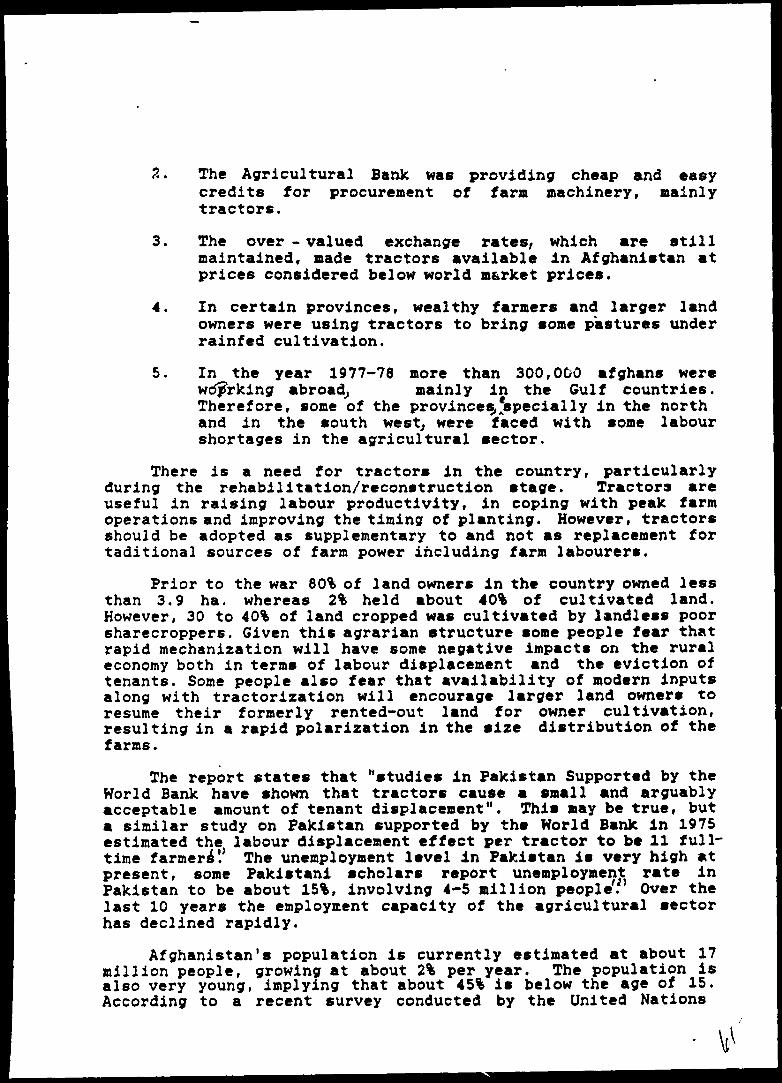
2. The Agricultural Bank was providing cheap and easycredits for procurement of farm machinery, mainlytractors.
3. The over - valued exchange rates/ which are stillmaintained, made tractors available in Afghanistan atprices considered below world market prices.
4. In certain provinces, wealthy farmers and larger landowners were using tractors to bring some pastures underrainfed cultivation.
5. In the year 1977-78 more than 300,000 afghans wereworking abroad, mainly in the Gulf countries.Therefore, some of the provinces,'specially in the northand in the south west, were faced with some labourshortages in the agricultural sector.
There is a need for tractors in the country, particularlyduring the rehabilitation/reconstruction stage. Tractors areuseful in raising labour productivity, in coping with peak farmoperations and improving the timing of planting. However, tractorsshould be adopted as supplementary to and not as replacement fortaditional sources of farm power including farm labourers.
Prior to the war 80% of land owners in the country owned lessthan 3.9 ha. whereas 2% held about 40% of cultivated land.However, 30 to 40% of land cropped was cultivated by landless poorsharecroppers. Given this agrarian structure some people fear thatrapid mechanization will have some negative impacts on the ruraleconomy both in terms of labour displacement and the eviction oftenants. Some people also fear that availability of modern inputsalong with tractorization will encourage larger land owners toresume their formerly rented-out land for owner cultivation,resulting in a rapid polarization in the size distribution of thefarms.
The report states that "studies in Pakistan Supported by theWorld Bank have shown that tractors cause a small and arguablyacceptable amount of tenant displacement". This »ay be true, buta similar study on Pakistan supported by the World Bank in 1975estimated the labour displacement effect per tractor to be 11 full-time farmers'!' The unemployment level in Pakistan is very high atpresent, some Pakistani scholars report unemployment rate inPakistan to be about 15%, involving 4-5 million people. Over thelast 10 years the employment capacity of the agricultural sectorhas declined rapidly.
Afghanistan's population is currently estimated at about 17million people, growing at about 2% per year. The population isalso very young, implying that about 45% is below the age of 15.According to a recent survey conducted by the United Nations
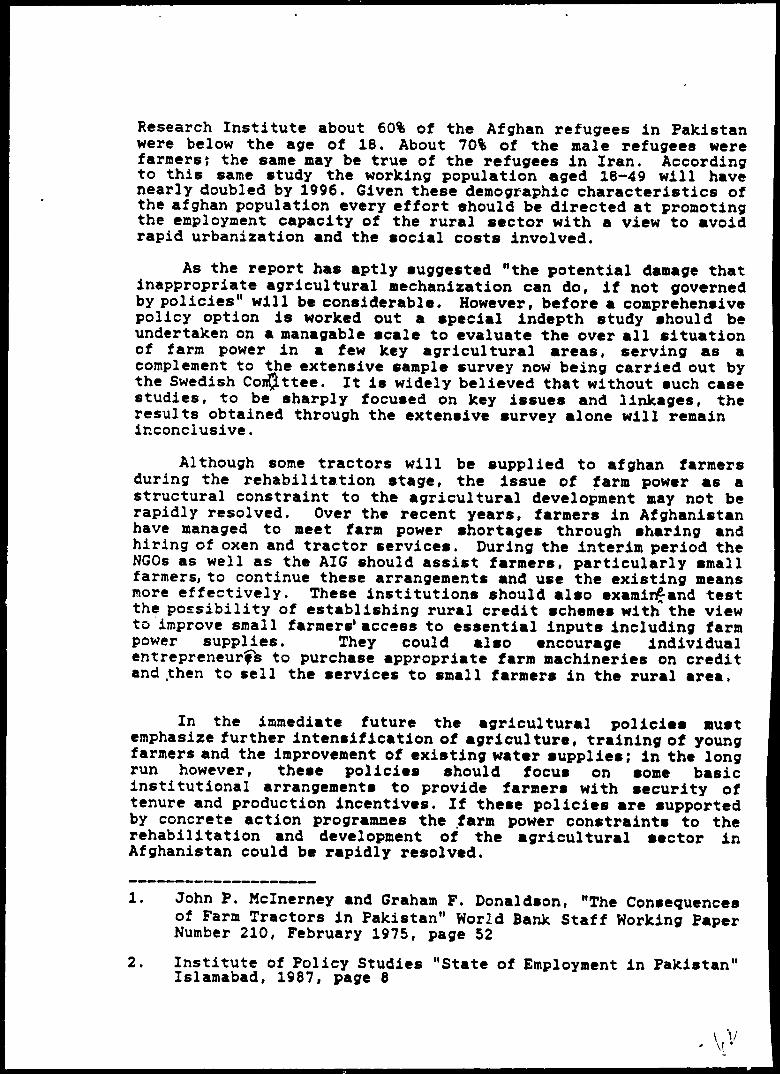
Research Institute about 60% of the Afghan refugees in Pakistanwere below the age of 18. About 70% of the male refugees werefarmers? the same may be true of the refugees in Iran. Accordingto this same study the working population aged 18-49 will havenearly doubled by 1996. Given these demographic characteristics ofthe afghan population every effort should be directed at promotingthe employment capacity of the rural sector with a view to avoidrapid urbanization and the social costs involved.
As the report has aptly suggested "the potential damage thatinappropriate agricultural mechanization can do, if not governedby policies" will be considerable. However, before a comprehensivepolicy option is worked out a special indepth study should beundertaken on a managable scale to evaluate the over all situationof farm power in a few key agricultural areas, serving as acomplement to the extensive sample survey now being carried out bythe Swedish Conftttee. It is widely believed that without such casestudies, to be sharply focused on key issues and linkages, theresults obtained through the extensive survey alone will remaininconclusive.
Although some tractors will be supplied to afghan farmersduring the rehabilitation stage, the Issue of farm power as astructural constraint to the agricultural development may not berapidly resolved. Over the recent years, farmers in Afghanistanhave managed to meet farm power shortages through sharing andhiring of oxen and tractor services. During the interim period theNGOs as well as the AIG should assist farmers, particularly emailfarmers, to continue these arrangements and use the existing meansmore effectively. These institutions should also examinf-and testthe possibility of establishing rural credit schemes with the viewto improve small farmers'access to essential inputs including farmpower supplies. They could also encourage individualentrepreneurs to purchase appropriate farm machineries on creditand .then to sell the services to small farmers in the rural area.
In the immediate future the agricultural policies mustemphasize further intensification of agriculture, training of youngfarmers and the improvement of existing water supplies; in the longrun however, these policies should focus on some basicinstitutional arrangements to provide farmers with security oftenure and production incentives. If these policies are supportedby concrete action programmes the farm power constraints to therehabilitation and development of the agricultural sector inAfghanistan could be rapidly resolved.
1. John P. Mclnerney and Graham F. Donaldson, "The Consequencesof Farm Tractors in Pakistan" World Bank Staff Working PaperNumber 210, February 1975, page 52
2. Institute of Policy Studies "State of Employment in Pakistan"Islamabad, 1987, page 8
\ V\r
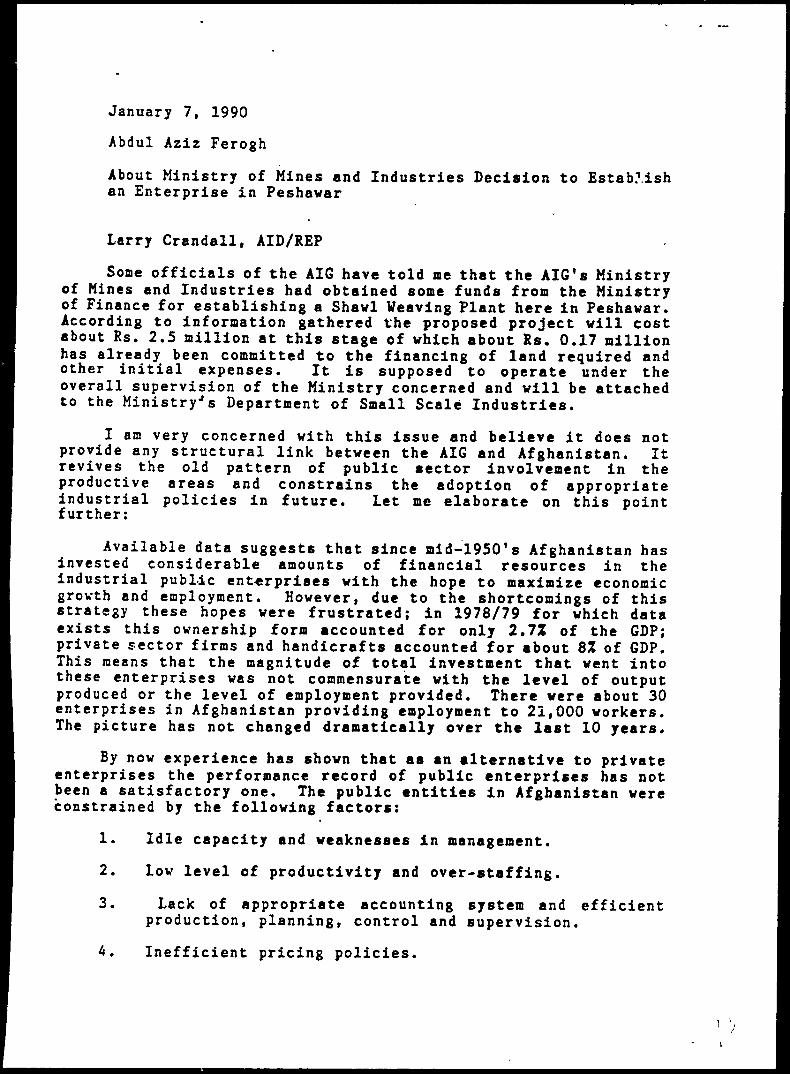
January 7, 1990
Abdul Aziz Ferogh
About Ministry of Mines and Industries Decision to Establishan Enterprise in Peshawar
Larry Crandall, AID/REP
Some officials of the AIG have told me that the AIG's Ministryof Mines and Industries had obtained some funds from the Ministryof Finance for establishing a Shawl Weaving Plant here in Peshawar.According to information gathered the proposed project will costabout Rs. 2.5 million at this stage of which about Rs. 0.17 millionhas already been committed to the financing of land required andother initial expenses. It is supposed to operate under theoverall supervision of the Ministry concerned and will be attachedto the Ministry's Department of Small Scale Industries.
I am very concerned with this issue and believe it does notprovide any structural link between the AIG and Afghanistan. Itrevives the old pattern of public sector involvement in theproductive areas and constrains the adoption of appropriateindustrial policies in future. Let me elaborate on this pointfurther:
Available data suggests that since mid-1950's Afghanistan hasinvested considerable amounts of financial resources in theindustrial public enterprises with the hope to maximize economicgrowth and employment. However, due to the shortcomings of thisstrategy these hopes were frustrated; in 1978/79 for which dataexists this ownership form accounted for only 2.72 of the GDP;private sector firms and handicrafts accounted for about 8* of GDP.This means that the magnitude of total investment that went intothese enterprises was not commensurate with the level of outputproduced or the level of employment provided. There were about 30enterprises in Afghanistan providing employment to 21,000 workers.The picture has not changed dramatically over the last 10 years.
By now experience has shown that as an alternative to privateenterprises the performance record of public enterprises has notbeen a satisfactory one. The public entities in Afghanistan wereconstrained by the following factors:
1. Idle capacity and weaknesses in management.
2. Low level of productivity and over-staffing.
3. Lack of appropriate accounting system and efficientproduction, planning, control and supervision.
4. Inefficient pricing policies.
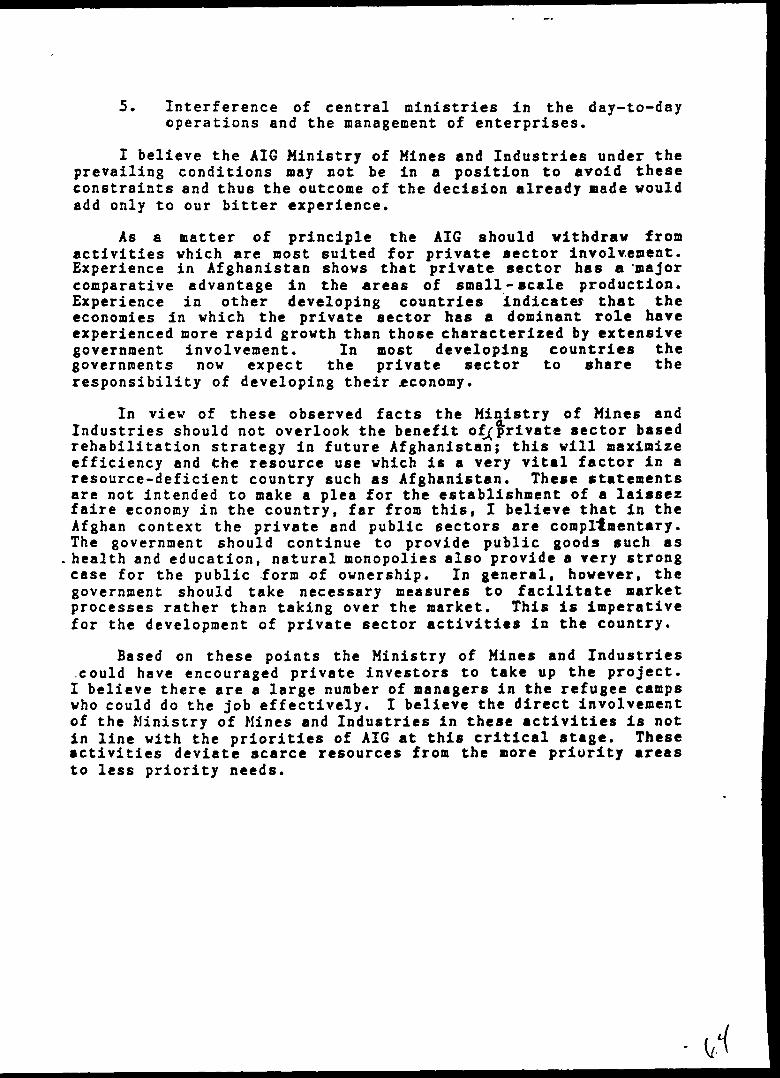
5. Interference of central ministries in the day-to-dayoperations and the management of enterprises.
I believe the AIG Ministry of Mines and Industries under theprevailing conditions may not be in a position to avoid theseconstraints and thus the outcome of the decision already made wouldadd only to our bitter experience.
As a matter of principle the AIG should withdraw fromactivities which are most suited for private sector involvement.Experience in Afghanistan shows that private sector has a 'majorcomparative advantage in the areas of small-scale production.Experience in other developing countries indicates that theeconomies in which the private sector has a dominant role haveexperienced more rapid growth than those characterized by extensivegovernment involvement. In most developing countries thegovernments now expect the private sector to share theresponsibility of developing their jeconomy.
In view of these observed facts the Ministry of Mines andIndustries should not overlook the benefit of^private sector basedrehabilitation strategy in future Afghanistan; this will maximizeefficiency and the resource use which is a very vital factor in aresource-deficient country such as Afghanistan. These statementsare not intended to make a plea for the establishment of a laisserfaire economy in the country, far from this, I believe that in theAfghan context the private and public sectors are complimentary.The government should continue to provide public goods such ashealth and education, natural monopolies also provide a very strongcase for the public form of ownership. In general, however, thegovernment should take necessary measures to facilitate marketprocesses rather than taking over the market. This is imperativefor the development of private sector activities in the country.
Based on these points the Ministry of Mines and Industries.could have encouraged private investors to take up the project.I believe there are a large number of managers in the refugee campswho could do the job effectively. I believe the direct involvementof the Ministry of Mines and Industries in these activities is notin line with the priorities of AIG at this critical stage. Theseactivities deviate scarce resources from the more priority areasto less priority needs.
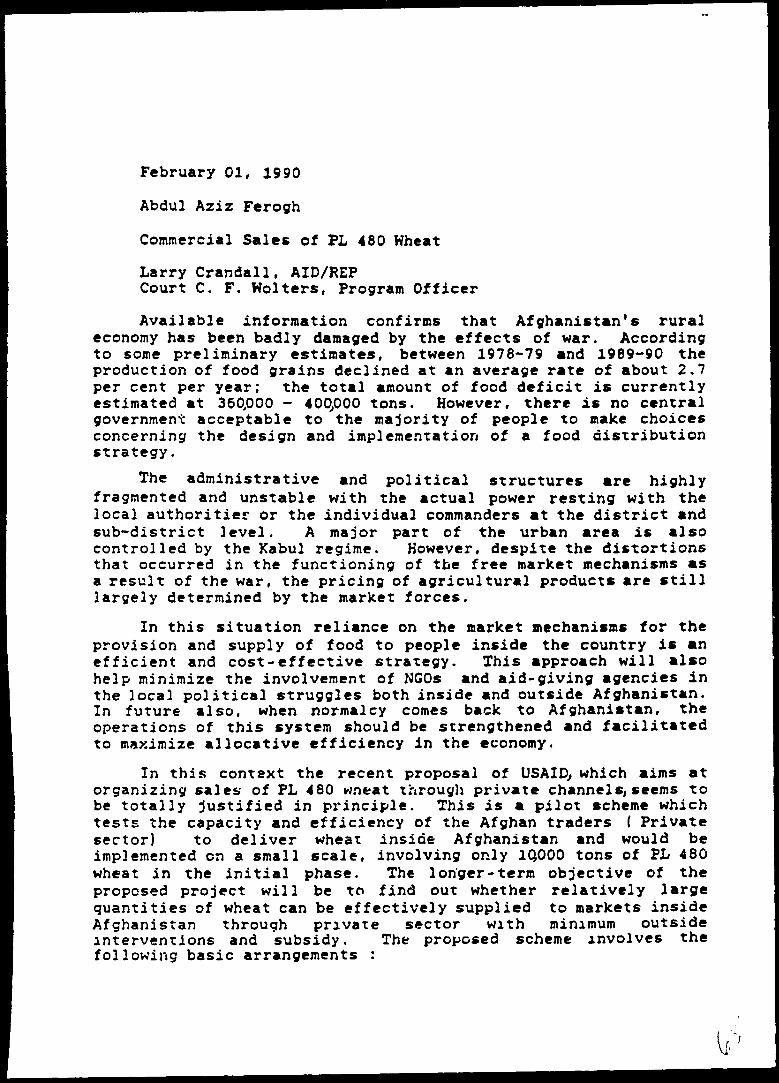
February 01, 1990
Abdul Aziz Ferogh
Commercial Sales of PL 480 Wheat
Larry Crandall, AID/REPCourt C. F. Wolters, Program Officer
Available information confirms that Afghanistan's ruraleconomy has been badly damaged by the effects of war. Accordingto some preliminary estimates, between 1978-79 and 1989-90 theproduction of food grains declined at an average rate of about 2.7per cent per year; the total amount of food deficit is currentlyestimated at 360,000 - 400,000 tons. However, there is no centralgovernment acceptable to the majority of people to make choicesconcerning the design and implementation of a food distributionstrategy.
The administrative and political structures are highlyfragmented and unstable with the actual power resting with thelocal authoritier or the individual commanders at the district andsub-district level. A major part of the urban area is alsocontrolled by the Kabul regime. However, despite the distortionsthat occurred in the functioning of the free market mechanisms asa result of the war, the pricing of agricultural products are stilllargely determined by the market forces.
In this situation reliance on the market mechanisms for theprovision and supply of food to people inside the country is anefficient and cost-effective strategy. This approach will alsohelp minimize the involvement of NGOs and aid-giving agencies inthe local political struggles both inside and outside Afghanistan.In future also, when normalcy comes back to Afghanistan, theoperations of this system should be strengthened and facilitatedto maximize allocative efficiency in the economy.
In this context the recent proposal of USAID, which aims atorganizing sales of PL 480 wneat through private channels, seems tobe totally justified in principle. This is a pilot scheme whichtests the capacity and efficiency of the Afghan traders ( Privatesector) to deliver wheat inside Afghanistan and would beimplemented on a small scale, involving only 1QOOO tons of PL 480wheat in the initial phase. The longer-term objective of theproposed project will be to find out whether relatively largequantities of wheat can be effectively supplied to markets insideAfghanistan through private sector with minimum outsideinterventions and subsidy. The proposed scheme involves thefollowing basic arrangements :

1. The USG and GOP will appoint an experienced agent toimplement the program
2. Qualified Afghan traders will be selected to obtain wheatfrom GOP's Department of Food in both NWFP andBaluchistan and then ship the same to aarket centersinside Afghanistan
3. The GOP is assumed to provide the Afghan traders with therequired facilities such as the export and transitpermits
While the USAID proposal is quite sound in principle, a numberof points should be taken into account while planning for theimplementation of the proposed pilot scheme. These are brieflypresented in the following paragraphs.
The proposed project links the Afghan traders with thePkaistani bureaucracy, at least through the implementing agentwhich in all probability would be a Pakistani firm. Whether thisarrangement will be attractive and acceptable to the Afghan tradersat this juncture is still an open question. However experience hasshown that the Afghan traders prefer to procure wheat and otheressential commodities from traders in the border areas due to anumber of social and administrative complexities involved.
In order to maintain the existing situation undisturbed theimplementing agent could be authorized to make arrangements forshipment of wheat to border areas for transshipment to Afghanistan.The Afghan traders (private sector) will purchase PL 480 wheat frompre-planned and pre-deternuned sales centres in these areas fordelivery to urban or rural centers inside Afghanistan as the casemay be.
These arrangements will not affect the substance of the pilotscheme in any way but will facilitate a lot of things for^ theAfghan traders ; no transit or export permits will be required andat the yame time the Afghan dealers will not be obliged to makearrangements with the tribales, Pakistani police, Political agentsand the like.
The implementation of the proposed strategy is based on thebasic assumption that the people inside Afghanistan are equippedwith adequate purchasing power and can obtain wheat from theinternal markets at the market-determined prices. At the momentvery little or no information is available: on purchasing power inAfghanistan. This issue must be tested through the proposedprogramme as well as by other independent studies.
The market mechanism through which the private sector isexpected to operate usually allocates goods, including wheat, amongthose buyers who can afford and are willing to pay the marketprice; all those who cannot afford to pay the price will be unableto get them no matter how badly they need them.
Even before the war purchasing power was very limited,particularly in the food deficit areas. According to the worldBank, about 30 % of the population were below the poverty line.Over the l#st ten years the situation has aggravated further dueto loss of assets, such as the livestock and the lack of employmentopportunities. According to ay preliminary estimates, between1978-79 and 1989-90 GDP dropped by 22 %, agricultural crops by31 %, and the livestock production by 46 % over the period. Theseindicators emphasise the fact that the purchasing power at themacro level is now at its lowest level. In addition severe foodshortages have been reported in certain areas due to naturalcalamities and locust attacks.
Avail-able information and highly systematic studies revealthat increasing market segmentation, transport constraints, lackof security and above all the taxes imposed by the localauthorities ha$* severely disrupted the market mechanisms andcreated the conditions for monopoly pricing practices at variouslevels. As a result of these distorting factors and also becauseof the food shortages the price of wheat in certain areas,including Kabul, appears to be sky-high and prohibitive.
However, if the results obtained from the proposedexperimental scheme show that the distribution costs cannot befully met by the final consumers then the USAID will have toreview the programme once more and consider practical alternatives,even if these alternatives may involve provision of some sort ofsubsidies to the Afghan private traders. It is suggested that freedistribution of wheat should be curtailed as much as possible toavoid the creation of an overdependance on external assistance fora long time. It is also stated that the distribution of food asa gift over a long period will lead to accusations ofdiscrimination from those who will have to buy food or work forit.
It should be noted,however, that the vulnerable groups in thesociety cannot be served through the market mechanisms and theprivate sector which operates through these mechanisms. There is,therefore, a need for the implementation of direct support measuresto meet the basic requirements of the vulnerable segments of theAfghan society.
( 3 )
A
Under any circumstances provision of food- for-work shouldreceive the highest priority under the external aid programmes asincreased production of domestic food and the restoration of theproductive capacity of the economy will be the only optimumsolution to the food supply problem in the country during the longrun. .Provisions of cash-for-food on a selective basis would alsoprovide the Afghan labourers in the rural area with the purchasingpower, facilitating the operations of commercial market mechanisms.
In view of these considerations, a flexible approach whichcombines the market mechanisms with the existing measures of directsupport will be an optimum strategy during the interim period.While the proposed strategy of commercial sales of PL 460 is quitesound it has to be expanded gradually as the economic conditionspermit. At present a number of NGOs1 political parties, and UNagencies are proving food for the Afghan people at various levels.Unfortunately no coordination and standardization exists; whilesome sources are trying to avoid free distribution of food andessential commodities others are allocating these items free ofcost. Experience has shown that lack of coordination andstandardization of aid serves as a severe constraint to theimplementation of a rigid commercial distribution system.
It will not be out of context to mention here that prior tothe war Afghanistan benefitted from the US-supplied wheat underTitle I , PL 480 programme in a number of critical years.According to the procedures prevailing at the time, after the PL480 wheat arrived at the Karachi port, the Government ofAfghanistan called the wheat forward and shipped it directly insideAfghanistan, using the transit facilities provided under thetransit agreements between Afghanistan and Pakistan.
In the context of the proposed scheme the role of the Peshawar-based AIG has not yet been determined. This matter is quiteunderstandable at this juncture. However, my impression as anindividual is that the procedures contained under the proposedprogramme would not limit the options that would be available tothe future government of Afghanistan, once such a representativegovernment is in place inside the country.
BIBLIOGRAPHY
Agency Coordinating Body for Afghanistan Relief. Directory of Members.Peshawar, Pakistan, November 1989.
Central Statistical Office. Statistical Yearbook, 1985/86. (In Dari), Kabul, 1986.
Central Statistical Office. Statistical Yearbook, 1987/88. (In Dari), Kabul, 1988.
Ministry of Planning. Main Indicators of the 1989/90Social and EconomicDevelopment Plan. (In Dari), Kabul, 1990.
Ministry of Planning. Socio-Economic Situation and Progress for 1990s.Kabul, July 1990.
Robert R. Nathan Associates, Inc., and Louis Berger International, Inc., A jointventure. Afghanistan Macroeconomic Database Development(Appendices) January 1990.
State Planning Committee, Socio-Economic Development Plan for the Year 1365(1986/87). Kabul, 1986.
The Swedish Committee for Afghanistan. The Agricultural Survey ofAfghanistan, Farm Power. Vol. 1, April 1989.
The Swedish Committee for Afghanistan. The Agricultural Survey ofAfghanistan, First Report. 1988.
The Swedish Committee for Afghanistan. Crops and Yields. August 1989.
United Nations Coordinator for Humanitarian and Economic AssistanceProgramme Relating to Afghanistan. First Consolidated Report. Geneva,1988.
United Nations Development Programme. Draft discussion paper containingproposals for a programme of relief, rehabilitation and reconstruction inAfghanistan. April 1988.
72
United Nations Research Institute for Social Development. Survey of theSocisl and Economic Conditions of Afghan Refugees in Pakistan. 1988.
World Bank. Afghanistan, The Journey to Economic Development Vol. 2,March 1978.
.-f