Embed Size (px)
Citation preview
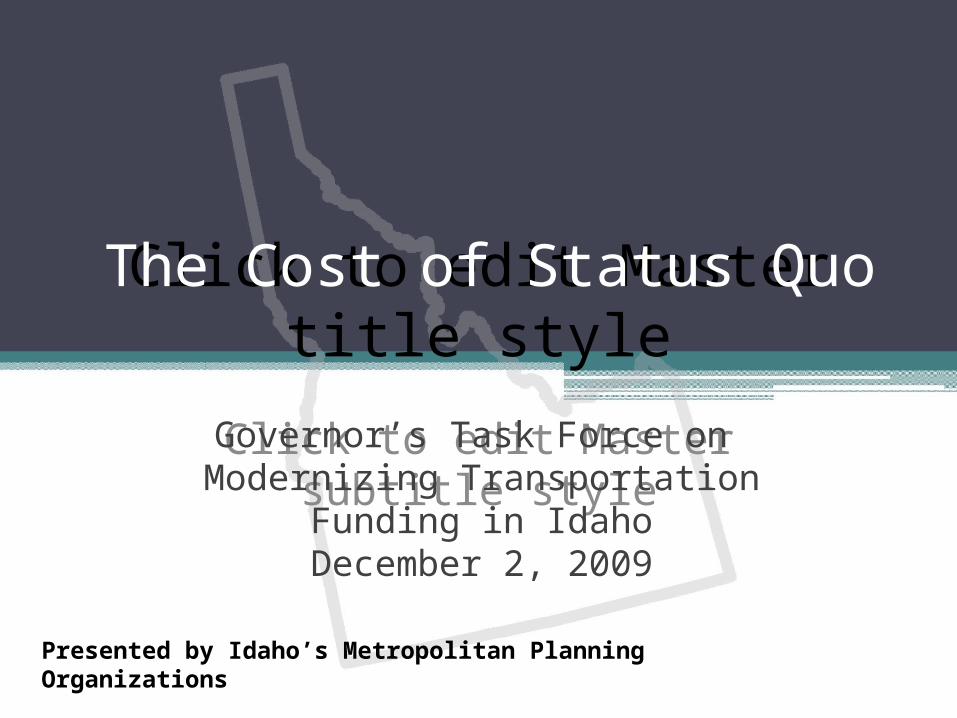
The Cost of Status Quo
Governor’s Task Force on Modernizing Transportation Funding
in IdahoDecember 2, 2009
Presented by Idaho’s Metropolitan Planning Organizations
Presentation Outline
•What is a Metropolitan Planning Organization (MPO)? ▫Why do we exist? ▫What do we do?
•How do MPOs develop plans?•What is the funding situation?
▫What are the assumptions used?•What are the ramifications?
• Congestion• Financial
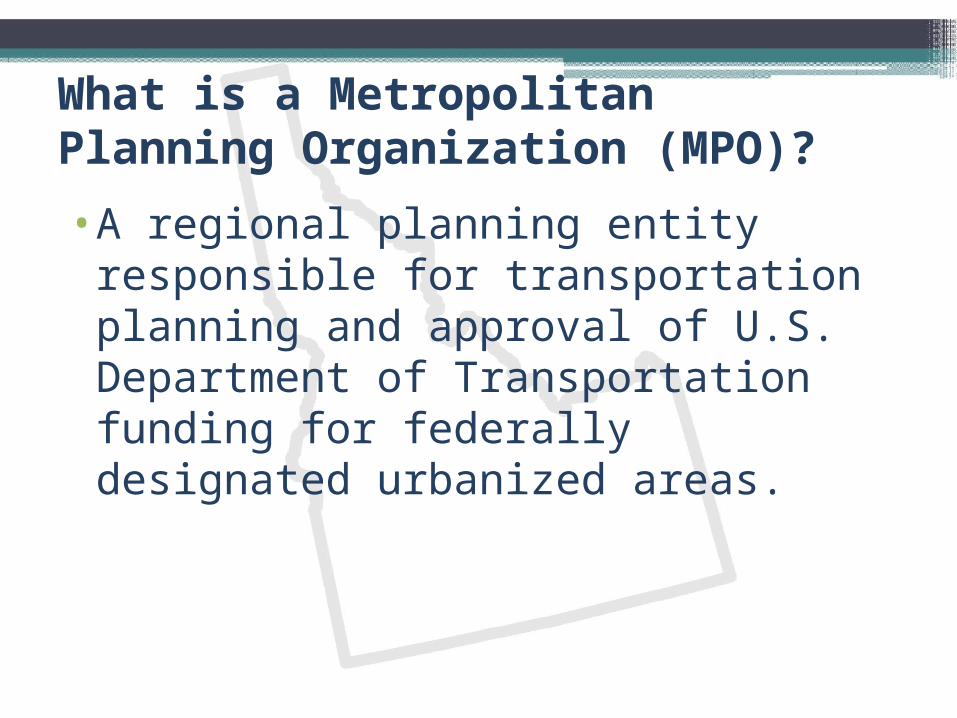
What is a Metropolitan Planning Organization (MPO)?
•A regional planning entity responsible for transportation planning and approval of U.S. Department of Transportation funding for federally designated urbanized areas.
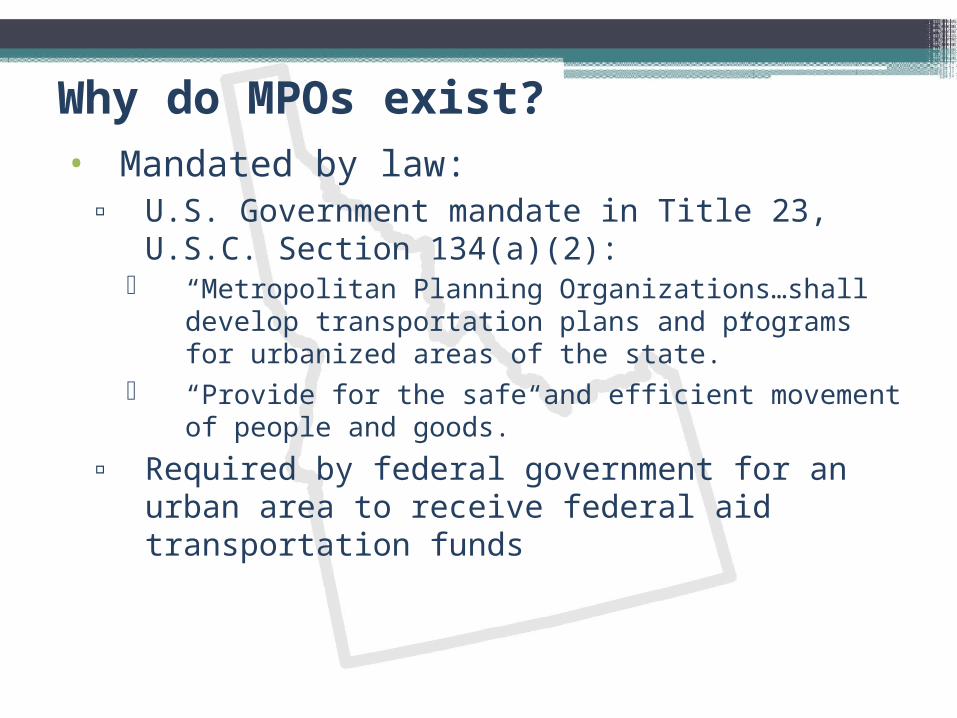
Why do MPOs exist?• Mandated by law:
▫ U.S. Government mandate in Title 23, U.S.C. Section 134(a)(2):
“Metropolitan Planning Organizations…shall develop transportation plans and programs for urbanized areas of the state.”
“Provide for the safe and efficient movement of people and goods.”
▫ Required by federal government for an urban area to receive federal aid transportation funds
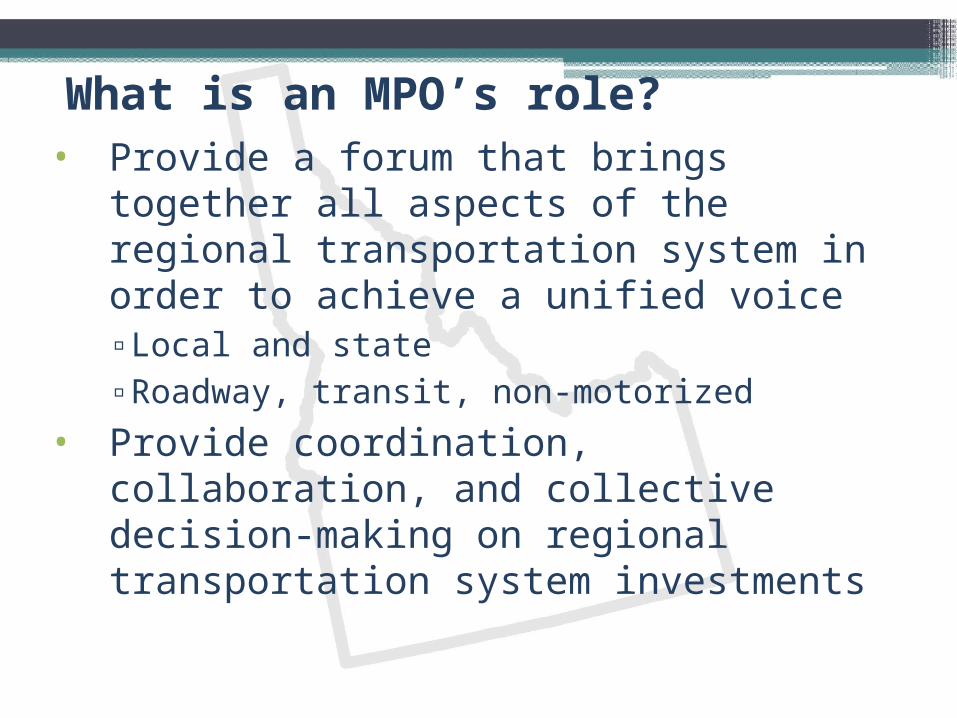
What is an MPO’s role?• Provide a forum that brings together all
aspects of the regional transportation system in order to achieve a unified voice▫Local and state▫Roadway, transit, non-motorized
• Provide coordination, collaboration, and collective decision-making on regional transportation system investments
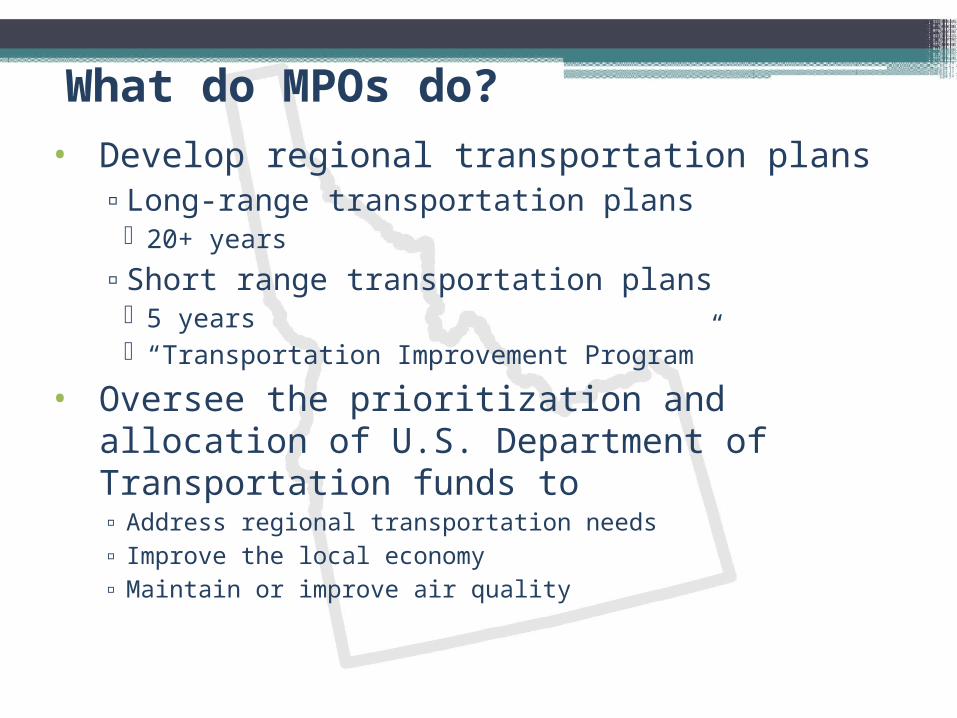
What do MPOs do?• Develop regional transportation plans
▫Long-range transportation plans 20+ years
▫Short range transportation plans 5 years “Transportation Improvement Program”
• Oversee the prioritization and allocation of U.S. Department of Transportation funds to▫ Address regional transportation needs▫ Improve the local economy▫ Maintain or improve air quality
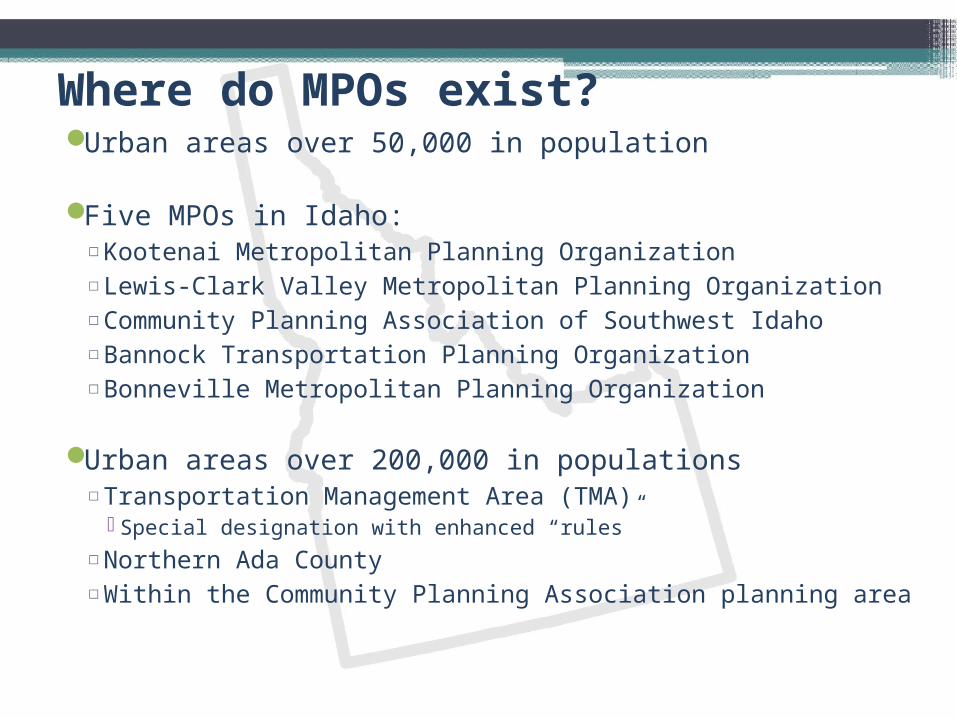
Where do MPOs exist?Urban areas over 50,000 in population
Five MPOs in Idaho: □ Kootenai Metropolitan Planning Organization□ Lewis-Clark Valley Metropolitan Planning Organization□ Community Planning Association of Southwest Idaho□ Bannock Transportation Planning Organization□ Bonneville Metropolitan Planning Organization
Urban areas over 200,000 in populations□ Transportation Management Area (TMA)
Special designation with enhanced “rules”□ Northern Ada County□ Within the Community Planning Association planning area
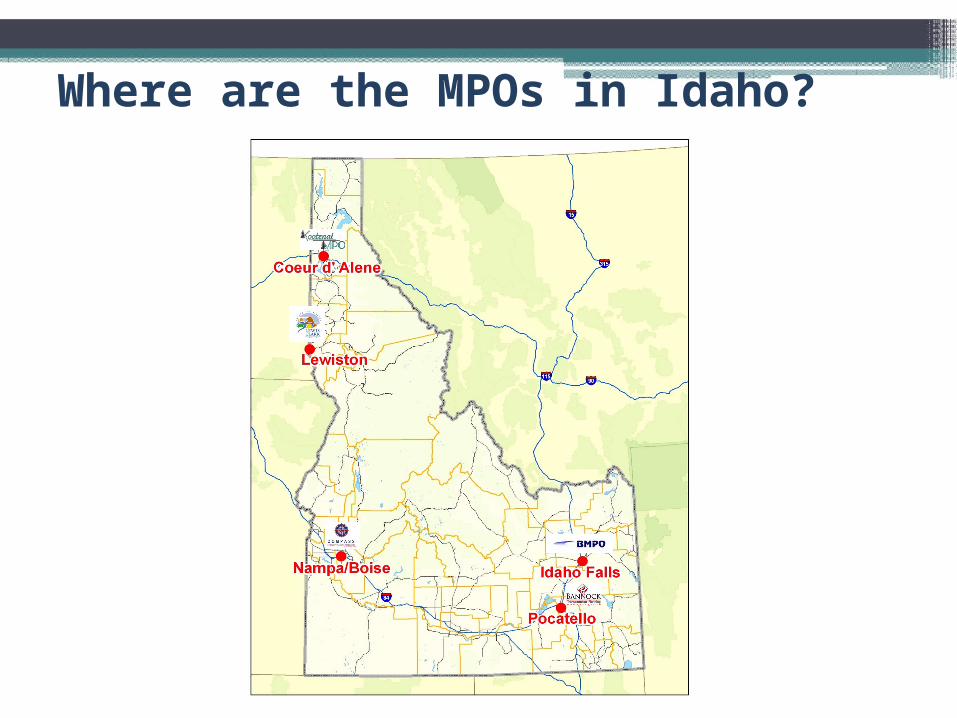
Where are the MPOs in Idaho?
1
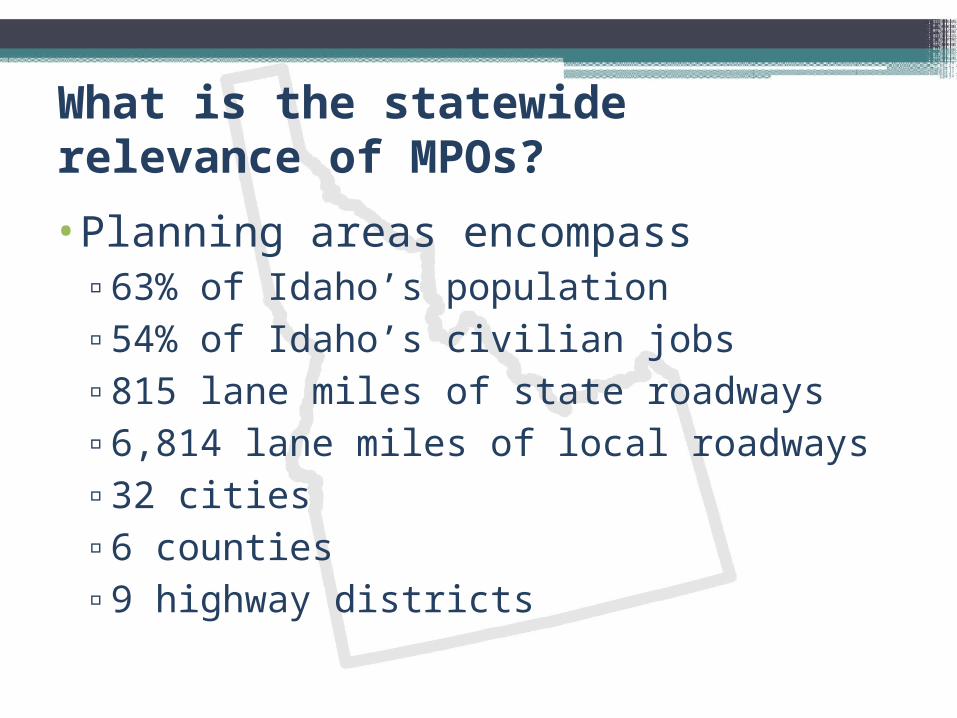
What is the statewide relevance of MPOs?
•Planning areas encompass▫63% of Idaho’s population▫54% of Idaho’s civilian jobs▫815 lane miles of state roadways▫6,814 lane miles of local roadways▫32 cities▫6 counties▫9 highway districts
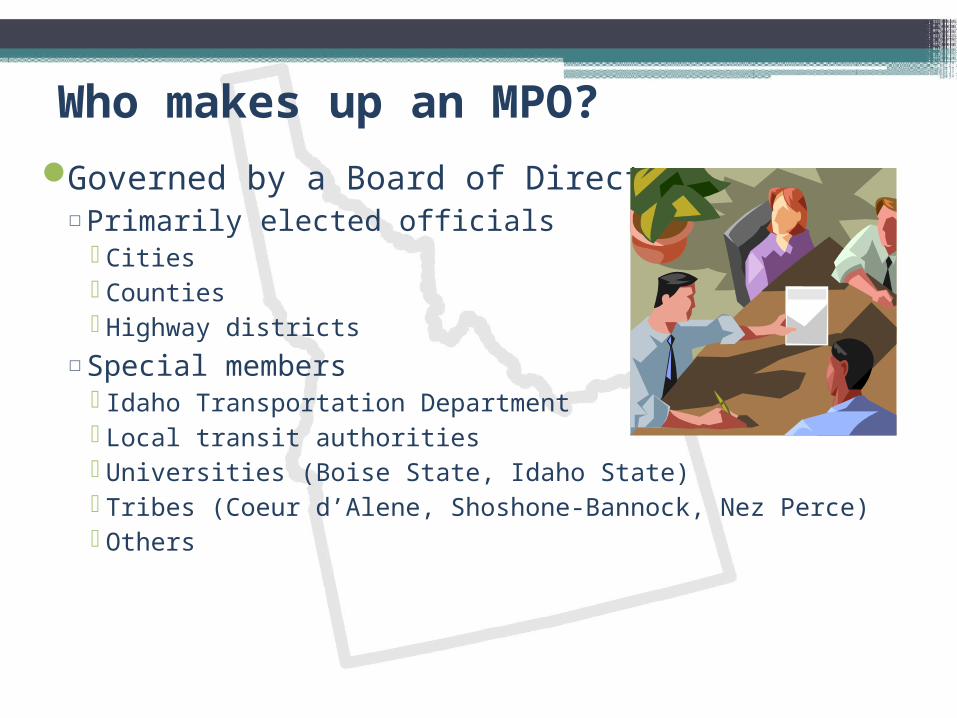
Who makes up an MPO?
Governed by a Board of Directors□Primarily elected officials
Cities Counties Highway districts
□Special members Idaho Transportation Department Local transit authorities Universities (Boise State, Idaho State) Tribes (Coeur d’Alene, Shoshone-Bannock, Nez Perce) Others
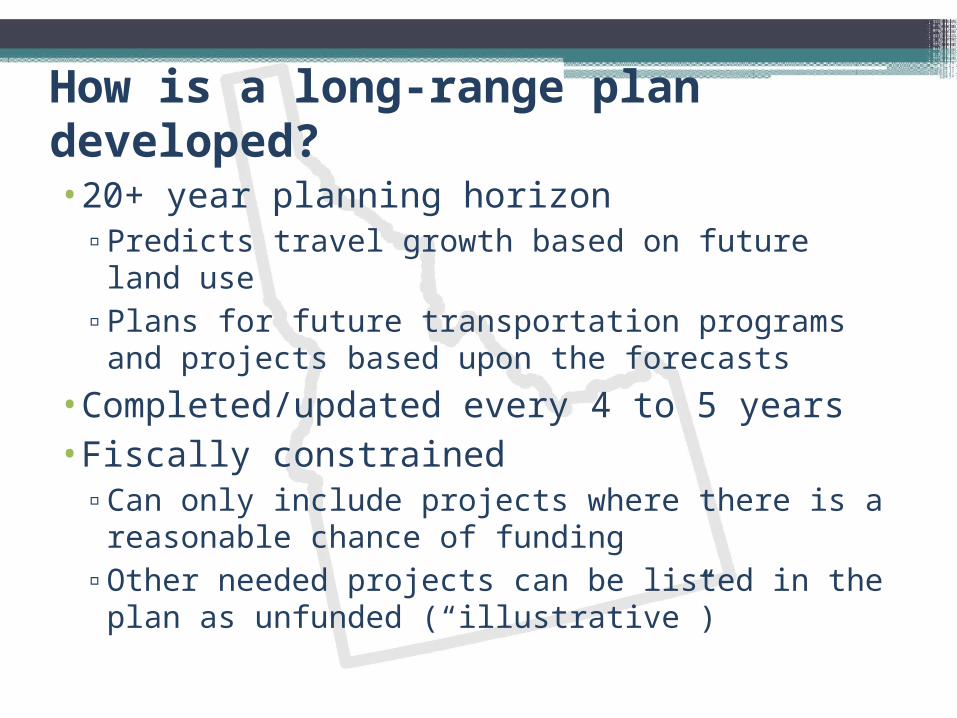
How is a long-range plan developed?
•20+ year planning horizon▫Predicts travel growth based on future land use▫Plans for future transportation programs and projects
based upon the forecasts•Completed/updated every 4 to 5 years•Fiscally constrained
▫Can only include projects where there is a reasonable chance of funding
▫Other needed projects can be listed in the plan as unfunded (“illustrative”)
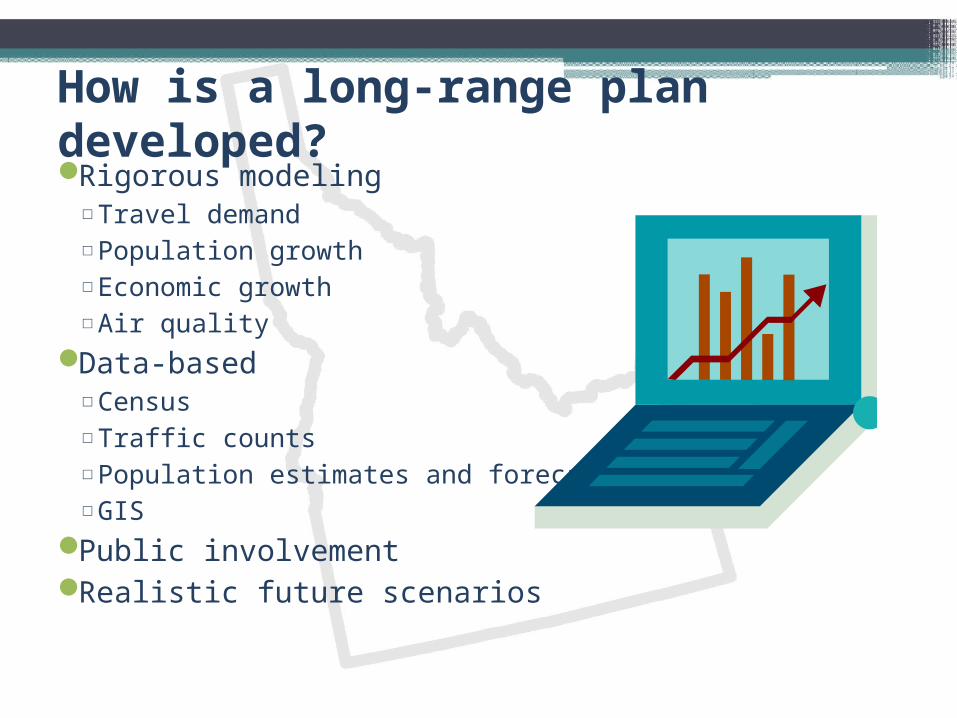
How is a long-range plan developed?Rigorous modeling
□ Travel demand□ Population growth□ Economic growth□ Air quality
Data-based□ Census□ Traffic counts□ Population estimates and forecasts□ GIS
Public involvementRealistic future scenarios
What is considered when making planning decisions?•Data and modeling results•Necessities to accommodate future growth
and travel demand•Fiscal realities•Regional dialogue on a vision of the future•Planning for level of service “C” or “D”
▫Pragmatic; not extravagant
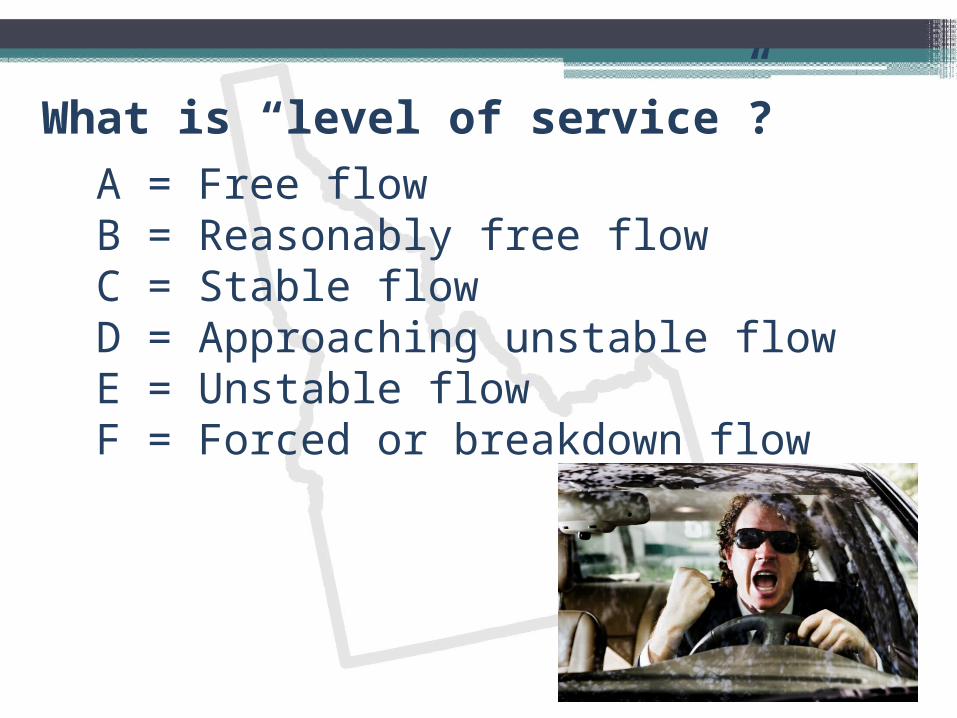
What is “level of service”?A = Free flow B = Reasonably free flowC = Stable flowD = Approaching unstable flowE = Unstable flowF = Forced or breakdown flow
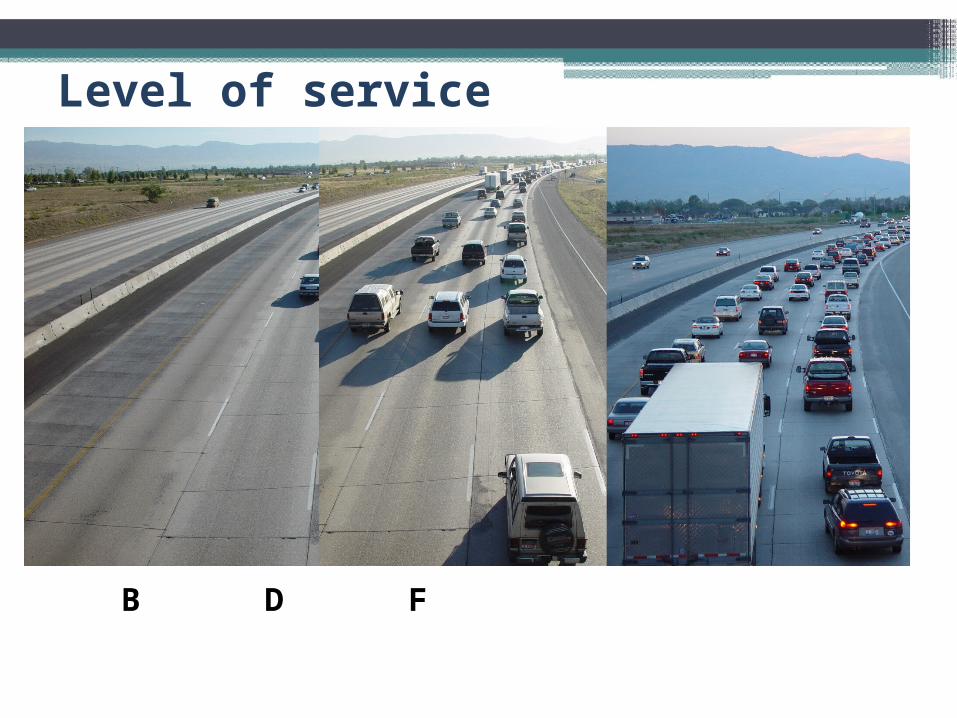
Level of service
B D F
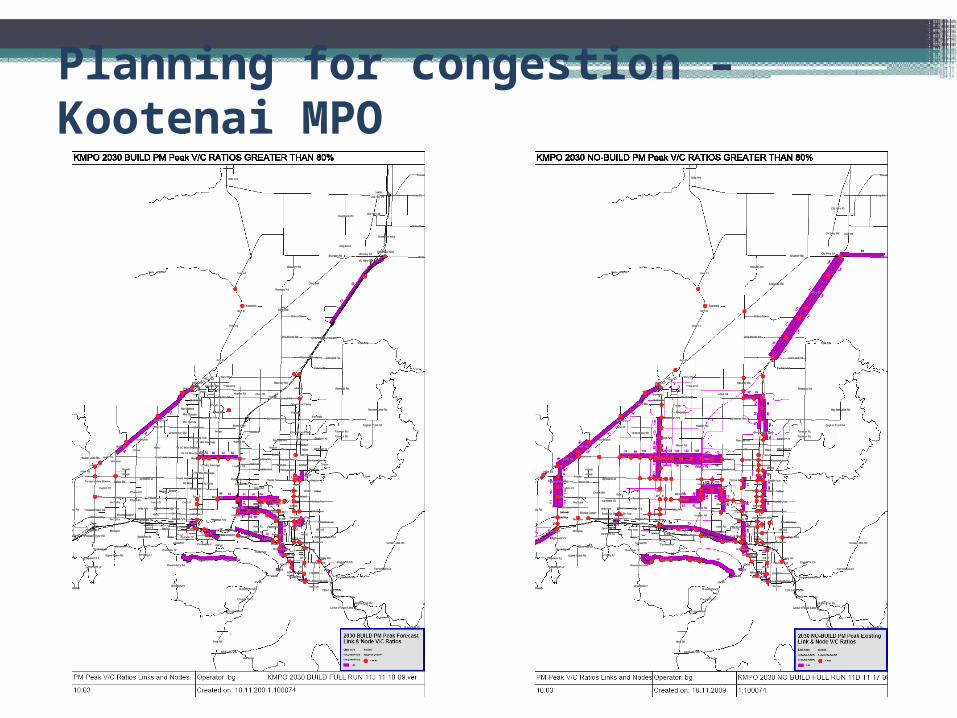
Planning for congestion – Kootenai MPO
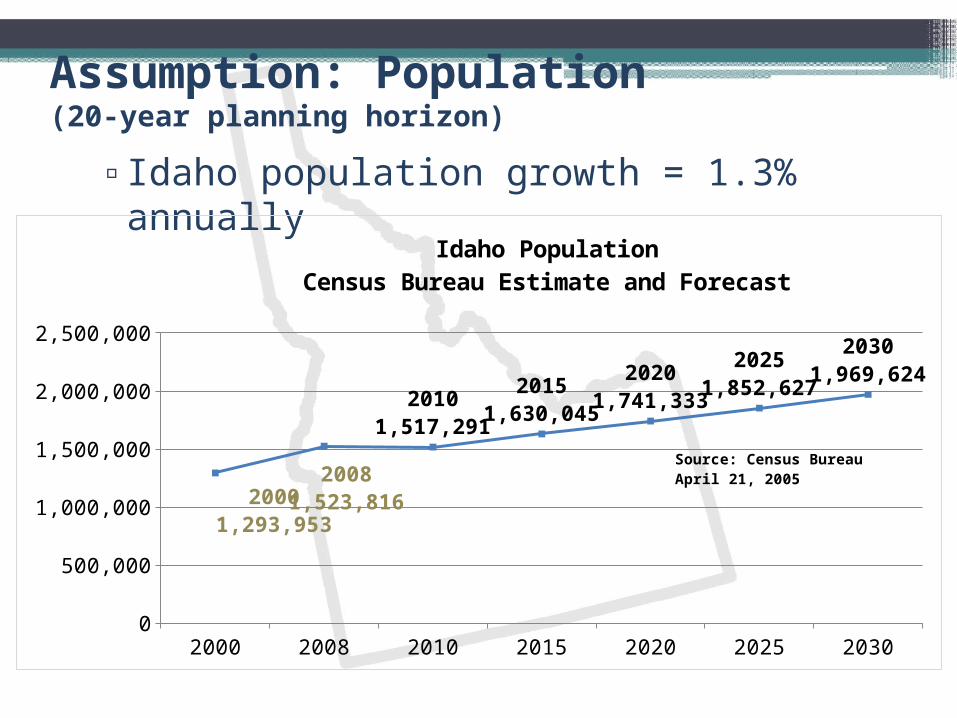
Assumption: Population(20-year planning horizon)
▫Idaho population growth = 1.3% annually
2000 2005 2010 2015 2020 2025 20300
500,000
1,000,000
1,500,000
2,000,000
2,500,000
20001,293,953
20081,523,816
20101,517,291
20151,630,045
20201,741,333
20251,852,627
20301,969,624
Idaho PopulationCensus Bureau Estimate and Forecast
Source: Census BureauApril 21, 2005
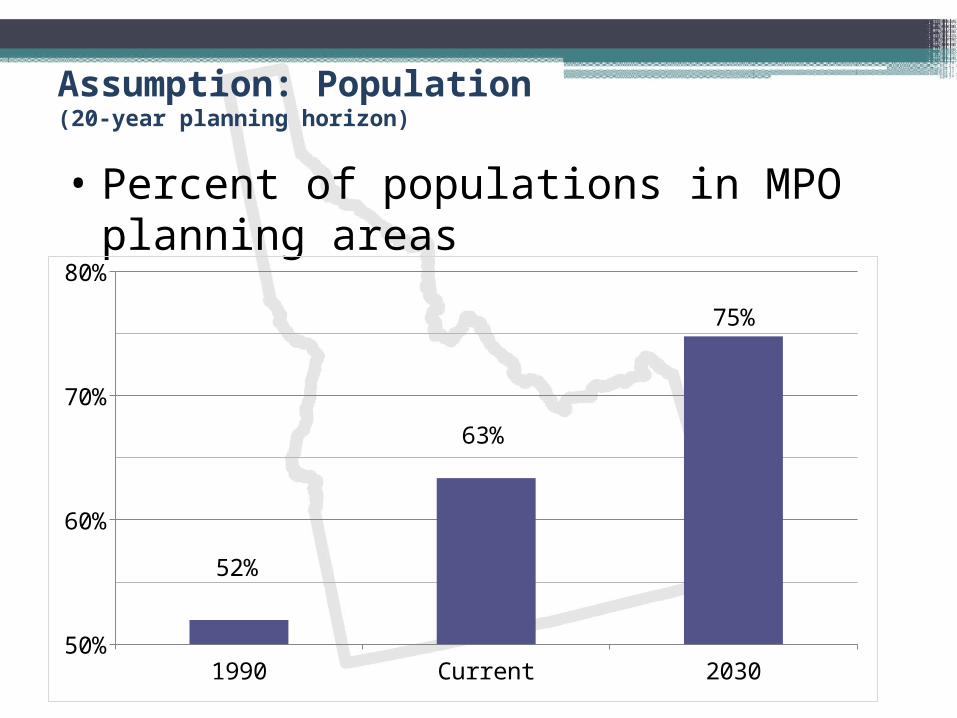
Assumption: Population(20-year planning horizon)
• Percent of populations in MPO planning areas
1990 Current 203050%
60%
70%
80%
52%
63%
75%
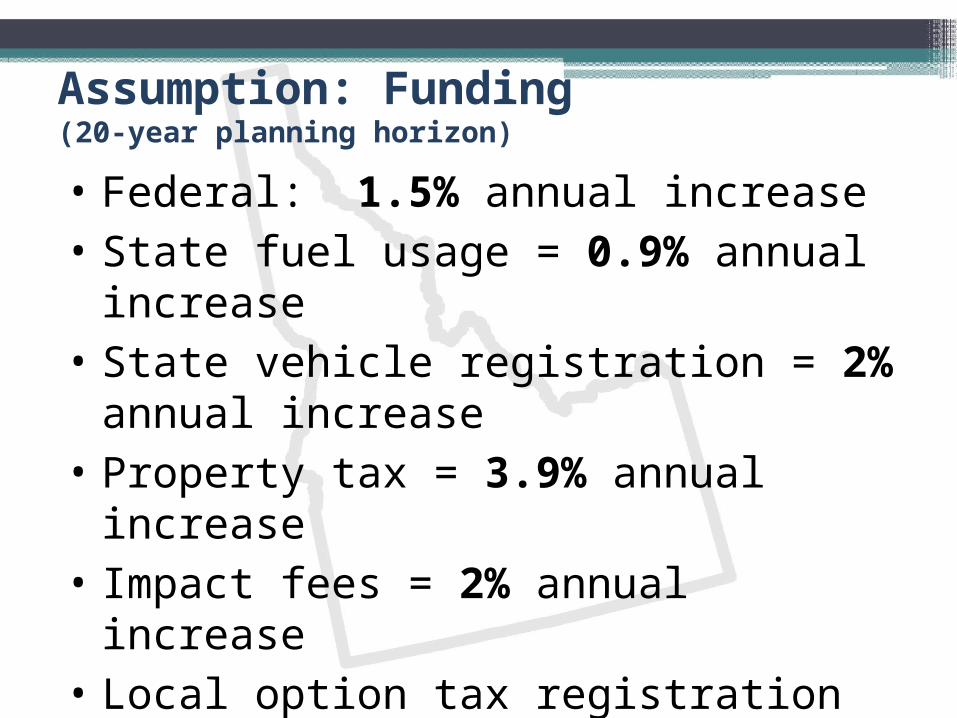
Assumption: Funding (20-year planning horizon)
• Federal: 1.5% annual increase• State fuel usage = 0.9% annual increase• State vehicle registration = 2% annual increase• Property tax = 3.9% annual increase• Impact fees = 2% annual increase• Local option tax registration fee = 4% annual
increase
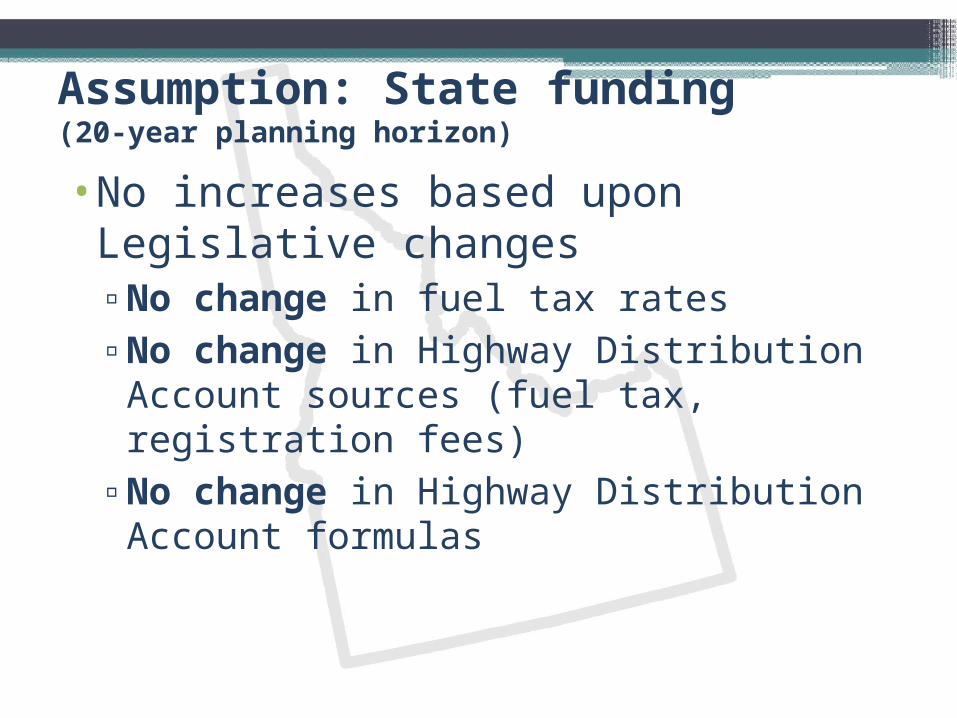
Assumption: State funding (20-year planning horizon)
•No increases based upon Legislative changes▫No change in fuel tax rates▫No change in Highway Distribution Account
sources (fuel tax, registration fees)▫No change in Highway Distribution Account
formulas
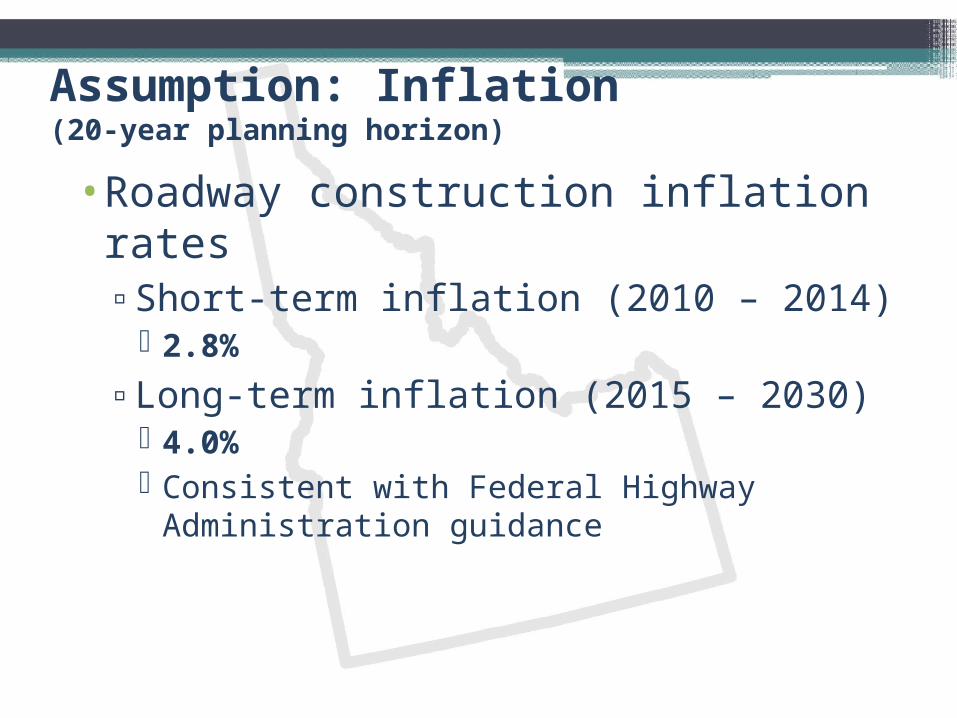
Assumption: Inflation (20-year planning horizon)
•Roadway construction inflation rates▫Short-term inflation (2010 – 2014)
2.8%
▫Long-term inflation (2015 – 2030) 4.0% Consistent with Federal Highway Administration
guidance
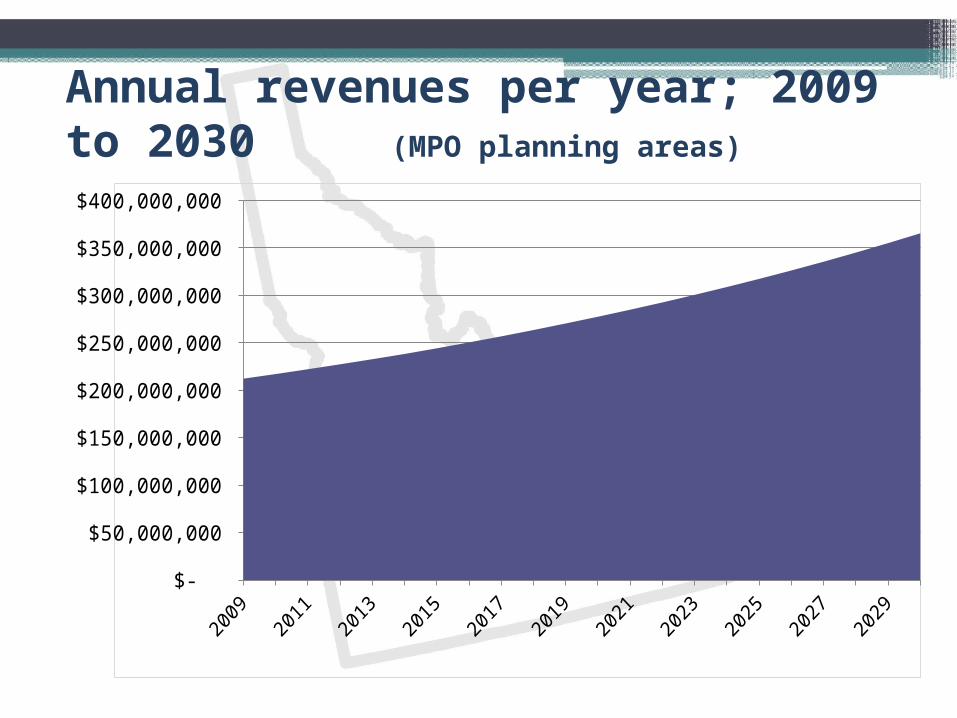
Annual revenues per year; 2009 to 2030 (MPO planning areas)
$-
$50,000,000
$100,000,000
$150,000,000
$200,000,000
$250,000,000
$300,000,000
$350,000,000
$400,000,000
Total Revenues
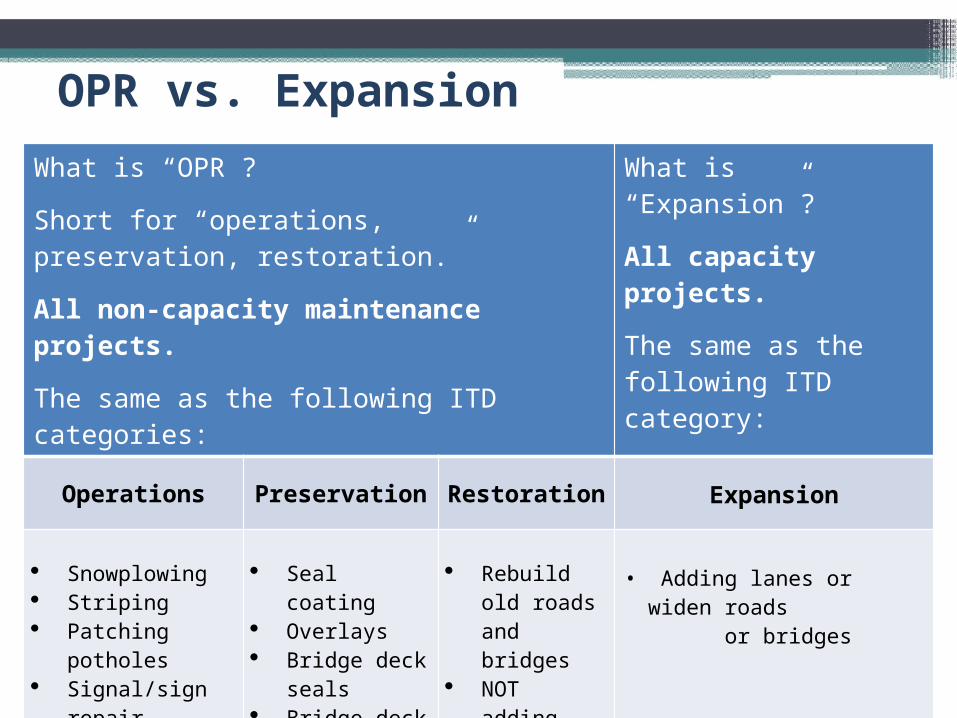
OPR vs. ExpansionWhat is “OPR”? Short for “operations, preservation, restoration.”
All non-capacity maintenance projects.
The same as the following ITD categories:
What is “Expansion”?
All capacity projects.
The same as the following ITD category:
Operations Preservation Restoration Expansion
Snowplowing Striping Patching potholes Signal/sign repair Crack sealing Guard rail repair Grading gravel
Seal coating Overlays Bridge deck
seals Bridge deck
replacement Grading gravel
surfaces
Rebuild old roads and bridges
NOT adding lanes or widen roads
• Adding lanes or widen roads
or bridges
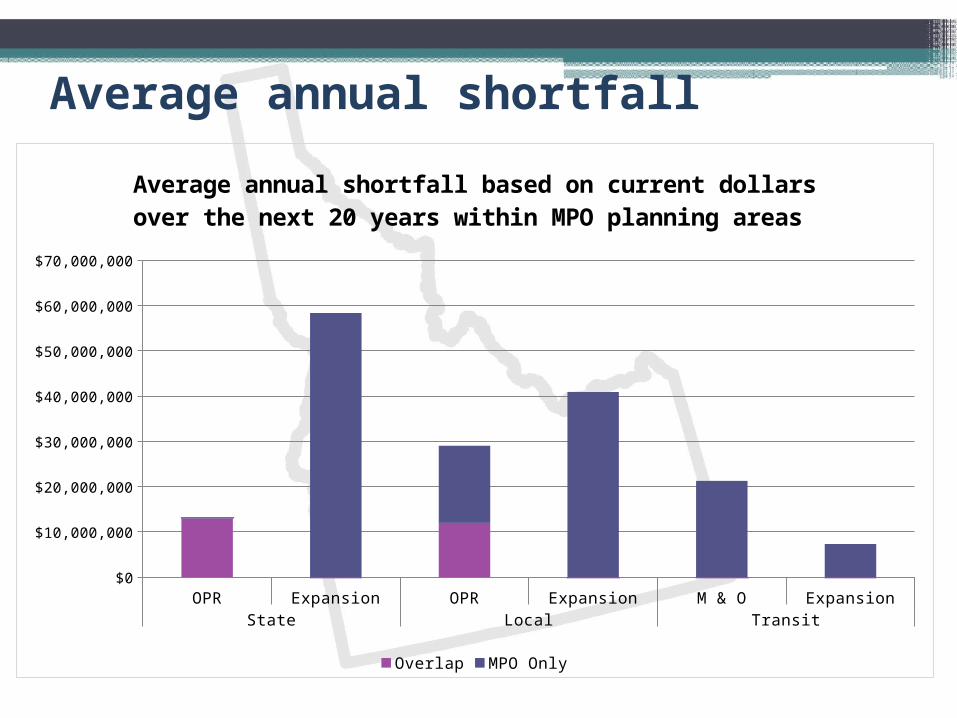
Average annual shortfall
OPR Expansion OPR Expansion M & O ExpansionState Local Transit
$0
$10,000,000
$20,000,000
$30,000,000
$40,000,000
$50,000,000
$60,000,000
$70,000,000
Average annual shortfall based on current dollars over the next 20 years within MPO planning areas
Overlap MPO Only
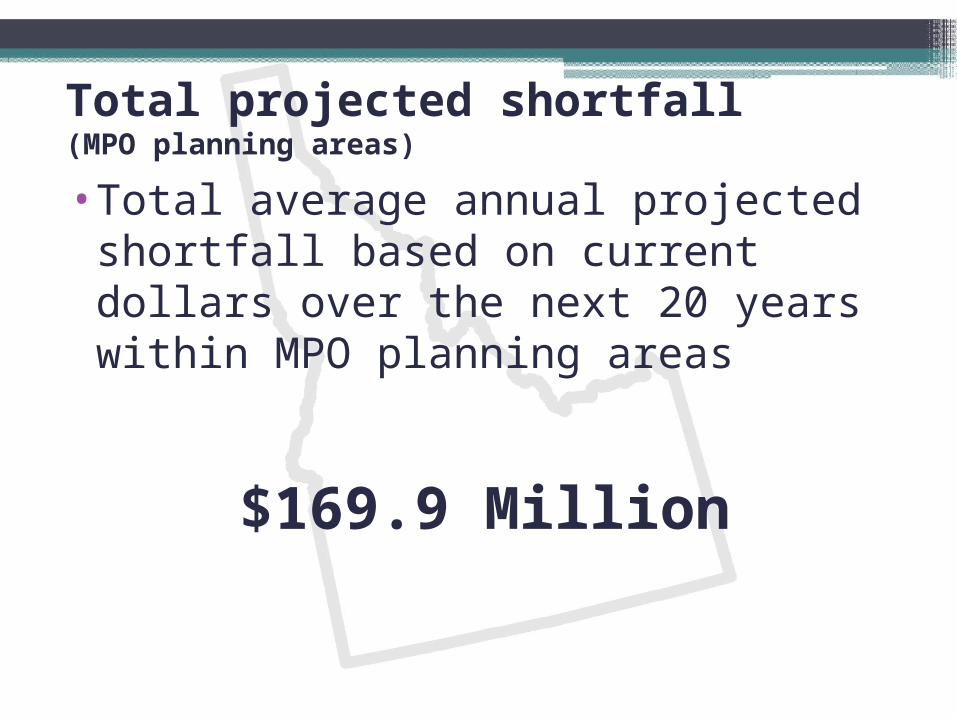
Total projected shortfall (MPO planning areas)
•Total average annual projected shortfall based on current dollars over the next 20 years within MPO planning areas
$169.9 Million
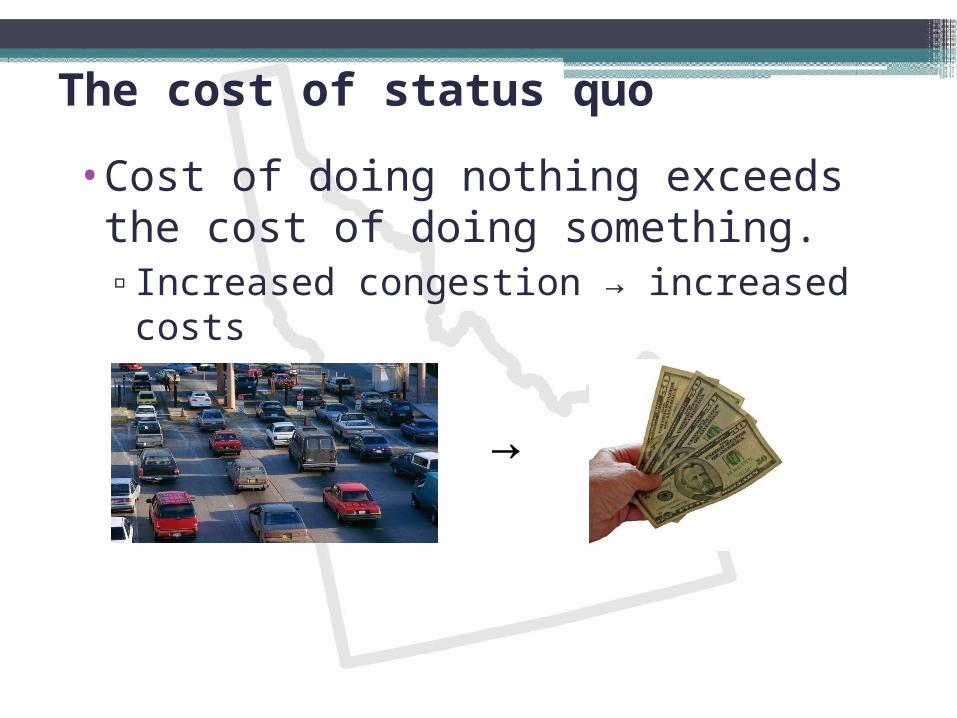
The cost of status quo
•Cost of doing nothing exceeds the cost of doing something.▫Increased congestion → increased costs
→
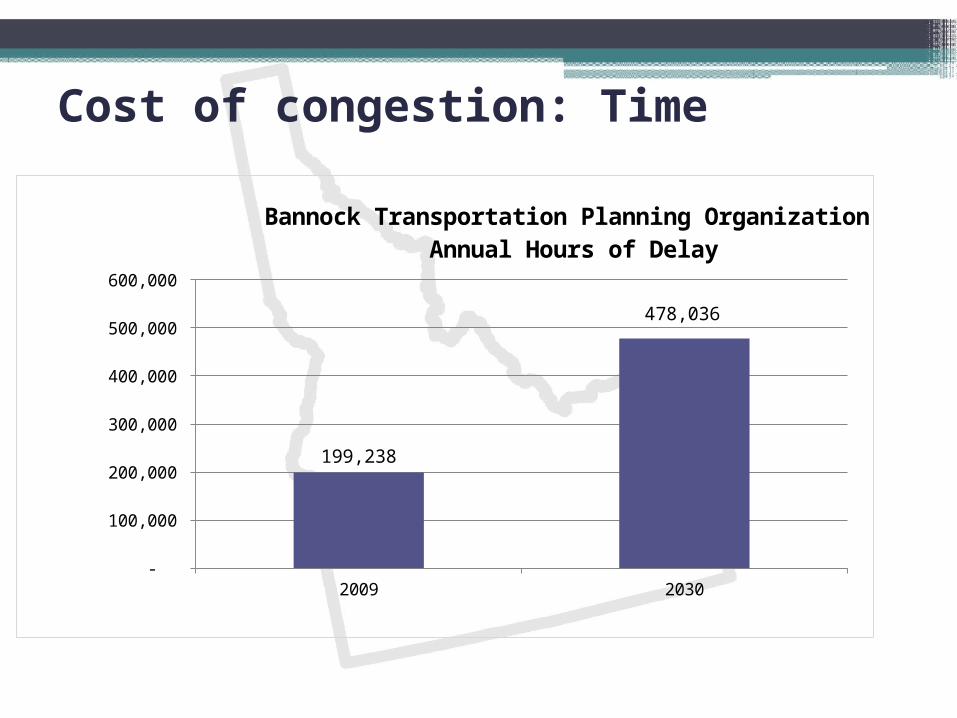
Cost of congestion: Time
2009 2030 -
100,000
200,000
300,000
400,000
500,000
600,000
199,238
478,036
Bannock Transportation Planning Organization Annual Hours of Delay
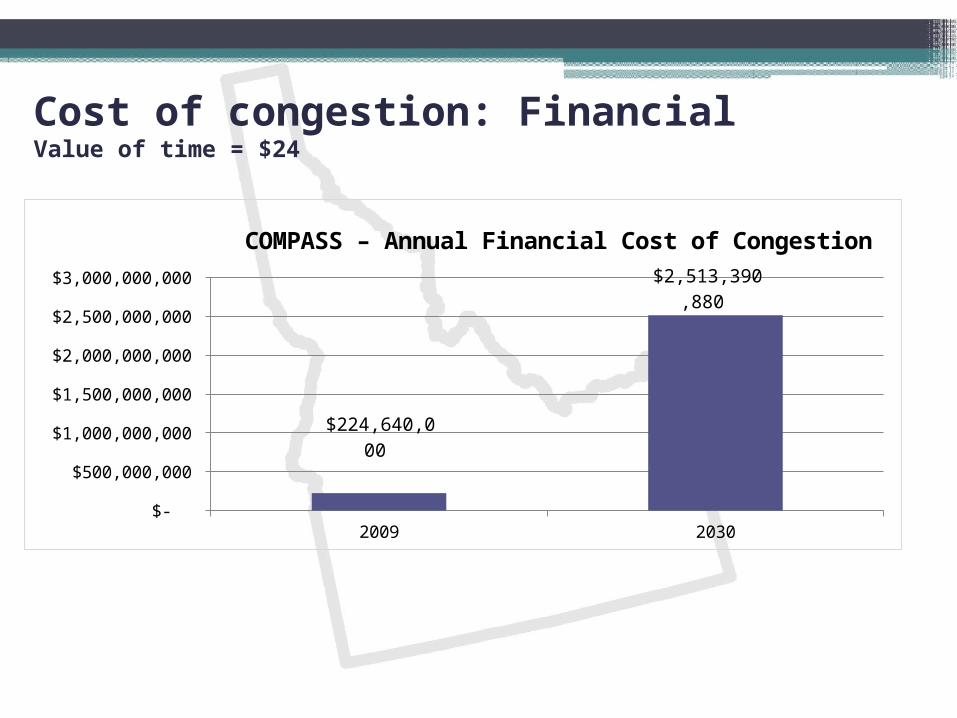
Cost of congestion: FinancialValue of time = $24
2009 2030 $-
$500,000,000
$1,000,000,000
$1,500,000,000
$2,000,000,000
$2,500,000,000
$3,000,000,000
$224,640,000
$2,513,390,88
0
COMPASS – Annual Financial Cost of Congestion
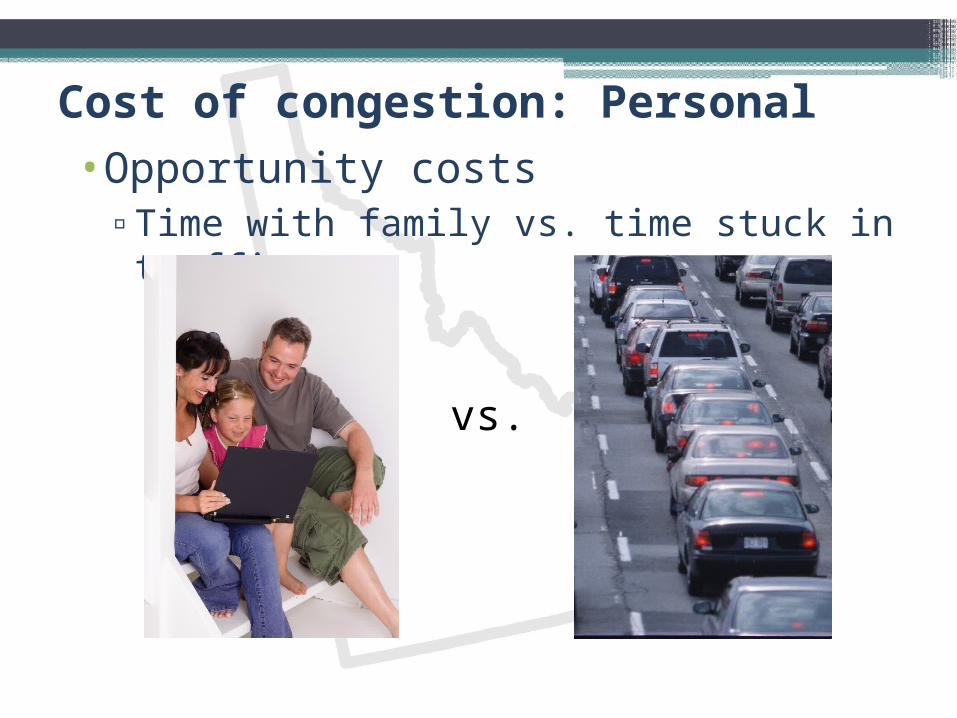
Cost of congestion: Personal•Opportunity costs
▫Time with family vs. time stuck in traffic
vs.
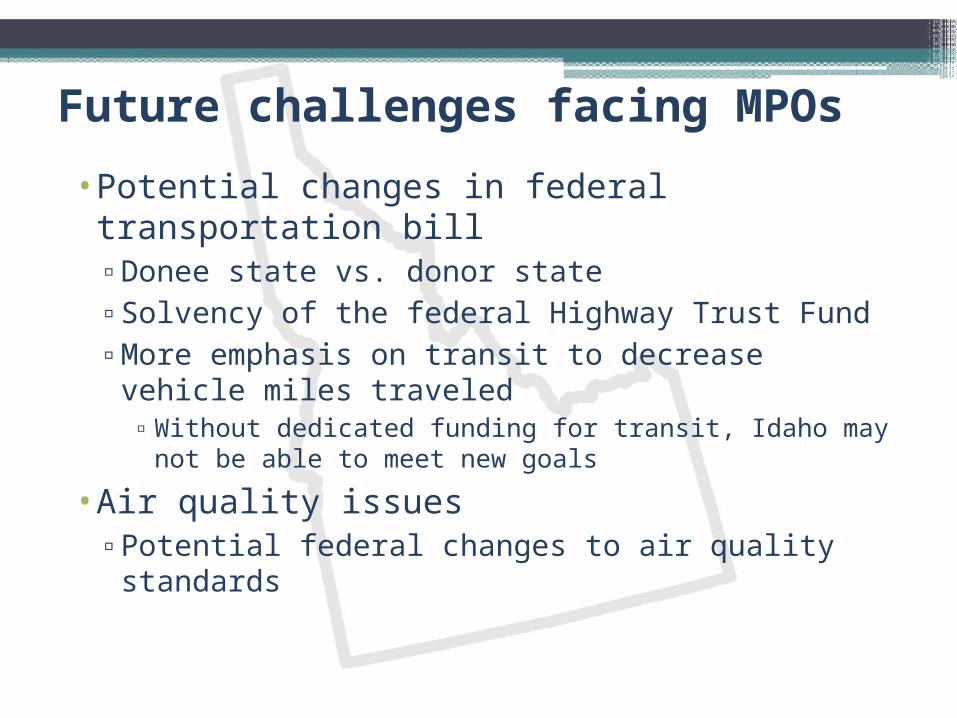
Future challenges facing MPOs
•Potential changes in federal transportation bill▫Donee state vs. donor state▫Solvency of the federal Highway Trust Fund▫More emphasis on transit to decrease vehicle
miles traveled ▫Without dedicated funding for transit, Idaho may not be
able to meet new goals
•Air quality issues▫Potential federal changes to air quality standards
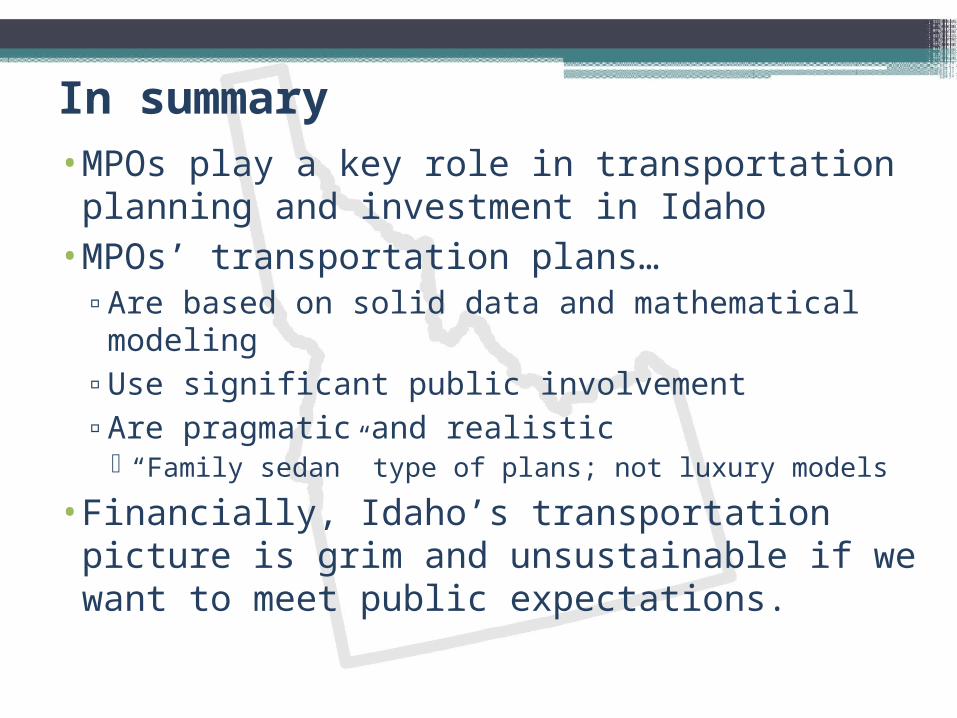
In summary•MPOs play a key role in transportation planning
and investment in Idaho•MPOs’ transportation plans…
▫Are based on solid data and mathematical modeling▫Use significant public involvement▫Are pragmatic and realistic
“Family sedan” type of plans; not luxury models
•Financially, Idaho’s transportation picture is grim and unsustainable if we want to meet public expectations.
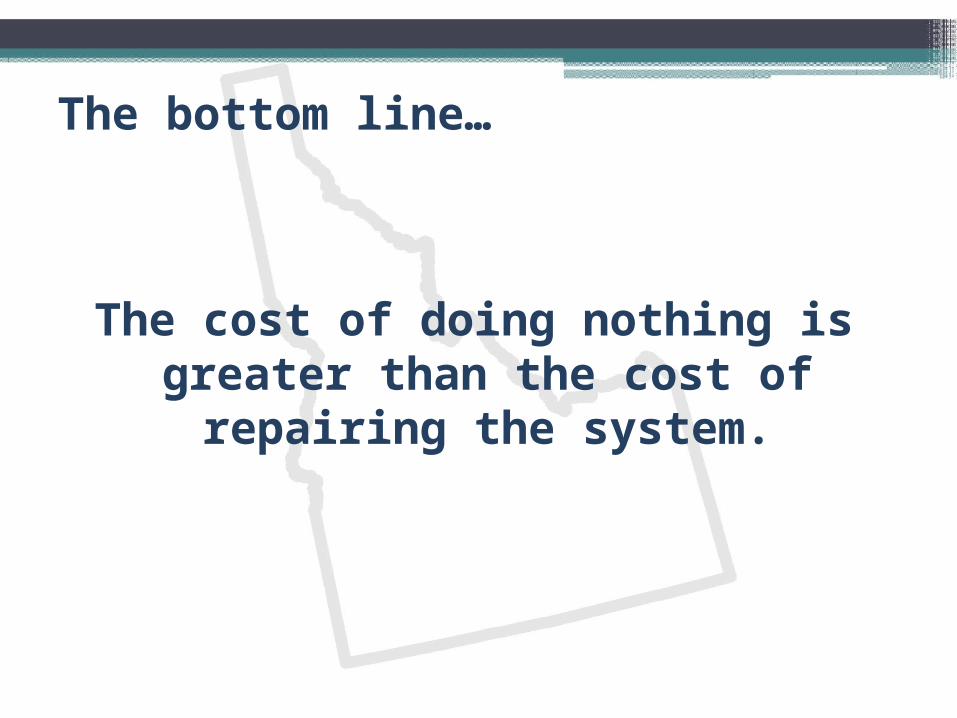
The bottom line…
The cost of doing nothing is greater than the cost of repairing the system.
Thank you