Embed Size (px)
DESCRIPTION
Idaho’s Water Energy Resources and Hydroelectric Potential. Douglas G. Hall, Program Manager INL Hydropower Program. August 2006. Topics. Idaho electricity state of the state Energy sources, production, and consumption Hydroelectric plants and generation - PowerPoint PPT Presentation
Citation preview
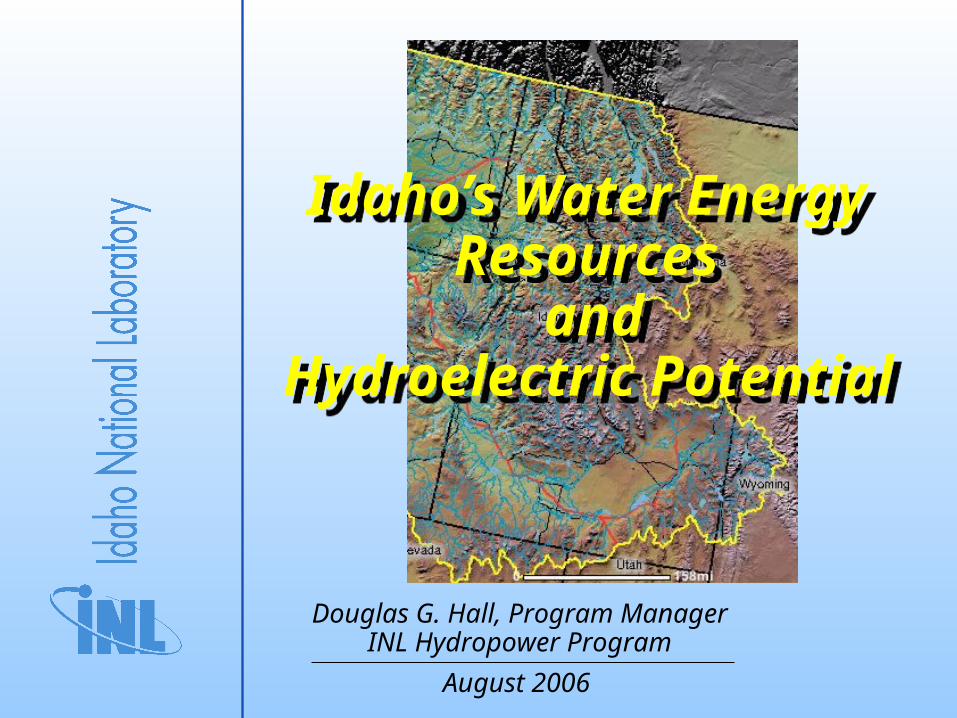
Idaho’s Water Energy Resources
and Hydroelectric Potential
Idaho’s Water Energy Resources
and Hydroelectric Potential
Douglas G. Hall, Program ManagerINL Hydropower Program
August 2006
2
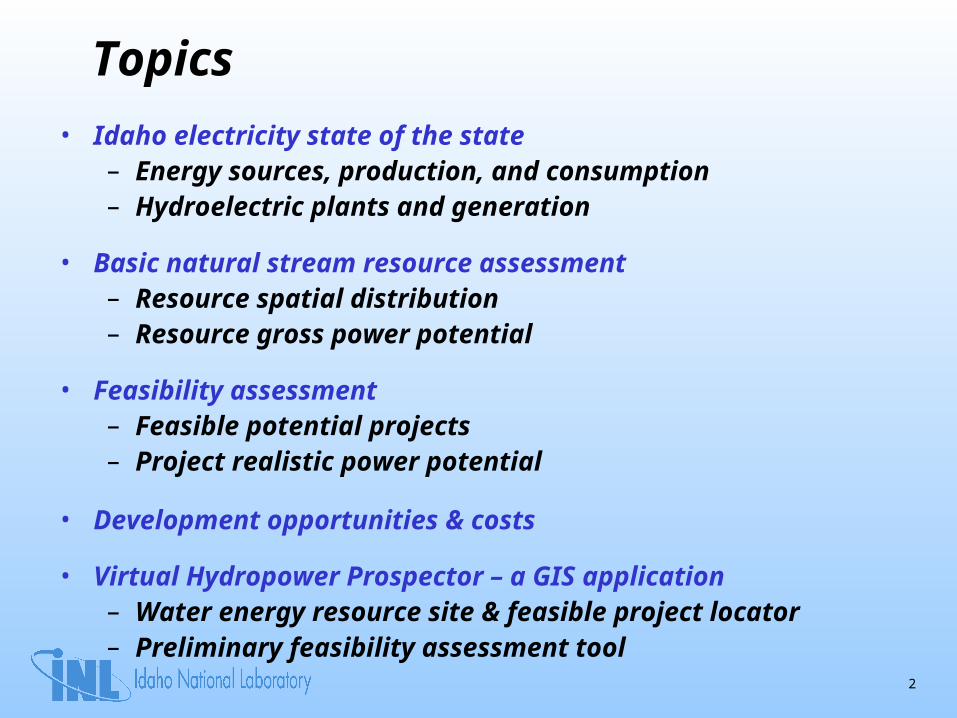
Topics
• Idaho electricity state of the state– Energy sources, production, and consumption– Hydroelectric plants and generation
• Basic natural stream resource assessment– Resource spatial distribution– Resource gross power potential
• Feasibility assessment– Feasible potential projects– Project realistic power potential
• Development opportunities & costs
• Virtual Hydropower Prospector – a GIS application– Water energy resource site & feasible project locator– Preliminary feasibility assessment tool
3
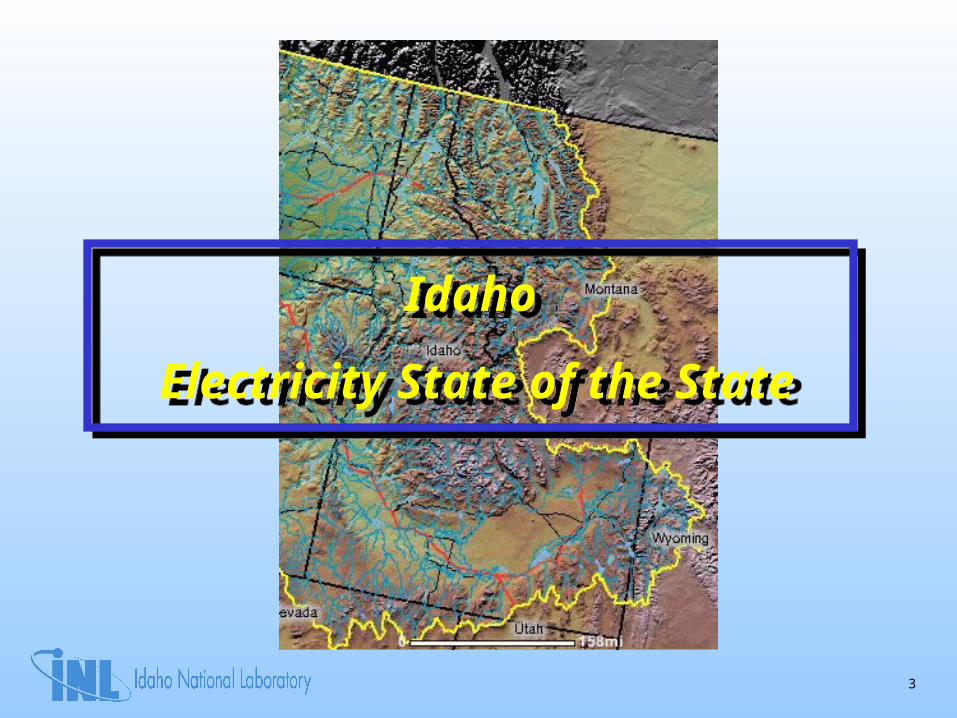
Idaho
Electricity State of the State
Idaho
Electricity State of the State
4
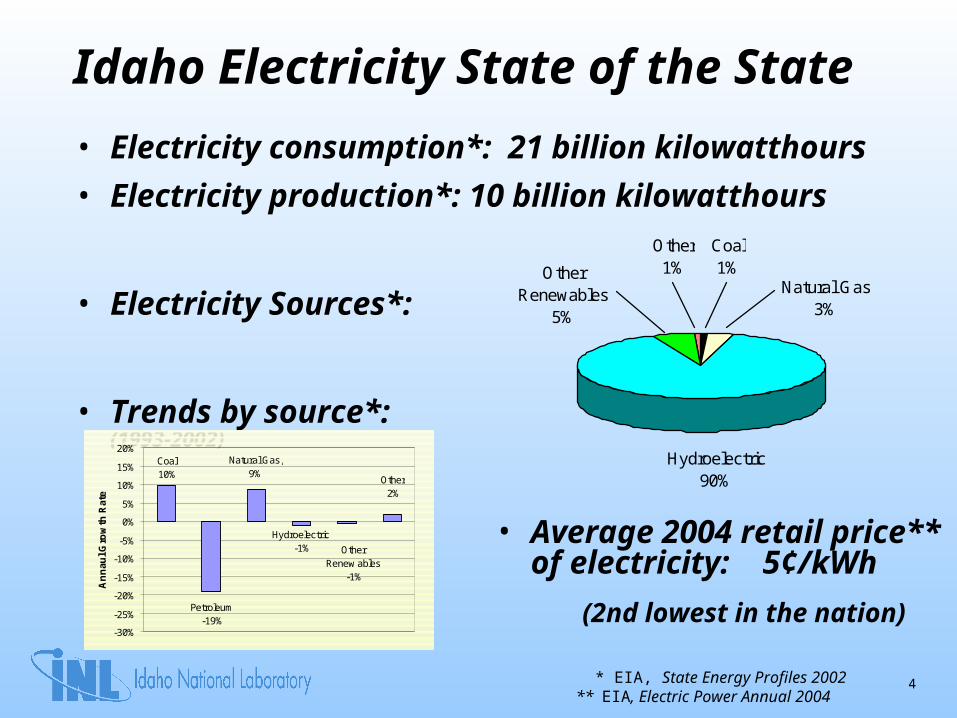
Idaho Electricity State of the State
• Electricity consumption*: 21 billion kilowatthours
• Electricity production*: 10 billion kilowatthours
• Electricity Sources*:
• Trends by source*:(1993-2002)
• Average 2004 retail price** of electricity: 5¢/kWh
(2nd lowest in the nation)
Natural Gas3%
Other Renewables
5%
Other1%
Coal1%
Hydroelectric90%
Coal 10% Other
2%
Natural Gas, 9%
Other Renew ables
-1%
Hydroelectric -1%
Petroleum -19%
-30%
-25%
-20%
-15%
-10%
-5%
0%
5%
10%
15%
20%
An
nau
l Gro
wth
Rat
e
* EIA, State Energy Profiles 2002** EIA, Electric Power Annual 2004
5
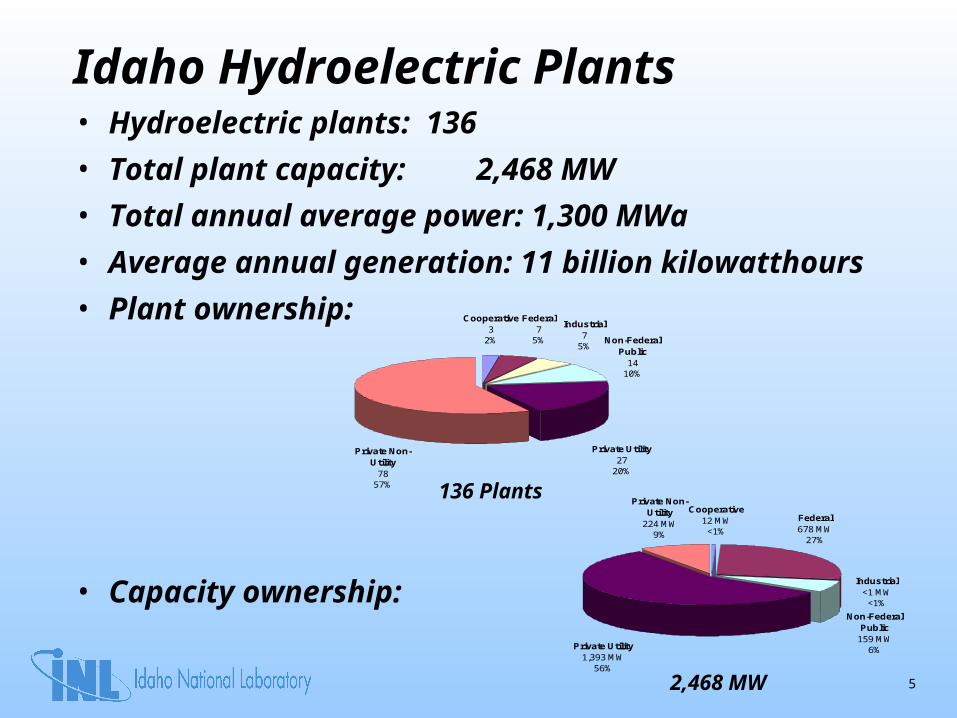
Idaho Hydroelectric Plants• Hydroelectric plants: 136
• Total plant capacity: 2,468 MW
• Total annual average power: 1,300 MWa
• Average annual generation: 11 billion kilowatthours
• Plant ownership:
• Capacity ownership:
Private Utility27
20%
Non-Federal Public
1410%
Industrial7
5%
Federal7
5%
Cooperative3
2%
Private Non-Utility
7857%
Industrial<1 MW
<1%
Non-Federal Public
159 MW6%
Federal678 MW
27%
Cooperative12 MW
<1%
Private Non-Utility
224 MW9%
Private Utility1,393 MW
56%
136 Plants
2,468 MW
6
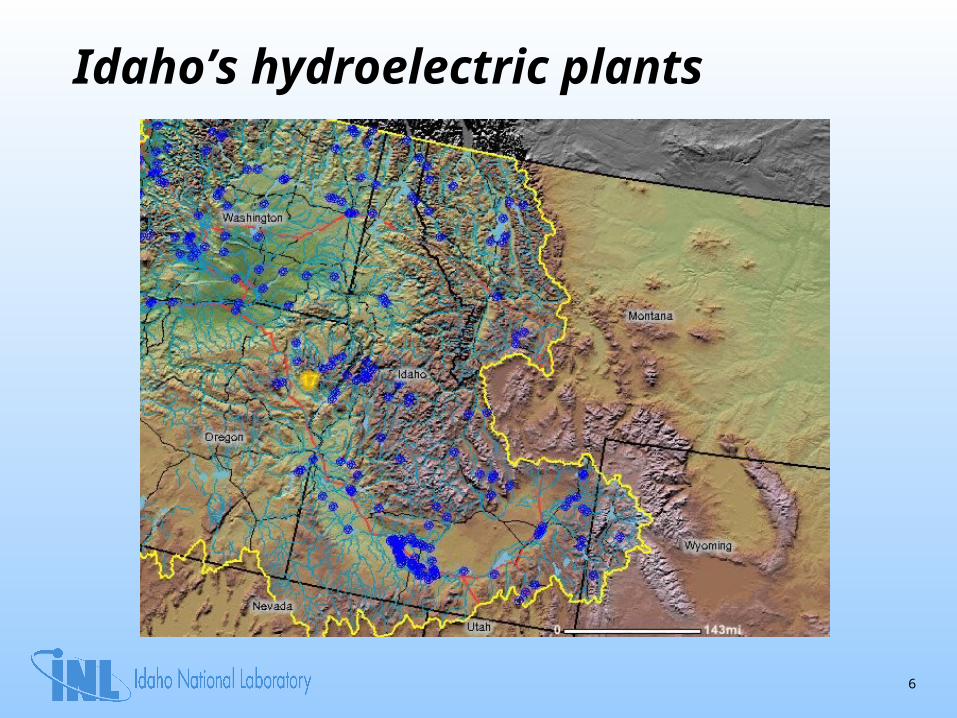
Idaho’s hydroelectric plants
7
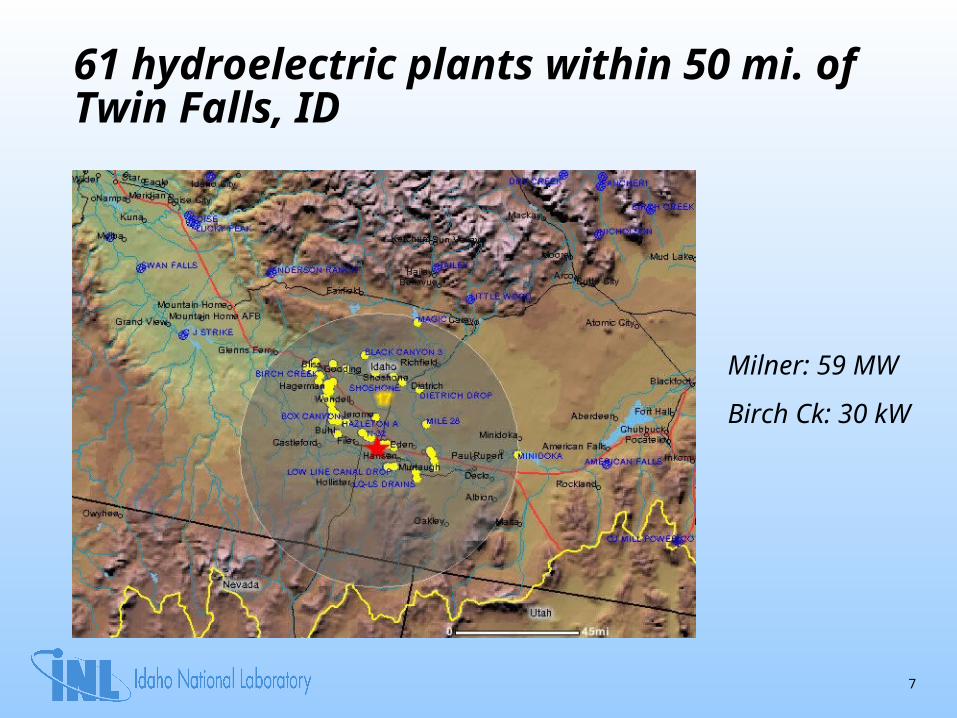
61 hydroelectric plants within 50 mi. of Twin Falls, ID
Milner: 59 MW
Birch Ck: 30 kW
8
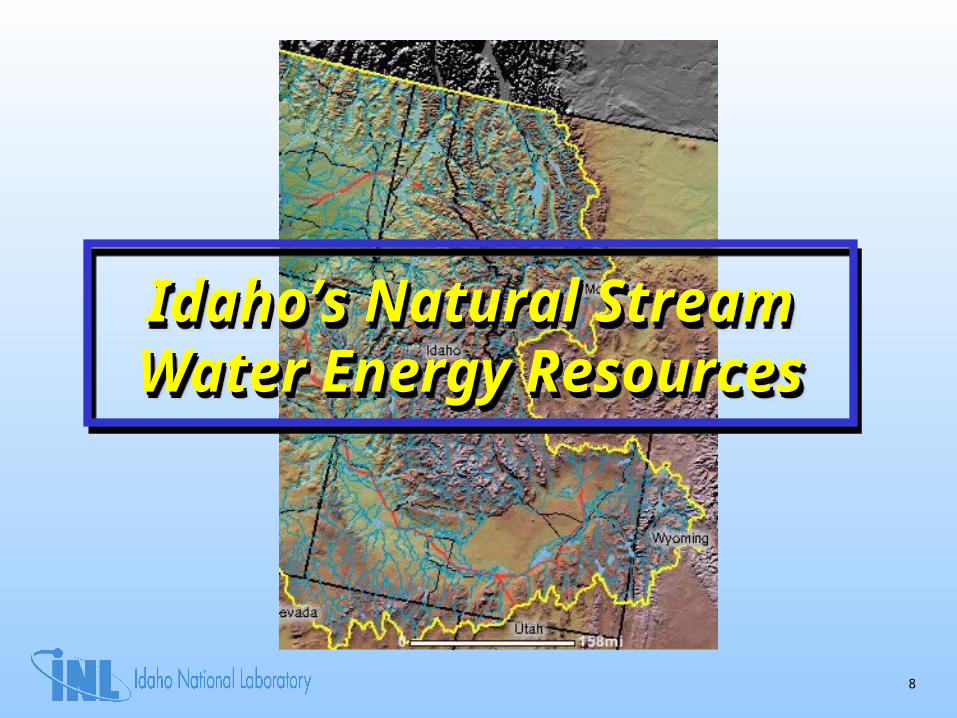
Idaho’s Natural Stream Idaho’s Natural Stream Water Energy ResourcesWater Energy ResourcesIdaho’s Natural Stream Idaho’s Natural Stream
Water Energy ResourcesWater Energy Resources
9
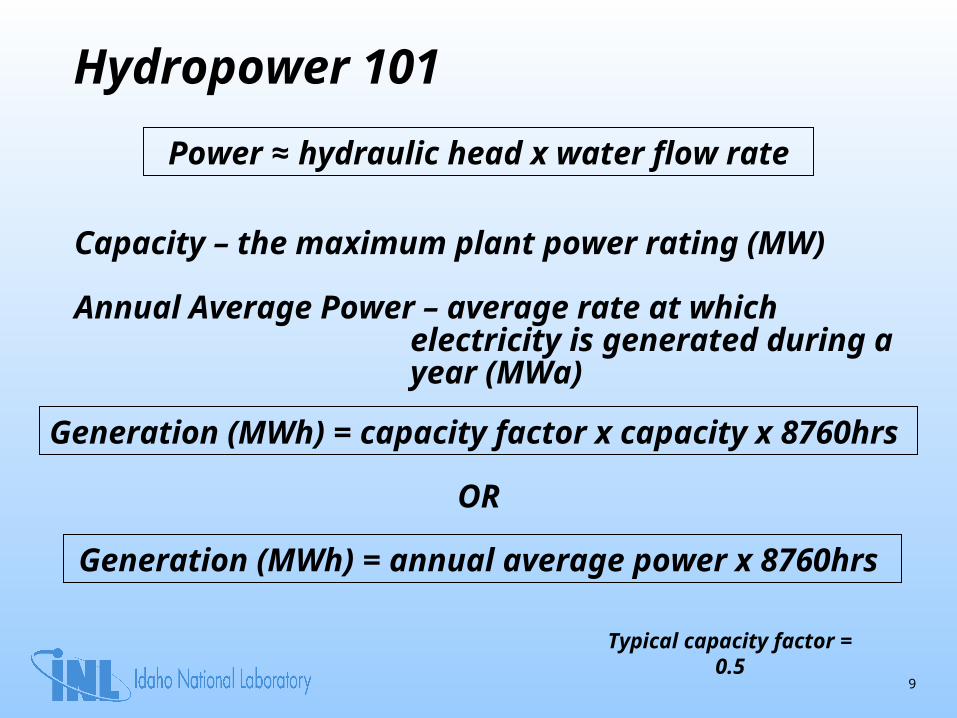
Hydropower 101
Capacity – the maximum plant power rating (MW)
Annual Average Power – average rate at which electricity is generated during a year (MWa)
Power ≈ hydraulic head x water flow rate
Generation (MWh) = capacity factor x capacity x 8760hrs
OR
Generation (MWh) = annual average power x 8760hrs
Typical capacity factor = 0.5
10
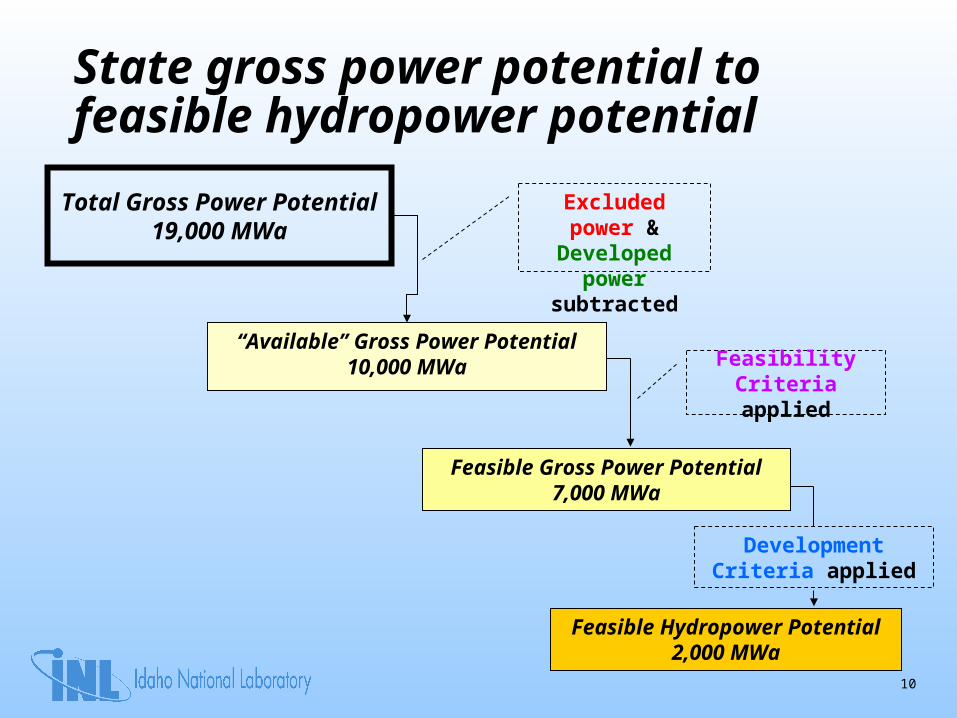
State gross power potential to feasible hydropower potential
Total Gross Power Potential19,000 MWa
Excluded power & Developed power
subtracted
Feasibility Criteriaapplied
“Available” Gross Power Potential10,000 MWa
Feasible Gross Power Potential7,000 MWa
Development Criteria applied
Feasible Hydropower Potential2,000 MWa
11
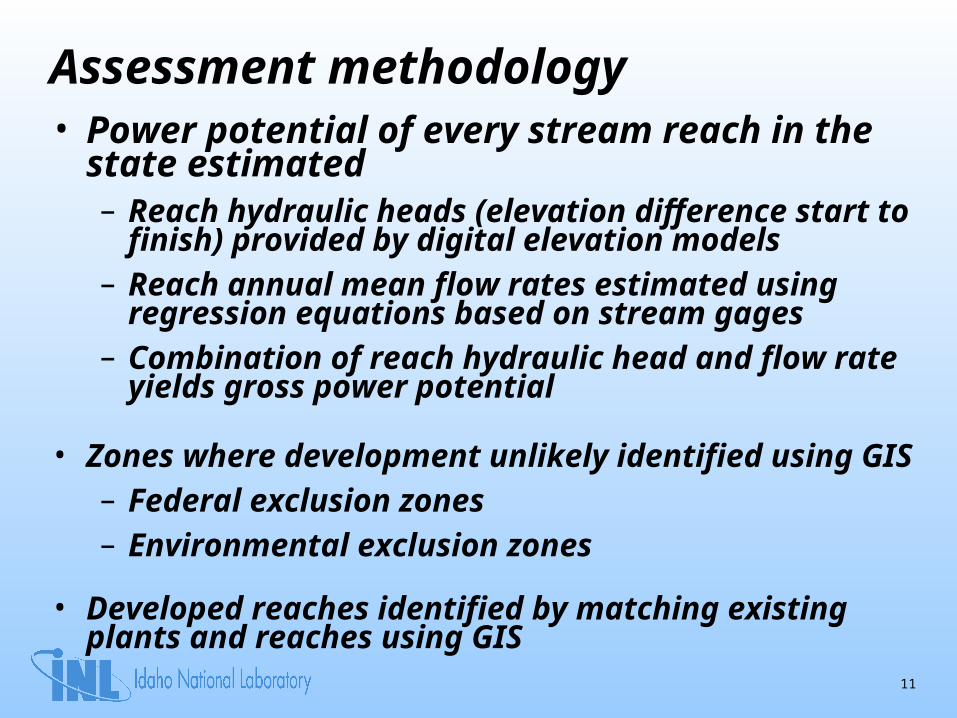
Assessment methodology• Power potential of every stream reach in the
state estimated– Reach hydraulic heads (elevation difference start to
finish) provided by digital elevation models– Reach annual mean flow rates estimated using
regression equations based on stream gages– Combination of reach hydraulic head and flow rate
yields gross power potential
• Zones where development unlikely identified using GIS– Federal exclusion zones– Environmental exclusion zones
• Developed reaches identified by matching existing plants and reaches using GIS
12
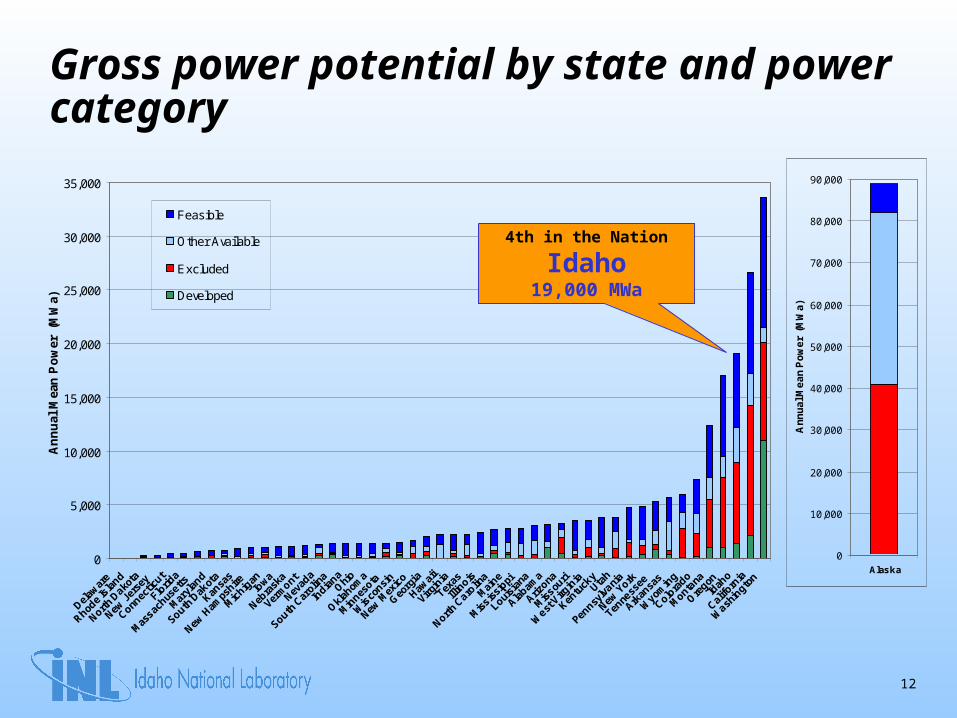
Gross power potential by state and power category
0
5,000
10,000
15,000
20,000
25,000
30,000
35,000
Delaw
are
Rhode
Isla
nd
North D
akota
New J
erse
y
Connec
ticut
Florid
a
Mas
sachus
etts
Mar
ylan
d
South D
akot
a
Kansa
s
New H
amps
hire
Mic
higanIo
wa
Nebra
ska
Verm
ont
Nevad
a
South C
arol
ina
India
naO
hio
Okl
ahom
a
Min
nesota
Wis
consi
n
New M
exic
o
Geo
rgia
Hawai
i
Virgin
ia
Texas
Illin
ois
North C
arolin
a
Mai
ne
Mis
sissi
ppi
Louisi
ana
Alabam
a
Arizona
Mis
souri
West
Virg
inia
Kentu
ckyUta
h
Pennsy
lvani
a
New Y
ork
Tenne
ssee
Arkan
sas
Wyom
ing
Colora
do
Monta
na
Ore
gonId
aho
Califo
rnia
Wash
ingto
n
An
nu
al M
ean
Po
wer
(M
Wa)
Feasible
Other Available
Excluded
Developed
0
10,000
20,000
30,000
40,000
50,000
60,000
70,000
80,000
90,000
Alaska
An
nu
al M
ea
n P
ow
er
(M
Wa
)
4th in the Nation
Idaho19,000 MWa
13
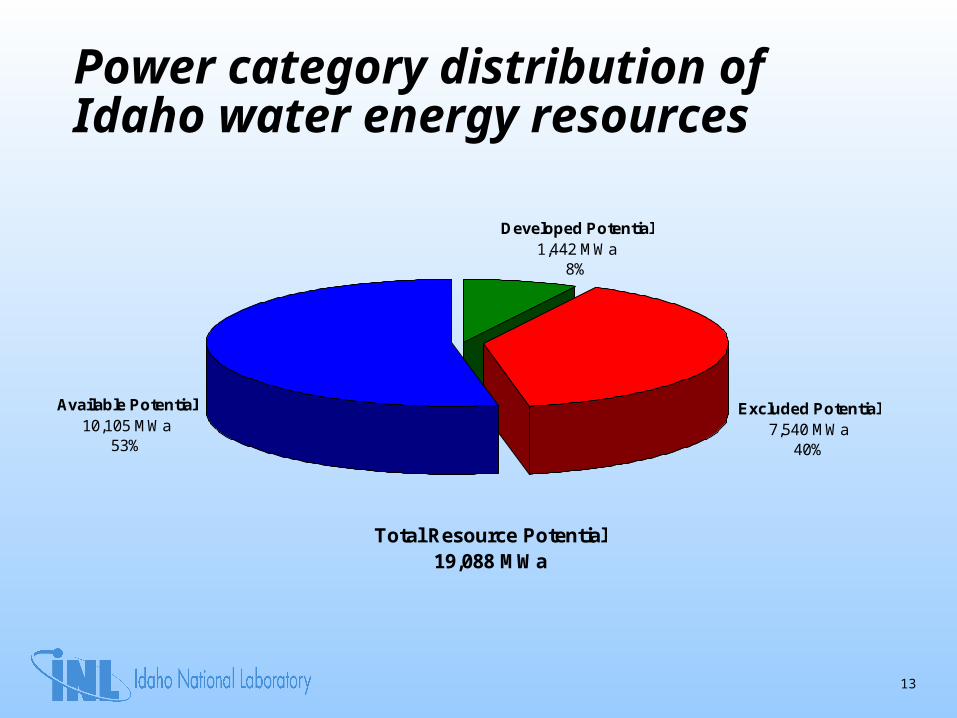
Power category distribution of Idaho water energy resources
Total Resource Potential19,088 MWa
Excluded Potential7,540 MWa
40%
Developed Potential1,442 MWa
8%
Available Potential10,105 MWa
53%
14
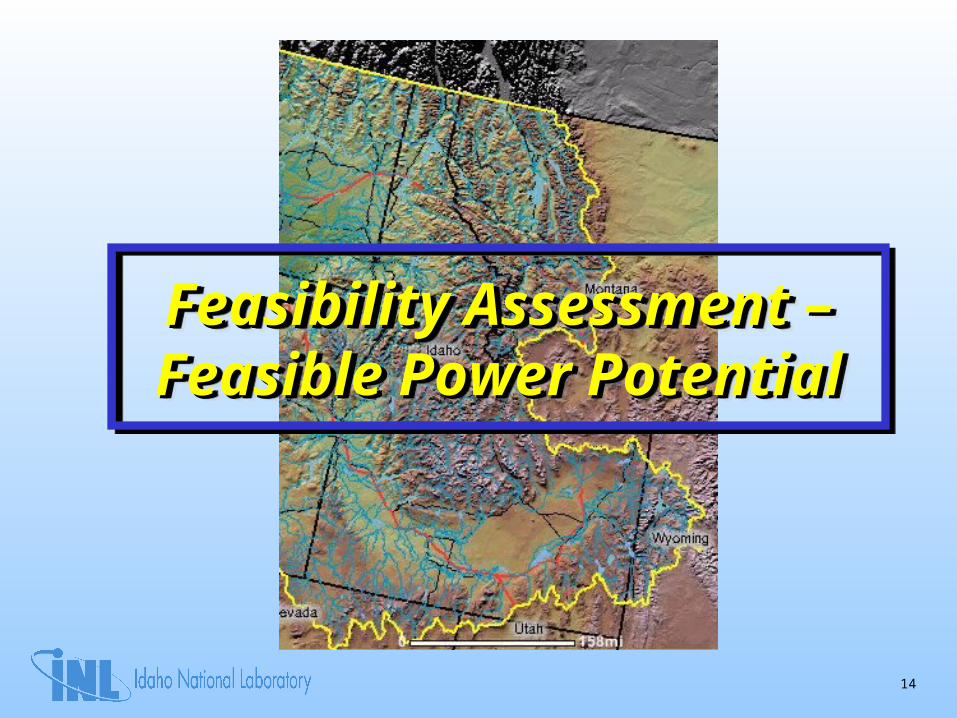
Feasibility Assessment – Feasibility Assessment – Feasible Power PotentialFeasible Power PotentialFeasibility Assessment – Feasibility Assessment – Feasible Power PotentialFeasible Power Potential
15
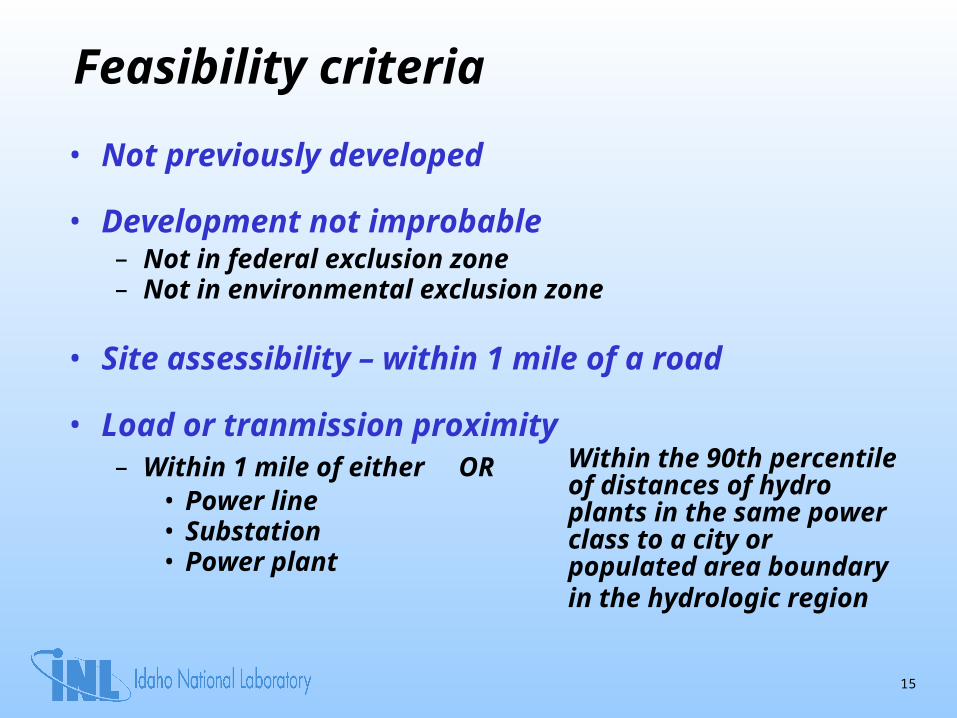
Feasibility criteria
• Not previously developed
• Development not improbable– Not in federal exclusion zone– Not in environmental exclusion zone
• Site assessibility – within 1 mile of a road
• Load or tranmission proximity– Within 1 mile of either OR
• Power line• Substation • Power plant
Within the 90th percentile of distances of hydro plants in the same power class to a city or populated area boundary in the hydrologic region
16
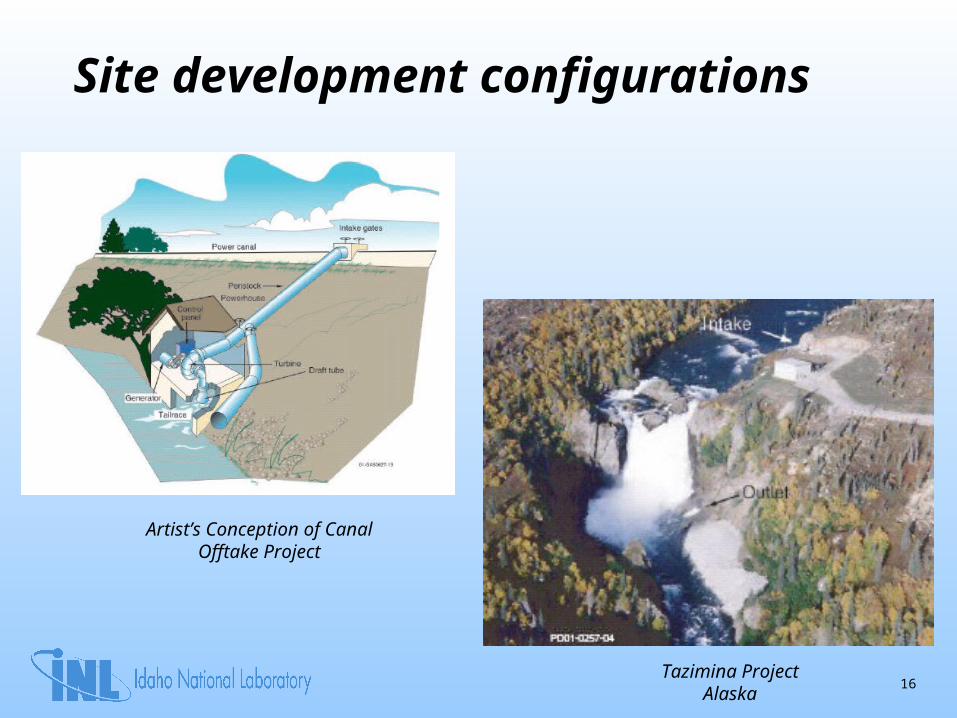
Site development configurations
Tazimina ProjectAlaska
Artist’s Conception of Canal Offtake Project
17
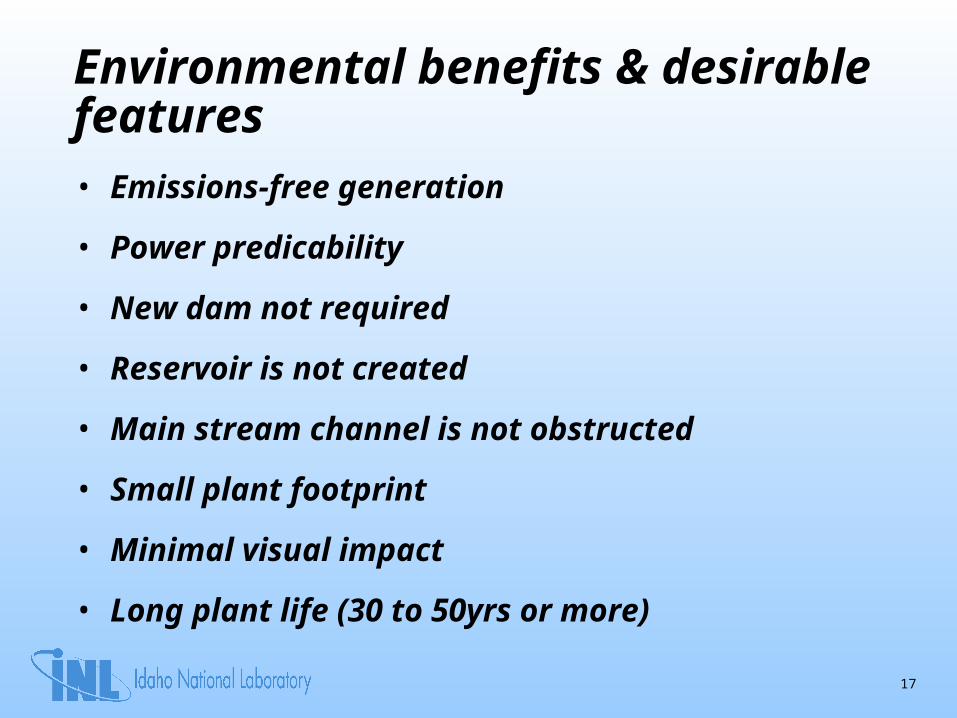
Environmental benefits & desirable features• Emissions-free generation
• Power predicability
• New dam not required
• Reservoir is not created
• Main stream channel is not obstructed
• Small plant footprint
• Minimal visual impact
• Long plant life (30 to 50yrs or more)
18
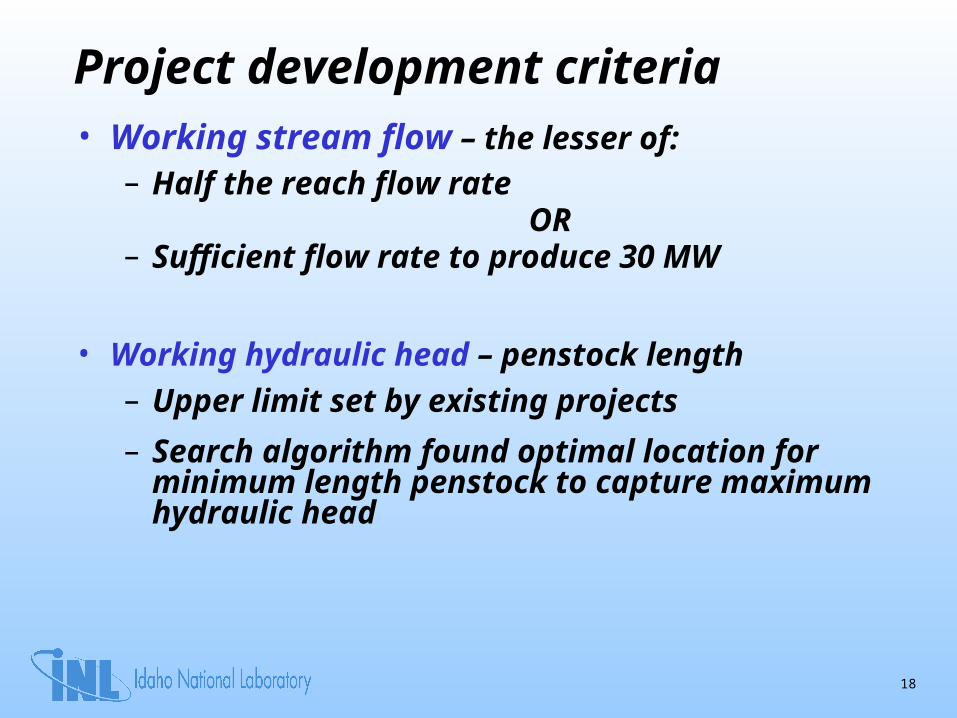
Project development criteria• Working stream flow – the lesser of:
– Half the reach flow rateOR
– Sufficient flow rate to produce 30 MW
• Working hydraulic head – penstock length– Upper limit set by existing projects
– Search algorithm found optimal location for minimum length penstock to capture maximum hydraulic head
19
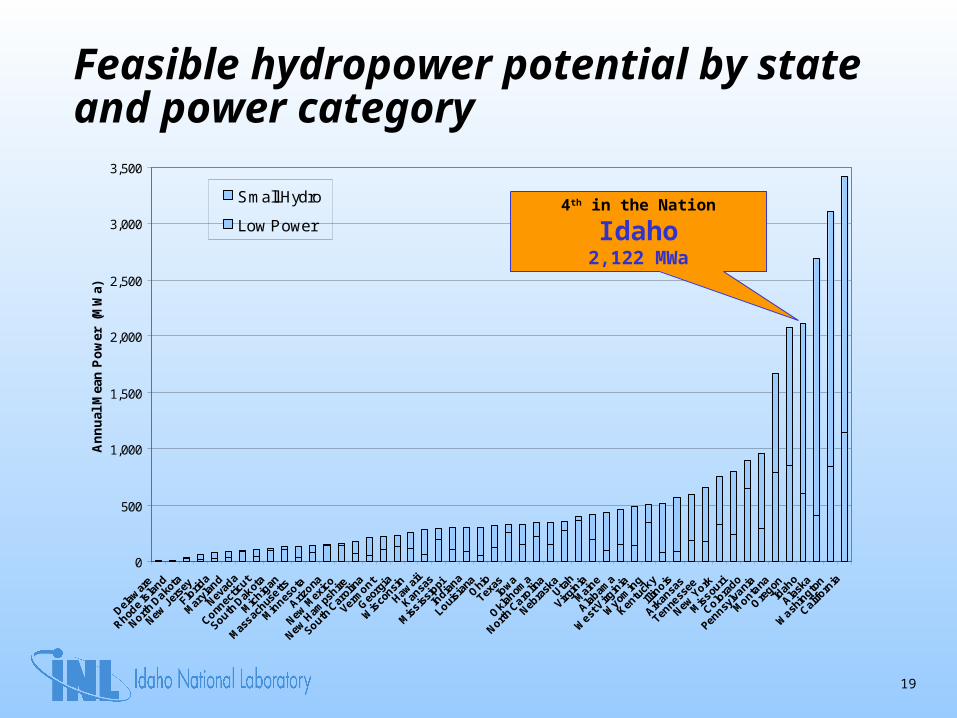
Feasible hydropower potential by state and power category
0
500
1,000
1,500
2,000
2,500
3,000
3,500
Delaw
are
Rhode
Isla
nd
North D
akota
New J
erse
y
Florid
a
Mar
ylan
d
Nevad
a
Connec
ticut
South D
akot
a
Mic
higan
Mas
sachus
etts
Min
nesota
Arizona
New M
exic
o
New H
amps
hire
South C
arol
ina
Verm
ont
Geo
rgia
Wis
consi
n
Hawai
i
Kansa
s
Mis
sissi
ppi
India
na
Louisi
anaO
hio
TexasIo
wa
Okl
ahom
a
North C
arolin
a
Nebra
skaUta
h
Virgin
ia
Mai
ne
Alabam
a
West
Virg
inia
Wyom
ing
Kentu
cky
Illin
ois
Arkan
sas
Tenne
ssee
New Y
ork
Mis
souri
Colora
do
Pennsy
lvani
a
Monta
na
Ore
gonId
aho
Alask
a
Wash
ingto
n
Califo
rnia
An
nu
al M
ean
Po
wer
(M
Wa)
Small Hydro
Low Power4th in the Nation
Idaho2,122 MWa
20
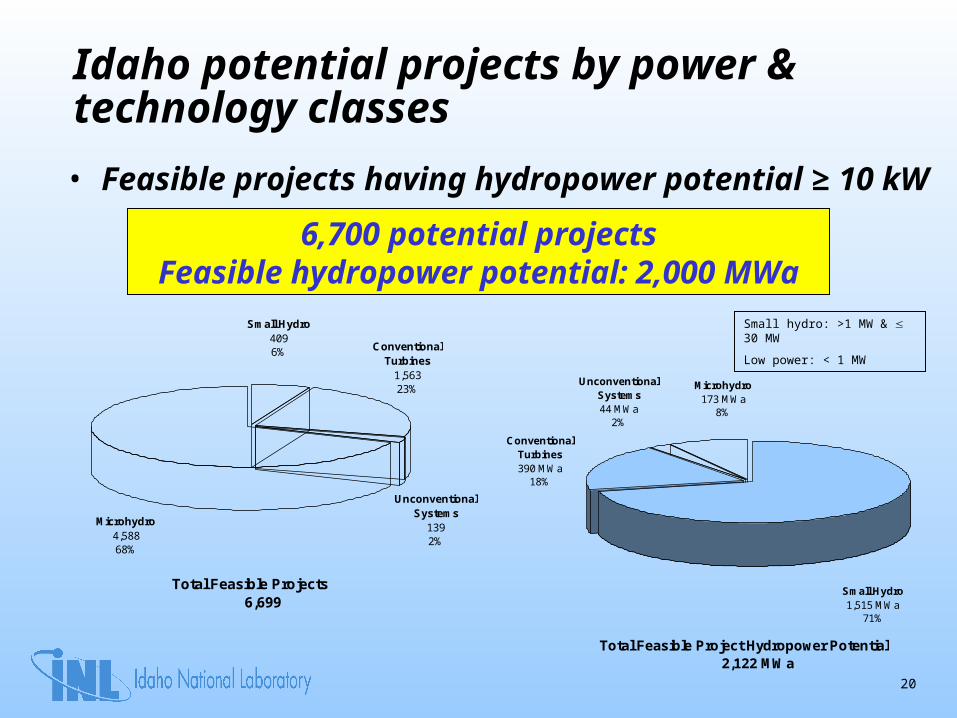
Idaho potential projects by power & technology classes
• Feasible projects having hydropower potential ≥ 10 kW
6,700 potential projectsFeasible hydropower potential: 2,000 MWa
Total Feasible Projects 6,699
Unconventional Systems
1392%
Microhydro4,58868%
Conventional Turbines
1,56323%
Small Hydro4096%
Total Feasible Project Hydropower Potential 2,122 MWa
Microhydro173 MWa
8%
Unconventional Systems44 MWa
2%
Conventional Turbines390 MWa
18%
Small Hydro1,515 MWa
71%
Small hydro: >1 MW & 30 MW
Low power: < 1 MW
21
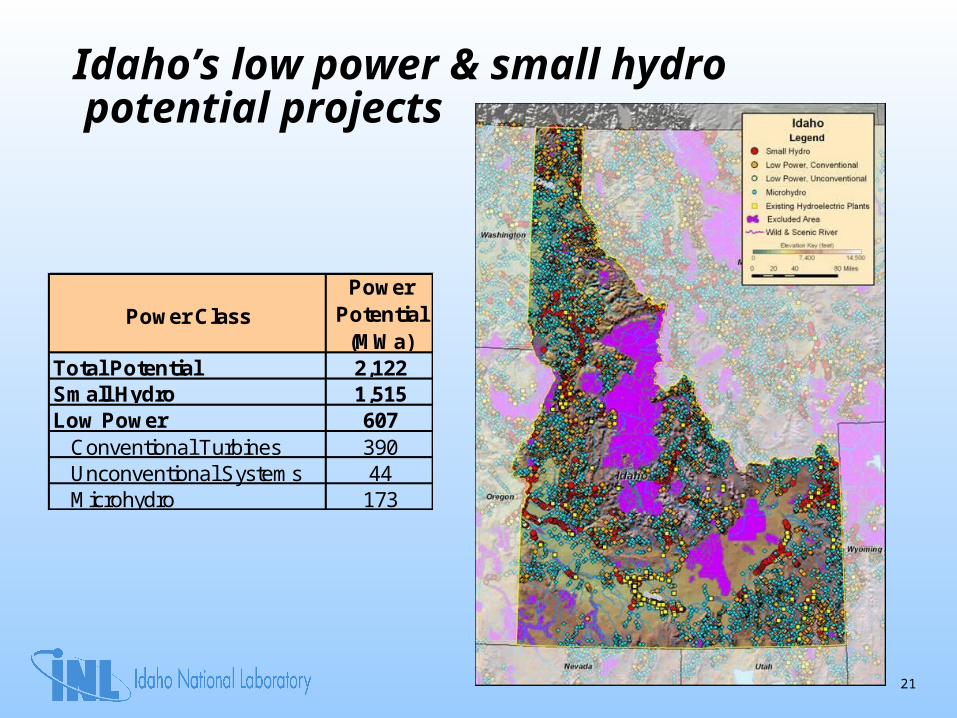
Idaho’s low power & small hydro potential projects
Power ClassPower
Potential(MWa)
Total Potential 2,122Small Hydro 1,515Low Power 607
Conventional Turbines 390Unconventional Systems 44Microhydro 173

22
Idaho hydroelectric growth potential from new low power and small hydro plants
Current Total Average Power
1,300 MWa
Potential Small Hydro1,515 MWa
Potential Low Power607 MWa
Current Annual Hydroelectric Generation
11 x 109 kWh
Annual Hydroelectric Generation w/ New Small Hydro
24 x 109 kWh
Annual Hydroelectric Generation w/ New Low Power & Small Hydro
30 x 109 kWh
Idaho Annual Consumption21 x 109 kWh
0
500
1,000
1,500
2,000
2,500
3,000
3,500
Ave
rag
e P
ow
er (
MW
a)
23
Opportunities & CostsOpportunities & CostsOpportunities & CostsOpportunities & Costs
24
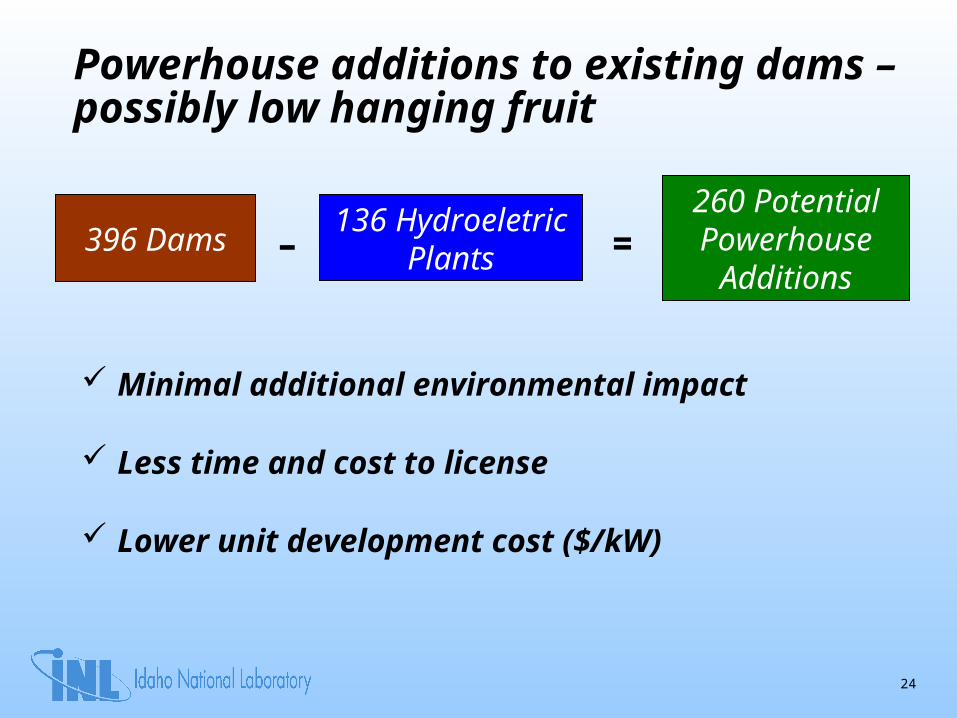
Powerhouse additions to existing dams – possibly low hanging fruit
Minimal additional environmental impact
Less time and cost to license
Lower unit development cost ($/kW)
396 Dams136 Hydroeletric
Plants =260 Potential Powerhouse
Additions–
25
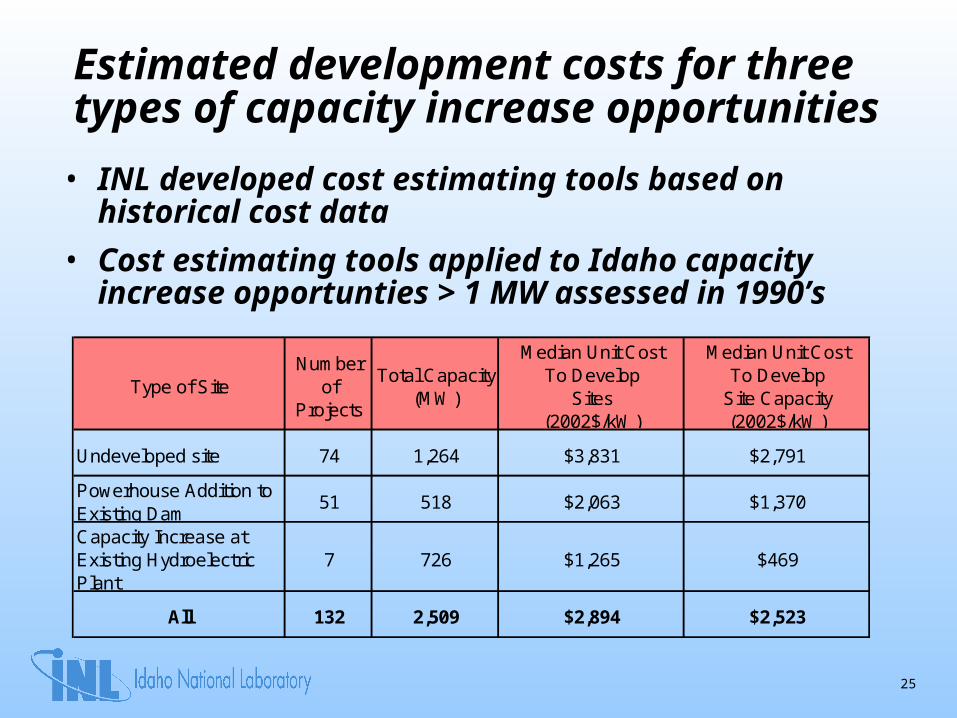
Estimated development costs for three types of capacity increase opportunities
• INL developed cost estimating tools based on historical cost data
• Cost estimating tools applied to Idaho capacity increase opportunties > 1 MW assessed in 1990’s
Type of SiteNumber
ofProjects
Total Capacity(MW)
Median Unit CostTo Develop
Sites(2002$/kW)
Median Unit CostTo Develop
Site Capacity(2002$/kW)
Undeveloped site 74 1,264 $3,831 $2,791
Powerhouse Addition to Existing Dam
51 518 $2,063 $1,370
Capacity Increase at Existing Hydroelectric Plant
7 726 $1,265 $469
All 132 2,509 $2,894 $2,523
26
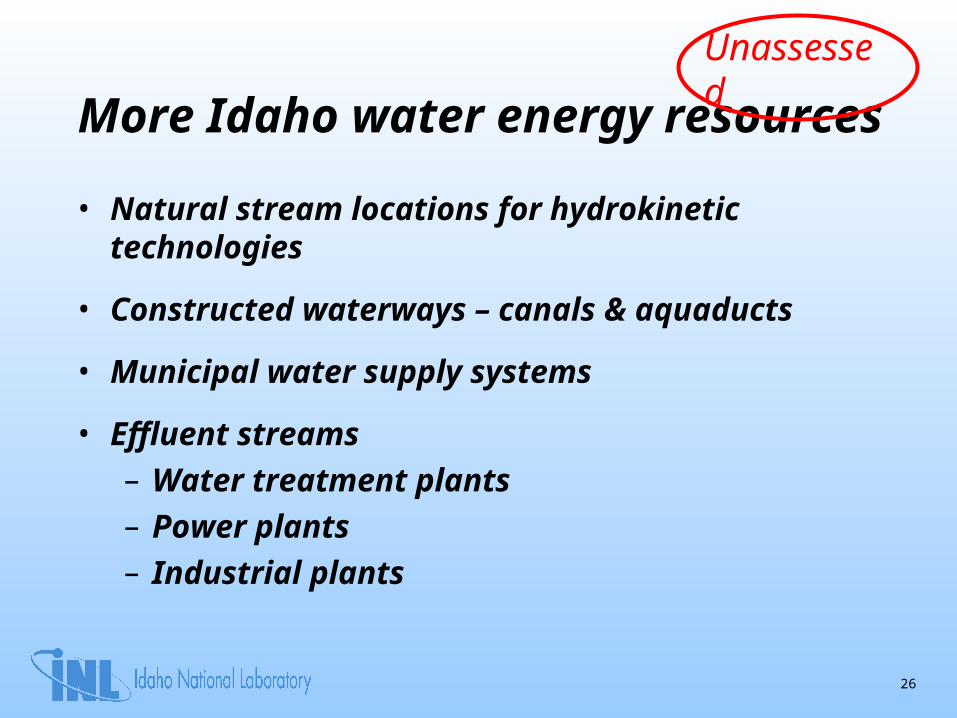
More Idaho water energy resources
• Natural stream locations for hydrokinetic technologies
• Constructed waterways – canals & aquaducts
• Municipal water supply systems
• Effluent streams– Water treatment plants– Power plants– Industrial plants
Unassessed
27
Virtual Hydropower Prospector
Virtual Hydropower Prospector
28
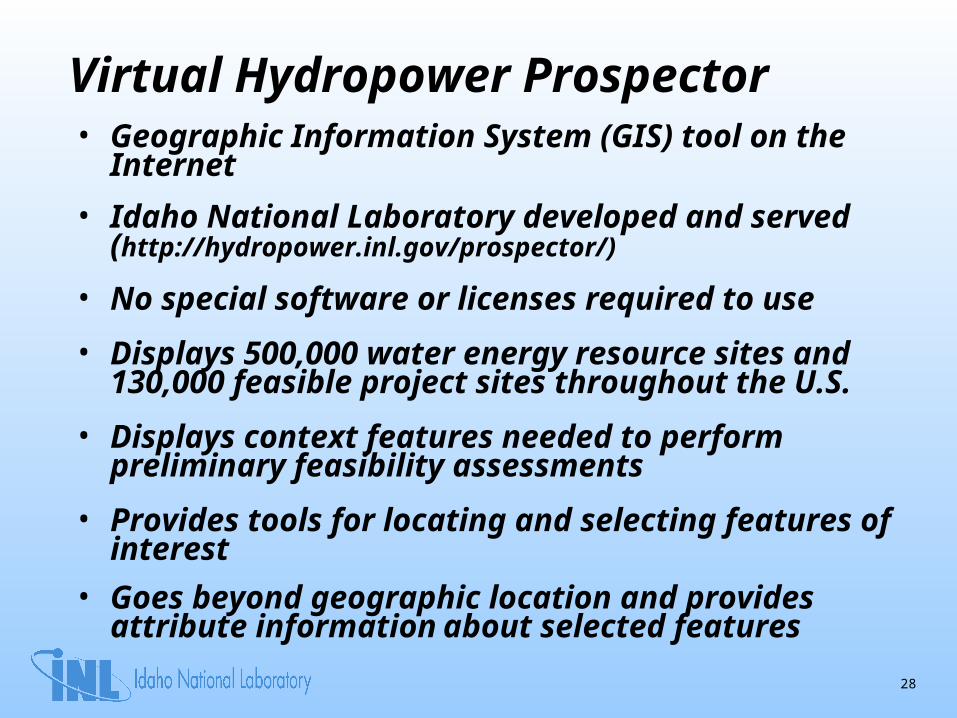
• Geographic Information System (GIS) tool on the Internet
• Idaho National Laboratory developed and served (http://hydropower.inl.gov/prospector/)
• No special software or licenses required to use
• Displays 500,000 water energy resource sites and 130,000 feasible project sites throughout the U.S.
• Displays context features needed to perform preliminary feasibility assessments
• Provides tools for locating and selecting features of interest
• Goes beyond geographic location and provides attribute information about selected features
Virtual Hydropower Prospector
29
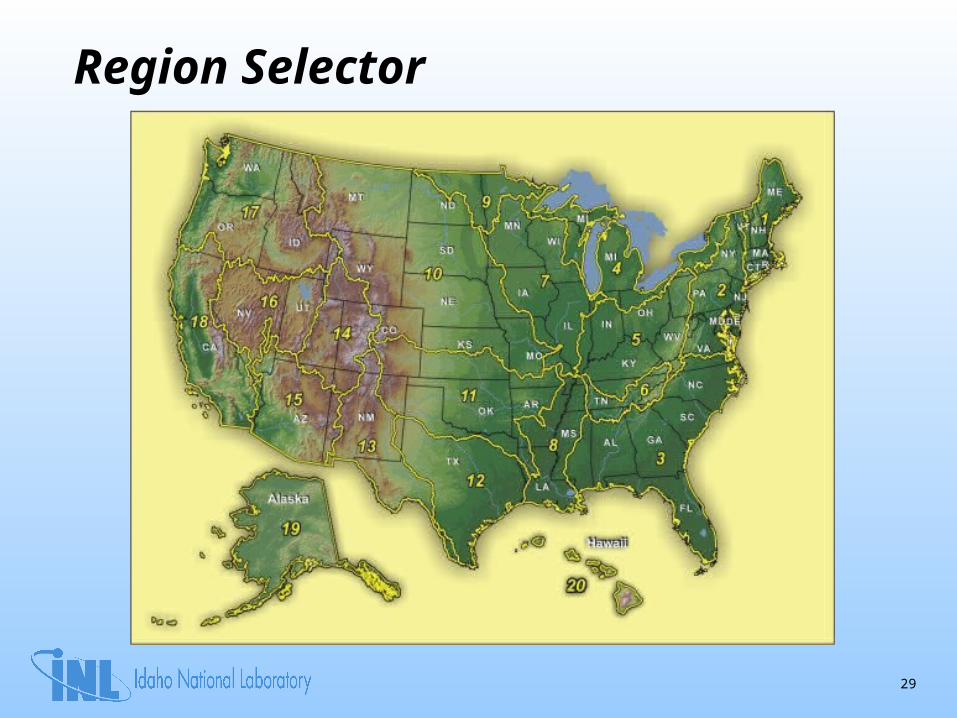
Region Selector
30
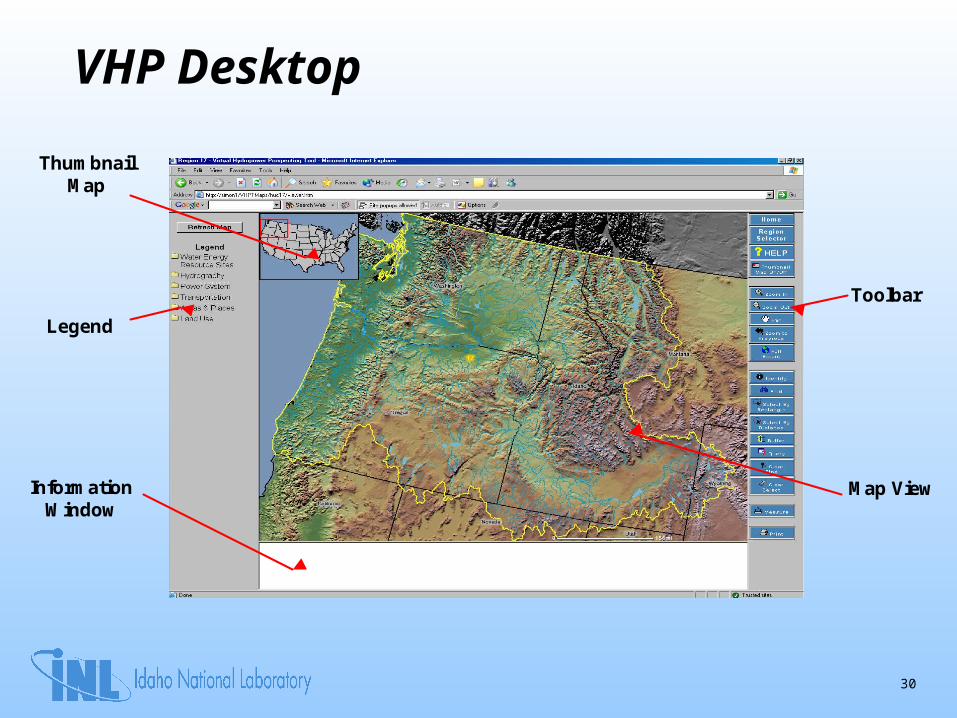
VHP Desktop
Legend
Thumbnail Map
Information Window
Toolbar
Map View
31
Features displayed
• Water energy features– Water energy resource
sites (500,000 sites)– Feasible potential projects
(130,000 sites)
• Hydrography (5 feature sets)
• Power system– Hydro plants– Other plants– Power lines– Substations
• Transporation– Roads– Railroads
• Areas & places– Cities– Populated areas– County boundaries– State boundaries– Hydrologic region
boundaries
• Land Use– Excluded areas
• Federally designated• Environmentally sensitive
– Bureau of Indian Affairs (BIA)– Bureau of Land Management (BLM)– Bureau of Reclamation (BOR)– Department of Defense (DOD)– U.S. Forest Service (FS)– U.S. Fish & Wildlife Service (FWS)– U.S. National Park Service (NP)
32
Conclusions• Idaho has a history of hydroelectric generation which
now allows it to enjoy the among the lowest electricity rates in the country
• Over 50% of the Idaho’s water energy resources have not been developed and are not in development exclusion zones
• Idaho could significantly increase hydroelectric generation using undeveloped sites, existing dams, equipment upgrades, non-traditional resources, and new technology
• Costs of new hydroelectric plants are competitive considering environmental benefits, attractive features, and long life
• Virtual Hydropower Prospector provides all hydropower stakeholders with a tool to evaluate new hydropower development
33
Access to references and VHP• Access: http://hydropower.inl.gov/
• References: (Resource Assessment link)
– Feasibility Assessment of the Water Energy Resources of the United States for New Low Power and Small Hydro Classes of Hydroelectric Plants, DOE-ID-11263, January 2006.
– Water Energy Resources of the United States with Emphasis on Low Head/Low Power Resources, DOE/ID-11111, April 2004.
– Estimation of Economic Parameters of U.S. Hydroelectric Resources, INEEL/EXT-03-00662, June 2003.
– U.S. Hydropower Resource Assessment Final Report, DOE/ID-10430.2, December 1998.
• VHP: Virtual Hydropower Prospector link
34
Contact
Douglas G. Hall, Program ManagerINL Hydropower Program
Idaho National Laboratory
2525 Fremont Ave.
Idaho Falls, ID 83415-3830
Telephone: 208-526-9525
Email: [email protected]