Embed Size (px)
Citation preview
CLIMATE RISK PERCEPTIONS IN THE ONTARIO (CANADA) ELECTRICITY SECTOR
Anna Dowbiggin, BA, MBA
Submitted for the degree of
Doctor of Business Administration
Heriot-Watt University, Edinburgh Business School
February 21, 2018
THE COPYRIGHT IN THIS THESIS IS OWNED BY THE AUTHOR. ANY
QUOTATION FROM THIS THESIS OR USE OF ANY OF THE INFORMATION
CONTAINED IN IT MUST ACKNOWLEDGE THIS THESIS AS THE SOURCE OF
THE QUOTATION OR INFORMATION.
ii
ABSTRACT
This thesis examines management cognition of climate risks in the electricity sector in Ontario
(Canada).
Risk perception literature is combined with corporate adaptation and risk management literature to
offer a broad conceptual framework of climate risk readiness among power producers and utilities.
This research aims to move management cognition of climate change past prior contributions which
considered climate risk as being solely physical in nature. In this work, eight exogenous and
endogenous factors relating to climate risk are examined for their influence on how management may
view a wider spectrum of climate change impacts. Using an inductive research approach, 20 in depth
case studies explore how electricity executives/senior managers perceive those risks using construct
elicitation (repertory grid technique). Findings are triangulated with a narrative analysis of their
corporate reportage of climate risks, to gain deeper insight into the complex phenomena of climate
risks for the sector.
Findings show some similarities and some appreciable differences in both groups’ view of climate
risks despite their legitimately contending positions in industry. Overall both power producers and
utilities are predominantly concerned with risk analysis and assessment of climate related risks, and
less with risk response, suggesting at present the sector remains in an analytical state. The potential
benefits of this research approach will provide useful insights to multiple groups including managers
and policy makers.

iii
ACKNOWLEDGEMENTS
Writing this thesis has been a monk’s walk. A very long walk indeed. Along the way, there have been
many individuals to whom I am grateful for their support and unwavering belief in my ability to stay
the course.
At the start I’d like to thank Dr. Steve Chapman for his kind and encouraging words when I entered
the DBA program, Dr. Neil Kay for his patience while I sorted out my research proposal, and then,
Prof. Devi Jankowicz, my advisor, for his guiding wisdom throughout the process. A heartfelt thank
you for your advice through it all. It is hard for me to imagine how I would have ever started or
completed this work without your patience and guidance. Devi, it has been a transformational
experience and I sincerely thank you.
These acknowledgements would be incomplete without the recognition of colleagues, friends and
family who believed in me, fed me and otherwise indulged me while I shut myself off from the
normal distractions of life, to keep going. I would especially like to acknowledge my dear friends Dr.
Betty Trott, whose fireside chats over single malts helped keep my perspective, and Dr. Marianne
Fedunkiw whose joyful outlook on life made me ‘lighten up’ at times. I would also like to thank
another EBS doctoral graduate Dr. Carmen Dima, who has since become my friend here in Canada.
Thank you, Carmen, for the lively coffee shop discussions and your encouraging advice. And to Serge
Collins who insisted on playing weekly games of chess with me to break up the endless reading and
writing.
Last but not least, I wish to thank my father posthumously - who became an academic later in life. Not
only did he encourage me to dig for the truth, and to never be satisfied with easy answers to complex
questions. I also know he would have understood the unique challenge of earning an advanced degree
in mid-career. And lastly but most importantly, to my family, my children and especially to Lucia and
Edward and their future sisters and brothers, whose future may hold improvements and newer
approaches to the topic of this research. To you, in the words of Edmund Burke (1729-1797), please
consider that ‘You can never plan the future by the past’.
—Anna Dowbiggin, February 21, 2018
iv
v
TABLE OF CONTENTS
ABSTRACT ............................................................................................................................... ii
ACKNOWLEDGEMENTS .................................................................................................................. iii
LIST OF TABLES ............................................................................................................................. xii
LIST OF FIGURES ............................................................................................................................ xiii
LIST OF APPENDICES ...................................................................................................................... xiv
LIST OF ACRONYMS AND ABBREVIATIONS .............................................................................. xv
GLOSSARY ............................................................................................................................. xvi
CHAPTER 1 INTRODUCTION ............................................................................................................ 1
1.1 RESEARCH AIMS ................................................................................................................ 1
1.2 BACKGROUND ................................................................................................................... 2
1.2.1 Electricity Sector at Risk in Ontario .................................................................................... 2
1.2.2 Risk Perceptions in the Electricity Sector ........................................................................... 4
1.3 POWER PRODUCERS AND UTILITIES IN ONTARIO ................................................... 4
1.4 RATIONALE ......................................................................................................................... 5
1.5 SOURCES OF CLIMATE RISK IMPACTS ........................................................................ 6
1.5.1 External Exogenous Factors ................................................................................................ 6
1.5.2 Endogenous Pressures ......................................................................................................... 7
1.5.3 Climate Change as Exogenous Pressure .............................................................................. 7
1.5.3.1 Non-Linear, Dynamic and Chaotic Characteristics ..................................................... 7
1.5.3.2 Deeply Uncertain Characteristic ................................................................................. 7
1.5.3.3 Dangerous Characteristic ............................................................................................ 8
1.5.3.4 Systemic Characteristic ............................................................................................... 8
1.5.4 Government Policy and Regulation as Exogenous Pressure ............................................... 8
1.5.5 Climate Data as Exogenous Pressure .................................................................................. 9
1.5.6 Aging Infrastructure as Exogenous Pressure ....................................................................... 9
1.5.7 Organizational Capacity and Organizational Resources as Endogenous Pressure .............. 9
1.5.8 Technical Knowledge as Endogenous Pressure ................................................................ 10
1.6 THE ELECTRICITY SECTOR IN ONTARIO (CANADA) .............................................. 10
vi
1.7 MANAGEMENT COGNITION, RISK PERCEPTONS, AND PERSONAL
CONSTRUCTS .................................................................................................................... 10
1.8 RESEARCH AIM, OBJECTIVES, AND RESEARCH QUESTIONS ............................... 12
1.9 METHODOLOGY OVERVIEW ........................................................................................ 12
1.10 SIGNIFICANCE .................................................................................................................. 13
1.11 OUTLINE OF THESIS ........................................................................................................ 13
CHAPTER 2: LITERATURE REVIEW .............................................................................................. 15
2.1 INTRODUCTION ............................................................................................................... 15
2.1.1 Overview and rationale for the selected literature threads ................................................ 15
2.2 CLIMATE CHANGE AND CLIMATE SCIENCE ........................................................... 17
2.2.1 Terminology, Definitions, Semantics ................................................................................ 17
2.2.2 Differing Views of Climate Change Terminology ............................................................ 18
2.2.3 Hazard versus Risk Descriptions of Climate Change ........................................................ 19
2.2.4 ‘Dangerous’ Descriptions of Climate Change ................................................................... 19
2.2.5 ‘Uncertain’ Descriptions of Climate Change .................................................................... 20
2.2.6 The Climate Science Community ...................................................................................... 21
2.2.7 Climate Models and Climate Data .................................................................................... 22
2.3 ELECTRICITY SECTOR PARTICIPANTS ...................................................................... 23
2.3.1 The Electricity Sector’s Contribution to Critical Infrastructure ........................................ 23
2.3.2 The Electricity Sector in Ontario (Canada) ....................................................................... 25
2.3.3. Exogenous and Endogenous Pressures on studied sector group ....................................... 26
2.3.4 Exogenous Pressures #1—Governmental Pressures of Policy and Regulation................. 27
2.3.5 Exogenous Pressures #2—Climate Impacts, Climate Data and Aging Infrastructure ...... 29
2.3.6 Endogenous Pressures—Organizational Capacity, Resources, Technical Knowledge ..... 34
2.4 CORPORATE ADAPTATION TO CLIMATE CHANGE ................................................ 35
2.4.1 Adaptation to Impacts ....................................................................................................... 36
2.4.2 Factors Influencing Adaptation ......................................................................................... 36
2.4.3 Adaptation Process ............................................................................................................ 36
2.5 RISK MANAGEMENT OF CLIMATE IMPACTS............................................................ 37
vii
2.5.1 Risk Management as Type of Corporate Adaptation to Climate Impacts ......................... 38
2.5.2 Climate Risk Readiness ..................................................................................................... 38
2.6 MANAGEMENT COGNITION, RISK, AND RISK PERCEPTIONS THEORIES .......... 39
2.6.1 Management Cognition ..................................................................................................... 39
2.6.2 The Nature of Risk ............................................................................................................ 40
2.6.3 Theories of Risk Perception .............................................................................................. 42
2.6.3.1 Knowledge Theory of Risk Perception ..................................................................... 43
2.6.3.2 Personality Theory of Risk Perception ...................................................................... 44
2.6.3.3 Economic Theory of Risk Perception ....................................................................... 44
2.6.3.4 Political Theory of Risk Perception .......................................................................... 45
2.6.3.5 Cultural Theory of Risk Perception ........................................................................... 45
2.6.3.6 Psychological Theory of Risk Perception ................................................................. 47
2.6.3.7 Social Amplification of Risk ..................................................................................... 48
2.6.3.8 Integrative Model of Risk Perception ....................................................................... 48
2.7 SENSE MAKING AND PERSONAL CONSTRUCT THEORY ....................................... 51
2.7.1 Sensemaking Theory ........................................................................................................ 51
2.7.2 Personal Construct Theory ........................................................................................ 53
2.8 LITERATURE REVIEW SUMMARY ............................................................................... 55
2.9 LITERATURE SYNTHESIS .............................................................................................. 59
2.9.1 Gaps and Additional Critical Analysis of the Literature ........................................... 60
2.10 RESEARCH QUESTIONS AND FRAMEWORK OF ANALYSIS .................................. 61
2.11 CHAPTER SUMMARY ...................................................................................................... 62
CHAPTER 3 RESEARCH DESIGN AND METHODOLOGY .......................................................... 63
3.1 RESEARCH AIM ................................................................................................................ 63
3.2 RESEARCH OBJECTIVES ................................................................................................ 63
3.3 RESEARCH QUESTION .................................................................................................... 63
3.4 METHODOLOGY FOR THE EMPIRICAL WORK ......................................................... 63
3.5 RESEARCH PARADIGM .................................................................................................. 64
3.6 RESEARCH METHOD ....................................................................................................... 67
viii
3.7 RESEARCH DESIGN ......................................................................................................... 68
3.8. THEORY DEVELOPMENT ............................................................................................... 69
3.9 CASE STUDY SELECTION .............................................................................................. 70
3.9.1 Respondent Selection ........................................................................................................ 71
3.10. REPERTORY GRID TECHNIQUE .................................................................................... 72
3.11 REPERTORY GRID PROCEDURE ................................................................................... 73
3.11.1 Elements ............................................................................................................................ 74
3.11.2 Constructs .......................................................................................................................... 75
3.11.3 Grid Analysis—Cluster, Principal Component and Content Analyses ............................. 76
3.11.4 Honey’s (1979) Procedure ................................................................................................. 78
3.11.5 Bootstrapping Technique for Core Categorization ............................................................ 79
3.12 ETHICAL CONSIDERATIONS ......................................................................................... 79
CHAPTER 4 PILOT STUDY ............................................................................................................... 81
4.1 INTRODUCTION AND OBJECTIVES ............................................................................. 81
4.2 PILOT STUDY SAMPLE ................................................................................................... 81
4.3 PROCEDURE ...................................................................................................................... 82
4.4 DATA ANALYSIS .............................................................................................................. 82
4.5 PILOT STUDY RESULTS .................................................................................................. 83
4.5.1 Content Analysis (Individual) ........................................................................................... 83
Participant #1 ........................................................................................................................ 83
Participant #2 ........................................................................................................................ 84
4.5.2 Principal Component Analysis (Individual) ...................................................................... 84
4.5.3 Content Analysis (Aggregate Analysis) ............................................................................ 84
4.5.4 Honey (1979) Method ....................................................................................................... 85
4.5.5 Cross Case Analysis .......................................................................................................... 86
4.6 PILOT STUDY CONCLUSION ......................................................................................... 86
4.6.1 Achievement of Objectives ............................................................................................... 86
4.6.2 Pilot Study Outcomes and Implications ............................................................................ 87
Evaluation and implications of time constraints (participants) ............................................. 87
ix
Selection of a second data source ......................................................................................... 88
Implications for research design ........................................................................................... 88
Implications for research aim ................................................................................................ 88
Implications for research objectives ..................................................................................... 88
Implications for research questions ....................................................................................... 89
Implications for methodology ............................................................................................... 89
4.7 CHAPTER CONCLUSION ................................................................................................. 90
CHAPTER 5 FINDINGS AND ANALYSES ...................................................................................... 91
5.1 INTRODUCTION ............................................................................................................... 91
5.2 REPERTORY GRID INTERVIEWS .................................................................................. 91
5.2.1 Content Analysis ............................................................................................................... 92
5.2.2 Categories/Themes ............................................................................................................ 95
5.2.2.1 Risk Identification—Risk Source and Risk Effect .................................................... 96
5.2.2.2 Risk Assessment—Risk Characteristics and Risk Consequences ............................. 97
5.2.2.3 Risk Response—Risk Response Type, Timing, and Singular and Shared Corporate
Response.................................................................................................................... 97
5.2.3 Comparative Analysis ....................................................................................................... 98
5.2.4 Comparative Themes ......................................................................................................... 98
5.2.4.1 Power producers—Themes ....................................................................................... 98
5.2.4.2 Utilities—Themes ..................................................................................................... 99
5.2.5 Honey’s (1979) Technique ................................................................................................ 99
5.2.6 Element Analysis, Using Honey’s Technique ................................................................. 101
5.2.7 Summary of Findings Related to Grid Data .................................................................... 104
5.2.7.1 Overall Findings ...................................................................................................... 104
5.2.7.2 Comparative Findings ............................................................................................. 104
5.3 CORPORATE REPORT NARRATIVES ......................................................................... 105
5.3.1 Introduction ..................................................................................................................... 105
5.3.2 Narrative Analysis ........................................................................................................... 106
5.3.2.1 Step 1—Source Documents..................................................................................... 106
x
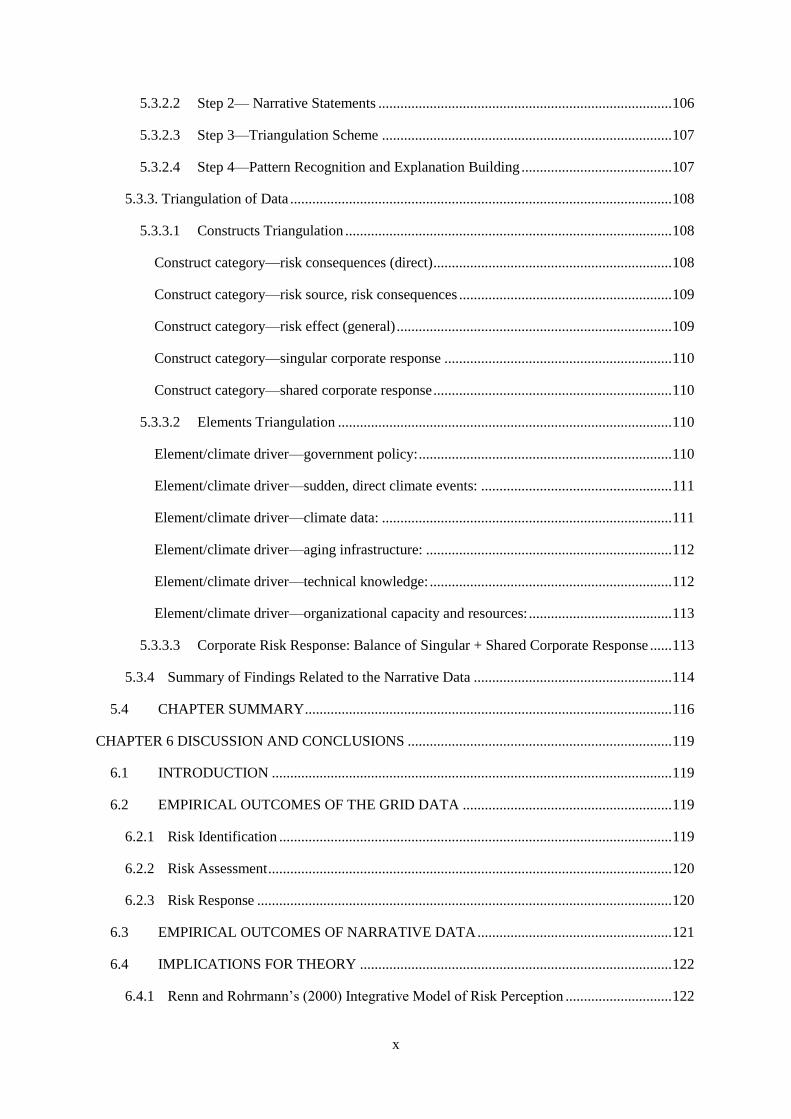
5.3.2.2 Step 2— Narrative Statements ................................................................................ 106
5.3.2.3 Step 3—Triangulation Scheme ............................................................................... 107
5.3.2.4 Step 4—Pattern Recognition and Explanation Building ......................................... 107
5.3.3. Triangulation of Data ........................................................................................................ 108
5.3.3.1 Constructs Triangulation ......................................................................................... 108
Construct category—risk consequences (direct) ................................................................. 108
Construct category—risk source, risk consequences .......................................................... 109
Construct category—risk effect (general) ........................................................................... 109
Construct category—singular corporate response .............................................................. 110
Construct category—shared corporate response ................................................................. 110
5.3.3.2 Elements Triangulation ........................................................................................... 110
Element/climate driver—government policy: ..................................................................... 110
Element/climate driver—sudden, direct climate events: .................................................... 111
Element/climate driver—climate data: ............................................................................... 111
Element/climate driver—aging infrastructure: ................................................................... 112
Element/climate driver—technical knowledge: .................................................................. 112
Element/climate driver—organizational capacity and resources: ....................................... 113
5.3.3.3 Corporate Risk Response: Balance of Singular + Shared Corporate Response ...... 113
5.3.4 Summary of Findings Related to the Narrative Data ...................................................... 114
5.4 CHAPTER SUMMARY .................................................................................................... 116
CHAPTER 6 DISCUSSION AND CONCLUSIONS ........................................................................ 119
6.1 INTRODUCTION ............................................................................................................. 119
6.2 EMPIRICAL OUTCOMES OF THE GRID DATA ......................................................... 119
6.2.1 Risk Identification ........................................................................................................... 119
6.2.2 Risk Assessment .............................................................................................................. 120
6.2.3 Risk Response ................................................................................................................. 120
6.3 EMPIRICAL OUTCOMES OF NARRATIVE DATA ..................................................... 121
6.4 IMPLICATIONS FOR THEORY ..................................................................................... 122
6.4.1 Renn and Rohrmann’s (2000) Integrative Model of Risk Perception ............................. 122
xi
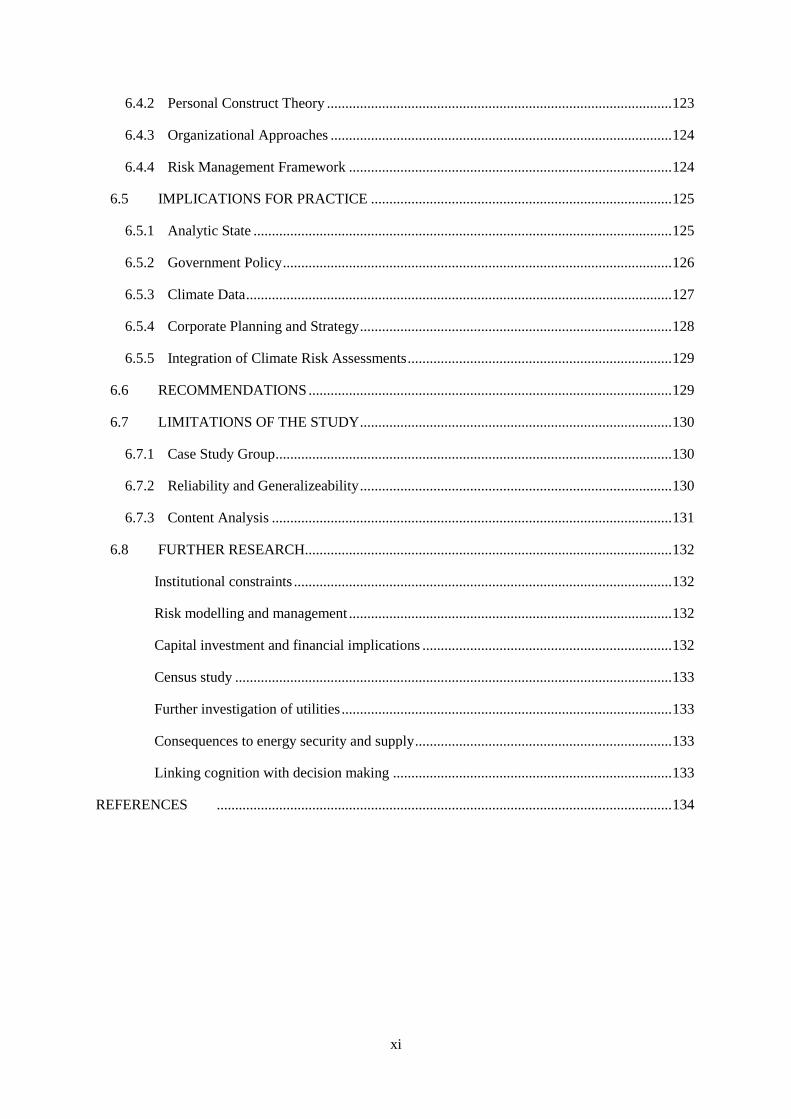
6.4.2 Personal Construct Theory .............................................................................................. 123
6.4.3 Organizational Approaches ............................................................................................. 124
6.4.4 Risk Management Framework ........................................................................................ 124
6.5 IMPLICATIONS FOR PRACTICE .................................................................................. 125
6.5.1 Analytic State .................................................................................................................. 125
6.5.2 Government Policy .......................................................................................................... 126
6.5.3 Climate Data .................................................................................................................... 127
6.5.4 Corporate Planning and Strategy ..................................................................................... 128
6.5.5 Integration of Climate Risk Assessments ........................................................................ 129
6.6 RECOMMENDATIONS ................................................................................................... 129
6.7 LIMITATIONS OF THE STUDY ..................................................................................... 130
6.7.1 Case Study Group ............................................................................................................ 130
6.7.2 Reliability and Generalizeability ..................................................................................... 130
6.7.3 Content Analysis ............................................................................................................. 131
6.8 FURTHER RESEARCH.................................................................................................... 132
Institutional constraints ....................................................................................................... 132
Risk modelling and management ........................................................................................ 132
Capital investment and financial implications .................................................................... 132
Census study ....................................................................................................................... 133
Further investigation of utilities .......................................................................................... 133
Consequences to energy security and supply ...................................................................... 133
Linking cognition with decision making ............................................................................ 133
REFERENCES ............................................................................................................................ 134
xii
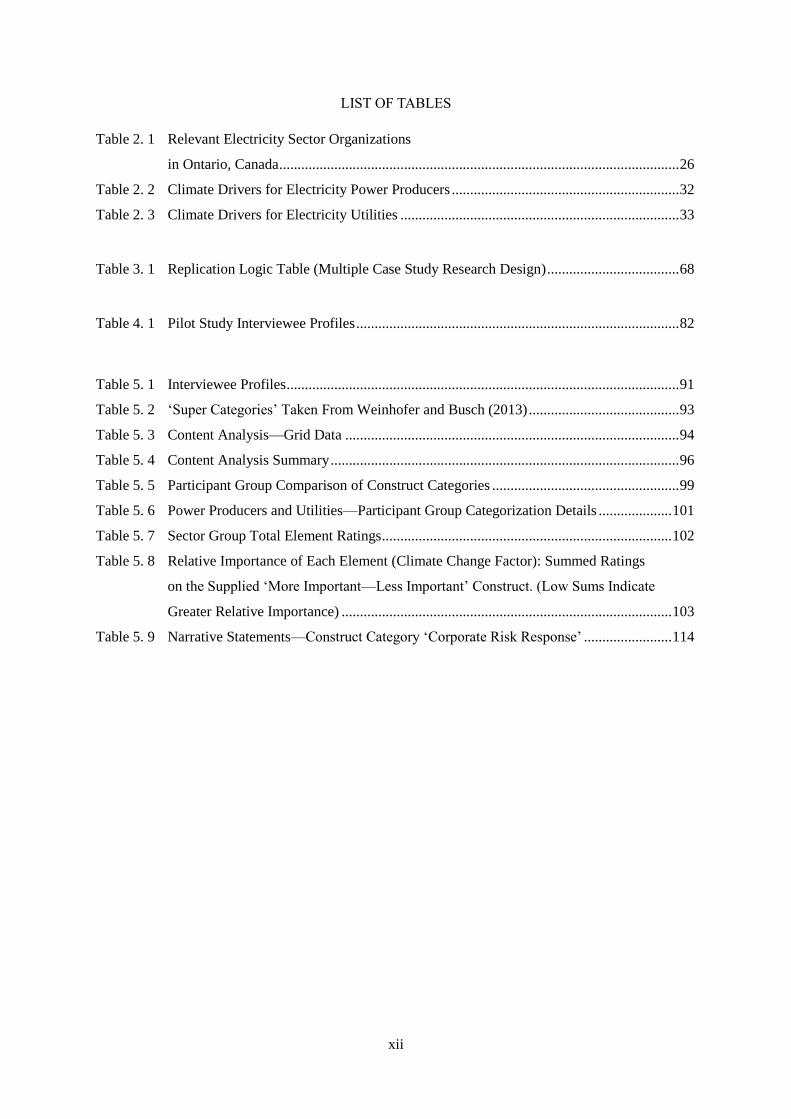
LIST OF TABLES
Table 2. 1 Relevant Electricity Sector Organizations
in Ontario, Canada ............................................................................................................. 26
Table 2. 2 Climate Drivers for Electricity Power Producers .............................................................. 32
Table 2. 3 Climate Drivers for Electricity Utilities ............................................................................ 33
Table 3. 1 Replication Logic Table (Multiple Case Study Research Design) .................................... 68
Table 4. 1 Pilot Study Interviewee Profiles ........................................................................................ 82
Table 5. 1 Interviewee Profiles ........................................................................................................... 91
Table 5. 2 ‘Super Categories’ Taken From Weinhofer and Busch (2013) ......................................... 93
Table 5. 3 Content Analysis—Grid Data ........................................................................................... 94
Table 5. 4 Content Analysis Summary ............................................................................................... 96
Table 5. 5 Participant Group Comparison of Construct Categories ................................................... 99
Table 5. 6 Power Producers and Utilities—Participant Group Categorization Details .................... 101
Table 5. 7 Sector Group Total Element Ratings ............................................................................... 102
Table 5. 8 Relative Importance of Each Element (Climate Change Factor): Summed Ratings
on the Supplied ‘More Important—Less Important’ Construct. (Low Sums Indicate
Greater Relative Importance) .......................................................................................... 103
Table 5. 9 Narrative Statements—Construct Category ‘Corporate Risk Response’ ........................ 114

xiii
LIST OF FIGURES
Figure 2.1 Electricity’s Contribution to Infrastructure ....................................................................... 23
Figure 2.2 Integrative Model of Risk Perceptions .............................................................................. 48
Figure 2.3 Simple Model of Risk Perceptions in the Electricity Sector ............................................. 60
Figure 5.1 Revised Model of Risk Perceptions in the Electricity Sector .......................................... 117
xiv
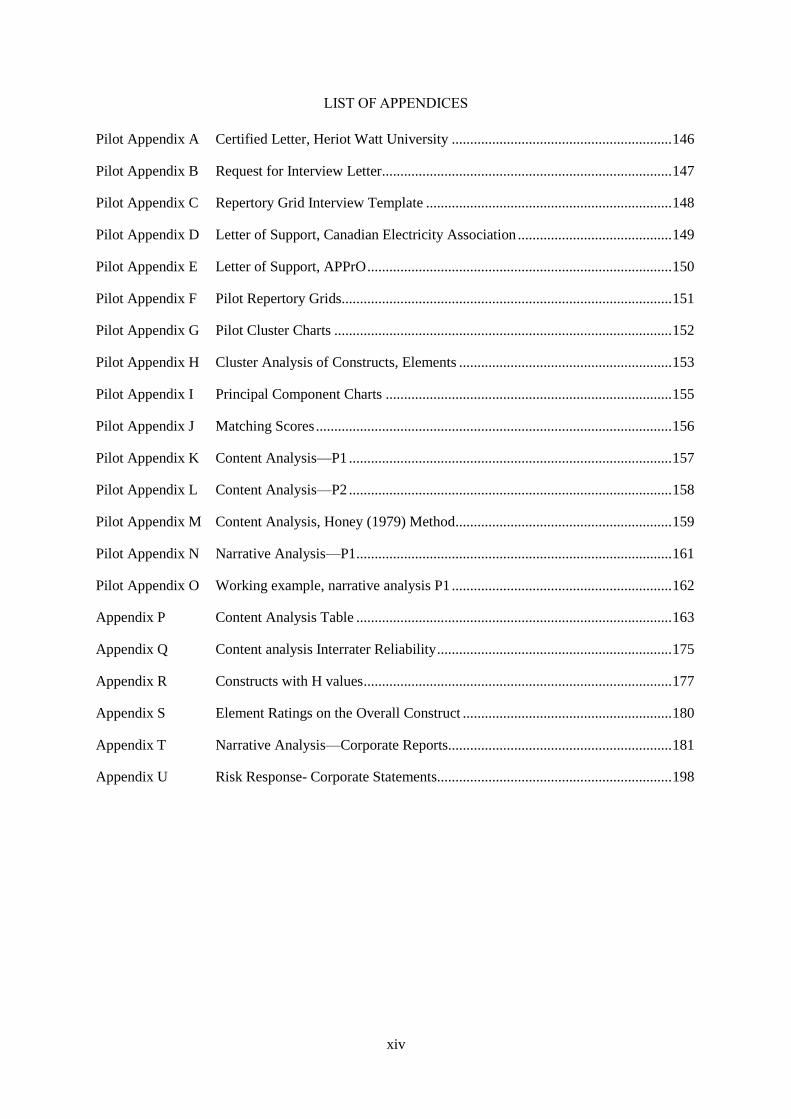
LIST OF APPENDICES
Pilot Appendix A Certified Letter, Heriot Watt University ............................................................ 146
Pilot Appendix B Request for Interview Letter............................................................................... 147
Pilot Appendix C Repertory Grid Interview Template ................................................................... 148
Pilot Appendix D Letter of Support, Canadian Electricity Association .......................................... 149
Pilot Appendix E Letter of Support, APPrO ................................................................................... 150
Pilot Appendix F Pilot Repertory Grids.......................................................................................... 151
Pilot Appendix G Pilot Cluster Charts ............................................................................................ 152
Pilot Appendix H Cluster Analysis of Constructs, Elements .......................................................... 153
Pilot Appendix I Principal Component Charts .............................................................................. 155
Pilot Appendix J Matching Scores ................................................................................................. 156
Pilot Appendix K Content Analysis—P1 ........................................................................................ 157
Pilot Appendix L Content Analysis—P2 ........................................................................................ 158
Pilot Appendix M Content Analysis, Honey (1979) Method ........................................................... 159
Pilot Appendix N Narrative Analysis—P1 ...................................................................................... 161
Pilot Appendix O Working example, narrative analysis P1 ............................................................ 162
Appendix P Content Analysis Table ...................................................................................... 163
Appendix Q Content analysis Interrater Reliability ................................................................ 175
Appendix R Constructs with H values .................................................................................... 177
Appendix S Element Ratings on the Overall Construct ......................................................... 180
Appendix T Narrative Analysis—Corporate Reports............................................................. 181
Appendix U Risk Response- Corporate Statements................................................................ 198
xv
LIST OF ACRONYMS AND ABBREVIATIONS
APPrO Association of Power Producers of Ontario
BCA Benefit cost analysis
CEA Canadian Electricity Association
CIP Critical infrastructure protection
CUE Centre for Urban Energy
GCM General circulation models
GHG Greenhouse gas
IA Integrated assessment
IESO Independent Electricity Systems Operator
IPCC Intergovernmental Panel on Climate Change
NASA National Aeronautics and Space Administration
PCA Principal component analysis
PCIC Pacific Climate Impacts Consortium
PCT Personal construct theory
PM Particulate matter
RAP Rational actor paradigm
RGT Repertory grid technique
RISP Risk Information Seeking and Processing
SAR Social amplification of risk
SO Sulphur oxide
TCCCR Tyndall Centre for Climate Change Research
TMI Three Mile Island
UNFCCC United Nations Framework Convention on Climate Change
xvi
GLOSSARY
Adaptive capacity is the ability of the organization to adjust to climate change impacts and to cope
with the consequences.
Agentic self is a term used in social cognition theory that views people as self-organizing, proactive,
self-reflective and self-regulating as times change.
Canadian Electricity Association (CEA) is the business association representing power producers,
Utilities and transmitters in Canada.
Cap and trade is the term used to describe regulated emissions control scheme designed to limit, or
‘cap’ carbon dioxide emissions by industrial emitters. Emitters which produce greenhouse gases
(GHG) in excess of a regulated threshold can trade allowances with others which need them, at a
carbon price regulated by the participating jurisdictions.
Centre for Urban Energy (CUE) is a research centre affiliated with Ryerson University.
Climate adaptation means anticipating the adverse effects of climate change and taking appropriate
action to adapt to the resulting damage they can cause.
Climate mitigation is a broad definition concerned with intervention before adverse effects of
climate change increase or take hold.
Corporate adaptation to climate change means organizational response to climate change.
Committee of Sponsoring Organizations of the Treadway Commission (COSO) is a joint
initiative of five financial sector associations concerned with the development of frameworks and
guidance on enterprise risk management, internal control and fraud deterrence.
Critical infrastructure refers to processes, systems, facilities, technologies, networks, assets and
services essential to the health, safety, security or economic well-being of modern society.
ECO Fiscal Commission of Canada is a university research initiative which studies the
quantification of losses produced by climate change in Canada.
Emissions refer to the pollutants, notably GHG produced by the emitter.
Energy sources refer to source fuel types, including nuclear, hydro, natural gas, coal and renewable
energy sources such as wind and solar. Energy sources are alternatively referred to as the power
producers’ mix
Energy systems refer to the electric power system for supply, transmission and consumption of
electric power.
xvii
Expected utility theory refers to the mean of the subjective values of all relevant outcomes weighted
by the subjective probability of occurrence of each.
Fat-tailed probability is a statistical phenomenon representing a greater likelihood of extreme events
occurring.
Gas-fired power producer plants refers to the segment of electricity supply organizations which use
fossil fuel in their fuel mix.
Greenhouse gases (GHG) are the gaseous mixtures emitted from the burning of fossil fuels. GHG
are understood to be a main trigger for global warming and climate change
Grey literature means material not published in refereed journals, and usually refers to corporate
literature.
Intact Centre for Climate Change is a research arm of the University of Waterloo.
Intergovernmental Panel on Climate Change (IPCC), a division of the United Nations, is a
consortium of 650 climate scientists and expert specialists which track and assess global climate
change patterns.
Intertie connections are found in a transmission facility that links one or more electric systems
outside Ontario (in this study) to one of more points on the interconnected electric system.
Narrative analysis is an analytic approach to analysing textual or narrative statements.
National Aeronautics and Space Administration (NASA) is an independent agency of the
executive branch of the United States federal government responsible for aeronautics and aerospace
research including satellite based collection of climate data for North America.
Natural gas is a source fuel (see energy sources) with high carbon content. Natural gas is a fossil
fuel, and is primarily Methane (CH4), which has a higher energy content relative to other fuels. Fuel
combustion of Natural Gas produces nitrogen oxides (NOx), carbon monoxide (CO), and carbon
dioxide (CO2), methane (CH4), nitrous oxide (N2O), volatile organic compounds (VOCs), trace
amounts of sulphur dioxide (SO2), and particulate matter (PM), otherwise known as greenhouse gases
(GHG).
Ontario Energy Board (OEB) is the provincial regulator for the electricity sector in Ontario.
Ontario Energy Board scorecard is the annual compliance ‘report card’ that utilities in Ontario
produce, Ontario utilities are currently prescribed by the OEB to disclose operational efficiency and
energy conservation levels., according to a set of metrics set out by the regulator.

xviii
Ouranos is a public/privately funded regional climate science consortium which tracks and assesses
climate change on a regional (Canada- wide) basis.
Power producers are electricity generation companies, producing electrical power for public and
private grids in Ontario.
Personal construct theory (PCT) is a psycho sociological theory of human behaviour explaining
how individuals make sense of their experiences in the world in uniquely personal ways, pioneered by
George Kelly in the 1950’s.
Personal construct psychology is a postmodern constructivist approach in psychology which looks
at the unique and personal ways in which individuals construe, (understand, interpret) their world.
PCT assessment tools include the repertory grid technique.
Sensemaking describes the process by which people ascribe meaning to their experience and their
actions, as first conceptualized by Karl Weick.
Utilities are municipally –owned Ontario distribution and transmission companies which transmit
electrical power to end users.
Repertory grid technique (RGT) The repertory grid technique is an interviewing technique designed
for eliciting personal constructs.
1
CHAPTER 1 INTRODUCTION
1.1 RESEARCH AIMS
The aim of the present study is to examine how electricity power producers and utilities in Ontario
view climate risks and how they expect to manage those risks in the future. Climate risks are risks
associated with climate change and are defined in this work as macro, exogenous risks and firm –
level, endogenous risks producing downside impacts on the organization. Of particular interest are
electrical utilities and the gas fired electricity production segment considered to be significant GHG
emitters.
Climate change is one of the modern world’s grandest challenges. Near future climate states are
forecast by scientific groups to produce increased incidence of extreme weather events that will have
destructive effects on electrical power supply around the world including Canada (IPCC, NASA,
Intact, and the Centre for Urban Energy (CUE; see Glossary). Climate change has already affected
Ontario electricity suppliers through heat waves, severe flooding and ice storms. Risk effects of the
physical manifestations of climate change have left businesses and households without power heating
or air conditioning on many occasions and are well documented. (Acharya-Tom Yew, 2014; Canadian
Electricity Association, 2016). Yet little work has been done on examining the additional risk effects
associated with secondary and indirect impacts of climate change on industry (Gasbarro et al., 2016).
The question of how the electricity sector expects to cope with the risk effects of climate change
suggests there is a need to understand how constituents perceive climate risks in the first place, and
furthermore how they expect to manage climate risk impacts in the near future. The researcher agrees
with several contributions which argue that the extent to which power producers and utilities manage
climate risks in the future depends upon their current management beliefs and interpretations
(Berkhout et al., 2006; Bleda & Shackley, 2008; Hoffmann et al., 2009). Using an inductive research
approach, 20 in depth case studies are examined to show how electricity executives/senior managers
perceive those risks. Construct elicitation techniques are conducted in semi structured face-to-face
interviews with study participants. Findings are then triangulated with narrative data from corporate
climate risk reports to gain insight into overall management cognition of climate risks for the sector.
In this work, comparative case study methodology is adopted with a mixed methods approach:
personal construct theory (PCT) and its related repertory grid technique (RGT) are employed for the
exploration of individual perceptions and risk beliefs. Narrative analysis of corporate reporting of
climate risk is utilized for the examination of differences in perceptions between formal public
statements of climate risk and the less formal, tacit understandings of climate risk elicited in
interviews.
2
The intention is fourfold. First and foremost, it is to identify the way in which the participants
construe and make sense of exogenous and endogenous influences of risk effects of climate change.
Exogenous risk effects are identified in this work as climate change itself, climate predictive data,
aging infrastructure, government policy and GHG emissions regulations. Endogenous risk effects are
defined in this work as technical knowledge, organizational resources and organizational capacity.
The second intention is to develop a category scheme that describes and enumerates the constructs
and beliefs management have about the influences (of the risk effects) involved, as well as the
examination of the differences that may exist in the construing of the two groups of sector
participants.
The third intention is to assess the relative importance the participants attribute to the exogenous and
endogenous risk effects using supplied construct ratings.
The fourth intention is to assess the similarities and differences between the fieldwork findings
produced by the repertory grid interviews, with the findings produced from the narrative analysis of
corporate reports.
The research study relies on a constructivist approach which accommodates the suggestion that
climate risk impact is actually a business construct with multiple potential meanings and perceptions
held by the sector participants. Prior management cognition literature has suggested that how
companies chose to manage climate risks is driven by management’s current risk beliefs and
construal. Furthermore, several authors suggest that combining exogenous factors with older
institutional views of firm - level dynamics of organizational life (Selznick, 1996) may help advance
explanations about management thinking. When combined, the role of these drivers and influences
may better support the debate related to how management intends to manage climate risks in the
future (Ingram & Silverman, 2000).
Motivation for this work comes from the doctoral candidate’s (herewith referred to as ‘the
researcher’) professional career experience in resource planning for a large energy developer in
Canada. Also providing motivation is the researcher’s view that the way in which producers and
utilities currently construe of climate risk may make a difference to the success of their future risk
management strategies.
1.2 BACKGROUND
1.2.1 Electricity Sector at Risk in Ontario
Climate risk management is particularly salient for the electricity sector in Ontario. District utilities
and their upstream generation partners are noted time and again for being vulnerable to potential
extreme and sudden weather impacts (CEA, National Resources Canada, Conference Board of
3
Canada, and CUE). Low use of climate data in decision making and dependency on large scale and
aging system infrastructure heighten exposure to climate risks (Gasbarro et al., 2016). Regulatory
uncertainty and constraints on capital investments to re-build or retrofit plants, and regulator-
approved cost recovery on potential damages to facilities and plants from flooding and the heat and
cold effects of extreme weather impacts—further increase sector exposure to climate risks
(Electricity Distributors Association, 2011; Murphy et al., 2014). Climate policies constraining fossil
fuel- based generation are noted as creating ‘unintended consequences’ for the electricity sector at
large (DeMarco, 2015). At the firm level, internal dynamics related to greater needs for climate
expertise, technical knowledge, resources and overall organizational capacity to manage
organizational change are seen as impacts created by climate risks (Busch, 2011).
Empirical work of how this sector group expects to cope with climate risks is found in technical and
grey literature (CUE, EDA, CEA). Limited academic work has focussed on the Canadian electricity
sector (Baker et al., 2011; Boyle et al., 2003; Canadian Electricity Association, 2016; Charron, 2014;
Laszlo & Marchionda, 2015). Outside the country, climate risk literature not only covers a broader
scope of issues and in several cases examines electricity and infrastructure in particular: Management
strategies regarding climate change in Swiss and Austrian utilities (Weinhofer & Busch, 2013); risk
perceptions of utility groups in the European Union (Gasbarro et al., 2016); and in Australia,
behavioural studies on climate risk reporting in the Australian electricity sector (Haigh & Griffiths,
2012) are some examples of related prior research.
Prior literature covers many perspectives on the motivations for organizational response to climate
change (to be discussed in Chapter 2). More recent studies however, frame climate change as a
business risk (Linnenlueke et al., 2012; Weinhofer & Busch, 2013). This shift to the risk management
paradigm suggests that a better understanding of how management views climate change can be
gained through a risk management perspective.
Minimizing risk is an established business practice essential to organizational performance (Roberts
et al., 2015). The identification, assessment and management of risks is obviously vital to business
operations to avoid negative impacts on business performance (Linnenlueke et al., 2012).
How organizations intend to manage risks is a key feature of risk management planning. The research
challenge here is to understand how the sector intends to manage the range of climate risks especially
in light of the deep uncertainty and the systemic nature of climate risk impacts that climate change is
producing (see Sections 2.1, 2.2.5). Understanding how the sector and its decision makers view such
risks is to understand their risk perceptions, and is congruent with Weinhofer and Busch’s (2013)
claim that “the extent to which companies actually start managing climate risks depends on
management’s risk beliefs and interpretations” (Weinhofer & Busch, 2013, p. 122).
4
In other words, how companies construe of risk determines the direction of the response to the risk.
Concomitantly, their mental model of such risks, including their perceptions, is key for corporate
strategy and decision-making.
1.2.2 Risk Perceptions in the Electricity Sector
Two main approaches dominate literature on risk perceptions. One is the positivist, realist approach
reflective of the technical and scientific field which suggests all risks are all quantifiable, objective
and knowable and therefore all risks can and ought to be construed in the same way. The present
study adopts the contending constructivist approach which best supports the ontological claim that
risk itself is subjective and socially constructed (Berger & Luckmann, 1991; Dake, 1992; Jasanoff,
1998; Renn, 2008) and helps to explain the anticipated variation in risk beliefs and construal of sector
participants.
Congruent with the chosen constructivist approach, literature is reviewed from five areas: the
discourse on the systemic nature of climate risks—which include not just the sudden, direct climate
events but the systemic and secondary risks created by climate change in the first instance. Second, a
discussion about the electricity sector and the various pressures it faces in Ontario is provided. Third,
a review of corporate adaptation to climate change literature is offered; fourth a review of literature on
risk management and its application to corporate adaptation to climate change is presented. Fifth, a
review of the literature pertaining to subjective views of management thinking is offered, focussing on
management cognition literature, risk perceptions and social theories of risk perceptions. Included in
that discussion are the contributions related to personal construct and sensemaking theory from Kelly
(1991, 2003) and Weick (1995) respectively, as support for the analytical framework in this work. A
brief overview of the Ontario electricity sector is offered next.
1.3 POWER PRODUCERS AND UTILITIES IN ONTARIO
Sector participants in this work are senior decision makers from two groups within the sector: the first
being natural gas fired power producers which generate electricity from a fossil fuel base, and the
second, municipally owned utilities which transmit electrical power to end users. (Other power
production types such as nuclear, hydro and renewable energy fall outside the research scope of this
work).
Natural gas power producers in Ontario (N=11) supply electricity to either the public grid or a private
grid such as a manufacturing plant or hospital. All natural-gas fired power producers in this study are
authorized market participants, monitored by the provincial grid systems operator (Independent
Electricity Systems Operator (IESO) and regulated by the provincial Ontario Energy Board (OEB).
Power producers have plant economics heavily influenced by government regulation, provincial
climate legislation, and commodity prices of natural gas as well as long run capital investment
5
horizons. Power producers in the present work are subject to annual disclosure of financial and
operational performance.
Utilities in Ontario (N=73) are owned by the local municipality (the city, town or township) and are
similarly regulated by the OEB and monitored by the IESO. Utilities transmit electricity from the
power generation plants to retail customers. Utilities’ performance in Ontario are influenced by
government climate policies related to energy conservation, utilities efficiency/ performance and
customer demand. Both power producers and utilities share complex energy system co-dependency
which can under sub optimal operating conditions, combine and cascade into significant problems.
Given the importance of energy security and reliable electricity supply in Ontario, (and for that
matter, everywhere else) examination of what, if anything, is driving management thinking about
climate risks in the sector becomes more intriguing (Adger et al., 2010). How do these power
producers and utilities—accustomed to high reliability standards to be ‘prepared for the
unpredictable’ (Coutu, 2003)—perceive climate risk? How do they individually, concerned with
failure prevention and resiliency, think about managing climate change impacts on their plants and
facilities? (Hoffman et al., 1995). And more centrally, what do they view as the greatest challenge of
anticipated climate risk management? It is likely that, given their different roles and accountabilities
in the sector, the pressures on the two groups may be different, resulting in expected differences in
climate risk perception.
1.4 RATIONALE
The rationale for the present study is to acquire deeper insight into a lightly explored area of research
which may offer answers to how decision makers in critical industries view the prospects of climate
risk impacts and its management. Prior contributions considered climate change as being solely
physical in nature, and sidestepped a broader spectrum of downside risks that climate change creates.
Much prior research on climate impact and adaptation addressed perspectives on human health,
biodiversity loss while corporate adaptation research has tended to be theoretical and not be context
specific (Winn et al., 2011). Even the more recent contributions on corporate climate change response
in the regulated utility and power field, mainly view climate change impact as being only a physical
phenomenon (Gasbarro & Pinkse, 2015).
A further rationale for the present work is to probe for cognition of climate risk among technical and
more highly informed corporate executives—another lightly explored area of research. Abundant and
important research exists already for lay population respondents, where risk perceptions of climate
change have been examined by researchers seeking to explain why ‘climate change doesn’t worry us’
(Leiserowitz, 2005) or why climate change is or isn’t viewed as dangerous, threatening, or even ‘real’
(Renn et al., 2000). Some work has been directed towards professional environmental managers but
explores personal values (Hill & Thompson, 2006). Few studies have attempted to explore
6
management cognition of climate risks as they directly relate to their organizations, and fewer still
have attempted to compare sub groups within one sector for differences, if any, in risk perception.
Furthermore, comparing individual constructs with public and more formal expressions of climate
risks in a mixed methods approach does not appear to have been conducted anywhere in the corporate
adaptation research field.
It is noted here that the rationale for this work does not just include theory construction per se, but that
the work examines existing models and theories for concepts that could be usefully integrated in the
climate risk perception debate. At present there appears to be a lack of theoretical consensus about
professional perceptions of risk as a social and a psychological phenomenon. This work seeks to
contribute to theory by looking at the phenomena of climate risk impacts for the electricity sector and
considers how it may be generalized to other similar groups facing the same set of pressures.
1.5 SOURCES OF CLIMATE RISK IMPACTS
Like all businesses, utilities and power producers need reliable conditions, resources and stable
business environments to conduct business. Reliable business environments allow companies to plan
and prepare for the future; resources enable organizational action and risk planning. Stable business
environments better enable companies to deal with uncertainty and vulnerability reduction.
Perceptions of uncertainty and vulnerability produced by risk impacts of climate change inform and
complicate risk planning; being under-resourced in areas management views as important, produces
pressure for organizations and their decision makers.
1.5.1 External Exogenous Factors
Key to understanding the sector participants’ constructs of climate risk, and how they expect to
manage those risks in the near future, is to consider the influence and pressure from their external
institutional environment. The influence of external constituents is limited in this work to policy
makers, regulators, and system grid partners (other utilities/generators). External policy makers,
regulators and grid partners are accountable and predominantly concerned with producing government
climate policy, GHG abatement regulations and managing aging electricity infrastructure.
Two further external factors proposed as influencers are added to the list. The first is climate change
itself, in the sense of it being a physical phenomenon, described as and limited to sudden, direct
climate events. The second is climate (predictive) data, seen as a climate risk pressure which may be
regarded as lessening the sensitivity of the organization to climate impacts. Given the long-term
capital investment horizon of the electricity sector, the issue of how management construes of climate
data in managing future (1-5 years) climate risk is also considered.
In keeping with the intention to move management cognition beyond the physical impacts of climate
change, and to consider perceptions as driven by a broader range of climate risk impacts, external
7
influences are further combined with firm-level, or endogenous influences. Three additional sources
of climate risk impacts are introduced.
1.5.2 Endogenous Pressures
Combined with the five aforementioned external pressures, the spectrum of climate risk impacts is
extended to firm-level pressures, where technical knowledge, organizational resources and capacity
are considered. Combining pressures from both the macro environment with internal dynamics is not
only reflective of current organizational theory (Delmas & Toffel, 2008) but seeks to address what is
identified as climate induced organizational change. Where Gasbarro and Pinkse (2015) examined
how corporations view their resources and capacities in order to respond to climate change, Okereke
et al. (2011) put it this way: ‘Relying on old and pre-existing sets of skills and capacity to handle the
new risks and challenges posed by climate change is bound to lead to suboptimal and ineffective
response strategies’ (Okereke et al., 2011, p.25)
1.5.3 Climate Change as Exogenous Pressure
Climate change’s potentiality for catastrophic impact on human welfare and institutions is well
documented as a physical phenomenon (Winn et al., 2011). Defining climate change according to its
chief attributes is an important first step in appreciating the challenge it presents for the sector
participants. In advance of the more detailed discussion in Chapter 2, four key characteristics of
climate change are discussed here.
1.5.3.1 Non-Linear, Dynamic and Chaotic Characteristics
Firstly, natural sciences literature has defined climate change as ‘non-linear, dynamic and chaotic in
nature’ (Daron, 2011; Lorenz, 2011; Solomon et al., 2007). The 2014 IPCC related those three
features to its assertion that climate change has and will continue to produce three outcomes: an
increase in mean temperatures; greater variability in weather patterns, and consequentially, an
intensification of extreme weather patterns (IPCC 2014). Similarly, management literature has called
climate change “climate disruption- to (dispute) this global warming as part of a natural cycle and
emphasize our contribution to the coming changes and the speed at which they are approaching”
(Rand, 2014, p. 9).
1.5.3.2 Deeply Uncertain Characteristic
Secondly, climate change is complicated by the presence of deep uncertainty (Weitzman, 2011).
Because climate data cannot reliably forecast future states based on historical evidence, Weitzman
(2011) suggested that it makes decision-making difficult as it is “immune to standard benefit cost
analysis (BCA) to the possibility of extreme outcomes” (Weitzman 2011, p 276).
8
1.5.3.3 Dangerous Characteristic
Thirdly, references to climate change as ‘dangerous’ were noted by the United Nations Framework
Convention on Climate Change (UNFCCC) as early as 1992 when it called for GHG stabilization
such that ‘dangerous anthropogenic interference’ with the climate system is prevented (Dietz 2007 p
313). In Dessai et al.’s (2004) essay ‘Defining and Experiencing Dangerous Climate Change’ the
authors concluded that external (objective, scientific) and internal (personal) definitions of dangerous
climate change need accounting for in climate policy making (Dessai et al., 2004).
1.5.3.4 Systemic Characteristic
Fourthly, climate change is characterized as being systemic. Slovic (1981) construed of risks as being
systemic where multiple groups are affected either at the same time or in ripple patterns and cascading
ways. In the context of climate change impacts, ‘systemic risk’ is an apt term where climate risk exists
at the intersection between natural events, economic consequences and policy driven actions (Renn,
2005).
1.5.4 Government Policy and Regulation as Exogenous Pressure
Governmental climate policies in this work are attributed to the current and intended long term market
de-carbonization ‘Long Term Energy Plan’ policy of the Ontario government and related GHG
reduction regulations (Energy, 2017). Both bring external pressure to bear on electricity producers
and utilities in the form of political and regulatory risk impacts with wide-ranging compliance costs,
measures and reporting.
From the cognitive perspective, external constituents’ views of risk may lead and influence internal,
management perceptions of risk. In regulated industries, where organizations are compelled to behave
according to compliance rules set by external constituents, risk perceptions of regulators and policy
makers become powerful instruments for shaping risk perceptions inside the organization.
Furthermore, where organizations seek to influence external constituents, Wachinger & Renn’s (2008)
concept of social and political arenas is apt – “where which powerful groups struggle for resources to
pursue their interests and objectives... act as powerful shaping instruments for eliciting new beliefs
about the risk or the source of risk” (Wachinger & Renn, 2010, p. 13).
Prior research also suggests that the trust response to external constituents who control and influence
business environments drives risk perceptions within business (Dietz et al., 2007; Lorenzoni &
Pidgeon, 2006). In the context of this work, critics note the prevalence of policy and regulatory
uncertainty in the electricity sector since 1980, calling provincial energy policy ‘unstable’ and ‘ad
hoc’, creating ultimate uncertainty for long term planning. (Winfield & MacWhirter, 2013). Energy
policy and regulation in Ontario are recent consequences of climate change. The seemingly
contradictory policy models have created external pressure on producers and utilities having to
9
respond to a variety of climate-driven policy responses. As Winfield & MacWhirter (2013) recount it,
“Energy policies since the 1980s have sequenced from supply planning, soft energy path policies,
integrated resource planning, a ‘market’ model; a ‘hybrid’ model combining market and planning
elements, a renewable energy paradigm fostered by the Ontario Green Energy Act (2009) and more
recently, an ad hoc approach driven by political management considerations” (Winfield &
MacWhirter, 2013, p. 1).
1.5.5 Climate Data as Exogenous Pressure
Scientific research groups located outside of the sector participants’ domain produce specialized and
predictive climate data. Due to the complex nature of climate change, decision makers are dependent
on scientists and professional experts to define what evidence is seen to be relevant. Reliance on
climate data for corporate response direction to climate risks is deemed in this work as an exogenous
pressure. How climate data is dispensed at the international and the more local, provincial level is
explored in this work.
1.5.6 Aging Infrastructure as Exogenous Pressure
Power producers and utilities are networked energy grid operators which manage system assets
(transformers, conductors, wires, poles, cables) according to standards set at the time of installation.
Today, assets for producers and utilities are variously aging and most are at the end of lifecycle
(Murphy et al., 2014).
Aging infrastructure is described as a risk impact of climate change and is frequently mentioned in
electricity producers’ corporate reports. Increased vulnerability to climate change is described as
being caused by aging infrastructure and is viewed is this work as an ‘instance of climate risk’.
1.5.7 Organizational Capacity and Organizational Resources as Endogenous Pressure
At the firm level, phenomena which influence the participants’ risk perceptions, are thought of as the
internal resources of the organization and its capacity to deal with climate change impacts. Here,
resources are defined as the fundamental assets owned or controlled by the corporation, including
technical knowledge; organizational capacity is defined as the capability of the organization to exploit
and deploy its resources. While Renn and Rohrmann's (2000) integrative model of risk perception
draws attention to the importance of social and political macroeconomic contexts that drive personal
constructs, how the participants’ risk perceptions are influenced by these factors within their own
organizations has yet to be addressed in the literature. Understanding the firm level context of
business pressures facing the sector participants is discussed in the next section.
10
1.5.8 Technical Knowledge as Endogenous Pressure
The pressure for more specialized and technical knowledge within organizations responding to
climate change is evident in literature. Busch (2011) referred to “climate knowledge absorption” as an
organizational capability for organizational adaptation (Busch, 2011, p. 389) while Berkhout et al.
(2006) suggested that “organizational learning” was instrumental to coping with climate adaptation
(Berkhout et al., 2006, p. 135).
Unsurprisingly, how organizations expect to learn from the direct experience of climate events,
interpret climate data, assess new standards for climate- hardened systems and equipment, procedures
and processes calls for improved and specialized technical knowledge and expertise.
1.6 THE ELECTRICITY SECTOR IN ONTARIO (CANADA)
Canadians consume more electricity on a per capita basis than any other OECD country surpassed
only by Norway and Iceland (World Bank, 2014), and are seventh highest consumers of electricity in
the world on a per capita basis (CIA, 2016). Ontario (the data location in this work) has the highest
per capita usage of electricity in the country, and the largest infrastructure network of electrical
utilities (Electricity Distributors Association, 2011). Population intensification in the southwest
quadrant of the province continues to increase electricity demand (Hydro Ontario, 2016) though some
energy planning groups suggest a ‘highly uncertain’ longer term demand outlook due to the prospects
of economic downturn and end user energy conservation (IESO, 2016). Concurrent with the above,
demand forecasts based on assumptions related to the province’s vehicle electrification programs
suggest yet another demand outlook for electricity. Nevertheless, extreme weather forecasting done in
2001 suggested Ontario was at high risk for flooding and freezing temperatures (McCarthy, 2001).
Fifteen years later, the Canadian Electricity Association reiterated the same claim, asserting the sector
is increasingly more vulnerable to climate risk due to aging transmission equipment, lack of capital
investment for infrastructure renewal and lack of planning for climate change impacts (Canadian
Electricity Association, 2016). CEA documents state that recent Canadian government infrastructure
planning did not include considerations for ‘climate hardening’ or the technical and structural
modifications to protect electrical power plants and equipment from specific physical impacts of
flooding and extreme hot and cold temperatures (Coad et al., 2012).
1.7 MANAGEMENT COGNITION, RISK PERCEPTONS, AND PERSONAL CONSTRUCTS
Prior contributions on management cognition and strategy have suggested organizational strategies
are influenced by management expectations about the future state of their enterprise, and about the
degree of uncertainty in assessing future conditions (Mililken, 1987). How management interprets
pressures and risks informs strategic choices and action (Leiserowitz, 2005; O'Connor et al., 1999).
Furthermore, how organizational decision makers make sense of and interpret the likelihood of
11
exposure to climate risks may determine how they build specific capabilities and strategies (Berkhout
et al., 2006). Claims like these found in literature depend on a view of management cognition as being
instrumental for organizational response to climate change.
It can be noted that in the risk perception literature, particularly when climate change is discussed,
two main but contending approaches are suggested for the climate risk debate. One of them, the
positivist approach, is consistent with the concept of bringing perception as close as possible to the
objective risk of an activity or an event. It assumes there is an outside objective world with risks we
can recognize and acknowledge (Rosa, 1998; Rosa, 2008). The researcher maintains that the
positivist approach would not question the climate risk per se, but would more likely argue that the
problem of risk perceptions can be solved with more information and a greater understanding of the
risk. Positivist approaches are invariably regarded as the quantitative, fact-driven approaches adopted
by expert constituents.
With climate change however, the ‘non-linear, dynamic and chaotic, dangerous, deeply uncertain and
systemic nature’ of it suggests we know very little still about the probability, magnitude, time scales,
and complexity of the phenomenon (see Sections 2.2.3, 2.2.4, and 2.2.5). Climate change therefore is
a non-re-occurring complex phenomenon where quantitative approaches may not yield all the answers
to how industry will cope with it. The qualitative factors driving individual constructions of climate
risks may explain more. According to Wachinger and Renn (2010), cultural factors, social political
influences, cognitive and affective factors along with personal heuristics of information processing
may help explain it better. Renn and Rohrmann’s (2010) integrative model of risk perception
partitions those factors to show how various levels of influences may affect perception. While the
model relies on lay persons’ perceptions and emphasizes personal values—neither of which are
examined in this work—it nonetheless has been selected as a useful organizing framework for the
discussion regarding qualitative factors and context levels affecting the sector participants.
In addition, the above climate-based challenges facing power producers and utilities can be viewed
not as a single reality but as a series of multiple realities, each of which should be understood and
taken into account. Taking the position that risk, and climate risk in particular, is a social construction
(Berger & Luckmann, 1991; Dake, 1992) and that decision-makers operate in a socially constructed
world, the importance of examining individual constructs of the sector participants becomes more
compelling.
Furthermore, these constructs/factors which influence management perceptions may support the
expected differences in perceptions between the two sector groups (producers versus utilities)
examined. These groups may have different risk beliefs and perceptions, stemming from their
legitimately contending industry positions and objectives. These assumptions lead to the research
questions and objectives, discussed next.
12
1.8 RESEARCH AIM, OBJECTIVES, AND RESEARCH QUESTIONS
The aim of the present study is to examine how electricity power producers and utilities in Ontario
view climate risks and how they expect to manage those risks in the future. The primary objective that
emerges from the above discussion is to identify the way in which the participants construe and make
sense of these ‘influencing’ factors related to the following: climate change itself, climate data,
governmental interventions of greenhouse gas regulation and climate policy, aging infrastructure and
the firm-level factors of organizational resources, capacity and technical knowledge.
The primary objective is broken down into three subordinate objectives to be addressed in the
empirical work: a) the development of a category scheme that describes and enumerates the constructs
they have about the drivers/influences/factors involved; b) the examination of the similarities and
differences that may exist in the constructs of the two groups of participants; and c) the examination
of the similarities and differences that may exist in the constructs expressed in the more formal,
published corporate reportage of climate risks, compared with the individual constructs elicited from
the participants.
Following on from the primary research objective, the central research question then becomes:
How do the sector participants construe and make sense of the factors outlined in this work, in
assessing the impact they have for managing those risks in the future?
1.9 METHODOLOGY OVERVIEW
This work adopts a constructivist approach to the research topic. Insights are taken from cognitive
science, economics, psychology, organizational studies, and sociology, dealing with qualitative
studies of organizational response, risk management, management cognition and risk perception.
Personal construct theory (PCT) is viewed as applicable to the study of individual risk perceptions and
is used in this work to guide data collection via the repertory grid technique (RGT) and its related
analytical framework. The description and explanation of management’s personal understandings of
climate risk are accomplished by using the RGT to elicit and identify participant constructs; narrative
content analysis is used to examine published constructs of climate risk, enabling methodological and
data triangulation to increase credibility of findings.
By ‘unpacking’ perceptions and further comparing them between the two sector groups, a richer
understanding is expected of what is driving management thinking in the electricity sector. While Karl
Weick’s (1995) esteemed sensemaking approach using questionnaires, interviews, observational and
documentary techniques are valuable as a methodology for this subject matter, the researcher
proposed that examining participants’ views with a constructivist approach based on Kelly’s (1991)
13
personal construct theory and its associated technique (RGT) would produce deeper and more precise
findings.
1.10 SIGNIFICANCE
Climate risk is a phenomenon already examined and understood within the financial and insurance
sector. It is still less examined in management literature which until recently, has tended to rely on
paradigms of organizational change and business transformation to discuss organizational responses
to climate change (Berkhout et al., 2004; Gasbarro & Pinkse, 2015; Linnenluecke et al., 2008; Winn
et al., 2011).
Using a broader range of exogenous and endogenous instances of climate risk impacts moves the
debate past prior contributions which considered climate change impacts as being solely physical in
nature. Identifying management perceptions and risk beliefs about climate change gives voice and
empirical evidence to a sector facing complex and evolving challenges today and in the near future.
Due to the paucity of climate risk research in Canada, the CEA initiated a climate risk assessment
report in 2015. While the report’s findings are suggestive and would have implications for
infrastructure financing and public policy, it is useful to note that the scope of risks assessed related to
weather impacts only. Again, this mirrors most corporate response research and does not take into
account secondary and indirect impacts of climate risks. In understanding the more individual views
of how climate risk perceptions are influenced, as well as what priorities electricity executives might
believe are necessary for future climate risk management, would produce greater insight and benefits
to constituents.
While theory construction has already been stated as not a primary objective of this work, empirical
data collected may open up the climate risk ‘black box’ by showing how management cognition of
risks is influenced by influential factors appearing on multiple fronts in the sector. Constructs and
themes found in management scholarship which can be integrated in this examination may produce
useful findings for policy actors and for risk management practices in the sector.
1.11 OUTLINE OF THESIS
The organization of the present work begins with an introduction of the research topic, already
completed in Chapter 1.
Chapter 2 presents a critical literature review.
Chapter 3 provides details on the methodology.
Chapter 4 presents the results obtained of the pilot study and the main research plan including an
analysis of the data.

14
Chapter 5 deals with a discussion and interpretation of the main study findings related to the literature
review.
Chapter 6 describes the present work’s contribution to the knowledge base and practice, as well as
limitations and suggestions for further research topics.
15
CHAPTER 2: LITERATURE REVIEW
2.1 INTRODUCTION
This thesis examines management cognition of climate risks in the electricity sector in Ontario
(Canada). The aim of the work is to examine how electricity power producers and utilities view
climate risks and how they expect to manage them in the future.
The research objective of the present study contributes to the knowledge base by empirically
examining the constructions/perceptions of electricity executives on how they view the prospects of
managing future climate risks. First, the researcher begins with controlling for some corporate
characteristics such as location (Ontario), fuel type (natural gas), operating status (authorized market
operator) and respondent type (senior executives). Next, an in-depth exploration of risk
identification, assessment and response issues is conducted to assess how management views
climate risks now and in the future. Findings and conclusions are drawn on an inductive basis to
answer the research question: How does the electricity sector view climate risks now and for the
future?
In this chapter, the literature review and literature synthesis combine five important literature threads
which pertain to the research topic and which help formulate and argue for the empirical work
conducted in this study. The literature threads pertain to the current knowledge base of research
relating to: 1) relevant literature on climate change and climate science; 2) the electricity sector in
Ontario; 3) the literature on corporate adaptation to climate change; 4) the literature on risk
management pertaining to climate mitigation issues; and 5) the literature on the management
cognition, including the risk perception literature. The five threads help establish the context and
justification for the research study. This chapter discusses relevant findings and insights from prior
contributions in these five literature threads to offer a broad conceptual framework of climate risk
readiness among power producers and utilities.
2.1.1 Overview and rationale for the selected literature threads
A brief overview of the rationale and focus within each of the five threads is introduced below.
Firstly, literature on climate change and climate science is provided to shed light on current and
multiple perspectives of the phenomenon. Attention is given to climate literature which addresses the
chosen constructivist view, including how message framing and the language of climate change
affects risk perceptions. By doing so, the researcher suggests the ‘effect of climate change’ debate
supports the constructivist argument in this work. The researcher argues that climate risk itself is a
subjective and individual construct. The effect of message framing of climate change is already
understood in past contributions (Gifford & Comeau, 2011) and that the effect of meaning or the
interpretation ascribed to different definitions of climate change elicit different risk perceptions
16
(Sidortsov, 2014). The existence of both objective and subjective treatments of risk perceptions is
acknowledged. Discussion is extended to illustrate how the contributions of scientific institutions
justifiably vested in the realist paradigm, influence and inform risk perceptions. Their important
contributions to climate science and modelling and the effect of them on risk perceptions for the
participants is considered.
Secondly, a review of current knowledge on the electricity sector’s contribution to critical
infrastructure, and the particular business environment of electricity producers and utilities in Ontario
is offered. This thread illustrates show how this ’climate-sensitive’ group of organizations are subject
to a unique set of pressures derived from climate change, and how those pressures affect their
business environment (Davis & Clemmer, 2014; Gasbarro et al., 2016; Haigh & Griffiths, 2012).
Literature on the Ontario electricity sector is provided for context and insight into the two sector
groups examined in this work.
Thirdly, a review of the extant literature on business response and corporate adaptation to climate
change is provided. This thread illustrates the current state of knowledge and multiple research
perspectives in corporate adaptation literature. Specific attention is given to corporate adaptation by
utilities and other critical sector groups’ response to climate change.
Fourthly, a review of risk management literature, pertaining to climate issues is provided as support
for the framework used in the analysis phase of this work. This chosen thread departs from prior
research which has tended to rely on alternate frameworks of business transformation and knowledge
management to explain corporate adaptation to climate change. The conceptual treatment of climate
risk as a subjectively perceived emergent state is a recurring theme throughout this work. Thusly, the
inclusion of a risk management literature thread helps support the approach taken in this study.
Fifthly, the literature on management cognition studies and theories including sensemaking theory and
a survey of risk perceptions theories. Special attention is given to personal construct theory (PCT).
The subjective constructivist debate around climate risk perceptions is supported by this important
review of literature. As Sidortsov (2014) stated: “What is understood and described as a risk often
reflects and influences what decision makers actually do about risks” (Sidortsov, 2014, p. 173). Beck
(2006) added “Risk does not mean catastrophe, Risk means the anticipation of catastrophe” (Beck,
2006, p. 332). The determinants of risk perception in the subjective constructivist mode is key to the
aims and objectives of this work.
As described above, special attention is given to PCT as it serves as the theoretical framework to
support the phenomenological orientation of this research. Prior research on management cognition
and sensemaking processes derived from Karl Weick’s (1995) work are discussed. Though Weick’s
approach support the constructivist comparative case study approach of this work, emphasis will be
placed on PCT as it is expected to elicit deeper insights from the individual sector participants.
17
The five literature threads are combined to provide context and opportunity for examining how the
study participants construe and make sense of climate risk. Combined, the literature threads respond
to the primary research question of how the sector participants construe and make sense of the factors
outlined in this work, in assessing the impact they have for managing those risks in the future.
In turning to the first thread on climate change and climate science, the review of literature is guided
by three questions developed by the researcher:
What is it about climate change that creates risk?
How does the climate science community view climate risk?
How are perceptions of climate risk different for all others?
Guided by these questions, it is anticipated that the complexity of the perceptions debate is
appropriately discussed and produces a clearer picture of the determinants of risk perceptions for the
study participants
2.2 CLIMATE CHANGE AND CLIMATE SCIENCE
Understanding what constitutes the concept of climate change is critical for corporate action (Busch,
2011; Schneider, 2001). Literature shows variations in conceptual understanding about climate
change; exploring what they are and why they exist is a useful pre- condition for the discussion
around climate risk perception. Furthermore, literature shows that the framing of climate language
produces multiple interpretations for expert actors, professional managers and the lay public (Gifford
& Comeau, 2011; Sidortsov, 2014). More significantly, stakeholder groups may not necessarily and
completely understand the hazard (climate change) itself and chose instead to reference climate
change/risk as the effect (Sidortsov, 2014) Consequently, clear challenges exist for different actors in
understanding climate change’s inherent complexity, deep uncertainty and its ‘non-linear, dynamic,
chaotic’ features (Daron, 2011, p. 12).
Given that climate literature is terminology-heavy and filled with semantically non-equivalent
expressions and terms, a review of the phraseology and definitions related to climate change is
presented next.
2.2.1 Terminology, Definitions, Semantics
Literature examining the effect of language use of climate change terminology began in the first
decade of the 21st century, the warmest decade recorded globally since 1880 (Schmunk, 2010).
Global warming over the past 50 years has been widely attributed to the increase of greenhouse gases
in the atmosphere, primarily caused by anthropogenic emissions of carbon dioxide, methane and other
trace GHGs (Parry, 2007). The term ‘global warming’ was the dominant popular usage in climate
18
discourse from when it was first coined by Wallace Broecker of Columbia University, who
commented: ‘It is possible that we are on the brink of a several decade long period of rapid warming’
(Broecker, 1975, p. 462).
The term ‘climate change’ entered the lexicon of climate science in the 1990s when the IPCC
formally recognized that the side effects of global warming such as melting glaciers, heavier
rainstorms, or more frequent drought, were also part of an emerging future climate state (Solomon et
al., 2007). Research has shown however, that ‘global warming’ and ‘climate change’ are not
semantically equivalent terms and have different connotations eliciting different reactions in people
(Whitmarsh, 2008). Today, the use of the term ‘climate change’ however continues to dominate usage
by the Intergovernmental Panel on Climate Change (IPCC), the National Aeronautics and Space
Administration (NASA), and Canadian governmental groups.
2.2.2 Differing Views of Climate Change Terminology
Differing views of climate change are represented by objective and subjective treatments of climate
change language. These different views are variously reflective of the disciplines and institutions
which have them. Two striking examples are the narratives produced by the IPCC consortium and by
the Tyndall Centre for Climate Change Research (TCCCR). Both institutions have used the same
terms to characterize climate change but with different meanings. The IPCC’s technological
orientation representative of its global scientific consortia, produces what one researcher referred to as
an ‘objective’ description of climate change (Dessai et al., 2004). Functionally, the IPCC aggregates
and distributes global state of the art, spatial and temporal descriptions of climate variability and
intensity changes. IPCC climate assessment reports are derived from regional climate research
contributions including the TCCCR in the UK and the Ouranos research group in Canada. IPCCC
assessment reports ultimately inform international communities with policy directives based on their
climate risk assessments.
Another example is Dessai et al’s (2004)’s work when they described the IPCC paradigm of “top
down, scientific, quantitative indicators, used as inputs in hierarchical models, and concerned with
physical measures and threats to continued functioning of some part of the non-human world”, as the
objective perspective (Dessai et al., 2004, p. 11). In contrast, they noted that the competing,
internalized perspective of climate change “recognizes that to be real, the danger (of climate change)
has to be either experienced or perceived” (Dessai et al., 2004, p. 11). Sidortsov (2014) called Dessai
et al’s reference to the internalized perspective as a subjective perceived risk, and proposed that the
key difference between objective and subjective perceived risk stems from who actually anticipates
the risk (Sidortsov, 2014). In contrast, social science institutions pre-occupied with sustainability
objectives relating to human and or biological adaptation to climate risk, offer different if not
contradictory definitions of climate effects.
19
The TCCCR, as the other example, explained the difference as follows: “Social scientists and climate
scientists often mean different things when they use the term (climate) ‘vulnerability’; whereas social
scientists end to view vulnerability as representing the set of social-economic factors that determine
people’s ability to cope with stress or change climate scientists often view vulnerability in terms of
the likelihood of occurrence and impacts of weather and climate related events” (Allen, 2003; Brooks,
2003).
It is noted here that while rationalist explanations provide useful insights, rational utility theory,
subsumed in many of the principles of the rational actor paradigm (RAP) (Jaeger et al., 2001), they
do not adequately address the human decision making challenges of climate risk problems. Because
climate change and catastrophic risks, being defined as low-probability events are still not well
understood, expected utility theories may not work well because of a general underestimation of low
probability events (Chichilnisky, 2000). Consistent with this, Chichilnisky (2000) claimed that “using
such criteria (of utility theories) undervalues catastrophic risks and hence conflicts with the observed
evidence of how humans evaluate such risks” (Chichilnisky, 2000, p. 224). This contributes to the
researcher’s preference for the constructivist approach of the present study.
2.2.3 Hazard versus Risk Descriptions of Climate Change
The terms ‘hazard’ and ‘risk’ are frequently applied to descriptions of climate change in the literature.
The researcher notes in prior work, the conflation of the word risk with the word hazard, or in other
cases, ‘risk as hazard’. In further contradiction, the International Risk Governance Council (IRGC)
deemed that hazards actually characterize risks, while other work notes that risks are the potential
effects that hazards are likely to cause (Renn, 2005; Rosa, 2008).
Sidortsov’s (2014) work provides a useful example of ‘risk as effect’. Using the case of ocean
acidification as an environmental risk event he explained “Stakeholders may be familiar with the
effect of an activity and not necessarily the activity itself” (Sidortsov, 2014, p. 172). In that example,
he defines climate change as the hazard, GHG emitting oil exploration as the hazard source, and
ocean acidification as the effect (Sidortsov, 2014, p. 172) The researcher agrees with Sidortsov’s
view that risk operates as the effect (of a hazard) and determines in this work that ‘climate risk is
defined as the effect of climate change’.
2.2.4 ‘Dangerous’ Descriptions of Climate Change
Prior research also notes climate impacts as being essentially ‘dangerous’ (Weber, 2006; Weber,
2010; Weinhofer & Busch, 2013). Leiserowitz (2005) maintained that the term ‘dangerous’ is an
ambiguous expression contested by multiple definitions of danger, while other climate literature
indicates the use of the words ‘danger and dangerous’ are defined as a function of both hazard and
risk.
20
For example, the IPCC 2014 Fourth Assessment reported references to climate change as having
‘dangerous’ consequences—as well as admitting that ‘interpretations of danger are complex and can
only be partially supported with science’ (Intergovernmental Panel on Climate Change, 2014, p.
122). Integrative statements like this which acknowledge ‘multiple interpretations and normative
judgements of acceptable levels of danger (climate risk) reflect new IPCC requirements to
“synthesize’ different perspectives on acceptable levels of climate impacts” (Intergovernmental Panel
on Climate Change, 2014, p. 122).
Other contributions appear to view climate change in light of dangerous consequences to human and
natural environments specifically. Sarewitz (2003) defined risk as ‘social or inherent vulnerability’
(Sarewitz et al., 2003, p. 803) while Schneider (2001) maintained that danger is determined by
personal experience, values, information and trust.
2.2.5 ‘Uncertain’ Descriptions of Climate Change
The reference to uncertainty and the effect of it (uncertainty) on risk perceptions is widely debated in
the climate literature (Heal & Kriström, 2002; Jaeger et al., 2001; Polasky et al., 2011; Prato, 2008;
Renn et al., 2000; Weitzman, 2011; Willows et al., 2003).
At the 2011 Harvard symposium on the Economics of Climate Change for example, Weitzman (2011)
asserted that “the deep structural uncertainty about the unknown unknowns of climate change is
coupled with essentially unlimited downside liability on possible planetary damages”, and referenced
statistical ‘fat tail’ (see Glossary), uncertainty as another constituent feature of climate change
(Weitzman, 2011, p. 275).
The distinction between risk and uncertainty in the context of ‘non-linear, dynamic and chaotic’
climate change is a nuanced but useful one to the discussion around climate data and information.
Prato (2008), in another instance, claimed that decision makers who assign probabilities to future
climate change states base their decisions on ‘climate risk’, and when the probabilities of future
climate states cannot be determined, decision makers base their decisions on ‘climate uncertainty’
(Prato, 2008). Despite documented evidence and accumulating scientific consensus on the causes of
climate change (Anderegg et al., 2010; Cook et al., 2016) incertitude about future climate states is
referred in economic literature to as the ‘unknown unknowns’ of climate change (Purchase, 2013;
Stern, 2008). Given that climate simulation models are limited and cannot capture all the variables
necessary to create a concrete picture of the future, as discussed in Section 2.2.5, the challenge for
constituents however is one of decision making with imperfect information. More specifically,
incorporating climate change into risk assessments is challenging because of the significant difficulty
of assigning measures of probability to any future climate state.
21
In sum, framing and selection of climate change language by institutional groups can be viewed as
influencing risk perceptions. Science-based institutions generally take an objective, measurable
approach to defining climate risks, while social science-based institutions generally assign more
subjective and humanistic language to the same terms. Consistent with the constructivist approach of
this work, the researcher defines climate risk as a social construct of an emergent and uncertain state.
Perception of future states are supported by notions of risk and risk perceptions influenced by a
number of determinants. Determinants suggested in Renn and Rohrmann’s (2000) integrative model
of risk perception provide a partial explanatory framework. It is expected that constructs elicited from
the sector participants reflect differing factors influencing them (the constructs) in this work.
As shown above, different types of risks and associated meanings are related to user orientation.
While the dominant approach in this work is subjective, it is nevertheless noteworthy to understand
the orientation of the science community. Despite Dessai et al’s (2004) characterization of the ‘top
down, mathematical orientation’ of IPCC consortia partners, the climate science community is to
credited with forming the empirical foundation for climate knowledge globally. Without their
contribution, there would be little understanding of the phenomenon in the first place.
A brief discussion of the reportage of the IPCC, and other expert groups which independently
measure the progression of climate change and likely future climate states, is provided in the next
section.
2.2.6 The Climate Science Community
Due to the complexity of climate change, organizational decision makers are dependent on scientists
and professional experts to define what evidence is seen to be relevant. The climate science
community is credited with providing the knowledge and scientific basis on which public policy and
government climate action are based. Globally the climate science community, including the network
of 650 IPCC scientists, the 450 Canadian climate scientists affiliated with Pacific Climate Impacts
Consortium (PCIC ) and the Quebec-based Ouranos Consortia, produce aggregated evidence to
formulate global climate risk assessments which in turn, inform public policy (Hulme & Mahoney,
2010; Ouranos Consortia, 2016; PCIC).
From 1990 to 2013, the IPCC published five comprehensive assessment reports on climate risk
impacts used to illustrate potential future climate trajectories. The results provide the scientific basis
for global GHG reduction targets and the policy debate of the UNFCCC, the affiliated organization
which establishes consensus agreements among countries. They do this at annual Conference of the
Parties meetings which aim to set among other goals, aspirational GHG emissions targets for member
countries.
22
In Canada, climate science consortia partially derive their critical assessments from the IPCC so that
higher resolution and more detailed climate assessments relevant to specific regions of Canada are
produced. Unlike the U.S. at the time of writing, Canada does not have a national research laboratory
nor an expert government department similar to the National Centre for Atmospheric Research or the
U.S. Energy Information Administration (USEIA). In fact, Canadian academic critics note that
climate data collected by Statistics Canada, the National Energy Board, Natural Resources Canada’s
Climate Adaptation Platform and Environment Canada are often incomplete and disconnected
(Layzell, 2016).
Canadian and regional initiatives providing more localized and relevant climate analysis are done by
volunteer and paid academic and privately sponsored university research institutions such as
University of Alberta’s Canadian Energy Systems Analysis and Research and the University of
Waterloo’s Intact Centre on Climate Adaptation (Intact, 2016; Layzell, 2016). The PCIC established
by the University of British Columbia (Pacific Climate Institute of Canada, 2016) and the fee-for
service Ouranos Consortia in Quebec (Ouranos Consortia, 2016) provide downscaled, higher
resolution regional assessments for local governments and industry groups. The CEA’s 2015 climate
adaptation report Adapting to Future Climate Change relied on Ouranos’ climate assessments
(McCarthy, 2015). Climate risk findings and conclusions of that report are discussed ahead in Section
2.3.
Scientific output in the form of climate models produced or reported by the above groups produce
climate information and knowledge for local constituents. Regional and local constituents ultimately
derive their assessment from global work, and further disaggregate it to a level which can be used for
local climate risk assessments.
2.2.7 Climate Models and Climate Data
The main instrument for simulating future climate states is a climate model. The IPCC publishes
global climate studies based on data from general circulation models (GCMs) for climate impact
analysis. As previously mentioned, these models are developed and prepared for the IPCC by various
international research consortia, including for example, the TCCCR in the UK, and Ouranos in
Canada. The GCMs are numeric and integrated multi-system models that simulate physical processes
in the atmosphere, ocean, cryosphere and land surface to the effect of increasing GHG concentrations.
These variables taken together, create a “mathematical representation of the climate system, based on
equations that drive the physical processes governing the climate, including the role of the
atmosphere, hydrosphere, biosphere, etc” (Charron, 2014, p. 78).While GCMs are considered to be
the only credible climate tool currently available, their usefulness for local impact analysis is limited
due to their coarse spatial resolution (typically of the order 50,000 km²) and consequent limitations to
resolve sub-grid scale features such as clouds and topography (Samadi et al., 2010; Wilby et al.,
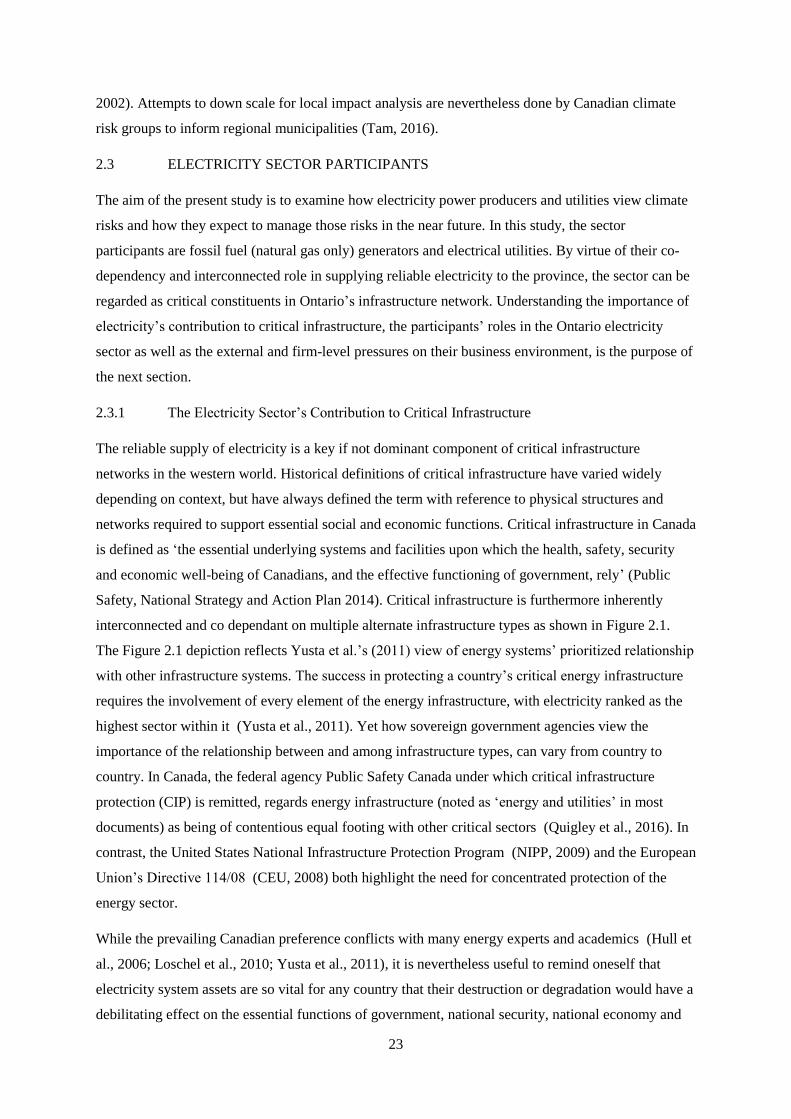
23
2002). Attempts to down scale for local impact analysis are nevertheless done by Canadian climate
risk groups to inform regional municipalities (Tam, 2016).
2.3 ELECTRICITY SECTOR PARTICIPANTS
The aim of the present study is to examine how electricity power producers and utilities view climate
risks and how they expect to manage those risks in the near future. In this study, the sector
participants are fossil fuel (natural gas only) generators and electrical utilities. By virtue of their co-
dependency and interconnected role in supplying reliable electricity to the province, the sector can be
regarded as critical constituents in Ontario’s infrastructure network. Understanding the importance of
electricity’s contribution to critical infrastructure, the participants’ roles in the Ontario electricity
sector as well as the external and firm-level pressures on their business environment, is the purpose of
the next section.
2.3.1 The Electricity Sector’s Contribution to Critical Infrastructure
The reliable supply of electricity is a key if not dominant component of critical infrastructure
networks in the western world. Historical definitions of critical infrastructure have varied widely
depending on context, but have always defined the term with reference to physical structures and
networks required to support essential social and economic functions. Critical infrastructure in Canada
is defined as ‘the essential underlying systems and facilities upon which the health, safety, security
and economic well-being of Canadians, and the effective functioning of government, rely’ (Public
Safety, National Strategy and Action Plan 2014). Critical infrastructure is furthermore inherently
interconnected and co dependant on multiple alternate infrastructure types as shown in Figure 2.1.
The Figure 2.1 depiction reflects Yusta et al.’s (2011) view of energy systems’ prioritized relationship
with other infrastructure systems. The success in protecting a country’s critical energy infrastructure
requires the involvement of every element of the energy infrastructure, with electricity ranked as the
highest sector within it (Yusta et al., 2011). Yet how sovereign government agencies view the
importance of the relationship between and among infrastructure types, can vary from country to
country. In Canada, the federal agency Public Safety Canada under which critical infrastructure
protection (CIP) is remitted, regards energy infrastructure (noted as ‘energy and utilities’ in most
documents) as being of contentious equal footing with other critical sectors (Quigley et al., 2016). In
contrast, the United States National Infrastructure Protection Program (NIPP, 2009) and the European
Union’s Directive 114/08 (CEU, 2008) both highlight the need for concentrated protection of the
energy sector.
While the prevailing Canadian preference conflicts with many energy experts and academics (Hull et
al., 2006; Loschel et al., 2010; Yusta et al., 2011), it is nevertheless useful to remind oneself that
electricity system assets are so vital for any country that their destruction or degradation would have a
debilitating effect on the essential functions of government, national security, national economy and
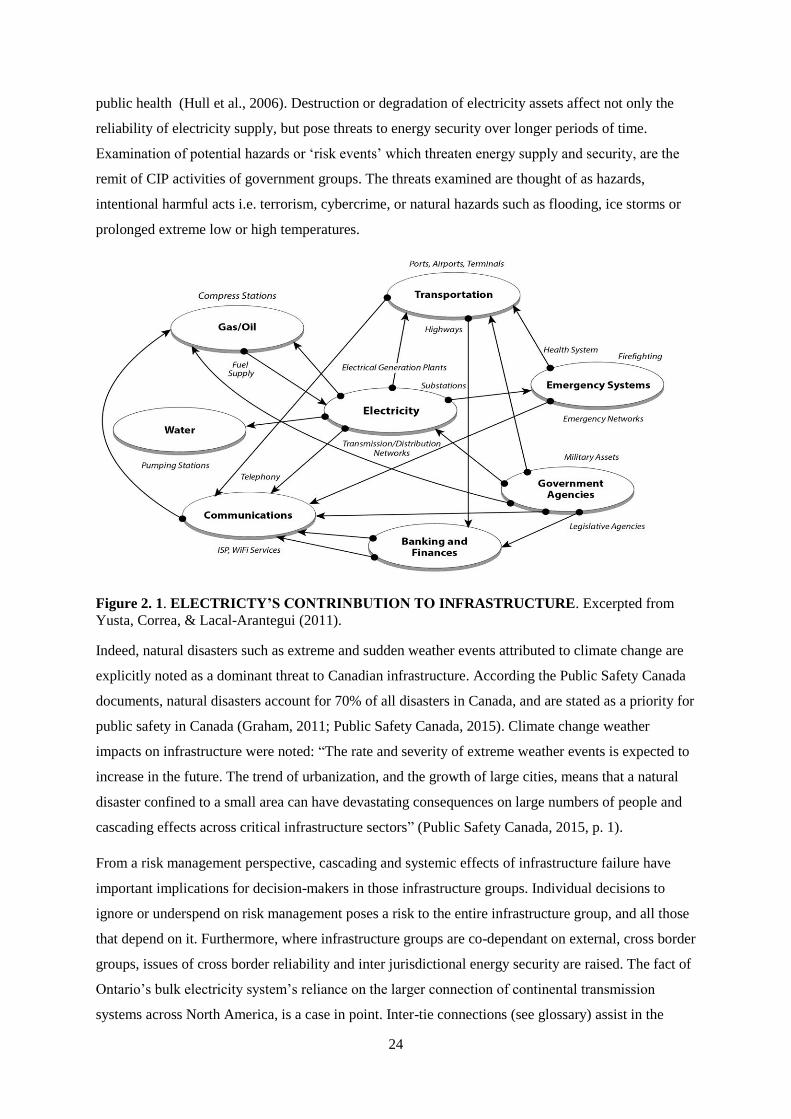
24
public health (Hull et al., 2006). Destruction or degradation of electricity assets affect not only the
reliability of electricity supply, but pose threats to energy security over longer periods of time.
Examination of potential hazards or ‘risk events’ which threaten energy supply and security, are the
remit of CIP activities of government groups. The threats examined are thought of as hazards,
intentional harmful acts i.e. terrorism, cybercrime, or natural hazards such as flooding, ice storms or
prolonged extreme low or high temperatures.
Figure 2. 1. ELECTRICTY’S CONTRINBUTION TO INFRASTRUCTURE. Excerpted from
Yusta, Correa, & Lacal-Arantegui (2011).
Indeed, natural disasters such as extreme and sudden weather events attributed to climate change are
explicitly noted as a dominant threat to Canadian infrastructure. According the Public Safety Canada
documents, natural disasters account for 70% of all disasters in Canada, and are stated as a priority for
public safety in Canada (Graham, 2011; Public Safety Canada, 2015). Climate change weather
impacts on infrastructure were noted: “The rate and severity of extreme weather events is expected to
increase in the future. The trend of urbanization, and the growth of large cities, means that a natural
disaster confined to a small area can have devastating consequences on large numbers of people and
cascading effects across critical infrastructure sectors” (Public Safety Canada, 2015, p. 1).
From a risk management perspective, cascading and systemic effects of infrastructure failure have
important implications for decision-makers in those infrastructure groups. Individual decisions to
ignore or underspend on risk management poses a risk to the entire infrastructure group, and all those
that depend on it. Furthermore, where infrastructure groups are co-dependant on external, cross border
groups, issues of cross border reliability and inter jurisdictional energy security are raised. The fact of
Ontario’s bulk electricity system’s reliance on the larger connection of continental transmission
systems across North America, is a case in point. Inter-tie connections (see glossary) assist in the
25
reliability of electricity delivery in Ontario enabling electricity exports to neighbouring jurisdictions
during surplus supply conditions, and imports of electrical power during regional (Ontario) supply
shortages. The 2003 electrical grid blackout across north eastern Canada and the U.S. brought
attention to the failure of the bulk electricity system and was deemed a critical infrastructure crisis,
posing operational and strategic challenges to both government and private actors (Spears, 2013).
The above descriptions not only highlight the highly interconnected and complex nature of electricity
systems in supporting critical infrastructure, but remind us how vulnerable we become the more
dependent we are on electricity systems (Boin & McConnell, 2007).
Next, the sector roles of power producers and utilities are discussed.
2.3.2 The Electricity Sector in Ontario (Canada)
Historically, the electricity sector in Ontario has evolved in a somewhat uneven fashion over the last
15 years. From the 1980’s the electricity market moved from a monopoly based electricity system to a
competitive wholesale electricity market in 2002 effectively dismantling the province–wide Ontario
Hydro’s (and local municipalities’) monopoly on energy provision to the province (Ontario Energy
Board, 2015). Additionally, price setting previously established by the provincial government was
also abandoned in favour of an open wholesale electricity price system. A mix of private, not for
profit and publicly owned entities now exist in Ontario’s hybrid electricity market. Ontario’s
wholesale electricity market was and continues to be restructured with new market constituents,
pricing methodologies, policies and regulatory regimes. A progression of provincial statutes fostered
the above changes including The Ontario Electricity Act (1998), The Electricity Restructuring Act
(2004), The Ontario Green Energy Act (2009) and The Climate Change and Low-Carbon Economy
Act (2016). Additionally, the Ontario Regulation 144/16, understood as ‘The Cap and Trade Program’
provides the regulatory framework for the 2016 Climate Change Act. Both the Climate Change Act
and the Cap and Trade Regulation establish the details of Ontario’s Cap and Trade program for the
purpose of reducing GHG emissions in Ontario. For Ontario’s electricity sector, the implications of
GHG emissions reduction or ‘abatement’ has broad-reaching effects, particularly for the fossil fuel
electricity power producers and their upstream natural gas fuel suppliers (see Section 2.3.4).
Sector constituents and their accountabilities and relationships are compiled by the researcher in the
following chart, shown next in Table 2.1.
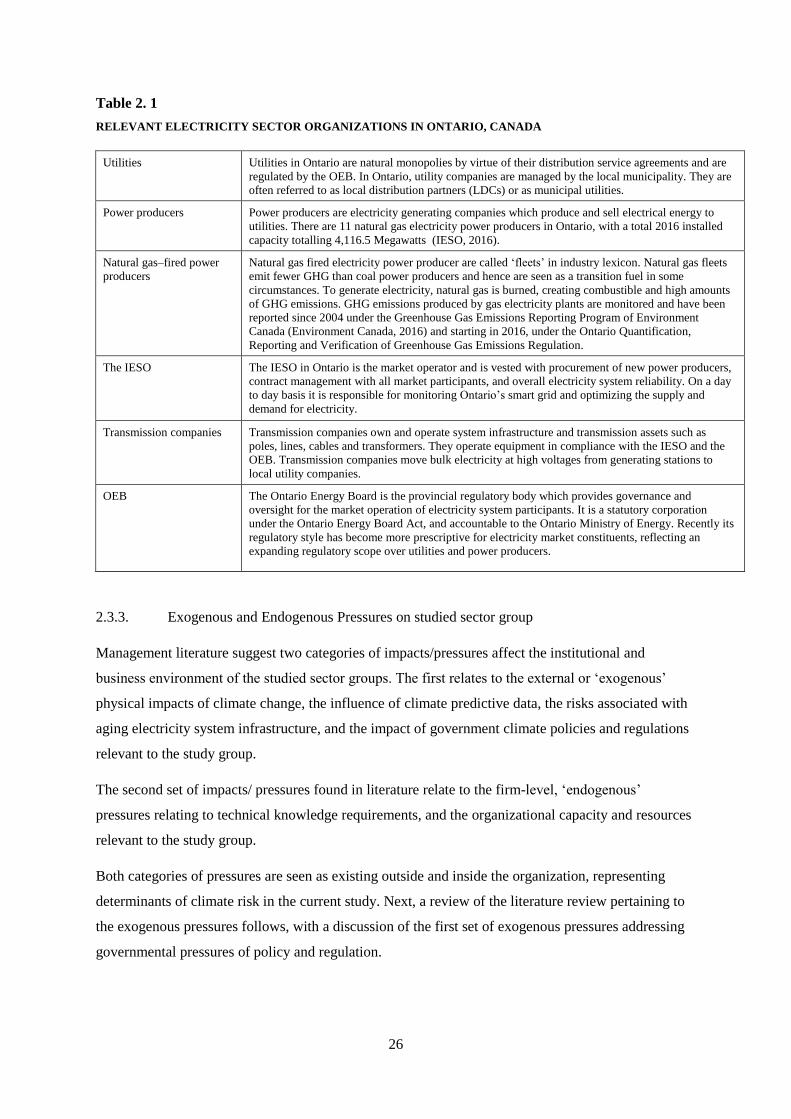
26
Table 2. 1
RELEVANT ELECTRICITY SECTOR ORGANIZATIONS IN ONTARIO, CANADA
Utilities Utilities in Ontario are natural monopolies by virtue of their distribution service agreements and are
regulated by the OEB. In Ontario, utility companies are managed by the local municipality. They are
often referred to as local distribution partners (LDCs) or as municipal utilities.
Power producers Power producers are electricity generating companies which produce and sell electrical energy to
utilities. There are 11 natural gas electricity power producers in Ontario, with a total 2016 installed
capacity totalling 4,116.5 Megawatts (IESO, 2016).
Natural gas–fired power
producers
Natural gas fired electricity power producer are called ‘fleets’ in industry lexicon. Natural gas fleets
emit fewer GHG than coal power producers and hence are seen as a transition fuel in some
circumstances. To generate electricity, natural gas is burned, creating combustible and high amounts
of GHG emissions. GHG emissions produced by gas electricity plants are monitored and have been
reported since 2004 under the Greenhouse Gas Emissions Reporting Program of Environment
Canada (Environment Canada, 2016) and starting in 2016, under the Ontario Quantification,
Reporting and Verification of Greenhouse Gas Emissions Regulation.
The IESO The IESO in Ontario is the market operator and is vested with procurement of new power producers,
contract management with all market participants, and overall electricity system reliability. On a day
to day basis it is responsible for monitoring Ontario’s smart grid and optimizing the supply and
demand for electricity.
Transmission companies Transmission companies own and operate system infrastructure and transmission assets such as
poles, lines, cables and transformers. They operate equipment in compliance with the IESO and the
OEB. Transmission companies move bulk electricity at high voltages from generating stations to
local utility companies.
OEB The Ontario Energy Board is the provincial regulatory body which provides governance and
oversight for the market operation of electricity system participants. It is a statutory corporation
under the Ontario Energy Board Act, and accountable to the Ontario Ministry of Energy. Recently its
regulatory style has become more prescriptive for electricity market constituents, reflecting an
expanding regulatory scope over utilities and power producers.
2.3.3. Exogenous and Endogenous Pressures on studied sector group
Management literature suggest two categories of impacts/pressures affect the institutional and
business environment of the studied sector groups. The first relates to the external or ‘exogenous’
physical impacts of climate change, the influence of climate predictive data, the risks associated with
aging electricity system infrastructure, and the impact of government climate policies and regulations
relevant to the study group.
The second set of impacts/ pressures found in literature relate to the firm-level, ‘endogenous’
pressures relating to technical knowledge requirements, and the organizational capacity and resources
relevant to the study group.
Both categories of pressures are seen as existing outside and inside the organization, representing
determinants of climate risk in the current study. Next, a review of the literature review pertaining to
the exogenous pressures follows, with a discussion of the first set of exogenous pressures addressing
governmental pressures of policy and regulation.
27
2.3.4 Exogenous Pressures #1—Governmental Pressures of Policy and Regulation
The first set of exogenous pressures in this study refer to the external impacts of government climate
policy and GHG regulation affecting the studied participants. Government policy is understood as the
policy framework promoting climate change mitigation in Ontario, as exemplified by the Ontario
Long Term Energy Plan and the related statute, the Climate Change and Low Carbon Economy Act
(2016). GHG abatement is embodied in the Ontario 144/16 regulation which actively prescribes
emissions reduction for large GHG emitters and participation in the emissions trading scheme known
as The Ontario Cap and Trade program. Both climate policy and regulation are governmental
mechanisms to de-carbonize the province’s energy systems, affecting electricity power producers in
different ways. While the impact of government policy and regulation on other types of electricity
production i.e. nuclear, hydro-electric are also significant, focus here is on the gas fired electricity
power producers exclusively, and the other group, electrical utilities.
Congruent with the research aim of this work, management cognition of these two particular forces of
pressure are viewed by the researcher as potential influences on climate risk perceptions. Examination
of how electricity managers view these pressures are examined.
The economics of fossil fuel-based electricity power production and electricity distribution by utilities
are influenced by a number of factors, including natural gas commodity prices, governmental energy
policies, GHG regulations mandating emissions control expenses, grid reliability, and market factors
relating to consumption and power producers mix (see Glossary) in the province. The researcher
reminds that management cognition of climate risks may be influenced by either or both exogenous
pressures either directly or indirectly.
Most of Ontario’s electrical power producers mix (see Glossary) is generated by hydro and nuclear
power producers sources; however, production by natural gas fired plants, the focus of one of two
groups in the present study, is forecast to increase four fold by 2025—to 29 per cent of Ontario’s
overall power producers mix (Navigant Consulting, 2015). Reasons attributed to these projections
include fuel-switching due to Ontario’s recent coal-fired plant retirements, planned nuclear power
plant refurbishments, electrification of vehicles, and increased need for natural gas produced
electricity to support the province’s planned integration of additional renewable power resources into
the grid (Navigant Consulting, 2015).
Exogenous pressures affecting power producers’ companies include upstream, supply side factors,
namely commodity pricing and other characteristics of natural gas extraction. Abundantly increasing
supplies of natural gas from recently discovered North American shale gas reserves, produce
increases not only in production, but in reserves (in the ground, capacity) estimates. Newer fracking
and horizontal drilling technologies have further increased production efficiencies of natural gas
28
extraction, accelerated time to market and improved reliability and overall supply chain performance
of natural gas–fired power producer plants (Navigant Consulting, 2015).
The increase in demand for natural gas fired electricity is further enhanced by operational versatility:
the flexibility of natural gas fleets to ramp up quickly and be operated as base load, intermediate and
peak load facilities (the relative degree of electricity demand, according to volume) allow for fuel
switching, load switching from nuclear, and load support for intermittent power generated by time and
weather-dependant renewable energy resources such as solar and wind power (National Energy
Board, 2016).
More significantly. fuel substitution away from coal to natural gas operationalized by the province’s
2003 Long Term Energy Plan, encouraged new construction of natural gas plants in the province,
resulting in 90 per cent of all natural gas fleet being less than 10 years old (DeMarco, 2015).
Reportedly, these plants were not built with emissions control technologies to meet current regulatory
GHG emissions control requirements (DeMarco, 2015, p. 3).
Industry representatives from the Association of Power Producers of Ontario (APPrO) explained it
this way: “Emissions improvements in this segment may be achieved only through decreased
production or asset retirement, or decreased contract life of an asset. Ontario’s existing natural gas
fleet has no physical ability to mitigate its emissions as the power producers’ technology is set at the
time of construction and the supply mix directives have stipulated how much capacity is to be
allocated to what power producers technologies” (DeMarco, 2015, p. 3). Supply agreements for power
producers facilities under clean energy supply contracts, and the extension of older non-utilities
(NUG) contracts, APPrO stated, ‘do not adequately address GHG related costs in a manner that is
equitable, and keeps power producers whole’ (DeMarco, 2015, p. 5).
In further irony, the same energy policies which fostered increased investment in gas-fired electricity
production, paradoxically now constrain their current upstream natural gas suppliers with increased
costs for compliance and emissions control (Butters, 2018). At the time of this research, gas-based
electricity producers were temporarily exempted until 2020 from having to purchase emissions
allowances under the Cap and Trade program. However, starting in 2018, they will bear an
incremental and increasing direct cost of emissions allowances at a rate of 4.57% per year (GoEnergy,
2017; MOE, 2017).
Implications of these government policy and regulatory interventions create a financial burden for
industry participants in at least two ways: a reduction in total revenue requirements of power
producers and an increase in the marginal cost of energy produced by natural gas fleets (Parmesano
& Kury, 2015).

29
Firstly, anticipated total revenue reductions brought about by new climate–related regulatory
pressures occur where gas fired electricity power producers are fully regulated into the government
scheme in 2020 and their compliance costs will include the costs of emissions allowances or permits
to ‘clear’ or cover their emissions levels. At the same time, natural gas electricity producers will need
to find cost effective methods to reduce emissions. Emissions control technologies such as advanced
turbine equipment are just being developed globally but are costly and represent significant capital
expenditures for market participants (Packham, 2015).
Secondly, higher input costs of managing emissions will likely affect the marginal cost of energy
produced by this segment. In a wholesale market where the marginal cost of energy is the market
price of energy, and in a scenario where the marginal cost increases to include the costs of associated
emissions control, market prices for electricity will increase and market demand and consumption
may fall, and/or switch to alternative sources of electricity production (Parmesano & Kury, 2015).
The implications of governmental and regulatory pressures on the natural gas segment of electricity
producers in the present study have been discussed. Next, the other dominant set of exogenous
pressures affecting both power producers’ groups and utilities, those being the impacts of climate
change and climate data, are discussed.
2.3.5 Exogenous Pressures #2—Climate Impacts, Climate Data and Aging Infrastructure
The second set of exogenous pressures in this work refer to the external impacts of direct, sudden
climate events, the impact of climate data and of aging infrastructure. Climate data is understood as
predictive data of weather patterns in the medium term, beyond the range of local meteorological
forecasting services. Aging infrastructure is understood as electricity system infrastructure relating to
overhead infrastructure assets (substations, distribution lines, wires, and poles) and underground
assets (below-ground substations and distribution circuits and cables; Singh et al., 2015).
Lifecycle analyses of Ontario’s electricity infrastructure is variously end of lifecycle in many regions
and as such, is regarded as insufficiently ‘climate-hardened’ for future increases in extreme weather
events.
Climate impacts can be gradual over time, or sudden, surprising and catastrophic. While there is more
certainty about the occurrence of long term climate changes, less is known about the effect of future
sudden and potentially catastrophic weather on organizations’ ability to cope with such events.
Empirical evidence exists that severe weather is becoming more common. Climate risk analysts with
Lloyd’s of London insurance group reported that the phenomenon in which events that were expected
to occur only once in 100 years are now occurring with much greater frequency. The report
commented “we have tended to think of climate change as a gradual phenomenon, with the impact
expected to be felt evenly over time, and any increase in loss taking place incrementally” (Lloyd's of
30
London, 2006, p. 3). In Ontario, storms that used to occur once every forty years now occur once
every six (Reduction, 2012). Identification and assessment of these climate impacts highlight the
CEA’s 2015 report on Climate Adaptation. Nine specific climate impacts on electricity power
producers and utilities are noted in the report: 1) increases in air and water temperatures; 2) changes in
water availability; 3) ice storms; 4) sea level rises, storm surges; 5) impacts on biodiversity and
invasive species; 6) changes in precipitation, runoff and ground conditions; 7) permafrost melt and ice
reductions; 8) higher winds; and 9) wildfires. These climate drivers as shown in Tables 2.2 and 2.3
ahead.
Furthermore, assessments of climate impacts on electricity company performance were noted as
including loss of efficiency in electricity output, damage to facilities, cables and wires, flooding of
substations; and wildfires creating dangerous’ flashovers’ from electricity infrastructure (Canadian
Electricity Association, 2015).
The CEA report also noted that “The potential climate impacts for the electricity sector will vary by
region, and vary in their material importance i.e. financial sensitivities and insurance exposure, for
individual companies” (Canadian Electricity Association, 2016, p. 20). Furthermore, due to the
complexity and system-wide co-dependencies of the electrical power supply system, impacts which
occur outside of the categories of the study groups, e.g. on a non-natural gas electricity power station,
such as a nuclear power generating station, can still have significant cascading effects on natural gas
plants as they are called to dispatch supporting power to offset power losses.
One measure of the magnitude of the impact of direct sudden weather events is represented by the
quantification of insurable losses reported by government and insurance groups. For instance, the
2015 Quadrennial Energy Review, directed by US President Obama’s via executive order, identified
almost $22 billion (USD) in total losses from a range of weather events in the year 2013, excluding
self-insured losses, and points out that “extreme weather events resulting in more than $1 billion
(USD) in damages” are increasing (as excerpted in Canadian Electricity Association, 2016, p. 8).
Many examples of financial loss due to climate change in Canada have been documented. Utilities are
increasingly reporting that climate change is the cause of power outages and service interruption in
customer communications (Horizon Utilties, 2016; Hydro Quebec, 2016; Toronto Hydro
Commission, 2016). Meanwhile, catastrophic loss due to climate change is becoming a more common
reference where insurable loss per weather event exceed $25 million per event in a given year. The
Insurance Bureau of Canada’s analysis of the period 2009 to 2016, has determined that two climate
variables specific to Canada are of some concern. According to the Insurance Bureau of Canada,
changes in intensity and duration of rain fall events, and impacts on aging infrastructure in urban and
rural settings are the leading climate drivers for catastrophic business loss (Insurance Bureau of
Canada, 2015).
31
The second exogenous pressure in this set is the risk impact of climate data. Sudden direct climate
events are inherently difficult to forecast. Climate data and modelling of high impact, low probability
patterns of climate behaviour would be useful to infrastructure planners for planning purposes, and to
power producers and utilities for operational and longer-term planning. Operationally, producers and
utilities would be able to appraise the sufficiency of overhead and underground system assets to
withstand extreme events in the future. Climate data and climate modelling simulating future climatic
impacts are still limited. Due to the limitations of GCMs reported by the IPCC, the mean grid spacing
for data is approximately 500 kilometres. Thus, weather developments acting on smaller scales cannot
be fully determined. This results in high levels of uncertainty associated with climate data and
modelling.
The third exogenous pressure identified in this section is the risk impact of aging electrical
infrastructure. Many elements of the electrical grid now approach or have already exceeded their
initial design span. The U.S. Association of Civil Engineers reported that North American (including
Canadian inter-tie grids) electrical transmission and distribution lines were built between 1950 and
1969 with expected operating lifespans of 50 years (Engineers, 2017). In most areas of Canada,
expansion and climate-hardening of the electrical transmission system lags behind the growth of
electricity demand and expansion of generation capacity (Baker et al., 2011). Operating in Ontario’s
largest urban centre, Toronto Hydro estimated that approximately one–third of its electrical
distribution assets are currently past their expected useful life (Toronto Hydro, 2013). It also
attributed 40 % of outages to aging equipment (Kane, 2013, January 28; Toronto Star, 2016). Across
Ontario, similarly, the largest reported threat to Ontario’s bulk electricity system for the period 1992-
2012, were interruptions due to severe weather and related events (Singh et al., 2015). For the present
time, aging infrastructure has been and remains a key source of concern for power producers and
utilities (Canadian Electricity Association, 2016).
The above serves as a brief introduction to the second set of exogenous pressures identified in this
study. Understanding the context and scope of power producers’ and utilities’ concern for these
factors is key to this work. The pressures discussed are now adapted to the nomenclature of the CEA
(2015) report as ‘climate drivers’. Climate drivers, as construed by the CEA for power producers and
utilities, are excerpted in Tables 2.2 and 2.3.
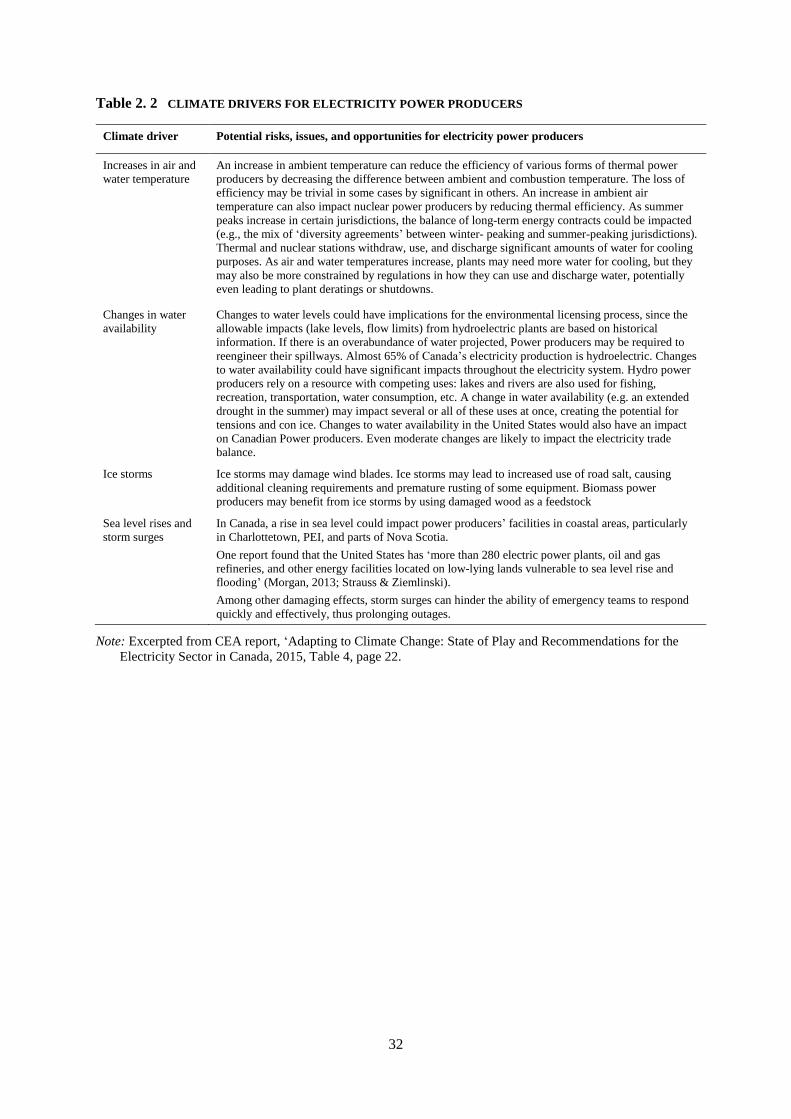
32
Table 2. 2 CLIMATE DRIVERS FOR ELECTRICITY POWER PRODUCERS
Climate driver Potential risks, issues, and opportunities for electricity power producers
Increases in air and
water temperature
An increase in ambient temperature can reduce the efficiency of various forms of thermal power
producers by decreasing the difference between ambient and combustion temperature. The loss of
efficiency may be trivial in some cases by significant in others. An increase in ambient air
temperature can also impact nuclear power producers by reducing thermal efficiency. As summer
peaks increase in certain jurisdictions, the balance of long-term energy contracts could be impacted
(e.g., the mix of ‘diversity agreements’ between winter- peaking and summer-peaking jurisdictions).
Thermal and nuclear stations withdraw, use, and discharge significant amounts of water for cooling
purposes. As air and water temperatures increase, plants may need more water for cooling, but they
may also be more constrained by regulations in how they can use and discharge water, potentially
even leading to plant deratings or shutdowns.
Changes in water
availability
Changes to water levels could have implications for the environmental licensing process, since the
allowable impacts (lake levels, flow limits) from hydroelectric plants are based on historical
information. If there is an overabundance of water projected, Power producers may be required to
reengineer their spillways. Almost 65% of Canada’s electricity production is hydroelectric. Changes
to water availability could have significant impacts throughout the electricity system. Hydro power
producers rely on a resource with competing uses: lakes and rivers are also used for fishing,
recreation, transportation, water consumption, etc. A change in water availability (e.g. an extended
drought in the summer) may impact several or all of these uses at once, creating the potential for
tensions and con ice. Changes to water availability in the United States would also have an impact
on Canadian Power producers. Even moderate changes are likely to impact the electricity trade
balance.
Ice storms Ice storms may damage wind blades. Ice storms may lead to increased use of road salt, causing
additional cleaning requirements and premature rusting of some equipment. Biomass power
producers may benefit from ice storms by using damaged wood as a feedstock
Sea level rises and
storm surges
In Canada, a rise in sea level could impact power producers’ facilities in coastal areas, particularly
in Charlottetown, PEI, and parts of Nova Scotia.
One report found that the United States has ‘more than 280 electric power plants, oil and gas
refineries, and other energy facilities located on low-lying lands vulnerable to sea level rise and
flooding’ (Morgan, 2013; Strauss & Ziemlinski).
Among other damaging effects, storm surges can hinder the ability of emergency teams to respond
quickly and effectively, thus prolonging outages.
Note: Excerpted from CEA report, ‘Adapting to Climate Change: State of Play and Recommendations for the
Electricity Sector in Canada, 2015, Table 4, page 22.
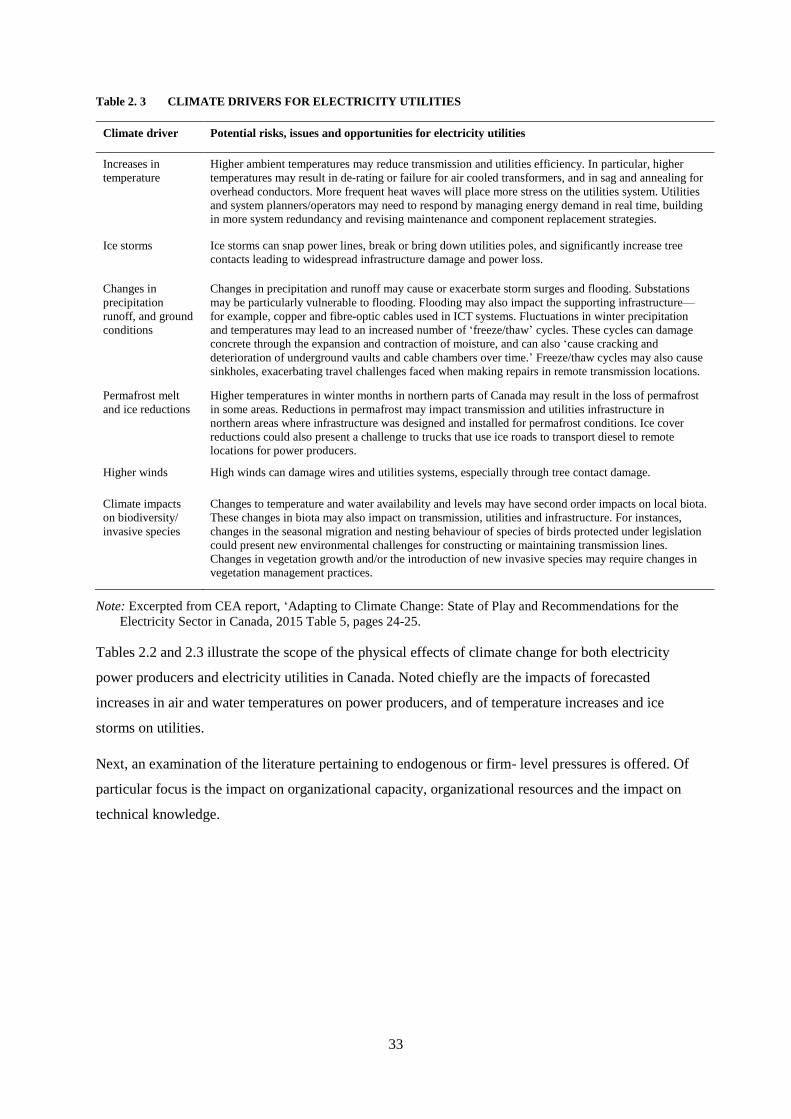
33
Table 2. 3 CLIMATE DRIVERS FOR ELECTRICITY UTILITIES
Climate driver Potential risks, issues and opportunities for electricity utilities
Increases in
temperature
Higher ambient temperatures may reduce transmission and utilities efficiency. In particular, higher
temperatures may result in de-rating or failure for air cooled transformers, and in sag and annealing for
overhead conductors. More frequent heat waves will place more stress on the utilities system. Utilities
and system planners/operators may need to respond by managing energy demand in real time, building
in more system redundancy and revising maintenance and component replacement strategies.
Ice storms Ice storms can snap power lines, break or bring down utilities poles, and significantly increase tree
contacts leading to widespread infrastructure damage and power loss.
Changes in
precipitation
runoff, and ground
conditions
Changes in precipitation and runoff may cause or exacerbate storm surges and flooding. Substations
may be particularly vulnerable to flooding. Flooding may also impact the supporting infrastructure—
for example, copper and fibre-optic cables used in ICT systems. Fluctuations in winter precipitation
and temperatures may lead to an increased number of ‘freeze/thaw’ cycles. These cycles can damage
concrete through the expansion and contraction of moisture, and can also ‘cause cracking and
deterioration of underground vaults and cable chambers over time.’ Freeze/thaw cycles may also cause
sinkholes, exacerbating travel challenges faced when making repairs in remote transmission locations.
Permafrost melt
and ice reductions
Higher temperatures in winter months in northern parts of Canada may result in the loss of permafrost
in some areas. Reductions in permafrost may impact transmission and utilities infrastructure in
northern areas where infrastructure was designed and installed for permafrost conditions. Ice cover
reductions could also present a challenge to trucks that use ice roads to transport diesel to remote
locations for power producers.
Higher winds High winds can damage wires and utilities systems, especially through tree contact damage.
Climate impacts
on biodiversity/
invasive species
Changes to temperature and water availability and levels may have second order impacts on local biota.
These changes in biota may also impact on transmission, utilities and infrastructure. For instances,
changes in the seasonal migration and nesting behaviour of species of birds protected under legislation
could present new environmental challenges for constructing or maintaining transmission lines.
Changes in vegetation growth and/or the introduction of new invasive species may require changes in
vegetation management practices.
Note: Excerpted from CEA report, ‘Adapting to Climate Change: State of Play and Recommendations for the
Electricity Sector in Canada, 2015 Table 5, pages 24-25.
Tables 2.2 and 2.3 illustrate the scope of the physical effects of climate change for both electricity
power producers and electricity utilities in Canada. Noted chiefly are the impacts of forecasted
increases in air and water temperatures on power producers, and of temperature increases and ice
storms on utilities.
Next, an examination of the literature pertaining to endogenous or firm- level pressures is offered. Of
particular focus is the impact on organizational capacity, organizational resources and the impact on
technical knowledge.
34
2.3.6 Endogenous Pressures—Organizational Capacity, Resources, Technical Knowledge
Endogenous pressures, as mentioned, are those factors related to firm-level and internal pressures on
the organization created by climate change. A review of the literature in this thread suggests that
business responses to climate change are enabled or constrained by the capacity and resources of the
firm, as well as the level of technical knowledge of the firm in managing climate-related phenomena.
Gasbarro et al. (2016) noted that firm level interpretations of physical climate impacts determined
corporate adaptation behaviour. Weinhofer and Busch (2013) asserted that most negative impacts on
business operations created by climate change deal with future conditions and are therefore subject to
uncertainty. It was established earlier that climate change is characterized by a high degree of
uncertainty. Because of this, there is greater institutional pressure to develop organizational capacities
and resources to deal with uncertain future operating conditions. Prior literature of corporate climate
based action dealt with corporate response to gradual changes in climate events, and included
technology and management strategies accommodating slow-moving environmental changes
(Linnenluecke et al., 2008). More recently, literature has broadened to include work on corporate
response to sudden, high impact events, providing practical approaches of corporate strategy and
decision making at the strategic and operational level of the organization. Organization capacity at the
strategic and operational level of the organization, and the corporate resource of knowledge, either
with experience or without prior experience, is designated here as the endogenous factors driving
corporate recognition of climate risk.
Most discussions on organizational capacity were framed in the earlier resource-based view of the
organization addressing the central question why some firms outperform in a competitive
environment and some don’t. Weinhofer and Busch (2013)’s more recent work defined organizational
capacity of firms as driven by the “internal conditions (which allow) organizations to develop
strategies and mechanisms for reducing exposure to extreme climate events” (Weinhofer & Busch,
2013, p. 193). Their work echoes prior contributions that proposed that decision making biases and
aspects of organizational implementation can influence organizational capacity (Amit and
Schoemaker,1993).
In the context of climate risk management, the strategic capabilities of the firm, as discussed by
Wilbanks & Sathaye (2007) include corporate recognition and assessment of the broader view of
organizational vulnerability to projected and ongoing changes in weather patterns. Awareness and
understanding of how climate events interact with organizational activities and identification of
weather hotspots are part of strategic capabilities (Wilbanks & Sathaye, 2007). Discussions in their
work are noted operational capacity as including crisis management programs but note them however
as temporary and short term.
35
In other contributions, theories about what causes changes in organizational capacity related to ideas
about munificence, complexity and dynamism (Dess & Beard, 1984). More recent discussions about
the effect on organizational capacity by the ‘surprise’ element of extreme climate events appear, not
too surprisingly in climate literature (Haigh & Griffiths, 2012). Moreover, knowledge regarding how
to respond to these dynamic environmental changes are driven by social constructions of climate
change and are ‘routed into the social political context of the organization’ (Rothenberg &
Zyglidopoulos, 2007, p. 40).
Other contributions suggest the implications of strategic and operational capacities are derived from
the organization’s knowledge and sensemaking capacity informed by prior experience with direct and
extreme weather events (Holling et al., 2002). According to several contributors, firm-level
sensemaking of experience instils corporate memory, learning moments, teachable moments and
knowledge useful for appraisal and decision-making (Berkes & Folke, 2002; Linnenluecke et al.,
2008; Schneider, 2001; Smith, 1997). References to corporate knowledge without experience (first-
hand experience) are rare however, since most companies tend to accelerate ways to learn from the
experience of others through observations, case studies, and best practices. Busch (2011) said
corporate knowledge on climate issues is significantly different from ‘business as usual’ corporate
knowledge and suggested that knowledge absorption, operational flexibility and strategic integration
of climate knowledge were prescriptive for corporate improvements in this area.
2.4 CORPORATE ADAPTATION TO CLIMATE CHANGE
How business succeeds or fails is a driving theme in research and theory construction (Yin, 2014).
How business succeeds or fails to respond or adapt to climate change impacts is a relatively new field
of investigation in academic literature. Corporate adaptation can be understood as the result of
measures that a company chooses to implement to adapt to climate change (Adger et al., 2010). This
section draws together the relatively recent contributions addressing corporate adaptation from a
number of different perspectives.
Several research streams stand out for their conceptual and empirical contributions to the corporate
adaptation debate. A sizable body of earlier academic literature explains corporate adaptation by
open–systems organizational theory (Pfeffer, 1997), where organizations rarely adapt
“autonomously” (Berkhout et al., 2006, p. 135) but instead are strongly influenced by other
organizations and influences outside the firm. Strategic fit, and, alignment are constructs found in that
earlier work—where organizational environments pre-dated the recognition of climate change as a
fact of organizational life (Winn et al., 2011).
However, while the open systems concept of organizational response complements the research
design of this work (where multiple macro, external and firm level, internal influences are construed
as climate drivers), only three sub themes appear to dominate corporate adaptation literature at this
36
point in time. Beyond descriptive discussions of types of adaptation i.e. planned versus unplanned
adaptation (Metzger & Rounsevell, 2011), anticipatory adaptation (Linnenlueke et al., 2012), pre-
emptive versus reactive adaptation (Gasbarro & Pinkse, 2015) prior research has tended to answer
three general questions: What climate change impacts is the organization adapting to? What are the
factors influencing the process of adaptation? What does the adaptation process look like? A review
of literature addressing those sub themes is offered next.
2.4.1 Adaptation to Impacts
In answering the first question of what climate change impacts is the organization adapting to, the
answer appears to lie in only two well discussed areas: the impact of regulation and the impact of
climate change as a physical phenomenon. Climate impacts research has looked at the effect of
regulatory carbon management regimes in various contributions (Hoffmann et al., 2009; Kolk et al.,
2008; Kolk & Pinkse, 2004; Weinhofer & Hoffmann, 2008). A great deal more has focussed on the
physical dimensions of climate change, e.g. (Linnenluecke & Griffiths, 2010; Linnenluecke et al.,
2008; Linnenlueke et al., 2012; Winn et al., 2011; Winn & Kirchgeorg, 2005). Provocative and novel
terms for climate change impacts were offered in those contributions, such as “massive discontinuous
change” (Winn et al., 2011, p. 157) and “disruptions in the natural environment” (Busch, 2011, p.
389). Definitions of climate impacts in that literature seem variously reflective of the ‘organization
and the natural environment’ paradigm.
2.4.2 Factors Influencing Adaptation
In answering the second question of what factors seem to play a role in driving corporate adaptation,
the research is mixed. Factors identified in prior work were awareness and concern (Arnell &
Delaney, 2005) vulnerability (Berkhout et al., 2004) regulatory uncertainty (Hoffmann et al., 2009),
organizational capabilities (Busch, 2011),and location (Galbreath, 2014). More recently, subjective
reasoning and management interpretation of factors influencing corporate adaptation has appeared in
the literature. Gasbarro and Pinkse (2015) asserted that the way in which firms interpret climate
impacts will play a role in organizational response. Similarly, Linnenlueke et al. (2012)‘s work
proposed that the process of management interpretation of climate impacts was done through
organizational sensemaking to model corporate adaptation.
2.4.3 Adaptation Process
The researcher agrees with contributions that suggest how an organization responds to climate
impacts is actually a form of organizational adaptation. Whether the organization prepares in advance
for future conditions through mitigative action, or responds to impacts as they unfold, both responses
are adaptive in nature. A review of literature pertaining to how industries are planning to cope with
climate impacts can be found in prior empirical work in the agriculture, residential construction and
37
winter tourism industries (Schneider et al., 2000; Warner et al., 2010) Hertin et al., 2003) (Konig &
Abegg, 2010). In those contributions, corporate adaptation is described as a corporate innovation
mode (Pinkse & Kolk, 2010) and in others, as organizational learning (Berkhout et al., 2006;
Okereke et al., 2011). Still others suggest that the corporate adaptation processes bear close similarity
with standard risk management approaches and that corporate adaptive behaviour resembles risk
management strategy (Weinhofer & Busch, 2013). This work accommodates this last approach.
Bridging the discussion about the process of corporate adaptation with the process of risk
management is the goal of the next section.
2.5 RISK MANAGEMENT OF CLIMATE IMPACTS
A review of literature pertaining to the management of climate risks indicated that contributions exist
albeit in a narrow empirical context dominated by the financial and insurance fields (Disclosures,
2017; Power, 2003).
A growing body of empirical literature now suggests that the impact of climate change is of material
interest to businesses, and as such, ought to be managed within a risk management framework
(Weinhofer and Busch 2013). Indeed, the proposition of this study suggests that climate risks are
appearing on a number of fronts within the studied electricity sector: the definition of climate risk is
broader than just the impact of physical events attributed to climate change. Climate risks now
represent for the study participants a wide range of exogenous and endogenous impacts on
organizations in the studied field. Congruently, the proactive and systematic process of understanding
and managing risks across the organization can be better served by risk management disciplines. Not
only is risk management a component of good management and decision making, its relevance for
climate risk management cannot be understated. It offers important insights for identifying, assessing
and responding to risks (Grinyer et al., 1980). Most risk management programs are standardized and
process-based and seek to immunize subjective interpretations of corporate risks (Roberts et al.,
2015). However, effective risk management nevertheless requires an understanding of the perceptions
and beliefs of involved parties, and how these beliefs give rise to actions that influence those risk
management decisions (Wood et al., 2012).
Most if not all risk management focuses on potential events, rather than past performance and
therefore has no uniquely identifiable measurement mechanism. Instead one finds in risk management
practice a variety of risk identification and assessment tools and processes to explicate future
eventualities (Mikes & Kaplan, 2014). The Committee of Sponsoring Organizations of the Treadway
Commission (COSO, see glossary) defined risk management as ‘ a process, affected by an entity’s
board of directors and management designed to identify potential events that may affect the entity,
and manage those risks to be within its risk appetite, and to provide reasonable assurance regarding
the achievement of entity objectives (Steinberg et al, 2004, p. 2).
38
2.5.1 Risk Management as Type of Corporate Adaptation to Climate Impacts
Standardized risk management taught in business schools today reference an integral three phase
process for identifying risks, analysing them and then deciding upon a response (Roberts et al. 2005).
More specifically, Weinhofer and Busch (2013) defined corporate management of climate risks as
those three measures ‘taken by the organization to address the potential negative impacts imposed on
their business activities arising from climate change’ (Weinhofer & Busch, 2013, p. 127).
Corporate response to climate change that mirror the three-stage corporate risk management
framework are evident in other contributions. For instance, Arnell and Delaney (2005) suggested
organizations must be aware of climate risks in order to address the impacts, be concerned about the
consequences and be able to develop a corporate response to the impacts. Berkhout et al. (2006)’s
adaptation strategy of “risk assessment and options appraisal” suggested the organization begin a risk
management process by focusing on risk identification and risk assessment (Berkhout et al., 2006, p.
151). The third stage of risk management—that being risk response- is reflected in Berkhout et al.’s
(2006) strategy for “bearing and managing risks” and “sharing and shifting risks”- which focuses on
transferring risk through insurance and collaboration (Berkhout et al., 2006, p. 151).
How decision makers interpret or appraise the implications of risk may be categorized by risk
management techniques. For example, companies may rely on climate data to identify the source and
classification of extreme and sudden weather events (Changnon et al., 1995; Ouranos Consortia,
2016). Decision makers may use technical risk estimates of the probability of harm or damage to
evaluate or assess risks. Decisions on how to respond to risks may be preventative in nature, or rely
on risk transfer options such as insurance to protect organizational assets.
2.5.2 Climate Risk Readiness
The construct of climate risk readiness identified in Weinhofer and Busch’s (2013) empirical work of
European electricity utilities is a useful one in the present study. Weinhofer and Busch (2013) relied
on a risk management framework in their methodology to identify the state of climate risk readiness
of European utilities. Their conclusion was respondents were in various stages of climate risk
readiness “predominantly ascribed to different levels of knowledge about climate changes and the
already experienced, expected and not yet fully anticipated negative impacts caused by these changes”
(Weinhofer & Busch, 2013, p.138).
The same framework will be used in this work to establish the broad categories of participant
constructs elicited in the Pilot Study (see Chapter 4) and in the Main Study (see Chapter 5).
Next the researcher turns to the review of the literature on management cognition and the survey of
risk perception theories, including sensemaking theories. Special focus is given to PCT in the
following section.
39
2.6 MANAGEMENT COGNITION, RISK, AND RISK PERCEPTIONS THEORIES
2.6.1 Management Cognition
Central to this research is the question of how management construes and makes sense of climate
risks. Unsurprisingly, the examination of how management thinks about issues, strategies and
business risks is found in management cognition literature. A number of post-war theories of
organizational life viewed management thinking as rationally-bounded and objectivist in nature
(Simon, 1955). Until Chandler (1962) wrote Strategy and Structure, views of corporate decision
making mainly rested on notions of think-alike, utility seeking managers, producing similar or same
responses to management issues. Schendel and Hofer (1979)’s strategic management paradigm
extended Chandler’s (1962) proposition, implying a cognitive basis for management thinking.
Stubbart (1989)’s work drew greater attention to management cognition theory, admonishing
“rationality as an ideal rather than as an empirical fact” (Smircich & Stubbart, 1985, p. 238). Stubbart
asserted that individuals are not cognitively homogeneous, as had been previously thought. Smircich
& Stubbart (1985) proposed that business environments are ‘enacted’ or formed through social
construction and interactive processes of constituent groups (Smircich & Stubbart, 1985). They and
later, others, i.e. Weick (1988) and Kahneman and Tversky (1984) suggested that normative models
of decision making would better explain why managers are capable of envisioning, perceiving and
construing of the future. Stubbart’s (1989) landmark contribution Managerial Cognition: A Missing
Link in Strategic Management Research is no less explicit in remarking that the contributions of
cognitive science and psychology might better explain management cognition.
Around the same time Stubbart was theorizing about management cognition, behavioural
psychologists (i.e. Wood and Bandura, 1989) and later, interpretive sociologists (i.e. Weick, 1995)
were proposing that social cognitive and psychological theories might better explain corporate
performance. Wood and Bandura (1989) ’s social cognitive theory of organizational management, for
instance, proposed that organizational performance was a function of managerial ability driven by
managers’ cognitive, social and behavioural competencies.
A decade later, Weick’s (1995) fieldwork on decision making within high reliability organizations
(nuclear plants, in one instance) suggested that corporate actors interpret and act upon serious
business impacts (such as nuclear accidents) through a process of sensemaking. Using this process,
managers try to make sense of external stimuli through a process combining beliefs, preferences and
ideology to guide organizational response to external threats. Weick (1995) argued that organizational
ideology acts as a key driver for the sensemaking process as ‘it combines belief about cause and effect
relations, preferences for certain outcomes, and expectations to which sensemaking of appropriate
behaviour’ (Weick, 1995, p. 111). It is noteworthy that more recent examinations of corporate
response to climate change suggest that sensemaking processes aren’t necessarily useful. According to
40
Linnenlueke et al. (2012), organizational ideologies which drive the sensemaking process, pose
cognitive limits for individuals, constrain management choices and actions within the organization
(Linnenlueke et al., 2012, p. 26).
Next, the researcher turns to the discussions in the literature about risk itself, and its inherent
characteristics and implications for risk perceptions.
2.6.2 The Nature of Risk
In understanding risk, one can begin with the contemplation that the concept of risk itself is
epistemologically questionable if not flawed altogether. Why? Its primary condition is that of an
emergent state associated with situations in which it is possible but not certain that some undesirable
event will take place. Where there is a risk, there must be something unknown about the situation, or
the situation has an unknown outcome. In other words, knowledge about risk is knowledge about the
lack of knowledge. In this way, the study of risk and its various types, i.e., objective and subjective,
introduced in Section 2.2.2 and discussed further here, raises questions about their epistemological
status.
Debates over whether quantitative interpretations of risk earn more epistemological status over
qualitative interpretations are beyond the scope of this work. The key point to remember is that
climate change discourse, as discussed in Section 2.2., recognizes climate risk as a phenomenon that
gets treated in different ways by different groups. The quantitative definition of risk as ‘probability
multiplied by severity of an adverse impact’ satisfies the pre-occupation with cost benefit analysis and
technological assessment in natural science, insurance and jurisprudence (Sidortsov, 2014). In
contrast, qualitative definitions of risk as the effect of a hazard, and which is subject to multiple
interpretations of what the effect is, is aligned with the constructivist preference in this work.
The discussion of whether risk is to be treated with objective or subjective reasoning was addressed
by Adams (1995). He asserted that objective views of risk were the prerogatives of experts, while
subjective views were for lay people with their own ‘individual and socially constructed perceptions
of risk’ (Adams, 1995, p. 20). It is useful to note here that in prior work the objective- subjective
dichotomy was consistently and perhaps conveniently ascribed to either expert or non-expert groups.
None if any literature seems to have considered whether expert groups could themselves have
multiple risk constructions. Findings in the present study may throw light on this point, as study
participants themselves have expertise in climate risk management beyond what would be expected of
lay persons.
Extreme positions on the nature of risk are also noted. At one end of the spectrum, Brehmer and
Brehmer (1987) rejected subjective risks altogether arguing that no one can actually sense risk. At the
41
other end, proponents of subjective risk deny outright the existence of objective risk because “all risks
are at some point appraised by humans” (Beck, 2006, p. 334).
Sjöberg (1996) positioned in the middle ground, argued for co-existence of objective and subjective
risks, seemingly reflective of Sandman (1987)’s work that had defined risk as “combination of hazard
with outrage” (Sandman, 1987, pp. 21-22). Since Sjoberg (1996), other contributions have continued
to support the “fragile compromise” debate (between quantitative and subjective views). Renn et al.’s
(2000) work, for instance, suggested risk was ‘both a potential for harm as well as a social
construction for worry’ (p. 1).
Other important contributions on the nature of risk are found in Slovic’s (1981, 2000) work. His
construct of systemic risk, where multiple groups are affected either at the same time or in rippling
and cascading ways, is an appropriate reference to climate risk in this work. To appreciate this, one
could reflect on the 2003 OECD report entitled ‘Emerging Risks in the 21st Century’ where the threat
of climate change was stated as being concentrated and directed towards “human and natural
environments” (Hood, 2005, p. 30). However, in the context of energy systems, infrastructure and
electricity supply, more is at stake than human and natural environments. ‘Systemic risk’ is a more apt
term for climate change impacts. It not only reflects current risk governance literature which note risk
as embedded in the larger context of societal, financial and economic consequences, but it is at the
intersection between natural events, economic, social and technological developments and policy-
driven actions (Renn, 2005; Slovic, 2000; Slovic et al., 1981).
Other contributions made by Slovic (2000) and Beck (2006) broadened descriptions of systemic risk
in different and important ways. Slovic’s (2000) work on the Three Mile Island (TMI) nuclear
accident reckoned other consequences of risk besides injury, death and property damage, as costs of
stricter regulation (capital and operating costs), reduced operation of reactors worldwide, greater
public opposition to nuclear power, investor flight, community opposition and litigation. He put TMI
like accidents in the category of ‘unknown’ and ‘dread hazards’ capable of creating ‘large ripples’ or
cascading, systemic effects of risks. Wiser et al. (2004) called systemic risk a risk that affects all
members of a group simultaneously. Beck’s (2006) contribution to systemic risk in his essay Living in
the World Risk Society, noted that modern societies are being shaped by new kinds of risks
characterized by de-localization (risks are omnipresent) incalculableness (risks cannot be calculated)
and non-compensability (risks cannot be compensated for) (Beck, 2006, p. 334). Beck’s non-
compensability concept is reflected in the ‘precautionary principle’, discussed ahead in Section
2.6.3.5. As Beck stated: ‘Not only is prevention taking precedence over compensation, we are also
trying to anticipate and prevent risks whose existence has not been proven’ (Beck, 2006, p. 330).
Two preliminary agreements for the debate on risk perceptions have been arrived at so far. The first
was acknowledgement of the existence of subjective risk; in other words, if the notion of subjective
42
risk was rejected there would be no need to discuss risk perceptions. The second agreement that risk
exists for many as the ‘effect’ of a hazard. The ‘risk as hazard’ proposition aligns with the research
topic in this work where climate risk is defined as the effect of climate change (the hazard). Having
addressed both, the researcher turns next to the review of literature which variously attempts to
explain how perceptions of risk are formed.
2.6.3 Theories of Risk Perception
Theories of risk perception are found in literature from the sociology, political science, psychology
and anthropology fields. Uniformly, theorists sought to explain how risks interact with social,
institutional and cultural processes (Thompson et al., 1990). Congruently with that, the emphasis in
this literature review concentrates on theories which support the constructivist preference of the
present study. The literature reviewed here clearly departs from theories perhaps first articulated by
Lord Kelvin who said: ‘Anything that exists, exists in some quantity and can therefore be measured’
(Beer, 1967). Kelvin’s views suggested quantitative reasoning could account for all phenomena. It is
useful to note that Kelvin school fostered the basis for the RAP, which views risk as an objective
condition with a rational and individual bias (Jaeger et al., 2001, pp. 19-22). In risk management,
certain tools lend themselves to a RAP approach to risk. Probabilistic risk assessments offer a method
for analysing the failure of complex system. Risk estimates of a systems failure are typically based on
fault tree and event tree methods (Jaeger et al., 2001, p. 90). Yet rare events such as direct sudden
climate events discussed in Section 2.2 have little or no event data. Furthermore, the implications of
rare events as a social experience cannot be necessarily accommodated by RAP thinking.
Renn et al. (2000) and other critics of RAP have asserted that the social experience of risk has to be
reconciled with scientific assessments in what Renn et al. (2000) called a “fragile compromise” (Renn
et al., 2000, p. 1). Congruently with the above, the researcher looks away from RAP to focus on
constructivist contributions, offering either theoretical explanations or empirical evidence of
subjective approaches to risk. What follows is a survey of social theories of risk, a brief discussion of
the Social Amplification of Risk (SAR) framework followed by an introduction to Renn and
Rohrmann’s (2000) integrative model of risk perceptions, which serves ultimately as the organizing
framework for the present study (Renn & Rohrmann, 2000).
Wildavsky and Dake’s (1990) review of risk theories provides a useful sequence and outline for the
initial discussion (Thompson et al., 1990). Generally viewed as adherents of cultural theory,
Wildavsky and Dake themselves proposed that social theories of risk relate to five predictive forces:
knowledge, personality, economic, political, and cultural dimensions. Wildavsky and Dake’s (1990)
taxonomy, including their own cultural force proposition, preceded the more recent contribution of
psychometric theory and related psychological theories - which are added to this discussion.
43
2.6.3.1 Knowledge Theory of Risk Perception
At the time, Wildavsky and Dake (1990) claimed knowledge theory as the most widely held theory of
risk perception, suggesting actors perceive risks to be dangerous because they know them to be
dangerous. The theoretical assumption overlays the notion that perceptions and knowledge are
interconnected; in other words, people can’t perceive what they don’t know, or in reverse logic, what
people know, and the extent to which they do, informs their perceptions of risk. Knowledge theory is
embedded in notions of qualitative, scientific explanations of hazards and risks, and explains
perceptions as being produced by cognitive processing of objective information. Knowledge theory
underpins mental modelling approaches in research, which examine inferences respondents make
based on the knowledge they have benchmarked against knowledge of experts (Bostrom & Lashof,
2004; Bostrom et al., 1994; Craik, 1943; Gentner & Whitley, 1997).
Mental model studies are prevalent in research of public views of climate change benchmarked
against expert and professional views (Bostrom et al., 1994). In other climate studies, benchmarks are
dispensed with altogether as in the case of Hill and Thompson (2006)’s climate risk perception study.
Their work raised questions about the power of knowledge, salience, intrinsic value of nature, and
perceived resilience of nature from professional managers and their views on global environmental
risk—without using classical convergence measurement tools used in traditional mental model work.
Still again, mental model research related to climate change has been modified in other cases to
accommodate subjective information. Views on climate change induced heat wave risks, collected by
Chowdhrury (2012)for example, mapped knowledge structures of opinions in a modified mental
model approach where associated belief systems of participants were added to provide ‘ continuum of
knowledge capturing human belief systems from both scientific as well as wider social contexts
(Chowdhrury, 2012, p. 166).
Climate scholars note climate risk forecasts and assessments, a critical source of knowledge have
important roles in risk perception (Leiserowitz, 2005; O'Connor et al., 1999). Critics of knowledge
theory contend however that successful transmission of climate knowledge is subject to message
framing and is dependent on levels of personal concern and trust in the institutions producing the
knowledge (Flynn & Goldsmith, 1999; Gifford & Comeau, 2011; Metlay, 1999; Spence & Pidgeon,
2010; Weber, 2010).
Distancing or temporal and spatial perspectives along with fear- invoking messaging produce gain-
loss risk perceptions (Spence & Pidgeon, 2010). Motivating or sacrificing message framing was
shown to have effect on climate change behavioural intentions in Gifford and Comeau (2011)’s work.
In other contributions, knowledge theory is embedded in the Risk Information Seeking and Processing
Model (RISP) literature. Yang et al. (2014) explored the effect of message elaboration, information
sufficiency and risk information- seeking on climate perceptions. The RISP framework relies on the
44
premise that risk information processing is motivated by information insufficiency. The RISP model
proposes that an individual’s cognitive assessment of a potential hazard, or risk perception, stimulates
their emotional responses to the risk which subsequently elevate their information seeking behaviour
(Slovic et al., 2004; Yang et al., 2014).
Bridging knowledge theory with principles of behavioural economics, Suarez and Patt (2004)
explored the effect of information overload (of climate forecasts) on food security NGOs in
Zimbabwe as an explanation for climate forecasting caution. Cautionary approaches were explained
as reflective of behaviour economic theory which implies decision-makers have limited ability to
process information as problem solvers and don’t always act rationally in the face of information
producing anomalies (Suarez & Patt, 2004).
Another example of integrated theory- making between knowledge theory and system dynamic
modelling is found in Bleda and Shackley (2008) examination of ‘process formation of belief’ in
climate change at the organizational level. Kollmuss and Agyeman (2002) noted knowledge of issues,
and knowledge as action strategies as contributing factors for corporate response.
2.6.3.2 Personality Theory of Risk Perception
The second, social risk theory of ‘personality’ suggests that risk adverse or risk taking propensities of
individuals are explanatory factors for their own risk perceptions and inform their preferences for risk
management (Sitkin & Weingart, 1995; Thompson et al., 1990).
Prior work in this area suggests risk-based personality traits reflect individual attitudes towards
danger; however where individuals are embedded in organizations as decision-makers, organizational
risk culture may influence the risk propensity of the individual (Ortiz & Harwood, 2007)
Disagreements about personality theory’s contribution to risk perceptions is based on discussions
whether risk propensity is a behaviour or a personality trait (Ortiz & Harwood, 2007). Measurements
of risk propensity, behaviour trends relating to risks, and organizational risk propensity have been
critiqued for methodological validity Harwood’s critique of risk propensity measures, contended a
lack of ‘analytical process transparency, as most of these studies are conducted in ‘laboratory’ settings
and adopt a deductive approach’ (Ortiz & Harwood, 2007).
2.6.3.3 Economic Theory of Risk Perception
The third, theoretical explanation of risk perceptions is found in economic theory. Classical economic
theory is pre-occupied with notions of expected utility, described here as the degree of satisfaction or
dissatisfaction associated with an action or decision, and with ‘probabilities’ classically defined as
relative frequencies. Fischhoff et al. (1978) broadened the definition and deemed probabilities as
‘strengths of belief’ building on Tversky and Kahneman’s (1974) critical work that maintained people
show different preferences when combining subjective probabilities and utility (Fischhoff et al.,
45
1978) Their contributions suggested that individuals don’t base their risk judgements on expected
values but are motivated by internal biases affecting their ability to draw inferences from probabilistic
information. Their important contribution adds to the discussion about the fifth ‘psychological theory
of risk’ section. The economic risk concept, as Renn (1998) suggested, ‘is good for situations where
utility decisions are made and the consequences of them are confined to the decision-maker’ ( p. 58).
In the context of climate change however, most risk decisions are collective decisions affecting
aggregate utility of different groups, leading one to consider a behavioural economic approach or an
alternative framework altogether. Sidortsov’s (2014) behavioural economic ideas suggested
economically affluent individuals are buffered against risks and therefore more inclined to view risks
as manageable. He suggested that while marginalized and vulnerable populations may do whatever it
takes (including taking more risks) to become wealthier (Sidortsov, 2014, page 174) affluent groups
may be less concerned with pursuing material rewards because they already have what they feel are
sufficient resources.
He further suggested that affluent individuals are more concerned with global climate change because
they can afford to be concerned with long run probabilities. The researcher suggests Sidortsov’s
(2014) distinctions are congruent with cultural theory concepts of worldview and social economic
status, to be discussed in the cultural theory of risk, Section 2.6.3.5.
2.6.3.4 Political Theory of Risk Perception
Next, fourthly, the political theory of risk, which concerns itself with allocation of interests and power
in society, explains risk perception by predictive power of social and political characteristics. Renn
(1998) noted that the struggle of group power and ideology is germane to risk appraisals. Adherents to
political theory of risk suggest North American party affiliations and global warming beliefs are
related. Cotgrove (1982) said liberal and conservative ratings and or adherence to certain political
parties reflect dichotomous views of climate change as catastrophic or cornucopian respectively
(Cotgrove, 1982). Furthermore, partisan support for climate change has widened in recent years
between left- right sides of the political spectrum (Dispensa & Brulle, 2003). Closely aligned with
political theory is cultural theory, discussed next.
2.6.3.5 Cultural Theory of Risk Perception
Fifthly, cultural theory, pioneered by the British anthropologist Mary Douglas suggested risk is a
socio- cultural construction and not an objective entity to be measured independently of the context in
which hazards occur (Douglas & Wildavsky, 1982). Cultural theorists i.e. Beck (2009),Cvetkovich
and Earle (1991),Dake (1992), (Johnson & Covello, 1987),Thompson et al. (1990) saw risk as a
danger or threat to a value system subsumed in institutional arrangements. Furthermore, adherents of
cultural theory maintained that cultural differences, when applied to matters of risk, produces two
general types of risk responses. Douglas and Wildavsky (1982) exemplified this when began their
46
work with both a question and an answer: ‘Can we know the risks we face now and in the future? No
we cannot; but yes, we must act as if we do’ (Cvetkovich & Earle, 1991, p. 1). They were trying to
illustrate how social groups vary in response to risks: some rationalist groups would say ‘no we don’t
know the risks and therefore we won’t respond (because we don’t know the risks)’ and other groups,
open to subjectivist reasoning, will say ‘no we don’t know the risks, but we should act on it anyway’.
It is useful here to note that the subjective reasoning argument aligns with the pre-cautionary
principle, which has and continues to guide much of the environmental movement. Just as Douglas
and Wildavsky (1982) proposed, the precautionary principle suggests that the approach to managing
risk should be based on prevention and elimination of risk exposure, if not wholesale adoption of cost-
effective action. The pre-cautionary principle arose because of the perception that the pace of efforts
to combat climate change is too slow and that climate risks continue to emerge more rapidly than
society’s ability to identify and manage them (Quigley et al., 2016). Furthermore, the precautionary
principle prescribes approaches to risk management based on preventative action in the face of
uncertainty and complexity. Kriebel et al. (2001) asserted that the principle also means shifting the
burden of proof to the proponents of the (risk-producing) activity, exploring a wide range of
alternatives to possibly harmful actions and increasing public participation in the decision-making of
what constitutes precautionary measures (Kriebel et al., 2001).
Douglas and Wildavsky (1982) proposed that cultural theory explained much of risk perception,
maintaining that groups and individuals are active organizers of their own perceptions and that they
choose what to fear and how much to fear it in order to support their way of life. According to them,
risk preferences related to cultural biases or worldviews and ideologies entailing deeply held beliefs
and values that support social relations of differing personal views and ways of life.
Worldviews of these groups, their cultural proposition goes, could be distinguished by classification
of hierarchical, egalitarian, individualistic and fatalist types. This worldview classification becomes
more useful and appropriate in the current climate debate when it is applied to general assumptions
about nature. Contributions offered by Holling et al. (2002) and Schwarz and Thompson (1990) note
the Myth of Nature Framework developed by Dake (1992).The literature shows all three argued that
the origins of the beliefs of nature guide risk taking decisions in a number of different ways depending
on which worldview was at stake. For example, adherents of ‘hierarchical’ bias and values are
socially optimistic and obedient to authority and rely on experts to assess and endorse risks as being
manageable. In contrast, proponents of the ‘egalitarian’ bias hold views that ‘nature is fragile’ to
justify sharing environmental assets. Distinctions of the individualistic bias are belief in competition
and that nature is abundant, cornucopian; and a general trust in institutions to control or compensate
for the downside of extreme (climate) events (Thompson et al., 1990).
47
Cultural theory proponents further argued individuals can be expected to form risk perceptions that
reinforce their idealized way of life. Congruent with that, persons whose values are hierarchical or
individualistic would be sceptical of environmental risk while egalitarian value groups more likely to
be ambivalent towards commerce and industry and readily accept that business should be regulated
(Adams, 1995; Dake, 1992; Thompson et al., 1990).While constructs in cultural theory were
illuminating, critics maintained it (cultural theory) could not claim universal validity because
empirical support for it was weak and inherently problematic. The inability and difficulty to account
for universal conditions outside empirical settings, which may or may not be consistent with research
observations, produced what Renn (2008) called ‘a lack of ontological realism’.
2.6.3.6 Psychological Theory of Risk Perception
The sixth theory in this discussion is broadly defined as psychological theory along with the
companion psychometric paradigm, credited to Chauncey Starr (Starr, 1969). Adherents of
psychological theory rejected social and cultural claims for predicting evaluations of risk and
proposed that personal qualities better predict risk perceptions (Fischhoff et al., 1978; Slovic et al.,
1981). The psychometric paradigm- the theory and technique of mental measurement- helped to
conceptualize risk as personal expressions of individual fears or expectations. Cognitive psychologists
suggested that individuals respond to their own perceptions, regardless of how those perceptions
reflect ‘reality’. Fischhoff’s landmark 1978 paper ‘How Safe is safe enough?’ attempted to measure
how individuals respond to their own perceptions by asking them to appraise technology risks against
benefits to society.
Other ‘psychology of risk’ literature addresses risk perceptions where outcomes are unknown and not
well understood. Kahneman and Tversky’s (1974) enduring work on heuristics and biases is relevant
in current debates about climate risks. Heuristics and biases better explain how individuals draw
inferences from risk information, according to availability, anchoring, representative and avoidance
biases. Heuristics in this context are thought of as problem- specific thinking mechanisms for deciding
upon something (how to prepare for climate risks) where there is incomplete information; biases are
thought of as the preferences for the approach. An explanation of the heuristics found in PCT is
discussed in Section 2.7.2.
Contributions to each of the theoretical propositions presented thus far address a particular dimension
or context for the risk perception debate. Wildavsky and Dake went so far as to call them ‘rival’
theories suggesting each as being reductive and universally applicable in explaining the social
experience of risk, one theory or the other. However, as the researcher has shown, each of the six
theoretical frameworks has potential to combine with other explanations in an integrated way. Nor are
they necessarily mutually exclusive. Theories which explain social and political environments as
predictive do not account for, for example, the personal heuristics of a manager who has never
48
experienced a catastrophic climate event, or who might be disinclined to access the anchoring effect
bias because of low personal salience for climate change.
Theoretical reach may not extend into other levels of context, as is the case with psychological
theories which tend to neglect exogenous political forces such as policy communities, sector
associations, institutional affiliations and geographic focus that might influence risk perceptions. The
relevance of credibility and trust in institutions attempting to manage climate change problems, in
fact, is a construct to be explored with the study participants. Specialized focus on institutional trust
was raised in O’Riordan and Jordan (1999)’s work and further assessed by Stedman (2004) who
observed that institutional position and opinion relative to climate change varied among Canadian
policy actors, when a combination of cognitive structure factors, sociodemographic variables and
political identity factors were observed.
2.6.3.7 Social Amplification of Risk
Kasperson et al. (1988 ), motivated by this assemblage of social risk theories in previous years,
formulated a social amplification of risk framework (SAR) as an attempt to integrate risk concepts
and explain how risks interact with psychological, social, institutional, and cultural processes in ways
that may amplify or attenuate public responses to the risk or risk event.
Kasperson’s (1988) thesis argued that social amplification occurs at two stages: in the transfer of
information about the risk, and in the response mechanisms of society. Signals about risk are
processed by individual and social amplification stations, including the scientist who communicates
the risk assessment, the news media, cultural groups, interpersonal networks, and others. Critics of
SAR on the other hand, suggest the model concretizes risk, is ill equipped to describe social
complexity and sides with the risk assessor against ‘non-expert’ stakeholders (Duckett & Busby,
2013).
2.6.3.8 Integrative Model of Risk Perception
So, what is left? Renn & Rohrmann (2000), who sought to understand the relevance of cultural theory,
concluded the issue of risk perceptions was complex and not explainable on the basis of a single
theory ( Renn & Rohrmann, 2000, p. 213). In the face of theoretical limitations and open and
unanswered questions, their proposition of a structured framework of factors which account for
perceptions according to differing and integrated levels of context provides the best available model
for the present discussion. The researcher argues risk perception is a multi-dimensional concept
whose examination is better served by integrative thinking according to personal and collective
approaches, levels of context and interdependencies of factors. Determinants of risk perceptions in
Renn & Rohrmann’s (2000) integrative model of risk perception at least allows for mutual
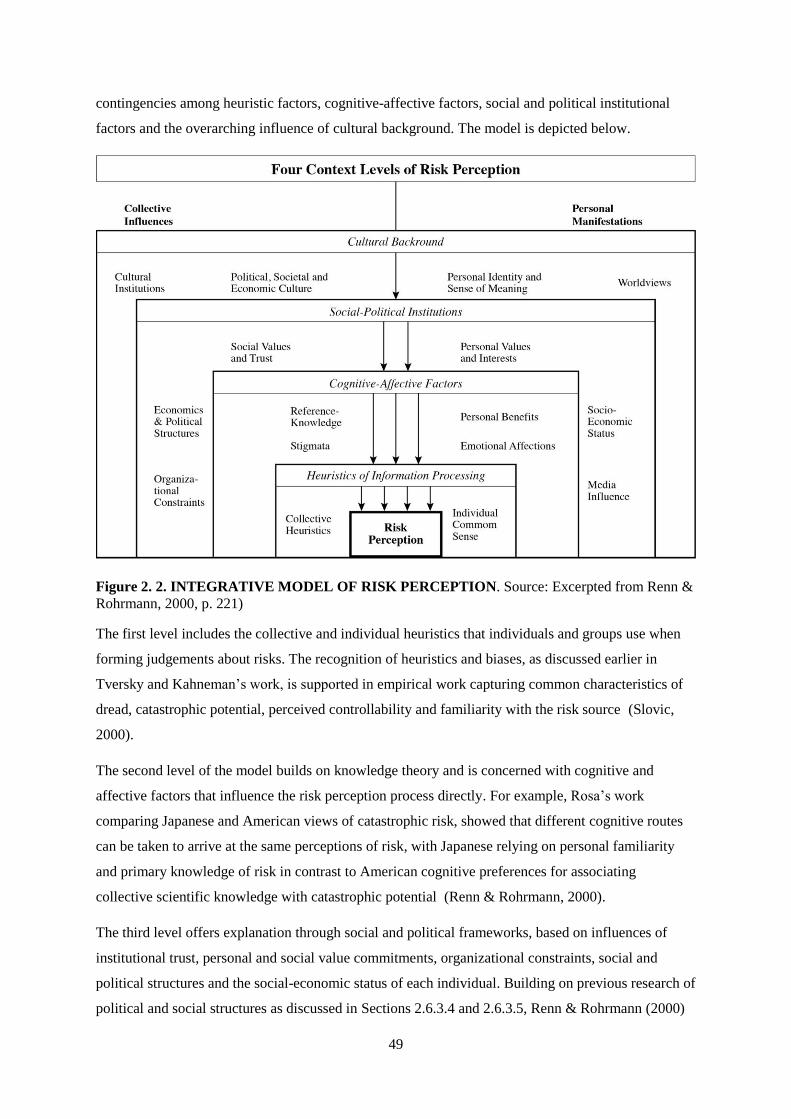
49
contingencies among heuristic factors, cognitive-affective factors, social and political institutional
factors and the overarching influence of cultural background. The model is depicted below.
Figure 2. 2. INTEGRATIVE MODEL OF RISK PERCEPTION. Source: Excerpted from Renn &
Rohrmann, 2000, p. 221)
The first level includes the collective and individual heuristics that individuals and groups use when
forming judgements about risks. The recognition of heuristics and biases, as discussed earlier in
Tversky and Kahneman’s work, is supported in empirical work capturing common characteristics of
dread, catastrophic potential, perceived controllability and familiarity with the risk source (Slovic,
2000).
The second level of the model builds on knowledge theory and is concerned with cognitive and
affective factors that influence the risk perception process directly. For example, Rosa’s work
comparing Japanese and American views of catastrophic risk, showed that different cognitive routes
can be taken to arrive at the same perceptions of risk, with Japanese relying on personal familiarity
and primary knowledge of risk in contrast to American cognitive preferences for associating
collective scientific knowledge with catastrophic potential (Renn & Rohrmann, 2000).
The third level offers explanation through social and political frameworks, based on influences of
institutional trust, personal and social value commitments, organizational constraints, social and
political structures and the social-economic status of each individual. Building on previous research of
political and social structures as discussed in Sections 2.6.3.4 and 2.6.3.5, Renn & Rohrmann (2000)
50
noted the contributions of Short and Clarke (1992) and Freudenburg (1992, 1993) who contributed to
theory on organizational constraints. In the present study, the researcher has referred to the more up to
date institutional constraints as ‘pressures’ existing exogenously and endogenously for the
participants, as previously discussed in Sections 1.5 and 2.3.3. Endogenous pressures of
organizational capacity and resources, coupled with exogenous pressures of governmental policy and
regulations are congruent with Renn & Rohrmann’s Level 3 social-political tenet in their Integrative
Model of Risk Perception.
The fourth and last context level refers to cultural factors which govern the lower levels of influence
suggesting cultural based preferences and biases drive risk perceptions. While validity over cultural
theory has been contested on grounds of empirical weakness (Sjoberg, Rosa, Slovic), Renn &
Rohrmann (2000) nevertheless claim that while ‘universal yardsticks to evaluate risks exist’ (p. 222),
they are contingent on lower levels of cognitive and affective patters (level three) and social and
political environments (Level 2). Renn & Rohrmann’s model is provided in Figure 2.2.
The Integrative Model of Risk Perception has however some limitations. Renn & Rohrmann’s model
illuminates and organizes the relationship among and between four levels of social theories of risk
perceptions; however, its limitations are twofold. First, it appears to be a linear top-down construction
that does not account for potential feedback loops between theoretical ‘levels’ that may otherwise
exist in integrative models. Second, it does not appear to address other variables within each level
other than the ‘individual’ or the ‘collective or group’ variable. This is significant in this work for
three reasons. First, Renn & Rohrmann’s four-factor model applies to a lay population and not to
expert or professional individuals or groups, as is the case in this research. Second, the model implies
that values—trust and ‘social value commitments’ for example in Level 3 of the model—inform risk
perceptions. Perceptions of climate risk are conditioned by values which may vary according to
assumptions, conventions and practices. Personal values however, are not addressed in this work, as
specified in Section 1.8. Third, the effect of media and other social institutions in Level 3 that mediate
experiences of risk (for the individual or collective group which has not experienced it first hand) also
do not apply in this work. Sector participants in this research have personal experience of the risk, and
are able to verify their own organizational claims of risk. Research participants in this work are well
informed executives and have a high degree of personal efficacy for risk decision-making in their
organizations.
While there is little evidence for any theory of risk perceptions of individual professionals per se,
several attempts have been made. Hill & Thompson (2006) explored global environmental views
between environmental managers and non-environmental managers, concluding that professionals
viewed environmental issues as more important because of heightened knowledge, perceived
resilience of nature and emotional connection to the environment (Hill & Thompson, 2006, p. 779).
51
Public versus expert perceptions of climate risk events (heat waves in Canada) were studied by
Chowdhrury (2012), concluding that experts had more knowledge about the risk effects associated
with heat waves and that knowledge gaps existed for public respondents studied. Reynolds et al.
(2010) compared ‘educated’ laypeople’s understanding of climate change effects in 1992 and 2009 to
assess knowledge among the respondent group, concluding not much had changed in risk perceptions
in 17 years. Olatumile (2013) assessed environmental professional’s perception of awareness and
knowledge of climate change concluding that more knowledge about climate change and risk effects
‘will be helpful in meeting their information needs’ (Olatumile, 2013).
Theoretical support for the study of risk perceptions among individual professionals seems to be
incoherent and unresolved. While Renn & Rohrmann’s (2000) model does not apply to professional
groups, nor abstract the risk concept to one rigid formula, it does assume that multiple forces conspire
to affect perceptions of risks—an assumption which sounds intuitively reasonable. The model is
conceptually appealing for three more reasons: (a) it does recognize that what people believe to be
true about risks determines how they think about risk characteristics and how serious the risk is (Level
2); (b) it recognizes that organizations outside of the personal or corporate setting can impact risk
perceptions (Level 3); and (c) it proposes that macro-sociological developments and a prevailing
scepticism about contests in social arenas where ‘powerful groups struggle for resources to pursue
their interests and objectives’ shape risk perceptions ( Level 4). In conclusion, it is foremost an
organizing framework which elucidates multiple social theories against which sensemaking theory
and PCT can be applied, as discussed in the next section.
2.7 SENSE MAKING AND PERSONAL CONSTRUCT THEORY
In exploring the factors influencing decision-maker’s views of climate risks, two further and
important contributions are drawn into the debate: sensemaking and personal construct theories, from
Weick and Kelly respectively. While both theories attempt to explain how individuals form their
judgements about risks, they have striking differences in theoretical stance and empirical support, as
will be discussed next.
2.7.1 Sensemaking Theory
Sensemaking, or the ‘making of sense’ by Weick builds on ideas of the agentic self (see Glossary)
‘constructing sensible, sensable events’ (Huber & Daft, 1987, p. 154) and where individuals
‘structure the unknown’ into something more tangible (Waterman, 1990, p. 41). Weick asserted
sensemaking was an explanatory process of ‘invention’ where the individual ‘constructs, filters,
frames and creates facticity ‘ (Weick, 1995, p. 114). In high hazard and high reliability industries
where high risk failure events may occur, sensemaking theory provides relevant explanatory power
for how individuals form judgements under stressful and ambiguous operating conditions. In
predictable environments, where the relationship between organizational action and outcome are
52
known, organizations can predictably deploy resources to deal with routine situations, and institute
familiar sounding ‘Standard Operating Procedures’. In operating environments where the action-
outcome relationship is ambiguous or completely unknown, as is likely to be the case with extreme
and sudden climate risk events, decision makers must make sense their own accumulating practical
experience with the risks at hand to arrive at a judgement or decision (Carroll, 1995).
It is useful to note here again the enduring work of Tversky & Kahneman (1971, 1973, 1974, and
1984). Their contributions to the field of decision making under uncertainty proposed that individuals
often rely on reflexive interpretations employing judgemental heuristics or biases, to arrive at a
judgement or a decision. Reliance on the accumulating practical experience that Carroll (1995) above
reported, would have been viewed in the Tversky & Kahneman lens as an activation of personal
heuristics or biases. They proposed that in making predictions and judgements under uncertainty,
people do not appear to follow statistical theories of prediction. Instead they rely on a limited number
of heuristics, namely the heuristics of availability (judgements made according to how easily a
scenario is called to mind), representativeness (judgements made by comparing with a prior mental
model) and or anchoring and adjustment heuristic (judgements made on an initial value or anchor,
modified by additional information). The researcher asserts that Tversky & Kahneman’s contributions
do not necessarily clash with sensemaking theory, only to remark their work illuminates the
psychological dimension of the sensemaking process by identifying biases which may be operating in
the sensemaking individual. Where there is information missing, judgements about climate future
imply a prediction, as in ‘This looks like an ice storm coming through; we may have to launch back
up systems’. Predictions intrinsically imply some kind of judgement that involves uncertainty. In
assessing future climate risks, where exact climate impacts are not completely known, judgements
about the future cannot necessarily be appraised on the basis of Carroll’s (1995) ‘accumulating
practical experience with the risks at hand’.
From surveying other contributions, sensemaking appears to be explained as a kind of psychological
process purposefully contributing to a collective aim. For example, proponents define sensemaking
variously as ‘an iterative social process that allows people to exchange interpretations and the
construal of schemas likely to generate coherent adaptive strategies’ (Landau & Drori, 2008, p. 703).
Further definitions suggest it as a ‘contribution to organizational identity’ (Pratt, 2000) and as a
‘mechanism that minimizes ambiguity and uncertainty by providing organizational members with an
interpretative reference point during or after periods of change (Landau & Drori, 2008, p. 702).
One concludes from a survey of the sensemaking literature that sensemaking theory, valuable as it is,
is vested in the ‘collective self’ where the higher priority of organizational goals eclipses the personal
and individual sense making of events. In the Weickian view, organizational values are superior to
personal values, and sensemaking theory is instrumental in supporting group and social values.
53
Additionally, the researcher’s review of relevant case studies suggests a general pre-occupation with
sensemaking of past events (Coutu, 2003; Landau & Drori, 2008; Weick, 1988; Weick, 1995; Weick
& Roberts, 1993). Few if any published empirical studies appear to deal with sensemaking of
anticipated events –a scenario that is central to the research topic of this thesis.
Still again, applying sensemaking theory to Renn & Rohrmann’s (2000) integrative model of risk
perception, discussed in Section 2.6.3.7, illustrates its lack of relevance in the present study. Using
Renn’s model as an organizing framework, Sense making theory contributes to the model’s interface
between higher levels of influence of social political institutions, including organizational constraints
(pressure, ambiguity and incomplete information) and with the next lower levels of cognitive affective
factors of knowledge and reference. Its alignment is weakest with Renn & Rohrmann’s ‘heuristics of
information processing’ explanatory level where individual heuristics and common sense drive risk
perceptions at the personal level. In the present study it is, in fact, individual heuristics and individual
common sense at the personal level which drive risk perceptions and support the approach and
research design of this work.
Given this, reliance on sensemaking theory in the present study, where individual perceptions of
anticipated events with unknown effects are central to this thesis, does not seem productive.
Furthermore, empirical support for sensemaking relies on methodologies involving questionnaires and
surveys, which may or may not elicit the range and depth of personal constructs to the extent that PCT
promises.
2.7.2 Personal Construct Theory
Kelly’s work on PCT offers a more individually based examination of factors to explain how the
individual makes sense of her/his (further referenced as ‘his’) world. Kelly preferred to call his theory
an ‘interim’ psychological one, reflecting his distinctive philosophical position of ‘constructive
alternativism’ where ‘all perceptions are open to question and reconsideration’ which includes PCT
itself (Kelly, 2003 p4). In other words, Kelly is both saying all perceptions are open to questioning
and reconsideration- as are his own views and theories as well.
Kelly’s central theoretical assumption is that we ascribe meanings to events, past and anticipated, or
put another way, ‘the way a person anticipates events is a function of his own personal constructs’
(Kelly, 2003, p. 7). PCT suggests people develop constructs—or internal models of reality—to
understand and explain the world around them, and in so doing, they can actively predict what will
happen next (Jankowicz, 2001).
Of key interest to the present study are several of Kelly’s assertions or corollaries of PCT. Beyond
PCT’s fundamental assumption that all individuals operate and process their world according to
internal models of their own experiences the PCT corollaries of construction, organization,
54
experience, individual and commonality are useful in the current debate in the following five ways,
noted in the chart below:
1. The Construction corollary, which describes how people develop internal representations by
recognizing recurring patterns in their experience supports the anticipated perceptions of participants
who define climate risks in terms of their past experiences with it;
2. The Organization corollary, which suggests that individuals organize their personal constructs in a
hierarchical way, with some constructs in a superordinate position and others subordinate to them.
This corollary suggests, in the current work, that perceptions of climate risks may or may not be
influenced by his/her personal values;
3. The Experience corollary, where constructs are ‘working hypotheses’ about what will happen next,
supports the notion that if constructs fail in predictive power, they are open to amendment in light of
new events. This would be the case of participants who acknowledge that existing preferences for
managing operational risks, may no longer be effective in the future;
4. The Individuality corollary, where different people develop their own meanings for the same
events, supports the observation of multiple participants arriving at entirely different constructs for the
same event;
5. The Commonality corollary, which contends that ‘people are similar to the extent they construe
similarly; not because they encounter similar events, nor because they behave in the same way’
(Jankowicz, 2001). In the current work, this corollary applies to the anticipated consensus among
varying participants that ’managing climate risks is an industry priority’; and
6. The Sociality Corollary proposes that it is possible to discern and make sense of other people’s
constructs, regardless if one uses those constructs oneself. In this way, the corollary is about being
able to discern and utilize other’s constructs whether they are similar to, or indeed very different from
one’s own.
In the present study, it can be noted that multiple actors in intra and inter organizational relationships,
i.e. electricity producers and their utility partners- may view a need to interact to manage anticipated
climate risks, but may share or have differing construal of the same climate events, past and future. As
well, the Sociality Corollary suggests that the better individuals are at observing what’s driving other
people’s behaviour, the more effectively they can interact with them.
One can conclude that Sense Making Theory and PCT, while both contributing to the study of risk
perceptions, do so in different ways: sensemaking theory relies on the instructive power of social and
collective values while Personal Construct Theory focusses on an individualistic orientation. The
present study is concerned with the exploration of individual constructs of future unknown events
55
presented by climate change. Examining the expected variability of risk-based views of participants,
who work in an engineering culture where qualitative assessments provide (competing) corporate
legitimacy, is expected to prove fruitful with a constructivist approach. Demarcating personal views
away from corporate objectives and organizational values highlighted in sensemaking may well
expose personal and internalized risk perceptions of critical importance to industry and public policy,
let alone differences which may exist between the two sub groups studied in this work. Climate risk
construal may be different between power producers and their supply chain utilities partners due to
differing pressures and resources and ultimately suggest different industry priorities for managing
climate risks.
Both sector groups examined in the present study represent different component parts of the
electricity production supply chain. At the upstream position in the electricity production supply
chain, natural gas electricity power producer companies operate under a unique set of business
conditions, government regulation and pressures while their downstream (closer to the end user)
supply chain partners in transmission and utilities likewise operate under different sets of business
conditions, government regulations and operating pressures, as discussed in Sections 1.5, 1.5.2, and
2.3.4. Elicitation of constructs from decision makers from both groups are likely to show how their
differing accountabilities, business pressures, resources and organizational capacities may reflect
different priorities for managing climate risks, as stated in Sections 1.3 and 2.3.2.
2.8 LITERATURE REVIEW SUMMARY
The previously reviewed literature threads on climate change and climate science, the electricity
sector, corporate adaptation, risk management, management cognition, risk perceptions theories and
PCT in particular, are summarized below, and crystallized in point form. Gaps and further critical
analysis in the extant literature are also included. As stated earlier, the research objective is to
examine the way in which the sector participants construe of the influencing factors of climate risk.
The discussion was first developed with a broader discussion on climate change and climate science
and the climate risks presented for industry. Reasons for why climate risks are salient for the
electricity sector were discussed. Theories and empirical work on corporate adaptation were presented
next, followed by contextualizing corporate adaptation in the risk management paradigm. A
discussion around management cognition and decision making and the subjectivity of organizational
life was then presented, followed by a review of risk and risk perceptions theories.
A narrower discussion about psychological theories of risk perception introduced sense making and
finally PCT. Renn & Rohrmann’s (2000) integrative model of risk perception was finally suggested as
a partial organizing framework against which to assign the examination of perceptions of climate risk
among the sector participants in this work.
56
Point #1. The exploration of management risk perceptions is key to understanding how companies
expect to prepare for extreme and sudden climate events. Perceptions matter, in the sense that
perceptions drive corporate climate strategy.
In building a foundation for the discussion around the ultimate source of climate risk—that being the
physical phenomenon of climate change itself, multiple relevant literature sources were noted.
Contributions made by IPCC consortia authors including Pachauri et al. (2015) and Solomon et al.
(2007) asserted that future, extreme and sudden changing climate states will prevail, that scientific
consensus for future conditions is documented (Cook et al., 2016) and that future climate states will
likely have severe consequences for businesses and potential catastrophic effects on organizations
relying on critical infrastructure including electricity (Linnenlueke et al., 2012). Daron (2011) drew
on multiple literature sources in his PhD thesis to characterize climate change as a ‘non-linear,
dynamic and chaotic’ phenomenon, while Stern (2008) and later Weitzman (2011) referenced future
climate change as high-impact, low probability events which have created ‘unknown unknowns’ and
‘fat tails’ of probability utility respectively.
Point #2. Many interpretations of risk and hazards exist in the general climate change lexicon. When
climate risks are discussed, there is still no unifying definition of climate risks.
The contributions of Heal & Kriström (2002); Jaeger et al. (2001); Prato (2008); Renn et al. (2000)
and Willows et al. (2003) discussed the effect of the complexity and uncertainty of climate change on
risk perceptions. Literature suggested that climate language and terminology have an effect on risk
perceptions. This proposition was supported by three propositions on framing, experience and
knowledge source by Gifford & Comeau’s (2011) work on message framing; Dessai et al’s (2004)
theory on how internalized perspectives of climate change information lead to personal and subjective
understandings of climate risks; and Sidortsov’s (2014) work that proposed that climate language
emanates from two camps, the positivist camp of technical and scientific experts and from the
subjective, constructivist camp differs according to who is anticipating the risk. As Sidortsov (2014)
said, perceptions of climate risks vary according to who is actually anticipating the risk.
His work suggested, that climate change terminology evokes two distinct perspectives in the debate:
one dominated by the positivist, objective perspectives of technical climate experts to describe climate
risks in terms of mathematically modelled explanations of climate change impacts; and the other,
subjective, constructivist school which is either equally and/or more concerned with overall
sustainability and systemic risks attributed to climate change. These distinctions were raised by
Brooks (2003), Allen (2003), and Chichilnisky (2000). Tversky & Kahneman (1974) concluded that
various biases influence judgements under uncertainty and showed that judgement can be distorted by
memory.
57
Renn (2000) also noted the failure of rationalist utilities approaches to account for human perceptions
of risk, concluding that appraisals of climate risks ought to at least include or be prescribed by
constructivist thinking to allow for variability and individual perceptions.
Point #3. Risk perceptions, ultimately informing one’s appraisal of anticipated risks, are particularly
vexatious when dealing with climate risks. Climate risks are not well understood because they are
complex and difficult to predict.
Sidortsov’s (2014) research and literature from climate science consortia groups were included in the
literature review to suggest that climate knowledge and climate modelling reports are generally the
main source of knowledge for industry of future climate states. Climate assessments conducted by the
Canadian Ouranos consortia were foundational to the findings of the CEA’s 2015 forward-looking
climate Adaptation report for the Canadian electricity sector. The report findings articulated specific
and detailed climate risks for the electricity sector, and excerpts of their findings were included in
prior sections. The direct and more prevalent climate risks to Ontario electrical power operators were
noted as being floods and heavy precipitation, ice storms and polar vortex climate events.
Providing context about the study groups’ business environment, a general description of the industry
was assembled from energy regulatory documents, legislative summaries, public policy analyses and
energy consultants’ reports. The resulting profile of the sector groups indicated that it is governed by
macro, external institutional forces of government regulation and interventions, and significantly in
the current context, subjected to GHG emissions abatement policies and Cap and Trade (emissions
certificate trading) schemes. It is also subject to firm-level internal pressures relating to organizational
resources, capacity and technical knowledge.
Point #4. Climate risks have high saliency for electricity companies. They are climate- sensitive
organizations and are considered vulnerable to sudden extreme climate events because of aging
infrastructure, regulatory and governmental policy risks and accountabilities for continuous
provision of electrical supply. They are also considered to be sensitive to climate risks in terms of the
risk impacts associated with organizational resources, capacity and technical knowledge.
The review of corporate adaptation literature showed that debates and discussions about responses to
climate change are relatively recent. Literature indicated that corporate adaptation to climate change is
understood as an outcome of measures the company chooses to implement to adapt to risks presented
by climate change.
Point #5. Corporate adaptation to climate change is an organizational response to external and
internal factors in the business environment. Climate change itself is seen as an external impact;
however, it is not the only climate risk impact discussed in climate adaptation literature.
58
Corporate adaptation literature acknowledges the open system organizational perspective where
responses are done to factors outside and inside the organization.
Point #6. Factors influencing the process of corporate adaptation are mixed and varied; however,
literature has raised the issue of management interpretation of risk impacts as an influencing factor.
Three themes were identified in corporate adaptation literature relating to the types of impacts the
organization is adapting to, the factors influencing the process of adaptation and to the characteristics
of the adaptation process.
Examples of corporate adaptive responses in the literature show how prior contributions contextualize
the debate in different frames and paradigms (organizational transformation, organizational change,
knowledge management and learning environments). More recent work suggests corporate climate
adaptation most resembles risk management strategy.
Point #7. Corporate adaptation research is increasingly contextualizing climate risks within the risk
management paradigm.
Risk management literature noted that climate change impacts are a newly regarded material business
risk. Even corporate adaptation scholars suggested that climate change impacts should be treated
within a risk management framework (Gasbarro et al., 2016). While risk management practice cannot
measure risk impacts that haven’t occurred yet, it nonetheless offers useful tools and approaches for
the identification, assessment and response decisions relating to climate impacts.
Point #8. Climate change impacts are seen as a material business risk for organizations.
Literature suggested the three stages of traditional risk management processes resemble corporate
adaptation phases. For example, Arnell and Delaney (2005) proposed that organizations must be
firstly aware of climate risks to address the impacts—a similar process to the traditional risk
identification phase.
Point #9. Risk management practice offer useful tools and approaches for responding to climate
impacts.
(Berkhout et al., 2006)stated that corporate strategy of ‘risk assessment and options appraisal’ mirrors
the process of the risk assessment phase. The risk response phase, normally the third and final stage of
traditional risk management programs, resembled Berkhout et al.’s (2006) strategy for ‘managing and
sharing risks’. Before response decisions are made, risk management practice suggests that the prior
two phases need to be addressed.
Point #10. Risk management phases resemble phases in adaptation strategy, and examples exist in the
literature. Risk readiness is implied by which risk management stage the organization is in.
59
Prior sections also canvassed 30 years of risk perception literature to establish why risk perceptions
vary among cultures, institutions, groups and individuals.
While it is a reasonable view that risk perceptions cannot be exclusively explained by one factor,
Renn & Rohrmann’s (2000) integrative model of risk perception, while useful as an organizing
structure, suggests how complex and nascent the literature of risk perceptions still is. Many facets of
the model are shown to have unidirectional influence, from top to bottom, contradicting what might
otherwise be expected of an integrated model. It includes, notably, the presence of cultural force on
risk perceptions albeit within a range, in contradiction to Renn & Rohrmann’s initial rejection of
cultural theory.
Point #11. Risk perception theories attempt to explain which factors drive perceptions. Not all risk
perception theories have been shown to have empirical support. Perceptions of risk cannot be
explained by one theory alone.
Further literature presented contributions of sensemaking theory and PCT by Weick and Kelly
respectively. Both theories support the exploration of internal individual construction of events or
phenomena to help explain ‘what happened’ or ‘what will happen’, as is the case in Kelly’s (1991,
2003) PCT proposition. PCT in the present work is helpful in understanding how decision makers
make sense of and construe the influences and pressures affecting their views of managing climate
risks in the future.
Point #12. While sensemaking theory is useful in understanding how individuals and processes within
organizations understand 'what happened’, Kelly’s proposition that individuals’ construing of future
events based on their experience of the past, is more apt to the theme of the current research.
2.9 LITERATURE SYNTHESIS
In synthesizing the literature review, a number of unifying statements can be made, as offered below.
1. Given the sheer complexity of formulating approaches to managing the impacts of climate
change, it may be fruitful to focus on the perceptions and construal of managers involved in
planning the corporate response. This arises from Points 1, 2, 3, and 4.
2. Researchers have found it convenient to analyse climate risks within a risk management
framework. The identification, assessment and risk response decisions depend on how climate
risk impacts are interpreted, and on the emphasis given to each of the three stages, by the
managers involved. This arises from Points 5, 6, 7, 8, 9, and 10.
3. While various theories of risk perceptions exist, with varying degrees of empirical support,
there is still no consensus on a single approach. Since, however, this work focuses on the
managers responsible for the corporate response to risk impacts, it is clear that it is their
60
personal theorizing, their sensemaking and their construing, which should form the focus of
this empirical work. This arises from Points 11 and 12.
2.9.1 Gaps and Additional Critical Analysis of the Literature
The present study builds on prior empirical studies and theoretical contributions on risk perceptions. It
provides a Canadian and a single industry context to the exploration of climate perceptions among
utilities managers in Ontario (Canada). Given climate risk is a relatively new academic topic, it was
not surprising that many contributions noted the need for future work into a) how businesses perceive
climate change; and b) how their perceptions are reflected in their own organizational response to
climate change (Cox Jr, 2012; Gasbarro & Pinkse, 2015; Gasbarro et al., 2016; Lempert & Collins,
2007; Linnenluecke et al., 2008; Lujala et al., 2015; Stedman, 2004; Weinhofer & Busch, 2013; Winn
et al., 2011)
In critically assessing prior literature however, a number of empirical contributions were noted for
having low external validity and of low internal validity, as discussed next.
External validity, or the extent to which the internally valid results of a study can be held to be true
for other cases, other people or other times produces generalizability for future investigations. In the
prior qualitative literature which relied heavily on single and multiple case study approaches in
specific geographic locations (Galbreath, 2014; Gasbarro et al., 2016; Haigh & Griffiths, 2012;
Stedman, 2004), generalizability to the industry at large and across multiple geographic locations
could not be achieved. Galbreath et al. (2014) noted in their cross sectional study of businesses that
‘the ability of these findings should not be assumed’ (Galbreath, 2014, p. 102).They further noted that
other organizations in the same industry but at different locations were not experiencing the same
climate effects. In other words, extant corporate climate research seeks answers for industry specific
contexts but also for the effect of location-based climate impacts on the studied organizations.
With respect to internal validity, two types of research limitations in the prior work are noted as
potentially reducing internal validity. There appears to be a lack thus far of longitudinal data in the
climate literature to account for how perceptions or organizational responses change over time. This
lack of empirical support may be noted for limiting the research claim that risk perceptions are
dynamic and may evolve in the constructivist ‘man as scientist, continually reassessing and re-
construing the world’ proposition. Haigh & Griffiths (2012)’s empirical work which considered
‘climate surprise’ as a driver for management cognition suggests cognitive change took place despite
the absence of ‘before and after’ empirical support.
Furthermore, prior climate literature which relied heavily on questionnaires and surveys for insights
into management cognition on climate risks (Stedman, 2004; Weinhofer & Busch, 2013) may have
been subject to social desirability bias from respondents. Responses that answer questions in a manner
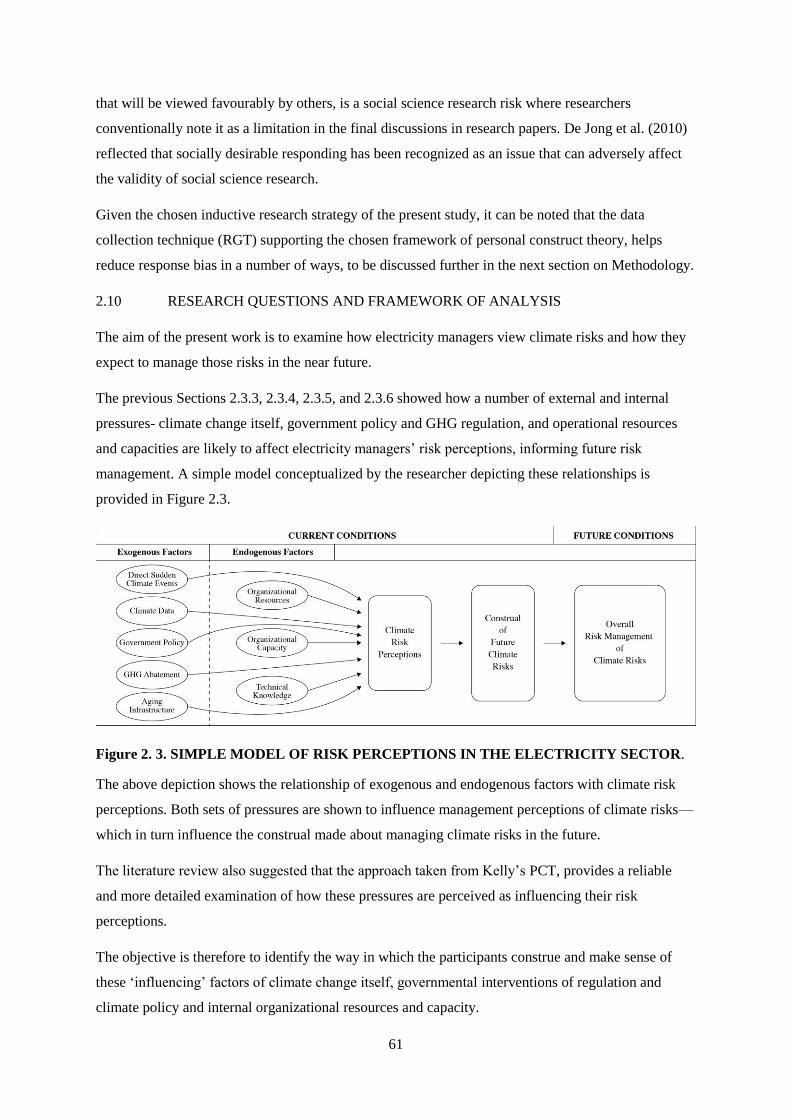
61
that will be viewed favourably by others, is a social science research risk where researchers
conventionally note it as a limitation in the final discussions in research papers. De Jong et al. (2010)
reflected that socially desirable responding has been recognized as an issue that can adversely affect
the validity of social science research.
Given the chosen inductive research strategy of the present study, it can be noted that the data
collection technique (RGT) supporting the chosen framework of personal construct theory, helps
reduce response bias in a number of ways, to be discussed further in the next section on Methodology.
2.10 RESEARCH QUESTIONS AND FRAMEWORK OF ANALYSIS
The aim of the present work is to examine how electricity managers view climate risks and how they
expect to manage those risks in the near future.
The previous Sections 2.3.3, 2.3.4, 2.3.5, and 2.3.6 showed how a number of external and internal
pressures- climate change itself, government policy and GHG regulation, and operational resources
and capacities are likely to affect electricity managers’ risk perceptions, informing future risk
management. A simple model conceptualized by the researcher depicting these relationships is
provided in Figure 2.3.
Figure 2. 3. SIMPLE MODEL OF RISK PERCEPTIONS IN THE ELECTRICITY SECTOR.
The above depiction shows the relationship of exogenous and endogenous factors with climate risk
perceptions. Both sets of pressures are shown to influence management perceptions of climate risks—
which in turn influence the construal made about managing climate risks in the future.
The literature review also suggested that the approach taken from Kelly’s PCT, provides a reliable
and more detailed examination of how these pressures are perceived as influencing their risk
perceptions.
The objective is therefore to identify the way in which the participants construe and make sense of
these ‘influencing’ factors of climate change itself, governmental interventions of regulation and
climate policy and internal organizational resources and capacity.
62
This leads to three research questions in particular:
1. How do the study participants construe and make sense of the influential pressures outlined in
this work, in assessing the impact of future climate risks on their operations?
Since there are two sector groups within the study group, as explained earlier in Sections 1.3 and 2.3,
the comparison of respondents’ construal may illuminate differing priorities, the first research
question is demarcated into a second and third research question:
2. What differences in risk perceptions, if any, exist between the two sector groups (power producers
and utilities)?
3. How do the sector participants construe of the relative influence of climate drivers on their view of
future climate risk management?
In summary, the primary research question is designed to gain an understanding of how electricity
managers view climate risks and how they expect to manage those risks in the near future.
The second and third research questions are designed to compare any differences or similarities in
individual constructs between the two sub-groups, and differences or similarities in the assessment of
the relative importance of the different climate drivers (the element analysis).
2.11 CHAPTER SUMMARY
As a review of the literature, this chapter brought focus to the research topic of climate risk
perceptions in the electricity sector in Ontario. The work is presented in the broader field of risk
perception theories, and in the prior work of industry-specific studies of challenges facing
infrastructure and electricity companies in the western world. The chapter considered some of the
primary literature sources related to climate change itself, the electricity sector in Ontario, corporate
adaptation, risk management practice, risk perception theories, and PCT. The resulting view
suggested the prospects of managing future climate change impacts are driven by perceptions of risk;
and that risk perceptions themselves are potentially influenced by a range of drivers/pressures relevant
to the present study.
Congruent with that, the former chapter described two constructivist approaches to understanding how
individuals construe and make sense of their world—that of sensemaking theory and of PCT. The
chosen research design, described in the next chapter, will rely on PCT and the RGT to elicit
respondent constructs of climate risk in relation to the previously discussed factors, deemed the
‘elements’ in the grid, as will be shown in the next chapter.
63
CHAPTER 3 RESEARCH DESIGN AND METHODOLOGY
This chapter provides an explanation of the many and varied issues relating to the research design and
methodology used in the main study and the pilot analysis.
For ease of reference, the aims, objectives and research question are recapped below.
3.1 RESEARCH AIM
The research aim of the present study is to understand how decision makers in the electricity sector in
Ontario (Canada) view climate risks and how they expect to manage those risks in the near future.
3.2 RESEARCH OBJECTIVES
The primary objective that emerges from the above discussion is to identify the way in which the
participants construe and make sense of the influencing factors related to the exogenous and
endogenous pressures on electricity producers and utilities. Exogenous pressures in this study are
direct climate impacts of extreme weather events, the indirect climate impacts of climate data, aging
infrastructure, government policy, and GHG regulation. Endogenous pressures in this study are the
risk impacts of technical knowledge, organizational resources and organizational capacity.
From the above, further empirical work is proposed to address three subordinate objectives, namely,
a) the development of a category scheme that describes and enumerates the constructs participants
have about the drivers/influences involved, b) the examination of the differences that may exist in the
constructs of the two groups of participants and c) the examination of the differences in the constructs
expressed in the more formal published corporate reportage of climate risks, compared with the
individual constructs elicited from the participants.
3.3 RESEARCH QUESTION
Based on the above, the central research question is recapped here for consistency: How do the sector
participants construe and make sense of the factors outlined in this work in assessing the impact they
have for managing those risks in the future?
3.4 METHODOLOGY FOR THE EMPIRICAL WORK
The present study is concerned with exploring management thinking about climate risks in the
electricity sector. It has been noted in Sections 1.4, 1.8, and 2.6 that how electricity executives
perceive climate risks for their own operations—in light of external and internal factors, including
most visibly a sector wide ‘call for action’ on climate risks (CEA 2015) is likely to inform their
decisions and actions.
Other climate risks related to aging infrastructure, while a concern for both groups, may inform
participants’ perceptions of climate risk impacts in different ways. Additionally, government policy
64
and GHG abatement regulations targeting the participants place unique and pervasive pressures on
(natural gas) power producers’ groups—but not likely to the same extent on their counterpart utility
groups.
Furthermore, organizational pressures for increased capacity and resources to manage future risks,
whether direct impacts of extreme weather or whether indirect impacts of public policy and regulation
and organizational burdens, may produce variations in perceptions reflecting different constructs in
the utilities manager.
While risk perceptions of climate change may have associations with highly variable meanings, the
constructivist approach adopted in this work suggests that decision-makers’ constructs reflect their
assumptions about the risks that climate change produces in the first place.
Based on the above, and the importance of the perceptions held by the utilities managers under study,
a phenomenological approach organised as an exploratory study is appropriate.
Given the research objective to understand the differences between and among multiple case studies, a
comparative case study approach is selected. A further mixed methods approach using narrative
analysis of participant corporate reports is introduced in the second phase of the empirical work.
3.5 RESEARCH PARADIGM
The researcher’s philosophical assumptions about the empirical nature of the present study, and about
the way in which data about climate risk perceptions should be gathered and analysed, are provided
by the following and brief discussion about the philosophical and paradigmatic features of the work.
Briefly the phenomenological approach is discussed followed by the recognition of the ontology and
epistemology of the research topic, with specific reference to constructivism. All three facets shape
the approach to theory and methods in qualitative inquiry (Gibbert et al., 2008).
Firstly, the present inquiry is committed to a phenomenological approach so that the analysis can seek
to “grasp and elucidate the meaning structure and essence of the lived phenomenon for a person or a
group of people” (Patton, 2002, p. 482). In the words of Snape & Spencer (2003), “phenomenological
research seeks to understand the constructs people use in everyday life to make sense of their world”
(Snape & Spencer, 2003, p. 12). Congruent with that, the central focus of the present work is
primarily on eliciting these constructs from the participants to understand their perceptions of climate
risk on their organizations.
Secondly, the ontology and epistemology—which are two ways of describing the philosophical
position taken, are considered. Ontology can be defined as a belief system that reflects the
interpretation of an individual about what she/he sees as ‘reality’. In simpler terms, ontology is
associated with a central question of whether phenomena need be identified as objective or realist, or

65
subjective. In the present work and shown throughout Sections 1.8, 2.2, 2.6.1, and 2.6.2, the
ontological orientation of the climate risk perceptions debate has been argued and supported through
the extensive use of literature depicting climate risk as a social construction. Given that, the ontology
for the present work is phenomenological in nature.
Epistemology, another philosophical dimension, deals with the nature of knowledge and what counts
as proof. A prior reference in this work about the discussion of climate risk suggested that the concept
of risk itself is epistemologically questionable however, given that knowledge about it (risk) is
knowledge about the lack of knowledge (See Section 2.6.2 for further discussion).Overall however,
the epistemological position is one of constructivism, allowing for the collection of individual risk
perceptions according to a constructivist approach using methodology and data collection techniques
to explore human perception and appraisals of future climate risks.
Understanding constructivism in terms of what it is and what it is not, produces an opportunity to
compare it with its paradigmatic opposite—the positivist school of inquiry. In the context of the
present work, a constructivist approach will provide a way of understanding and interpreting the
world of electricity utilities managers, and will look for multiple meanings and complexity of the
participants’ viewpoints on climate risk. In other words, constructivism aims to understand how the
participants create meanings about their world and experiences when asked, in this work, about the
prospects of managing future climate risks. In the constructivist tradition, different meanings of the
same phenomena are seen as due to different individual constructs derived from a variety of
experiences. This is consistent with a phenomenological approach, a variant of the constructivist
school, where the researcher gains knowledge about the ‘lived experiences’ of participants through
exploratory techniques and analysis of narrative data.
In contrast, positivism is concerned almost exclusively with empirical observation of variables,
hypothesis and testing, often resulting in statistically supported conclusions about correlations or
causal relationships between/among variables.
Unlike the constructivist approach where all phenomena (variables) and their interacting relationships
are observed, the positivist school is oriented towards holding variables constant to test for
relationships which support established theoretical assumptions. In further distinction the
corresponding research paradigm for constructivist inquiry is one of a ‘bottom up’ inductive reasoning
(Jankowicz et al., 2016). The inductive approach used in this work corresponds with assumptions of
using empirical observations first to generate broader generalizations and theory development.
Constructivism is concerned with the ‘making of meaning’ where according to Crotty (1998)
‘meaning is not discovered but constructed’, and with ‘inviting a radical spirit of openness’ to
accommodate a variety of individual experiences and personal meanings’ (Crotty, 1998, p. 9).
66
In literature the constructivist variants ‘radical constructivism’, ‘social constructivism’ and
‘constructivist alternativism’ are useful to note (Von Glasersfeld, 1989) prior to discussing PCT as
theoretical support for the present research method and technique.
Radical constructivism claims “all knowledge is actively received and built up by the cognizing
subject, where the function of cognition is adaptive and helps to organize the experiential world for
the individual” (Von Glasersfeld, 1989, p. 162).
In contrast social constructivist-based theory emphasizes the role of culture and context in developing
shared interpretations of reality where meaning is an agreement shaped by social patterns and the
assumptions encapsulated in language. (Von Glasersfeld, 1989). In other words, social constructivism
refers to the process of individuals making ‘meaning’ within a social context (Berger & Luckmann,
1991).
Contributions from Lorsbach and Tobin (1992) suggest that the process of construing incorporates
both social and individual aspects where individuals will form relationships and construe of each
other’s constructs, often resulting in an improved understanding of others/groups constructs. This
sociality proposition is noted in Kelly’s sociality corollary ‘as the pattern of behaviour that an
individual will follow and modify based on her/his understanding and prediction of her social
environment (Kelly, 2003, p. 96).
Before the social constructivist movement took hold, Kelly expanded the concept of constructivist
thinking to one called ‘constructivist alternativism’ to support his ‘man as scientist’ argument, where
individuals may be initially committed to a belief, held tentatively—but continually reappraise new
and alternative information to form alternate constructions.
Kelly’s formal explanation of Personal Construct Theory used logic based, axiomatic language and
described the basic principles of PCT as fundamental postulates and corollaries. As noted in Section
2.7.2, chief among them are the five PCT principles relevant for the present study: (a) the
construction corollary (individuals develop internal representations of reality by recognizing patterns
in their experiences); (b) the experience corollary (where constructs are tentative about what will
happen next); (c) the individuality corollary (individuals have different constructs); (d) the
commonality corollary (individuals may share constructs with others, promoting role relations); and
(e) the sociality corollary, as described above.
While once rejecting the traditional label of ‘cognitive’ processing where it would apply to mental
reasoning, logic and deduction to explain for constructs, Kelly nevertheless referred to the predictive
power of cognitive complexity (Kelly, 2003) in an individual. He explained that the level of
differentiation, or ‘the greater the degree of differentiation among constructs, the greater will be the
predictive power of the individual’ (Kelly, 2003, p. 53). Furthermore, the more cognitively complex
67
individuals are in terms of constructs they use to interpret their own experience, the more constructs
their social and business partners will need, to effectively construe their construction processes (Kelly,
2003, p. 54). It can be noted that Kelly’s notion of cognitive complexity is significant and implied in
the RGT where there is a procedural aim to elicit from four to six constructs as a minimum, from each
individual. Further discussion of RGT and data collection is found the next section.
Kelly (2003) explained his view of individuals as incipient scientists that create their own ways of
seeing the world and events, this way: ‘As a scientist, a man seeks to predict and control the course of
events. The constructs which he formulates are intended to aid him in his predictive efforts’ (Kelly
1963, p 12). While recent critics of Kelly’s man as scientist proposition have argued that individuals
in fact do not always make good scientists in view of modern day idolatry and celebrity messaging of
information, (Bannister & Fransella, 1986), the researcher believes that Kelly’s guiding principle of
‘man as scientist’ sufficiently applies to constructs elicited in this work, given the technical
orientation and industrial training of the participants.
3.6 RESEARCH METHOD
Congruent with the epistemological constructivism and the qualitative nature of this inquiry the
selected method is one of case study design. While the six main research methods—interpretivist,
survey, experiment, case study, action research and grounded theory (Jankowicz et al., 2016) have
been considered, the preferred research method for the present work is a comparative case study,
enabling the researcher to not only explore constructs elicited in case study design, but to compare
them between two distinct groups in the study. The terms case work, case study research and case
study method are used interchangeably in this discussion.
The case study rationale for this work is based on the assumption that this work investigates ‘a
contemporary phenomenon within its real life context’ (Yin, 2014, p. 16). He suggested ‘where the
boundaries between phenomenon and context are not clearly evident; and in which multiple sources
of evidence are used’ (Yin, 2014, p. 17) case study design is appropriate. In other words, a case study
is a unique way of observing any natural phenomenon which exists in a set of data—unlike positivist
work “which may observe patterns in data at the macro level on the basis of frequency being
observed, case studies observe the data at the micro level” (Zainal, 2007, p. 2). It can be noted here
that the units of analysis in the present work are the individual constructs of the participants.
Conditions supporting the rationale for the case study method are noted in literature (Dooley, 2002;
Eisenhardt, 1989; Eisenhardt, 1991; Yin, 2014). Specific discussions about multiple case studies are
supported in contributions (Herriott & Firestone, 1983; Yin, 2014). Eisenhardt (1991) asserted the
rationale for multiple case studies allows for a wider base of knowledge, and allows “the researcher to
view patterns on a larger scale” (Eisenhardt, 1991, p. 620). Similarly, Herriott and Firestone (1983)
maintained that the overall study is regarded as being more robust (than a single case study).
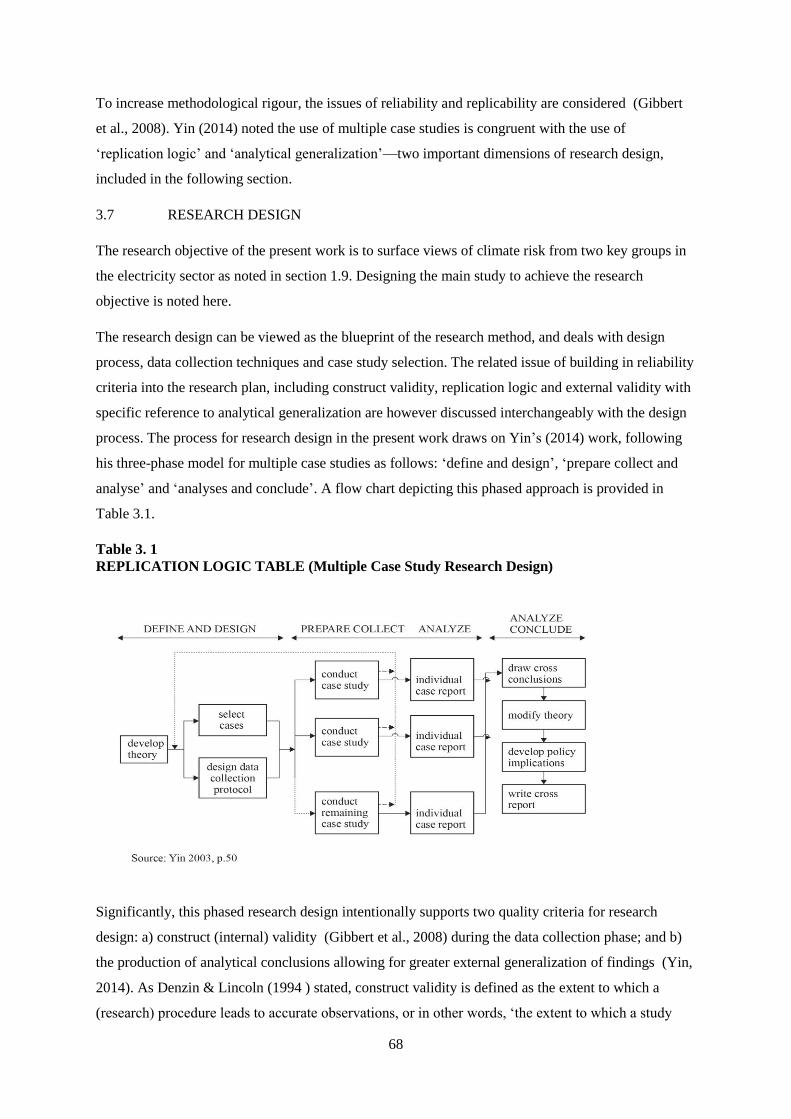
68
To increase methodological rigour, the issues of reliability and replicability are considered (Gibbert
et al., 2008). Yin (2014) noted the use of multiple case studies is congruent with the use of
‘replication logic’ and ‘analytical generalization’—two important dimensions of research design,
included in the following section.
3.7 RESEARCH DESIGN
The research objective of the present work is to surface views of climate risk from two key groups in
the electricity sector as noted in section 1.9. Designing the main study to achieve the research
objective is noted here.
The research design can be viewed as the blueprint of the research method, and deals with design
process, data collection techniques and case study selection. The related issue of building in reliability
criteria into the research plan, including construct validity, replication logic and external validity with
specific reference to analytical generalization are however discussed interchangeably with the design
process. The process for research design in the present work draws on Yin’s (2014) work, following
his three-phase model for multiple case studies as follows: ‘define and design’, ‘prepare collect and
analyse’ and ‘analyses and conclude’. A flow chart depicting this phased approach is provided in
Table 3.1.
Table 3. 1
REPLICATION LOGIC TABLE (Multiple Case Study Research Design)
Significantly, this phased research design intentionally supports two quality criteria for research
design: a) construct (internal) validity (Gibbert et al., 2008) during the data collection phase; and b)
the production of analytical conclusions allowing for greater external generalization of findings (Yin,
2014). As Denzin & Lincoln (1994 ) stated, construct validity is defined as the extent to which a
(research) procedure leads to accurate observations, or in other words, ‘the extent to which a study
69
investigates what it claims to investigate (Gibbert et al., 2008, p. 3). Formulating the research design
as a protocol as Yin has shown, establishes ‘a clear chain of evidence to re-construct how the
researcher went from the original research questions to the final conclusions’ (Yin, 2014, p. 237).
Secondly, external validity or generalizability assumes that operationalized theories must be shown to
account for phenomena not only in the settings in which they are studied, but also in other settings
(Calder et al., 1981; McGrath & Brinberg, 1983).
The rationale and application of generalization techniques in differing research contexts are well
discussed in literature (Maxwell, 1992, 2005; Polit & Beck, 2010; Yin, 2014). Case study method
uses analytical generalization by applying specific findings derived from one case to other cases in
which similar theoretical propositions are felt to apply—rather than by using statistical generalization.
Statistical generalization, in contrast, relies on some defined population that has been sampled.
Replication logic—or asking the same questions repeatedly of two or more contrasted groups to see
whether the results are as expected from the theory with which the analytical generalization is
working (Jankowicz,2016) promotes external validity through replicability of results.
Yin’s (2014) replication logic for multiple case studies followed in this work is as follows:
The Define and Design phase, beyond theory building, encompasses case study selection and
establishment of data collection protocol;
The Prepare, Collect and Analyse phase encompasses data collection from each case study and report
writing;
The Analyse and Conclude phase involves in case and cross case analyses, any theory modification
and the cross-case report writing.
3.8. THEORY DEVELOPMENT
The focus of this research is to understand and gain insight from two sector groups, their perceptions
of climate risk that may influence views of future management of them (climate risks). The theory
used as an organizing framework to understand the risk source and level of influence on risk
perceptions is Renn & Rohrmann’s (2000) integrative model of risk perception (as introduced in
Section 2.6.3.7).
According to Renn et al.’s model, and where it applies to ‘personal manifestations’ (see Figure 2.2),
perceptions of risk result from four factors: (a) heuristics of information processing at the most
individual level; (b) cognitive and affective factors; (c) social and political institutions; and (d)
cultural background. These four levels of factors in Renn & Rohrmann’s proposition influence risk
70
perceptions in a hierarchical structure where the most immediate influence on individual perceptions
is heuristics and common sense.
In exploring the individual perceptions of the two key study groups it is expected that the source of
influence over individual perceptions in the empirical data may match or relate to those in Renn’s
model. Theory contribution is anticipated where if any differences in perceptions pertaining to the two
groups are noted in the empirical work; hence the empirical data collected will provide data for the
test of Renn & Rohrmann’s (2000) integrative model of risk perception.
Additionally, there has not been, to the best of the researcher’s knowledge, any prior empirical testing
of the integrative model of risk perception; nor have standard measures been developed to test the
validity of the model. Emergent results from this study will be novel and contribute to theory
building.
3.9 CASE STUDY SELECTION
Multiple case studies were purposively selected from two groups in the electricity sector: one group of
10 case studies was selected from the natural gas electricity power producer industry and the other
group of 10 case studies was selected from the electricity production and utilities industry. Twenty
case study organizations in total are identified and selected using a purposive selection strategy
(Transportation Research Board, 2009).
According to Yin (2014), six to 10 case studies would provide compelling support while Patton
(2002) suggested there are no specific rules for the number of cases in multiple case study research of
this nature (Quirk, 2013). Furthermore, Eisenhardt (1989)stated while there is no ideal number of
cases in phenomenological and constructivist research, four to 10 cases is normally ideal (Quirk
2013). In consideration of the RGT procedural requirements for eliciting 300-350 constructs however,
a total of 20 case study organizations were selected on the assumption that each participant would
produce between 12-15 constructs in the grid process. Following Diaz de Leon & Guild (2003) ‘s
work which obtained an average of 11 constructs per interview, it is anticipated that between 12-15
constructs per interview would be acceptable.
The selection of the participating organisations took place as follows. After information from multiple
sources of secondary data were retrieved, an industry-wide survey of power producers, transmission
and utilities companies operating in Ontario was obtained in October 2016. Relevant statistics and
corporate characteristics of all market operating companies were compiled in excel spreadsheets for
ease of handling. Annual report links were embedded in the documents, as were any relevant internet-
sourced industry and specialist’s commentary on risk issues pertaining to the organizations.
71
After assembling a formal statement of the total population of gas fired electricity producers and
municipal utilities in Ontario, the researcher’s task was six-fold:
1. Determine operating status of the company within the province of Ontario;
2. Determine whether the power producers and utilities were contracted by the Independent
Market Operator (IESO) so as to verify connectivity with the Ontario public grid (see
Sections 1.6 and 2.3);
3. Determine whether the organizations were certified under the CEA’s sustainable utilities
program, as participating organizations were thought to have more value to contribute to this
research;
4. Determine names and roles of informants within the organization for securing access and
research participation;
5. Contact industry sources (the CEA, the Association of Power Producers, Electricity
Distribution Association) and government agencies (Ministry of Energy in Ontario, the IESO)
to determine which organizations had the most potential to contribute to this research. This
process assisted in also assessing which companies were interested in participating in the field
study, and
6. Execute a geo-locational selection criterion to limit the case selection to organizations located
in the south west quadrant of Ontario (within a 200 km radius of Toronto, Ontario). Limiting
the geographic reach of the study was a pragmatic consideration of the in-person requirement
for interviewing and also of Ontario’s inclement winter weather during the scheduled data
collection phase. Most of Ontario’s electricity infrastructure, as mentioned in Sections 1.7 and
2.3, are located in the southwest quadrant, accounting for over 75 per cent of electrical power
producers and utilities in the province.
The unit of analysis in this work is the construct (elicited) fulfilling what Yin (2014) deemed as the
definition of the case, and is related to the way the research question is defined. In other words, each
construct represents a single unit of meaning (Jankowicz, 2004).
3.9.1 Respondent Selection
After identifying 20 companies (10 producers, 10 utilities) the researcher emailed and posted a written
request for the grid interview (see Pilot Appendix B). Attached with the correspondence were letters
of acknowledgement from CEA, APPrO as well as a certified letter of introduction from Heriot Watt
University (see Pilot Appendices A, D and E).
The purposive targeting of senior executives was done to obtain participation from the most
knowledgeable individual within the organization. Selection criteria were based on two assumptions:
a) that the chief executive officer was most familiar with the strategic climate risks the company
72
faced; and b) that they would speak with candour about their individual views of climate risk
management.
The assumption was made that line managers might be less knowledgeable on all matters and be
reluctant to speak freely about all issues. It can be noted that the researcher was cognizant of the
possibility of systemic bias among all executive respondents who might promote a shared industry
agenda.
3.10. REPERTORY GRID TECHNIQUE
This section deals with the description, the rationale and for the chosen primary data collection
method, the repertory grid technique.
Developed by Kelly (1991) as an investigative tool in his constructivist research, RGT is a tool that
reduces the influence of the researcher’s frame of reference on what is observed, leaving the
participant to reveal their own personal mental models or cognitive maps on a topic (Diaz de Leon &
Guild, 2003). The investigator’s world view is set aside in construct elicitation under the procedures
suggested by (Jankowicz, 2004; Jankowicz et al., 2016) so that the resulting narrative data are
relatively free of researcher’s bias (Reger & Huff, 1993).
Fransella (2003) described the RGT as an instrument which provides a concise description of the way
an individual understands the world. Kelly (2003) proposed that individuals over time develop
subjective theoretical frameworks of their world enabling them to make meaningful judgements or
evaluations of specific situation as well as anticipate or manage events. Thus, risk perceptions
influenced primarily by these subjective frameworks, can be drawn out through RGT. This framework
produces for the researcher cognitive maps of how decision makers construe climate risk drivers and
organizational pressures on their organizations. Moreover, the framework is essential to answering the
research questions and is aligned with the constructivist approach of understanding how utilities
managers make sense of the influences drivers and pressures on their views for managing climate risk
in the future. Participants develop and express their own constructs to reveal the thinking the
participants possess but are possibly unable to articulate (Diaz de Leon & Guild, 2003). Congruent
with that, RGT is an appropriate technique for reducing social desirability bias which may otherwise
distort results (Jankowicz, 2004).
Construct elicitation by the interviewer it is noted may require surfacing of tacit constructs enabling
the participant to express what the participant intends to say and on occasion suggesting the words
that might express the intended meaning (assuming the participant agrees). Assisting the participant to
articulate the words that might best express the meaning intended is one such process subtlety.
The RGT has been variously used in applied business cases though its genesis is found in Kelly’s
earlier clinical psychology investigations. Variations on elicitation methods are noted in literature
73
where RGT was used for eliciting management views relating to: strategic planning assumptions
(Calori et al., 1994); consumer marketing (Rogers & Ryals, 2007); usability studies of technology
(Oppenheim et al., 2003); stakeholder diversity (Girard, 2013); and intangibles in venture capital
groups (Diaz de Leon & Guild, 2003).
As well as identifying an individual’s basic constructs, one variation of the basic RGT procedure is to
identify the kinds of constructs that indicate the personal values a person holds about the topic of the
grid. Three reasons militate against this variation: time constraints (eliciting values would tend to
double the interview time to an unacceptable level), technical orientation (where the respondents do
not generally make their decisions based on personal values, but follow technical criteria) and the
presence of a regulatory system that emphasises operational rather than technical demands.
While elicitation techniques varied in this group of contributions, RGT protocol for the present study
will be discussed next.
3.11 REPERTORY GRID PROCEDURE
The RGT was the primary data collection tool used in the work for unearthing individual
meanings/beliefs (constructs) from the participants. The rationale for the technique has been
addressed above and data were collected from the participants through face-to-face interviews.
The interview process was conducted in two phases, an introduction and overview as the first phase
and the constructs elicitation as the second phase. The interview process began with the researcher
briefly describing the research topic, objectives, and procedure for the interview. A researcher’s
statement of research was provided as well as the letter of introduction from Edinburgh Business
School. The researcher reiterated that collected data is anonymized and also disclosed to the
participant after each interview. The participant was asked to initial the grid documents.
In the second phase, primary data were collected with the RGT, according to the multistep process
noted in literature (Fransella, 2003; Jankowicz, 2004; Rogers & Ryals, 2007) in the following
manner:
The topic for the grid was stated. In this study it is how climate risks influence participant’s views of
future climate risk management.
Elements were provided and explained. The elements 2343 the factors identified in the literature (see
Chapter 2) and provided for in Table 3.2.
Constructs were elicited from triadic style elicitation of elements, where elements are selected in a
unique sequence (to prevent repeating combinations) and the recurring question posed to the
participant: ‘In what way are two of these the same and different from the third—in terms of the way
they influence your management of climate risks?’
74
The participant was asked to rate on a scale the bi polar positions of constructs he/she identified.
Steps 3 and 4 were repeated until no new constructs are offered by the participant.
To improve the specificity of constructs, the laddering down technique was employed, using the ‘in
what way, how’ line of inquiry. To ensure that the elicited constructs provide a suitable level of detail,
the ‘laddering down’ technique was used as necessary. This asked the interviewee to state ‘in what
way’/ ‘how’ the construct might be stated in more detailed operationally specific terms.
Results from the grid interview were recorded in a repertory grid matrix template, prepared in
advance of the interview (See Pilot Appendix C).
3.11.1 Elements
As noted above, the RGT uses elements, or ‘the things or events which are abstracted by a construct ‘
(Kelly, 1991, p. 137). Elements are an example of the topic and are developed to reflect a ‘range of
convenience’, or the context of the constructs used (Fransella, 2003). Elements can be developed by
the researcher or by the participant (Jankowicz, 2004).
While Fransella (2004) noted “it is common practice for the elements to be developed by the grid
designer” (Fransella, 2003, p. 21), variations in approach are noted in literature (Calori et al., 1994;
Diaz de Leon & Guild, 2003; Girard, 2013; Oppenheim et al., 2003).
In this study, eight elements were supplied by the researcher: three were selected from the CEA’s
climate risk adaptation report, and five more were gathered from the literature and conference
proceedings of electricity utilities conferences in Canada. The selected elements reflect a
homogeneous range of climate risk impacts and are categorized in three categories of concern for the
industry (a) direct weather effects; (b) exogenous factors (climate data, government policy, emissions
regulation, aging infrastructure); and (c) endogenous factors (technical knowledge, organizational
capacity and resources).
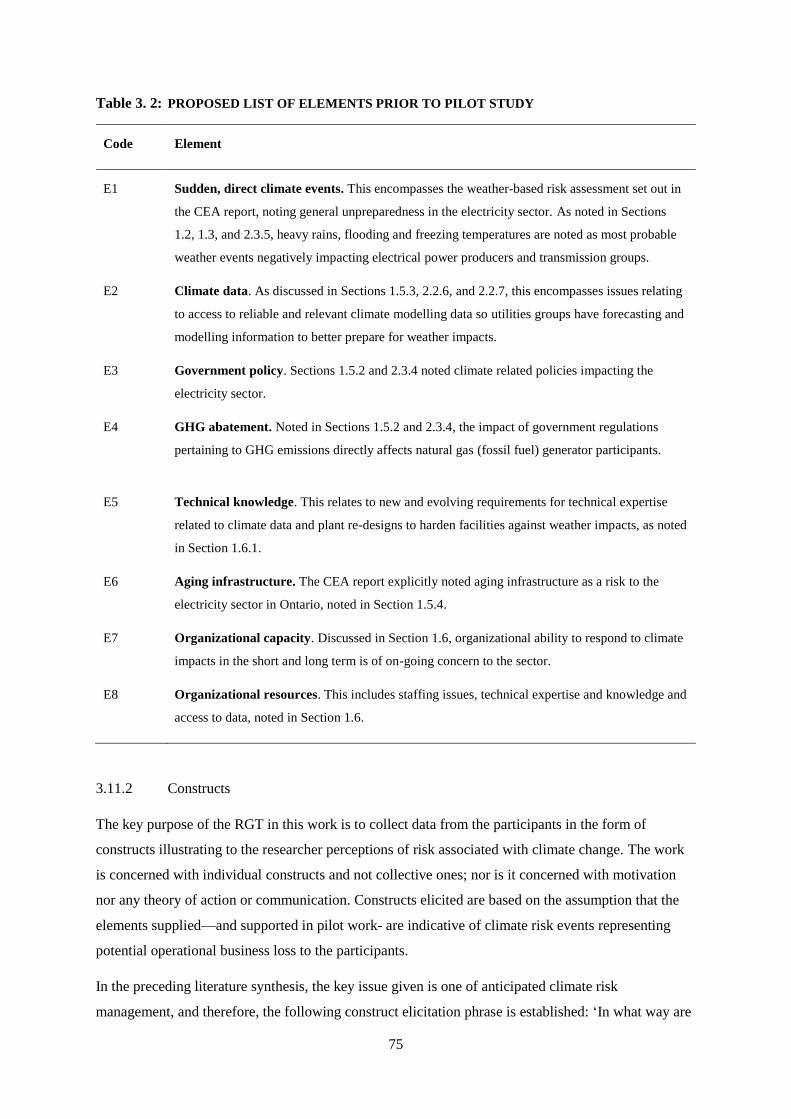
75
Table 3. 2: PROPOSED LIST OF ELEMENTS PRIOR TO PILOT STUDY
Code Element
E1 Sudden, direct climate events. This encompasses the weather-based risk assessment set out in
the CEA report, noting general unpreparedness in the electricity sector. As noted in Sections
1.2, 1.3, and 2.3.5, heavy rains, flooding and freezing temperatures are noted as most probable
weather events negatively impacting electrical power producers and transmission groups.
E2 Climate data. As discussed in Sections 1.5.3, 2.2.6, and 2.2.7, this encompasses issues relating
to access to reliable and relevant climate modelling data so utilities groups have forecasting and
modelling information to better prepare for weather impacts.
E3 Government policy. Sections 1.5.2 and 2.3.4 noted climate related policies impacting the
electricity sector.
E4 GHG abatement. Noted in Sections 1.5.2 and 2.3.4, the impact of government regulations
pertaining to GHG emissions directly affects natural gas (fossil fuel) generator participants.
E5 Technical knowledge. This relates to new and evolving requirements for technical expertise
related to climate data and plant re-designs to harden facilities against weather impacts, as noted
in Section 1.6.1.
E6 Aging infrastructure. The CEA report explicitly noted aging infrastructure as a risk to the
electricity sector in Ontario, noted in Section 1.5.4.
E7 Organizational capacity. Discussed in Section 1.6, organizational ability to respond to climate
impacts in the short and long term is of on-going concern to the sector.
E8 Organizational resources. This includes staffing issues, technical expertise and knowledge and
access to data, noted in Section 1.6.
3.11.2 Constructs
The key purpose of the RGT in this work is to collect data from the participants in the form of
constructs illustrating to the researcher perceptions of risk associated with climate change. The work
is concerned with individual constructs and not collective ones; nor is it concerned with motivation
nor any theory of action or communication. Constructs elicited are based on the assumption that the
elements supplied—and supported in pilot work- are indicative of climate risk events representing
potential operational business loss to the participants.
In the preceding literature synthesis, the key issue given is one of anticipated climate risk
management, and therefore, the following construct elicitation phrase is established: ‘In what way are
76
two of these (constructs) the same and one different, in terms of the way they influence your
management of climate risks?’
The elicitation process is expected to surface differences in constructs from study participants on an
individual basis. Comparisons are expected to be made between individual constructs in one group
with the other, looking for differences in the construing of both groups studied. Moreover, the
proposed construct elicitation provides the foundation for Honey’s content analysis technique
(Honey, 1979) for identifying the most salient personal construct identified in the content analysis
stage. Furthermore, construct elicitation, as described above, is likely to be useful in the proposed
testing Renn & Rohrmann’s (2000) integrative model of risk perception.
Construct elicitation, as indicated in the previous section, was done with triadic options presented to
the participant. The process was intended to produce two contrasting poles for the construct
representing opposites in meaning. From the research method point of view, constructs offered by
participants should present an accurate picture of personal meaning for the participant in a
‘constellatory’ manner where additional associations can be elicited (Easterby-Smith et al.,1996, p. 8).
There are however four non-performing construct types which may challenge the researcher to
abandon or employ laddering down techniques: (a) situational constructs (‘power producers plant
new, operating only for three months now’); (b) excessively permeable (‘our industry is government
regulated’); (c) vague or superficial constructs (‘sounds like a good idea’); and (d) constructs
generated by the role title (‘aging infrastructure is old’; Easterby-Smith, 1980). Easterby-Smith et al.
(1996), Jankowicz (2004), and other RGT exponents suggest laddering down techniques to obtain
specificity in construct power producers, as in ‘in what way does government regulation have an
effect on your thoughts about future climate risk management?’
3.11.3 Grid Analysis—Cluster, Principal Component and Content Analyses
Once grid data was collected, a quantitative analysis of the relationships inter and intra elements and
constructs was done to assess and describe the relative strength of relationships in the participant’s
construct system. Similarly to Bell (1990), three central questions were asked of grid data to answer
such inquiries:
How do the constructs relate to one another? That is, are some constructs seen as similar to one
another and if so, do they exist in clusters or bundles? Which constructs are seen as dissimilar?
How do the elements relate to one another? Which elements are seen as similar and which are
dissimilar?
How do the elements relate to the constructs? Which constructs are important when the subject
construes a particular element?
77
While content analysis was the main technique proposed in the present work, an overview of all three
grid analysis techniques was provided for clarity. In general, three main statistical techniques are used
in grid analysis: cluster, principal component and content analysis—after an ‘eyeball’ analysis and
general construct characterization is done by the researcher (Jankowicz, 2004, p. 72) to establish the
integrity of the grid results.
Statistical similarity using measures of correlation between different constructs or elements was done
in cluster analysis to determine whether highly correlated constructs in a cluster have a relationship to
another construct or a distinct cluster of constructs. In other words, can constructs be explained by one
unique name or label, or several? Cluster analysis is done with both individual case reports and across
case or aggregated reports of all case studies.
Calculations on construct relationships, expressed with nominal or ordinal data, are displayed in tree,
dendrogram and correlation table representations. The interpretation of results from cluster analysis
for the Pilot Study is found in Section 4.5.1 where results and conclusions are discussed.
Principal component analysis (PCA) goes farther than cluster analysis to express the relationship if
any between constructs and elements in the same individual grid. Fransella (2003) Bell (1990) and
Bannister (1986) proposed a singular-value decomposition technique that approximates a grid by
examining two component loaded matrices –one for elements and one for constructs. The
decomposition technique identifies variability of the components in descending order. The process
‘decomposes’ by eliminating the greatest variability then examines the next. The interpretation of
results from a PCA for the pilot study are found in Section 4.5.2 where results and conclusions are
discussed.
While cluster and principal component techniques are applied for analysis of individual grids, the
third analysis technique—content analysis where constructs across all case groups are aggregated and
categorized—is the main tool for analysing multiple grid data produced by the study informants.
Content analysis in the present study is seen as a ‘technique in which the constructs of all interviewees
are pooled and categorized according to the meanings they express,’ (Jankowicz 2004, p.148).
Content analysis enables the researcher to examine the different ways in which utilities managers
make sense of climate risks and how they might be managed.
Procedures applied at the content analysis stage are Honey’s Technique (Honey, 1979) and
Bootstrapping (Jankowicz, 2004). While both procedures are done to aggregate meaning from
multiple RGT interviews, the rationale, process and outcome for each technique is different, discussed
next. Honey’s Technique was chosen over other techniques, such as Wright (2004)’s aggregated
super- grid approach, to better fit with Kelly’s view of constructive alternativism. Essentially the
(Honey) technique is a compilation of the separate grids provided by a sample of interviewees
presenting the set of constructs and ratings as a single grid. Quirk (2013) stated, ‘Wright’s (2004)
78
approach creates an ‘average’ person that does not really exists resulting in the loss of the
individuality of the different interviewee’s grids’ (Quirk, 2013, p. 68).
Honey’s (1979) procedure identifies constructs which are particularly salient to the participants, and
in so doing, preserves the information about each individuals’ view in terms of how they personally
look at the topic (Jankowicz 2004).
3.11.4 Honey’s (1979) Procedure
Honey (1979) offers a useful technique for aggregating the meaning in a set of grids while keeping
track of each interviewee’s own understanding of the topic. S/he does so by supplying the interviewee
with an ‘Overall’ construct. In the present work, since the researcher is interested in the ways in which
the interviewees view the influences on their management of climate risk, this is worded as:’ Overall,
has a stronger influence on my management of climate risks/overall has a weaker influence on my
management of climate risks.’
S/he then identifies the extent to which the elicited constructs share meaning with the Overall. Some
of the constructs will rate the elements in much the same way as the Overall; others, differently. S/he
does this by summing the differences between the ratings of the elements on each construct and the
Overall. S/he then turns these sums of differences into a percentage similarity score, since this is
easier to interpret. (100% indicates identical ratings).
Because constructs are bipolar, the ratings on each construct are compared once with the Overall
ratings, and again with the Overall ratings reversed; the higher of the two being used in the
subsequent analysis.
Honey’s technique takes into account that different people have different similarity metrics: one
person may use ratings which match in the range 60% to 75% with his or her Overall, while another
may use ratings in the range 75% to 100%. To reflect this, Honey labels the top third of each
individual’s similarity scores High (H); the middle third as Intermediate (I) and the bottom third as
LOW (L)—for that person.
In summary, the content analysis will indicate the different kinds of meaning present in the whole
group of interviewees, while Honey’s procedure, with each construct’s% matching score tagged with
its H-I-L label, will indicate how important that construct is to each individual’s personal
understanding of the topic.
79
The formula used for the% Matching Score of elicited construct ratings with ratings on the supplied
overall construct is as follows:
3.11.5 Bootstrapping Technique for Core Categorization
After Honey’s (1979) technique was completed, a Bootstrapping procedure was then done at the
content analysis stage. As stated earlier where the pre-existing category scheme from Weinhofer and
Busch’s (2011) methodology was being employed, a Bootstrapping approach nevertheless was
applied to determine if there were additional categories of constructs. The bootstrapping (Jankowicz
2004) procedure was conducted as follows: subcategories were developed from the construct data to
express the different kinds of meanings present in the sample of respondents as a whole. The core
procedure was one in which all the constructs were assigned to a set of mutually exclusive set of
categories allowing for a ‘miscellaneous category containing no more than 5% of the constructs.
The reliability of the core categorization results was then assessed to ensure the category system was
logical. The reliability analysis was carried out independently by two researchers and reliability
indices based on percentage agreement, using Cohen’s Kappa Index was computed. The researchers
repeated the reliability analysis after a careful discussion of category definitions had taken place,
resulting in an acceptably high (>95% agreement) level of reliability.
Levels and similarities were assessed according to reliability tables and Cohen’s Kappa (Cohen 1969).
Inter-rater reliability values were acknowledged at.80 or better.
3.12 ETHICAL CONSIDERATIONS
Ethical principles and values in research promote the aim of the research ‘such as knowledge, truth
and avoidance of error’ (Resnick, 2015). The research in the present work has complied with the
highest ethical principles in accordance with the post graduate research policies of Heriot Watt
University. As such, those principles must be communicated to the participant prior to data collection.
80
In so doing, prior to the collection of any data from the pilot or the main study, the Heriot Watt
University/Edinburgh Business School Letter of Introduction (see Pilot Appendix A) was presented to
each participant. In light of the governmental regulatory environment for the study participants in
Ontario (see Sections 1.7 and 2.3), assurances regarding confidentiality and anonymity are discussed
and provided for in the researcher’s written request for participation (see Pilot Appendix B).
Third, each participant was asked to initial the grid interview document (see Pilot Appendix C) at the
end of the interview, acknowledging that their participation is voluntary and that they agree with
thesis publication disclosures.
Lastly, a letter of support from the CEA and/or the Association of Power Producers in Ontario is
supplied to the researcher’s request for an interview (see Pilot Appendices D and E).
In summary, the four documents reflecting ethical standards for the present work and presented to the
study participants before and after grid interviews take place are:
Heriot Watt /Edinburgh Business School Letter of Introduction
Researcher’s ‘request for a grid interview’ letter
Acknowledgement of informed consent, via the grid document
Industry Letters of Support
81
CHAPTER 4 PILOT STUDY
4.1 INTRODUCTION AND OBJECTIVES
A pilot study involving one decision maker from each of the two study groups was conducted to test
and refine the data collection and analysis techniques, specifically the use of the repertory grid
technique (RGT). The pilot study was planned as a two-part study with grid interviews conducted
before the second set of data collection and analysis was conducted.
The objectives of the RGT phase of the pilot study were:
1. To assess the relevance of the supplied elements.
2. To identify the types of constructs that utilities managers in the electricity sector use to
construe climate risk impacts on their organizations. While results in the pilot stage are not
expected to be conclusive, they are supposed to help in understanding the range of issues and
provide a preliminary look at the types of constructs that are likely to surface in the main
study.
3. To estimate a typical number of elicited constructs for the repertory grid interview. In doing
so, an approximation could be made of the number of interviews needed in the final research
phase. For conclusive results a total of 250-300 constructs is needed.
4. To gain proficiency with RGT. In gaining proficiency, the interviewer is sufficiently practiced
with the technique, allowing her to focus on construct eliciting in a more conversational,
interactive manner with the interviewee.
5. To practice cluster analysis, PCA and content analysis. By doing so, the analysis software is
reviewed and tested prior to the main study. The analysis software provides a part of the
eventual analysis of the main sample data.
6. To appraise the viability of additional data access from the participants. Time constraints
were raised in the participant’s correspondence prior to grid interviews; asking for more time
for values elicitation, or a questionnaire was deferred until after the grid interviews were
completed.
4.2 PILOT STUDY SAMPLE
Two pilot study interviews were conducted in total. A senior climate risk analyst from the largest
electrical power producer company in Ontario and the chief executive officer from a large
municipally owned electricity utility company agreed to participate in the pilot study. Selecting one
from each of the two key study groups was expected to generate views and attitudes of the two groups
to produce sufficiently unique empirical data to demonstrate the potential differences and potential
similarities in attitudes and perceptions of climate risks.
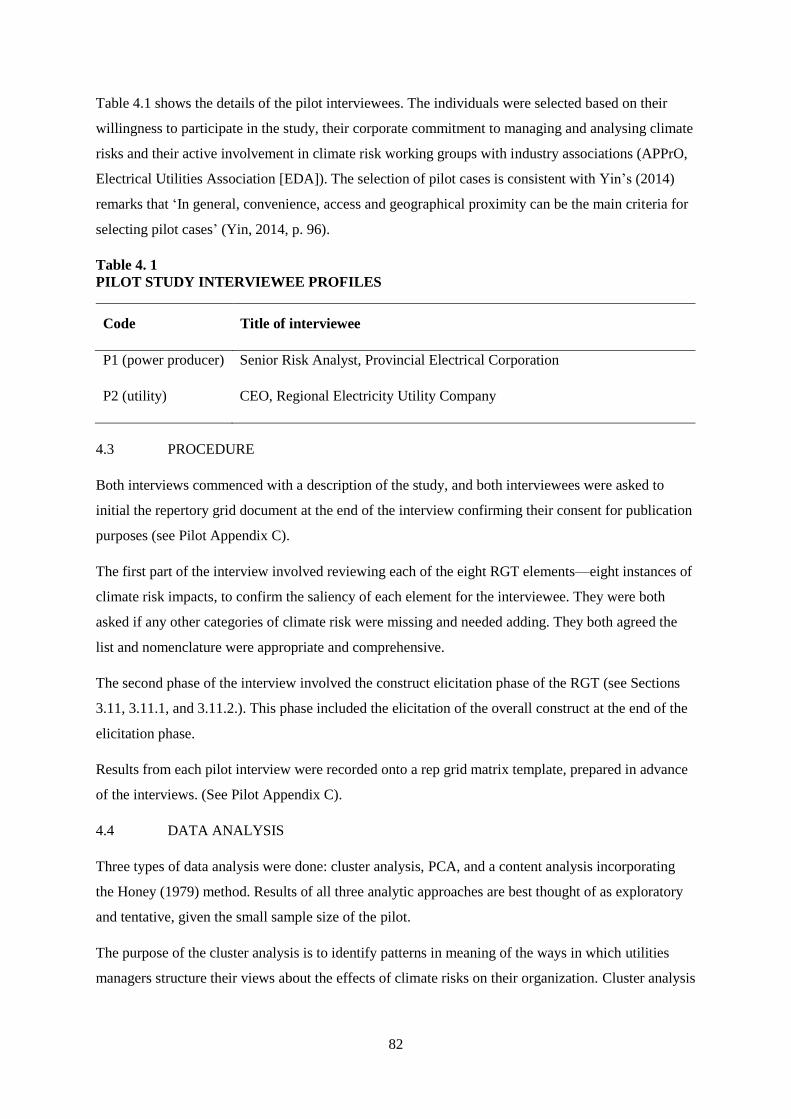
82
Table 4.1 shows the details of the pilot interviewees. The individuals were selected based on their
willingness to participate in the study, their corporate commitment to managing and analysing climate
risks and their active involvement in climate risk working groups with industry associations (APPrO,
Electrical Utilities Association [EDA]). The selection of pilot cases is consistent with Yin’s (2014)
remarks that ‘In general, convenience, access and geographical proximity can be the main criteria for
selecting pilot cases’ (Yin, 2014, p. 96).
Table 4. 1
PILOT STUDY INTERVIEWEE PROFILES
Code Title of interviewee
P1 (power producer) Senior Risk Analyst, Provincial Electrical Corporation
P2 (utility) CEO, Regional Electricity Utility Company
4.3 PROCEDURE
Both interviews commenced with a description of the study, and both interviewees were asked to
initial the repertory grid document at the end of the interview confirming their consent for publication
purposes (see Pilot Appendix C).
The first part of the interview involved reviewing each of the eight RGT elements—eight instances of
climate risk impacts, to confirm the saliency of each element for the interviewee. They were both
asked if any other categories of climate risk were missing and needed adding. They both agreed the
list and nomenclature were appropriate and comprehensive.
The second phase of the interview involved the construct elicitation phase of the RGT (see Sections
3.11, 3.11.1, and 3.11.2.). This phase included the elicitation of the overall construct at the end of the
elicitation phase.
Results from each pilot interview were recorded onto a rep grid matrix template, prepared in advance
of the interviews. (See Pilot Appendix C).
4.4 DATA ANALYSIS
Three types of data analysis were done: cluster analysis, PCA, and a content analysis incorporating
the Honey (1979) method. Results of all three analytic approaches are best thought of as exploratory
and tentative, given the small sample size of the pilot.
The purpose of the cluster analysis is to identify patterns in meaning of the ways in which utilities
managers structure their views about the effects of climate risks on their organization. Cluster analysis
83
determines whether highly correlated constructs in a cluster have a relationship to another construct or
a distinct cluster of constructs.
The purpose of the PCA in the present work is to examine data on proportion of variance accounted
for by the first two components so as to gain a view of the level of cognitive complexity of the grid
interviewees.
The purpose of the Honey (1979) method is to assist in understanding the saliency associated with
‘greatest influence versus weakest influence on risk management’. In the present study, Honey’s
(1979) method facilitates in understanding the views and perceptions which are most similar to the
overall supplied construct of ‘greatest influence versus weakest influence’ (see Section 3.11.4).
4.5 PILOT STUDY RESULTS
The cluster analysis identifies patterns of meaning by computing how constructs and elements group
together. Web grid software produces tree-diagrams showing the relative position of most similar
constructs and separately, most similar elements. Most similar constructs are indicated as a cluster
formation in the dendrogram. ‘Branched’ constructs and branched elements reflect a comparable
percentage of similarity (see Pilot Appendix G).
4.5.1 Content Analysis (Individual)
Participant #1
Pilot Participant #1 (power producer) showed six construct clusters. The first cluster indicates an
identical (100% match) in constructs between proactive management of impacts with preventative
maintenance, and reactive management with ‘fix and restart’ constructs. The second two sub-cluster
associates three constructs with a 95% similarity, and likely reflects the power producer’s perceived
importance of process control, documentation and knowledge. The second sub cluster surround two
constructs with another 95% of similarity, likely revealing the importance of corporate initiative with
business decision making and regulatory compliance issues. The last two clusters at 80% similarity
associate a) specialized skills and endogenous impact, and b) risk governance with investment in
resources (see Pilot Appendix G).
Participant #1 (power producer) perceptions of most similar elements (instances of climate risks) is
also provided for in the cluster analysis. Participant #1 has a high (90% similarity score) association
of organizational resources with organizational capacity. Participant #1 also highly associates though
less so (80%), GHG abatement and emissions control with governmental policy.
84
Participant #2
Participant #2 (utility) clusters around four construct groups. In this case, the first subgroup (97%
similarity) suggest its strong association of external expertise (outside consultants) with macro,
enterprise wide pressures and corporate knowledge with targeted pressures on the organization.
Another sub cluster at 85% similarity shows an association between power producers’ partnerships
and business needs.
Cluster analysis of the elements for Participant #2 showed a similar pattern to Participant #1 (90%
similarity) for associating organizational resources with organizational capacity, albeit at a slightly
weaker (80% similarity) value.
4.5.2 Principal Component Analysis (Individual)
PCA observes patterns of variability or components, with the first (largest) accounting for the largest
variation, and the second and subsequent, increasingly residual degrees of variation. PCA benchmarks
for cognitive complexity are indicated when the largest variance accounts for 50% or more
(Fransella, 2003). (See Pilot Appendix I)
Cognitive complexity suggests that the actuarial variety of issues a person construes of to a topic,
indicates the level of complexity in construing. In other words, the lower the variance accounted for
by the first two principal components, the higher the level of cognitive complexity; it implies that one
needs more distinct components to account for the total variety in thinking (Diaz de Leon and Guild,
2003). Pilot Appendix I shows the PCA maps generated.
Participant #1 (power producer) showed a total percentage of variance in the first two components
combined at 67% while Participant #2 (utility) showed a total percentage of variance in their first two
components at 58.7%, indicating that Participant #2 was likely more cognitively complex.
For Participant #1, it was shown that constructs related to knowledge capture, documentation and
business decisions are closely related to the first component. For Participant #2 constructs related to
technical knowledge and mitigative and adaptive responses, are highly important to the participant.
This may indicate that Participant #2 used more associations of issues when reflecting on the impact
of climate risk on operations.
4.5.3 Content Analysis (Aggregate Analysis)
The constructs of both grids were then analysed and categorized (see Pilot Appendix K). For the pilot,
three categories were derived from the climate change and climate risk literature (Chapter 2) and from
Weinhofer & Busch’s (2013) analytical framework for assessing risk management preparedness
among European utilities (see Section 2.5).
85
While the pilot sample is small and therefore preliminary, the content analysis of two participants
nevertheless provides an example of the approach to be used in the main study. The bootstrapping
technique would be used to capture any additional sub categories in the main study.
Two steps were taken to confirm the reliability of the pilot classification scheme following the
procedure summarized in Section 3.11.5. Separately, classifications were done by the researcher and a
colleague to determine which constructs would be classified according to which of the three branches
of risk management: risk identification; risk assessment and risk response. Criteria for selection was
mutual exclusiveness and saturation. Consensus was reached after discussions, explanations and re-
classifications were done. The reliability check was conducted as a simple index of agreement
Cohen’s kappa (Cohen 1969).
The construct summary provided in Pilot Appendices K and L indicates that Participant #1’s main
constructs are concerned with risk response (69.4%) whereas Participant #2 is more concerned with
risk identification (74%) and marginally less so with risk assessment (72.0%).
Conclusions cannot be based on a pilot sample of two companies, but an illustration of the kinds of
conclusions that might be made if these data were to be reflected in the main study would be along the
following lines: power producers company reflects on issues related to business continuity (84%
similarity) to be of highest priority in their climate risk management. In contrast, the
utilities/transmission company views dynamic change (84% similarity) as being of the greatest
influence on their management of climate risks.
From the classification scheme perspective, the power producer participant shows the relative lowest
concern with risk assessment issues (65.3%) relating to knowledge retention, process control,
planning process, specialized skills, system boundaries and knowledge capture. While the participant
may place business decisions, time horizon considerations, endogenous impacts, risk governance and
business continuity practices in the middle range of importance at 67.6%, her relative concern for risk
assessment issues is only marginally less so, at 65.3% similarity.
4.5.4 Honey (1979) Method
Consistent with Honey method, a supplied construct of ‘greatest influence –weakest influence on risk
management was captured in the pilot in advance of the main study. The supplied construct is to help
indicate ‘the interviewee’s individual stance to the topic as a whole’ (Jankowicz 2004, p 170).
The pilot study indicates, for illustrative purposes, that Participant #1’s (power producer company)
constructs pertaining to business continuity matched highest with her overall construct ratings. For
Participant #2’s (utility company) constructs relating to dynamic change matched highest with his
overall construct ratings (see Pilot Appendix J).
86
4.5.5 Cross Case Analysis
From the 32 constructs elicited in the pilot study, it is noteworthy that the constructs vary widely; no
construct is shared by the participants. While the power producer company participant views the
assessment of climate risk from the perspective of knowledge management, skills, process and
planning control, the utility company participant views climate assessment differently by considering
(in part) issues external to the organization (external consultants, customer expectations and system –
wide reliability).
These pilot results indicate that it is feasible that appreciable differences might be identified between
the main sample power producers’ companies’ and the main sample utilities companies’ constructs.
Looking at elements, both participants group together organizational resources with organizational
capacity (90% power producer; 80% utility) suggesting however, a consistency in views about the
‘two sides of the same coin’ relationship between resources and capacity.
Additionally, the power producer shows a view of GHG abatement and emissions control as being
‘almost equal’ in construal to government policy (90%).
4.6 PILOT STUDY CONCLUSION
The pilot study was designed to test and refine the data collection techniques with special attention to
the RGT. Additionally, the pilot study provided a test sample of the constructs of utilities managers
with respect to the ways in which they view climate impacts and the implications they have on
operational risk management.
The pilot study grid produced 32 constructs related to climate risk management supplied by two
participants. The constructs were grouped into categories identified by the prior work of Weinhofer
and Busch (2011) with a reliability check of 78.12% (final agreement on 25 of 32 constructs). This
resulted in three main categories presented in Pilot Appendices K and L. Next, the content was
analysed using Honey’s (1979) method to identify similarities and differences between power
producers and the utilities constructs of climate risk. The constructs were put in order according to the
matching score between their ratings, and those of the supplied construct ‘greatest versus weakest’
construct.
4.6.1 Achievement of Objectives
The objectives of the pilot study were presented in Section 4.1. Outcomes of the pilot study were as
follows:
1. To assess the relevance of the supplied elements. Both pilot interviewees were asked
if the supplied elements reflected the range of climate impacts relevant to their
87
industry and whether additional instances of climate risk impacts needed adding. Both
interviewees found the supplied elements to be comprehensive and representative.
2. To identify the types of constructs that managers in the electricity sector use to
construe climate risk impacts on their organizations.
Thirty-two unique constructs were elicited in total in the two pilot interviews.
3. To estimate a typical number of elicited constructs for the repertory grid interviews.
Based on pilot results it is anticipated that 15 constructs per interviewee are attainable
for the main study interviews. The number of constructs elicited in the pilot study
suggested that around 20 interviews would be required in the main study to attain the
250 to 300 constructs necessary for a content analysis.
4. To gain proficiency with RGT.
The pilot study provided the opportunity to practice and improve data collection
procedures of the RGT to be used in the main study. This included construct
elicitation and laddering down techniques. Each pilot interview was approximately 75
minutes in duration.
5. To practice cluster, PCA, and content analysis for the pilot participants.
PCA and cluster analysis were done for each pilot interview using WebGrid Plus. The
PCA graph and Cluster analysis charts are provided for in Pilot Appendices G and H.
Content analysis, using Honey method was done manually by the researcher.
4.6.2 Pilot Study Outcomes and Implications
A number of outcomes and implications for the main study became apparent during the pilot study
phase.
4.6.2.1 Evaluation and implications of time constraints (participants)
Due to the time constraints of the pilot interviewees, the researcher concluded that the direct
collection of additional data from the participants was not achievable. Up to this phase of this pilot
study, the researcher had deferred appraising the participants for their willingness to participate in a
second round of data collection by either values elicitation, questionnaire or survey. The researcher
had determined that a second source of empirical data was necessary to obtain a broader and fuller
picture of the phenomenon under study but would reappraise the issue of data access after the first
phase of the pilot was completed. In analysing the pilot data, informal discussions with the pilot
interviewees, the researcher’s own experience as a senior practitioner all suggested that the grid data
of the main study would be greatly enriched by examination of information contained in corporate
climate change/environmental reports.
88
4.6.2.2 Selection of a second data source
The selection of a second data source was done to triangulate findings between the less formal tacit
interview constructs, with the more formal and public expressions of climate risk constructs, derived
from corporate reports. Electrical power companies in Ontario release annual environmental and
sustainability reports either as a stand-alone document or as a designated section in their corporate
annual report. Report content conveys the corporations’ management of environmental issues
including climate change impacts on their operations. It was determined that the environmental report
and not the annual report, would offer richer narratives about how the corporation is managing
climate risks. The 2015 editions of environmental reports were available at the time of the pilot study.
To achieve the research objectives, corporate environmental and sustainability reports of the RGT
grid respondents were therefore established as the second data source for the pilot and the main study
4.6.2.3 Implications for research design
By examining two sets of data by different means and from different sources, a stronger measure of
data triangulation would be achieved. Both techniques support the overall mixed methods approach
where not only the techniques are mixed but also ontological and epistemological orientations are
blended as well (Creswell et al., 2007). The details of the construal of climate risks in two different
data groups can have significant impact on findings that otherwise might remain limited. The rep grid
data can be used as a rich source of data in choosing appropriate categories for the narrative analyses.
Prior work has used a similar approach where ethnographic interviews were used to assist in choosing
grid elements (Dobosz-Bourne, 2004).
4.6.2.4 Implications for research aim
Examining additional empirical data continues to preserve the research aim, expressed as ‘to
understand how Electricity Utilities in Ontario (Canada) view the prospects of climate risk
management in light of increasing climate change impacts, macroeconomic factors and internal
pressures to embed a climate risk mentality within their organizations’ (Section 3.1)
4.6.2.5 Implications for research objectives
Examining additional empirical data continues to preserve the primary research objective and the
subordinate objectives, described in Section 3.2, and provided here.
The primary objective is to identify the way in which the participants construe and make sense of the
direct climate impacts of extreme weather events.
From the above, two subordinate objectives: namely, (a) the development of a category scheme that
describes and enumerates the constructs participants have about the drivers/influences involved, and
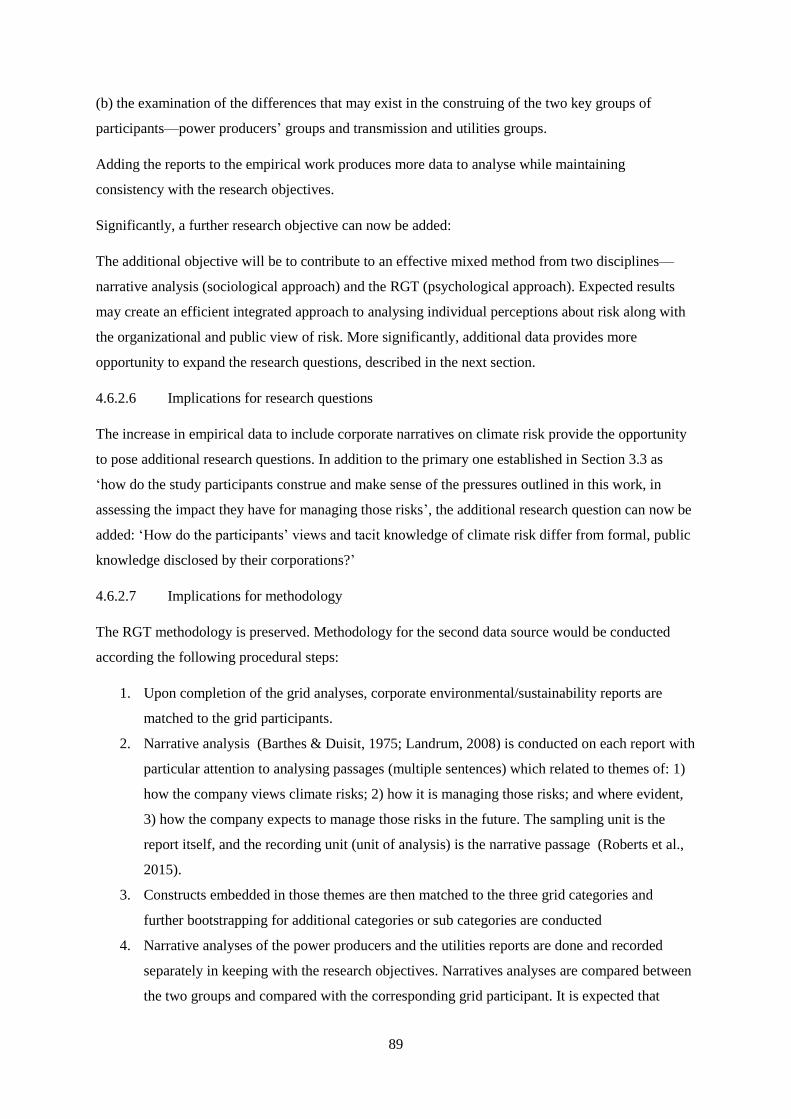
89
(b) the examination of the differences that may exist in the construing of the two key groups of
participants—power producers’ groups and transmission and utilities groups.
Adding the reports to the empirical work produces more data to analyse while maintaining
consistency with the research objectives.
Significantly, a further research objective can now be added:
The additional objective will be to contribute to an effective mixed method from two disciplines—
narrative analysis (sociological approach) and the RGT (psychological approach). Expected results
may create an efficient integrated approach to analysing individual perceptions about risk along with
the organizational and public view of risk. More significantly, additional data provides more
opportunity to expand the research questions, described in the next section.
4.6.2.6 Implications for research questions
The increase in empirical data to include corporate narratives on climate risk provide the opportunity
to pose additional research questions. In addition to the primary one established in Section 3.3 as
‘how do the study participants construe and make sense of the pressures outlined in this work, in
assessing the impact they have for managing those risks’, the additional research question can now be
added: ‘How do the participants’ views and tacit knowledge of climate risk differ from formal, public
knowledge disclosed by their corporations?’
4.6.2.7 Implications for methodology
The RGT methodology is preserved. Methodology for the second data source would be conducted
according the following procedural steps:
1. Upon completion of the grid analyses, corporate environmental/sustainability reports are
matched to the grid participants.
2. Narrative analysis (Barthes & Duisit, 1975; Landrum, 2008) is conducted on each report with
particular attention to analysing passages (multiple sentences) which related to themes of: 1)
how the company views climate risks; 2) how it is managing those risks; and where evident,
3) how the company expects to manage those risks in the future. The sampling unit is the
report itself, and the recording unit (unit of analysis) is the narrative passage (Roberts et al.,
2015).
3. Constructs embedded in those themes are then matched to the three grid categories and
further bootstrapping for additional categories or sub categories are conducted
4. Narrative analyses of the power producers and the utilities reports are done and recorded
separately in keeping with the research objectives. Narratives analyses are compared between
the two groups and compared with the corresponding grid participant. It is expected that
90
differences in climate risk construal may differ from report to grid interview, and from power
producers’ group report to utilities group report.
5. A reliability check on the narrative analyses will be provided through a ‘showing of the
workings’. A sample original text document will appear in the Appendices, illustrating how
the researcher marked up the categories in the sample and tabulated the outcome. The
recording unit and the relevant themes will be underlined and highlighted. (See Appendix O.)
A worked example of the pilot power producers’ company’s narrative analysis is found in Pilot
Appendix N.
4.7 CHAPTER CONCLUSION
This chapter detailed the pilot study objectives, procedures, analysis, results and outcomes of the grid
data collection. Implications of a second data source on research aim, objectives, questions and
methodology were included. Detailed results of the pilot study are found in the Pilot Appendices F, G,
H, I, J, K, L, M, and N. Documents related to ethical conduct are in Pilot Appendices B and C and
letters of support are in Pilot Appendices D and E.
The pilot study provided a preliminary, indicative glimpse of the potential constructs that may well be
identified in the main study.
Details of the main study are found next in Chapters 5 and 6.
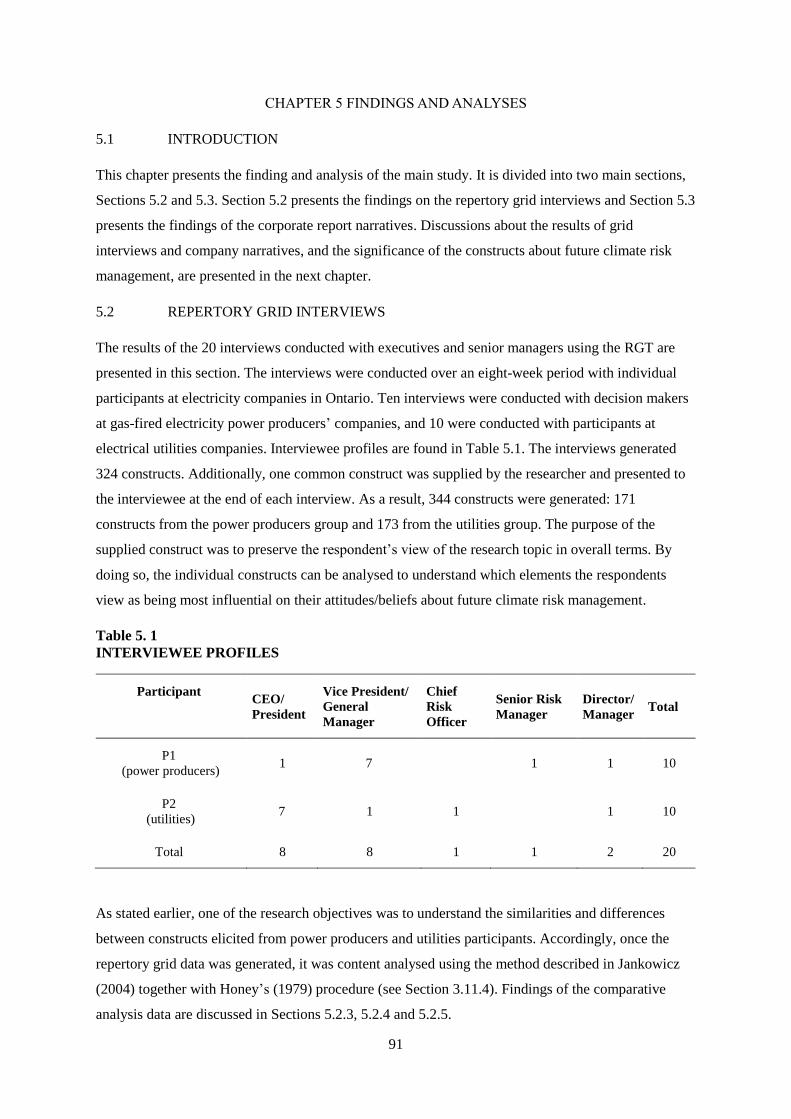
91
CHAPTER 5 FINDINGS AND ANALYSES
5.1 INTRODUCTION
This chapter presents the finding and analysis of the main study. It is divided into two main sections,
Sections 5.2 and 5.3. Section 5.2 presents the findings on the repertory grid interviews and Section 5.3
presents the findings of the corporate report narratives. Discussions about the results of grid
interviews and company narratives, and the significance of the constructs about future climate risk
management, are presented in the next chapter.
5.2 REPERTORY GRID INTERVIEWS
The results of the 20 interviews conducted with executives and senior managers using the RGT are
presented in this section. The interviews were conducted over an eight-week period with individual
participants at electricity companies in Ontario. Ten interviews were conducted with decision makers
at gas-fired electricity power producers’ companies, and 10 were conducted with participants at
electrical utilities companies. Interviewee profiles are found in Table 5.1. The interviews generated
324 constructs. Additionally, one common construct was supplied by the researcher and presented to
the interviewee at the end of each interview. As a result, 344 constructs were generated: 171
constructs from the power producers group and 173 from the utilities group. The purpose of the
supplied construct was to preserve the respondent’s view of the research topic in overall terms. By
doing so, the individual constructs can be analysed to understand which elements the respondents
view as being most influential on their attitudes/beliefs about future climate risk management.
Table 5. 1
INTERVIEWEE PROFILES
Participant CEO/
President
Vice President/
General
Manager
Chief
Risk
Officer
Senior Risk
Manager
Director/
Manager Total
P1
(power producers) 1 7 1 1 10
P2
(utilities) 7 1 1 1 10
Total 8 8 1 1 2 20
As stated earlier, one of the research objectives was to understand the similarities and differences
between constructs elicited from power producers and utilities participants. Accordingly, once the
repertory grid data was generated, it was content analysed using the method described in Jankowicz
(2004) together with Honey’s (1979) procedure (see Section 3.11.4). Findings of the comparative
analysis data are discussed in Sections 5.2.3, 5.2.4 and 5.2.5.
92
5.2.1 Content Analysis
Content analysis on the grid data was done so that the elicited constructs could be grouped and
categorized based on the meanings they express. Content analysis as outlined by Jankowicz (2004)
was used in the analysis furthermore as an aggregation technique. In this work, analysis went beyond
examining the individual descriptions of how each respondent thinks, as provided in the repertory
grids—to a summary of the kinds of meanings (categories) that were more frequent and less frequent
in the sample as a whole. From there, content analysis made it possible to identify the differences in
attitudes and beliefs of the two groups. As discussed in Chapter 3, Honey’s (1979) technique provided
a way of preserving the personal similarity metric, and provided a way of allowing for differences
among personal metrics within this aggregation.
The constructs were analysed and grouped into the original three super categories as set out and tested
in the pilot study. The three super categories reflected the category scheme used by Weinhofer and
Busch (2013). Both the respondent and an independent collaborator agreed on the super categories,
and the constructs assigned to those categories, to an almost perfect match. Given the data load of 344
constructs however, each of the three super categories were disaggregated into eight smaller
categories by the researcher and then a reliability check done on the assignment of constructs to those
categories with an independent colleague. The first comparison of how the researcher and the
independent colleague assigned constructs to each of those eight categories produced an 86.77
percentage agreement. After the second attempt and discussion over category meanings, revisions
resulted in a 97.23 percentage agreement, indicating a high level of agreement (see Appendix Q).
Given the small 2.77% agreement difference, in the final categorization of data used in the subsequent
analysis, the ‘Interviewer’ categorization was used as this is the typical procedure (Jankowicz 2004, p
163) because the researcher designed the study and had more familiarity with the constructs.
Tables 5.2, 5.3, and 5.4 summarize the categorization of the grid data. Table 5.2 presents the risk
management scheme categories used in Weinhofer and Busch (2013) as discussed in Section 2.5.2. It
also presents the frequency count of the constructs allocated to the study category scheme, and the
corresponding percentage of those constructs.
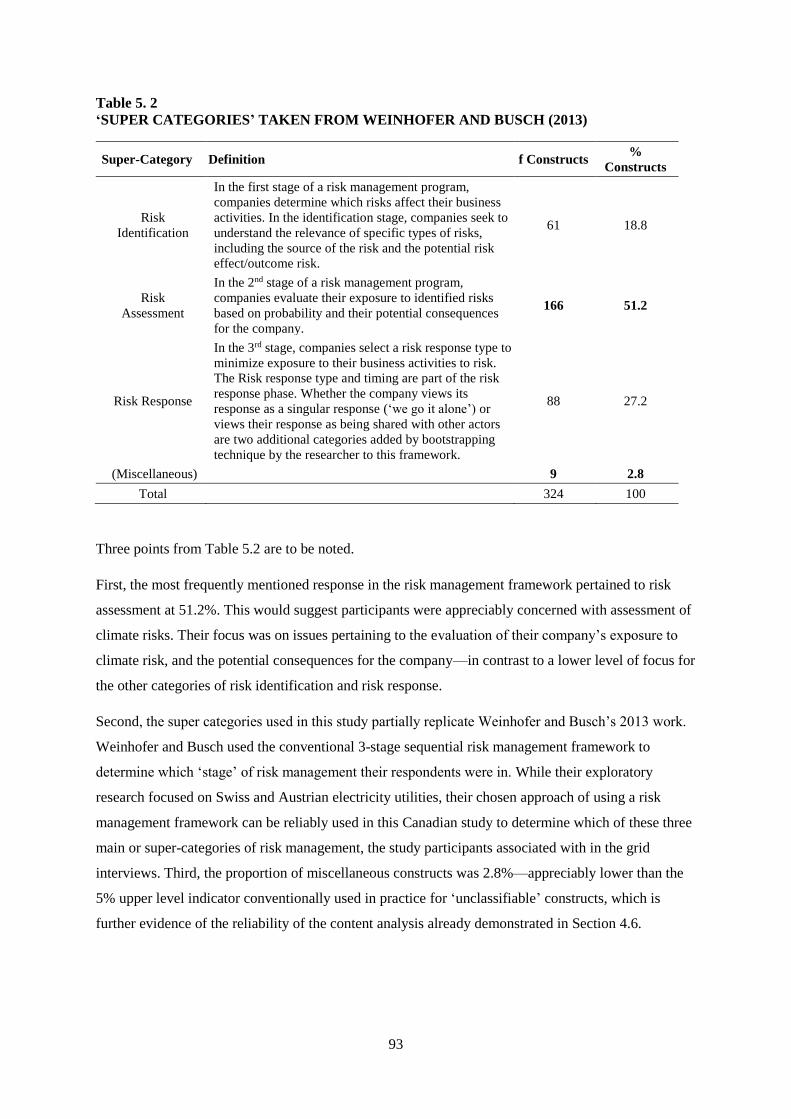
93
Table 5. 2
‘SUPER CATEGORIES’ TAKEN FROM WEINHOFER AND BUSCH (2013)
Super-Category Definition f Constructs %
Constructs
Risk
Identification
In the first stage of a risk management program,
companies determine which risks affect their business
activities. In the identification stage, companies seek to
understand the relevance of specific types of risks,
including the source of the risk and the potential risk
effect/outcome risk.
61 18.8
Risk
Assessment
In the 2nd stage of a risk management program,
companies evaluate their exposure to identified risks
based on probability and their potential consequences
for the company.
166 51.2
Risk Response
In the 3rd stage, companies select a risk response type to
minimize exposure to their business activities to risk.
The Risk response type and timing are part of the risk
response phase. Whether the company views its
response as a singular response (‘we go it alone’) or
views their response as being shared with other actors
are two additional categories added by bootstrapping
technique by the researcher to this framework.
88 27.2
(Miscellaneous) 9 2.8
Total 324 100
Three points from Table 5.2 are to be noted.
First, the most frequently mentioned response in the risk management framework pertained to risk
assessment at 51.2%. This would suggest participants were appreciably concerned with assessment of
climate risks. Their focus was on issues pertaining to the evaluation of their company’s exposure to
climate risk, and the potential consequences for the company—in contrast to a lower level of focus for
the other categories of risk identification and risk response.
Second, the super categories used in this study partially replicate Weinhofer and Busch’s 2013 work.
Weinhofer and Busch used the conventional 3-stage sequential risk management framework to
determine which ‘stage’ of risk management their respondents were in. While their exploratory
research focused on Swiss and Austrian electricity utilities, their chosen approach of using a risk
management framework can be reliably used in this Canadian study to determine which of these three
main or super-categories of risk management, the study participants associated with in the grid
interviews. Third, the proportion of miscellaneous constructs was 2.8%—appreciably lower than the
5% upper level indicator conventionally used in practice for ‘unclassifiable’ constructs, which is
further evidence of the reliability of the content analysis already demonstrated in Section 4.6.
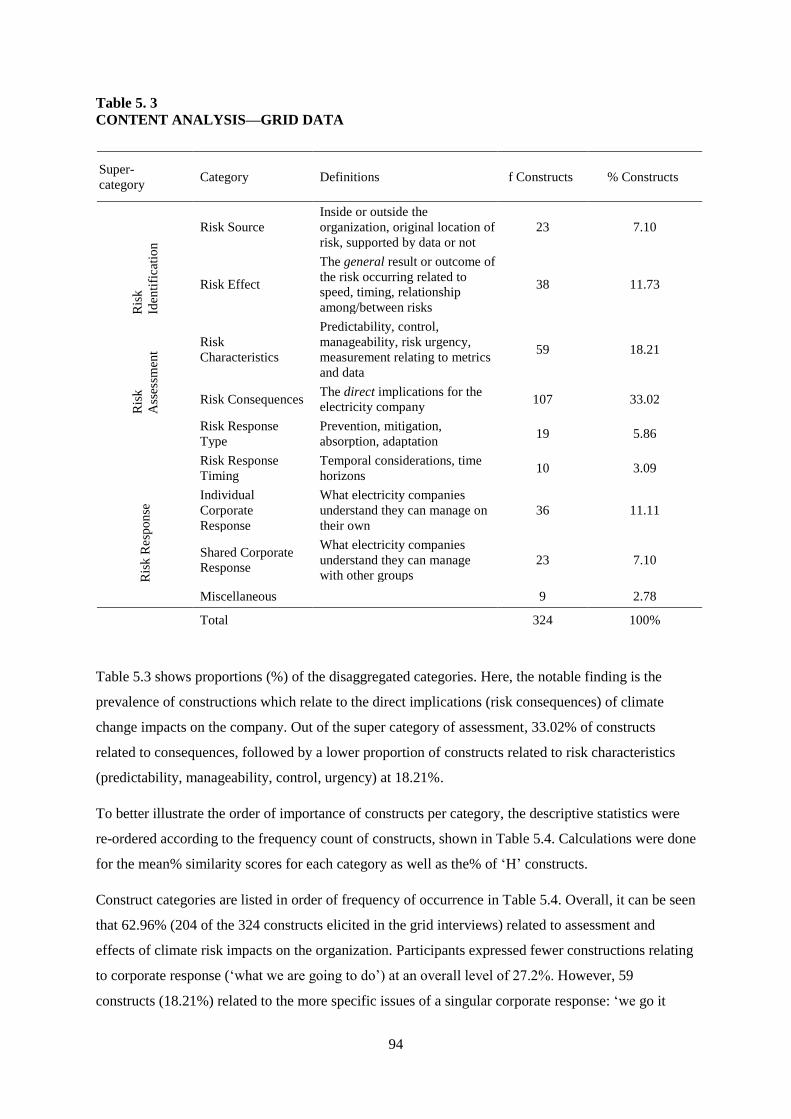
94
Table 5. 3
CONTENT ANALYSIS—GRID DATA
Table 5.3 shows proportions (%) of the disaggregated categories. Here, the notable finding is the
prevalence of constructions which relate to the direct implications (risk consequences) of climate
change impacts on the company. Out of the super category of assessment, 33.02% of constructs
related to consequences, followed by a lower proportion of constructs related to risk characteristics
(predictability, manageability, control, urgency) at 18.21%.
To better illustrate the order of importance of constructs per category, the descriptive statistics were
re-ordered according to the frequency count of constructs, shown in Table 5.4. Calculations were done
for the mean% similarity scores for each category as well as the% of ‘H’ constructs.
Construct categories are listed in order of frequency of occurrence in Table 5.4. Overall, it can be seen
that 62.96% (204 of the 324 constructs elicited in the grid interviews) related to assessment and
effects of climate risk impacts on the organization. Participants expressed fewer constructions relating
to corporate response (‘what we are going to do’) at an overall level of 27.2%. However, 59
constructs (18.21%) related to the more specific issues of a singular corporate response: ‘we go it
Super-
category Category Definitions f Constructs % Constructs
Ris
k
Iden
tifi
cati
on
Risk Source
Inside or outside the
organization, original location of
risk, supported by data or not
23 7.10
Risk Effect
The general result or outcome of
the risk occurring related to
speed, timing, relationship
among/between risks
38 11.73
Ris
k
Ass
essm
ent
Risk
Characteristics
Predictability, control,
manageability, risk urgency,
measurement relating to metrics
and data
59 18.21
Risk Consequences The direct implications for the
electricity company 107 33.02
Ris
k R
esp
on
se
Risk Response
Type
Prevention, mitigation,
absorption, adaptation 19 5.86
Risk Response
Timing
Temporal considerations, time
horizons 10 3.09
Individual
Corporate
Response
What electricity companies
understand they can manage on
their own
36 11.11
Shared Corporate
Response
What electricity companies
understand they can manage
with other groups
23 7.10
Miscellaneous 9 2.78
Total 324 100%

95
alone’; or a shared one: ‘we need to work with other groups’. This would suggest that participants’
thinking about how they will manage or their own or how they will manage with other market actors
is more important to them than the general statements about mitigation and adaption strategies, and
time horizons for implementation.
5.2.2 Categories/Themes
As noted in Sections 2.5 and 5.2.1, the three super categories were disaggregated into eight categories,
enabling refinement in the analysis of meanings of the participants’ grid interview responses. A
summary of the themes and their definitions res represented in Tables 5.3 and 5.4.
It can be noted in Table 5.4 that the mean percentage similarity scores were calculated to demonstrate
what proportion of those construct categories were rated by participants as being of highest personal
value to the topic of climate risk management. Notable here is, while the frequency count of shared
corporate response constructs is relatively low at 7.10 per cent of all constructs, as a category it (the
shared corporate response) was rated almost as high as the dominant construct category.
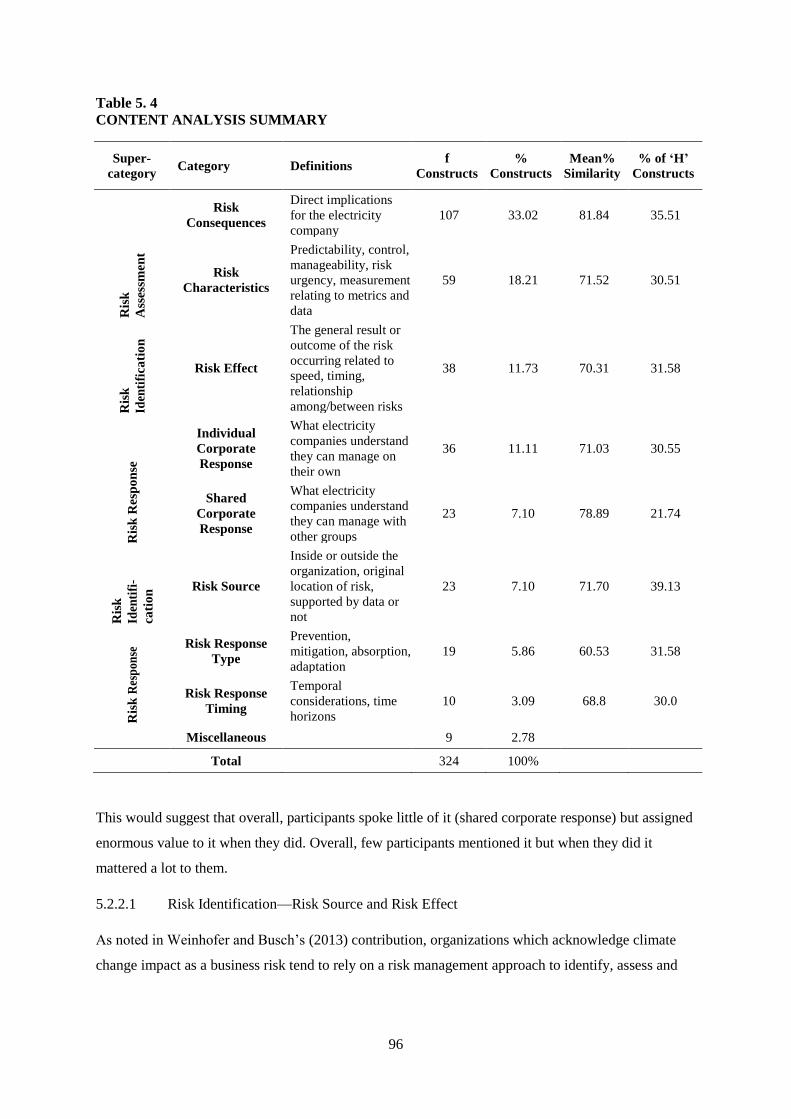
96
Table 5. 4
CONTENT ANALYSIS SUMMARY
Super-
category Category Definitions
f
Constructs
%
Constructs
Mean%
Similarity
% of ‘H’
Constructs
Ris
k
Ass
essm
en
t
Risk
Consequences
Direct implications
for the electricity
company
107 33.02 81.84 35.51
Risk
Characteristics
Predictability, control,
manageability, risk
urgency, measurement
relating to metrics and
data
59 18.21 71.52 30.51
Ris
k
Iden
tifi
cati
on
Risk Effect
The general result or
outcome of the risk
occurring related to
speed, timing,
relationship
among/between risks
38 11.73 70.31 31.58
Ris
k R
esp
on
se
Individual
Corporate
Response
What electricity
companies understand
they can manage on
their own
36 11.11 71.03 30.55
Shared
Corporate
Response
What electricity
companies understand
they can manage with
other groups
23 7.10 78.89 21.74
Ris
k
Iden
tifi
-
cati
on
Risk Source
Inside or outside the
organization, original
location of risk,
supported by data or
not
23 7.10 71.70 39.13
Ris
k R
esp
onse
Risk Response
Type
Prevention,
mitigation, absorption,
adaptation
19 5.86 60.53 31.58
Risk Response
Timing
Temporal
considerations, time
horizons
10 3.09 68.8 30.0
Miscellaneous 9 2.78
Total 324 100%
This would suggest that overall, participants spoke little of it (shared corporate response) but assigned
enormous value to it when they did. Overall, few participants mentioned it but when they did it
mattered a lot to them.
5.2.2.1 Risk Identification—Risk Source and Risk Effect
As noted in Weinhofer and Busch’s (2013) contribution, organizations which acknowledge climate
change impact as a business risk tend to rely on a risk management approach to identify, assess and
97
respond to those risks. Identifying the risk source and the risk effect is a common if not standard
management practice related to the risk identification process (Roberts et al., 2015).
Congruent with that, the researcher disaggregated the risk identification category into categories of
risk source and risk effect. Risk source can be seen as the location or point at which the risks originate
while risk effect is seen as the general result or outcome of the risk occurring. Category data from
Table 5.3 showed 18.8 per cent of the 324 constructs related to risk identification. Out of that, as
shown in Table 5.4, 7.10% of all constructions were about the source of climate risks, while the
general effect or outcome of climate risks represented were 11.73%.
5.2.2.2 Risk Assessment—Risk Characteristics and Risk Consequences
Similarly, the original super category of risk assessment was disaggregated into two: risk
characteristics and risk consequences. Respondent’s constructions about climate risk characteristics
related to how manageable or controllable they believed climate risks were, while their construal
about risk consequences were viewed as the direct implications for the participant’s organization.
Category data showed 51.2 per cent of the 324 constructs related to risk assessment. Out of that 33 per
cent of constructs related to direct consequences for the participant’s company and 18.21% related to
characteristics of the risks themselves (see Table.5.4).
5.2.2.3 Risk Response—Risk Response Type, Timing, and Singular and Shared Corporate
Response
The third super category of risk response was broken down into four refinements: response type,
response timing, singular corporate response and shared corporate response. Themes related to
Response Type included the broad descriptive terms of mitigation, preventative maintenance,
adaptation and fix and re-start constructions. Risk response timing themes were expressed by the
participants as being related to temporal considerations: when or what point in time did they perceive
climate risks appearing and becoming an issue for the organization. Category data showed 27.2 per
cent of the 324 constructs related to risk response.
The final 3rd and 4th categories relating to risk response were divided between what the participants
viewed as a singular corporate response (‘we go it alone’), and as a shared climate risk response
requiring the involvement of other groups, e.g. other grid operators, government, associations. Risk
response constructions relating to a singular corporate response (‘we go it alone’) represented 11.11%
of all constructs, while a shared risk response represented 7.10%.
After disaggregating the super categories (now, the ‘categories’), frequency and percentage data
produced a moderately more detailed picture. As a group, the respondents focussed appreciably on
assessment (51% of all constructs) and this assessment was dominated by the potential direct
consequences for the company (33% of all constructs being in the risk consequences category), rather
98
than characteristics such as predictability and control (18% of all constructs, albeit the second most
frequent category overall). Both categories produced an appreciably high mean per cent similarity
Scores (see Section 3.11.4) with risk consequences producing an 81.8 per cent similarity score and
risk characteristics producing a 71.5 per cent similarity score. Overall, both categories, as well as
being the two more frequent categories overall, produced the highest mean per cent similarity scores
suggesting that these two categories most strongly identify with what the whole topic means for the
participants. Furthermore, corporate aspects of the risk response (singular corporate at 11% and
shared corporate at 7%, dominate over implementation –type risk response, risk type at 6% and risk
timing at 3% (see Table 5.4).
Following the analysis of the findings shown in Tables 5.2, 5.3 and 5.4, it is useful to understand if
the overall results presented are the same in a comparative analysis of both groups. Determining
whether the power producers and utilities respondents differ in category frequencies and proportions,
is in keeping with Yin’s case study approach for analytical generalization (Yin, 2014).
5.2.3 Comparative Analysis
A comparative analysis of both participant groups was done to determine if the same patterns exist in
the same way for each of the two groups. By doing so, the researcher could determine if participant
groups see the different categories as more or less important. The comparative analysis of power
producers and utilities constructs revealed a number of findings. Table 5.5 highlights the
categorization of the constructs.
5.2.4 Comparative Themes
This subsection reports on the findings of two sets of grid data which compare construct
categories/themes between both participant groups.
5.2.4.1 Power producers—Themes
For power producers, the themes with the most constructs were their perceptions about risk
consequences and risk characteristics (36%, 14.91% of all constructs). Both categories are
thematically related to general risk assessment about climate change impacts and therefore would
otherwise suggest power producers were largely focussing on risk assessment issues. The categories
with the fewest constructs for power producers were risk response type and risk response timing
(4.46% and 4.35% of all constructs), suggesting they are relatively less concerned with thinking about
temporal considerations of risks appearing and their understanding of how they will manage climate
risks on their own.
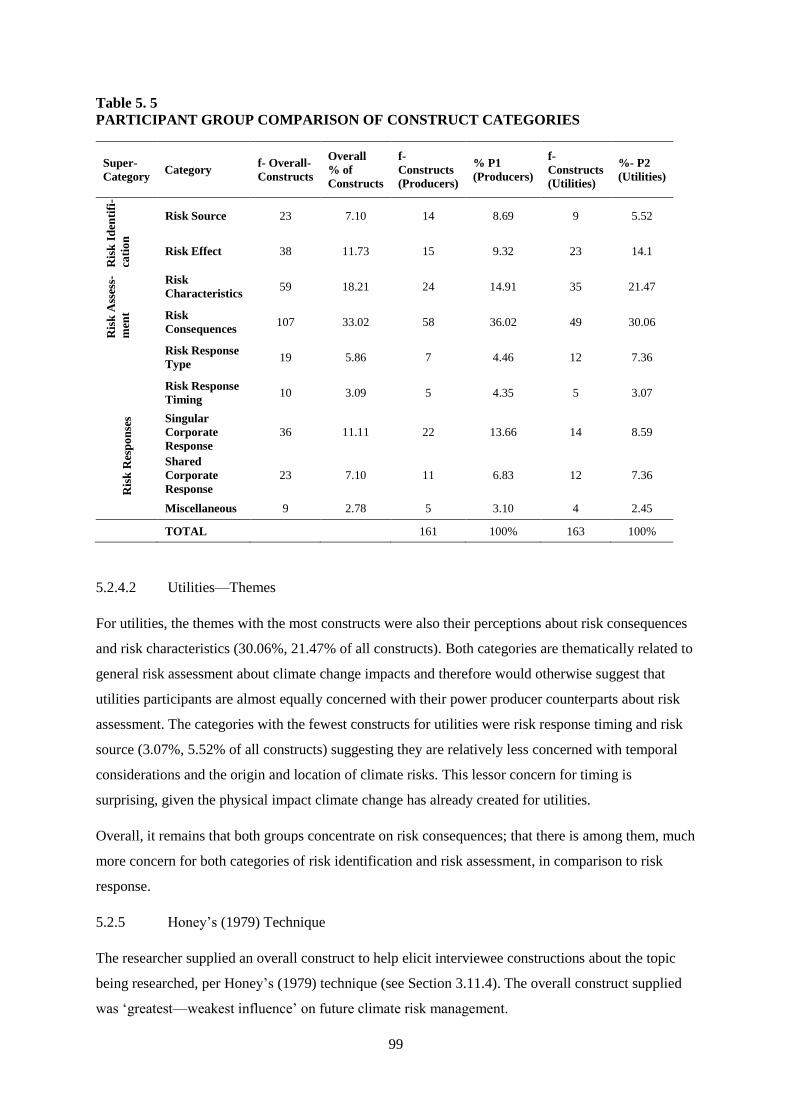
99
Table 5. 5
PARTICIPANT GROUP COMPARISON OF CONSTRUCT CATEGORIES
Super-
Category Category
f- Overall-
Constructs
Overall
% of
Constructs
f-
Constructs
(Producers)
% P1
(Producers)
f-
Constructs
(Utilities)
%- P2
(Utilities)
Ris
k I
den
tifi
-
cati
on
Risk Source 23 7.10 14 8.69 9 5.52
Risk Effect 38 11.73 15 9.32 23 14.1
Ris
k A
sses
s-
men
t
Risk
Characteristics 59 18.21 24 14.91 35 21.47
Risk
Consequences 107 33.02 58 36.02 49 30.06
Ris
k R
esp
on
ses
Risk Response
Type 19 5.86 7 4.46 12 7.36
Risk Response
Timing 10 3.09 5 4.35 5 3.07
Singular
Corporate
Response 36 11.11 22 13.66 14 8.59
Shared
Corporate
Response 23 7.10 11 6.83 12 7.36
Miscellaneous 9 2.78 5 3.10 4 2.45
TOTAL 161 100% 163 100%
5.2.4.2 Utilities—Themes
For utilities, the themes with the most constructs were also their perceptions about risk consequences
and risk characteristics (30.06%, 21.47% of all constructs). Both categories are thematically related to
general risk assessment about climate change impacts and therefore would otherwise suggest that
utilities participants are almost equally concerned with their power producer counterparts about risk
assessment. The categories with the fewest constructs for utilities were risk response timing and risk
source (3.07%, 5.52% of all constructs) suggesting they are relatively less concerned with temporal
considerations and the origin and location of climate risks. This lessor concern for timing is
surprising, given the physical impact climate change has already created for utilities.
Overall, it remains that both groups concentrate on risk consequences; that there is among them, much
more concern for both categories of risk identification and risk assessment, in comparison to risk
response.
5.2.5 Honey’s (1979) Technique
The researcher supplied an overall construct to help elicit interviewee constructions about the topic
being researched, per Honey’s (1979) technique (see Section 3.11.4). The overall construct supplied
was ‘greatest—weakest influence’ on future climate risk management.
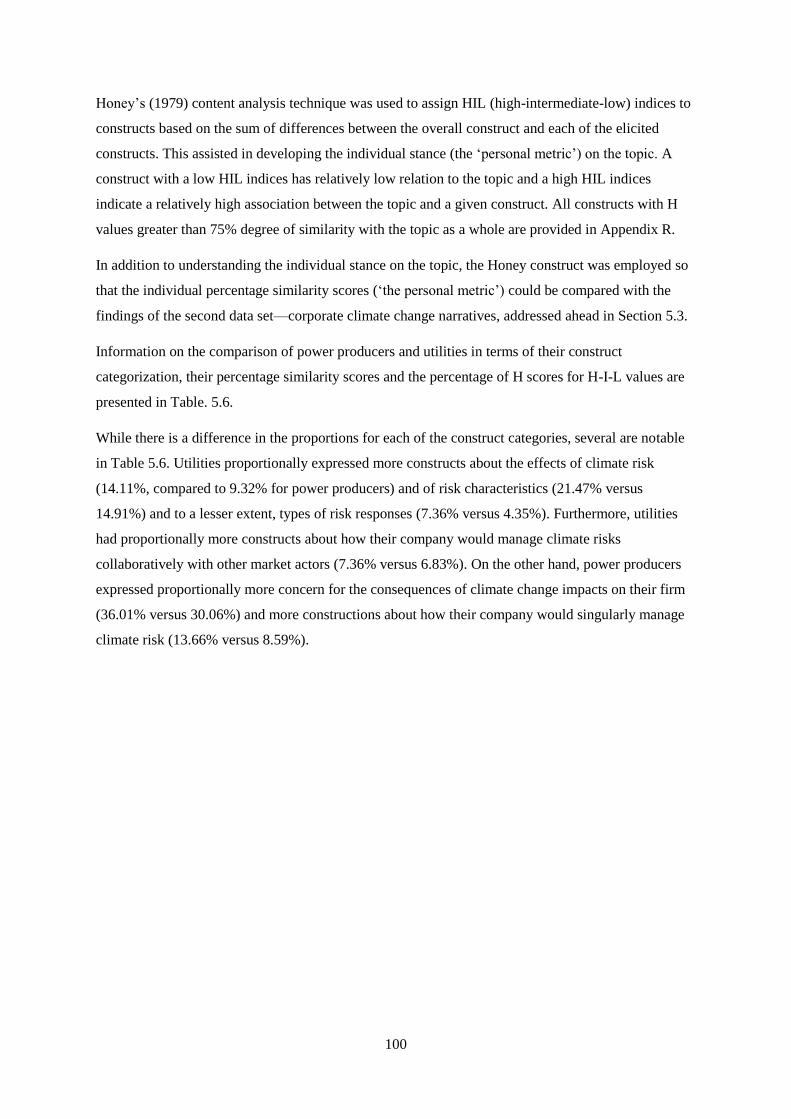
100
Honey’s (1979) content analysis technique was used to assign HIL (high-intermediate-low) indices to
constructs based on the sum of differences between the overall construct and each of the elicited
constructs. This assisted in developing the individual stance (the ‘personal metric’) on the topic. A
construct with a low HIL indices has relatively low relation to the topic and a high HIL indices
indicate a relatively high association between the topic and a given construct. All constructs with H
values greater than 75% degree of similarity with the topic as a whole are provided in Appendix R.
In addition to understanding the individual stance on the topic, the Honey construct was employed so
that the individual percentage similarity scores (‘the personal metric’) could be compared with the
findings of the second data set—corporate climate change narratives, addressed ahead in Section 5.3.
Information on the comparison of power producers and utilities in terms of their construct
categorization, their percentage similarity scores and the percentage of H scores for H-I-L values are
presented in Table. 5.6.
While there is a difference in the proportions for each of the construct categories, several are notable
in Table 5.6. Utilities proportionally expressed more constructs about the effects of climate risk
(14.11%, compared to 9.32% for power producers) and of risk characteristics (21.47% versus
14.91%) and to a lesser extent, types of risk responses (7.36% versus 4.35%). Furthermore, utilities
had proportionally more constructs about how their company would manage climate risks
collaboratively with other market actors (7.36% versus 6.83%). On the other hand, power producers
expressed proportionally more concern for the consequences of climate change impacts on their firm
(36.01% versus 30.06%) and more constructions about how their company would singularly manage
climate risk (13.66% versus 8.59%).
101
Table 5. 6
POWER PRODUCERS AND UTILITIES—PARTICIPANT GROUP CATEGORIZATION
DETAILS
POWER PRODUCERS UTILITIES
Category f constructs % of
constructs
Mean%
similarity
score
% scores w
H values f
constructs % of
constructs
Mean%
similarity
score
% scores w
H values
Risk source 14 8.69 70.36 28.57 9 5.52 74.11 55.55
Risk effect 15 9.32 67.33 13.33 23 14.11 72.26 43.48
Risk characteristics 24 14.91 74.0 25.0 35 21.47 69.83 34.28
Risk consequences 58 36.01 66.64 36.21 49 30.06 70.39 34.69
Risk response type 7 4.35 69.28 57.19 12 7.36 55.42 16.67
Risk response timing 5 3.10 68.6 20.00 5 3.07 69.00 20.0
Singular corporate
response 22 13.66 72.32 27.27 14 8.59 69.00 35.71
Shared corporate
response 11 6.83 74.91 27.27 12 7.36 65.93 16.66
Miscellaneous 5 3.10 63.20 60.0 4 2.45 79.00 50.0
TOTAL 161 100% 163 100%
While proportional differences between the two groups in the mean percentage similarity scores were
not appreciably different, the difference in percentage scores with H values presents a different
picture.
High (H) values were assigned to the highest one third of similarity scores and represented the
constructs which were deemed personally most important to the participant. As such, the percentage
scores of H value constructs produce a picture of more striking differences between the two groups.
Power producers deemed personally more important constructions about various types of risk
response they envisioned (57.19% versus 16.67%). This may suggest that power producers have a
more developed or concretized view of the issues driving their climate risk responses. Of less
proportion in terms of personal importance, power producers deemed that the consequences of climate
risk for their organizations was marginally higher than how utilities viewed the matter (36.21% versus
34.69%). This may suggest a sense of relative urgency that their utilities counterparts may or may not
have. Constructions they made about sharing the risk of climate change impacts with other market
actors (27.27% versus 16.66%) they deemed as being personally important in the overall topic of
climate risk management. This may suggest that power producers think proportionally more about
shared corporate responses that include other market actors, than their utilities counterparts.
5.2.6 Element Analysis, Using Honey’s Technique
The above sections dealt with the findings pertaining to how the participants made sense of the
influence of climate drivers (the elements) on their and anticipated future climate risk management
plans. The study is also concerned with how the participants view the relative importance of the
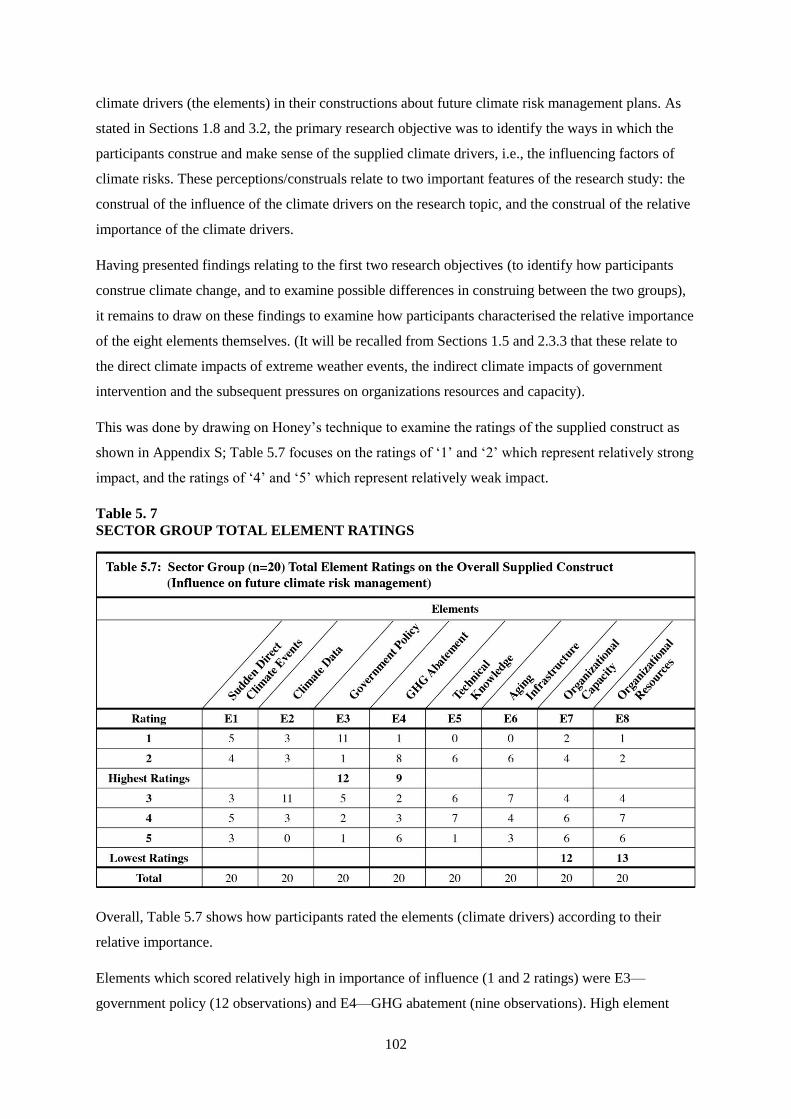
102
climate drivers (the elements) in their constructions about future climate risk management plans. As
stated in Sections 1.8 and 3.2, the primary research objective was to identify the ways in which the
participants construe and make sense of the supplied climate drivers, i.e., the influencing factors of
climate risks. These perceptions/construals relate to two important features of the research study: the
construal of the influence of the climate drivers on the research topic, and the construal of the relative
importance of the climate drivers.
Having presented findings relating to the first two research objectives (to identify how participants
construe climate change, and to examine possible differences in construing between the two groups),
it remains to draw on these findings to examine how participants characterised the relative importance
of the eight elements themselves. (It will be recalled from Sections 1.5 and 2.3.3 that these relate to
the direct climate impacts of extreme weather events, the indirect climate impacts of government
intervention and the subsequent pressures on organizations resources and capacity).
This was done by drawing on Honey’s technique to examine the ratings of the supplied construct as
shown in Appendix S; Table 5.7 focuses on the ratings of ‘1’ and ‘2’ which represent relatively strong
impact, and the ratings of ‘4’ and ‘5’ which represent relatively weak impact.
Table 5. 7
SECTOR GROUP TOTAL ELEMENT RATINGS
Overall, Table 5.7 shows how participants rated the elements (climate drivers) according to their
relative importance.
Elements which scored relatively high in importance of influence (1 and 2 ratings) were E3—
government policy (12 observations) and E4—GHG abatement (nine observations). High element
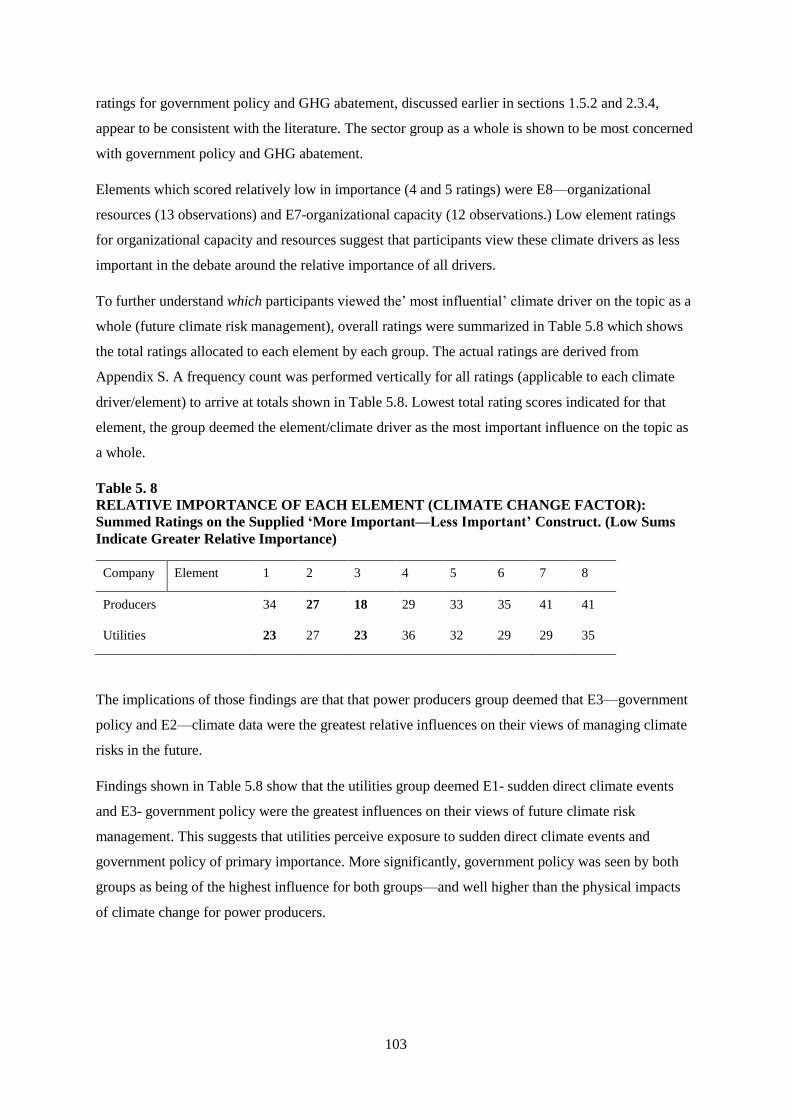
103
ratings for government policy and GHG abatement, discussed earlier in sections 1.5.2 and 2.3.4,
appear to be consistent with the literature. The sector group as a whole is shown to be most concerned
with government policy and GHG abatement.
Elements which scored relatively low in importance (4 and 5 ratings) were E8—organizational
resources (13 observations) and E7-organizational capacity (12 observations.) Low element ratings
for organizational capacity and resources suggest that participants view these climate drivers as less
important in the debate around the relative importance of all drivers.
To further understand which participants viewed the’ most influential’ climate driver on the topic as a
whole (future climate risk management), overall ratings were summarized in Table 5.8 which shows
the total ratings allocated to each element by each group. The actual ratings are derived from
Appendix S. A frequency count was performed vertically for all ratings (applicable to each climate
driver/element) to arrive at totals shown in Table 5.8. Lowest total rating scores indicated for that
element, the group deemed the element/climate driver as the most important influence on the topic as
a whole.
Table 5. 8
RELATIVE IMPORTANCE OF EACH ELEMENT (CLIMATE CHANGE FACTOR):
Summed Ratings on the Supplied ‘More Important—Less Important’ Construct. (Low Sums
Indicate Greater Relative Importance)
Company Element 1 2 3 4 5 6 7 8
Producers 34 27 18 29 33 35 41 41
Utilities 23 27 23 36 32 29 29 35
The implications of those findings are that that power producers group deemed that E3—government
policy and E2—climate data were the greatest relative influences on their views of managing climate
risks in the future.
Findings shown in Table 5.8 show that the utilities group deemed E1- sudden direct climate events
and E3- government policy were the greatest influences on their views of future climate risk
management. This suggests that utilities perceive exposure to sudden direct climate events and
government policy of primary importance. More significantly, government policy was seen by both
groups as being of the highest influence for both groups—and well higher than the physical impacts
of climate change for power producers.
104
5.2.7 Summary of Findings Related to Grid Data
5.2.7.1 Overall Findings
The first emergent finding from the grid data showed that both groups overall are much more
concerned with the ‘assessment’ of climate risks than any other construct category. 166 out of 324
constructs related to either the direct consequences of climate change impacts on their organization or
to the characteristics of climate risks as they viewed them, eclipsing all other categories including
response constructs, or the more formative risk management phase of risk identification constructs.
The second emergent finding showed that out of the general category of assessment, participants in
both groups are most concerned with the implications/consequences of climate change impacts for
their organization. This would suggest an operational, ‘on the ground’ view of risk management,
devoid of longer term strategic intention but most concerned with reaction and ‘what will happen
next’.
The third emergent finding showed a prevalence of constructs about singular and shared corporate
responses produced in the risk response theme for both groups. This would suggest that climate risk
management is construed not simply in terms of a corporate response taken by the organization alone,
but within the wider context provided by other sector groups and constituents beyond the immediate
organization.
The fourth emergent finding showed that overall, power producers and utilities don’t differ in their
perception of the relative importance of construct categories.
The fifth emergent finding is that they do differ partially in their views about the relative importance
of climate drivers. Comparative findings are discussed next.
5.2.7.2 Comparative Findings
Comparatively, there were additionally a number of findings which suggest that the two groups have
different views on climate risk management, in several areas:
1. Utilities expressed proportionally more constructs about the effects of climate risk than power
producers.
2. Utilities expressed proportionally more constructs about the manageability of risk and other
characteristics than power producers.
3. Utilities had proportionally more constructions about how their company would manage
climate risks collaboratively with other market actors.
4. On the other hand, power producers expressed proportionally more concern for the direct
consequences of climate change impacts on their firm.
105
5. Power producers produced more constructions about how their company would singularly
manage climate risk.
Where constructs were rated as personally more important to the overall topic of climate risk
management, more findings emerged from the Honey analysis (see Sections 5.2.5 and 5.2.6):
1. Power producers tended to rate corporate response as personally more important compared to
Utilities, suggesting a relative difference in the way power producers view the importance of
responding to climate risks.
2. Power producers also rated ‘shared corporate response’—the sharing of corporate responses
with other market actors- as personally more important, suggesting that power producers have
a broader view of market and stakeholder alliances as being part of an overall climate risk
response in the electricity sector.
3. Power producers and utilities both deemed government policy as a climate driver, as having
the greatest influence on their views of how they would expect to manage climate risks in the
future.
4. Despite their shared view of government policy as having high relevance for their views on
future climate risk management, producers and utilities differed in their views regarding the
relative importance of the physical manifestation of climate change (E1) and of climate data
(E2). There, producers deemed climate data is having the second highest influence of future
climate action while utilities rated sudden direct climate events as being equally important as
government policy.
The main findings and analysis using the repertory grid methods have been shown and quantified
above. The analyses included content analysis, Honey’s technique and an element analysis, using
Honey’s technique. All three analyses have been applied to the case study group as a whole, and to
each of the two groups, for a comparative analysis of similarities and differences. Discussed next, are
the findings and analyses pertaining to corporate report narrative of the same 20 participant
organizations.
5.3 CORPORATE REPORT NARRATIVES
The second phase of the empirical work was an analysis of published corporate statements (narrative
statements) about climate risks made by the sector group. Comparing the more explicit and public
narrative statements with the less formal tacit expressions of climate risk construals was done to
produce more findings and insight and to improve the overall credibility of the empirical work.
5.3.1 Introduction
As indicated in Section 4.5.2, the 2015 corporate reports of the participants’ companies were
examined by narrative analysis in the ethnographic tradition to determine the triangulation effect of
construct categories and elements (climate drivers) established in the grid data. This mixed methods
106
approach facilitates the comparison of’ private perception’ of the grid data with the more ‘public
expression’ of corporate reporting. By doing so, insights are expected to emerge into how the sector
construes of future climate risk management. Corporate reporting standards mandate accurate and
timely discussion of operational and financial performance, including the company’s risk
management context in which their financial results were achieved. With respect to this research
study, of particular concern in corporate reporting are the risks the company believes are associated
with climate change. How the sector participants construed of climate risks in the more public domain
of corporate reporting, is key to the triangulation of constructs in this work. Furthermore, how the
participants’ reports discuss climate change impacts in terms of risk identification, risk assessment
and risk response categories will help to understand the relative strength of the triangulation effect.
5.3.2 Narrative Analysis
In keeping with Yin’s (2014) case study approach and the use of replication logic to help improve
generalizability to the Ontario population, the following four steps were conducted to systematically
evaluate the climate risk content in the corporate reports: a) development of the list of source
documents (corporate reports) for the sector participants; b) development of the identification of
‘narrative statements’ about climate risks the company construes; and c) development of the
triangulation scheme for construct categories and elements. The results are provided for in Appendix
T. Each stage of how Appendix T was assembled is discussed below in more detail.
5.3.2.1 Step 1—Source Documents
In the first step, a web search was conducted to retrieve all 2015 annual public disclosure documents
of the participants. Four types of public reporting documents were reviewed for the group as a whole:
2015 annual financial reports, 2015 environmental reports, 2015 municipal financial reports, and 2015
regulatory (OEB) reports.
For the 10 power producers, only annual financial and environmental reports were available. For the
10 utilities, annual municipal reports and annual regulatory reports were only available. There was
one instance of a utility producing an extended sustainability report on climate change impacts.
5.3.2.2 Step 2— Narrative Statements
The researcher manually scanned each of the corporate documents named above for statements made
about climate change impacts and climate risk. Particular attention was given to how the company
described climate risk, if at all, in the risk disclosure section of corporate annual financial reports and
municipal annual financial reports. As shown in Appendix T, each statement was recorded as a direct
quotation with the corresponding participant code and the page location in the company’s report. The
risk management construct categories as well as elements/climate drivers were allocated to the
107
narrative statement by the researcher. To provide more dimensionality, any related issues mentioned
in the narrative statement were noted and manually coded as a related issue.
5.3.2.3 Step 3—Triangulation Scheme
A triangulation scheme was established to show how, if at all, construct categories and elements
(climate drivers) established in the grid data are reflected in corporate narrative statements. For
example, turning to Appendix T, the statement ‘The Corporation has identified climate change
adaptation and extreme weather as a strategic risk for the company’ was made by Participant #1.1 and
pertains to risk effect (construct category) where ‘sudden direct climate events’ is noted as the
element (climate driver) and is expressed and seen by the company as an issue for corporate strategy
(related issue). Further examples of the triangulation effect are provided in Section 5.3.3.
While all narrative statements made in the reports are contained in Appendix T, a representative
selection of quotations was chosen which reflected the most diverse and most detailed statements
pertaining to the construct categories and the climate drivers used in the grid data.
5.3.2.4 Step 4—Pattern Recognition and Explanation Building
Explanation building is a form of triangulation which goes beyond confirming, in this research, the
exemplification of construct categories and looks at what else is being said, related to the construct
categories. The point here is that an explanation is not necessarily proved to be valid when the
explanation is shown to be consistent with data; but rather, that it accounts for all the data, and that
there are no additional data that might contradict the explanation and suggest some alternative
explanation.
It is important to note that all of the corporate statements about climate risks are in fact exemplified in
the grid construct categories. This suggests that each and every corporate statement corresponded with
risk identification, risk assessment or risk response constructs. Climate drivers established in the pilot
study and supported by literature are also exemplified in the corporate narrative data. Both construct
categories and climate drivers assigned to corporate statements are found in Appendix T. Alongside
constructs and drivers are noted the related issues implied or stated in the corporate statement. The
related issue may indicate additional meanings the participants attribute to the construct, or to the
climate driver. P1.4’s statement is one example:
Our business is subject to various risks and include without limitation, the effects of
weather, which affect demand for electricity and fuel as well as operating conditions;
risk beyond our control, including but not limited to natural disasters or other
catastrophic events; the impact of significant energy, environmental and other
regulations on our projects.
108
In this case, energy demand, is an additional construct which the sector participant is construing of as
a future climate risk- related to risk assessment. The relevance of additional constructs is discussed
ahead in Section 5.3.3.1
5.3.3. Triangulation of Data
A careful inspection of the narrative statements presented in Appendix T showed three distinctions:
1. The narrative statements of participants 1.1 and 1.10 (power producers) are identical since
both power producers are owned by the same corporation. Thusly, narrative statements made
by the parent corporation were allocated to both participants.
2. 50% of utility reports contained a standardized statement on ’weather’ risks, in the ‘voice’ of
and prepared by the Ontario regulator (OEB). The narrative statements indicated in Appendix
T were supplied as the ‘Note to Reader of 2015 Scorecard MD&A’ in five out of the 10
utilities reports.
3. A systematic search for the following terms was done: ‘climate change’, ‘climate risk’,
‘climate data’, ‘government policy’, ‘emmissions’, ‘aging infrastructure’.
The sum of all corporate narrative statements found in corporate reports are included in Appendix T.
Based on Appendix T, the triangulation effect of the narrative data was shown in the risk management
construct categories and elements (climate drivers) in the following examples. Triangulation of
construct categories is discussed first, followed by triangulation of element categories. Finally,
narrative data are examined that pertain to one particular issue: the balance of singular and shared
concerns relating to corporate risk response.
As shown below, construct categories in some instances are combined where the narrative statements
bundled references to multiple constructs. Examples of quotations are provided in descending order of
construct prevalence in the narrative data.
5.3.3.1 Constructs Triangulation
Construct category—risk consequences (direct)
To date the company has not experienced impacts attributable to climate change but it
is recognized that efforts are required to assess the short and long-term risks and to
monitor for developments in climate science, adaptation activities and potential
changes to policy and regulatory requirements. (Power producer, page 22, 2015
Environmental Report)
The generation group’s thermal Energy Division uses natural gas and oil, and produces
exhaust gases which if not properly treated and monitored could cause hazardous
chemicals to be released into the atmosphere. The units could be restricted from
purchasing gas/oil due to either shortages or pollution levels, which could hamper
output of the facility. (Power producer, page 62, 2015 Environmental Report)
109
As a result of more favorable conditions brought on by climate change, the rates of
vegetation and tree growth have increased. This increase, in turn, increases the potential
risk to reliability and safety. In terms of the health of the trees, there are limits to the
amount of foliage that can be removed without having a negative impact. (Utility, page
37, 2015 Sustainability Report)
The above quotations indicate how the companies construe of the specific and direct effects of climate
impacts on their organization.
Construct category—risk source, risk consequences
Climate change is a risk relating to the external environment. In the short term, climate
phenomena will have an impact on energy power producers as well as on demand for
electricity. In the longer term, climate change could have a broader impact on the
company’s activities: changing energy needs, CO2 emissions reduction, etc. (Power
producer, page 21, 2015 Integrated Annual Report)
The effects of weather and climate change may adversely impact our business, results
of operations and financial condition. Our operations are affected by weather
conditions which directly influence the demand for electricity. Temperatures above
normal levels in the summer tend to increased summer cooling electricity demand and
revenues. Conversely, moderate temperatures in winter tend to increase winter heating
electricity demand and revenues. To the extent that weather is warmer in the summer
or colder in the winter than assumed, we may require greater resources to meet our
contractual commitments. These conditions which cannot be accurately predicted, may
have an adverse effect on our business results of operations and financial condition by
causing us to seek additional capacity at a time when wholesale markets are tight or to
seek to sell excess capacity at a time when markets are weak. (Power producer, page
27, 2015 Annual Information Report)
The company’s facilities and projects are exposed to the elements such as wind, water
and are also susceptible to weather and other natural events such as hurricanes
tornadoes lightning storms and icing events that can cause construction delays. Natural
events may also make it impossible for operations and maintenance crews to access the
disabled equipment. (Utility, page 42, 2015 Annual Report)
These quotations combine risk source with risk consequences, providing a more detailed explanation
of how the company attributes the risk consequence to the risk source.
Construct category—risk effect (general)
Unusual or unpredictable weather has the potential to damage electricity power
producers and transmission infrastructure. (Power producer, page 22, 2015
Environmental Report)
The corporation has identified climate change adaptation and extreme weather as a
strategic risk for the company. (Power producer, page 22, 2015 Environmental Report)
The information provided by Utilities on their future performance (or what can be
construed as forward-looking information) may be subject to a number of risks,
uncertainties and other factors that may cause actual events, conditions or results to
differ materially from historical results or those contemplated by the distributor
regarding their future importance. (Utility, page 19, 2015 Regulatory Report)
110
The above quotations show in effect how the company construes of the general effect of climate
impacts on their organization.
Construct category—singular corporate response
We have incident, emergency and crisis management systems to ensure an effective
response to minimize further loss or injuries and to enhance our ability to resume
operations. We also have a business continuity program that determines critical
business processes and develops resumption plans to ensure process continuity. We
have comprehensive insurance to mitigate certain of these risks, but insurance does not
cover all events in all circumstances. (Power producer, page 94, 2015 Annual Report)
The increased demand on our system due to climate change (i.e. the increase in the
number and duration of peak demand days and severe storms) is mitigated by the robust
infrastructure that our capital reinvestment strategy has created. (Utility, page 36, 2015
Sustainability Report)
The corporation began a review of the emergency flood plan and embarked upon the
challenge of describing the requirements of an off-site business continuity location
within the city. (Utility, page 37, 2015 Sustainability Report)
The above quotations are statements reflecting how risks will be handled within the organization
context.
Construct category—shared corporate response
The corporation is an integral community partner and maintains active membership in
the City’s Advisory Committee on the Environment. The Sub Committee on Energy,
Community Energy Action Plan. (Utility, page 37, 2015 Sustainability Report)
The utilities and the town have implemented Business Continuity Management to
ensure critical services and functions are maintained in the event of an interruption or
emergency. (Utility, page 76, 2015 Municipal Annual Financial Report)
The above quotations suggest the corporation is either already working with outside groups e.g. the
local municipality in determining a course of action on climate change. The triangulation effect of
elements (climate drivers) is discussed next. Examples of narrative statements referencing climate
drivers are provided to illustrate how the company frames climate drivers in its corporate narrative
statements.
5.3.3.2 Elements Triangulation
Element/climate driver—government policy:
To date, the company has not experienced impacts attributable to climate change but it
is recognized that efforts are required to assess the short and long term risks and to
monitor for developments in climate science, adaptation activities and potential
changes to policy and regulatory requirements. (Power producer, page 22, 2015
Environmental Report)
111
Material risk factors include the effects of changes in environmental and other laws and
regulatory policy applicable to the energy and utilities sector. (Power producer, page
15, 2015 Annual Report)
As power markets evolve across North America, there is the potential for regulatory
bodies to implement new rules that could negatively affect us as a generator. These
may be in the form of market rule changes, changes in the interpretation and application
of market rules by regulators, price caps, emissions controls, emissions costs, cost
allocations to Power producers and out of market actions taken by others to build excess
power producers, all of which negatively affect the price of power or capacity, or both.
(Power producer, page 77, 2015 Annual Report)
For the last several decades, the greenhouse effect and its influence on climate change
has caused environmental concern… Should any legislation related to GHG regulation
impose any costs on the corporation, certain of its facilities may not be able to recover
some or all of such costs under its power purchasing agreement, which would result in
reduced cash flow and asset impairments upon implementation. (Power producer, page
43, 2015 Annual Report)
The above quotations provide a variety of statements about how the corporation views government
policy as a source of material risk for the company.
Element/climate driver—sudden, direct climate events:
Significant changes in temperature and other weather events have many effects on our
business, ranging from the impact on demand, availability and commodity prices, to
efficiency and output capability. (Power producer, page 77, 2015 Annual Report)
Extreme weather can affect market demand for power and natural gas and can lead to
significant price volatility. (Power producer, page 77, 2015 Annual Report)
Business interruption is the highest operational risk we face. Operational risks,
including labor disputes, equipment malfunctions or breakdowns, acts of terror or
natural disasters and other catastrophic events. (Power producer, page 77, 2015 Annual
Report)
Changes in precipitation patterns, water temperatures, and ambient air temperatures
can impact the availability of water resources, which could affect power production at
the thermal facility. (Power producer, page 22, 2015 Environmental Report)
The frequency and intensity of extreme weather, as opposed to the changing climate,
is the greater concern for the electricity sector. (Power producer, page 22, 2015
Environmental Report)
The above quotations provide examples of a variety of narrative statements pertaining to the physical
manifestation of climate change, noted in some cases as ‘extreme weather’ and in others as ‘changes
in precipitation patterns’.
Element/climate driver—climate data:
To better prepare for the potential impacts of climate change, the City collaborated with
the University of Western Ontario’s Department of Civil and Environmental
Engineering to analyze changes in rainfall intensity, duration and frequency. Results
112
indicated that the frequency and intensity of rainfall in the area has increased since
1965 and is likely to increase with the onset of climate change. (Utility, page 37, 2015
Sustainability Report)
As a result of more favorable conditions brought on by climate change, the rates of
vegetation and tree growth have increased. This increase, in turn, increases the potential
risk to reliability and safety. In terms of the health of the trees, there are limits to the
amount of foliage that can be removed without having a negative impact. (Utility, page
37, 2015 Sustainability Report)
The above quotations reveal a concern with climate data as a source of risk for the corporation. The
effect of climate data to inform how the company addresses climate risks is shown as data collection
initiatives in the first instance, and as the use of data to measure vegetation and tree growth—which
for utilities creates hazards for transmission lines.
Element/climate driver—aging infrastructure:
Unusual or unpredictable weather has the potential to damage electricity power
producers and transmission infrastructure. (Power producer, page 22, 2015
Environmental Report)
Aging utilities infrastructure continues to be a challenge for many utilities today. Like
most utilities in Ontario, the company must replace aging infrastructure at a steady pace
in order to meet this challenge. Therefore, the company strategically plans to meet the
renewal and growth of the utilities system in a cost-effective manner. (Utility, page 1,
2015 Regulatory Report)
In 2014, the city published a comprehensive analysis of existing infrastructure and
floodwater capacities which was summarized in ‘The City: Vulnerability of
Infrastructure to Climate Change’. As a result of this study, a long-term adaptation
strategy was created. The significance of the findings regarding the potential for
increased flooding directly affects the corporation. (Utility, page 37, 2015,
Sustainability Report)
The above quotations provide examples of the way in which producers and utilities view the risks
created by climate change on system infrastructure.
Element/climate driver—technical knowledge:
To better prepare for the potential impacts of climate change, the City collaborated with
the University of Western Ontario’s Department of Civil and Environmental
Engineering to analyze changes in rainfall intensity, duration and frequency. Results
indicated that the frequency and intensity of rainfall in the area has increased since
1965 and is likely to increase with the onset of climate change. (Utility, page 37, 2015
Sustainability Report)
The above quotation is an example of how the corporation views the importance of having upgraded
technical knowledge, especially in the area of assessing climate change impacts.
113
Element/climate driver—organizational capacity and resources:
The company could also be subject to claims for damages caused by its failure to
transmit or distribute electricity. (Utility, page 35, 2015 Environmental Report)
The corporation is an integral community partner and maintains active membership in
the City’s Advisory Committee on the Environment. The Sub Committee on Energy,
Community Energy Action Plan. (Utility, page 37, 2015 Sustainability Report)
Although constructed, operated and maintained to industry standards, the Company’s
facilities may not withstand occurrences of this type in all circumstance. (Utility, page
34, 2015 Annual Report)
The corporation’s Safe Work Practices Manual outlines the Heat Stress and Cold
Weather strategies employed to mitigate the negative effects of extreme weather on the
health and safety of employees and to reduce WSIB claims costs, which are expected
to increase as a result of climate change. (Utility, page 36, 2015 Annual Report)
The above quotations are examples of corporate narrative statements of how the corporation views its
vulnerability to climate change in terms of organizational resources and capacity.
5.3.3.3 Corporate Risk Response: Balance of Singular + Shared Corporate Response
Another triangulation effect is found in the risk management construct category of risk response,
where 14 out of 20 participant reports (nine out of 10 for producers; five out of 10 for utilities) raised
the issue of what action the corporation is taking or intends to take in response to managing climate
risks.
Singular corporate response was a construct category established in the grid data, and allocated to grid
constructs which reflected notions of what corporate action the company alone intends to take. For
example, referring to constructs enumerated in Appendix T, one participant said: ‘We own assets and
have business interests in a number of regions where there are regulations to address industrial GHG
emissions. We have procedures in place to comply with these regulations’ (Participant #1.4).
Construct examples of a shared, collaborative response from the grid content included comments such
as:
Aging utilities infrastructure continues to be a challenge for many utilities today. Like
most utilities in Ontario, the company must replace aging infrastructure at a steady pace
in order to meet this challenge. Therfore the company strategically plans to meet the
renewal and growth of the utilities system in a cost effective manner. (Participant #2.3)
When the more distinct response categories are considered—namely shared corporate response and
singular corporate response, more distinction is shown between the two groups (see Table 5.9).
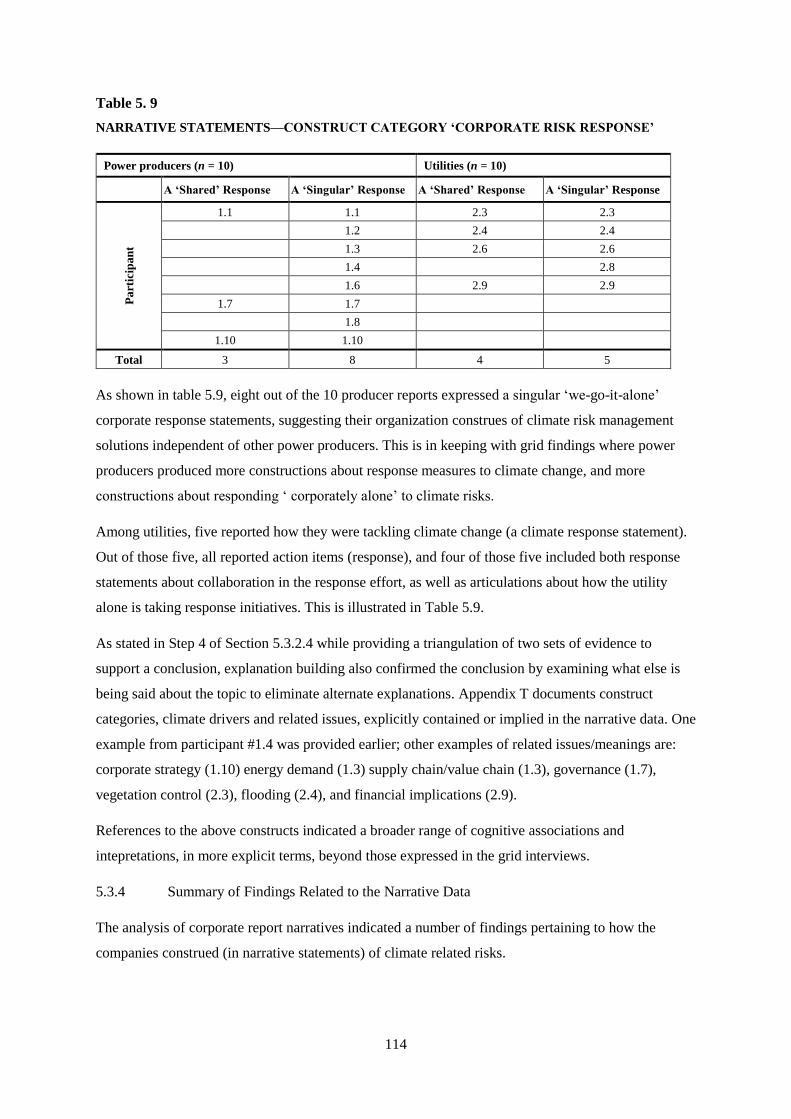
114
Table 5. 9
NARRATIVE STATEMENTS—CONSTRUCT CATEGORY ‘CORPORATE RISK RESPONSE’
Power producers (n = 10) Utilities (n = 10)
A ‘Shared’ Response A ‘Singular’ Response A ‘Shared’ Response A ‘Singular’ Response
Pa
rtic
ipan
t
1.1 1.1 2.3 2.3
1.2 2.4 2.4
1.3 2.6 2.6
1.4 2.8
1.6 2.9 2.9
1.7 1.7
1.8
1.10 1.10
Total 3 8 4 5
As shown in table 5.9, eight out of the 10 producer reports expressed a singular ‘we-go-it-alone’
corporate response statements, suggesting their organization construes of climate risk management
solutions independent of other power producers. This is in keeping with grid findings where power
producers produced more constructions about response measures to climate change, and more
constructions about responding ‘ corporately alone’ to climate risks.
Among utilities, five reported how they were tackling climate change (a climate response statement).
Out of those five, all reported action items (response), and four of those five included both response
statements about collaboration in the response effort, as well as articulations about how the utility
alone is taking response initiatives. This is illustrated in Table 5.9.
As stated in Step 4 of Section 5.3.2.4 while providing a triangulation of two sets of evidence to
support a conclusion, explanation building also confirmed the conclusion by examining what else is
being said about the topic to eliminate alternate explanations. Appendix T documents construct
categories, climate drivers and related issues, explicitly contained or implied in the narrative data. One
example from participant #1.4 was provided earlier; other examples of related issues/meanings are:
corporate strategy (1.10) energy demand (1.3) supply chain/value chain (1.3), governance (1.7),
vegetation control (2.3), flooding (2.4), and financial implications (2.9).
References to the above constructs indicated a broader range of cognitive associations and
intepretations, in more explicit terms, beyond those expressed in the grid interviews.
5.3.4 Summary of Findings Related to the Narrative Data
The analysis of corporate report narratives indicated a number of findings pertaining to how the
companies construed (in narrative statements) of climate related risks.
115
An initial observation was that none of the participant reports contained the term ‘climate risk’ but
referred to physical climate related impacts as ‘extreme weather’ (P1.1), ‘natural disasters’ (P1.2), ‘a
risk related to the external environment’ (P1.3). 35% (7) participants used the term ‘climate change’.
Overall all participant reports expressed at least one of the eight risk management construct categories
in relation to climate change impacts.
Of the participant reports, 90% referenced sudden direct weather events as one source of climate risk.
Only 50% of the total group of participant reports referenced the additional seven climate drivers
(elements) as risks, and none expressed all climate drivers used in the grid data as risks. Overall, most
participant reports (13 out of 20) included narrative statements pertaining to the direct risk
consequences of climate change on their organization. This suggests a strong triangulation effect of
assessment constructs between narrative and grid data—which earlier showed a similar finding (see
Section 5.2.7.1).
Most reported on climate response. 14 out of 20 participant reports (nine out of 10 for producers; five
out of 10 for utilities) raised the issue of what action the corporation is taking or intends to take in
response to managing climate risks. Most of the power producers reported singular, going it alone
responses, while half of the utilities expressed corporate response measures they are and would take
on their own and equally, what measures they would undertake with groups outside of the company.
It is useful to note a particular difference between grid findings and narrative findings (see Section
5.2.7.1) regarding the construct category of risk response. Grid findings suggested that both sector
groups overall expressed more constructs about risk identification and risk assessment. Findings
depicted in Table 5.5 illustrate the frequency count and percentage of constructs allocated in both the
super and the main construct category levels. This suggested overall that producers and utilities
provided the most constructs about risk identification and risk assessment, and in contrast, the least
amount of constructs about climate responses (7.36% of overall constructs, 4.35% of overall
constructs, producers and utilities, respectively).
Analysis of triangulated data showed a different pattern however, suggesting that overall both groups
publically state greater instances of risk response statements (producers 45%, utilities 24.5%; see
Appendix U). In some cases, sector participants discussed risk response statements ony, to the
exclusion of risk identification and risk assessment categories—as was the case with Participants #1.6
and #1.7.
Similar to grid observations, producer corporate statements were significantly more focussed on
discussing risk responses than utilities, as was the pattern in grid data.
116
With respect to the overall concern for risk assessment by the sector participants, grid findings and
analysis indicated that half of the consructs expressed by both groups were about risk assessment
issues (producers 50.92% of all constructs; utilities 51.53% of all constructs).
One possible conclusion one could make as to why there is an overall sector pre-occupation with
climate risk assessment, based on the above issues expressed by the group, is that ‘the assessment
work is not complete’. The range of issues producers and utlities deem to be part of their assessment
of climate risks, is not only future-bound but large and complex. Appraisals of future risks is a facet
of risk management strategy. The complexity and the funding required to resolve or manage the
issues, as the participants raised, suggested at the very least why the sector participants appear to
remain in a risk analysis state.
To understand why this is so, a review of statements categorized as assessment statements was done
to see what themes or reasons might be given or inferred (see Appendix T). Producers stated a number
of related issues pertaining to their assessment statements, including corporate strategy, monitoring,
sector impacts, financial implications, energy demand, operating conditions, technical impacts, market
demand, energy security, capacity output and business interruption. Utilities stated or implied future
performance, vegetation control (as in ‘tree trimming’), reliability, safety, climate data, emergency
preparedness and the built environment.
5.4 CHAPTER SUMMARY
This chapter reports on the findings and analyses of two data group settings in the empirical work. A
mixed methods approach was conducted to elicit individual constructs of climate risks through the
RGT, and the public constructs of climate risks through narrative analysis. Narrative analysis was
conducted to determine the extent, if any, of the triangulation effect of climate risk constructs in the
two settings. It can be noted that the sequence of data collection in the two settings was not dependent
on one or the other; the empirical study could have commenced with either phase.
Comparing the informal tacit constructs with the more formal explicit statements made by the same
organization, was done to produce more findings and insight, and to improve the overall credibility
and external validity of the research study.
Chief findings from the grid data analyses showed that the participant group as a whole is very much
pre-occupied with the analysis or assessment of climate risk, suggesting the group as a whole remains
in an analytical state (see Tables 5.4, 5.5, 5.6).
The participant group as a whole, expressed more constructions about the direct consequences of
climate risks on their operations, more so than any other construct category (see Tables 5.4, 5.5, 5.6).
This ‘on the ground’ view of operational implications of climate related risks suggests that the
companies view climate risk as an operational risk, as opposed to a strategic risk.
117
Another key finding in the grid data suggested both groups construe of managing climate risks not
just alone but with the collaborative effort and involvement of other market actors,producers, utilities
and governments (see Tables 5.4, 5.5, 5.6).
Utilities produced more constructs about the general effects of climate risks, and more constructs
about how they construe sharing corporate action. Power producers on the other hand, produced more
constructs about the direct consequences of climate change impacts, and also more constructs about
how they would singularly manage the risks (see Tables 5.4, 5.5, 5.6).
Differences were found between the groups however, about the relative importance of certain climate
drivers. Power producers rated government policy and climate data as their two most influential
factors affecting their view of future climate risk management. Utilities viewed the phyicals effects of
climate change and government policy as their two most influential factors affecting their construal of
future climate risks management (see Table 5.7).
Chief findings of the narratived data suggested overall that there is a triangulation effect pertaining to
risk analysis and assessment, as shown in the grid data. Findings showed triangulation with the
discussions about direct implications/consequences (as part of risk assessment). While none of the
participant reports mentioned all eight climate drivers (elements, from the grid data), the high
majority (90%) reported that the physical effects of climate change was construed as a business risk to
their organization (see Appendix T).
Another triangulation was found with how the companies reported on their responses to climate
change. The majority of power producers reported ‘a go it alone’ response, consistent with grid
findings. Utilities reported a combined collaborative and independent response on how they are and
intend to respond to climate impacts. (see Appendix T).
It is notable that findings showed the emphasis is not soley on internal, organizational response to
climate change. These findings challenged the researcher’s initial reliance on corporate response
theories of Berkhout et al. (2006); Bleda and Shackley (2008); and Hoffmann et al. (2009).
Overall, findings suggested a confluence of factors driving risk perceptions in the electricity sector,
namely the influencing factors of climate change itself, governmental influence through regulation
and climate policy and internal organizational resources and capacity.
Based on findings, the following is the revised model (see the orginal model as Figure 2.3 in Section
2.10) of how decision makers can be thought to view future climate risks in terms of risk readiness.
Depicted in Figure 5.1 is the emphasis on risk analysis, as presented by findings, and the addition of
climate risk reporting as a reflection of management perceptions. Exogenous and endogenous factors
are shown to not only influence perceptions but also corporate statements about climate risks. The
suggested construal of future conditions with respect to managing climate risks is shown as reaching
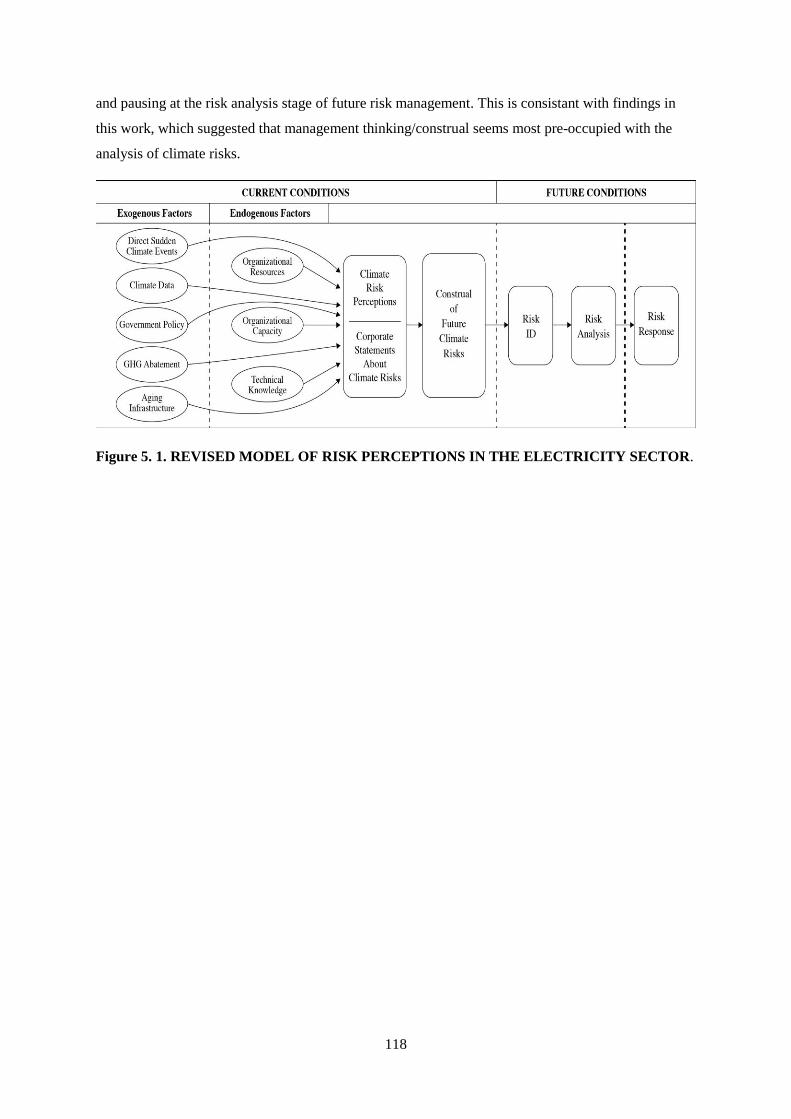
118
and pausing at the risk analysis stage of future risk management. This is consistant with findings in
this work, which suggested that management thinking/construal seems most pre-occupied with the
analysis of climate risks.
Figure 5. 1. REVISED MODEL OF RISK PERCEPTIONS IN THE ELECTRICITY SECTOR.
119
CHAPTER 6 DISCUSSION AND CONCLUSIONS
6.1 INTRODUCTION
This chapter discusses the findings generated in Chapter 5. Empirical outcomes of the work are
reviewed and the implications for practice and theory are discussed. Finally, recommendations,
limitations and suggestions for further research are presented.
6.2 EMPIRICAL OUTCOMES OF THE GRID DATA
As indicated in Chapter 5, 324 constructs were generated. Of these, 161 were from power producers
and 163 were from utilities. Based on the content analysis, the following can be deduced:
1. Overall both groups expressed the greatest number of constructions about the analysis and
assessment of risks, more than any other construct category. Participants overall expressed the
highest number of constructs relating to the direct consequences of climate risks, in particular.
2. Power producers deemed government policy and climate data as the top two most influential
factors affecting their view of how they expect to tackle climate change impacts.
3. Utilities deemed the physical manifestation of climate change and government policy equally
as their top two most influential factors affecting their view of how they expect to manage
climate risks.
4. Grid results indicated that the constructs could be usefully grouped into three main super
categories: risk identification, risk assessment and risk response.
Next a discussion of the above, follows. It is important to examine these three categories in
consecutive order. Mehr and Hedges (1963), generally viewed as the fathers of risk management,
established the sequence as an industry standard - which continues to be used comtemporaniously by
many proponents (Merna & Althani, 2008).
6.2.1 Risk Identification
According to risk methodologies taught in today’s business schools, risk identification is the critical
first stage of the process (Roberts et al., 2015). According to Roberts et al. (2015), risk identifcation
has to account for risks at several levels e.g. primary risks versus secondary risks, and for the
possibility of consequential and cascading risks. Abkowitz (2008) said risk management should cover
a range of issues and themes and that it is important for companies to understand not only all the risks
but any relationship that might exist between/among them. While approaches to risk identification
may vary, most are based on risk source and effect (Roberts et al. (2015). Identifying only the
physical impact of climate change as a risk is a serious oversight according to the Global Task Force
on Climate Change Financial Disclosures. According to the group, many organizations “incorrectly
perceive the implication of climate change as having only physical effects” and are therefore
120
underreporting risks to the detriment of economic–decision making (Disclosures, 2017, p. 4).
Furthermore, the task force has noted that many groups perceive the effects of climate change as
occuring well into the future. Grid findings in this work appear to reflect that perception. Producers
and utilities expressed relatively fewer constructs related to the temporal aspects of managing climate
risks.
6.2.2 Risk Assessment
Risk assesssment was the most prevalent theme mentioned in the grid data. The super category of
asssessment was divided into two categories: risk characteristics and risk consequences. Factors
which shape corporate response to climate change are driven by the issues the corporation identifies in
the assessment and analysis stage of risk management.
According to Klinke and Renn (2002) social institutions evaluate and manage risks to reduce and
control them. Gasbarro and Pinkse (2015) suggested that how firms assess climate impacts is driven
by management’s perception of risk. Arnell and Delaney (2005) posited that awareness is a driving
factor while Berkhout et al. (2006) and Weinhofer and Hoffmann (2008) suggested that how
corporations assess their risk exposure and vulnerability in their risk assessments inform their
responses. And again, Busch (2011) pointed to organizational capacity as key factor in assessment.
Furthermore, Linnenlueke et al. (2012) suggested that corporate responses differ because of the
subjective nature of risk assessment which accounts for difffering corporate responses. Weick (1995)
suggested that the interpretation and evaluation of these impacts are done through sensemaking
processes in the organization while Kelly (2003) proposed that assessment is done through personal
construction of risks, according to a set of corollaries.
6.2.3 Risk Response
The risk response category was the second most prevalent theme mentioned after risk assessment. The
super category risk response was divided further into risk response type, response timing, individual
and shared corporate response. The most prevalent themes mentioned within this group were
individual and shared corporate response.
Weinhofer and Busch (2013) explained the risk response phase as where companies select response
actions—where appropriate—to minimize the exposure of the business to risks. Merna and Althani
(2008) referred to all potential response actions can be assigned to three different response objectives:
risk reduction, risk avoidance and risk transfer. Bootstrapped categories in this work enhance this risk
response construct category by considering risk responses in terms of individual corporate response
and shared corporate response.
121
6.3 EMPIRICAL OUTCOMES OF NARRATIVE DATA
As indicated in Chapter 5, a narrative analysis of corporate reports for the 20 participants was
conduced to understand how the participants construed (in narrative statements) of climate related
risks. Based on the narrative analysis, the following findings were deduced:
1. Low (35%) numbers of reports mentioned the term ‘climate change’, choosing to use
alternate terms such as extreme weather, heavy precipation.
2. Almost all identified only ‘sudden direct climate events’ as the source of climate risk for the
company.
3. Fifty per cent did not identify any of the other sources of climate risk, as were exemplified as
climate drivers in the grid data.
4. Triangulation between narrative and grid data occurred on risk consequence and corporate
response construct categories.
The level of climate risk disclosure in the narrative data was arguably low. Few reports mentioned
climate change as a business risk, and half of them did not identify any of the other climate drivers.
Standard risk disclosure is required in corporate reports by either law or formal codes of practice in
corporate governance. Firms are required to provide under the caption ‘risk factors’ a concise and
logical discussion of the most significant factors. The paucity of climate risk reporting, as a new
category of risk reporting was identified recently by the Global Task Force on Climate Change
Financial Disclosures and by investor protection groups in Canada and the U.S.
Prior research on narrative portions of annual reports has yielded interesting findings to account for
the low level of climate risk and risk reporting in general. For example H.W. and Snyder (1981)
showed that a predominantly optimism bias and a ‘Pollyanna effect’ were evident in their analysis of
corporate narratives. Crombie and Samujh (1999) pointed to deliberate obscuring of reported risks, to
deflect readers from the major risks the company faced. Wright and Nyberg (2015) suggested a
process of dilution occurs when corporate reporting enmeshes attention to climate change within a
broader range of concerns. The low level of published expression about climate change and related
impacts would suggest that a dilution process was in effect in the corporate reportage of this sector
group.
In further explanation, Kohut and Segars (1992) found a predominant focus on reporting on past
events and disclosures, concluding that executives felt more confident discussing the certain past
rather than the uncertain future. While the empirical evidence indicated climate risk disclosure was
low for the sector participants, it did raise the question of whether the phenonmenon was a reflection
of management perceptions in the sector of climate risks, or was indicative of other factors. Deumes
(2008) theorized that risk disclosures are an indicator for “uncertainty reduction” (Deumes, 2008, p.
122
151). Brashers (2001) claimed that “the effect of risk disclosure is both a cause and a sympton of
underdeveloped ideas about uncertainty and methods of managing it” (Brashers, 2001, p. 478).
These suggestions raises the question of what accounts for the difference between the tacit
expressions of climate risk constructs in grid interviews and the low level of climate risk reporting in
public documents. This area is worthy of further investigation.
6.4 IMPLICATIONS FOR THEORY
A number of implications for theory and academic contribution were found in this work, and are
offered below. While this work filled a gap in climate risk research related to how senior managers
perceive climate risks and how those risks could be understood for future management, the empirical
work carried some implications for Renn and Rohrmann’s (2000) integrative model of risk
perception, and for the use of Kelly’s PCT.
6.4.1 Renn and Rohrmann’s (2000) Integrative Model of Risk Perception
As established in Section 2.6.3.7, this research relied on the framework of Renn and Rohrmann’s
(2000) integrative model of risk perception to help organize the discussion of risk perception
determinants. The usefulness of the model in providing explanatory power was indicated by the
empirical alignment with two out of the four factor levels found in the model. Those two are Level 3
(political influences) and Level 2 (cognitive influences) and are exemplified in the empirical findings
of both grid and narrative data, and also in the characteristics of the respondents.
For example, Level 3 of the model suggests that political influences shape risk perceptions. This is in
alignment with findings where government policy was perceived as the greatest influence overall on
future climate risk management by both participant groups. Related to political influence is the issue
of ‘trust’ as an accelator of political influence, as indicated in Figure 2.2. Constructs expressed as’
trust’ and ‘lack of trust’ did emerge in the grid interviews (see constructs P2.9.1 and P2.6.13 in
Appendix P).
Level 2 of the model suggests cognitive forces influence risk perceptions. Discussed in Section
2.6.3.6, cognitive factors of knowledge, and knowledge acquired through experience, account for
shaping risk perceptions. In the sense that personal familiarity and primary first-hand knowledge of
risks are seen as directly influencing risk perceptions, Renn and Rohrmann’s cognitive explanation is
also aligned with empirical evidence in this work. As stated earlier, sector participants have personal
experience of the risks and are able to verify their own organization’s claims of risk. Participants are
well-informed executives and have a high degree of personal efficacy for risk decision making in their
organizations. As such, Renn and Rohrmann’s (2000) proposition that cognitive factors relating to
knowledge and experience seems well explicated in the present study. Another finding supporting
Level 2 alignment, is in the participants’ significant concern for climate data. In the field study, when
123
asked which of all instances of climate risk did they view as the greatest influence on their views,
power producers indicated climate data was their top concern.
The two remaining levels (Level 1, 4) of Renn and Rohrmann’s model do not appear to offer much
explanatory power in this work. For example, Level 1 factors relating to personal heuristics of
information processing where bias and other constraints may be operating, are less likely to be
manifest in this group of participants. Their advanced levels of technical knowledge and training
make them less likely to rely on personal assumptions, schema and limitations of knowledge
absorption. Likewise, Renn and Rohrmann’s Level 4 explanation of cultural background, worldview
and personal identify does not appear to apply in this work. While it might be useful to consider
cultural force as a predictor for institutional action, or to examine its influence on legislation and
policy making, it appears that the overarching influence of cultural influence bears no relevance on
management perceptions of climate risk in this work.
6.4.2 Personal Construct Theory
The other framework used in this research was PCT. There again, only a partial usefulness of Kelly’s
PCT appears to be aligned in the empirical findings (see Section 2.7.2). The application of three of the
five major PCT corollaries (construction, experience and commonality) appear to be operationalized
in the research based on grid interview findings and corporate report narratives.
For example,the construction corollary, which describes how people develop internal representations
by recognizing recurring patterns in their experience (see Section 2.7.2), appears supported.
Individual participants and corporate reports indicated in many cases whether the company had prior
experience of climate events, and other climate risk impacts. Sector participants widely expressed
their experience and recognition of other climate risks, such as regulatory and governmental risks (e.g.
P1.8, P 1.5 and P2.1 in Appendix T, and all constructs categorized as ‘risk sources’ in Appendix P ).
The experience corollary, where constructs are ‘working hypotheses’ about what will happen next
support the notion that if constructs fail in predictive power, they are open to amendment in light of
new events (see Section 2.7.2). Again, the experience corollary is aligned with empirical evidence in
this work. Examples of the experience corollary are produced by participants who acknowledge that
existing preferences for managing risks may no longer be effective in the future. Examples of this are
found in elicited constructs relating to ‘uncertainty’ (e.g. constructs P2.6.3, P2.4.4 in appendix P),
‘lack of control’ (e.g. constructs P1.5.6, P1.5.2, 1.8.5 in Appendix P), and ‘unpredictability’ (e.g.
constructs P1.12, P2.3.3, P2.1.2, P2.3.4, and P2.4.13 in Appendix P). See also P2.2, P2.7 as further
examples in Appendix T.
The commonality corollary, where individual share constructs with others thus promoting role
relations and shared views, appears operationalized in the present study. Examples of this are found in
124
constructs pertaining to collective industry concerns and shared corporate responses to managing
climate risks (e.g., constructs 1.3.15, 2.10.14, 1.4.13, 1.5.11, 2.2.5, 2.3.7), As well, the extent of the
effect of the commonality corollary is indicated by frequency counts and calculations of
proportionality among each of the two study groups (See Tables 5.5, 5.6.).
6.4.3 Organizational Approaches
Berkhout et al. (2006), Bleda and Shackley (2008), and Hoffmann et al. (2009) similarily wrote that
management action is informed by managers’ views of climate risks, and that these views help in
locating influencing factors (of climate risks) inside the organization. The present study has suggested
that climate risk impacts also emenate from external forces (other than physical climate change
events) suggesting that risk impacts are both exogenous and endogenous in nature. Organizational
theorists that promote organizational frameworks for understanding corporate response, may want to
consider both external and internal firm level impacts, in discussions about climate change.
Theorectical power may be enhanced by examining multiple contexts as climate risks are appearing
on multiple fronts. Furthermore, empirical evidence in this work suggests that corporate responses are
seen as being shared with other market constituents. Organizational theories may need to
accommodate this new phenomenon. The traditional response of corporations to manage risks on their
own, may, in fact become outmoded by climate risk impacts. These issues raise questions about the
current validity of some organizational theories to explain corporate response to climate change.
6.4.4 Risk Management Framework
This work relied on the lexicon of a typical risk management framework to produce the labelling
scheme for categorizing constructs and narrative statements. Mehr and Hedges (1963) spoke of risk
management as having essentially three sequential stages of analysis: risk identification, risk
assessment and risk response—the universal three stage framework which is still recognized in
management practice.
Weinhofer and Busch (2013) spoke of the same general risk management scheme as a metaphor for
understanding risk readiness. For one reason or another, organizations may dwell in a particular risk
management phase, unable to move onto the next phase. Utilizing a risk management framework for
the present study proved to be fruitful for several reasons. Insights were gained into which phase of
risk management the participants’constructs related to. Additionally, an understanding was gained
into what stage of risk readiness the participants are in, as evidenced by the results of the content
analysis of grid and narrative constructs. Moreoever, by identifying which stage of the risk
management process participants’ constructs were concentrated in, one could infer which risk
management phase is still left to be developed. In all, the risk management framework proved to be
robust enough in the present study for the above reasons.
125
6.5 IMPLICATIONS FOR PRACTICE
6.5.1 Analytic State
Findings in the grid and narrative data indicated that individual constructions of climate risks in the
studied participant groups are predominantly concerned with analysis and assessment, suggesting at
present the sector seems stalled in an analytical state.
The sector participants’ preoccupation with assessment can be explained by some of the intrinsic
difficulties in climate risk analysis. Estimating the exact timing, frequency and severity of extreme
weather events is inherently problematic. Rare climate events have little to no data thus making
decision making more difficult. This is consistent with the climate science literature which suggests
that climate change is inherently dynamic, non linear and choatic (Daron, 2011). The provision and
quality of localized climate data currently does not produce enough information to support decision
making in the medium term. Moreover, re-vitalizing Ontario’s aging electricity system infrastructure
cannot be done without thorough feasibility assessments and careful technical co-ordination, let alone
significant capital expenditures and public funding support.
Uncertainty created by fluctuating policy responses to climate change directly influence corporate
behaviour and constrain business planning and climate initiatives in this regulated sector. Until such
time as capital investment and system-wide infrastructure upgrading are completed, electricity groups
may stall in their assessments given technical and governmental uncertainties. Low levels of
understanding from external market actors, such as local municipalities and cross border intertie
entitites, may delay or indirectly prevent electricity groups from proceeding with pro-active climate
response.
Where risks have not been sufficiently identified and appraised in risk management, actionable
response is incomplete and compromised. As Weinhofer and Busch (2013) reminded, if the risk
analysis stage is incomplete, the organization cannot be viewed as ‘risk ready’ for moving forward
into the actionable phase of risk management. The overall pre-occupation with analysis in the studied
sector raises questions about the level of uncertainty and the overall need for more data and
information. Analytical stasis and general unreadiness for climate response may also be a function of
the formal structure of the sector. Complexity in the institutional environment and the organizational-
instrumental explanations given by institutional theorists may explain more (Christensen & Peters,
1999). In Ontario, top-down, prescriptive regulation is evident for power producers and utilities in
different ways. Power producers comply with a range of operating contracts to produce electricity on
algorithmically based demand management agreements (Winfield & MacWhirter, 2013). Natural gas
electricity power producers in particular, are constrained by grid regulation rules to produce specific
output levels when called upon by the market grid operator (IESO). This requires natural gas
electricity producers to be on standby, and have available generation capacity for peak or base load
126
demands (see glossary). Electricity utilities in Ontario are likewise regulated to perform at pre-
determined and increasingly high energy efficiency and conservation standards. Complexities within
this regulated sector may well influence actionable climate risk responses. Inderberg (2012) ‘s work
on the Swedish electricity sector called these regulations, rules and lines of command, the formal
structure of the industry. Establishing who can do what and how, Inderberg asserted, has an effect on
the adaptive capacity of the utility or producer. Christensen and Peters (1999)’s organizational-
instrumental perspective suggested these formal structures influence action within the intra- or inter
organizational structure and can radically affect different organizational goals (Inderberg, 2012, p.
970).
6.5.2 Government Policy
A key finding in this work suggests that both power producers and utilities uniformly view
government policy as the most influential factor affecting their views of future climate risk
management. In the narrative data, government policy was identified, and in some cases was conflated
with regulatory risk. For example, it was put this way by two participants, one power producer (1.4)
and one utility (2.4):
The introduction of new laws, or other future regulatory developments, may have a
material adverse impact on our business, operations or financial condition. Changes of
provincial statutes and of regulations in Ontario could have a material effect on our
projects. (1.4)
While the nature of the risks related to climate change such as damage to the
corporation’s infrastructure as a result of severe storms or flooding, is primarily
physical, the risks are also considered regulatory as the corporation is mandated by its
regulators to maintain a reliable supply of electricity to its customers. (2.4)
Framing of government policy as a climate risk suggests it is both a stressor and a constraint to the
firm’s capacity to deal with climate change. This is consistant with Inderberg's (2011) work on the
Norweigan electricty sector where he concluded that the nature of the institutional environment was
an indicator for the amount of corporate capacity to deal with climate risks. His hypothesis was
supported by organizational theory and the ‘instrumental perspective’ (Christensen & Peters, 1999)
which focussed on “the formal structures consisting of the explicit rules and regulations that define
who can do what, both between organizations and inside of them” (Inderberg, 2011, p. 2).
How both groups consistantly viewed government policy as the dominant influence/pressure may be
explained by the ‘organizational field’ concept purported by other organizational theorists. DiMaggio
and Powell (1983) for example, suggested that where institutional factors not only exist at the
individual and organizational levels but span an entire sector, the phenomenon can be viewed as an
‘organizational field’. Inderberg (2011) defined it (the organizational field) as a recognizable area of
institutional life that includes suppliers, resources, and government and regulatory agencies. These
127
groups are viewed as agents within such fields, sharing a common regulatory framework and a
relatively unified governmental structure with congruency and sub-ordination (Scott, 2001).
6.5.3 Climate Data
Power producers pointed to climate (predictive) data in this work as the second most important
influence on their views of managing climate risks in the future.While the use of climate data to
inform management decision making in electricity sectors is not widely researched, some prior work
sheds light on its uses and applications. Climate data in the context of this work refers to probability
based forecasts for time periods from three months hence to up to four seasons ahead (Changnon et
al., 1995). According to Changnon et al. (1995)’s work on the U.S. power utility market, primary
applications of climate forecasts exist in power trading, local forecasting, fuel acquisition and system
planning. While the present work does not generalize to the US electricity sector, Changnon et al.’s
(1995) survey of 56 decision makers in six U.S. utilities nonetheless showed that only three of the 56
decision makers used forecasts (Changnon et al., 1995, p. 711). Reasons why Ontario power
producers viewed climate data as of prime importance to their views of future climate risk
management, are still not understood due to paucity of research.
Several reasons may exist however, for why climate data is important for power producers. One may
speculate about this by asking three questions: 1.) Are the benefits of climate data are well
understood? 2.) Are there current constraints to accessing and using climate data? 3.) Is the current
quality of climate data insufficient for decision-making, and related, what types of decision-making
are significantly reliant on climate data?
In answering the first two questions, the literature may offer some explanation. Changon et al (1995)
noted that hindrances to the use of forecasts at the time of his research were “hard-to understand
formats, lack of corporate acceptance and lack of expertise” (Changnon et al., 1995, p. 711). Brekke
(2016) asserted that operator training in power plants would benefit from new skills and the discipline
of assessing uncertainty in climate projections. Unsurprisingly, these are examples of several climate
risk impacts used in this work. Training, knowledge and expertise building as indicated above are
reflective of three of the eight climate drivers—organizational resources, technical knowledge and
organizational capacity- used in this work.
In answering the third question of what types of decision-making are contingent on climate data, one
can look to Cherry et al. (2017) whose work on arctic power plants may offer some explanation. In
her work, utilitization of climate data was found to be beneficial for power producers in the area of
seasonal prediction, estimation and uncertainty reductionin in both operational and strategic planning.
Cherry et al. (2017) proposed that seasonal climate data of is beneficial at the very least—where
managers may not have personal past experience to anticipate necessararily critical operational
128
decisions. She claimed that while climate data and climate models cannot perfectly forecast the
climate system, even moderately flawed seasonal forecasting assists in uncertainty reduction in the
shorter term. Strategic adaptive measures, according to Cherry (2017) such as licensing processes (i.e.
contractual agreements for power provision) may be better negotiated between power producers and
governmental and system operators. Moreover, shorter term licenses, which might include operational
responses when operating or engineering thresholds are reached could be better negotiated with
supporting climate impact estimates given in seasonal climate models. Likewise, Brekke (2016)
suggested that licensing structures need to reflect changing and extreme climate states. The impact of
climate change impacts, as evidenced by predictive climate data, may well influence formal legal
structures of market activity related to contracts, licenses, and agreements between power producers
and system operators and regulators. Exisiting contractual agreements between power producers and
government may not take into account future climatic states which may exceed currently manageable
operating and engineering threshholds.
Brekke (2016) and Cherry et al.’s (2017) reasoning seem intuitively acceptable. Given that planned
and exisiting power production plants are worth millions, if not billions of dollars, climate prediction
and estimation tools represent a small fraction of the cost of maintaining the facility. Climate data,
those authors maintained, is useful for decision-making and can and should be used in risk
management as a valuable input. The researcher raises the additional speculation that formal, legal
relationships between producers and the governmental authorities which govern Ontario’s electricity
grids need reviewing, in light of what climate data suggests. Those may be some of the plausible
reasons why power producers construed climate data as being highly important to their views of
future climate risk management.
6.5.4 Corporate Planning and Strategy
Another empirical finding in this work suggests that risk response measures are construed of by the
participants as occuring within the organizational context, but outside as well. Response statements in
corporate reports and grid interviews indicated that many participants are working with external
constituents on climate response. Examples given were collaborations on data collection with
municipalities, producer and utility participation on community-at-large energy action plans, and
ongoing collaboration with university researchers and the provincial regulator (see Appendix T).
Findings showed climate action is to be found not just within the organizational context, but with
other market actors and institutions. Integrating climate action with other groups has implications for
corporate planning and strategy, especially as it might relate to the distinct approaches of the
electricity sector.
129
6.5.5 Integration of Climate Risk Assessments
Consistent with changing organizational boundaries to accommodate collaborative climate response
as described above, integration of climate risk assessments with external stakeholders seems blatantly
apparent for the sector group. Kloprogge and Van Der Sluijs (2006) referred to ‘Integrated
Assessment (IA) as an approach to link knowledge and action in a way to accomodate uncertainties
and different perspectives on climate risks’ (Kloprogge & Van Der Sluijs, 2006, p. 359). Utilities and
power producers are system partners in critical infrastructure and as such may also look to producing
sector wide benefits with integrated approaches to climate risk assessment.
6.6 RECOMMENDATIONS
1. Sector-level consideration should be given to developing a coherent framework for climate risk
disclosure for the sector. (At the present time, there is no obligation under existing law to disclose
material information of the risk impacts of climate change for Ontario corporations.) However,
voluntary disclosures in two areas may offer coherence to a risk reporting framework and yield
benefits for the studied groups. The two areas of proposed climate-related disclosure should include
the organization’s governance of climate risks, and management’s approach to managing those risks.
Disclosures related to governance should describe the board’s intended oversight of risks as well as its
prospective view of management’s role in assessing and managing climate risks.
Risk management disclosures should describe how the organization identifies, assesses and manages
climate risks. Benefits of disclosures in these two areas are threefold:
(i) Public and private groups may gain better insight into the governance and climate risk
management context in which the groups’ operating and financial results are achieved;
(ii) The company, internally and externally may improve awareness and understanding of
climate risks, resulting in better risk management and more informed strategic planning;
and
(iii) External stakeholders and financial groups may have greater confidence that the
company’s climate related risks are appropriately assessed and managed.
2. Firm-level and sector-level consideration should be given to strengthening information-sharing
practices of climate risk management among and between sector participants. This could be done as a
joint initiative by the Ontario Distributors’ Association and the Association of Power Producers of
Ontario, for instance. Corporate governance should provide oversight to these cross- management
processes and support inter-group collaborations. Collaborations may raise external stakeholders’
awareness and improve collaborative decision-making on such issues as system planning, assurance
and infrastructure investments.
130
3. Firm-level consideration should be given to economic impact analysis of opportunities e.g.
innovations, technology, funding programs, which climate risk presents. The suggestion here is that
economic decision-making may be enhanced by considering the impact of risk opportunities—inside
and outside the organization.
4. Firm-level consideration should be given to improving risk communication frequency and volume,
and with larger audiences. Message framing can at least be initially controlled by the firm. Improved
understanding of sector climate risk management by multiple constituents could be expected.
Groups which may organize and co-ordinate recommendations one and two include the Ontario
Ministry of Energy, the regulatory groups in Ontario, and relevant business associations and their
proponents.
Groups which may organize and implement recommendation three may include the participants
themselves, in consultation with in house business or economic analysts skilled in the area of
economic impact analysis.
Groups which may organize and co-ordinate recommendation four may include in-house corporate
communications specialists and external communications advisors.
6.7 LIMITATIONS OF THE STUDY
6.7.1 Case Study Group
Case studies in this work consisted of 20 companies in the electricity sector in Ontario. The power
producers selected were natural gas power producers, subject to fossil fuel regulations and therefore
subject to more regulation than their nuclear, hydro and renewable counterparts in electricity
production. (Utilities selected were homegeneous in characteristics.) Using case studies has its
limitations. Limiting the case studies to companies operating in Ontario decreases the generalization
to other provinces. The use of Yin’s (2014) concept of replication logic however, provides support for
the findings to be generalized to other power producers and utilities in Ontario having similar
characteristics. It can be noted that the benefits of using multiple case studies, where theory building
with evidence from empirical observations is made, are that they result in theory that is likely to be
empirically valid (Eisenhardt, 1989). Furthermore, triangulation of data produced by muliple case
studies in the ‘mixed method’ approach used in this work, further helped to improve empirical
validity.
6.7.2 Reliability and Generalizeability
Data collection via interviews is not without limitations. Limitations can include personal bias (of the
interviewer) and lack of awareness by interviewees (Patton, 2002). Lack of awareness of the climate
risk issues among the sector participants was virtually non-existent: interviewees were senior
131
managers or executives with high levels of technical knowledge and organizational authority for
decision-making. In any event, the RGT was adopted as the main data collection technique in order to
overcome some of these limitations. The RGT is noted for removing interviewer bias (Diaz de Leon
& Guild, 2003; Fransella, 2003; Jankowicz, 2004) and assisting in surfacing tacit knowledge of the
respondent (Rogers & Ryals, 2007).
Additionally, social desireablity bias-or the interviewee’s inclination to produce responses in a
favourable light- is reduced with the grid interview technique, which allows the researcher to get
underneath the constructs which otherwise the interviewee may view as ‘the correct answer’
(Easterby-Smith et al., 1996; Jankowicz, 2004). Of greater concern was the researcher’s initial
contemplation the the participants would express their views to be consistant with the sector regulator,
or without the awareness of climate risk issues for the organization. As one measure to reduce
respondent bias, the researcher solicited interviewees from senior and executive management, where
it was thought the most authoritative management voice would ‘unabashedly speak the (unbiased)
truth’. As a counterpoint however, it can be mentioned that the researcher was also aware of potential
systemic bias among executive respondents. Each interviewee, while presenting themselves as highly
informed and technically astute, had the potential for what social scientists refer to as promoting
systemic or institutional bias to produce a particular response. The concern was that the executive
perspective would reflect a latent collective agenda among the participants.
However, if the respondents were all line managers and not executives, questions eliciting their
constructs of climate risks would likely have been quite different. More likely, they would have been
reflective of their personal but perhaps limited or specialized understanding of the issues related to
climate risks. Line managers in the electricity sector function in operationally siloed and specific
expertise areas and thus not likely to have the broader strategic view of the organization’s challenges.
They may have expert knowledge on particular operational matters, but likely little knowledge of the
regulatory implications of GHG reporting, as one example.
Data collection via corporate reports is not without its limitations also. Five out of the 10 utilities in
this work did not produce their own 2015 annual report, available in public records. As the next best
alternative, the researcher looked for the organization’s 2015 regulatory report. However, risk
disclosures in those five reports were also non existent except for a Note to Reader MD&A, discussed
in Section 5.3.3. This work is limited, in effect, by the lack of corporate ‘voice’ and independent risk
reporting from five utilities.
6.7.3 Content Analysis
Content analysis and a form of narrative analysis were used in this study. Critics of these approaches
point to researcher subjectivity as a research limitation (Dowling, 2000). To maximize reliability an
independent evaluator was used to interpret construct categories in the grid interviews. The
132
independent evaluator was a colleague with the researcher’s firm with management expertise in
assessing risks in infrastructure projects. A Reliability assessment was taken to reduce researcher bias.
The reliability assessment followed reliability procedures reported by Janokowicz (2004) where a
reliability table was created and interrater reliability coefficients were calculated. The final Cohen’s
Kappa was 0.965, indicating over 95% agreement on the construct allocations. Reliability measures of
the narrative analysis of corporate reports followed Yin’s replication logic for selection of construct
categories, element categories and the systematic arrangement af narrative statements produced in
corporate reports ultimately presented in Appendix T. The researcher was successful in overcoming
the research biases explained above, as indicated in Section 5.2.1. and Appendix Q.
6.8 FURTHER RESEARCH
Institutional constraints
Further investigation into the effects of institutional constraints on the sector would be useful. Both
groups pointed to climate policy response as having the greatest influence on how they view
managing climate risks in the future. Investigating how and in what ways policy and other forms of
governmental behaviour i.e. regulations and other institutional constraints, affect the sector’s ability to
respond to climate risks would be helpful. Further research into the relevance of climate data and
modelling for power producers would also be beneficial. Future research may pose the question of
what type of decision making among producers, which viewed it (climate data) as highly relevant, is
contingent upon climate data and modelling.
Risk modelling and management
Examining and benchmarking management practices of risk modelling and intergrated management in
this sector would provide some insights. Collaborations in this area, between sector participants and
other institutions would be constructive for the sector, in light of the data which showed a concern for
‘shared responses’ to managing climate risks.
Capital investment and financial implications
Research which looks at how climate risks in the sector are perceived by investment and infrastructure
finance groups would likely provide insights. Future research may pose the question: In what ways is
the impact of climate risk modifying long term financial forecasting principles? Another area of
potential research might look at economic impact modelling to quantity what it may cost society if no
timely climate risk response is taken in the electricity sector. In other words, what will it cost, if the
sector continues to stall in its apparent analytic state at the moment. It would be a useful reference for
public policy makers to consider.
133
Census study
This research included empirical data collection from a portion of the naturual gas segment of
electrical power producers. A census approach including every natural gas power producer as well as
all other types of electricty generation participants (hydro, nuclear, renewable) would produce sector-
wide findings. Apart from relying on different fuel sources, power producers in Ontario share similar
corporate characteristics, and mostly use similar generation technologies but all are subject to most of
the same regulations and government policies. Investigating how variously exogenous and
endogenous pressures are construed by the sector at large would likely provide meaningful insights
for energy planners and other constituents.
Further investigation of utilities
The study included participation from 10 utilities, five of which did not produce a public document
disclosing business risks. Further research might be undertaken to triangulate grid interview findings
with a management questionnaire or a more ethnographic style of research inquiry for respondents in
that group.
Consequences to energy security and supply
Consideration should be given to research on the implications of unmanaged climate risks on energy
supply and energy security. Unmanaged risks may threaten electricity production and distribution
over longer terms than just one day or a week-long ‘severe weather event’. Research on energy supply
security in Europe has looked at financial dimensions (Chalvatzis & Ioannidis, 2017), the effect of
financial incentives and policies to improve energy security (Metcalf, 2014), and the growth of smart
grid technology to improve the security of electricity supply (Clastres, 2011). In those cases, proactive
practices were assessed for the effect they (proactive practices) had on preserving energy security.
Linking cognition with decision making
Observing longitudinal changes in management thinking about climate risks may yield useful findings
in this sector, and others. Comparing management cognitions with actual climate risk decision making
ex-post, may produce further intriguing findings and contribute to theory. The construct of forced
response—as in, ‘we must do something’ and the extent to which the precautionary principle is
utilized is another area of future research. Noting how the sector evolves, if at all, in its thinking about
climate risk management would provide potentially exemplary models of how other industries or
sectors might (or might not) decide to respond to climate risks.
134
REFERENCES
Abkowitz, M. (2008). Operational Risk Management: A case Study Approach to Effective Planning.
New Jersey: Wiley.
Acharya-Tom Yew, M. (2014, January 20). Ice storm pushed weather losses to record $3.2 billion:
Insurance Bureau. Toronto Star. Accessed on March 9, 2016. Retrieved from
https://www.thestar.com/business/2014/01/20/severe_weather_losses_hit_a_record_32_billio
n_in_2013.html
Adams, J. (1995). Risk. London: Routledge.
Adger, N. W., Lorenzoni, I., & O'Brien, K. L. (2010). Adapting to Climate Change: Thresholds,
Values, Governance. Cambridge: Cambridge University Press.
Allen, K. (2003). Vulnerability reduction and the community -based approach: a Phillipines Study. In
M. Peling (Ed.), Natural Disasters and Development in a Globalizing World (pp. 170-184):
Routledge.
Amit, R., & Schoemaker, P. (1993). Strategic Assets and organizational rent. Strategic Management
Journal, 14 (1), 33-46. doi:10.1002/smj.4250140105
Anderegg, W. R. L., Prall, J. W., Harold, J., & Schneider, S. H. (2010). Expert credibility in climate
change. Proceedings of the National Academy of Sciences of the United States of America,
107 (27), 12107-12109. doi:10.1073/pnas.1003187107
Arnell, N., & Delaney, K. (2005). Adapting to Climate Change: Public Water Supply in England and
Wales. Climatic Change, 78, 225-255. doi:10.1007/s10584-006-9067-0
Baker, B., Sklokin, I., Coad, L., & Crawford, T. (2011). Canada’s Electricity Infrastructure: Building
a Case for Investment. http://www.electricity.ca/media/ReportsPublications/11-
257_ElectricityInfrastructure%5b1%5d.pdf: The Conference Board of Canada Accessed on
Feb 11, 2015.
Bannister, D., & Fransella, F. (1986). The Enquiring Man: The Psychology of Personal Constructs
(3rd ed.). London: Croom Helm.
Barthes, R., & Duisit, L. (1975). An introduction to the structural analysis of narrative. New Literary
History, 6 (2), 237-272.
Beck, U. (2006). Living in the world risk society. Paper presented at the Economy and Society,
London School of Economics. journal article retrieved from
http://hudson2.skidmore.edu/~rscarce/Soc-Th-Env/Env%20Theory%20PDFs/Beck--
WorldRisk.pdf
Beck, U. (2009). World at Risk. Cambridge: Polity Press.
Beer, S. (1967). Management Science. London: Aldus.
Bell, R. C. (1990). Analytical issues in the use of RGT (Vol. 1). New York, NY: JAI press.
Berger, P. L., & Luckmann, T. (1991). The Social Construction of Reality: A Treatise in the Sociology
of Knowledge. London, UK: Penguin Books.
Berkes, F., & Folke, C. (2002). Back to the Future: Ecosystem dynamics and local knowledge.
Washington: Island Press.
Berkhout, F., Hertin, J., & Arnell, N. (2004). Business and Climate Change: Measuring and
Enhancing Adaptive Capacity.Accessed on Retrieved from UK:
Berkhout, F., Hertin, J., & Gann, D. M. (2006). Learning to adapt: organisational adaptation to
climate change impacts. Climatic Change, 78, 135-156.
Bleda, M., & Shackley, S. (2008). The dynamics of belief in climate change and its risks in business
organisations. Ecological Economics, 66, 517-532.
Boin, A., & McConnell, A. (2007). Preparing for Critical Infrastructure Beakdowns: The Limits of
Crisis Management and the need for Resilience. Journal of Contingencies and Crisis
Management, 15 (1), 50-59.
Bostrom, A., & Lashof, D. (2004). Weather it's climate change. Creating a Climate for change. Paper
presented at the American Geophysical Union.
Bostrom, A., Morgan, M. G., Fischhoff, B., & Read, D. (1994). What do people know about global
climate change?. Risk Analysis, 14, 959-970.
135
Boyle, J., Cunningham, M., & Dekens, J. (2003). Climate change adaptation and Canadian
infrastructure: A review of the literature.Accessed on Feb 11, 2015. Retrieved from
http://www.iisd.org/pdf/2013/adaptation_can_infrastructure.pdf
Brashers, D. E. (2001). Communication and Uncertainty Management. Journal of Communications,
51 (3), 477-497.
Brehmer, B., & Brehmer, A. (1987). The Psychology of Risk. Risk and Decisions, 25-39.
Brekke, L. (2016). Addressing Climate Change in long term water resources Planning and
Management User needs for Improving tools and Information.Accessed on August 28, 2017.
Retrieved from http:// www.usbr.gov/climate/userneeds
Broecker, W. S. (1975). Climate change: Are we on the brink of a pronounced global warming?
Science, 189 (4201), 460-463. doi:10.1126/science.189.4201.460
Brooks, N. (2003). Vulnerability, risk and adaptation: A conceptual framework.Accessed on Feb 11,
2015. Retrieved from East Anglia, UK:
Busch, T. (2011). Organizational adaptation to disruptions in the natural environment: The case of
climate change. Scandinavian Journal of Management, 27 (4), 389-404.
doi:10.1016/j.scaman.2010.12.010
Butters, D. (2018, January 22, 2018). [Accountability of Natural Gas Suppliers under Cap and Trade
Program of Ontario].
Calder, B., Phillips, L., & Tybout, A. (1981). Designing Research for Application. Journal of
Consumer Research, 8 (2), 197-207. doi:10.1086/208856
Calori, R., Johnson, G., & Sarnin, P. (1994). CEOs' cognitive maps and the scope of the organization.
Strategic Management Journal, 15 (6), 437-457.
Canadian Electricity Association. (2016). Adapting to climate change: State of play and
recommendations for the electricity sector in Canada.Accessed on Retrieved from
http://www.electricity.ca/media/ReportsPublications/Adapting_to_Climate_Change-
State_of_Play_and_Recommendations_for_the_Electricity_Sector_in_Canada.pdf
Carroll, J. S. (1995). Incident Reviews in High Hazard Industries: Sense Making and Learning Under
Ambiguity and Accountability. Industrial and Environmental Crisis Quarterly, 9 (2), 175-
197.
CEU. (2008). On the identification and designation of European critical infrastructures and the
assessment of the need to improve their protection. Directive 114. Brussels, Belgium: Official
Journal of the European Communities Accessed on.
Chalvatzis, K., & Ioannidis, A. (2017). Energy Security Supply in Southern Europe and Ireland.
Energy Procedia, 105, 2916-2922. doi:10.1016/j.egypro.2017.03.660
Chandler, A. D. (1962). Strategy and Structure: Chapters in the History of the Industrial Enterprise.
Boston: MIT press.
Changnon, S. A., Changnon, J. M., & Changnon, D. (1995). Uses and applications of climate
forecasts for power utilities. Bulletin of the American Meteorological Society, 76, 711-720.
Charron, I. (2014). A Guidebook on Climate Scenarios: Using Climate Information to Guide
Adaptation Research and Decision.Accessed on September 22, 2016. Retrieved from
Montreal, Canada: http://www.ouranos.ca/media/publication/352_GuideCharron_ENG.pdf
Cherry, J., Knapp, C., Trainor, S., et al. (2017). Planning for climate change impacts on hydropower
in the Far North. Hydrology Earth System Sciences, 21, 133-151. doi:10.5194/hess-21-133-
2017
Chichilnisky, G. (2000). An axiomatic approach to choice under uncertainty with catastrophic risks.
Resource and Energy Economics, 22, 221-231.
Chowdhrury, P. D. (2012). Public versus expert knowledge and perception of climate change-induced
heat wave risk: a modified mental model approach. Journal of Risk Research, 15 (2), 149-
168. doi:10.1080/13669877.2011.601319
Christensen, T., & Peters, B. G. (1999). Structure, Culture and Governance: A comparision of
Norway and the United States. Lanham, MD: Rowman and Littlefield.
CIA. (2016). World Fact Book. Washington, DC: Central Intelligence Agency.
136
Clastres, C. (2011). Smart Grids: Another step towards competition, energy security and climate
change objectives. Energy Policy, 39 (9), 5399-5408. doi:10.1016/j.enpol.2011.05.024
Coad, L., Crawford, T., & Macdonald, A. (2012). Shedding light on the economic impact of investing
in electricity infrastructure.Accessed on April 17, 2015. Retrieved from
http://www.conferenceboard.ca/temp/ae4beaf9-b085-4712-ae77-9fc0c246a8cf/12-
221_sheddinglight_rpt.pdf
Cook, J., Oreskes, N., Doran, P. T., et al. (2016). Consensus on consensus: a synthesis of consensus
estimates on human-caused global warming. Environmental Research Letters, 11 (4), 048002.
Cotgrove, S. (1982). Catastrophe or Cornucopia: the Environment and Politics of the Future. New
York: Wiley.
Coutu, D. (2003). Sense and reliability. A conversation with celebrated psychologist Karl E. Weick.
Harvard Business Review, 81, 84-90,123.
Cox Jr, L. A. T. (2012). Community resilience and decision theory challenges for catastrophic events.
Risk Analysis, 32 (11), 1919-1934.
Craik, K. J. (1943). The nature of Explanation. Cambridge, U.K.: Cambridge University.
Creswell, J., Klassen, A., Plano Clark, V., & Smith, K. (2007). Best Practices for Mixed Methods
Research in the Health Sciences. US: National Institutes of Health Accessed on.
Crombie, W., & Samujh, H. (1999). Negative messages as strategic communication. Journal of
Business Communication, 36 (3), 229-246.
Crotty, M. (1998). The foundations of Social Research: Meaning and Perspective in the Research
Process. Thousand Oaks, CA: Sage Publications.
Cvetkovich, G., & Earle, T. (1991). Risk and Culture. Journal of Cross-Cultural Psychology, 22 (1),
206-225.
Dake, K. (1992). Myths of nature: Culture and the social construction of risk. Journal of Social Issues,
48 (4), 21-37.
Daron, J. D. (2011). Examining the decision relevance of climate model information for the insurance
industry. (PhD), London School of Economics, London, UK.
Davis, M., & Clemmer, S. (2014). Power failure: How climate change puts our electricity at risk- and
what we can do.Accessed on September 28, 2016. Retrieved from
http://www.ucsusa.org/sites/default/files/legacy/assets/documents/Power-Failure-How-
Climate-Change-Puts-Our-Electricity-at-Risk-and-What-We-Can-Do.pdf
De Jong, M. G., Pieters, R., & Fox, J. P. (2010). Reducing social desirability bias through item
randomized response: An application to measure underreported desires. Journal of Marketing
Research, 47 (1), 14-27.
Delmas, M., & Toffel, M. W. (2008). Organizational Responses to environmental demands: opening
the black box, 29 (10), 1027-1055. doi:10.1002/smj.701
DeMarco, L. (2015). Submission of the Association of Power Producers of Ontario. Toronto Accessed
on October 16, 2016.
Dess, G., & Beard, D. (1984). Dimensions of Organizational Task Environments. Administrative
Science Quarterly, 29 (1), 52-73.
Dessai, S., Adger, N. W., & Hulme, M. (2004). Defining and Experiencing Dangerous Climate
Change. Climatic Change, 64 (1), 11-25.
Deumes, R. (2008). Corporate risk reporting: A content analysis of narrative risk disclosures in
prospectuses. Journal of Business Communication, 45 (2), 120-157.
Diaz de Leon, E., & Guild, P. (2003). Using repertory grid to identify intangibles in business plans.
Venture Capital, 5 (2), 135-160.
Dietz, T., Dan, A., & Shwom, R. (2007). Support for climate change policy: Social psychological and
social structural influences. Rural Sociology, 72 (2), 185-214.
DiMaggio, P., & Powell, W. (1983). The Iron Cage revisited: Institutional Isomorphism and collective
rationality in Organizational Fields. American Sociological Review, 48 (2), 147-160.
Disclosures, T. F. o. C. r. F. (2017). Final Report: Recommendations of the Task Force on Climate-
related Financial Disclosures.Accessed on August 11, 2017. Retrieved from Basel,
Switzerland: www.fsb-tcfd.org/publications/final-recommendations-report/
137
Dispensa, J. M., & Brulle, R. J. (2003). Media’s Social Construction of Environmenis tal Issues:Focus
on Global Warming—A Comparative Study,. International Journal of Sociology and Social
Policy, 74-105.
Dobosz-Bourne, D. (2004). Knowledge Transfer across cultural boundaries in the global economy
based on the model of travel of ideas exemplified by the quality transfer in car manufacture
from West Europe to Poland. (PhD), University of Luton, England.
Dooley, L. M. (2002). Case study research and theory building. Advances in developing human
resources, 4 (3), 335-354.
Douglas, M., & Wildavsky, A. (1982). How can we know the Risks we face? Why Risk selection is a
social process. Risk Analysis, 22 (2), 49-58.
Dowling, R. (2000). Power, subjectivity and ethics in qualitative research. UK: Oxford University
Press.
Duckett, D., & Busby, J. (2013). Risk Amplification as social attribution. Risk Management, 15 (2),
132-153.
Easterby-Smith, M. (1980). The design, analysis and interpretation of repertory grids. International
Journal of Man Machine Studies, 13, 33-24.
Easterby-Smith, M., Thorpe, R., & Holman, D. (1996). Using repertory grids in management. Journal
of European Industrial Training, 20 (3), 3-30.
Eisenhardt, K. M. (1989). Building theories from case study research. Academy of management
review, 14 (4), 532-550.
Eisenhardt, K. M. (1991). Better stories and better constructs: The case for rigor and comparative
logic. Academy of Management review,, 16 (3), 620-627.
Electricity Distributors Association. (2011). Electricity is the answer: The EDA's road map for
delivering Ontario's electric future.Accessed on August 7, 2016. Retrieved from
https://secure2.eda-
on.ca/iMIS15/EDA/EDA_Priorities/EDA_Policy_Papers/Electricity_is_the_answer.aspx
Energy, O. M. o. (2017). Ontario's Long Term Eneergy Plan. Ontario Canada: Queen's printer
Accessed on October 7, 2017. Retrieved from ww.energy.gov.on.ca/en/ltep.
Engineers, A. S. o. C. (2017). Infrastructure Report Card.Accessed on Retrieved from Washington,
D.C.:
Fischhoff, B., Slovic, P., Lichtenstein, S., Read, S., & Combs, B. (1978). How safe is safe enough? A
psychometric study of attitudes towards technological risks and benefits. Policy Sciences, 9
(2), 127-152.
Flynn, L. R., & Goldsmith, R. E. (1999). A short, reliable measure of subjective knowledge.. Journal
of Business Research, 46 (1), 57-66.
Fransella, F. (Ed.) (2003). International Handbook of Personal Construct Psychology. Chichester:
John Wiley & Sons.
Freudenburg, W. (1992). Nothing Recedes Like Success-Risk Analysis and the Organizational
Amplification of Risks. Risk: Health, Safety and the Environment (1990-2002), 3 (1).
Freudenburg, W. R. (1993). Risk and Recreancy: Weber, the Division of Labor, and the Rationality of
Risk Perceptions. Social Forces, 71 (4), 909-932. doi:10.1093/sf/71.4.909
Galbreath, J. (2014). Climate change response: Evidence from the Margaret River wine region of
Australia. Business Strategy and the Environment, 23, 89-104.
Gasbarro, F., & Pinkse, J. (2015). Corporate adaptation behaviour to deal with climate change: the
influence of firm specific interpretations of physical climate impacts. Corporate Social
Responsibility and Environmental Management, 23 (3), 179-192.
doi:http://dx.doi.org/10.1002/csr.1374
Gasbarro, F., Rizzi, F., & Frey, M. (2016). Adaptation measures of energy and utility companies to
cope with water scarcity induced by climate change. Business Strategies and the
Environment, 25 (1), 54-72. doi:10.1002/bse.1857
Gentner, D., & Whitley, E. W. (1997). Mental models of population growth. Environment, ethics and
behaviour.
Gibbert, M., Ruigrok, W., & Wicki, B. (2008). What passes as a rigorous case study? Strategic
Management Journal, 29 (13), 1465-1474.
138
Gifford, R., & Comeau, L. (2011). Message framing influences perceived climate change competence,
engagement, and behavioural intentions. Global Environmental Change, 21 (4), 1301–1307.
doi:10.1016/j.gloenvcha.2011.06.004
Girard, N. (2013). Categorizing stakeholders’ practices with repertory grids for sustainable
development. 1 (16), 118. doi:10.3917/mana.161.0031
GoEnergy, I. (2017). Ontario—First Year of Cap and Trade. Accessed on January 20, 2018. Retrieved
from https://goenergy.ca/ontarios-first-year-of-cap-and-trade/
Graham, A. (2011). Canada's Critical Infrastructure: When is safe enough safe enough?Accessed on
September 29, 2015. Retrieved from Canada:
http://www.macdonaldlaurier.ca/files/pdf/Canadas-Critical-Infrastructure-When-is-safe-
enough-safe-enough-December-2011.pdf
Grinyer, P. H., Yasai-Ardekani, M., & Al-Bazzaz, S. (1980). ‘Strategy, structure, the environment,
and financial performance in 48 United Kingdom companies. ‘. 23, 193-220.
H.W., H., & Snyder, R. D. (1981). The Pollyanna Hypothesis in Business Writing. Journal of
Business Communication, 18 (1), 5-15.
Haigh, N., & Griffiths, A. (2012). Surprise as a catalyst for including climatic change in the strategic
environment. Business & Society, 51 (1), 89-120. doi:10.1177/0007650311427425
Heal, G., & Kriström, B. (2002). Uncertainty and climate change. Environmental and Resource
Economics, 22, 3-39.
Herriott, R. E., & Firestone, W. A. (1983). Multisite qualitative policy research: Optimizing
description and generalizability. Educational researcher, 12 (2), 14-19.
Hertin, J., Berkhout, F., Gann, D. M., & Barlow, J. (2003). Climate change and the UK house
building sector: perceptions, impacts and adapative capacity. Building Research and
Information, 31 (3-4), 278-290. doi:10.1080/0961321032000097683
Hill, S. D., & Thompson, D. (2006). Understanding managers' views of global environmental risk.
Environmental Management, 37 (6), 773-787. doi:10.1007/s00267-004-0238-z
Hoffman, D. A., Jacobs, R., & Landy, F. (1995). High reliability process industries: Individual, micro,
and macro organizational influences on safety performance. Journal of Safety Research, 26
(3), 131-149. doi:10.1016/0022-4375 (95)00011-E
Hoffmann, V. H., Trautmann, T., & Hamprecht, J. (2009). Regulatory Uncertainty: A reason to
postpone Investments? Not Necessarily. Journal of Management Studies, 46 (7).
Holling, C. S., Gunderson, L. H., & Peterson, G. (2002). Sustainability and panarchies. Washington,
DC.: Island Press.
Honey, P. (1979). The repertory Grid in Action: How to use it to conduct an Attitude Survey.
Industrial and Commercial Training, 11 (11), 452-459.
Hood, J. (2005). Emerging Risks in the 21st Century: an agenda for action. Risk Management, 7, 69-
70. doi:10.1057/palgrave.rm.8240215
Horizon Utilties. (2016). Horizon Utilities signs Hamilton Climate Change Action Charter. Accessed
on October 16,2016. Retrieved from
https://www.horizonutilities.com/ourCompany/sustainability/Pages/ClimateChangeCharter.as
px
Huber, G. P., & Daft, R. L. (1987). The Information Environments of Organizations. Newbury Park,
CA: Sage.
Hull, R., Belluck, D., & Lipchin, C. (2006). A framework for multi-crieria decision-making with
special reference to critical infrastructure: Policy and Risk Management working group
summary and recommendations. Nato Security through Science Series, 355-369.
Hulme, M., & Mahoney, M. (2010). Climate change: What do we know about the IPCC? Progress in
Physical Geography, 34 (5), 705-718. doi:10.1177/0309133310373719
Hydro Ontario. (2016). 2016 Forecast. Accessed on March 12, 2016. Retrieved from
http://www.ieso.ca/Pages/Participate/Reliability-Requirements/Forecasts-&-18-Month-
Outlooks.aspx
Hydro Quebec. (2016). Causes of Outages. Accessed on October 16,2016. Retrieved from
http://poweroutages.hydroquebec.com/poweroutages/understand-and-prevent.html
IESO. (2016). Independent Electricity System Operator. Accessed on Retrieved from
http://www.ieso.ca/
139
IESO. (2016). Ontario Planning Outlook: A technical report on the electricity system.Accessed on
January 14, 2017. Retrieved from http://www.ieso.ca/Documents/OPO/Ontario-Planning-
Outlook-September2016.pdf
Inderberg, T. (2011). Institutional Constraints to Adaptive Capacity. Local Environment, 16 (4), 303-
317.
Inderberg, T. (2012). Governance for climate change adapative capacity in the swedish electricity
sector. Public Management Review, 14 (7), 967-985.
Ingram, P., & Silverman, B. S. (2000). Introduction: The new institutionalism in strategic
management Advances in Strategic Management (pp. 1-30): Emerald Group Publishing
Limited.
Insurance Bureau of Canada. (2015). The Economic Impacts of the Weather Effects of Climate
Change on Communities.Accessed on October 3, 2016. Retrieved from
http://assets.ibc.ca/Documents/Studies/IBC-The-Economic-Impacts.pdf
Intact. (2016). Climate Change Adaptation Project Accessed on February 16, 2016. Retrieved from
Intact Centre on Climate Adaptation: http://www.intactcentreclimateadaptation.ca/
Intergovernmental Panel on Climate Change. (2014). What is dangerous interference with the climate
system?Accessed on September 4, 2016. Retrieved from
https://www.ipcc.ch/publications_and_data/ar4/wg3/en/ch1s1-2-2.html
Jaeger, C., Renn, O., Rosa, E., & Webler, T. (2001). Risk, Uncertainty and Rational Action. London,
UK: Earthscan.
Jankowicz, D. (2001). Why does subjectivity make us nervous? Making the tacit explicit. Journal of
Intellectual Capital, 2 (1), 61-73.
Jankowicz, D. (2004). The Easy Guide to Repertory Grids. London: John Wiley & Sons.
Jankowicz, D., O'Farrell, P., & Wallace, W. (2016). Introduction to Business Research 1: The
Research Proposal. Edinburgh, UK: Heriot-Watt University.
Jasanoff, S. (1998). The political science of risk perception. Reliability Engineering and System
Safety, 59 (1), 91-99. doi:10.1016/S0951-8320 (97)00129-4
Johnson, B. B., & Covello, V. T. (1987). The social and cultural construction of Risk: Essays on Risk
selection and perception (Vol. 3): Springer Science and Business Media.
Kahneman, D., & Tversky, A. (1984). Choices, values, and frames. American Psychologist, 39 (4),
341-350. doi:10.1037/0003-066X.39.4.341
Kane, L. (2013, January 28). Toronto must overhaul aging infrastructure to meet dramatic climate
change projections, study shows. The Toronto Star. Retrieved from
https://www.thestar.com/news/gta/2013/01/28/toronto_must_overhaul_aging_infrastructure_t
o_meet_dramatic_climate_change_projections_study_shows.html
Kasperson, R. E., Renn, O., Slovic, P., et al. (1988 ). The social amplification of risk: A conceptual
framework.. Risk Analysis, 8 (2), 177-187.
Kelly, G. (1991). The Psychology of Personal Constructs. New York, NY: Routledge.
Kelly, G. (2003). A brief introduction to personal construct theory. In F. Fransella (Ed.), International
handbook of personal construct psychology (pp. 3-20). Chichester, England: John Wiley &
Sons.
Klinke, A., & Renn, O. (2002). A new approach to Risk Evaluation and Management: Risk based,
precaution Based, and Discourse based Strategies. Risk Analysis, 22 (6), 1071-1094.
Kloprogge, P., & Van Der Sluijs, J. P. (2006). The inclusion of Stakeholder Knowledge and
Perspectives in Integrated Assessment of Climate change. Climatic Change, 75 (3), 359-389.
Kohut, G. F., & Segars, A. H. (1992). The president's Letter to Stakeholders:An examination of
Corporate communication strategy. Journal of Business Communication, 29 (1), 7-21.
Kolk, A., Levy, D., & Pinkse, J. (2008). Corporate responses in an emerging climate regime: the
institutionalization and commensuration of carbon disclosure., 17, 719-745.
Kolk, A., & Pinkse, J. (2004). Market strategies for Climate change. European Management Journal,
22 (3), 304-314.
Kollmuss, A., & Agyeman, J. (2002). Mind the gap: why do people act environmentally and what are
the barriers to pro-environmental behaviour? Environmental education research, 8 (3), 239-
260.
140
Konig, U., & Abegg, B. (2010). Impacts of Climate Change on Winter Tourism in the Swiss Alps.
Journal of Sustainable tourism, 5 (1), 46-58. doi:10.1080/096695589708667275
Kriebel, D., Tickner, J., Epstein, P., et al. (2001). The precautionary Principle in Environmental
Science. Environmental Health Perspectives, 109 (9), 871-876.
Landau, D., & Drori, I. (2008). Narratives as sensemaking accounts: the case of an R&D laboratory.
Journal of Organizational Change Management, 21, 701-720.
Landrum, N. E. (2008). A narrative analysis revealing strategic intent and posture. Qualitative
Research in Organizations and Management, 3 (2), 127-145.
Laszlo, R., & Marchionda, S. (2015). Resilient Pipes and Wires.Accessed on Retrieved from Toronto:
http://www.questcanada.org/files/download/f0d858d953eda43
Layzell, D. (2016). Visualizing Canada's Energy Systems. Retrieved from www.cesarnet.ca/all-
visualizations
Leiserowitz, A. (2005). American Risk Perceptions: Is Climate Change Dangerous? Risk Analysis, 25
(6), 1433-1442. doi:10.1111/j.1540-6261.2005.00690.
Lempert, R. J., & Collins, M. T. (2007). Managing the risk of uncertain threshold responses:
comparison of robust, optimum, and precautionary approaches. Risk Analysis, 27 (4), 009-
1026.
Linnenluecke, M., & Griffiths, A. (2010). Beyond adaptation: resilience for business in light of
climate change and weather extremes. Business & Society.
Linnenluecke, M., Griffiths, A., & Winn, M. (2008). Organizational adaptation and resilience to
extreme weather events. Paper presented at the Academy of Management, Anaheim.
Linnenlueke, M. K., Griffiths, A., & Winn, M. (2012). Extreme weather events and the critical
importance of anticipatory adaptation and organizational resilience in responding to impacts.
Business Strategy and the Environment, 21 (1), 17-32. doi:10.1002/bse.708
Lloyd's of London. (2006). Lloyds 360 risk project: catastrophic trends, rapid climate
change.Accessed on December 12, 2015. Retrieved from
http://www.lloyds.com/~/media/lloyds/reports/360/360%20climate%20reports/360_rapidclim
atechangereport.pdf
Lorenz, E. N. (2011). Can chaos and intransitivity lead to interannual variability? Tellus, 42 (3).
doi:http://dx.doi.org/10.3402/tellusa.v42i3.11884
Lorenzoni, I., & Pidgeon, N. (2006). Public Views on Climate Change: European and USA
Perspectives. Climatic Change, 77 (1), 73-95.
Lorsbach, A., & Tobin, K. (1992). Constructivism as a Referent for Science Teaching. National
Association for Research in Science Teaching newsletter, 30, 5-7.
Loschel, A., Moslener, U., & Rubbelke, D. (2010). Energy security- concepts and indicators. Energy
Policy, 38, 1607-1608.
Lujala, P., Lein, H., & Rød, J. K. (2015). Climate change, natural hazards, and risk perception: The
role of proximity and personal experience. Local Environment, 20 (4), 489-509.
doi:10.1080/13549839.2014.887666
Maxwell, J. (1992). Understanding and Validity in Qualitative Research. Harvard Educational
Review:, 62 (3), 279-301. doi: http://dx.doi.org/10.17763/haer.62.3.8323320856251826
Maxwell, J. (2005). Qualitative Research Design: An Interactive Approach (2nd ed.). Thousand Oaks,
CA.: Sage.
McCarthy, D. (2015). [Ouranos].
McCarthy, J. J. (2001). Climate change 2001: impacts, adaptation, and vulnerability: contribution of
Working Group II to the third assessment report of the Intergovernmental Panel on Climate
Change: Cambridge University Press.
McGrath, J., & Brinberg, D. (1983). External Validity and the Research Process: A Comment on the
Calder/Lynch Dialogue. Journal of Consumer Research, 10 (1), 115-124.
Mehr, R. I., & Hedges, B. A. (1963). Risk Management in the Business Enterprise. Illinois: Richard
D. Irwin.
Merna, T., & Althani, F. (2008). Corporate Risk Management: an organizational perspective (2nd
ed.). Chichester: John Wiley and Sons.
Metcalf, G. (2014). The economics of energy security. Annual Review of Resource Economics, 6
(November), 155-174. doi:10.1146/annurev-resource-100913-012333
141
Metlay, D. (1999). Institutional trust and confidence: A journey into a conceptual quagmire. Social
trust and the management of risk. London: Earthscan.
Metzger, M., & Rounsevell, M. (2011). A need for planned adaptation to climate change in the wine
industry. Environmental Research Letters, 6 (3). doi:10.1088/1748-9326/6/3/031001
Mikes, A., & Kaplan, R. (2014). Towards a contingency theory of Enterprise Risk Management.
Working Paper 13-063. Harvard Business School. US. Accessed on January 1, 2017.
Retrieved from http://www.hbs.edu/faculty/Publication%20Files/13-063_5e67dffe-aa5e-4fac-
a746-7b3c07902520.pdf
Mililken, F. (1987). Three types of perceived Uncertainty about the Environment: State, Effect and
Response Uncertainty. Academy of Management Journal, 12 (1), 133-143. doi:10.5465/AMR
1987.4306502
MOE. (2017). Cap and Trade Program Overview. Accessed on January 20, 2018. Retrieved from
https://www.ontario.ca/page/cap-and-trade-program-overview
Morgan, J. (2013). How Climate Change Impacts America’s Energy Infrastructure.
Murphy, P., Zade, R., Conway, S., & Venkatesh, B. (2014). LDC Asset Renewal Series: Part 2:
Climate Change.Accessed on May 4, 2017. Retrieved from Toronto:
National Energy Board. (2016). Canada's Energy Future Accessed on Nov 4,2016. Retrieved from
http://www.neb-one.gc.ca/nrg/ntgrtd/ftr/2016pt/k-fndngs-prvnc-trrtr-eng.html#tabON
Navigant Consulting. (2015). 2014 Natural Gas Market Review Final Report.Accessed on August 30,
2016. Retrieved from Toronto, Ontario:
http://www.ontarioenergyboard.ca/oeb/_Documents/EB-2014-
0289/2014_Natural_Gas_Market_Review_Final_Report.pdf
NIPP. (2009). National Infrastructure Protection Plan. Washington, D.C. (USA): U.S. Department of
Homeland Security Accessed on January 20, 2018. Retrieved from www.dhs.gov/nipp.
O'Connor, R. E., Bord, R. J., & Fisher, A. (1999). Risk perceptions, General Environmental Beliefs,
and Willingness to Address Climate Change. Risk Analysis, 19 (3), 461–471.
doi:10.1023/A:1007004813446
O’Riordan, T., & Jordan, A. (1999). Institutions, climate change and cultural theory: towards a
common analytical framework. Global Environmental Change, 9 (2), 81-93.
Okereke, C., Wittneben, B., & Bowen, F. (2011). Climate Change: Challanging Business,
Transforming Politics. Business & Society, 51 (1), 7-30. doi:10.1177/0007650311427659
Olatumile, A. (2013). Environmental Professionals's Perception of the Usefulness of Knowledge and
Awareness of Climate Change. Journal of Educational and Social Research, 3 (3), 61-68.
Ontario Energy Board. (2015). History of the OEB.Accessed on November 4, 2016. Retrieved from
http://www.ontarioenergyboard.ca/oeb/industry/about+the+oeb/legislation/history+of+the+oe
b
Oppenheim, C., Stenson, J., & Wilson, R. M. (2003). Studies on information as an asset I: definitions.
Journal of Information Science, 29 (3), 159-166.
Ortiz, M., & Harwood, J. (2007). A social cognitive theory approach to the effects of mediated
intergroup contact on intergroup attitudes. Journal of Broadcasting & Electronic Media, 51
(4), 615-631.
Ouranos Consortia. (2016). Consortium on Regional Climatology and Adaptation to Climate Change.
Accessed on May 1, 2016. Retrieved from https://www.ouranos.ca/en/ouranos/
Pachauri, R. K., Allen, M. R., Barros, V. R., et al. (2015). Climate change 2014: Synthesis report.
Contribution of working groups I, II and III to the fifth assessment report of the
intergovernmental panel on climate change.Accessed on Retrieved from
http://epic.awi.de/37530/1/IPCC_AR5_SYR_Final.pdf
Pacific Climate Institute of Canada. (2016). About PCIC. Accessed on July 15, 2016. Retrieved from
https://pacificclimate.org/
Packham, K. (2015). Lean-burn engine technology increases efficiency, reduces NOx emissions
Retrieved from http://power.cummins.com/sites/default/files/literature/technicalpapers/PT-
7009-LeanBurn-en.pdf
Parmesano, H., & Kury, T. (2015). Implications of Carbon Cap-and-Trade for Electricity Rate
Design, with examples from Florida.Accessed on Augsut 23, 2016. Retrieved from Florida:
142
https://www.researchgate.net/publication/227418720_Implications_of_Carbon_Cap-and-
Trade_for_Electricity_Rate_Design_with_Examples_from_Florida
Parry, M. L. (Ed.) (2007). ‘Climate change 2007-impacts, adaptation and vulnerability: Working
group II contribution to the fourth assessment report of the IPCC (Vol. 4). ‘: Cambridge
University Press.
Patton, M. Q. (2002). Qualitative research & evaluation methods. Thousand Oaks, CA: Sage.
PCIC. Pacific Climate Impacts Consortium (PCIC) Regional Analysis Tool
http://pacificclimate.org/tools/regionalanalysis/. Accessed on May 30, 2016.
Pfeffer, J. (1997). New Directions for Organization theory: Problems and Prospects. London: Oxford
University Press.
Pinkse, J., & Kolk, A. (2010). Challenges and trade-offs in corporate innovation for Climate Change.
Business Strategy and the Environment, 19, 261-271.
Polasky, S., Carpenter, S. R., Folke, C., & Keeler, B. (2011). Decision-making under great
uncertainty: Environmental management in an era of global change. Trends in ecology &
evolution, 26 (8), 398-404. doi:10.1016/j.tree.2011.04.007
Polit, D., & Beck, C. (2010). Generalization in quantitative and qualitative research; myths and
strategies. International Journal of Nursing Studies, 47, 1451-1458.
Power, M. (2003). The invention of operational risk.Accessed on Retrieved from Centre for analysis
of risk and regulation:
Prato, T. (2008). Accounting for risk and uncertainty in determining preferred strategies for adapting
to future climate change. Mitigation and Adaptation Strategies for Global Change, 13 (1), 47-
60. doi:10.1007/s11027-007-9080-y
Pratt, M. G. (2000). The Good, the bad and the Ambivalent: managing identification among Amway
distributors. Administrative Science Quarterly, 45, 456-493.
Public Safety Canada. (2015). Action Plan for Critical Infrastructure. Accessed on May 29. Retrieved
from http://www.publicsafety.gc.ca/cnt/rsrcs/pblctns/pln-crtcl-nfrstrctr/index-eng.aspxd
Purchase, B. (2013, March 27). Mortal Hazard—Why catastrophic events like the sub-prime
mortgage crisis and climate change are inevitable. The Walrus Magazine.
Quigley, K., Bisset, B., & Mills, B. (2016). Too Critical to Fail: How Canada Manages Threats to
Critical Infrastructure. Montreal, Canada: McGill-Queen's University Press.
Quirk, D. (2013). How Canadian homes builders construe their decision to participate in a voluntary
environmental program (DBA), Heriot Watt, Ediburgh Business School, Scotland.
Rand, T. (2014). Waking the Frog: Solutions for Our Climate Change Paralysis: ECW Press.
Reduction, I. f. C. L. (2012). Telling the weather story. Accessed on September 3, 2016. Retrieved
from http://www.ibc.ca/en/natural_disasters/documents/mcbean_report.pdf
http://www.questcanada.org/files/download/f0d858d953eda43.
Reger, R. K., & Huff, A. S. (1993). Strategic groups: A cognitive perspective. Strategic Management
Journal,, 14 (2), 103-123.
Renn, O. (1998). Three Decades of risk Research: Accomplishments and new challenges. Journal of
Risk Research, 1 (1), 49-71.
Renn, O. (2005). Risk Governance: towards an integrative approach.Accessed on September 12,
2016. Retrieved from
https://www.irgc.org/IMG/pdf/IRGC_WP_No_1_Risk_Governance__reprinted_version_.pdf
Renn, O. (2008). Risk governance: Coping with uncertainty in a complex world. Sterling, VA:
Earthscan.
Renn, O., Jaeger, C., Rosa, E., & Webler, T. (2000). The Rational Actor Paradigm in Risk Theories:
Analysis and Critique. Risk in the Modern Age: Social Theory, Science and Environmental
Decison-Making. Accessed on March 14, 2016. Retrieved from
https://www.kent.ac.uk/scarr/events/finalpapers/renn.pdf
Renn, O., & Rohrmann, B. (2000). Cross Cultural Risk Perception: A survey of Empirical Studies
(Vol. 13). Dordrecht: Kluwer Academic Publishers.
Resnick, D. (2015). What is ethics in research and why is it important? Washington, DC.: US
government Accessed on September 22, 2016.
143
Reynolds, T., Bostrom, A., Read, D., & Morgan, M. G. (2010). Now what do people know about
global climate change? Survey studies of educated laypeople.. Risk Analysis, 30 (10), 1520-
1538.
Roberts, A., Wallace, W., & McClure, N. (2015). Strategic Risk Management. Edinburgh, UK:
Heriot-Watt University.
Rogers, B., & Ryals, L. (2007). Using Repertory Grid to access the underlying realities in key account
relationships. International Journal of Market Research, 49 (5), 595-612.
Rosa, E. (1998). Metatheorectical foundations for post normal risk. Journal of Risk Research, 1 (1),
15-44. doi:10.1080/136698798377303
Rosa, E. A. (Ed.) (2008). White Black and Grey: critical dialogue with the International Risk
Governance Council's Framework for Risk Governance: Springer.
Rothenberg, S., & Zyglidopoulos, S. C. (2007). Determinants of Environmental innovation adoption
in the printing industry: the importance of task environment. Business Strategies and the
Environment, 16 (1), 39-49.
Samadi, S., Sagareswar, G., & Tajiki, M. (2010). Comparison of General Circulation Models:
methodology for selecting the best GCM in Kermanshah Synoptic Station, Iran. International
Journal of Global Warming, 2 (4).
Sandman, P. M. (1987). Risk Communication: Facing Public Outrage. Environmental Protection
Jounal, 13 (21), 21.
Sarewitz, D., Pielke, R., & Keykhah, M. ( 2003). Vulnerability and Risk: Some Thoughts from a
Political and Policy Perspective. Risk Analysis, 23 (4), 805-810. doi:10.1111/1539-
6924.00357
Schendel, D., & Hofer, C. (1979). Strategic management: A new view of business policy and
planning. : Little, Brown.
Schmunk, R. B. (2010). 2009: Second warmest year on record; End of warmest decade. Accessed on
June 17, 2016. Retrieved from http://www.giss.nasa.gov/research/news/20100121/
Schneider, N. (2001). What is 'dangerous' climate change? Nature, 411, 17-19. doi:10.1038/35075167
Schneider, S. H., Easterling, W. E., & Mearns, K. (2000). Adaptation: Sensitivty to natural variability,
agent assumptions and dynamic climate changes. Climatic Change, 45, 203-221.
Schwarz, M., & Thompson, M. (1990). Divided We Stand: Redefining Politics, Technology, and
Social Choice. Philadelphia: : University of Pennsylvania Press.
Scott, W. R. (2001). Institutions and Organizations. Thousand Oaks,California: Sage.
Selznick, P. (1996). Institutionalism ‘Old’ and ‘New’. Adminstrative Science Quarterly, 41 (2), 270-
277. doi:10.2307/2393719
Short, J. F., & Clarke, L. (1992). Social Organization and Risk. Boulder: Westview, US.
Sidortsov, R. (2014). Reinventing rules for environmental risk governance in the energy sector.
Energy Research & Social Science, 1 (March), 171–182. doi:10.1016/j.erss.2014.03.013
Simon, H. (1955). A behavioural model of rational choice. The quarterly journal of economics, 99-
118.
Singh, B., Roy, P., Spiess, T., & Venkatesh, B. (2015). Achieving electricity grid resiliency.Accessed
on Retrieved from Toronto, Canada:
Sitkin, S. B., & Weingart, L. R. (1995). Determinants of risky decision-making behaviour: A test of
the mediating role of risk perceptions and propensity. Academy of Management Journal, 38
(6), 1573-1592.
Sjöberg, L. (1996). A discussion of the limitations of the psychometric and cultural theory approaches
to risk perception. Radiation Protection Dosimetry, 68 (3), 219-225.
Slovic, P. (2000). The Perceptions of Risk: Earthscan Publications.
Slovic, P., Finucane, M. L., Peters, E., & MacGregor, D. G. (2004). Risk as Analysis and Risk as
Feelings: some thoughts about affect, reason, risk and rationality. Risk Analysis, 24 (2), 311-
322.
Slovic, P., Fischhoff, B., Lichtenstein, S., & Roe, F. J. C. (1981). Perceived risk: psychological
factors and social implications [and discussion]. Paper presented at the Mathematical,
Physical and Engineering Sciences, London.
Smircich, L., & Stubbart, C. (1985). Strategic Management in an enacted World. Academy of
management review, 10 (4), 724-736.
144
Smith, K. (1997). Economic infrastructures and innovation systems. Systems of innovation:
technologies, institutions, and organizations/edited by C Edquist. London: Pinter. p, 86-106.
Snape, D., & Spencer, L. (2003). The foundations of qualitative research. Qualitative research
practice: A guide for social science students and researchers (J. Ritchie & J. Lewis Eds.).
London, UK: Sage.
Solomon, S., Qin, D., Manning, M., et al. (2007). Climate change 2007: The physical science basis:
Working group I contribution to the fourth assessment report of the IPCC (Vol. 4).Accessed
on Retrieved from https://www.ipcc.ch/pdf/assessment-
report/ar4/wg1/ar4_wg1_full_report.pdf
Spears, J. (2013, August 13, 2013). Blackout 2003: How Ontario went dark. Toronto Star. Accessed
on October 10, 2017. Retrieved from
https://www.thestar.com/business/economy/2013/08/13/blackout_2003_how_ontario_went_d
ark.html
Spence, A., & Pidgeon, N. (2010). Framing and communicating climate change: The effects of
distance and outcome frame manipulations. Global Environmental Change, 20 (4), 656-667.
Starr, C. (1969). Social Benefit versus Technological Risk. Science, 165 (3899), 1232-1238.
Stedman, R. C. (2004). Risk and Climate change: perceptions of key policy actors in Canada. Risk
Analysis, 24 (5), 1395-1406.
Steinberg, R., Martens, F., Everson, M., & Nottingham, L. (2004). Enterprise Risk Management-
Integrated Framework.Accessed on September 1, 2016. Retrieved from New York:
https://www.coso.org/Documents/COSO-ERM-Executive-Summary.pdf
Stern, N. (2008). The Economics of Climate Change. American Economic Review, 98 (2), 1-37.
Strauss, B., & Ziemlinski, R. Sea Level Rise Threats to Energy Infrastructure.Accessed on Retrieved
from http://slr.s3.amazonaws.com/SLR-Threats-to-Energy-Infrastructure.pdf:
Stubbart, C. (1989). Managerial Cognition: A Missing Link in Strategic Management Research.
Journal of Management Studies, 26 (4), 326-347.
Suarez, P., & Patt, A. G. (2004). Cognition, caution, and credibility: the risks of climate forecast
application.. Risk Decision and Policy, 9 (1), 75-89.
Tam, B. (2016). Canadian Climate Data and Scenarios (CCDS).Accessed on Retrieved from Ottawa:
Thompson, M., Ellis, R., & Wildavsky, A. (1990). Cultural Theory: Westwood Press.
Toronto Hydro. (2013). 2012 Annual Report: The measure of our comittment, 2013.Accessed on
January 20, 2017. Retrieved from Toronto, ON:
https://www.torontohydro.com/sites/corporate/InvestorRelations/FinancialReports/Financial
%20Report/Annual%20Report%20-%20PDF.pdf
Toronto Hydro Commission. (2016). Changing Weather Patterns. Accessed on October 16, 2016.
Retrieved from
http://www.torontohydro.com/sites/electricsystem/GridInvestment/TorontosGrid/Pages/Chan
gingWeatherPatterns.aspx
Toronto Star, n. (2016). Toronto Hydro tackling aging infrastructure. Accessed on Retrieved from
https://www.pressreader.com/canada/toronto-star/20161208/282432758782201
Transportation Research Board, N. C. H. R. P. (2009). Communicating the Value of Research:
Contractor's Final Report.Accessed on Retrieved from Washington, DC.:
Von Glasersfeld, E. (1989). Cognition, construction of knowledge, and teaching. Synthese, 80 (1),
121-140.
Wachinger, G., & Renn, O. (2010). Risk perception and natural hazards.Accessed on July 15, 2016.
Retrieved from Stuttgart:
Warner, K., Hamza, M., Oliver-Smith, A., Renaud, F., & Julia, A. (2010). Climate change,
environmental degradation and migration. Natural Hazards, 55 (3), 689-715.
doi:10.1007/s11069-009-9419-7
Waterman, R. H. (1990). Adhocracy: the Power to Change. Memphis, TN: Whittle Direct Books.
Weber, E. (2006). Experience-based and description-based perceptions of long-term risk: Why global
warming does not scare us (yet). Climate Change, 77 (2), 103-120. doi:10.1007/s10584-006-
9060-3
Weber, E. (2010). What shapes perceptions of climate change? Wiley Interdisciplinary Reviews:
Climate Change, 1 (3), 332-342. doi:10.1002/wcc.41
145
Weick, K. E. (1988). Enacted Sensemaking in Crisis Situations. Journal of Management Studies, 25
(4), 305-316.
Weick, K. E. (1995). Sensemaking in organizations (G. Dickens Ed.). London, UK: Sage
Publications.
Weick, K. E., & Roberts, K. H. (1993). Collective Mind in Organizations: Heedfull Interrelating on
Flight Decks. Administrative Science Quarterly, 38, 357-381.
Weinhofer, G., & Busch, T. (2013). Corporate strategies for managing climate risks. Business
Strategy and the Environment, 22 (2), 121-144. doi:10.1002/bse.1744
Weinhofer, G., & Hoffmann, V. (2008). Mitigating Climate Change- How do corporate strategies
differ? Business Strategy and the Environment, 19, 77-89.
Weitzman, M. L. (2011). Fat-tailed uncertainty in the economics of catastrophic climate change.
Review of Environmental Economics and Policy, 5, 275-292.
Whitmarsh, L. (2008). What's in a name? Commonalities and differences in public understanding of
‘climate change’and ‘global warming’. Public Understanding of Science.
doi:10.1177/0963662506073088
Wilbanks, T. J., & Sathaye, J. (2007). Integrating mitigation and adaptation as responses to climate
change: a synthesis. Mitigation and Adaptation Strategies for Global Change, 12 (5), 957-
962.
Wilby, R. L., Dawson, C. W., & Barrow, E. M. (2002). SDSM- A Decision Support Tool for the
assessment of regional climate change impacts. Environmental Modelling and Software, 17
(2), 145-157.
Willows, R., Reynard, N., Meadowcroft, I., & Connell, R. (2003). Climate adaptation: Risk,
uncertainty and decision-making. UKCIP Technical Report: UK Climate Impacts
Programme.
Winfield, M., & MacWhirter, B. (2013). Competing Policy Paradigms and Hardpath inertia: The
Search for Sustainability in Ontario Electricity Policy. Environmental Studies. York
University. Accessed on
Winn, M., Kirchgeorg, M., Griffiths, A., Linnenlueke, M. K., & Günther, E. (2011). Impacts from
climate change on organizations: a conceptual foundation. Business Strategy and the
Environment, 20 (3), 157-173.
Winn, M. I., & Kirchgeorg, M. (2005). The siesta is over: a rude awakening from sustainability
myopia. In S. Sharma & M. Starik (Eds.), Corporate environmental strategy and competitive
advantage (pp. 232-258). Cheltenham, UK: Edward Elgar Publishing.
Wiser, R., Bachrach, D., Bolinger, M., & Grove, W. (2004). Comparing the Risk Profiles of
renewable and natural gas fired electricity contracts. Renewable and Sustainable Energy
Reviews, 8 (4), 335-363.
Wood, M., Bostrom, A., Bridges, T., & Linkov, I. (2012). Cognitive Mapping Tools: review and Risk
management needs. Risk Analysis, 32 (8), 1333-1348. doi:1-.1111/j.1539-6924.2011.01767.x
Wood, R., & Bandura, A. (1989). Social Cognitive Theory of Organizational Management. Academy
of Management Journal, 14 (3), 361-384.
World Bank. (2014). List of Countries by Electricity Consumption.Accessed on November 4, 2016.
Retrieved from http://data.worldbank.org/indicator/EG.USE.ELEC.KH.PC
Wright, C., & Nyberg, D. (2015). An Inconvenient Truth: How Organizations translate Climate
Change into Business as Usual. Academy of Management Journal, 1 (1).
Wright, R. (2004). Mapping cognitions to better understand attitudinal and behavioural responses in
appraisal research. Journal of Organizational Behaviour, 25 (3), 339-374.
Yang, Z. J., Aloe, A. M., & Feeley, T. H. (2014). Risk information seeking and processing model: A
meta‐analysis. Journal of Communications, 64 (1), 20-41.
Yin, R. (2014). Case Study Research: Design and Methods (5 ed. Vol. 5). Thousand Oaks, CA.: Sage
Publications, Inc.
Yusta, J. M., Correa, G. J., & Lacal-Arántegui, R. (2011). Methodologies and applications for critical
infrastructure protection: State-of-the-art. Energy Policy, 39 (10), 6100-6119.
doi:10.1016/j.enpol.2011.07.010
Zainal, Z. (2007). Case study as a research method. Journal Kemanusiaan, 9, 1-6.
146
PILOT APPENDIX A
24 February 2017
To whom it may concern
Re: Doctoral study by Anna Dowbiggin, Student #12833-96-09
I can confirm that Anna Dowbiggin is registered on the DBA programme at Edinburgh Business
School, Heriot-Watt University, Edinburgh.
Anna is currently working on her doctoral research thesis entitled ' Climate Risks in the Electricity
Sector' under the supervision of Professor Devi Jankowicz. Anna's field work is being conducted in
Canada and her preferred email address is [email protected].
Anna's research is subject to University guidelines on research ethics and confidentiality. I hope you
are able to offer her any assistance you can in this stage.
If any further information is required please do not hesitate to contact me on +44
(0)131 451 3090 or [email protected].
Yours sincerely
Adrian Carberry
147
PILOT APPENDIX B
Anna Dowbiggin, Doctoral candidate
Edinburgh Business School, Heriot Watt University, Scotland UK
...............................................................................................................................................
...............................................................................................................................................
...............................................................................................................................................
....................................................................................................... By email (date, 2017) to:
Dear:
Re: Interview request, regarding Doctoral research
I am a doctoral student with the Edinburgh Business School, Scotland UK, conducting interviews for
my dissertation topic, ‘Climate Risk Perceptions in the Canadian Electricity Sector’. My research
objective is to understand (not hypothesize or test) climate risk perceptions among gas fired power
producers and transmission/utilities companies operating in Ontario. In short, I’m interested in
exploring what Ontario companies think about the effects of climate change and the full spectrum of
the indirect and direct impacts of climate change on operations. My intent is to build on the existing
scholarly research on climate risk perceptions for utilities already done in the UK, European Union
and Australia.
To this end, I need to conduct a series of in-person interviews, to run through a series of questions,
and to ask for an opinion on an overarching question. All time taken would be 60 minutes.
Confidentiality and Anonymity
As a post graduate researcher, I comply with the Ethical Standards and Guidelines at Edinburgh
Business School, and ensure steps are taken to ensure confidentiality and anonymity for the
participant and his/her organization, through anonymized coding of corporate names, and
confidentiality of all participants between and among them.
I will phone you directly in the next day or so to determine your availability for an interview and your
suggestions for additional people at ________. If you have questions, please ask; I can be reached at
416 817 4399. Please note that Dave Butters of APPrO and Francis Bradley of the CEA (see his
attached letter of support) have given me their organization’s acknowledgement and explicit support.
It is anticipated that the findings from my doctoral study will inform policy and practice and assist in
the process of advancing corporate adaptation measures for future climate change in Canada.
Anna Dowbiggin, BA, MBA, DBA candidate
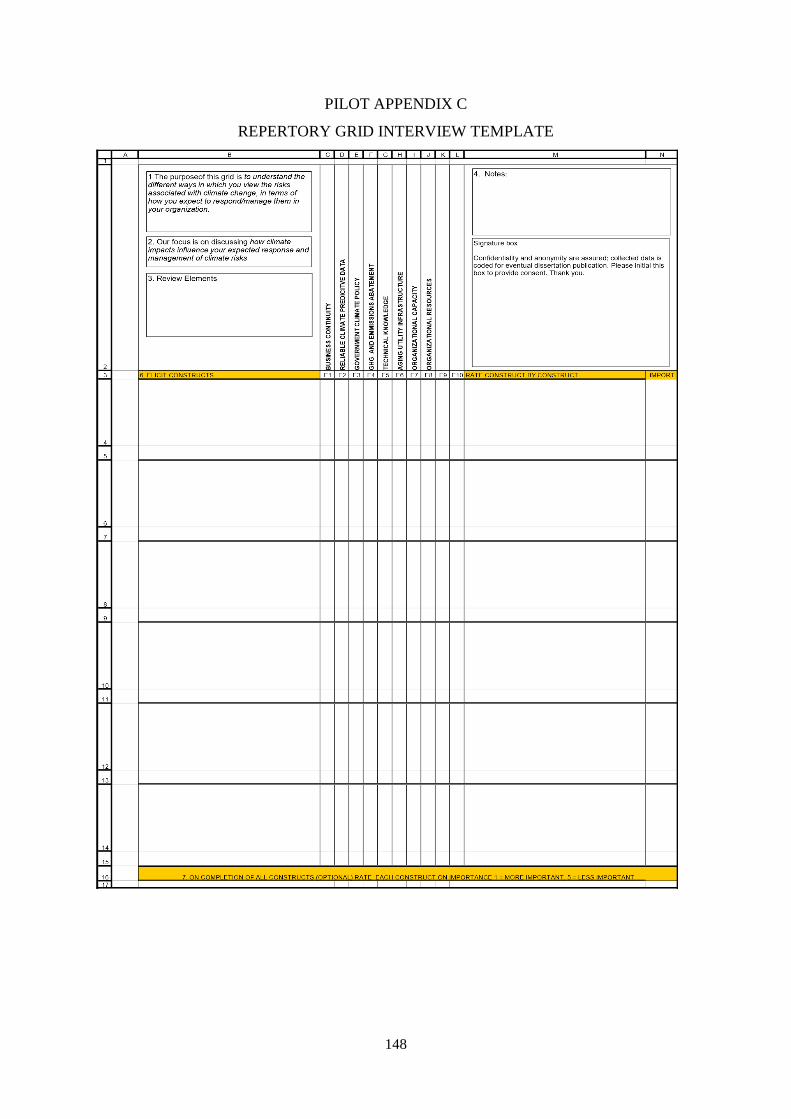
148
PILOT APPENDIX C
REPERTORY GRID INTERVIEW TEMPLATE
149
PILOT APPENDIX D
150
PILOT APPENDIX E
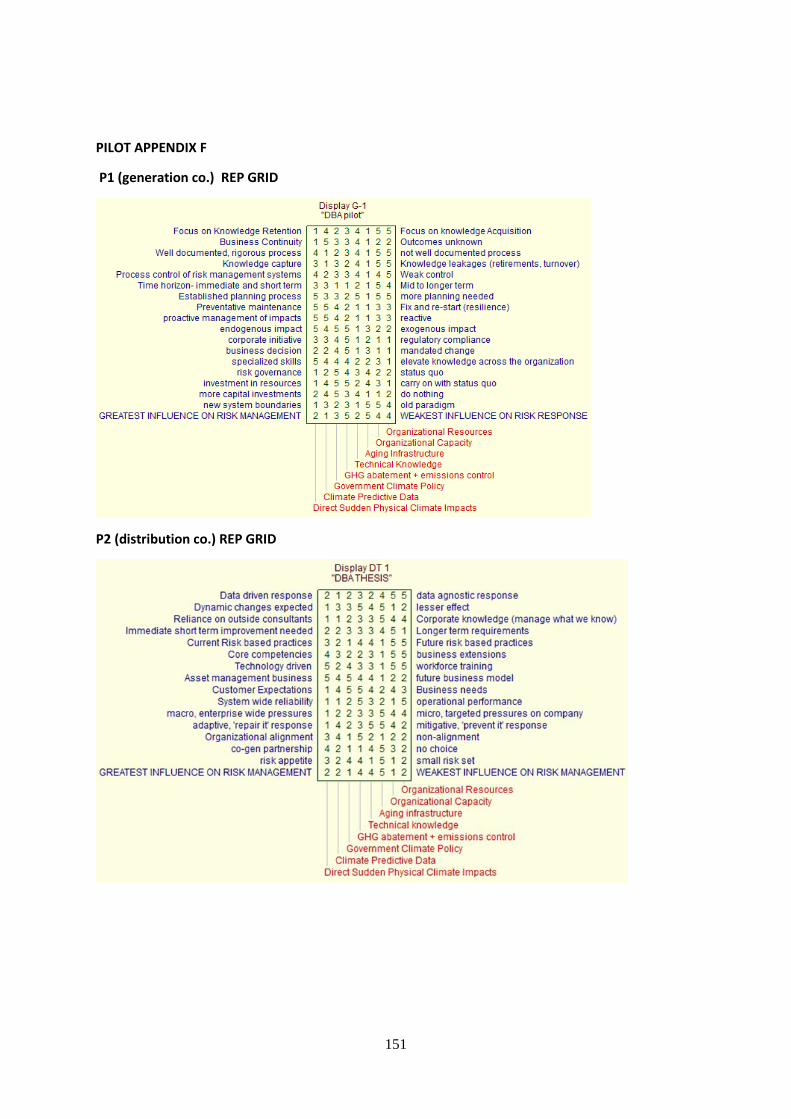
151
PILOT APPENDIX F
P1 (generation co.) REP GRID
P2 (distribution co.) REP GRID
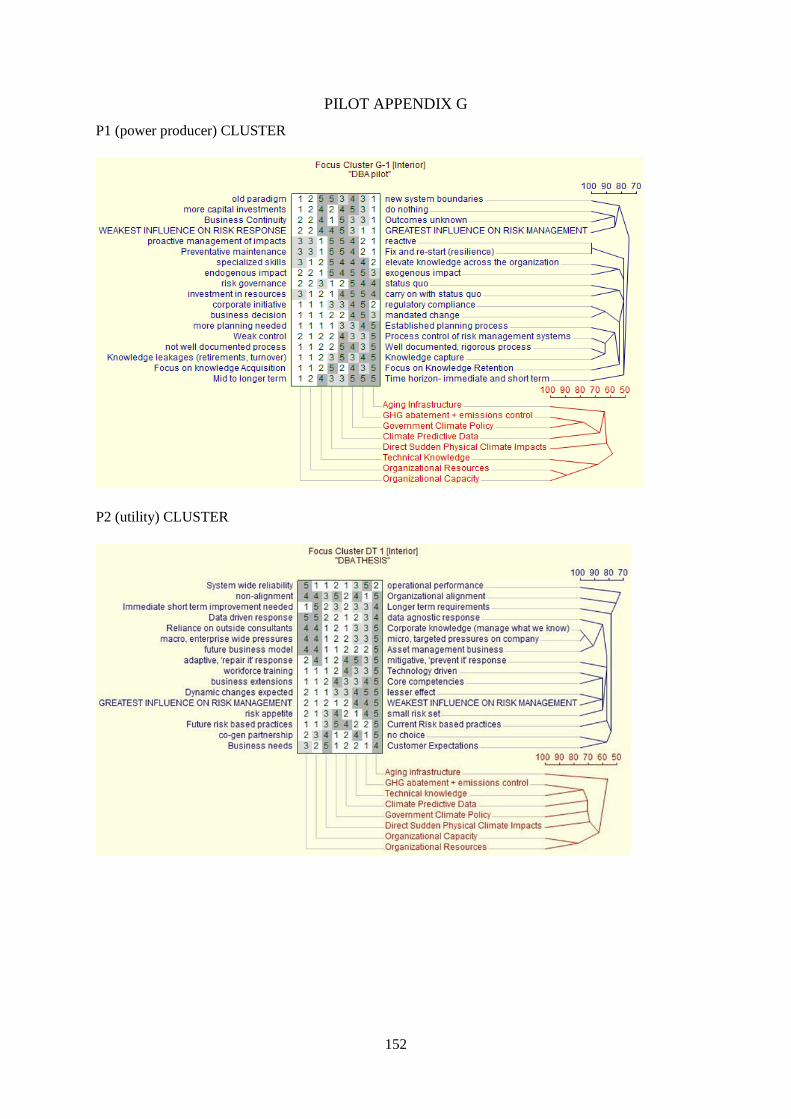
152
PILOT APPENDIX G
P1 (power producer) CLUSTER
P2 (utility) CLUSTER
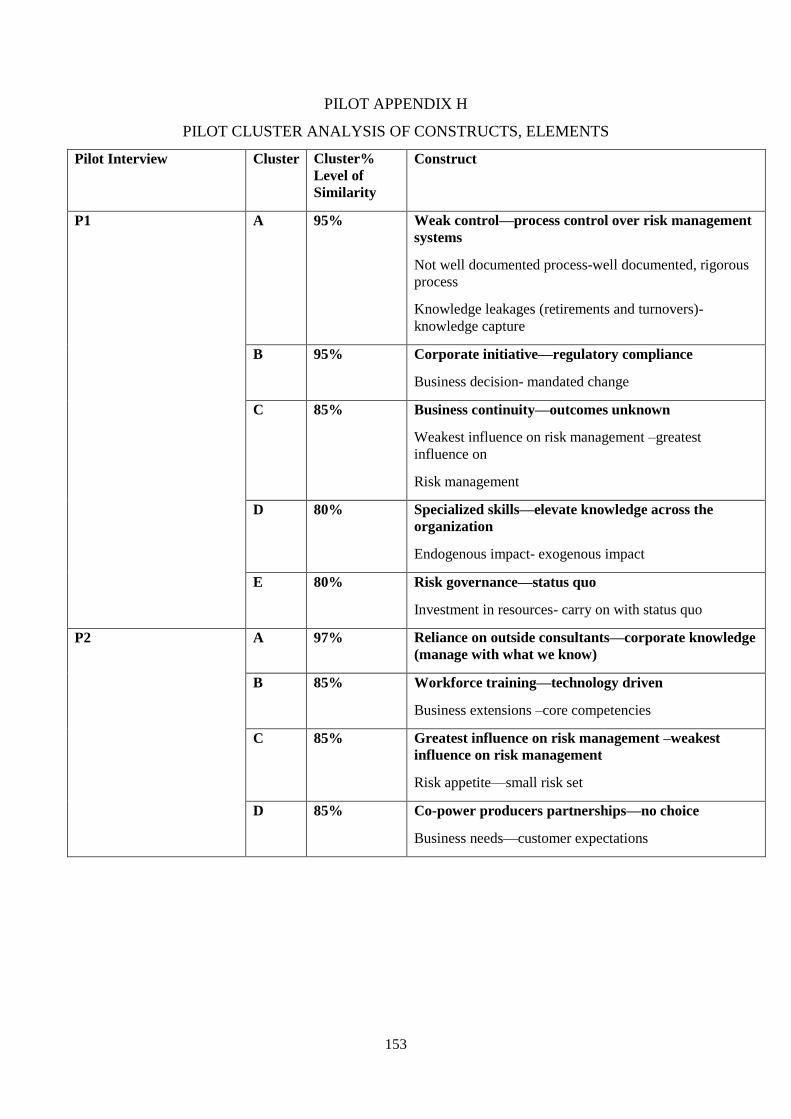
153
PILOT APPENDIX H
PILOT CLUSTER ANALYSIS OF CONSTRUCTS, ELEMENTS
Pilot Interview Cluster Cluster%
Level of
Similarity
Construct
P1 A 95% Weak control—process control over risk management
systems
Not well documented process-well documented, rigorous
process
Knowledge leakages (retirements and turnovers)-
knowledge capture
B 95% Corporate initiative—regulatory compliance
Business decision- mandated change
C 85% Business continuity—outcomes unknown
Weakest influence on risk management –greatest
influence on
Risk management
D 80% Specialized skills—elevate knowledge across the
organization
Endogenous impact- exogenous impact
E 80% Risk governance—status quo
Investment in resources- carry on with status quo
P2 A 97% Reliance on outside consultants—corporate knowledge
(manage with what we know)
B 85% Workforce training—technology driven
Business extensions –core competencies
C 85% Greatest influence on risk management –weakest
influence on risk management
Risk appetite—small risk set
D 85% Co-power producers partnerships—no choice
Business needs—customer expectations
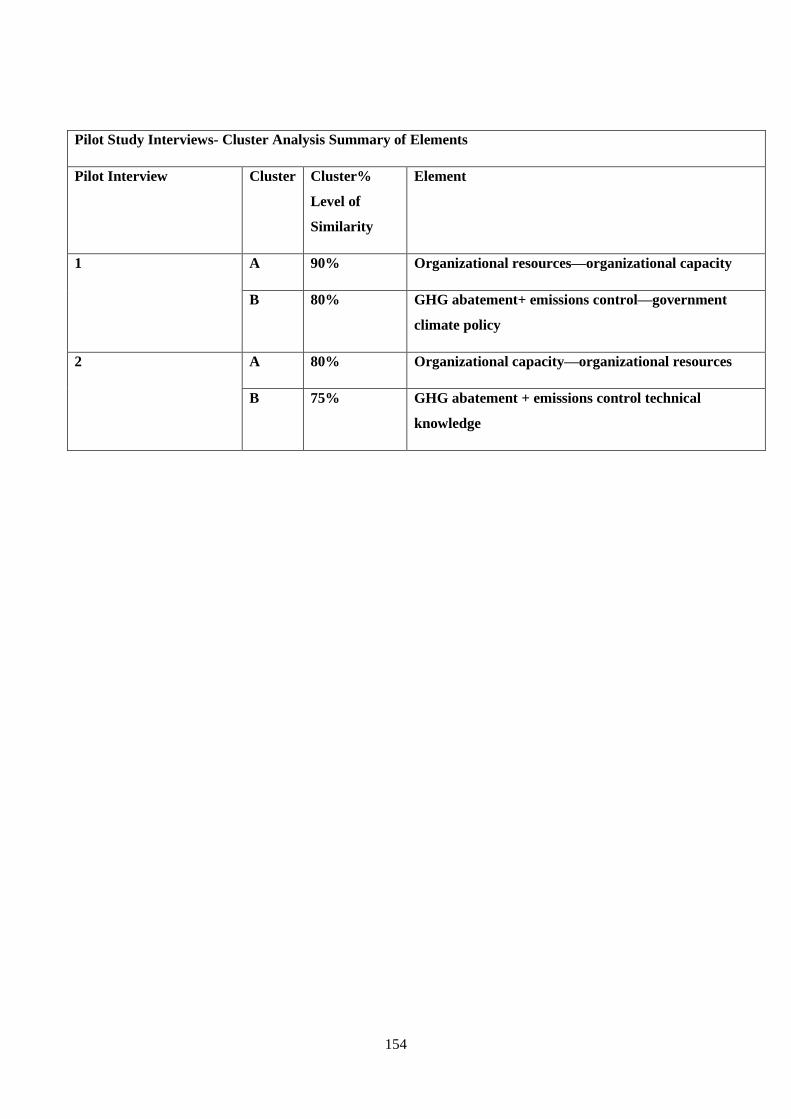
154
Pilot Study Interviews- Cluster Analysis Summary of Elements
Pilot Interview Cluster Cluster%
Level of
Similarity
Element
1 A 90% Organizational resources—organizational capacity
B 80% GHG abatement+ emissions control—government
climate policy
2 A 80% Organizational capacity—organizational resources
B 75% GHG abatement + emissions control technical
knowledge
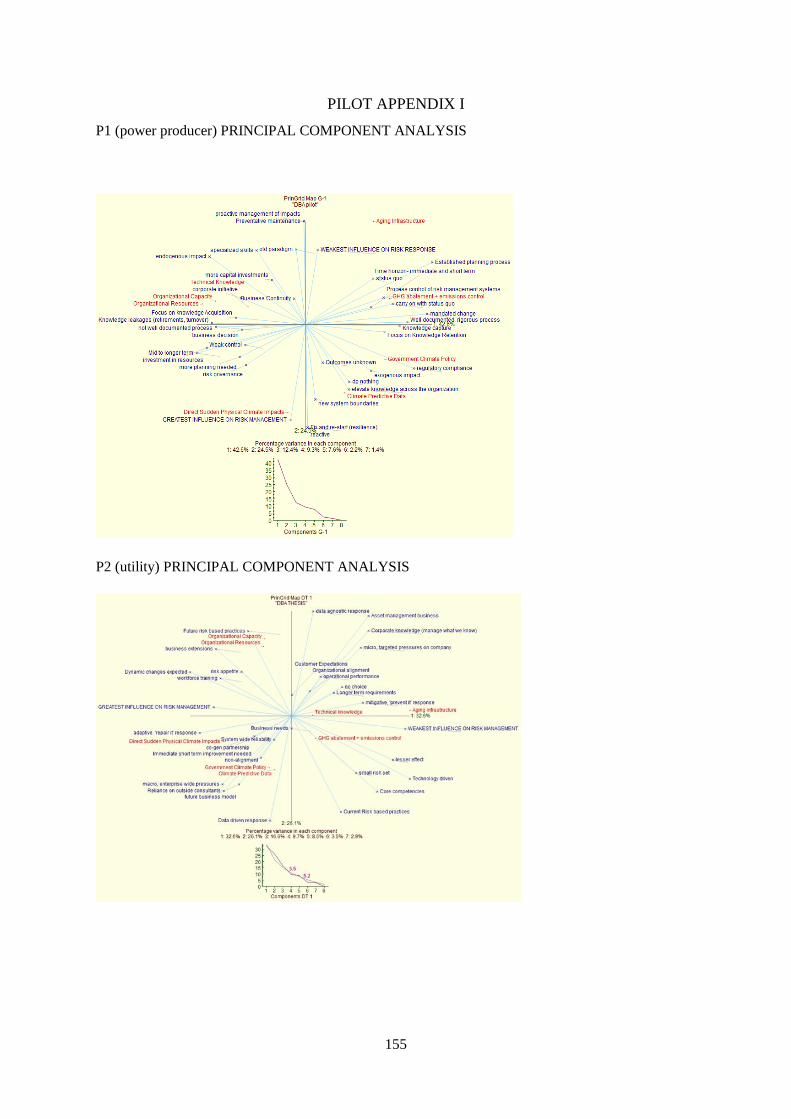
155
PILOT APPENDIX I
P1 (power producer) PRINCIPAL COMPONENT ANALYSIS
P2 (utility) PRINCIPAL COMPONENT ANALYSIS
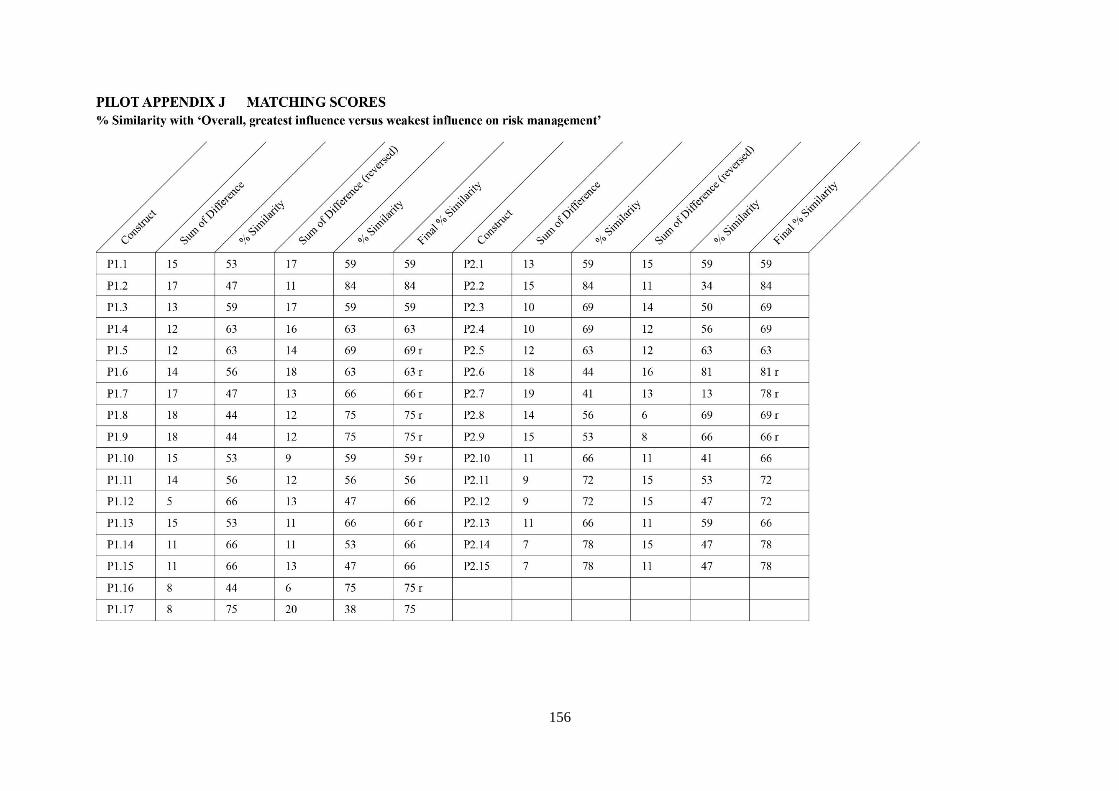
156
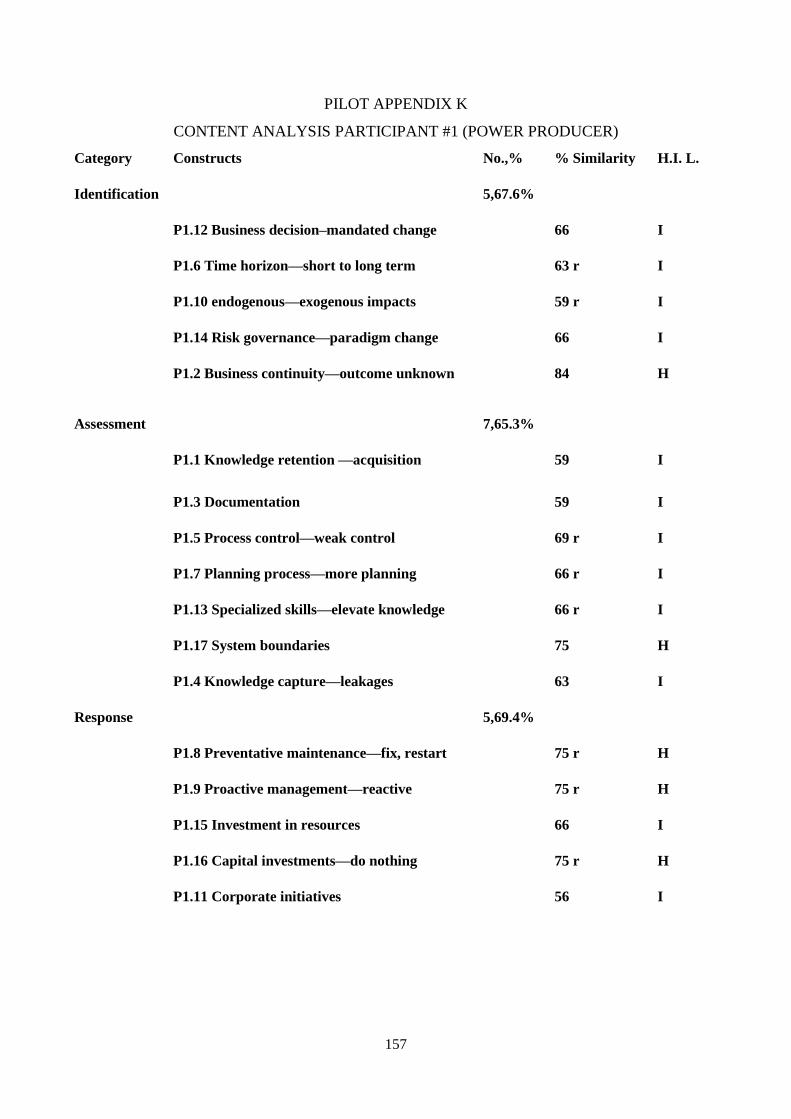
157
PILOT APPENDIX K
CONTENT ANALYSIS PARTICIPANT #1 (POWER PRODUCER)
Category Constructs No.,% % Similarity H.I. L.
Identification 5,67.6%
P1.12 Business decision–mandated change 66 I
P1.6 Time horizon—short to long term 63 r I
P1.10 endogenous—exogenous impacts 59 r I
P1.14 Risk governance—paradigm change 66 I
P1.2 Business continuity—outcome unknown 84 H
Assessment 7,65.3%
P1.1 Knowledge retention —acquisition 59 I
P1.3 Documentation 59 I
P1.5 Process control—weak control 69 r I
P1.7 Planning process—more planning 66 r I
P1.13 Specialized skills—elevate knowledge 66 r I
P1.17 System boundaries 75 H
P1.4 Knowledge capture—leakages 63 I
Response 5,69.4%
P1.8 Preventative maintenance—fix, restart 75 r H
P1.9 Proactive management—reactive 75 r H
P1.15 Investment in resources 66 I
P1.16 Capital investments—do nothing 75 r H
P1.11 Corporate initiatives 56 I
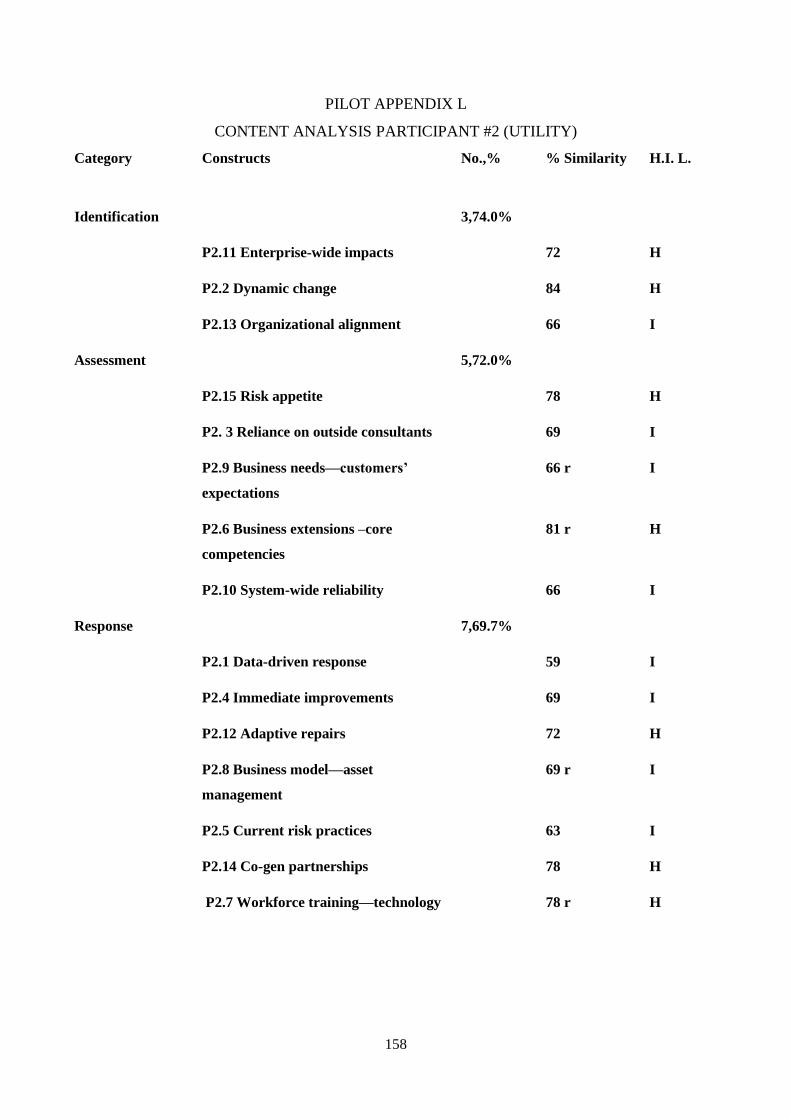
158
PILOT APPENDIX L
CONTENT ANALYSIS PARTICIPANT #2 (UTILITY)
Category Constructs No.,% % Similarity H.I. L.
Identification 3,74.0%
P2.11 Enterprise-wide impacts 72 H
P2.2 Dynamic change 84 H
P2.13 Organizational alignment 66 I
Assessment 5,72.0%
P2.15 Risk appetite 78 H
P2. 3 Reliance on outside consultants 69 I
P2.9 Business needs—customers’
expectations
66 r I
P2.6 Business extensions –core
competencies
81 r H
P2.10 System-wide reliability 66 I
Response 7,69.7%
P2.1 Data-driven response 59 I
P2.4 Immediate improvements 69 I
P2.12 Adaptive repairs 72 H
P2.8 Business model—asset
management
69 r I
P2.5 Current risk practices 63 I
P2.14 Co-gen partnerships 78 H
P2.7 Workforce training—technology 78 r H
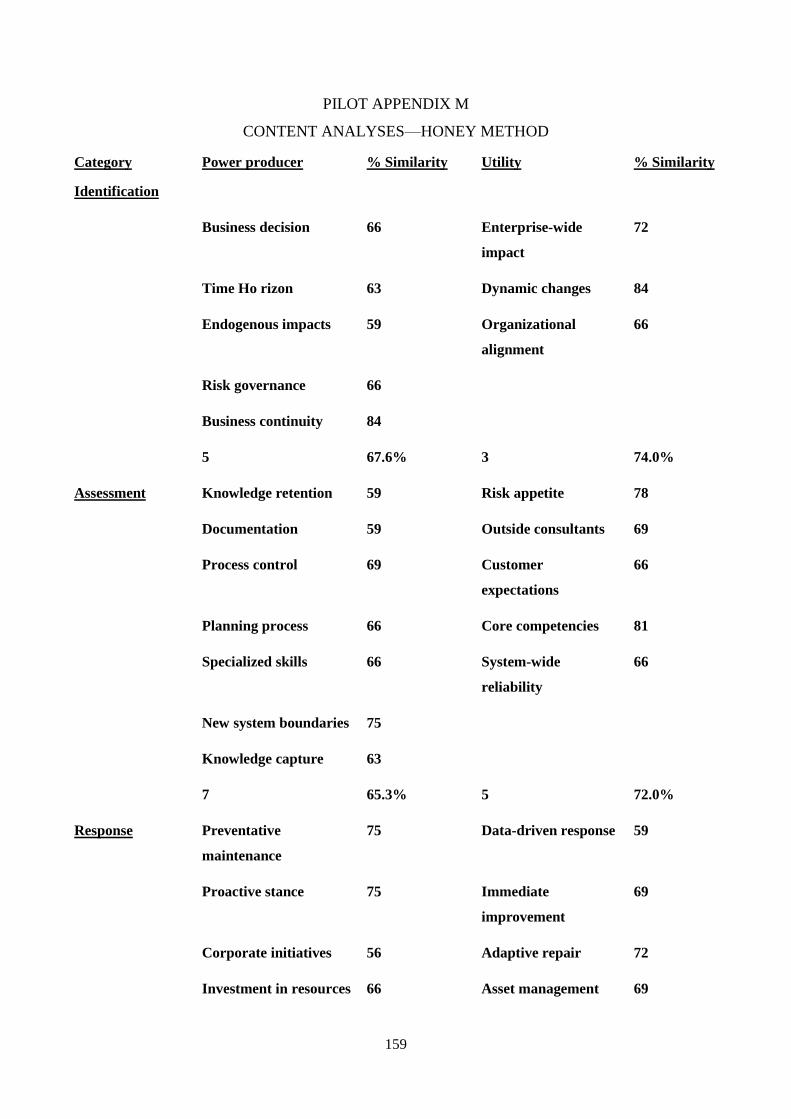
159
PILOT APPENDIX M
CONTENT ANALYSES—HONEY METHOD
Category Power producer % Similarity Utility % Similarity
Identification
Business decision 66 Enterprise-wide
impact
72
Time Ho rizon 63 Dynamic changes 84
Endogenous impacts 59 Organizational
alignment
66
Risk governance 66
Business continuity 84
5 67.6% 3 74.0%
Assessment Knowledge retention 59 Risk appetite 78
Documentation 59 Outside consultants 69
Process control 69 Customer
expectations
66
Planning process 66 Core competencies 81
Specialized skills 66 System-wide
reliability
66
New system boundaries 75
Knowledge capture 63
7 65.3% 5 72.0%
Response Preventative
maintenance
75 Data-driven response 59
Proactive stance 75 Immediate
improvement
69
Corporate initiatives 56 Adaptive repair 72
Investment in resources 66 Asset management 69

160
Capital investments 75 Current risk
practices
63
5 69.4% Co-gen partnerships 78
Technology
workforce
78
7
69.7%
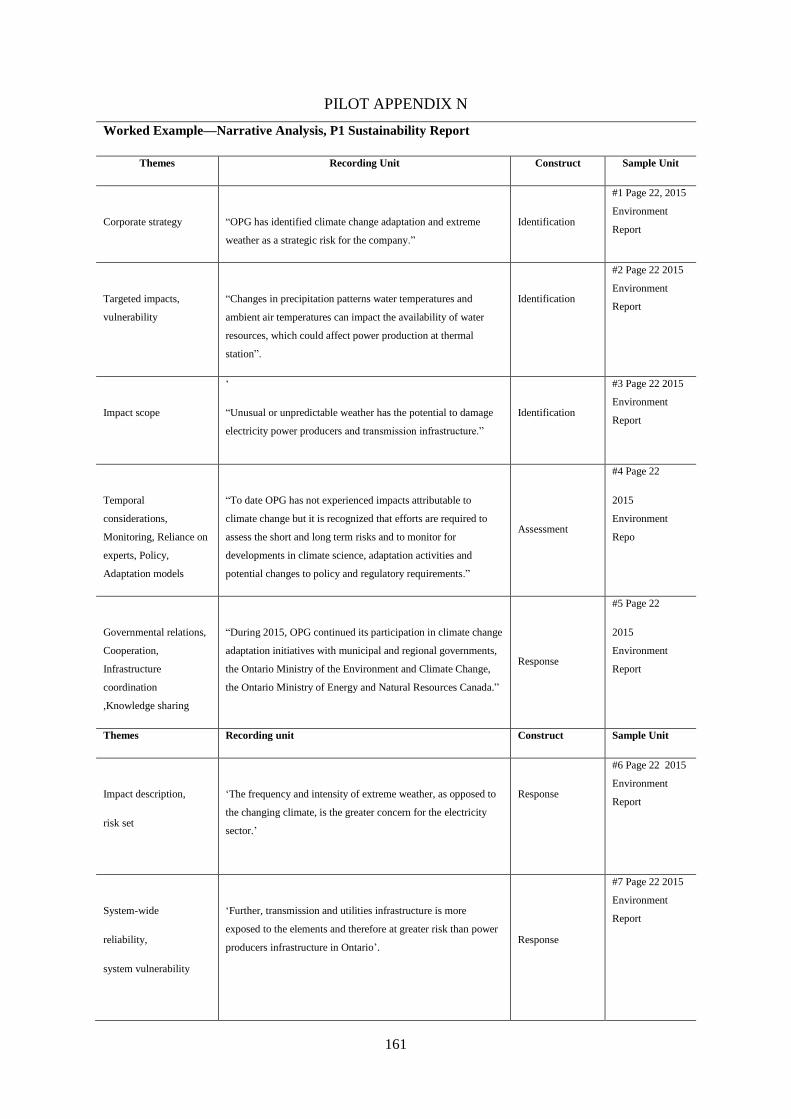
161
PILOT APPENDIX N
Worked Example—Narrative Analysis, P1 Sustainability Report
Themes Recording Unit Construct Sample Unit
Corporate strategy
“OPG has identified climate change adaptation and extreme
weather as a strategic risk for the company.”
Identification
#1 Page 22, 2015
Environment
Report
Targeted impacts,
vulnerability
“Changes in precipitation patterns water temperatures and
ambient air temperatures can impact the availability of water
resources, which could affect power production at thermal
station”.
Identification
#2 Page 22 2015
Environment
Report
Impact scope
‘
“Unusual or unpredictable weather has the potential to damage
electricity power producers and transmission infrastructure.”
Identification
#3 Page 22 2015
Environment
Report
Temporal
considerations,
Monitoring, Reliance on
experts, Policy,
Adaptation models
“To date OPG has not experienced impacts attributable to
climate change but it is recognized that efforts are required to
assess the short and long term risks and to monitor for
developments in climate science, adaptation activities and
potential changes to policy and regulatory requirements.”
Assessment
#4 Page 22
2015
Environment
Repo
Governmental relations,
Cooperation,
Infrastructure
coordination
,Knowledge sharing
“During 2015, OPG continued its participation in climate change
adaptation initiatives with municipal and regional governments,
the Ontario Ministry of the Environment and Climate Change,
the Ontario Ministry of Energy and Natural Resources Canada.”
Response
#5 Page 22
2015
Environment
Report
Themes Recording unit Construct Sample Unit
Impact description,
risk set
‘The frequency and intensity of extreme weather, as opposed to
the changing climate, is the greater concern for the electricity
sector.’
Response
#6 Page 22 2015
Environment
Report
System-wide
reliability,
system vulnerability
‘Further, transmission and utilities infrastructure is more
exposed to the elements and therefore at greater risk than power
producers infrastructure in Ontario’.
Response
#7 Page 22 2015
Environment
Report
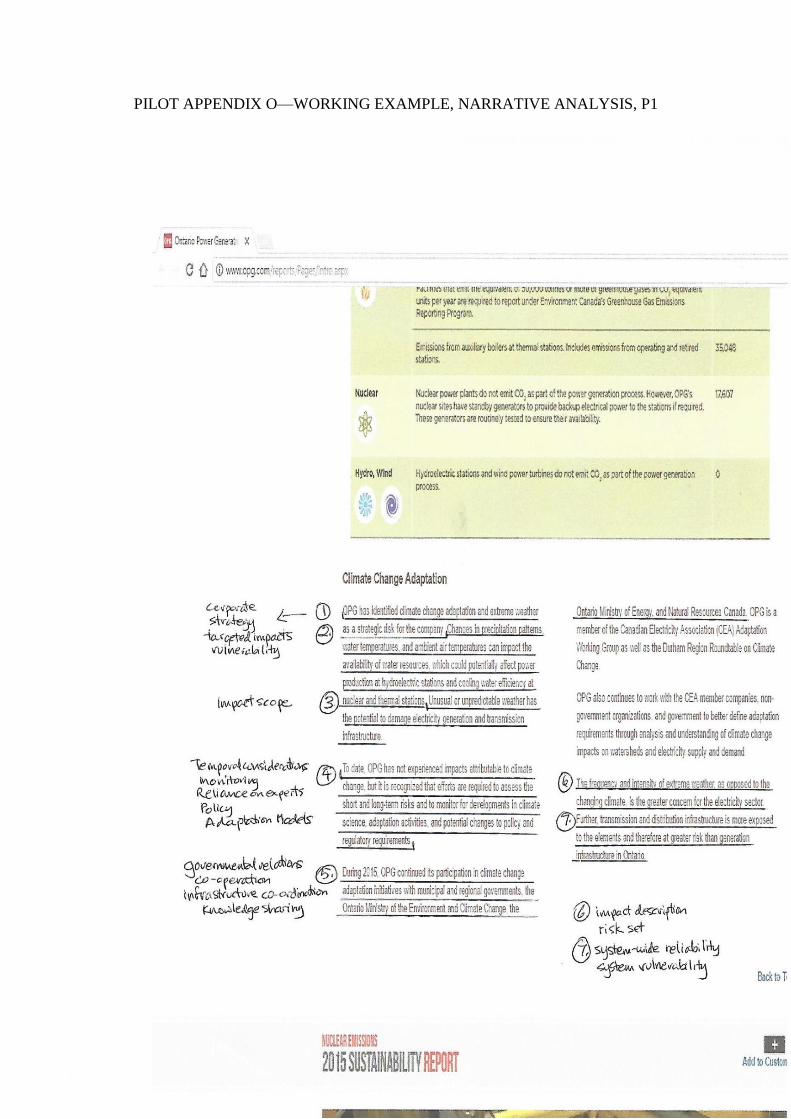
162
PILOT APPENDIX O—WORKING EXAMPLE, NARRATIVE ANALYSIS, P1
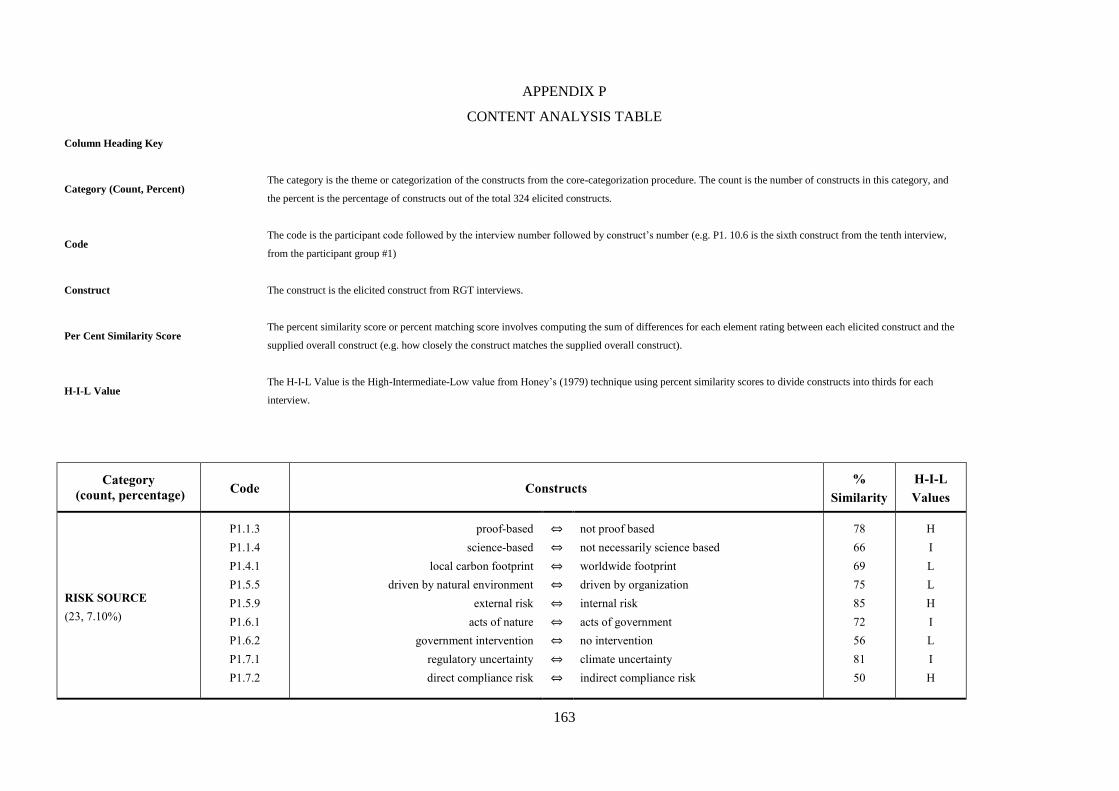
163
APPENDIX P
CONTENT ANALYSIS TABLE
Column Heading Key
Category (Count, Percent) The category is the theme or categorization of the constructs from the core-categorization procedure. The count is the number of constructs in this category, and
the percent is the percentage of constructs out of the total 324 elicited constructs.
Code The code is the participant code followed by the interview number followed by construct’s number (e.g. P1. 10.6 is the sixth construct from the tenth interview,
from the participant group #1)
Construct The construct is the elicited construct from RGT interviews.
Per Cent Similarity Score The percent similarity score or percent matching score involves computing the sum of differences for each element rating between each elicited construct and the
supplied overall construct (e.g. how closely the construct matches the supplied overall construct).
H-I-L Value The H-I-L Value is the High-Intermediate-Low value from Honey’s (1979) technique using percent similarity scores to divide constructs into thirds for each
interview.
Category
(count, percentage) Code Constructs
%
Similarity
H-I-L
Values
RISK SOURCE
(23, 7.10%)
P1.1.3
P1.1.4
P1.4.1
P1.5.5
P1.5.9
P1.6.1
P1.6.2
P1.7.1
P1.7.2
proof-based
science-based
local carbon footprint
driven by natural environment
external risk
acts of nature
government intervention
regulatory uncertainty
direct compliance risk
⇔
⇔
⇔
⇔
⇔
⇔
⇔
⇔
⇔
not proof based
not necessarily science based
worldwide footprint
driven by organization
internal risk
acts of government
no intervention
climate uncertainty
indirect compliance risk
78
66
69
75
85
72
56
81
50
H
I
L
L
H
I
L
I
H
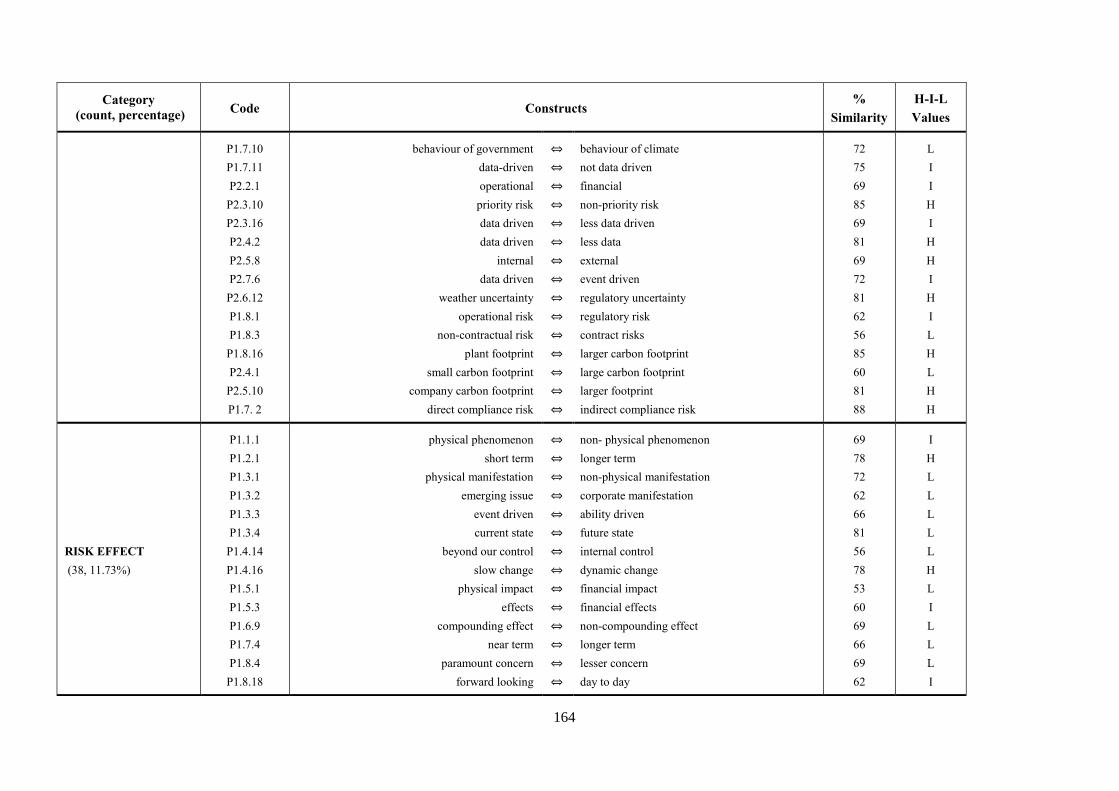
164
Category
(count, percentage) Code Constructs
%
Similarity
H-I-L
Values
P1.7.10
P1.7.11
P2.2.1
P2.3.10
P2.3.16
P2.4.2
P2.5.8
P2.7.6
P2.6.12
P1.8.1
P1.8.3
P1.8.16
P2.4.1
P2.5.10
P1.7. 2
behaviour of government
data-driven
operational
priority risk
data driven
data driven
internal
data driven
weather uncertainty
operational risk
non-contractual risk
plant footprint
small carbon footprint
company carbon footprint
direct compliance risk
⇔
⇔
⇔
⇔
⇔
⇔
⇔
⇔
⇔
⇔
⇔
⇔
⇔
⇔
⇔
behaviour of climate
not data driven
financial
non-priority risk
less data driven
less data
external
event driven
regulatory uncertainty
regulatory risk
contract risks
larger carbon footprint
large carbon footprint
larger footprint
indirect compliance risk
72
75
69
85
69
81
69
72
81
62
56
85
60
81
88
L
I
I
H
I
H
H
I
H
I
L
H
L
H
H
RISK EFFECT
(38, 11.73%)
P1.1.1
P1.2.1
P1.3.1
P1.3.2
P1.3.3
P1.3.4
P1.4.14
P1.4.16
P1.5.1
P1.5.3
P1.6.9
P1.7.4
P1.8.4
P1.8.18
physical phenomenon
short term
physical manifestation
emerging issue
event driven
current state
beyond our control
slow change
physical impact
effects
compounding effect
near term
paramount concern
forward looking
⇔
⇔
⇔
⇔
⇔
⇔
⇔
⇔
⇔
⇔
⇔
⇔
⇔
⇔
non- physical phenomenon
longer term
non-physical manifestation
corporate manifestation
ability driven
future state
internal control
dynamic change
financial impact
financial effects
non-compounding effect
longer term
lesser concern
day to day
69
78
72
62
66
81
56
78
53
60
69
66
69
62
I
H
L
L
L
L
L
H
L
I
L
L
L
I
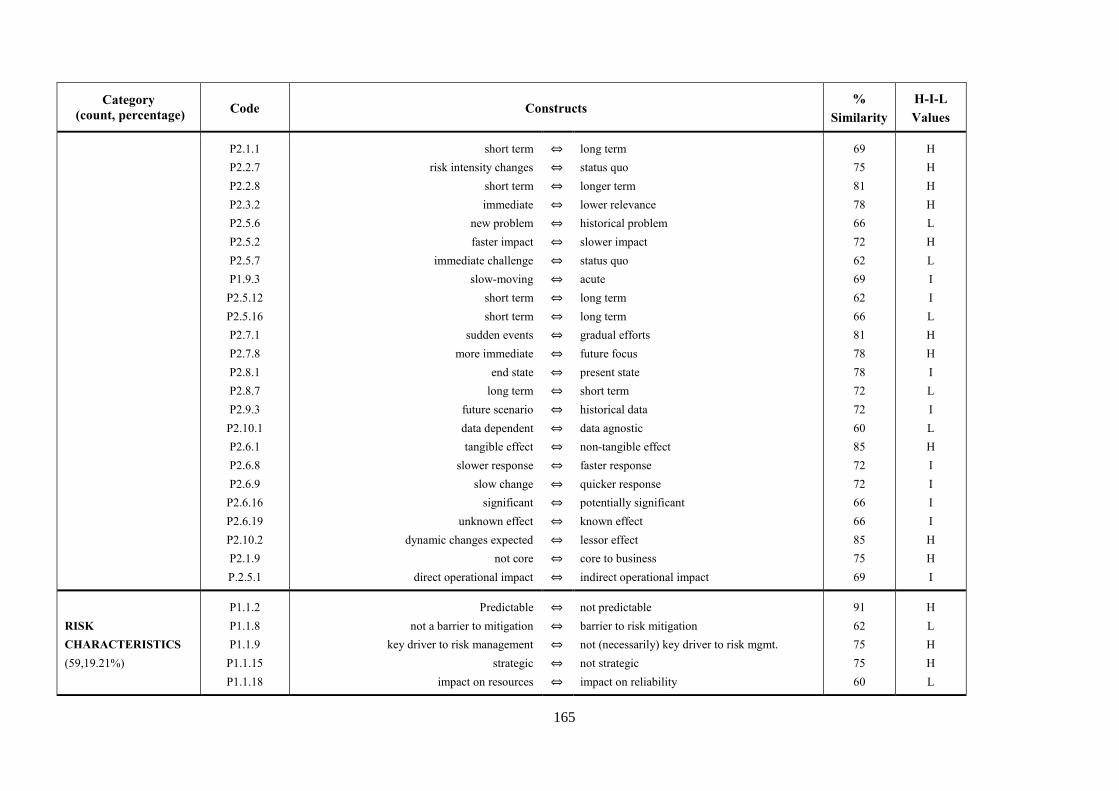
165
Category
(count, percentage) Code Constructs
%
Similarity
H-I-L
Values
P2.1.1
P2.2.7
P2.2.8
P2.3.2
P2.5.6
P2.5.2
P2.5.7
P1.9.3
P2.5.12
P2.5.16
P2.7.1
P2.7.8
P2.8.1
P2.8.7
P2.9.3
P2.10.1
P2.6.1
P2.6.8
P2.6.9
P2.6.16
P2.6.19
P2.10.2
P2.1.9
P.2.5.1
short term
risk intensity changes
short term
immediate
new problem
faster impact
immediate challenge
slow-moving
short term
short term
sudden events
more immediate
end state
long term
future scenario
data dependent
tangible effect
slower response
slow change
significant
unknown effect
dynamic changes expected
not core
direct operational impact
⇔
⇔
⇔
⇔
⇔
⇔
⇔
⇔
⇔
⇔
⇔
⇔
⇔
⇔
⇔
⇔
⇔
⇔
⇔
⇔
⇔
⇔
⇔
⇔
long term
status quo
longer term
lower relevance
historical problem
slower impact
status quo
acute
long term
long term
gradual efforts
future focus
present state
short term
historical data
data agnostic
non-tangible effect
faster response
quicker response
potentially significant
known effect
lessor effect
core to business
indirect operational impact
69
75
81
78
66
72
62
69
62
66
81
78
78
72
72
60
85
72
72
66
66
85
75
69
H
H
H
H
L
H
L
I
I
L
H
H
I
L
I
L
H
I
I
I
I
H
H
I
RISK
CHARACTERISTICS
(59,19.21%)
P1.1.2
P1.1.8
P1.1.9
P1.1.15
P1.1.18
Predictable
not a barrier to mitigation
key driver to risk management
strategic
impact on resources
⇔
⇔
⇔
⇔
⇔
not predictable
barrier to risk mitigation
not (necessarily) key driver to risk mgmt.
not strategic
impact on reliability
91
62
75
75
60
H
L
H
H
L
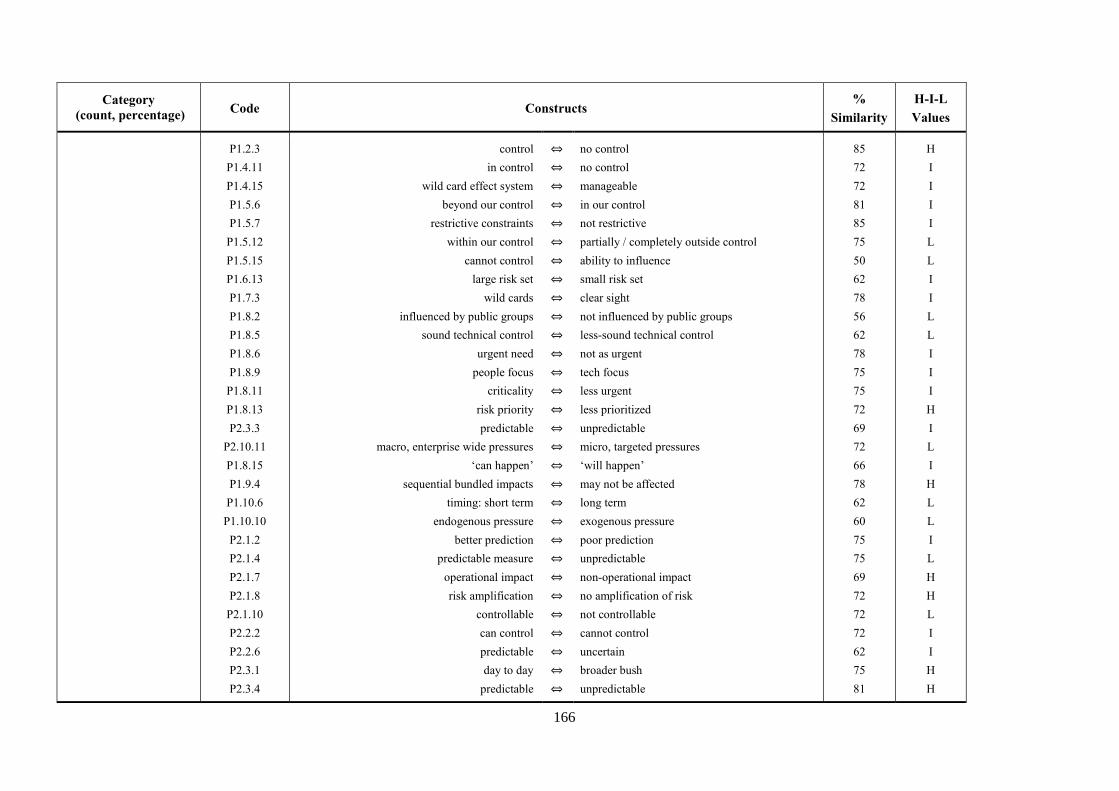
166
Category
(count, percentage) Code Constructs
%
Similarity
H-I-L
Values
P1.2.3
P1.4.11
P1.4.15
P1.5.6
P1.5.7
P1.5.12
P1.5.15
P1.6.13
P1.7.3
P1.8.2
P1.8.5
P1.8.6
P1.8.9
P1.8.11
P1.8.13
P2.3.3
P2.10.11
P1.8.15
P1.9.4
P1.10.6
P1.10.10
P2.1.2
P2.1.4
P2.1.7
P2.1.8
P2.1.10
P2.2.2
P2.2.6
P2.3.1
P2.3.4
control
in control
wild card effect system
beyond our control
restrictive constraints
within our control
cannot control
large risk set
wild cards
influenced by public groups
sound technical control
urgent need
people focus
criticality
risk priority
predictable
macro, enterprise wide pressures
‘can happen’
sequential bundled impacts
timing: short term
endogenous pressure
better prediction
predictable measure
operational impact
risk amplification
controllable
can control
predictable
day to day
predictable
⇔
⇔
⇔
⇔
⇔
⇔
⇔
⇔
⇔
⇔
⇔
⇔
⇔
⇔
⇔
⇔
⇔
⇔
⇔
⇔
⇔
⇔
⇔
⇔
⇔
⇔
⇔
⇔
⇔
⇔
no control
no control
manageable
in our control
not restrictive
partially / completely outside control
ability to influence
small risk set
clear sight
not influenced by public groups
less-sound technical control
not as urgent
tech focus
less urgent
less prioritized
unpredictable
micro, targeted pressures
‘will happen’
may not be affected
long term
exogenous pressure
poor prediction
unpredictable
non-operational impact
no amplification of risk
not controllable
cannot control
uncertain
broader bush
unpredictable
85
72
72
81
85
75
50
62
78
56
62
78
75
75
72
69
72
66
78
62
60
75
75
69
72
72
72
62
75
81
H
I
I
I
I
L
L
I
I
L
L
I
I
I
H
I
L
I
H
L
L
I
L
H
H
L
I
I
H
H
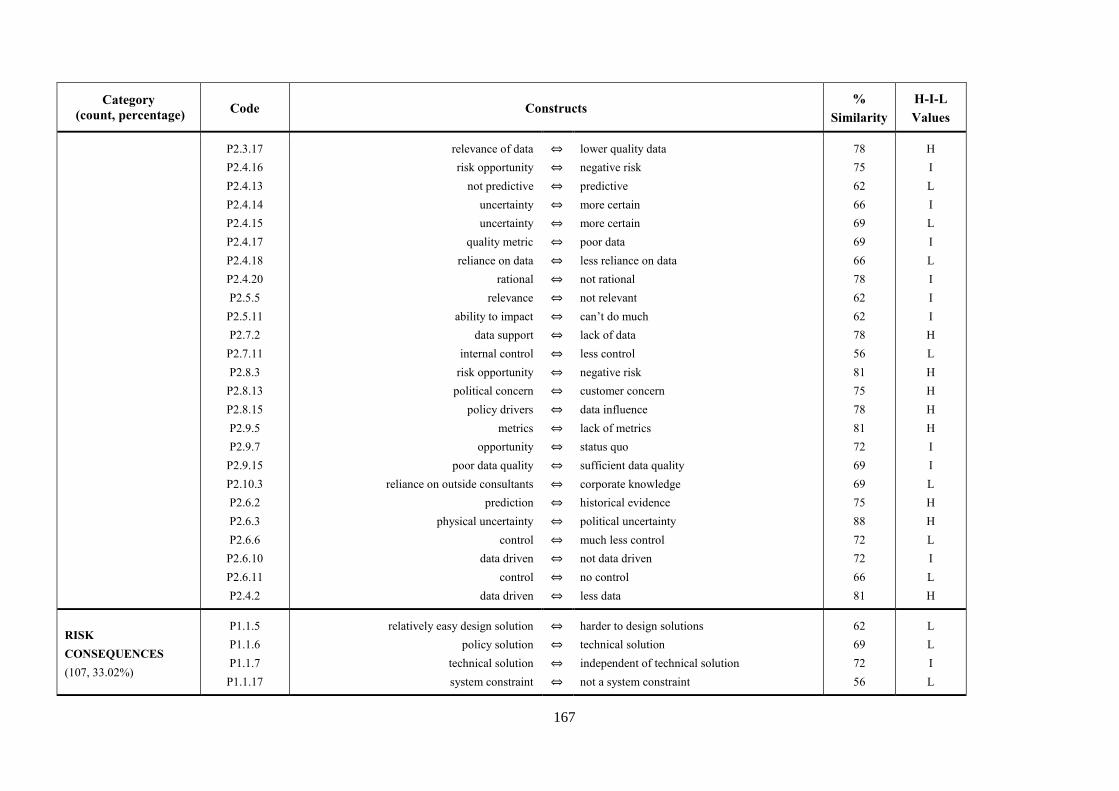
167
Category
(count, percentage) Code Constructs
%
Similarity
H-I-L
Values
P2.3.17
P2.4.16
P2.4.13
P2.4.14
P2.4.15
P2.4.17
P2.4.18
P2.4.20
P2.5.5
P2.5.11
P2.7.2
P2.7.11
P2.8.3
P2.8.13
P2.8.15
P2.9.5
P2.9.7
P2.9.15
P2.10.3
P2.6.2
P2.6.3
P2.6.6
P2.6.10
P2.6.11
P2.4.2
relevance of data
risk opportunity
not predictive
uncertainty
uncertainty
quality metric
reliance on data
rational
relevance
ability to impact
data support
internal control
risk opportunity
political concern
policy drivers
metrics
opportunity
poor data quality
reliance on outside consultants
prediction
physical uncertainty
control
data driven
control
data driven
⇔
⇔
⇔
⇔
⇔
⇔
⇔
⇔
⇔
⇔
⇔
⇔
⇔
⇔
⇔
⇔
⇔
⇔
⇔
⇔
⇔
⇔
⇔
⇔
⇔
lower quality data
negative risk
predictive
more certain
more certain
poor data
less reliance on data
not rational
not relevant
can’t do much
lack of data
less control
negative risk
customer concern
data influence
lack of metrics
status quo
sufficient data quality
corporate knowledge
historical evidence
political uncertainty
much less control
not data driven
no control
less data
78
75
62
66
69
69
66
78
62
62
78
56
81
75
78
81
72
69
69
75
88
72
72
66
81
H
I
L
I
L
I
L
I
I
I
H
L
H
H
H
H
I
I
L
H
H
L
I
L
H
RISK
CONSEQUENCES
(107, 33.02%)
P1.1.5
P1.1.6
P1.1.7
P1.1.17
relatively easy design solution
policy solution
technical solution
system constraint
⇔
⇔
⇔
⇔
harder to design solutions
technical solution
independent of technical solution
not a system constraint
62
69
72
56
L
L
I
L
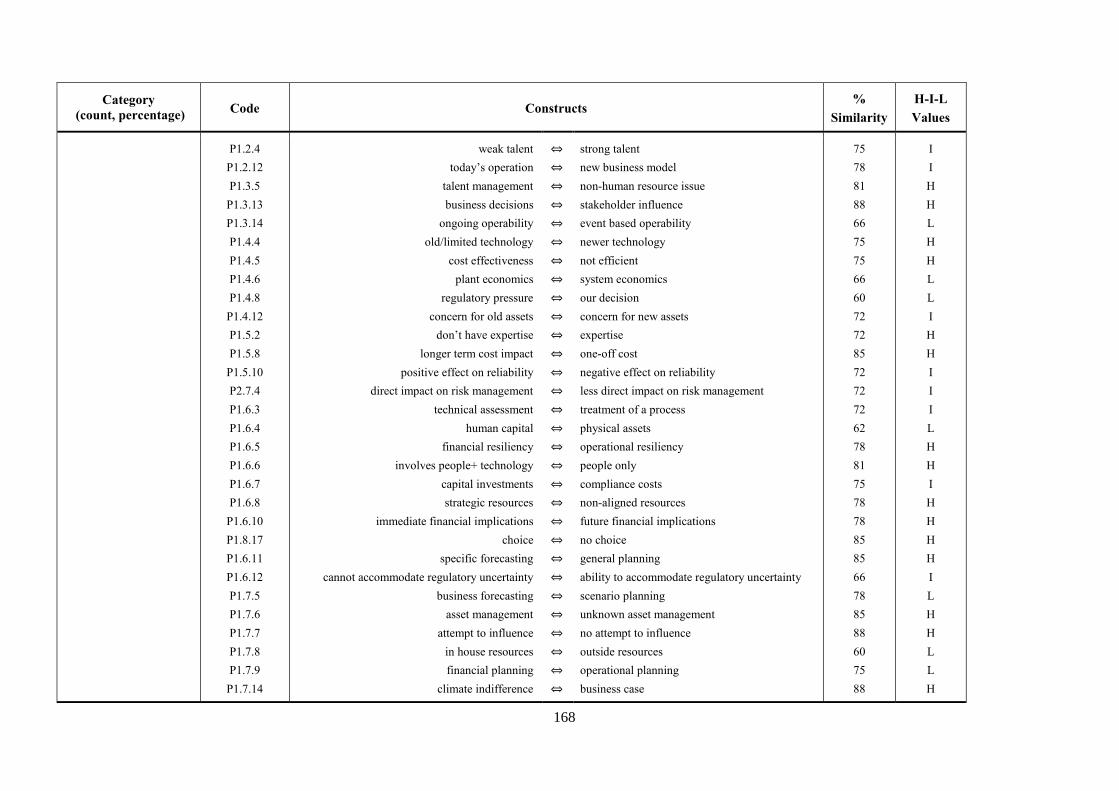
168
Category
(count, percentage) Code Constructs
%
Similarity
H-I-L
Values
P1.2.4
P1.2.12
P1.3.5
P1.3.13
P1.3.14
P1.4.4
P1.4.5
P1.4.6
P1.4.8
P1.4.12
P1.5.2
P1.5.8
P1.5.10
P2.7.4
P1.6.3
P1.6.4
P1.6.5
P1.6.6
P1.6.7
P1.6.8
P1.6.10
P1.8.17
P1.6.11
P1.6.12
P1.7.5
P1.7.6
P1.7.7
P1.7.8
P1.7.9
P1.7.14
weak talent
today’s operation
talent management
business decisions
ongoing operability
old/limited technology
cost effectiveness
plant economics
regulatory pressure
concern for old assets
don’t have expertise
longer term cost impact
positive effect on reliability
direct impact on risk management
technical assessment
human capital
financial resiliency
involves people+ technology
capital investments
strategic resources
immediate financial implications
choice
specific forecasting
cannot accommodate regulatory uncertainty
business forecasting
asset management
attempt to influence
in house resources
financial planning
climate indifference
⇔
⇔
⇔
⇔
⇔
⇔
⇔
⇔
⇔
⇔
⇔
⇔
⇔
⇔
⇔
⇔
⇔
⇔
⇔
⇔
⇔
⇔
⇔
⇔
⇔
⇔
⇔
⇔
⇔
⇔
strong talent
new business model
non-human resource issue
stakeholder influence
event based operability
newer technology
not efficient
system economics
our decision
concern for new assets
expertise
one-off cost
negative effect on reliability
less direct impact on risk management
treatment of a process
physical assets
operational resiliency
people only
compliance costs
non-aligned resources
future financial implications
no choice
general planning
ability to accommodate regulatory uncertainty
scenario planning
unknown asset management
no attempt to influence
outside resources
operational planning
business case
75
78
81
88
66
75
75
66
60
72
72
85
72
72
72
62
78
81
75
78
78
85
85
66
78
85
88
60
75
88
I
I
H
H
L
H
H
L
L
I
H
H
I
I
I
L
H
H
I
H
H
H
H
I
L
H
H
L
L
H
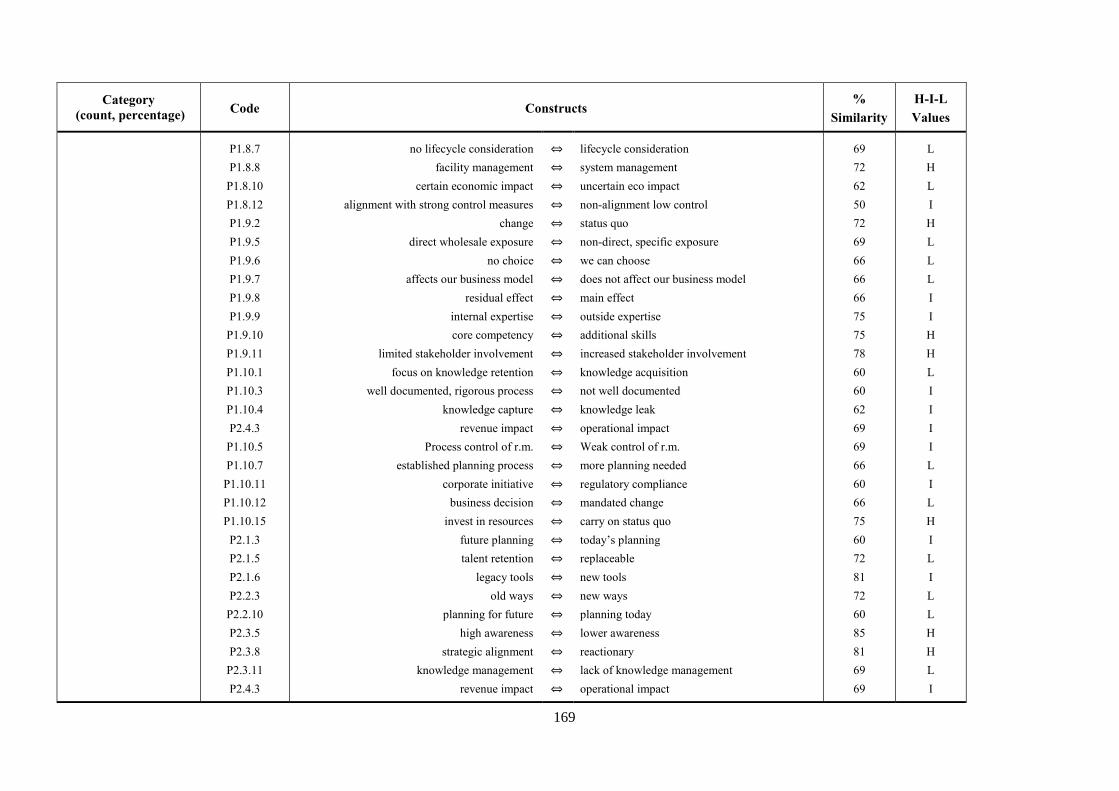
169
Category
(count, percentage) Code Constructs
%
Similarity
H-I-L
Values
P1.8.7
P1.8.8
P1.8.10
P1.8.12
P1.9.2
P1.9.5
P1.9.6
P1.9.7
P1.9.8
P1.9.9
P1.9.10
P1.9.11
P1.10.1
P1.10.3
P1.10.4
P2.4.3
P1.10.5
P1.10.7
P1.10.11
P1.10.12
P1.10.15
P2.1.3
P2.1.5
P2.1.6
P2.2.3
P2.2.10
P2.3.5
P2.3.8
P2.3.11
P2.4.3
no lifecycle consideration
facility management
certain economic impact
alignment with strong control measures
change
direct wholesale exposure
no choice
affects our business model
residual effect
internal expertise
core competency
limited stakeholder involvement
focus on knowledge retention
well documented, rigorous process
knowledge capture
revenue impact
Process control of r.m.
established planning process
corporate initiative
business decision
invest in resources
future planning
talent retention
legacy tools
old ways
planning for future
high awareness
strategic alignment
knowledge management
revenue impact
⇔
⇔
⇔
⇔
⇔
⇔
⇔
⇔
⇔
⇔
⇔
⇔
⇔
⇔
⇔
⇔
⇔
⇔
⇔
⇔
⇔
⇔
⇔
⇔
⇔
⇔
⇔
⇔
⇔
⇔
lifecycle consideration
system management
uncertain eco impact
non-alignment low control
status quo
non-direct, specific exposure
we can choose
does not affect our business model
main effect
outside expertise
additional skills
increased stakeholder involvement
knowledge acquisition
not well documented
knowledge leak
operational impact
Weak control of r.m.
more planning needed
regulatory compliance
mandated change
carry on status quo
today’s planning
replaceable
new tools
new ways
planning today
lower awareness
reactionary
lack of knowledge management
operational impact
69
72
62
50
72
69
66
66
66
75
75
78
60
60
62
69
69
66
60
66
75
60
72
81
72
60
85
81
69
69
L
H
L
I
H
L
L
L
I
I
H
H
L
I
I
I
I
L
I
L
H
I
L
I
L
L
H
H
L
I
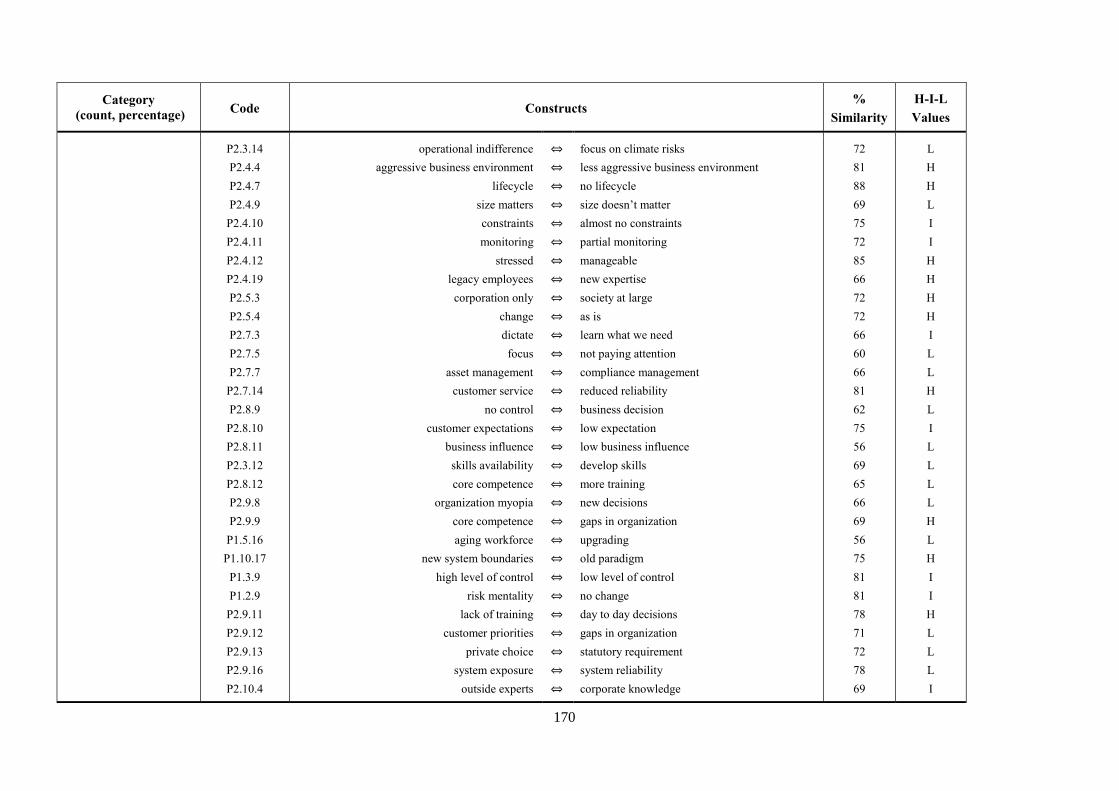
170
Category
(count, percentage) Code Constructs
%
Similarity
H-I-L
Values
P2.3.14
P2.4.4
P2.4.7
P2.4.9
P2.4.10
P2.4.11
P2.4.12
P2.4.19
P2.5.3
P2.5.4
P2.7.3
P2.7.5
P2.7.7
P2.7.14
P2.8.9
P2.8.10
P2.8.11
P2.3.12
P2.8.12
P2.9.8
P2.9.9
P1.5.16
P1.10.17
P1.3.9
P1.2.9
P2.9.11
P2.9.12
P2.9.13
P2.9.16
P2.10.4
operational indifference
aggressive business environment
lifecycle
size matters
constraints
monitoring
stressed
legacy employees
corporation only
change
dictate
focus
asset management
customer service
no control
customer expectations
business influence
skills availability
core competence
organization myopia
core competence
aging workforce
new system boundaries
high level of control
risk mentality
lack of training
customer priorities
private choice
system exposure
outside experts
⇔
⇔
⇔
⇔
⇔
⇔
⇔
⇔
⇔
⇔
⇔
⇔
⇔
⇔
⇔
⇔
⇔
⇔
⇔
⇔
⇔
⇔
⇔
⇔
⇔
⇔
⇔
⇔
⇔
⇔
focus on climate risks
less aggressive business environment
no lifecycle
size doesn’t matter
almost no constraints
partial monitoring
manageable
new expertise
society at large
as is
learn what we need
not paying attention
compliance management
reduced reliability
business decision
low expectation
low business influence
develop skills
more training
new decisions
gaps in organization
upgrading
old paradigm
low level of control
no change
day to day decisions
gaps in organization
statutory requirement
system reliability
corporate knowledge
72
81
88
69
75
72
85
66
72
72
66
60
66
81
62
75
56
69
65
66
69
56
75
81
81
78
71
72
78
69
L
H
H
L
I
I
H
H
H
H
I
L
L
H
L
I
L
L
L
L
H
L
H
I
I
H
L
L
L
I
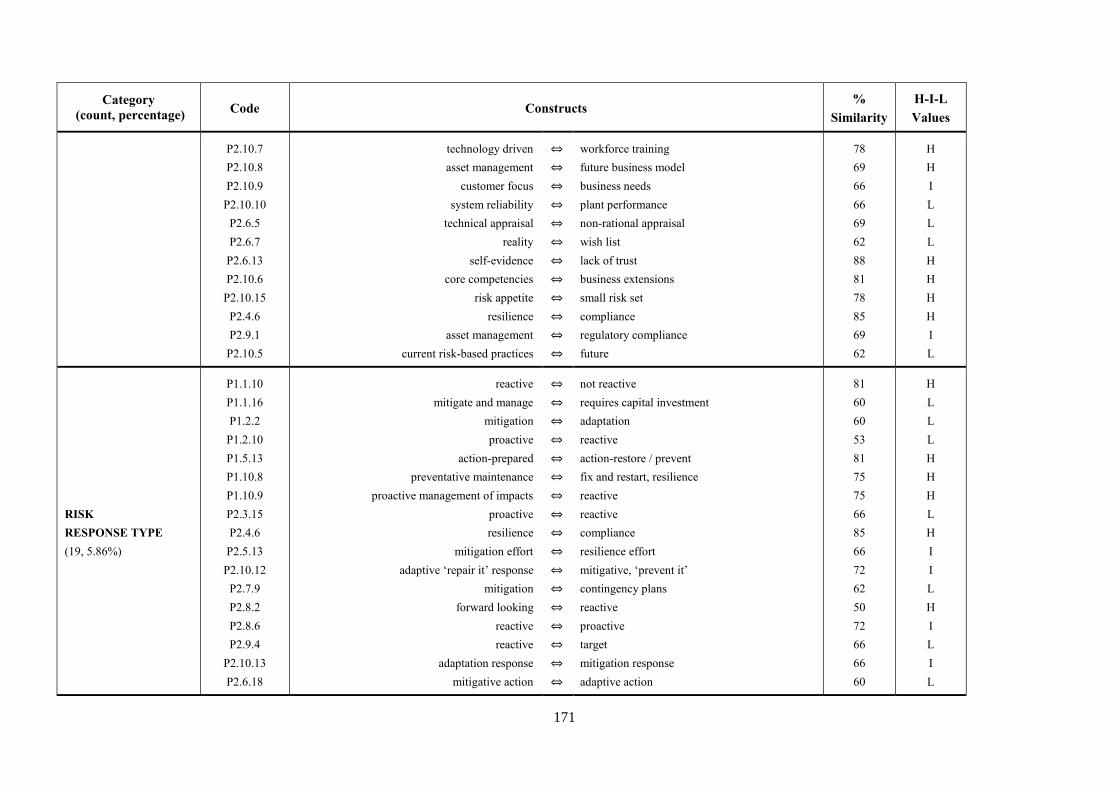
171
Category
(count, percentage) Code Constructs
%
Similarity
H-I-L
Values
P2.10.7
P2.10.8
P2.10.9
P2.10.10
P2.6.5
P2.6.7
P2.6.13
P2.10.6
P2.10.15
P2.4.6
P2.9.1
P2.10.5
technology driven
asset management
customer focus
system reliability
technical appraisal
reality
self-evidence
core competencies
risk appetite
resilience
asset management
current risk-based practices
⇔
⇔
⇔
⇔
⇔
⇔
⇔
⇔
⇔
⇔
⇔
⇔
workforce training
future business model
business needs
plant performance
non-rational appraisal
wish list
lack of trust
business extensions
small risk set
compliance
regulatory compliance
future
78
69
66
66
69
62
88
81
78
85
69
62
H
H
I
L
L
L
H
H
H
H
I
L
RISK
RESPONSE TYPE
(19, 5.86%)
P1.1.10
P1.1.16
P1.2.2
P1.2.10
P1.5.13
P1.10.8
P1.10.9
P2.3.15
P2.4.6
P2.5.13
P2.10.12
P2.7.9
P2.8.2
P2.8.6
P2.9.4
P2.10.13
P2.6.18
reactive
mitigate and manage
mitigation
proactive
action-prepared
preventative maintenance
proactive management of impacts
proactive
resilience
mitigation effort
adaptive ‘repair it’ response
mitigation
forward looking
reactive
reactive
adaptation response
mitigative action
⇔
⇔
⇔
⇔
⇔
⇔
⇔
⇔
⇔
⇔
⇔
⇔
⇔
⇔
⇔
⇔
⇔
not reactive
requires capital investment
adaptation
reactive
action-restore / prevent
fix and restart, resilience
reactive
reactive
compliance
resilience effort
mitigative, ‘prevent it’
contingency plans
reactive
proactive
target
mitigation response
adaptive action
81
60
60
53
81
75
75
66
85
66
72
62
50
72
66
66
60
H
L
L
L
H
H
H
L
H
I
I
L
H
I
L
I
L
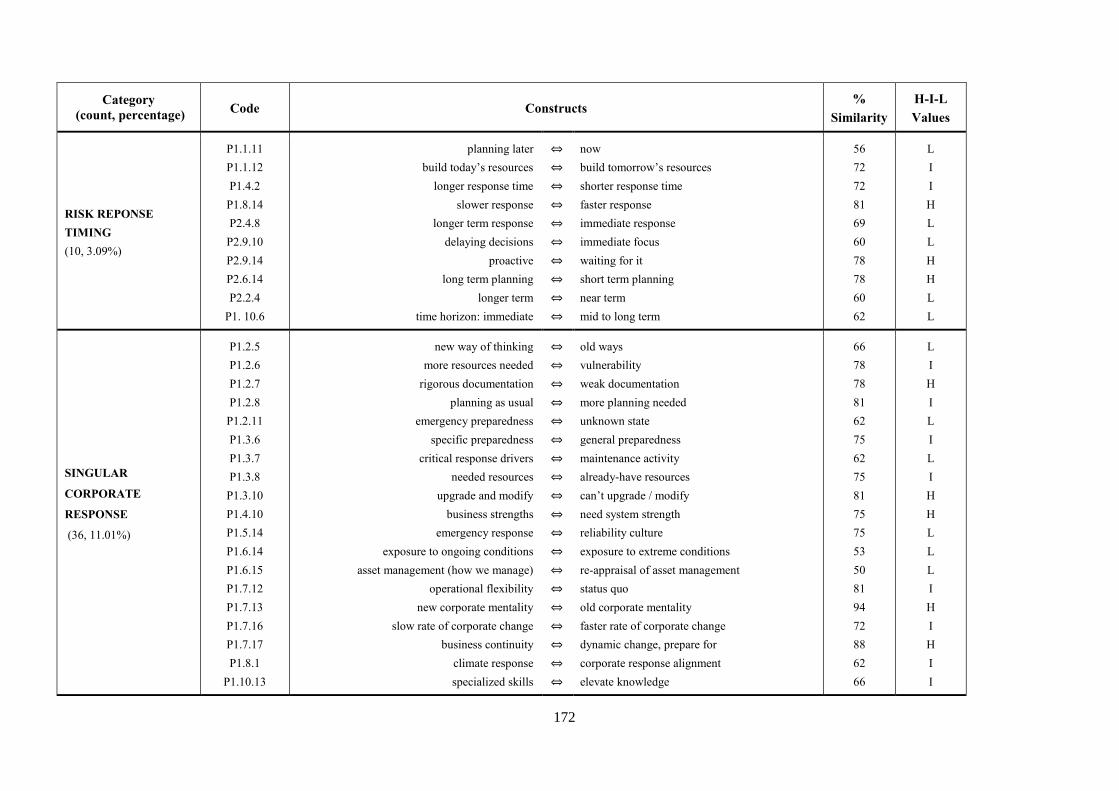
172
Category
(count, percentage) Code Constructs
%
Similarity
H-I-L
Values
RISK REPONSE
TIMING
(10, 3.09%)
P1.1.11
P1.1.12
P1.4.2
P1.8.14
P2.4.8
P2.9.10
P2.9.14
P2.6.14
P2.2.4
P1. 10.6
planning later
build today’s resources
longer response time
slower response
longer term response
delaying decisions
proactive
long term planning
longer term
time horizon: immediate
⇔
⇔
⇔
⇔
⇔
⇔
⇔
⇔
⇔
⇔
now
build tomorrow’s resources
shorter response time
faster response
immediate response
immediate focus
waiting for it
short term planning
near term
mid to long term
56
72
72
81
69
60
78
78
60
62
L
I
I
H
L
L
H
H
L
L
SINGULAR
CORPORATE
RESPONSE
(36, 11.01%)
P1.2.5
P1.2.6
P1.2.7
P1.2.8
P1.2.11
P1.3.6
P1.3.7
P1.3.8
P1.3.10
P1.4.10
P1.5.14
P1.6.14
P1.6.15
P1.7.12
P1.7.13
P1.7.16
P1.7.17
P1.8.1
P1.10.13
new way of thinking
more resources needed
rigorous documentation
planning as usual
emergency preparedness
specific preparedness
critical response drivers
needed resources
upgrade and modify
business strengths
emergency response
exposure to ongoing conditions
asset management (how we manage)
operational flexibility
new corporate mentality
slow rate of corporate change
business continuity
climate response
specialized skills
⇔
⇔
⇔
⇔
⇔
⇔
⇔
⇔
⇔
⇔
⇔
⇔
⇔
⇔
⇔
⇔
⇔
⇔
⇔
old ways
vulnerability
weak documentation
more planning needed
unknown state
general preparedness
maintenance activity
already-have resources
can’t upgrade / modify
need system strength
reliability culture
exposure to extreme conditions
re-appraisal of asset management
status quo
old corporate mentality
faster rate of corporate change
dynamic change, prepare for
corporate response alignment
elevate knowledge
66
78
78
81
62
75
62
75
81
75
75
53
50
81
94
72
88
62
66
L
I
H
I
L
I
L
I
H
H
L
L
L
I
H
I
H
I
I
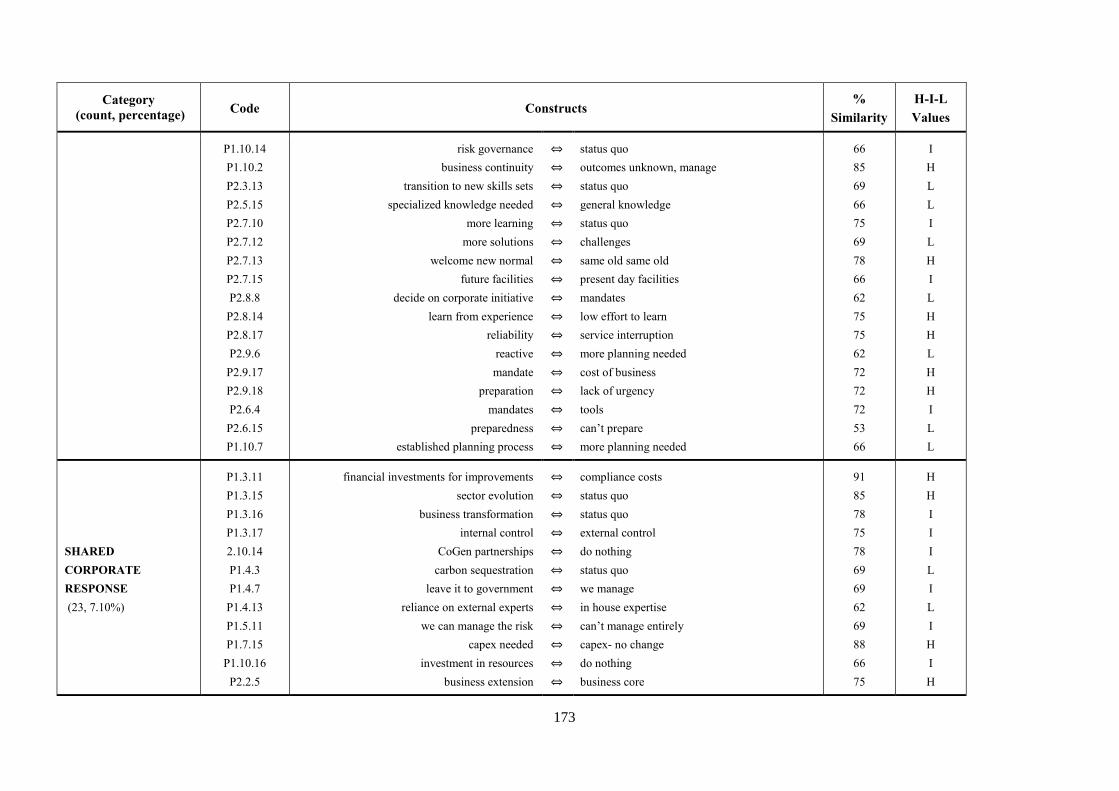
173
Category
(count, percentage) Code Constructs
%
Similarity
H-I-L
Values
P1.10.14
P1.10.2
P2.3.13
P2.5.15
P2.7.10
P2.7.12
P2.7.13
P2.7.15
P2.8.8
P2.8.14
P2.8.17
P2.9.6
P2.9.17
P2.9.18
P2.6.4
P2.6.15
P1.10.7
risk governance
business continuity
transition to new skills sets
specialized knowledge needed
more learning
more solutions
welcome new normal
future facilities
decide on corporate initiative
learn from experience
reliability
reactive
mandate
preparation
mandates
preparedness
established planning process
⇔
⇔
⇔
⇔
⇔
⇔
⇔
⇔
⇔
⇔
⇔
⇔
⇔
⇔
⇔
⇔
⇔
status quo
outcomes unknown, manage
status quo
general knowledge
status quo
challenges
same old same old
present day facilities
mandates
low effort to learn
service interruption
more planning needed
cost of business
lack of urgency
tools
can’t prepare
more planning needed
66
85
69
66
75
69
78
66
62
75
75
62
72
72
72
53
66
I
H
L
L
I
L
H
I
L
H
H
L
H
H
I
L
L
SHARED
CORPORATE
RESPONSE
(23, 7.10%)
P1.3.11
P1.3.15
P1.3.16
P1.3.17
2.10.14
P1.4.3
P1.4.7
P1.4.13
P1.5.11
P1.7.15
P1.10.16
P2.2.5
financial investments for improvements
sector evolution
business transformation
internal control
CoGen partnerships
carbon sequestration
leave it to government
reliance on external experts
we can manage the risk
capex needed
investment in resources
business extension
⇔
⇔
⇔
⇔
⇔
⇔
⇔
⇔
⇔
⇔
⇔
⇔
compliance costs
status quo
status quo
external control
do nothing
status quo
we manage
in house expertise
can’t manage entirely
capex- no change
do nothing
business core
91
85
78
75
78
69
69
62
69
88
66
75
H
H
I
I
I
L
I
L
I
H
I
H
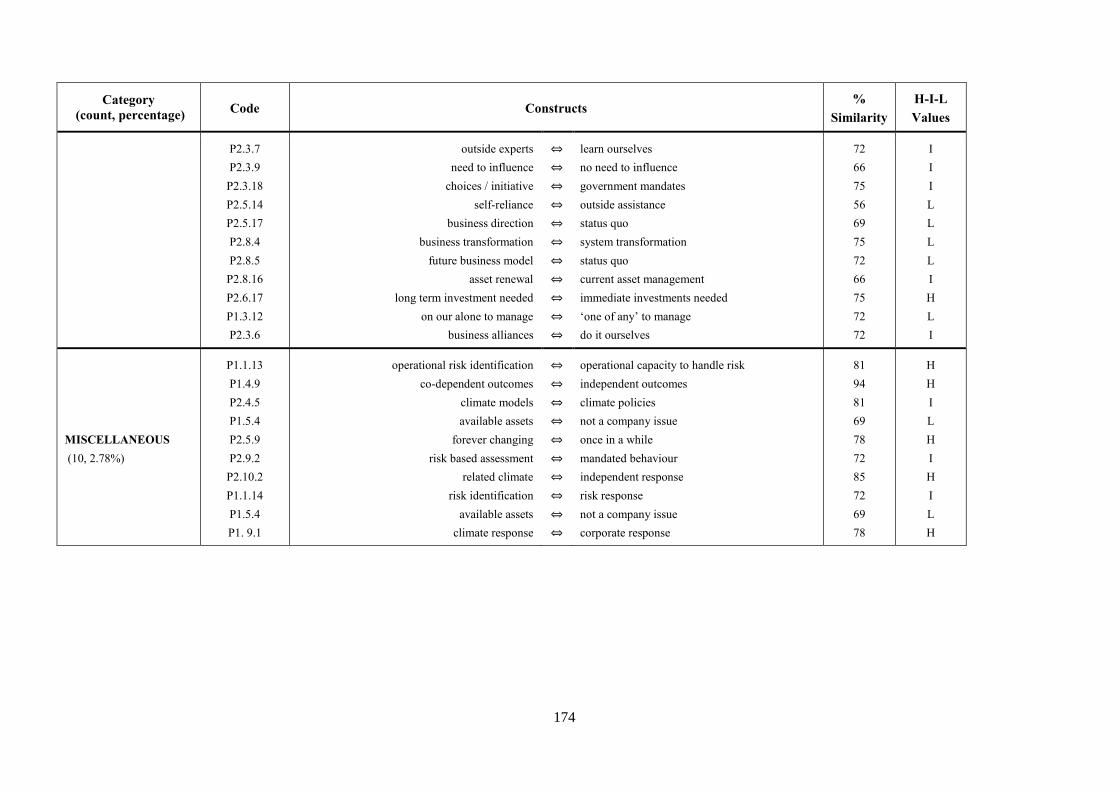
174
Category
(count, percentage) Code Constructs
%
Similarity
H-I-L
Values
P2.3.7
P2.3.9
P2.3.18
P2.5.14
P2.5.17
P2.8.4
P2.8.5
P2.8.16
P2.6.17
P1.3.12
P2.3.6
outside experts
need to influence
choices / initiative
self-reliance
business direction
business transformation
future business model
asset renewal
long term investment needed
on our alone to manage
business alliances
⇔
⇔
⇔
⇔
⇔
⇔
⇔
⇔
⇔
⇔
⇔
learn ourselves
no need to influence
government mandates
outside assistance
status quo
system transformation
status quo
current asset management
immediate investments needed
‘one of any’ to manage
do it ourselves
72
66
75
56
69
75
72
66
75
72
72
I
I
I
L
L
L
L
I
H
L
I
MISCELLANEOUS
(10, 2.78%)
P1.1.13
P1.4.9
P2.4.5
P1.5.4
P2.5.9
P2.9.2
P2.10.2
P1.1.14
P1.5.4
P1. 9.1
operational risk identification
co-dependent outcomes
climate models
available assets
forever changing
risk based assessment
related climate
risk identification
available assets
climate response
⇔
⇔
⇔
⇔
⇔
⇔
⇔
⇔
⇔
⇔
operational capacity to handle risk
independent outcomes
climate policies
not a company issue
once in a while
mandated behaviour
independent response
risk response
not a company issue
corporate response
81
94
81
69
78
72
85
72
69
78
H
H
I
L
H
I
H
I
L
H
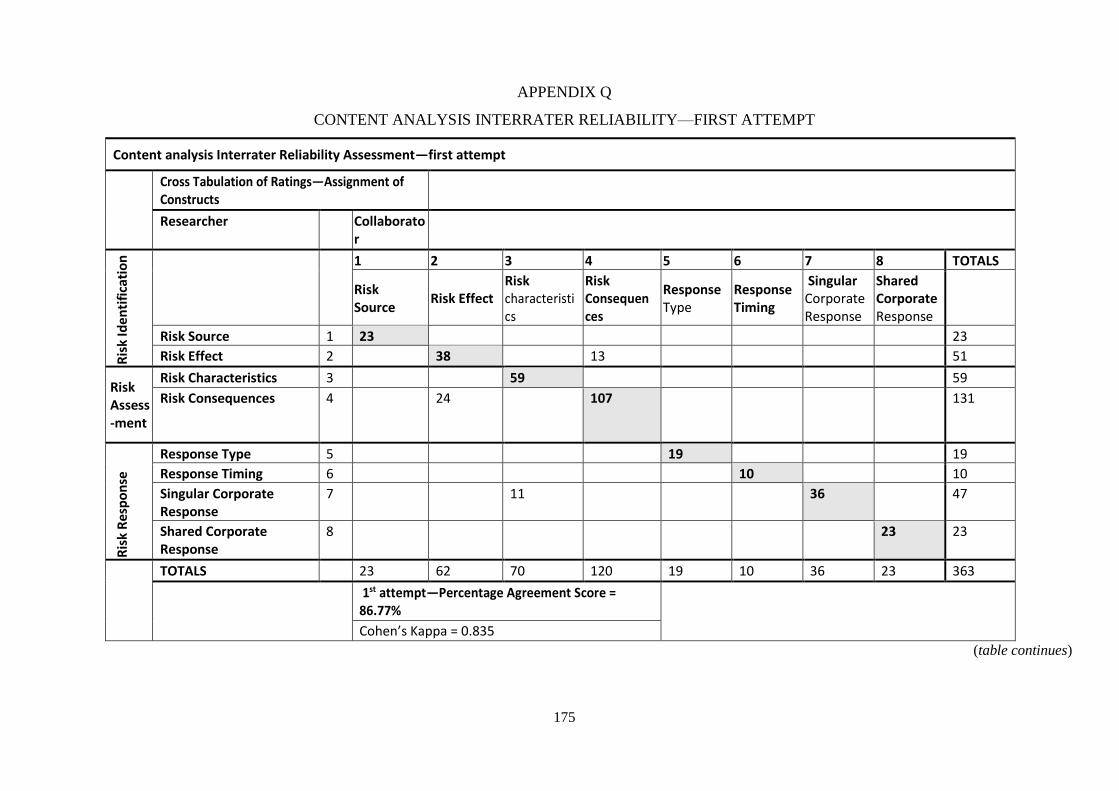
175
APPENDIX Q
CONTENT ANALYSIS INTERRATER RELIABILITY—FIRST ATTEMPT
Content analysis Interrater Reliability Assessment—first attempt
Cross Tabulation of Ratings—Assignment of Constructs
Researcher Collaborator
Ris
k Id
en
tifi
cati
on
1 2 3 4 5 6 7 8 TOTALS
Risk Source
Risk Effect Risk characteristics
Risk Consequences
Response Type
Response Timing
Singular Corporate Response
Shared Corporate Response
Risk Source 1 23 23
Risk Effect 2 38 13 51
Risk Assess-ment
Risk Characteristics 3 59 59
Risk Consequences 4 24 107 131
Ris
k R
esp
on
se
Response Type 5 19 19
Response Timing 6 10 10
Singular Corporate Response
7 11 36 47
Shared Corporate Response
8 23 23
TOTALS 23 62 70 120 19 10 36 23 363
1st attempt—Percentage Agreement Score = 86.77%
Cohen’s Kappa = 0.835
(table continues)
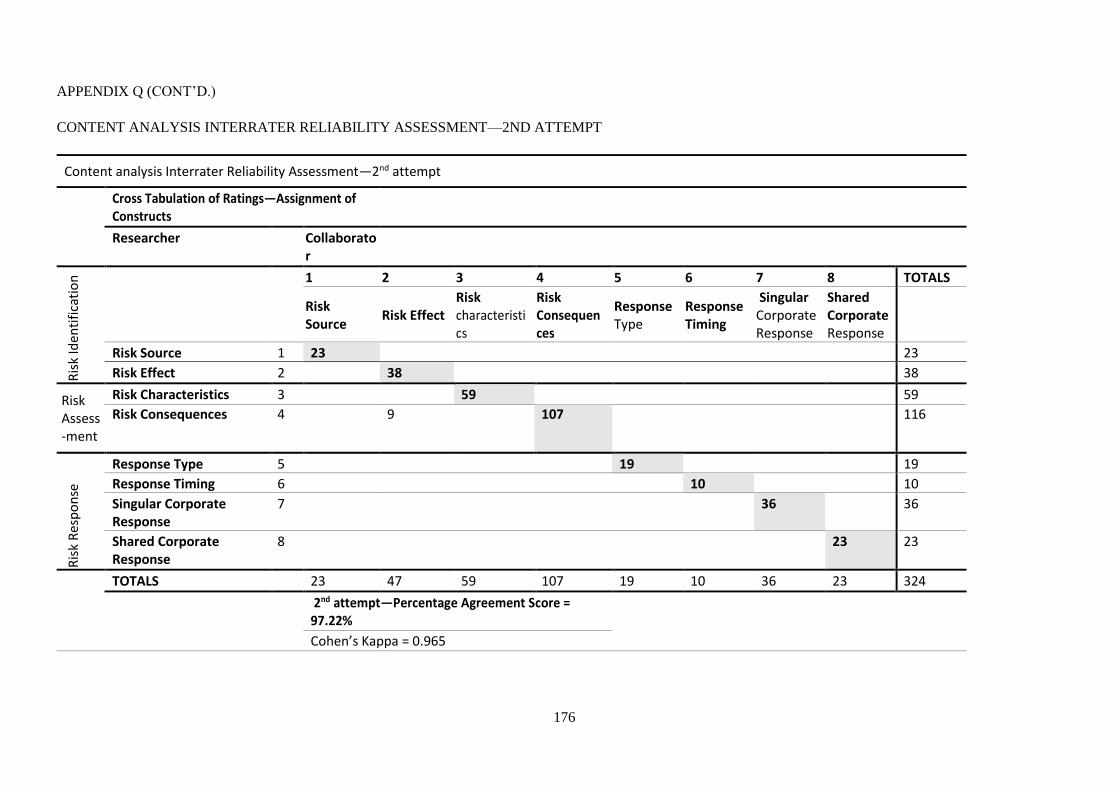
176
APPENDIX Q (CONT’D.)
CONTENT ANALYSIS INTERRATER RELIABILITY ASSESSMENT—2ND ATTEMPT
Content analysis Interrater Reliability Assessment—2nd attempt
Cross Tabulation of Ratings—Assignment of Constructs
Researcher Collaborator
Ris
k Id
enti
fica
tio
n 1 2 3 4 5 6 7 8 TOTALS
Risk Source
Risk Effect Risk characteristics
Risk Consequences
Response Type
Response Timing
Singular Corporate Response
Shared Corporate Response
Risk Source 1 23 23
Risk Effect 2 38 38
Risk Assess-ment
Risk Characteristics 3 59 59
Risk Consequences 4 9 107 116
Ris
k R
esp
on
se
Response Type 5 19 19
Response Timing 6 10 10
Singular Corporate Response
7 36 36
Shared Corporate Response
8 23 23
TOTALS 23 47 59 107 19 10 36 23 324
2nd attempt—Percentage Agreement Score = 97.22%
Cohen’s Kappa = 0.965
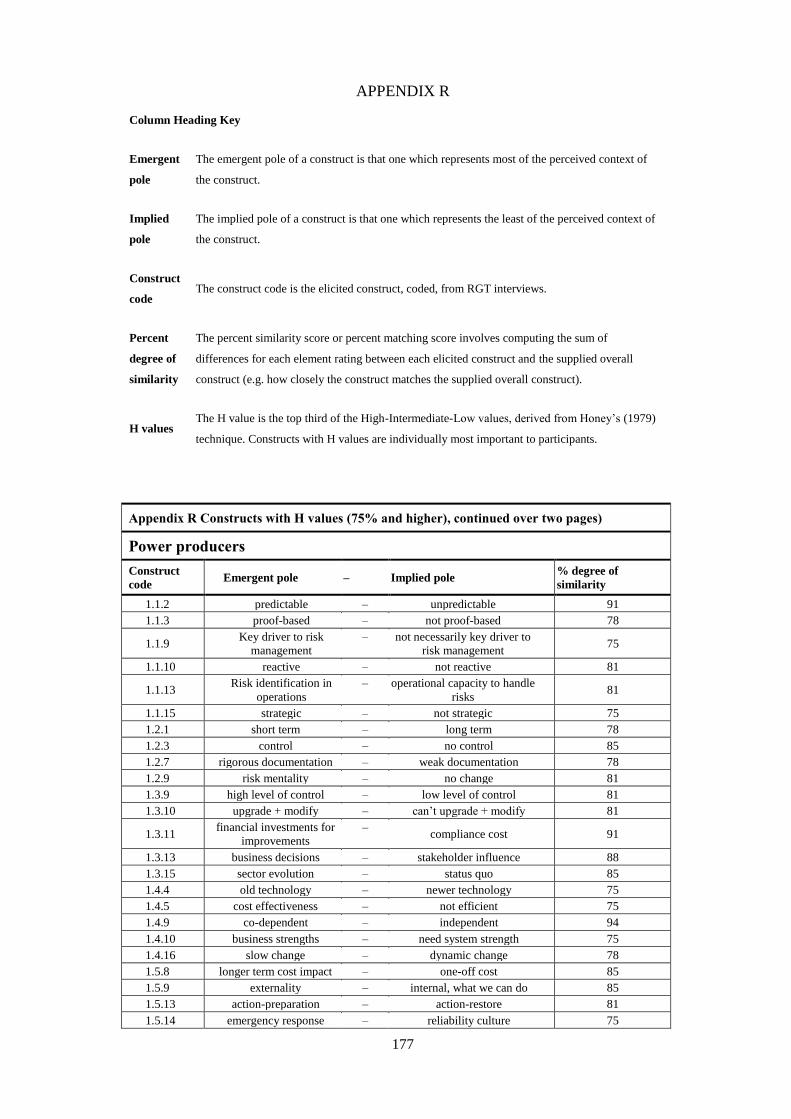
177
APPENDIX R
Column Heading Key
Emergent
pole
The emergent pole of a construct is that one which represents most of the perceived context of
the construct.
Implied
pole
The implied pole of a construct is that one which represents the least of the perceived context of
the construct.
Construct
code The construct code is the elicited construct, coded, from RGT interviews.
Percent
degree of
similarity
The percent similarity score or percent matching score involves computing the sum of
differences for each element rating between each elicited construct and the supplied overall
construct (e.g. how closely the construct matches the supplied overall construct).
H values The H value is the top third of the High-Intermediate-Low values, derived from Honey’s (1979)
technique. Constructs with H values are individually most important to participants.
Appendix R Constructs with H values (75% and higher), continued over two pages)
Power producers
Construct
code Emergent pole – Implied pole % degree of
similarity
1.1.2 predictable – unpredictable 91 1.1.3 proof-based – not proof-based 78
1.1.9 Key driver to risk
management – not necessarily key driver to
risk management 75
1.1.10 reactive – not reactive 81
1.1.13 Risk identification in
operations – operational capacity to handle
risks 81
1.1.15 strategic – not strategic 75 1.2.1 short term – long term 78 1.2.3 control – no control 85 1.2.7 rigorous documentation – weak documentation 78 1.2.9 risk mentality – no change 81 1.3.9 high level of control – low level of control 81 1.3.10 upgrade + modify – can’t upgrade + modify 81
1.3.11 financial investments for
improvements –
compliance cost 91
1.3.13 business decisions – stakeholder influence 88 1.3.15 sector evolution – status quo 85 1.4.4 old technology – newer technology 75 1.4.5 cost effectiveness – not efficient 75 1.4.9 co-dependent – independent 94 1.4.10 business strengths – need system strength 75 1.4.16 slow change – dynamic change 78 1.5.8 longer term cost impact – one-off cost 85 1.5.9 externality – internal, what we can do 85 1.5.13 action-preparation – action-restore 81 1.5.14 emergency response – reliability culture 75
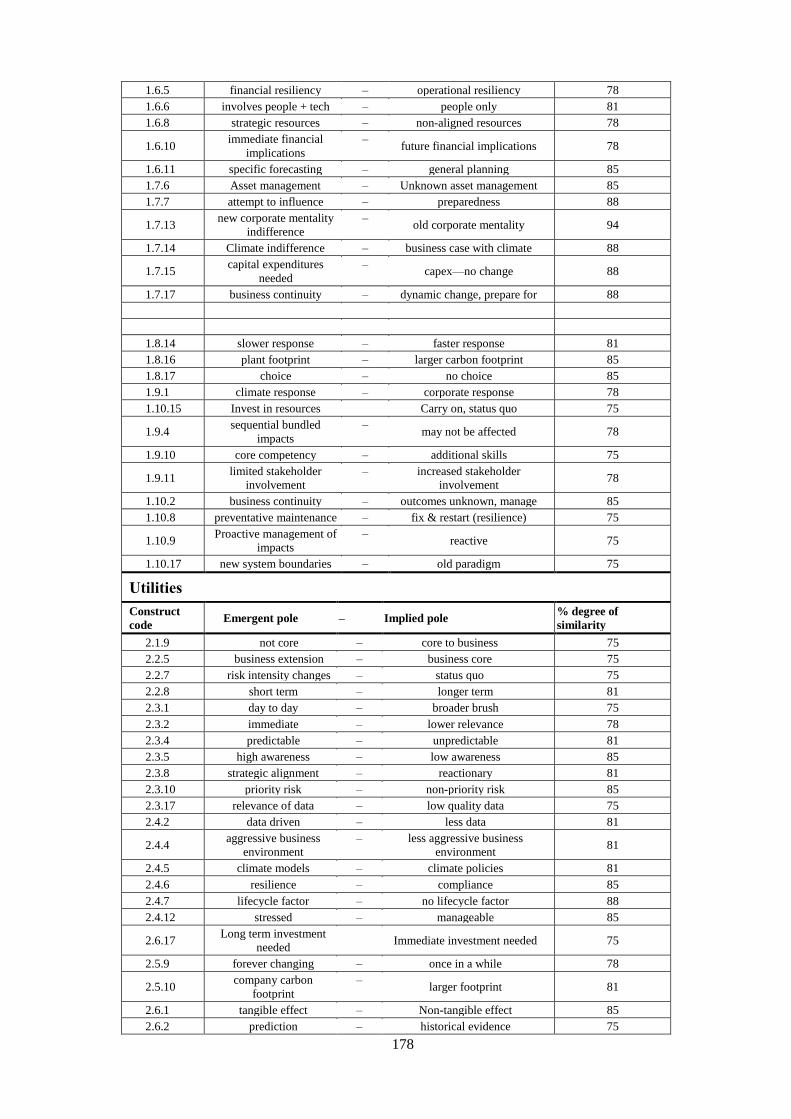
178
1.6.5 financial resiliency – operational resiliency 78 1.6.6 involves people + tech – people only 81 1.6.8 strategic resources – non-aligned resources 78
1.6.10 immediate financial
implications –
future financial implications 78
1.6.11 specific forecasting – general planning 85 1.7.6 Asset management – Unknown asset management 85 1.7.7 attempt to influence – preparedness 88
1.7.13 new corporate mentality
indifference –
old corporate mentality 94
1.7.14 Climate indifference – business case with climate 88
1.7.15 capital expenditures
needed –
capex—no change 88
1.7.17 business continuity – dynamic change, prepare for 88
1.8.14 slower response – faster response 81 1.8.16 plant footprint – larger carbon footprint 85 1.8.17 choice – no choice 85 1.9.1 climate response – corporate response 78 1.10.15 Invest in resources Carry on, status quo 75
1.9.4 sequential bundled
impacts –
may not be affected 78
1.9.10 core competency – additional skills 75
1.9.11 limited stakeholder
involvement – increased stakeholder
involvement 78
1.10.2 business continuity – outcomes unknown, manage 85 1.10.8 preventative maintenance – fix & restart (resilience) 75
1.10.9 Proactive management of
impacts –
reactive 75
1.10.17 new system boundaries – old paradigm 75
Utilities
Construct
code Emergent pole – Implied pole % degree of
similarity 2.1.9 not core – core to business 75 2.2.5 business extension – business core 75 2.2.7 risk intensity changes – status quo 75 2.2.8 short term – longer term 81 2.3.1 day to day – broader brush 75 2.3.2 immediate – lower relevance 78 2.3.4 predictable – unpredictable 81 2.3.5 high awareness – low awareness 85 2.3.8 strategic alignment – reactionary 81 2.3.10 priority risk – non-priority risk 85 2.3.17 relevance of data – low quality data 75 2.4.2 data driven – less data 81
2.4.4 aggressive business
environment – less aggressive business
environment 81
2.4.5 climate models – climate policies 81 2.4.6 resilience – compliance 85 2.4.7 lifecycle factor – no lifecycle factor 88 2.4.12 stressed – manageable 85
2.6.17 Long term investment
needed
Immediate investment needed 75
2.5.9 forever changing – once in a while 78
2.5.10 company carbon
footprint –
larger footprint 81
2.6.1 tangible effect – Non-tangible effect 85 2.6.2 prediction – historical evidence 75
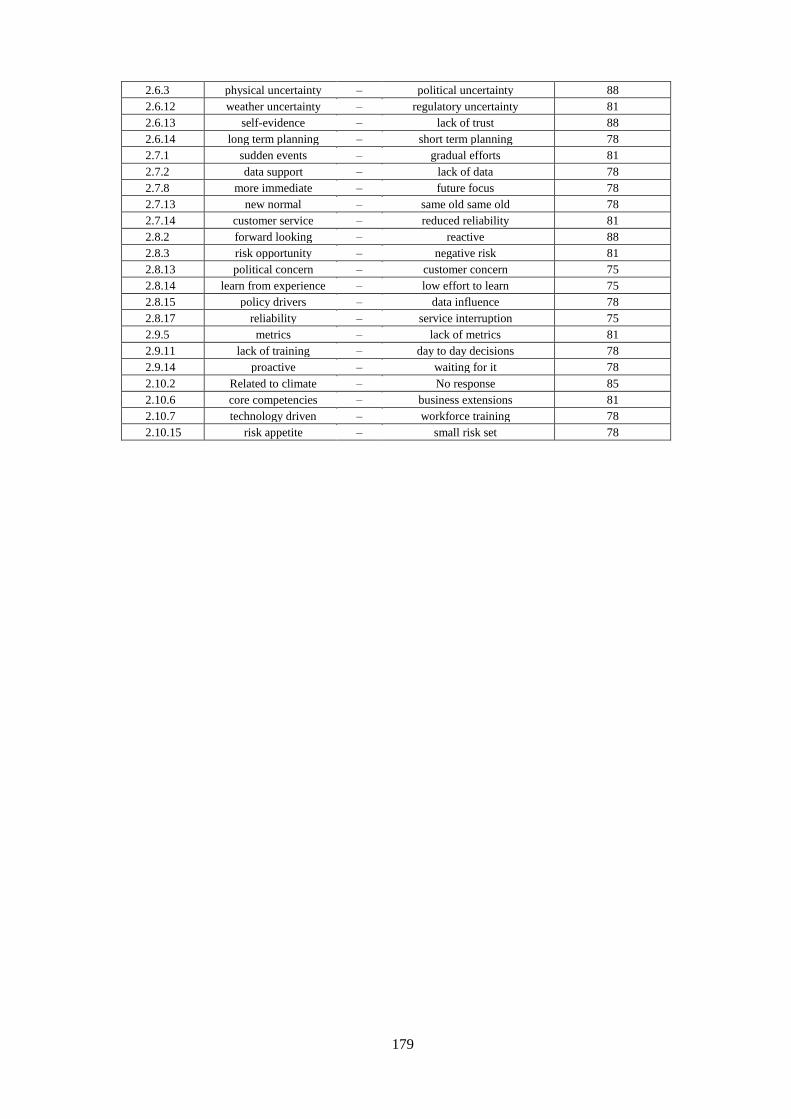
179
2.6.3 physical uncertainty – political uncertainty 88 2.6.12 weather uncertainty – regulatory uncertainty 81 2.6.13 self-evidence – lack of trust 88 2.6.14 long term planning – short term planning 78 2.7.1 sudden events – gradual efforts 81 2.7.2 data support – lack of data 78 2.7.8 more immediate – future focus 78 2.7.13 new normal – same old same old 78 2.7.14 customer service – reduced reliability 81 2.8.2 forward looking – reactive 88 2.8.3 risk opportunity – negative risk 81 2.8.13 political concern – customer concern 75 2.8.14 learn from experience – low effort to learn 75 2.8.15 policy drivers – data influence 78 2.8.17 reliability – service interruption 75 2.9.5 metrics – lack of metrics 81 2.9.11 lack of training – day to day decisions 78 2.9.14 proactive – waiting for it 78 2.10.2 Related to climate – No response 85 2.10.6 core competencies – business extensions 81 2.10.7 technology driven – workforce training 78 2.10.15 risk appetite – small risk set 78

180
APPENDIX S—ELEMENT RATINGS ON THE OVERALL SUPPLIED
CONSTRUCT (GREATEST- WEAKEST)
Elements
E1 E2 E3 E4 E5 E6 E7 E8
Power producers Power producers
P1.1 Overall 4 3 1 2 4 3 5 5 P1.2 Overall 4 3 1 2 4 3 5 5 P1.3 Overall 3 3 1 2 4 4 4 4 P1.4 Overall 5 4 1 4 3 3 2 2 P1.5 Overall 3 3 2 1 5 4 5 5 P1.6 Overall 3 1 4 4 2 3 5 5 P1.7 Overall 4 3 1 2 4 3 5 5 P1.8 Overall 4 3 3 5 2 3 1 1 P1.9 Overall 2 3 1 2 3 4 5 5
P1.10 Overall 2 1 3 5 2 5 4 4
Utilities Utilities
P2.1 Overall 1 4 3 3 5 2 2 4 P2.2 Overall 1 1 3 3 2 2 2 4 P2.3 Overall 1 3 4 5 2 4 3 3 P2.4 Overall 4 2 1 2 4 5 3 3 P2.5 Overall 2 3 1 5 3 2 4 4 P2.6 Overall 1 4 5 5 4 2 2 3 P2.7 Overall 1 2 3 5 2 3 4 4 P2.8 Overall 5 3 1 2 3 2 4 4 P2.9 Overall 5 3 1 2 3 2 4 4
P2.10 Overall 2 2 1 4 4 5 1 2
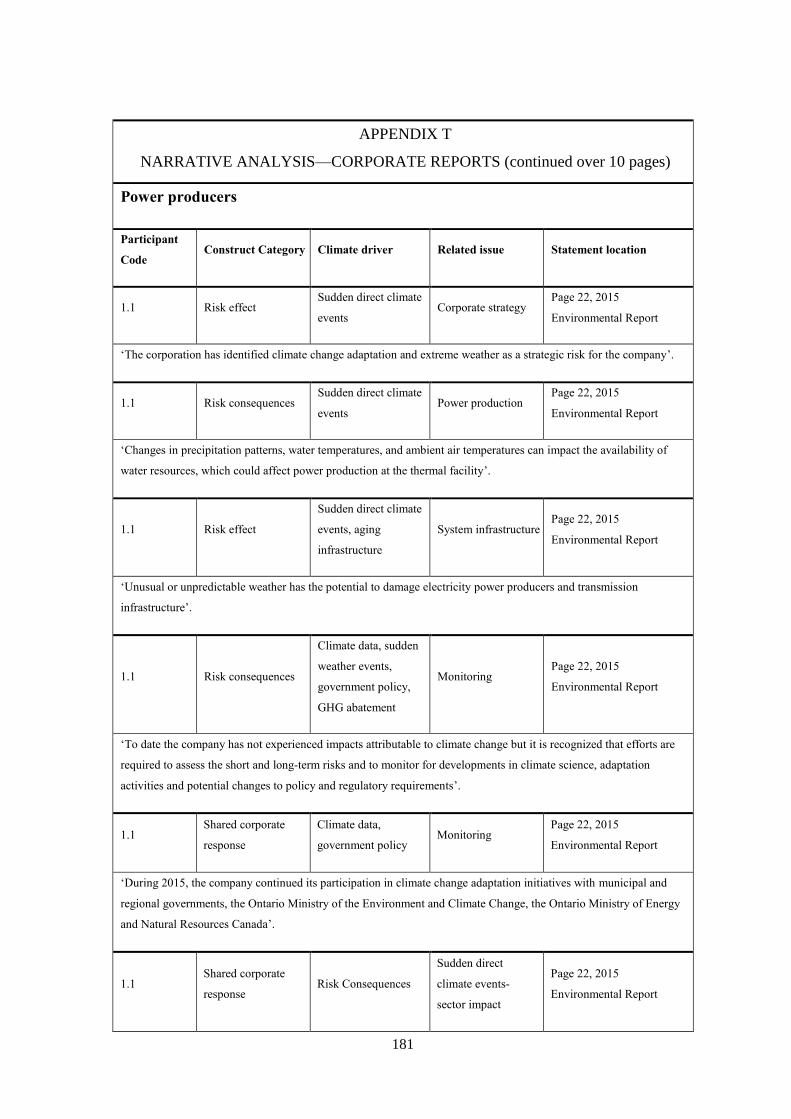
181
APPENDIX T
NARRATIVE ANALYSIS—CORPORATE REPORTS (continued over 10 pages)
Power producers
Participant
Code Construct Category Climate driver Related issue Statement location
1.1 Risk effect Sudden direct climate
events Corporate strategy
Page 22, 2015
Environmental Report
‘The corporation has identified climate change adaptation and extreme weather as a strategic risk for the company’.
1.1 Risk consequences Sudden direct climate
events Power production
Page 22, 2015
Environmental Report
‘Changes in precipitation patterns, water temperatures, and ambient air temperatures can impact the availability of
water resources, which could affect power production at the thermal facility’.
1.1 Risk effect
Sudden direct climate
events, aging
infrastructure
System infrastructure Page 22, 2015
Environmental Report
‘Unusual or unpredictable weather has the potential to damage electricity power producers and transmission
infrastructure’.
1.1 Risk consequences
Climate data, sudden
weather events,
government policy,
GHG abatement
Monitoring Page 22, 2015
Environmental Report
‘To date the company has not experienced impacts attributable to climate change but it is recognized that efforts are
required to assess the short and long-term risks and to monitor for developments in climate science, adaptation
activities and potential changes to policy and regulatory requirements’.
1.1 Shared corporate
response
Climate data,
government policy Monitoring
Page 22, 2015
Environmental Report
‘During 2015, the company continued its participation in climate change adaptation initiatives with municipal and
regional governments, the Ontario Ministry of the Environment and Climate Change, the Ontario Ministry of Energy
and Natural Resources Canada’.
1.1 Shared corporate
response Risk Consequences
Sudden direct
climate events-
sector impact
Page 22, 2015
Environmental Report
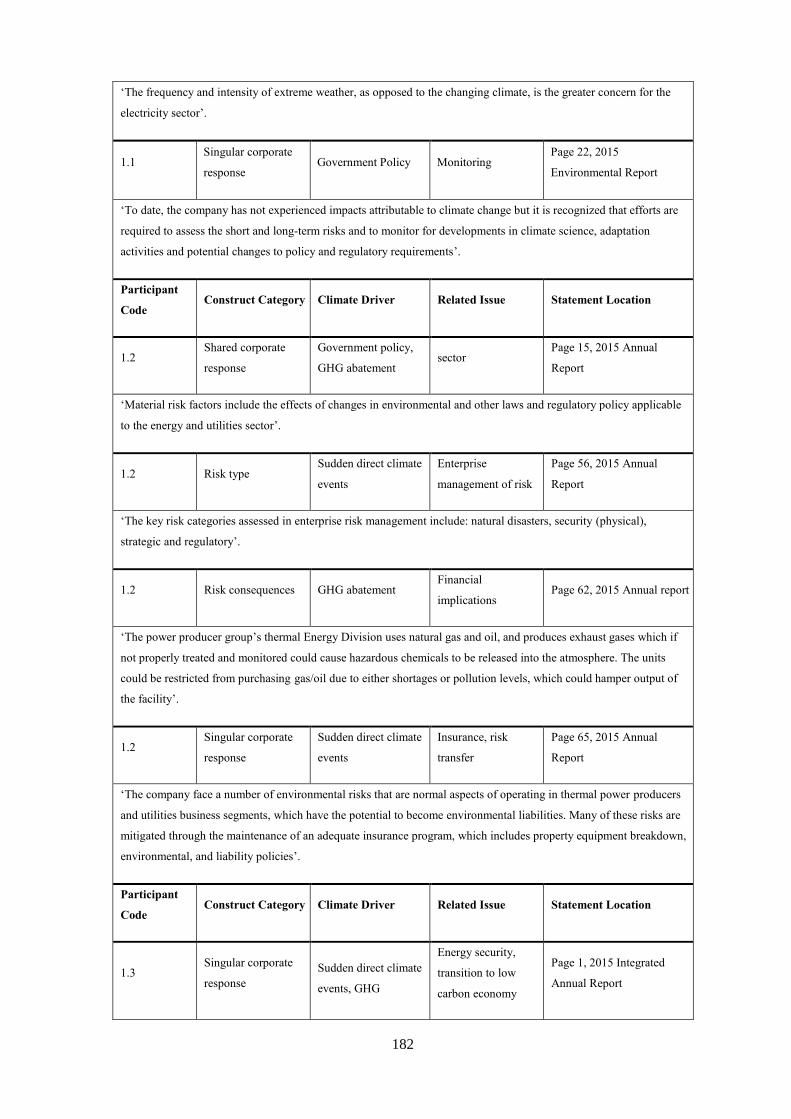
182
‘The frequency and intensity of extreme weather, as opposed to the changing climate, is the greater concern for the
electricity sector’.
1.1 Singular corporate
response Government Policy Monitoring
Page 22, 2015
Environmental Report
‘To date, the company has not experienced impacts attributable to climate change but it is recognized that efforts are
required to assess the short and long-term risks and to monitor for developments in climate science, adaptation
activities and potential changes to policy and regulatory requirements’.
Participant
Code Construct Category Climate Driver Related Issue Statement Location
1.2 Shared corporate
response
Government policy,
GHG abatement sector
Page 15, 2015 Annual
Report
‘Material risk factors include the effects of changes in environmental and other laws and regulatory policy applicable
to the energy and utilities sector’.
1.2 Risk type Sudden direct climate
events
Enterprise
management of risk
Page 56, 2015 Annual
Report
‘The key risk categories assessed in enterprise risk management include: natural disasters, security (physical),
strategic and regulatory’.
1.2 Risk consequences GHG abatement Financial
implications Page 62, 2015 Annual report
‘The power producer group’s thermal Energy Division uses natural gas and oil, and produces exhaust gases which if
not properly treated and monitored could cause hazardous chemicals to be released into the atmosphere. The units
could be restricted from purchasing gas/oil due to either shortages or pollution levels, which could hamper output of
the facility’.
1.2 Singular corporate
response
Sudden direct climate
events
Insurance, risk
transfer
Page 65, 2015 Annual
Report
‘The company face a number of environmental risks that are normal aspects of operating in thermal power producers
and utilities business segments, which have the potential to become environmental liabilities. Many of these risks are
mitigated through the maintenance of an adequate insurance program, which includes property equipment breakdown,
environmental, and liability policies’.
Participant
Code Construct Category Climate Driver Related Issue Statement Location
1.3 Singular corporate
response Sudden direct climate
events, GHG
Energy security,
transition to low
carbon economy
Page 1, 2015 Integrated
Annual Report
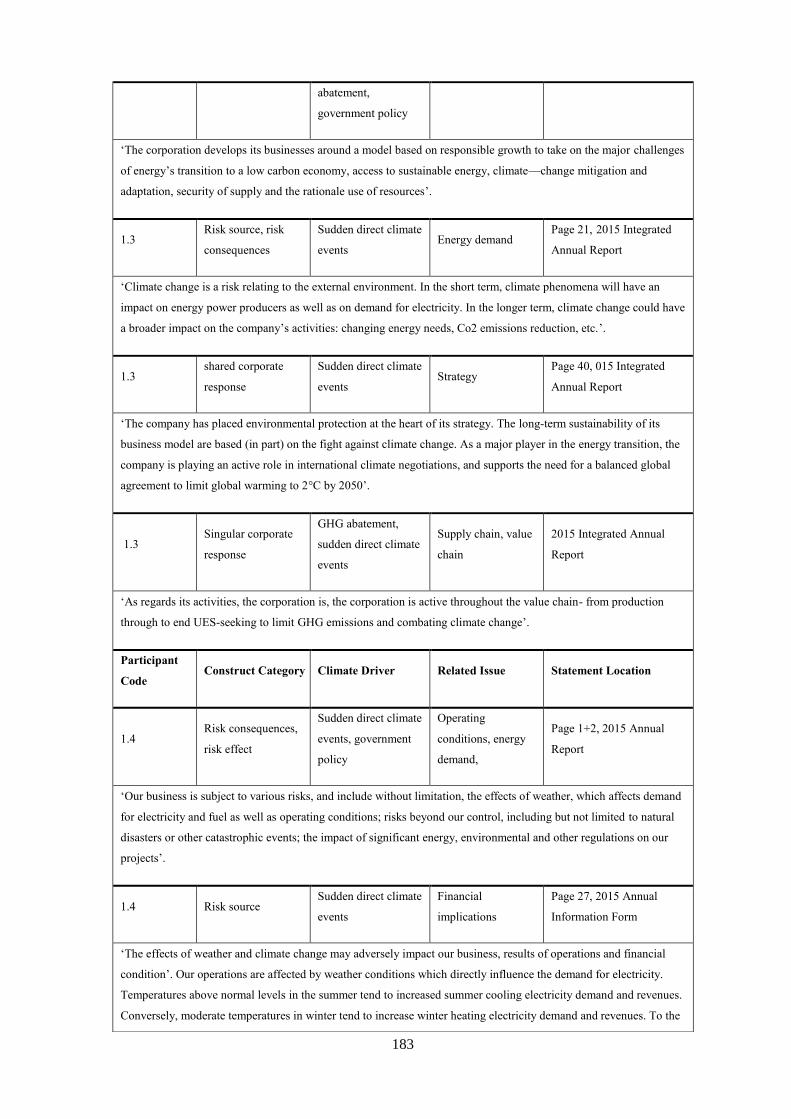
183
abatement,
government policy
‘The corporation develops its businesses around a model based on responsible growth to take on the major challenges
of energy’s transition to a low carbon economy, access to sustainable energy, climate—change mitigation and
adaptation, security of supply and the rationale use of resources’.
1.3 Risk source, risk
consequences
Sudden direct climate
events Energy demand
Page 21, 2015 Integrated
Annual Report
‘Climate change is a risk relating to the external environment. In the short term, climate phenomena will have an
impact on energy power producers as well as on demand for electricity. In the longer term, climate change could have
a broader impact on the company’s activities: changing energy needs, Co2 emissions reduction, etc.’.
1.3 shared corporate
response
Sudden direct climate
events Strategy
Page 40, 015 Integrated
Annual Report
‘The company has placed environmental protection at the heart of its strategy. The long-term sustainability of its
business model are based (in part) on the fight against climate change. As a major player in the energy transition, the
company is playing an active role in international climate negotiations, and supports the need for a balanced global
agreement to limit global warming to 2°C by 2050’.
1.3 Singular corporate
response
GHG abatement,
sudden direct climate
events
Supply chain, value
chain
2015 Integrated Annual
Report
‘As regards its activities, the corporation is, the corporation is active throughout the value chain- from production
through to end UES-seeking to limit GHG emissions and combating climate change’.
Participant
Code Construct Category Climate Driver Related Issue Statement Location
1.4 Risk consequences,
risk effect
Sudden direct climate
events, government
policy
Operating
conditions, energy
demand,
Page 1+2, 2015 Annual
Report
‘Our business is subject to various risks, and include without limitation, the effects of weather, which affects demand
for electricity and fuel as well as operating conditions; risks beyond our control, including but not limited to natural
disasters or other catastrophic events; the impact of significant energy, environmental and other regulations on our
projects’.
1.4 Risk source Sudden direct climate
events
Financial
implications
Page 27, 2015 Annual
Information Form
‘The effects of weather and climate change may adversely impact our business, results of operations and financial
condition’. Our operations are affected by weather conditions which directly influence the demand for electricity.
Temperatures above normal levels in the summer tend to increased summer cooling electricity demand and revenues.
Conversely, moderate temperatures in winter tend to increase winter heating electricity demand and revenues. To the
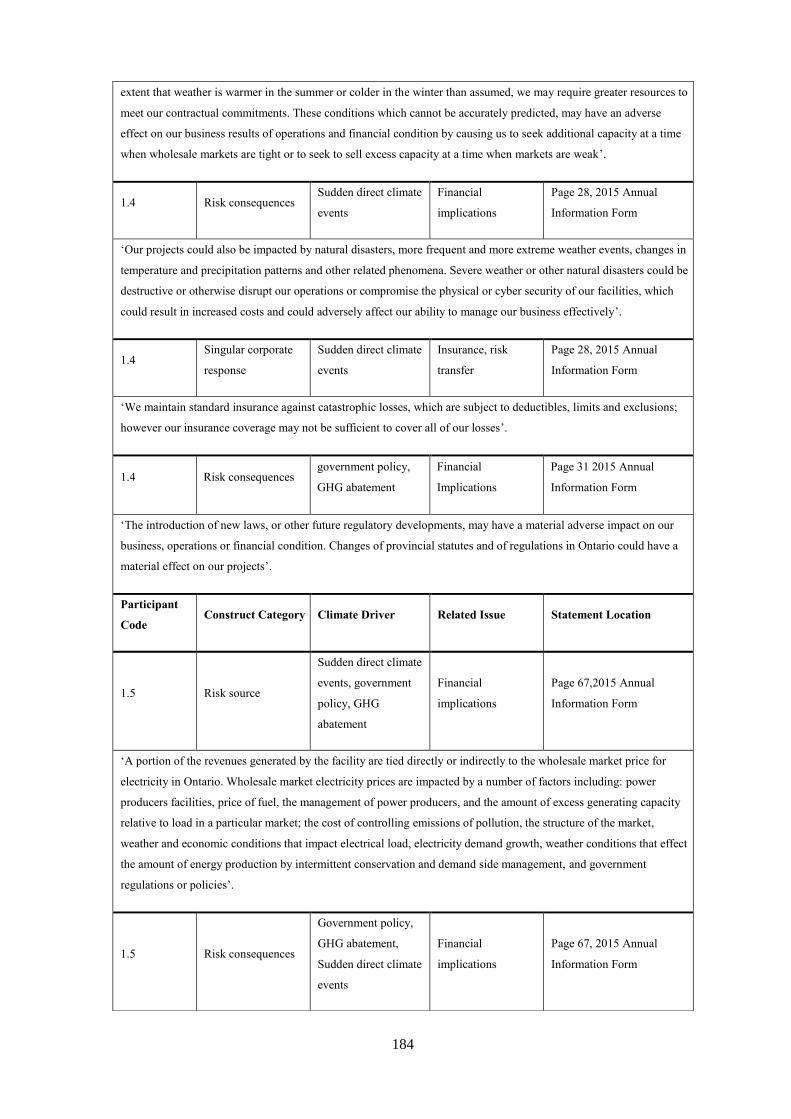
184
extent that weather is warmer in the summer or colder in the winter than assumed, we may require greater resources to
meet our contractual commitments. These conditions which cannot be accurately predicted, may have an adverse
effect on our business results of operations and financial condition by causing us to seek additional capacity at a time
when wholesale markets are tight or to seek to sell excess capacity at a time when markets are weak’.
1.4 Risk consequences Sudden direct climate
events
Financial
implications
Page 28, 2015 Annual
Information Form
‘Our projects could also be impacted by natural disasters, more frequent and more extreme weather events, changes in
temperature and precipitation patterns and other related phenomena. Severe weather or other natural disasters could be
destructive or otherwise disrupt our operations or compromise the physical or cyber security of our facilities, which
could result in increased costs and could adversely affect our ability to manage our business effectively’.
1.4 Singular corporate
response
Sudden direct climate
events
Insurance, risk
transfer
Page 28, 2015 Annual
Information Form
‘We maintain standard insurance against catastrophic losses, which are subject to deductibles, limits and exclusions;
however our insurance coverage may not be sufficient to cover all of our losses’.
1.4 Risk consequences government policy,
GHG abatement
Financial
Implications
Page 31 2015 Annual
Information Form
‘The introduction of new laws, or other future regulatory developments, may have a material adverse impact on our
business, operations or financial condition. Changes of provincial statutes and of regulations in Ontario could have a
material effect on our projects’.
Participant
Code Construct Category Climate Driver Related Issue Statement Location
1.5 Risk source
Sudden direct climate
events, government
policy, GHG
abatement
Financial
implications
Page 67,2015 Annual
Information Form
‘A portion of the revenues generated by the facility are tied directly or indirectly to the wholesale market price for
electricity in Ontario. Wholesale market electricity prices are impacted by a number of factors including: power
producers facilities, price of fuel, the management of power producers, and the amount of excess generating capacity
relative to load in a particular market; the cost of controlling emissions of pollution, the structure of the market,
weather and economic conditions that impact electrical load, electricity demand growth, weather conditions that effect
the amount of energy production by intermittent conservation and demand side management, and government
regulations or policies’.
1.5 Risk consequences
Government policy,
GHG abatement,
Sudden direct climate
events
Financial
implications
Page 67, 2015 Annual
Information Form
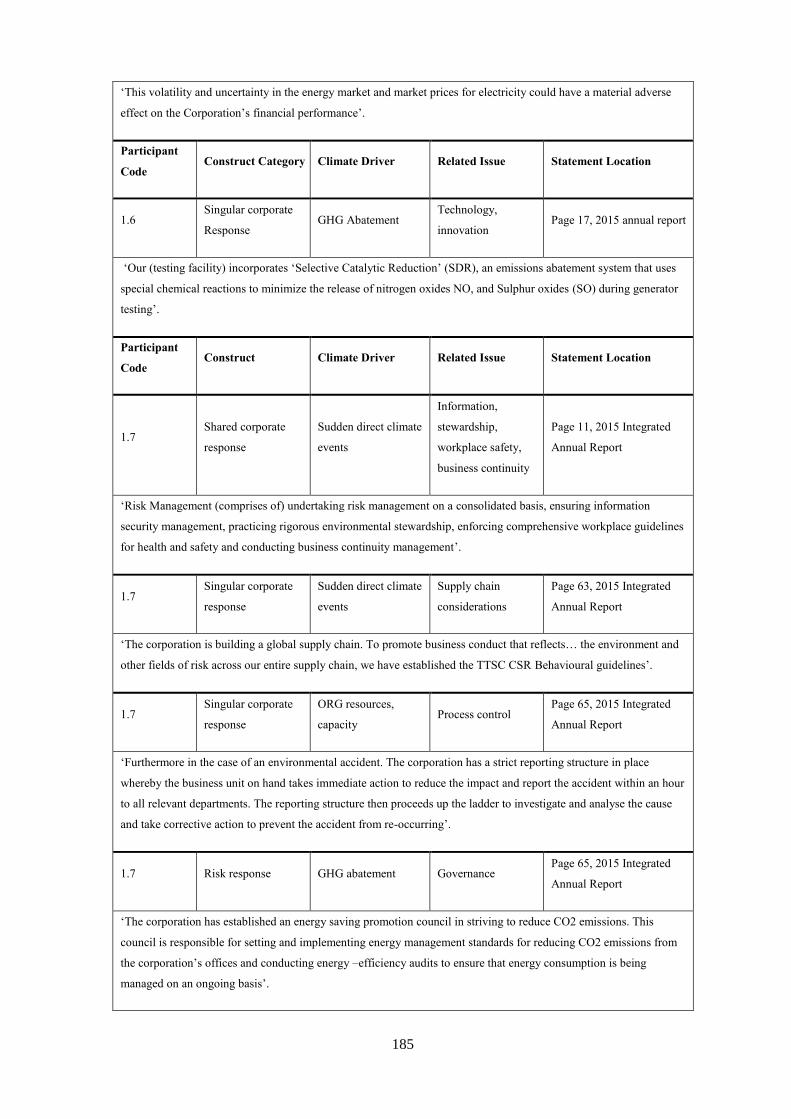
185
‘This volatility and uncertainty in the energy market and market prices for electricity could have a material adverse
effect on the Corporation’s financial performance’.
Participant
Code Construct Category Climate Driver Related Issue Statement Location
1.6 Singular corporate
Response GHG Abatement
Technology,
innovation Page 17, 2015 annual report
‘Our (testing facility) incorporates ‘Selective Catalytic Reduction’ (SDR), an emissions abatement system that uses
special chemical reactions to minimize the release of nitrogen oxides NO, and Sulphur oxides (SO) during generator
testing’.
Participant
Code Construct Climate Driver Related Issue Statement Location
1.7 Shared corporate
response
Sudden direct climate
events
Information,
stewardship,
workplace safety,
business continuity
Page 11, 2015 Integrated
Annual Report
‘Risk Management (comprises of) undertaking risk management on a consolidated basis, ensuring information
security management, practicing rigorous environmental stewardship, enforcing comprehensive workplace guidelines
for health and safety and conducting business continuity management’.
1.7 Singular corporate
response
Sudden direct climate
events
Supply chain
considerations
Page 63, 2015 Integrated
Annual Report
‘The corporation is building a global supply chain. To promote business conduct that reflects… the environment and
other fields of risk across our entire supply chain, we have established the TTSC CSR Behavioural guidelines’.
1.7 Singular corporate
response
ORG resources,
capacity Process control
Page 65, 2015 Integrated
Annual Report
‘Furthermore in the case of an environmental accident. The corporation has a strict reporting structure in place
whereby the business unit on hand takes immediate action to reduce the impact and report the accident within an hour
to all relevant departments. The reporting structure then proceeds up the ladder to investigate and analyse the cause
and take corrective action to prevent the accident from re-occurring’.
1.7 Risk response GHG abatement Governance Page 65, 2015 Integrated
Annual Report
‘The corporation has established an energy saving promotion council in striving to reduce CO2 emissions. This
council is responsible for setting and implementing energy management standards for reducing CO2 emissions from
the corporation’s offices and conducting energy –efficiency audits to ensure that energy consumption is being
managed on an ongoing basis’.
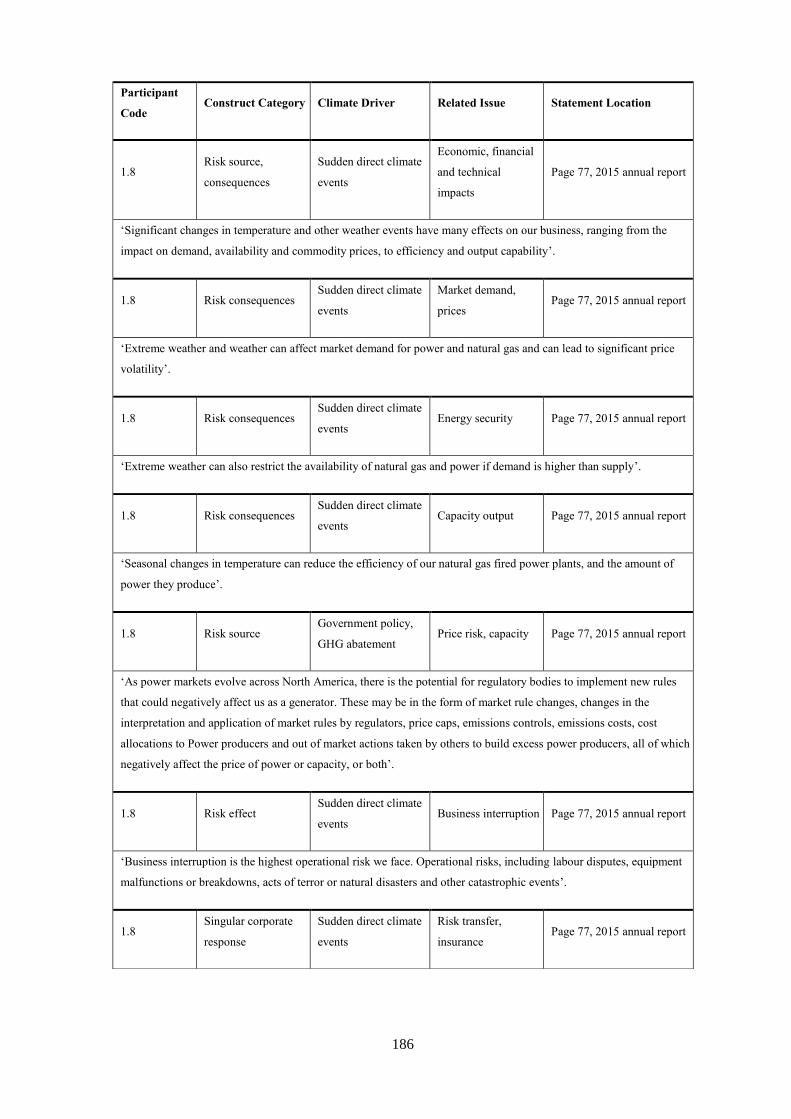
186
Participant
Code Construct Category Climate Driver Related Issue Statement Location
1.8 Risk source,
consequences
Sudden direct climate
events
Economic, financial
and technical
impacts
Page 77, 2015 annual report
‘Significant changes in temperature and other weather events have many effects on our business, ranging from the
impact on demand, availability and commodity prices, to efficiency and output capability’.
1.8 Risk consequences Sudden direct climate
events
Market demand,
prices Page 77, 2015 annual report
‘Extreme weather and weather can affect market demand for power and natural gas and can lead to significant price
volatility’.
1.8 Risk consequences Sudden direct climate
events Energy security Page 77, 2015 annual report
‘Extreme weather can also restrict the availability of natural gas and power if demand is higher than supply’.
1.8 Risk consequences Sudden direct climate
events Capacity output Page 77, 2015 annual report
‘Seasonal changes in temperature can reduce the efficiency of our natural gas fired power plants, and the amount of
power they produce’.
1.8 Risk source Government policy,
GHG abatement Price risk, capacity Page 77, 2015 annual report
‘As power markets evolve across North America, there is the potential for regulatory bodies to implement new rules
that could negatively affect us as a generator. These may be in the form of market rule changes, changes in the
interpretation and application of market rules by regulators, price caps, emissions controls, emissions costs, cost
allocations to Power producers and out of market actions taken by others to build excess power producers, all of which
negatively affect the price of power or capacity, or both’.
1.8 Risk effect Sudden direct climate
events Business interruption Page 77, 2015 annual report
‘Business interruption is the highest operational risk we face. Operational risks, including labour disputes, equipment
malfunctions or breakdowns, acts of terror or natural disasters and other catastrophic events’.
1.8 Singular corporate
response
Sudden direct climate
events
Risk transfer,
insurance Page 77, 2015 annual report
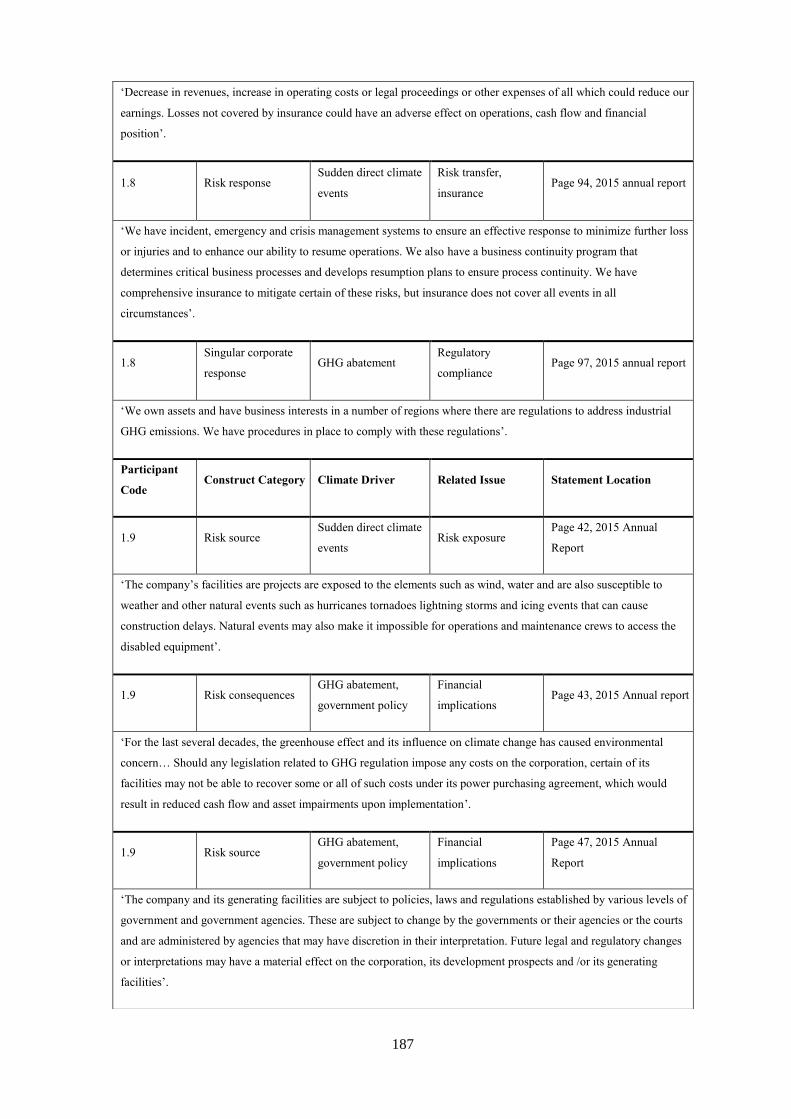
187
‘Decrease in revenues, increase in operating costs or legal proceedings or other expenses of all which could reduce our
earnings. Losses not covered by insurance could have an adverse effect on operations, cash flow and financial
position’.
1.8 Risk response Sudden direct climate
events
Risk transfer,
insurance Page 94, 2015 annual report
‘We have incident, emergency and crisis management systems to ensure an effective response to minimize further loss
or injuries and to enhance our ability to resume operations. We also have a business continuity program that
determines critical business processes and develops resumption plans to ensure process continuity. We have
comprehensive insurance to mitigate certain of these risks, but insurance does not cover all events in all
circumstances’.
1.8 Singular corporate
response GHG abatement
Regulatory
compliance Page 97, 2015 annual report
‘We own assets and have business interests in a number of regions where there are regulations to address industrial
GHG emissions. We have procedures in place to comply with these regulations’.
Participant
Code Construct Category Climate Driver Related Issue Statement Location
1.9 Risk source Sudden direct climate
events Risk exposure
Page 42, 2015 Annual
Report
‘The company’s facilities are projects are exposed to the elements such as wind, water and are also susceptible to
weather and other natural events such as hurricanes tornadoes lightning storms and icing events that can cause
construction delays. Natural events may also make it impossible for operations and maintenance crews to access the
disabled equipment’.
1.9 Risk consequences GHG abatement,
government policy
Financial
implications Page 43, 2015 Annual report
‘For the last several decades, the greenhouse effect and its influence on climate change has caused environmental
concern… Should any legislation related to GHG regulation impose any costs on the corporation, certain of its
facilities may not be able to recover some or all of such costs under its power purchasing agreement, which would
result in reduced cash flow and asset impairments upon implementation’.
1.9 Risk source GHG abatement,
government policy
Financial
implications
Page 47, 2015 Annual
Report
‘The company and its generating facilities are subject to policies, laws and regulations established by various levels of
government and government agencies. These are subject to change by the governments or their agencies or the courts
and are administered by agencies that may have discretion in their interpretation. Future legal and regulatory changes
or interpretations may have a material effect on the corporation, its development prospects and /or its generating
facilities’.
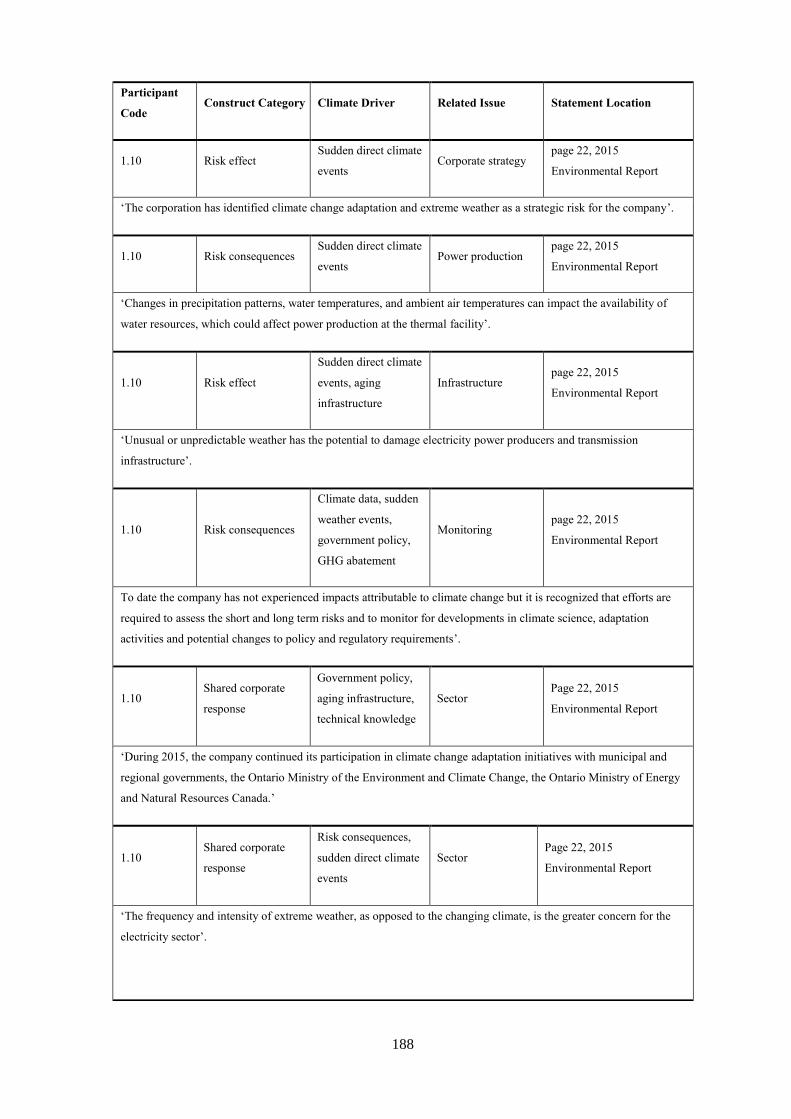
188
Participant
Code Construct Category Climate Driver Related Issue Statement Location
1.10 Risk effect Sudden direct climate
events Corporate strategy
page 22, 2015
Environmental Report
‘The corporation has identified climate change adaptation and extreme weather as a strategic risk for the company’.
1.10 Risk consequences Sudden direct climate
events Power production
page 22, 2015
Environmental Report
‘Changes in precipitation patterns, water temperatures, and ambient air temperatures can impact the availability of
water resources, which could affect power production at the thermal facility’.
1.10 Risk effect
Sudden direct climate
events, aging
infrastructure
Infrastructure page 22, 2015
Environmental Report
‘Unusual or unpredictable weather has the potential to damage electricity power producers and transmission
infrastructure’.
1.10 Risk consequences
Climate data, sudden
weather events,
government policy,
GHG abatement
Monitoring page 22, 2015
Environmental Report
To date the company has not experienced impacts attributable to climate change but it is recognized that efforts are
required to assess the short and long term risks and to monitor for developments in climate science, adaptation
activities and potential changes to policy and regulatory requirements’.
1.10 Shared corporate
response
Government policy,
aging infrastructure,
technical knowledge
Sector Page 22, 2015
Environmental Report
‘During 2015, the company continued its participation in climate change adaptation initiatives with municipal and
regional governments, the Ontario Ministry of the Environment and Climate Change, the Ontario Ministry of Energy
and Natural Resources Canada.’
1.10 Shared corporate
response
Risk consequences,
sudden direct climate
events
Sector Page 22, 2015
Environmental Report
‘The frequency and intensity of extreme weather, as opposed to the changing climate, is the greater concern for the
electricity sector’.
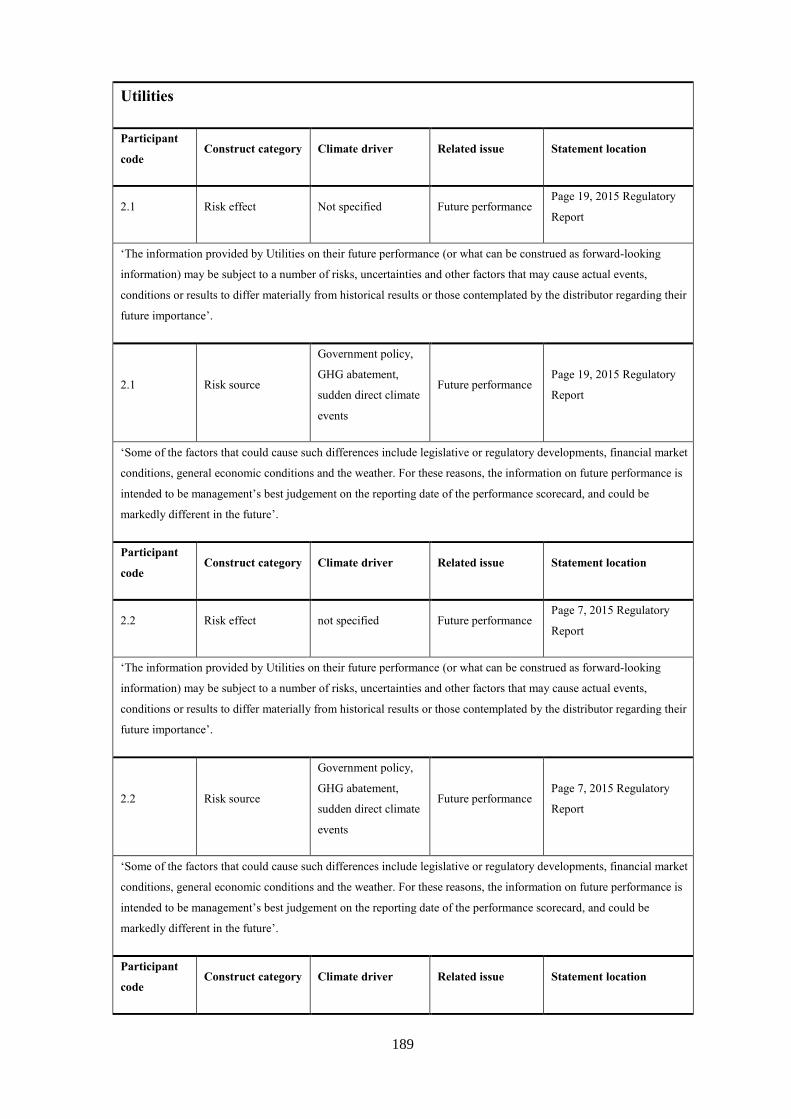
189
Utilities
Participant
code Construct category Climate driver Related issue Statement location
2.1 Risk effect Not specified Future performance Page 19, 2015 Regulatory
Report
‘The information provided by Utilities on their future performance (or what can be construed as forward-looking
information) may be subject to a number of risks, uncertainties and other factors that may cause actual events,
conditions or results to differ materially from historical results or those contemplated by the distributor regarding their
future importance’.
2.1 Risk source
Government policy,
GHG abatement,
sudden direct climate
events
Future performance Page 19, 2015 Regulatory
Report
‘Some of the factors that could cause such differences include legislative or regulatory developments, financial market
conditions, general economic conditions and the weather. For these reasons, the information on future performance is
intended to be management’s best judgement on the reporting date of the performance scorecard, and could be
markedly different in the future’.
Participant
code Construct category Climate driver Related issue Statement location
2.2 Risk effect not specified Future performance Page 7, 2015 Regulatory
Report
‘The information provided by Utilities on their future performance (or what can be construed as forward-looking
information) may be subject to a number of risks, uncertainties and other factors that may cause actual events,
conditions or results to differ materially from historical results or those contemplated by the distributor regarding their
future importance’.
2.2 Risk source
Government policy,
GHG abatement,
sudden direct climate
events
Future performance Page 7, 2015 Regulatory
Report
‘Some of the factors that could cause such differences include legislative or regulatory developments, financial market
conditions, general economic conditions and the weather. For these reasons, the information on future performance is
intended to be management’s best judgement on the reporting date of the performance scorecard, and could be
markedly different in the future’.
Participant
code Construct category Climate driver Related issue Statement location
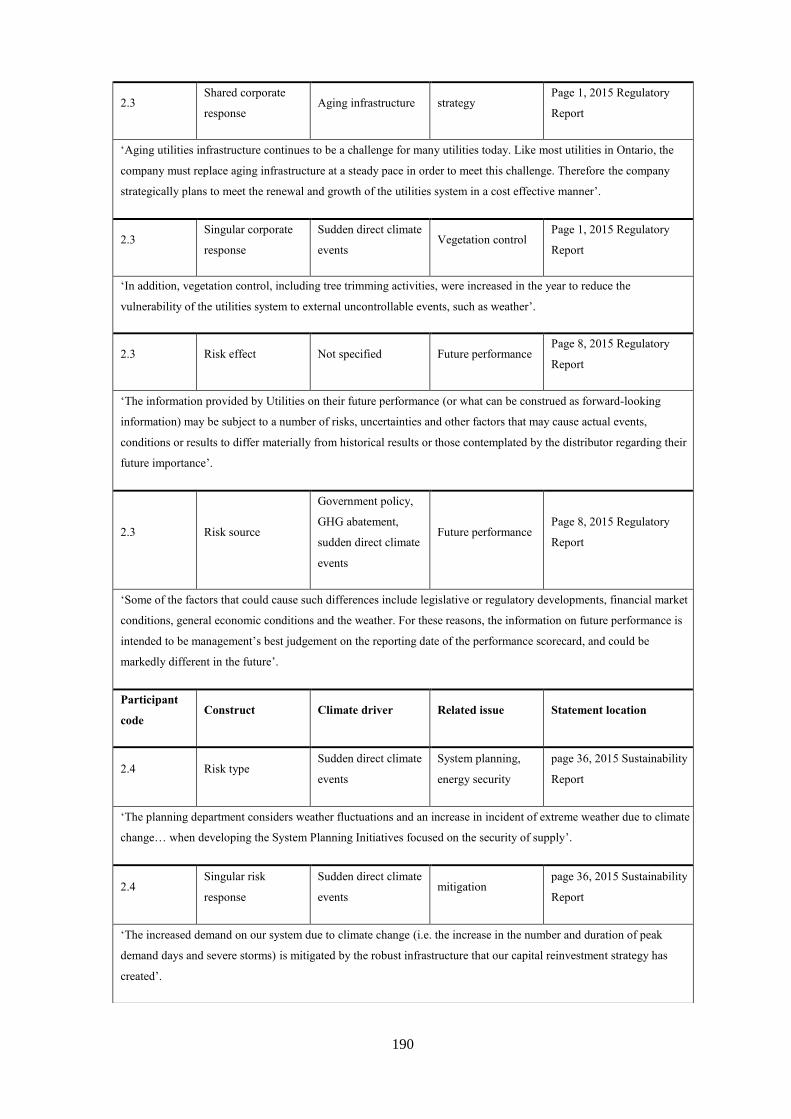
190
2.3 Shared corporate
response Aging infrastructure strategy
Page 1, 2015 Regulatory
Report
‘Aging utilities infrastructure continues to be a challenge for many utilities today. Like most utilities in Ontario, the
company must replace aging infrastructure at a steady pace in order to meet this challenge. Therefore the company
strategically plans to meet the renewal and growth of the utilities system in a cost effective manner’.
2.3 Singular corporate
response
Sudden direct climate
events Vegetation control
Page 1, 2015 Regulatory
Report
‘In addition, vegetation control, including tree trimming activities, were increased in the year to reduce the
vulnerability of the utilities system to external uncontrollable events, such as weather’.
2.3 Risk effect Not specified Future performance Page 8, 2015 Regulatory
Report
‘The information provided by Utilities on their future performance (or what can be construed as forward-looking
information) may be subject to a number of risks, uncertainties and other factors that may cause actual events,
conditions or results to differ materially from historical results or those contemplated by the distributor regarding their
future importance’.
2.3 Risk source
Government policy,
GHG abatement,
sudden direct climate
events
Future performance Page 8, 2015 Regulatory
Report
‘Some of the factors that could cause such differences include legislative or regulatory developments, financial market
conditions, general economic conditions and the weather. For these reasons, the information on future performance is
intended to be management’s best judgement on the reporting date of the performance scorecard, and could be
markedly different in the future’.
Participant
code Construct Climate driver Related issue Statement location
2.4 Risk type Sudden direct climate
events
System planning,
energy security
page 36, 2015 Sustainability
Report
‘The planning department considers weather fluctuations and an increase in incident of extreme weather due to climate
change… when developing the System Planning Initiatives focused on the security of supply’.
2.4 Singular risk
response
Sudden direct climate
events mitigation
page 36, 2015 Sustainability
Report
‘The increased demand on our system due to climate change (i.e. the increase in the number and duration of peak
demand days and severe storms) is mitigated by the robust infrastructure that our capital reinvestment strategy has
created’.
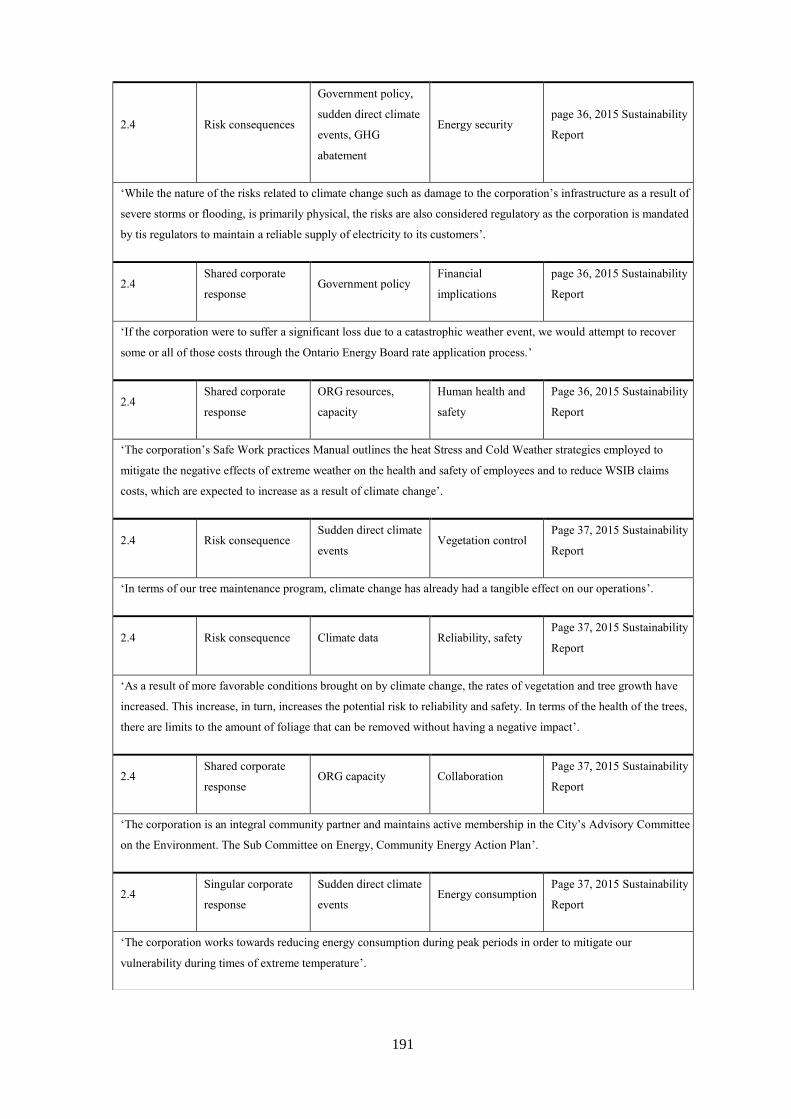
191
2.4 Risk consequences
Government policy,
sudden direct climate
events, GHG
abatement
Energy security page 36, 2015 Sustainability
Report
‘While the nature of the risks related to climate change such as damage to the corporation’s infrastructure as a result of
severe storms or flooding, is primarily physical, the risks are also considered regulatory as the corporation is mandated
by tis regulators to maintain a reliable supply of electricity to its customers’.
2.4 Shared corporate
response Government policy
Financial
implications
page 36, 2015 Sustainability
Report
‘If the corporation were to suffer a significant loss due to a catastrophic weather event, we would attempt to recover
some or all of those costs through the Ontario Energy Board rate application process.’
2.4 Shared corporate
response
ORG resources,
capacity
Human health and
safety
Page 36, 2015 Sustainability
Report
‘The corporation’s Safe Work practices Manual outlines the heat Stress and Cold Weather strategies employed to
mitigate the negative effects of extreme weather on the health and safety of employees and to reduce WSIB claims
costs, which are expected to increase as a result of climate change’.
2.4 Risk consequence Sudden direct climate
events Vegetation control
Page 37, 2015 Sustainability
Report
‘In terms of our tree maintenance program, climate change has already had a tangible effect on our operations’.
2.4 Risk consequence Climate data Reliability, safety Page 37, 2015 Sustainability
Report
‘As a result of more favorable conditions brought on by climate change, the rates of vegetation and tree growth have
increased. This increase, in turn, increases the potential risk to reliability and safety. In terms of the health of the trees,
there are limits to the amount of foliage that can be removed without having a negative impact’.
2.4 Shared corporate
response ORG capacity Collaboration
Page 37, 2015 Sustainability
Report
‘The corporation is an integral community partner and maintains active membership in the City’s Advisory Committee
on the Environment. The Sub Committee on Energy, Community Energy Action Plan’.
2.4 Singular corporate
response
Sudden direct climate
events Energy consumption
Page 37, 2015 Sustainability
Report
‘The corporation works towards reducing energy consumption during peak periods in order to mitigate our
vulnerability during times of extreme temperature’.
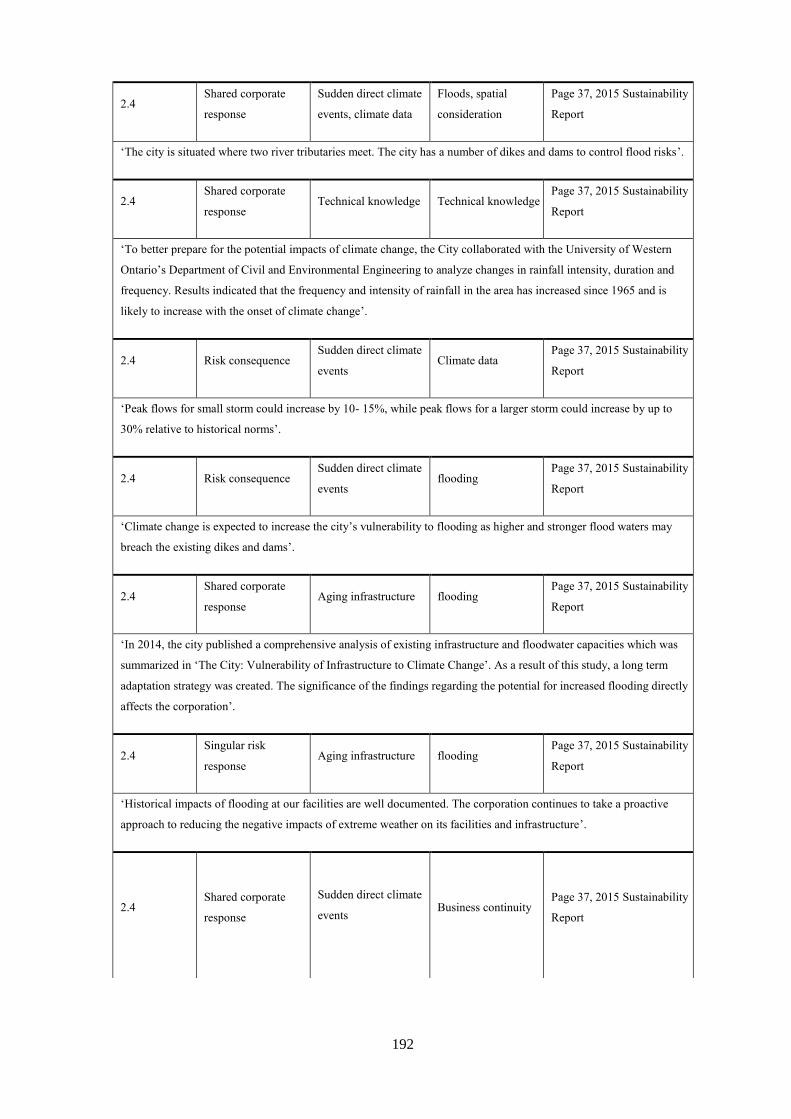
192
2.4 Shared corporate
response
Sudden direct climate
events, climate data
Floods, spatial
consideration
Page 37, 2015 Sustainability
Report
‘The city is situated where two river tributaries meet. The city has a number of dikes and dams to control flood risks’.
2.4 Shared corporate
response Technical knowledge Technical knowledge
Page 37, 2015 Sustainability
Report
‘To better prepare for the potential impacts of climate change, the City collaborated with the University of Western
Ontario’s Department of Civil and Environmental Engineering to analyze changes in rainfall intensity, duration and
frequency. Results indicated that the frequency and intensity of rainfall in the area has increased since 1965 and is
likely to increase with the onset of climate change’.
2.4 Risk consequence Sudden direct climate
events Climate data
Page 37, 2015 Sustainability
Report
‘Peak flows for small storm could increase by 10- 15%, while peak flows for a larger storm could increase by up to
30% relative to historical norms’.
2.4 Risk consequence Sudden direct climate
events flooding
Page 37, 2015 Sustainability
Report
‘Climate change is expected to increase the city’s vulnerability to flooding as higher and stronger flood waters may
breach the existing dikes and dams’.
2.4 Shared corporate
response Aging infrastructure flooding
Page 37, 2015 Sustainability
Report
‘In 2014, the city published a comprehensive analysis of existing infrastructure and floodwater capacities which was
summarized in ‘The City: Vulnerability of Infrastructure to Climate Change’. As a result of this study, a long term
adaptation strategy was created. The significance of the findings regarding the potential for increased flooding directly
affects the corporation’.
2.4 Singular risk
response Aging infrastructure flooding
Page 37, 2015 Sustainability
Report
‘Historical impacts of flooding at our facilities are well documented. The corporation continues to take a proactive
approach to reducing the negative impacts of extreme weather on its facilities and infrastructure’.
2.4 Shared corporate
response
Sudden direct climate
events
Business continuity Page 37, 2015 Sustainability
Report
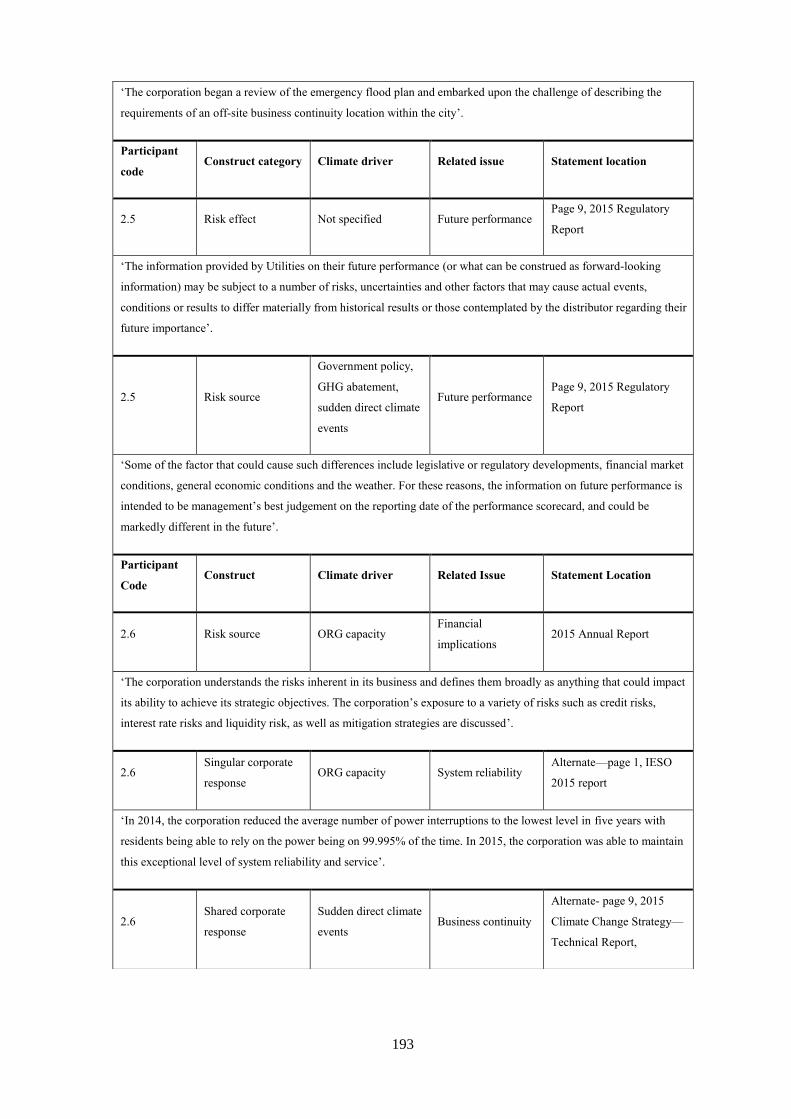
193
‘The corporation began a review of the emergency flood plan and embarked upon the challenge of describing the
requirements of an off-site business continuity location within the city’.
Participant
code Construct category Climate driver Related issue Statement location
2.5 Risk effect Not specified Future performance Page 9, 2015 Regulatory
Report
‘The information provided by Utilities on their future performance (or what can be construed as forward-looking
information) may be subject to a number of risks, uncertainties and other factors that may cause actual events,
conditions or results to differ materially from historical results or those contemplated by the distributor regarding their
future importance’.
2.5 Risk source
Government policy,
GHG abatement,
sudden direct climate
events
Future performance Page 9, 2015 Regulatory
Report
‘Some of the factor that could cause such differences include legislative or regulatory developments, financial market
conditions, general economic conditions and the weather. For these reasons, the information on future performance is
intended to be management’s best judgement on the reporting date of the performance scorecard, and could be
markedly different in the future’.
Participant
Code Construct Climate driver Related Issue Statement Location
2.6 Risk source ORG capacity Financial
implications 2015 Annual Report
‘The corporation understands the risks inherent in its business and defines them broadly as anything that could impact
its ability to achieve its strategic objectives. The corporation’s exposure to a variety of risks such as credit risks,
interest rate risks and liquidity risk, as well as mitigation strategies are discussed’.
2.6 Singular corporate
response ORG capacity System reliability
Alternate—page 1, IESO
2015 report
‘In 2014, the corporation reduced the average number of power interruptions to the lowest level in five years with
residents being able to rely on the power being on 99.995% of the time. In 2015, the corporation was able to maintain
this exceptional level of system reliability and service’.
2.6 Shared corporate
response
Sudden direct climate
events Business continuity
Alternate- page 9, 2015
Climate Change Strategy—
Technical Report,
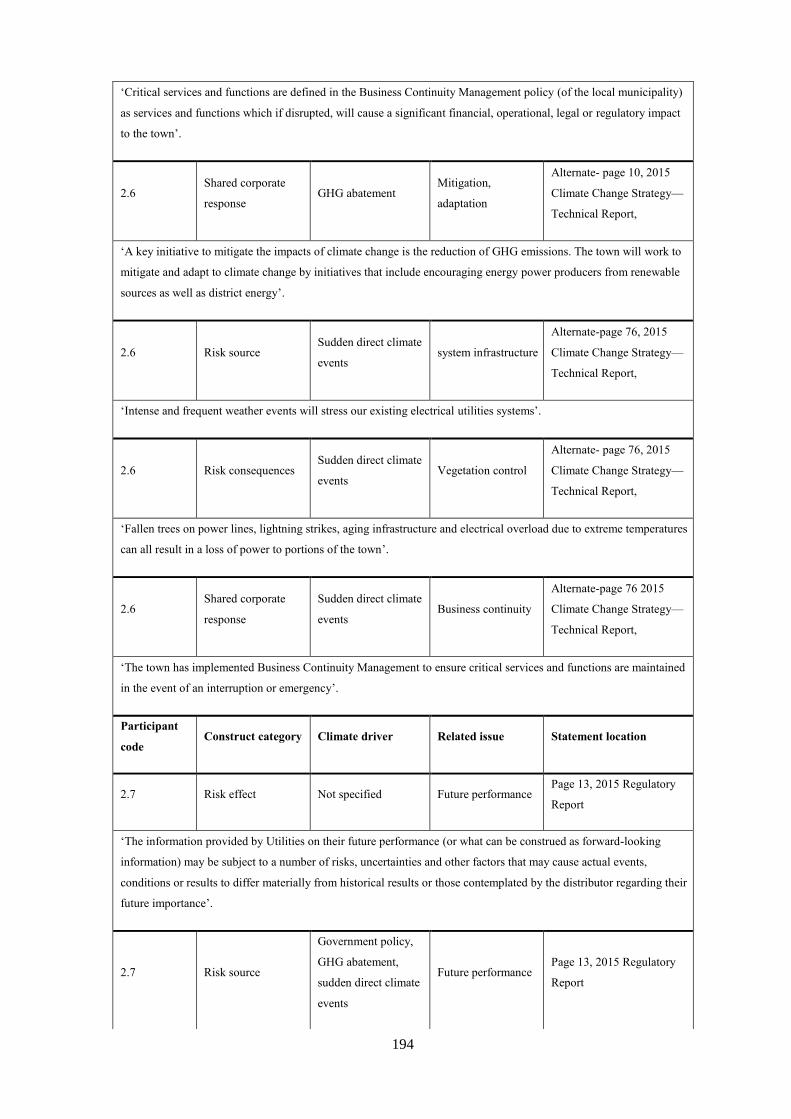
194
‘Critical services and functions are defined in the Business Continuity Management policy (of the local municipality)
as services and functions which if disrupted, will cause a significant financial, operational, legal or regulatory impact
to the town’.
2.6 Shared corporate
response GHG abatement
Mitigation,
adaptation
Alternate- page 10, 2015
Climate Change Strategy—
Technical Report,
‘A key initiative to mitigate the impacts of climate change is the reduction of GHG emissions. The town will work to
mitigate and adapt to climate change by initiatives that include encouraging energy power producers from renewable
sources as well as district energy’.
2.6 Risk source Sudden direct climate
events system infrastructure
Alternate-page 76, 2015
Climate Change Strategy—
Technical Report,
‘Intense and frequent weather events will stress our existing electrical utilities systems’.
2.6 Risk consequences Sudden direct climate
events Vegetation control
Alternate- page 76, 2015
Climate Change Strategy—
Technical Report,
‘Fallen trees on power lines, lightning strikes, aging infrastructure and electrical overload due to extreme temperatures
can all result in a loss of power to portions of the town’.
2.6 Shared corporate
response
Sudden direct climate
events Business continuity
Alternate-page 76 2015
Climate Change Strategy—
Technical Report,
‘The town has implemented Business Continuity Management to ensure critical services and functions are maintained
in the event of an interruption or emergency’.
Participant
code Construct category Climate driver Related issue Statement location
2.7 Risk effect Not specified Future performance Page 13, 2015 Regulatory
Report
‘The information provided by Utilities on their future performance (or what can be construed as forward-looking
information) may be subject to a number of risks, uncertainties and other factors that may cause actual events,
conditions or results to differ materially from historical results or those contemplated by the distributor regarding their
future importance’.
2.7 Risk source
Government policy,
GHG abatement,
sudden direct climate
events
Future performance Page 13, 2015 Regulatory
Report
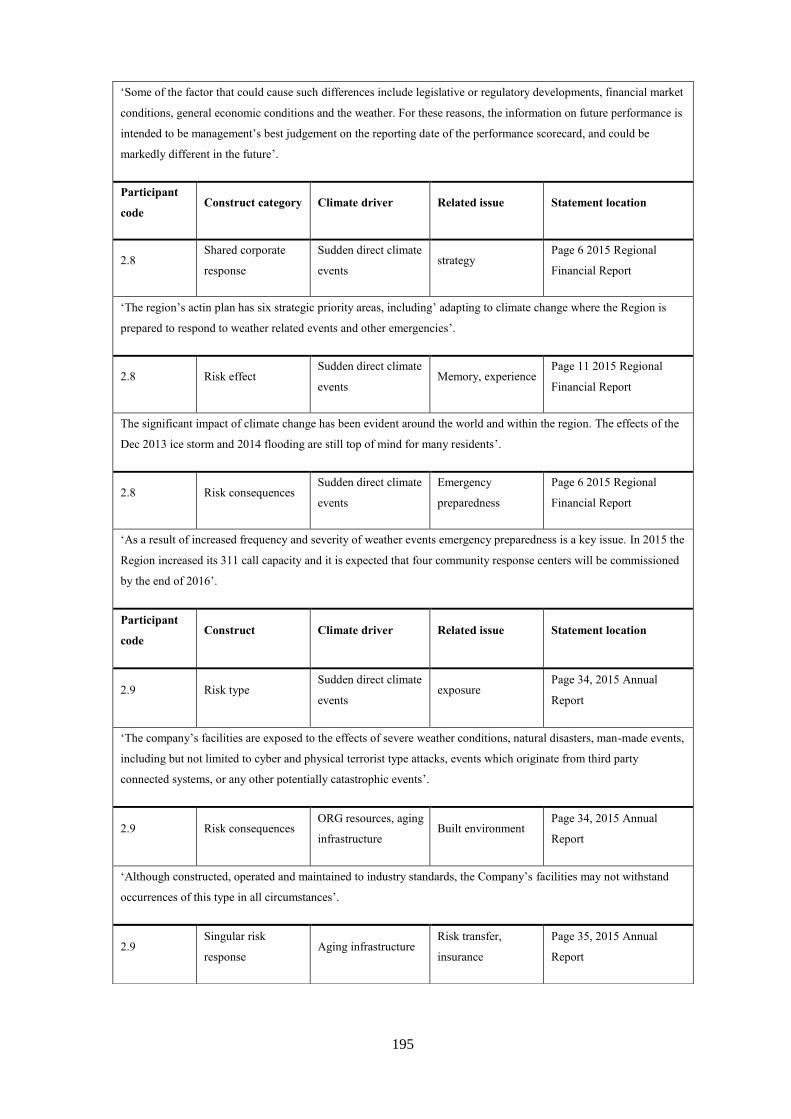
195
‘Some of the factor that could cause such differences include legislative or regulatory developments, financial market
conditions, general economic conditions and the weather. For these reasons, the information on future performance is
intended to be management’s best judgement on the reporting date of the performance scorecard, and could be
markedly different in the future’.
Participant
code Construct category Climate driver Related issue Statement location
2.8 Shared corporate
response
Sudden direct climate
events strategy
Page 6 2015 Regional
Financial Report
‘The region’s actin plan has six strategic priority areas, including’ adapting to climate change where the Region is
prepared to respond to weather related events and other emergencies’.
2.8 Risk effect Sudden direct climate
events Memory, experience
Page 11 2015 Regional
Financial Report
The significant impact of climate change has been evident around the world and within the region. The effects of the
Dec 2013 ice storm and 2014 flooding are still top of mind for many residents’.
2.8 Risk consequences Sudden direct climate
events
Emergency
preparedness
Page 6 2015 Regional
Financial Report
‘As a result of increased frequency and severity of weather events emergency preparedness is a key issue. In 2015 the
Region increased its 311 call capacity and it is expected that four community response centers will be commissioned
by the end of 2016’.
Participant
code Construct Climate driver Related issue Statement location
2.9 Risk type Sudden direct climate
events exposure
Page 34, 2015 Annual
Report
‘The company’s facilities are exposed to the effects of severe weather conditions, natural disasters, man-made events,
including but not limited to cyber and physical terrorist type attacks, events which originate from third party
connected systems, or any other potentially catastrophic events’.
2.9 Risk consequences ORG resources, aging
infrastructure Built environment
Page 34, 2015 Annual
Report
‘Although constructed, operated and maintained to industry standards, the Company’s facilities may not withstand
occurrences of this type in all circumstances’.
2.9 Singular risk
response Aging infrastructure
Risk transfer,
insurance
Page 35, 2015 Annual
Report
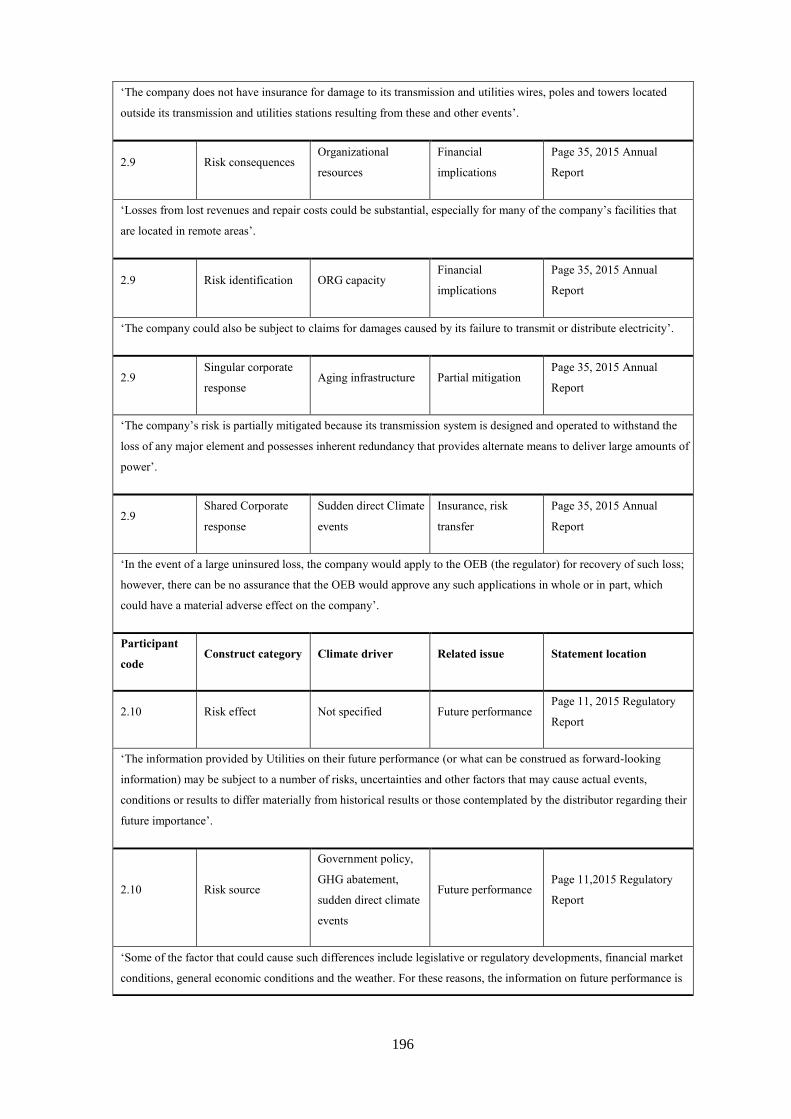
196
‘The company does not have insurance for damage to its transmission and utilities wires, poles and towers located
outside its transmission and utilities stations resulting from these and other events’.
2.9 Risk consequences Organizational
resources
Financial
implications
Page 35, 2015 Annual
Report
‘Losses from lost revenues and repair costs could be substantial, especially for many of the company’s facilities that
are located in remote areas’.
2.9 Risk identification ORG capacity Financial
implications
Page 35, 2015 Annual
Report
‘The company could also be subject to claims for damages caused by its failure to transmit or distribute electricity’.
2.9 Singular corporate
response Aging infrastructure Partial mitigation
Page 35, 2015 Annual
Report
‘The company’s risk is partially mitigated because its transmission system is designed and operated to withstand the
loss of any major element and possesses inherent redundancy that provides alternate means to deliver large amounts of
power’.
2.9 Shared Corporate
response
Sudden direct Climate
events
Insurance, risk
transfer
Page 35, 2015 Annual
Report
‘In the event of a large uninsured loss, the company would apply to the OEB (the regulator) for recovery of such loss;
however, there can be no assurance that the OEB would approve any such applications in whole or in part, which
could have a material adverse effect on the company’.
Participant
code Construct category Climate driver Related issue Statement location
2.10 Risk effect Not specified Future performance Page 11, 2015 Regulatory
Report
‘The information provided by Utilities on their future performance (or what can be construed as forward-looking
information) may be subject to a number of risks, uncertainties and other factors that may cause actual events,
conditions or results to differ materially from historical results or those contemplated by the distributor regarding their
future importance’.
2.10 Risk source
Government policy,
GHG abatement,
sudden direct climate
events
Future performance Page 11,2015 Regulatory
Report
‘Some of the factor that could cause such differences include legislative or regulatory developments, financial market
conditions, general economic conditions and the weather. For these reasons, the information on future performance is

197
intended to be management’s best judgement on the reporting date of the performance scorecard, and could be
markedly different in the future’.

198
APPENDIX U
Appendix U—Risk Response Statements—Frequency, Percentage of Corporate Statements
Participant Codes f—Risk Response
Statements f—All Statements % of Risk Response
Statements
PRODUCERS
1.1 3 7 .42
1.2 2 4 .50
1.3 3 4 .75
1.4 1 5 .20
1.5 0 2 0
1.6 1 1 1.0
1.7 4 4 1.0
1.8 3 9 .33
1.9 0 3 0
1.10 2 6 .33
Mean 45%
UTILITIES
2.1 0 2 0
2.2 0 2 0
2.3 2 4 .50
2.4 10 16 62.50
2.5 0 2 0
2.6 4 7 57.14
2.7 0 2 0
2.8 1 3 .33
2.9 3 7 .42
2.10 0 2 0
Mean 24.5%