Embed Size (px)
Citation preview

Copyright is owned by the Author of the thesis. Permission is given for a copy to be downloaded by an individual for the purpose of research and private study only. The thesis may not be reproduced elsewhere without the permission of the Author.

Loneliness among older people living in long term care settings in New Zealand
A thesis presented in partial fulfilment of the
requirements for the degree of
Master of Philosophy
in
Health
at Massey University, Albany
New Zealand.
Rubina Bogati
2016

ii
Abstract
Introduction
Loneliness is a major problem experienced by older people living in long term care
settings. Among older people, loneliness has been associated with poorer physical and
mental health. However, there is limited information known about the prevalence of
loneliness and socio-demographic and health characteristics associated with loneliness,
among older people living in long term care settings in New Zealand.
Methodology
This study used a cross-sectional correlational design to explore the degree of loneliness
among older people living in long term care settings in New Zealand and the socio-
demographic and heath characteristics associated with loneliness. Methods included a
demographic data sheet, the Barthel Index to measure functional independence, the EQ-
5D-5L and EQ-VAS to measure health and wellbeing, the geriatric depression scale to
measure depression, and the De-Jong Gierveld loneliness scale to measure loneliness.
Between December 2015 and April 2016, data from 36 participants were collected using
predominantly face to face interviews.
Results
The mean age of participants was 81 years (95% CI: 77.81-84.42). Analysis revealed
older people experienced marginal loneliness (M = 2.36, 95% CI: 1.76-2.96). Logistic
regression predicted loneliness was almost twice as likely to occur in older people with
low perceived health (OR = 1.78, p = .04) and was more than twice as likely to occur in
those with fewer social networks (OR = 2.53, p = .03). Logistic regression also
predicted that those with fewer social networks were three times more likely to
experience social loneliness (OR = 3.18, p < .00).

iii
Conclusion
Loneliness is prevalent among older people living in long term care settings in New
Zealand and is associated with lower levels of perceived health and fewer social
networks. Further research with a larger population is needed to understand loneliness,
the factors associated with it, and more importantly, strategies to reduce it.

iv
Acknowledgements
I would like to acknowledge the people without whom this thesis would have never
been completed. First and most importantly, to older people who very kindly
participated in this study and long term care settings who allowed me into their
premises to conduct this study.
My supervisor, Doctor Alison Pirret for her patience, support, knowledge, and
encouragement while I muddled through the steps of this thesis. I am forever grateful to
you, without your endless support this thesis would have never been completed. You
have been inspirational throughout this journey.
I am very thankful to Associate Professor Stephen Neville for providing me with the
idea and information to start this thesis. Julia Russell, Mary Jo Gagan, and Carla
Arkless for cordially giving their time and valuable suggestions to improve the design
of this study. Your input has been instrumental in designing this study, for which I am
very thankful.
The Massey University Human Ethics Committee for providing ethical approval to
conduct this thesis. The New Zealand Nursing Education and Research Foundation for
providing postgraduate study grant and the Massey University Graduate Research Fund
that provided the financial support which covered some of the cost associated with data
collection. Age Concern Auckland for being prepared to support participating older
people if they experienced distress during the research process.
A massive thanks to all of my friends and my ward 8 family for your support. Finally, to
the most important people in my life, Dad, Mom, Rishna, Maa, Aama and Jeet for
providing constant motivation, love and support. Thank you Jagz for supporting me
every single day while I lived this thesis for past two years.

v
Table of Contents
Abstract ii
Acknowledgements iv
Table of Contents v
List of Tables x
List of Appendices xi
Chapter one: Introduction 1
1.1. Background and rationale 1
1.2. Usage of terms 2
1.3. Research aims and questions 2
1.4. Overview of the thesis 3
1.5. Chapter summary 3
Chapter two: Literature review 5
2.1. Literature search process 5
2.2. Loneliness 6
2.3. Effects of loneliness 7
2.4. Loneliness in older people 9
2.5. Loneliness in long term care 10
2.6. Socio-demographic and health factors associated with loneliness 12
2.6.1. Age 12
2.6.2. Gender 13
2.6.3. Marital status 14

vi
2.6.4. Social networks 14
2.6.5. Health and wellbeing 15
2.6.6. Institutionalisation 15
2.6.7. Residential satisfaction 16
2.7. Measuring loneliness 16
2.7.1. University of California, Los Angeles loneliness scale 16
2.7.2. De Jong Gierveld loneliness scale 17
2.7.3. Social provision scale 17
2.8. Measuring functional independence 17
2.8.1. The Barthel Index 18
2.8.2. Functional Independence Measure 18
2.9. Measuring self-reported health status 18
2.9.1. 36-item short form health survey 18
2.9.2. EQ-5D-5L 19
2.10. Measuring depression 19
2.10.1. Hamilton Rating Scale for depression 20
2.10.2. Zung self-rating depression scale 20
2.10.3. Montgomery-Asberg depression rating scale 20
2.10.4. Geriatric depression scale 20
2.11. Chapter summary 21
Chapter three: Methodology 22
3.1. Theoretical framework 22
3.2. Research design 23
vii
3.3. Methods 25
3.3.1. Demographic data 25
3.3.2. Social networks 25
3.3.3. Health Scores 26
3.3.3.1. Functional independence 26
3.3.3.2. Health and wellbeing 27
3.3.3.2.1. Perceived health 27
3.3.3.2.2. Health rating 27
3.3.3.3. Depression 28
3.3.4. Loneliness 28
3.4. Participant selection 29
3.5. Sample size 31
3.6. Data collection 32
3.7. Ethical considerations 33
3.8. Data analysis 34
3.8.1. Inferential statistics 34
3.8.1.1. Pearson product-moment correlation coefficient 35
3.8.1.2. Spearman rank order 35
3.8.1.3. The independent sample t-test 36
3.8.1.4. Mann-Whitney U test 36
3.8.1.5. A one-way analysis of variance 36
3.8.1.6. Kruskal-Wallis test 37
3.8.1.7. Jonckheere–Terpstra test for ordered alternatives 37
3.8.1.8. Logistic regression 37

viii
3.9. Transformed variables 38
3.10. Research rigour 39
3.10.1. Objectivity 39
3.10.2. Reliability 39
3.10.3. Validity 40
3.10.4. Generalisability 41
3.11. Chapter summary 42
Chapter four: Results 43
4.1. Participant demographics 43
4.2. Health scores 45
4.3. Demographic factors influencing health scores 45
4.4. Relationships between health scores 47
4.5. Loneliness 48
4.6. Factors associated with loneliness 49
4.7. Chapter summary 53
Chapter five: Discussion 55
5.1. Socio-demographic factors 55
5.2. Health factors 58
5.2.1. Functional independence 59
5.2.2. Health and Wellbeing 60
5.2.3. Depression 60
5.3. Loneliness 61
5.4. Chapter Summary 62

ix
Chapter six: Conclusion 64
6.1. Limitations of this study 65
6.2. Future research 67
6.3. Implications of the study 68
6.4. Chapter Summary 69
Appendices 70
References 108

x
List of Tables
Table 1 Reliability of scales…………………………………………………………………...41
Table 2 Patient demographic data……………………………………………………………44
Table 3 Relationships between socio-demographic factors and health scores…………46
Table 4 Correlation between health scores………………………………………......…….47
Table 5 Correlations between health scores and loneliness……………………………...48
Table 6 Relationships between loneliness and socio-demographic factors…………….50
Table 7 Logistic regression predicting loneliness…………………………………………51
Table 8 Logistic regression predicting emotional loneliness…………………………….52
Table 9 Logistic regression predicting social loneliness………………………………...53

xi
List of Appendices
Appendix A. Summary of relevant studies……………………………………….71
Appendix B. Questionnaire……………………………………………………….76
Appendix C. Permission to use EQ-5D-5L and EQ-VAS………………………..83
Appendix D. Participant information sheet………………………………………85
Appendix E. Participant consent form…………………………………………....88
Appendix F. Coding sheet………………………………………………………..89
Appendix G. Massey University Human Ethics Committee approval…………...93
Appendix H. Graduate research fund approval letter…………………………….94
Appendix I. NZNO grant approval letter…………………………………………95
Appendix J. Consultation email I ………………………………………………..96
Appendix K. Consultation email II………………………………………………101
Appendix L. Recruitment email to Managers of long term care settings………..106

1
Chapter one: Introduction
This thesis explores loneliness among older people living in long term care settings
within New Zealand. This chapter introduces this thesis by providing background on
loneliness among older people, the rationale for conducting the research, the research
aims and questions, and finally an overview of the thesis. My interest in this topic
comes from my experience as a registered nurse caring for older people living in long
term care settings and concern that some of these older people may experience
loneliness.
1.1. Background and rationale
The oldest age group are more at risk of loneliness; this is believed to be associated with
grief, loss of close associates, change in living conditions, and other related life events
(Dykstra, 2009; La Grow, Neville, Alpass, & Rodgers, 2012; Weiss, 1974). In older
people, loneliness has been found to be associated with increased risk of mortality,
poorer physical and mental health, and increased risk of institutionalisation (Luo,
Hawkley, Waite, & Cacioppo, 2012; Prieto-Flores, Forjaz, Fernandes-Mayoralas, Perez,
& Martines-Martin, 2011).
Institutionalisation in itself, is believed to cause an increased level of loneliness, with
older people living in long term care settings twice as likely to feel lonely than those
living in community settings (Prieto-Flores et al., 2011). It is estimated that more than
47% of older New Zealanders aged 65 years and above will use long term care settings
in their life (Broad et al., 2015). The population of older people in New Zealand is
growing and Statistics New Zealand predicts a 90% probability of older people aged 65
years and above to reach 1.37 million by 2041 (MacPherson, 2014). This increase is
likely to also mean there will also be an increasing number of older people living in
long term care settings.

2
There is limited information known about the prevalence of loneliness in older people
living in long term care settings and the socio-demographic and health characteristics
associated with it (La Grow et al., 2012; Prieto-Flores et al., 2011). Courtin and Knapp
(2015) conducted a scoping review of the studies exploring loneliness among older
people and found only 10% of the studies were conducted in long term care settings; the
other 90% were conducted in community settings. In completing a literature review, no
studies were identified exploring loneliness in New Zealand (NZ) long term care
settings; this suggests research into loneliness in these settings is needed.
1.2. Usage of terms
In this thesis, the term long term care settings is used frequently throughout all the
chapters. In this thesis, this term refers to the settings in which older people live where
24 hours nursing care is provided to them.
1.3. Research aims and questions
As previously discussed, loneliness is prevalent among older people living in long term
care settings however limited research has been conducted in this area (Prieto-Flores et
al., 2011). Review of the literature identified no studies exploring loneliness in NZ long
term care settings. The inadequacy of research in this area informed the aim and
research questions of this thesis.
The aim of this study was to explore the degree of loneliness among the group of older
people living in NZ long term care settings. The research questions of this study are:
1. Is loneliness prevalent among older people living in NZ long-term care settings?
2. Are socio-demographic and health characteristics associated with loneliness?
3. Is depression one of the factors associated with increased levels of loneliness?

3
1.4. Overview of the thesis
This thesis is divided into six chapters. This chapter introduces this thesis. Following
this chapter, Chapter two, Literature review, synthesises and critiques the literature
pertaining to loneliness among older people. Chapter two presents the definition of
loneliness, effects of loneliness, socio-demographic and health factors associated with
loneliness and tools available to measure loneliness.
Chapter three, Methodology, discusses the suitability of post-positivism and objectivism
as the philosophical and theoretical underpinnings of this study. It also presents and
justifies the cross-sectional correlational design used in this study, the research methods
and the data collection and data analysis processes. Finally the chapter outlines the
ethical considerations pertaining to the study and the measures used to ensure research
rigour.
Chapter four, Results, answers the research questions by presenting the findings of the
data analysis. These findings determine the prevalence of loneliness among older people
living in long term care settings and factors associated with loneliness.
Chapter five, Discussion, elaborates on the findings of this thesis and relates them to
wider research conducted in this field. This chapter scrutinises the relevance of the
findings in the NZ context.
Chapter six, Conclusion, summarises the findings of this study. This chapter addresses
the study limitations and the implications of the findings to the NZ context.
1.5. Chapter summary
This study explores loneliness among older people living in NZ long term care settings.
This chapter outlined the rationale for studying loneliness in long term care settings due

4
to the detrimental effect it has on physical and mental wellbeing of older people. The
research aim and questions were highlighted and an overview of the six chapters
provided. The literature exploring loneliness among older people will be presented in
the next chapter.

5
Chapter two: Literature review
This chapter explores literature pertaining to loneliness and justifies the need for
exploring the following research questions:
1. Is loneliness prevalent among older people living in NZ long-term care settings?
2. Are socio-demographic and health characteristics associated with loneliness?
3. Is depression one of the factors associated with increased levels of loneliness?
This chapter explores the concept of loneliness and the determinants of loneliness. It
also provides an overview of current knowledge pertaining to loneliness among older
people living in long term care settings. The influence this knowledge had on the study
design and the contribution this study could have on loneliness in long term care
settings are discussed. This chapter also outlines the importance of continuing research
into this area and conducting this study.
2.1. Literature search process
An inclusive search for the relevant studies was done using the databases EBSCO host,
CINAHL complete, Medline, Google Scholar, Discover and Scopus for peer reviewed
journal articles published from time period between 2005-2016 and using the search
terms ‘elder* OR “old* people” OR “old* adult*” OR “old* person*” OR “age*
person*” OR “age* people*” AND lonel* OR isolat* OR segregat*’. This yielded
relevant articles which were narrowed down using availability of full text, peer
reviewed and in the English language. Further articles were also selected from the
references within articles found in the search. Suitable articles were also selected by
isolating authors who have contributed towards research in loneliness in older people
and by conducting search of their work in this field.

6
2.2. Defining Loneliness
Loneliness is defined as a subjective and negative experience, which is rooted within the
quality and quantity of social networks, and possibly having an impact on the
individual’s health and wellbeing. Loneliness has been argued by various researchers as
a major indicator of the social well-being of an individual (De Jong Gierveld & van
Tilburg, 2006). Loneliness is considered as a person’s subjective estimation of his or her
involvement or withdrawal from society (De Jong Gierveld & van Tilburg, 2006).
Loneliness can be present without a person being socially isolated. Older people who
are socially isolated tend to feel lonely, but experiencing loneliness is not identical to a
person being socially isolated (Luo, Hawkley, Waite, & Cacioppo, 2012). Various
researchers have recognised loneliness as a two dimensional concept that extends
beyond social isolation.
Loneliness has social and emotional dimensions and the presence of one does not imply
the presence of other. The concept of social and emotional loneliness was initially
proposed by Weiss, and has received support from other researchers (Dahlberg &
McKee, 2014). Social loneliness has been described as an absence of a social group,
leading to a person feeling empty and lacking a sense of belonging with a group or
community (Dahlberg & McKee, 2014). Emotional loneliness on the other hand is
much deeper and personal to the person as it originates from within a person. The
person feels an absence of a close bond, intimate support, and reliable people to turn to
or a meaningful close relationship in life (Dahlberg & McKee, 2014).
The social and emotional dimensions should be explored independently when studying
loneliness as they may not be present together. A longitudinal study with 2,101
participants (more than 50 years of age), conducted over a six year period in America,
found 43% of the participants were lonely and only 18% were living alone; this
suggested loneliness was present even in the absence of social isolation (Luo et al.,
2012). Lou et al.’s study highlights the importance of studying loneliness with distinct
social and emotional components.

7
2.3. Effects of loneliness
Loneliness has been increasingly associated with the deterioration in physiological and
psychological wellbeing of older people. Luo et al. (2012) found loneliness to be
significantly associated with an increased risk of mortality; those with extreme
loneliness were almost twice as likely to die over the following six-year period when
compared to those with the lowest levels of loneliness. Along with an increasing risk of
mortality, loneliness has been associated with various mental and physical illnesses.
Research demonstrates loneliness is associated with the development of mental illnesses
in older people making them at risk of depression (Coyle & Dugan, 2012; Losada et al.,
2012; Prieto-Flores, et al., 2011; Van Beljouw et al., 2014). Considerable research
demonstrates depression to be related to the levels of loneliness among older people
living in long term care settings (Drageset, Kirkevold, & Espehaug, 2011; Luanaigh &
Lawlor, 2008; Golden et al., 2009; Nikmat, Hashim, Omar, & Salmi, 2015; Nyqvist,
Cattan, Andersson, Forsman, & Gustafson, 2016; Prieto-Flores et al., 2011; Theeke,
2010). Drageset et al. (2011) found depression was related to both social and emotional
loneliness and loneliness has been associated with an increased level of depression in
older males in New Zealand (Alpass & Neville, 2003).
In addition to depression, loneliness appears to be associated with other areas of mental
functioning. It has been related to dementia (Holwerda et al., 2012) and decreased
cognition, with reduced psychomotor processing speed and visual memory (Luanaigh
and Lawlor, 2008). Being lonely and socially isolated is also linked to an increase in
health risk behaviours, such as smoking and inactivity (Shankar, McMunn, Banks, &
Steptoe, 2011; Theeke, 2010).
Apart from the direct relation with health risk behaviours, loneliness has also been
linked with various chronic conditions such as hypertension, which could be a result of
health risk behaviours (Cacioppo et al., 2002; Cacioppo, Hawkley, & Thisted, 2010).
Research suggests social isolation is directly linked to increases in blood pressure,
fibrinogen levels and C- Reactive proteins (Shankar et al., 2011) all of which can

8
eventually lead to an increased risk of developing cardiovascular disease and other
chronic illnesses (Reed, Crespo, Harvey & Anderson, 2011).
Dahlberg and McKee (2014) in their correlational study of 1,255 older people aged over
65 years, demonstrated similar results to other studies portraying the wider effects of
loneliness. They showed significant relationships between poor physical health and
increased level of both social and emotional loneliness (Dahlberg & McKee, 2014).
Various other studies have also found chronic health conditions and poor health to be a
strong predictor of loneliness (Arslantaş, Adana, Abacigil Ergin, Kayar, & Acar, 2015;
Losada et al., 2012; Theeke, 2010).
Loneliness furthermore, has been associated with altered immunity in older people
(Pressman et al., 2005) and a triggering factor for stress responses (Luanaigh & Lawlor,
2008). Loneliness increases the hypothalamic pituitary adrenocortical activity (Adam,
Hawkley, Kudielka, & Cacioppo, 2006) and reduces the anti-inflammatory response
whilst increasing the pro-inflammatory response (Cole, Hawkley, Arivalo, & Cacioppo,
2011). This means older people experiencing loneliness are more prone to infection and
have less ability to recover from it.
Research suggest decreased levels of loneliness is associated with improved physical
and mental function. In a British longitudinal study of 999 participants over and eight-
year period, Victor and Bowling (2012) found a strong positive correlation between
improved physical health and a reduced level of loneliness. Rueggeberg, Wrosch,
Miller, and McDade (2012) identified stress and inflammatory disturbances associated
with loneliness are reduced in lonely older people who engage in strategies to protect
themselves from being lonely. As loneliness is associated with various problems that
can disrupt normal bodily functions and decrease the quality in life, older people who
experience loneliness are especially vulnerable to a decline in their quality of life.

9
2.4. Loneliness in older people
The population of older people in New Zealand is growing. The population of older
people aged 65 years or older in New Zealand was 0.65 million in 2014 and Statistics
New Zealand projects a 90% probability of the count reaching 1.37 million in 2041 and
1.81 million in 2068 (MacPherson, 2014). It is estimated that more than 47% of older
New Zealanders aged 65 years or older will use long term care settings in their life
(Broad, Ashton, Gott, McLeod, Davis, & Connolly, 2015). This suggests there will be
an increase in number of older people in NZ and a subsequent increase in people living
in long term care settings.
One of the biggest problems faced by older people is loneliness. Older people are highly
vulnerable to loneliness and several studies have found high levels of loneliness among
older people (Prieto-Flores et al., 2011; La Grow, Neville, Alpass, & Rodgers, 2012).
Loneliness has increased rapidly in western societies as the pressure to become
productive has led people to ignore their social networks. The basic structure of society
is evolving and is witnessing a rapid decline in larger family units with increases in
nuclear families, divorce rates and the number of people who choose to stay single
(Dykstra, 2009). These changes create a smaller social pool for older people and
predispose them to loneliness when they start losing their family and friends (Dykstra,
2009). All of these factors can lead to increased loneliness among older people and
therefore, if we are to improve the quality of life of our older population in NZ, there is
an urgent need to better identify loneliness and determine strategies to reduce it. The
importance of managing loneliness among older people in order to improve their quality
of life has been recognised in various policies worldwide and in New Zealand (Statistics
New Zealand, 2013) and the New Zealand Ministry of Health recognises reduced
loneliness as a healthcare target (Statistics New Zealand, 2013)

10
2.5. Loneliness in long term care
There are various studies conducted in the field of loneliness but the majority of them
have explored loneliness in the community settings (Prieto-Flores et al., 2011).
Research demonstrates loneliness is more prevalent in older people living in long term
care settings when compared to those living in community settings therefore, focus into
research among older people living in long term care settings is required. Prieto-Flores
et al. (2011) conducted a comparative study between loneliness in Spanish older people
living in long term care settings and those living in the communities. They had 234
participating older people 60 years old and above from long term care and an equal
number from the community. They found older people living in long term care settings
were twice as likely to be lonely than those living in the community (Prieto-Flores et al.,
2011). The study found depression and participants’ social networks were closely
associated with loneliness.
The findings related to a higher prevalence of loneliness in older people living in long
term care settings when compared to community settings, is supported by Heidari,
Ghodusi, and Shirvani (2016) in an Iranian descriptive cross-sectional study of 100
older people over 60 years. Among them, 50 were living in long term care settings, and
loneliness was significantly higher in older people living in long term care settings
compared to those living in communities. Their study however, excluded participants
with disabling acute or chronic physical or mental conditions. As disabilities have been
identified as an indicator for loneliness (Golden et al., 2009; Theeke, 2010), this study
may have underestimated the degree of loneliness in the wider population living in long
term care settings. Heidari et al. (2016) used the Loneliness Self-reported Questionnaire
which is not widely used in studies exploring loneliness in older people in long term
care settings and may not have derived the true degree of loneliness in this population.
Nyqvist et al.’s (2016) Swedish study found 55% of those living in Swedish long term
care settings and 45% of those living in Swedish community settings were lonely. They
used a cross-sectional population-based study with a total of 483 older people aged 85
years and over to investigate the association between aspects of social capital
(structural, cognitive and health resources) and loneliness. They found loneliness was

11
found to be closely associated with living alone, depression, and the geographical
region they lived in (Nyqvist et al., 2016). Nyqvist, et al. used a single question for their
assessment of loneliness “Do you ever feel lonely?” This question had four responses:
often, sometimes, seldom, and never. Nyqvist et al. argue the use of this single question
to assess loneliness was as equally valid as the multi-items tools developed. However,
the use of a single question does not explore the two-dimensional concept of social and
emotional loneliness which has been identified as being quite different. Drageset, Eide,
Kirkevold, and Ranhoff (2012) previously used a single dimensional tool to measure
loneliness, however, now suggests a multi-dimensional measure that enables
differentiation between emotional and social loneliness to enable deeper insights into
loneliness.
Between 2004 and 2010, Drageset et al. (2012) conducted a study on 227 cognitively
intact older people aged 65-102 years, from 30 different long term care settings in
Norway. Using face-face interviews and the Social Provisions Scale to measure
loneliness, they found emotional loneliness was significantly associated with mortality.
From the same sample, using a cross-sectional, descriptive, correlational design
Drageset et al. (2011) explored the relationships between depressive symptoms, sense of
coherence and emotional and social loneliness and found depression to be associated
with both social and emotional loneliness.
Whilst Drageset et al. (2011) showed depression was associated with loneliness in
cognitively intact older people, cognitive impairment is also associated with loneliness.
Nikmat et al. (2015), in a Malaysian cross sectional survey involving 149 older people
aged more than 60 years with cognitive impairment, found loneliness or social isolation
was prevalent in 95.5% of participants and was strongly associated with depression and
relationship satisfaction with their children (Nikmat et al., 2015). This shows loneliness
is prevalent among both cognitively intact and impaired older people, and in both
groups it is associated with depression. Nikmat et al. (2015) however did not
differentiate between loneliness and social isolation but rather used the Friendship Scale
(FS) to measure loneliness. The FS does not measure loneliness as a unique two-
dimensional concept and focusses more towards the social component of the loneliness.

12
It was designed to measure social isolation among older people (Hawthorne, 2006) and
has been used to measure just the social engagement of older people (de Guzman et al.,
2012). Hence using this scale may be inadequate in assessing loneliness.
The association between loneliness, social isolation, social engagement, and life
satisfaction among 180 older people in Philippines living in long term care settings was
examined by de Guzman et al. (2012). They used the University of California Los
Angeles Loneliness Scale (UCLA) and found association between increased loneliness
and increased social isolation, inadequate social engagement and decreased life
satisfaction. A tabulated summary of the studies conducted in long term care settings
exploring loneliness is included in appendix A.
2.6. Socio-demographic and health factors associated with loneliness
There are various socio-demographic and health factors that have been associated with
loneliness. The socio-demographic factors include age, gender, marital status, ethnicity,
and social networks. The factors relating to health and wellbeing include
institutionalisation and residential satisfaction. These factors will now be discussed.
2.6.1. Age
There are numerous studies suggesting increased age correlates with increased levels of
loneliness however, some suggest a positive correlation and some have found a negative
correlation between them. Age related degeneration has been associated with increased
levels of loneliness (De Jong Gierveld & van Tilburg, 2006; Dykstra, 2009; Golden et
al., 2009; Kobayashi, Cloutier-Fisher, & Roth, 2009; Losada et al., 2012). In a
secondary analysis of a longitudinal health and retirement study, Theeke (2010) found
age to be inversely related to the likelihood of loneliness. The NZ General Social
Survey conducted in 2010 found the likelihood of feeling lonely decreased with the
increment in age (Statistics New Zealand, 2013).

13
2.6.2. Gender
The relationship between gender and loneliness does not appear to be clearly
established. There are numerous studies associating increased loneliness in women and
some studies suggest a relationship between male gender and increased loneliness.
Dahlberg and McKee (2014) found male gender a factor associated with increased level
of social loneliness; a similar result was found by Djukanovic, Sorjonen and Peterson
(2014) who identified the largest proportion of loneliness in their study was among
males. On the other hand, Losada et al. (2012) and Golden et al. (2009) found being
female as a strong predictor of loneliness.
Some studies propose theories to explain how women cope better with loneliness than
men. Some studies suggest women cope with loneliness in a more effective way than
men, leading to a lower prevalence of loneliness among them (Honigh-de Vlaming,
Haveman-Nies, Bos-Oude Groeniger, de Groot, & Veer, 2014). Others suggest women,
when compared to men, are less likely to be socially isolated due to their increased
tendency to engage in social groups and make social relationships (Honing-de Vlaming,
et al., 2014).
Bekhet and Zauszniewski (2012) in a descriptive and comparative study examined
gender associations with loneliness and resourcefulness skills in older people living in
long term care settings. They found the interaction between gender and loneliness was
not significant, however, older people who reported not feeling lonely had higher
resourcefulness scores than those who reported feeling lonely (Bekhet & Zauszniewski,
2012).
The degree of loneliness varies depending on the instruments used to measure it.
Nicolaisen and Thorsen (2014) found asking direct questions showed loneliness was
more prevalent in women, however, when using De Jong Gierveld loneliness scale, it
was found to be more prevalent in men (Nicolaisen & Thorsen, 2014). This emphasises
the influence varying tools have on the study findings and the care required when
generalising the results to the older population.

14
2.6.3. Marital status
There appears to be uniformity in results exploring association between marital status
and loneliness. The majority of research associates not being married, or being
widowed, or having no partner to an increased level of social and emotional loneliness
(Dahlberg & McKee, 2014; Golden et al., 2009; Honing-de Vlaming et al., 2014;
Kobayashi et al., 2009; Prieto-Flores et al., 2011; Theeke, 2010). Prieto-Flores et al.
(2011) found loneliness twice more likely to exist in older people without partners
compared to those with partners.
2.6.4. Social networks
The social networks of older people encourages them to be part of society. The
meaningful contacts made by older people enable them to feel associated with the
society thereby, reducing the levels of loneliness (Stephens, Alpass, Towers, &
Stevenson, 2011). Various studies have found association between the social networks
of older people and their levels of loneliness. Prieto-Flores et al. (2011) found personal
networks to be the major factor associated with the increased levels of loneliness in
older people living in long term care settings.
Victor and Bowling (2012) in their longitudinal study of 999 participants, also found
social networks to be a direct measure to reduce loneliness in older people, and
Dahlberg and McKee (2014) found less contact with family and friends contributed to
an increased level of social loneliness among older people. Living alone and having
dissatisfaction with the frequency of contact with relatives and friends is a strong
predictor of loneliness (Losada et al., 2012).
The degree of loneliness appears to be related to the composition of households and the
relationships with family members. Theeke (2010) found living in the household with
limited people significantly increased the likelihood of older people getting lonely.
These findings were supported by Chen and Feeley (2014) who found support from
spouse/partner, family, friends, and children as a significant indicator of decreased
loneliness whereas, strain in relationships was linked to increased levels of loneliness.

15
2.6.5. Health and wellbeing
The perceived wellbeing and ability to function physically appears to be related to
loneliness levels. Dahlberg and McKee (2014) found low level of activities contributed
to an increased level of loneliness and was a significant predictor for social loneliness.
Lack of hobbies is a strong indicator of loneliness (Arslantaş et al., 2015) and loneliness
is increased in those who are physically disabled or have physical limitations (Golden et
al., 2009; Honing-de Vlaming et al., 2014; Theeke, 2010). High levels of restriction in
performing activities, such as inability to perform activities of daily living, is also
associated with increased levels of emotional loneliness (Dahlberg & McKee, 2014).
The relationship between the loneliness and wellbeing of older people appears to be
inter-related. Loneliness has been associated with the decline in the physical functioning
and that decline leads to the loss of independence among older people. The inability to
independently manage activities of daily living may also cause distress, isolation, grief,
sense of helplessness, and other psychological problems (Dahlberg & McKee, 2014)
that can lead to loneliness.
2.6.6. Institutionalisation
Prieto-Flores et al. (2011) found the effects of institutionalisation was significantly
associated with loneliness. They also found older people living in long term care
settings twice as likely to feel lonely than those living in the community.
Moving into an unfamiliar environment of a long term care setting brings with it its’
own problems that can increase the vulnerability and stress levels among older people.
Moving away from familiar surroundings and people into a setting which has
timetables, policies and practices, insufficient space, structured environment, time
constraints and most importantly the distance separating them from their meaningful
social contacts, increases the likelihood of feeling lonely (Prieto-Flores et al., 2011).
Older people with cognitive impairment and/or other limiting health and wellbeing
factors may not be able to form meaningful relationships once they move into long term
settings. Prieto-Flores et al. (2011) state “Not only does institutionalisation have an

16
effect on the feeling of loneliness, but extreme loneliness may also lead to
institutionalisation” (p.190).
2.6.7. Residential satisfaction
The wellbeing of older people living in long term care is associated with the physical
and social environment of long term care setting they live in (Cheng et al., 2011). There
is limited research on the residential satisfaction among older people living in long term
care settings despite the negative effects of institutionalisation on the social world of
older people (Fernandez-Mayoralas, Prieto-Flores, Forjaz, Rojo-Perez, & Martinez-
Martin, 2011). A cross-sectional study conducted in Spain found residential satisfaction
positively affects the sense of belonging and negatively affects loneliness among older
people living in long term care settings (Fernandez-Mayoralas, et al., 2011).
Socio-structural factors, such as education and income, have also been associated with
loneliness. Theeke (2010) found lower levels of education and income were associated
with increased loneliness among older people living in the community settings. On the
other hand, education and income have not been frequently associated with loneliness
among older people living in long term care settings. Having discussed factors affecting
loneliness, the tools available to measure loneliness will now be discussed.
2.7. Measuring loneliness
There are tools developed and utilised to measure loneliness among older people living
in long term care settings. The tools described below have been used in the studies
conducted in long term care settings and consist of both uni-dimensional and multi-
dimensional tools to measure loneliness.
2.7.1. University of California, Los Angeles loneliness scale
University of California, Los Angeles (UCLA) loneliness scale is a 20-item scale used
to measure loneliness and social isolation. Although the scale was developed using

17
sample of young people, the validity of the scale has also been proven in older people
(Dahlberg & McKee, 2014). This scale appears to be highly reliable with an internal
consistency (Cronbach’s α = .89 - .94) and test-retest reliability over a 1-year period (r =
.73) (Russell, 1996).
2.7.2. De Jong Gierveld loneliness scale
The De Jong Gierveld Loneliness Scale provides a multi-dimensional measure of
loneliness as it covers both social and emotional dimensions (Dahlberg & McKee,
2014). This scale is regarded to be appropriate, widely used and has been validated for
use in long term care settings for assessment of loneliness in older people (Cronbach’s α
= .76) (Dahlberg & McKee, 2014; De Jong Gierveld & van Tilburg, 2006; Penning, Liu
& Chou, 2013). Penning, Liu and Chou (2013) also found this scale more suitable to use
in older people when compared to the ULCA.
2.7.3. Social provision scale
The social provision scale (SPS) was designed by Cutrona and Russell in 1987 to
measure the extents to which a person reports being satisfied with their present
relationships. It is an interviewer administered scale and contains 16 items, based on the
four social provisions identified by Weiss (1974) which are attachment, social
integration, nurturance and reassurance of worth. This scale has been used in a variety
of populations including older people, but it was not designed specifically for the
geriatric setting. High scores of SPS indicate a high level of satisfaction with their
present relationship. The revised SPS has shown good reliability when used among
older people living in long term care settings and good has validity measures (Drageset
et al., 2011).
2.8. Measuring functional independence
There are various tools designed to measure the functional ability of an individual to
perform activities of daily living (ADL). Among them, the most commonly used are the

18
Barthel Index and the functional independence measure (Cheng, Weng, Chang, Tan, &
Tang, 2014) which are described below.
2.8.1. The Barthel Index
The Barthel Index is used to assess functional independence of older people to carry out
activities of daily living and has been used in other studies exploring loneliness of older
people living in long term care settings. It consists of 10 activities of daily living and
can be completed through observation or self-report and is seen as a valid tool to
measure functional ability (Collin, Wade, Davies, & Horne, 1988).
2.8.2. Functional independence measure
The functional independence measure (FIMTM) is an 18-item ordinal scale used to
measure the functional status often in the rehabilitation community (Wright, 2000). The
FIMTM is a valid and reliable tool to measure functional ability among older people as it
has shown good construct validity and reliability (Cheng et al., 2014). This tool
however, has not been widely used in studies exploring loneliness among older people.
2.9. Measuring self-reported health status
There are various tools developed to measure health status of older people. Among the
available tools, two of the tools previously used in the research exploring loneliness
among older people are described below.
2.9.1. 36-item short form health survey
The 36-item short form health survey (SF-36) was developed by the Research and
Development (RAND) Corporation as part of the medical outcomes study which was a
survey conducted to assess the quality of life in people with chronic conditions (RAND
Corporation, 2016). It was designed to evaluate medical outcomes and rationalise
differences in patient outcomes (RAND Corporation, 2016). The SF-36 is an
articulated, generic and self-reporting tool which covers quality of life measures, such

19
as physical functioning, social functioning, role limitations due to physical problems
and/or emotional problems, mental health, energy or vitality, pain, general health
perception and health changes over the past year (Garcia & McCarthy, n.d.; RAND
Corporation, 2016). It is widely used for routine monitoring and assessment of care
outcomes and has been widely used in studies involving older people (Garcia &
McCarthy, n.d.).
Haywood, Garratt, and Fitzpatrick (2005) performed a systematic review of generic
self-assessed health scales in older people and among the 15 most widely used
instruments assessed, SF-36 was found to have the most extensive evidence of both
internal consistency and test-retest reliability. It has an extensive amount of evidence
supporting its reliability and validity and recommended in older people when a broad
range of health assessment needs to be carried out (Haywood, Garratt, & Fitzpatrick,
2005). A study conducted by Andresen, Gravitt, Aydelotte, and Podgorski (1999) found
SF-36 valid and reliable to use in long term care settings however, they recommend it to
be used for participants with higher cognitive function.
2.9.2. EQ-5D-5L
The EQ-5D-5L is a tool developed by the EuroQol group to measure health and it has
widespread application in the health setting including use in clinical research (Janssen et
al., 2013). It measures five dimensions of health: mobility, self-care, usual activities,
pain/discomfort, and anxiety/depression. EuroQol group requires EQ-VAS to be used as
a part of EQ-5D-5L to measure health; EQ-VAS is a slider scale that records the
perceived health score. This tool has previously been used in the long term care setting
to determine the perceived health of older people (Prieto-Flores et al., 2011).
2.10. Measuring depression
There are various tools commonly used to assess levels of depression in older people
living in long term care. Four tools commonly used in clinical studies to assess
depression in older people include the Hamilton Rating Scale for Depression, the Zung

20
Self-rating Depression Scale, the Montgomery-Asberg Depression Rating, and the
Geriatric Depression Scale.
2.10.1. Hamilton Rating Scale for Depression
The Hamilton Rating Scale for Depression (HAM-D) is a commonly used tool to
identify people with depressive disorders in clinical studies (Holroyd & Clayton, 2000).
The HAM-D is a 21-item scale which is completed by an observer following an
interview with the participant. The validity of this scale in the geriatric setting has not
been well established (Holroyd & Clayton, 2000).
2.10.2. Zung Self-rating Depression Scale
The Zung Self-rating Depression Scale (SDS) uses graded responses and is widely used
in clinical studies (Holroyd & Clayton, 2000). The SDS is not recommended for use in
older people due to the false positives it can produce and does not have a well-
established validity for use in the geriatric setting (Holroyd & Clayton, 2000).
2.10.3. Montgomery-Asberg Depression Rating Scale
The Montgomery-Asberg Depression Rating Scale (MADRS) is completed by an
observer, based on an interview of the participant (Holroyd & Clayton, 2000). The scale
consists of 10 questions covering core symptoms of depression. The scale has not been
validated sufficiently in the geriatric setting (Holroyd & Clayton, 2000).
2.10.4. Geriatric Depression Scale
The Geriatric Depression Scale (GDS) short form consists of 15-items (Sheikh &
Yesavage, 1986) and was developed to be used in the geriatric setting (Jongenelis et al.,
2005). It is one of the most widely used assessment tools to measure depression in older
people living in NZ long term care settings (New Zealand Guidelines Group, 2008) and
is considered reliable and well validated for use in this population (Jongenelis et al.,
21
2005; Lesher & Berryhill, 1994; Smalbrugge, Jongenelis, Pot, Beekman & Eefsting,
2008).
2.11. Chapter summary
Loneliness is a subjective and negative experience which is prevalent among older
people and it is believed to be twice as prevalent among older people living in long term
care settings compared to those living in the community. Loneliness is considered a two
dimensional concept, consisting of emotional and social loneliness.
Loneliness is associated with the deterioration in the health and wellbeing of older
people. Research has found various socio-demographic and health factors, such as age,
gender, marital status, ethnicity, social network, depression, residential satisfaction and
institutionalisation, associated with loneliness among older people. Whilst there are
various studies conducted in the area of loneliness; it has not been explored in NZ long
term care settings.
This chapter explored the concept of loneliness and the research associated with it. The
next chapter presents the methodology used to explore loneliness in older people in NZ
long term settings.

22
Chapter three: Methodology
This chapter explains the methodology used to answer the following research questions:
1. Is loneliness prevalent among older people living in NZ long-term care settings?
2. Are socio-demographic and health characteristics associated with loneliness?
3. Is depression one of the factors associated with increased levels of loneliness?
This chapter presents the theoretical framework that underpins this study, the
methodology and the methods utilised to answer the research questions, ethical
considerations, participant selection processes, and processes used to ensure research
rigour.
3.1. Theoretical framework
The philosophical underpinning for this study was objectivism as it followed a scientific
method to answer the research questions. Objectivism believes in the existence of a
reality and therefore, considers the research process as a way to discover the reality
(Gray, 2014). Understanding the philosophical foundation of a study is essential as it
aids in understanding the background of the research problem, articulating research
questions, validating the methodological approach, and providing criteria which can be
used to assess the rigour of the published research findings (Comerasamy & Siu, 2013).
The theoretical stance of this study was post-positivism. Post-positivism stems from
positivism and retains some aspects of it hence an understanding of positivism is
needed. Positivism believes in only gaining knowledge from phenomena that can be
directly observed and measured (Crossan, 2003); once this knowledge is gained it
presents truth (Giddings & Grant, 2007). Criticisms pertaining to Positivism led to the
development of a post-positivist view.

23
Post-positivists believe that all observations and measurements can have errors
(Crossan, 2003). They support objectivity, however, they define objectivity as a social
phenomenon rather than characteristic of an individual researcher. They believe
in achieving objectivity by valuing or critiquing knowledge discovered by work of one
another (Giddings & Grant, 2007; Houghton, Hunter, & Meskell, 2012). The knowledge
that survives the scrutiny of truth seekers is closer to achieving objectivity (Houghton,
Hunter, & Meskell, 2012). Post-positivists also believe in uncertainty, with truth being
highly likely but not certain (Giddings & Grant, 2007) and that research outcomes are a
result of interactions related to a complex range of causative factors (Giddings & Grant,
2007).
This study follows objectivism and post-positivism as there were no known studies
conducted in the area of loneliness in older people living in NZ long term care settings
which meant uncertainty around the study’s findings. The long term care setting is a
complex environment where previous research has found difficulty recruiting
participants (Tzouvara, 2015) and the interaction of numerous factors, such as physical
health, age and gender, influencing the levels of loneliness in older people.
Although a post-positivist approach may include both quantitative and qualitative
methods, this study used a quantitative design to identify whether loneliness exists in
older people living in long-term care settings. Due to the requirements of a post-
positivist approach, this thesis had processes in place to minimise researcher bias related
to the researcher’s personal values, emotions, and beliefs to enable it to generate results
that would be useful in informing future research and improving care of older people.
3.2. Research design
This study used a cross-sectional correlational design to investigate loneliness in older
people living in long term care settings. Loneliness being a subjective experience cannot
be measured experimentally, which makes correlational design as an appropriate design
for a quantitative study on loneliness (Eng, 2016; Weeks, Michela, Peplau, & Bragg,
1980).

24
Cross-sectional correlational study uses a single timeframe to collect data from a cross-
section of population and is beneficial in assessing variables of interest in a population
sample (DePoy & Gitlin, 2011). In a cross-sectional correlational design, the
independent variables are not controlled and all the variables are measured as they exist,
without any manipulation (Beck & Polit, 2012).
DePoy and Gitlin (2011) recommend cross-sectional correlational design in conducting
research in a real life setting as it helps enhance understanding about the existing real
world setting around us; this is likely the reason why most studies conducted around
loneliness in older people have used a correlational design.
This thesis closely resembles a Spanish study which used a cross-sectional correlational
design to investigate loneliness among older people living in the community and in long
term care settings (Prieto-Flores et al., 2011). Prieto-Flores et al. (2011) used correlation
to identify if the socio-demographic factors, depression, and health and wellbeing of the
participants was associated with levels of loneliness. A NZ cross-sectional survey
conducted in the community setting established relationships between loneliness and
self-reported health (La Grow, Neville, Alpass, Rodgers, 2012). La Grow, et al. (2012)
found 52% of the participants to be lonely and loneliness was associated with lower
physical and mental health scores.
This study used a cross-sectional correlational design, because it aimed to determine the
health and demographic factors associated with loneliness in a cross-section of
population of older people living in NZ long term care settings at one point in time.
Correlation was used to determine whether any relationships exist between loneliness,
depression, health and socio-demographic characteristics.

25
3.3. Methods
As previously stated, this study used a cross-sectional correlational design and
resembles the study of Prieto-Flores et al. (2011). Prieto-Flores et al. (2011) utilised
previously validated and reliable quantitative tools to explore prevalence and socio-
demographic and health factors associated with loneliness. This study compared the
factors associated with loneliness among the older people living in community settings
and those living in long term care settings. The study from Prieto-Flores et al. identified
statistically significant relationships between loneliness, depression and the social
network of the participants living in long term care settings.
This thesis used a questionnaire to collect data on participant demographics, their social
network, functional independence, perception of health and well-being, and self-
reported level of depression and loneliness. Functional independence, health and
wellbeing, and depression were included as components of participants’ health scores.
(see Appendix B). Each of these methods will now be discussed.
3.3.1. Demographic data
Prieto-Flores et al. (2011) collected data on gender, age, marital status, education level,
number of children, and the place of residence. The demographic data in this thesis also
collected data on the participants’ gender, age, marital status, and ethnicity (see
Appendix B). As the entry criteria required participants to be living in long term care
settings, this was automatically collected. The study did not collect data on education
level and number of children as the majority of studies conducted in long term care
settings either did not include these factors in their demographic data or when included,
have not found any association with loneliness (Nikmat et al., 2015; Nyqvist et al.,
2013).
3.3.2. Social networks
To identify factors associated with loneliness, Prieto-Flores et al. (2011) collected data
on participants’ social network as indicated by the frequency of meaningful gatherings

26
they have within the setting and the frequency of visits they have outside the setting
with their friends, family and neighbours. This study has also used these questions to
collect data on participants’ social networks. In this study, this data were collected using
an interval scale with categories of ‘less than once a month’, ‘once or twice a month’,
and ‘once a week or more frequently’. The response of ‘less than once a month’ was
allocated a score of ‘3’, ‘once or twice a month’ allocated a score of ‘2’, and ‘once a
week or more frequently’ allocated a score of ‘1’. The higher the score, the lesser the
frequency of contact with friends, neighbours and family therefore fewer social
networks (see Appendix B). This data was not measured within a certain time period but
related to the frequency of gatherings and visits occurring generally.
3.3.3. Health Scores
The participants’ health scores consists of their level of functional independence, health
and wellbeing, and depression. The health and wellbeing is further divided into
perceived health and health rating.
3.3.3.1. Functional independence
Prieto-Flores et al. (2011) utilised the Barthel Index to assess participants’ functional
abilities and its association with loneliness; the Barthel Index was also used in this
thesis. The Barthel Index collected data on the functional independence of the
participants. The Barthel Index is validated, reliable, and has been widely used in the
geriatric settings to assess functional ability of older people (Lübke, Meinck, & Von
Renteln-Kruse, 2004). The items in the index includes 10 personal activities of daily
living: mobilising, transferring from one seating position to another, using stairs,
controlling bladder, controlling bowel, bathing, using toilet, personal grooming,
dressing, and feeding. Each of the responses to the items in the index would score 0, 5,
10, or 15, depending on the item. The total of the responses to 10 items are then added
for a final score ranging from 0 (completely dependent) to 100 (completely
independent).

27
3.3.3.2. Health and wellbeing
Prieto-Flores et al. (2011) used the EQ-5D and EQ-VAS to collect data on the health
and wellbeing of the participants. This thesis used the EQ-5D-5L and EQ-VAS to
collect data on participants’ perceived health and wellbeing. The EQ-5D-5L is an
updated version of EQ-5D. The health and wellbeing is measured by two different tools
and therefore, is further divided into perceived health and health rating.
3.3.3.2.1. Perceived health
Data on the self-reported perceived health were collected using EQ-5D-5L. Copyright
of EQ-5D-5L is held by the EuroQol Group Association therefore, permission to use the
NZ version of EQ-5D-5L for this study was obtained from them (see Appendix C). The
EQ-5D-5L is a validated and reliable tool and is widely used in multiple countries to
collect data on self-reported health status of older people (Hulme, Long, Kneafsey, &
Reid, 2004).
The EQ-5D-5L includes five items which collects data on the ability of participants to
mobilise, perform activities of daily living, basic management of the environment
around them, pain or discomfort level, and level of anxiety and depression. Each item
has five responses; each response scores a number ranging from 1 to 5. The responses
from five items are added to provide a total score, ranging from 5 to 25, where 5 reflects
a high perceived health and 25 a low perceived health.
3.3.3.2.2. Health rating
The data on participants’ perceived ranking of their health and wellbeing on a scale
were collected using the EQ-Visual analogue scale (EQ-VAS).The EuroQol Group
Association requires the use of the EQ-5D-5L to be accompanied by the EQ-VAS tool,
which is a continuous scale with scores between 0 and 100 measuring participants’
perceived health and wellbeing scores. It required participants to rate their health and
wellbeing in a scale, with 0 being the lowest and 100 being the highest level of health
and wellbeing at that particular point in time.
28
3.3.3.3. Depression
Prieto-Flores et al. (2011) used hospital anxiety and depression scale (HADS) to assess
the presence of depression. In this thesis, the 15 item ‘geriatric depression scale’ (GDS-
15) was used as it is recommended by the Ministry of Health of New Zealand as a tool
to detect depression among older people and is widely used in long term care settings in
New Zealand (New Zealand Guidelines Group, 2008). The majority of studies outlined
in the literature review exploring loneliness and conducted in long term care settings
have used GDS-15 for the assessment of depression.
The GDS-15 is a valid, reliable and efficient tool in screening for depression among
older people living in long term care settings (Smalbrugge, et al., 2008). It is a
dichotomous tool and uses ‘yes’ or ‘no’ as responses to fifteen questions. For every
question, a positive score was assigned if the response indicated depression. The sum
total of 15 questions would then give a score ranging from 0-15, where 0 would be no
presence of depression and 15 would indicate severe depression.
3.3.4. Loneliness
Prieto-Flores et al. (2011) used the 6-item De-Jong Gierveld Loneliness Scale in long
term care settings to measure loneliness; this was also used in this thesis to assess levels
of loneliness. Although other studies exploring loneliness in long term care settings
have used the Social Provisions Scale, UCLA loneliness scale, and Friendship scale,
these scales were not designed to measure social and emotional components of
loneliness separately (Drageset, Eide, Kirkevold, & Ranhoff, 2012). Drageset et al.
(2012) recommended use of a multi-dimensional tool to measure loneliness to gain a
deeper understanding of it. The 6-item De-Jong Gierveld Loneliness Scale is a multi-
dimensional tool that measures both social and emotional loneliness.
The 6-item De-Jong Gierveld Loneliness Scale has been tested as being reliable and
valid in the context of long term care setting (De Jong Gierveld & Tilburg, 2006). It has
six items with five possible responses which includes ‘yes!’, ‘yes’, ‘more or less’, ‘no’,
and ‘no!’. The scale consists of three questions measuring the levels of social loneliness

29
and three questions measuring emotional loneliness. For this study, loneliness was
studied in its entirety as well as by differentiating it into social and emotional loneliness.
The items related to the emotional loneliness were negatively worded (1, 5, and 6) and
the responses to these items would score 1 for ‘yes!’, ‘yes’, or ‘more or less’ and 0 for
‘no’ or ‘no!’. The items related to social loneliness were positively worded and
responses for these items (2, 3, and 4) would score 1 for ‘no!’, ‘no’, or ‘more or less’
and 0 for ‘yes’ or ‘yes!’ options. The sum total of the six questions would give a final
score ranging from 0-6, where 0 would be not lonely and 6 would be extreme
loneliness.
3.4. Participant selection
This study used non-probability and purposive sampling to recruit participants. This
was to maximise participation and due to the intention of the research to study the
population of older people living in long term care settings. Purposive sampling is a
non-random sampling technique, where the able and willing participants participate in
the study to provide information based on their experience or knowledge (Moule &
Goodman, 2009).
To access participants, agreement of the management of the long-term care settings and
their input in identifying older people who would meet the inclusion criteria for the
study was required. The study had inclusion and exclusion criteria defined to ensure
only reliable data were collected. The inclusion criteria included: 1) Older people aged
65 years or over living in long term care settings, 2) cognitively capable to make their
own decisions as indicated by a mini-mental state examination (MMSE) score of 27 or
greater, 3) proficient in English, and, 4) participating settings are within the greater
Auckland region, and, 5) were able to either self-administer the questionnaire or answer
the questions asked by the interviewer.

30
The exclusion criteria for the study included: 1) Older people living in care settings who
do not require 24 hours nursing care (i.e. older people living independently in villas or
apartments of care settings, 2) Older people living in care settings with an activated
Enduring Power of Attorney, 3) Older people medically deemed incapable to make
decision for themselves (e.g. diagnosis of dementia) and, 4) Older people who score less
than or equal to 26 points in MMSE test.
Whilst Prieto-Flores et al. (2011) used Pfeifer’s short portable mental state
questionnaire to determine cognitive ability for participation in the study, this study
used the MMSE test which was previously administered by the registered nurses of the
participating long term care settings as part of their routine patient assessment. The
MMSE is routinely used as a tool to assess cognitive function of older people living in
the majority of long-term care settings interested in participating in this study. When
consulting with experts during the design phase of this study, the managers of the
settings interested in their residents participating in the study requested a commonly
used tool.
The MMSE is the most widely used tool to assess cognitive levels of older people in NZ
settings, even though there are debates around the sensitivity and specificity of the tool
(Strauss, Leathem, Humphries, & Podd, 2012). Strauss et al. (2012) found the MMSE
the most popular among the health care professionals in NZ as they found it easily
available, concise and required less time to complete when compared to the other
commonly used tools. This study required registered nurses from the participating
settings to utilise previously completed MMSE scores on prospective participants
therefore, the tool needed to be already in use.
The MMSE has 11 questions that tests five areas of cognitive function: orientation,
registration, attention and calculation, recall, and language, and has a maximum score of
30 (Tombaugh & McIntyre, 1992). There are debates about cut-off values of MMSE,
with studies suggesting the cut off value should be 27 instead of the traditional 24 when
using it in population at a high risk of dementia (Larner, 2008; O'Bryant, Humphreys,

31
Smith, Ivnik, Graff-Radford, Petersen, & Lucas, 2008). This study used the cut-off
value of 27 to ascertain the participants were cognitively capable to complete
questionnaires and to ensure they were capable of providing informed consent.
The Managers of 81 eligible long-term care settings in the Greater Auckland Region
were contacted via email, and given information about the study, and approached for the
participation of their setting. Among them, only six of the settings were interested in
participating in the study. Four other settings replied saying they were not interested.
There were no response received from 71 settings. Among the six settings who agreed
to participate initially, two of them declined participation during the data collection
phase of the study; One said they did not have time to participate in the study due to
various other activities going on in the setting whilst the other, although initially
showing interest in the study, gave no response when contacted further about the study.
Finally, four of the settings were included in this study. The difficulty in recruiting
participants in long term care settings is not a problem isolated to this study. This has
been experienced by various researchers internationally. A study conducted by
Tzouvara (2015) on loneliness among older people living in long term care settings
experienced similar problems in recruitment and highlighted it as a significant
challenge.
The Managers of the four participating settings identified older people who met the
inclusion criteria for the study, and provided them with the brief information about the
study and the information sheet. Finally, older people, willing to participate in this study
and who met the inclusion criteria for the study, were approached by the researcher.
3.5. Sample size
The sample size of the study was calculated using power tables by Clark-Carter (2009).
Clark-Carter (2009) suggests having a minimum sample size of 35 to allow the two-
tailed Pearson’s product moment correlation coefficient to achieve a greater than 80%
power and an effect size of 0.5. An adequate sample size is important in avoiding a

32
result which may not be sufficiently powered to detect a difference between the groups
therefore, resulting in a type II error due to false negatives (Nayak, 2010).
The effect size gives information on the magnitude of the difference between two
groups (Sullivan & Feinn, 2012). This study has chosen a medium effect size of 0.5.
The effect size is important in identifying whether a statistically significant difference is
enough to be a clinically significant difference as well (Nayak, 2010). The alpha value
for this study was 0.05.
3.6. Data collection
After consultation with experts in the field of long term care for older people, it was
identified that the majority of older people living in long term care settings may require
assistance with completing the questionnaire. This thesis was designed to include older
people who would meet the inclusion criteria for the study, and may be willing to
participate in the study, but their participation may be limited due to the physical and/or
sensory deficits, such as arthritis or vision impairment. Participants who could fill out
the questionnaire independently were encouraged to do so and if they were unable to
complete it themselves then, they were offered a face to face interview. For participants
that accepted the face to face interview, they were assisted by the researcher to complete
the questionnaire.
The interviews occurred at a time convenient for the participants and in a quiet, private
and uninterrupted area of the long-term care settings. The interviews occurred in the
long-term care setting that each participant was residing in. The interviews lasted from
twenty minutes to one and one-half hours depending on the details of participants’
discussion. The responses obtained from the participants were recorded on the
questionnaire.

33
3.7. Ethical considerations
Ethical approval for this study was obtained from the Massey University Human Ethics
Committee. As the study involved participation of vulnerable older people living in long
term care settings, a complete application was submitted to the committee. Throughout
the research process, the information gained from the participants was kept private and
confidential.
The consent forms and questionnaires were coded for identification purposes to enable
identification and removal of data if any participants decided to withdraw from the
study. The information gained during the data collection process was relevant and
served the purpose of this study. The data gained from the participants were stored
appropriately in a locked cupboard and were used only for the purpose of this study.
Patient confidentiality and anonymity was maintained throughout the study. Each
participant received a small gift for participating in the study.
Participants were provided with an information sheet, which included information about
the background of the study, aim of the study, details about what participation in the
study entailed, inclusion criteria for the study, rights of the participants, details of the
support services available for the participants, details of the researcher, details of the
researcher’s supervisor, and the ethics committee approval statement. The participants
were also given detailed information about the contents of the information sheet
verbally prior to the interview. The participants were given information about the
storage of the data, which will be kept for five years in Massey University (see
Appendix D).
At the time of interview, the researcher explained to the participants the details of the
study, re-emphasised the details contained in the information sheet, the rights of the
participants, and the support system available for them if they experienced any distress
during the research process. Once the participants were satisfied with the information
they had received, and had agreed to participate in the study, verbal and written

34
informed consent were obtained from them prior to completion of the questionnaire or
interview process (see Appendix E).
Information given by the participants during interviews, which were not required by the
questionnaire, was not included in the study. At the end of the interview, participants
were given an opportunity to discuss any concerns or distresses they may have had
during the period of data collection. The availability of support services were
highlighted once again if required by the participants.
3.8. Data analysis
As this study followed a quantitative design, data were analysed quantitatively. Data
were entered into the Statistical Package for Social Sciences (IBM-SPSS) version 22.0
for windows for descriptive and statistical analysis. All data were subjected to
exploratory data analysis (EDA). The skewness value, kurtosis, and histograms were
used to determine normality in the distribution of data. Normally distributed continuous
data were analysed using mean and 95% Confidence Interval (CI) whilst non-normally
distributed continuous data were analysed using median, inter-quartile range (IQR) and
range. Categorical data were analysed using frequency count and percentage. Following
descriptive analysis, Inferential statistical analysis was applied to the data; this will now
be discussed.
3.8.1. Inferential statistics
All parametric tests assume the distribution of scores on the dependent variable is
‘normal’ (Pallant, 2016). A variable is considered ‘normal’ when scores of the variable,
if plotted in a graph, shows the majority of the scores concentrated in the middle and
tapering towards the extreme, giving a symmetrical, bell-shaped curve to the
distribution (Clark-Carter, 2004; Pallant, 2016). Variable analysed using parametric
statistics in this study met the assumption of normality and those not meeting the
assumption of normality, were analysed using non-parametric tests. Homoscedasticity is
an assumption of parametric tests which means the sample was obtained from a
population of equal variances (Pallant, 2016). In this study the Levene’s test was

35
conducted when a parametric test was used to ensure the assumption of
homoscedasticity was met. Both parametric and non-parametric tests assume the groups
being tested are independent of one another (Pallant, 2013).
This study used two-tailed tests for all statistical tests performed. A two-tailed test has
rejection regions in both right and left tails of the distribution curve (Mann, 2010). This
allowed data analysis to be performed without any predicting which direction the result
may take. Each of the statistical tests used will now be outlined.
3.8.1.1. Pearson product-moment correlation coefficient
The Pearson product-moment correlation coefficient (r) is a parametric statistical test
that measures the relationship between two continuous variables (Pallant, 2013;
Tabachnick & Fidell, 2013). The assumptions of this test require the variables to have a
linear relationship as demonstrated on a scatterplot. The values of Pearson’s r ranges
from -1 to +1, where -1 indicates perfect negative correlation, +1 indicates perfect
positive correlation and 0 indicates no correlation (Pallant, 2013). Pearson’s r was used
in this study to identify any relationship between participants’ perceived health and
functional independence.
3.8.1.2. Spearman rank order coefficient
The Spearman rank order coefficient (rs) is a non-parametric test that is equivalent to
the Pearson’s product moment correlation coefficient and is used when continuous
variables do not meet the assumptions of Pearson’s r (Clark-Carter, 2004; Pallant,
2016). Spearman rank order coefficient ranks data then completes the Pearson product-
moment correlation coefficient to measure the relationship between two variables
(Pallant, 2013). This study used Spearman rank order correlation to determine if: 1) age
was associated with loneliness or health scores (that included functional independence,
perceived health, health rating, and depression), 2) depression was associated with
health scores or loneliness, and 3) health scores were associated with loneliness.

36
3.8.1.3. The independent samples t-test
The independent samples t-test (t) is a parametric test used to compare the means of two
independent continuous variables (Pallant, 2016; Tabachnick & Fidell, 2013). This test
requires the continuous dependent variables to be normally distributed and needs
homoscedasticity to be met. The test is used to determine if there is any difference
between the means of two different groups or conditions. In this study the test was used
to determine if there were differences in male and female loneliness scores and
perceived health scores.
3.8.1.4. Mann-Whitney U test
The Mann-Whitney U (U) test is a non-parametric test used to compare two
independent groups when the data is not normally distributed and the dependent
variable is continuous or ordinal in nature (Clark-Carter, 2004; Pallant, 2016). The
Mann-Whitney U test can be applied when the independent variable has two sub
groups. In this study, the Mann Whitney U test was used to identify differences in
female and male participants’ functional independence, health rating and depression.
3.8.1.5. A one-way analysis of variance
A one-way analysis of variance (ANOVA) is a parametric test used to compare two
independent groups when the distribution of data is normal (Pallant, 2016). ANOVA
assesses the influence of categorical variables with more than two levels on a normally
distributed continuous variable and requires the assumptions of homoscedasticity and
normality to be met. The Levene’s test was performed to ensure the tests conducted
using ANOVA had not violated these assumptions. In this study ANOVA was used to
ascertain differences in participants’ marital status and their perceived health and
loneliness scores. Marital status was a categorical variable with six items and the
perceived health and loneliness were normative continuous variables.

37
3.8.1.6. Kruskal-Wallis test
The Kruskal-Wallis test is a non-parametric test to compare two independent groups,
one a dependent continuous variable and the other a categorical variable with more than
two items (Pallant, 2016). This test does not assume that the data are normally
distributed, however it assumes the distribution of data is heteroscedastic (McDonald,
2014). It was used in this study to assess if participants’ with differing marital status had
different health scores, including functional independence, health rating and depression.
These health scores had non-normative distribution of data. It was also used to identify
if participants’ with varying ethnicity had different health scores and loneliness scores.
Ethnicity and marital status were categorical variables with eight and six items
respectively. The loneliness score and health scores were continuous variables.
3.8.1.7. Jonckheere–Terpstra test for ordered alternatives
The Jonckheere-Terpstra test for ordered alternatives is a non-parametric test to
compare two independent groups when the distribution of data is not normative, the
dependent variable is continuous and the independent variable is ordinal in nature
(Hinton, Brownlow, McMurray, & Cozens, 2004). This test is preferred to the Kruskal
Wallis test when the data is of ranked order (Singh, 2007). It was used in this study to
identify if participants’ varying levels of social networks that was collected as ordinal
data, created differences in participants’ health scores and loneliness score.
3.8.1.8. Logistic Regression
Logistic regression was used to determine if all the health scores as a set of predictors
had an impact on participants’ loneliness scores. The study was conducted in long term
care settings which is a complex environment to study correlation between variables,
because there may be multiple variables interrelated to each other. Logistic regression is
considered a versatile and ideal statistical technique to explore interrelationships
between variables in a sophisticated real-life setting (Stoltzfus, 2011).

38
The previous studies conducted in long-term care settings exploring loneliness have
successfully used logistic regression to test whether a model comprising of a set of
predictor variables has any influence on the levels of loneliness (de Guzman et al.,
2012; Nyqvist et al., 2013; Prieto-Flores et al., 2011). This study also utilised logistic
regression to assess whether demographics and health scores as a whole had any
influence on the loneliness scores. Logistic regression was also used to test the
influence of the same predictor variables on both social loneliness and emotional
loneliness scores.
Logistic regression is very sensitive to the outliers and multicollinearity (highly
correlated independent variables), (r = 0.9 or above) (Pallant, 2016; Tabachnick &
Fidell, 2013). Logistic regression has an assumption of singularity where any subset of a
scale cannot be used together with the complete scale as independent variables
(Stoltzfus, 2011). Logistic regression does not follow the assumption of linearity
(dependent variable and predictors in a linear relationship) (Pallant, 2016; Tabachnick
& Fidell, 2013).
Logistic regression requires at least 10 cases per independent variable analysed
(Stoltzfus, 2011). The socio-demographic characteristics were excluded from the
analysis to match the independent variable and sample size ratio required by the test.
The goodness-of-fit measures were used to assess the overall fit of the model to the
sample data.
3.9. Transformed variables
The scores of the visits conducted by the participants inside and outside the setting were
added to provide a total score reflecting participants’ social networks and used only in
the logistic regression analysis. The scores for the Barthel Index were reversed so that
the higher value would mean high dependency. The reversed value ranged from 0 to
100, where ‘0’ indicated complete independence whereas, ‘100’ indicated complete
dependence. This was done so it would align with other variables and for the
interpretation to be easier during the data analysis process.

39
Prieto-Flores et al. (2011) dichotomised the De-Jong Gierveld Loneliness scale due to
skewed data. Although dichotomization of variables implies a loss of information,
loneliness responses have been dichotomised in many studies for reasons, such as
reducing the number of response categories to gain statistical power and presence of
skewed data (Nyqvist et al., 2013). This study dichotomised the loneliness score as ‘not
lonely’ for scores of 0-1 and ‘lonely’ for scores of 2-6, when performing logistic
regression and followed the same separation of categories as Prieto-Flores et al. (2011).
This study used the Loneliness scale in its pure form in all other analyses apart from
when it was being subjected to logistic regression analysis. If the loneliness score was
used in the pure continuous form, it would have required multiple regression, which was
not completed due to the assumptions of the test not being met. Having discussed the
data analysis process, the measures used to ensure research rigour will be discussed.
3.10. Research rigour
Having a sound process is an essential part of research. Quantitative studies use
objectivity, reliability, validity, and generalisability to measure the research rigour. The
measures utilised to ensure diligence of this study will now be discussed.
3.10.1. Objectivity
Objectivity focusses on the measures utilised to avoid any biased results (Beck & Polit,
2014). This study was based on the post positivist paradigm therefore, the researcher
was aware of the need to minimise contamination of data related to her personal values
and emotions. The study used a questionnaire when collecting data which meant
questions were asked without altering the format of the questionnaire and ensuring
consistency in data collection.
3.10.2. Reliability
Reliability focusses on the uniformity and the ability of the study to be duplicated (Beck
& Polit, 2014). The criteria of reliability were met, by clearly outlining the research
process to enable replication of this study in a similar setting with similar participants.

40
3.10.3. Validity
Validity focusses on the extent to which results of the study are true and the extent of
credit that can be given to the variables measured (Beck & Polit, 2014). This study
involved a heterogeneous sample and the sample were from four different long-term
care settings. The design of the study was critically examined by experts in the field of
long term care settings, and the design was modified to ensure it collected data that
would provide results reflective of that population sample.
The study recruited an adequate sample size for statistical analysis to be performed
without creating a Type II error. The methods including, the Barthel Index, the EQ-5D-
5L, the 6-item De Jong Gierveld loneliness scale, and the GDS-15, all which have been
previously validated and extensively utilised in the quantitative studies in long term care
settings.
All methods used in correlation research should ensure the internal consistency is
sufficient to ensure the tools used measures the same general construct. Cronbach’s
alpha is the most widely used objective tool to assess internal consistency of scales used
to measure a variable, and values range between 0 and 1 (Tavakol & Dennick, 2011).
The acceptable values of alpha generally ranges from 0.70 - 0.95 (Tavakol & Dennich,
2011). This study used Cronbach’s alpha to measure internal consistency of the scales
used in this study to ensure they were reliable. The previously established Cronbach’s
alpha (α) for the 6-item De Jong Gierveld loneliness scale varies between .70 and .76;
The 3-item emotional loneliness component of the scale has α values between .67 and
.74, and the 3-item social loneliness component of the scale has α values between .70
and .73 (De Jong Gierveld & Van Tilburg, 2006).
The reliability of the scales used in this study was measured using Cronbach’s alpha
(see Table 1). As shown in Table 1, the Cronbach alpha showed good internal
consistency (above .7) for the Barthel Index and the Geriatric Depression Scale,
however, low internal consistency for the EQ-5D-5L and the De-Jong Gierveld
loneliness scale; both of these scales had less than 10 items each. Pallant (2016)

41
suggests scales with less than 10 items often get a low Cronbach’s alpha value and
proposes reporting mean inter-item correlations when the value obtained for Cronbach’s
alpha is low. Using inter-item correlations, the EQ-5D-5L and the De-Jong Gierveld
loneliness scale showed these scales had adequate internal consistency (.2-.4).
Table 1
Reliability of scales
Scales Total
items
Cronbach’s
alpha
Mean inter-item
correlations
The Barthel Index 10 .92
EQ-5D-5L 5 .60 .22 (-.21-.80)
GDS-15 15 .82
The De-Jong Gierveld loneliness scale 6 .67 .26(-.19-.77)
The independent variables that were assessed for correlations with the levels of
loneliness were selected based on the previously conducted studies in this field. This
study’s questionnaire included questions and tools successfully used in previous studies
exploring loneliness in long term care settings. The content of the questionnaire had
sufficient data to answer the research questions therefore, this study ensured internal
validity.
Collection of data did not take place from mid-December 2015 to mid-January 2016 in
order to avoid the Christmas holiday period and prevent it contributing to loneliness and
influencing the findings of the study. This was due to the potential for increased levels
of loneliness during the holiday period and the frequency of gatherings made by the
participants with their family, friends or neighbours may vary during the festive and
holiday season.
3.10.4. Generalisability
Generalisability focusses on the extent to which the results of a study can be applicable
to other similar areas and populations (Beck & Polit, 2014). This study may not be

42
generalisable to the entire population of older people living in NZ long term care
settings due to the small sample size and the recruitment method. The study employed a
small sample size to meet the boundaries of a Master’s thesis and the need for face to
face interviews in the sample population. It was conducted within a single metropolitan
city and involved only four participating centres and hence if completed in different
centres or in another town or city, the findings may differ.
3.11. Chapter summary
The aim of the study was to identify the prevalence of loneliness among older people
living in NZ long-term care settings and to identify if any association exists between
loneliness and socio-demographic factors, depression and health characteristics. This
study was based on the philosophical underpinnings of objectivism and post-positivism
and used a cross-sectional correlational research design due to the utilisation of this
design in previously conducted studies.
Purposive sampling was utilised to select participants due the health characteristics of
the participants and their accessibility. Data were collected using a questionnaire which
was either self-administered by the participants, or completed during a face to face
interview. The study used previously validated methods to collect data and appropriate
descriptive and statistical analysis were performed on the data. Having discussed the
methodology related to the research, the next chapter presents the results of the study.

43
Chapter four: Results
This chapter describes the findings of this thesis exploring loneliness and answers the
following research questions:
1. Is loneliness prevalent among older people living in NZ long-term care settings?
2. Are socio-demographic and health characteristics associated with loneliness?
3. Is depression one of the factors associated with increased levels of loneliness?
This study recruited 39 participants from four different long term care settings in
Auckland, NZ. These participants were selected by the managers of participating long
term care settings. At the time of data collection, three participants were excluded from
the study as further investigation found they did not meet the inclusion criteria of the
study. Finally, a total of 36 participants were included in the data analysis process.
For the data collection process, 34 participants chose to have face to face interviews and
two participants opted to complete the questionnaire themselves. The data were
collected over a five month period from December 2015 to April 2016.
4.1. Participant demographics
The mean age of the participants was 81 years old (95% CI: 77.81-84.42). The majority
of the participants identified themselves as Pakeha (n = 30, 83.3%). Most of the
participants were female (n = 21, 58.3%) and many were widowed (n = 15, 41.7%).
Most of the participants visited their family, friends, and neighbours outside the setting
once a week or more (n = 20, 55.6%). A number of participants received visits from
family, friends, and neighbours inside the setting once a week or more (n = 15, 41.7%)
(see Table 2).

44
Table 2
Patient demographic data
Variable Number (Percent)
Gender
Female
Male
21 (58.3)
15 (41.7)
Ethnicity
Pakeha
Māori
Chinese
Other
30 (83.3)
1 (2.8)
1 (2.8)
4 (11.1)
Marital status
Legally Married
Divorced
Widowed
Single
11 (30.6)
5 (13.9)
15 (41.7)
5 (13.9)
Social networks
Frequency of visits made by the participants with their
friends, family or neighbours
Outside the setting
Once a week or more frequently
Once or twice a month
Less than once a month
Inside the setting
Once a week or more frequently
Once or twice a month
Less than once a month
20 (55.6)
4 (11.1)
12 (33.3)
15 (41.7)
7 (19.4)
14 (38.9)

45
4.2. Health scores
Participants’ health scores included the Barthel Index, the EQ-5D-5L and EQ-VAS and
the GDS-15. The Barthel Index measured participants’ functional independence. The
median score for this index was 97.50 (IQR = 32.50, range =15.00-100.00) showing that
most of the participants required minimal assistance in carrying out activities of daily
living.
Both the EQ-5D-5L and EQ-VAS determined participants’ perceived health. The mean
score for EQ-5D-5L was 9.67 (95% CI: 8.32-11.02) and the median score of EQ-VAS
was 70 (IQR= 38.75, range = 30.00-100.00), both reflecting participants’ perceiving
they had a low level of health.
The GDS-15 measured the presence of depression in the participants. The median score
was 4.00 (IQR = 3.75, range = 0.00-15.00) showing a low prevalence of depression
among the sample population.
4.3. Demographic factors influencing health scores
The data were analysed to identify any relationships between participants’ health scores
and their age, gender, ethnicity, marital status and social networks. The type of test used
and the results of this analysis are outlined in Table 3. As shown in Table 3,
participants’ social network was positively associated with their functional
independence suggesting older people with higher functional independence had more
frequent visits with family, friends and neighbours inside and outside long term care
settings they lived in. Analysis demonstrated no other significant relationships between
participants’ health scores and other socio-demographic variables.

46
Tabl
e 3
Rela
tions
hips
bet
wee
n so
cio-
dem
ogra
phic
fact
ors a
nd h
ealth
scor
es
Soci
o-de
mog
raph
ic
varia
bles
Fu
nctio
nal i
ndep
ende
nce
Hea
lth a
nd w
ellb
eing
D
epre
ssio
n St
atis
tical
te
st
Res
ult
Perc
eive
d he
alth
H
ealth
ratin
g (0
-100
) St
atis
tical
te
st
Res
ult
Stat
istic
al
test
R
esul
t St
atis
tical
te
st
Res
ult
Age
Sp
earm
an’s
rh
o r s
= -.2
1,n
= 36
, p =
.23
Spea
rman
’s
rho
r s =
-.09,
n
= 36
, p =
.6
2
Spea
rman
’s rh
o r s
= -.1
4, n
=
36, p
=
.42
Spea
rman
’s
rho
r s =
.04,
n =
36
, p =
.81
Gen
der
Man
n-W
hitn
ey U
U
= 1
16, z
=
-1.4
2, p
=
.19
Inde
pend
ent
t-tes
t t(3
6) =
-0.
85, p
=
.40
Man
n-W
hitn
ey
U
U =
153
.50,
z =
-.13
, p =
.9
0
Man
n-W
hitn
ey U
U
= 1
23.5
0 ,
z = -1
.10
, p
= .2
8 Et
hnic
ity
Kru
skal
-W
allis
χ2 (3
, n =
36
) = 1
.64,
p
= .6
5
Kru
skal
-W
allis
χ2 (3
, n =
36
) =
4.18
, p =
.2
4
Kru
skal
-W
allis
χ2 (3
, n =
36
) = 3
.21,
p
= .3
6
Kru
skal
-W
allis
χ2 (3
, n =
36)
=
4.86
, p =
.1
8
Mar
ital s
tatu
s K
rusk
al-
Wal
lis
χ2 (3, n
=
36) =
7.8
1,
p =
.05
AN
OV
A
F (3
, 36)
=
2.08
, p
= .1
2
Kru
skal
-W
allis
χ2 (3
, n =
36
) = 1
.11,
p
= .7
7
Kru
skal
-W
allis
χ2 (3
, n =
36)
=
6.87
, p =
.0
8 So
cial
ne
twor
ks
(Fre
quen
cy
of v
isits
)
outs
ide
the
setti
ng
Jonc
keer
e-Te
rpst
ra te
st
T JT =
27
0.50
, z =
2.
02, p
=
.04*
Jonc
keer
e-Te
rpst
ra te
st
T JT =
16
5.50
, z
= -1
.22,
p
= .2
2
Jonc
keer
e-T
erps
tra
test
T JT =
20
4.50
, z =
-.0
6, p
=
.95
Jonc
keer
e-Te
rpst
ra
test
T JT =
224
.50,
z =
.54,
p =
.5
9
insi
de th
e se
tting
Jo
ncke
ere-
Terp
stra
test
T J
T =
261.
50, z
=
2.55
, p =
.0
1*
Jonc
keer
e-Te
rpst
ra te
st
T JT =
14
6.00
, z
= -1
.18,
p
= .2
4
Jonc
keer
e-T
erps
tra
test
T JT =
16
6.50
, z =
-.5
4, p
=
.59
Jonc
keer
e-Te
rpst
ra
test
T JT =
165
.00,
z =
-.59
, p =
.5
6
Not
e. *
indi
cate
s sta
tistic
al si
gnifi
canc
e
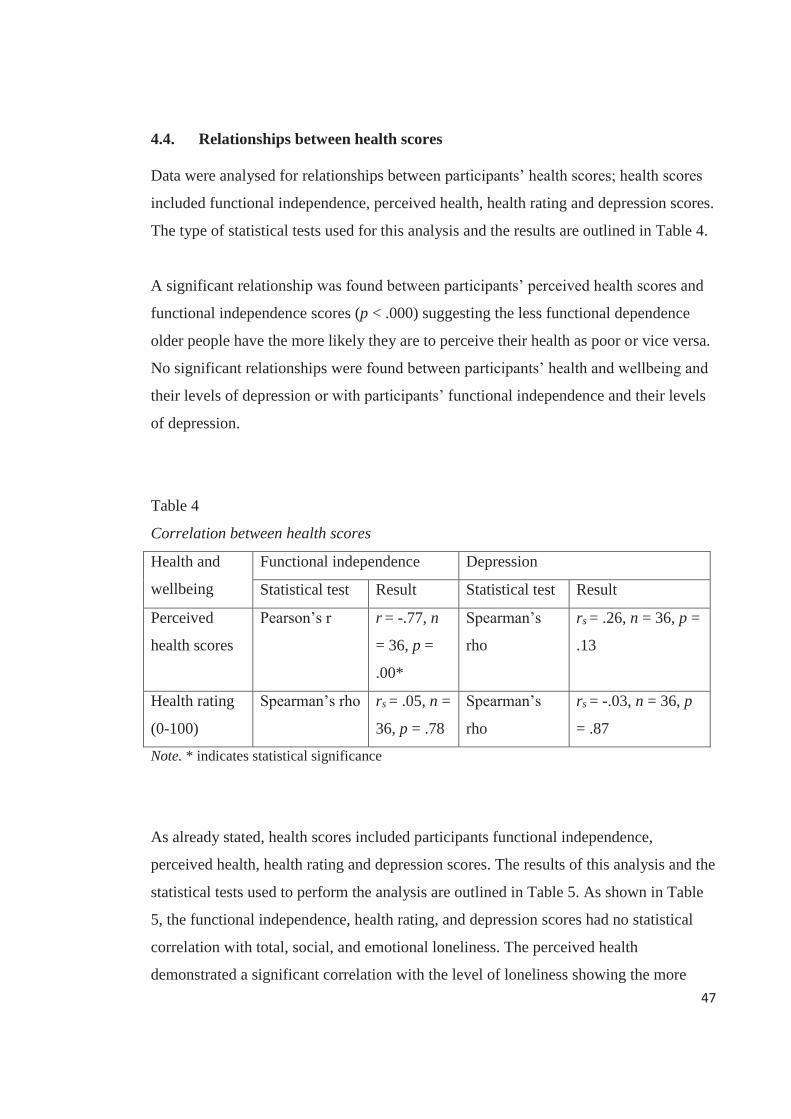
47
4.4. Relationships between health scores
Data were analysed for relationships between participants’ health scores; health scores
included functional independence, perceived health, health rating and depression scores.
The type of statistical tests used for this analysis and the results are outlined in Table 4.
A significant relationship was found between participants’ perceived health scores and
functional independence scores (p < .000) suggesting the less functional dependence
older people have the more likely they are to perceive their health as poor or vice versa.
No significant relationships were found between participants’ health and wellbeing and
their levels of depression or with participants’ functional independence and their levels
of depression.
Table 4
Correlation between health scores
Health and
wellbeing
Functional independence Depression
Statistical test Result Statistical test Result
Perceived
health scores
Pearson’s r r = -.77, n
= 36, p =
.00*
Spearman’s
rho
rs = .26, n = 36, p =
.13
Health rating
(0-100)
Spearman’s rho rs = .05, n =
36, p = .78
Spearman’s
rho
rs = -.03, n = 36, p
= .87
Note. * indicates statistical significance
As already stated, health scores included participants functional independence,
perceived health, health rating and depression scores. The results of this analysis and the
statistical tests used to perform the analysis are outlined in Table 5. As shown in Table
5, the functional independence, health rating, and depression scores had no statistical
correlation with total, social, and emotional loneliness. The perceived health
demonstrated a significant correlation with the level of loneliness showing the more

48
older people perceived their health as poor, the more likely they were to experience
loneliness (see Table 5).
Table 5
Correlations between health scores and loneliness
Health scores Statistical test Loneliness
Total Social Emotional
Functional independence Spearman’s
rho
rs = -.07,
n=36, p =
.68
rs = -.06, n =
36, p = .73
rs = .01, n
= 36, p =
.94
Health and
wellbeing
Perceived
health
Spearman’s
rho
rs = .38, n
= 36, p =
.02*
rs = .24, n =
36, p = .17
rs = .31, n
= 36, p =
.07
Health
rating (0-
100)
Spearman’s
rho
rs = -.31, n
= 36, p =
.06
rs = -.18, n =
36, p = .30
rs = -.22, n
= 36, p =
.20
Depression Spearman’s
rho
rs = .01, n
= 36, p =
.97
rs = -.18, n =
36, p = .29
rs = .27, n
= 36, p =
.12
Note. * indicates statistical significance
4.5. Loneliness
The 6-item De-Jong Gierveld loneliness scale determined participants’ levels of
loneliness. The participants’ mean score was 2.36 (95% CI: 1.76-2.96), representing
presence of loneliness but only at a marginal level.
The 6-item De-Jong Gierveld loneliness scale has three items dedicated to social
loneliness and three items dedicated to emotional loneliness. The mean score for social
loneliness was 1.08 (95% CI: 0.65-1.52) indicating presence of social loneliness was
also at a marginal level, whilst the mean score for emotional loneliness was 1.28 (95%

49
CI: 0.97-1.59) indicating the presence of emotional loneliness was slightly higher than
social loneliness.
4.6. Factors associated with loneliness
Participant demographic factors were assessed for their relationship to loneliness. The
type of statistical test used and the results are outlined in Table 6. The Jonckeere-
Terpstra test for ordered alternatives identified a significant positive relationship
between levels of loneliness and the frequency of social networks. This means that older
people with fewer visits from family or friends either inside or outside long term care
settings experienced more loneliness. The Jonckeere-Terpstra test also identified a
significant relationship between the frequency of these social networks and social
loneliness however the frequency of social networks was not related to emotional
loneliness (see Table 6).
Analysis revealed no relationships between loneliness and age, gender, ethnicity and
marital status (see Table 6). Although not statistically significant there was a trend
towards participants’ age being associated with social loneliness which may mean the
older the person is the more likely they are to experience social loneliness.

50
Table 6
Relationships between loneliness and socio-demographic factors
Socio-demographic variables
Statistical test Result for loneliness Total Social Emotional
Age Spearman’s rho
rs = -.22, n = 36, p = 0.21
rs = -.33, n = 36, p = .05
rs = .00, n = 36, p = .10
Gender Independent t-test
t(36) = 1.10, p = .91
t(36) = .71, p = .48
t(36) = -.80, p = .43
Ethnicity Kruskal Wallis
χ2 (3, n = 36) = .93, p = .65
χ2 (3, n = 36) = 2.69, p = .44
χ2 (3, n = 36) = 2.50, p = .48
Marital status ANOVA F (3, 36) = .58, p = .63
F (3, 36) = 1.05, p = .38
F (3, 36) = .14, p = .93
Social networks (Frequency of visits)
outside the setting
Jonckeere-Terpstra test
TJT = 289.50, z = 2.51, p = .01*
TJT = 277.50, z = 2.29, p = .02*
TJT = 256.50, z = 1.55, p = .12
inside the setting
Jonckeere-Terpstra test
TJT = 250.00, z = 2.08, p = .04*
TJT = 269.00, z = 2.87, p = .00*
TJT = 195.50, z = .37, p = .71
Note. * indicates statistical significance
A direct logistic regression was performed by recoding loneliness scores into a
dichotomous categorical variable with 0 denoting absence of loneliness and 1 for the
presence of loneliness. The functional ability, health and wellbeing, depression, and
social network scores were used as predictors, to determine if loneliness scores could be
predicted. The total scores of visits that occurred inside and outside the setting was
summed up to a total social network score for inclusion in the model. The socio-
demographic variables such as gender and marital status of the participants were
excluded from this analysis as the inclusion of these variables resulted in a p value of
<.05 for the Hosmer and Lemeshow test, indicating the model was not supported.

51
The full model containing all the predictors was statistically significant, χ2 (5, n = 36) =
19.75, p < .00, indicating the model was able to differentiate between participants who
reported and did not report the presence of loneliness. The model as a whole explained
between 42.2% (Cox and Snell R square) and 57.3% (Nagelkerke R squared) of the
variance in loneliness levels, and correctly classified 86.1% of the cases. The social
network and the perceived health strongly predicted the levels of loneliness compared to
the other variables in the model (see Table 7). Participants’ who perceived their health
to be poor were 1.78 times more likely to experience loneliness when compared to those
who viewed their health more positively. Participants who had fewer social networks
were 2.53 times more likely to experience loneliness when compared to those who have
stronger social networks.
Table 7
Logistic regression predicting loneliness
B S.E. Wald Df P Odds
ratio
95% C.I. for
Odds ratio
Lower Upper
Functional
independence
.03 .03 .86 1 .36 1.03 .97 1.10
Perceived health .58 .28 4.29 1 .04* 1.78 1.03 3.07
Health rating -.05 .02 3.08 1 .07 .95 .90 1.00
Depression -.02 .17 .01 1 .93 .98 .70 1.38
Social networks .93 .42 4.93 1 .03* 2.53 1.12 5.75
Constant -6.89 5.50 1.57 1 .21 .00
Note. * indicates statistical significance
A direct logistic regression was conducted predicting emotional loneliness with the
same model of five variables (functional independence, perceived health, health rating,
social network, and depression). The full model containing all the predictors was not
statistically significant, χ2 (5, n = 36) = 9.04, p = .11, indicating the model was not able
to differentiate between participants who reported and did not report the presence of

52
emotional loneliness. The model as a whole explained between 22.2% (Cox and Snell R
square) and 34.0% (Nagelkerke R squared) of the variance in the emotional loneliness
levels, and correctly classified 77.8% of the cases. None of the variables made a
statistically significant contribution to the model (see Table 8).
Table 8
Logistic regression predicting emotional loneliness
B S.E. Wald Df P Odds ratio
95% C.I. for Odds ratio
Lower Upper
Functional independence
-.00 .04 .01 1 .92 1.00 .93 1.07
Perceived health
.22 .24 .85 1 .36 1.25 .78 1.99
Health rating -.05 .03 2.63 1 .11 .95 .90 1.01
Depression .23 .21 1.21 1 .27 1.26 .83 1.91
Social networks
.07 .30 .06 1 .81 1.08 .60 1.93
Constant 2.37 5.40 .19 1 .66 10.66
The same model of five predictor variables (functional independence, perceived health,
health rating, social networks and depression) was used to predict social loneliness
using logistic regression analysis. The entire model was statistically significant, χ2 (5, n
= 36) = 17.30, p < .00, in differentiating participants who reported and did not report the
presence of social loneliness. The model as a whole explained between 38.2% (Cox and
Snell R square) and 50.9% (Nagelkerke R squared) of the variance in social loneliness
levels, and correctly classified 72.2% of the cases. The social network of the
participants made a statistically significant contribution to the model (see Table 9). This
means that older people who have fewer visits inside or outside long term care setting,
are 3.18 times more likely to experience social loneliness.

53
Table 9
Logistic regression predicting social loneliness
B S.E. Wald Df P Odds ratio
95% C.I. for Odds ratio Lower Upper
Functional independence
-.01 .03 .23 1 .63 .99 .93 1.04
Perceived health .26 .21 1.48 1 .22 1.29 .86 1.96
Health rating .00 .02 .01 1 .93 1.00 .96 1.05
Depression -.24 .14 2.91 1 .09 .78 .59 1.04
Social networks 1.16 .39 8.64 1 .00* 3.18 1.47 6.89
Constant -5.05 4.55 1.24 1 .27 .00
Note. * indicates statistical significance
4.7. Chapter summary
Over half of the participants in this study were female and identified themselves as
Pakeha. Under 50% of them would gather with their family, friends, and neighbours
less than once a week, both inside and outside the setting. The frequency of their visits
(both inside and outside the setting) significantly contributed to loneliness with those
who experienced fewer social visits experiencing more loneliness. There was no
significant correlation between any of the socio-demographic variables and the health
scores of the participants. Participants’ perceived health was strongly associated with
their functional independence indicating the more functional independence older people
had, the better they perceived their health and wellbeing or vice versa.
Logistic regression predicted older people who perceived their health to be poor were
almost twice as likely to experience loneliness when compared to those who viewed
their health more positively. It also predicted that older people who had fewer social
networks were more than two times as likely to experience loneliness when compared to
those who have more frequent social networking. The model also predicted that those
who had fewer visits inside or outside long term care settings were three times more

54
likely to experience social loneliness. Having presented the study results, the next
chapter discusses these results and how they relate to the NZ context and wider
international research.

55
Chapter five: Discussion
The previous chapter answered the research questions of this study. This chapter will
discuss the findings of the study and relate it to the wider research conducted in this
area. The research questions of this study were:
1. Is loneliness prevalent among older people living in NZ long-term care settings?
2. Are socio-demographic and health characteristics associated with loneliness?
3. Is depression one of the factors associated with increased levels of loneliness?
This study found a low degree of loneliness among older people living in four NZ long
term care settings. Older people with weaker social networks that meant they had fewer
visits from family, neighbours, or friends inside or outside long term care settings
experienced more loneliness. Those who perceived their health to be poor perceived
themselves to have less functional independence and were more likely to feel lonely.
The findings of this study are discussed in three different sections: socio-demographic
factors, health scores, and loneliness. Health scores are further divided into functional
independence, health and wellbeing, and depression.
5.1. Socio-demographic factors
In this study age had no correlation with the levels of loneliness or any other health
scores of the participants. This finding was similar to those of Prieto-Flores et al.
(2011) who also had participants of a similar age. They found age did not influence the
levels of loneliness among older people living in long term care settings however, it had
a significant effect on the loneliness of older people living in the communities.

56
Although the absence of relationship between age and loneliness found in this study
aligns with the result of Prieto-Flores et al. (2011), it is in contrast to the findings of
several other studies that have found loneliness to either increase or decrease with age.
In the NZ General Social Survey (NZGSS), the distribution of loneliness was linear
across age, with older people experiencing the lowest levels of loneliness (Statistics
New Zealand, 2013). The study by the Auckland Council (2012) found age had no
correlation with loneliness among people aged 50 years or above in Auckland, however
these studies did not solely focus on older people living in long term care settings. Older
people living in long term care settings are generally there because of difficulties
associated with living independently in their previous home hence the previous NZGSS
and the Auckland study cannot be generalised to long term care settings.
This study had slightly more female participants (58.3%) than males (41.7%). In the
census of 2013, 68.1% of older people living in long term care settings in Auckland
were female and a total of 54.1% of older people 65 years old and above in NZ were
female (Statistics New Zealand, 2015). The gender distribution of the sample in this
study appears to represent the general pattern of gender distribution in Auckland long
term care settings.
Gender was found to have no association with participants’ loneliness or any other
health scores, including functional independence, perceived health and depression, in
this study. This is in contrast to the study of Prieto-Flores et al. (2011) who reported
females were 56% less likely to feel lonely than males and their findings correspond to
the findings pertaining to the majority of studies conducted in long term care settings.
However the NZGSS found females were more likely than males to feel lonely
(Statistics New Zealand, 2013) and the Auckland Council (2012) study found males
were lonelier than females. La Grow et al. (2012) in their NZ study of loneliness in
older people living in their community dwellings, found no relation between gender and

57
loneliness. The discrepancy in the results of these study means the relationship between
gender and loneliness among older people in NZ is not clearly understood.
This inconsistency in gender and its association with loneliness could be a factor related
to different perceptions of loneliness among males and females. Older females in NZ
were found to have a better social network than older males however, they were also
more likely to report being lonely (Stephens et al., 2011). This indicates that perceived
loneliness varies depending on the individual’s expectation of acceptable levels of
social engagement which differs between males and females and this could be a factor
causing discrepancy in the results of NZ studies.
The ethnicity of the participants had no influence over participants’ levels of loneliness
and their health scores. The majority of the participants in this study were Pakeha
(83.3%) so the sample of this study did not represent NZ’s diverse ethnic distribution;
however this may be representative of the distribution of ethnicity in long term care
settings of Auckland and the total population of New Zealand. In the census data of
2013, a vast majority (93.4%) of older people residing in long term care settings in the
Auckland region were Pakeha, aligning with the 87.8% of the total population of New
Zealand 65 years of age or above who identify themselves as Pakeha (Statistics New
Zealand, 2015).
Over 40% of the participants were widowed (41.7%) which appears to resemble the
trend of long term care settings in Auckland (Statistics New Zealand, 2015). Census
data of 2013 found 60.4% of older people living in long term care settings were
widowed (Statistics New Zealand, 2015). Participants’ marital status had no relation to
their feelings of loneliness and their health scores. This was also the case among the
community dwelling older people in NZ, where no relationship between participants’
loneliness and the marital status were found (La Grow et al., 2012). This is in contrast to

58
those of Prieto-Flores et al. (2011) who identified not having a partner increases the
levels of loneliness. They identified the majority of older people in long term care
(89.1%) had no partner and they were twice as likely to feel lonely than those with a
partner.
The social networks of the participants were measured using the same questions used by
Prieto-Flores et al. (2011). In this thesis, the majority of the participants received visits
inside the setting (41.7%) and gathered outside the setting (55.6%) once a week or
more. This aligns with the findings of Prieto-Flores et al. (2011) who found 63.2% of
older people living in long term care settings gathered with their family, friends, or
neighbours once a week or more frequently. The higher frequency of social networks
found in this study and that by Prieto-Flores et al. (2011) is not consistent with other
studies. Nyqvist et al. (2013) found more than 70% of older people living in long term
care had no contact with their family, friends and relatives face to face or over the
telephone for the week before the data was collected.
This thesis identified participants’ fewer social networks inside and outside the setting
predicted loneliness and social loneliness. This aligns with the findings of Prieto-Flores
et al. (2011) who found social networks to be the most significant factor that influenced
the levels of loneliness.
5.2. Health scores
Participants’ health scores comprised of their functional independence, health and
wellbeing, and depression levels. Health and wellbeing was measured using two
different tools: EQ-5D-5L measured the perceived health and EQ-VAS measured the
health rating on a scale of 0-100.

59
5.2.1. Functional independence
The median score of the Barthel Index that measured functional independence showed
the majority of older people were functionally able to perform most of their activities of
daily living; however this may not be an actual reflection of the functional status of the
population of older people living in long term care settings. Prieto-Flores et al. (2011)
found only 26.7% of older people in long term care settings were completely
independent and a higher functional independence was linked to a lower likelihood of
feeling lonely. This thesis did find a significant relationship between older people’s
functional independence and their perception of health and there was a significant
relationship between their perceived health and loneliness. This means a larger study
may identify a relationship between functional independence and loneliness; this is a
subject for future research.
There are conflicting reasons explaining the relationship of functional independence and
loneliness. It is suggested that older peoples’ functional dependence on their caregivers
help build a level of attachment that serves as a protective factor against loneliness
(Korporaal, van Groenou, Marjolein, & van Tilburg, 2008; Savikko et al., 2005). This is
in contrast to the view of Grenade and Boldy (2008) who argue that older peoples’
functional dependence on long term care staff may not reduce loneliness as older people
many not see this relationship as providing any meaningful interactions for them. They
stress staff members are not the family and friends of older people and the frailty of
older people may limit the amount and degree of interaction they can conduct with the
staff and other older people living in long term care settings (Grenade & Boldy, 2008).
Therefore, this area needs to be explored further to more clearly understand any
association between loneliness and functional independence.

60
5.2.2. Health and Wellbeing
The perceived health measured using EQ-5D-5L found the majority of participating
older people perceived their health as low, despite being reasonably independent in
carrying out their activities of daily living. As already mentioned, this study found a
significant correlation between participants’ functional independence and their
perceived health. This is not surprising since physical ability is often an indication of
older peoples’ overall health and wellbeing (Ailshire & Crimmins, 2013).
Our findings showed older people perceived their health as low. Similarly, in the study
by Prieto-Flores et al. (2011) the EQ-5D showed a lower health among older people
living in long term care settings when compared to those living in the communities.
Perceived health has been frequently associated with levels of loneliness. This thesis
found being lonely was associated with lower perceived health which was also the
finding of a cross-sectional study conducted in the community dwelling older people in
NZ (La Grow et al., 2011). La Grow et al. (2011) found older people who were lonely
also scored lower in the physical and mental health scores.
5.2.3. Depression
The levels of depression was measured using GDS and it showed a low level of
depression among older people. This is in contrast to the study of Prieto-Flores et al.
(2011) and other studies done in this area where levels of depression has been found to
be significantly higher. This could be a result of difference in tools utilised to measure
depression between the studies. However, the GDS was used by Nikmat et al. (2015)
and Drageset et al. (2011) and both of these studies identified prevalence of depression
among older people and significant association between depression and loneliness.

61
This thesis found no correlation between depression and loneliness of older people. This
is in contrast to the findings of other studies, including Prieto-Flores et al. (2011), that
established a significant relationship between depression and loneliness among older
people living in long term care settings. Prieto-Flores et al. (2011) found older people
living in long term care settings twice as likely to be lonely as those living in the
communities.
As discussed in the literature review, other studies identified depression as one of the
most prominent factors associated with levels of loneliness. Among the studies
exploring loneliness in older people, 25% of them have identified association of
depression with loneliness (Courtin & Knapp, 2015). In this study however, depression
had no relationship with either emotional or social loneliness. In a study conducted by
Auckland Council (2012) depression was reported least by the people who identified as
Pakeha than any other ethnicities living in Auckland. This could be one of the reasons
behind the presence of low levels of depression among the participating older people, as
83.3% of them were Pakeha.
5.3. Loneliness
The result of this study found a low degree of loneliness was prevalent among older
people and this was similar for both the levels of social and emotional loneliness. The
finding of this thesis are similar to those of Prieto-Flores et al. (2011). The logistic
regression analysis showed fewer social networks and poorer perception of health
predicted loneliness and social loneliness however, did not predict emotional loneliness.
The current research around loneliness among older people in NZ has conflicting
findings. The NZGSS found loneliness was least common among older people in NZ
compared to the other age groups (Statistics New Zealand, 2013). This survey however
utilised a single question to assess loneliness. It is questionable whether this single
question was effective in recognising the multi-dimensional nature of loneliness.

62
A study conducted by the Auckland Council (2012) with people aged 50 years and
above found over half of the participating people living in Auckland were lonely. A
study conducted in the community settings of NZ found a prevalence of significant
loneliness among older people, where 52% of the participating older people were lonely
(La Grow et al., 2012). These conflicting findings on loneliness among older people in
NZ suggests this area needs to be explored further.
This study was conducted in Auckland, which has the largest number of older people
living in long term care settings and has the largest population in New Zealand. In 2013,
Auckland had a total of 31,899 older people residing in 822 long term care settings
(Statistics New Zealand, 2015). Auckland being the biggest city in NZ, might have had
an influence on the levels of loneliness experienced by older people living in long term
care settings. Savikko et al. (2005) found the experience of loneliness tends to be more
common in the rural areas than in the cities. Auckland Council (2012) found Pakeha
people aged 50 years and above in Auckland were less likely to be lonely than other
ethnicities. This may also be a factor in the presence of the low degree of loneliness
among the participating older people, as the majority of them were Pakeha.
5.4. Chapter Summary
The socio-demographic characteristics of the participants in this study appeared to be
representative of the population of older people residing in long term care settings in
Auckland. However, participants’ health scores, reflecting their functional status,
perceived health and depression, did not resemble the findings of other studies
conducted in this area. The majority of the participants in this study were functionally
able to do most things for themselves and had lower levels of depression. This is in
contrast to the findings of the majority of the studies conducted in this group of people.

63
Only a low level of loneliness was identified in this study. Loneliness was associated
with poor perceived health and fewer social networks. This reflects international
literature also identifying these factors as a significant predictor of loneliness among
older people living in long term care settings. Having discussed the findings of this
study, the next chapter presents the limitations and the implications of this study.

64
Chapter six: Conclusion
Loneliness has been found to be highly prevalent among older people living in long
term care settings (Nyqvist et al., 2011; Prieto-Flores et al., 2011). Loneliness has been
associated with a decreased quality of life among older people due to the detrimental
effect it has on their health and wellbeing (Luo et al., 2012; Prieto-Flores et al., 2011).
Even though loneliness has been recognised as a prominent problem faced by older
people, limited research has been done to explore loneliness in long term care settings
(Prieto-Flores et al., 2011).
This thesis used a post-positivist approach and a cross-sectional correlational design to
explore loneliness among older people living in NZ long term care settings. This study
was designed to answer the followed research questions:
1. Is loneliness prevalent among older people living in NZ long-term care settings?
2. Are socio-demographic and health characteristics associated with loneliness?
3. Is depression one of the factors associated with increased levels of loneliness?
This study used a questionnaire that included a demographic data sheet. The
questionnaire collected data on participants’ socio-demographic characteristics, social
network, loneliness, depression, functional independence, and health and wellbeing. All
the scales used in the study were validated, reliable and previously used in other studies
exploring loneliness among older people living in long term care settings. The
questionnaires were either self-administered by participating older people or completed
using face to face interviews. This study included 36 participants selected from four
different long term care settings in the Auckland region.

65
Loneliness was found to be present among the participating older people but only to a
marginal degree. The fewer social networks of the participants and their poorer
perceived health significantly contributed to loneliness.
6.1. Limitations of the study
The study had a number of limitation due to the nature of the study and the population
being studied. The limitations of this study are discussed below as recognising
limitations helps interpret whether the study was valid and whether the results derived
were credible (Ioannidis, 2007) and able to be generalised to older people living in other
long term care settings.
The study may have encountered a selection bias due to the technique utilised to recruit
participants. Although the majority of the studies conducted in the area of loneliness
among older people living in long term care have utilised convenience sampling,
participants in this study were recruited by the managers of long term care settings
which may have led to a sample selection bias. Older people who agreed to participate
may have been satisfied with the long term care facility they were residing in and this
may have reflected their lower reported levels of loneliness.
The levels of loneliness found in this study could have been influenced by factors that
were not tested in this study. This study did not collect data on factors, such as
participants’ residential satisfaction, something that has been linked to levels of
loneliness in previous studies. As this study was conducted to fit within a Masters’
thesis, only the common variables most relevant to older people living in long term care
settings were included even though, inclusion of further variables may have enriched
the study. Collecting data on participants’ satisfaction with their long term care setting,
would have likely made recruitment of participants more difficult than it already was.

66
In this thesis, social networks were measured using the questions used by Prieto-Flores
et al. (2011) which may not be sufficient in gathering information about the
participants’ social networks. This study and the study of Prieto-Flores et al. (2011)
have found high frequency of social network among participating older people which is
contrary to the findings of other studies in this field. Forsman et al. (2013) highlighted
that long-lasting friendship is vital to the well-being of older people living in long term
care and the loss of close friends is irreplaceable. In this respect, this study has managed
to capture most of the meaningful interaction of the participating older people.
This thesis did not study grief as one of the variables associated with loneliness. The
levels of loneliness among the participating older people may have been influenced if
they were grieving during the period of data collection.
Participants had MMSE scores completed by staff in their long term care settings prior
to being recruited into the study. Participants MMSE scores were 27 or above reflecting
a high level of cognitive functioning thereby ensuring they could fully consent to
participating in the study. This level of cognition may not be representative of this
population and could be a factor contributing to the low degree of loneliness found in
this study; higher levels of cognition has been associated with lower incidents of
loneliness (Lunaigh et al., 2011). As loneliness is considered a social stigma (Tzouvara,
2015) and it is often difficult for people to admit they are lonely, it may be that
participants with higher cognition chose not to admit the presence of loneliness to avoid
stigmatisation.
The results of the study should be treated with caution as the sample size of this study
was small and the results may not be generalisable to other older people living in long
term care settings in NZ. The sample size was limited due to the difficulty faced in

67
recruiting participants from long term care settings combined with the restricted
financial resources and the boundaries of the masters’ thesis. This study however serves
as a gateway for future research exploring loneliness in NZ long term care settings.
6.2. Future research
Although this study has a number of limitations, it provides a foundation for larger NZ
studies. Marginal loneliness was present among the participating older people in this
study but those with fewer social networks and poorer perceived health were more
likely to be lonely. There is now a need for a larger study exploring loneliness in long
term care settings; if loneliness is found to exist in a larger study, the results may enable
a more strategic approach to minimize loneliness in this population.
Older people living in care settings cannot be assumed to have any lower risk of
loneliness because of the structured environment of the setting and presence of
companions in the form of staff or other residents. They have almost every other high
risk factors that are outlined by the relevant studies that increases the risk of both social
and emotional loneliness and therefore highlights the necessity for further research into
this area (Grenade & Boldy, 2008; Prieto-Flores et al., 2011).
As the majority of the research conducted in this area have used a cross-sectional
design, causal relationships between variables have not been identified. The studies
showing association of variables such as depression and social networks with loneliness
were all cross-sectional and hence, they have not identified causal relationships
(Nyqvist et al., 2013). Further research is needed to discover causal relationships
between the established associations of loneliness.

68
As fewer social networks was associated with increased levels of loneliness, which has
also been established by several other studies such as Prieto-Flores et al. (2011), further
research into this area needs to be conducted for better understanding of this
relationship. This study participants reported comparatively better physical
independence when compared to many others living in long term settings which could
have enabled them to build social networks. Hence the findings may differ in studies
with less functional independence. Nyqvist et al. (2011) found social networks
significantly reduced among older people with functional limitations living in long term
care.
The prevalence of loneliness was minimal in this study which may be an indicative of
the staff and the culture of long term care settings they live in. It is believed that the
culture of long term care and the staff is influential in determining the quality of
relationships between older people and staff (Cook & Brown Wilson, 2010); however as
already stated this also could be related to selection bias.
There exist three different types of relationships between staff and older people and
their families, which are: individualised task-centred, resident-centred, and relationship-
centred (Brown Wilson, Davies, & Nolan, 2009). In order to improve experience of
older people, Brown Wilson, Davies and Nolan (2009) emphasises the importance of
relationship-centred care practices which takes into account the needs of older people,
their family and staff. This shows further research focussing on the influence of the
relationship between older people and long term care staff members on older peoples’
loneliness is needed.
6.3. Implications of the study
This study may have a number of implications for policy, service provision, future
research and practice in the field of long term care settings. This study found fewer

69
social networks significantly increased older peoples’ levels of loneliness. Older people
living in long term care settings have social networks around them, but they still feel
lonely. Focussing more on facilitating social connections within long term care settings,
may prove beneficial in reducing the levels of loneliness in older people. To prevent
loneliness among older people living in long term care settings, staff can develop their
plan of care to facilitate the social contact between older people and their close ones.
6.4. Chapter summary
This study was designed to explore loneliness among older people living in long term
care settings in NZ. This study showed the prevalence of loneliness among older people
was significantly associated to their poorer perceived health and fewer social networks.
This study had various limitations due to the nature of the study and the population
being studied however, informs future larger studies. The findings of this study may
help in the development of policies and in tailoring care of older people living in long
term care settings to address the issue of loneliness.

70
Appendices

71
Appe
ndix
A. S
umm
ary
of re
leva
nt st
udie
s
Aut
hor(
s)
Setti
ng(s
) Po
pula
tion
Stud
y A
im(s
) St
udy
Des
ign(
s)
Res
ult(s
) To
ol u
tilis
ed to
m
easu
re
Lone
lines
s
Prie
to-F
lore
s et a
l.,
(201
1)
Spai
n N
= 2
34 o
lder
pe
ople
mor
e th
an
60 y
ears
old
liv
ing
in lo
ng
term
car
e se
tting
s an
d 23
4 ol
der
peop
le li
ving
in
com
mun
ity
setti
ngs.
To e
xam
ine
whe
ther
an
y so
cio-
dem
ogra
phic
or h
ealth
fa
ctor
s con
tribu
tes
diff
eren
tially
to
lone
lines
s
Cro
ss-s
ectio
nal
corr
elat
iona
l D
epre
ssio
n an
d fr
eque
ncy
of
visi
ts m
ade
by th
e pa
rtici
pant
s ou
tsid
e an
d in
side
th
e se
tting
with
th
eir f
amily
, fr
iend
s, or
ne
ighb
ours
co
ntrib
uted
to
incr
ease
d le
vels
of
lone
lines
s
The
six-
item
De-
Jong
Gie
rvel
d lo
nelin
ess s
cale

72
Fern
ande
z-M
ayor
alas
et a
l.,
(201
1)
Spai
n N
= 2
34 o
lder
pe
ople
mor
e th
an
60 y
ears
old
liv
ing
in lo
ng
term
car
e se
tting
s an
d 23
4 ol
der
peop
le li
ving
in
com
mun
ity
setti
ngs.
To a
naly
se th
e in
fluen
ce o
f re
side
ntia
l sat
isfa
ctio
n an
d se
nse
of
belo
ngin
g on
lo
nelin
ess
Cro
ss-s
ectio
nal
corr
elat
iona
l R
esid
entia
l sa
tisfa
ctio
n po
sitiv
ely
affe
cts
sens
e of
be
long
ing
and
nega
tivel
y af
fect
s lo
nelin
ess
The
six-
item
De-
Jong
Gie
rvel
d lo
nelin
ess s
cale
Nik
mat
, Has
him
, O
mar
, & R
azal
i (2
015)
Mal
aysi
a N
= 1
10 o
lder
pe
ople
age
d m
ore
than
60
year
s liv
ing
in lo
ng
term
car
e se
tting
s
To d
eter
min
e th
e pr
eval
ence
of
lone
lines
s/so
cial
is
olat
ion
and
late
-life
de
pres
sion
am
ong
olde
r peo
ple
with
co
gniti
ve im
pairm
ent
livin
g in
long
term
ca
re se
tting
s.
Cro
ss-s
ectio
nal
corr
elat
iona
l D
epre
ssio
n w
as
stro
ngly
as
soci
ated
with
lo
nelin
ess o
r so
cial
isol
atio
n
Frie
ndsh
ip S
cale
(F
S)

73
de G
uzm
an,
Mar
avill
a,
Mar
avill
a, M
arfil
, M
arin
as, &
M
arqu
ez (2
012)
Phili
ppin
es
N =
180
old
er
peop
le a
ged
mor
e th
an 6
0 ye
ars
livin
g in
long
te
rm c
are
setti
ngs
To e
xam
ine
the
inte
rpla
y be
twee
n an
d am
ong
lone
lines
s, so
cial
isol
atio
n, so
cial
en
gage
men
t, an
d lif
e sa
tisfa
ctio
n.
Cro
ss-s
ectio
nal
corr
elat
iona
l In
crea
sed
soci
al
isol
atio
n,
inad
equa
te so
cial
en
gage
men
t and
de
crea
sed
life
satis
fact
ion
aggr
avat
es
lone
lines
s
UC
LA lo
nelin
ess
scal
e
Nyq
vist
, Cat
tan,
A
nder
son,
Fo
rsm
an, &
G
usta
fson
(201
3)
Swed
en
N =
149
old
er
peop
le a
ged
mor
e th
an 8
5 ye
ars
livin
g in
long
te
rm c
are
setti
ngs
and
334
olde
r pe
ople
age
d m
ore
than
85
year
s liv
ing
in th
eir
own
hom
es.
To in
vest
igat
e th
e as
soci
atio
n be
twee
n as
pect
s of s
ocia
l ca
pita
l and
lone
lines
s.
Cro
ss-s
ectio
nal
long
itudi
nal
(200
5-20
07)
Lone
lines
s pr
eval
ent i
n 55
%
livin
g in
long
te
rm c
are
and
clos
ely
rela
ted
to
depr
essi
on a
nd to
th
e ge
ogra
phic
al
regi
on th
ey li
ve
in
A si
ngle
que
stio
n st
atin
g “D
o yo
u ev
er fe
el
lone
ly?”
Dra
gese
t, Es
peha
ug, &
K
irkev
old
(201
1)
Nor
way
N
= 2
27
cogn
itive
ly in
tact
ol
der p
eopl
e ag
ed
mor
e th
an 6
5 ye
ars l
ivin
g in
lo
ng te
rm c
are
setti
ngs f
or m
ore
than
6 m
onth
s
To a
naly
se th
e re
latio
nshi
ps b
etw
een
depr
essi
ve s
ympt
oms,
sens
e of
coh
eren
ce
and
emot
iona
l and
so
cial
lone
lines
s
Cro
ss-s
ectio
nal
corr
elat
iona
l D
epre
ssio
n co
ntrib
utes
to
soci
al a
nd
emot
iona
l lo
nelin
ess
The
revi
sed
soci
al p
rovi
sion
s sc
ale
(SPS
)

74
Dra
gese
t, Ei
de,
Kirk
evol
d, &
R
anho
ff (2
012)
Nor
way
N
= 2
27 o
lder
pe
ople
livi
ng in
lo
ng te
rm c
are
setti
ngs f
or m
ore
than
6 m
onth
s, w
ithou
t cog
nitiv
e im
pairm
ent,
and
aged
mor
e th
an
65 y
ears
To a
sses
s whe
ther
so
cial
and
em
otio
nal
lone
lines
s inf
luen
ced
mor
talit
y am
ong
the
cogn
itive
ly in
tact
ol
der p
eopl
e w
ith
canc
er li
ving
in lo
ng
term
car
e se
tting
s
Cro
ss-s
ectio
nal
Long
itudi
nal
(200
4 - 2
010)
Emot
iona
l lo
nelin
ess w
as
asso
ciat
ed w
ith
mor
talit
y
The
revi
sed
soci
al p
rovi
sion
s sc
ale
(SPS
)
Bek
het &
Za
uszn
iew
ski
(201
2)
Nor
thea
st O
hio,
U
nite
d St
ates
of
Am
eric
a
N =
314
old
er
peop
le li
ving
in
long
term
car
e se
tting
s
To e
xam
ine
gend
er
diff
eren
ces a
nd
asso
ciat
ion
betw
een
lone
lines
s, in
dica
tors
of
phy
sica
l and
men
tal
heal
th c
onse
quen
ces,
and
reso
urce
fuln
ess
skill
s am
ong
olde
r pe
ople
livi
ng in
long
te
rm c
are
setti
ngs
Des
crip
tive
and
Com
para
tive
A
nxie
ty a
nd
depr
essi
on
sign
ifica
ntly
re
late
d to
lo
nelin
ess
Sing
le it
em
ques
tion
Hei
dari,
Gho
dusi
, &
Shi
rvan
i (20
16)
Shah
reko
rd, I
ran
N =
100
old
er
peop
le a
ged
mor
e th
an 6
0 ye
ars,
50
of th
em li
ving
in
long
term
car
e se
tting
s and
oth
er
50 in
the
com
mun
ity
To a
sses
s lon
elin
ess i
n re
latio
n w
ith
dem
ogra
phic
fact
ors
Des
crip
tive
Cro
ss-s
ectio
nal
The
prev
alen
ce o
f lo
nelin
ess i
s hi
gher
in th
e ol
der w
omen
liv
ing
in lo
ng
term
car
e se
tting
s.
Aut
hors
co
nstru
cted
Lo
nelin
ess s
cale

75
setti
ngs
Tzou
vara
(201
5)
Uni
ted
Kin
gdom
N
= 1
6 ol
der
peop
le fo
r qu
antit
ativ
e se
ctio
n an
d 10
ol
der p
eopl
e fo
r qu
alita
tive
part
of
the
stud
y. A
ll of
th
em re
side
d in
lo
ng te
rm c
are
setti
ngs
To in
vest
igat
e th
e in
ter-
rela
tions
hips
be
twee
n se
lf-st
igm
a,
lone
lines
s, an
d cu
lture
am
ong
olde
r pe
ople
with
men
tal
illne
ss re
sidi
ng in
long
te
rm c
are
setti
ngs
Mix
ed-m
etho
d Lo
nelin
ess w
as
iden
tifie
d to
be
prev
alen
t am
ong
mor
e th
an h
alf o
f th
e sa
mpl
e (6
8.8%
). Th
ere
was
als
o a
posi
tive
corr
elat
ion
betw
een
lone
lines
s, ag
e an
d re
ligio
sity
Sing
le se
lf-re
porti
ng
ques
tion

76
Appendix B. Questionnaire

77

78

79

80

81

82

83
Appendix C. Permission to use EQ-5D-5L and EQ-VAS
RE: New registration
Mandy van Reenen
Wed 26/08/2015, 8:45 p.m.
Dear Ms/Mr. Bogati,
Thank you for registering your research at the EuroQol Group Foundation's website.
As the study you registered involves low patient numbers (60) you may use the EQ-5D-
5L instrument (Paper version) free of charge. Please note that separate permission is
required if any of the following is applicable:
- Funded by a pharmaceutical company, medical device manufacturer or other profit-
making stakeholder;
- Number of respondents ≥ 5000
- Routine Outcome Measurement;
- Developing or maintaining a Registry;
- Digital representations (e.g. PDA, Tablet or Web)

84
Please find attached the English EQ-5D-5L version (word format). A brief user guide is
downloadable from the EuroQol website (www.euroqol.org).
Please note that over the next months the first value sets associated with the EQ-5D-5L
system will be published. It will take time before 5L value sets will be available for
most countries. Please check our website to see which 5L value sets are currently
available. In the meantime, the EuroQol Research Foundation has developed a
“crosswalk” between the EQ-5D-3L value sets and the new EQ-5D-5L descriptive
system, resulting in interim value sets for the new EQ-5D-5L descriptive system. Please
find all information about the crosswalk from EQ-5D-5L data to the EQ-5D-3L value
sets online at the EuroQol website (http://www.euroqol.org/about-eq-5d/valuation-of-
eq-5d/eq-5d-5l-value-sets.html).
Best regards,
Mandy van Reenen
Communications Specialist
EuroQol Research Foundation
T: + 31 88 4400190
W: www.euroqol.org

85
Appendix D. Participant information sheet

86

87

88
Appendix E. Participant Consent form

89
Appendix F. Coding Sheet
Coding Sheet for data analysis
Section 1
Demographic variables will explain the sample size.
Gender : male (1)
Female (2)
Gender Diverse (3)
Age will be a categorical scale.
Marital status:
I am legally married (1)
I am in a civil union/de facto/partnered relationship (2)
I am permanently separated from my legal husband or wife (3)
I am divorced or my marriage has been dissolved (4)
I am a widow or widower (5)
I have never been legally married (6)
Ethnic group:
Pakeha / New Zealander of European descent (1)
Māori (2)

90
Samoan (3)
Cook Island Maori (4)
Tongan (5)
Chinese (6)
Indian (7)
Other (8)
Q 5-6 will be used to determine the frequency of visits.
In response of Q5-6; ‘less than once a month’ will get a score of 3, ‘once or twice a
month’ will score 2 and ‘once a week or frequently’ will get a score of 1.
Section 2
The Barthel Index
1. How do you mobilise indoors? Score for
data analysis
Immobile 0
Wheelchair independent (including comers/doors) 5
Help of one untrained person, including supervision 10
Independent (may use aid) 15
The total sum of the participants’ scores will range from 0 – 100, with lower scores
indicating increased disability.
Section 3

91
EQ-5D-5L
For each question; the first level answer will score 1 and last level answer will score 5.
For e.g.
MOBILITY
I have no problems in walking about - this will score 1
I have slight problems in walking about - this will score 2
I have moderate problems in walking about -this will score 3
I have severe problems in walking about -this will score 4
I am unable to walk about -this will score 5
For EQ-VAS section at the end of EQ-5D-5L
The participant will rate a number out of 0-100 for how good/bad their health is today.
Section 4
The Geriatric Depression Scale- 15 item
Each question has a bold underlined response which will get a score of 1 and the other
response will get score of 0. For e.g.
1. Are you basically satisfied with your life? YES / NO (No = 1 and yes
= 0)
2. Have you dropped many of your activities and interests? YES / NO (No = 0 and yes
= 1)
3. Do you feel that your life is empty? YES / NO (No = 0 and yes
= 1)
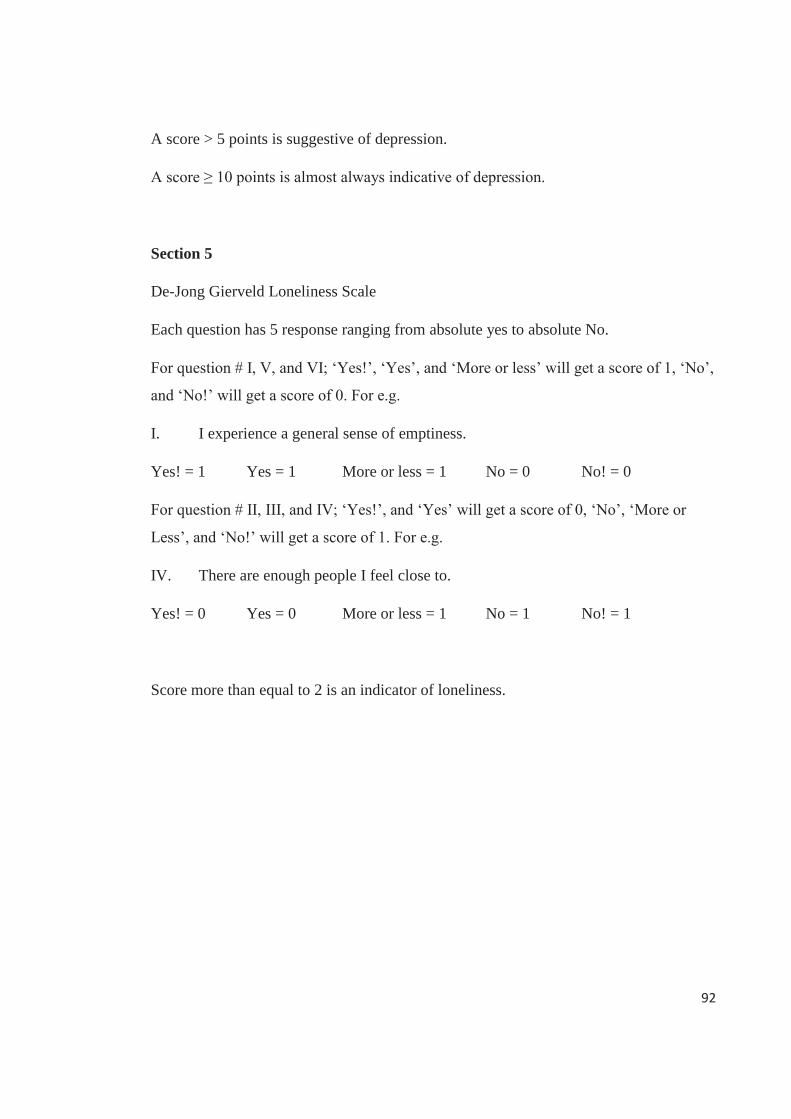
92
A score > 5 points is suggestive of depression.
A score ≥ 10 points is almost always indicative of depression.
Section 5
De-Jong Gierveld Loneliness Scale
Each question has 5 response ranging from absolute yes to absolute No.
For question # I, V, and VI; ‘Yes!’, ‘Yes’, and ‘More or less’ will get a score of 1, ‘No’,
and ‘No!’ will get a score of 0. For e.g.
I. I experience a general sense of emptiness.
Yes! = 1 Yes = 1 More or less = 1 No = 0 No! = 0
For question # II, III, and IV; ‘Yes!’, and ‘Yes’ will get a score of 0, ‘No’, ‘More or
Less’, and ‘No!’ will get a score of 1. For e.g.
IV. There are enough people I feel close to.
Yes! = 0 Yes = 0 More or less = 1 No = 1 No! = 1
Score more than equal to 2 is an indicator of loneliness.

93
Appendix G. Massey University Human Ethics Committee approval

94
Appendix H. Graduate research fund approval letter

95
Appendix I. NZNO grant approval letter

96
Appendix J. Consultation Email I
On Aug 2, 2015, at 7:48 PM, Rubina Bogati <[email protected]> wrote:
Good Evening Dr Gagan
My name is Rubina - a Registered Nurse who used to work in Caughey Preston - upland
and ventnor. I am currently working with WDHB. I got your email address from one of
your publications. I am writing this email to you to seek your expert advice regarding
research with older people in care settings.
I am currently enrolled in MPhil at Massey University and doing a study on rate of
loneliness in older people living in care settings in NZ. My supervisor Dr Alison Pirret
suggested to try contacting you for your advice in recruitment of participants for this
study. Would you be able to suggest me on how I should go about recruiting
participants for my study? This is a cross sectional survey and postal questionnaires will
be used for data collection.
I would be very grateful if you could guide me in the right direction. I hope I am not
asking for too much.
Thank you.
Kind Regards
Rubina Bogati
Ph # 0226580474

97
Subject: Re: Seeking your advice regarding study in older people
From: [email protected]
Date: Mon, 3 Aug 2015 08:47:36 +1200
Hi Rubina, nice to hear from you. I guess the first place to start is with admin of a
couple different settings to secure their support for a project like this in their setting.
Then you would need to talk to other RNs on staff at the settings to identify residents
who could participate. Then approach residents.
I would suggest you use at least three different settings to try to capture different
socioeconomic and cultural backgrounds as those could be variables that contribute to
or reduce loneliness.
Good luck.
Mary Jo Gagan PhD, NP, FAANP
Sent from my iPad

98
On Aug 14, 2015, at 6:29 PM, Rubina Bogati <[email protected]> wrote:
Good Evening Dr Gagan
Re: Research on loneliness and the impact it has on health and wellbeing of older
people living in care settings in NZ.
Thank you so much for your reply. As you know I am currently pursuing Mphil. I am
currently designing a study utlising a tool used by La Grow, et al. in 2012, to explore
loneliness in NZ older people living in the community and it’s impact on their self-
reported mental and physical health (Please find attached my research proposal). For
my study the participants will be older people living in aged care settings. I am hoping
to study residents in 3-4 aged care centres. I was wondering if you would look at my
proposal and provide any feedback that would develop the proposal further.
I would also like your advice on care settings that I could approach that would be
ammenable to supporting this research once it has been developed further. If you know
of any, would you please let me know the contact person for me to get in touch with.
Many thanks for your time. I look forward to hearing from you.
Kind Regards
Rubina Bogati
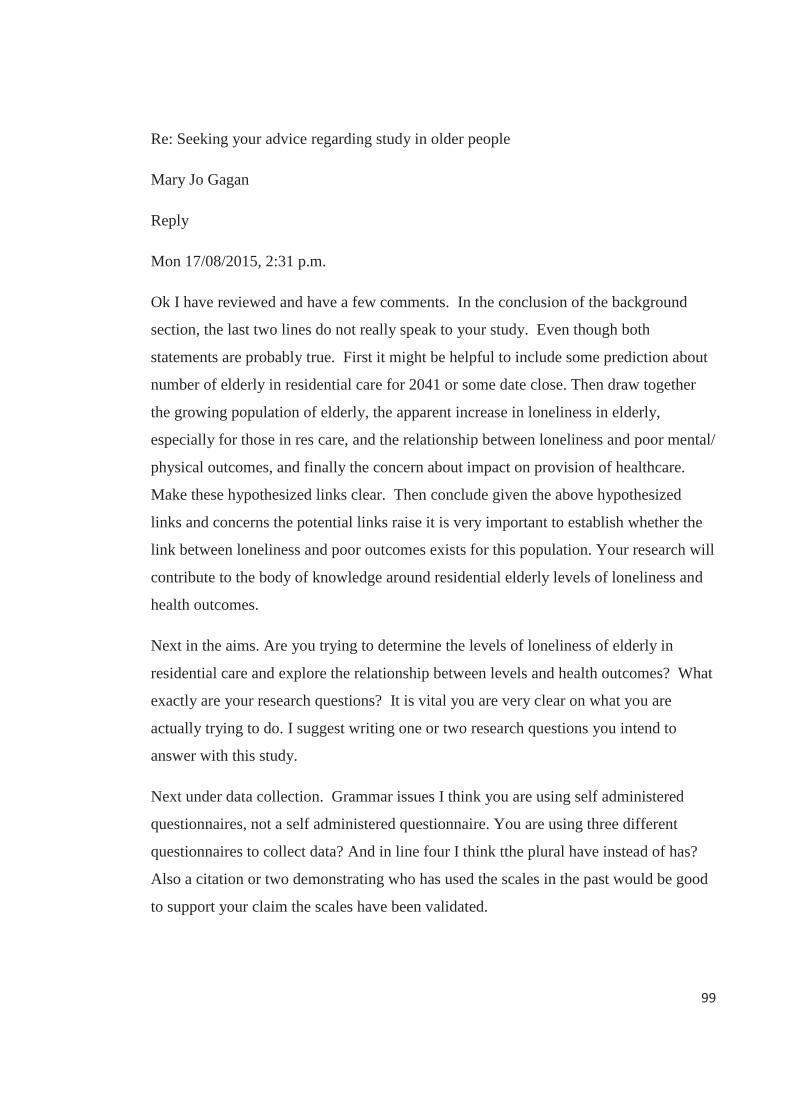
99
Re: Seeking your advice regarding study in older people
Mary Jo Gagan
Reply
Mon 17/08/2015, 2:31 p.m.
Ok I have reviewed and have a few comments. In the conclusion of the background
section, the last two lines do not really speak to your study. Even though both
statements are probably true. First it might be helpful to include some prediction about
number of elderly in residential care for 2041 or some date close. Then draw together
the growing population of elderly, the apparent increase in loneliness in elderly,
especially for those in res care, and the relationship between loneliness and poor mental/
physical outcomes, and finally the concern about impact on provision of healthcare.
Make these hypothesized links clear. Then conclude given the above hypothesized
links and concerns the potential links raise it is very important to establish whether the
link between loneliness and poor outcomes exists for this population. Your research will
contribute to the body of knowledge around residential elderly levels of loneliness and
health outcomes.
Next in the aims. Are you trying to determine the levels of loneliness of elderly in
residential care and explore the relationship between levels and health outcomes? What
exactly are your research questions? It is vital you are very clear on what you are
actually trying to do. I suggest writing one or two research questions you intend to
answer with this study.
Next under data collection. Grammar issues I think you are using self administered
questionnaires, not a self administered questionnaire. You are using three different
questionnaires to collect data? And in line four I think tthe plural have instead of has?
Also a citation or two demonstrating who has used the scales in the past would be good
to support your claim the scales have been validated.

100
Sample size section please state how many subjects you would ideally like to include
this is N=30 or something like that. Also line 3 use small not smaller. If you say
smaller then you must say smaller than what. Same in limitations say small, not smaller.
Finally in the data analysis section I would expect more detail. For example to address
research question one simple descriptive statistics will be used to categorize levels of
loneliness. To answer research question two about the relationship between Lon,ones
and health out comes... Will be used. You need to see your statistician now and have
them help you develop questions, determine how to analyze data and help you decide
how many subjects you need to have enough power to draw conclusions from results.
Interesting stuff, good luck!
Mary Jo Gagan PhD, NP, FAANP
Sent from my iPad

101
Appendix K. Consultation Email II
From: Rubina Bogati [mailto:[email protected]]
Sent: Friday, 14 August 2015 6:40 p.m.
To: Julia Russell
Subject: Seeking your feedback
Dear Julia
Re: Research on loneliness and the impact it has on health and wellbeing of older
people living in care settings in NZ.
As you know I am currently pursuing Mphil. I am currently designing a study utlising a
tool used by La Grow, et al. in 2012, to explore loneliness in NZ older people living in
the community and it’s impact on their self-reported mental and physical health (Please
find attached my research proposal). For my study the participants will be older people
living in aged care settings. I am hoping to study residents in 3-4 aged care centres. I
was wondering if you would look at my proposal and provide any feedback that would
develop the proposal further.
Many thanks for your time. I look forward to hearing from you.
Kind Regards
Rubina Bogati

102
RE: Seeking your feedback
Julia Russell
Reply
Sun 16/08/2015, 1:57 p.m.
Thanks for letting me look at this and it looks great. Just the spell check option – the
first line of your inclusion criteria says requires it should be require. Also in the data
collection paragraph line 4 – the has needs removed and the sentence could then read –
Both of the scales have been validated for use in older people, and used extensively in
previous studies.
Other thoughts
Many residents would require assistance to complete this as it is very long and quite
complicated. Is there a possibility that those who receive assistance may be in a
different position than others who would have no one to assist them or indeed their
answers might be different if they have assistance?
Some of the questions in this survey are not relevant to someone living in a setting -
have you considered a modified questionnaire which would remove questions that
would make the exercise seem a little silly and perhaps a barrier to complete given the
environment people are in such as 28, 29. Question 3 refers to household tasks most
people are with us because they cant do these tasks and if they have been with us for a
while then they wouldn’t be doing these. Have you done a small trial – run a focus
group to
Recruiting - have you identified settings that you will use - are you going to use a
middle person to introduce the idea or how will you obtain access to these people. If so
I think this needs to be said and if not I winder how you will access folk?
Some other thoughts for your discussion, you refer to older people as those over 65

103
- do you think loneliness may be affected by increased age ie those younger in a
setting may still have friends, spouse - children. Our age range at present in our
settings is 49 – 102. Average age 85 – in doing this I do remove the outliers as they
change the average significantly.
- I look forward to seeing how this progresses. We have been looking at doing
some more focussed actions on satisfaction for people and I cant remember the tool but
it is a commonly used smiley faces approach to measuring a variety of things –
happiness, satisfaction etc. We thought we could do this by utilising a tablet with older
people
Take care
Julia
Julia Russell RN, MPhil Nursing
Director of Services for Older People | Presbyterian Support Southland

104
Research into loneliness in older people
Rubina Bogati
Mon 7/09/2015, 10:34 p.m.
Dear Julia
Thank you so much for your suggestions regarding research proposal. They were very
helpful in further designing the study. Replicating Dr Neville’s study in rest home
setting did not appear feasible therefore, the methodology of the study has now been
changed based on an international study completed on loneliness in long term care
settings. Hence the questionnaire of the study has been changed and instead of sending
postal questionnaire, I will interview participants in person.
I would be very grateful if you could provide further feedback regarding this revised
study design? (Please find attached the research proposal).
Prior to submitting an ethics application I would also like to identify possible long term
care settings that would be willing for their residents to participate in the study. Would
any of your centres be willing to be one of three to four centres allowing me to
interview residents?
I look forward to hearing from you.
Kind Regards
Rubina

105
From: Julia Russell
Date: 08/09/2015 07:14 (GMT+12:00)
To: 'Rubina Bogati'
Subject: Research proposal.docx
Good morning
Yes I think this looks better and more achievable, I have only noted one point which is
are you calling them – participants, patients, older people ?
I m sure we could help find some people but we are a long way down here. I think it
would also be good for all participants not to all be at the same setting or the same
group?
I am happy for you to decide what you wish to do.
Regards Julia

106
Appendix L. Recruitment email to Managers of long term care settings
From: Rubina Bogati [mailto:[email protected]]
Sent: Tuesday, 8 September 2015 12:16 a.m.
To:
Subject: Research on loneliness in older people
Dear
I am searching for settings as a possible site for research I am wanting to undertake
following Massey University Humans Ethics Approval. Prior to submitting an ethics
application I would like to identify possible long term care settings that would be
willing for their residents to participate in this study. I am emailing to ask if you would
consider your centre to be one of three to four centres allowing me to interview
residents.
I am a Registered Nurse currently doing a research to complete a Master’s of
Philosophy - Nursing Degree at Massey University. My research will explore the degree
of loneliness among older people living in long term care settings in New Zealand.
Numerous studies explore loneliness in older people living in communities however,
very limited information is known about loneliness of those living in long term care
settings. In older people loneliness has been found to be associated with increased risk
of mortality, poorer physical and mental health, and increased risk of
institutionalisation. Institutionalisation in itself, is believed to cause an increased level
of loneliness, with older people living in long term care settings twice as likely to feel
lonely than those living in community settings (Prieto-Flores et al., 2011).
I have attached a copy of my draft research proposal which outlines the research.
Please do not hesitate to contact me if any further information is required. I look
forward to hearing from you.

107
Sincerely,
Rubina Bogati
Ph # 0226580474

108
References
Adam, E. K., Hawkley, L. C., Kudielka, B. M., & Cacioppo, J. T. (2006). Day-to-day
dynamics of experience: Cortisol associations in a population-based sample of
older adults. Proceedings of the National Academy of Science of the United
States of America, 103, 17058-17063.
Ailshire, J., & Crimmins, E. (2013). Physical and biological indicators of health and
functioning in the U.S. oldest old. In Sussman, S. W. (Eds.), Annual review of
gerontology and geriatrics: healthy longevity, a global approach (pp. 193-216).
Retrieved from https://books.google.co.nz/
Alpass, F. M., & Neville, S. (2003). Loneliness, health and depression in older males.
Aging Mental Health, 7(3), 212-216. doi: 10.1080/1360786031000101193
Andresen, E., Gravitt, G., Aydelotte, M., & Podgorski, C. (1999). Limitations of the SF-
36 in a sample of nursing home residents. Age & Ageing, 28(6), 562-566.
Arslantaş, H., Adana, F., Abacigil Ergin, F., Kayar, D., & Acar, G. (2015). Loneliness
in elderly people, associated factors and its correlation with quality of life: A
field study from Western Turkey. Iranian Journal of Public Health, 44(1), 43-50
Auckland Council. (2012). Aucklanders 50 and over: A health, social, economic and
demographic summary analysis of the life experiences of older Aucklanders.
Retrieved from http://www.aucklandcouncil.govt.nz
Beck, C. T., & Polit, D. F. (2014). Essentials of nursing research: Appraising evidence
for nursing practice (8th ed.). Philadelphia, PA: Lippincott Williams & Wilkins.
Beck, C. T., & Polit, D. F. (2012). Nursing research: Generating and assessing
evidence for nursing practice (9th ed.). Hong Kong, China: Lippincott Williams
& Wilkins.
Bekhet, A. K., & Zauszniewski, J. A. (2012). Mental health of elders in retirement
communities: Is loneliness a key factor? Archives of Psychiatric Nursing,
26 (3), 214–224. doi:10.1016/j.apnu.2011.09.007.

109
Broad, J., Ashton, T., Gott, M., McLeod, H., Davis, P., & Connolly, M. (2015).
Likelihood of residential aged care use in later life: A simple approach to
estimation, with international comparison. Australian New Zealand Journal of
Public Health, 39(4), 374-379. doi: 10.1111/1753-6405.12374
Brown Wilson, C., Davies, S. & Nolan, M. R. (2009). Developing relationships in care
homes - the contribution of staff, residents and families. Ageing and Society, 29,
1041–1063.
Bruce, N., Pope, D., & Stanistreet, D. (2008). Quantitative methods for health research:
A practical interactive guide to epidemiology and statistics. West Sussex,
England: John Wiley & Sons Ltd.
Cacioppo, J. T., Hawkley, L. C., Crawford, L. E., Ernst, J. M., Burleson, M. H.,
Kowalewski, R. B., et al. (2002). Loneliness and health: potential mechanisms.
Psychosomatic Medicine, 64(3), 407-417.
Cacioppo, J. T., Hawkley, L. C., & Thisted, R. A. (2010). Perceived social isolation
makes me sad: 5-year cross-lagged analyses of loneliness and depressive
symptomatology in the Chicago Health, Aging, and Social Relations Study.
Psychology and Aging, 25(2), 453-463.
Carpenter, B. D. (2002). Family, peer, and staff social support in nursing home patients:
Contributions to psychological well-being. Journal of Applied Gerontology, 21,
275-293.
Chen, Y., & Feeley, T. H. (2013). Social support, social strain, loneliness, and well-
being among older adults: An analysis of the Health and Retirement Study.
Journal of Social and Personal Relationships, 31(2), 141-161. doi:
10.1177/0265407513488728
Cheng, Y., Weng, S., Chang, S., Tan, S., & Tang, Y. (2014). Evaluating functional
independence in older adults using subscales of the Berg Balance Scale. Journal
of Clinical Gerontology and Geriatrics, 5(4), 111-116. doi:
10.1016/j.jcgg.2014.05.001.

110
Clark-Carter, D. (2004). Quantitative psychological research: A student’s handbook
(2nd ed.). East Sussex, United Kingdom: Psychology Press.
Cole, S. W., Hawkley, L. C., Arevalo, J. M., & Cacioppo, J. T. (2011). Transcript origin
analysis identifies antigen presenting cells as primary targets of socially
regulated leukocyte gene expression. Proceedings of the National Academy of
Sciences, 108, 3080-3085.
Collin, C., Wade, D. T., Davies, S., & Horne, V. (1988). The Barthel ADL index: A
reliability study. International Disability Studies, 10(2), 61-63.
Comerasamy, H., & Siu, C. (2013). Doing a research project in nursing & midwifery: A
basic guide to research using the literature review methodology. London,
United Kingdom: SAGE Publications Ltd.
Cook, G. & Brown Wilson, C. (2010). Care home residents’ experiences of social
relationships with staff. Nursing Older People, 22, 24–29.
Courtin, E. & Knapp, M. (2015). Social isolation, loneliness and health in old age: A
scoping review. Health & Social Care in the Community. doi:
10.1111/hsc.12311
Coyle, C. E., & Dugan, E. (2012). Social isolation, loneliness and health among older
adults. Journal of Aging Health, 24(8), 1346-1363. doi:
10.1177/0898264312460275
Creswell, J. W. (2009). Research Design: Qualitative, Quantitative, and Mixed Methods
Approaches (3rd ed.). Los Angeles: SAGE Publications, Inc.
Crossan, F. (2003). Research philosophy: Towards an understanding. Nurse Researcher,
11(1), 46-55. doi: 10.7748/nr2003.10.11.1.46.c5914
Cutrona, C. E., & Russell, D. (1987). The provisions of social relationships and
adaptation to stress. In W. H. Jones & D. Perlman (Eds.), Advances in personal
relationships (Vol. 1, pp. 37-67). Greenwich, CT: JAI Press.

111
Dahlberg, L., & McKee, K. J. (2014). Correlates of social and emotional loneliness in
older people: evidence from an English community study. Aging Mental Health,
18(4), 504-514. doi: 10.1080/13607863.2013.856863
de Guzman, A. B., Maravilla, K.N., Maravilla V.A., Marfil, J. D. V., Mariñas, J. A. R.,
& Marquez, J. M. B. (2012). Correlates of geriatric loneliness in Philippine
nursing homes: A multiple regression model. Educational Gerontology, 38 (8),
563-575, doi: 10.1080/03601277.2011.645443
De Jong Gierveld, J., & van Tilburg, T. (2006). A 6-Item Scale for Overall, Emotional,
and Social Loneliness. Research on Aging, 28(5), 582-598.
DePoy, E., & Gitlin, L. N. (2011). Introduction to research: Understanding and
applying multiple strategies (4th ed.). Missouri: Elsevier Inc.
Djukanovic, I., Sorjonen, K., & Peterson, U. (2015). Association between depressive
symptoms and age, sex, loneliness and treatment among older people in Sweden.
Aging Mental Health, 19(6), 560-568. doi: 10.1080/13607863.2014.962001
Drageset, J., Kirkevold, M., & Espehaug, B. (2011). Loneliness and social support
among nursing home residents without cognitive impairment: A questionnaire
survey. International Journal of Nursing Studies, 48, 611–619.
Drageset, J., Eide, G. E., Kirkevold, M., & Ranhoff, A. H. (2012). Emotional loneliness
is associated with mortality among mentally intact nursing home residents with
and without cancer: A five-year follow-up study. Journal of Clinical Nursing,
22, 106–114. doi: 10.1111/j.1365-2702.2012.04209.x
Dykstra, P. (2009). Older adult loneliness: myths and realities. European Journal of
Ageing, 6(2), 91-100. doi:10.1007/s10433-009-0110-3
Eng, A. (2016). Understanding loneliness. Retrieved from
http://www.publichealth.northwestern.edu/docs/nphr-docs/2016articles/nphr-
2016-eng-loneliness.pdf
Fernandez-Mayoralas, G., Prieto-Flores, M. E., Forjaz, M. J., Rojo-Perez, F., &
Martinez-Martin, P. (2011). Residential satisfaction, sense of belonging and

112
loneliness among older adults living in the community and in care facilities.
Health & Place, 17, 1183–1190. doi: 10.1016/j.healthplace.2011.08.012
Forsman, A. K., Herberts, C., Nyqvist, F., Wahlbeck, K., & Shierenbeck, I. (2013).
Understanding the role of social capital for mental well-being among older
adults. Ageing & Society, 33, 804-825.
Garcia, P. & McCarthy, M. (n.d.). Measuring Health: A step in the development of city
health profiles. Copenhagen, Denmark: World Health Organisation.
Giddings, L. S., & Grant, B. M. (2007). A Trojan horse for positivism? A critique of
mixed methods research. Advances in Nursing Science, 30(1), 52-60.
Golden, J., Conroy, R. M., Bruce, I., Denihan, A., Greene, E., Kirby, M., & Lawlor, B.
A. (2009). Loneliness, social support networks, mood and wellbeing in
community-dwelling elderly. International Journal of Geriatric Psychiatry,
24(7), 694-700. doi: 10.1002/gps.2181
Gray, D. E. (2014). Doing research in the real world (3rd ed.). London, United
Kingdom: SAGE Publications Ltd.
Grenade, L., & Boldy, D. (2008). Social isolation and loneliness among older people:
issues and future challenges in community and residential settings. Australian
Health Review, 32(3), 468-478.
Hawthorne, G. (2006). Measuring social isolation in older adults: Development and
initial validation of the friendship scale. Social Indicators Research, 77: 521.
doi:10.1007/s11205-005-7746-y
Haywood, K. L., Garratt, A. M., & Fitzpatrick, R. (2005). Quality of life in older
people: A structured review of generic self-assessed health instruments. Quality
of Life Research, 14(7), 1651-1668. doi: 10.1007/s11136-005-1743-0
Heidari, M., Ghodusi, M., & Shirvani, M. (2016). Loneliness in elderly and non-elderly
residents of nursing homes. International Journal of Nursing Education, 8(2),
72-76. doi: 10.5958/0974-9357.2016.00051.9

113
Hinton, P. R., Brownlow, C., McMurray, I., & Cozens, B. (2004). SPSS explained.
London, United Kingdom: Routledge.
Holroyd, S. & Clayton, A. H. (2000). Measuring depression in the elderly: Which scale
is best. Medscape General Medicine, 2(4).
Holwerda, T., Deeg, D., Beekman, A., van Tilburg, T., Stek, M., Jonker, C., &
Schoevers, R. (2012). Feelings of loneliness, but not social isolation, predict
dementia onset: Results from the Amsterdam Study of the Elderly (AMSTEL).
Journal of neurology, neurosurgery, and psychiatry.
Holwerda, T. J., Van Tilburg, T. G., Deeg, D. J. H., Schutter, N., Van, R., Dekker, J.,
Stek, M. L., Beekman, A. T. F., & Schoevers, R. A. (2016). Impact of loneliness
and depression on mortality: Results from the longitudinal ageing study
Amsterdam. The British Journal of Psychiatry, 1(8). doi:
10.1192/bjp.bp.115.168005
Honigh-de Vlaming, R., Haveman-Nies, A., Bos-Oude Groeniger, I., de Groot, L., &
Veer, P. (2014). Determinants of trends in loneliness among Dutch older people
over the period 2005-2010. Journal of Aging Health, 26(3), 422-440. doi:
10.1177/0898264313518066
Houghton, C., Hunter, A., & Meskell, P. (2012). Linking aims, paradigm and method in
nursing research. Nurse Researcher, 20(2), 34-39.
Hubbard, G., Tester, S., & Downs, M. G. (2003). Meaningful social interactions
between older people in institutional care settings. Ageing & Society, 23, 99-114.
Hulme, C., Long, A., Kneafsey, R., & Reid, G. (2004). Using the EQ-5D to assess
health-related quality of life in older people. Age & Ageing, 33(5), 504-507.
Ioannidis J. P. (2007). Limitations are not properly acknowledged in the scientific
literature. Journal of Clinical Epidemiology, 60(4): 324-329.
Janssen, M. F., Pickard, A. S., Golicki, D., Gudex, C., Niewada, M., Scalone, L.,
Swinburn, P., & Busschbach, J. (2013). Measurement properties of the EQ-5D-

114
5L compared to the EQ-5D-3L across eight patient groups: A multi-country
study. Quality of Life Research, 22(7), 1717–1727. doi: 10.1007/s11136-012-
0322-4
Jongenelis, K., Pot, A. M., Eisses, A. M., Gerritsen D. L., Derksen, M., Beekman, A. T.,
Kluiter, H., Ribbe, M. W., Eisses, A. M. H., & Beekman, A. T. F. (2005).
Diagnostic accuracy of the original 30-item and shortened versions of the
geriatric depression scale in nursing home patients. International Journal of
Geriatric Psychiatry, 20, 1067–1074.
Kobayashi, K. M., Cloutier-Fisher, D., & Roth, M. (2009). Making meaningful
connections: A profile of social isolation and health among older adults in small
town and small city, British Columbia. Journal of Aging & Health, 21(2), 374-
397.
Korporaal, M., van Groenou, B., Marjolein, I., & van Tilburg, T. G. (2008). Effects of
own and spousal disability on loneliness among older adults. Journal of Aging
and Health, 20, 306.
La Grow, S., Neville, S., Alpass, F., & Rodgers, V. (2012). Loneliness and self-reported
health among older persons in New Zealand. Australasian Journal of Ageing,
31(2), 121-123. doi: 10.1111/j.1741-6612.2011.00568.x
Larner, A. J. (2008). Neuropsychological neurology: The neurocognitive impairments of
neurological disorders. New York, United States of America: Cambridge
University Press.
Lesher, E. L. & Berryhill, J. S. (1994). Validation of the geriatric depression scale –
short form among inpatients. Journal of Clinical Psychology, 50, 256–260.
Losada, A., Márquez-González, M., García-Ortiz, L., Gómez-Marcos, M. A.,
Fernández-Fernández, V., & Rodríguez-Sánchez, E. (2012). Loneliness and
mental health in a representative sample of community-dwelling Spanish older
adults. Journal of Psychology, 146(3), 277-292.
doi:10.1080/00223980.2011.582523

115
Luanaigh, C. O., & Lawlor, B. A. (2008). Loneliness and the health of older people.
International Journal of Geriatric Psychiatry, 23(12), 1213-1221. doi:
10.1002/gps.2054
Lübke, N., Meinck, M., & Von Renteln-Kruse, W. (2004). The Barthel index in
geriatrics. A context analysis for the Hamburg classification manual. Zeitschrift
Fur Gerontologie Und Geriatrie, 37(4), 316-326. doi:10.1007/s00391-004-
0233-2
Luo, Y., Hawkley, L. C., Waite, L. J., & Cacioppo, J. T. (2012). Loneliness, health, and
mortality in old age: A national longitudinal study. Social Science and Medicine,
74(6), 907-914. doi: 10.1016/j.socscimed.2011.11.028
MacPherson, L. (2014). National population projections. Retrieved from
http://www.stats.govt.nz/
Mann, P. S. (2010). Introductory statistics (7th ed.). Retrieved form
https://books.google.co.nz/
McDonald, J. H. (2014). Handbook of biological statistics. Retrieved from
http://www.biostathandbook.com/kruskalwallis.html
Moule, P., & Goodman, M. (2009). Nursing research: An introduction. London, United
Kingdom: SAGE Publications limited.
Nayak, B. K. (2010). Understanding the relevance of sample size calculation. Indian
Journal of Ophthalmology, 58(6), 469-470. doi:10.4103/0301-4738.71673
New Zealand Guidelines Group. (2008). Identification of common mental disorders and
management of depression in primary care: An evidence-based best practice
guideline. Wellington, New Zealand: Ministry of Health.
Nicolaisen, M., & Thorsen, K. (2014). Who are lonely? Loneliness in different age
groups (18-81 Years Old), using two measures of loneliness. The International
Journal of Aging and Human Development, 78(3), 229-257. doi:
10.2190/AG.78.3.b

116
Nikmat, A. W., Hashim, N. A., Omar, S. A., & Salmi, R. (2015). Depression and
loneliness/social isolation among patients with cognitive impairment in nursing
home. ASEAN Journal of Psychiatry, 16(2).
Nyqvist, F., Cattan, M., Andersson, L., Forsman, A. K., & Gustafson, Y. (2013). Social
capital and loneliness among the very old living at home and in institutional
settings: A comparative study. Journal of Aging and Health, 1-23. doi:
10.1177/0898264313497508
O'Bryant, S. E., Humphreys, J. D., Smith, G. E., Ivnik, R. J., Graff-Radford, N. R.,
Petersen, R. C., & Lucas, J. A. (2008). Detecting dementia with the mini-mental
state examination (MMSE) in highly educated individuals. Archives in
Neurology. 65(7): 963–967. doi:10.1001/archneur.65.7.963.
Pallant, J. (2016). SPSS survival manual: A step by step guide to data analysis using
IBM SPSS. (6th ed.). New South Wales, Australia: Allen & Unwin.
Pallant, J. (2013). SPSS survival manual: A step by step guide to data analysis using
IBM SPSS. (5th ed.). New South Wales, Australia: Allen & Unwin.
Penning, M. J., Liu, G., & Chou, P. H. B. (2013). Measuring loneliness among middle-
aged and older adults: The UCLA and De Jong Gierveld loneliness scales.
Social Indicators Research, 118(3), 1147-1166. doi: 10.1007/s11205-013-0461-
1
Pressman, S. D., Cohen, S., Miller, G. E., Barkin, A., Rabin, B. S., & Treanor, J. J.
(2005).Loneliness, social network size, and immune response to influenza
vaccination in college freshmen. Health Psychology, 24(3), 297e306.
Prieto-Flores, M. E., Forjaz, M. J., Fernandez-Mayoralas, G., Rojo-Perez, F., &
Martinez-Martin, P. (2011). Factors associated with loneliness of
noninstitutionalized and institutionalized older adults. Journal of Aging Health,
23(1), 177-194. doi: 10.1177/0898264310382658
RAND Corporation (2016). 36-Item short form survey (SF-36). Retrieved from
http://www.rand.org/health/surveys_tools/mos/mos_core_36item.html

117
Reed, S. B., Crespo, C. J., Harvey, W., & Andersen, R. E. (2011). Social isolation and
physical inactivity in older US adults: Results from the third national health and
nutrition examination survey. European Journal of Sport Science, 11(5), 347-
353. doi: 10.1080/17461391.2010.521585
Rueggeberg, R., Wrosch, C., Miller, G. E., & McDade, T. W. (2012). Associations
between health-related self-protection, diurnal cortisol, and C-reactive protein in
lonely older adults. Psychosomatic Medicine, 74(9), 937-944. doi:
10.1097/PSY.0b013e3182732dc6
Russell, D. (1996). UCLA loneliness scale (version 3): Reliability, validity, and factor
structure. Journal of Personality Assessment, 66, 20-40.
Savikko, N., Routasalo, P., Tilvis, R. S., Strandberg, T. E., & Pitkälä, K. H. (2005).
Predictors and subjective causes of loneliness in an aged population. Archives of
Gerontology and Geriatrics, 41, 223-233.
Schneider, Z., Whitehead, D., Elliott, D., LoBiondo-Wood, G., & Haber, J. (2007).
Nursing & midwifery research: Methods and appraisal for evidence-based
practice. (3rd ed.). New South Wales, Australia: Elsevier Australia.
Shankar, A., McMunn, A., Banks, J., & Steptoe, A. (2011). Loneliness, social isolation,
and behavioral and biological health indicators in older adults. Health
Psychology, 30(4), 377-385. doi: 10.1037/a0022826
Sheikh, J. I. & Yesavage, J. A. (1986). Geriatric depression scale: Recent evidence and
development of a shorter version. In T. L. Brink (Eds.), Clinical gerontology: A
guide to assessment and intervention (pp. 165–173). New York, NY: Haworth
Press.
Singh, K. (2007). Quantitative social research methods. Retrieved from
https://books.google.co.nz
Smalbrugge, M., Jongenelis, L., Pot, A. M., Beekman, A. T., & Eefsting, J. A. (2008).
Screening for depression and assessing change in severity of depression. Is the
geriatric depression scale (30-, 15- and 8-item versions) useful for both purposes

118
in nursing home patients?. Aging and Mental Health, 12, 244–248. doi:
10.1080/13607860801987238
Statistics New Zealand (2015). Living outside the norm: An analysis of people living in
temporary and communal dwellings, 2013 Census. Retrieved from
www.stats.govt.nz
Statistics New Zealand (2013). Loneliness in New Zealand: Findings from the 2010 NZ
General Social Survey. Retrieved from www.stats.govt.nz.
Stephens, C., Alpass, F., Towers, A., & Stevenson, B. (2011). The effects of types of
social networks, perceived social support, and loneliness on the health of older
people: Accounting for the social context. Journal of Aging and
Health, 23(6), 887–911.
Stoltzfus, J. C. (2011). Logistic regression: A brief primer. Academic Emergency
Medicine, 18(10): 1099-104. doi: 10.1111/j.1553-2712.2011.01185.x.
Strauss, H., Leathem, J., Humphries, S., & Podd, J. (2012). The use of brief screening
instruments for age related cognitive impairment in New Zealand. New Zealand
Journal of Psychology. 41(2): 13-22.
Sullivan, G. M., & Feinn, R. (2012). Using effect size - or why the p value is not
enough. Journal of Graduate Medical Education, 4(3), 279-282.
doi:10.4300/JGME-D-12-00156.1
Tabachnick, B. G. & Fidell, L. S. (2013). Using multivariate statistics (6th ed.). United
States of America: Pearson Education, Inc.
Tavakol, M. (2011). Making sense of Cronbach’s alpha. International Journal of
Medical Education. 2: 53-55. doi: 10.5116/ijme.4dfb.8dfd
Theeke, L. A. (2010). Sociodemographic and health-related risks for loneliness and
outcome differences by loneliness status in a sample of U.S. older adults.
Research in Gerontological Nursing, 3(2), 113-125. doi: 10.3928/19404921-
20091103-99

119
Tombaugh, T. N., & McIntyre, N. J. (1992). The mini-mental state examination: A
comprehensive review. Journal of the American Geriatrics Society, 40: 922–
935. doi: 10.1111/j.1532-5415.1992.tb01992.x
Van Beljouw, I. M., Van Exel, E., De Jong Gierveld, J., Comijs, H. C., Heerings, M.,
Stek, M. L., & van Marwijk, H. W. (2014). "Being all alone makes me sad":
loneliness in older adults with depressive symptoms. International
Psychogeriatrics, 1-11. doi: 10.1017/S1041610214000581
Van Tilburg, T. & De Jong Gierveld, J. (2010). The De Jong Gierveld short scales for
emotional and social loneliness: Tested on data from 7 countries in the UN
generations and gender surveys. European Journal of Ageing, 7(2), 121-130.
doi: 10.1007/s10433-010-0144-6
Victor, C. R., & Bowling, A. (2012). A longitudinal analysis of loneliness among older
people in Great Britain. Journal of Psychology, 146(3), 313-331. doi:
10.1080/00223980.2011.609572
Weeks, D. G., Michela, J. L., Peplau, L. A., & Bragg, M. E. (1980). Relation between
loneliness and depression: A structural equation analysis. Journal of Personality
and Social Psychology, 39, 1238-1244.
Weiss, R. S. (1974). The provisions of social relationships. In Z. Rubin (Eds.), Doing
unto others (pp. 17-26). Englewood Cliffs, NJ: Prentice-Hall.
Wright, J. (2000). The FIM™. The centre for outcome measurement in brain injury.
http://www.tbims.or/combi/FIM