Embed Size (px)
Citation preview
The Climate Decade: Changing Attitudes on Three Continents Fredrik Carlsson, Mitesh Kataria, Alan Krupnick, Elina Lampi, Åsa Löfgren, Ping Qin, Thomas Sterner, and Xiaojun Yang
Working Paper 21-02
January 2021
Resources for the Future i
About the Authors
Fredrik Carlsson: Department of Economics, University of Gothenburg, Box 640, SE-
40530 Gothenburg, Sweden (email: [email protected])
Mitesh Kataria: Department of Economics, University of Gothenburg, Box 640, SE-
40530 Gothenburg, Sweden (email: [email protected])
Alan Krupnick: Resources for the Future, 1616 P St., NW, Washington, DC 20036,
USA (email: [email protected])
Elina Lampi: Department of Economics, University of Gothenburg, Box 640, SE-
40530 Gothenburg, Sweden (email: [email protected])
Åsa Löfgren: Department of Economics, University of Gothenburg, P.O. Box 640, S-
405 30 Gothenburg, Sweden (email: [email protected])
Ping Qin: School of Applied Economics, Renmin University of China, China (email:
Thomas Sterner: Department of Economics, University of Gothenburg, Box 640, SE-
40530 Gothenburg, Sweden (email: [email protected])
Xiaojun Yang: School of Public Policy and Administration, Xi'an Jiaotong University,
China (email: [email protected])
Acknowledgments
The authors acknowledge financial support from the Mistra Carbon Exit research
program (the Swedish Foundation for Strategic Environmental Research) and
Swedish Energy Agency project 46167-1. We have received valuable comments from
two anonymous reviewers, participants of the RWI Empirical Environmental
Economics Workshop in Essen, and seminar participants at Umeå University and
University of Gothenburg.
The Climate Decade: Changing Attitudes on Three Continents ii
About RFF
Resources for the Future (RFF) is an independent, nonprofit research institution in
Washington, DC. Its mission is to improve environmental, energy, and natural
resource decisions through impartial economic research and policy engagement.
RFF is committed to being the most widely trusted source of research insights and
policy solutions leading to a healthy environment and a thriving economy.
Working papers are research materials circulated by their authors for purposes of
information and discussion. They have not necessarily undergone formal peer
review. The views expressed here are those of the individual authors and may differ
from those of other RFF experts, its officers, or its directors.
Sharing Our Work
Our work is available for sharing and adaptation under an Attribution-
NonCommercial-NoDerivatives 4.0 International (CC BY-NC-ND 4.0) license. You
can copy and redistribute our material in any medium or format; you must give
appropriate credit, provide a link to the license, and indicate if changes were made,
and you may not apply additional restrictions. You may do so in any reasonable
manner, but not in any way that suggests the licensor endorses you or your use. You
may not use the material for commercial purposes. If you remix, transform, or build
upon the material, you may not distribute the modified material. For more
information, visit https://creativecommons.org/licenses/by-nc-nd/4.0/.
Resources for the Future iii
Abstract
Using identical surveys a decade apart, we examine how attitudes and willingness to pay (WTP) for climate policies have changed in the United States, China, and Sweden. All three countries exhibit an increased willingness to pay for climate mitigation. Ten years ago, Sweden had a larger fraction of believers in anthropogenic climate change and a higher WTP for mitigation, but today the national averages are more similar. Although we find convergence in public support for climate policy across countries, there is considerable divergence in both WTP and climate attitudes within countries. Political polarization explains part of this divergence.
Keywords: Climate change, willingness to pay, climate policy attitudes, political polarization, multicountry, China, United States, Sweden
JEL Classification: Q51, Q54
The Climate Decade: Changing Attitudes on Three Continents iv
Contents
1. Introduction 1
2. Survey Design 5
3. Results 10
3.1. Respondent Characteristics 10
3.2. Attitudes toward Climate Change and Climate Policies 10
3.3. Willingness to Pay for Reducing Greenhouse Gas Emissions 13
3.4. WTP for Reducing Greenhouse Gas Emissions and the Social Cost of Carbon 14
4. Econometric Analysis 16
4.1. Changes in WTP And Determinants of WTP 16
4.2. Political Polarization and Climate Policy 20
5. Conclusions and Implications for Global Climate Policy 25
6. References 28
Appendix A 32
Online Appendix. Assumptions And Conversion Of Monthly Household Willingness to Pay (WTP) to WTP/Ton CO2 46
Resources for the Future 1
1. Introduction
The last decade can surely be called the Climate Decade. High temperatures and
carbon dioxide (CO2) emissions have set new records, but effective political action
has proven elusive. Despite strong scientific evidence of the risks of continued
warming and substantial progress with renewable energy, little overall progress has
been made toward a coherent set of global climate policies. The only signature result
has been the 2015 Paris Agreement. While many individual countries and regions
have implemented various policies, ranging from energy efficiency standards to
carbon pricing, the scope is often too narrow, and policies remain too weak to deliver
on the objectives of the Paris Agreement (World Bank, 2019). There are many
reasons why policies have or have not been implemented and why there is a lack of
stricter global agreements. One important reason is that climate change has the
characteristics of an international social dilemma, where countries have to make
sacrifices for the collective good (i.e., the global climate system) but, given ample
free-riding possibilities, are hesitant to do so. Since mitigating climate change
involves economic costs today with mainly collective benefits in the future, political
leaders in democratic countries face challenges in legitimizing such costs to their
electorates. A vast body of literature explains the difficulty in agreeing on top-down
global policies and effort-sharing rules (see, e.g., Keohane, 2011).
Our study examines whether the increasing warning signs over the last decade that
the earth is warming are matched by citizens’ demand for stronger policy action.
Specifically, we address three important questions: (i) how much citizens are willing
to pay for reducing CO2 emissions, (ii) whether citizens’ willingness to pay (WTP) has
changed over the past decade, and (iii) whether political polarization has increased
or decreased when it comes to opinions on climate policies and preferences for
decreasing CO2 emissions. We do this in three key geographies: the United States,
China, and Europe (represented in this case by Sweden).
To answer these three questions, we estimate WTP across the three continents in
both 2009 and 2019, using the same survey design and the same method
(contingent valuation). This comparison with consistent methodology provides a
unique opportunity to investigate whether attitudes and WTP have changed both
within each country and across the three countries over the decade since the
Copenhagen Accord. To our knowledge, this kind of comparison over time has not
been undertaken before.
The Climate Decade: Changing Attitudes on Three Continents 2
In our comparative study from 2009 (Carlsson et al., 2012), we found that Americans
and Chinese citizens were willing to give up about the same percentage of their
income for reducing carbon emissions (controlling for income differences), while
Swedes were willing to give up a larger fraction of their income. A larger share of
Americans were skeptical of climate change and the responsibility of human
activities, compared with the Chinese and Swedes. Since that study, a number of
cross-country studies have been conducted, several of which include comparisons of
US and Chinese citizens (see, e.g., Jamelske et al., 2015; Ziegler, 2017; Schwirplies,
2018; Winden et al., 2018).
Attitudinal changes over time could result from many causes, including increasing
political polarization. In the United States, the climate debate has long been
polarized between Republicans and Democrats, even well before 2009 (Malka et al.,
2009), and in Sweden, signs of increased polarization between sympathizers of
different political parties regarding environmental and climate issues have emerged
over the last decade (Martinsson and Weissenbilder, 2019). Guber (2013) warns that
polarization allows political parties to frame the debate over climate change, with
troubling implications. Political polarization could lead to political inaction or weak
policies and shift the focus from climate to ideology (Hoffman, 2011). Notably, the
United States under the Trump administration has withdrawn from the Paris
Agreement, although the incoming Biden administration has announced that the
country will immediately rejoin. The election outcome may well be one of the most
significant factors in addressing global climate change during the coming decade.
While previous literature has investigated the relationship between WTP for climate
policies and political affiliation (Ziegler, 2017; Hornsey et al., 2016; Hornsey et al.,
2018) and attitudes and beliefs (Schwirplies, 2018), we instead investigate political
polarization related to climate policy and whether this relationship has changed
during the past decade. The importance of political ideology in affecting willingness
to pay for climate change mitigation does not apply only to Americans. As shown by
Hornsey et al. (2016) in a meta-analysis of 171 academic studies across 56 nations,
factors such as education, gender, subjective knowledge about climate change, and
experience of extreme weather events seem to be less important to explain belief in
climate change than ideology, worldview, and political orientation. This result seems
particularly important in light of the increased political polarization and the rise of
populist parties in the United States and Europe over the last decade (Westfall et al.,
2015; Muis and Immerzeel, 2017). Kousser and Tranter (2018) argue that in the
presence of political polarization, when political leaders disagree on issues such as
climate, the electorate also becomes more polarized.
Resources for the Future 3
Our results show that 10 years ago, Sweden stood out, with a larger fraction of
believers in anthropogenic climate change and a higher WTP for mitigation. Over the
last decade, there have been greater increases in both of these measures in China
and the United States, so today the national averages are much more similar. These
results are in line with the picture given by individual studies conducted in these
countries during the last decade. In particular, there seems to be a trend that
Chinese citizens have increased their WTP over time. For example, in the 2018 study
by Winden and colleagues, Chinese WTP was more than twice that of their US
counterparts (in purchasing power parity terms). Notably, the levels of WTP in 2019
in the three different countries compare closely to conventional measures of the
social cost of carbon in China and the United States and to current carbon taxes in
Sweden. This is further discussed in both the results and the conclusions sections.
We also find that there is a considerable heterogeneity within the countries, with
respect to both attitudes and, more importantly, political affiliation. In both the
United States and Sweden, we find a left-right difference in WTP. In the United
States, the average WTP of self-identified Republicans is significantly lower than
that of people affiliated with other parties, especially Democrats. This is clearly in
line with the findings of previous studies, such as Ziegler (2017). Schwirplies (2018)
investigates China and the United States (as well as Germany) and finds that
political attitudes and socioeconomic characteristics are the main sources of cross-
country heterogeneity. Hornsey and colleagues (2018) find that the correlation
between climate skepticism and ideology is both stronger and more consistent in
the United States than in 24 other countries. In China, those who are members of the
Communist Party have a higher WTP, confirming the previous findings by Ziegler
(2017).
Finally, the political divide between Republicans and Democrats in terms of climate
policy already existed in 2009, and we find sizable but statistically insignificant
changes in polarization in the whole sample of US respondents. This is consistent
with the studies on climate attitudes in the United States by Jon Krosnick (PPRG,
2018). Krosnick finds that the partisanship gap in climate beliefs between
Republicans and Democrats has been essentially constant since 2011, although it has
increased by a small percentage from 2009. However, in our study there is some
evidence of increased polarization in the United States if we look at the number of
respondents who are not willing to pay anything to decrease carbon dioxide
emissions. We find that among self-identified Republicans, this share is large and
stable over time, while the corresponding shares among Democrats and
independents have significantly decreased further during the past decade. This is an
indication of increased polarization between Republicans and others within this
The Climate Decade: Changing Attitudes on Three Continents 4
dimension (zero WTP). In Sweden, our results provide stronger evidence of
increased polarization with respect to WTP for a stricter climate policy. We find an
increasing polarization between left-wing and right-wing voters, and the share of
right-wing voters with a zero WTP is significantly larger than the corresponding
shares of other voters. Still, it should be noted that in both Sweden and the United
States, there is still an overall increase in support for climate policy over the last
decade.
The rest of the paper is organized as follows: In section II we describe the design of
the studies in 2009 and 2019. In section III we present the results, and in section IV
we discuss our findings and their implications.
Resources for the Future 5
2. Survey Design
To be able to rule out that any changes across time are not due to changes in the
survey design, we used, as far as possible, the same survey in both 2009 and 2019.
This comes at a potential cost because the standards for survey design have
changed during the last 10 years. However, since the focus of the current study is on
comparisons across time, this should not be of any major concern. One of the very
few differences between the surveys is that the 2009 survey was longer than the
2019 survey. More specifically, the 2009 survey included a section at the end that
was not relevant for the current study.1 Following are descriptions of the three
segments of questions that were included in both the 2009 and 2019 surveys.
In the first segment, we asked general questions about climate change to establish
the degree to which respondents are climate change deniers. We asked whether
respondents believed that the world’s average temperature has increased during the
past 100 years, and if so, whether this increase has been caused by human behavior.
We also asked whether respondents believed that climate change is inevitable or
that there are actions that can reduce or stop it.
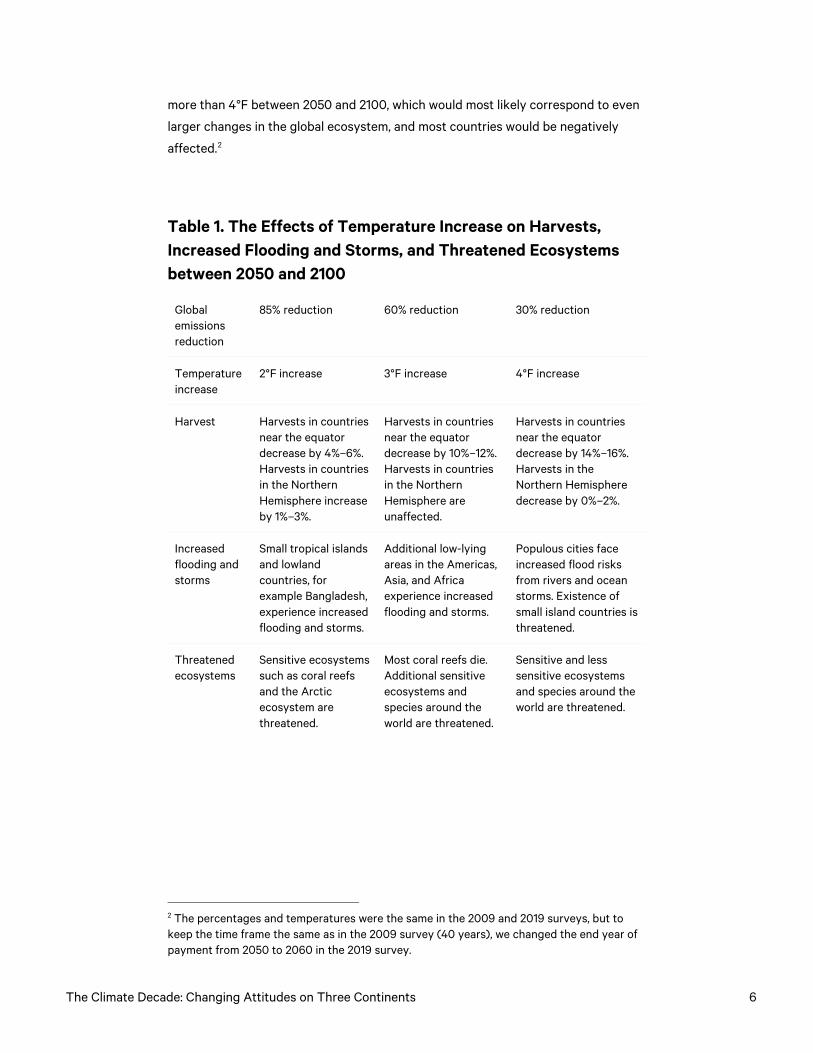
In the second segment, we provided information about how different levels of global
temperature increases would affect environmental outcomes sensitive to climate
change, such as harvests, flooding, storms, and threatened ecosystems. This
information was based on a set of UN Intergovernmental Panel on Climate Change
(IPCC) reports from 2008. Furthermore, we gave the respondents the following
information: “There are a small number of experts who disagree with the IPCC
consensus, but because the IPCC represents the large majority of climate
researchers, this survey will use information from the IPCC.” To keep the information
as simple as possible and understandable for respondents without statistical
literacy, we did not communicate any additional uncertainties. We explained that the
temperature increase depends on the quantity of future global CO2 emissions. To
limit the temperature increase to just 2°F, 3°F, or 4°F, yearly CO2 emissions would
need to be decreased from current levels. The information given to the respondents
is shown in Table 1. The respondents were given the information that CO2 reductions
of 30, 60, and 85 percent correspond to temperature increases of 4°F, 3°F, and 2°F,
respectively. In addition, we noted that if the world does not reduce emissions and
continues with business as usual, the IPCC experts predict a temperature increase of
1 The section at the end of the 2009 survey was reported in Carlsson et al. (2013), and analyzed respondents’ preferences for how to divide the global costs to decrease CO2 emissions among different countries.
The Climate Decade: Changing Attitudes on Three Continents 6
more than 4°F between 2050 and 2100, which would most likely correspond to even
larger changes in the global ecosystem, and most countries would be negatively
affected.2
Table 1. The Effects of Temperature Increase on Harvests, Increased Flooding and Storms, and Threatened Ecosystems between 2050 and 2100
Global emissions reduction
85% reduction 60% reduction 30% reduction
Temperature increase
2°F increase 3°F increase 4°F increase
Harvest Harvests in countries near the equator decrease by 4%–6%. Harvests in countries in the Northern Hemisphere increase by 1%–3%.
Harvests in countries near the equator decrease by 10%–12%. Harvests in countries in the Northern Hemisphere are unaffected.
Harvests in countries near the equator decrease by 14%–16%. Harvests in the Northern Hemisphere decrease by 0%–2%.
Increased flooding and storms
Small tropical islands and lowland countries, for example Bangladesh, experience increased flooding and storms.
Additional low-lying areas in the Americas, Asia, and Africa experience increased flooding and storms.
Populous cities face increased flood risks from rivers and ocean storms. Existence of small island countries is threatened.
Threatened ecosystems
Sensitive ecosystems such as coral reefs and the Arctic ecosystem are threatened.
Most coral reefs die. Additional sensitive ecosystems and species around the world are threatened.
Sensitive and less sensitive ecosystems and species around the world are threatened.
2 The percentages and temperatures were the same in the 2009 and 2019 surveys, but to keep the time frame the same as in the 2009 survey (40 years), we changed the end year of payment from 2050 to 2060 in the 2019 survey.
Resources for the Future 7
After presenting this information, the survey included a set of attitudinal questions
about how the respondent’s own country should decrease CO2 emissions and
whether it should reduce these emissions even if other countries do not. The
segment ended with a cheap talk script,3 followed by three WTP questions asking
the respondents to state their household’s maximum monthly willingness to pay to
decrease CO2 emissions by 30, 60, and 85 percent (in both surveys, the payment
time frame was 40 years). The first WTP question asked respondents how much
their household would be willing to pay for a 30 percent reduction compared with no
reduction at all (business as usual). The second question asked respondents how
much more their household would pay for a 60 percent reduction instead of the 30
percent reduction. The final WTP question asked them how much more their
household would be willing to pay for an 85 percent reduction compared with the 60
percent reduction.
A payment card with 24 bids was used when eliciting WTP. The highest bid was
$220, and those who were willing to pay more than that could state their WTP in an
open-ended payment question. Respondents who stated zero WTP were also asked
all three WTP questions. In each WTP question, total monthly and yearly costs were
shown to the respondents to make sure that they understood the consequence of
their answers. The payment vehicle for obtaining the different reductions was
increases in energy costs, such as through higher electricity and gasoline prices
(adjusted for inflation). Respondents were also told that the costs of reducing CO2
emissions would be shared among the countries according to their current
emissions. There were several reasons for using the payment card format. First,
there was a clear risk of a poor bid-vector design for at least one country if we would
use a closed-ended format, given the uncertainties about the underlying true WTP
function. Second, respondents could be uncertain about their WTP, and a payment
card format that allows for a wider range of response compared with a discrete
choice format could therefore be preferred (Welsh and Poe, 1998). Finally, prior
3 The cheap talk script read, “Before making your choices, please consider how an increased cost would affect your possibilities for buying other things. Previous studies of this kind have shown that people claim to be willing to pay more money than they actually would in a real situation. It is important to us that you answer the questions in this study as truthfully as possible.” As Johnston and colleagues. (2017) discuss, the use of cheap talk is potentially problematic, particularly if it affects the perceived consequentiality for some respondents. However, since the script was included in the study conducted in 2009, we decided to keep it in the 2019 study as well. It should be noted that respondents were told that the purpose of the study was to design better climate policies. We therefore have no reason to believe that respondents viewed our study as less consequential than other, similar types of studies, but we did not include any follow-up question on perceived consequentiality (Vossler et al., 2012) or vary the message regarding consequentiality of the survey (Meginnis et al., 2018; Zawojska et al., 2019).
The Climate Decade: Changing Attitudes on Three Continents 8
experience with administering both closed-ended and payment card questions in
China (Krupnick et al., 2010) led us to favor the latter, based on performance of
external scope tests.
The third (and final) segment of the survey included background questions for
respondents, mainly about socioeconomic characteristics such as gender, age,
education, occupation, and income.
The first study was conducted in November–December 2009. The Chinese survey
was administered in four cities: Beijing, Nanning, Jiujiang, and Chonqging.
Respondents were randomly selected using neighborhood-based databases, and
they were invited to take the survey in special rooms with laptops. These cities were
chosen by the Chinese government’s Ministry of the Environment (now Ministry of
Ecology and Environment) as broadly representative of Chinese cities in terms of
size, location, and income (Krupnick et al., 2010). The US and Swedish respondents
answered the survey online and were recruited through two large online panels. The
2009 survey yielded 1,221 usable responses in Sweden, 989 in the United States, and
1,264 in China.
The second study was conducted as a web survey during February–April 2019 in all
three countries. Before the main study, a pilot study was conducted in each country.
The 2019 survey yielded 1,480 usable responses in Sweden, 1,436 in the United
States, and 1,557 in China.4 The Swedish and US respondents were recruited from
random samples of a representative panel from each population.5 The Chinese
respondents were recruited from a panel that gave the opportunity to sample from
the same four cities as in the 2009 survey. The 2019 panel in China had very few
older respondents, creating differences between the two waves in China. To be able
to compare the 2009 and 2019 waves, we decided to make a round of additional data
4 In total, we received 1,497 survey replies from Sweden, 1,461 from the United States, and 1,579 from China in 2019, but some had to be excluded from the study because of missing observations or extreme values of stated WTP (>$220 per month). The 2009 survey had 1,229 responses in Sweden, 1,000 in the United States, and 1,448 in China. 5 The Swedish respondents were representative in terms of age, gender, median income, and geography when compared with numbers at the national level (Statistics Sweden, 2018a, b, c), but university-educated respondents were overrepresented (Statistics Sweden, 2018d). The respondents from the US panel were representative in terms of age (CIA, 2018a), gender (US Census Bureau, 2018a), and geography (US Census Bureau, 2018b), but the share of university-educated respondents was too large compared with numbers at the national level (US Census Bureau, 2019). For China, the share of young people was overrepresented compared with national statistics (CIA, 2018b).
Resources for the Future 9
collection in China in which we targeted older respondents. This data collection was
done in December 2019.6
Participants in China were invited to take the survey in special rooms with laptops to
collect data in 2009, whereas a web-based survey was used in 2019, so potential
survey mode effects cannot strictly be excluded. The sense of observability and
importance could presumably be stronger in the 2009 survey. In an extensive
review, however, Lindhjem and Navrud (2011) conclude that the literature reports
similar WTP estimates and no substantial differences between internet surveys and
other survey modes. Our results are that the mean WTPs are substantially higher in
2019 than in 2009, which goes in the opposite direction from any survey mode
effect.
6 An additional 405 interviews in total were conducted on December 2–10, 2019, in Nanning (109), Jiujiang (103), Chongqing (103), and Beijing (90) to complement the data with Chinese respondents age 55 and older. Interviewers visited parks, residential areas, shopping centers, and elderly homes. Representativeness was secured by conducting the interviews in different types of areas and having quotas for age and gender.
The Climate Decade: Changing Attitudes on Three Continents 10
3. Results
3.1. Respondent Characteristics
The econometric analysis is based on 2,458 observations from the United States,
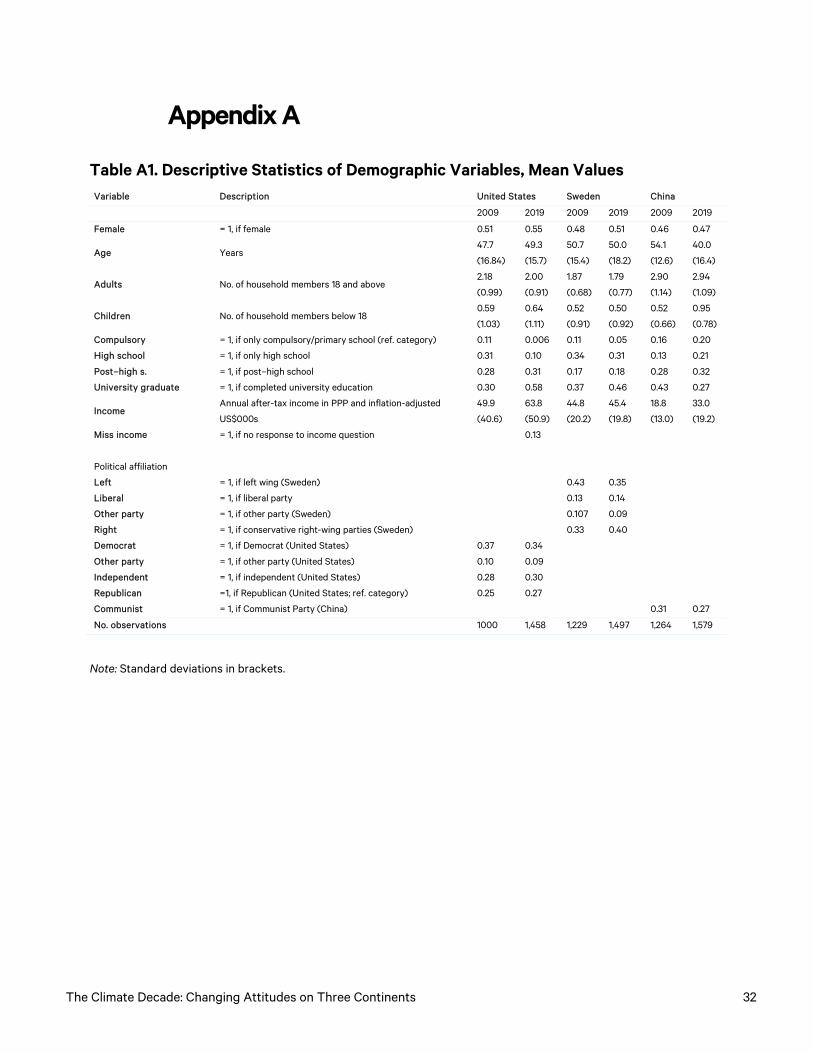
2,726 observations from Sweden, and 2,843 observations from China. Descriptive
statistics for the demographic variables for the three countries in the two waves are
shown in Appendix Table A1. Overall, most demographic variables are stable within
countries across years, with a few exceptions. For both Sweden and the United
States, the 2019 sample includes more university graduates.7 In addition, in Sweden,
political preferences have changed from 2009 to 2019. In particular, support for the
conservative and nationalistic right-wing party, the Sweden Democrats, tripled
during this period (Valmyndigheten, 2019a, b). For the China sample, the main
differences are that monthly income was substantially higher in the 2019 sample and
that the average age was only around 40 years in 2019, whereas it was 54 years in
2009. Note also that the share of members of the Communist Party was relatively
high in both waves, with a national average of around 6 percent, although this is
likely higher in the urban population. In the analysis, we apply survey weights based
on the correct level of educational attainment of the population in all three countries
and in 2009 and 2019, respectively. For the Chinese sample, this also partly dealt
with the overrepresentation of members of the Communist Party, since membership
is more prevalent among those with a higher education. In addition, the main
analysis comparing differences between the two waves controls for respondent
characteristics.
3.2. Attitudes toward Climate Change and Climate Policies
Descriptive statistics of the most important attitudinal variables are presented in
Table 2. The mean values in Table 2 are corrected to account for
nonrepresentativeness of the samples with respect to educational attainment in all
three countries using poststratification weights (see Appendix Table A4).
Differences in means are tested using a Wald chi-squared test.
7 For the Swedish and US samples, the larger shares of university graduates were mostly due to an overrepresentation of respondents with a university degree in the panels (see Appendix Table A2). For the Chinese sample, the overrepresentation of university graduates in our sample was lower in 2019 than in 2009 (see Appendix Table A3).
Resources for the Future 11
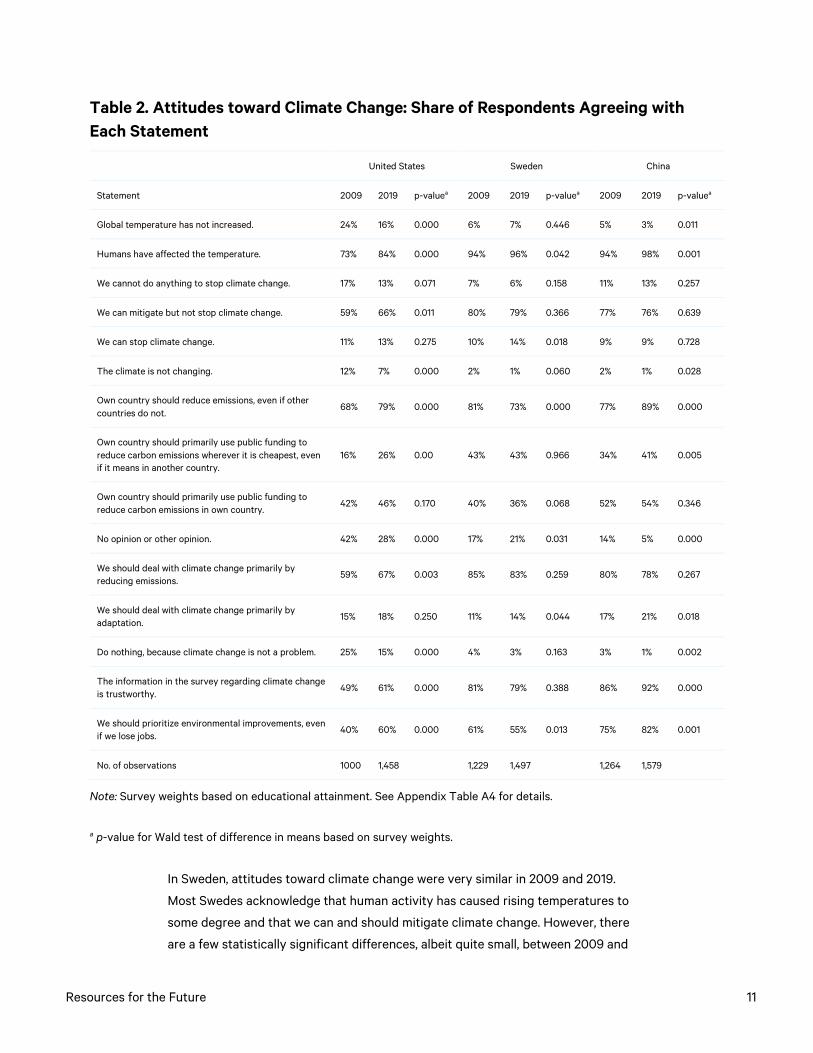
Table 2. Attitudes toward Climate Change: Share of Respondents Agreeing with Each Statement
United States Sweden China
Statement 2009 2019 p-valuea 2009 2019 p-valuea 2009 2019 p-valuea
Global temperature has not increased. 24% 16% 0.000 6% 7% 0.446 5% 3% 0.011
Humans have affected the temperature. 73% 84% 0.000 94% 96% 0.042 94% 98% 0.001
We cannot do anything to stop climate change. 17% 13% 0.071 7% 6% 0.158 11% 13% 0.257
We can mitigate but not stop climate change. 59% 66% 0.011 80% 79% 0.366 77% 76% 0.639
We can stop climate change. 11% 13% 0.275 10% 14% 0.018 9% 9% 0.728
The climate is not changing. 12% 7% 0.000 2% 1% 0.060 2% 1% 0.028
Own country should reduce emissions, even if other countries do not.
68% 79% 0.000 81% 73% 0.000 77% 89% 0.000
Own country should primarily use public funding to reduce carbon emissions wherever it is cheapest, even if it means in another country.
16% 26% 0.00 43% 43% 0.966 34% 41% 0.005
Own country should primarily use public funding to reduce carbon emissions in own country.
42% 46% 0.170 40% 36% 0.068 52% 54% 0.346
No opinion or other opinion. 42% 28% 0.000 17% 21% 0.031 14% 5% 0.000
We should deal with climate change primarily by reducing emissions.
59% 67% 0.003 85% 83% 0.259 80% 78% 0.267
We should deal with climate change primarily by adaptation.
15% 18% 0.250 11% 14% 0.044 17% 21% 0.018
Do nothing, because climate change is not a problem. 25% 15% 0.000 4% 3% 0.163 3% 1% 0.002
The information in the survey regarding climate change is trustworthy.
49% 61% 0.000 81% 79% 0.388 86% 92% 0.000
We should prioritize environmental improvements, even if we lose jobs.
40% 60% 0.000 61% 55% 0.013 75% 82% 0.001
No. of observations 1000 1,458 1,229 1,497 1,264 1,579
Note: Survey weights based on educational attainment. See Appendix Table A4 for details.
a p-value for Wald test of difference in means based on survey weights.
In Sweden, attitudes toward climate change were very similar in 2009 and 2019.
Most Swedes acknowledge that human activity has caused rising temperatures to
some degree and that we can and should mitigate climate change. However, there
are a few statistically significant differences, albeit quite small, between 2009 and
The Climate Decade: Changing Attitudes on Three Continents 12
2019. Most of these indicate that Swedish respondents are now somewhat less
committed to certain climate change policies. For example, fewer respondents in
2019 thought that Sweden should prioritize the environment even if that means lost
jobs (a decrease by 6 percentage points).
Several prominent and significant attitude changes occurred among the US
respondents between 2009 and 2019, most of which were likely to make them more
positive toward climate change policies. For instance, the share of people who
acknowledge an increase in average global temperature rose by 8 percentage points,
and the share who believe that humans have contributed to this rose by 11
percentage points. While the share of Swedish citizens who want their own country
to reduce CO2 emissions, even if other countries do not, has significantly decreased
during the past 10 years (81 versus 73 percent), the pattern is the opposite in the
United States. In 2019, about 79 percent of US citizens in supported this position,
while the corresponding number in 2009 was 68 percent. The largest change in the
US samples was that in 2019, a significantly larger share (60 versus 40 percent) of
US citizens were willing to prioritize the environment even at the expense of lost
jobs.
The Chinese respondents also experienced changes in attitudes regarding climate
change, most being more positive toward climate policies. For example, in 2019, 89
percent of the Chinese respondents thought that their own country should decrease
CO2 emissions even if other countries do not, increasing from 77 percent in 2009.
There was also stronger support for cost-efficient policies and for mitigation policies
in 2019.
Our overarching conclusion is that the populations in these countries are converging
in their attitudes. The Chinese and Americans are becoming more convinced of the
necessity for climate change action and more committed to taking that action.
Comparing across the countries, in general it seems that the Chinese to a greater
extent believe that the climate is changing, followed by the Swedes and Americans.
The Chinese also seemed more favorable in 2019 toward their country acting
independently of what other countries do to reduce carbon emissions (89 percent),
compared with the United States (78 percent) and Sweden (73 percent). In contrast,
in 2009, Swedes were the most positive among the three countries about acting
independently of other countries. However, the largest changes in climate-related
attitudes have occurred in the United States. In the 2009 sample, 24 percent of US
respondents did not believe that the global average temperature had increased, but
in 2019, that share was 16 percent.
Resources for the Future 13
3.3. Willingness to Pay for Reducing Greenhouse Gas Emissions
Table 3 presents household monthly WTP to reduce CO2 emissions by 30, 60, and 85
percent. We use the number each respondent chose from a payment card matrix as
an estimate of their maximum WTP. The WTPs are weighted to adjust for
unrepresentativeness of educational attainment in all three countries (see Appendix
Table A4 for the poststratification weights). Respondents’ WTP is censored at the
highest bid on the payment card.8 For the United States, 1.5 percent of the
respondents exceeded this limit, and for China and Sweden, the corresponding
fractions were 0.8 and 0.9 percent, respectively.
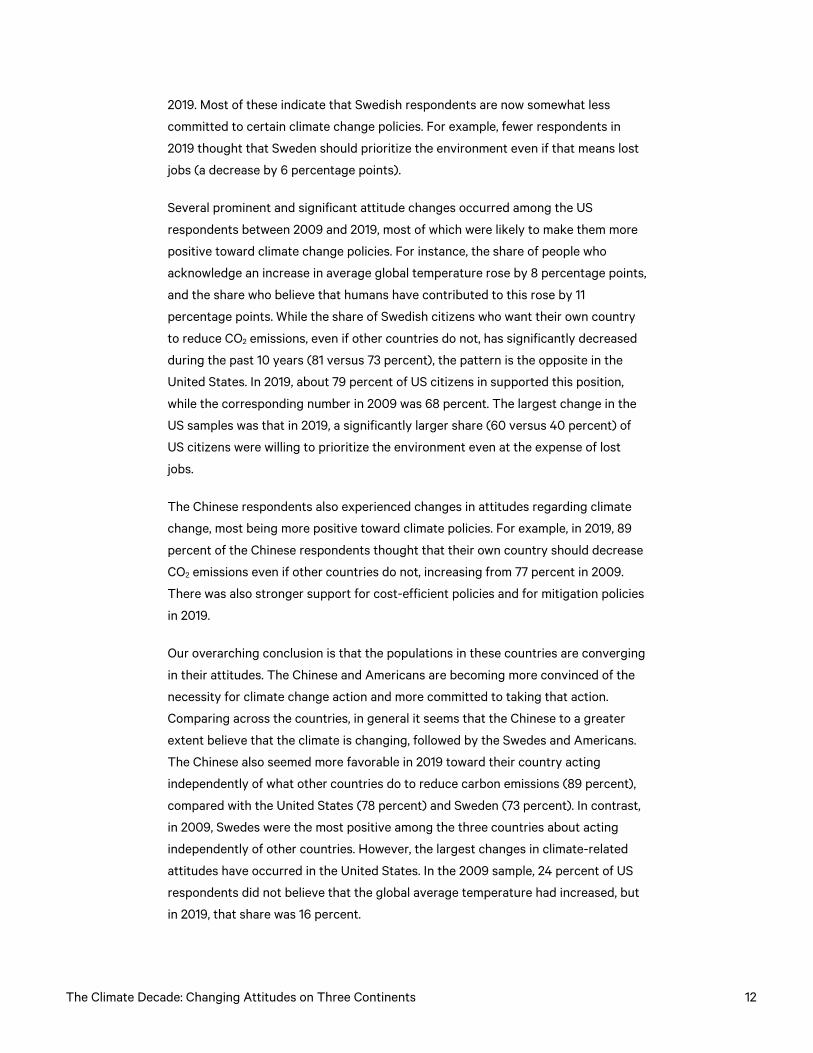
Table 3. Attitudes toward Climate Change: Share of Respondents Agreeing with Each Statement
United States Sweden China
Mean Share zero Share inc. Mean Share zero Share inc. Mean Share zero Share inc.
2019 wave
30% reduction 32 (53) 0.21 0.006 29 (42) 0.14 0.008 24 (40) 0.12 0.009
60% reduction 56 (93) 0.19 0.011 52 (78) 0.12 0.013 49 (78) 0.10 0.018
85% reduction 78 (131) 0.18 0.015 71 (110) 0.12 0.019 75 (118) 0.09 0.027
2009 wave
30% reduction 20 (42) 0.29 0.005 23 (35) 0.10 0.006 6 (9) 0.21 0.003
60% reduction 32 (67) 0.26 0.007 42 (63) 0.08 0.011 10 (16) 0.18 0.006
85% reduction 42 (88) 0.24 0.010 57 (90) 0.08 0.015 13 (23) 0.17 0.008
Note: Survey weights based on educational attainment (see Appendix Table A4). Standard deviation in parentheses.
The WTP estimates increase with increasing CO2 reduction level in all three
countries. In general, the WTP estimates are significantly higher for the 2019 wave
8 We adjusted the WTP for individuals who stated a WTP outside the range of the payment card—that is, those who had a WTP larger than the highest bid of $220 per month (in the US version)—and set it to $220. This was because these individuals represent only a small proportion (≈ 1%) of the population that potentially can have a great influence on the mean WTP. Mean WTP would be substantially lower if we instead exclude these responses, in particular for the United States. However, comparisons across time and between countries still reveal the same pattern, and we would reach the same conclusions as we do with the full set of observations.
The Climate Decade: Changing Attitudes on Three Continents 14
for all three countries and quite similar in absolute values. The mean WTP for the 85
percent reduction levels in 2019 are strikingly similar, at $78 in the United States,
about $71 in Sweden, and $75 in China. For the 85 percent reduction level and from
2009 to 2019, China had the largest increase (477 percent), followed by the United
States (86 percent). The increase in Sweden was relatively modest (25 percent).
Moreover, only 9 percent of the respondents in China were not willing to pay
anything to reduce emissions, compared with 12 percent in Sweden and 18 percent in
the United States. This statistic has risen since 2009 by 4 percentage points (from 8
percent) in Sweden, but it has fallen by 6 percentage points (from 24 percent) in the
United States and by 8 percentage points (from 17 percent) in China. Thus, the
decrease in the fraction of zero WTP responses in the United States and China can
partly explain the increase in their mean WTP, and it is another example of the
convergence across countries we noted in the previous section. One possible
explanation for the decrease in the share of zero WTPs in both China and the United
States is the large and significant change in attitudes toward climate change and
climate policies that we (and others) have documented.
Finally, we also estimate WTP as a share of mean income in each country. We find
that Swedish respondents were willing to pay the largest share of their income in
2009, and the shares were very similar in the United States and China. In 2019, WTP
measured as a share of income was quite similar across the countries for the 30
percent reduction level. However, at the 85 percent reduction level, the Chinese
respondents stand out as willing to pay considerably more, the US respondents had
the lowest value, and the Swedish respondents were intermediate.
3.4. WTP for Reducing Greenhouse Gas Emissions and the Social Cost of Carbon
We now compare our WTP estimates with the social cost of carbon (SCC). The SCC
is the damage from emitting an additional ton of carbon dioxide and is used as a
proxy for the value of reducing carbon emissions in the economics literature (see,
e.g., Greenstone et al., 2013; Pizer et al., 2014; Drupp et al., 2018) as well as in
policymaking, particularly in the United States (see, e.g., NASEM, 2017; OECD, 2018).
Using public data on emissions in combination with population and household
statistics, we perform a simple calculation of willingness to pay per ton of reduced
carbon emissions based on our 30 percent reduction estimates as presented in
Resources for the Future 15
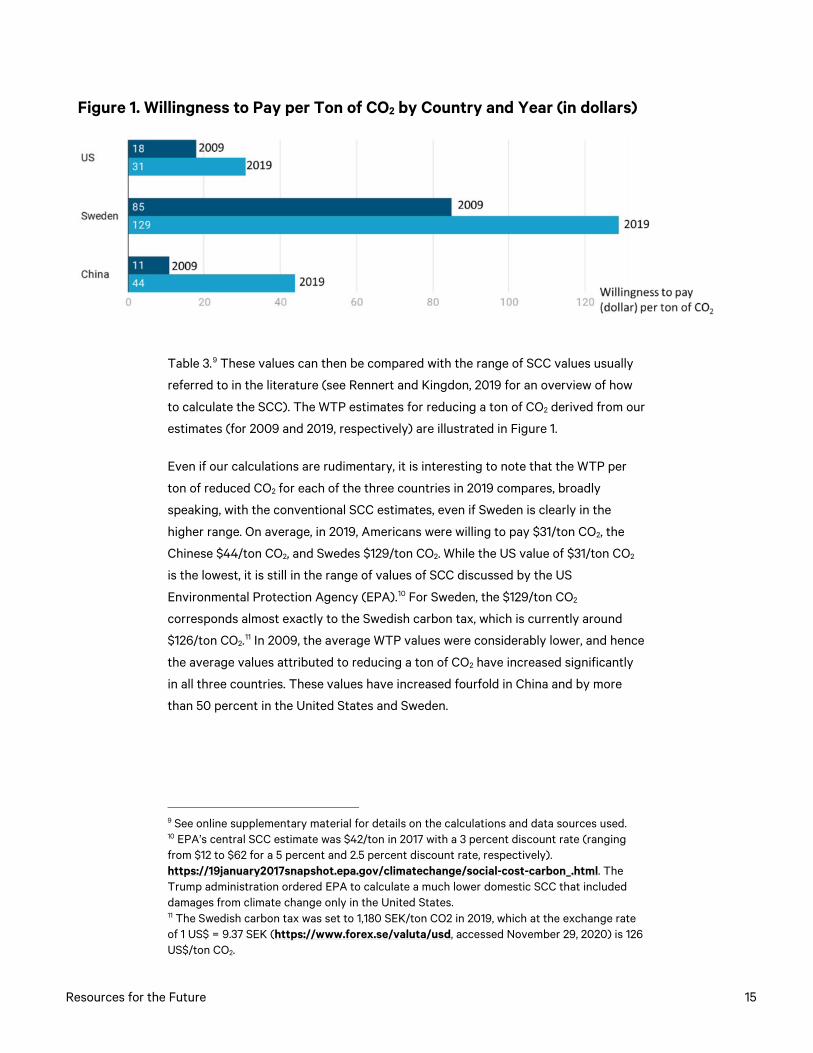
Figure 1. Willingness to Pay per Ton of CO2 by Country and Year (in dollars)
Table 3.9 These values can then be compared with the range of SCC values usually
referred to in the literature (see Rennert and Kingdon, 2019 for an overview of how
to calculate the SCC). The WTP estimates for reducing a ton of CO2 derived from our
estimates (for 2009 and 2019, respectively) are illustrated in Figure 1.
Even if our calculations are rudimentary, it is interesting to note that the WTP per
ton of reduced CO2 for each of the three countries in 2019 compares, broadly
speaking, with the conventional SCC estimates, even if Sweden is clearly in the
higher range. On average, in 2019, Americans were willing to pay $31/ton CO2, the
Chinese $44/ton CO2, and Swedes $129/ton CO2. While the US value of $31/ton CO2
is the lowest, it is still in the range of values of SCC discussed by the US
Environmental Protection Agency (EPA).10 For Sweden, the $129/ton CO2
corresponds almost exactly to the Swedish carbon tax, which is currently around
$126/ton CO2.11 In 2009, the average WTP values were considerably lower, and hence
the average values attributed to reducing a ton of CO2 have increased significantly
in all three countries. These values have increased fourfold in China and by more
than 50 percent in the United States and Sweden.
9 See online supplementary material for details on the calculations and data sources used. 10 EPA’s central SCC estimate was $42/ton in 2017 with a 3 percent discount rate (ranging from $12 to $62 for a 5 percent and 2.5 percent discount rate, respectively). https://19january2017snapshot.epa.gov/climatechange/social-cost-carbon_.html. The Trump administration ordered EPA to calculate a much lower domestic SCC that included damages from climate change only in the United States. 11 The Swedish carbon tax was set to 1,180 SEK/ton CO2 in 2019, which at the exchange rate of 1 US$ = 9.37 SEK (https://www.forex.se/valuta/usd, accessed November 29, 2020) is 126 US$/ton CO2.
The Climate Decade: Changing Attitudes on Three Continents 16
4. Econometric Analysis
To investigate the determinants of WTP and its change over the decade, we pool the
data for the two waves and estimate a model for each of the three countries
separately, using an interval regression model with survey weights to correct for
overrepresentation in educational attainment. The interval model was chosen due to
the payment card structure, which implies that we only know the ordered categories
of WTP but not the exact value of the observation. A dummy variable is included to
indicate the 2019 wave. The dependent variable is the interval for the stated WTP in
PPP-adjusted dollars at 2018 prices. For brevity, we focus on WTP for reducing
emissions by 30 percent compared with the business-as-usual scenario.12
4.1. Changes in WTP and Determinants of WTP
For each country, we estimate five models. The first, and simplest, model includes
only a dummy variable for the 2019 wave as an explanatory variable (model 1). The
model is then expanded with an increasing number of explanatory variables, adding
socioeconomic characteristics (model 2), political attitudes (model 3), attitudes
toward climate change and policy (model 4), and interaction terms with the dummy
variable for the 2019 wave and all other explanatory variables (model 5).13
Full results for models 1–5 for a 30 percent reduction are presented in Appendix
Tables A5–A7. In this section, we focus on the changes in WTP between the two
survey rounds. Table 4 presents the estimates of the difference in WTP between the
two survey waves for models 1–4 for the three countries.
12 Results for 60 and 85 percent reductions for models 1 to 4 are presented in Appendix Tables A8–A10. Results are to a large extent unchanged with respect to statistical significance. 13 Models 2–5 contain a set of location control variables. For the United States, we include four regional dummies, with the Southwest region as the reference region. For China, we include city dummy variables, with Beijing as the reference city. For Sweden, we include dummy variables based on the size of the city in which the respondent lives; in total, there are four groups, and the reference category is living in one of the three biggest cities in Sweden. Notably, bigger cities tend to have higher levels of air pollution, and some regions can be more vulnerable to climate change.
Resources for the Future 17
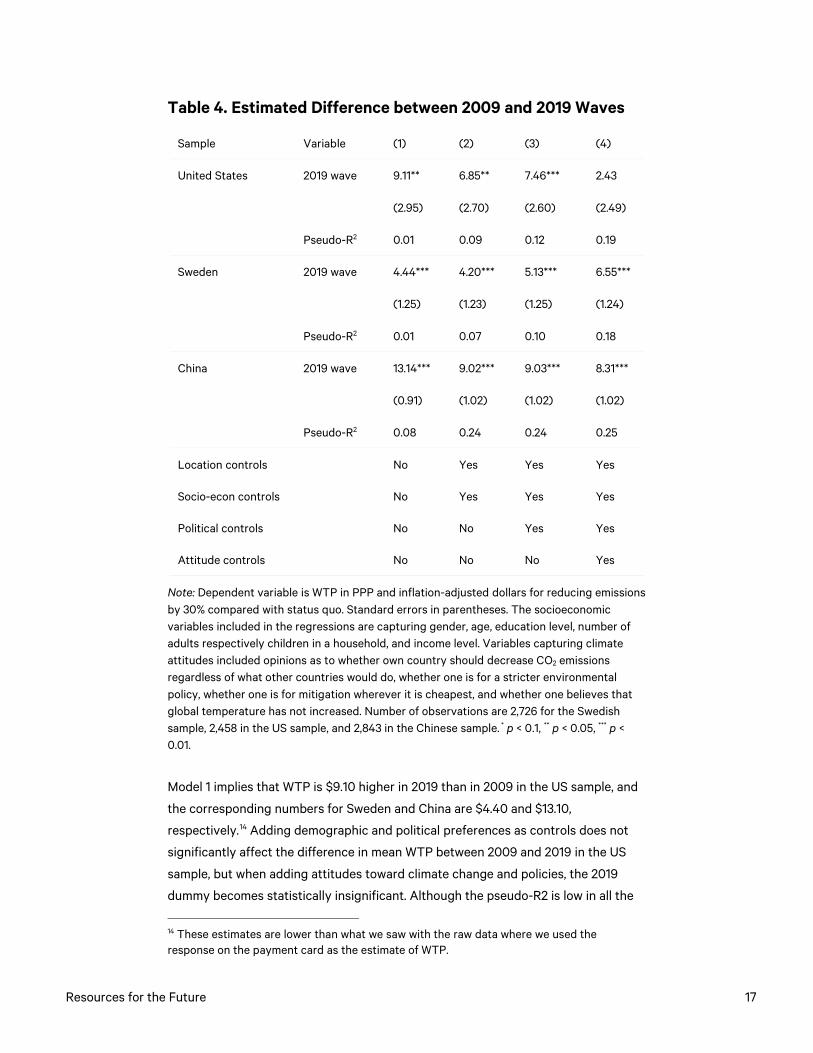
Table 4. Estimated Difference between 2009 and 2019 Waves
Sample Variable (1) (2) (3) (4)
United States 2019 wave 9.11** 6.85** 7.46*** 2.43
(2.95) (2.70) (2.60) (2.49)
Pseudo-R2 0.01 0.09 0.12 0.19
Sweden 2019 wave 4.44*** 4.20*** 5.13*** 6.55***
(1.25) (1.23) (1.25) (1.24)
Pseudo-R2 0.01 0.07 0.10 0.18
China 2019 wave 13.14*** 9.02*** 9.03*** 8.31***
(0.91) (1.02) (1.02) (1.02)
Pseudo-R2 0.08 0.24 0.24 0.25
Location controls No Yes Yes Yes
Socio-econ controls No Yes Yes Yes
Political controls No No Yes Yes
Attitude controls No No No Yes
Note: Dependent variable is WTP in PPP and inflation-adjusted dollars for reducing emissions by 30% compared with status quo. Standard errors in parentheses. The socioeconomic variables included in the regressions are capturing gender, age, education level, number of adults respectively children in a household, and income level. Variables capturing climate attitudes included opinions as to whether own country should decrease CO2 emissions regardless of what other countries would do, whether one is for a stricter environmental policy, whether one is for mitigation wherever it is cheapest, and whether one believes that global temperature has not increased. Number of observations are 2,726 for the Swedish sample, 2,458 in the US sample, and 2,843 in the Chinese sample. * p < 0.1, ** p < 0.05, *** p < 0.01.
Model 1 implies that WTP is $9.10 higher in 2019 than in 2009 in the US sample, and
the corresponding numbers for Sweden and China are $4.40 and $13.10,
respectively.14 Adding demographic and political preferences as controls does not
significantly affect the difference in mean WTP between 2009 and 2019 in the US
sample, but when adding attitudes toward climate change and policies, the 2019
dummy becomes statistically insignificant. Although the pseudo-R2 is low in all the
14 These estimates are lower than what we saw with the raw data where we used the response on the payment card as the estimate of WTP.
The Climate Decade: Changing Attitudes on Three Continents 18
models, there is a sizable increase in the pseudo-R2 when we add the attitudinal
variables for the US sample in model 4. For the Swedish sample, the difference
increases from $4.40 to $5.10 when adding demographic and political preference
controls. Moreover, when we add climate change attitudes, the difference between
2009 and 2019 actually increases to $6.60. Similarly, as for the US sample, adding
the attitudinal variables increases pseudo-R2 significantly in model 4. Finally, for
China, the difference in WTP decreases to about $9.00 if we add demographic and
party membership controls and to $8.30 if we add variables capturing attitudes
toward climate change and policies. Further, the increase in pseudo-R2 comes
mainly from adding demographic variables. For all three countries, a sizable fraction
of the increase in WTP is unexplained even when adding a number of control
variables.
In model 5, we include interaction terms between the dummy variable for the 2019
wave and all other independent variables. An interaction term reveals whether the
increase in WTP from 2009 to 2019 is explained by any of the observable
determinants. For example, if the interaction term between the time dummy and the
female variable were positive and significant, that would mean that the increase in
average WTP between 2009 and 2019 was partly driven by women increasing their
WTP more than men. The full model results are presented in Appendix Tables A5–
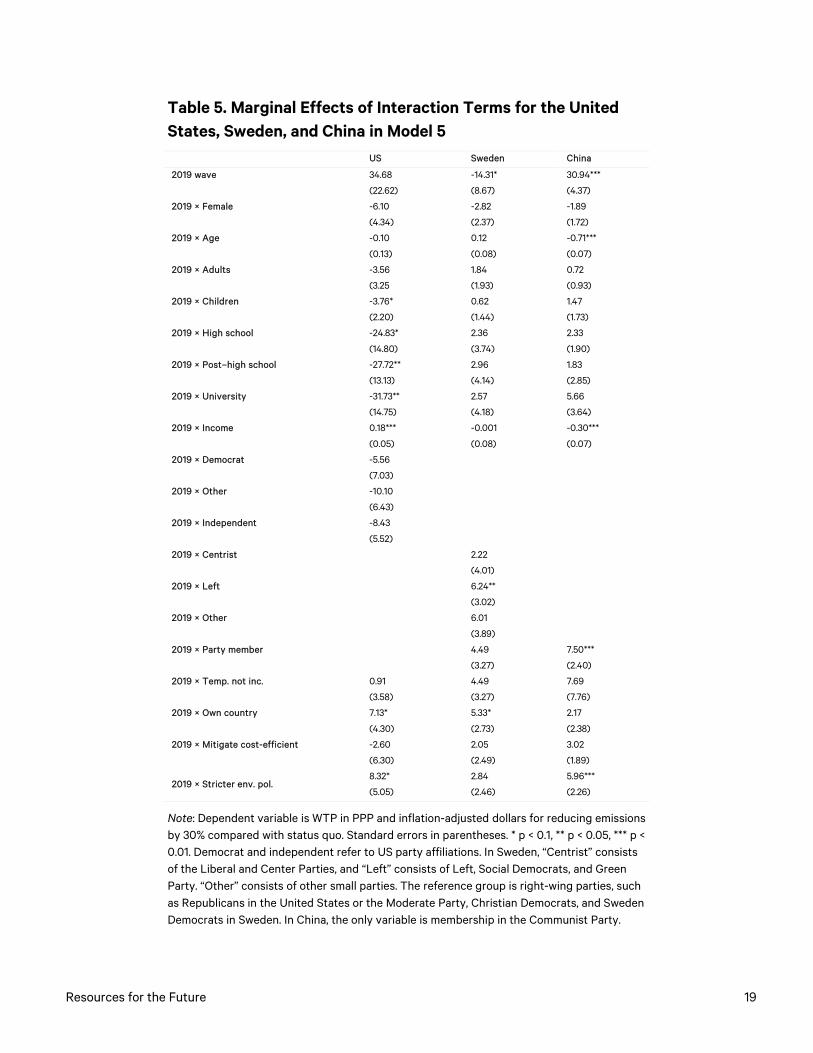
A7, while Table 5 reports only the interaction terms.
There are several significant interaction terms, especially for the United States,
where the interaction term for income is positive and statistically significant. This
means that the increase in WTP between 2009 and 2019 is explained by higher-
income groups increasing their WTP more than other income groups. Moreover, the
interaction terms capturing educational levels are all large, negative, and significant,
indicating that those with a low education level have increased their WTP relatively
more between 2009 and 2019 than those with a higher education level. Moreover,
those who believe that the United States should decrease their CO2 emissions
regardless of what other countries would do, as well as those who are in favor of a
stricter environmental policy, have increased their WTP relatively more than others
have during the 10-year period. For Sweden, the increase in the average WTP from
2009 to 2019 was partly driven by the fact that left-wing voters increased their WTP
relatively more than right-wing voters. For China, we find that older respondents and
those with higher incomes have not increased their WTP as much as younger
respondents and those with lower incomes. Moreover, members of the Communist
Party and those who are for a stricter environmental policy have increased their
WTP relatively more than others.
Resources for the Future 19
Table 5. Marginal Effects of Interaction Terms for the United States, Sweden, and China in Model 5 US Sweden China
2019 wave
34.68 -14.31* 30.94***
(22.62) (8.67) (4.37)
2019 × Female
-6.10 -2.82 -1.89
(4.34) (2.37) (1.72)
2019 × Age
-0.10 0.12 -0.71***
(0.13) (0.08) (0.07)
2019 × Adults
-3.56 1.84 0.72
(3.25 (1.93) (0.93)
2019 × Children
-3.76* 0.62 1.47
(2.20) (1.44) (1.73)
2019 × High school
-24.83* 2.36 2.33
(14.80) (3.74) (1.90)
2019 × Post–high school
-27.72** 2.96 1.83
(13.13) (4.14) (2.85)
2019 × University
-31.73** 2.57 5.66
(14.75) (4.18) (3.64)
2019 × Income
0.18*** -0.001 -0.30***
(0.05) (0.08) (0.07)
2019 × Democrat
-5.56
(7.03)
2019 × Other
-10.10
(6.43)
2019 × Independent
-8.43
(5.52)
2019 × Centrist
2.22
(4.01)
2019 × Left
6.24**
(3.02)
2019 × Other
6.01
(3.89)
2019 × Party member
4.49 7.50***
(3.27) (2.40)
2019 × Temp. not inc.
0.91 4.49 7.69
(3.58) (3.27) (7.76)
2019 × Own country
7.13* 5.33* 2.17
(4.30) (2.73) (2.38)
2019 × Mitigate cost-efficient
-2.60 2.05 3.02
(6.30) (2.49) (1.89)
2019 × Stricter env. pol. 8.32* 2.84 5.96***
(5.05) (2.46) (2.26)
Note: Dependent variable is WTP in PPP and inflation-adjusted dollars for reducing emissions by 30% compared with status quo. Standard errors in parentheses. * p < 0.1, ** p < 0.05, *** p < 0.01. Democrat and independent refer to US party affiliations. In Sweden, “Centrist” consists of the Liberal and Center Parties, and “Left” consists of Left, Social Democrats, and Green Party. “Other” consists of other small parties. The reference group is right-wing parties, such as Republicans in the United States or the Moderate Party, Christian Democrats, and Sweden Democrats in Sweden. In China, the only variable is membership in the Communist Party.
The Climate Decade: Changing Attitudes on Three Continents 20
4.2. Political Polarization and Climate Policy
In this section, we explore the issue of political polarization and attitudes toward
climate policy in Sweden and the United States. The word polarization is used to
describe both a state (a connotation of a division of opinion) and a process whereby
opinions become more divided. It is important to note that polarization can be
measured in at least two ways: in absolute terms (the difference in WTPs) and in
relative terms (the ratio of WTPs). Both measures of polarization can be used to
understand the development of climate attitudes and WTP over time.
Relative polarization measures the ratio of WTP of one group compared with another
group. Polarization in absolute terms measures the (dollar) difference in WTP of one
group compared with another group. Since our focus will mainly be on whether
polarization has increased between 2009 and 2019, it is important to note that
absolute polarization may increase while the relative polarizations are either
unchanged or decreased. For example, assume that WTP is initially twice as high for
one group as for the other. Suppose both groups double their WTP at a later point in
time. This would result in a doubled difference in absolute WTP but no change in
relative WTP between the groups compared across time. Both measures are
capturing the extent of polarization but in different units.
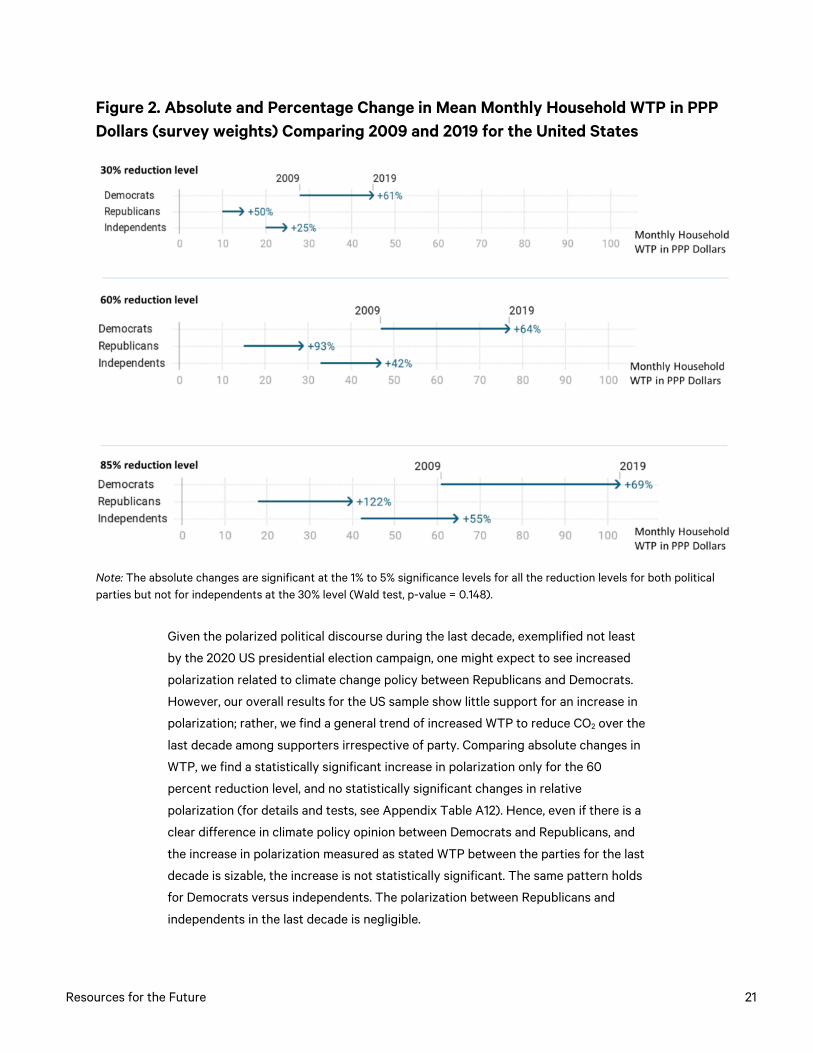
Absolute and percentage changes in WTP by (self-reported) political affiliation in
the United States are illustrated in Figure 2 (summary statistics, including standard
deviations and statistical significance, as well as comparisons of absolute and
relative polarization can be found in Appendix Tables A11–A12).
Resources for the Future 21
Figure 2. Absolute and Percentage Change in Mean Monthly Household WTP in PPP Dollars (survey weights) Comparing 2009 and 2019 for the United States
Note: The absolute changes are significant at the 1% to 5% significance levels for all the reduction levels for both political parties but not for independents at the 30% level (Wald test, p-value = 0.148).
Given the polarized political discourse during the last decade, exemplified not least
by the 2020 US presidential election campaign, one might expect to see increased
polarization related to climate change policy between Republicans and Democrats.
However, our overall results for the US sample show little support for an increase in
polarization; rather, we find a general trend of increased WTP to reduce CO2 over the
last decade among supporters irrespective of party. Comparing absolute changes in
WTP, we find a statistically significant increase in polarization only for the 60
percent reduction level, and no statistically significant changes in relative
polarization (for details and tests, see Appendix Table A12). Hence, even if there is a
clear difference in climate policy opinion between Democrats and Republicans, and
the increase in polarization measured as stated WTP between the parties for the last
decade is sizable, the increase is not statistically significant. The same pattern holds
for Democrats versus independents. The polarization between Republicans and
independents in the last decade is negligible.
The Climate Decade: Changing Attitudes on Three Continents 22
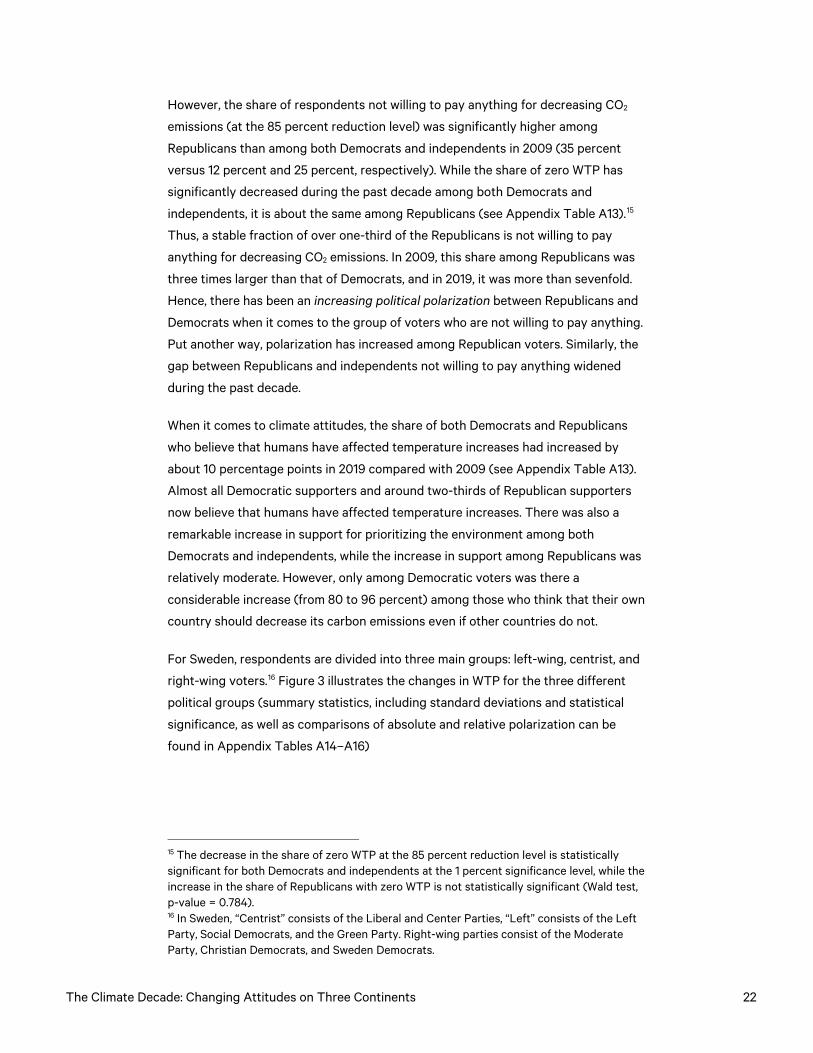
However, the share of respondents not willing to pay anything for decreasing CO2
emissions (at the 85 percent reduction level) was significantly higher among
Republicans than among both Democrats and independents in 2009 (35 percent
versus 12 percent and 25 percent, respectively). While the share of zero WTP has
significantly decreased during the past decade among both Democrats and
independents, it is about the same among Republicans (see Appendix Table A13).15
Thus, a stable fraction of over one-third of the Republicans is not willing to pay
anything for decreasing CO2 emissions. In 2009, this share among Republicans was
three times larger than that of Democrats, and in 2019, it was more than sevenfold.
Hence, there has been an increasing political polarization between Republicans and
Democrats when it comes to the group of voters who are not willing to pay anything.
Put another way, polarization has increased among Republican voters. Similarly, the
gap between Republicans and independents not willing to pay anything widened
during the past decade.
When it comes to climate attitudes, the share of both Democrats and Republicans
who believe that humans have affected temperature increases had increased by
about 10 percentage points in 2019 compared with 2009 (see Appendix Table A13).
Almost all Democratic supporters and around two-thirds of Republican supporters
now believe that humans have affected temperature increases. There was also a
remarkable increase in support for prioritizing the environment among both
Democrats and independents, while the increase in support among Republicans was
relatively moderate. However, only among Democratic voters was there a
considerable increase (from 80 to 96 percent) among those who think that their own
country should decrease its carbon emissions even if other countries do not.
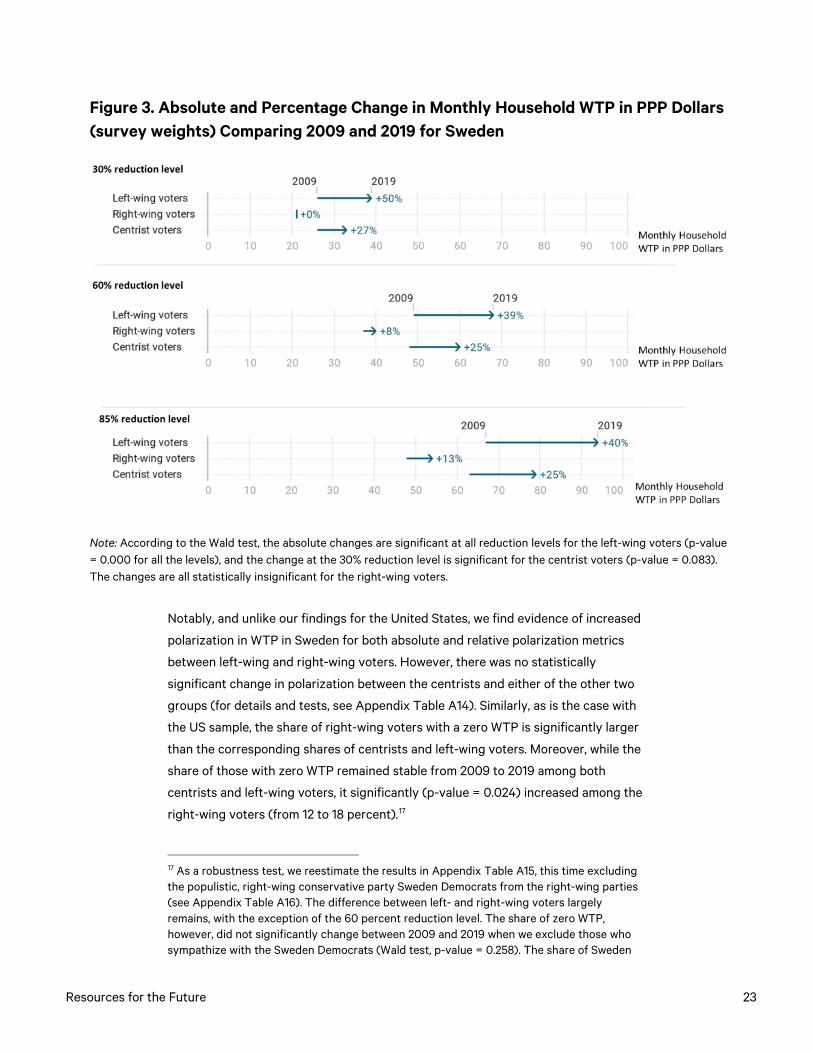
For Sweden, respondents are divided into three main groups: left-wing, centrist, and
right-wing voters.16 Figure 3 illustrates the changes in WTP for the three different
political groups (summary statistics, including standard deviations and statistical
significance, as well as comparisons of absolute and relative polarization can be
found in Appendix Tables A14–A16)
15 The decrease in the share of zero WTP at the 85 percent reduction level is statistically significant for both Democrats and independents at the 1 percent significance level, while the increase in the share of Republicans with zero WTP is not statistically significant (Wald test, p-value = 0.784). 16 In Sweden, “Centrist” consists of the Liberal and Center Parties, “Left” consists of the Left Party, Social Democrats, and the Green Party. Right-wing parties consist of the Moderate Party, Christian Democrats, and Sweden Democrats.
Resources for the Future 23
Figure 3. Absolute and Percentage Change in Monthly Household WTP in PPP Dollars (survey weights) Comparing 2009 and 2019 for Sweden
Note: According to the Wald test, the absolute changes are significant at all reduction levels for the left-wing voters (p-value = 0.000 for all the levels), and the change at the 30% reduction level is significant for the centrist voters (p-value = 0.083). The changes are all statistically insignificant for the right-wing voters.
Notably, and unlike our findings for the United States, we find evidence of increased
polarization in WTP in Sweden for both absolute and relative polarization metrics
between left-wing and right-wing voters. However, there was no statistically
significant change in polarization between the centrists and either of the other two
groups (for details and tests, see Appendix Table A14). Similarly, as is the case with
the US sample, the share of right-wing voters with a zero WTP is significantly larger
than the corresponding shares of centrists and left-wing voters. Moreover, while the
share of those with zero WTP remained stable from 2009 to 2019 among both
centrists and left-wing voters, it significantly (p-value = 0.024) increased among the
right-wing voters (from 12 to 18 percent).17
17 As a robustness test, we reestimate the results in Appendix Table A15, this time excluding the populistic, right-wing conservative party Sweden Democrats from the right-wing parties (see Appendix Table A16). The difference between left- and right-wing voters largely remains, with the exception of the 60 percent reduction level. The share of zero WTP, however, did not significantly change between 2009 and 2019 when we exclude those who sympathize with the Sweden Democrats (Wald test, p-value = 0.258). The share of Sweden
The Climate Decade: Changing Attitudes on Three Continents 24
Regarding climate attitudes and beliefs about anthropogenic global warming, there
was an increase (from 6 to 11 percent) in right-wing voters who think that we can
stop climate change. However, there was a considerable decrease (from 73 to 60
percent) among right-wing voters who think that their own country should decrease
its carbon emissions even if other countries do not. In general, less support exists
among Swedish right-wing voters for prioritizing the environment, and the share that
shows support is considerably lower than among left-wing voters and centrists.
Summing up, it is fair to say that political polarization has increased in relation to
climate policy in Sweden during the last decade (see Appendix Table A17 for
attitudinal results).
Democrat voters has tripled in the country during the time period of our study (2009–19) (Valmyndigheten, 2019 a, b), and the party’s support is rising.
Resources for the Future 25
5. Conclusions and Implications for Global Climate Policy
The United States and China are the two largest carbon emitters in the world. While
US per capita emissions are more than twice as high as in China, the emissions
trends over the last decade are quite different. The United States experienced a
decreasing emissions trend between 2000 and 2014, while emissions in China
increased (World Bank, 2020). Since 2005, China has been emitting more in total
than the United States and is the world’s largest emitter. Notably, China alone has
accounted for two-thirds of global emissions growth over the past decade (IEA,
2018). Europe accounts for less than 10 percent of total global emissions, and
Sweden is an insignificant contributor, with per capita emissions that are
approximately half of China’s and significantly lower than those of the United States.
Despite its marginal contribution to global carbon emissions, Sweden is known for its
willingness to take a leading role in climate change mitigation and has adopted an
ambitious climate target of zero net emissions by 2045. The United States, on the
other hand, has withdrawn from the Paris Agreement under the Trump
administration, although the incoming Biden administration has announced that the
country will join again. The election outcome may well be one of the most significant
factors in addressing global climate change during the coming decade. In addition,
the United States has multiple ongoing state initiatives (e.g., California’s initiatives
for reducing climate change and the Regional Greenhouse Gas Initiative, a
cooperative effort among 10 eastern states) and federal regulations (e.g., the Clean
Air Act) in place to reduce greenhouse gases. China recently launched a large-scale
national power sector emissions trading program to curb carbon emissions and is a
leader in renewable energy (Ambrose, 2019), but the country relies heavily on coal,
and new investments in coal are being planned at an alarming rate as part of the Belt
and Road Initiative (Alvarez, 2019; Saha, 2019). Hence, these three countries reflect
very different climate policy contexts, differences that may show up in citizens’
attitudes toward climate policies and willingness to pay for climate mitigation.
Interestingly, our results show an increased willingness to pay for climate mitigation
in all three countries. Notably, in 2019, the willingness to pay per ton of reduced CO2
compares closely to conventional measures of the social cost of carbon in China and
the United States and to carbon taxes in Sweden. Ten years ago, Sweden stood out
with a larger fraction of believers in anthropogenic climate change and a higher WTP
for mitigation. Over the last decade, there have been greater increases in both of
these measures in China and the United States, so today the national averages are
much more similar. Now China stands out with a higher WTP as a share of income.
The Climate Decade: Changing Attitudes on Three Continents 26
When interpreting these figures, we need to bear in mind the dramatic changes in
these countries over the time period studied. The increased WTP in China should be
considered against a background of rapidly rising income, even more rapidly
escalating emissions, and a strong increase in stated commitment among political
leaders to address climate change. The Swedish numbers may also be seen in the
light of a country that has been rather ambitious in its climate efforts but, with a
relatively stagnant economy, is now trying to stimulate its economy and coordinate
mitigation efforts with other countries in the EU, including countries that are more
skeptical toward more stringent climate policies.
What does all this imply for the future of climate policy? A key reason for political
inaction could be that public demand for more stringent policies is weak. However,
we do not find support for such arguments. Instead, we find that for all three
countries, the average WTP per ton of carbon emissions reduced is within the range
of the social cost of carbon values usually referred to in the literature. In Sweden,
WTP per ton of carbon emissions reduced is comparable to the Swedish carbon tax
(approximately $126/ton), and in the United States, it is below but roughly on par
with EPA’s central estimates of the social cost of carbon in 2017 ($42/ton).
On the other hand, within countries, these averages conceal considerable preference
divergence, most importantly relating to political affiliation. We find a clear left-right
difference in WTP in both the United States and Sweden. In the United States, the
average WTP of self-identified Republicans is significantly lower than that of others,
especially Democrats. At the same time, this difference in preferences was already
present in 2009, and we find little evidence of sizable increases in polarization
across Democrats and Republicans when looking at the whole sample. In Sweden,
however, which was more homogeneous earlier, there is stronger evidence of
increased polarization in both preferences and attitudes toward climate policy. While
WTP for climate change policy among right-wing voters has increased, it has
increased to a significantly lesser degree than among left-wing and centrist voters.
Moreover, in both the United States and Sweden, the share of respondents with zero
WTP is significantly higher among Republicans and right-wing party voters than
among any other voters, and that gap has increased during the past decade. Hence,
while we see convergent tendencies across countries, there is some evidence of
increased divergence within countries.
Returning to our initial question whether the increasing warning signs over the last
decade that the earth is warming are matched by citizens’ demand for stronger
policy action, the answer is affirmative and positive for those who have hoped that
electorates will demand more stringent climate policies from their leaders. This
greater support for climate action could influence future domestic and global
policies. However, a consequence of political polarization might be that large groups
Resources for the Future 27
of citizens are unhappy with their country´s climate politics. If so, political
polarization could shift the focus from climate to ideology, and political decisions
about climate policies could become more difficult to reach both nationally and
globally.
The Climate Decade: Changing Attitudes on Three Continents 28
6. References
Alvarez, C. F. 2019. “Commentary: Fading Fast in the US and Europe, Coal Still Reigns in Asia.” December 12. International Energy Agency. https://www.iea.org/commentaries/fading-fast-in-the-us-and-europe-coal-still-reigns-in-asia.
Ambrose, J. 2019. “China’s Appetite for Coal Power Returns despite Climate Pledge.” Guardian, November 20. https://www.theguardian.com/world/2019/nov/20/china-appetite-for-coal-power-stations-returns-despite-climate-pledge-capacity.
Carlsson, F., M. Kataria, A. Krupnick, E. Lampi, Å. Löfgren, P. Qin, S. Chung, and T. Sterner. 2012. “Paying for Mitigation: A Multiple Country Study.” Land Economics 88 (2): 326–40. https://doi.org/10.3368/le.88.2.326.
Carlsson, F., M. Kataria, A. Krupnick, E. Lampi, Å. Löfgren, P. Qin, and T. Sterner. 2013. “A Fair Share: Burden-Sharing Preferences in the United States and China.” Resource and Energy Economics 35 (1): 1–17.
CIA (Central Intelligence Agency). 2018a. The World Factbook, United States. https://www.cia.gov/library/publications/the-world-factbook/geos/us.html.
———. 2018b. The World Factbook, China. https://www.cia.gov/library/publications/the-world-factbook/geos/ch.html.
Drupp, M. A., M. C. Freeman, B. Groom, and F. Nesje. 2018. “Discounting Disentangled.” American Economic Journal: Economic Policy 10 (4): 109–34.
Greenstone, M., E. Kopits, and A. Wolverton. 2013. “Developing a Social Cost of Carbon for US Regulatory Analysis: A Methodology and Interpretation.” Review of Environmental Economics and Policy 7 (1): 23–46.
Guber, D. L. 2013. “A Cooling Climate for Change? Party Polarization and the Politics of Global Warming.” American Behavioral Scientist 57 (1), 93–115.
Hoffman, A. J. 2011. “The Growing Climate Divide.” Nature Climate Change 1 (4): 195–96.
Hornsey, M. J., E. A. Harris, P. G. Bain, and K. S. Fielding. 2016. “Meta-Analyses of the Determinants and Outcomes of Belief in Climate Change.” Nature Climate Change 6 (6): 622–26.
Hornsey, M. J., E. A. Harris, and K. S. Fielding. 2018. “Relationships among Conspiratorial Beliefs, Conservatism and Climate Scepticism across Nations.” Nature Climate Change 8 (7): 614–20.
IEA (International Energy Agency). 2018. CO2 Emissions from Fuel Combustion 2018. Paris: IEA.
Jamelske, E., J. Boulter, W. Jang, J. Barrett, L. Miller, and W. L. Han. 2015. “Examining Differences in Public Opinion on Climate Change between College Students in China and the USA.” Journal of Environmental Studies and Sciences 5 (2): 87–98. https://doi.org/10.1007/s13412-015-0229-9.
Resources for the Future 29
Johnston, R. J., K. J. Boyle, W. Adamowicz, J. Bennett, R. Brouwer, T. A. Cameron, @. M. Hanemann, et al. 2017. “Contemporary Guidance for Stated Preference Studies.” Journal of the Association of Environmental and Resource Economists 4 (2): 319–405.
Keohane, R. O., and D. G. Victor. 2011. “The Regime Complex for Climate Change.” Perspectives on Politics 9 (1): 7–23.
Kousser, T., and B. Tranter. 2018. “The Influence of Political Leaders on Climate Change Attitudes.” Global Environmental Change 50:100–109.
Krinsky, I., and L. Robb. “On Approximating the Statistical Properties of Elasticities.” Review of Economics and Statistics 68:715–19.
Krupnick, A., S. Hoffman, and P. Qin. 2010. “The Willingness to Pay for Mortality Risk Reductions in China.” Working paper. Washington, DC: Resources for the Future.
Lindhjem, H., and S. Navrud. 2011. “Using Internet in Stated Preference Surveys: A Review and Comparison of Survey Modes.” International Review of Environmental and Resource Economics 5 (4): 309–51.
Malka, A., J. A. Krosnick, and G. Langer. 2009. “The Association of Knowledge with Concern about Global Warming: Trusted Information Sources Shape Public Thinking.” Risk Analysis 29 (5): 633–47.
Martinsson, J., and M. Weissenbilder. 2019 ”Polariserade problembeskrivningar?” i Andersson m.fl. (red) Storm och stiltje. GU: SOM-institutet.
Meginnis, K., M. Burton, R. Chan, and D. Rigby. 2018. “Strategic Bias in Discrete Choice Experiments.” Journal of Environmental Economics and Management 102163. https://doi.org/10.1016/j.jeem.2018.08.010.
Muis, J., and T. Immerzeel. 2017. “Causes and Consequences of the Rise of Populist Radical Right Parties and Movements in Europe.” Current Sociology 65 (6): 909–30. https://doi.org/10.1177/0011392117717294.
NASEM (National Academies of Sciences, Engineering, and Medicine). 2017. Valuing Climate Damages: Updating Estimation of the Social Cost of Carbon Dioxide. Washington, DC: National Academies Press. https://doi.org/10.17226/24651.
OECD (Organisation for Economic Co-operation and Development). 2018. “Current Use of Cost-Benefit Analysis.” Chap. 14 in Cost-Benefit Analysis and the Environment: Further Developments and Policy Use. Paris: OECD Publishing. https://doi.org/10.1787/9789264085169-en.
Pizer, W., M. Adler, J. Aldy, D. Anthoff, M. Cropper, K. Gillingham, M. Greenstone, et al. 2014. “Using and Improving the Social Cost of Carbon.” Science 346 (6214): 1189–90.
PPRG (Political Psychology Research Group). 2018. “American Public Opinion on Global Warming.” Stanford University. https://climatepublicopinion.stanford.edu/.
Rennert, K., and C. Kingdon. 2019. “Social Cost of Carbon 101: A Review of the Social Cost of Carbon, from a Basic Definition to the History of Its Use in Policy Analysis.” Washington, DC: Resources for the Future.
The Climate Decade: Changing Attitudes on Three Continents 30
Saha, S. 2019. “China’s Belt and Road Plan Is Destroying the World.” National Interest, August 18. https://nationalinterest.org/feature/chinas-belt-and-road-plan-destroying-world-74166.
Schwirplies, C. 2018. “Citizens’ Acceptance of Climate Change Adaptation and Mitigation: A Survey in China, Germany, and the U.S.” Ecological Economics 145:308–22. https://doi.org/10.1016/J.ECOLECON.2017.11.003.
Statistics Sweden. 2018a. “Population by Age and Sex: Year 1860–2018.” http://www.statistikdatabasen.scb.se/pxweb/en/ssd/START__BE__BE0101__BE0101A/BefolkningR1860/ (accessed September 26, 2019).
———. 2018b. “Median Salaries in Sweden.” [In Swedish.] https://www.scb.se/hitta-statistik/sverige-i-siffror/utbildning-jobb-och-pengar/medianloner-i-sverige/ (accessed September 25, 2019).
———. 2018c. “Population by Region, Marital Status, Age and Sex: Year 1968–2018.” http://www.statistikdatabasen.scb.se/pxweb/en/ssd/START__BE__BE0101__BE0101A/BefolkningNy/table/tableViewLayout1/ (accessed September 26, 2019).
———. 2018d. “Education Level in Sweden.” [In Swedish.] https://www.scb.se/hitta-statistik/sverige-i-siffror/utbildning-jobb-och-pengar/utbildningsnivan-i-sverige/?showRelatedArticles=False&showRelatedFacts=True (accessed September 25, 2019).
US Census Bureau. 2018a. “Quick Facts: Age and Sex.” https://www.census.gov/quickfacts/fact/table/U.S./LFE046217 (accessed September 26, 2019).
———. 2018b. “Table 1. Annual Estimates of the Resident Population for the United States, Regions, States, and Puerto Rico: April 1, 2010 to July 1, 2018.” NST-EST2018-01. https://www.census.gov/newsroom/press-kits/2018/pop-estimates-national-state.html (accessed September 26, 2019).
———. 2019. “Table 1. Educational Attainment of the Population 18 Years and Over, by Age, Sex, Race, and Hispanic Origin: 2018; All Races.” https://www.census.gov/data/tables/2018/demo/education-attainment/cps-detailed-tables.html (accessed September 26, 2019).
Valmyndigheten [Swedish Election Authority]. 2019a. “Election Results 2010.” [In Swedish.] https://val.se/valresultat/riksdag-landsting-och-kommun/2010/valresultat.html (accessed October 21, 2019).
———. 2019b. “Election Results 2018.” [In Swedish.] https://www.val.se/servicelankar/other-languages/english-engelska/election-results-2018.html (accessed October 21, 2019).
Vossler, C. A., M. Doyon, and D. Rondeau. 2012. “Truth in Consequentiality: Theory and Field Evidence on Discrete Choice Experiments.” American Economic Journal: Microeconomics 4(4): 145–71.
Welsh, M. P., and G. L. Poe. 1998. “Elicitation Effects in Contingent Valuation: Comparisons to a Multiple Bounded Discrete Choice Approach.” Journal of Environmental Economics and Management 36(2): 170–85.
Resources for the Future 31
Westfall, J., L. Van Boven, J. R. Chambers, and C. M. Judd. 2015. “Perceiving Political Polarization in the United States: Party Identity Strength and Attitude Extremity Exacerbate the Perceived Partisan Divide.” Perspectives on Psychological Science 10 (2): 145–58. https://doi.org/10.1177/1745691615569849.
Winden, M., E. Jamelske, and E. Tvinnereim. 2018. “A Contingent Valuation Study Comparing Citizen’s Willingness-to-Pay for Climate Change Mitigation in China and the United States.” Environmental Economics and Policy Studies 20 (2): 451–75. https://doi.org/10.1007/s10018-017-0202-9.
World Bank. 2019. “State and Trends of Carbon Pricing 2019.” Washington, DC: World Bank Group. https://openknowledge.worldbank.org/handle/10986/31755 (accessed April 28, 2020).
———. 2020. “World Development Indicators.” Washington, DC: World Bank Group. https://datacatalog.worldbank.org/dataset/world-development-indicators (accessed February 14, 2020).
Zawojska, E., A. Bartczak, and M. Czajkowski. 2019. “Disentangling the Effects of Policy and Payment Consequentiality and Risk Attitudes on Stated Preferences.” Journal of Environmental Economics and Management 93:63–84.
Ziegler, A. 2017. “Political Orientation, Environmental Values, and Climate Change Beliefs and Attitudes: An Empirical Cross Country Analysis.” Energy Economics 63:144–53. https://doi.org/10.1016/J.ENECO.2017.01.022.
The Climate Decade: Changing Attitudes on Three Continents 32
Appendix A
Table A1. Descriptive Statistics of Demographic Variables, Mean Values Variable Description United States Sweden China
2009 2019 2009 2019 2009 2019
Female = 1, if female 0.51 0.55 0.48 0.51 0.46 0.47
Age Years 47.7
(16.84)
49.3
(15.7)
50.7
(15.4)
50.0
(18.2)
54.1
(12.6)
40.0
(16.4)
Adults No. of household members 18 and above 2.18
(0.99)
2.00
(0.91)
1.87
(0.68)
1.79
(0.77)
2.90
(1.14)
2.94
(1.09)
Children No. of household members below 18 0.59
(1.03)
0.64
(1.11)
0.52
(0.91)
0.50
(0.92)
0.52
(0.66)
0.95
(0.78)
Compulsory = 1, if only compulsory/primary school (ref. category) 0.11 0.006 0.11 0.05 0.16 0.20
High school = 1, if only high school 0.31 0.10 0.34 0.31 0.13 0.21
Post–high s. = 1, if post–high school 0.28 0.31 0.17 0.18 0.28 0.32
University graduate = 1, if completed university education 0.30 0.58 0.37 0.46 0.43 0.27
Income Annual after-tax income in PPP and inflation-adjusted
US$000s
49.9
(40.6)
63.8
(50.9)
44.8
(20.2)
45.4
(19.8)
18.8
(13.0)
33.0
(19.2)
Miss income = 1, if no response to income question 0.13
Political affiliation
Left = 1, if left wing (Sweden) 0.43 0.35
Liberal = 1, if liberal party 0.13 0.14
Other party = 1, if other party (Sweden) 0.107 0.09
Right = 1, if conservative right-wing parties (Sweden) 0.33 0.40
Democrat = 1, if Democrat (United States) 0.37 0.34
Other party = 1, if other party (United States) 0.10 0.09
Independent = 1, if independent (United States) 0.28 0.30
Republican =1, if Republican (United States; ref. category) 0.25 0.27
Communist = 1, if Communist Party (China) 0.31 0.27
No. observations 1000 1,458 1,229 1,497 1,264 1,579
Note: Standard deviations in brackets.
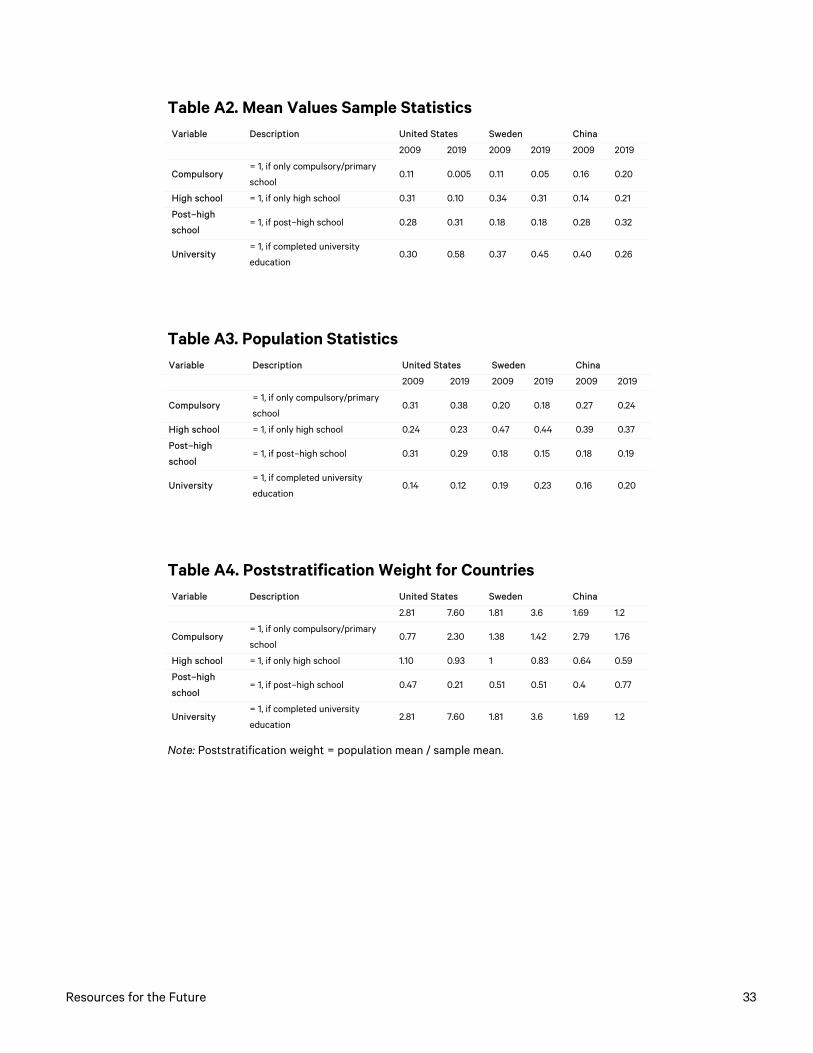
Resources for the Future 33
Table A2. Mean Values Sample Statistics Variable Description United States Sweden China
2009 2019 2009 2019 2009 2019
Compulsory = 1, if only compulsory/primary
school 0.11 0.005 0.11 0.05 0.16 0.20
High school = 1, if only high school 0.31 0.10 0.34 0.31 0.14 0.21
Post–high
school = 1, if post–high school 0.28 0.31 0.18 0.18 0.28 0.32
University = 1, if completed university
education 0.30 0.58 0.37 0.45 0.40 0.26
Table A3. Population Statistics Variable Description United States Sweden China
2009 2019 2009 2019 2009 2019
Compulsory = 1, if only compulsory/primary
school 0.31 0.38 0.20 0.18 0.27 0.24
High school = 1, if only high school 0.24 0.23 0.47 0.44 0.39 0.37
Post–high
school = 1, if post–high school 0.31 0.29 0.18 0.15 0.18 0.19
University = 1, if completed university
education 0.14 0.12 0.19 0.23 0.16 0.20
Table A4. Poststratification Weight for Countries Variable Description United States Sweden China
2.81 7.60 1.81 3.6 1.69 1.2
Compulsory = 1, if only compulsory/primary
school 0.77 2.30 1.38 1.42 2.79 1.76
High school = 1, if only high school 1.10 0.93 1 0.83 0.64 0.59
Post–high
school = 1, if post–high school 0.47 0.21 0.51 0.51 0.4 0.77
University = 1, if completed university
education 2.81 7.60 1.81 3.6 1.69 1.2
Note: Poststratification weight = population mean / sample mean.
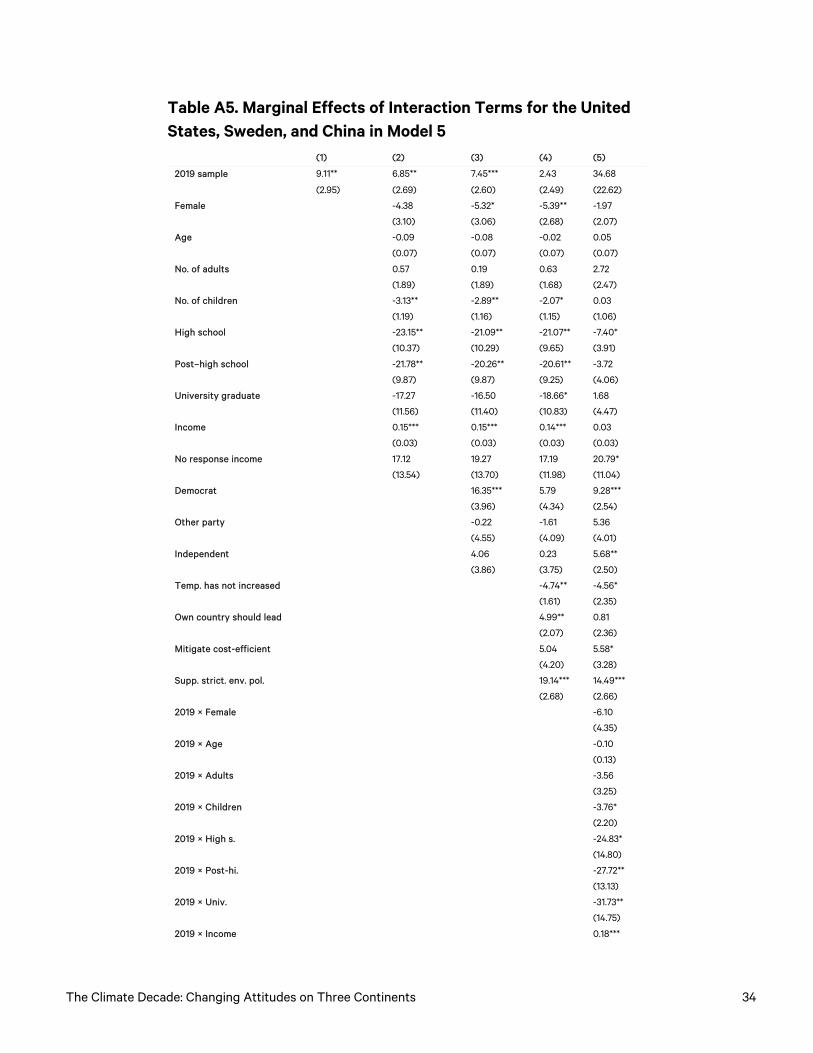
The Climate Decade: Changing Attitudes on Three Continents 34
Table A5. Marginal Effects of Interaction Terms for the United States, Sweden, and China in Model 5
(1) (2) (3) (4) (5)
2019 sample
9.11** 6.85** 7.45*** 2.43 34.68
(2.95) (2.69) (2.60) (2.49) (22.62)
Female
-4.38 -5.32* -5.39** -1.97
(3.10) (3.06) (2.68) (2.07)
Age
-0.09 -0.08 -0.02 0.05
(0.07) (0.07) (0.07) (0.07)
No. of adults
0.57 0.19 0.63 2.72
(1.89) (1.89) (1.68) (2.47)
No. of children
-3.13** -2.89** -2.07* 0.03
(1.19) (1.16) (1.15) (1.06)
High school
-23.15** -21.09** -21.07** -7.40*
(10.37) (10.29) (9.65) (3.91)
Post–high school
-21.78** -20.26** -20.61** -3.72
(9.87) (9.87) (9.25) (4.06)
University graduate
-17.27 -16.50 -18.66* 1.68
(11.56) (11.40) (10.83) (4.47)
Income
0.15*** 0.15*** 0.14*** 0.03
(0.03) (0.03) (0.03) (0.03)
No response income
17.12 19.27 17.19 20.79*
(13.54) (13.70) (11.98) (11.04)
Democrat
16.35*** 5.79 9.28***
(3.96) (4.34) (2.54)
Other party
-0.22 -1.61 5.36
(4.55) (4.09) (4.01)
Independent
4.06 0.23 5.68**
(3.86) (3.75) (2.50)
Temp. has not increased
-4.74** -4.56*
(1.61) (2.35)
Own country should lead
4.99** 0.81
(2.07) (2.36)
Mitigate cost-efficient
5.04 5.58*
(4.20) (3.28)
Supp. strict. env. pol.
19.14*** 14.49***
(2.68) (2.66)
2019 × Female
-6.10
(4.35)
2019 × Age
-0.10
(0.13)
2019 × Adults
-3.56
(3.25)
2019 × Children
-3.76*
(2.20)
2019 × High s.
-24.83*
(14.80)
2019 × Post-hi.
-27.72**
(13.13)
2019 × Univ.
-31.73**
(14.75)
2019 × Income 0.18***
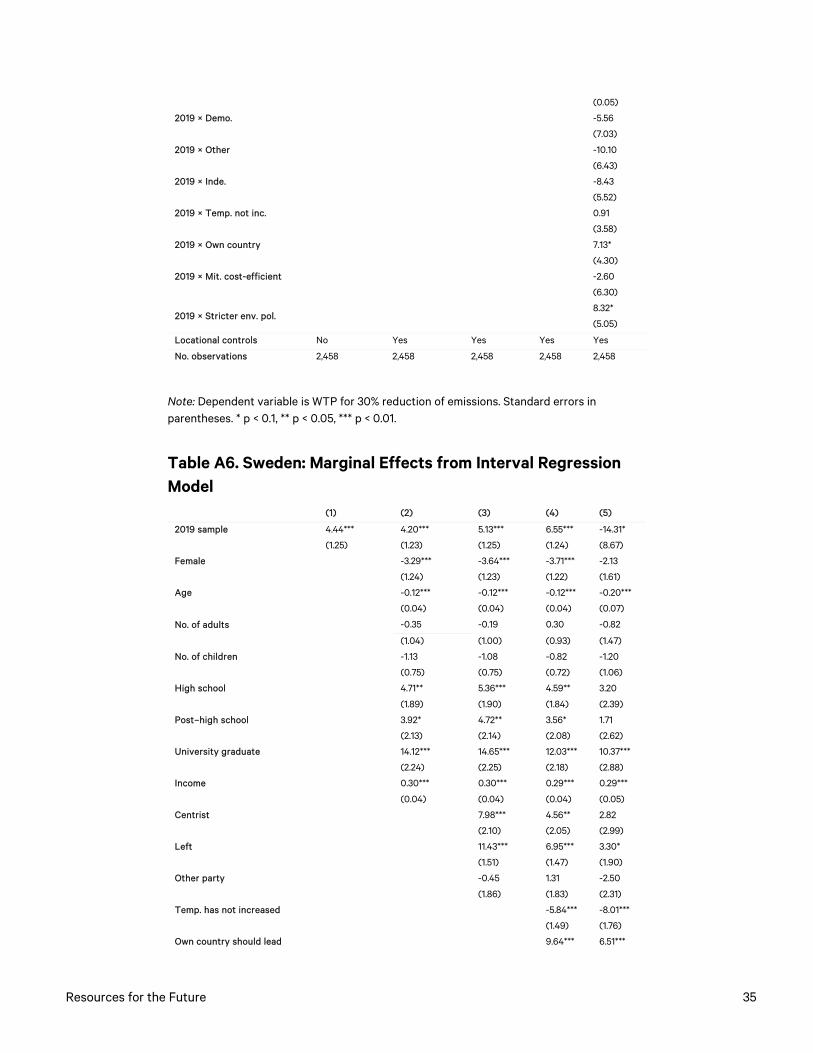
Resources for the Future 35
(0.05)
2019 × Demo.
-5.56
(7.03)
2019 × Other
-10.10
(6.43)
2019 × Inde.
-8.43
(5.52)
2019 × Temp. not inc.
0.91
(3.58)
2019 × Own country
7.13*
(4.30)
2019 × Mit. cost-efficient
-2.60
(6.30)
2019 × Stricter env. pol. 8.32*
(5.05)
Locational controls No Yes Yes Yes Yes
No. observations 2,458 2,458 2,458 2,458 2,458
Note: Dependent variable is WTP for 30% reduction of emissions. Standard errors in parentheses. * p < 0.1, ** p < 0.05, *** p < 0.01.
Table A6. Sweden: Marginal Effects from Interval Regression Model
(1) (2) (3) (4) (5)
2019 sample
4.44*** 4.20*** 5.13*** 6.55*** -14.31*
(1.25) (1.23) (1.25) (1.24) (8.67)
Female
-3.29*** -3.64*** -3.71*** -2.13
(1.24) (1.23) (1.22) (1.61)
Age
-0.12*** -0.12*** -0.12*** -0.20***
(0.04) (0.04) (0.04) (0.07)
No. of adults
-0.35 -0.19 0.30 -0.82
(1.04) (1.00) (0.93) (1.47)
No. of children
-1.13 -1.08 -0.82 -1.20
(0.75) (0.75) (0.72) (1.06)
High school
4.71** 5.36*** 4.59** 3.20
(1.89) (1.90) (1.84) (2.39)
Post–high school
3.92* 4.72** 3.56* 1.71
(2.13) (2.14) (2.08) (2.62)
University graduate
14.12*** 14.65*** 12.03*** 10.37***
(2.24) (2.25) (2.18) (2.88)
Income
0.30*** 0.30*** 0.29*** 0.29***
(0.04) (0.04) (0.04) (0.05)
Centrist
7.98*** 4.56** 2.82
(2.10) (2.05) (2.99)
Left
11.43*** 6.95*** 3.30*
(1.51) (1.47) (1.90)
Other party
-0.45 1.31 -2.50
(1.86) (1.83) (2.31)
Temp. has not increased
-5.84*** -8.01***
(1.49) (1.76)
Own country should lead 9.64*** 6.51***
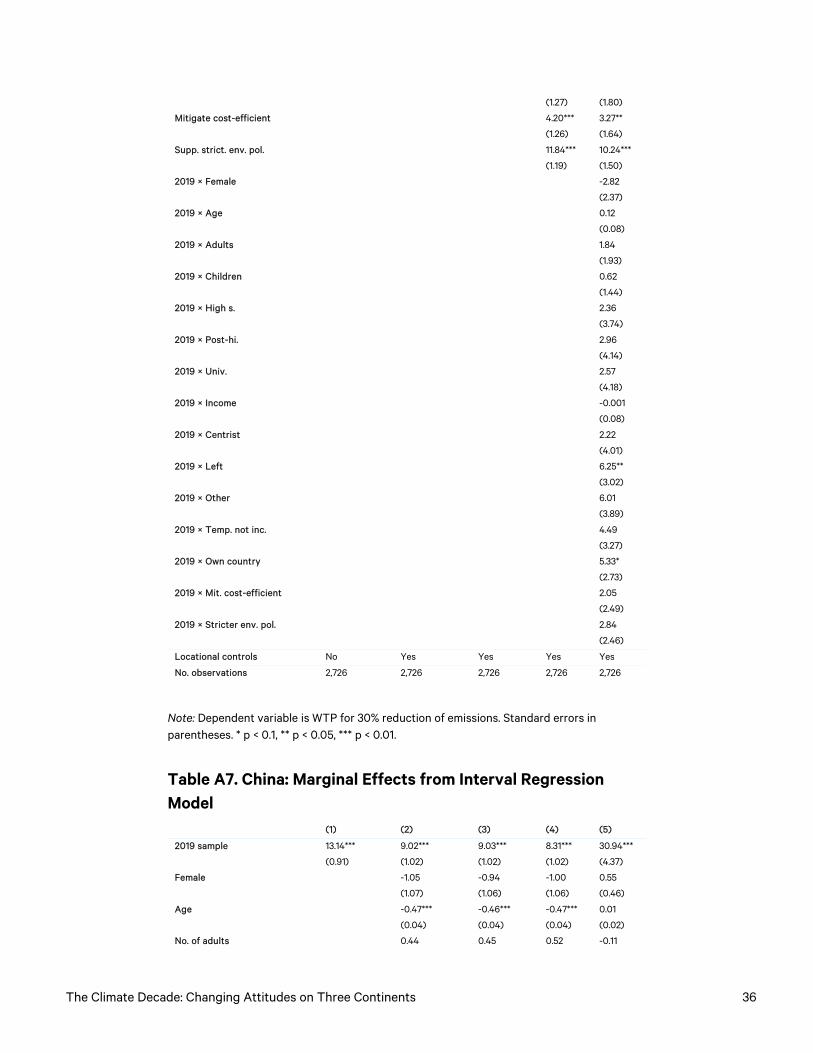
The Climate Decade: Changing Attitudes on Three Continents 36
(1.27) (1.80)
Mitigate cost-efficient
4.20*** 3.27**
(1.26) (1.64)
Supp. strict. env. pol.
11.84*** 10.24***
(1.19) (1.50)
2019 × Female
-2.82
(2.37)
2019 × Age
0.12
(0.08)
2019 × Adults
1.84
(1.93)
2019 × Children
0.62
(1.44)
2019 × High s.
2.36
(3.74)
2019 × Post-hi.
2.96
(4.14)
2019 × Univ.
2.57
(4.18)
2019 × Income
-0.001
(0.08)
2019 × Centrist
2.22
(4.01)
2019 × Left
6.25**
(3.02)
2019 × Other
6.01
(3.89)
2019 × Temp. not inc.
4.49
(3.27)
2019 × Own country
5.33*
(2.73)
2019 × Mit. cost-efficient
2.05
(2.49)
2019 × Stricter env. pol.
2.84
(2.46)
Locational controls No Yes Yes Yes Yes
No. observations 2,726 2,726 2,726 2,726 2,726
Note: Dependent variable is WTP for 30% reduction of emissions. Standard errors in parentheses. * p < 0.1, ** p < 0.05, *** p < 0.01.
Table A7. China: Marginal Effects from Interval Regression Model
(1) (2) (3) (4) (5)
2019 sample
13.14*** 9.02*** 9.03*** 8.31*** 30.94***
(0.91) (1.02) (1.02) (1.02) (4.37)
Female
-1.05 -0.94 -1.00 0.55
(1.07) (1.06) (1.06) (0.46)
Age
-0.47*** -0.46*** -0.47*** 0.01
(0.04) (0.04) (0.04) (0.02)
No. of adults 0.44 0.45 0.52 -0.11
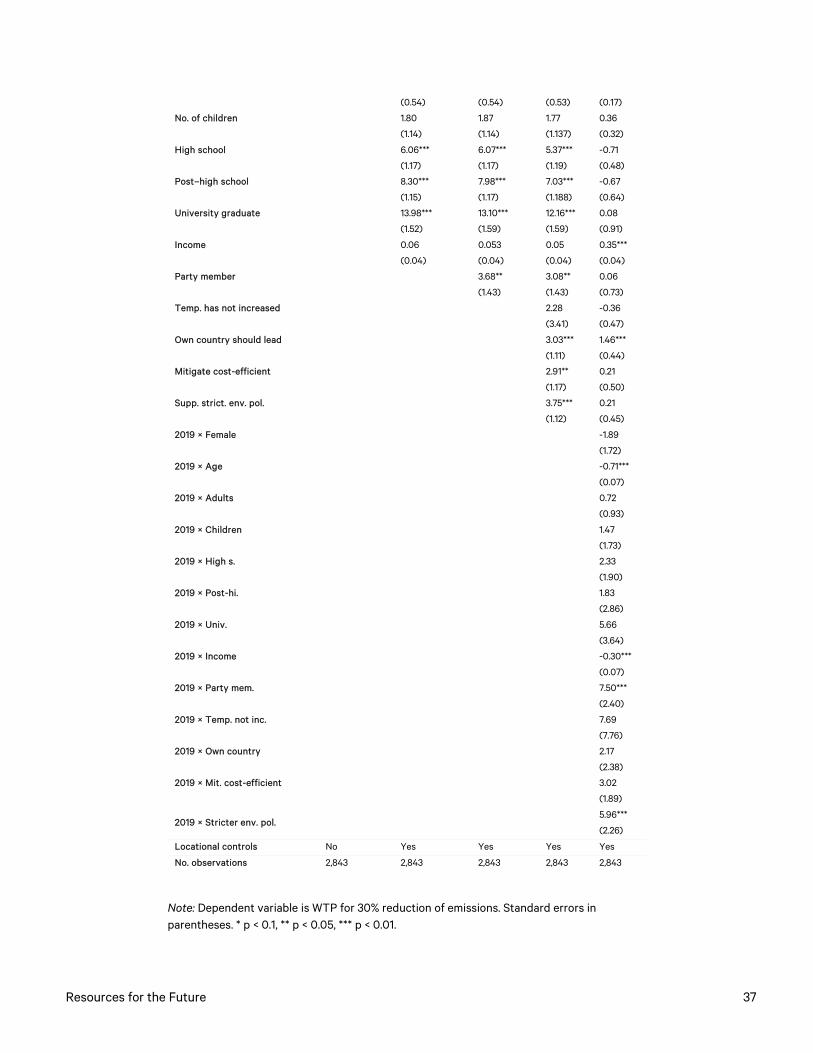
Resources for the Future 37
(0.54) (0.54) (0.53) (0.17)
No. of children
1.80 1.87 1.77 0.36
(1.14) (1.14) (1.137) (0.32)
High school
6.06*** 6.07*** 5.37*** -0.71
(1.17) (1.17) (1.19) (0.48)
Post–high school
8.30*** 7.98*** 7.03*** -0.67
(1.15) (1.17) (1.188) (0.64)
University graduate
13.98*** 13.10*** 12.16*** 0.08
(1.52) (1.59) (1.59) (0.91)
Income
0.06 0.053 0.05 0.35***
(0.04) (0.04) (0.04) (0.04)
Party member
3.68** 3.08** 0.06
(1.43) (1.43) (0.73)
Temp. has not increased
2.28 -0.36
(3.41) (0.47)
Own country should lead
3.03*** 1.46***
(1.11) (0.44)
Mitigate cost-efficient
2.91** 0.21
(1.17) (0.50)
Supp. strict. env. pol.
3.75*** 0.21
(1.12) (0.45)
2019 × Female
-1.89
(1.72)
2019 × Age
-0.71***
(0.07)
2019 × Adults
0.72
(0.93)
2019 × Children
1.47
(1.73)
2019 × High s.
2.33
(1.90)
2019 × Post-hi.
1.83
(2.86)
2019 × Univ.
5.66
(3.64)
2019 × Income
-0.30***
(0.07)
2019 × Party mem.
7.50***
(2.40)
2019 × Temp. not inc.
7.69
(7.76)
2019 × Own country
2.17
(2.38)
2019 × Mit. cost-efficient
3.02
(1.89)
2019 × Stricter env. pol. 5.96***
(2.26)
Locational controls No Yes Yes Yes Yes
No. observations 2,843 2,843 2,843 2,843 2,843
Note: Dependent variable is WTP for 30% reduction of emissions. Standard errors in parentheses. * p < 0.1, ** p < 0.05, *** p < 0.01.
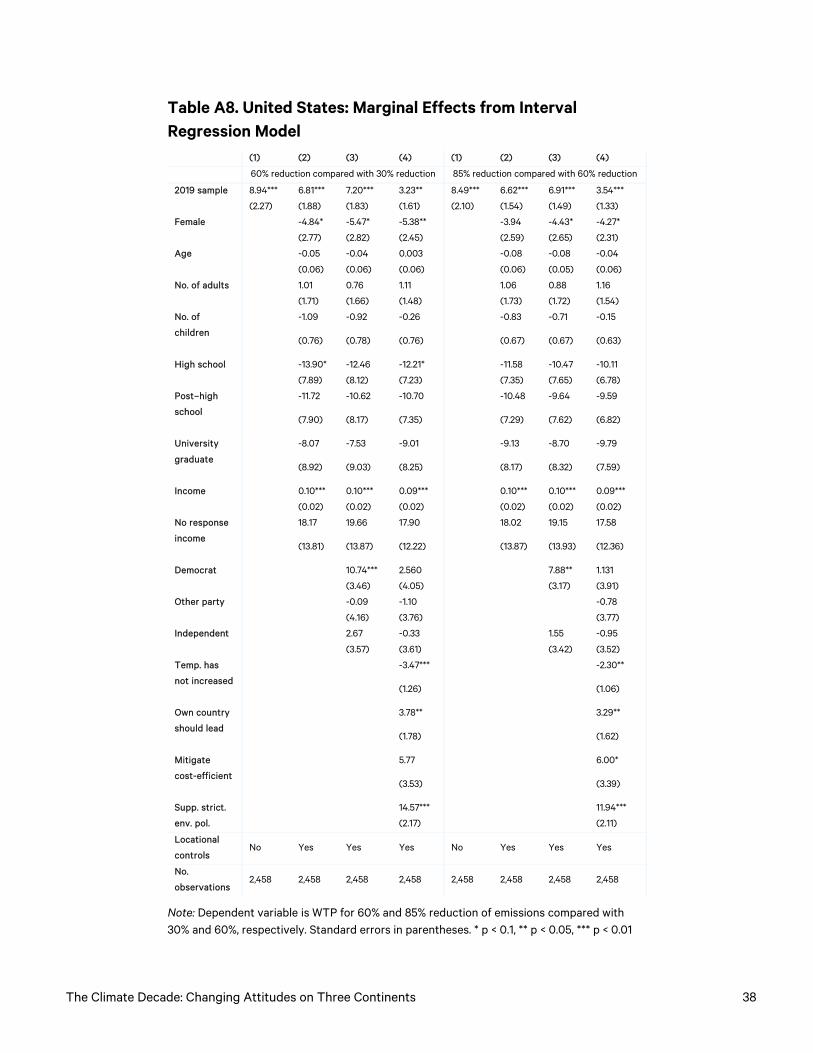
The Climate Decade: Changing Attitudes on Three Continents 38
Table A8. United States: Marginal Effects from Interval Regression Model
(1) (2) (3) (4) (1) (2) (3) (4)
60% reduction compared with 30% reduction 85% reduction compared with 60% reduction
2019 sample
8.94*** 6.81*** 7.20*** 3.23** 8.49*** 6.62*** 6.91*** 3.54***
(2.27) (1.88) (1.83) (1.61) (2.10) (1.54) (1.49) (1.33)
Female
-4.84* -5.47* -5.38** -3.94 -4.43* -4.27*
(2.77) (2.82) (2.45) (2.59) (2.65) (2.31)
Age
-0.05 -0.04 0.003 -0.08 -0.08 -0.04
(0.06) (0.06) (0.06) (0.06) (0.05) (0.06)
No. of adults
1.01 0.76 1.11 1.06 0.88 1.16
(1.71) (1.66) (1.48) (1.73) (1.72) (1.54)
No. of
children
-1.09 -0.92 -0.26 -0.83 -0.71 -0.15
(0.76) (0.78) (0.76) (0.67) (0.67) (0.63)
High school
-13.90* -12.46 -12.21* -11.58 -10.47 -10.11
(7.89) (8.12) (7.23) (7.35) (7.65) (6.78)
Post–high
school
-11.72 -10.62 -10.70 -10.48 -9.64 -9.59
(7.90) (8.17) (7.35) (7.29) (7.62) (6.82)
University
graduate
-8.07 -7.53 -9.01 -9.13 -8.70 -9.79
(8.92) (9.03) (8.25) (8.17) (8.32) (7.59)
Income
0.10*** 0.10*** 0.09*** 0.10*** 0.10*** 0.09***
(0.02) (0.02) (0.02) (0.02) (0.02) (0.02)
No response
income
18.17 19.66 17.90 18.02 19.15 17.58
(13.81) (13.87) (12.22) (13.87) (13.93) (12.36)
Democrat
10.74*** 2.560 7.88** 1.131
(3.46) (4.05) (3.17) (3.91)
Other party
-0.09 -1.10 -0.78
(4.16) (3.76) (3.77)
Independent
2.67 -0.33 1.55 -0.95
(3.57) (3.61) (3.42) (3.52)
Temp. has
not increased
-3.47*** -2.30**
(1.26) (1.06)
Own country
should lead
3.78** 3.29**
(1.78) (1.62)
Mitigate
cost-efficient
5.77 6.00*
(3.53) (3.39)
Supp. strict.
env. pol.
14.57*** 11.94***
(2.17) (2.11)
Locational
controls No Yes Yes Yes No Yes Yes Yes
No.
observations 2,458 2,458 2,458 2,458 2,458 2,458 2,458 2,458
Note: Dependent variable is WTP for 60% and 85% reduction of emissions compared with 30% and 60%, respectively. Standard errors in parentheses. * p < 0.1, ** p < 0.05, *** p < 0.01
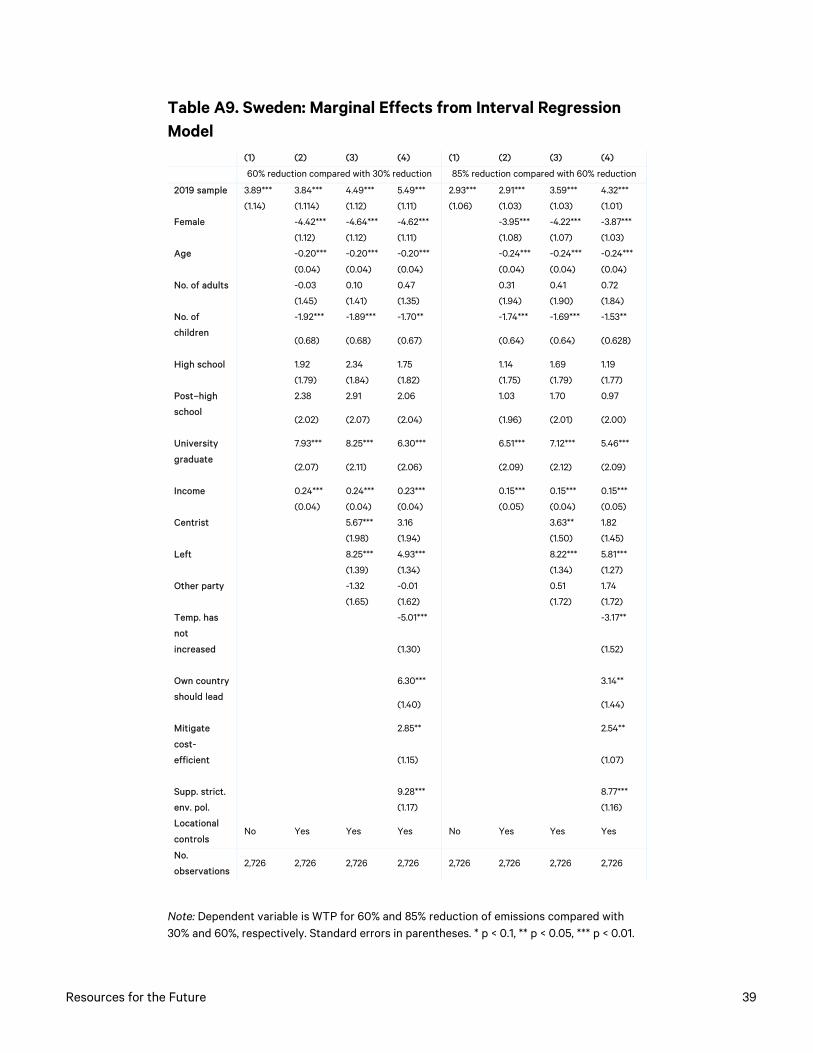
Resources for the Future 39
Table A9. Sweden: Marginal Effects from Interval Regression Model
(1) (2) (3) (4) (1) (2) (3) (4)
60% reduction compared with 30% reduction 85% reduction compared with 60% reduction
2019 sample
3.89*** 3.84*** 4.49*** 5.49*** 2.93*** 2.91*** 3.59*** 4.32***
(1.14) (1.114) (1.12) (1.11) (1.06) (1.03) (1.03) (1.01)
Female
-4.42*** -4.64*** -4.62*** -3.95*** -4.22*** -3.87***
(1.12) (1.12) (1.11) (1.08) (1.07) (1.03)
Age
-0.20*** -0.20*** -0.20*** -0.24*** -0.24*** -0.24***
(0.04) (0.04) (0.04) (0.04) (0.04) (0.04)
No. of adults
-0.03 0.10 0.47 0.31 0.41 0.72
(1.45) (1.41) (1.35) (1.94) (1.90) (1.84)
No. of
children
-1.92*** -1.89*** -1.70** -1.74*** -1.69*** -1.53**
(0.68) (0.68) (0.67) (0.64) (0.64) (0.628)
High school
1.92 2.34 1.75 1.14 1.69 1.19
(1.79) (1.84) (1.82) (1.75) (1.79) (1.77)
Post–high
school
2.38 2.91 2.06 1.03 1.70 0.97
(2.02) (2.07) (2.04) (1.96) (2.01) (2.00)
University
graduate
7.93*** 8.25*** 6.30*** 6.51*** 7.12*** 5.46***
(2.07) (2.11) (2.06) (2.09) (2.12) (2.09)
Income
0.24*** 0.24*** 0.23*** 0.15*** 0.15*** 0.15***
(0.04) (0.04) (0.04) (0.05) (0.04) (0.05)
Centrist
5.67*** 3.16 3.63** 1.82
(1.98) (1.94) (1.50) (1.45)
Left
8.25*** 4.93*** 8.22*** 5.81***
(1.39) (1.34) (1.34) (1.27)
Other party
-1.32 -0.01 0.51 1.74
(1.65) (1.62) (1.72) (1.72)
Temp. has
not
increased
-5.01*** -3.17**
(1.30) (1.52)
Own country
should lead
6.30*** 3.14**
(1.40) (1.44)
Mitigate
cost-
efficient
2.85** 2.54**
(1.15) (1.07)
Supp. strict.
env. pol.
9.28*** 8.77***
(1.17) (1.16)
Locational
controls No Yes Yes Yes No Yes Yes Yes
No.
observations 2,726 2,726 2,726 2,726 2,726 2,726 2,726 2,726
Note: Dependent variable is WTP for 60% and 85% reduction of emissions compared with 30% and 60%, respectively. Standard errors in parentheses. * p < 0.1, ** p < 0.05, *** p < 0.01.
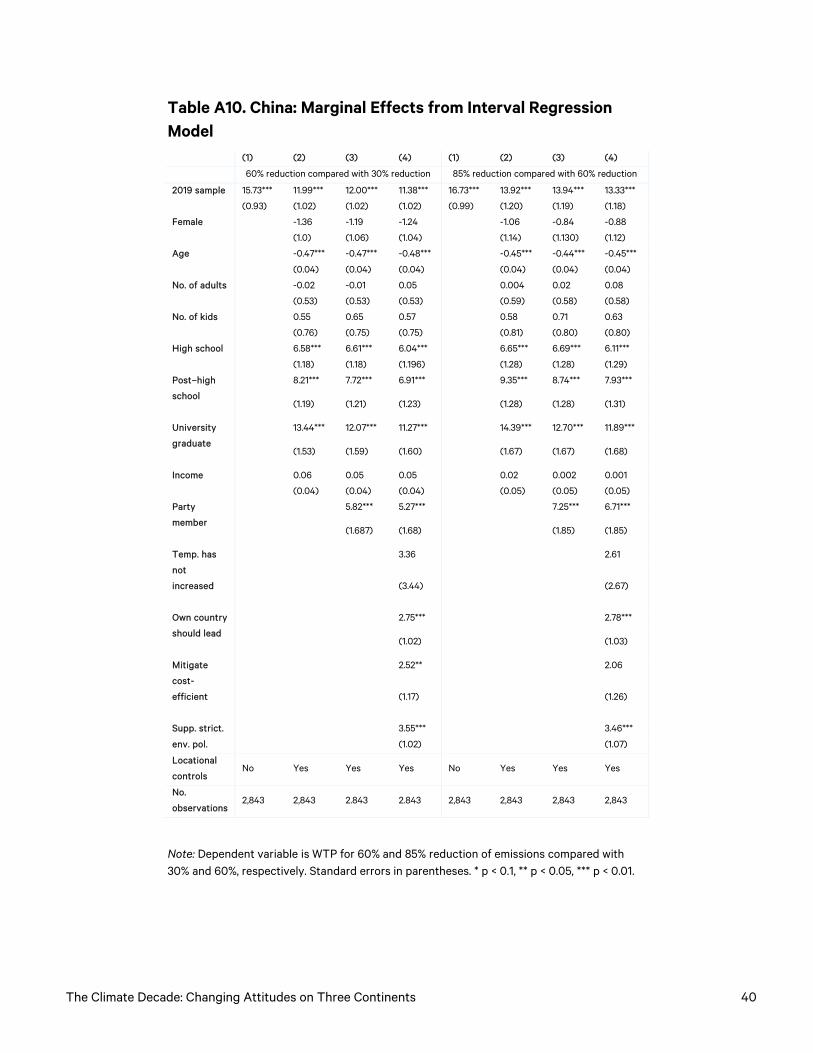
The Climate Decade: Changing Attitudes on Three Continents 40
Table A10. China: Marginal Effects from Interval Regression Model (1) (2) (3) (4) (1) (2) (3) (4)
60% reduction compared with 30% reduction 85% reduction compared with 60% reduction
2019 sample
15.73*** 11.99*** 12.00*** 11.38*** 16.73*** 13.92*** 13.94*** 13.33***
(0.93) (1.02) (1.02) (1.02) (0.99) (1.20) (1.19) (1.18)
Female
-1.36 -1.19 -1.24 -1.06 -0.84 -0.88
(1.0) (1.06) (1.04) (1.14) (1.130) (1.12)
Age
-0.47*** -0.47*** -0.48*** -0.45*** -0.44*** -0.45***
(0.04) (0.04) (0.04) (0.04) (0.04) (0.04)
No. of adults
-0.02 -0.01 0.05 0.004 0.02 0.08
(0.53) (0.53) (0.53) (0.59) (0.58) (0.58)
No. of kids
0.55 0.65 0.57 0.58 0.71 0.63
(0.76) (0.75) (0.75) (0.81) (0.80) (0.80)
High school
6.58*** 6.61*** 6.04*** 6.65*** 6.69*** 6.11***
(1.18) (1.18) (1.196) (1.28) (1.28) (1.29)
Post–high
school
8.21*** 7.72*** 6.91*** 9.35*** 8.74*** 7.93***
(1.19) (1.21) (1.23) (1.28) (1.28) (1.31)
University
graduate
13.44*** 12.07*** 11.27*** 14.39*** 12.70*** 11.89***
(1.53) (1.59) (1.60) (1.67) (1.67) (1.68)
Income
0.06 0.05 0.05 0.02 0.002 0.001
(0.04) (0.04) (0.04) (0.05) (0.05) (0.05)
Party
member
5.82*** 5.27*** 7.25*** 6.71***
(1.687) (1.68) (1.85) (1.85)
Temp. has
not
increased
3.36 2.61
(3.44) (2.67)
Own country
should lead
2.75*** 2.78***
(1.02) (1.03)
Mitigate
cost-
efficient
2.52** 2.06
(1.17) (1.26)
Supp. strict.
env. pol.
3.55*** 3.46***
(1.02) (1.07)
Locational
controls No Yes Yes Yes No Yes Yes Yes
No.
observations 2,843 2,843 2.843 2.843 2,843 2,843 2,843 2,843
Note: Dependent variable is WTP for 60% and 85% reduction of emissions compared with 30% and 60%, respectively. Standard errors in parentheses. * p < 0.1, ** p < 0.05, *** p < 0.01.
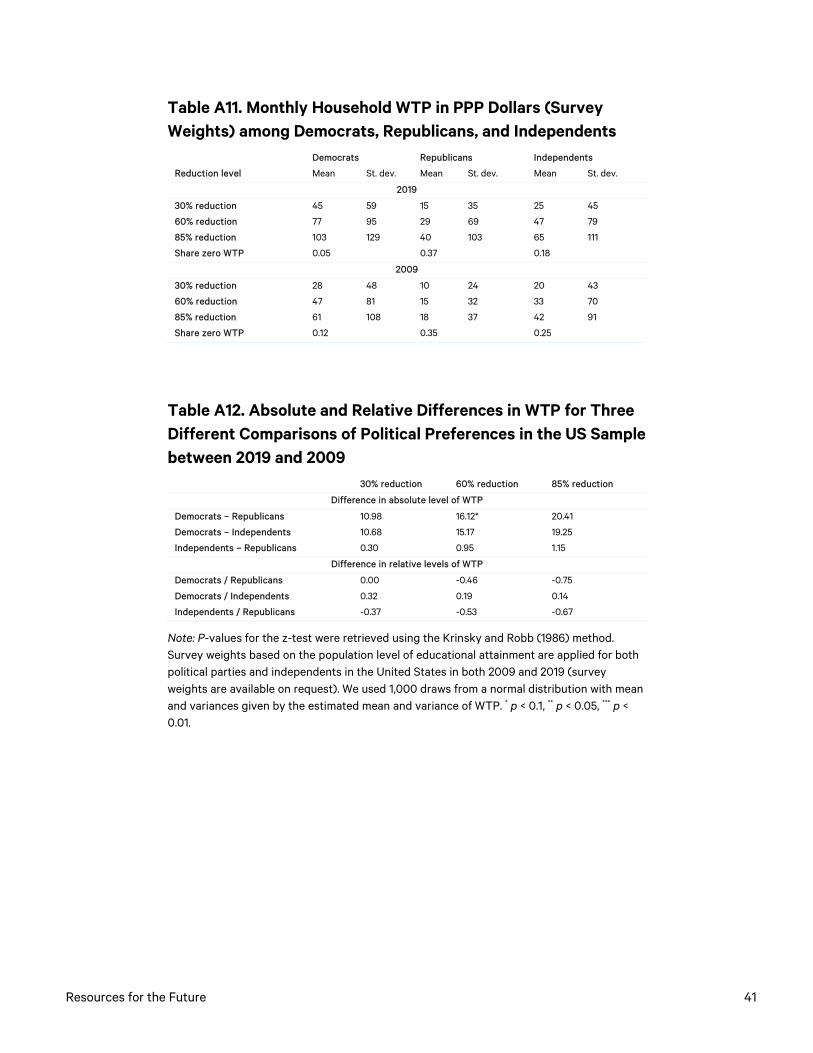
Resources for the Future 41
Table A11. Monthly Household WTP in PPP Dollars (Survey Weights) among Democrats, Republicans, and Independents
Democrats Republicans Independents
Reduction level Mean St. dev. Mean St. dev. Mean St. dev.
2019
30% reduction 45 59 15 35 25 45
60% reduction 77 95 29 69 47 79
85% reduction 103 129 40 103 65 111
Share zero WTP 0.05 0.37 0.18
2009
30% reduction 28 48 10 24 20 43
60% reduction 47 81 15 32 33 70
85% reduction 61 108 18 37 42 91
Share zero WTP 0.12 0.35 0.25
Table A12. Absolute and Relative Differences in WTP for Three Different Comparisons of Political Preferences in the US Sample between 2019 and 2009
30% reduction 60% reduction 85% reduction
Difference in absolute level of WTP
Democrats – Republicans 10.98 16.12* 20.41
Democrats – Independents 10.68 15.17 19.25
Independents – Republicans 0.30 0.95 1.15
Difference in relative levels of WTP
Democrats / Republicans 0.00 -0.46 -0.75
Democrats / Independents 0.32 0.19 0.14
Independents / Republicans -0.37 -0.53 -0.67
Note: P-values for the z-test were retrieved using the Krinsky and Robb (1986) method. Survey weights based on the population level of educational attainment are applied for both political parties and independents in the United States in both 2009 and 2019 (survey weights are available on request). We used 1,000 draws from a normal distribution with mean and variances given by the estimated mean and variance of WTP. * p < 0.1, ** p < 0.05, *** p < 0.01.
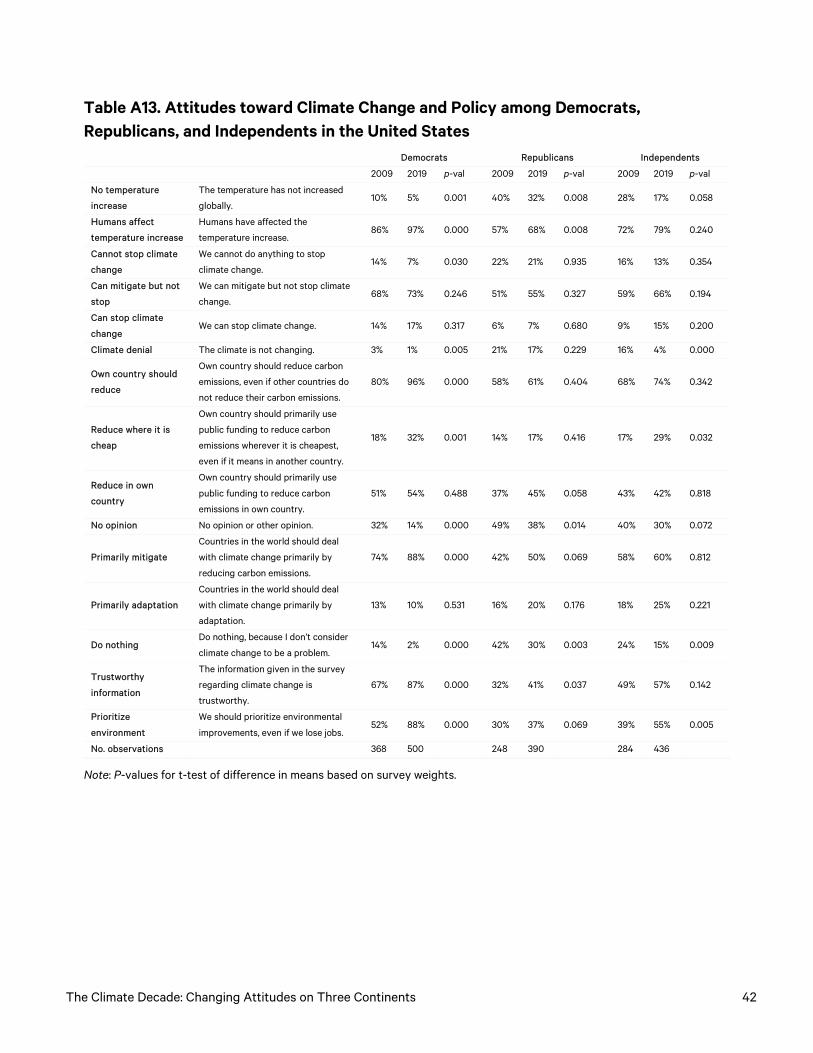
The Climate Decade: Changing Attitudes on Three Continents 42
Table A13. Attitudes toward Climate Change and Policy among Democrats, Republicans, and Independents in the United States
Democrats Republicans Independents
2009 2019 p-val 2009 2019 p-val 2009 2019 p-val
No temperature
increase
The temperature has not increased
globally. 10% 5% 0.001 40% 32% 0.008 28% 17% 0.058
Humans affect
temperature increase
Humans have affected the
temperature increase. 86% 97% 0.000 57% 68% 0.008 72% 79% 0.240
Cannot stop climate
change
We cannot do anything to stop
climate change. 14% 7% 0.030 22% 21% 0.935 16% 13% 0.354
Can mitigate but not
stop
We can mitigate but not stop climate
change. 68% 73% 0.246 51% 55% 0.327 59% 66% 0.194
Can stop climate
change We can stop climate change. 14% 17% 0.317 6% 7% 0.680 9% 15% 0.200
Climate denial The climate is not changing. 3% 1% 0.005 21% 17% 0.229 16% 4% 0.000
Own country should
reduce
Own country should reduce carbon
emissions, even if other countries do
not reduce their carbon emissions.
80% 96% 0.000 58% 61% 0.404 68% 74% 0.342
Reduce where it is
cheap
Own country should primarily use
public funding to reduce carbon
emissions wherever it is cheapest,
even if it means in another country.
18% 32% 0.001 14% 17% 0.416 17% 29% 0.032
Reduce in own
country
Own country should primarily use
public funding to reduce carbon
emissions in own country.
51% 54% 0.488 37% 45% 0.058 43% 42% 0.818
No opinion No opinion or other opinion. 32% 14% 0.000 49% 38% 0.014 40% 30% 0.072
Primarily mitigate
Countries in the world should deal
with climate change primarily by
reducing carbon emissions.
74% 88% 0.000 42% 50% 0.069 58% 60% 0.812
Primarily adaptation
Countries in the world should deal
with climate change primarily by
adaptation.
13% 10% 0.531 16% 20% 0.176 18% 25% 0.221
Do nothing Do nothing, because I don’t consider
climate change to be a problem. 14% 2% 0.000 42% 30% 0.003 24% 15% 0.009
Trustworthy
information
The information given in the survey
regarding climate change is
trustworthy.
67% 87% 0.000 32% 41% 0.037 49% 57% 0.142
Prioritize
environment
We should prioritize environmental
improvements, even if we lose jobs. 52% 88% 0.000 30% 37% 0.069 39% 55% 0.005
No. observations 368 500 248 390 284 436
Note: P-values for t-test of difference in means based on survey weights.
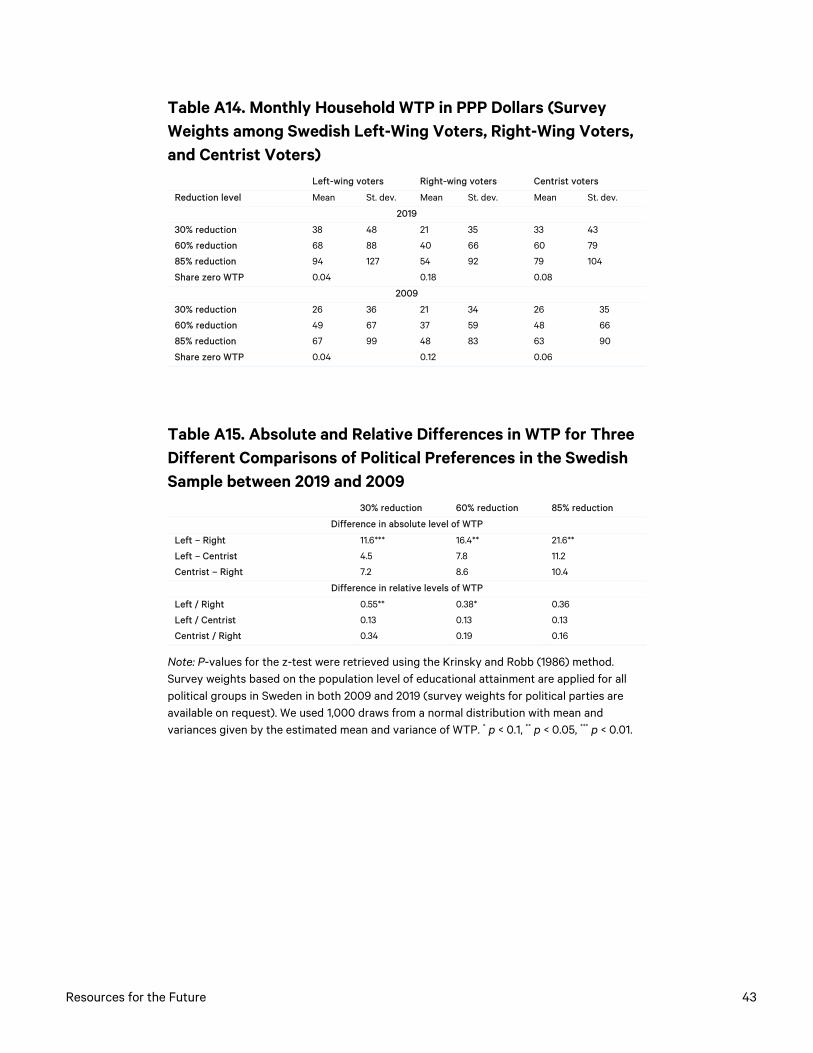
Resources for the Future 43
Table A14. Monthly Household WTP in PPP Dollars (Survey Weights among Swedish Left-Wing Voters, Right-Wing Voters, and Centrist Voters)
Left-wing voters Right-wing voters Centrist voters
Reduction level Mean St. dev. Mean St. dev. Mean St. dev.
2019
30% reduction 38 48 21 35 33 43
60% reduction 68 88 40 66 60 79
85% reduction 94 127 54 92 79 104
Share zero WTP 0.04 0.18 0.08
2009
30% reduction 26 36 21 34 26 35
60% reduction 49 67 37 59 48 66
85% reduction 67 99 48 83 63 90
Share zero WTP 0.04 0.12 0.06
Table A15. Absolute and Relative Differences in WTP for Three Different Comparisons of Political Preferences in the Swedish Sample between 2019 and 2009
30% reduction 60% reduction 85% reduction
Difference in absolute level of WTP
Left – Right 11.6*** 16.4** 21.6**
Left – Centrist 4.5 7.8 11.2
Centrist – Right 7.2 8.6 10.4
Difference in relative levels of WTP
Left / Right 0.55** 0.38* 0.36
Left / Centrist 0.13 0.13 0.13
Centrist / Right 0.34 0.19 0.16
Note: P-values for the z-test were retrieved using the Krinsky and Robb (1986) method. Survey weights based on the population level of educational attainment are applied for all political groups in Sweden in both 2009 and 2019 (survey weights for political parties are available on request). We used 1,000 draws from a normal distribution with mean and variances given by the estimated mean and variance of WTP. * p < 0.1, ** p < 0.05, *** p < 0.01.
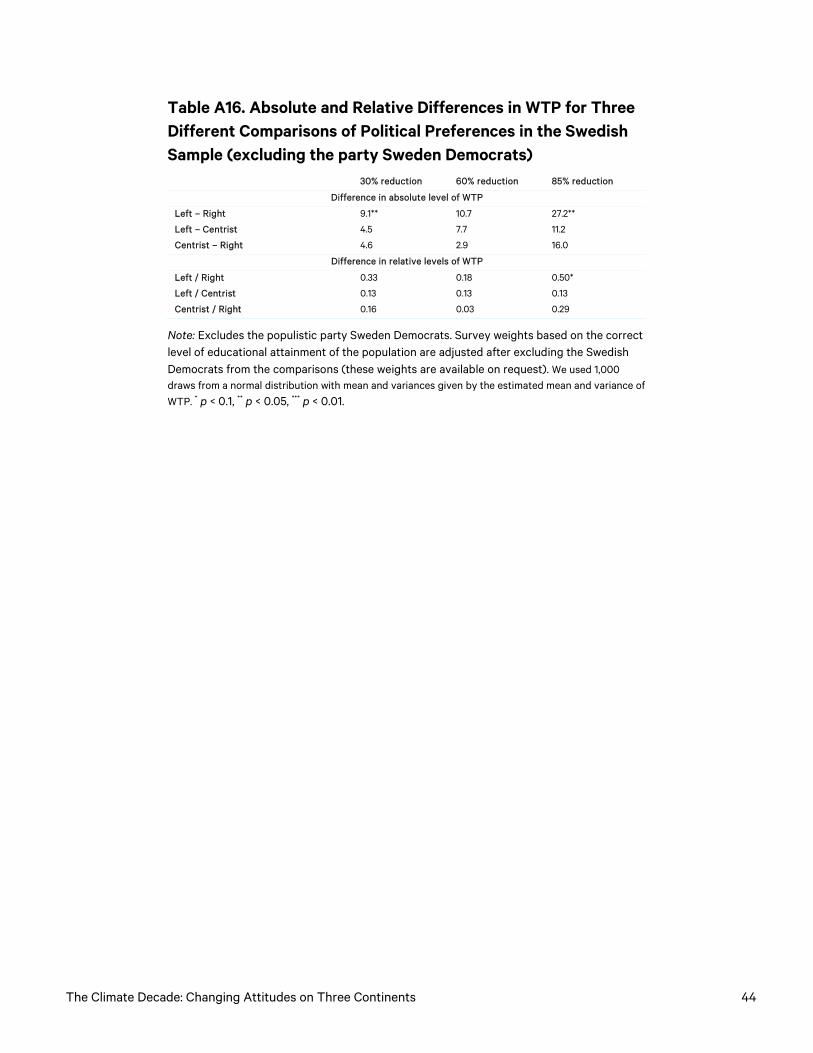
The Climate Decade: Changing Attitudes on Three Continents 44
Table A16. Absolute and Relative Differences in WTP for Three Different Comparisons of Political Preferences in the Swedish Sample (excluding the party Sweden Democrats)
30% reduction 60% reduction 85% reduction
Difference in absolute level of WTP
Left – Right 9.1** 10.7 27.2**
Left – Centrist 4.5 7.7 11.2
Centrist – Right 4.6 2.9 16.0
Difference in relative levels of WTP
Left / Right 0.33 0.18 0.50*
Left / Centrist 0.13 0.13 0.13
Centrist / Right 0.16 0.03 0.29
Note: Excludes the populistic party Sweden Democrats. Survey weights based on the correct level of educational attainment of the population are adjusted after excluding the Swedish Democrats from the comparisons (these weights are available on request). We used 1,000 draws from a normal distribution with mean and variances given by the estimated mean and variance of WTP. * p < 0.1, ** p < 0.05, *** p < 0.01.
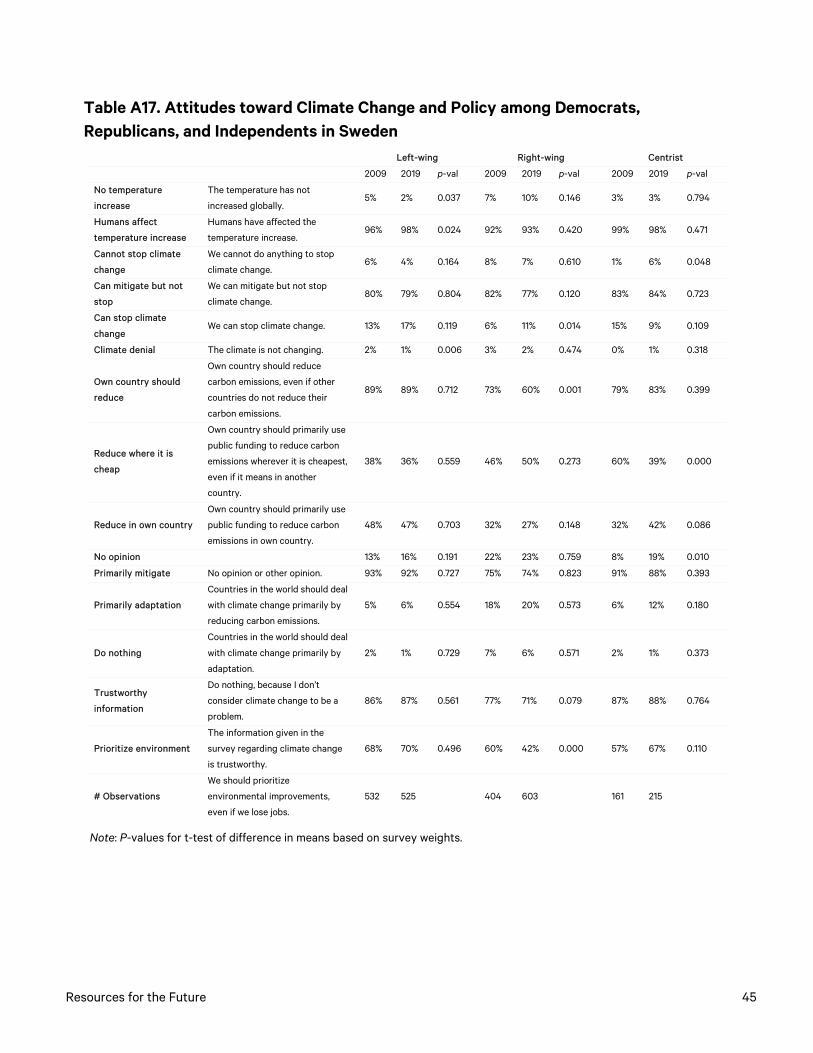
Resources for the Future 45
Table A17. Attitudes toward Climate Change and Policy among Democrats, Republicans, and Independents in Sweden
Left-wing Right-wing Centrist
2009 2019 p-val 2009 2019 p-val 2009 2019 p-val
No temperature
increase
The temperature has not
increased globally. 5% 2% 0.037 7% 10% 0.146 3% 3% 0.794
Humans affect
temperature increase
Humans have affected the
temperature increase. 96% 98% 0.024 92% 93% 0.420 99% 98% 0.471
Cannot stop climate
change
We cannot do anything to stop
climate change. 6% 4% 0.164 8% 7% 0.610 1% 6% 0.048
Can mitigate but not
stop
We can mitigate but not stop
climate change. 80% 79% 0.804 82% 77% 0.120 83% 84% 0.723
Can stop climate
change We can stop climate change. 13% 17% 0.119 6% 11% 0.014 15% 9% 0.109
Climate denial The climate is not changing. 2% 1% 0.006 3% 2% 0.474 0% 1% 0.318
Own country should
reduce
Own country should reduce
carbon emissions, even if other
countries do not reduce their
carbon emissions.
89% 89% 0.712 73% 60% 0.001 79% 83% 0.399
Reduce where it is
cheap
Own country should primarily use
public funding to reduce carbon
emissions wherever it is cheapest,
even if it means in another
country.
38% 36% 0.559 46% 50% 0.273 60% 39% 0.000
Reduce in own country
Own country should primarily use
public funding to reduce carbon
emissions in own country.
48% 47% 0.703 32% 27% 0.148 32% 42% 0.086
No opinion 13% 16% 0.191 22% 23% 0.759 8% 19% 0.010
Primarily mitigate No opinion or other opinion. 93% 92% 0.727 75% 74% 0.823 91% 88% 0.393
Primarily adaptation
Countries in the world should deal
with climate change primarily by
reducing carbon emissions.
5% 6% 0.554 18% 20% 0.573 6% 12% 0.180
Do nothing
Countries in the world should deal
with climate change primarily by
adaptation.
2% 1% 0.729 7% 6% 0.571 2% 1% 0.373
Trustworthy
information
Do nothing, because I don’t
consider climate change to be a
problem.
86% 87% 0.561 77% 71% 0.079 87% 88% 0.764
Prioritize environment
The information given in the
survey regarding climate change
is trustworthy.
68% 70% 0.496 60% 42% 0.000 57% 67% 0.110
# Observations
We should prioritize
environmental improvements,
even if we lose jobs.
532 525 404 603 161 215
Note: P-values for t-test of difference in means based on survey weights.
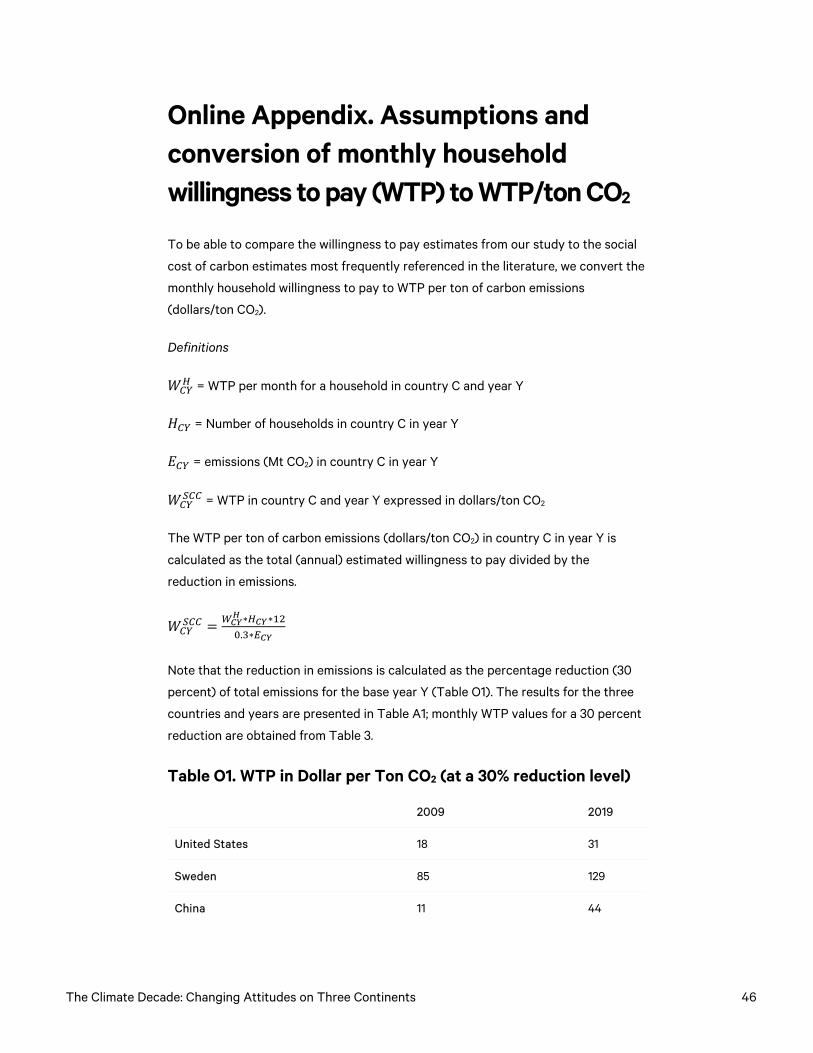
The Climate Decade: Changing Attitudes on Three Continents 46
Online Appendix. Assumptions and conversion of monthly household willingness to pay (WTP) to WTP/ton CO2
To be able to compare the willingness to pay estimates from our study to the social
cost of carbon estimates most frequently referenced in the literature, we convert the
monthly household willingness to pay to WTP per ton of carbon emissions
(dollars/ton CO2).
Definitions
𝑊𝑊𝐶𝐶𝐶𝐶𝐻𝐻 = WTP per month for a household in country C and year Y
𝐻𝐻𝐶𝐶𝐶𝐶 = Number of households in country C in year Y
𝐸𝐸𝐶𝐶𝐶𝐶 = emissions (Mt CO2) in country C in year Y
𝑊𝑊𝐶𝐶𝐶𝐶𝑆𝑆𝐶𝐶𝐶𝐶 = WTP in country C and year Y expressed in dollars/ton CO2
The WTP per ton of carbon emissions (dollars/ton CO2) in country C in year Y is
calculated as the total (annual) estimated willingness to pay divided by the
reduction in emissions.
𝑊𝑊𝐶𝐶𝐶𝐶𝑆𝑆𝐶𝐶𝐶𝐶 = 𝑊𝑊𝐶𝐶𝐶𝐶
𝐻𝐻 ∗𝐻𝐻𝐶𝐶𝐶𝐶∗120.3∗𝐸𝐸𝐶𝐶𝐶𝐶
Note that the reduction in emissions is calculated as the percentage reduction (30
percent) of total emissions for the base year Y (Table O1). The results for the three
countries and years are presented in Table A1; monthly WTP values for a 30 percent
reduction are obtained from Table 3.
Table O1. WTP in Dollar per Ton CO2 (at a 30% reduction level)
2009 2019
United States 18 31
Sweden 85 129
China 11 44
Resources for the Future 47
Data Sources
Emissions data from Global Carbon Atlas
Gilfillan, D., G. Marland, T. Boden, and R. Andres, 2019. ”Global, Regional, and National
Fossil-Fuel CO2 Emissions.” Boone, NC: Carbon Dioxide Information Analysis Center
at Appalachian State University. https://energy.appstate.edu/research/work-
areas/cdiac-appstate (accessed September 27, 2019).
UNFCCC (United Nations Framework Convention on Climate Change). 2019.
“National Inventory Submissions 2019.” https://unfccc.int/process-and-
meetings/transparency-and-reporting/reporting-and-review-under-the-
convention/greenhouse-gas-inventories-annex-i-parties/national-inventory-
submissions-2019 (accessed June 11, 2019).
BP. 2019. “Statistical Review of World Energy.”
https://www.bp.com/en/global/corporate/energy-economics/statistical-review-of-
world-energy.html (accessed June 11, 2019).
Population data
World Bank. https://data.worldbank.org/country/ (accessed November 16, 2020).
Number of persons per household
Sweden: Data from Statistics Sweden 2019 and 2012.
https://www.statistikdatabasen.scb.se/ (accessed November 16, 2020).
United States: Data from https://www.statista.com/statistics/183648/average-size-
of-households-in-the-us/ (accessed November 16, 2020).
China: Data from https://www.statista.com/statistics/278697/average-size-of-
households-in-china/ (accessed November 16, 2020).