Embed Size (px)
Citation preview
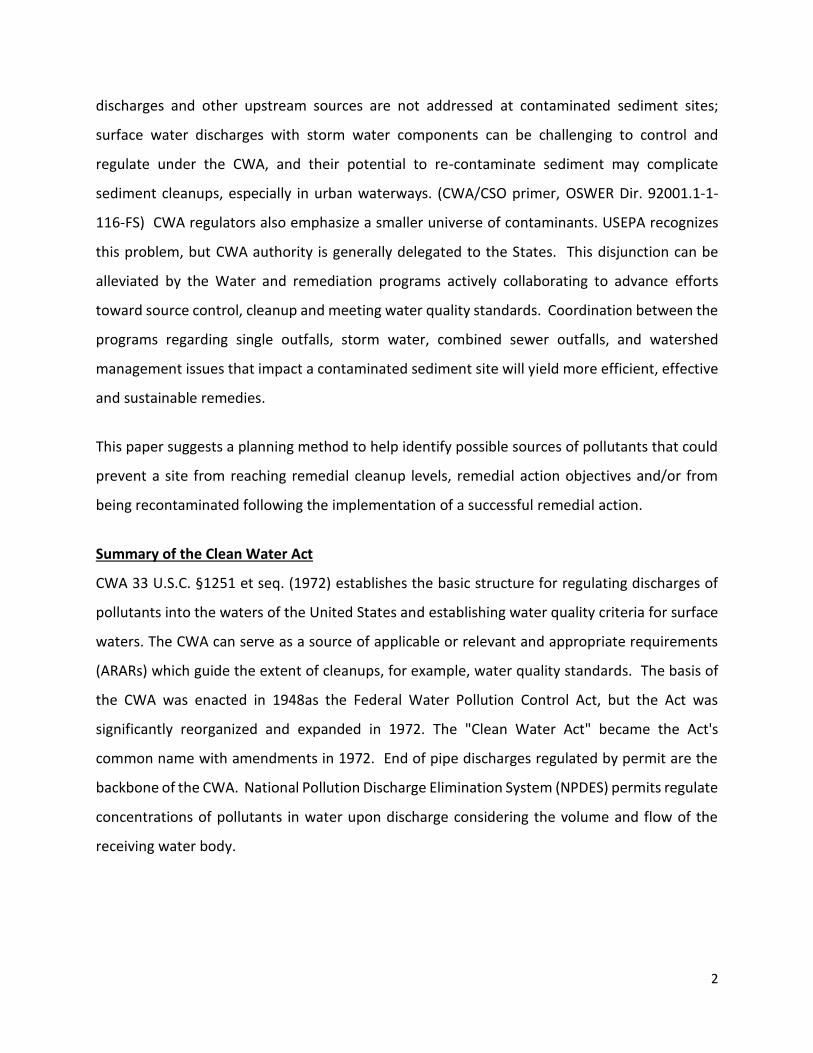
The Clean Water Act and Sediment Remediation
ASTSWMO Sediments Focus Group
April 2016
1
The Clean Water Act (CWA) and Sediment Remediation: Using the Data Quality Objectives Process (DQOs) to Help Assure that Remediated Sediment Sites are
not Re-Contaminated
Introduction
Ensuring that remediated sediment remains uncontaminated is a concern for environmental
decision makers, and the environmental, economic and political consequences of having a site
that has implemented a remedy for sediment contamination to be subsequently re-
contaminated are substantial. Sites can be re-contaminated by many means. Close integration
with Clean Water Act (CWA) authorities can bring a more comprehensive knowledge and
understanding of watershed pollutants to help prevent recontamination (Sediment Remedy
Effectiveness and Recontamination: Selected Case Studies, ASTSWMO, 2013). The primary
audience for this paper is environmental authorities over both the CWA and Comprehensive
Environmental Response, Compensation and Liability Act (CERCLA) in a jurisdiction including
State, federal, Territorial and/or tribal decision makers.
Efforts to address damaged water bodies often rely on the CWA and CERCLA. The CWA regulates
discharges of pollutants to surface water, while CERCLA provides a mechanism for the
assessment and cleanup of surface water and sediment contamination resulting from the release
of hazardous substances that present unacceptable risks to human health and/or the
environment. CWA and CERCLA are linked at contaminated sediment sites because surface water
discharges can be sources of contamination to sediment, and contaminated sediment can be an
ongoing source of contamination to surface water.
Significant resources are expended remediating contaminated sediment, and common sense,
prudent environmental management and fiscal responsibility dictate that strategies to prevent
or minimize the recontamination of remediated sediments, be considered. Yet, there is
sometimes a disjunction between the CWA activities (permitting) and sediment remediation.
Clean-up plans do not always consider variables beyond the immediate sediment project. Often
CWA regulators do not consider possible adverse effects to sediment in general, or, in particular,
to remediated sediment sites within the watershed. Too often the identification of CWA
2
discharges and other upstream sources are not addressed at contaminated sediment sites;
surface water discharges with storm water components can be challenging to control and
regulate under the CWA, and their potential to re-contaminate sediment may complicate
sediment cleanups, especially in urban waterways. (CWA/CSO primer, OSWER Dir. 92001.1-1-
116-FS) CWA regulators also emphasize a smaller universe of contaminants. USEPA recognizes
this problem, but CWA authority is generally delegated to the States. This disjunction can be
alleviated by the Water and remediation programs actively collaborating to advance efforts
toward source control, cleanup and meeting water quality standards. Coordination between the
programs regarding single outfalls, storm water, combined sewer outfalls, and watershed
management issues that impact a contaminated sediment site will yield more efficient, effective
and sustainable remedies.
This paper suggests a planning method to help identify possible sources of pollutants that could
prevent a site from reaching remedial cleanup levels, remedial action objectives and/or from
being recontaminated following the implementation of a successful remedial action.
Summary of the Clean Water Act
CWA 33 U.S.C. §1251 et seq. (1972) establishes the basic structure for regulating discharges of
pollutants into the waters of the United States and establishing water quality criteria for surface
waters. The CWA can serve as a source of applicable or relevant and appropriate requirements
(ARARs) which guide the extent of cleanups, for example, water quality standards. The basis of
the CWA was enacted in 1948as the Federal Water Pollution Control Act, but the Act was
significantly reorganized and expanded in 1972. The "Clean Water Act" became the Act's
common name with amendments in 1972. End of pipe discharges regulated by permit are the
backbone of the CWA. National Pollution Discharge Elimination System (NPDES) permits regulate
concentrations of pollutants in water upon discharge considering the volume and flow of the
receiving water body.
3
CWA Considerations for a Sediment Remediation Site
CWA pollution controls currently range from general practices to detailed engineering designs
for meeting specific objectives. The CWA requires characterization of water bodies and water
sheds to assess need and priority for pollution control and abatement practices. Understanding
major CWA practices and conditions in the surrounding watershed can greatly inform a CERCLA
project about sustainable remediation goals for sediment.
Combined Sewer Outfalls (CSOs)
Prior to the 1950s, untreated sewage and industrial process wastewater was commonly
discharged into waterways. In the 1950s and 1960s, basic sewage treatment was focused on
helping to manage infectious diseases. Through the 1970s water quality criteria were
established to protect natural resources. Meanwhile, the older water treatment systems often
could not meet the newer criteria.
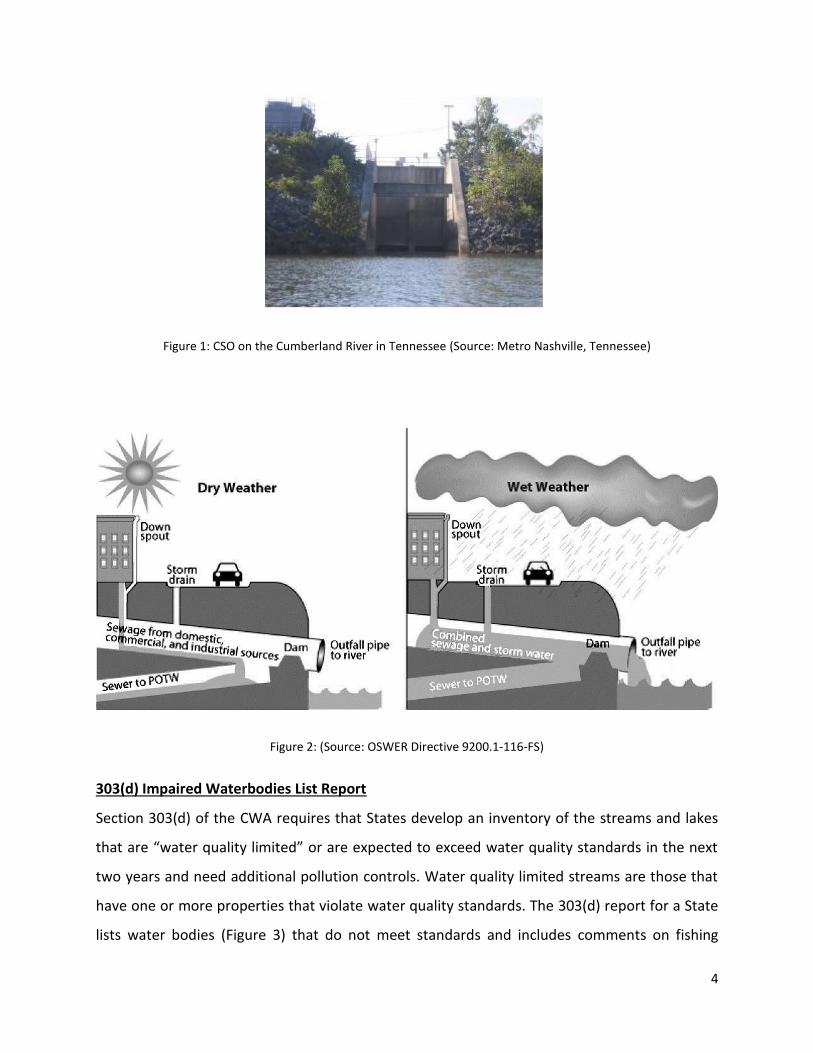
Combined sewer management was a solution, albeit not a perfect one, to protect waterways
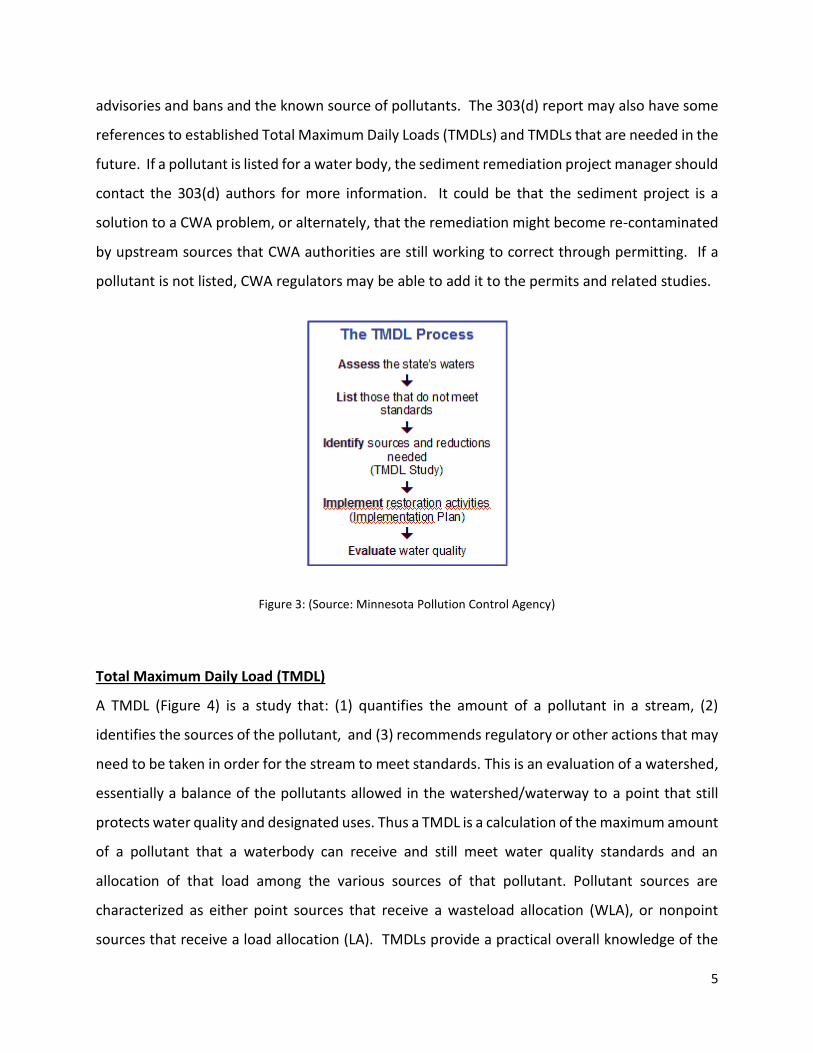
from raw sewage and untreated wastewater during low flows (Figure 1). During rainfall events,
cleaner runoff water mixes with the sewage and process wastewater carried in sanitary sewers
to create a volume that overwhelms treatment capacity and the excess volume bypasses through
CSOs (Figure 2). New and common management practices include diversion and/or capture of
the cleaner runoff water, preventing it from mixing with the sanitary systems; however,
wastewater bypasses are not yet comprehensively implemented across the country.
Managers of sediment remediation projects should identify the existing CSOs that could be a
source of recontamination by working with the CWA regulators and municipalities. They should
know of any contamination sources affecting CSOs and, hence, downstream sediment
remediation projects. See “Long Term Control Plan for Metro Nashville Combined Sewer
Overflows” (2011) for examples of management techniques and diversion devices.
4
Figure 1: CSO on the Cumberland River in Tennessee (Source: Metro Nashville, Tennessee)
Figure 2: (Source: OSWER Directive 9200.1-116-FS)
303(d) Impaired Waterbodies List Report
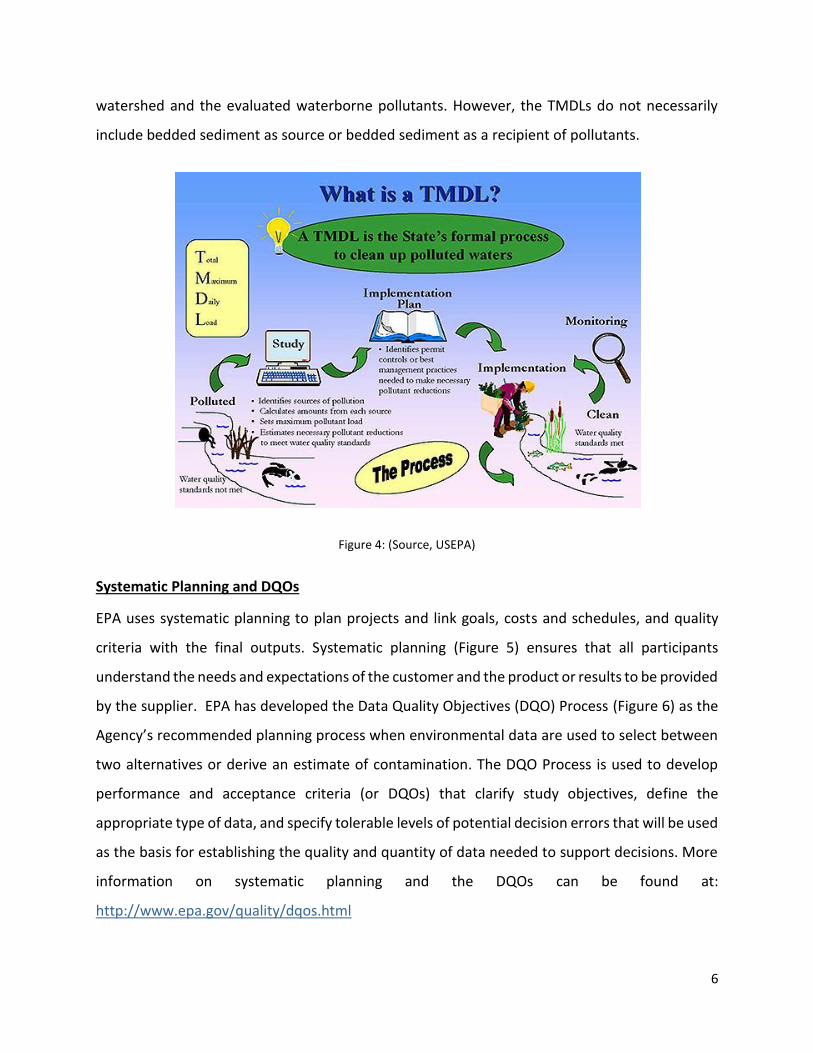
Section 303(d) of the CWA requires that States develop an inventory of the streams and lakes
that are “water quality limited” or are expected to exceed water quality standards in the next
two years and need additional pollution controls. Water quality limited streams are those that
have one or more properties that violate water quality standards. The 303(d) report for a State
lists water bodies (Figure 3) that do not meet standards and includes comments on fishing
5
advisories and bans and the known source of pollutants. The 303(d) report may also have some
references to established Total Maximum Daily Loads (TMDLs) and TMDLs that are needed in the
future. If a pollutant is listed for a water body, the sediment remediation project manager should
contact the 303(d) authors for more information. It could be that the sediment project is a
solution to a CWA problem, or alternately, that the remediation might become re-contaminated
by upstream sources that CWA authorities are still working to correct through permitting. If a
pollutant is not listed, CWA regulators may be able to add it to the permits and related studies.
Figure 3: (Source: Minnesota Pollution Control Agency)
Total Maximum Daily Load (TMDL)
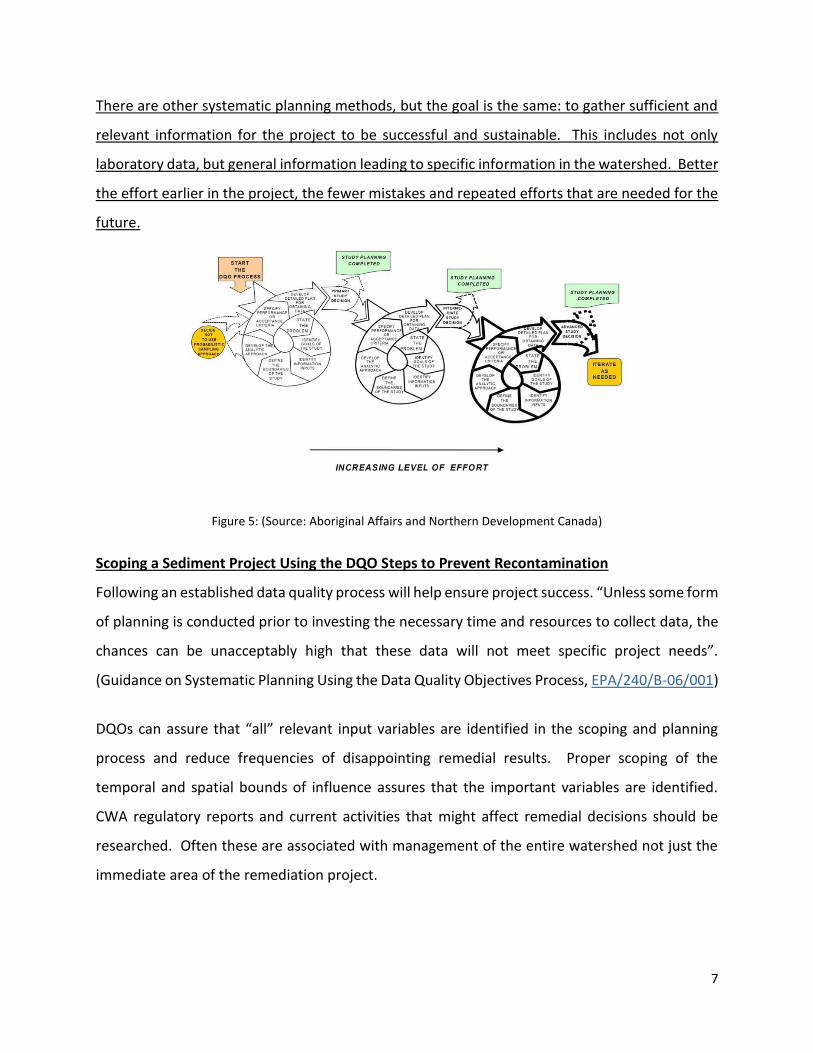
A TMDL (Figure 4) is a study that: (1) quantifies the amount of a pollutant in a stream, (2)
identifies the sources of the pollutant, and (3) recommends regulatory or other actions that may
need to be taken in order for the stream to meet standards. This is an evaluation of a watershed,
essentially a balance of the pollutants allowed in the watershed/waterway to a point that still
protects water quality and designated uses. Thus a TMDL is a calculation of the maximum amount
of a pollutant that a waterbody can receive and still meet water quality standards and an
allocation of that load among the various sources of that pollutant. Pollutant sources are
characterized as either point sources that receive a wasteload allocation (WLA), or nonpoint
sources that receive a load allocation (LA). TMDLs provide a practical overall knowledge of the
6
watershed and the evaluated waterborne pollutants. However, the TMDLs do not necessarily
include bedded sediment as source or bedded sediment as a recipient of pollutants.
Figure 4: (Source, USEPA)
Systematic Planning and DQOs
EPA uses systematic planning to plan projects and link goals, costs and schedules, and quality
criteria with the final outputs. Systematic planning (Figure 5) ensures that all participants
understand the needs and expectations of the customer and the product or results to be provided
by the supplier. EPA has developed the Data Quality Objectives (DQO) Process (Figure 6) as the
Agency’s recommended planning process when environmental data are used to select between
two alternatives or derive an estimate of contamination. The DQO Process is used to develop
performance and acceptance criteria (or DQOs) that clarify study objectives, define the
appropriate type of data, and specify tolerable levels of potential decision errors that will be used
as the basis for establishing the quality and quantity of data needed to support decisions. More
information on systematic planning and the DQOs can be found at:
http://www.epa.gov/quality/dqos.html
7
There are other systematic planning methods, but the goal is the same: to gather sufficient and
relevant information for the project to be successful and sustainable. This includes not only
laboratory data, but general information leading to specific information in the watershed. Better
the effort earlier in the project, the fewer mistakes and repeated efforts that are needed for the
future.
Figure 5: (Source: Aboriginal Affairs and Northern Development Canada)
Scoping a Sediment Project Using the DQO Steps to Prevent Recontamination
Following an established data quality process will help ensure project success. “Unless some form
of planning is conducted prior to investing the necessary time and resources to collect data, the
chances can be unacceptably high that these data will not meet specific project needs”.
(Guidance on Systematic Planning Using the Data Quality Objectives Process, EPA/240/B-06/001)
DQOs can assure that “all” relevant input variables are identified in the scoping and planning
process and reduce frequencies of disappointing remedial results. Proper scoping of the
temporal and spatial bounds of influence assures that the important variables are identified.
CWA regulatory reports and current activities that might affect remedial decisions should be
researched. Often these are associated with management of the entire watershed not just the
immediate area of the remediation project.
8
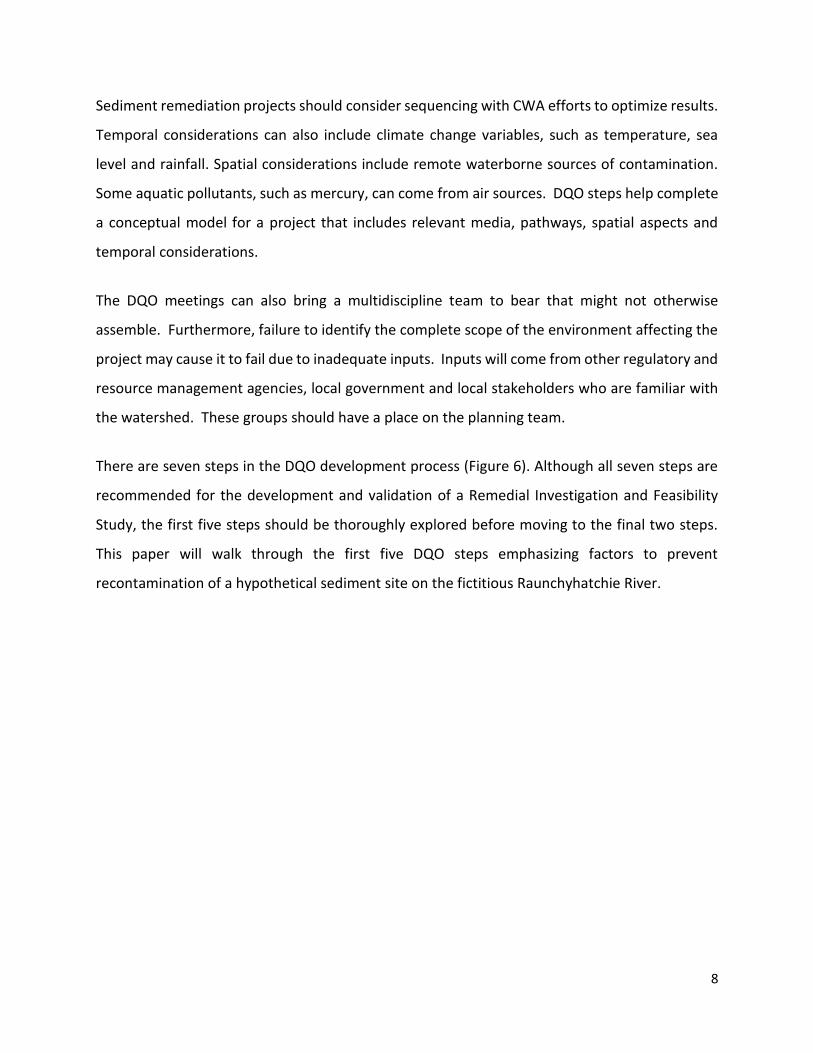
Sediment remediation projects should consider sequencing with CWA efforts to optimize results.
Temporal considerations can also include climate change variables, such as temperature, sea
level and rainfall. Spatial considerations include remote waterborne sources of contamination.
Some aquatic pollutants, such as mercury, can come from air sources. DQO steps help complete
a conceptual model for a project that includes relevant media, pathways, spatial aspects and
temporal considerations.
The DQO meetings can also bring a multidiscipline team to bear that might not otherwise
assemble. Furthermore, failure to identify the complete scope of the environment affecting the
project may cause it to fail due to inadequate inputs. Inputs will come from other regulatory and
resource management agencies, local government and local stakeholders who are familiar with
the watershed. These groups should have a place on the planning team.
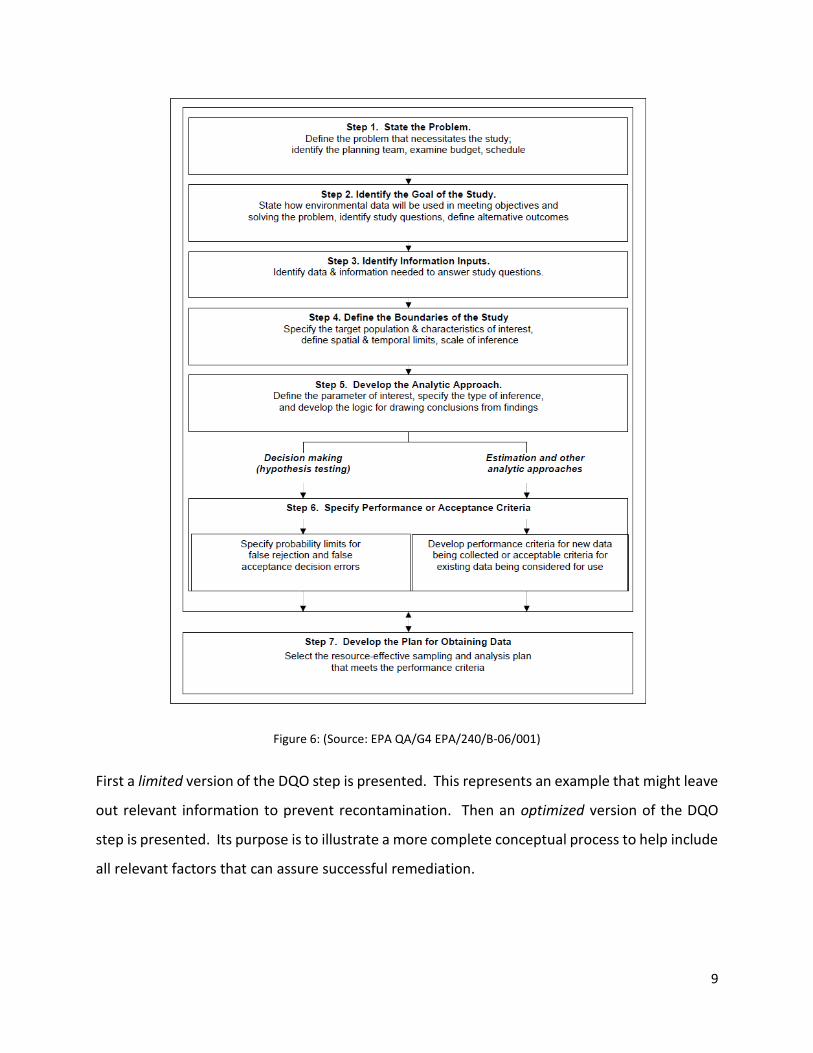
There are seven steps in the DQO development process (Figure 6). Although all seven steps are
recommended for the development and validation of a Remedial Investigation and Feasibility
Study, the first five steps should be thoroughly explored before moving to the final two steps.
This paper will walk through the first five DQO steps emphasizing factors to prevent
recontamination of a hypothetical sediment site on the fictitious Raunchyhatchie River.
9
Figure 6: (Source: EPA QA/G4 EPA/240/B-06/001)
First a limited version of the DQO step is presented. This represents an example that might leave
out relevant information to prevent recontamination. Then an optimized version of the DQO
step is presented. Its purpose is to illustrate a more complete conceptual process to help include
all relevant factors that can assure successful remediation.
10
Step 1: State the Problem
Define the problem that necessitates the study, identify the planning team, examine budget, and
schedule.
Statement of the Problem, limited. The Raunchyhatchie River has fishing advisories for striped
bass and catfish as fish fillet PCB concentrations exceed USEPA, Food and Drug Administration
(FDA), and State criteria. Pilot sampling indicates an area and depth of sediment that is
concentrated enough in PCBs to be considered a source. This sediment volume is defined in a
Remedial Investigation (RI) and a Feasibility Study (FS) (RI/FS) is completed to select an
appropriate remedial alternative.
Statement of the Problem, optimized. The Raunchyhatchie River has fishing advisories for striped
bass and catfish because there are PCB concentrations in fish fillets above the U.S. EPA, FDA, and
State criteria. Pilot sampling indicates an area and depth of sediment that is concentrated
enough in PCBs to be considered a source. The fishing advisory, however, extends far upstream
from the identified area. The advisory is imposed by State CWA or health department authorities
with cooperation from the State fisheries management agency. It is not known if upstream
sources are still contributing to the problem. Are the fish and other aquatic organisms moving
up and down river after they are being locally contaminated? Or, are there still significant sources
of PCBs upstream as well as the recognized local area of sediment contamination? An additional
reach of the Raunchyhatchie River and its tributaries is identified for DQO discussion to assure all
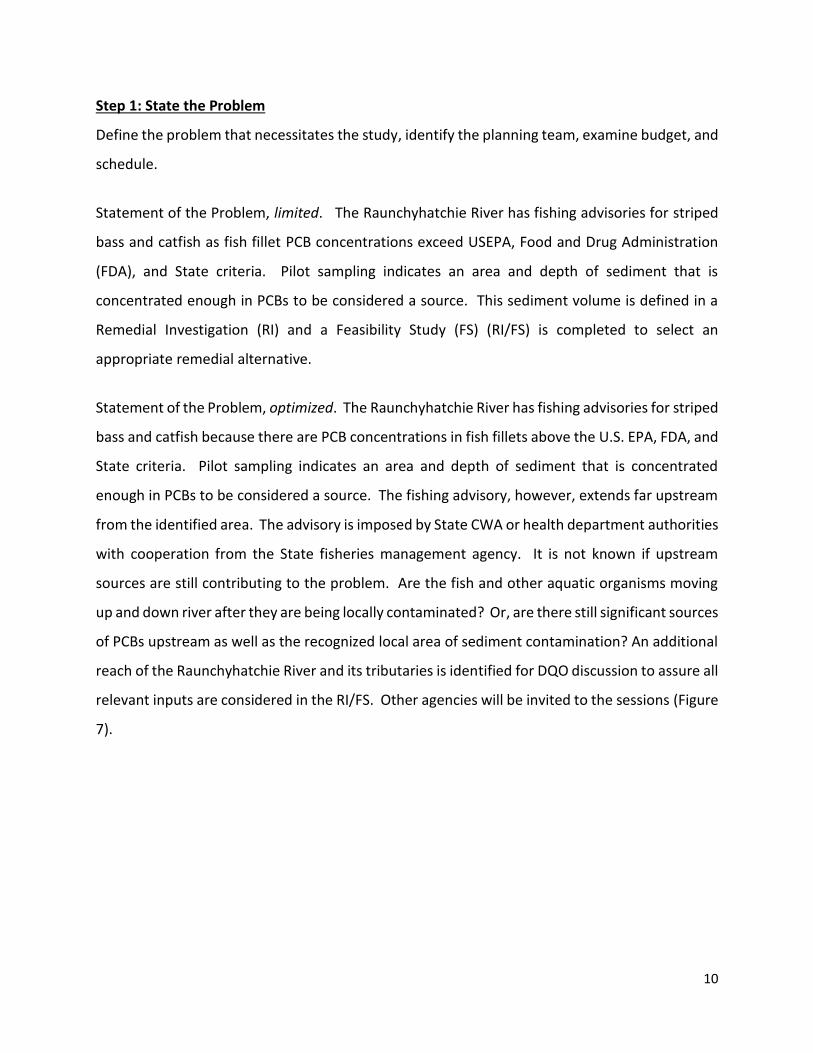
relevant inputs are considered in the RI/FS. Other agencies will be invited to the sessions (Figure
7).
11
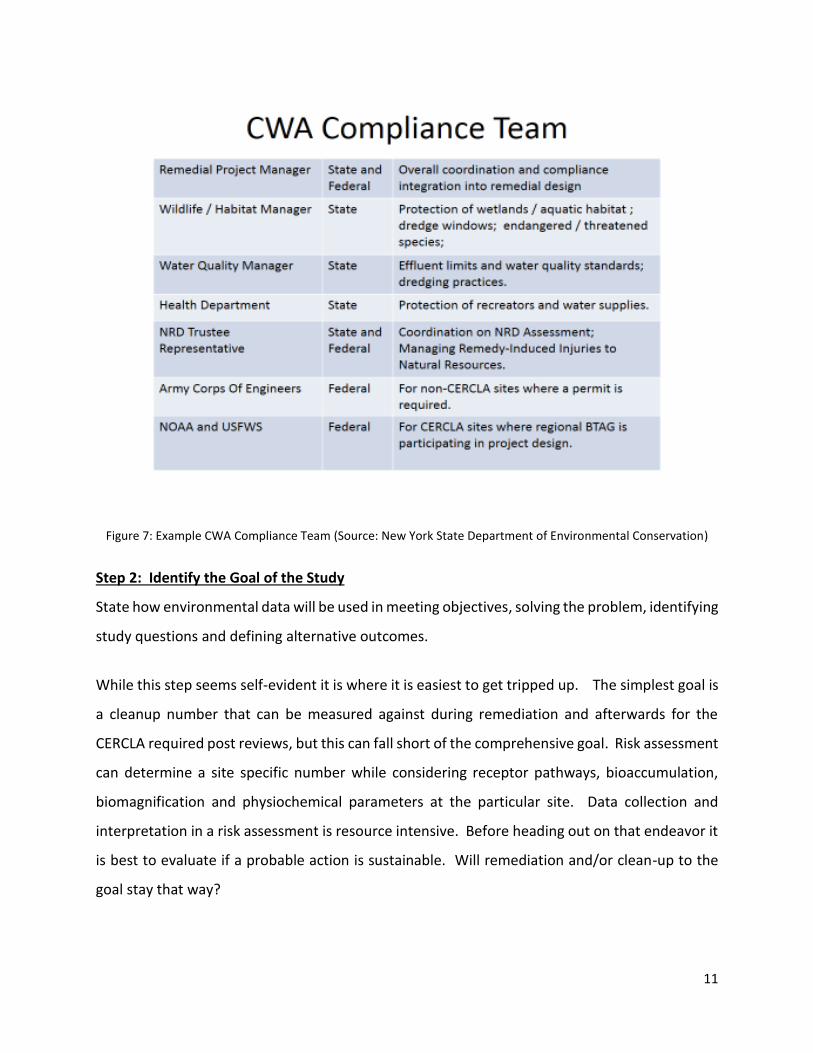
Figure 7: Example CWA Compliance Team (Source: New York State Department of Environmental Conservation)
Step 2: Identify the Goal of the Study
State how environmental data will be used in meeting objectives, solving the problem, identifying
study questions and defining alternative outcomes.
While this step seems self-evident it is where it is easiest to get tripped up. The simplest goal is
a cleanup number that can be measured against during remediation and afterwards for the
CERCLA required post reviews, but this can fall short of the comprehensive goal. Risk assessment
can determine a site specific number while considering receptor pathways, bioaccumulation,
biomagnification and physiochemical parameters at the particular site. Data collection and
interpretation in a risk assessment is resource intensive. Before heading out on that endeavor it
is best to evaluate if a probable action is sustainable. Will remediation and/or clean-up to the
goal stay that way?
12
Identify the Goal of the Study, limited. Reduce the sediment concentration of PCBs in the defined
area to a regulatory standard (ARAR) or risk based number.
Identify the Goal of the Study, optimized. Reduce the concentration of PCBs in the defined area
of contamination in order to remove the fishing advisories and prevent recontamination of the
remediated sediment site.
Step 3: Identify Information Inputs
Identify data and information needed to answer study questions. The purpose of this step is to
identify data and information needed to answer study questions. Questions about upstream
sources are important to include in the study questions at most sediment sites. Because
significant amounts of information may have been collected previously by other entities, the
inclusion of all relevant stakeholders will ensure this information is considered and will provide
the most complete list of study questions. The stakeholders shown in Figure 7 make up the
planning team for the Raunchyhatchie River project.
Information Inputs, limited. Basic regulatory standards and guidance that make the immediate
result of the work at the known area of contamination compliant with State and federal law.
ARARs are documented with the expectation that the project will attain them during and after
remediation.
Information Inputs, optimized. Basic regulatory standards and guidance that makes the
immediate result of the work at the known area of contamination compliant with State and
federal law. ARARs are documented in a Record of Decision (ROD) with the expectation that the
project will attain them during and after remediation. There is a relative paucity of regulatory
standards applicable to sediments that can be used as ARARs. Land disposal standards or soil
Preliminary Remediation Goals (PRGs) as sediment remedial goals may not be protective.
Discharges during remediation are subject to the applicable requirements of the CWA. Recognize
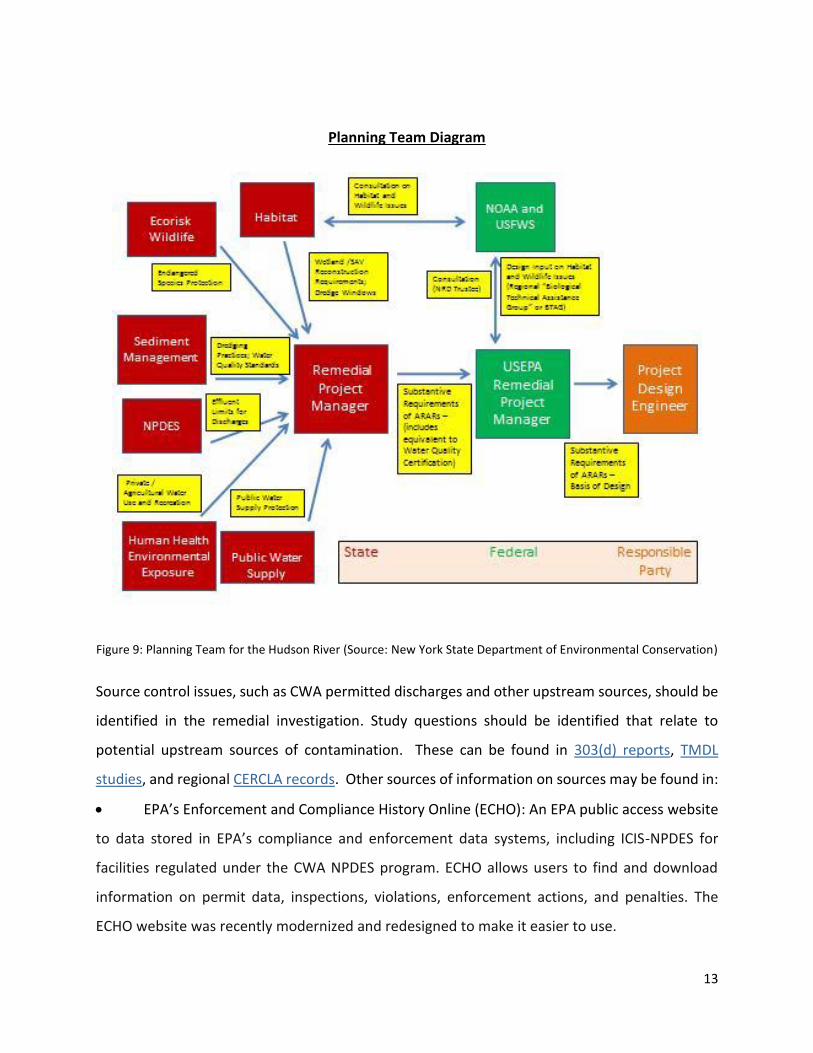
that different agencies have responsibility for different aspects (Figure 9). Site specific human
health and ecological risk assessments should be performed to assure that both human and
ecological receptors are protected.
13
Planning Team Diagram
Figure 9: Planning Team for the Hudson River (Source: New York State Department of Environmental Conservation)
Source control issues, such as CWA permitted discharges and other upstream sources, should be
identified in the remedial investigation. Study questions should be identified that relate to
potential upstream sources of contamination. These can be found in 303(d) reports, TMDL
studies, and regional CERCLA records. Other sources of information on sources may be found in:
EPA’s Enforcement and Compliance History Online (ECHO): An EPA public access website
to data stored in EPA’s compliance and enforcement data systems, including ICIS-NPDES for
facilities regulated under the CWA NPDES program. ECHO allows users to find and download
information on permit data, inspections, violations, enforcement actions, and penalties. The
ECHO website was recently modernized and redesigned to make it easier to use.
14
The CWA Discharge Monitoring Reports (DMR) Pollutant Loading Tool: Designed to help
determine who is discharging, what pollutants are being discharged and how much, and where
they are discharging. Provides and calculates water discharge information from the EPA system
for water enforcement and compliance data and from the Toxics Release Inventory (2007-2011).
It can be searched by location, watershed, pollutant, or industry.
EPA’s “My WATERS Mapper”- Displays snapshots of EPA Office of Water program data
and enables you to create customized maps at national and local scales. The “Other EPA Water
Data” section allows the user to display all NPDES facilities on a map, along with several other
features, such as impaired waters and waters with TMDLs.
Municipalities are constantly managing utility systems and tactical discussions with them can
identify the relative performance of their CSOs during rain events. Discussions with other
authorities and stakeholders will lead to other relevant goal related questions. For example,
State fisheries managers can advise whether the population of fish is resident or migratory, the
fraction of uptake from the known area and through what trophic level and prey species. CWA
authorities likely know what PCB Aroclors or PCB congeners are dominant in the fish tissues.
Fingerprint these to the ones found at the known source area to see if other sources contribute
to the problem. The goal is that all CWA discharges should be considered and addressed in
coordination with CERCLA and the CWA.
Step 4: Define the Boundaries of the Study
Specify the target population and characteristics of interest, define spatial and temporal limits,
and scale of inference.
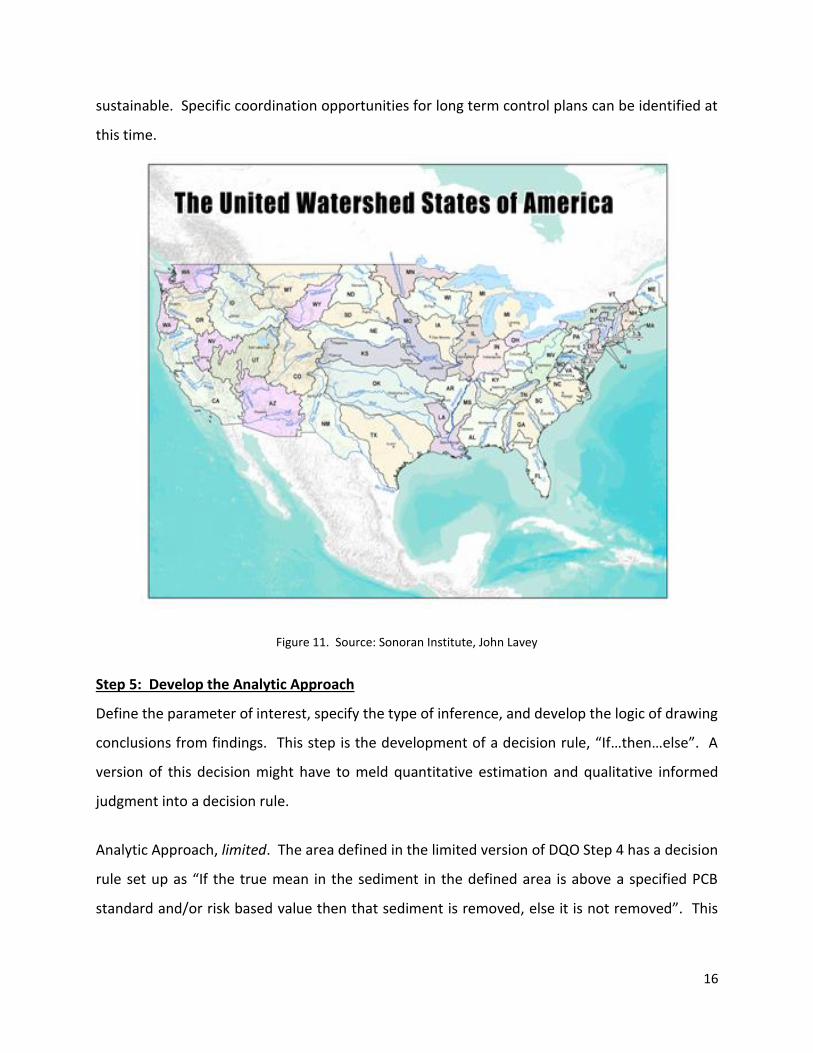
The scale of inference may include the entire watershed or that portion that directly affects the
site. This defined watershed may cross many jurisdictions (Figure 11). The initial focus should
be on direct discharges to the CERCLA site and then expand to consider other discharges in the
watershed. Emphasize sources that have the potential to re-contaminate the site. Temporal
15
factors, such as how long on-site or upstream sources will take to re-contaminate the remediated
site, must be considered. In a way, this step should be performed with the first step. The
boundaries of the study are inherent to the scope of the problem and vice versa. Bounce around
between the steps as much as needed to optimize comprehension of the problem and its true
scope, both spatially and temporally. Concurrent and iterative approaches are appropriate.
Reach agreement on the boundary of the study that can assess sustainability.
Define the Boundaries of the Study, limited. The spatial boundary is the original area confirmed
as contaminated with PCBs above a certain level by the RI. The temporal boundary is the length
of time it takes it takes to complete the project.
Define Boundaries of a Study, optimized. The Raunchyhatchie River sediment and fish have been
contaminated long enough that State CWA authorities and State fisheries managers have had to
manage the resource with fish consumption advisories for decades. Although a defined area of
sediment contaminated with PCBs has been identified, inquiry into upstream sources is prudent
by starting with available CWA documents for the watershed.
For example, the State 303(d) report might list the Raunchyhatchie as not attaining its designated
use for fisheries and fish consumption due to PCBs deposited in sediments. This deposition
originated from an upstream drain release from an electrical manufacturer to a tributary about
60 years ago through what is now a CSO. CWA regulators inform the program manager that the
municipality has prioritized this outfall system for a clean-out of legacy PCBs and refurbishment
with diversion of clean storm water to prevent bypass. This information leads to an expanded
spatial boundary to the study area as well as the fact that the sediment project may need to
sequence after the CSO is corrected. The probability that other PCB sediment deposits also exist
should now be included in the spatial scope. The alternative information might be that the
watershed seems to be free of PCBs upstream from your project area and that the contamination
is attributable to something more local. This kind of information will dictate if and when is the
best time to complete the remediation on the known area of contamination. It dictates the
confidence in whether or not the remediation goals can be reached and that the goals are
16
sustainable. Specific coordination opportunities for long term control plans can be identified at
this time.
Figure 11. Source: Sonoran Institute, John Lavey
Step 5: Develop the Analytic Approach
Define the parameter of interest, specify the type of inference, and develop the logic of drawing
conclusions from findings. This step is the development of a decision rule, “If…then…else”. A
version of this decision might have to meld quantitative estimation and qualitative informed
judgment into a decision rule.
Analytic Approach, limited. The area defined in the limited version of DQO Step 4 has a decision
rule set up as “If the true mean in the sediment in the defined area is above a specified PCB
standard and/or risk based value then that sediment is removed, else it is not removed”. This
17
version ignores the potential for upstream sources to recontaminate this Raunchyhatchie River
area with PCBs.
Analytic Approach, optimized. Review the optimized version of DQO Step 1 to see where an
optimized analytic approach comes from. This decision rule, although no longer purely
quantitative, will provide an overall higher quality decision rule. “If the true mean in the
sediment in the defined area is above a specified PCB standard or risk based value and the re-
contaminating sources are controlled, then that sediment is removed, else it is not removed.”
Determine if upstream or direct sources can re-contaminate on-site sediments. If so, then
coordinate with those implementing the CWA to address the contributing discharge. Recognize
that elements of the CWA are authorized under different agencies (Figure 3) and that the ARARs
may have to be coordinated with the various agencies. This may affect the RI in the bounds of
the available data and the ultimate available action alternatives for the FS. This may even produce
additional action alternatives or bias toward the no action alternative until upstream activities
are controlled. Perhaps the FS now has a phased approach and phase 1 is to control upstream
sources before the phase 2 of sediment removal is completed. Or, to save time, all the work is
done concurrently with enhanced controls.
DQO Step 6: Specify Performance Acceptance Criteria
Performance Acceptance Criteria develop and document probability limits for false rejection and
false acceptance decision errors. This step helps develop performance criteria for new data being
collected or acceptable criteria for existing data being considered for use. But these criteria can
fail to meet project objectives without thorough treatment of the first five DQO steps. Optimized
development of the previous DQOs provides a set of limitations to the power of the statistical
Performance Acceptance Criteria. These limitations may not be quantitative, but based on the
professional judgment of involved agencies and municipalities.
A statistician will be able to test a hypothesis (Performance Acceptance Criteria) with data from
characterization. Data distributions are often not normally distributed and this sometimes
causes the average investigator to get beyond average ability in statistics.

18
Statisticians, though, work best with defined data sets and can inform the team with a defined
level of uncertainty about decision errors. Frankly, one could opine that sometimes the DQO
process is effectively started here without a thorough understanding of the total problem
statement and development of a complete decision rule. The approach is sometimes more about
data quality and what the statistician needs rather than overall project quality. The first five DQO
steps are not always optimized for project success even though data quality for a defined area
may be as high as a statistician would require.
Since the DQO process is modeled after the scientific method, it is pertinent to understand
hypothesis testing. The scientific method is a way to properly perform experiments. One
performs a test to a hypothesis to see if it withstands the test. This does not validate the
hypothesis because it might fail a different test. After many different tests a hypothesis gains
stature as a theory and achieves scientific reputation. Sediment recontamination is like an
experiment where the hypothesis fails a different unanticipated test. It cannot be
overemphasized how important it is to consider all potential sources of recontamination. Indeed
qualitative discussions from knowledgeable agencies and individuals are indispensable.
DQO Step 7: Develop the Plan for Obtaining Data
The goal of Step 7 is to develop a resource-effective design for collecting and measuring
environmental samples, or for generating other types of information needed to address your
problem. This corresponds to generating either (a) the most resource-effective data collection
process that is sufficient to fulfill study objectives, or (b) a data collection process that maximizes
the amount of information available for synthesis and analysis within a fixed budget. In addition,
this design will lead to data that will achieve your performance or acceptance criteria.
(EPA/240/B-06/001, EPA QA/G-4)
The EPA guidance describes data requirements for a defined area, but is less specific about other
information that is often qualitative. Failure to properly develop the early DQO steps hinders the
development of data requirements and subsequent sampling and analysis plan.
19
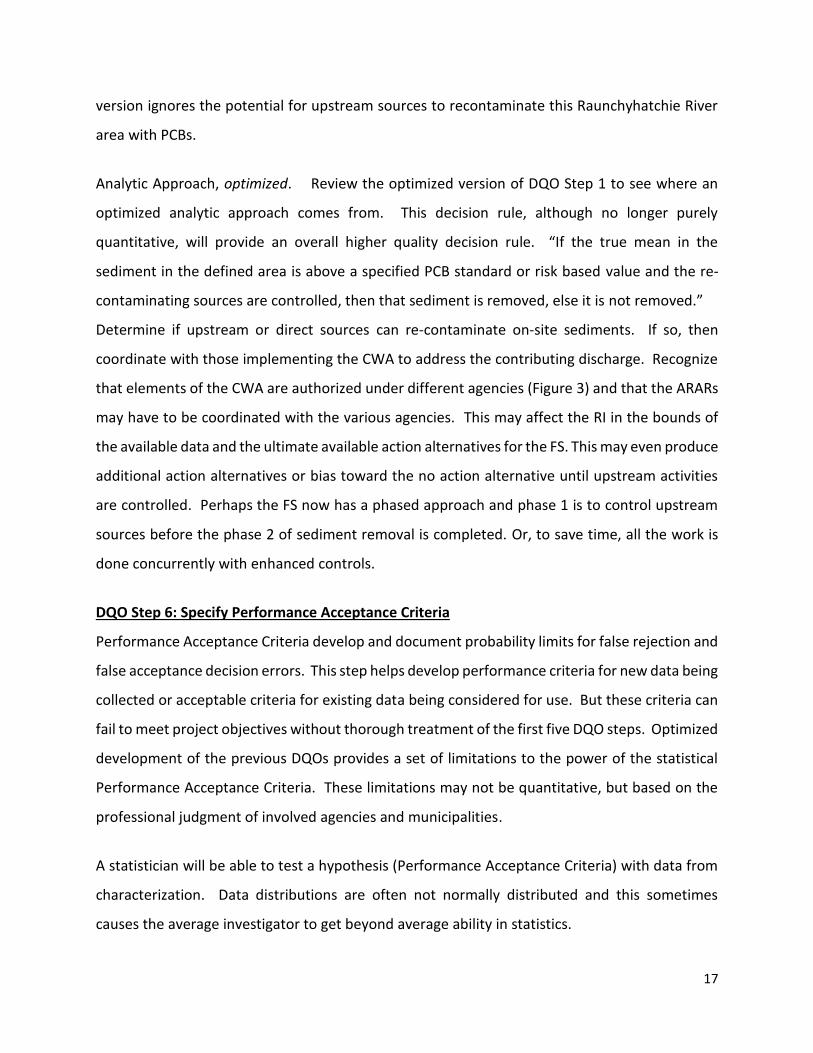
Imagine the difference again in these two decision rules what they mean in terms of a complete
data and information set.
Limited -“If the true mean in the sediment in the defined area is above a specified PCB standard
and/or risk based value then that sediment is removed, else it is not removed”.
Optimized -“If the true mean in the sediment in the defined area is above a specified PCB
standard or risk based value and the re-contaminating sources are controlled, then that sediment
is removed, else it is not removed”.
The optimized version of the decision rule expands the area where data and other information
are required. The additional information is the type that can help to prevent recontamination of
remediated sediment sites. These other information sources can also inform other agencies
toward practices to track and prevent spreading of contamination into fish and wildlife
populations for which they have responsibility.
(Figure 12).
Figure 14. Source: Tennessee Department of Environment and Conservation
20
Summary
By using systematic planning and following the DQO process, including assembling a diverse team
of permitting, health and enforcement professionals, sound decisions on sediment remediation
can be made to improve the likelihood of long term success of any sediment remediation project.
This assemblage should include those knowledgeable about site characterization and data
sources. Surface water environments are dynamic and sediment is affected by multiple sources,
many of which are not related to the source of hazardous substances or petroleum that are
responsible for remedial action. Therefore, it is suggested here that a structured approach be
employed as part of the decision making process for sediment remediation. Difficulty may be
encountered as this approach brings together groups that often are not combined during
traditional cleanups. In addition, regulatory authority is often narrowly defined which may
complicate changes in permits or practices to an entity not directly responsible for the sediment
remediation project. However, by including other potential sources of sediment contamination
in the decision process, the goal of protecting human health and the environment is likely more
efficiently and cost-effectively achieved and ensured over time.
21
References
1. A GUIDE TO PREPARING SUPERFUND PROPOSED PLANS, RECORDS OF DECISION, AND OTHER REMEDY SELECTION DECISION DOCUMENTS (EPA 540-R-98-031)
2. Contaminated Sediment Remediation Guidance for Hazardous Waste Sites (EPA-540-R-05-012)
3. http://water.epa.gov/lawsregs/lawsguidance/cwa/tmdl/glossary.cfm
4. ASTSWMO 2013. Sediment Remedy Effectiveness and Recontamination: Selected Case Studies.
5. http://astswmo.org/
6. http://www.epa.gov/superfund/health/conmedia/sediment/guidance.htm
7. http://water.epa.gov/polwaste/npdes/basics/index.cfm
8. http://www2.epa.gov/laws-regulations/summary-clean-water-act
9. http://www.epa.gov/superfund/policy/cercla.htm
10. OSWER Directive 9200.1-116-FS December 2013. A Primer for Remedial Project Managers on Water Quality Standards and the Regulation of Combined Sewage Overflows under the Clean Water Act --http://www.epa.gov/superfund/health/conmedia/sediment/pdfs/CWA_Primer_Final_-_SAMS_4_-_Dec_10_2013__508.pdf
11. http://www.gpo.gov/fdsys/browse/collectionUScode.action?collectionCode=USCODE
12. FEDERAL WATER POLLUTION CONTROL ACT [As Amended Through P.L. 107–303, November 27, 2002] -- http://www.epw.senate.gov/water.pdf
13. 2011. Long Term Control Plan for Metro Nashville Combined Sewer Overflows.
14. TMDL. http://water.epa.gov/lawsregs/lawsguidance/cwa/tmdl/
15. CWA-Section 3.3 (d): http://water.epa.gov/lawsregs/lawsguidance/cwa/tmdl/overview.cfm
16. EPA DQO: http://www.epa.gov/quality/dqos.html
17. 2006 February. EPA/240/B-06/001. Guidance on Systematic Planning Using the Data Quality Objectives Process EPA QA/G-4. http://www.epa.gov/QUALITY/qs-docs/g4-final.pdf
18. RI/FS: http://www.epa.gov/superfund/cleanup/rifs.htm
19. ARARs: http://www.epa.gov/superfund/policy/remedy/sfremedy/arars.htm
20. Risk Assessment: http://www.epa.gov/oswer/riskassessment/index.htm
22
21. Land Disposal Standards: http://www.epa.gov/osw/hazard/tsd/ldr/
22. PRG Risk Based calculator: http://epa-prgs.ornl.gov/cgi-bin/chemicals/csl_search
23. CERCLA RODs: http://cumulis.epa.gov/superrods/index.cfm?fuseaction=main.search
24. TMDL studies/Data: http://iaspub.epa.gov/waters10/attains_nation_cy.control?p_report_type=T
25. PCB/Aroclors: http://www.epa.gov/epawaste/hazard/tsd/pcbs/pubs/aroclor.htm
26. Liverman, L.A. 2015 Preventing Recontamination for CERCLA Using Clean Water Act Tool: A Reluctant Marriage That’s Actually in Violent Agreement
Acknowledgements
This document was prepared by the ASTSWMO Sediments Focus Group, with assistance from the U.S.
Environmental Protection Agency (EPA) under Cooperative Agreement RT-83500901.