Embed Size (px)
Citation preview
MOORE.DOCX (DO NOT DELETE) 5/22/2015 9:51 AM
1177
THE CIVIL CASELOAD OF THE FEDERAL DISTRICT COURTS
Patricia W. Hatamyar Moore*
This Article responds to changes proposed by Congress and the Advisory Committee on Civil Rules to restrict civil lawsuits by re-forming procedure. It argues that while these changes are purported to be based on empirical studies, there is no reference to actual gov-ernment statistics about whether the civil caseload has grown, whether the median disposition time has increased, or whether the most preva-lent types of civil cases have changed. Based on statistics published by the Administrative Office of the United States Courts, this Article shows that the civil docket has actually stagnated, not exploded. It first looks at trends in the overall volume and duration of federal civil litigation since 1986, suggests a proper methodology for measure-ment, and shows that the rate of increase of civil filings is less than the growth in the country’s population and the increase in judicial re-sources in civil cases, noting that any increase must be attributable to the criminal docket. Next, this Article studies the rates at which cases are terminated by various methods, noting today’s primary method is before pretrial with court action due to dispositive motions and judi-cial management. Third, this Article tracks and explains changes in the “Big Six” categories of civil litigation. Finally, this Article empha-sizes the need to look at the government’s caseload statistics to note that the federal civil caseload has been relatively stable for twenty-five years.
TABLE OF CONTENTS
I. INTRODUCTION .................................................................................. 1178 II. THE OVERALL VOLUME AND DURATION OF FEDERAL CIVIL
LITIGATION SINCE 1986 .................................................................... 1182 A. Counting Civil Case Filings ....................................................... 1183 B. Civil Filings per Authorized Judgeship .................................... 1187
* Professor of Law, St. Thomas University School of Law. I wish to thank Marc Galanter and Philip Habel for their comments on a draft of this Article, and Kevin Scott for helping me understand some statistics of the Administrative Office of the United States Courts. I am also grateful to my re-search assistants, Carey Neal and Tricia Posten, and Research Librarian Courtney Segota, for their cheerful assistance in the preparation of this Article.
MOORE.DOCX (DO NOT DELETE) 5/22/2015 9:51 AM
1178 UNIVERSITY OF ILLINOIS LAW REVIEW [Vol. 2015
C. The Disposition Time of Civil Cases ........................................ 1197 1. Median Disposition Time ................................................... 1198 2. Average Disposition Time .................................................. 1203
III. CHANGES IN THE PROPORTION OF CIVIL CASES TERMINATING AT DIFFERENT POINTS IN THE PROCEEDING ................................. 1204
IV. THE TYPES OF CIVIL CASES FILED: WHERE ARE THE “BIG SIX” TODAY? ...................................................................................... 1208 A. The Evolution of Tort Litigation .............................................. 1211 B. The Continued Rise in Prisoner Petitions ................................ 1215 C. Civil Rights Cases ....................................................................... 1221 D. Where Have All the Contract Cases Gone? ............................. 1226
1. The Death of “Recovery” Contract Cases ........................ 1227 2. Increases in Amount-in-Controversy Requirement for
Diversity Jurisdiction .......................................................... 1229 3. Other Venues ....................................................................... 1229 4. Incentives to Lawyers ......................................................... 1231 5. Other Possible Reasons for the Decline in Contract
Cases ..................................................................................... 1232 E. Labor Cases ................................................................................ 1233
V. CONCLUSION ..................................................................................... 1235
I. INTRODUCTION
From 1960 to 1986, annual civil case filings in U.S. district courts grew 398%.1 This fourfold increase helped to cultivate a widely-held be-lief in a “litigation explosion,” supposedly caused by hyperlitigious Americans.2 Responding to that view, Marc Galanter examined the com-position of the federal civil caseload during that time period. He called the six categories of cases that were mostly responsible for the surge in filings the “Big Six” (contracts cases, tort cases, “recovery” cases, prison-er petitions, civil rights cases, and social security cases)3 and examined the unique trend of each case category. Instead of “a generalized litiga-tion fever” that spurred an across-the-board increase in case filings,
1. Marc Galanter, The Life and Times of the Big Six; Or, the Federal Courts Since the Good Old Days, 1988 WIS. L. REV. 921, 924 (1988). 2. Id. at 923 (“[F]igures on federal courts are frequently cited as proof of runaway litigiousness throughout American society”); see also Arthur R. Miller, The Pretrial Rush to Judgment: Are the “Lit-igation Explosion,” “Liability Crisis,” and Efficiency Clichés Eroding Our Day in Court and Jury Trial Commitments?, 78 N.Y.U. L. REV. 982, 996–1003 (2003) (tracing history of procedural “reform” as a response to the alleged “litigation explosion”); Linda S. Mullenix, Discovery in Disarray: The Perva-sive Myth of Pervasive Discovery Abuse and the Consequences for Unfounded Rulemaking, 46 STAN. L. REV. 1393, 1398–1401 (1994) (describing rampant belief in the “litigation explosion” and general me-dia hostility toward the United States legal system and lawyers); id. at 1404 (“Throughout the 1980s, the media helped spread the myths of litigiousness and discovery abuse to an uncritically receptive public.”). 3. Galanter, supra note 1, at 924.

MOORE.DOCX (DO NOT DELETE) 5/22/2015 9:51 AM
No. 3] CIVIL CASELOAD 1179
Galanter concluded that different causes for changes in different case types explained caseload trends.4
Today, there seems to be no less, and possibly more, contentious debate about the civil justice system than there was in the late 1980s. The American Bar Association (“ABA”) rhetorically asks whether courts are “dying”5 and whether people have “given up” on the courts.6 Those who support restrictions on civil lawsuits continue to assert that increases in federal case filings demand further “reforms” in procedure.7 A bill in Congress to increase the size of the federal judiciary by 10% was said to be necessary because “litigants have their cases delayed for months and months because our Federal courts are understaffed.”8
Most pressingly, the Advisory Committee on Civil Rules (“the Ad-visory Committee”), still wringing its hands over the supposed “cost and delay” of litigation,9 has approved yet another round of changes to the Federal Rules of Civil Procedure (“FRCP”).10 If approved by the Supreme Court and not blocked by Congress, the pending amendments will narrow the scope of pretrial discovery, hamper the imposition of
4. Id. at 951. 5. Inadequate Court Resources Hurt Access to Justice, Say Nation’s Top Jurists, A.B.A (Aug. 9, 2013, 1:41 PM), http://www.abanow.org/2013/08/inadequate-court-resources-hurt-access-to-justice-say-nations-top-jurists/ (explaining that at a panel entitled “Are Courts Dying? The Decline of Open and Public Adjudication,” panelists noted decreasing funding for courts, the high cost of legal representa-tion and concomitant growth in self-represented litigants, and the rise of privatized dispute resolution such as arbitration). 6. James Podgers, Are Businesses and Individuals Giving Up On the Courts? Yes, and It’s ‘A Disaster,’ Judge Says, A.B.A. J. (Aug. 8, 2013, 10:15 PM), http://www.abajournal.com/news/article/ funding_concerns_force_courts_to_think_about_their_future/. See also ANTHONY V. CURTO, THE
TIME FOR JUSTICE: HOW THE EXCESSES OF TIME HAVE BROKEN OUR CIVIL JUSTICE SYSTEM 177 (2012) (detailing the nine-year saga of James v. Powell, a lawsuit against the late Adam Clayton Powell, Jr. for defamation, in which “more than 80 judges sitting in 10 courts had heard parts of the case”). 7. E.g., Lawsuit Abuse Reduction Act of 2013, H.R. 2655, at 4 n.4, 113th Cong. (1st Sess. 2013), available at http://www.gpo.gov/fdsys/pkg/CRPT-112hrpt174/pdf/CRPT-112hrpt174.pdf (claiming a 9.2% increase in federal civil filings from March 31, 2009 to March 31, 2010; these figures were three years old at the time the report was published, and did not mention that terminations had increased, and pending cases decreased, during that same time period). 8. The Federal Judgeship Act of 2013, Hearing on S.1385 Before the Subcomm. on Bankr. and the Courts of the Comm. on the Judiciary, 113th Cong. 30 (Sept. 10, 2013) [hereinafter S.1385 Hear-ings] (statement of Sen. Patrick Leahy). 9. COMMITTEE ON RULES OF PRACTICE AND PROCEDURE OF THE JUDICIAL CONFERENCE OF
THE UNITED STATES, PRELIMINARY DRAFT OF PROPOSED AMENDMENTS TO THE FEDERAL RULES OF
BANKRUPTCY AND CIVIL PROCEDURE 270 (2013) [hereinafter PROPOSED AMENDMENTS], available at http://www.ediscoverylaw.com/files/2013/11/Published-Rules-Package-Civil-Rules-Only.pdf (“[T]hese proposals can do much to reduce cost and delay.”). Slightly modified, the amendments were unani-mously approved by the Advisory Committee in April 2013 and then by the Committee on Rules of Practice and Procedure (commonly called the Standing Committee) in May 2014. Memorandum from Judge David G. Campbell to Judge Jeffrey Sutton (June 14, 2014), http://www.uscourts.gov/uscourts/ RulesAndPolicies/rules/Reports/ST09-2014-add.pdf. Without any discussion, the Judicial Conference of the United States approved the pending amendments at its meeting in September 2014. At this writ-ing, the amendments await Supreme Court review. 10. For two of the many fine articles tracing the history of numerous “reforms” to the federal civil discovery rules, see Danya Shocair Reda, The Cost-and-Delay Narrative in Civil Justice Reform: Its Fallacies and Functions, 90 OR. L. REV. 1085, 1091–1100 (2012) and Emery G. Lee III & Thomas E. Willging, Defining the Problem of Cost in Federal Civil Litigation, 60 DUKE L.J. 765, 765–67 (2010).
MOORE.DOCX (DO NOT DELETE) 5/22/2015 9:51 AM
1180 UNIVERSITY OF ILLINOIS LAW REVIEW [Vol. 2015
sanctions for the spoliation of electronic evidence, and signal approval of the Supreme Court’s greater scrutiny of pleadings.11 The pending amendments generated an unprecedented quantity of passionate public commentary.12 Almost uniformly, plaintiffs’ attorneys opposed the pro-posals and defendants’ attorneys supported them.13
The Advisory Committee claims that its proposals are supported by “empirical studies,” most of which were nonrandom opinion surveys sub-ject to self-selection bias and other methodological flaws.14 Conspicuous-ly absent from the Advisory Committee’s Report accompanying the pro-posed amendments was any reference to actual government statistics about whether the civil caseload has grown (overall or per judge), whether the median disposition time for civil cases has increased, or whether the most prevalent types of civil cases have changed.
I propose to remedy that oversight. Wading deeply into the volumi-nous statistics published by the Administrative Office of the United States Courts (“AO”), I offer a radical interpretation: since 1986, instead of an “explosion” of the civil docket, we have seen the opposite—if not quite an implosion, at least stagnation.
Moreover, in continuing Galanter’s 1988 study of the “shifting pop-ulations of cases” passing through the federal district courts, I find that five of the six most prevalent civil case types today are primarily brought by the “have-nots” of society: individuals pressing tort, prisoner, civil rights, labor (particularly Fair Labor Standards Act), and social security
11. The pending amendments are available at http://www.uscourts.gov/uscourts/RulesAnd Policies/rules/Reports/ST09-2014-add.pdf. 12. See Proposed Amendments to the Federal Rules of Civil Procedure, REGULATIONS.GOV, http://www.regulations.gov/#!docketDetail;D=USC-RULES-CV-2013-0002 (last visited Jan. 29, 2015) (as of Jan. 29, 2015, 2356 comments had been received); Tony Mauro, Lawyers Spar Over Discovery Rules; Litigation Costs at Center of Debate, NAT’L L.J. (Feb. 24, 2014). 13. See Patricia W. Moore, More Public Comments (Including Mine) on the Proposed FRCP Amendments, CIVIL PROCEDURE & FED. COURTS BLOG (Jan. 31, 2014), http://lawprofessors.typepad. com/civpro/2014/01/more-public-comments-including-mine-on-the-proposed-frcp-amendments.html. I also submitted public comments opposing the amendments which are available at http:// www.regulations.gov/#!documentDetail;D=USC-RULES-CV-2013-0002-0491. 14. PROPOSED AMENDMENTS, supra note 9, at 265. See ABA SECTION OF LITIGATION, MEMBER
SURVEY ON CIVIL PRACTICE: DETAILED REPORT, AM. BAR ASS’N (Dec. 11, 2009), available at http://www.uscourts.gov/uscourts/RulesAndPolicies/rules/Duke%20Materials/Library/ABA%20Section%20of%20Litigation,%20Survey%20on%20Civil%20Practice.pdf; Rebecca M. Hamburg & Matthew C. Koski, Summary of Results of Federal Judicial Center Survey of NELA Members, Fall 2009, NAT’L EMPLOYMENT LAWYERS ASSOC. (Mar. 26, 2010), available at http://www.uscourts.gov/ uscourts/RulesAndPolicies/rules/Duke%20Materials/Library/NELA,%20Summary%20of%20Results%20of%20FJC%20Survey%20of%20NELA%20Members.pdf; LAWYERS FOR CIVIL JUSTICE ET AL., Litigation Cost Survey of Major Companies, 2010 CONFERENCE ON CIVIL LITIG. (May 10–11, 2010), available at http://www.uscourts.gov/uscourts/RulesAndPolicies/rules/Duke%20Materials/Library/ Litigation%20Cost%20Survey%20of%20Major%20Companies.pdf. In contrast, the Federal Judicial Center (“FJC”) conducted the best-designed and most probative study, because it randomly selected attorneys of record on all cases that closed in the last quarter of 2008. To study whether litigation was “too expensive,” the FJC asked those attorneys to focus on the actual costs in the case that had just closed, rather than asking them about their overall impressionistic beliefs, as did many of the other studies. EMERY G. LEE III & THOMAS E. WILLGING, FED. JUDICIAL CTR. NATIONAL, CASE-BASED
CIVIL RULES SURVEY: PRELIMINARY REPORT TO THE JUDICIAL CONFERENCE ADVISORY
COMMITTEE ON CIVIL RULES (2009).
MOORE.DOCX (DO NOT DELETE) 5/22/2015 9:51 AM
No. 3] CIVIL CASELOAD 1181
claims. Of those, civil rights and labor litigants have the most to fear from the pending amendments to the FRCP. Much federal tort litigation has coordinated pretrial discovery in conjunction with multidistrict litigation (“MDL”). There is little discovery in prisoner or social security litigation. Accordingly, it is difficult not to wonder if the pending amendments are aimed primarily at civil rights and labor cases.
This Article will proceed in four parts. Part II examines trends in the overall volume and duration of federal civil litigation since 1986.15 I explain that there are several ways to measure the number of civil case filings, and that the only method that does not double-count cases is to measure original filings plus removals from state court. By that measure, civil filings have grown a mere 9% since 1986. By any measure, the rate of increase in civil filings is less than the growth in the U.S. population, and far less than the growth in real disposable income per capita, during the same time period. Part II also documents an increase in judicial re-sources available to the district courts, a steady weighted civil caseload per authorized district judge, and a stable median disposition time, since 1986. The criminal docket, however, has steadily increased, primarily due to the so-called “war on drugs,”16 and the increase in criminal filings has caused the overall caseload per authorized judge to rise, despite the flat civil filings.17
Part III studies changes in the rates at which cases are terminated by various methods, noting that in 1986, the dominant method of case ter-mination was without court action, while today, the dominant method of case termination is before pretrial with court action. I suggest that this shift is probably attributable, at least in part, to increased judicial man-agement and to increases in the rates of filing and granting dispositive motions, such as motions to dismiss and motions for summary judgment.
Part IV catches up with the Big Six case categories since 1986. Tort cases have moved to the top of the Big Six, but the nature of the federal tort docket has been transformed by a substantial increase in MDL. Pris-oner petitions have jumped from the fourth largest case category in 1986 to the second largest in 2013, strongly correlating with a steep rise in the U.S. incarceration rate. Civil rights cases (which exclude prisoner peti-
15. Although most U.S. litigation takes place in state, not federal courts, the federal courts re-ceive far more academic and popular attention. This is due not only to national awareness of federal litigation, but also to the much greater ease of accessing caseload and other statistics about the federal courts. Galanter, supra note 1, at 923; see also Patricia Hatamyar Moore, Confronting the Myth of “State Court Class Action Abuses” Through an Understanding of Heuristics and a Plea for More Statis-tics, 82 UMKC L. REV. 133, 163–64, 178–79 (2013) (surveying state courts’ publicly available caseload statistics). 16. E.g., ADMIN. OFFICE OF THE U.S. COURTS, JUDICIAL BUSINESS OF THE UNITED STATES
COURTS: 1990 ANNUAL REPORT OF THE DIRECTOR 2 (1991) [hereinafter 1990 ANNUAL REPORT] (“New drug cases continue to push criminal workload up.”). The AO releases an annual report on the federal judiciary, with caseload and other statistics as of the end of that fiscal year. Through 1991, the fiscal year ended June 30. From 1992 on, the fiscal year has ended September 30. 17. E.g., JOHN SHAPARD, HOW CASELOAD STATISTICS DECEIVE, FED. JUDICIAL CTR. 3 (1991), available at https://bulk.resource.org/courts.gov/fjc/0020.pdf.
MOORE.DOCX (DO NOT DELETE) 5/22/2015 9:51 AM
1182 UNIVERSITY OF ILLINOIS LAW REVIEW [Vol. 2015
tions and include employment discrimination cases) have vaulted from fifth place to third place. Contract cases have dwindled from their top slot to a distant fourth, and “recovery” contract cases have all but disap-peared, falling out of the Big Six entirely. Social security cases have inched up from the sixth largest case category in 1986 to the fifth largest in 2013. Finally, labor cases, led by Fair Labor Standards Act (“FLSA”) cases, have moved into sixth place; labor cases were not in Galanter’s original Big Six. The cases that have seen gains since 1986—torts, prison-er, civil rights, social security, and labor—are paradigmatically brought by an individual plaintiff (often pro se) against an institutional defendant.
The Article concludes by counseling against uncritical acceptance of charges that federal civil litigation is in crisis without taking account of the government’s own caseload statistics. Rather than inexorable growth, the federal civil caseload has been relatively stable for over twenty-five years.
II. THE OVERALL VOLUME AND DURATION OF FEDERAL CIVIL
LITIGATION SINCE 1986
This Part of the Article will examine the overall rate of civil filings, the civil caseload per authorized judgeship, and the median disposition time for civil cases in federal district courts since 1986.18 The number of first-time civil filings in federal district courts (original filings plus re-movals from state court) has increased only 9% since 1986. Moreover, the average district court judge has the same weighted number of civil cases now as the average district court judge had in 1986. Further, the median life of a civil case is only twenty-four days longer now than it was in 1986.
These may be surprising claims to a casual observer primed to ex-pect an exponentially-growing amount of litigation cost and delay. They may even be surprising claims to a not-so-casual follower of the AO’s annual reports, given that the AO generally reports on changes from the immediately preceding year and does not normally take a twenty-five year retrospective view.19 But it is true: in contrast to the almost 400%
18. At this writing, for most of the types of data used in this Article, the latest available statistics from the AO are for the fiscal year ending September 30, 2012. ADMIN. OFFICE OF THE U.S. COURTS, JUDICIAL BUSINESS OF THE UNITED STATES COURTS: 2012 ANNUAL REPORT OF THE DIRECTOR
(2013) [hereinafter 2012 ANNUAL REPORT], available at http://www.uscourts.gov/Statistics/Judicial Business/2012.aspx. While this Article was being written, the AO released some Federal Court Man-agement Statistics for fiscal year 2013, and Chief Justice John Roberts released a limited amount of information for fiscal year 2013 in his annual report on the state of the federal courts. See ADMIN. OFFICE OF THE U.S. COURTS, FEDERAL COURT MANAGEMENT STATISTICS (2013), available at http://www.uscourts.gov/Statistics/FederalCourtManagementStatistics/district-courts-september-2013. aspx; JOHN ROBERTS, JR., 2013 YEAR-END REPORT ON THE FEDERAL JUDICIARY 13 (2013), available at http://www.supremecourt.gov/publicinfo/year-end/2013year-endreport.pdf. The 2013 data has been used whenever possible. 19. See, e.g., ADMIN. OFFICE OF THE U.S. COURTS, JUDICIAL BUSINESS OF THE UNITED STATES
COURTS: 1998 ANNUAL REPORT OF THE DIRECTOR 15 (1999) [hereinafter 1998 ANNUAL REPORT], available at http://www.uscourts.gov/Statistics/JudicialBusiness/JudicialBusiness1998.aspx (“The major
MOORE.DOCX (DO NOT DELETE) 5/22/2015 9:51 AM
No. 3] CIVIL CASELOAD 1183
increase in civil filings from 1960 to 1986, the increase in the federal civil caseload since 1986 has been anemic.
A. Counting Civil Case Filings
Pinning down the overall volume of civil case filings is not as simple a task as may first appear. The AO reports a total number of “Civil Cas-es Commenced” in several different statistical tables within its annual re-ports on the federal courts.20 I will use the AO-reported total of “Civil Cases Commenced” as the first measure of civil filings, and call this, un-imaginatively, the “AO-Reported Total.” But the AO-Reported Total, taken at face value, overstates the true amount of litigation activity for at least two reasons. First, the AO-Reported Total double-counts some fil-ings, and that double-counting has increased since 1986.21
To understand the double-counting, it is necessary to know that the AO categorizes the “origin” of civil cases22 in one of five major23 ways:
1. “Original Filings”: cases that are originally filed for the first time in federal district court;
2. “Removals from State Courts”: cases that are originally filed in state court and then removed to federal district court;24
3. “Remands from Courts of Appeals”: cases that were already counted as “Original Filings” or “Removals from State Courts,” but have gone to the appellate court and are now remanded back to the district court;
trend emerging from the 1998 data . . . is that the federal courts’ caseload rose in most program areas this year.”); ADMIN. OFFICE OF THE U.S. COURTS, JUDICIAL BUSINESS OF THE UNITED STATES
COURTS: 2004 ANNUAL REPORT OF THE DIRECTOR 12 (2005) [hereinafter 2004 ANNUAL REPORT], available at http://www.uscourts.gov/Statistics/JudicialBusiness/JudicialBusiness2004.aspx (“Caseloads were high in all areas of the federal court system.”); 2012 ANNUAL REPORT, supra note 18, at 1 (“This year, growth in filings occurred in some areas of the Federal Judiciary, but other areas experienced reductions.”). 20. See, e.g., 2012 ANNUAL REPORT, supra note 18, at tbl.C-1, available at http://www.uscourts. gov/uscourts/Statistics/JudicialBusiness/2012/appendices/C01Sep12.pdf (“U.S. District Courts--Civil Cases Commenced, Terminated, and Pending During the 12-Month Period Ending September 30, 2012”); id. at tbl.C-2 (“U.S. District Courts--Civil Cases Commenced, by Basis of Jurisdiction and Na-ture of Suit, During the 12-Month Periods Ending September 30, 2011 and 2012”). 21. See, e.g., 2012 ANNUAL REPORT, supra note 18, at tbl.C-8, available at http://www.uscourts. gov/uscourts/Statistics/JudicialBusiness/2012/appendices/C08Sep12.pdf (“U.S. District Courts—Civil Cases Filed, by Origin, During the 12-Month Periods Ending September 30, 2008 Through 2012”). 22. See id. (listing case types as “Original Filings; Remands from Courts of Appeals; Removals from State Courts; Reopens; Transfers; and Others”). 23. There is an “Other” category, but it does not contain more than a handful of cases. In addi-tion, the AO formerly included a category of “origin” called “Appeals from Magistrate Judgments.” See, e.g., ADMIN. OFFICE OF THE U.S. COURTS, JUDICIAL BUSINESS OF THE UNITED STATES COURTS: 1986 ANNUAL REPORT OF THE DIRECTOR 108 (1987) [hereinafter 1986 ANNUAL REPORT] (data col-lection for Appeals from Magistrate Judgments began in 1981). This number appears never to have exceeded 300, and often was much less. 24. See, e.g., 28 U.S.C. §1441 (2012).
MOORE.DOCX (DO NOT DELETE) 5/22/2015 9:51 AM
1184 UNIVERSITY OF ILLINOIS LAW REVIEW [Vol. 2015
4. “Reopens”: cases that were already counted as “Original Filings” or “Removals from State Courts,” but were closed for some rea-son, and are now being reopened; and
5. “Transfers”: cases that were already counted in the transferor court as “Original Filings” or “Removals from State Courts,” but upon transfer to another district court, are now counted again, as “Transfers” in the transferee court.25
As can be gleaned from these descriptions, the last three catego-ries—remands, reopens, and transfers—present opportunities for the same case to be counted twice.26 That is, when a case is transferred by one federal district court to another federal district court, it is counted twice: once by the transferor court and once by the transferee court. If the transfer happens in the same year as the original filing, which is probably the case most of the time, then the same case has been counted twice in the total for the year.27 Similarly, when a case has been closed but is later reopened, or is remanded from the court of appeals, it is counted again as a filing in the total number of civil filings for the year.28
Therefore, only original filings and removals from state courts are cases that are new to the federal district courts. So my second measure of civil filings I will call “New Filings,” which is simply the sum of “Original Filings” and “Removals from State Courts.” (Or, to put it backwards, “New Filings” is roughly29 equal to the AO-Reported Total minus the “Remands,” “Reopens,” and “Transfers.”)
The second reason that the AO-Reported Total of civil filings over-states the true amount of litigation activity is that it includes many cases that require only a small fraction of the judicial time required to handle a typical federal civil case. These include the so-called “recovery” cases—a mysterious label, to those uninitiated in federal court statistics. “Recov-ery” cases refer to a category of civil cases that the AO classifies as a type of contract case.30 These cases are primarily filed by the United States to recover on defaulted student loans and overpayments of veter-an’s benefits.31
25. The primary mechanisms for transfer of a civil case from one district court (the transferor court) to another district court (the transferee court) are transfer of venue in the interest of justice and for the convenience of parties and witnesses, 28 U.S.C. § 1404(a) (2012), and transfer for consolidated pretrial proceedings in MDL, 28 U.S.C. § 1407(a) (2012). 26. See Margo Schlanger, Inmate Litigation, 116 HARV. L. REV. 1555, 1579 (2003). 27. It may be that the transfer does not happen in the same year as the filing. The point remains, though, that the same case is counted twice. 28. Reopens and remands are less likely to occur in the same year as the original filing. How-ever, at some earlier point in time, the case was counted once as an original filing (or a removal), and it is then counted a second time when it is reopened or remanded. 29. See supra note 21 and accompanying text. 30. See Civil Cover Sheet Form, U.S. CTS. (Dec. 2012), http://www.uscourts.gov/uscourts/Forms AndFees/Forms/JS044.pdf (listing “Recovery of Overpayment & Enforcement of Judgment” as a type of contract suit). 31. See Galanter, supra note 1, at 928–29.

MOORE.DOCX (DO NOT DELETE) 5/22/2015 9:51 AM
No. 3] CIVIL CASELOAD 1185
Each “recovery” case is filed and counted as a separate lawsuit, but each takes little judicial time. In the AO’s caseload weighting system, each “recovery” case is weighted only 0.10, compared to an average civil filing, which is weighted 1.0.32 Further, the number of “recovery” case fil-ings over the years has wildly fluctuated with the changing collection pol-icies of the federal government,33 from a high of 58,160 “recovery” cases in 1985 to a low of 1822 in 1995.34 A swing of 57,000 case filings can cause increases or decreases of 20% or more in the AO-Reported Total.35 Thus, the third and final measure of civil filings I will use is to subtract the “recovery” cases from the AO-Reported Total. I will call this the “no recovery” measure.
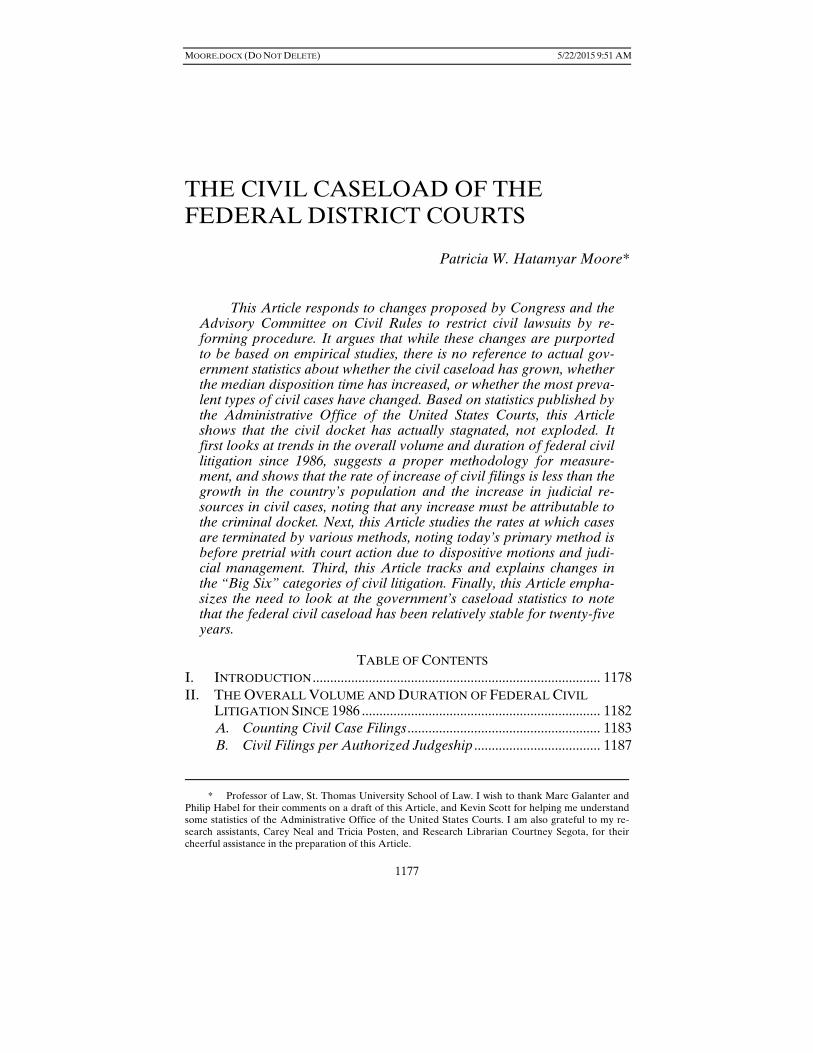
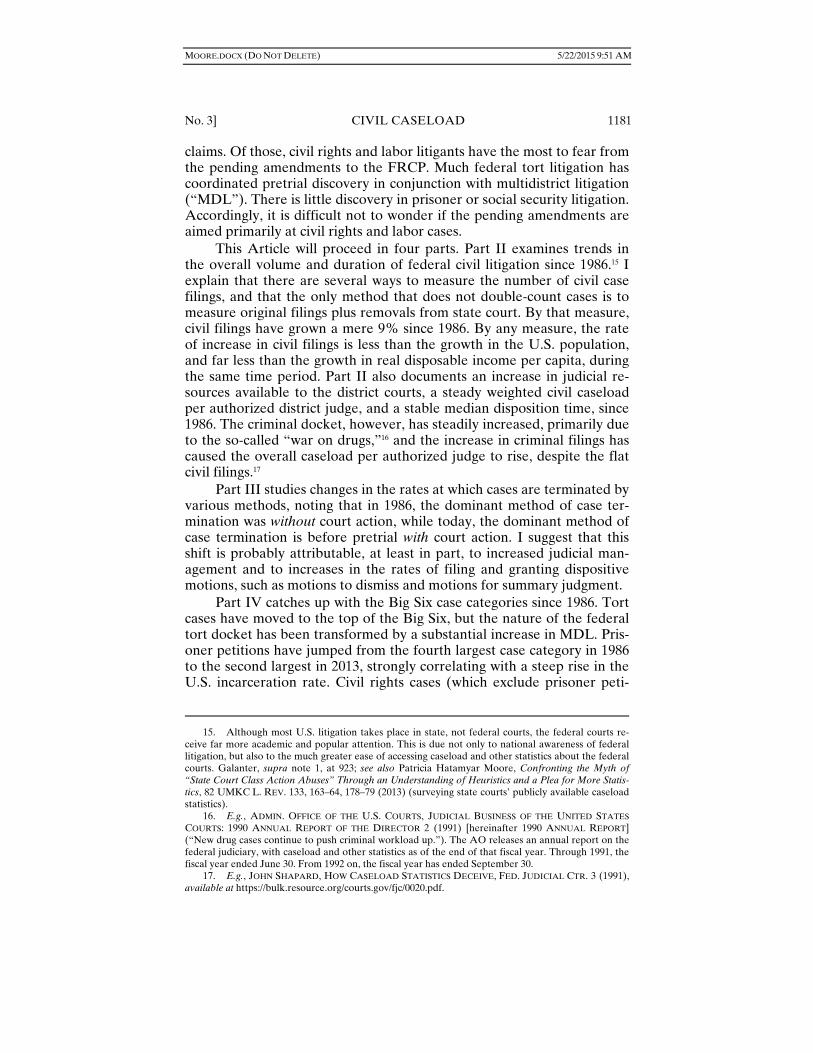
Figure 1 presents, for 1986 to 2013, the three measures of civil filings that I discussed above.
32. PATRICIA LOMBARD & CAROL KRAFKA, FED. JUD. CTR., 2003–2004 DISTRICT COURT
CASE-WEIGHTING STUDY: FINAL REPORT TO THE SUBCOMMITTEE ON JUDICIAL STATISTICS OF THE
COMMITTEE ON JUDICIAL RESOURCES OF THE JUDICIAL CONFERENCE OF THE UNITED STATES 62 fig.4 (2005) (showing Overpayment and Recovery cases weighted 0.10); 2012 ANNUAL REPORT, supra note 18. See also FED. R. CIV. P. 26(a)(1)(B)(vi)–(vii) (excluding student loan cases and veterans cases from the automatic initial disclosure obligations). 33. See Galanter, supra note 1, at 928–29. 34. Id. at 929. 35. However, the inclusion of “recovery” cases in the AO-reported total is less misleading today than it was in 1986: there are far fewer of them today, because the federal government's initiation of such cases has declined over time.
MOORE.DOCX (DO NOT DELETE) 5/22/2015 9:51 AM
1186 UNIVERSITY OF ILLINOIS LAW REVIEW [Vol. 2015
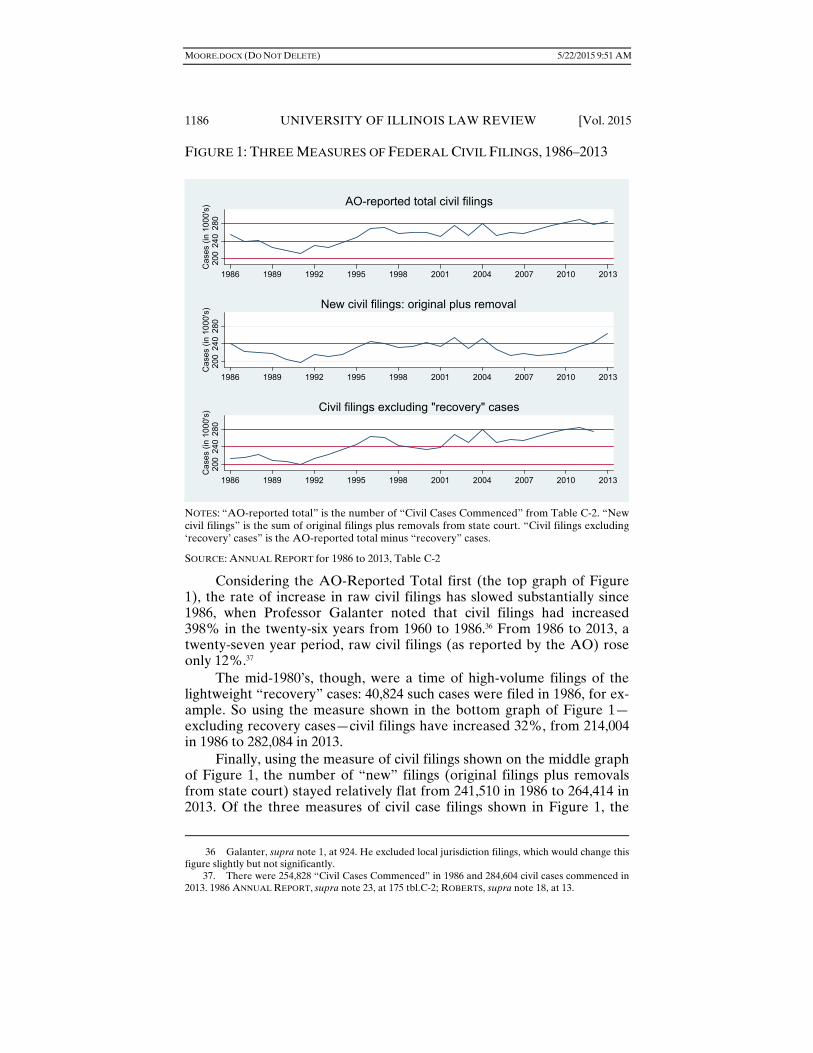
FIGURE 1: THREE MEASURES OF FEDERAL CIVIL FILINGS, 1986–2013
NOTES: “AO-reported total” is the number of “Civil Cases Commenced” from Table C-2. “New civil filings” is the sum of original filings plus removals from state court. “Civil filings excluding ‘recovery’ cases” is the AO-reported total minus “recovery” cases.
SOURCE: ANNUAL REPORT for 1986 to 2013, Table C-2
Considering the AO-Reported Total first (the top graph of Figure 1), the rate of increase in raw civil filings has slowed substantially since 1986, when Professor Galanter noted that civil filings had increased 398% in the twenty-six years from 1960 to 1986.36 From 1986 to 2013, a twenty-seven year period, raw civil filings (as reported by the AO) rose only 12%.37
The mid-1980’s, though, were a time of high-volume filings of the lightweight “recovery” cases: 40,824 such cases were filed in 1986, for ex-ample. So using the measure shown in the bottom graph of Figure 1—excluding recovery cases—civil filings have increased 32%, from 214,004 in 1986 to 282,084 in 2013.
Finally, using the measure of civil filings shown on the middle graph of Figure 1, the number of “new” filings (original filings plus removals from state court) stayed relatively flat from 241,510 in 1986 to 264,414 in 2013. Of the three measures of civil case filings shown in Figure 1, the
36 Galanter, supra note 1, at 924. He excluded local jurisdiction filings, which would change this figure slightly but not significantly. 37. There were 254,828 “Civil Cases Commenced” in 1986 and 284,604 civil cases commenced in 2013. 1986 ANNUAL REPORT, supra note 23, at 175 tbl.C-2; ROBERTS, supra note 18, at 13.
200
240
280
Cas
es (
in 1
000'
s)
1986 1989 1992 1995 1998 2001 2004 2007 2010 2013
AO-reported total civil filings20
024
028
0C
ases
(in
100
0's)
1986 1989 1992 1995 1998 2001 2004 2007 2010 2013
New civil filings: original plus removal
200
240
280
Cas
es (
in 1
000'
s)
1986 1989 1992 1995 1998 2001 2004 2007 2010 2013
Civil filings excluding "recovery" cases
MOORE.DOCX (DO NOT DELETE) 5/22/2015 9:51 AM
No. 3] CIVIL CASELOAD 1187
“new filings” measure is probably the most accurate gauge of the “true” incoming civil workload of the federal district courts. It omits the double-counting of the AO-Reported Total. It does reintroduce the insubstantial “recovery” cases, but the AO aggregate data does not provide a way to calculate how many of the “recovery” cases filed in a given year might have come by way of transfers, remands, or reopens. So we cannot simp-ly subtract the “recovery” cases from the “new” cases, or we might be subtracting some of the same cases twice from the total number of civil filings.
“New” civil filings in federal district court have increased a mere 9% in twenty-seven years. During the same time period, real disposable personal income per capita in the United States grew about 56%,38 and the U.S. population grew about 32%.39 Thus, the rate of increase in fed-eral civil filings since 1986 has lagged far behind the rate of increases in population growth and real disposable income per capita.40
B. Civil Filings per Authorized Judgeship
So we learned in the last Section that federal civil filings have in-creased by 9%, 12%, or 32% since 1986, depending on the measure (al-though I argue that 9% is the most accurate measure). But however we measure it, are the courts not more burdened with civil cases, causing more delay in resolving civil litigation?
In a word, no. The judicial resources available to handle the civil caseload have grown more than enough to offset any increase in civil cases. Caseload pressure has come primarily from the criminal docket.
Looking first at judicial resources, the number of authorized district court judgeships has increased 18% since 1986.41 In determining the need for new judgeships, the Judicial Conference of the United States takes into account “the number of senior judges available to a specific court, their ages, and level of activity” and “available magistrate judge assis-
38. Real disposable personal income per capita in the United States was $23,632 in 1986 and $36,815 in 2013 (in 2009 dollars). Real Disposable Personal Income: Per Capita, FED. RES. BANK OF
ST. LOUIS ECON. DATA, http://research.stlouisfed.org/fred2/series/A229RX0A048NBEA# (last updat-ed July 30, 2014, 1:22 PM). 39. The United States population was 240,132,887 in 1986 and 316,128,839 in 2013. Historical National Population Estimates: July 1, 1900 to July 1, 1999, U.S. CENSUS BUREAU, http://www.census. gov/popest/data/national/totals/pre-1980/tables/popclockest.txt (last updated June 28, 2000); Monthly Population Estimates for the United States: April 1, 2010 to December 1, 2014, U.S. CENSUS BUREAU, http://www.census.gov/popest/data/national/totals/2013/index.html (last visited Mar. 5, 2015). 40. There may not be a direct causal connection between population growth or real GDP per capita and civil case filings in federal district court. But there is a positive correlation: if there are more people and more economic activity, there are likely to be more disputes resulting in more lawsuits. See, e.g., Jerry Goldman, Richard L. Hooper & Judy A. Mahaffey, Caseload Forecasting Models for Federal District Courts, 5 J. LEGAL STUD. 201, 201 (1976) (stating that the volume of litigation relates to changes in social, political, economic, and demographic activity). 41. There were 575 and 677 authorized district court judgeships in 1986 and 2012, respectively. 1986 ANNUAL REPORT, supra note 23, at 7; 2012 ANNUAL REPORT, supra note 18, at tbl.11, available at http://www.uscourts.gov/Statistics/JudicialBusiness/2012/status-article-iii-judgeships.aspx (last visit-ed Mar. 5, 2015).
MOORE.DOCX (DO NOT DELETE) 5/22/2015 9:51 AM
1188 UNIVERSITY OF ILLINOIS LAW REVIEW [Vol. 2015
tance.”42 The number of senior district court judges authorized for staff has increased 122% since 1986.43 The number of full-time magistrate judge positions has increased 90% since 1986.44 All told, the number of filled (not vacant)45 district court, senior judge, and full-time magistrate judge positions increased 28% from 1986 to 2013.46
Recent scholarship has attempted to estimate the workload of sen-ior judges. One study conservatively assumes that “senior judges work a caseload equal to 25% of that of active judges,”47 in part because “judges can retain eligibility for any salary increases granted to active status by performing work equal to 25% of the work of an active judge.”48 Other scholars estimate that senior judges shoulder even more work than that: 42. Statement of Hon. Timothy M. Tymkovich, Chair, Comm. on Jud. Res. of the Jud. Conf. of the United States, Before the Subcomm. on Bankr. and the Cts. of the Comm. on the Judiciary of the U.S. Senate (Sept. 10, 2013). See also Stephen B. Burbank et al., Leaving the Bench, 1970-2009: The Choices Federal Judges Make, What Influences Those Choices, and Their Consequences, 161 U. PA. L. REV. 1, 23–24 (2012). 43. There were 156 and 346 senior district court judges in 1986 and 2013, respectively. 1986 ANNUAL REPORT, supra note 23, at 7; 2012 ANNUAL REPORT, supra note 18, at tbl.11, available at http://www.uscourts.gov/Statistics/JudicialBusiness/2012/status-article-iii-judgeships.aspx (last visited Mar. 5, 2015); see also GEN. GOV’T DIV., U.S. GOV'T ACCOUNTABILITY OFFICE, GAO-98-57R, FED. D. POPULATION AND CASE FILINGS 173 n.3 (1998) (“Senior judges are judges who have retired from active, full-time status and who may, at their option, continue to handle a reduced caseload. According to [the AO], during the fiscal years 1992–96, senior district court judges (1) closed 15 percent of the civil cases and criminal defendants terminated in district courts and (2) conducted between 16 and 19 percent of all trials.”). 44. There were 280 and 531 full-time magistrate judges in 1986 and 2012, respectively. 1986 ANNUAL REPORT, supra note 23, at 7, 65; 2012 ANNUAL REPORT, supra note 18, at tbl.13, available at http://www.uscourts.gov/Statistics/JudicialBusiness/2012/appointments-magistrate-judges.aspx (last visited Mar. 5, 2015). As is evident, the use of magistrate judges in civil cases has expanded since 1986. See, e.g., ADMIN. OFFICE OF THE U.S. COURTS, JUDICIAL BUSINESS OF THE UNITED STATES COURTS: 1997 ANNUAL REPORT OF THE DIRECTOR 24 [hereinafter 1997 ANNUAL REPORT], available at http://www.uscourts.gov/Statistics/JudicialBusiness/JudicialBusiness1997.aspx (“The consensual use of magistrate judges for civil case dispositions has continued to expand, facilitated in many courts by means such as including magistrate judges in the random ‘draw’ system for assigning civil cases.”); ADMIN. OFFICE OF THE U.S. COURTS, JUDICIAL BUSINESS OF THE UNITED STATES COURTS: 2006
ANNUAL REPORT OF THE DIRECTOR 29 [hereinafter 2006 ANNUAL REPORT], available at http://www.uscourts.gov/uscourts/Statistics/JudicialBusiness/2006/front/completejudicialbusiness.pdf (although magistrate judges’ holding of civil settlement conferences and evidentiary hearings declined, “magistrate judges submitted more reports and recommendations on case-dispositive motions in civil cases than in 2005, including those in Social Security appeals . . . cases involving prisoners . . . and oth-er civil cases. This growth is notable because assignments requiring reports and recommendations tend to be quite time-consuming”). 45. Of course, judicial vacancies, many of which are long-lasting, contribute to delay. E.g., LEONIDAS RALPH MECHAM, THE CIVIL JUSTICE REFORM ACT OF 1990: FINAL REPORT, in 175 F.R.D. 62, 87–88 (1997). 46. In 1986, there were 575 authorized district court judgeships, less 40 vacancies, plus 156 senior district court judges, plus 280 full-time magistrate judges, for a total of 1154 filled positions. In 2012, there were 677 authorized district court judgeships, less 75 vacancies, plus 346 senior district court judges, plus 531 full-time magistrate judges, for a total of 1479 filled positions. 1986 ANNUAL REPORT, supra note 23, at 7, 65; 2012 ANNUAL REPORT, supra note 18, at tbl.11 & tbl.3. See also Marc Galanter, The Vanishing Trial: An Examination of Trials and Related Matters in Federal and State Courts, 1 J. EMPIRICAL LEGAL STUD. 459, 503–04 (2004) (although no data available after 1992, federal judicial employees other than Article III judges, magistrates, and bankruptcy judges rose steadily from 5602 in 1962 to 25,947 in 1992). 47. Philip Habel & Kevin Scott, New Measures of Judges’ Caseload for the Federal District Courts, 1964–2012, J.L. & CTS. 153, 163 (2014). 48. Id.
MOORE.DOCX (DO NOT DELETE) 5/22/2015 9:51 AM
No. 3] CIVIL CASELOAD 1189
“on average, district court judges serving in senior status were carrying a 43.5% case workload [compared to a full-time district court judge] in the 1990s and a 50.3% case workload in the 2000s.”49
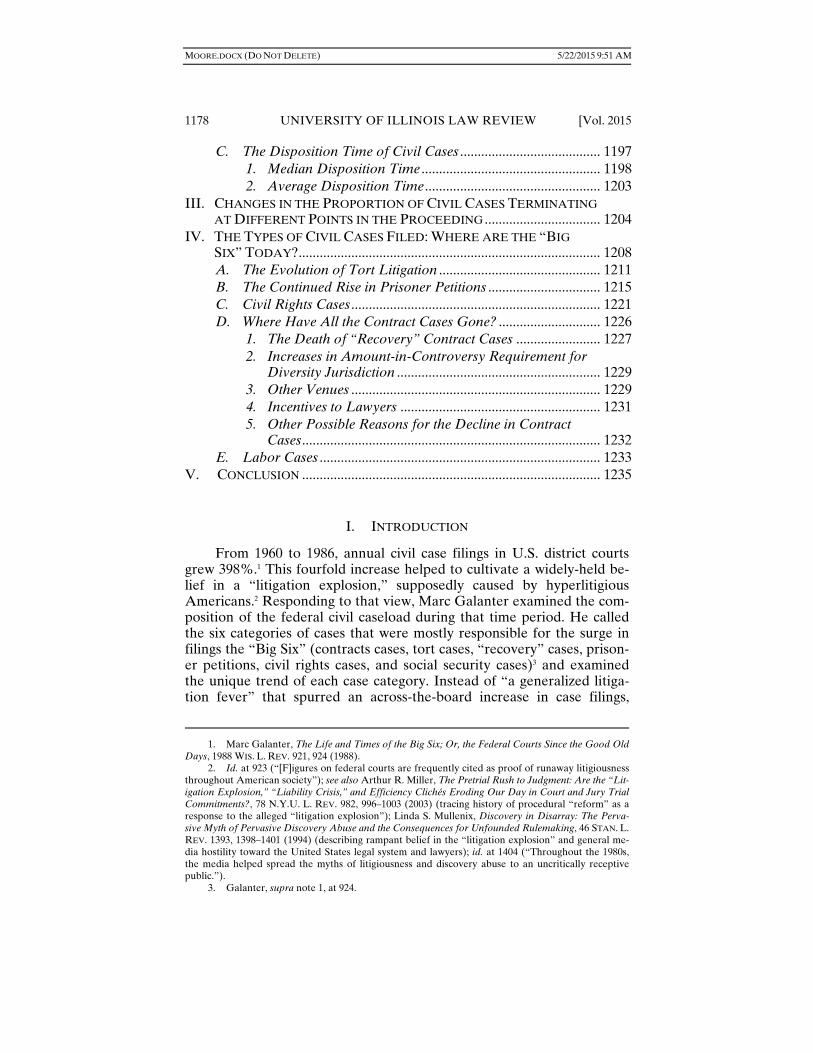
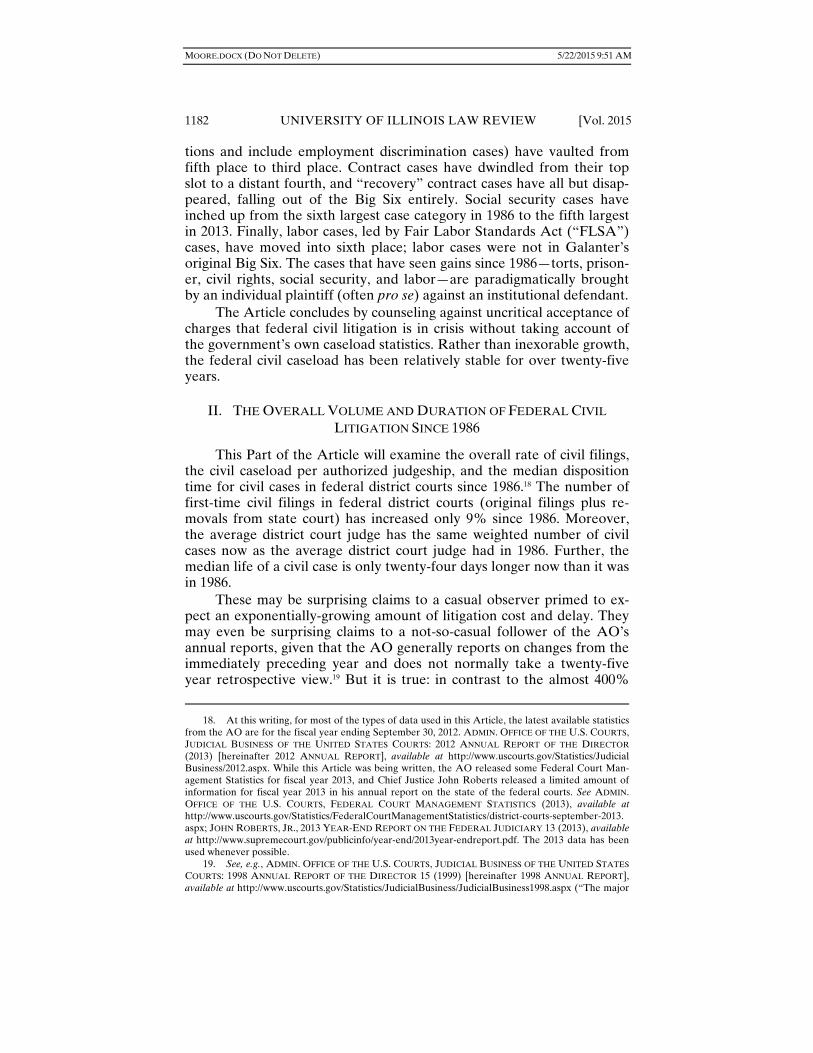
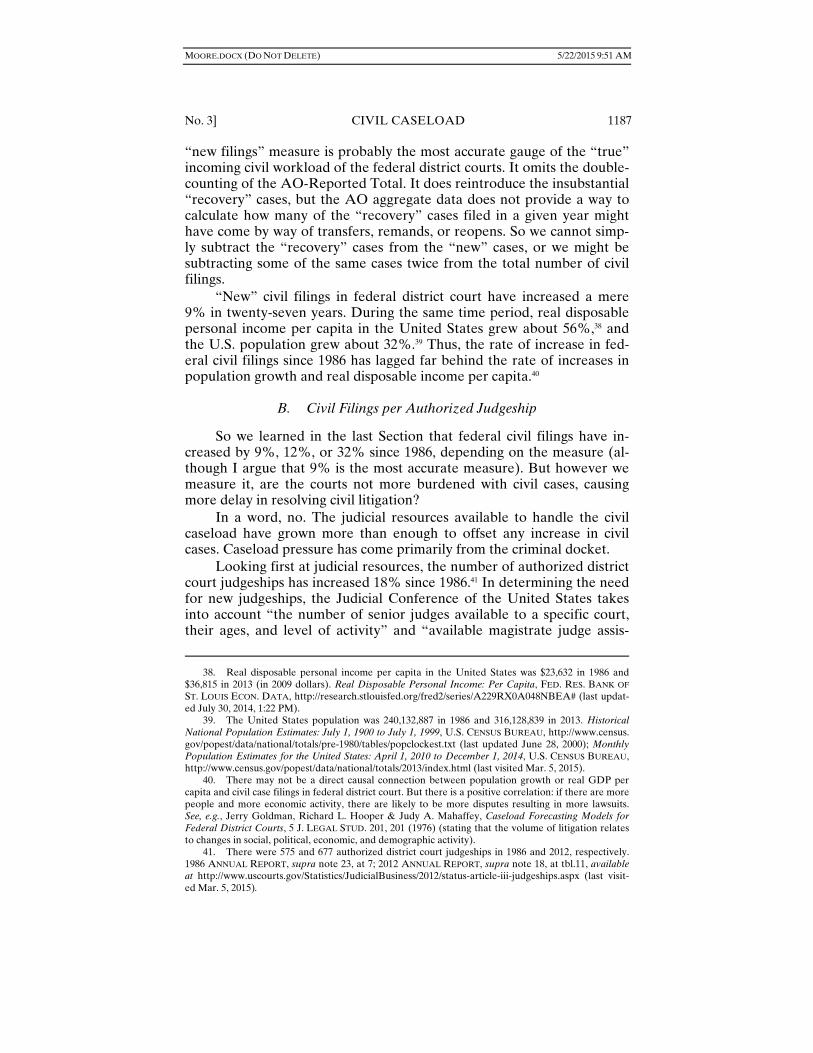
Figure 2 below takes the more conservative approach and weights the caseload of a senior judge as 25% of that of a full-time district court judge. Figure 2 shows the steady rise of judicial resources available to the federal district courts since 1986.
FIGURE 2: FEDERAL JUDICIAL RESOURCES, 1986–2013
NOTE: “Article III judges” includes full-time district court judges (authorized judgeships minus vacancies) plus senior district court judges, who are weighted as one-fourth of a full-time district court judge. “Magistrate judges” includes all authorized magistrate judge positions (full-time and part-time). The percentage of full-time magistrates has grown from 60% of all magistrates in 1986 to 93% of all magistrates in 2013, so the rise in magistrate manpower has actually been steeper than the dotted line shows.
I turn now to the approximate caseload per judge. The AO reports statistics, known as “weighted filings per authorized judgeship” and “un-weighted filings per authorized judgeship,” which attempt to measure the civil, criminal, and total caseload per district court judge.50 What is meant by “authorized judgeship” is clear enough: this is a congressionally-authorized district court judgeship, whether or not filled, which excludes
49. Stephen B. Burbank et al., supra note 42, at 29. 50. See, e.g., 2012 ANNUAL REPORT, supra note 18, at tbl.X-1A, available at http://www.us courts.gov/uscourts/Statistics/JudicialBusiness/2012/appendices/X01ASep12.pdf.
400
500
600
700
800
Num
ber
of ju
dges
1986 1989 1992 1995 1998 2001 2004 2007 2010 2013
Article III judges Magistrate judges

MOORE.DOCX (DO NOT DELETE) 5/22/2015 9:51 AM
1190 UNIVERSITY OF ILLINOIS LAW REVIEW [Vol. 2015
senior judges and magistrate judges.51 The term “unweighted filings” is essentially the raw number of case filings, or what I have called the “AO-Reported Total” above for civil cases, but excluding transfers, reopens, and remands.
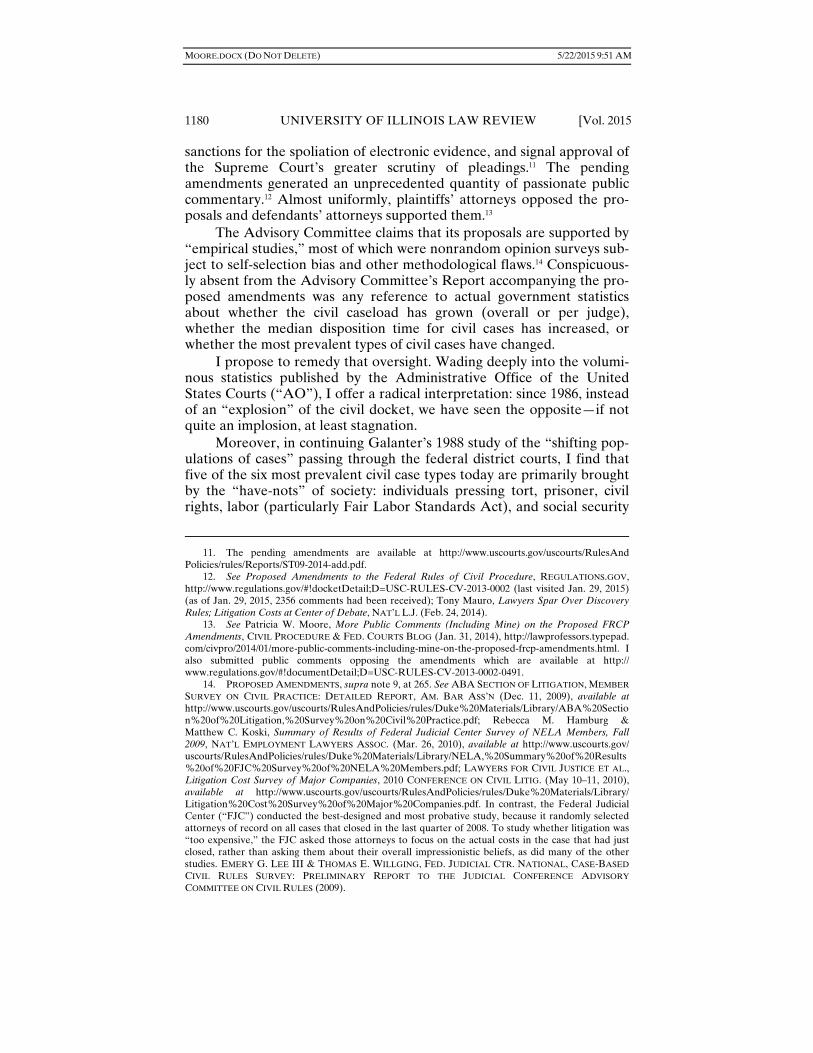
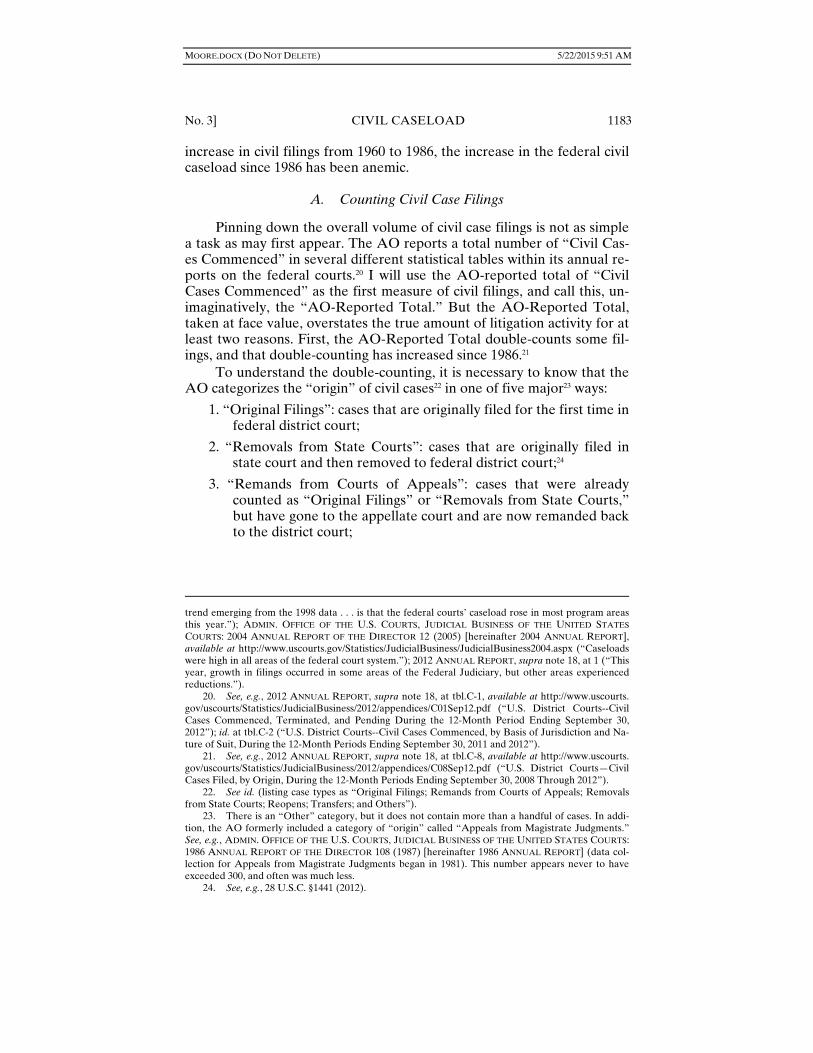
Unweighted civil filings per authorized judgeship have declined 10% since 1986, from 445 in 1986 to 400 in 2013,52 as the bottom graph of Fig-ure 3 shows.
FIGURE 3: WEIGHTED AND UNWEIGHTED FILINGS PER
AUTHORIZED DISTRICT COURT JUDGESHIP, 1985–2013
NOTE: Senior judges and magistrate judges are not included.
SOURCE: Table X-1 for 1986; Table X-1A for 2013.
51. See U.S. GOV'T ACCOUNTABILITY OFFICE, GAO-13-862T, FEDERAL JUDGESHIPS: THE
GENERAL ACCURACY OF DISTRICT AND APPELLATE JUDGESHIP CASE-RELATED WORKLOAD
MEASURES 2 (2013). 52. 1986 ANNUAL REPORT, supra note 23, at tbl.X-1 & tbl.X-1A; ADMIN. OFFICE OF THE U.S. COURTS, JUDICIAL BUSINESS OF THE UNITED STATES COURTS: 2013 ANNUAL REPORT OF THE
DIRECTOR tbl. X-1A (2014) [hereinafter 2013 ANNUAL REPORT], available at http://www.uscourts.gov/ Statistics/JudicialBusiness/2013.aspx.
020
040
060
0
1986 1989 1992 1995 1998 2001 2004 2007 2010 2013
Total weighted Civil
Criminal
Weighted filings per authorized district court judgeship
020
040
060
0
1986 1989 1992 1995 1998 2001 2004 2007 2010 2013
Total unweighted Civil
Criminal
Unweighted filings per authorized district court judgeship
MOORE.DOCX (DO NOT DELETE) 5/22/2015 9:51 AM
No. 3] CIVIL CASELOAD 1191
Criminal filings have caused the increase in the total number of un-weighted cases per authorized judgeship since 1986.53 As shown in the bottom graph of Figure 3, unweighted criminal filings per judgeship have about doubled, from 70 in 1986 to 135 in 2013. Criminal filings thus caused the number of total unweighted filings per authorized judgeship to increase from 515 in 1986 to 573 in 2013.
Turning now to weighted filings, the underlying idea is that different types of cases take different amounts of judicial time, so the raw number of case filings may not be an accurate representation of the court’s true workload. Thus, the AO has devised a system of case “weights” to apply to different types of cases.54
The weights have changed numerous times, so the figures are not directly comparable from year to year.55 The average civil case is weighted about 1.0,56 which the AO calculates is about 441 minutes.57 Thus, for example, a case weight of 0.67 means that the average case of that type supposedly takes nearly five hours of judge time (about 295 minutes) from filing to disposition. The weights are calculated for both civil and criminal cases, and in 2002 the AO added contested supervised release hearings conducted in district courts as a separate category in-cluded in the total.58
53. See S.1385 Hearings, supra note 8, at 57 (statement of Michael Reed) (“[Since 1990], federal judicial caseloads have steadily and steeply increased, fueled in large part by congressional expansion of federal court jurisdiction and national drug and immigration policies that call for and fund en-hanced law enforcement efforts.”); Miller, supra note 2, at 990 (“[T]he increasing federalization of criminal law has burdened the federal judicial system and reduced its capacity to administer civil jus-tice . . . .”); Mullenix, supra note 2, at 1413 (describing a 1988 opinion survey that found, through ques-tionable social science methodology, that a majority of the surveyed judges and lawyers believed that the costs of civil litigation were a “major problem,” and noting that “[r]espondents had no opportunity . . . to consider whether the increasing volume of criminal cases and the priority they are given affect the high costs and delays alleged to exist in federal civil litigation”). 54. The case weights are based solely on work done by district judges, not magistrate judges. LOMBARD & KRAFKA, supra note 32, at 6. The case weights also do not include “civil cases arising by reopening, remand, and transfer to the district by order of the Judicial Panel on Multidistrict Litiga-tion . . . .” ADMIN. OFFICE OF THE U.S. COURTS, EXPLANATION OF SELECTED TERMS 1–2, available at http://www.uscourts.gov/viewer.aspx?doc=/uscourts/Statistics/FederalCourtManagementStatistics/2013/explanation-of-selected-terms-september-2013.pdf. 55. The exact civil and criminal weights by nature of suit or offense used to be reported fully in Table X-2 as part of the Detailed Statistical Tables in the annual “Judicial Business of the United States” report. See, e.g., ADMIN. OFFICE OF THE U.S. COURTS, JUDICIAL BUSINESS OF THE UNITED
STATES COURTS: 1980 ANNUAL REPORT OF THE DIRECTOR 625 (1981). The AO no longer releases Table X-2. 56. EXPLANATION OF SELECTED TERMS, supra note 54. 57. LOMBARD & KRAFKA, supra note 32, at 58. But see Schlanger, supra note 26, at 1589 n.96 (AO representative told Schlanger that a weight of 1.0 under the 1993 weights was “supposed to rep-resent about three hours of judge time”). 58. ADMIN. OFFICE OF THE U.S. COURTS, JUDICIAL BUSINESS OF THE UNITED STATES COURTS: 2002 ANNUAL REPORT OF THE DIRECTOR 25 [hereinafter 2002 ANNUAL REPORT], available at http://www.uscourts.gov/Statistics/JudicialBusiness/JudicialBusiness2002.aspx (“In 2002, a new statisti-cal indicator was added to the formula for calculating both weighted and unweighted filings nationally and in the individual US district courts. This indicator, ‘supervised release hearings,’ includes . . . con-tested supervised release hearings held in the US district courts.”).
MOORE.DOCX (DO NOT DELETE) 5/22/2015 9:51 AM
1192 UNIVERSITY OF ILLINOIS LAW REVIEW [Vol. 2015
The latest case weights were announced in 2004.59 Rather than using the earlier time study method for determining case weights (in which judges kept detailed timesheets), the AO in 2004 used an “event-based” method, which “combines docketing information from the courts, objec-tive information from statistical reports, and time estimates derived from the consensus of experienced district judges whenever objective infor-mation was not available.”60
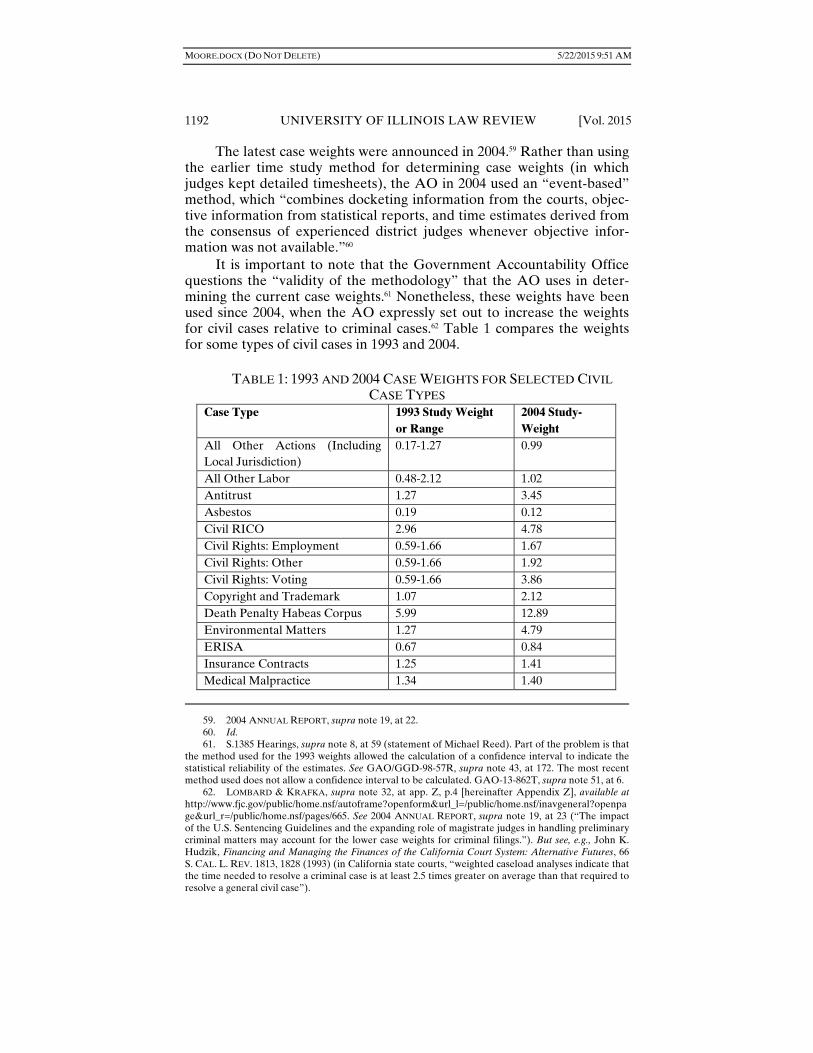
It is important to note that the Government Accountability Office questions the “validity of the methodology” that the AO uses in deter-mining the current case weights.61 Nonetheless, these weights have been used since 2004, when the AO expressly set out to increase the weights for civil cases relative to criminal cases.62 Table 1 compares the weights for some types of civil cases in 1993 and 2004.
TABLE 1: 1993 AND 2004 CASE WEIGHTS FOR SELECTED CIVIL
CASE TYPES Case Type 1993 Study Weight
or Range 2004 Study-Weight
All Other Actions (Including Local Jurisdiction)
0.17-1.27 0.99
All Other Labor 0.48-2.12 1.02 Antitrust 1.27 3.45 Asbestos 0.19 0.12 Civil RICO 2.96 4.78 Civil Rights: Employment 0.59-1.66 1.67 Civil Rights: Other 0.59-1.66 1.92 Civil Rights: Voting 0.59-1.66 3.86 Copyright and Trademark 1.07 2.12 Death Penalty Habeas Corpus 5.99 12.89 Environmental Matters 1.27 4.79 ERISA 0.67 0.84 Insurance Contracts 1.25 1.41 Medical Malpractice 1.34 1.40
59. 2004 ANNUAL REPORT, supra note 19, at 22. 60. Id. 61. S.1385 Hearings, supra note 8, at 59 (statement of Michael Reed). Part of the problem is that the method used for the 1993 weights allowed the calculation of a confidence interval to indicate the statistical reliability of the estimates. See GAO/GGD-98-57R, supra note 43, at 172. The most recent method used does not allow a confidence interval to be calculated. GAO-13-862T, supra note 51, at 6. 62. LOMBARD & KRAFKA, supra note 32, at app. Z, p.4 [hereinafter Appendix Z], available at http://www.fjc.gov/public/home.nsf/autoframe?openform&url_l=/public/home.nsf/inavgeneral?openpage&url_r=/public/home.nsf/pages/665. See 2004 ANNUAL REPORT, supra note 19, at 23 (“The impact of the U.S. Sentencing Guidelines and the expanding role of magistrate judges in handling preliminary criminal matters may account for the lower case weights for criminal filings.”). But see, e.g., John K. Hudzik, Financing and Managing the Finances of the California Court System: Alternative Futures, 66 S. CAL. L. REV. 1813, 1828 (1993) (in California state courts, “weighted caseload analyses indicate that the time needed to resolve a criminal case is at least 2.5 times greater on average than that required to resolve a general civil case”).
MOORE.DOCX (DO NOT DELETE) 5/22/2015 9:51 AM
No. 3] CIVIL CASELOAD 1193
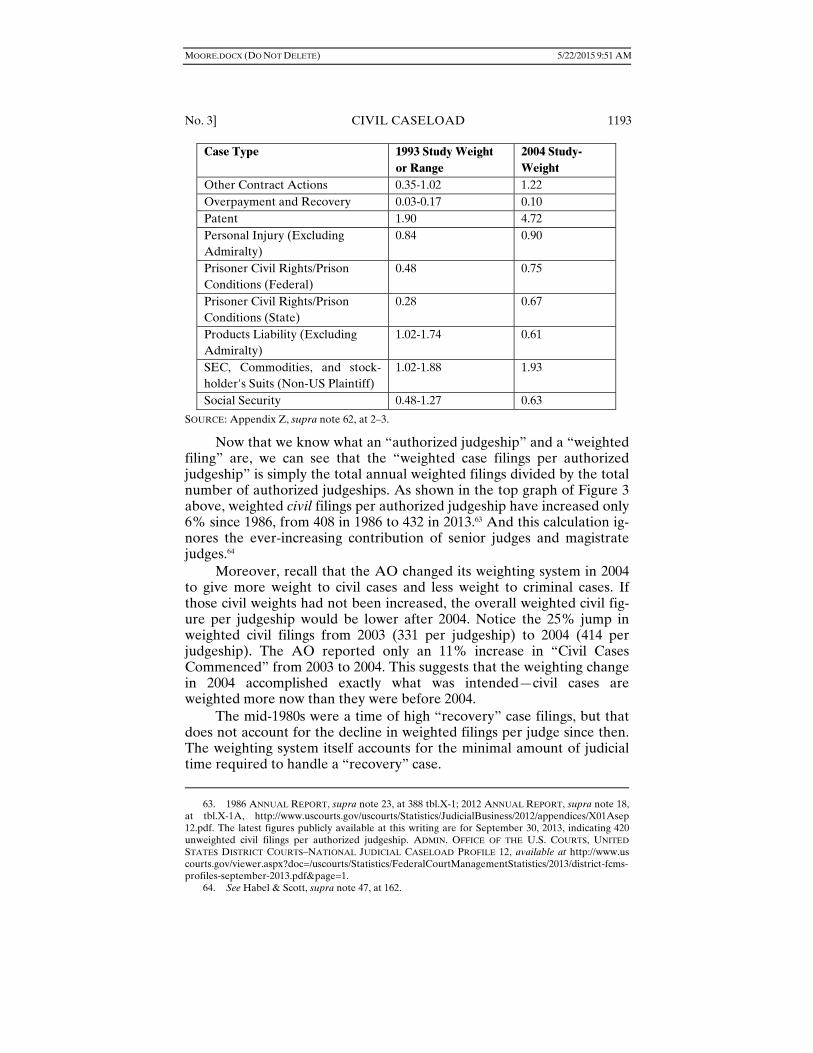
Case Type 1993 Study Weight or Range
2004 Study-Weight
Other Contract Actions 0.35-1.02 1.22 Overpayment and Recovery 0.03-0.17 0.10 Patent 1.90 4.72 Personal Injury (Excluding Admiralty)
0.84 0.90
Prisoner Civil Rights/Prison Conditions (Federal)
0.48 0.75
Prisoner Civil Rights/Prison Conditions (State)
0.28 0.67
Products Liability (Excluding Admiralty)
1.02-1.74 0.61
SEC, Commodities, and stock-holder's Suits (Non-US Plaintiff)
1.02-1.88 1.93
Social Security 0.48-1.27 0.63
SOURCE: Appendix Z, supra note 62, at 2–3.
Now that we know what an “authorized judgeship” and a “weighted filing” are, we can see that the “weighted case filings per authorized judgeship” is simply the total annual weighted filings divided by the total number of authorized judgeships. As shown in the top graph of Figure 3 above, weighted civil filings per authorized judgeship have increased only 6% since 1986, from 408 in 1986 to 432 in 2013.63 And this calculation ig-nores the ever-increasing contribution of senior judges and magistrate judges.64
Moreover, recall that the AO changed its weighting system in 2004 to give more weight to civil cases and less weight to criminal cases. If those civil weights had not been increased, the overall weighted civil fig-ure per judgeship would be lower after 2004. Notice the 25% jump in weighted civil filings from 2003 (331 per judgeship) to 2004 (414 per judgeship). The AO reported only an 11% increase in “Civil Cases Commenced” from 2003 to 2004. This suggests that the weighting change in 2004 accomplished exactly what was intended—civil cases are weighted more now than they were before 2004.
The mid-1980s were a time of high “recovery” case filings, but that does not account for the decline in weighted filings per judge since then. The weighting system itself accounts for the minimal amount of judicial time required to handle a “recovery” case.
63. 1986 ANNUAL REPORT, supra note 23, at 388 tbl.X-1; 2012 ANNUAL REPORT, supra note 18, at tbl.X-1A, http://www.uscourts.gov/uscourts/Statistics/JudicialBusiness/2012/appendices/X01Asep 12.pdf. The latest figures publicly available at this writing are for September 30, 2013, indicating 420 unweighted civil filings per authorized judgeship. ADMIN. OFFICE OF THE U.S. COURTS, UNITED
STATES DISTRICT COURTS–NATIONAL JUDICIAL CASELOAD PROFILE 12, available at http://www.us courts.gov/viewer.aspx?doc=/uscourts/Statistics/FederalCourtManagementStatistics/2013/district-fcms-profiles-september-2013.pdf&page=1. 64. See Habel & Scott, supra note 47, at 162.
MOORE.DOCX (DO NOT DELETE) 5/22/2015 9:51 AM
1194 UNIVERSITY OF ILLINOIS LAW REVIEW [Vol. 2015
Again, criminal filings, not civil filings, caused most of the increase in total weighted cases per authorized judgeship from 469 in 1986 to 545 in 2013. As the top graph of Figure 3 shows, weighted criminal filings per judgeship have increased 75%, from 61 in 1986 to 107 in 2013.
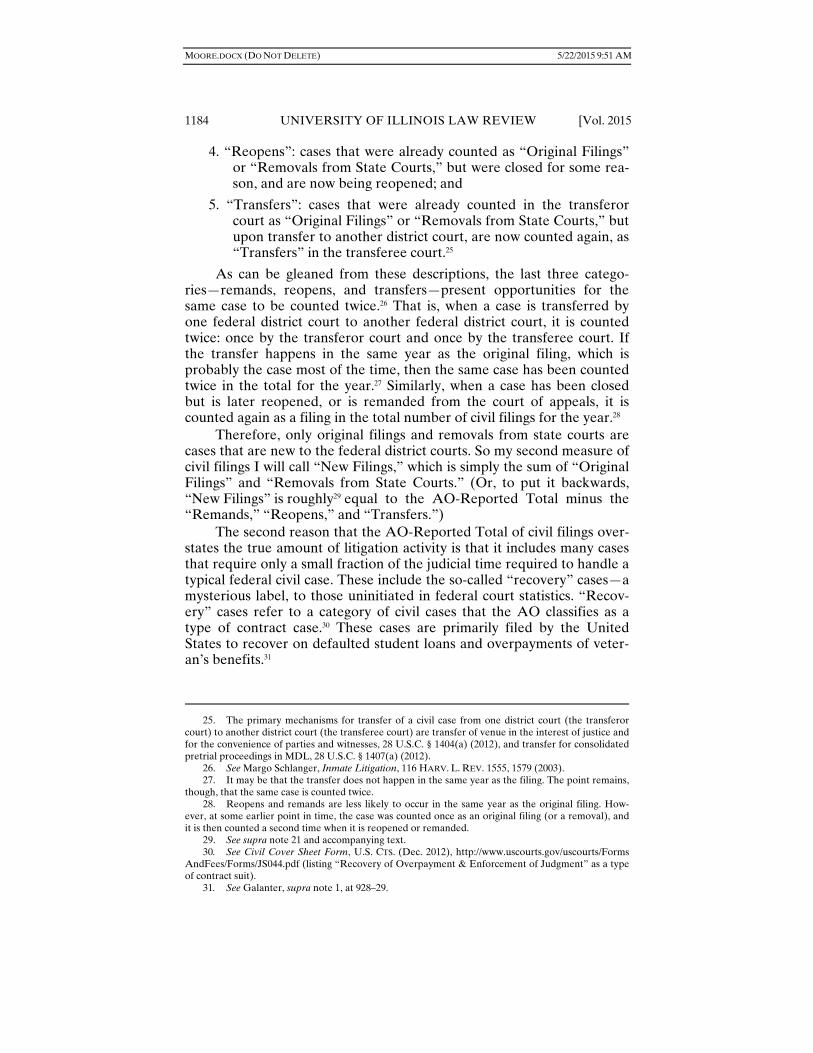
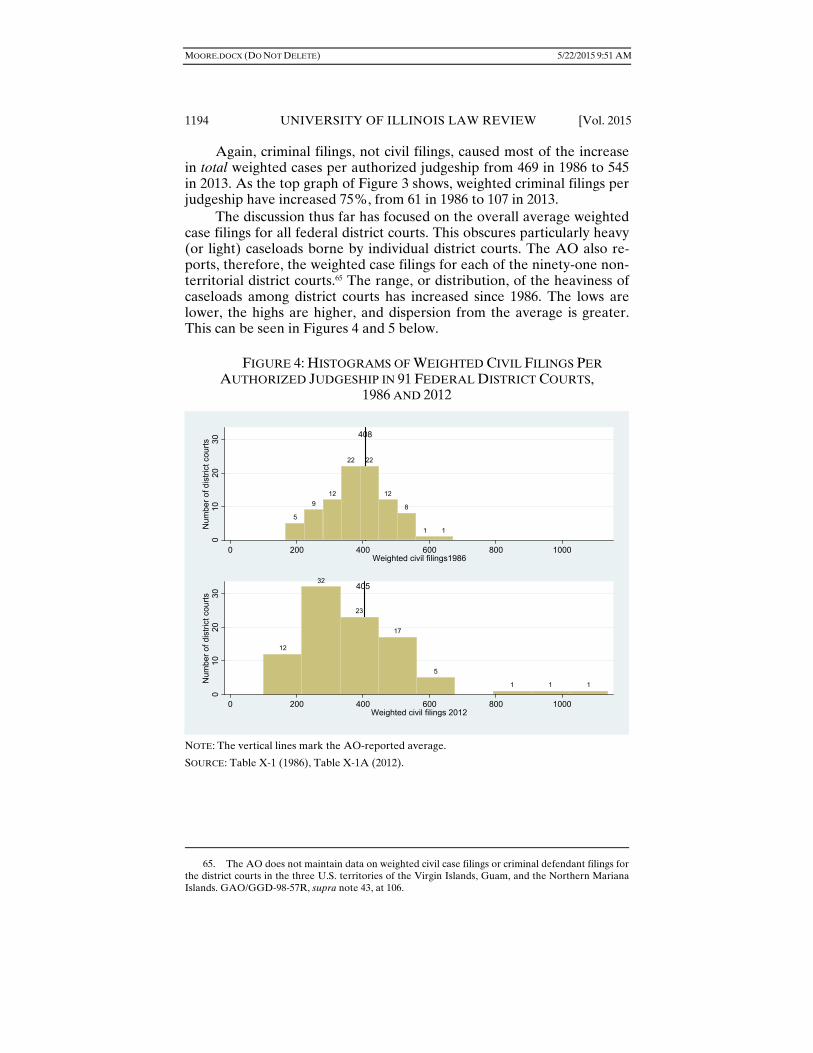
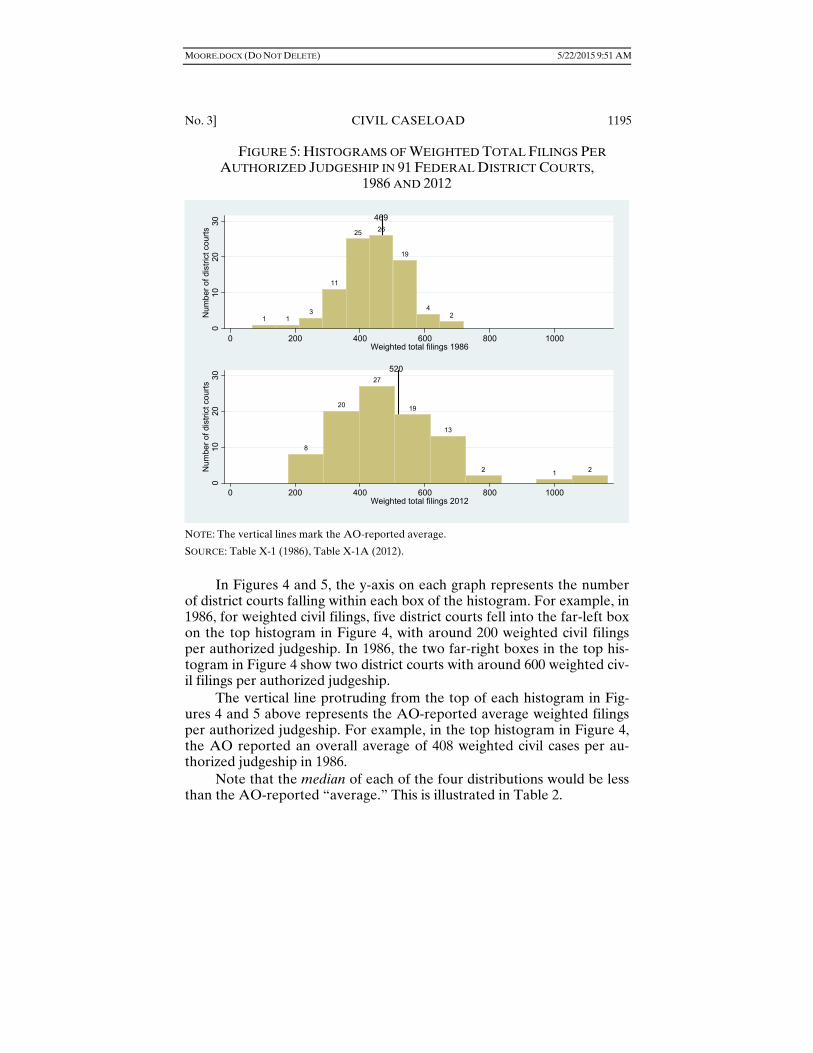
The discussion thus far has focused on the overall average weighted case filings for all federal district courts. This obscures particularly heavy (or light) caseloads borne by individual district courts. The AO also re-ports, therefore, the weighted case filings for each of the ninety-one non-territorial district courts.65 The range, or distribution, of the heaviness of caseloads among district courts has increased since 1986. The lows are lower, the highs are higher, and dispersion from the average is greater. This can be seen in Figures 4 and 5 below.
FIGURE 4: HISTOGRAMS OF WEIGHTED CIVIL FILINGS PER
AUTHORIZED JUDGESHIP IN 91 FEDERAL DISTRICT COURTS, 1986 AND 2012
NOTE: The vertical lines mark the AO-reported average.
SOURCE: Table X-1 (1986), Table X-1A (2012).
65. The AO does not maintain data on weighted civil case filings or criminal defendant filings for the district courts in the three U.S. territories of the Virgin Islands, Guam, and the Northern Mariana Islands. GAO/GGD-98-57R, supra note 43, at 106.
5
9
12
22 22
12
8
1 1
408
010
2030
Num
ber
of d
istr
ict c
ourt
s
0 200 400 600 800 1000Weighted civil filings1986
12
32
23
17
5
1 1 1
405
010
2030
Num
ber
of d
istr
ict c
ourt
s
0 200 400 600 800 1000Weighted civil filings 2012
MOORE.DOCX (DO NOT DELETE) 5/22/2015 9:51 AM
No. 3] CIVIL CASELOAD 1195
FIGURE 5: HISTOGRAMS OF WEIGHTED TOTAL FILINGS PER AUTHORIZED JUDGESHIP IN 91 FEDERAL DISTRICT COURTS,
1986 AND 2012
NOTE: The vertical lines mark the AO-reported average.
SOURCE: Table X-1 (1986), Table X-1A (2012).
In Figures 4 and 5, the y-axis on each graph represents the number of district courts falling within each box of the histogram. For example, in 1986, for weighted civil filings, five district courts fell into the far-left box on the top histogram in Figure 4, with around 200 weighted civil filings per authorized judgeship. In 1986, the two far-right boxes in the top his-togram in Figure 4 show two district courts with around 600 weighted civ-il filings per authorized judgeship.
The vertical line protruding from the top of each histogram in Fig-ures 4 and 5 above represents the AO-reported average weighted filings per authorized judgeship. For example, in the top histogram in Figure 4, the AO reported an overall average of 408 weighted civil cases per au-thorized judgeship in 1986.
Note that the median of each of the four distributions would be less than the AO-reported “average.” This is illustrated in Table 2.
1 13
11
25 26
19
42
4690
1020
30N
umbe
r of
dis
tric
t cou
rts
0 200 400 600 800 1000Weighted total filings 1986
8
20
27
19
13
2 1 2
520
010
2030
Num
ber
of d
istr
ict c
ourt
s
0 200 400 600 800 1000Weighted total filings 2012

MOORE.DOCX (DO NOT DELETE) 5/22/2015 9:51 AM
1196 UNIVERSITY OF ILLINOIS LAW REVIEW [Vol. 2015
TABLE 2: WEIGHTED CIVIL AND TOTAL FILINGS, 1986 AND 2012
AO-reported "average"
Number of district courts lying below the "average"
Number of district courts lying above the "average"
1986 civil 408 50 41
2012 civil 405 59 32
1986 total 469 51 39
2012 total 520 56 35
The distribution of the ninety-one nonterritorial district courts
around the AO’s stated average of weighted cases in 1986 was far closer to normal than the distribution in 2012. By 2012, it is evident that several high-volume districts at the top of the distribution are pulling up the av-erage.66 The “outlier” courts in 2012 are farther from the average than the outliers were in 1986. But there are also more courts below the aver-age in 2012 than there were in 1986.
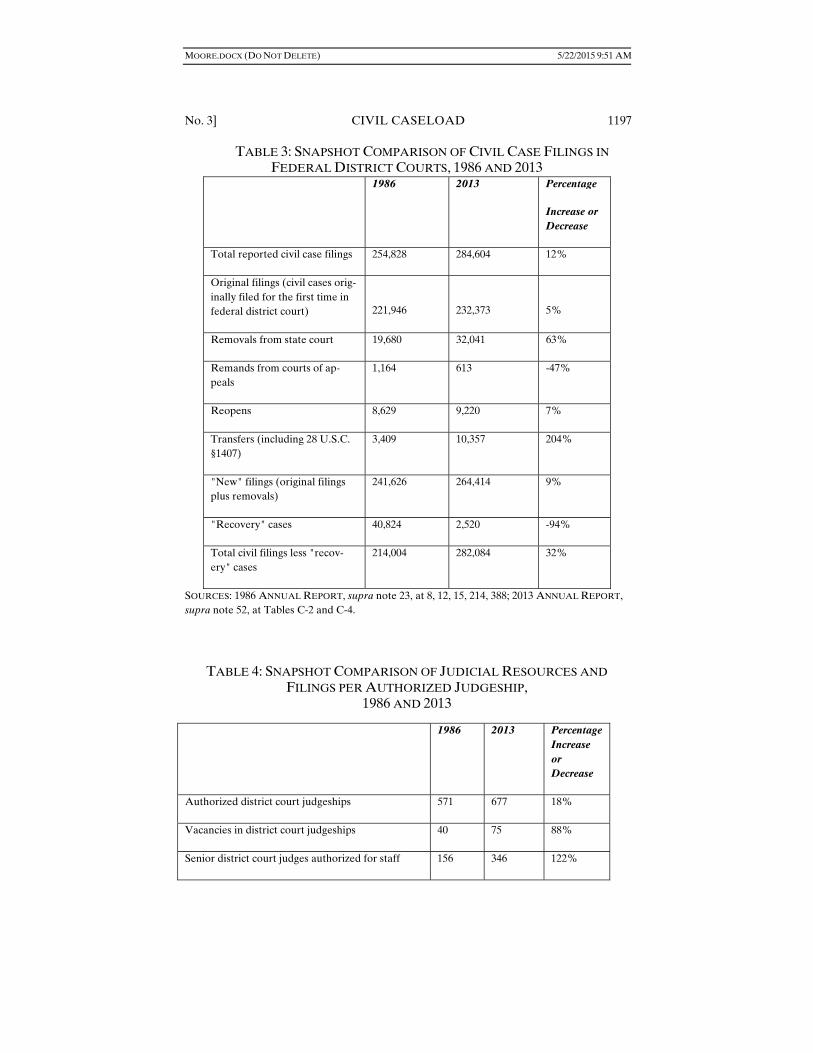
To sum up the last two Parts of this Article, Tables 3 and 4 present snapshots of the federal civil caseload in 1986 and 2013. Table 3 shows what might be called “demand-side” measures: different measures for case filings.67 Table 4 shows what might be called “supply-side” measures: judicial resources to be applied to the case filings.
66. The ten districts with the highest number of weighted civil cases per authorized judgeship as of September 30, 2012 were the Northern District of Alabama (545), the Southern District of Indiana (546), the Southern District of West Virginia (568), Colorado (574), the Northern District of California (611), the Central District of California (626), the Southern District of Illinois (633), the Eastern District of Texas (890), the Eastern District of California (947), and Delaware (1138). The districts of Colorado, the Northern District of California, the Central District of California, the South-ern District of Illinois, the Eastern District of Texas, the Eastern District of California, and Delaware were also in the top ten districts for total weighted case filings. 2012 ANNUAL REPORT, supra note 18, at tbl.X-1A. Most of these are districts for which Senate Bill 1385, The Federal Judgeship Act of 2013, has requested additional permanent or temporary judgeships. S. 1385, supra note 8. 67. See Richard A. Posner, Demand and Supply Trends in Federal and State Courts Over the Last Half Century, 8 J. APP. PRAC. & PROCESS 133 (2006).
MOORE.DOCX (DO NOT DELETE) 5/22/2015 9:51 AM
No. 3] CIVIL CASELOAD 1197
TABLE 3: SNAPSHOT COMPARISON OF CIVIL CASE FILINGS IN FEDERAL DISTRICT COURTS, 1986 AND 2013
1986 2013 Percentage
Increase or Decrease
Total reported civil case filings 254,828 284,604 12%
Original filings (civil cases orig-inally filed for the first time in federal district court)
221,946
232,373
5%
Removals from state court 19,680 32,041 63%
Remands from courts of ap-peals
1,164 613 -47%
Reopens 8,629 9,220 7%
Transfers (including 28 U.S.C. §1407)
3,409 10,357 204%
"New" filings (original filings plus removals)
241,626 264,414 9%
"Recovery" cases 40,824 2,520 -94%
Total civil filings less "recov-ery" cases
214,004 282,084 32%
SOURCES: 1986 ANNUAL REPORT, supra note 23, at 8, 12, 15, 214, 388; 2013 ANNUAL REPORT, supra note 52, at Tables C-2 and C-4.
TABLE 4: SNAPSHOT COMPARISON OF JUDICIAL RESOURCES AND FILINGS PER AUTHORIZED JUDGESHIP,
1986 AND 2013
1986 2013 Percentage Increase or Decrease
Authorized district court judgeships 571 677 18%
Vacancies in district court judgeships 40 75 88%
Senior district court judges authorized for staff 156 346 122%
MOORE.DOCX (DO NOT DELETE) 5/22/2015 9:51 AM
1198 UNIVERSITY OF ILLINOIS LAW REVIEW [Vol. 2015
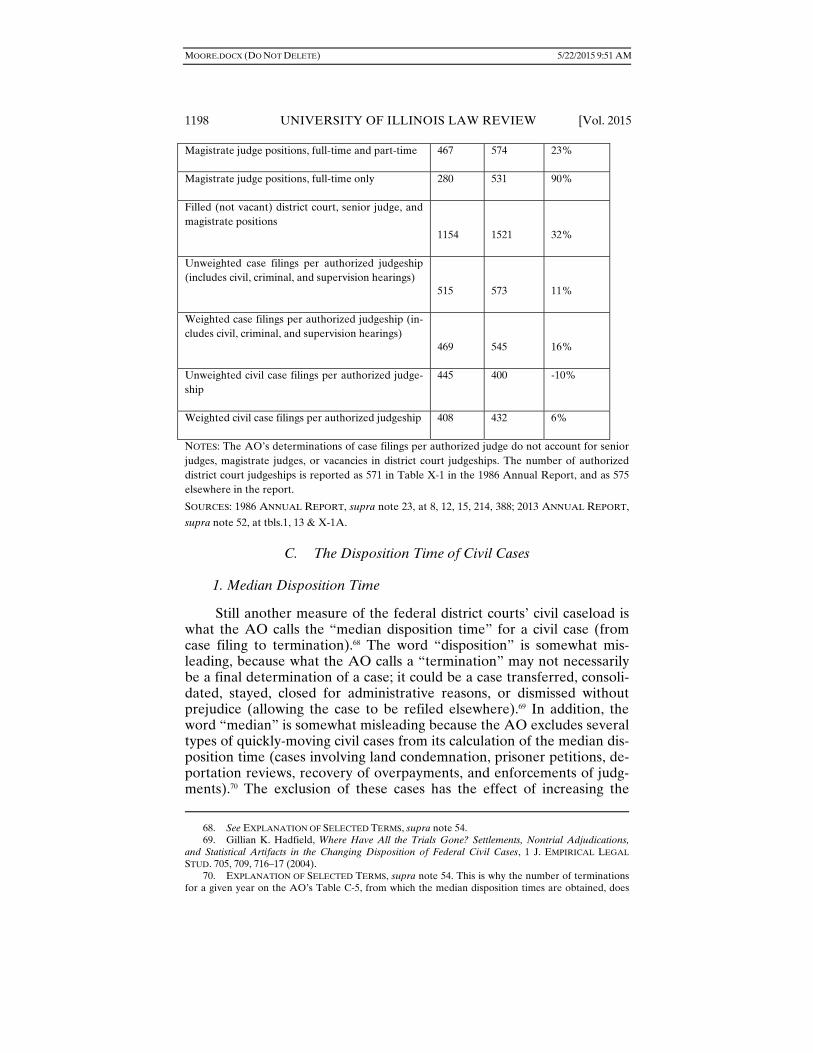
Magistrate judge positions, full-time and part-time 467 574 23%
Magistrate judge positions, full-time only 280 531 90%
Filled (not vacant) district court, senior judge, and magistrate positions
1154
1521
32%
Unweighted case filings per authorized judgeship (includes civil, criminal, and supervision hearings)
515
573
11%
Weighted case filings per authorized judgeship (in-cludes civil, criminal, and supervision hearings)
469
545
16%
Unweighted civil case filings per authorized judge-ship
445 400 -10%
Weighted civil case filings per authorized judgeship 408 432 6%
NOTES: The AO’s determinations of case filings per authorized judge do not account for senior judges, magistrate judges, or vacancies in district court judgeships. The number of authorized district court judgeships is reported as 571 in Table X-1 in the 1986 Annual Report, and as 575 elsewhere in the report.
SOURCES: 1986 ANNUAL REPORT, supra note 23, at 8, 12, 15, 214, 388; 2013 ANNUAL REPORT,
supra note 52, at tbls.1, 13 & X-1A.
C. The Disposition Time of Civil Cases
1. Median Disposition Time
Still another measure of the federal district courts’ civil caseload is what the AO calls the “median disposition time” for a civil case (from case filing to termination).68 The word “disposition” is somewhat mis-leading, because what the AO calls a “termination” may not necessarily be a final determination of a case; it could be a case transferred, consoli-dated, stayed, closed for administrative reasons, or dismissed without prejudice (allowing the case to be refiled elsewhere).69 In addition, the word “median” is somewhat misleading because the AO excludes several types of quickly-moving civil cases from its calculation of the median dis-position time (cases involving land condemnation, prisoner petitions, de-portation reviews, recovery of overpayments, and enforcements of judg-ments).70 The exclusion of these cases has the effect of increasing the
68. See EXPLANATION OF SELECTED TERMS, supra note 54. 69. Gillian K. Hadfield, Where Have All the Trials Gone? Settlements, Nontrial Adjudications, and Statistical Artifacts in the Changing Disposition of Federal Civil Cases, 1 J. EMPIRICAL LEGAL
STUD. 705, 709, 716–17 (2004). 70. EXPLANATION OF SELECTED TERMS, supra note 54. This is why the number of terminations for a given year on the AO’s Table C-5, from which the median disposition times are obtained, does
MOORE.DOCX (DO NOT DELETE) 5/22/2015 9:51 AM
No. 3] CIVIL CASELOAD 1199
median time reported; in other words, if these cases were included, the median time would be less.
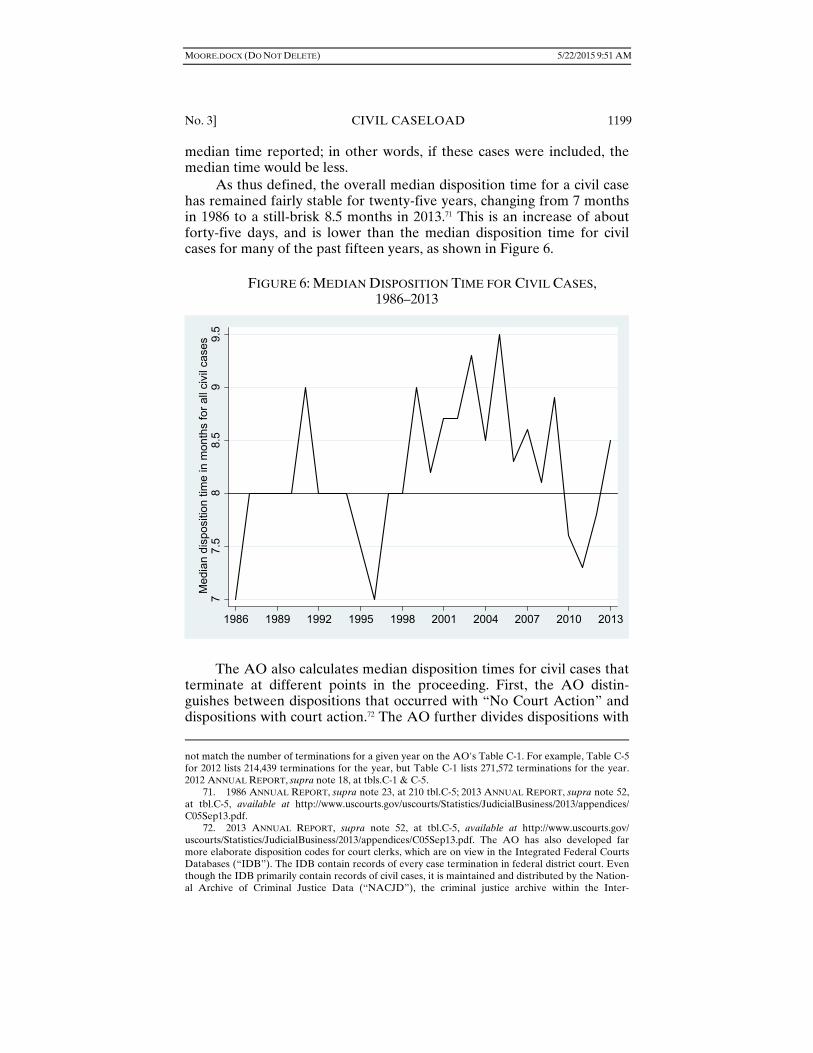
As thus defined, the overall median disposition time for a civil case has remained fairly stable for twenty-five years, changing from 7 months in 1986 to a still-brisk 8.5 months in 2013.71 This is an increase of about forty-five days, and is lower than the median disposition time for civil cases for many of the past fifteen years, as shown in Figure 6.
FIGURE 6: MEDIAN DISPOSITION TIME FOR CIVIL CASES,
1986–2013
The AO also calculates median disposition times for civil cases that terminate at different points in the proceeding. First, the AO distin-guishes between dispositions that occurred with “No Court Action” and dispositions with court action.72 The AO further divides dispositions with
not match the number of terminations for a given year on the AO's Table C-1. For example, Table C-5 for 2012 lists 214,439 terminations for the year, but Table C-1 lists 271,572 terminations for the year. 2012 ANNUAL REPORT, supra note 18, at tbls.C-1 & C-5. 71. 1986 ANNUAL REPORT, supra note 23, at 210 tbl.C-5; 2013 ANNUAL REPORT, supra note 52, at tbl.C-5, available at http://www.uscourts.gov/uscourts/Statistics/JudicialBusiness/2013/appendices/ C05Sep13.pdf. 72. 2013 ANNUAL REPORT, supra note 52, at tbl.C-5, available at http://www.uscourts.gov/ uscourts/Statistics/JudicialBusiness/2013/appendices/C05Sep13.pdf. The AO has also developed far more elaborate disposition codes for court clerks, which are on view in the Integrated Federal Courts Databases (“IDB”). The IDB contain records of every case termination in federal district court. Even though the IDB primarily contain records of civil cases, it is maintained and distributed by the Nation-al Archive of Criminal Justice Data (“NACJD”), the criminal justice archive within the Inter-
77.
58
8.5
99.
5M
edia
n di
spos
ition
tim
e in
mon
ths
for
all c
ivil
case
s
1986 1989 1992 1995 1998 2001 2004 2007 2010 2013
MOORE.DOCX (DO NOT DELETE) 5/22/2015 9:51 AM
1200 UNIVERSITY OF ILLINOIS LAW REVIEW [Vol. 2015
court action into three categories: dispositions that occurred “Before Pretrial,” “During or After Pretrial,” or at “Trial.”73 The AO reports the median disposition time for all districts combined, as well as the median disposition time for individual district courts, for all of these categories.
Figure 7 below shows the median disposition times for federal civil cases since 1985. For cases terminating with “no court action,” the medi-an time from filing to termination rose from four months in 1986 to five months in 2013. For cases terminating with some court action before pre-trial, the median time from filing to termination rose from 7 months in 1986 to 8.5 months in 2013. For cases terminating during or after pretrial (but before trial), the median time from filing to termination declined from fifteen months in 1986 to 12.5 months in 2013.
University Consortium for Political and Social Research. The IDB database series is restricted from general dissemination. A researcher must be approved by the NACJD to gain access to these datasets. See Federal Court Cases: Integrated Data Base, 2010, INTER-UNIVERSITY CONSORTIUM FOR
POLITICAL AND SOCIAL RESEARCH, U. OF MICH., http://www.icpsr.umich.edu/icpsrweb/ICPSR/series/ 00072/studies/30401?archive=ICPSR&sortBy=7&permit%5B0%5D=AVAILABLE (find “Access Notes” section and click “restrictions note”) (last visited Mar. 5, 2015) (“Users interested in obtaining these data must complete a Restricted Data Use Agreement, specify the reasons for the request, and obtain IRB approval or notice of exemption for their research”). 73. These categories, as well as the more elaborate coding described in 2013 ANNUAL REPORT, supra note 52 at tbl.C-5, available at http://www.uscourts.gov/uscourts/Statistics/JudicialBusiness/ 2013/appendices/C05Sep13.pdf are murky at best. One scholar’s audit of types of dispositions in 2000 found very large errors in coding (as much as 69% for one code). Hadfield, supra note 69, at 710–11. In addition, the AO revised the coding system in 1987, 1992, and 1995, making direct comparisons problematic. Id. Nonetheless, the AO’s statistics are all that are available, and they are far more com-prehensive than most state courts’ caseload statistics.

MOORE.DOCX (DO NOT DELETE) 5/22/2015 9:51 AM
No. 3] CIVIL CASELOAD 1201
FIGURE 7: MEDIAN DISPOSITION TIMES (IN MONTHS) FOR CIVIL CASES TERMINATED AT VARIOUS POINTS IN THE “PROCEDURAL
PROGRESS,” 1986–2013
SOURCE: Table C-5, U.S. District Courts—Median Time Intervals From Filing to Disposition of
Civil Cases Terminated, by District and Method of Disposition, During the 12-Month Period
Ending September 30, [year], for the years 1985 through 2013. Information for 1993 and 1995 is
not available. I have omitted an outlier of 33.9 months in 2006 for the “during or after pretrial”
category and an outlier of 127.6 months in 2007 for the “trial” category. These outliers were in-
fluenced by the termination of large numbers of long-pending mass tort cases in those years. See
2006 ANNUAL REPORT, supra note 44, at 23; 2007 ANNUAL REPORT, infra note 77, at 24.
The only category for which the median disposition time has in-creased significantly is cases terminating at trial (from 19 months in 1986 to 24.1 months in 2013). But as followers of the “vanishing trial” know, both the absolute number of federal civil cases going to trial74 and the percentage of all civil cases that terminated at trial have sharply fallen since 1986.75 Thus, while a five-month increase in the median disposition
74. 1986 ANNUAL REPORT, supra note 23, at 210, tbl.C-5; 2013 Annual REPORT, supra note 52, at tbl.C-5, available at http://www.uscourts.gov/uscourts/Statistics/JudicialBusiness/2013/appendices/ C05Sep13.pdf. The AO considers a trial to include any “contested proceeding before a court or jury where evidence is introduced.” 1986 ANNUAL REPORT, supra note 23, at 19. 75. In 1986, 10,690 civil cases terminated at trial, or 5% of all civil cases terminating that year. 1986 ANNUAL REPORT, supra note 23, at 210, tbl.C-5. In 2012, 2804 cases terminated at trial, or 1% of all civil cases terminating that year. 2012 ANNUAL REPORT, supra note 18, at tbl.C-5. See, e.g., Ga-lanter, supra note 46, at 482. But see Gillian K. Hadfield, Exploring Economic and Democratic Theo-ries of Civil Litigation: Differences Between Individual and Organizational Litigants in the Disposition
010
2030
40
Med
ian
disp
ositi
on ti
me
in m
onth
s
1986 1989 1992 1995 1998 2001 2004 2007 2010 2013
No court action Before pretrialDuring or after pretrial Trial

MOORE.DOCX (DO NOT DELETE) 5/22/2015 9:51 AM
1202 UNIVERSITY OF ILLINOIS LAW REVIEW [Vol. 2015
time of cases terminating at trial may be of concern, it is a concern that affects only 1% of all civil cases.
Of course, this is the median time for all district courts, and there are numerous district courts laboring under a higher disposition time (just as there are numerous courts with a shorter disposition time).76 In addition, changes in the overall median time can be misleading. Like the moon’s gravitational pull on the tides, cases consolidated in MDL litiga-tions exert a massive influence on terminations and disposition times each year. For example, in 2007:
The national median time from filing to disposition for civil cases was 8.6 months, up from 8.3 months in 2006. This increase resulted from the disposition of more than 6,300 oil refinery explosion cases in the Middle District of Louisiana that had been pending more than [ten] years. Excluding the oil refinery explosion cases, the na-tional median time for civil cases was 8.2 months.77
As can be seen from this example, the termination of large numbers of long-pending mass tort cases (or any large number of cases) releases long disposition times into the numerator and increases the median disposi-tion time for the year.78 Thus, when a court is actually “cleaning up” its docket by terminating older cases, it paradoxically is causing an increase in its median disposition time for the year.
The AO does not generally release the median disposition times for different case types, but a smattering of information indicates that the times for some case types have also not materially increased since 1986. For civil rights cases, the median disposition time of 11 months was un-changed from 1990 to 2006, and the mean disposition time actually de-clined from 15.1 months in 1990 to 13.6 months in 2006.79 And although the number of cases pending more than three years has increased since 1991, primarily due to the rise in MDL litigation, the number of motions pending more than 6 months has decreased 173% since 1991, and the
of Federal Civil Cases, 57 STAN. L. REV. 1275, 1314–17 (2005) (calculating a greater trial rate than that suggested by the AO's figures). 76. See 2006 ANNUAL REPORT, supra note 44, at 23. 77. ADMIN. OFFICE OF THE U.S. COURTS, JUDICIAL BUSINESS OF THE UNITED STATES COURTS: 2007 ANNUAL REPORT OF THE DIRECTOR 24 (2008) [hereinafter 2007 ANNUAL REPORT], available at http://www.uscourts.gov/Statistics/JudicialBusiness/JudicialBusiness2007.aspx. 78. E.g., 2006 ANNUAL REPORT, supra note 44, at 23; ADMIN. OFFICE OF THE U.S. COURTS, JUDICIAL BUSINESS OF THE UNITED STATES COURTS: 2009 ANNUAL REPORT OF THE DIRECTOR 10–11 (2010) [hereinafter 2009 ANNUAL REPORT], available at http://www.uscourts.gov/FederalCourts /UnderstandingtheFederalCourts/AdministrativeOffice/DirectorAnnualReport/Viewer.aspx?doc=/uscourts/FederalCourts/AnnualReport/2009/directors-message.shtml; ADMIN. OFFICE OF THE U.S. COURTS, JUDICIAL BUSINESS OF THE UNITED STATES COURTS: 2010 ANNUAL REPORT OF THE
DIRECTOR 21 (2011) [hereinafter 2010 ANNUAL REPORT], available at http://www.uscourts.gov/ FederalCourts/UnderstandingtheFederalCourts/AdministrativeOffice/DirectorAnnualReport/Annual Report_2010.aspx. 79. BUREAU OF JUSTICE STATISTICS, CIVIL RIGHTS COMPLAINTS IN U.S. DISTRICT COURTS, 1990–2006 7 (2008), available at http://www.bjs.gov/index.cfm?ty=pbdetail&iid=556.
MOORE.DOCX (DO NOT DELETE) 5/22/2015 9:51 AM
No. 3] CIVIL CASELOAD 1203
number of bench trials submitted for more than 6 months has decreased 146% since 1991.80
2. Average Disposition Time
The median, of course, is not the same as the arithmetic mean. The Federal Judicial Center (“FJC”) has explained that the “ratio of pending cases to annual case terminations is a good estimate of the true average duration (or life expectancy) of a court’s cases (the ratio gives average case duration in years; if multiplied by twelve the result is average case duration in months).”81 According to the FJC, the ratio of pending to terminated cases is a better estimate of the average lifespan of a civil case than the median disposition time82 because terminated cases (from which the median disposition time is calculated) may not be representative of the court’s current caseload:
The reason can be seen by considering the analogy to human popu-lations. In human populations as well as court caseloads, the life ex-pectancy of newborns or of newly filed cases is not necessarily the same as the average age at death of persons who died last year or of cases disposed of last year. There is a connection, but it is diffused, sometimes greatly, by the passage of time between birth and death or filing and disposition.83
Using this analysis, the ratio of pending to terminated cases was 0.91 in 1986, suggesting an estimated average case duration of about eleven months (0.91 x 12).84 In 2013, the ratio was 1.18, suggesting an estimated average case duration of about fourteen months (1.18 x 12).85 It should be noted that the ratio had dropped to 0.88 in 2011, which was below the 1986 level.86 It is possible that the federal courts’ “limited resources”87 due to budget cuts, as well as unfilled judicial vacancies, contributed to the rise in civil case duration since 2011.
80. The number of motions pending more than six months fell from 13,083 in September 1991 to 5511 in March 2013, and the number of bench trials submitted more than six months fell from 221 in 1991 to 70 in 2013. ADMIN. OFFICE OF THE U.S. COURTS, CIVIL JUSTICE REFORM ACT OF 1990: REPORT OF MOTIONS PENDING MORE THAN SIX MONTHS, BENCH TRIALS SUBMITTED MORE THAN
SIX MONTHS, BANKRUPTCY APPEALS PENDING MORE THAN SIX MONTHS, SOCIAL SECURITY APPEAL
CASES PENDING MORE THAN SIX MONTHS, AND CIVIL CASES PENDING MORE THAN THREE YEARS
ON MARCH 31, 2013 at 3 (2013) [hereinafter 2013 REPORT OF MOTIONS], available at http://www. uscourts.gov/uscourts/statistics/cjra/2013-03/CJRAMarch2013.pdf; ADMIN. OFFICE OF THE U.S. COURTS, CIVIL JUSTICE REFORM ACT OF 1990: REPORT OF MOTIONS PENDING MORE THAN SIX
MONTHS, BENCH TRIALS SUBMITTED MORE THAN SIX MONTHS, AND CIVIL CASES PENDING MORE
THAN THREE YEARS ON MARCH 31, 1995 at 2 (1995). 81. SHAPARD, supra note 17, at 3. 82. Id. at 1–3. 83. Id. at 1. 84. 1986 ANNUAL REPORT, supra note 23, at 8 tbl.4. 85. 2013 ANNUAL REPORT, supra note 52, at tbl.C-8, available at http://www.uscourts.gov/ uscourts/Statistics/JudicialBusiness/2013/appendices/C08Sep13.pdf. 86. Id. See supra note 84 and accompanying text. 87. ROBERTS, supra note 18, at 10.

MOORE.DOCX (DO NOT DELETE) 5/22/2015 9:51 AM
1204 UNIVERSITY OF ILLINOIS LAW REVIEW [Vol. 2015
III. CHANGES IN THE PROPORTION OF CIVIL CASES TERMINATING AT
DIFFERENT POINTS IN THE PROCEEDING
Part II.C.2 examined the median case disposition times for civil cas-es overall and at the various disposition endpoints used by the AO (no court action, before pretrial with court action, during or after pretrial, or at trial). At which of these points do most federal civil cases terminate? As Galanter noted in 2005:
[F]rom the mid-1980s, there was a dramatic fall in the portion [of cases] terminating with “no court action” and a corresponding rise in cases terminating “before pretrial.” Federal courts that formerly focused their attention on those cases that approached or reached trial now spend considerable effort on cases that terminate at early procedural stages.88
This trend has continued to the present. Figure 8 illustrates the changing percentages of civil cases terminating at each of these four pro-cedural stages.
88. Marc Galanter, The Hundred-Year Decline of Trials and the Thirty Years War, 57 STAN. L. REV. 1255, 1265 (2005); see also Galanter, supra note 46, at 482; Hadfield, supra note 69, at 708 (“If the decrease in trials is fully taken up by increases in nontrial adjudication, increased case manage-ment and heightened standards for surviving motions to dismiss or for summary judgment may in fact be increasing judicial workloads and litigation costs, as cases that in the prior regime would have set-tled out of court are now resolved through judicial effort.” (emphasis in original)).
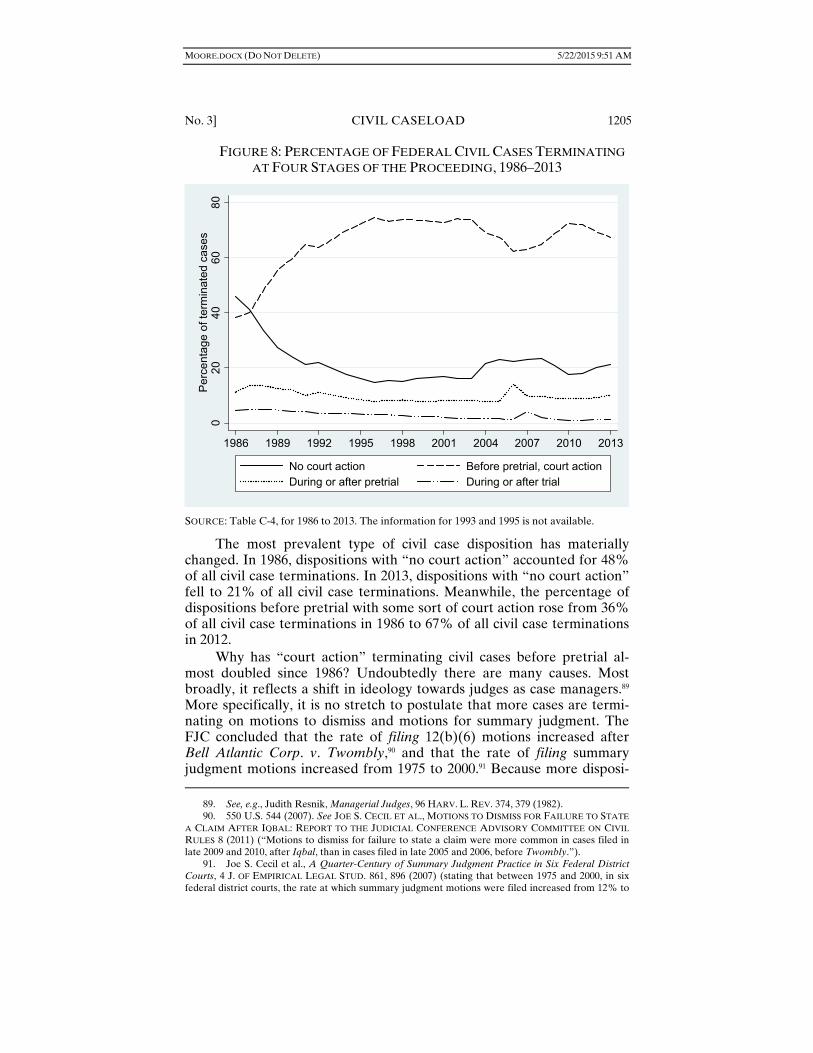
MOORE.DOCX (DO NOT DELETE) 5/22/2015 9:51 AM
No. 3] CIVIL CASELOAD 1205
FIGURE 8: PERCENTAGE OF FEDERAL CIVIL CASES TERMINATING AT FOUR STAGES OF THE PROCEEDING, 1986–2013
SOURCE: Table C-4, for 1986 to 2013. The information for 1993 and 1995 is not available.
The most prevalent type of civil case disposition has materially changed. In 1986, dispositions with “no court action” accounted for 48% of all civil case terminations. In 2013, dispositions with “no court action” fell to 21% of all civil case terminations. Meanwhile, the percentage of dispositions before pretrial with some sort of court action rose from 36% of all civil case terminations in 1986 to 67% of all civil case terminations in 2012.
Why has “court action” terminating civil cases before pretrial al-most doubled since 1986? Undoubtedly there are many causes. Most broadly, it reflects a shift in ideology towards judges as case managers.89 More specifically, it is no stretch to postulate that more cases are termi-nating on motions to dismiss and motions for summary judgment. The FJC concluded that the rate of filing 12(b)(6) motions increased after Bell Atlantic Corp. v. Twombly,90 and that the rate of filing summary judgment motions increased from 1975 to 2000.91 Because more disposi- 89. See, e.g., Judith Resnik, Managerial Judges, 96 HARV. L. REV. 374, 379 (1982). 90. 550 U.S. 544 (2007). See JOE S. CECIL ET AL., MOTIONS TO DISMISS FOR FAILURE TO STATE
A CLAIM AFTER IQBAL: REPORT TO THE JUDICIAL CONFERENCE ADVISORY COMMITTEE ON CIVIL
RULES 8 (2011) (“Motions to dismiss for failure to state a claim were more common in cases filed in late 2009 and 2010, after Iqbal, than in cases filed in late 2005 and 2006, before Twombly.”). 91. Joe S. Cecil et al., A Quarter-Century of Summary Judgment Practice in Six Federal District Courts, 4 J. OF EMPIRICAL LEGAL STUD. 861, 896 (2007) (stating that between 1975 and 2000, in six federal district courts, the rate at which summary judgment motions were filed increased from 12% to
020
4060
80P
erce
ntag
e of
term
inat
ed c
ases
1986 1989 1992 1995 1998 2001 2004 2007 2010 2013
No court action Before pretrial, court actionDuring or after pretrial During or after trial

MOORE.DOCX (DO NOT DELETE) 5/22/2015 9:51 AM
1206 UNIVERSITY OF ILLINOIS LAW REVIEW [Vol. 2015
tive motions are being filed, then even if the rate of granting such mo-tions has stayed constant, the math is inescapable that more cases are falling victim to a dispositive motion.92 For example, suppose 1000 civil cases were filed in 2005, that 12(b)(6) motions were filed in 4% of all cases, and that such motions were granted 50% of the time. Twenty cases would be dismissed in 2005. Now suppose 1000 civil cases were filed in 2010, that 12(b)(6) motions were filed in 6% of all cases, and that such motions were still granted 50% of the time. Thirty cases would be dis-missed in 2010, 50% more cases than in 2005.
Moreover, studies have suggested that the rates of granting (not just filing) summary judgment motions 93 and 12(b)(6) motions have also in-creased.94 Other studies have also shown a rise in the pretrial adjudica-tion rate that has worked to defendants’ advantage.95
Finally, in the wake of controversy over Twombly and Iqbal, the AO published figures on a quarterly basis from the first quarter of 2007 to the third quarter of 2010 with regard to the number of motions to dis-miss under Rule 12(b) filed, granted, and denied.96 From May 2007, when Twombly was decided, to September 2010, when the AO stopped pub-lishing data on this subject, the rate of motions to dismiss granted as a percentage of the total number of cases filed trended upward from ap-proximately 12% to over 14%.97 The AO’s raw data showed that 309,366 motions to dismiss were filed in this period, and 116,041 motions to dis-
21%, and the rate at which cases were terminated by summary judgment increased from 4% to 8%). The 1986 Supreme Court trilogy of Celotex Corp. v. Catrett, 477 U.S. 317 (1986), Anderson v. Liberty Lobby, 477 U.S. 242 (1986), and Matsushita Electric Indus. Co. v. Zenith Radio Corp., 475 U.S. 574 (1986), likely encouraged a greater use of summary judgment, but it has been suggested that the trend had begun well before the trilogy. E.g., Miller, supra note 2, at 984. 92. See Kevin M. Clermont & Theodore Eisenberg, Plaintiphobia in the Supreme Court 4–5 (Cornell L. Sch. Legal Stud. Research Paper Series, No. 13-94, 2013), available at http://ssrn. com/abstract=2347360. 93. See Stephen Burbank, Vanishing Trials and Summary Judgment in Federal Civil Cases: Drift-ing Toward Bethlehem or Gomorrah?, 1 J. EMPIRICAL LEGAL STUD. 591, 612 (2004). 94. E.g., Patricia Hatamyar Moore, An Updated Quantitative Study of Iqbal’s Impact on 12(b)(6) Motions, 46 U. RICHMOND L. REV. 603, 613 (2012) (finding that in a random sample of 1326 cases on Westlaw, the percentage of 12(b)(6) motions that were granted, with or without leave to amend, in-creased from 46% pre-Twombly to 61% post-Iqbal); see also e.g., Raymond H. Brescia, The Iqbal Ef-fect: The Impact of New Pleading Standards in Employment and Housing Discrimination Litigation, 100 KY. L.J. 235, 240 (2011–2012); Joseph A. Seiner, The Trouble with Twombly: A Proposed Pleading Standard for Employment Discrimination Cases, 2009 U. ILL. L. REV. 1011, 1029–30. But see, e.g., David Freeman Engstrom, The Twiqbal Puzzle and Empirical Study of Civil Procedure, 65 STAN. L. REV. 1203 (2013); William H. J. Hubbard, Testing for Change in Procedural Standards, With Applica-tion to Bell Atlantic v. Twombly, 42 J. LEGAL STUD. 35 (2013). 95. Clermont & Eisenberg, supra note 92, at 5; Hadfield, supra note 69, at 733. 96. ADMIN. OFFICE OF THE U.S. COURTS, MOTIONS TO DISMISS: INFORMATION ON COLLECTION
OF DATA (2010) [hereinafter MOTIONS TO DISMISS: INFORMATION], available at http://www.uscourts. gov/uscourts/RulesAndPolicies/rules/Motions%20to%20Dismiss%20Statistics%20-%20October%202 010.pdf. The AO later posted a note that because the FJC has published its study, see CECIL ET AL., supra note 90, the AO is no longer studying this issue. ADMIN. OFFICE OF THE U.S. COURTS, NOTICE
ON MOTION TO DISMISS DATA PROVIDED BY THE ADMINISTRATIVE OFFICE, available at http://www. uscourts.gov/uscourts/RulesAndPolicies/rules/Notice_Regarding_Collection_of_Motion_to_Dismiss_Data.pdf. 97. See MOTIONS TO DISMISS: INFORMATION, supra note 96 (chart entitled “Rate of Motions to Dismiss Granted as Percentage of Total Cases Filed”).

MOORE.DOCX (DO NOT DELETE) 5/22/2015 9:51 AM
No. 3] CIVIL CASELOAD 1207
miss were granted in this period. Although the manner in which the data was compiled does not match the motions filed to the motions granted,98 these data indicate generally that a substantial percentage of 12(b) mo-tions are granted, and that the trend line was upward.
On a related point, the preparation and determination of dispositive motions are time-intensive activities. In particular, the preparation of a summary judgment motion, or a response in opposition, are likely to take far more attorney time than drafting or responding to a typical discovery request.99 The AO recognizes the substantial expenditure of judicial time on dispositive motions by weighting cases that are likely to have disposi-tive motions more heavily than cases that are not. For example, the FJC describes how it calculated the weight for patent cases:
[T]wo events contribute heavily to the high case weight calculated for this case type. The time associated with preparing orders on substantive motions, averaged across all Patent cases, is estimated to consume more than 900 minutes (15 hours), and orders on mo-tions for summary judgment consume more than 500 minutes (8.3 hours). These event categories stand out both because the time es-timate is substantial and because there is a relatively high likelihood that a newly filed patent case will include a ruling on one of these types of motions.100
The Advisory Committee has blamed pretrial discovery for the sup-posed “cost and delay” of civil litigation for the past several decades.101 Assuming that there is, in fact, some unacceptable level of delay, a far more likely culprit is a rise in dispositive motions.
Moreover, the long-term switch to a mode of termination by a judge before pretrial raises the specter of caseload management driving sub-stantive decisions on dispositive motions. As an ABA representative re-cently testified, “[w]e caution that utilization of more and more methods to dispose of cases as quickly as possible runs the grave risk of adversely affecting the quality of justice delivered by our federal courts.”102
98. See Moore, supra note 94, at 630. 99. Cf. LOMBARD & KRAFKA, supra note 32, at 57. 100. Id. 101. See Reda, supra note 10, at 1087. 102. S.1385 Hearings, supra note 8 (statement of Michael Reed).

MOORE.DOCX (DO NOT DELETE) 5/22/2015 9:51 AM
1208 UNIVERSITY OF ILLINOIS LAW REVIEW [Vol. 2015
IV. THE TYPES OF CIVIL CASES FILED: WHERE ARE THE “BIG SIX”
TODAY?
Before turning to the shifting proportions of case types over time, I must again provide caveats about the AO data.103 The case types that I discuss below are those reported by the AO for the “Nature of Suit.” The “Nature of Suit” for a case derives from a single box on the Civil Cover Sheet that is checked by the person filing the lawsuit.104 The major cate-gories listed on the federal district court Civil Cover Sheet are Contract, Real Property, Torts, Civil Rights, Prisoner Petitions, Forfeiture/Penalty, Labor, Immigration, Bankruptcy, Property Rights (which means intellec-tual property rights), Social Security, Federal Tax Suits, and Other Stat-utes. Most of these major categories have many subcategories.
Clearly, there are numerous opportunities for inaccuracy here. First, it is unclear who decides what box to check or whether there is any quali-ty control of that decision.105 The titles of many of the subcategories are less than self-explanatory,106 and the categorization of some of the sub-categories appears arbitrary and overlapping.107 Second, most federal cases include more than one claim for relief, so any claims for relief other than the one checked are not included in the computerized databases. For example, if the plaintiff in a lawsuit that contained claims for copy- 103. As Schlanger explains: “Staff in the court clerks’ offices fill in a computerized query screen for each case upon filing, and again on termination. Case coding is done by a court clerk, following guidelines offered by the AO.” Schlanger, supra note 26, at 1699. Although Schlanger “generally found the AO's data very accurate,” she noted some coding problems in the “Nature of Suit” catego-ries that she was studying, for prisoner litigation. Id. at 1699–1700. See also Theodore Eisenberg & Margo Schlanger, The Reliability of the Administrative Office of the U.S. Courts Database: An Initial Empirical Analysis, 78 NOTRE DAME L. REV. 1455, 1460 (2003) (“[T]he AO data are very accurate when they report a judgment for plaintiff or defendant, except in cases in which judgment is reported for plaintiff but damages are reported as zero.”); Hadfield, supra note 69, at 726 tbl.5 (finding that of cases coded with the disposition “Judgment on Motion Before Trial,” approximately 28% were actual-ly settled, not decided on motion, and another approximately 28% were nonfinal dispositions); Teresa A. Sullivan et al., The Use of Empirical Data in Formulating Bankruptcy Policy, 50 L. & CONTEMP. PROBS. 195, 222–24 (1987) (questioning the accuracy of the AO's bankruptcy data). 104. See Civil Cover Sheet Form, supra note 30 (directions for Section IV, Nature of Suit, are to “Place an ‘X’ in One Box Only”). 105. Id. (“If the nature of suit cannot be determined, be sure the cause of action, in Section VI below, is sufficient to enable the deputy clerk or the statistical clerk(s) in the Administrative Office to determine the nature of suit. If the cause fits more than one nature of suit, select the most definitive.”). Section VI instructs: “Cause of Action. Report the civil statute directly related to the cause of action and give a brief description of the cause. DO NOT CITE JURISDICTIONAL STATUTES UNLESS DIVERSITY. Example: U.S. Civil Statute: 47 USC 553[;] Brief Description: Unauthorized reception of cable ser-vice.” Id. (emphasis in original). 106. For example, Torts—Personal Injury includes separate subcategories (each with a separate box) for Airplane, Airplane Product Liability, Marine, Marine Product Liability, Motor Vehicle, Mo-tor Vehicle Product Liability, Personal Injury—Product Liability, Health Care/Pharmaceutical Per-sonal Injury Product Liability, Asbestos Personal Injury Product Liability, and four others. Id. Rea-sonable lawyers, let alone clerks, paralegals, and pro se litigants, might have difficulty choosing one of these. In 2012, approximately 94% of prisoner petitions and approximately 12% of nonprisoner com-plaints were filed pro se. 2012 ANNUAL REPORT, supra note 18, at tbl.C-13. 107. For example, “Truth in Lending” is a subcategory of Torts-Personal Property, while “Con-sumer Credit” is a subcategory of “Other Statutes.” See Civil Cover Sheet, supra note 30. The category for Real Property contains a subcategory called “Tort Product Liability.” Id. There is a subcategory for “Other Fraud,” but there is no subcategory just for “Fraud.” Id.
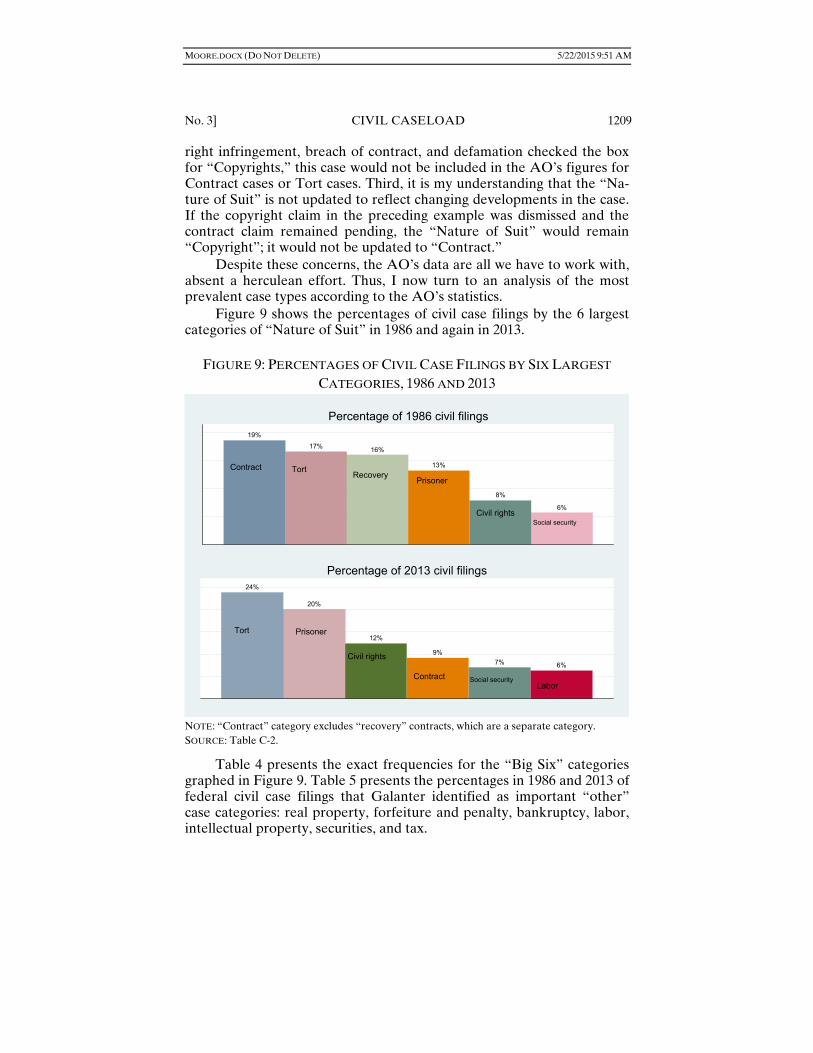
MOORE.DOCX (DO NOT DELETE) 5/22/2015 9:51 AM
No. 3] CIVIL CASELOAD 1209
right infringement, breach of contract, and defamation checked the box for “Copyrights,” this case would not be included in the AO’s figures for Contract cases or Tort cases. Third, it is my understanding that the “Na-ture of Suit” is not updated to reflect changing developments in the case. If the copyright claim in the preceding example was dismissed and the contract claim remained pending, the “Nature of Suit” would remain “Copyright”; it would not be updated to “Contract.”
Despite these concerns, the AO’s data are all we have to work with, absent a herculean effort. Thus, I now turn to an analysis of the most prevalent case types according to the AO’s statistics.
Figure 9 shows the percentages of civil case filings by the 6 largest categories of “Nature of Suit” in 1986 and again in 2013.
FIGURE 9: PERCENTAGES OF CIVIL CASE FILINGS BY SIX LARGEST
CATEGORIES, 1986 AND 2013
NOTE: “Contract” category excludes “recovery” contracts, which are a separate category. SOURCE: Table C-2.
Table 4 presents the exact frequencies for the “Big Six” categories graphed in Figure 9. Table 5 presents the percentages in 1986 and 2013 of federal civil case filings that Galanter identified as important “other” case categories: real property, forfeiture and penalty, bankruptcy, labor, intellectual property, securities, and tax.
19%
17% 16%
13%
8%
6%
Contract TortRecovery
Prisoner
Civil rightsSocial security
Percentage of 1986 civil filings
24%
20%
12%
9%
7% 6%
Tort Prisoner
Civil rights
Contract Social securityLabor
Percentage of 2013 civil filings
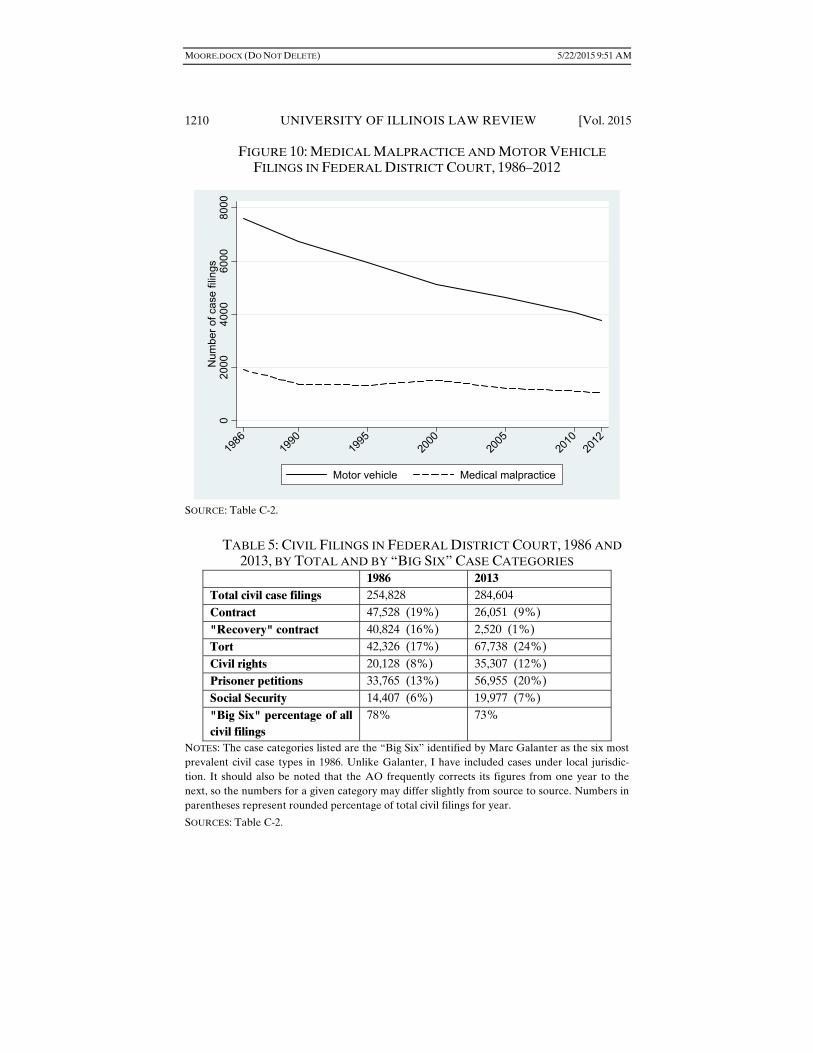
MOORE.DOCX (DO NOT DELETE) 5/22/2015 9:51 AM
1210 UNIVERSITY OF ILLINOIS LAW REVIEW [Vol. 2015
FIGURE 10: MEDICAL MALPRACTICE AND MOTOR VEHICLE FILINGS IN FEDERAL DISTRICT COURT, 1986–2012
SOURCE: Table C-2.
TABLE 5: CIVIL FILINGS IN FEDERAL DISTRICT COURT, 1986 AND
2013, BY TOTAL AND BY “BIG SIX” CASE CATEGORIES 1986 2013 Total civil case filings 254,828 284,604 Contract 47,528 (19%) 26,051 (9%) "Recovery" contract 40,824 (16%) 2,520 (1%) Tort 42,326 (17%) 67,738 (24%) Civil rights 20,128 (8%) 35,307 (12%) Prisoner petitions 33,765 (13%) 56,955 (20%) Social Security 14,407 (6%) 19,977 (7%) "Big Six" percentage of all civil filings
78% 73%
NOTES: The case categories listed are the “Big Six” identified by Marc Galanter as the six most prevalent civil case types in 1986. Unlike Galanter, I have included cases under local jurisdic-tion. It should also be noted that the AO frequently corrects its figures from one year to the next, so the numbers for a given category may differ slightly from source to source. Numbers in parentheses represent rounded percentage of total civil filings for year.
SOURCES: Table C-2.
020
0040
0060
0080
00N
umbe
r of
cas
e fil
ings
1986
2012
1990
1995
2000
2005
2010
Motor vehicle Medical malpractice

MOORE.DOCX (DO NOT DELETE) 5/22/2015 9:51 AM
No. 3] CIVIL CASELOAD 1211
TABLE 6: CIVIL FILINGS IN FEDERAL DISTRICT COURT, 1986 AND 2013, BY SELECTED CASE TYPES
1986 2013
Real property 10,674 (4%) 10,762 (4%)
Forfeiture and penalty 3,480 (1%) 2,144 (1%)
Bankruptcy 4,561 (2%) 2,633 (1%)
Labor 12,839 (5%) 18,043 (6%)
Intellectual property 5,681 (2%) 13,335 (5%)
Securities 3,059 (1%) 1,113 (0%)
Tax 2,750 (1%) 1,113 (0%)
Percentage of all civil filings for these categories
17% 17%
NOTES: The case categories listed are the “Other” prevalent case types identified by Marc Ga-lanter in 1986. “Bankruptcy” cases do not include cases originally filed in bankruptcy court.
SOURCES: Table C-2.
There are several broad trends readily observable in Tables 5 and 6. First, contract cases, although still deserving “Big Six” status, have steep-ly declined as a percentage of civil filings since 1986. Second, “recovery” cases have dwindled from their “Big Six” status in 1986 to a miniscule percentage of federal filings in 2013. Third, the number and proportion of labor cases have increased since 1986, and labor cases replace “recov-ery” cases in the “Big Six” in 2013. Fourth, civil rights cases and prisoner petitions have increased since 1986, both in absolute numbers and as a percentage of civil filings. Fifth, intellectual property cases have in-creased considerably since 1986 (from 2% in 1985 to 5% in 2013), but not enough to catapult them into the “Big Six.” Finally, forfeiture and penal-ty cases, bankruptcy cases, securities cases, and tax cases have all de-creased in absolute and relative terms since 1986. These trends will be discussed in greater detail in remaining parts of this Article.
A. The Evolution of Tort Litigation
Torts constituted the second largest case type in 1986 (42,326 cases filed, or 17% of all federal civil filings), and grew to 24% of all federal civil filings (67,738 cases filed) in 2013, making tort cases the largest cate-gory of civil cases. But there has been a radical transformation of the na-ture of federal tort cases. Back in 1960, tort cases most commonly arose
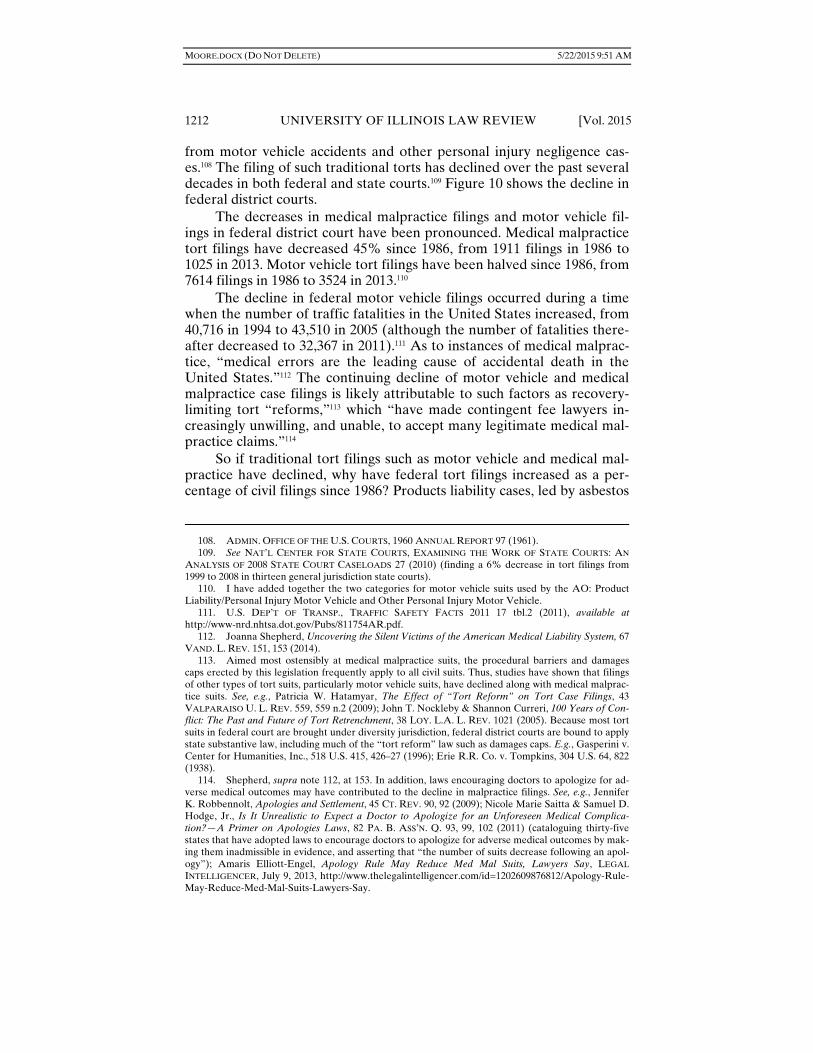
MOORE.DOCX (DO NOT DELETE) 5/22/2015 9:51 AM
1212 UNIVERSITY OF ILLINOIS LAW REVIEW [Vol. 2015
from motor vehicle accidents and other personal injury negligence cas-es.108 The filing of such traditional torts has declined over the past several decades in both federal and state courts.109 Figure 10 shows the decline in federal district courts.
The decreases in medical malpractice filings and motor vehicle fil-ings in federal district court have been pronounced. Medical malpractice tort filings have decreased 45% since 1986, from 1911 filings in 1986 to 1025 in 2013. Motor vehicle tort filings have been halved since 1986, from 7614 filings in 1986 to 3524 in 2013.110
The decline in federal motor vehicle filings occurred during a time when the number of traffic fatalities in the United States increased, from 40,716 in 1994 to 43,510 in 2005 (although the number of fatalities there-after decreased to 32,367 in 2011).111 As to instances of medical malprac-tice, “medical errors are the leading cause of accidental death in the United States.”112 The continuing decline of motor vehicle and medical malpractice case filings is likely attributable to such factors as recovery-limiting tort “reforms,”113 which “have made contingent fee lawyers in-creasingly unwilling, and unable, to accept many legitimate medical mal-practice claims.”114
So if traditional tort filings such as motor vehicle and medical mal-practice have declined, why have federal tort filings increased as a per-centage of civil filings since 1986? Products liability cases, led by asbestos
108. ADMIN. OFFICE OF THE U.S. COURTS, 1960 ANNUAL REPORT 97 (1961). 109. See NAT’L CENTER FOR STATE COURTS, EXAMINING THE WORK OF STATE COURTS: AN
ANALYSIS OF 2008 STATE COURT CASELOADS 27 (2010) (finding a 6% decrease in tort filings from 1999 to 2008 in thirteen general jurisdiction state courts). 110. I have added together the two categories for motor vehicle suits used by the AO: Product Liability/Personal Injury Motor Vehicle and Other Personal Injury Motor Vehicle. 111. U.S. DEP’T OF TRANSP., TRAFFIC SAFETY FACTS 2011 17 tbl.2 (2011), available at http://www-nrd.nhtsa.dot.gov/Pubs/811754AR.pdf. 112. Joanna Shepherd, Uncovering the Silent Victims of the American Medical Liability System, 67 VAND. L. REV. 151, 153 (2014). 113. Aimed most ostensibly at medical malpractice suits, the procedural barriers and damages caps erected by this legislation frequently apply to all civil suits. Thus, studies have shown that filings of other types of tort suits, particularly motor vehicle suits, have declined along with medical malprac-tice suits. See, e.g., Patricia W. Hatamyar, The Effect of “Tort Reform” on Tort Case Filings, 43 VALPARAISO U. L. REV. 559, 559 n.2 (2009); John T. Nockleby & Shannon Curreri, 100 Years of Con-flict: The Past and Future of Tort Retrenchment, 38 LOY. L.A. L. REV. 1021 (2005). Because most tort suits in federal court are brought under diversity jurisdiction, federal district courts are bound to apply state substantive law, including much of the “tort reform” law such as damages caps. E.g., Gasperini v. Center for Humanities, Inc., 518 U.S. 415, 426–27 (1996); Erie R.R. Co. v. Tompkins, 304 U.S. 64, 822 (1938). 114. Shepherd, supra note 112, at 153. In addition, laws encouraging doctors to apologize for ad-verse medical outcomes may have contributed to the decline in malpractice filings. See, e.g., Jennifer K. Robbennolt, Apologies and Settlement, 45 CT. REV. 90, 92 (2009); Nicole Marie Saitta & Samuel D. Hodge, Jr., Is It Unrealistic to Expect a Doctor to Apologize for an Unforeseen Medical Complica-tion?—A Primer on Apologies Laws, 82 PA. B. ASS’N. Q. 93, 99, 102 (2011) (cataloguing thirty-five states that have adopted laws to encourage doctors to apologize for adverse medical outcomes by mak-ing them inadmissible in evidence, and asserting that “the number of suits decrease following an apol-ogy”); Amaris Elliott-Engel, Apology Rule May Reduce Med Mal Suits, Lawyers Say, LEGAL
INTELLIGENCER, July 9, 2013, http://www.thelegalintelligencer.com/id=1202609876812/Apology-Rule-May-Reduce-Med-Mal-Suits-Lawyers-Say.

MOORE.DOCX (DO NOT DELETE) 5/22/2015 9:51 AM
No. 3] CIVIL CASELOAD 1213
cases,115 have caused the overall increase in tort filings since 1986. Per-sonal injury products liability suits grew from 29% of all federal tort fil-ings in 1986 to 70% of all federal tort filings in 2012. But products liabil-ity cases tend to be coordinated in MDL proceedings and brought against more concentrated defendants.116
In 1988, 41% of all asbestos cases were filed in federal court,117 and huge numbers of asbestos cases continue to be filed in federal district court every year.118 Large swings in the number of asbestos case filings in any given year affect the overall civil filing rate.119 In addition to asbestos, well-known conglomerations of tort cases in MDL proceedings include cases concerning breast implants,120 Baycol,121 hormone replacement drugs,122 diet drugs,123 Seroquel,124 the September 11, 2001 terrorist at-tack,125 Vioxx,126 Chinese drywall,127 Deepwater Horizon oil drilling rig,128 contraceptives,129 joint implants,130 and pelvic repair.131
115. See STEPHEN J. CARROLL ET AL., RAND INST. FOR CIVIL JUSTICE, ASBESTOS LITIGATION 1
(2005). See also, e.g., 1997 ANNUAL REPORT, supra note 44, at 25; 1998 ANNUAL REPORT, supra note 19, at 33; ADMIN. OFFICE OF THE U.S. COURTS, JUDICIAL BUSINESS 32 (2000) [hereinafter 1999
ANNUAL REPORT], available at http://www.uscourts.gov/uscourts/Statistics/JudicialBusiness/1999/ front/1999JudicialBusiness.pdf; ADMIN. OFFICE OF THE U.S. COURTS, JUDICIAL BUSINESS 27 (2001) [hereinafter 2001 ANNUAL REPORT], available at http://www.uscourts.gov/uscourts/Statistics/Judicial Business/2001/front/2001artext.pdf; 2002 ANNUAL REPORT, supra note 58, at 26; ADMIN. OFFICE OF
THE U.S. COURTS, JUDICIAL BUSINESS OF THE UNITED STATES COURTS: 2003 ANNUAL REPORT OF
THE DIRECTOR 23 (2004) [hereinafter 2003 ANNUAL REPORT], available at http://www.uscourts.gov/ uscourts/Statistics/JudicialBusiness/2003/front/jdbusiness.pdf. 116. E.g., 1990 ANNUAL REPORT, supra note 16, at 8; CARROLL ET AL., supra note 115, at xxii, 83–85. 117. See CARROLL ET AL., supra note 115, at 61. After the MDL consolidation of federal asbestos cases in the Eastern District of Pennsylvania in 1991, however, plaintiffs’ attorneys began turning more to state courts. Id. 118. See, e.g., 2002 ANNUAL REPORT, supra note 58, at 17 (noting that of 29,636 personal injury cases filed in 2002, more than 80% were asbestos cases). 119. See, e.g., 2006 ANNUAL REPORT, supra note 44, at 14. 120. See, e.g., 1997 ANNUAL REPORT, supra note 44, at 17; 1999 ANNUAL REPORT, supra note 115, at 24–25. 121. See, e.g., 2002 ANNUAL REPORT, supra note 58, at 19. 122. See ADMIN. OFFICE OF THE U.S. COURTS, JUDICIAL BUSINESS OF THE UNITED STATES
COURTS: 2008 ANNUAL REPORT OF THE DIRECTOR 25 (2009) [hereinafter 2008 ANNUAL REPORT], available at http://www.uscourts.gov/Statistics/JudicialBusiness/JudicialBusiness2008.aspx. 123. See, e.g., id. at 16–17; ALICIA MUNDY, DISPENSING WITH THE TRUTH: THE VICTIMS, THE
DRUG COMPANIES, AND THE DRAMATIC STORY BEHIND THE BATTLE OVER FEN-PHEN 28–32 (2001). 124. See, e.g., 2007 ANNUAL REPORT, supra note 77, at 23–24. 125. See id. These cases were not filed immediately after the 2001 attack because of the passage of the Airline Safety and System Stabilization Act, “which created the September 11th Victim Compen-sation Fund (VCF), a fund intended to divert victims’ families out of the legal system and into an ad-ministrative regime for compensation.” Hadfield, supra note 75, at 1291. 126. ADMIN. OFFICE OF THE U.S. COURTS, JUDICIAL BUSINESS OF THE UNITED STATES COURTS: 2005 ANNUAL REPORT OF THE DIRECTOR 26 [hereinafter 2005 ANNUAL REPORT], available at http://www.uscourts.gov/Statistics/JudicialBusiness/JudicialBusiness2005.aspx; 2007 ANNUAL REPORT, supra note 77, at 31. 127. 2009 ANNUAL REPORT, supra note 78, at 19. 128. 2010 ANNUAL REPORT, supra note 78, at 29. 129. Id. 130. 2012 ANNUAL REPORT, supra note 18. 131. Id.
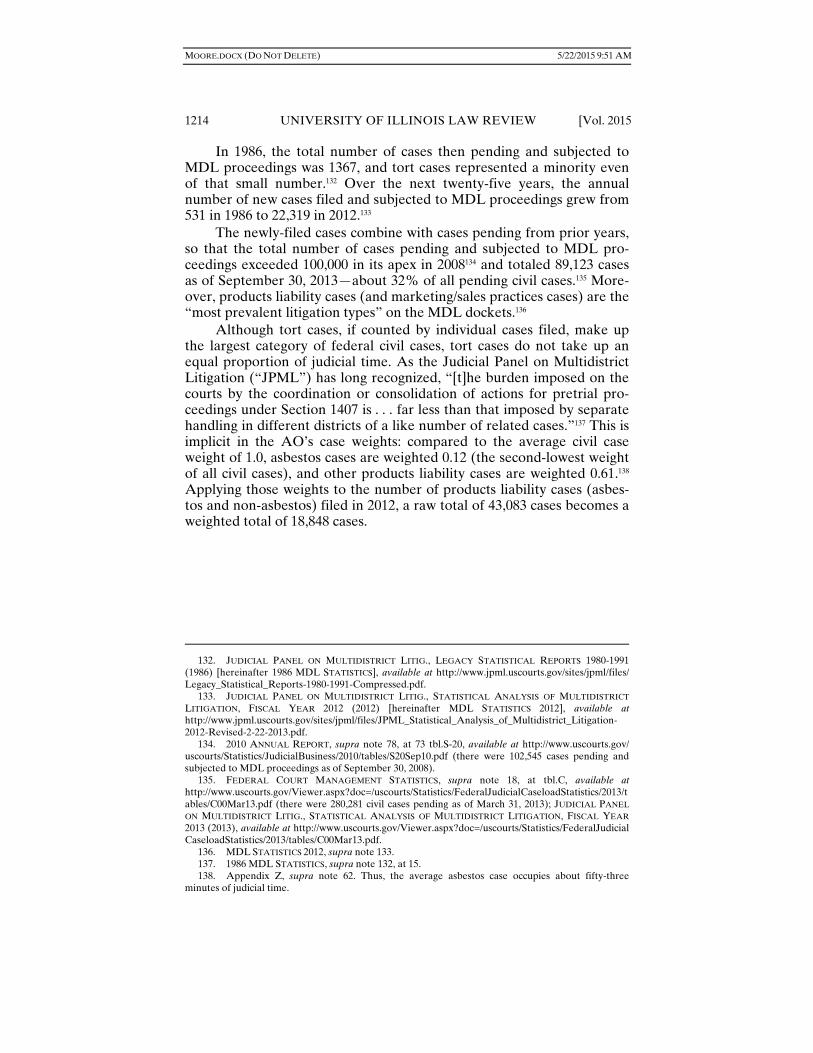
MOORE.DOCX (DO NOT DELETE) 5/22/2015 9:51 AM
1214 UNIVERSITY OF ILLINOIS LAW REVIEW [Vol. 2015
In 1986, the total number of cases then pending and subjected to MDL proceedings was 1367, and tort cases represented a minority even of that small number.132 Over the next twenty-five years, the annual number of new cases filed and subjected to MDL proceedings grew from 531 in 1986 to 22,319 in 2012.133
The newly-filed cases combine with cases pending from prior years, so that the total number of cases pending and subjected to MDL pro-ceedings exceeded 100,000 in its apex in 2008134 and totaled 89,123 cases as of September 30, 2013—about 32% of all pending civil cases.135 More-over, products liability cases (and marketing/sales practices cases) are the “most prevalent litigation types” on the MDL dockets.136
Although tort cases, if counted by individual cases filed, make up the largest category of federal civil cases, tort cases do not take up an equal proportion of judicial time. As the Judicial Panel on Multidistrict Litigation (“JPML”) has long recognized, “[t]he burden imposed on the courts by the coordination or consolidation of actions for pretrial pro-ceedings under Section 1407 is . . . far less than that imposed by separate handling in different districts of a like number of related cases.”137 This is implicit in the AO’s case weights: compared to the average civil case weight of 1.0, asbestos cases are weighted 0.12 (the second-lowest weight of all civil cases), and other products liability cases are weighted 0.61.138 Applying those weights to the number of products liability cases (asbes-tos and non-asbestos) filed in 2012, a raw total of 43,083 cases becomes a weighted total of 18,848 cases.
132. JUDICIAL PANEL ON MULTIDISTRICT LITIG., LEGACY STATISTICAL REPORTS 1980-1991
(1986) [hereinafter 1986 MDL STATISTICS], available at http://www.jpml.uscourts.gov/sites/jpml/files/ Legacy_Statistical_Reports-1980-1991-Compressed.pdf. 133. JUDICIAL PANEL ON MULTIDISTRICT LITIG., STATISTICAL ANALYSIS OF MULTIDISTRICT
LITIGATION, FISCAL YEAR 2012 (2012) [hereinafter MDL STATISTICS 2012], available at http://www.jpml.uscourts.gov/sites/jpml/files/JPML_Statistical_Analysis_of_Multidistrict_Litigation-2012-Revised-2-22-2013.pdf. 134. 2010 ANNUAL REPORT, supra note 78, at 73 tbl.S-20, available at http://www.uscourts.gov/ uscourts/Statistics/JudicialBusiness/2010/tables/S20Sep10.pdf (there were 102,545 cases pending and subjected to MDL proceedings as of September 30, 2008). 135. FEDERAL COURT MANAGEMENT STATISTICS, supra note 18, at tbl.C, available at http://www.uscourts.gov/Viewer.aspx?doc=/uscourts/Statistics/FederalJudicialCaseloadStatistics/2013/tables/C00Mar13.pdf (there were 280,281 civil cases pending as of March 31, 2013); JUDICIAL PANEL
ON MULTIDISTRICT LITIG., STATISTICAL ANALYSIS OF MULTIDISTRICT LITIGATION, FISCAL YEAR
2013 (2013), available at http://www.uscourts.gov/Viewer.aspx?doc=/uscourts/Statistics/FederalJudicial CaseloadStatistics/2013/tables/C00Mar13.pdf. 136. MDL STATISTICS 2012, supra note 133. 137. 1986 MDL STATISTICS, supra note 132, at 15. 138. Appendix Z, supra note 62. Thus, the average asbestos case occupies about fifty-three minutes of judicial time.
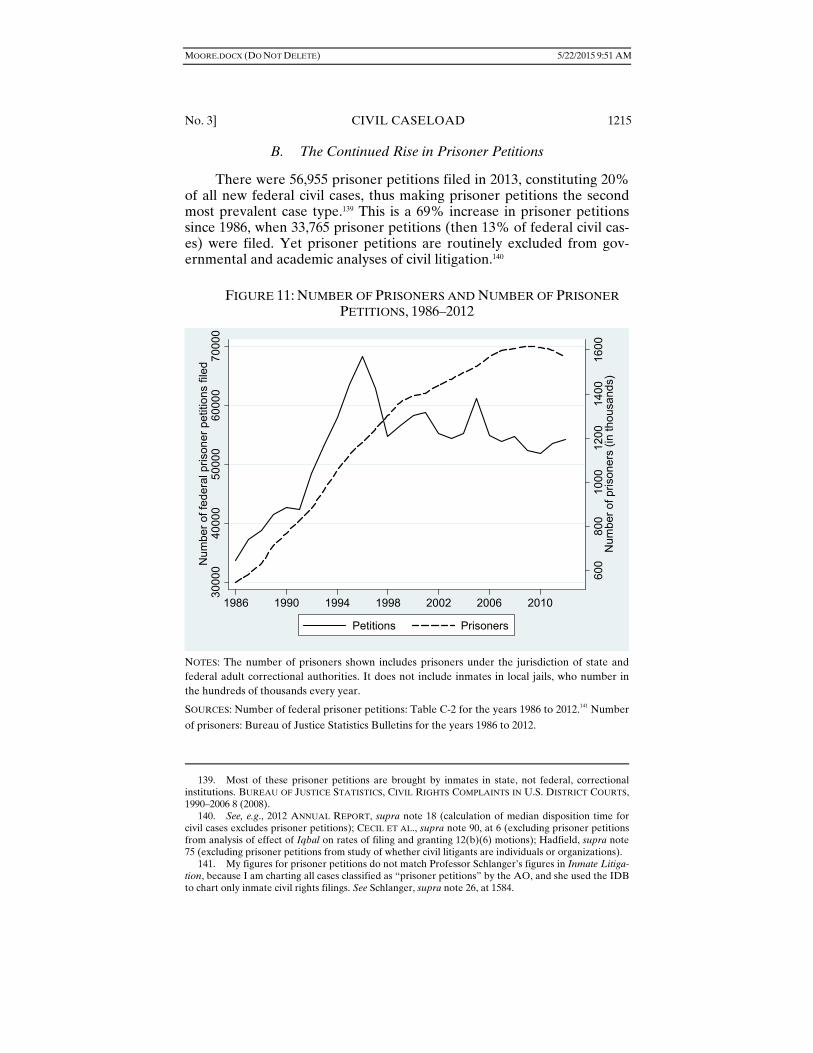
MOORE.DOCX (DO NOT DELETE) 5/22/2015 9:51 AM
No. 3] CIVIL CASELOAD 1215
B. The Continued Rise in Prisoner Petitions
There were 56,955 prisoner petitions filed in 2013, constituting 20% of all new federal civil cases, thus making prisoner petitions the second most prevalent case type.139 This is a 69% increase in prisoner petitions since 1986, when 33,765 prisoner petitions (then 13% of federal civil cas-es) were filed. Yet prisoner petitions are routinely excluded from gov-ernmental and academic analyses of civil litigation.140
FIGURE 11: NUMBER OF PRISONERS AND NUMBER OF PRISONER PETITIONS, 1986–2012
NOTES: The number of prisoners shown includes prisoners under the jurisdiction of state and federal adult correctional authorities. It does not include inmates in local jails, who number in the hundreds of thousands every year.
SOURCES: Number of federal prisoner petitions: Table C-2 for the years 1986 to 2012.141 Number
of prisoners: Bureau of Justice Statistics Bulletins for the years 1986 to 2012.
139. Most of these prisoner petitions are brought by inmates in state, not federal, correctional institutions. BUREAU OF JUSTICE STATISTICS, CIVIL RIGHTS COMPLAINTS IN U.S. DISTRICT COURTS, 1990–2006 8 (2008). 140. See, e.g., 2012 ANNUAL REPORT, supra note 18 (calculation of median disposition time for civil cases excludes prisoner petitions); CECIL ET AL., supra note 90, at 6 (excluding prisoner petitions from analysis of effect of Iqbal on rates of filing and granting 12(b)(6) motions); Hadfield, supra note 75 (excluding prisoner petitions from study of whether civil litigants are individuals or organizations). 141. My figures for prisoner petitions do not match Professor Schlanger’s figures in Inmate Litiga-tion, because I am charting all cases classified as “prisoner petitions” by the AO, and she used the IDB to chart only inmate civil rights filings. See Schlanger, supra note 26, at 1584.
600
800
1000
1200
1400
1600
Num
ber
of p
rison
ers
(in th
ousa
nds)
3000
040
000
5000
060
000
7000
0N
umbe
r of
fede
ral p
riso
ner
petit
ions
file
d
1986 1990 1994 1998 2002 2006 2010
Petitions Prisoners
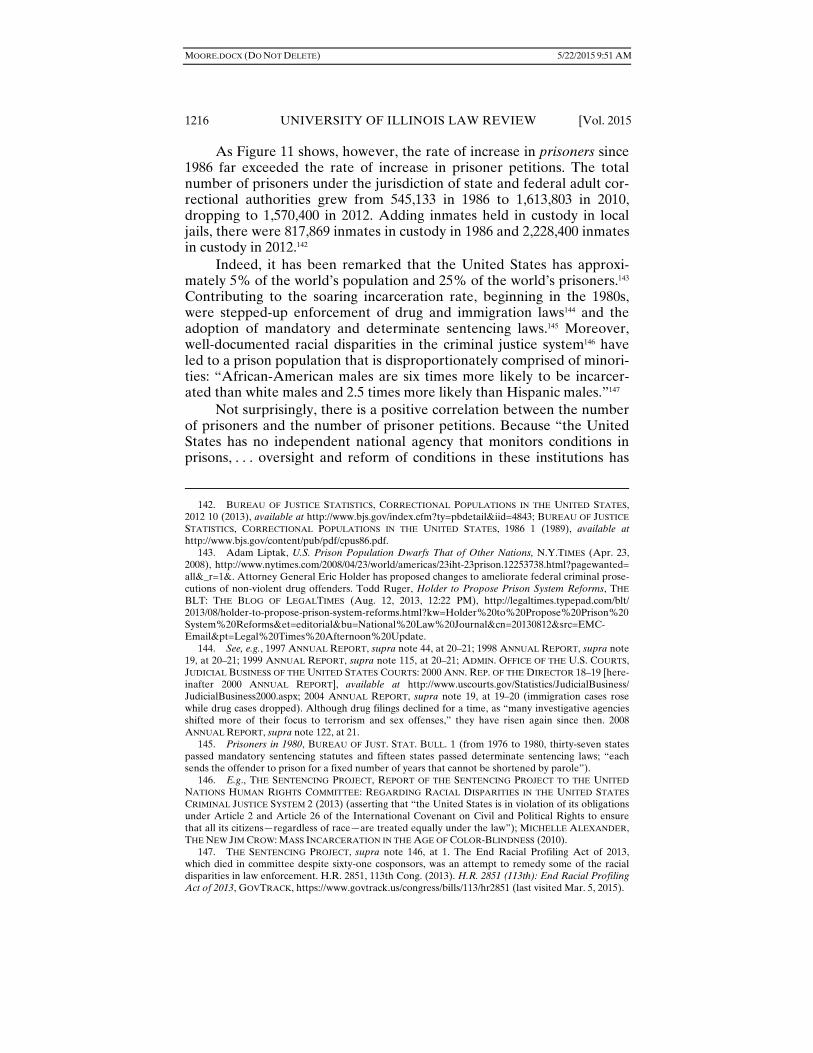
MOORE.DOCX (DO NOT DELETE) 5/22/2015 9:51 AM
1216 UNIVERSITY OF ILLINOIS LAW REVIEW [Vol. 2015
As Figure 11 shows, however, the rate of increase in prisoners since 1986 far exceeded the rate of increase in prisoner petitions. The total number of prisoners under the jurisdiction of state and federal adult cor-rectional authorities grew from 545,133 in 1986 to 1,613,803 in 2010, dropping to 1,570,400 in 2012. Adding inmates held in custody in local jails, there were 817,869 inmates in custody in 1986 and 2,228,400 inmates in custody in 2012.142
Indeed, it has been remarked that the United States has approxi-mately 5% of the world’s population and 25% of the world’s prisoners.143 Contributing to the soaring incarceration rate, beginning in the 1980s, were stepped-up enforcement of drug and immigration laws144 and the adoption of mandatory and determinate sentencing laws.145 Moreover, well-documented racial disparities in the criminal justice system146 have led to a prison population that is disproportionately comprised of minori-ties: “African-American males are six times more likely to be incarcer-ated than white males and 2.5 times more likely than Hispanic males.”147
Not surprisingly, there is a positive correlation between the number of prisoners and the number of prisoner petitions. Because “the United States has no independent national agency that monitors conditions in prisons, . . . oversight and reform of conditions in these institutions has
142. BUREAU OF JUSTICE STATISTICS, CORRECTIONAL POPULATIONS IN THE UNITED STATES, 2012 10 (2013), available at http://www.bjs.gov/index.cfm?ty=pbdetail&iid=4843; BUREAU OF JUSTICE
STATISTICS, CORRECTIONAL POPULATIONS IN THE UNITED STATES, 1986 1 (1989), available at http://www.bjs.gov/content/pub/pdf/cpus86.pdf. 143. Adam Liptak, U.S. Prison Population Dwarfs That of Other Nations, N.Y.TIMES (Apr. 23, 2008), http://www.nytimes.com/2008/04/23/world/americas/23iht-23prison.12253738.html?pagewanted= all&_r=1&. Attorney General Eric Holder has proposed changes to ameliorate federal criminal prose-cutions of non-violent drug offenders. Todd Ruger, Holder to Propose Prison System Reforms, THE
BLT: THE BLOG OF LEGALTIMES (Aug. 12, 2013, 12:22 PM), http://legaltimes.typepad.com/blt/ 2013/08/holder-to-propose-prison-system-reforms.html?kw=Holder%20to%20Propose%20Prison%20 System%20Reforms&et=editorial&bu=National%20Law%20Journal&cn=20130812&src=EMC-Email&pt=Legal%20Times%20Afternoon%20Update. 144. See, e.g., 1997 ANNUAL REPORT, supra note 44, at 20–21; 1998 ANNUAL REPORT, supra note 19, at 20–21; 1999 ANNUAL REPORT, supra note 115, at 20–21; ADMIN. OFFICE OF THE U.S. COURTS, JUDICIAL BUSINESS OF THE UNITED STATES COURTS: 2000 ANN. REP. OF THE DIRECTOR 18–19 [here-inafter 2000 ANNUAL REPORT], available at http://www.uscourts.gov/Statistics/JudicialBusiness/ JudicialBusiness2000.aspx; 2004 ANNUAL REPORT, supra note 19, at 19–20 (immigration cases rose while drug cases dropped). Although drug filings declined for a time, as “many investigative agencies shifted more of their focus to terrorism and sex offenses,” they have risen again since then. 2008 ANNUAL REPORT, supra note 122, at 21. 145. Prisoners in 1980, BUREAU OF JUST. STAT. BULL. 1 (from 1976 to 1980, thirty-seven states passed mandatory sentencing statutes and fifteen states passed determinate sentencing laws; “each sends the offender to prison for a fixed number of years that cannot be shortened by parole”). 146. E.g., THE SENTENCING PROJECT, REPORT OF THE SENTENCING PROJECT TO THE UNITED
NATIONS HUMAN RIGHTS COMMITTEE: REGARDING RACIAL DISPARITIES IN THE UNITED STATES
CRIMINAL JUSTICE SYSTEM 2 (2013) (asserting that “the United States is in violation of its obligations under Article 2 and Article 26 of the International Covenant on Civil and Political Rights to ensure that all its citizens—regardless of race—are treated equally under the law”); MICHELLE ALEXANDER, THE NEW JIM CROW: MASS INCARCERATION IN THE AGE OF COLOR-BLINDNESS (2010). 147. THE SENTENCING PROJECT, supra note 146, at 1. The End Racial Profiling Act of 2013, which died in committee despite sixty-one cosponsors, was an attempt to remedy some of the racial disparities in law enforcement. H.R. 2851, 113th Cong. (2013). H.R. 2851 (113th): End Racial Profiling Act of 2013, GOVTRACK, https://www.govtrack.us/congress/bills/113/hr2851 (last visited Mar. 5, 2015).

MOORE.DOCX (DO NOT DELETE) 5/22/2015 9:51 AM
No. 3] CIVIL CASELOAD 1217
fallen primarily to the federal courts.”148 After the 1978 Supreme Court decision of Hutto v. Finney, which held that the horrific conditions in an Arkansas prison violated inmates’ constitutional rights, prisoners increas-ingly filed lawsuits challenging a variety of unlawful prison conditions.149 As the “war on drugs” caused the prison population to soar,150 so too did the number of prisoner petitions.
Responding to the increasing lawsuits rather than to the underlying causes, Congress sought to stem the flow of prisoner filings.151 In what Margo Schlanger has called a largely unnoticed “federal tort reform measure,”152 the Prison Litigation Reform Act (“PLRA”) was passed in 1995.153 Its purposes were “to decrease the amount of prisoner litigation in the federal courts”154 and to increase the quality of the petitions that were filed.155 Among other things, the PLRA requires prisoners to ex-haust onerous administrative grievance procedures, imposes filing fees on inmates regardless of indigency, and requires district courts to review prisoner petitions sua sponte for failure to state a claim, without waiting for a 12(b)(6) motion from the defendant (or even service of process on the defendant).156 Stunningly, the PLRA even applies to incarcerated children, including those tried as juveniles.157
In addition, the Anti-Terrorism and Effective Death Penalty Act (“AEDPA”), was passed in 1996.158 The AEDPA “established a one-year limitation for filing prisoner petitions under 28 U.S.C. §2255 [state habe-as corpus].”159
148. HUMAN RTS. WATCH, NO EQUAL JUSTICE: THE PRISON LITIGATION REFORM ACT IN THE
UNITED STATES 3 (2009). 149. Id. at 7–8. Schlanger found that the four most prevalent topics were “physical assaults (by correctional staff or by other inmates), inadequate medical care, alleged due process violations relat-ing to disciplinary sanctions, and more general living-conditions claims (relating, for example, to nutri-tion or sanitation).” Schlanger, supra note 26, at 1571. 150. Kathleen Miles, Just How Much the War on Drugs Impacts Our Overcrowded Prisons, In One Chart, HUFFINGTON POST (Mar. 10, 2014), http://www.huffingtonpost.com/2014/03/10/war-on-drugs-prisons-infographic_n_4914884.html. 151. 141 CONG. REC. S14, 418 (daily ed. Sept. 27, 1995) (statement of Sen. Hatch) (asserting that prisoner petitions were “tying our courts in knots with an endless flood of frivolous litigation”). See also Henry F. Fradella, In Search of Meritorious Claims: A Study of the Processing of Prisoner Civil Rights Cases in a Federal District Court, 21 JUST. SYS. J. 23, 48 (1999) (“State officials, most frequently state attorneys general and their staff, list a handful of factually absurd claims as a representative illus-tration of the type of claims filed by inmates in state and local custody. The press reports these asser-tions to the public, who, outraged at the frivolity of such claims, calls for restraints on inmates’ abilities to sue.”). Although inmates did file federal civil rights cases at a rate that was thirty-five times as fre-quent as noninmates, when state court filings are added into the mix, “the total (state and federal) in-mate filing rate approximates the total noninmate filing rate.” Schlanger, supra note 26, at 1575–76. 152. Schlanger, supra note 26, at 1561. 153. Pub. L. 104-134, Title I, §101(a), 110 Stat. 1321-74 (1996); Pub. L. 104-140, §1(a), 110 Stat. 1327 (1996). 154. Galanter, supra note 46, at 469. 155. Porter v. Nussle, 534 U.S. 516, 525 (2002). 156. Schlanger, supra note 26, at 1627–33. 157. HUMAN RIGHTS WATCH, supra note 148, at 29–34. 158. Antiterrorism and Effective Death Penalty Act of 1966, Pub. L. No. 104-132, 110 Stat. 1214 (1996). 159. 1997 ANNUAL REPORT, supra note 44, at 17.
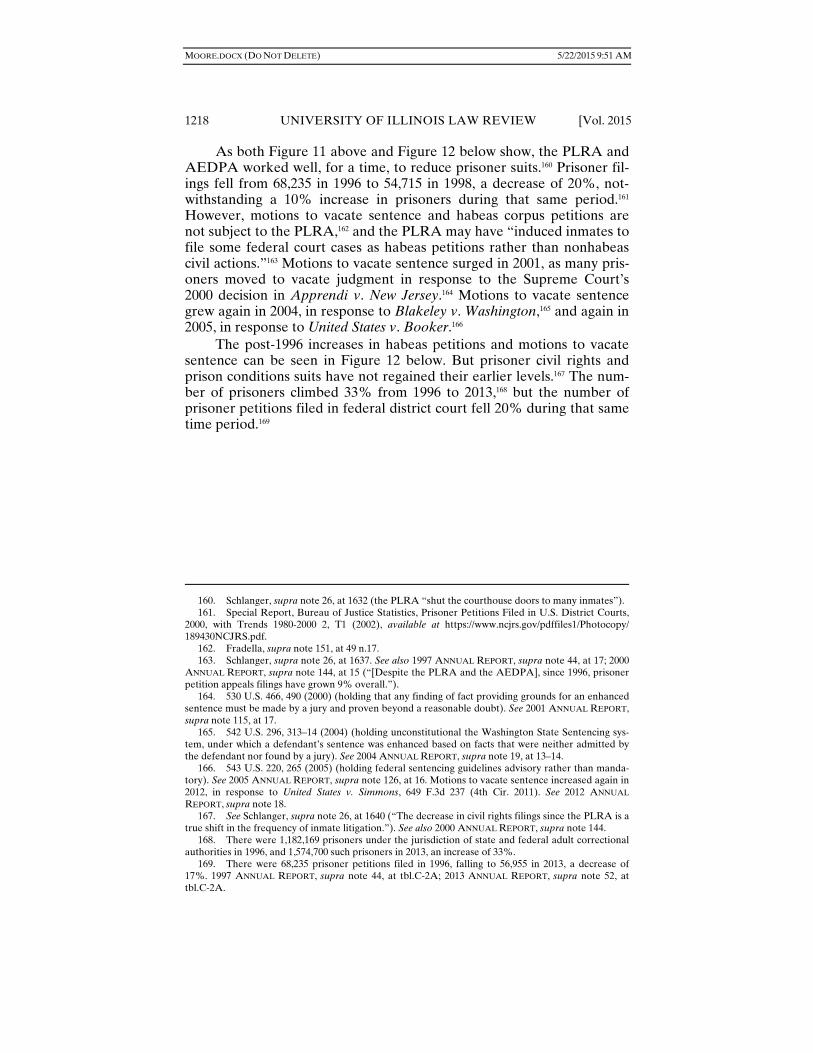
MOORE.DOCX (DO NOT DELETE) 5/22/2015 9:51 AM
1218 UNIVERSITY OF ILLINOIS LAW REVIEW [Vol. 2015
As both Figure 11 above and Figure 12 below show, the PLRA and AEDPA worked well, for a time, to reduce prisoner suits.160 Prisoner fil-ings fell from 68,235 in 1996 to 54,715 in 1998, a decrease of 20%, not-withstanding a 10% increase in prisoners during that same period.161 However, motions to vacate sentence and habeas corpus petitions are not subject to the PLRA,162 and the PLRA may have “induced inmates to file some federal court cases as habeas petitions rather than nonhabeas civil actions.”163 Motions to vacate sentence surged in 2001, as many pris-oners moved to vacate judgment in response to the Supreme Court’s 2000 decision in Apprendi v. New Jersey.164 Motions to vacate sentence grew again in 2004, in response to Blakeley v. Washington,165 and again in 2005, in response to United States v. Booker.166
The post-1996 increases in habeas petitions and motions to vacate sentence can be seen in Figure 12 below. But prisoner civil rights and prison conditions suits have not regained their earlier levels.167 The num-ber of prisoners climbed 33% from 1996 to 2013,168 but the number of prisoner petitions filed in federal district court fell 20% during that same time period.169
160. Schlanger, supra note 26, at 1632 (the PLRA “shut the courthouse doors to many inmates”). 161. Special Report, Bureau of Justice Statistics, Prisoner Petitions Filed in U.S. District Courts, 2000, with Trends 1980-2000 2, T1 (2002), available at https://www.ncjrs.gov/pdffiles1/Photocopy/ 189430NCJRS.pdf. 162. Fradella, supra note 151, at 49 n.17. 163. Schlanger, supra note 26, at 1637. See also 1997 ANNUAL REPORT, supra note 44, at 17; 2000 ANNUAL REPORT, supra note 144, at 15 (“[Despite the PLRA and the AEDPA], since 1996, prisoner petition appeals filings have grown 9% overall.”). 164. 530 U.S. 466, 490 (2000) (holding that any finding of fact providing grounds for an enhanced sentence must be made by a jury and proven beyond a reasonable doubt). See 2001 ANNUAL REPORT, supra note 115, at 17. 165. 542 U.S. 296, 313–14 (2004) (holding unconstitutional the Washington State Sentencing sys-tem, under which a defendant’s sentence was enhanced based on facts that were neither admitted by the defendant nor found by a jury). See 2004 ANNUAL REPORT, supra note 19, at 13–14. 166. 543 U.S. 220, 265 (2005) (holding federal sentencing guidelines advisory rather than manda-tory). See 2005 ANNUAL REPORT, supra note 126, at 16. Motions to vacate sentence increased again in 2012, in response to United States v. Simmons, 649 F.3d 237 (4th Cir. 2011). See 2012 ANNUAL
REPORT, supra note 18. 167. See Schlanger, supra note 26, at 1640 (“The decrease in civil rights filings since the PLRA is a true shift in the frequency of inmate litigation.”). See also 2000 ANNUAL REPORT, supra note 144. 168. There were 1,182,169 prisoners under the jurisdiction of state and federal adult correctional authorities in 1996, and 1,574,700 such prisoners in 2013, an increase of 33%. 169. There were 68,235 prisoner petitions filed in 1996, falling to 56,955 in 2013, a decrease of 17%. 1997 ANNUAL REPORT, supra note 44, at tbl.C-2A; 2013 ANNUAL REPORT, supra note 52, at tbl.C-2A.
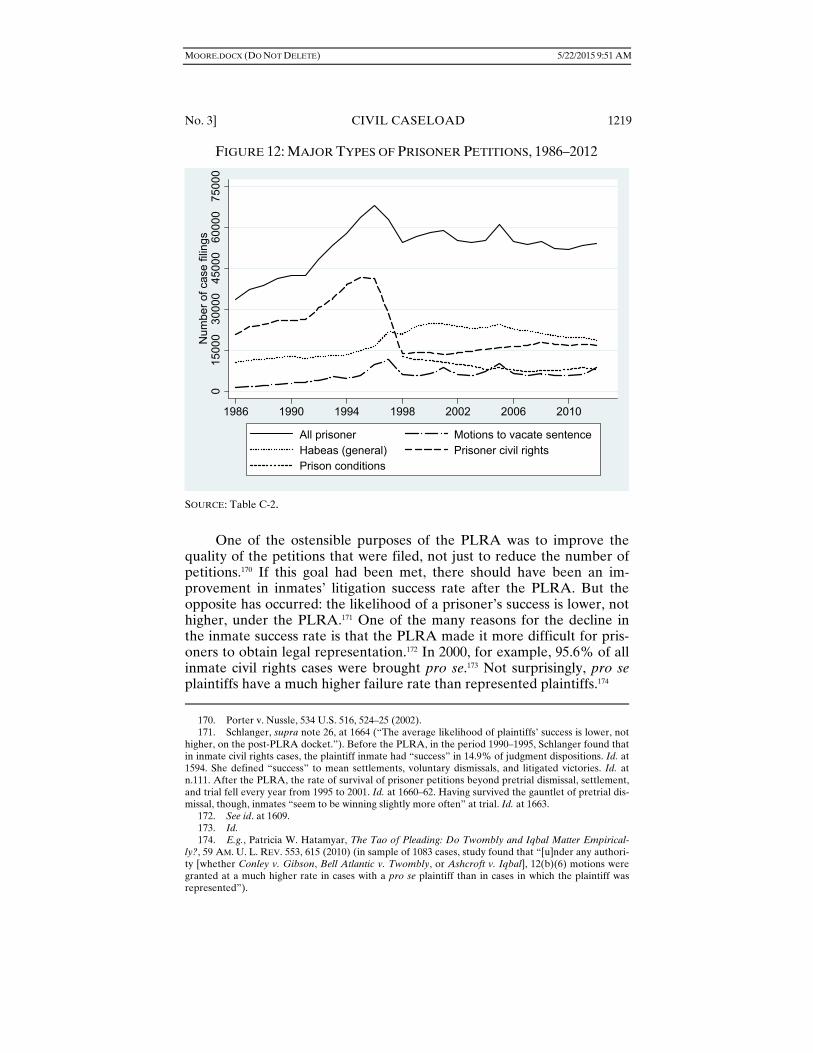
MOORE.DOCX (DO NOT DELETE) 5/22/2015 9:51 AM
No. 3] CIVIL CASELOAD 1219
FIGURE 12: MAJOR TYPES OF PRISONER PETITIONS, 1986–2012
SOURCE: Table C-2.
One of the ostensible purposes of the PLRA was to improve the
quality of the petitions that were filed, not just to reduce the number of petitions.170 If this goal had been met, there should have been an im-provement in inmates’ litigation success rate after the PLRA. But the opposite has occurred: the likelihood of a prisoner’s success is lower, not higher, under the PLRA.171 One of the many reasons for the decline in the inmate success rate is that the PLRA made it more difficult for pris-oners to obtain legal representation.172 In 2000, for example, 95.6% of all inmate civil rights cases were brought pro se.173 Not surprisingly, pro se plaintiffs have a much higher failure rate than represented plaintiffs.174 170. Porter v. Nussle, 534 U.S. 516, 524–25 (2002). 171. Schlanger, supra note 26, at 1664 (“The average likelihood of plaintiffs’ success is lower, not higher, on the post-PLRA docket.”). Before the PLRA, in the period 1990–1995, Schlanger found that in inmate civil rights cases, the plaintiff inmate had “success” in 14.9% of judgment dispositions. Id. at 1594. She defined “success” to mean settlements, voluntary dismissals, and litigated victories. Id. at n.111. After the PLRA, the rate of survival of prisoner petitions beyond pretrial dismissal, settlement, and trial fell every year from 1995 to 2001. Id. at 1660–62. Having survived the gauntlet of pretrial dis-missal, though, inmates “seem to be winning slightly more often” at trial. Id. at 1663. 172. See id. at 1609. 173. Id. 174. E.g., Patricia W. Hatamyar, The Tao of Pleading: Do Twombly and Iqbal Matter Empirical-ly?, 59 AM. U. L. REV. 553, 615 (2010) (in sample of 1083 cases, study found that “[u]nder any authori-ty [whether Conley v. Gibson, Bell Atlantic v. Twombly, or Ashcroft v. Iqbal], 12(b)(6) motions were granted at a much higher rate in cases with a pro se plaintiff than in cases in which the plaintiff was represented”).
015
000
3000
045
000
6000
075
000
Num
ber
of c
ase
filin
gs
1986 1990 1994 1998 2002 2006 2010
All prisoner Motions to vacate sentenceHabeas (general) Prisoner civil rightsPrison conditions

MOORE.DOCX (DO NOT DELETE) 5/22/2015 9:51 AM
1220 UNIVERSITY OF ILLINOIS LAW REVIEW [Vol. 2015
Some believe that the PLRA has had a negative effect on conditions in U.S. prisons.175 There is certainly no shortage of prisoner cases alleging abusive events and conditions.176 Nonetheless, numerous commentators believe the PLRA and AEDPA cut off meritorious claims along with the unmeritorious.177 Lower-court antipathy toward inmate suits can be seen in Erickson v. Pardus, where the district court dismissed a complaint al-leging that prison officials denied the inmate proper care for a serious medical condition, and the Supreme Court reversed in a per curiam opin-ion.178 According to another researcher, “judges and their law clerks con-tinually complain about the enormous volume of frivolous [prisoner] lawsuits.”179
In any event, district court judges do not spend much time on the average prisoner petition. In the AO’s case weighting system, based on its estimates of district judges’ time spent on various case types, a normal civil case is weighted 1.0.180 The case weights for prisoner suits range from 0.32 for motions to vacate sentence to 0.75 for federal prisoner civil rights or prison condition suits181 (except for death penalty habeas corpus peti-tions, of which there are only a small number per year). Referencing the low weights assigned to prisoner litigation (0.28 and 0.48 at the time she wrote), Schlanger calculated that although “inmate civil rights filings made up 14.7% of the total district court new docket, [they comprised] just 5.1% of the judges’ weighted caseload.”182 She also estimated, based on interviews with AO representatives, that district court judges spent less than one hour on the average prisoner petition, from filing to dispo-sition.183
Strangely, or perhaps not so strangely, even though judges usually spend little time on prisoner petitions, some of prisoner petitions tend to hang around on a judge’s docket for a long time. The Civil Justice Reform Act of 1990 (“CJRA”) requires district court judges to report 175. HUMAN RIGHTS WATCH, supra note 148, at 36. 176. See, e.g., id. at 14–18 (citing cases, among others, where prisoner complained of being stabbed in the eye, brutally attacked by other prisoners, and raped); AM. CIV. LIBERTIES UNION, SLAMMING THE COURTHOUSE DOORS: DENIAL OF ACCESS TO JUSTICE AND REMEDY IN AMERICA 12 (2010). The Prison Abuse Remedies Act of 2009, H.R. 4335 (111th Cong.), which died in committee, was introduced in recognition of these conditions. 177. E.g., Schlanger, supra note 26, at 1587–88. 178. 551 U.S. 89 (2007). 179. Fradella, supra note 151, at 48. On his review of a sample of such cases from federal district court in Arizona, however, only 29.5% of the cases were actually found to be legally “frivolous” upon review by the judge. 180. U.S. District Courts, UNITED STATES COURTS, http://www.uscourts.gov/Statistics/Judicial Business/2012/us-district-courts.aspx (last visited Mar. 5, 2015). 181. Appendix Z, supra note 62. Deportation/immigration petitions are weighted 0.44, mandamus petitions are weighted 0.49, general habeas corpus petitions are weighted 0.54, and state prisoner civil rights or prison condition suits are weighted 0.67. Death penalty habeas corpus petitions are weighted 12.89. There were 189 death penalty habeas corpus petitions filed in 2012, or 0.3% of all prisoner peti-tions. See 2012 ANNUAL REPORT, supra note 18, at tbl.C-2. 182. Schlanger, supra note 26, at 1589–90. 183. Id. at 1589. However, those conversations occurred under the 1993 weights. Under the cur-rent case weights, adopted in 2004, a federal prisoner petition alleging civil rights violations is weighted 0.75, which approximates 331 minutes of judge time, according to the AO.
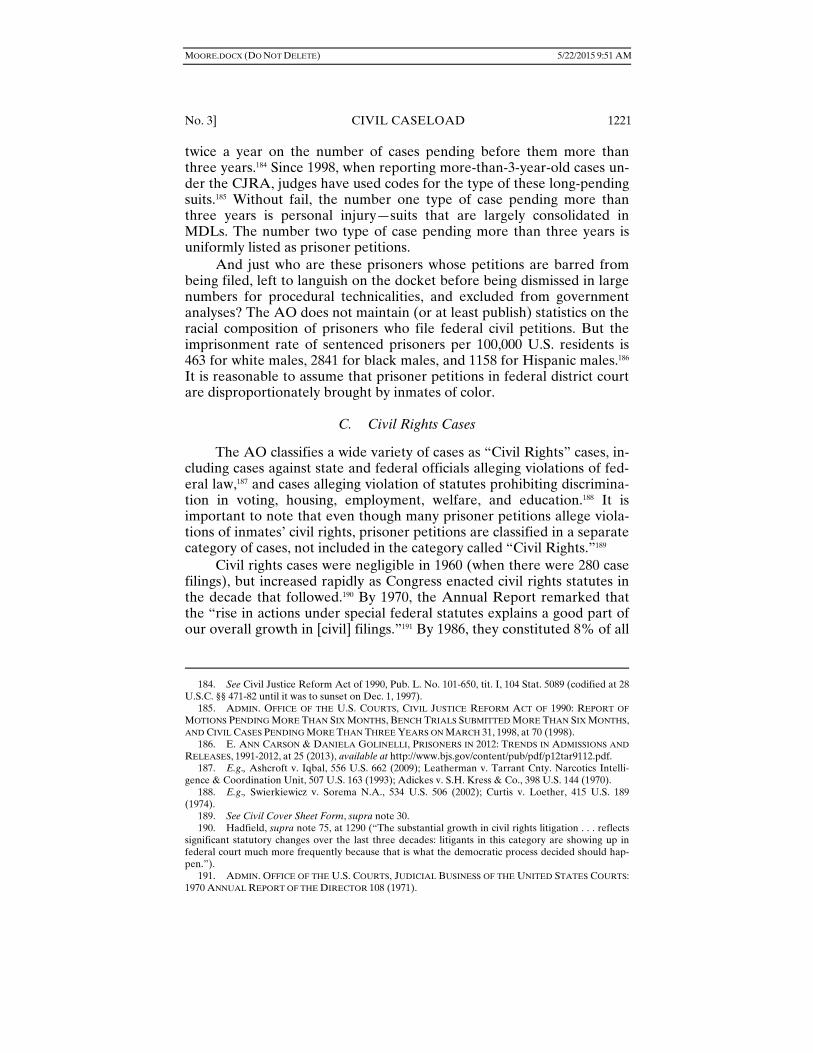
MOORE.DOCX (DO NOT DELETE) 5/22/2015 9:51 AM
No. 3] CIVIL CASELOAD 1221
twice a year on the number of cases pending before them more than three years.184 Since 1998, when reporting more-than-3-year-old cases un-der the CJRA, judges have used codes for the type of these long-pending suits.185 Without fail, the number one type of case pending more than three years is personal injury—suits that are largely consolidated in MDLs. The number two type of case pending more than three years is uniformly listed as prisoner petitions.
And just who are these prisoners whose petitions are barred from being filed, left to languish on the docket before being dismissed in large numbers for procedural technicalities, and excluded from government analyses? The AO does not maintain (or at least publish) statistics on the racial composition of prisoners who file federal civil petitions. But the imprisonment rate of sentenced prisoners per 100,000 U.S. residents is 463 for white males, 2841 for black males, and 1158 for Hispanic males.186 It is reasonable to assume that prisoner petitions in federal district court are disproportionately brought by inmates of color.
C. Civil Rights Cases
The AO classifies a wide variety of cases as “Civil Rights” cases, in-cluding cases against state and federal officials alleging violations of fed-eral law,187 and cases alleging violation of statutes prohibiting discrimina-tion in voting, housing, employment, welfare, and education.188 It is important to note that even though many prisoner petitions allege viola-tions of inmates’ civil rights, prisoner petitions are classified in a separate category of cases, not included in the category called “Civil Rights.”189
Civil rights cases were negligible in 1960 (when there were 280 case filings), but increased rapidly as Congress enacted civil rights statutes in the decade that followed.190 By 1970, the Annual Report remarked that the “rise in actions under special federal statutes explains a good part of our overall growth in [civil] filings.”191 By 1986, they constituted 8% of all
184. See Civil Justice Reform Act of 1990, Pub. L. No. 101-650, tit. I, 104 Stat. 5089 (codified at 28 U.S.C. §§ 471-82 until it was to sunset on Dec. 1, 1997). 185. ADMIN. OFFICE OF THE U.S. COURTS, CIVIL JUSTICE REFORM ACT OF 1990: REPORT OF
MOTIONS PENDING MORE THAN SIX MONTHS, BENCH TRIALS SUBMITTED MORE THAN SIX MONTHS, AND CIVIL CASES PENDING MORE THAN THREE YEARS ON MARCH 31, 1998, at 70 (1998). 186. E. ANN CARSON & DANIELA GOLINELLI, PRISONERS IN 2012: TRENDS IN ADMISSIONS AND
RELEASES, 1991-2012, at 25 (2013), available at http://www.bjs.gov/content/pub/pdf/p12tar9112.pdf. 187. E.g., Ashcroft v. Iqbal, 556 U.S. 662 (2009); Leatherman v. Tarrant Cnty. Narcotics Intelli-gence & Coordination Unit, 507 U.S. 163 (1993); Adickes v. S.H. Kress & Co., 398 U.S. 144 (1970). 188. E.g., Swierkiewicz v. Sorema N.A., 534 U.S. 506 (2002); Curtis v. Loether, 415 U.S. 189 (1974). 189. See Civil Cover Sheet Form, supra note 30. 190. Hadfield, supra note 75, at 1290 (“The substantial growth in civil rights litigation . . . reflects significant statutory changes over the last three decades: litigants in this category are showing up in federal court much more frequently because that is what the democratic process decided should hap-pen.”). 191. ADMIN. OFFICE OF THE U.S. COURTS, JUDICIAL BUSINESS OF THE UNITED STATES COURTS: 1970 ANNUAL REPORT OF THE DIRECTOR 108 (1971).
MOORE.DOCX (DO NOT DELETE) 5/22/2015 9:51 AM
1222 UNIVERSITY OF ILLINOIS LAW REVIEW [Vol. 2015
civil filings, earning them fifth place in Galanter’s “Big Six.”192 The per-centage of civil rights cases has continued to increase, up to 12% of all civil filings in 2013, which makes civil rights cases the third most preva-lent case type.193
Civil rights cases are not popular with institutional defendants or, it seems, some of the federal judiciary. Currently, although civil rights cases account for 12% of civil filings, they account for 24% of all motions pending more than six months in federal district court.194 Courts have erected numerous procedural barriers that are either directly aimed at, or have a disproportionate effect on, civil rights cases. For example, some of the lower federal courts in the 1980s developed a “heightened plead-ing standard” to more rigorously screen civil rights cases.195 Although the Supreme Court invalidated an explicit “heightened pleading standard” for civil rights cases in 1993,196 lower courts continued to grant 12(b)(6) motions against civil rights plaintiffs more frequently than against other plaintiffs.197 After the Supreme Court signaled a narrowing of the plead-ing standard in Ashcroft v. Iqbal, this differential became even more pronounced.198
Even if a civil rights case survives the pleading stage, it is more like-ly to suffer summary judgment than other civil cases.199 And under the 1983 version of Rule 11 of the FRCP (which mandated the imposition of sanctions if the rule was found to have been violated), civil rights and employment discrimination plaintiffs were disproportionately subject to sanctions motions and sanctioned at a higher rate than other plaintiffs.200
192. Galanter, supra note 1, at 925. 193. ADMIN. OFFICE OF THE U.S. COURTS, FEDERAL COURT MANAGEMENT STATISTICS (2013), available at http://www.uscourts.gov/Statistics/FederalCourtManagementStatistics/district-courts-sep tember-2013.aspx. 194. 2013 REPORT OF MOTIONS, supra note 80, at 2–3 (of 5511 motions pending more than six months on March 31, 2013, civil rights cases accounted for 1338 motions). 195. See, e.g., Leatherman v. Tarrant Cnty. Narcotics Intelligence & Coordination Unit, 507 U.S. 163, 165 (1993) (“The United States District Court . . . ordered the complaints dismissed because they failed to meet the ‘heightened pleading standard’ required by the decisional law of the Court of Ap-peals for the Fifth Circuit [to § 1983 actions alleging municipal liability]. The Fifth Circuit, in turn, af-firmed the judgment of dismissal.”). 196. Id. at 164. 197. Hatamyar, supra note 174, at 608–09; Joseph A. Seiner, Pleading Disability, 51 B.C. L. REV. 95, 116–18 (2009) (finding that in a study of 124 ADA cases in the federal district courts in the years before and after Bell Atlantic v. Twombly, 550 U.S. 544 (2006), while 54.2% of motions to dismiss were granted in the year before Twombly, 64.6% were granted in the year after Twombly). 198. See supra note 94. 199. Cecil et al., supra note 91, at 884, 896 (between 1975 and 2000, the rate at which cases were terminated by summary judgment increased from 4% to 8%, with civil rights cases disproportionately affected); see also Schlanger, supra note 26, at 1598 (finding that in 1995, of federal district court cases terminated by judgment, 53% in civil rights cases were by pretrial dismissals, a much higher rate of pretrial dismissal than for any other case types except inmate civil rights; in that same year, the rate for plaintiff victory at trial was 31% and 30%, respectively, for civil rights and civil rights employment, compared to an average plaintiff victory rate of 40%). 200. See Lonny Hoffman, The Case Against the Lawsuit Abuse Reduction Act of 2011, 48 HOUS. L. REV. 545, 553–57 (2011) (“The Advisory Committee itself eventually realized that under the 1983 rule, the poorest victims and their lawyers faced the greatest threat from monetary sanctions.”); see
MOORE.DOCX (DO NOT DELETE) 5/22/2015 9:51 AM
No. 3] CIVIL CASELOAD 1223
As with prisoner petitions, some of the explanation for civil rights plaintiffs’ relative lack of litigation success is that a higher proportion of civil rights plaintiffs are pro se,201 and pro se plaintiffs fail more often that represented plaintiffs.202 Many plaintiffs lack the resources to hire a law-yer except on a contingency fee, and plaintiffs’ lawyers are finding even meritorious claims “economically unfeasible to prosecute.’’203 Another explanation for civil rights plaintiffs’ relative lack of success is that their lawyers “may just not be that good.”204
Despite all these impediments to successful prosecution, civil rights cases have grown 87% in the past 27 years, from 20,128 in 1986 to 35,307 in 2013. Even so, the number today is down substantially from its high of 43,278 civil rights cases filed in 1997.
Figure 13 below shows a boost in civil rights cases from 1991 to 1997. Employment discrimination cases, which constitute the largest per-centage of civil rights cases,205 substantially increased after amendments to Title VII by the Civil Rights Act of 1991 added a right to jury trial and the availability of compensatory and punitive damages.206 There were 8413 employment discrimination cases filed in 1990, increasing to a peak of 23,796 filings in 1997.207
also Danielle Kie Hart, And the Chill Goes On—Federal Civil Rights Plaintiffs Beware: Rule 11 Vis-à-Vis 28 U.S.C. 1927 and the Court's Inherent Power, 37 LOY. L.A. L. REV. 645, 660–62 (2004). 201. Schlanger, supra note 26, at 1609 (in 2000, 29.8% of civil rights cases, and 20.1% of civil rights employment cases, were brought pro se, compared to a 10.1% pro se rate in other civil litigation, excluding inmate civil rights/habeas cases). 202. See supra note 174. 203. Brooke D. Coleman, The Vanishing Plaintiff, 42 SETON HALL L. REV. 501, 517 (2012) (quot-ing Elizabeth J. Cabraser, Apportioning Due Process: Preserving the Right to Affordable Justice, 87 DENV. U. L. REV. 437, 448–49 (2010)). 204. Id. at 519 (citing Marc Galanter, Why the “Haves” Come Out Ahead: Speculations on the Limits of Legal Change, 9 LAW & SOC’Y REV. 95, 97 (1974–1975)) (positing that lawyers who repre-sent individual plaintiffs are generally from the “lower echelons of the legal profession”). 205. BUREAU OF JUSTICE STATISTICS, CIVIL RIGHTS COMPLAINTS IN U.S. DISTRICT COURTS, 1990–2006, at 2 (2008). 206. Kevin M. Clermont & Stewart J. Schwab, Employment Discrimination Plaintiffs in Federal Court: From Bad to Worse?, 3 HARV. L. & POL’Y. REV. 103, 116 (2009). 207. Id. at 116, 118 n.45 (citing Laura Beth Nielsen, et al., Uncertain Justice: Litigating Claims of Employment Discrimination in the Contemporary United States 13–14 (Amer. Bar Ass’n., Research Paper No. 08-04, Apr. 16, 2008), available at http://papers.ssrn.com/sol3/papers.cfm?abstract_id=109 3313).
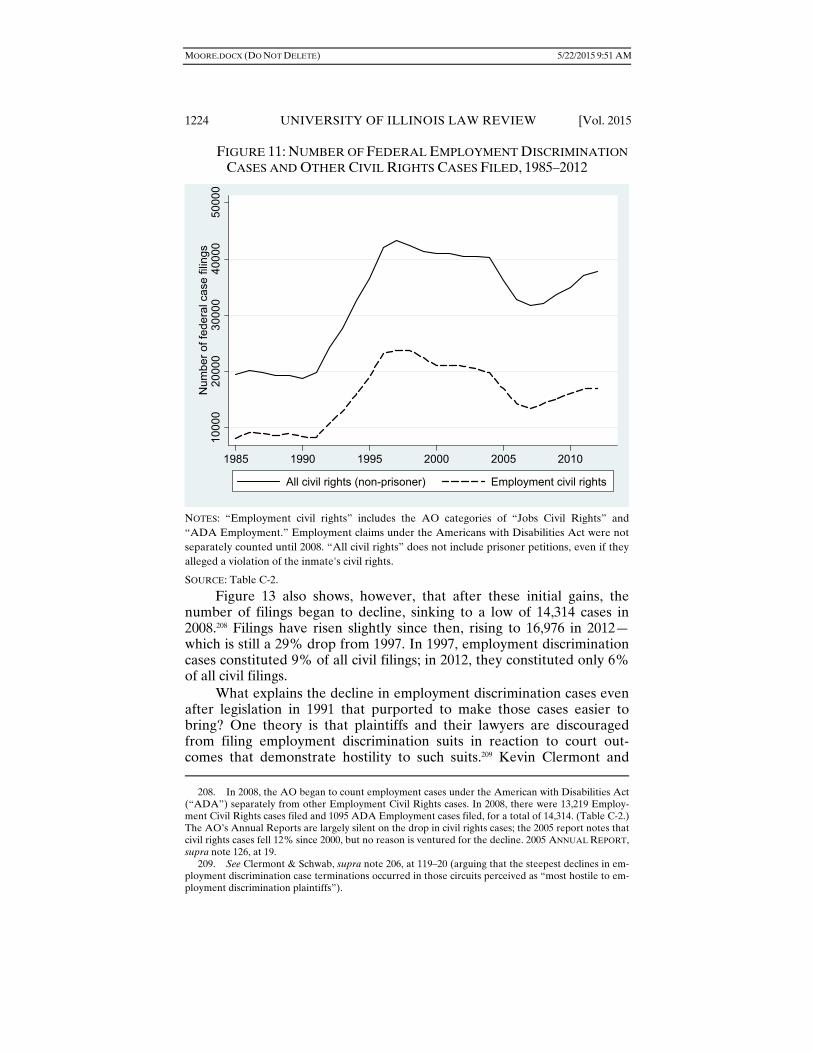
MOORE.DOCX (DO NOT DELETE) 5/22/2015 9:51 AM
1224 UNIVERSITY OF ILLINOIS LAW REVIEW [Vol. 2015
FIGURE 11: NUMBER OF FEDERAL EMPLOYMENT DISCRIMINATION CASES AND OTHER CIVIL RIGHTS CASES FILED, 1985–2012
NOTES: “Employment civil rights” includes the AO categories of “Jobs Civil Rights” and “ADA Employment.” Employment claims under the Americans with Disabilities Act were not separately counted until 2008. “All civil rights” does not include prisoner petitions, even if they alleged a violation of the inmate's civil rights.
SOURCE: Table C-2.
Figure 13 also shows, however, that after these initial gains, the number of filings began to decline, sinking to a low of 14,314 cases in 2008.208 Filings have risen slightly since then, rising to 16,976 in 2012—which is still a 29% drop from 1997. In 1997, employment discrimination cases constituted 9% of all civil filings; in 2012, they constituted only 6% of all civil filings.
What explains the decline in employment discrimination cases even after legislation in 1991 that purported to make those cases easier to bring? One theory is that plaintiffs and their lawyers are discouraged from filing employment discrimination suits in reaction to court out-comes that demonstrate hostility to such suits.209 Kevin Clermont and 208. In 2008, the AO began to count employment cases under the American with Disabilities Act (“ADA”) separately from other Employment Civil Rights cases. In 2008, there were 13,219 Employ-ment Civil Rights cases filed and 1095 ADA Employment cases filed, for a total of 14,314. (Table C-2.) The AO’s Annual Reports are largely silent on the drop in civil rights cases; the 2005 report notes that civil rights cases fell 12% since 2000, but no reason is ventured for the decline. 2005 ANNUAL REPORT, supra note 126, at 19. 209. See Clermont & Schwab, supra note 206, at 119–20 (arguing that the steepest declines in em-ployment discrimination case terminations occurred in those circuits perceived as “most hostile to em-ployment discrimination plaintiffs”).
1000
020
000
3000
040
000
5000
0N
umbe
r of
fede
ral c
ase
filin
gs
1985 1990 1995 2000 2005 2010
All civil rights (non-prisoner) Employment civil rights
MOORE.DOCX (DO NOT DELETE) 5/22/2015 9:51 AM
No. 3] CIVIL CASELOAD 1225
Stewart Schwab have documented a decline in federal employment dis-crimination case terminations in the last ten years,210 concluding that “re-sults in the federal courts disfavor employment discrimination plaintiffs, who are now forswearing use of those courts.”211 Moreover, Clermont and Schwab’s study was published before the issuance of several Su-preme Court decisions that raised the bar for plaintiffs in age discrimina-tion,212 workplace retaliation,213 and harassment cases.214
Some of the judicial hostility towards civil rights suits may be a product of the elite background of many federal judges,215 which does not make them overly receptive to labor or employment claims.216 With in-creasing freedom to grant motions to dismiss and summary judgment motions, district court judges may find it hard to credit civil rights plain-tiffs’ claims as “plausible.”217
So why have civil rights filings slightly increased in the last few years, despite almost insuperable obstacles? One obvious possibility is that the underlying conduct prohibited by civil rights laws has failed to wither. Charges of discrimination with the Equal Employment 210. Id. at 104; Kevin M. Clermont et al., How Employment-Discrimination Plaintiffs Fare in the Federal Courts of Appeals, 7 EMPLOYEE RTS. & EMP. POL’Y J. 547 (2003). 211. Clermont & Schwab, supra note 206, at 104. 212. Gross v. FBL Fin. Servs., Inc., 557 U.S. 167, 180 (2009) (holding “that a plaintiff bringing a disparate-treatment claim pursuant to the [Age Discrimination in Employment Act] must prove, by a preponderance of the evidence, that age was the ‘but-for’ cause of the challenged adverse employment action. The burden of persuasion does not shift to the employer to show that it would have taken the action regardless of age, even when a plaintiff has produced some evidence that age was one motivat-ing factor in that decision”). 213. Univ. of Tex. Sw. Med. Ctr. v. Nassar, 133 S. Ct. 2517, 2534 (2013) (holding that “a plaintiff making a [Title VII] retaliation claim . . . must establish that his or her protected activity was a but-for cause of the alleged adverse action by the employer”). 214. Vance v. Ball State Univ., 133 S. Ct. 2434, 2439 (2013) (holding that “an employee is a ‘su-pervisor’ for purposes of vicarious liability under Title VII if he or she is empowered by the employer to take tangible employment actions against the victim”). 215. See, e.g., NAT’L EMP’T LAWYERS ASS’N RPT.: JUDICIAL HOSTILITY TO WORKERS’ RIGHTS: THE CASE FOR PROFESSIONAL DIVERSITY ON THE FEDERAL BENCH, http://exchange.nela.org/ NELA/Contribute/Resources/ViewDocument/?DocumentKey=4c6e4546-acac-48fc-8bb3-7b1ce2bdc4 43 (2012) (“Like his predecessors, President Obama’s nominees have largely been corporate lawyers, judges, or prosecutors prior to their nominations, while fewer have been public defenders, legal ser-vices attorneys, or public interest lawyers. Even fewer have devoted their professional careers to rep-resenting workers and civil rights litigants.”); Michael J. Yelnosky, The Bar Association Panel Should Diversify its Representation, WASH. POST, Aug. 15, 2013, http://www.washingtonpost.com/opinions/the-bar-association-panel-should-diversify-its-representation/2013/08/15/b79c5a18-045f-11e3-88d6-d5795 fab4637_story.html (noting that in the ABA's Standing Committee on the Federal Judiciary, which rates potential nominees for federal judicial vacancies, “[n]ot one of the lawyers on the committee for 2013–14 regularly represents individuals who bring lawsuits alleging they were harmed by the actions of corporations or other business entities, and not one represents individuals charged with anything other than white-collar crimes”). 216. In this regard, it may be relevant to note that the percentage of civil rights litigants opting for a jury trial over a bench trial grew from about 50% in 1990 to about 86% in 2006, and that juries award civil rights plaintiffs damages more frequently than judges. BUREAU OF JUSTICE STATISTICS, supra note 205, at 1, 6–7. 217. Bell Atlantic v. Twombly, 550 U.S. 544, 570 (2006); see also, e.g., Coleman, supra note 203, at 522–23 (“The federal bench is largely composed of white men. This is not to say that all white male judges are incapable of or insensitive to the substance of vanishing plaintiffs' claims, but it is to say that the worldview of these judges varies significantly from that of the plaintiffs who bring these claims.”).

MOORE.DOCX (DO NOT DELETE) 5/22/2015 9:51 AM
1226 UNIVERSITY OF ILLINOIS LAW REVIEW [Vol. 2015
Opportunity Commission, for example, have increased from 80,860 in 1997 to 93,727 in 2013.218 Over one-third of those filings continue to con-tain charges of discrimination based on race, national origin, or color.219
D. Where Have All the Contract Cases Gone?
In 1986, contract filings in federal court were at an all-time high, and were the largest category of civil cases.220 Figure 14, however, shows that they have been in steady decline since then. In 2013, contract cases were only the fourth largest federal civil case type.221
FIGURE 12: CONTRACT FILINGS IN FEDERAL DISTRICT COURT,
1986–2012
NOTES: “Recovery” cases are a type of contract case classified by the AO. The vast majority (more than 95% in most years) of “recovery” contract filings are by the United States as plain-tiff against defaulting students and veterans receiving overpayments.
SOURCE: Table C-2.
218. EQUAL EMP’T OPPORTUNITY COMM’N, CHARGE STATISTICS FY 1997 THROUGH FY 2013, available at http://eeoc.gov/eeoc/statistics/enforcement/charges.cfm. 219. Id. (showing that there were 36,673 and 46,856 charges in 1997 and 2013, respectively, based on race, national origin, or color). 220. Galanter, supra note 1, at 942 (explaining that contract actions “may be the most spectacular area of growth in federal cases” from 1960 to 1986, even excluding “recovery” cases). 221. UNITED STATES COURTS, CASELOAD STATISTICS SUMMARY (2013), available at http://www. uscourts.gov/Statistics/FederalJudicialCaseloadStatistics/caseload-statistics-2013/caseload-summary. aspx.
020
000
4000
060
000
8000
0N
umbe
r of
cas
e fil
ings
1986 1990 1994 1998 2002 2006 2010
All contracts Only "recovery" contractsContracts excluding "recovery"
MOORE.DOCX (DO NOT DELETE) 5/22/2015 9:51 AM
No. 3] CIVIL CASELOAD 1227
As Figure 14 shows, the vicissitudes of the total number of contract filings have been driven primarily by the fluctuating number of filings of so-called “recovery” actions by the United States, which is itself driven by changes in government policy over the years. As seen by the dashed line in Figure 14 above, the number of non-“recovery” contract filings decreased fairly steadily, from 47,528 in 1986 (19% of all civil filings) to 25,434 in 2012 (9% of all civil filings). Interestingly, state courts have not seen a similar drop in the percentage of civil cases that are contract cases.222
The AO’s Annual Reports mostly note changes in filings from the previous year,223 and few of the Annual Reports mention the decline in “non-recovery” contract filings since 1986,224 let alone speculate on any causes thereof.225 But the amount of the year-to-year decline is typically slight. Only if one looks at the decline over the past twenty years or so does it become noticeable, and the Annual Reports usually do not take such a long retrospective. The following sections will speculate as to pos-sible reasons for the decline in federal contract cases.
1. The Death of “Recovery” Contract Cases
The most obvious reason for the drop in the AO-Reported Total for contract filings is that the United States, as plaintiff, has nearly ceased filing what are called “recovery” contract actions.226 Over 40,000 of such cases were filed in 1986, compared to about 3000 of them in 2012.227
The near-death of “recovery” cases brought by the United States is likely the result of shifting policies and methods for collection of student loans and veterans’ overpayments.228 Rather than filing suit to collect on a defaulted student loan, for example, the federal government can avail
222. See NAT’L CTR. FOR STATE COURTS, EXAMINING THE WORK OF STATE COURTS: AN
ANALYSIS OF 2008 STATE COURT CASELOADS 27 (2010), available at http://www.courtstatistics.org/~/ media/Microsites/Files/CSP/EWSC-2008-Online.ashx (finding a 63% increase in contract filings from 1999 to 2008 in thirteen general jurisdiction state courts); NAT’L CTR. FOR STATE COURTS, EXAMINING THE WORK OF STATE COURTS: AN ANALYSIS OF 2009 STATE COURT CASELOADS 11 (2011), available at http://www.courtstatistics.org/FlashMicrosites/CSP/images/CSP2009.pdf (estimat-ing that contract actions comprised 51% of civil cases filed, while tort cases comprised only 5%, in 2009). 223. One typically unenlightening comment was that “the major trend emerging from the 1999 data is that the federal courts’ caseload rose in some areas and declined in others.” 1999 ANNUAL
REPORT, supra note 115, at 1. 224. The sole exception is the Annual Report for 2005, which notes that “[o]ver the past five years . . . [c]ontracts filings have decreased 35 percent,” but does not venture a guess as to why. 2005 ANNUAL REPORT, supra note 126, at 19. 225. Since 2000, non-recovery contract filings declined from the previous year in 2003, 2004, 2005, 2010, 2011, and 2012. None of the Annual Reports for those years mention the decline. 226. The AO classifies these as contract actions. See Civil Cover Sheet Form, supra note 30. 227. See 1990 ANNUAL REPORT, supra note 16, at 7 (“[Recovery cases and Social Security cases] have had such a dramatic effect on the change in total civil filings from year-to-year that the direction and rate of change has been dependent on the number of recovery and Social Security cases filed.”). 228. See Galanter, supra note 1, at 928–29; 1997 ANNUAL REPORT, supra note 44, at 16 (noting a doubling of U.S. plaintiff student loan filings attributable “to intensified efforts by the Department of Education to submit defaulted student loans for collection”).
MOORE.DOCX (DO NOT DELETE) 5/22/2015 9:51 AM
1228 UNIVERSITY OF ILLINOIS LAW REVIEW [Vol. 2015
itself of more effective and direct remedies, such as taking tax refunds,229 garnishing paychecks,230 and taking federal benefits like social security.231 In addition, it appears that in the case of Perkins loans, the federal gov-ernment prefers that the schools themselves step up to file the lawsuits if necessary.232
While there was a slight upwards blip in 2011 in federal student loan collection cases,233 the United States in 2012 initiated just slightly more “recovery” cases than it did in 1960. Meanwhile, actions to recover over-payments of veterans’ benefits (over 21,000 cases in 1997) have fallen to almost nothing: eight in 2011 and six in 2012.
“Recovery” cases have a high default rate234 and do not take up much judicial time: the AO weights them only 0.10 in the weighted case-load calculations.235 Thus, counting each case fully in the figure for total contract filings tends to overstate and mask what is going on in the non-“recovery” contract filings, which are the subject of greater interest to most observers. But even excluding the precipitous drop in “recovery” cases since 1986, non-“recovery” contract cases have been cut almost in half since then. What accounts for the decrease in non-recovery contract cases?
229. Treasury and State Offset Programs, MYEDDEBT.COM, https://www.myeddebt.com/borrower/ treasuryOffsetNavigate.action (last visited Mar. 5, 2015) (“Pursuant to statutory mandate, since 1986 the Department has referred millions of defaulted student loan debts and grant claims to the Depart-ment of the Treasury . . . for collection by offset against federal and/or state income tax refunds and any other payments authorized by law.”); see 34 C.F.R. §§ 30.20–.33 (2014). 230. 20 U.S.C. § 1095a (2012); see also Administrative Wage Garnishment, MyED Debt.com, https://www.myeddebt.com/borrower/wageGarnishmentNavigate.action (last visited Mar. 5, 2015) (“Under the Higher Education Act, the Department and guaranty agencies may require em-ployers who employ individuals who have defaulted on the repayment of a student loan to deduct 15% of the borrower’s disposable pay per pay period toward repayment of the debt. In addition, the Debt Collection Improvement Act of 1996 permits the Department to garnish up to 15% of disposable pay.”). Nor are student loans ordinarily dischargeable in bankruptcy. 11 U.S.C. § 523(a)(8) (2012). 231. 31 U.S.C. § 3716(C)(3)(A)(I) (2012). 232. See Janet Lorin, Yale Suing Former Students Shows Crisis in Loans to Poor, BLOOMBERG.COM (Feb. 4, 2013), http://www.bloomberg.com/news/2013-02-05/yale-suing-former-students-shows-crisis-in-loans-to-poor.html (“While no one tracks the number of lawsuits, students defaulted on $964 million in Perkins loans in the year ended June 2011, 20 percent more than five years earlier, government data show. Unlike most student loans—distributed and collected by the fed-eral government—Perkins loans are administered by colleges, which use repayment money to lend to other poor students.”). 233. The United States filed less than 3000 suits per fiscal year to recover on student loans from 2003 to 2010. In 2011, the United States filed 4312 such suits. The number dropped to 2646 in 2012. 234. Hadfield, supra note 69, at 713 n.10. 235. See supra text accompanying note 32.

MOORE.DOCX (DO NOT DELETE) 5/22/2015 9:51 AM
No. 3] CIVIL CASELOAD 1229
2. Increases in Amount-in-Controversy Requirement for Diversity Jurisdiction
By far, the most common basis for federal subject matter jurisdic-tion over a non-“recovery” contract action is diversity.236 Thus, a small part of the decline in contract filings from 1986 to 2012 may be attributa-ble to increases in the amount-in-controversy requirement for diversity jurisdiction, from $10,000 to $50,000 in 1989,237 and then to $75,000 in 1997.238
Diversity contract filings did fall by about one-third from 32,835 in 1989 to 22,901 in 1990 when the amount-in-controversy requirement was raised to $50,000.239 But the decline in diversity contract filings when the requirement was raised to $75,000 was very slight, going from 21,652 in 1997 to 20,363 in 1998.240 In fact, neither the Annual Report for 1997 or 1998 even mentions the increase in the amount-in-controversy requirement.241
3. Other Venues
Another obvious possible cause of the decline in contract cases is the rise of arbitration, both voluntary and involuntary. In noting the de-cline in civil trials, some of the Annual Reports speculate that the rise in arbitration clauses and the courts’ willingness to enforce them may have contributed to the decline in trials.242 But an arbitration clause in a con-tract should prevent the filing of a suit at all, not just a trial.
Galanter, writing in 2001, observed the decline that had occurred in contract filings since his 1988 “Big Six” article.243 He considered as one possible cause “the diversion of potential contract cases into arbitration or other ‘alternative dispute resolution.’”244 But at the time, he concluded that there was “no direct indication that diversion to ADR (alternative
236. For example, 67% of nonrecovery contract cases were brought in diversity in 1986, rising to 80% of nonrecovery contract cases in 2012. 1986 ANNUAL REPORT, supra note 23, at 175 tbl.C-2 (not-ing that 31,702 of 47,528 nonrecovery contract actions were filed in diversity); 2012 ANNUAL REPORT, supra note 18, at tbl.C-2 (noting that 20,334 of 25,434 nonrecovery contract actions were filed in diver-sity). 237. Pub. L. No. 100-702, § 201(a), 102 Stat. 4642 (1988); see 1990 ANNUAL REPORT, supra note 16, at 8 (“Diversity filings declined by 15 percent (more than 10,000 cases) to 57,183 as a result of the increase in the jurisdictional amount from $10,000 to $50,000 in May 1989.”); id. at tbl.C2 (there were 22,901 contract actions brought under diversity jurisdiction in 1990). 238. Pub. L. No. 104-317, § 205(a)(1), 110 Stat. 3847 (1996) (codified at 28 U.S.C. § 1332(a) (2012)). 239. ADMIN. OFFICE OF THE U.S. COURTS, JUDICIAL BUSINESS OF THE UNITED STATES COURTS: 1989 ANNUAL REPORT OF THE DIRECTOR tbl.C-2 (1990); 1990 ANNUAL REPORT, supra note 16, at tbl.C-2. 240. 1997 ANNUAL REPORT, supra note 44, at tbl.C-2; 1998 ANNUAL REPORT, supra note 19, at tbl.C-2. 241. See generally 1997 ANNUAL REPORT, supra note 44; 1998 ANNUAL REPORT, supra note 19. 242. See, e.g., 2000 ANNUAL REPORT, supra note 144, at 25. 243. Marc Galanter, Contract in Court; or Almost Everything You May or May Not Want to Know About Contract Litigation, 2001 WIS. L. REV. 577, 586 (2001). 244. Id.
MOORE.DOCX (DO NOT DELETE) 5/22/2015 9:51 AM
1230 UNIVERSITY OF ILLINOIS LAW REVIEW [Vol. 2015
dispute resolution) is responsible for declining caseloads.”245 Indeed, court-annexed arbitration, created in 1989,246 declined over the next dec-ade, and some district courts discontinued their arbitration programs.247 Other researchers, however, have not been as reticent to link the decline in contract filings to mandatory arbitration clauses.248
Evaluating the effect of arbitrations on contract filings is difficult, in part due to a scarcity of relevant data.249 It is much more difficult to gath-er data about the number of arbitrations, or other privatized dispute mechanisms, in the United States, than it is to gather data about the number of civil case filings.250 As Judith Resnik has noted, “the major in-stitutions of the bench and bar” have devoted many more resources to gathering information about courts than about agencies or private dis-pute resolution centers.251 There is some indication, however, that the docket of the American Arbitration Association has grown steadily since 1960.252
In addition, depending on the state, businesses may prefer to con-duct their contract litigation in state court. In particular, at least seven-teen populous states have created “special court divisions to handle ‘complex litigation,’ ‘business litigation,’ or ‘commercial litigation.’”253 Such courts were created in part as an attractive alternative to federal court.254 The volume of cases handled by these courts is unclear, because caseloads statistics for these complex litigation courts are not publicly available.255
245. Id. at 586–87. 246. 2004 ANNUAL REPORT, supra note 19, at 17. 247. Id. at 18. 248. See, e.g., Charles L. Knapp, Taking Contracts Private: The Quiet Revolution in Contract Law, 71 FORDHAM L. REV. 761, 763 (2002); Brian J. Ostrom & Thomas B. Marvell, The Collapse in Con-tract Case Filings Since 1991, 17 JUST. SYS. J. 221, 223 (1994) (reporting an average decline of 30% in contract filings from 1991 to 1994 for seventeen states reporting such data). 249. Consumer contracts increasingly contain mandatory arbitration clauses, and studying the rate of these filings might have shed some light, but the AO did not report Consumer Credit cases separately until 2008. 250. E.g., Galanter, supra note 46, at 514 (“Data on the caseload of these free-standing [arbitra-tion] forums [such as the American Arbitration Association] is elusive.”). 251. Judith Resnik, Migrating, Morphing, and Vanishing: The Empirical and Normative Puzzles of Declining Trial Rates in Courts, 1 J. EMPIRICAL LEGAL STUD. 783, 785 (2004). 252. Galanter, supra note 46, at 515. 253. See Moore, supra note 15, at 173–75; Mitchell L. Bach & Lee Applebaum, A History of the Creation and Jurisdiction of Business Courts in the Last Decade, 60 BUS. LAW. 147, 151 (2004); Sen. Ember Reichgott Junge, Business Courts: Efficient Justice or Two-Tiered Elitism?, 24 WM. MITCHELL
L. REV. 315, 315 (1998). 254. See, e.g., JUSTICES OF THE COMMERCIAL DIV. OF THE SUPREME COURT OF THE STATE N.Y., COMMERCIAL DIVISION OF THE SUPREME COURT OF THE STATE OF NEW YORK, CELEBRATING A
TWENTY-FIRST CENTURY FORUM FOR THE RESOLUTION OF BUSINESS DISPUTES 3–4 (2006), available at http://www.courts.state.ny.us/courts/comdiv/PDFs/ComDiv-Jan06.pdf (noting that a stated purpose of New York’s Commercial Division was to discourage businesses from “resorting to other forums—the federal courts, Delaware, private ADR—to avoid New York’s overburdened state court system”). 255. Moore, supra note 15, at 174 n.233.
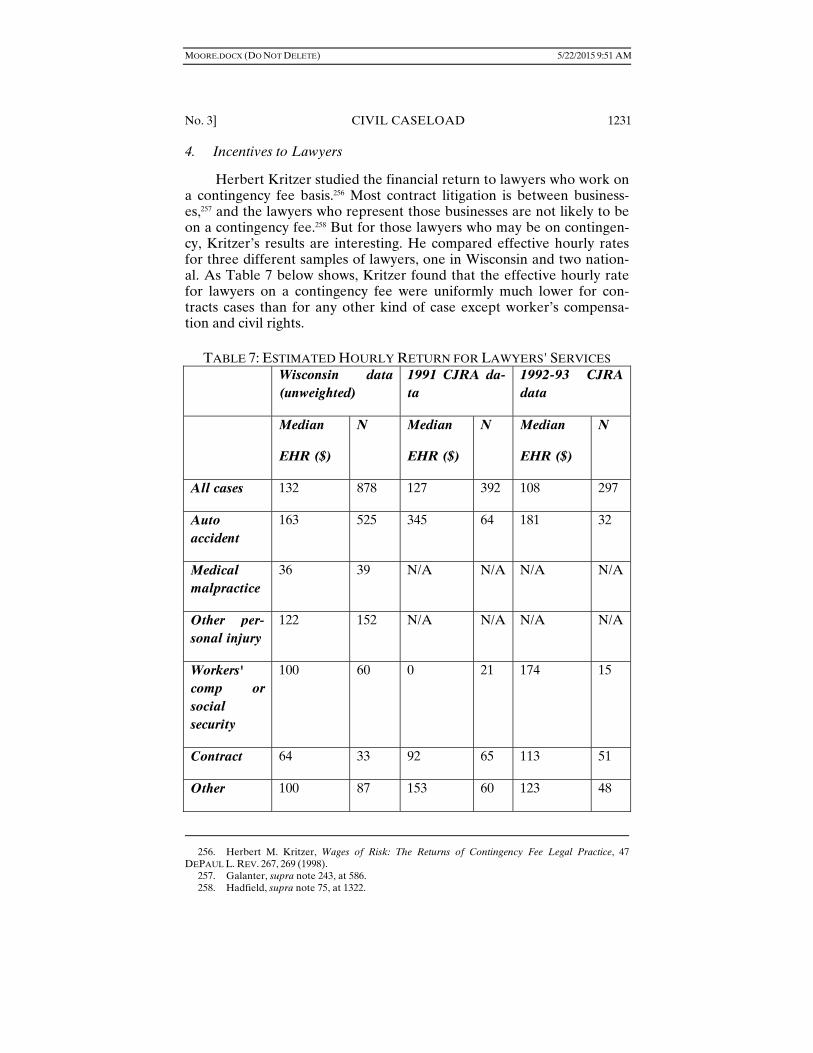
MOORE.DOCX (DO NOT DELETE) 5/22/2015 9:51 AM
No. 3] CIVIL CASELOAD 1231
4. Incentives to Lawyers
Herbert Kritzer studied the financial return to lawyers who work on a contingency fee basis.256 Most contract litigation is between business-es,257 and the lawyers who represent those businesses are not likely to be on a contingency fee.258 But for those lawyers who may be on contingen-cy, Kritzer’s results are interesting. He compared effective hourly rates for three different samples of lawyers, one in Wisconsin and two nation-al. As Table 7 below shows, Kritzer found that the effective hourly rate for lawyers on a contingency fee were uniformly much lower for con-tracts cases than for any other kind of case except worker’s compensa-tion and civil rights.
TABLE 7: ESTIMATED HOURLY RETURN FOR LAWYERS' SERVICES
Wisconsin data (unweighted)
1991 CJRA da-ta
1992-93 CJRA data
Median
EHR ($)
N Median
EHR ($)
N Median
EHR ($)
N
All cases 132 878 127 392 108 297
Auto accident
163 525 345 64 181 32
Medical malpractice
36 39 N/A N/A N/A N/A
Other per-sonal injury
122 152 N/A N/A N/A N/A
Workers' comp or social security
100 60 0 21 174 15
Contract 64 33 92 65 113 51
Other 100 87 153 60 123 48
256. Herbert M. Kritzer, Wages of Risk: The Returns of Contingency Fee Legal Practice, 47 DEPAUL L. REV. 267, 269 (1998). 257. Galanter, supra note 243, at 586. 258. Hadfield, supra note 75, at 1322.

MOORE.DOCX (DO NOT DELETE) 5/22/2015 9:51 AM
1232 UNIVERSITY OF ILLINOIS LAW REVIEW [Vol. 2015
Product liability
N/A N/A 156 42 233 25
Other tort N/A N/A 165 83 92 47
Civil rights N/A N/A 49 52 58 69
SOURCE: Constructed from Tables 6.2a, 6.5a, and 6.5b in HERBERT M. KRITZER, RISKS, REPUTATIONS, AND REWARDS: CONTINGENCY FEE LEGAL PRACTICE IN THE UNITED STATES 192, 214, 216 (2004).
5. Other Possible Reasons for the Decline in Contract Cases
Galanter rejected the notion that there had been a decrease in “un-derlying transactional activity.”259 The continuing rise in real GDP per capita bears this out. Instead, Galanter postulated that businesses had developed structural changes in their business practices that reduced the necessity for litigation.260 Another scholar theorized that “cost barriers to litigation create a freedom from contract” leading to decreased contract lawsuits.261 In addition, a recent study concluded that businesses are be-coming increasingly sophisticated in bargaining for arbitration in certain situations but maintaining the ability to file a lawsuit in others.262
Hadfield found that organizations, not individuals, were more likely to be the plaintiffs in contract cases.263 In turn, she estimated that the per-centage of cases brought by individual plaintiffs, as opposed to organiza-tional plaintiffs, had increased substantially from 1970 to 2000.264 Thus, as the percentage of cases in federal court in which an individual is the plaintiff increases, the percentage of contract filings is likely to decline.
Although the overall filings trend has been unmistakably downward for the past twenty years, there was an upswing in contract filings from 2006 to 2009. This was partly attributable to the more than 5000 insur-ance contract filings following Hurricane Katrina in August 2005, mostly in the Eastern District of Louisiana.265 More generally, insurance contract
259. Galanter, supra note 243, at 590. 260. Id. See also MARC GALANTER & JOEL ROGERS, A TRANSFORMATION OF AMERICAN
BUSINESS DISPUTING? SOME PRELIMINARY OBSERVATIONS (1991); Ross E. Cheit & Jacob E. Gerson, When Businesses Sue Each Other: An Empirical Study of State Court Litigation, 25 L. & SOC. INQUIRY 789 (2000). 261. Stewart Macaulay, Freedom from Contract: Solutions in Search of a Problem?, 2004 WIS. L. REV. 777, 778; see also Stewart Macaulay, Almost Everything That I Did Want to Know About Con-tract Litigation: A Comment on Galanter, 2001 WIS. L. REV. 629. 262. Erin O’Hara O’Connor & Christopher R. Drahozal, Carve-Outs and Contractual Procedure (Vanderbilt Univ. Law Sch. Pub. Law & Legal Theory Working Paper No. 13–29, 2013), http://papers. ssrn.com/sol3/papers.cfm?abstract_id=2279520. 263. Hadfield, supra note 75, at 1302. 264. Id. at 1298, 1304. She excluded prisoner petitions and recovery cases from her calculations. 265. See 2007 ANNUAL REPORT, supra note 77, at 29; 2005 ANNUAL REPORT, supra note 126, at 13.

MOORE.DOCX (DO NOT DELETE) 5/22/2015 9:51 AM
No. 3] CIVIL CASELOAD 1233
filings are the only subcategory of contract filings that has slightly in-creased since 1986, from 7558 in 1986 to 10,569 in 2013.266
E. Labor Cases
Cases that the AO classifies as “Labor” cases include cases under the Labor-Management Relations Act (“LMRA”), the Labor-Management Disclosure Reporting Act (“LMDRA”), the Fair Labor Standards Act (“FLSA”), and the Employees Retirement Income Security Act (“ERISA”).267 As Table 5 above shows, labor cases as a whole have risen from 5% of civil filings in 1986 to 6% of civil filings in 2013, thus bumping labor cases into sixth place in the “Big Six.” The growth of labor cases overall, however, is due entirely to the growth of FLSA cases. All other major categories of labor cases have declined since 1986.
FIGURE 13: NUMBER OF LABOR CASE FILINGS, 1986–2012
SOURCE: Table C-2.
One can speculate as to why most labor filings have been declining, while FLSA filings have been increasing. Labor unions have been in de-
266. Other subcategories of contract actions (excluding “recovery” contracts) classified by the AO are Franchise (which has only been categorized separately since 2008), Marine, Miller Act, Nego-tiable instruments, and “Other.” 267. 2007 ANNUAL REPORT, supra note 77, at 64.
050
0010
000
1500
020
000
Num
ber
of c
ase
filin
gs
1985 1990 1995 2000 2005 2010
Labor total FLSALMRA ERISA
MOORE.DOCX (DO NOT DELETE) 5/22/2015 9:51 AM
1234 UNIVERSITY OF ILLINOIS LAW REVIEW [Vol. 2015
cline nationwide,268 while some have asserted a perception of judicial hos-tility towards labor cases.269 ERISA plaintiffs, in particular, have experi-enced increasing difficulty obtaining full compensatory (or any) reme-dies.270 In addition, many companies are outsourcing jobs outside of the United States,271 while inside the United States, they are hiring more temporary workers.272 Foreign workers and temporary workers are likely to have fewer grounds or opportunities to sue their employers in U.S. courts under the labor laws.
Thus, the percentage of labor cases that are LMRA, LMDRA, and ERISA cases has been declining. LMRA cases constituted 29% of labor cases in 1986, but only 6% of labor cases in 2012. ERISA cases constitut-ed 64% of labor cases in 1995, but only 43% of labor cases in 2012. LMRDA cases, 2% of labor cases in 1986, have shrunk to less than 1% of labor cases in 2012. The number of labor cases brought by the United States as plaintiff has also shrunk, from 1006 cases in 1990 to 384 cases in 2012.
The only category of labor cases that has been growing is FLSA cases.273 FLSA cases accounted for only 12% of labor cases in 1986, but 42% of labor cases in 2012. FLSA cases have also been a rising percent-age of class action filings (although they are “opt-in” classes rather than “opt-out” classes).274 Interestingly, however, the AO downgraded the weight of an FLSA case from a case weight of 2.12 under the 1993 weights275 to 1.02 under the current weights.276
Perhaps as the relative value of the minimum wage falls,277 these cases are filed more often. But several recent federal decisions have
268. E.g., John S. Ahlquist & Margaret Levi, The Decline of Union Membership and What It Means for Politics, WASH. POST, Oct. 24, 2013, http://www.washingtonpost.com/blogs/monkey-cage/ wp/2013/10/24/the-decline-of-union-membership-and-what-it-means-for-politics/. 269. James J. Brudney et al., Judicial Hostility Toward Labor Unions? Applying the Social Back-ground Model to a Celebrated Concern, 60 OHIO ST. L.J. 1675, 1677 (1999). 270. See Thomas P. Kelly III, A Call For the Overhaul of ERISA: How the Employee Retirement Income Security Act of 1974 Rewards Employers for Bad Faith Denials of Legitimate Claims for Em-ployee Disability Benefits: A Multi-Case Study Involving One Philadelphia-Based Insurance Carrier, 37 SETON HALL LEGIS. J. 283, 287 (2013). 271. The Wall Street Journal surveyed employment data by some of the nation’s largest corpora-tions—General Electric, Caterpillar, Microsoft, Wal-Mart, Chevron, Cisco, Intel, Stanley Works, Merck, United Technologies, and Oracle—and found that they cut their workforces by 2.9 million people over the last decade while hiring 2.4 million people overseas. David Wessel, Big U.S. Firms Shift Hiring Abroad—Data Show Work Forces Shrinking at Home, Sharpening Debate on the Impact of Globalization, WALL ST. J., Apr. 19, 2011, http://online.wsj.com/article/SB100014240527487048 21704576270783611823972.html. 272. US Companies Increasingly Turning to Temporary Workers to Fill Positions, FOXNEWS.COM
(July 8, 2013), http://www.foxnews.com/us/2013/07/08/us-companies-increasingly-turning-to-temporary -workers-to-fill-positions/#ixzz2bWnw1TMc. 273. E.g., 2007 ANNUAL REPORT, supra note 77, at 24 (labor cases grew 13% largely because of more than 2,400 cases filed in the Northern District of Alabama under the FLSA); 2010 ANNUAL
REPORT, supra note 78, at 21. 274. Moore, supra note 15, at 171 tbl.4. 275. 2002 ANNUAL REPORT, supra note 58, at 25. 276. Appendix Z, supra note 62, at Attachment 2. 277. James Surowiecki, The Pay is Too Damn Low, NEW YORKER (Aug. 2013), available at http://www.newyorker.com/magazine/2013/08/12/the-pay-is-too-damn-low (stating today's hourly min-
MOORE.DOCX (DO NOT DELETE) 5/22/2015 9:51 AM
No. 3] CIVIL CASELOAD 1235
made it more difficult for plaintiffs to bring FLSA cases as collective ac-tions.278 It remains to be seen whether those decisions will negatively af-fect the filing rate of FLSA cases.
V. CONCLUSION
Much of the acrimonious discussion about the civil justice system continues to proceed without any seeming awareness of the mountain of official federal caseload statistics that might be relevant to the debate. One does not need to be a statistician or have access to massive govern-ment databases to unearth some startling trends in the civil caseload of the federal district courts.
First, the number of new civil cases filed since 1986 has increased a mere 9%. Second, the number of weighted civil filings per authorized district court judge has increased only 6% since 1986. During this same time period, the judicial resources available to oversee these cases have increased much more than these small upticks in filings. Authorized dis-trict court judgeships have increased 18%, senior judges have increased 127%, and magistrate judge positions have increased 23%.
Third, the median disposition time for civil cases has not dramatical-ly spiked since 1986: it has hovered around eight months for the past twenty-seven years. Any increase in the overall congestion of the district courts has been caused by increases in the criminal, not the civil, docket.
In his continuing exploration of the “vanishing trial” (the rapidly declining number and percentage of cases that are adjudicated at trial), Galanter attributed part of the cause of the vanishing trial to “the turn against law”:
[T]he recent sharp drop [in trials] is a component and reflection of a massive shift in legal culture that itself reflects other developments within the legal system and in the wider society. This shift encom-passes the ascendancy of business within the legal system, as con-sumer of an increasing portion of legal services; the disproportion-ate growth of the ‘corporate hemisphere’ of the legal profession; and the development of think tanks, university programs, and pub-lic interest law firms promoting probusiness policies, including mas-
imum wage of $7.25 “is still well below its 1968 peak (when it was worth about $10.70 an hour in to-day's dollars)”); see CRAIG K. ELWELL, CONG. RESEARCH SERV., R42973, INFLATION AND THE REAL
MINIMUM WAGE: A FACT SHEET 1 (2014), available at http://www.fas.org/sgp/crs/misc/R42973.pdf. 278. See, e.g., Genesis Healthcare Corp. v. Symczyk, 133 S. Ct. 1523, 1532 (2013) (holding that a plaintiff could not continue to pursue a collective action under the Fair Labor Standards Act by refus-ing to accept an offer of judgment under Rule 68 that fully satisfied the plaintiff’s individual claim); Sutherland v. Ernst & Young LLP, 726 F.3d 290, 293 (2d Cir. 2013) (upholding a mandatory arbitra-tion clause that specifically applied to the FLSA and state wage laws, as well as a provision that “dis-putes pertaining to different employees will be heard in separate proceedings”); Acevedo v. Allsup’s Convenience Stores, Inc., 600 F.3d 516, 523 (5th Cir. 2010) (upholding denial of joinder, under Fed. R. Civ. P. 20, of the claims of approximately 800 current and former employees who sought payment of unpaid wages and overtime under the Fair Labor Standards Act).
MOORE.DOCX (DO NOT DELETE) 5/22/2015 9:51 AM
1236 UNIVERSITY OF ILLINOIS LAW REVIEW [Vol. 2015
sive campaigns to reduce the legal obligations of business and to curtail legal remedies for others.279
Galanter’s observations may apply equally to the slowdown in federal civil filings since 1986.
Finally, the proportion of federal plaintiffs that are individuals, ra-ther than organizations, continues to grow. In Professor Galanter’s ter-minology, these are “uphill” cases: they are “typically brought by indi-viduals against organizations, are more frequently contested, take considerably longer, and end with fewer plaintiff victories.”280 Five of the six largest categories of federal civil cases (torts, prisoner, civil rights, la-bor, and Social Security) tend to be such “uphill” cases: the plaintiff is highly likely to be an individual, and the defendant is likely to be a busi-ness or governmental entity.281 Those five categories of cases made up 43% of all federal civil case filings in 1986; they now make up 69%.282
Policy discussions about civil litigation, including whether the dis-covery rules should be narrowed, should explicitly consider the growth in these “uphill” cases and how proposals would impact these cases. The shift since 1986 towards cases brought primarily by individual plaintiffs has highly significant implications for the civil justice system. Despite ris-ing barriers to suit, the growing wealth inequality in the United States may have contributed to the growth of these types of cases.283
Moreover, a disturbing link between the racial disparity in the crim-inal justice system and the increase in civil prisoner petitions and civil rights cases needs further exploration. The criminal docket has over-whelmed the civil docket, but it is civil litigation that has been the target of endless “reform” efforts. “Cost and delay” in the federal district courts, to the extent it exists, could probably be addressed much more
279. Galanter, supra note 88, at 1271–72 (footnotes omitted). 280. Galanter, supra note 243, at 593. In contrast, in “downhill” cases, “the typical plaintiff is an organization but defendants are split, with a slight preponderance of organizational defendants, de-faults are frequent, settlements are somewhat less frequent, disposition comes sooner, trials are quite rare, and plaintiffs have a very high win rate.” Id. Contract cases are the only category in the “Big Six” that tend to be “downhill” cases. 281. See Hadfield, supra note 75, at 1302. 282. See FEDERAL COURT MANAGEMENT STATISTICS, supra note 18, at 1; Galanter, supra note 1, at 925. 283. The index of wealth inequality, the Gini index, for the United States rose from 40.8 in 1997 to 45 in 2007. CENTRAL INTELLIGENCE AGENCY: THE WORK OF A NATION. CENTER OF
INTELLIGENCE, https://www.cia.gov/library/publications/the-world-factbook/geos/us.html. The Central Intelligence Agency explains the Gini index as follows:
This index measures the degree of inequality in the distribution of family income in a country. The index is calculated from the Lorenz curve, in which cumulative family income is plotted against the number of families arranged from the poorest to the richest. . . If income were distrib-uted with perfect equality, . . . the index would be zero; if income were distributed with perfect inequality, . . . the index would be 100.
The World Factbook: Distribution of Family Income, CENTRAL INTELLIGENCE AGENCY THE WORK
OF A NATION. CENTER OF INTELLIGENCE, https://www.cia.gov/library/publications/the-world-factbook/docs/notesanddefs.html?fieldkey=2172&alphaletter=D&term=Distribution%20of%20family%20income%20-%20Gini%20index.

MOORE.DOCX (DO NOT DELETE) 5/22/2015 9:51 AM
No. 3] CIVIL CASELOAD 1237
effectively by curtailing drug and immigration prosecutions.284 We should be highly suspicious of attempts to blame the civil docket, because the consequences of further civil “reforms” will fall on those least able to shoulder them.
284. “Drugs are still the most often prosecuted [crimes] and once again [as in 2011] accounted for 31% of total defendant filings. Defendants charged with immigration offenses constitute 27% of total criminal defendant filings.” 2012 ANNUAL REPORT, supra note 18, at 12. Persons convicted of drug offenses also account for a high percentage of persons under postconviction supervision (also known as probation). E.g., 2007 ANNUAL REPORT, supra note 77, at 36 (45% of persons under supervision had been convicted of drug offenses). Cf. Matt Apuzzo, Holder and Republicans Unite to Soften Sen-tencing Laws, N.Y. TIMES, Mar. 4, 2014, http://www.nytimes.com/2014/03/04/us/politics/holder-and-republicans-unite-to-soften-sentencing-laws.html?.

MOORE.DOCX (DO NOT DELETE) 5/22/2015 9:51 AM
1238 UNIVERSITY OF ILLINOIS LAW REVIEW [Vol. 2015