Embed Size (px)
Citation preview

Cancer Immunol Immunother (2008) 57:289–302
DOI 10.1007/s00262-007-0378-0ORIGINAL ARTICLE
The CIMT-monitoring panel: a two-step approach to harmonize the enumeration of antigen-speciWc CD8+ T lymphocytes by structural and functional assays
C. M. Britten · C. Gouttefangeas · M. J. P. Welters · G. Pawelec · S. Koch · C. Ottensmeier · A. Mander · S. Walter · A. Paschen · J. Müller-Berghaus · I. Haas · A. Mackensen · T. Køllgaard · P. thor Straten · M. Schmitt · K. Giannopoulos · R. Maier · H. Veelken · C. Bertinetti · A. Konur · C. Huber · S. StevanoviT · T. Wölfel · S. H. van der Burg
Received: 2 April 2007 / Accepted: 17 July 2007 / Published online: 25 August 2007© Springer-Verlag 2007
Abstract The interpretation of the results obtained fromimmunomonitoring of clinical trials is a diYcult task due tothe variety of methods and protocols available to detectvaccine-speciWc T-cell responses. This heterogeneity aswell as the lack of standards has led to signiWcant scepti-cism towards published results. In February 2005, a work-ing group was therefore founded under the aegis of theAssociation for Immunotherapy of Cancer (“CIMT”) inorder to compare techniques and protocols applied for the
enumeration of antigen-speciWc T-cell responses. Here wepresent the results from two consecutive phases of an inter-national inter-laboratory testing project referred to as the“CIMT monitoring panel”. A total of 13 centers from sixEuropean countries participated in the study in which pre-tested PBMC samples, synthetic peptides and PE-conjugatedHLA-tetramers were prepared centrally and distributed toparticipants. All were asked to determine the number ofantigen-speciWc T-cells in each sample using tetramerstaining and one functional assay. The results of the Wrsttesting round revealed that the total number of cells ana-lyzed was the most important determinant for the sensitivedetection of antigen-speciWc CD8+ T-cells by tetramerstaining. Analysis by ELISPOT was inXuenced by a combi-nation of cell number and a resting phase after thawing ofperipheral blood mononuclear cells. Therefore, the experi-ments were repeated in a second phase but now the partici-pants were asked to change their protocols according to thenew guidelines distilled from the results of the Wrst phase.
C. M. Britten and C. Gouttefangeas contributed equally to this work. This manuscript is published in association with the original article “Results and Harmonization Guidelines from two large-scale international Elispot proWciency panels conducted by the Cancer Vaccine Consortium (CVC/SVI)” by S. Janetzki et al. and a commentary by C. M. Britten, S. Janetzki et al.: “Toward the harmonization of immune monitoring in clinical trials-Quo vadis?”.
Electronic supplementary material The online version of this article (doi:10.1007/s00262-007-0378-0) contains supplementary material, which is available to authorized users.
C. M. Britten (&) · M. J. P. WeltersDepartment of Immunohaematology and Blood Transfusion, Leiden University Medical Center, Leiden, The Netherlandse-mail: [email protected]
C. Gouttefangeas (&) · S. StevanoviTDepartment of Immunology, University of Tuebingen, Tuebingen, Germanye-mail: [email protected]
G. Pawelec · S. KochCentre for Medical Research, University of Tuebingen, Tuebingen, Germany
C. Ottensmeier · A. ManderCancer Sciences Division, Southampton University Hospitals, Southampton, UK
S. WalterImmatics Biotechnologies, Tuebingen, Germany
A. PaschenSkin Cancer Unit of the German Cancer Research Centre, University Clinics of Mannheim, Mannheim, Germany
J. Müller-BerghausPaul-Ehrlich-Institute, Langen, Germany
I. Haas · A. MackensenDepartment of Haematology and Oncology, University of Regensburg, Regensburg, Germany
T. Køllgaard · P. thor StratenDepartment of Haematology, Centre for Cancer Immune Therapy, Herlev, Denmark
123

290 Cancer Immunol Immunother (2008) 57:289–302
The recommendations improved the number of antigen-speciWc T-cell responses that were detected and decreasedthe variability between the laboratories. We conclude that atwo-step approach in inter-laboratory testing allows theidentiWcation of distinct variables that inXuence the sensi-tivity of diVerent T-cell assays and to formally show that adeWned correction to the protocols successfully increasesthe sensitivity and reduces the inter-center variability. Such“two-step” inter-laboratory projects could deWne rationalbases for accepted international guidelines and thereby leadto the harmonization of the techniques used for immunemonitoring.
Keywords ELISPOT · Tetramer · Standardization · Interlaboratory testing
AbbreviationsAPC Antigen presenting cellELISPOT Enzyme linked immuno spotPBMC Peripheral blood mononuclear cellsIFN� Interferon gammaICS Intracellular cytokine stainingND Not determined
Introduction
In the last two decades, more than 200 clinical trials ofdiVerent anti-tumor vaccines aiming to induce tumor-spe-ciWc immunity in cancer patients have been described [1].Most of these trials primarily assessed safety and immuno-genicity while reporting partial or complete clinicalresponses in a minority of patients [2, 3]. Despite the fact
that the low fraction of clinical responders still precludesthe establishment of a direct correlation between clinicaleYcacy and T-cell reactivity, it has become clear from ani-mal models and clinical observations that naturally-occur-ring or vaccine-induced CD8+ or CD4+ T-cells play animportant role in the control and regression of tumors [4–9]. Therefore, the number of subjects that mount a vaccine-induced T-cell response as well as the strength of a detectedT-cell response represent important surrogate markers forvaccine eYcacy. The enzyme-linked immunospot (ELI-SPOT) assay [10, 11], staining with HLA-peptide multi-mers [12] and intracellular cytokine staining (ICS) [13, 14]are technologies used commonly for the monitoring of anti-gen-speciWc immune responses. For these three assays, ahuge variety of diVerent protocols are available worldwide.This heterogeneity, together with the fact that the sensitiv-ity of the individual protocols can vary signiWcantly, makesa comparison of the results obtained in diVerent trials adiYcult task. Moreover, an increasing number of new tech-nologies are constantly being introduced to the Weld, whichmakes interpretations even more complex [15–25].
Current data and opinion support the use of a functionalassay like the ELISPOT or ICS in combination with a phe-notyping assay like HLA-multimers [26, 27], but recog-nized international standards for all these methodologiesare still lacking.
The main aim of the “CIMT monitoring panel” is to har-monize and optimize the monitoring of antigen-speciWcT-cells among the participating laboratories, based onobjective rationales with respect to the testing procedure,the analysis and the interpretation of results. Importantrequirements for an immunological test are sensitivity,applicability to large amounts of clinical material and feasi-bility at reasonable cost. The results generated by the testsshould be reproducible and sensitive, independently of theplace where they have been performed. After the Wrst meet-ing of the working group, a series of inter-laboratory testingprojects was initiated, in which individual laboratoriescould compare their performance, express their needs andexchange experience in order to improve their local assays.Here we report the results of the Wrst two phases of theCIMT monitoring panel, with 13 participating centers fromsix European countries.
Materials and methods
Preparation and screening of PBMC samples
BuVy coats from HLA-typed healthy volunteers werekindly provided from the Blood Bank of the UniversityMainz. HCMV sero-status was known. PBMC were iso-lated by Ficoll density gradient separation (Pharmacia,
M. SchmittThird Department of Internal Medicine, University of Ulm, Ulm, Germany
K. GiannopoulosClinical Immunology Department, Medical University of Lublin, Lublin, Poland
R. MaierResearch Department, Kantonal Hospital St Gallen, St Gallen, Switzerland
H. Veelken · C. BertinettiDepartment of Haematology and Oncology, Freiburg University Medical Centre, Freiburg, Germany
A. Konur · C. Huber · T. WölfelThird Medical Department, University Mainz, Mainz, Germany
S. H. van der Burg (&)Department of Clinical Oncology, Leiden University Medical Center, Leiden, The Netherlandse-mail: [email protected]
123

Cancer Immunol Immunother (2008) 57:289–302 291
Uppsala, Sweden), washed two times in RPMI 1640(GIBCO BRL, Grand Island, NY, USA) containing 10 mMHepes buVer, L-arginine (116 mg/ml), L-glutamine (216 mg/ml), penicillin (10 IU/ml), streptomycin (100 mg/ml) and10% FCS (GIBCO BRL), counted and frozen at 10 to20 £ 106 cells per cryovial in 1 ml of FCS 90% + DMSO10% at ¡80°C in freezing-boxes Wlled with iso-propanol.After 20 h, all cryovials were transferred to liquid nitrogenand stored until distribution to the participating laboratories.
Pre-screening and selection of the PBMC donors forinXuenza- and CMV- T-cell reactivities were performed bya central lab using the IFN� ELISPOT assay following alocal protocol as described previously [38]. Five donorswere selected for the Wrst phase of the panel and eight forthe second phase. One HLA-A*0201-negative donor wasincluded in each phase (negative control), all other sampleswere HLA-A*0201-positive.
Synthetic peptides and HLA-tetramers
Peptides were synthesized using standard Fmoc chemistry,dissolved at 10 mg/ml in DMSO, aliquotted and stored at¡80°C. The purity was checked by reverse-phase HPLCand was found to be >80%. Two known HLA-A*0201 T-cell epitopes were used: inXuenza MP 58–66 GILGFVFTLand HCMV pp65 495–503 NLVPMVATV (http://www.syfpeithi.de). Biotinylated recombinant HLA-A*0201monomers folded with the inXuenza MP 58–66 or theHMCV pp65 peptides were produced essentially asdescribed, puriWed by gel Wltration and stored as aliquots at¡80°C [12]. Fluorescent multimers were obtained by incu-bation with streptavidin-PE (Molecular Probes, Leiden,The Netherlands), then frozen as aliquots after addition of0.5% BSA and 16% glycerol. HLA-concentrations of inXu-enza-tetramer and HCMV-tetramers were 700 and 350 �g/ml, respectively. Both tetramers were checked by HPLCand/or validated by staining of a speciWc CD8+ T-cell line(InXuenza) or PBMC from HLA-A2-negative and HLA-A2-positive CMV seronegative donors (CMV). Such tetra-mers are stable at 4°C for at least 1 month (personal obser-vation) and participants were asked to perform all testswithin this time period.
Participating centers
Twelve centers from Wve European countries participatedin the Wrst phase of the monitoring panel. As one of theinvestigators moved to another institution during the studya 13th center from a 6th European country was added to thegroup in the second phase of the panel. Participation in thepanel was open to all interested laboratories with a focus onT-cell monitoring, independently of membership in theAssociation for Immunotherapy of Cancer.
Reagent distribution and assay guidelines
Coded PBMC samples, synthetic peptides and HLA-A*0201 tetramers were shipped on dry ice to the partici-pants. Additionally, guidelines for the two T-cell assayswere distributed for each phase:
Phase I/2005. A protocol for tetramer staining wasincluded. BrieXy, 1 £ 106 PBMC per test were transferreddirectly after thawing into one well of a 96 well u-bottomplate and washed in FACS buVer consisting of PBS, 2%FCS, 2 mM EDTA, 0.02% azide. Incubation with 5 �g/mlHLA-tetramer was then performed in FACS buVer with50% FCS for 30 min at room temperature in the dark. Afterone wash in FACS buVer, mAb for T-cell staining wereadded for 20 min at 4°C. Finally, cells were washed twicebefore Wxing in FACS buVer containing 1% formaldehydesolution. Three mAb combinations were proposed, CD8alone, CD3 plus CD8, or CD4 plus CD8. Each lab couldchoose here the antibody clones, Xuorescent dye and con-centrations used. Stainings were performed in duplicate.
For the functional assays, synthetic peptides were dilutedat 1 mg/ml in PBS as a stock solution. Concentrations infurther tests were 1–10 �g/ml, left to the choice of the par-ticipants. There were no recommendation which functionaltest should be performed, so that each group could choosethe test either routinely used, or to be implemented for itsown needs. In this Wrst phase, 11/12 laboratories chose theIFN� ELISPOT assay, one lab (Z10) a FACS-based intra-cellular IFN� staining and one lab performed both assays(Z7). Spot counting was performed locally.
Phase II/2006. Following the results obtained in the Wrsttesting phase, requirements were introduced and partici-pants were asked to apply exactly these new criteria (twofor the tetramer staining, and four for the ELISPOT, see“Results” section). The assay guidelines were modiWedaccordingly. However, in order to reduce the variability inthe FACS analysis of the 13 laboratories, a Wgure showingexemplary dot-plots, settings of gates and quadrants, andstatistical analysis was provided. All laboratories were nowrequired to perform an IFN� ELISPOT as the functionaltest, with a Wxed peptide concentration of 1 �g/ml. Partici-pants were encouraged to use a distributed model protocolbut were allowed to use their local protocol, provided thatthey applied the four new requirements introduced in thesecond phase.
Collection and analysis of results
After performing the required tests in each phase, partici-pants returned a completed report form containing all rele-vant information. Number of cells recovered after thawingwas included to assess viability after transport. For thetetramer staining experiments, mAb clone, manufacturer,
123

292 Cancer Immunol Immunother (2008) 57:289–302
amount, cytometer type and number of lymphocytes and/orCD8+ cells analyzed were noted. Results were expressed aspercentage of tetramer-positive cells among CD8+,CD3+CD8+, or CD4¡ lymphocytes, depending on whichmAb combination was used for the staining. Additionally,FACS dot-plots containing all gates, quadrants and deducedstatistical analysis were collected. For the functional test,medium and thawing procedure (e.g. addition of DNAse, ofa resting phase, etc.) had to be described, as well as the num-ber of cells per test, the antibodies used (clone, manufacturer,concentration), the Wnal peptide concentration and the incu-bation times. For the ELISPOT assay, the type of plate, theenzymatic visualization system and the spot reader were alsonoted. Absolute spot numbers were given by each partici-pant, and Wlter plates were kept for possible second analysis.
All results from both phases were collected and centrallyanalyzed. For the tetramer stainings, the number of lympho-cytes, number of CD8+ T-cells and frequencies of tetramer-positive cells were calculated on the basis of the stainingsand statistics provided by the participants. Apart from thesecalculated frequencies, a “visual evaluation” was necessary(see “Results”). For the ELISPOT, analysis was performedbased on the spot numbers reported by the participants, fol-lowed by a student t test. Results were accepted as positivereaction only when the numbers of antigen-speciWc spotsexceeded the number of spots in the background wells byatleast a factor two. The coeYcients of variation (CV) werecalculated for all results (CV = SD/mean £ 100) and areshown in supplementary Tables S1a, b.
The raw data from both panel phases will be provided tointerested readers upon request.
Results
Phase I/2005 of the interlaboratory testing project—general aspects
Coded PBMC samples from four HLA-A*0201-positiveand one HLA-A*0201-negative healthy donor (D1–D5)were included in this Wrst testing phase. The thawing proce-dure for PBMC samples in the test centers was not stan-dardized and the recovery of viable cells varied greatlybetween 45 and 102% (mean 73%) in the 12 labs. However,the number of cells recovered was in all cases suYcient toperform the required analyses. When all the data from thetetramer staining and functional tests were combined itbecame clear that subjects D1 and D5 had responded to theHLA-A*0201 restricted CMV-derived peptide, consistentwith their CMV seropositive-status, and that subjects D1,D2, D3, and D5 had responded to inXuenza. In total, eachlaboratory should in theory have been able to measure sixpositive (2£ CMV and 4£ inXuenza) responses.
Detection of antigen-speciWc T-cells by tetramer staining and IFN� ELISPOT
The protocol required that all PBMC samples should beanalyzed by the 12 participants for the presence of HLA-A*0201-restricted CMV-speciWc and inXuenza-speciWc CD8+
T-cells using centrally-prepared tetramers. The indicatedfrequencies of antigen-speciWc CD8+ cells generally representthe mean of two separate stainings with CD3 Ab/CD8 Ab/tetramer, except for centers Z1 (CD8/tetramer), Z7 (CD3/CD4/CD8/tetramer), Z5 and Z10 (one staining CD3/CD8/tetramer and one staining CD3/CD4/tetramer) and arebased on the analysis and dot plots provided by each partic-ipant. As illustrated in Fig. 1, the absolute numbers of tetra-mer-positive T-cells were inXuenced by the individualdecision of where to set the gates and quadrant markers forthe analysis. For example, the inclusion of the subset of Tlymphocytes expressing CD8 at a low density inXuencedthe number of CD8+ and consequently the frequency oftetramer+ cells. Moreover, non-speciWc binding of the tetra-mer (as seen on the CD8-negative subset) also variedbetween the diVerent laboratories. For these reasons, notonly the frequencies, but also the appearance of the tetra-mer-positive populations was carefully examined. Twoparameters were chosen for validation of “positive” results:(1) a clustered, but not diVuse, tetramer binding-population,and (2) strong intensity of tetramer staining, especiallymarked for the CMV-tetramer-binding population (Fig. 1).Table 1 shows: (I) the minimum, mean and maximum fre-quencies of antigen-speciWc CD8+ T-cells, (II) the resultsobtained from the individual centers Z1–Z12, and (III) thenumber and percentage of centers that detected a response.The high frequencies of CMV-speciWc CD8+ T-cells indonors D1 and D5 were readily detected by all participants(mean of 1 per 141 CD8 § 113 in D1 and mean of 1 per 80CD8 § 24 in D5, respectively). For inXuenza-speciWcCD8+ T-cells, the results were more variable. InXuenza-tetramer+ cells in donor D3 were detected by allparticipants with a mean frequency of one cell in 1014CD8+ T-cells § 355. In Donor D5, 11 of 12 laboratoriesdetected a mean of one tetramer binding cell per 1106CD8+ T-cells § 508. InXuenza-speciWc cells were lessnumerous in healthy subjects D1 and D2 and were onlydetected by Wve and eight laboratories, respectively. No falsepositive reactivity was reported by any of the participants.
Eleven laboratories analyzed the Wve PBMC samples forthe presence of HLA-A*0201-restricted CMV-speciWc andinXuenza-speciWc IFN�-producing T-cells by ELISPOTassay. Only one group (Z10) used an intracellular cytokinestaining as a functional test (data not shown because nocomparison with other groups possible). Table 2 shows (I)the minimum, mean and maximum frequencies of antigen-speciWc cells, (II) the results obtained from the individual
123

Cancer Immunol Immunother (2008) 57:289–302 293
centers Z1–Z12, and (III) the number and percentage ofcenters that detected each reactivity. As described in the“Materials and methods”, results of spot-forming cells perseeded PBMC were accepted as a positive reaction onlywhen passing statistical testing and when the number ofantigen-speciWc spots exceeded the number of spots in thebackground wells by at least a factor of two. IFN�-producing
cells reactive against CMV were detected by 10 of the 11laboratories in donor D1 (mean reactivity was 1 per 1,855PBMC § 825) but only by 8 of 11 in donor D5 (meanreactivity was 1 per 4,405 PBMC § 3,762). The inXu-enza-speciWc T-cells present in subject D3 were detectedby six laboratories, while the responses in the healthysubjects with markedly lower numbers of peripheral speciWc
Fig. 1 Example of tetramer staining results as provided by fourselected participating centers Z5, Z12, Z8 and Z1. All stainings wereperformed on donor D1 from phase I/2005 who showed reactivity withboth of the tested tetramers. Cells were gated either on the lymphocytepopulation (Z1), or the subsets of CD3+CD8+ (Z5) or CD3+ (Z8, Z12),according to the Ab combination used by each lab. The upper panel
shows results for tests with the CMV-tetramer, the lower panel showsresults for tests with the inXuenza-tetramer. In all dot-plots, the tetra-mer staining is displayed on the y-axis and anti-CD8-staining on the x-axis. Number of counted CD8+ T-cells and percentage of tetramer-pos-itive cells among the CD8 subset are indicated
Table 1 Overview of the tetramer results from phase I/2005 of the CIMT monitoring panel
D1 CMV D1 Flu D2 Flu D3 Flu D5 CMV D5 Flu
Min 448 20,000 6,667 1,818 106 1,786 (I)
Mean 141 8,095 1,909 1,014 80 1,106
Max 35 3,774 526 595 26 588
Z1 129 3,774 635 870 106 758 (II)
Z2 112 – – 1,818 70 1,770
Z3 n.d – – 701 n.d –
Z4 97 – – 854 106 1,342
Z5 161 – – 909 88 606
Z6 139 6,896 1,316 1,000 91 651
Z7 448 20,000 6,667 1,266 82 1,724
Z8 100 5,128 545 595 87 877
Z9 n.d – 1,316 1,274 n.d 1,786
Z10 94 – 2,597 1,360 86 1,439
Z11 99 4,675 1,667 877 58 588
Z12 35 – 526 645 26 625
Detected by 10/10 5/12 8/12 12/12 10/10 11/12 (III)
Detected % 100 42 67 100 100 92
(I) Minimum, mean and maximum frequencies of antigen-speciWc T-cells
(II) Results obtained from the individual centers Z1–Z12. All frequencies are indicated as 1 per x counted CD8+ T-cells
(III) Number and percentage of centers which detected a given reactivity in donors D1, D2, D3 and D5
123

294 Cancer Immunol Immunother (2008) 57:289–302
T-cells (D1, D2 and D5) were detected by three laboratoriesonly.
Subgroup analysis reveals that the number of CD8+ T-lymphocytes analyzed aVects the sensitivity of the tetramer staining
Although the tetramer stainings were performed with cen-trally prepared reagents following set guidelines, centerswere left free to select several parameters according to theirown protocols, and this could have inXuenced the testresults (see “Materials and methods”). Most of the partici-pants used monoclonal antibodies speciWc for CD3 andCD8 to co-stain the cells. There were no obvious diVer-ences in the performance of the centers depending on whichantibody clones, antibody combinations or cytometer wereused (data not shown).
There was a high degree of variability in the numberof CD8+ cells which were analyzed per staining, rangingfrom only 0.5 £ 104 to about 19 £ 104 (inter-center vari-ation). In addition, a non-negligible intra-center varia-tion was observed for the number of counted CD8+. Wetherefore analyzed each individual staining indepen-dently of the center that performed it and focused on thenumber of CD8+ T-cells that had been counted. For the
six diVerent antigen-speciWc populations detectable, atotal of 68 tests was performed by the group (seeTable 1). Overall, antigen-speciWc T-cell reactivitieswere reported in 82% of the tests (56/68, mean of dupli-cate stainings). When less than 30,000 CD8+ T-cellswere counted, only 70% of all responses were found. Incontrast, 89% of all responses were manifest when morethan 30,000 CD8+ T-cells were counted (Fig. 2a). Whenantigen-speciWc T-cells were present at high frequency,the number of cells counted did not inXuence the result,because CMV-speciWc T-cells from donors D1 and D5were detected irrespective of the number of CD8+ T-cells in the test. However, for the inXuenza-speciWccells, positivity was registered in only 75% of all testsperformed (36 of 48 tests). Strikingly, we observed amarked diVerence for the results derived from those testsinvolving less than 30,000 CD8+ T-cells (56% success indetection) as compared to tests performed with morethan 30,000 CD8+ T-cells (84%).
In conclusion, the ability to detect antigen-speciWc T-cellreactivities by tetramer staining was mainly aVected by thenumber of CD8+ T-cells stained and analyzed, especiallywhen the antigen-speciWc T-cells were present at low ormoderate frequencies. We therefore modiWed our guide-lines for the tetramer assay and recommended staining at
Table 2 Overview of the IFN� ELISPOT results from phase I/2005 of the CIMT monitoring panel
(I) Minimum, mean and maximum frequencies of antigen-speciWc cells
(II) Results obtained from the individual centers Z1–Z12. All frequencies are indicated as 1 per x seeded PBMC except for Z6* where it is indicatedas 1 per x seeded CD8+ T-cells
Results from Z6 were not included for calculation of the mean frequency of antigen-speciWc T-cells in D1, D3 and D5
(III) Number and percentage of centers that detected a given response in donors D1, D2, D3 and D5
ND not determined
D1 CMV D1 Flu D2 Flu D3 Flu D5 CMV D5 Flu
Min 3,061 62,500 55,555 33,333 11,428 50,000 (I)
Mean 1,855 38,141 43,589 17,547 4,405 30,811
Max 888 10,256 30,769 8,571 1,039 14,705
Z1 1,006 – – 8,571 – – (II)
Z2 2,439 – – – 2,816 –
Z3 1,295 62,500 – 22,727 1,412 27,727
Z4 1,312 – – 10,909 1,980 –
Z5 – – – – – –
Z6 233* – – 1,960* 253* –
Z7 1,895 10,256 44,444 33,333 11,428 50,000
Z8 3,061 – – – 6,896 –
Z9 888 41,666 55,555 12,195 1,039 14,705
Z10 ND ND ND ND ND ND
Z11 1,769 – 30,769 – – –
Z12 3,030 – – – 5,263 –
Detected by 10/11 3/11 3/11 6/11 8/11 3/11 (III)
Detected % 91 27 27 55 73 27
123
Cancer Immunol Immunother (2008) 57:289–302 295
least 1 £ 106 PBMC and analyzing all cells in the tube. Inaddition, we provided an example of how optimal cell gatesand dot-plot quadrants could be selected.
ELISPOT assays are heterogeneous and require standardization
The ELISPOT analyses were performed according to 11more or less diVerent protocols. The most discernible diVer-ences that were observed in these protocols concerned (1)the diVerent types of multi-screen plates, (2) the serum ori-gin, (3) the use of duplicates, triplicates or quadruplicates,(4) the use of allogeneic APC, (5) the inclusion of a restingphase after thawing the PBMC, (6) the number of PBMCper well, (7) the type of antibodies used, (8) the type ofspot-reader, and the (9) enzyme and substrate for stainingof the spots. Each center also used a diVerent plate protocol(distribution of the wells, number of replicates, controltests).
The inXuence of each of these parameters on the numberof positive responses was studied by further analysis inwhich the laboratories were divided into two subgroups. Asa result, several criteria were identiWed which could help toimprove the sensitivity and comparability of detection.
All data sets (duplicates, triplicates or quadruplicates)were Wrst analyzed by Student t test for unpaired samples(“Materials and methods”). In our panel, one center usedquadruplicates, nine centers used triplicates and one centerperformed the ELISPOT analysis in duplicates. Due to thevariety in the replicates, responses measured by duplicatewells failed to pass the Student t test more often as com-pared to triplicates.
Overall, the 11 centers were able to detect 50% of allpossible reactivities in this panel phase (Table 2; Fig. 2b).In a subgroup of three laboratories (Z5, Z6 and Z8), an allo-geneic APC population (T2 or K562-A*0201 cells) wasadded for binding and presentation of the synthetic pep-tides. The three centers that used allo-APC detected only28% of all responses, while the other centers detected 58%of all responses.
In Wve laboratories (Z3, Z4, Z7, Z8, and Z9) PBMC werethawed, and then incubated in culture medium at 37°C.After this resting phase of 2–20 h, living cells were washed,counted and seeded into ELISPOT plates. Laboratoriesusing a resting phase detected 73% of the positive reactivi-ties (22 out of 30 potentially positive tests). No signiWcantdiVerence in the ability to detect antigen-speciWc T cellswas found using shorter or longer resting-times. In contrast,the laboratories that did not use a resting proceduredetected only 30% of all positives (Fig. 2b).
Finally, the number of cells seeded per well diVered con-siderably between all participants and ranged from 1 to6 £ 105 PBMC. We divided the laboratories arbitrarily intotwo groups, those using either more than 4 £ 105 PBMC(Z4, Z7, Z8, and Z9) or less than 4 £ 105 PBMC (Z1, Z2,Z3, Z11 and Z12). The Wrst group detected 71% of all posi-tive samples, whereas the second group was able to detect
Fig. 2 a Subgroup analysis of tetramer results from phase I/2005.Bars indicate the percentage of positives that could be detected by tet-ramer staining. The Wrst group of bars shows the results for all of thesix detectable positives, the second group shows results from stainingswith the CMV-tetramer and the third group of columns shows resultsfrom stainings with the inXuenza-tetramer. The open bars in eachgroup represent all tests performed, grey bars represent results ob-tained in tests that were performed on more than 3 £ 104 CD8+ T-cellsand black bars represent results obtained in tests that were performedon less than 3 £ 104 CD8+ T-cells. The boxes within each bar indicatethe fraction of tests with a positive result. The asterisk indicates a P-value < 0.05 by Chi-square analysis. b Subgroup analysis of ELISPOTresults from phase I/2005. The bars indicate the percentage of positivereactivities detected by IFN� ELISPOT assays. The open bar showsthe percentage of all reactivities detected by all 11 centers that per-formed the ELISPOT assay as the functional test. Criteria for divisionof centers into two subgroups were based on the following require-ments: do not use allo-APC (Wrst subgroup analysis), use a resting time(second subgroup analysis) or use equal or more than 400,000 PBMCper well (third subgroup analysis). Grey bars always represent centersthat were in conformity with the indicated minimum requirement,black bars show results from centers that did not fulWl that require-ment. The boxes within each column indicate the fraction of centers ineach category. The asterisks indicate a P-value < 0.05 in Chi-squareanalysis
0
01
02
03
04
05
06
07
08
09
00a
b
1%
of
reac
tivi
ties
det
ecte
d
56/6
8
40/4
5
16/2
3
20/2
0
13/1
3
7/7
*
36/4
8
27/3
2
9/16
VMCtcaer tivi sei
azneulfnItcaer tivi sei
llatcaer tivi sei
% r
eact
ivit
ies
det
ecte
d
ton oD esuCPA-ollA
esU atser t-gni i em
esU ≥ 051 x 4CMBP
0
01
02
03
04
05
06
07
08
09
001
*
*
*
8 / 1
1
3 / 1
1
5 / 1
1
6 / 1
1
4 / 9
5 / 9
11 /
11
123

296 Cancer Immunol Immunother (2008) 57:289–302
only 43% of all positives (Fig. 2b). Centers Z5 and Z6 useda deWned number of separated CD8+ T-cells in the ELI-SPOT and were therefore not included in this subgroupanalysis.
None other of the nine depicted protocol variables hadany obvious impact on the detection of speciWc T-cells. Asa conclusion from these results, four minimum require-ments were formulated for the ELISPOT protocol: (1)perform triplicates for each test antigen (2) do not use allo-APC (3) add a resting time to increase the proportion ofliving cells seeded and (4) use a minimum number of4 £ 105 PBMC per well.
Phase II/2006 of the interlaboratory testing project—general aspects
To formally prove that the requirements formulated for tet-ramer staining and ELISPOT analysis increase the abilityof the participants to detect antigen-speciWc CD8+ T-cellsand reduce the inter-center variability, we decided to repeatthe analysis in a second phase of the panel, with the sameparticipants (phase II/2006). In this round, all groups wereasked to follow our modiWed guidelines for the tetramer-and the ELISPOT-assays.
Again, all PBMC samples were prepared and pre-testedin one central lab and peptide antigens and PE-conjugatedtetramers were also provided from one source. As oneinvestigator had meanwhile moved to another lab, weadded a 13th center to the group. PBMC from sevenselected healthy HLA-A*0201-positive donors and 1 HLA-A*0201-negative donor (D3) were required to be analyzed
for the presence of HLA-A*0201-restricted CMV-speciWcT cells and for inXuenza-speciWc T-cells. The mean numberof recovered cells after thawing was suYcient to performthe tests. When all the data were combined, it became clearthat subjects D2, D5 and D8 possessed CMV-speciWc CD8+
T-cell subsets, and D1, D2, D4, D6 and D7 possessed inXu-enza-speciWc CD8+ T-cells. Therefore, each laboratorycould theoretically have measured eight positives (3£CMV and 5£ InXuenza) in this second phase.
Analysis of CD8+ T-cell tetramer binding using the new guidelines
In the second phase, a total of 104 tests were performed todetect the eight possible tetramer reactivities. Following themodiWed guidelines for tetramer staining, the mean numberof CD8+ T-cells that were counted in each separate testincreased markedly (+36%): a mean of about 49,000 CD8+
cells were analyzed in the phase I (n = 68 tests) and a meanof 67,000 CD8+ T-cells in phase II (n = 104 tests). Thenumber of cells per test ranged from 12,000 to 467,000CD8+. In 81% (84 of 104) of the tests >30,000 CD8+ werecounted (compared to 66% of all relevant tests in the Wrstphase). Table 3 shows (I) the minimum, mean and maxi-mum frequencies of antigen-speciWc T-cells, (II) the resultsobtained from the individual centers Z1–Z13, and (III) thenumber and percentage of centers that detected each T-cellspeciWcity. Donors D2, D5 and D8 showed very strongreactivities with the CMV-tetramer, with mean frequenciesof 1/45 CD8+ T-cells, 1/37 CD8+ T-cells, and 1/19 CD8+
T-cells, respectively. All 13 laboratories were able to detect
Table 3 Overview of tetramer results from phase II/2006 of the CIMT monitoring panel
D1 Flu D2 CMV D2 Flu D4 Flu D5 CMV D6 Flu D7 Flu D8 CMV
Min 7,143 77 10,000 10,000 60 3,333 869 42 (I)
Medium 3,739 45 3,573 5,278 37 1,116 347 19
Max 1,538 28 1,250 2,500 30 571 202 8
Z1 3,333 45 3,333 5,000 39 769 294 10 (II)
Z2 4,000 30 3,333 5,000 30 1,100 250 21
Z3 4,000 47 – 5,000 45 588 270 20
Z4 1,538 71 2,857 6,666 33 769 263 42
Z5 6,666 54 2,500 – 43 1,428 377 24
Z6 5,000 77 – 10,000 60 1,666 869 27
Z7 2,857 47 3,333 6,666 38 833 290 22
Z8 2,000 35 3,333 3,333 31 666 244 8
Z9 3,333 31 10,000 3,333 32 3,333 625 20
Z10 3,333 28 2,222 – 30 952 202 13
Z11 1,666 36 1,250 2,500 32 571 215 15
Z12 7,413 37 – – 35 714 260 8
Z13 – 53 – – 34 – – 20
Detected by 12/13 13/13 9/13 9/13 13/13 12/13 12/13 13/13 (III)
Detected % 92 100 69 69 100 92 92 100
(I) Minimum, mean and maximum frequencies of antigen-speciWc T-cells
(II) Results obtained from the individual centers Z1–Z13. All frequencies are indicated as 1 per x counted CD8+ T-cells
(III) Number and percentage of centers that detected each of the eight possible responses
123

Cancer Immunol Immunother (2008) 57:289–302 297
these populations (Table 3). All but one center detected theinXuenza-speciWc cells present at high frequencies indonors D6 (1/1116 CD8+ T-cells) and D7 (1/347 CD8+
T-cells). Donors D1, D2 and D4 possessed fewer speciWccells (1/3,739, 1/3,573 and 1/5,278 CD8+ T-cells) whichwere found by 12, 9 and 9 centers, respectively. Three labo-ratories also reported inXuenza tetramer-binding CD8+ cellsin D5 or D8. According to the results of the other centers aswell as from the ELISPOT (see below), these stainingswere considered as false positive (not shown). One center(Z13) was not able to detect any of the inXuenza-speciWcCD8+ T-cell reactivities. Finally, no tetramer+ cells weredescribed in the HLA-A*0201-negative donor (D3).
Analysis of CD8+ T-cell responses by ELISPOT following the introduction of a set of four rules
In this second phase, all laboratories performed ELISPOTanalysis following local protocols, all of which conformedto the newly introduced minimum requirements. Table 4shows (I) the minimum, mean and maximum frequencies ofantigen-speciWc cells, (II) the results obtained from theindividual centers Z1–Z13, and (III) the number and per-centage of centers that detected the response. High fre-quency T-cell responses against CMV could readily bedetected by all 13 centers in donors D5 and D8 and by 12 of13 in donor D2. Failure of center Z4 to detect the CMVreactivity in donor D2 was due to a very high backgroundof the medium control. The number of spots representingIFN�-producing cells after inXuenza-peptide stimulationwas generally lower, and consequently, the inXuenza-
speciWc T-cell responses in subjects D1, D2, D4 and D6were detected by fewer laboratories (four centers for D1,three centers for D2, two centers for D4 and ten centers forD6). The high numbers of inXuenza-speciWc T-cells presentin D7 were detected by all 13 laboratories (Table 4).
Comparison of the results obtained in both phases
When the mean frequencies of all T-cell responses in bothtesting rounds were compared, it became clear that therewas a diVerence in the distribution of reactivities (Fig. 3).In the tetramer assay, the mean T-cell frequency of the sixpossible positives in the Wrst phase was 1 per 2,083 CD8+
T-cells. This value was 1 per 1,769 CD8+ T-cells for theeight possible positives in the second phase. Similarly, themean T-cell frequency of the responses detected in IFN�ELISPOT was 1 per 22,369 PBMC for Phase I/2005 but 1per 14,653 PBMC for Phase II/2006. To allow a compari-son of the overall performance in both phases of the panel,we therefore decided to deWne theoretical thresholds forhigh, moderate and low T-cell responses and then to com-pare data of the participating laboratories within thesegroups.
In order to deWne such thresholds for low, medium andhigh T-cell responses, we Wrst displayed the probability ofdetecting each of the 14 diVerent reactivities as a value in acoordinate system and inserted a trendline. For both the tet-ramer assay and the ELISPOT assay, we observed a clearcorrelation between the frequencies of antigen-speciWcT-cells and the number of participating centers that wereable to detect these populations. We then calculated the
Table 4 Overview of IFN� ELISPOT results from phase II/2006 of the CIMT monitoring panel
D1 Flu D2 CMV D2 Flu D4 Flu D5 CMV D6 Flu D7 Flu D8 CMV
Min 44,118 1,791 33,803 58,824 1,745 48,387 14,720 1,698 (I)
Medium 28,823 1,088 16,395 49,960 999 14,265 4,669 1,023
Max 10,345 396 1,231 41,096 391 4,458 1,706 269
Z1 44,118 596 – – 596 48,387 14,720 318 (II)
Z2 – 1,732 – – 1,745 4,739 2,222 1,698
Z3 – 1,333 – – 1,117 – 2,982 1,292
Z4 – – – – 774 – 2,273 447
Z5 – 997 – – 1,157 17,647 3,827 1,209
Z6 10,345 1,031 14,151 – 1,006 – 1,706 1,005
Z7 – 1,317 – – 1,061 10,000 6,000 1,661
Z8 32,258 396 – 58,824 391 4,458 3,623 269
Z9 28,571 966 – 41,096 912 14,423 8,955 1,081
Z10 – 847 1,231 – 806 7,426 3,052 696
Z11 – 1,044 33,803 – 1,087 20,339 3,670 1,273
Z12 – 1,791 – – 1,387 10,619 3,057 1,583
Z13 – 1,008 – – 949 4,615 4,615 770
Detected by 4/13 12/13 3/13 2/13 13/13 10/13 13/13 13/13 (III)
Detected % 31 92 23 15 100 77 100 100
(I) Minimum, mean and maximum frequencies of antigen-speciWc cells
(II) Results obtained from the individual centers Z1–Z13. All frequencies are indicated as 1 per x seeded PBMC
(III) Number and percentage of centers that detected each of the eight possible responses
123
298 Cancer Immunol Immunother (2008) 57:289–302
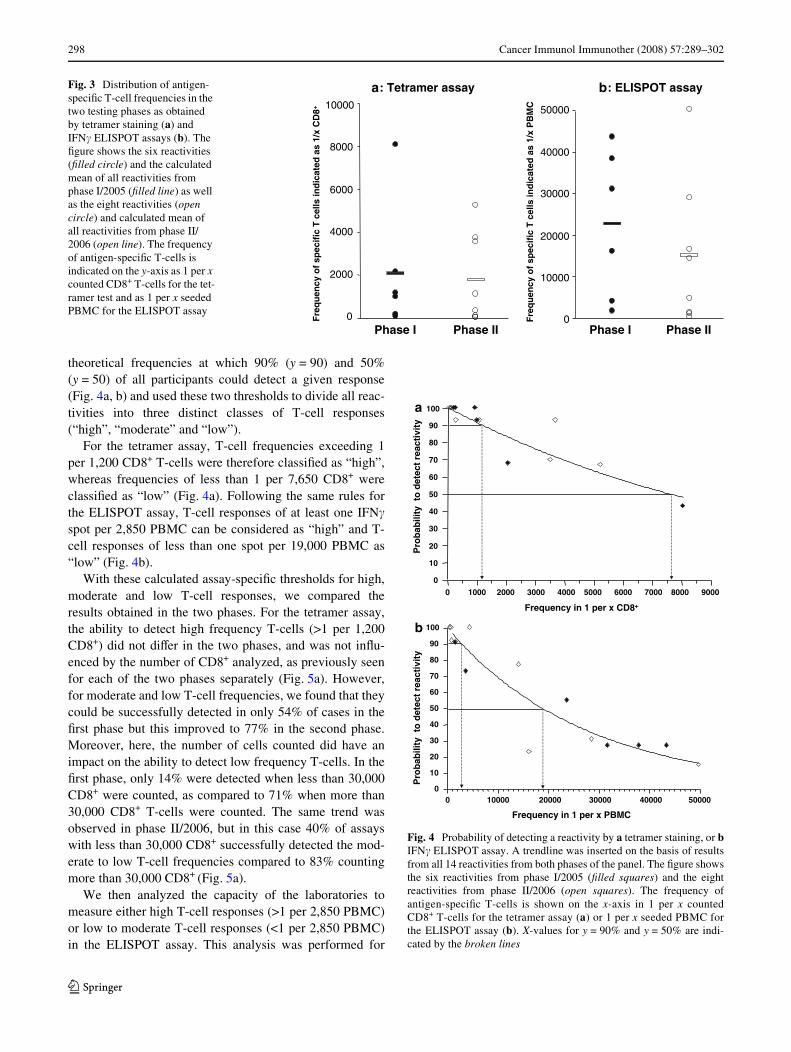
theoretical frequencies at which 90% (y = 90) and 50%(y = 50) of all participants could detect a given response(Fig. 4a, b) and used these two thresholds to divide all reac-tivities into three distinct classes of T-cell responses(“high”, “moderate” and “low”).
For the tetramer assay, T-cell frequencies exceeding 1per 1,200 CD8+ T-cells were therefore classiWed as “high”,whereas frequencies of less than 1 per 7,650 CD8+ wereclassiWed as “low” (Fig. 4a). Following the same rules forthe ELISPOT assay, T-cell responses of at least one IFN�spot per 2,850 PBMC can be considered as “high” and T-cell responses of less than one spot per 19,000 PBMC as“low” (Fig. 4b).
With these calculated assay-speciWc thresholds for high,moderate and low T-cell responses, we compared theresults obtained in the two phases. For the tetramer assay,the ability to detect high frequency T-cells (>1 per 1,200CD8+) did not diVer in the two phases, and was not inXu-enced by the number of CD8+ analyzed, as previously seenfor each of the two phases separately (Fig. 5a). However,for moderate and low T-cell frequencies, we found that theycould be successfully detected in only 54% of cases in theWrst phase but this improved to 77% in the second phase.Moreover, here, the number of cells counted did have animpact on the ability to detect low frequency T-cells. In theWrst phase, only 14% were detected when less than 30,000CD8+ were counted, as compared to 71% when more than30,000 CD8+ T-cells were counted. The same trend wasobserved in phase II/2006, but in this case 40% of assayswith less than 30,000 CD8+ successfully detected the mod-erate to low T-cell frequencies compared to 83% countingmore than 30,000 CD8+ (Fig. 5a).
We then analyzed the capacity of the laboratories tomeasure either high T-cell responses (>1 per 2,850 PBMC)or low to moderate T-cell responses (<1 per 2,850 PBMC)in the ELISPOT assay. This analysis was performed for
Fig. 3 Distribution of antigen-speciWc T-cell frequencies in the two testing phases as obtained by tetramer staining (a) and IFN� ELISPOT assays (b). The Wgure shows the six reactivities (Wlled circle) and the calculated mean of all reactivities from phase I/2005 (Wlled line) as well as the eight reactivities (open circle) and calculated mean of all reactivities from phase II/2006 (open line). The frequency of antigen-speciWc T-cells is indicated on the y-axis as 1 per x counted CD8+ T-cells for the tet-ramer test and as 1 per x seeded PBMC for the ELISPOT assay
yassa TOPSILE :b:a remarteT yassa
I esahP P II esahF
req
uen
cyo
f sp
ecif
icT
cel
lsin
dic
ated
as 1
/x C
D8+
0
0002
0004
0006
0008
00001
I esahP P II esah0
00001
00002
00003
00004
00005
Fre
qu
ency
of
spec
ific
T c
ells
ind
icat
edas
1/x
PB
MC
Fig. 4 Probability of detecting a reactivity by a tetramer staining, or bIFN� ELISPOT assay. A trendline was inserted on the basis of resultsfrom all 14 reactivities from both phases of the panel. The Wgure showsthe six reactivities from phase I/2005 (Wlled squares) and the eightreactivities from phase II/2006 (open squares). The frequency ofantigen-speciWc T-cells is shown on the x-axis in 1 per x countedCD8+ T-cells for the tetramer assay (a) or 1 per x seeded PBMC forthe ELISPOT assay (b). X-values for y = 90% and y = 50% are indi-cated by the broken lines
0 1000 2000 3000 4000 5000 6000 7000 8000 9000
0
10
20
30
40
50
60
70
80
90
100a
b
Pro
bab
ility
to
det
ect
reac
tivi
ty
euqerF 8DC x rep 1 ni ycn +
0 10000 20000 30000 40000 500000
10
20
30
40
50
60
70
80
90
100
Pro
bab
ility
to
det
ect
reac
tivi
ty
euqerF MBP x rep 1 ni ycn C
123
Cancer Immunol Immunother (2008) 57:289–302 299
two deWned subgroups of participants. The Wrst subgroupincluded those Wve centers (Z3, Z4, Z7, Z8 and Z9) thatalready fulWlled three or four of the requirements in the Wrstphase of the panel. These Wve centers did not have to intro-duce any change or at least no major changes to their proto-col for the repetition of the experiments in phase II. Thesecond subgroup included the new center Z13 (led by a col-league that had been in a laboratory that only fulWlled oneof four requirements in phase I) and all others that had ful-Wlled only one or two of the four requirements in the Wrstphase. All laboratories in this second group had to intro-duce marked changes to their locally established protocols.
Similar to the tetramer analysis, the new requirements werenot necessary to detect antigen-speciWc responses amongthe category of high T-cell frequencies in either the Wrst orsecond phases (Fig. 5b). However, applying the set of rulesdeWned in phase I markedly improved the capacity of cen-ters to detect the low to moderate T-cell responses. The Wrstsubgroup detected a total of 68% of the low to moderatereactivities in phase I, whereas the second subgroupdetected only 20% (Fig. 5b). After harmonization of theprotocols, both subgroups performed equally well. In addi-tion, the inter-group variability in detecting positiveresponses was reduced in phase II (percentage of detectedresponses ranged from 38 to 88% with a mean of 67 § 16%)as compared to phase I (percentage of detected responsesranged from 0 to 100% with a mean of 55 § 33%).
Experience does not equal performance
Among the 13 centers that had participated in phase II, tet-ramer stainings had been performed for 1–8 years. Simi-larly, the experience in the ELISPOT technology variedbetween 1 and 10 years. For both techniques, we could notWnd any correlation between the years of experience andthe ability to detect T-cell responses, not even among thesubgroups of moderate or low T-cell responses (notshown).
Discussion
Whenever new techniques are introduced to the scientiWccommunity, they are Wrst only available to a small group ofexpert laboratories. If these assays are robust and applicablefor speciWc research or routine applications, they spread tothe international community. In general, the “original” pro-tocol then undergoes several adaptations in order to meetspeciWc needs. On the one hand, changes can be beneWcialand result in the improvement of protocols. On the other,this evolutionary process leads to employment of manydiVerent protocol variants, limiting comparison of the studyresults obtained by diVerent laboratories. Thus, standardi-zation approaches should be omitted during the initialdevelopment but are absolutely required when assays havebecome Wrmly established. In recent years, several activi-ties aiming at the harmonization of techniques used to mon-itor the presence of antigen-speciWc T-cells have beeninitiated for ELISPOT [28–31], tetramer staining [32] andICS [33–36]. While these studies showed the feasibility,general applicability and the diversity of performanceamong participants, they were not designed to either sys-tematically investigate the inXuence of distinct protocolvariables nor to test whether changes to these parameterscan lead to a global improvement of the group. The CIMT
Fig. 5 a Percentage of reactivities actually detected by tetramer stain-ing. The Wrst two groups of bars show the detection rate for the ninehigh reactivities (>1 per 1,200 CD8+ T-cells) in phase I/2005 and phaseII/2006. The next two groups of bars show the detection rate for Wvemoderate to low reactivities (<1 per 1,200 CD8+) in phase I/2005 (thirdgroup) or phase II/2006 (fourth group). The open bars represent alltests performed, grey bars represent results obtained in tests that wereperformed on more than 3 £ 104 CD8+ T-cells and Wlled bars representresults obtained in tests that were performed on less than 3 £ 104 CD8+
T-cells. b Percentage of reactivities detected in IFN� ELISPOT assays.The Wrst two groups of bars show the rate of detection of the four highreactivities (>1 per 2,850 PBMC in phase I/2005 and phase II/2006.The next two groups of columns show the rate of detection for the tenmoderate to low reactivities (<1 per 2,850 PBMC) in phase I/2005 andphase II/2006. The open bars represent the performances of all centersin the respective panel phase, grey bars represent results obtained fromthe Wve centers that already fulWlled at least three of the four minimumcriteria in phase I/2005 and Wlled bars represent results obtained fromcenters that fulWlled less than three of the four minimum criteria inphase I/2005
5002/I esahP 6002/II esahP 5002/I esahP 6002/II esahP
tivitcaer hgiH sei dna etaredoM l wo tcaer i tiv i se
% r
esp
on
ses
det
ecte
d
0
10
20
30
40
50
60
70
80
90
100a
b
5002/I esahP 6002/II esahP
% r
esp
on
ses
det
ecte
d
0
10
20
30
40
50
60
70
80
90
100
5002/I esahP 6002/II esahP
tivitcaer hgiH sei M dna etaredo l wo tcaer i tiv i se
123

300 Cancer Immunol Immunother (2008) 57:289–302
monitoring panel is the Wrst initiative that has now intro-duced the two-step approach proposing a strategy wheretechnical variables that inXuence the performance of a deW-ned assay are Wrst systematically identiWed (“Wrst step”)followed by a new testing phase where resultant protocolchanges are validated under controlled conditions withinthe same group of investigators (“second step”).
As soon as a number of protocol variables that mighthave inXuenced the sensitivity and the quality of the testswere identiWed in the Wrst phase of our study, it wasdecided to validate this Wnding in a second phase. Becausethis two-step approach was not initially foreseen, the sec-ond phase was performed with PBMC samples obtainedfrom diVerent donors than those used in the Wrst round. Thedistribution and the frequencies of detectable T-cellresponses directed against the chosen model antigens werediVerent in the Wrst and second group of donors (Fig. 3)precluding a direct comparison of the results obtained inboth phases of the panel. To circumvent this problem, twoassay-speciWc frequency thresholds were introduced thatallowed us to distinguish classes of T-cell responses (low,moderate and high) (Fig. 4a, b). Clearly, high-frequency T-cell responses were detected irrespective of the protocolused and as such did not allow the identiWcation of factorsthat exert a strong inXuence on the sensitivity and variabil-ity of the protocols used. Relevant parameters could onlybe detected when the comparison was focused on the detec-tion of T-cells that are present at low to moderate frequen-cies in PBMC. This Wnding should be taken into accountwhen selecting model antigens for use in monitoring panels[37], in particular by laboratories that are interested in thedetection of peripheral tumor-speciWc T-cells, which areoften present at low frequencies, even after vaccination.
Although our experiments do not speciWcally address thequestion of detection limits for the ELISPOT and tetramerassays, we could detect a high variability in the sensitivityof protocols used by the diVerent participants. The majorityof labs (y = 90%) is able to detect responses with a fre-quency above 1 per 1,200 CD8+ T cells in the tetramerassay or responses with a frequency above 1 per 2,859PBMC in the ELISPOT. Note that some of the centerscould reliably detect a response with a frequency of about 1per 8,000 CD8+ T cells in the tetramer assay and about 1per 40,000 PBMC in the ELISPOT assay. These low fre-quencies are in the range of that is commonly reported asthe detection limit for internally validated protocols forboth technologies [39, 40, own unpublished observations].Another important task of standardization eVorts should beto decrease the variation of results obtained in a group ofseveral laboratories down to the stable and low values(15–30%) that can be reproducibly found within singlelabs. In order to quantify the variation of results amonglaboratories we calculated the coeYcient of variation for all
14 reactivities of the two panel phases. The CVs weredetermined on the base of centers that were able to detectthe respective T cell response and the results are shown insupplementary Tables S1a, b. As expected, the CVs wefound in our inter-laboratory testing project were higherthan those reported from intra-center analysis [39, 40].
In the ELISPOT assay, the background spot numbersobtained by the diVerent participants varied greatly, but wewere unable to correlate this Wnding to a distinct variable.Since the spontaneous cytokine secretion impacts signiW-cantly on the sensitivity of this assay, factors that especiallyinXuence the non-speciWc spot production, possibly themedium type or serum source, will need to be systemati-cally analyzed in a separate study.
The main conclusions from our study have been drawnon the basis of subgroup analyses. Although the CIMTpanel in general (13 centers in this initial action), and con-sequently the subgroups formed during the analysis wererather small, we could already identify statistically signiW-cant diVerences in the ability to detect positive responses.We concluded that the number of counted CD8+ T-cells isthe most inXuential crucial factor for the tetramer assay andthat the combination of a resting-time and a high number ofPBMC leads to increased sensitivity in the ELISPOT assay.This suggests that the impact of the identiWed technicalvariables on the quality of the assays is high. In order toidentify those protocol variables that lead to more subtlediVerences, a larger group of participants would be needed.
In addition to the systematic identiWcation of variablesthat correlate with sensitivity/insensitivity of various assays,inter-laboratory testing projects also allow the rapid evalua-tion of individual performance among a group. Interestingly,the Wnding that experienced laboratories did not performbetter than laboratories which recently applied these tech-niques strongly suggests that non-optimal protocols, onceestablished in a lab, can commonly be maintained for sev-eral years. Periodic comparison of local protocols with thoseof other centers is recommended. Even if a new staV mem-ber uses an established protocol, it is recommended to havethem participate in inter-laboratory testing/teaching exer-cise. Regular participation in multi-center comparisonscould thereby help to optimize and validate participants’performance over time and to maintain sensitive protocols orminimal standards. This is of great importance when mate-rial from expensive clinical trials has to be analyzed.
All data from the CMV-serology, from the pre-testingexperiments and from the results generated by the partici-pating laboratories in ELISPOT and tetramer staining weretaken together for each donor in order to qualitatively vali-date the presence of CMV- and inXuenza-speciWc T-cells.To estimate the quantity, i.e. the frequency of speciWcT-cells in each donor, we calculated the average of all qual-itatively positive results, as well as the standard deviations.
123

Cancer Immunol Immunother (2008) 57:289–302 301
This procedure constitutes only an approximation of thereal number of antigen-speciWc cells present in a givensample, and cannot be taken as a method for determiningabsolute T-cell frequencies. Cell samples that containpre-deWned numbers of antigen-speciWc T-cells (e.g. spikedT-cell clones), especially tumor-reactive T-cells, are not eas-ily available for use in multi-center comparisons, althoughsuch standard samples are urgently needed. We see this asone major bottle-neck for the optimization and standardiza-tion of immunomonitoring techniques. Methods to generatesuch standard samples for broader use will therefore be elu-cidated with high priority in the near future for the nextphases of this international collaboration. Another big chal-lenge will be to deWne accepted rules for the settings of theequipment used in these analyses (Xow cytometer or ELI-SPOT reader) in order to uniformly process and analyze theraw data. Ten from eleven laboratories that performed theELISPOT assay in the Wrst phase used an ELISPOT readerfor spot counting. It is known that spot counts between cen-ters can diVer signiWcantly and this may be explained by theuse of diVerent reading machines, diVerent settings for thesame type of machine or by the experience of the operator.Within this group, four diVerent commercially availablereading systems were used (supplementary Table S2). Wewere not able to identify diVerences between the types ofELISPOT readers. A new ELISPOT panel phase is cur-rently in preparation, that will speciWcally focus on the per-formances of diVerent ELISPOT readers and try tointroduce tools to control inter center variation. In addition,none of the participant reported on the use of live/dead celldiscrimination on thawed PBMC samples for the FACS-based experiments. Whether the combination of staining withAb/HLA-tetramers and vital dyes or with a resting phase isbeneWcial for increasing the sensitivity of the tetramer stain-ing assay could be addressed in future testing actions.
Results from a proWciency panel of 36 laboratories fromnine diVerent countries in which the ELISPOT assay wasvalidated are now also being reported [41]. This initiative,conducted under the aegis of the Cancer Vaccine Consor-tium (CVC), was mainly designed to oVer an external vali-dation to the participating laboratories but the in depthanalysis of the obtained data sets lead to similar Wndingsand recommendations as the CIMT monitoring panel. ItconWrmed that a resting phase of cells prior to addition tothe ELISPOT plates is advantageous and should thereforebe generally recommended. Furthermore, a long year expe-rience in a technology did not guarantee for a sensitive testand failure to detect speciWc T cell responses concentratedon the weak responses. The fact that two independent ini-tiatives come to similar Wndings is surely notable andshows the necessity to carry on running proWciency panels.
Last but not least, we would like to stress that even thebest guidelines and protocols alone cannot guarantee good
performance. Monitoring of antigen-speciWc T-cell responsesrequires skills as well as experience. Participation in immun-omonitoring panels cannot compensate for the need to con-stantly educate and train staV and to develop speciWcexpertise for covering individual needs. Nevertheless, westrongly believe that by organizing further two-step inter-laboratory testing projects, the CIMT monitoring panel willbe able to improve the sensitivity of the assays used forimmunomonitoring as well as to actively participate in theharmonization of these assays, which is required to enablethe comparison of immunotherapeutic trials performed indiVerent centers.
Acknowledgments We thank the executive board members of theAssociation for Immunotherapy of Cancer (CIMT) for taking over thepatronage and partial costs of the monitoring panel. We also thank P.Hrstic for technical assistance (Tuebingen), D. Sigurdardottir (Tuebin-gen) and C.L.C.M. Franken (Leiden) for HLA tetramers, J. W. Drijfh-out for peptides and the Blood Bank at the Johannes-GutenbergUniversity Mainz for providing HLA-typed buVy coats. C.M.B. issupported by a Dr. Mildred Scheel research grant from the DeutscheKrebshilfe (DKH). We thank Lynne Yakes for editorial assistance.
References
1. Mocellin S, Lise M, Nitti D (2005) Targeted therapy for colorectalcancer: mapping the way. Trends Mol Med 11:327
2. Mocellin S, Mandruzzato S, Bronte V, Marincola FM (2004)Cancer vaccines: pessimism in check. Nat Med 10:1278
3. Restifo NP, Rosenberg SA (2005) Use of standard criteria forassessment of cancer vaccines. Lancet Oncol 6:3
4. Galon J, Costes A, Sanchez-Cabo F, Kirilovsky A, Mlecnik B, Lag-orce-Pages C, Tosolini M, Camus M, Berger A, Wind P, Zinzindo-houe F, Bruneval P, Cugnenc PH, Trajanoski Z, Fridman WH, PagesF (2006) Type, density, and location of immune cells within humancolorectal tumors predict clinical outcome. Science 313:1960
5. Romero P, Cerottini JC, Speiser DE (2004) Monitoring tumor antigenspeciWc T-cell responses in cancer patients and phase I clinical trialsof peptide-based vaccination. Cancer Immunol Immunother 53:249
6. Dunn GP, Old LJ, Schreiber RD (2004) The immunobiology ofcancer immunosurveillance and immunoediting. Immunity 21:137
7. Boon T, Coulie PG, Van den Eynde BJ, van der Bruggen P (2006) Hu-man T-cell responses against melanoma. Annu Rev Immunol 24:175
8. de Jong A, van Poelgeest MI, van der Hulst JM, Drijfhout JW,Fleuren GJ, Melief CJ, Kenter G, OVringa R, van der Burg SH(2004) Human papillomavirus type 16-positive cervical cancer isassociated with impaired CD4+ T-cell immunity against earlyantigens E2 and E6. Cancer Res 64:5449
9. van Poelgeest MI, van Manon S, van Marc B, Kwappenberg KM,Heijmans-Antonissen C, Drijfhout JW, Melief CJ, Kenter GG,Helmerhorst TJ, OVringa R, van der Burg SH (2005) Detection ofhuman papillomavirus (HPV) 16-speciWc CD4+ T-cell immunityin patients with persistent HPV16-induced vulvar intraepithelialneoplasia in relation to clinical impact of imiquimod treatment.Clin Cancer Res 11:5273
10. Czerkinsky C, Andersson G, Ekre HP, Nilsson LA, Klareskog L,Ouchterlony O (1988) Reverse ELISPOT assay for clonal analysisof cytokine production. I. Enumeration of gamma-interferon-secreting cells. J Immunol Methods 110:29
11. Herr W, Schneider J, Lohse AW, Meyer zum Buschenfelde KH,Wölfel T (1996) Detection and quantiWcation of blood-derived
123

302 Cancer Immunol Immunother (2008) 57:289–302
CD8+ T lymphocytes secreting tumor necrosis factor alpha inresponse to HLA-A2.1-binding melanoma and viral peptideantigens. J Immunol Methods 191:131
12. Altman JD, Moss PA, Goulder PJ, Barouch DH, Heyzer-WilliamsMG, Bell JI, McMichael AJ, Davis MM (1996) Phenotypic analy-sis of antigen-speciWc T lymphocytes. Science 274:94
13. Jung T, Schauer U, Heusser C, Neumann C, Rieger C (1993)Detection of intracellular cytokines by Xow cytometry. J ImmunolMethods 159:197
14. Assenmacher M, Schmitz J, Radbruch A (1994) Flow cytometricdetermination of cytokines in activated murine T helper lympho-cytes: expression of interleukin-10 in interferon-gamma and ininterleukin-4-expressing cells. Eur J Immunol 24:1097
15. Stone JD, Demkowicz WE Jr, Stern LJ (2005) HLA-restrictedepitope identiWcation and detection of functional T-cell responsesby using MHC-peptide and costimulatory microarrays. Proc NatlAcad Sci USA 102:3744
16. Betts MR, Brenchley JM, Price DA, De Rosa SC, Douek DC,Roederer M, Koup RA (2003) Sensitive and viable identiWcationof antigen-speciWc CD8+ T-cells by a Xow cytometric assay fordegranulation. J Immunol Methods 281:65
17. Chattopadhyay PK, Yu J, Roederer M (2005) A live-cell assay todetect antigen-speciWc CD4+ T-cells with diverse cytokine pro-Wles. Nat Med 11:1113
18. Frentsch M, Arbach O, KirchhoV D, Moewes B, Worm M, RotheM, ScheVold A, Thiel A (2005) Direct access to CD4+ T-cellsspeciWc for deWned antigens according to CD154 expression. NatMed 11:1118
19. Scriba TJ, Purbhoo M, Day CL, Robinson N, Fidler S, Fox J,Weber JN, Klenerman P, Sewell AK, Phillips RE (2005) Ultrasen-sitive detection and phenotyping of CD4+ T-cells with optimizedHLA class II tetramer staining. J Immunol 175:6334
20. Chattopadhyay PK, Price DA, Harper TF, Betts MR, Yu J, GostickE, Perfetto SP, Goepfert P, Koup RA, De Rosa SC, Bruchez MP,Roederer M (2006) Quantum dot semiconductor nanocrystals forimmunophenotyping by polychromatic Xow cytometry. Nat Med12:972
21. Speiser DE, Baumgaertner P, Barbey C, Rubio-Godoy V, MoulinA, Corthesy P, Devevre E, Dietrich PY, Rimoldi D, Lienard D,Cerottini JC, Romero P, Rufer N (2006) A novel approach to char-acterize clonality and diVerentiation of human melanoma-speciWcT-cell responses: spontaneous priming and eYcient boosting byvaccination. J Immunol 177:1338
22. Devevre E, Romero P, Mahnke YD (2006) Livecount assay: con-comitant measurement of cytolytic activity and phenotypic charac-terisation of CD8(+) T-cells by Xow cytometry. J ImmunolMethods 311:31
23. Batard P, Peterson DA, Devevre E, Guillaume P, Cerottini JC, Ri-moldi D, Speiser DE, Winther L, Romero P (2006) Dextramers:new generation of Xuorescent MHC class I/peptide multimers forvisualization of antigen-speciWc CD8+ T-cells. J Immunol Meth-ods 310:136
24. OVringa R, van der Burg SH, Ossendorp F, Toes RE, Melief CJ(2000) Design and evaluation of antigen-speciWc vaccination strat-egies against cancer. Curr Opin Immunol 12:576
25. Coulie PG, Karanikas V, Colau D, Lurquin C, Landry C, Marc-hand M, Dorval T, Brichard V, Boon T (2001) A monoclonal cyto-lytic T-lymphocyte response observed in a melanoma patientvaccinated with a tumor-speciWc antigenic peptide encoded bygene MAGE-3. Proc Natl Acad Sci USA 98:10290
26. Keilholz U, Weber J, Finke JH, Gabrilovich DI, Kast WM, DisisML, Kirkwood JM, Scheibenbogen C, Schlom J, Maino VC,Lyerly HK, Lee PP, Storkus W, Marincola F, Worobec A, AtkinsMB (2002) Immunologic monitoring of cancer vaccine therapy:results of a workshop sponsored by the Society for BiologicalTherapy. J Immunother 25:97
27. Keilholz U, Martus P, Scheibenbogen C (2006) Immune monitor-ing of T-cell responses in cancer vaccine development. Clin Can-cer Res 12:2346S
28. Scheibenbogen C, Romero P, Rivoltini L, Herr W, Schmittel A,Cerottini JC, Wölfel T, Eggermont AM, Keilholz U (2000)Quantitation of antigen-reactive T-cells in peripheral blood byIFNgamma-ELISPOT assay and chromium-release assay: a four-centre comparative trial. J Immunol Methods 244:81
29. Cox JH, Ferrari G, Janetzki S (2006) Measurement of cytokine releaseat the single cell level using the ELISPOT assay. Methods 38:274
30. Janetzki S, Cox JH, Oden N, Ferrari G (2005) Standardization andvalidation issues of the ELISPOT assay. Methods Mol Biol 302:51
31. Janetzki S, Schaed S, Blachere NE, Ben-Porat L, Houghton AN, Pan-ageas KS (2004) Evaluation of Elispot assays: inXuence of methodand operator on variability of results. J Immunol Methods 291:175
32. Heijnen IA, Barnett D, Arroz MJ, Barry SM, Bonneville M, Bran-do B, D’hautcourt JL, Kern F, Totterman TH, Marijt EW, BossyD, Preijers FW, Rothe G, Gratama JW (2004) Enumeration ofantigen-speciWc CD8+ T lymphocytes by single-platform, HLAtetramer-based Xow cytometry: a European multicenter evalua-tion. Cytometry B Clin Cytom 62:1
33. Maecker HT, Rinfret A, D’Souza P, Darden J, Roig E, Landry C,Hayes P, Birungi J, Anzala O, Garcia M, Harari A, Frank I, BaydoR, Baker M, Holbrook J, Ottinger J, Lamoreaux L, Epling CL, Sin-clair E, Suni MA, Punt K, Calarota S, El-Bahi S, Alter G, Maila H,Kuta E, Cox J, Gray C, Altfeld M, Nougarede N, Boyer J, TusseyL, Tobery T, Bredt B, Roederer M, Koup R, Maino VC, WeinholdK, Pantaleo G, Gilmour J, Horton H, Sekaly RP (2005) Standard-ization of cytokine Xow cytometry assays. BMC Immunol 6:13
34. Maecker HT, Moon J, Bhatia S, Ghanekar SA, Maino VC, PayneJK, Kuus-Reichel K, Chang JC, Summers A, Clay TM, MorseMA, Lyerly HK, DeLaRosa C, Ankerst DP, Disis ML (2005) Im-pact of cryopreservation on tetramer, cytokine Xow cytometry, andELISPOT. BMC Immunol 6:17
35. Maecker HT, Trotter J (2006) Flow cytometry controls, instrumentsetup, and the determination of positivity. Cytometry A 69:1037
36. Hobeika AC, Morse MA, Osada T, Ghanayem M, Niedzwiecki D,Barrier R, Lyerly HK, Clay TM (2005) Enumerating antigen-speciWc T-cell responses in peripheral blood: a comparison ofpeptide MHC tetramer, ELISpot, and intracellular cytokine analy-sis. J Immunother 28:63
37. Currier JR, Kuta EG, Turk E, Earhart LB, Loomis-Price L,Janetzki S, Ferrari G, Birx DL, Cox JH (2002) A panel of MHCclass I restricted viral peptides for use as a quality control forvaccine trial ELISPOT assays. J Immunol Methods 260:157
38. Britten CM, Meyer RG, Kreer T, Drexler I, Wölfel T, Herr W(2002) The use of HLA-A*0201-transfected K562 as standardantigen-presenting cells for CD8(+) T lymphocytes in IFN-gammaELISPOT assays. J Immunol Methods 259:95
39. Speiser DE, Pittet MJ, Guillaume P, Lubenow N, HoVman E,Cerottini J-C, Romero P (2004) Ex vivo analysis of humanantigen-speciWc CD8+ T-cell responses: Quality assessment ofXuorescent HLA-A2 multimer and interferon-� ELISPOT assaysfor patient immune monitoring. J Immunother 27:298
40. Comin-Anduix B, Gualberto A, Glaspy JA, Seja E, Ontiveros M,Reardon DL, Renteria R, Englahner B, Economou JS, Gomez-Navarro J, Ribas A (2006) DeWnition of an immunologic responseusing major histocompatibility complex tetramer and enzyme-linked immunospot assays. Clin Cancer Res 12:107
41. Janetzki S, Panageas KS, Ben-Porat L, Boyer J, Britten CM, ClayTM, Kalos M, Maecker HT, Romero P, Yuan J, Kast WA, Hoos A(2007) Results and harmonization guidelines from two large-scaleinternational elispot proWciency panels conducted by the CancerVaccine Consortium (CVC/SVI). Cancer Immunol Immunother.(doi:10.1007/s00262-007-0380-6)
123
![Upper Limb Treatment Principles in Intensive Functional ...currentneurobiology.org/neurobiology/upper-limb-treatment-principles-in-intensive...CIMT [H-CIMT], bimanual intensive movement](https://img.pdfslide.us/doc/110x75/5ea2417b6d256b24c6549424/upper-limb-treatment-principles-in-intensive-functional-cimt-h-cimt-bimanual.jpg)