Embed Size (px)
Citation preview
A joint project of five Catholic national
ministry organizations funded by Lilly
Endowment Inc. Research conducted by
the Center for Applied Research in the
Apostolate
The Changing
Face of U.S.
Catholic
Parishes Mark M. Gray, Mary L. Gautier, and
Melissa A. Cidade

This project is the work of five Catholic national ministerial organizations collaborating on
sustaining the pastoral excellence of the emerging models of pastoral leadership in the Catholic
Church. These organizations believe that, at this time, the life of the Catholic Church depends on
ongoing and sustained collaboration at all levels. Their vision is for a more fully collaborative,
competent, and mission-focused pastoral leadership, strengthened in their service to parish
communities at all levels. These organizations have researched marks of excellence for vibrant
parishes and are committed to providing research and dialogue with pastoral leadership in
pursuing this excellence. In order to create a climate in which much needed research, theological
reflection, and practical transforming action can take place, this Project has set three goals: 1) To
provide solid research on the emerging models of parish pastoral leadership; 2) To stimulate a
national conversation about the use of pastoral imagination to create vibrant parishes; and 3) To
explore ways in which national associations can collaborate to serve the Church.
Funded by Lilly Endowment Inc. The Emerging Models Project is made possible by the generosity of Lilly Endowment
Inc., which established its “Sustaining Pastoral Excellence Grant Program” in 2002.
This program was designed to provide funding to organizations that would establish
projects to enhance pastoral leadership in parishes and congregations across the
country. As a result of being selected to participate, the Emerging Models Project has
been able to provide national support by sharing ideas for enhancing parish life with
our constituencies and with parishes and dioceses across the country.
Research conducted by the Center for Applied Research in the Apostolate (CARA)
CARA is a national, non-profit, Georgetown University affiliated research center that
conducts social scientific studies about the Catholic Church. Founded in 1964, CARA
has three major dimensions to its mission: to increase the Church's self-understanding,
to serve the applied research needs of Church decision-makers, to advance scholarly
research on religion, particularly Catholicism. CARA’s longstanding policy is to let
research findings stand on their own and never take an advocacy position or go into
areas outside its social science competence. ©2011 National Association for Lay Ministry (NALM), Emerging Models of Pastoral Leadership Project. No portion may be duplicated or copied without expressed written consent. For information contact: National Association for Lay Ministry, 6896 Laurel Street NW, Washington, D.C. 20012 (202) 291-4100
Table of Contents
Executive Summary .................................................................................................................................... 1
Major Findings ............................................................................................................................................ 1
Introduction ................................................................................................................................................. 4
Background: Balancing the Parish Life Equation.................................................................................... 6
Major Sub-group Definitions ................................................................................................................... 11
Characteristics of Responding Parishes .................................................................................................. 12
Region ....................................................................................................................................................... 12
Age of Parish ............................................................................................................................................. 13
Most Recent Parish Construction .............................................................................................................. 14
Church Seating Capacity ........................................................................................................................... 15
Number of Registered Households ............................................................................................................ 17
Number of Individual Registered Parishioners ......................................................................................... 19
Mass Attendance ....................................................................................................................................... 21
Worship and Sacraments .......................................................................................................................... 26
Number of Worship Sites .......................................................................................................................... 26
Number of Weekend Masses per Week .................................................................................................... 27
Number of Weekday Masses per Week .................................................................................................... 29
Number of Other Services per Week ......................................................................................................... 30
Masses Celebrated in Languages Other than English ............................................................................... 31
Feats Days ................................................................................................................................................. 34
Sacraments and Other Celebrations ........................................................................................................... 35
Composition of the Parish Community ................................................................................................... 39
Race and Ethnicity of Registered Parishioners .......................................................................................... 39
Age of Parishioners ................................................................................................................................... 42
Parish Finances .......................................................................................................................................... 43
Parish Ministries, Programs, and Services ............................................................................................. 48
Parishes and Schools ................................................................................................................................. 50
Parish Changes in the Last Five Years .................................................................................................... 51
Changes in Parish registration ................................................................................................................... 51
Changes in Total Sunday/Saturday Vigil Mass Attendance ...................................................................... 52
Budget Change .......................................................................................................................................... 53
Changes in Parishioner Demographics ...................................................................................................... 54
Parish Staff ................................................................................................................................................. 55
Race and Ethnicity of Staff Members ....................................................................................................... 55
Age of Staff Members ............................................................................................................................... 56
Ecclesial Status .......................................................................................................................................... 57
Lay Ecclesial Ministry in U.S. Parishes .................................................................................................... 58
Area of Ministry Work .............................................................................................................................. 62
Most Common Parish Staff Positions ........................................................................................................ 63
Parish Consultative Bodies ....................................................................................................................... 65
Pastoral Council ........................................................................................................................................ 65
Finance Council ......................................................................................................................................... 68
Multiple Parish Ministry .......................................................................................................................... 70
Number of Parishes ................................................................................................................................... 70
Arrangements between Parishes ................................................................................................................ 71
Residence at Parish .................................................................................................................................... 72

Registered Households at All Shared Parishes .......................................................................................... 73
Year Multi-parish Ministry Began ............................................................................................................ 74
Distances between Parishes ....................................................................................................................... 75
Shared Ministries ....................................................................................................................................... 76
Other Ministries and Resources Shared in Multi-parish Ministry ............................................................. 77
Appendix: Questionnaire .......................................................................................................................... 78

1
The Changing Face of U.S. Catholic Parishes
Executive Summary
In 2009, the Emerging Models of Pastoral Leadership project, a Lilly Endowment Inc.
funded collaboration of five Catholic national ministerial organizations, commissioned the
Center for Applied Research in the Apostolate (CARA) at Georgetown University to conduct a
series of three surveys in parishes nationwide. The first of these was a single informant survey
sent to parishes to develop a portrait of parish life in the United States today. This survey was in
the field from March 2010 to December 2010. This report includes results from this survey based
on a sample of 5,549 U.S. parishes. A total of 846 parishes responded, for a response rate of 15.3
percent. The margin of sampling error for the survey is ±3.3 percentage points.
Major Findings
History, Location, and Size
The average year of parish founding is 1920. About a third of U.S. Catholic parishes (32
percent) were established after 1950 and another third (33 percent) were erected before 1900.
Parishes also provided the year of construction for the current church building. Most parishes
report the current church building was constructed in the 1940s and 1950s.
Thirty-seven percent of U.S. Catholic parishes are in the Midwest and 24 percent in the
Northeast. More than one in five parishes (22 percent) are in the South and only 17 percent
are in the West.
The average number of registered households in U.S. parishes is 1,168 (median of 761). A
third of parishes have more than 1,201 registered households. The percentage of parishes
with 200 or fewer households dropped from 24 percent in 2000 to 15 percent in 2010.
Parishes with more than 1,200 registered households now make up 33 percent of all parishes.
U.S. parishes average 3,277 (median of 1,950) individual registered parishioners. In 2000,
the average number of registered parishioners was 2,260. This number has risen by 45
percent as the Catholic population has grown and parishes in the U.S. have been closed and
consolidated. Smaller parishes are more likely than larger parishes to be closed or
consolidated. Forty percent of all growth in registered parishioners in U.S. parishes from
2005 to 2010 was among Hispanic/Latino(a)s.
Worship and Sacraments
The average number of Mass attenders at Sunday/Saturday Vigil Masses on a typical
weekend in October is 1,110 (median of 750). On average, this number represents 38 percent
of registered parishioners and 47 percent of parish capacity (number of Masses multiplied by
seating capacity). Smaller parishes have a higher proportion of parishioners attending Mass
that larger parishes.

2
Most parishes (82 percent) celebrate Mass at only one site. However, 13 percent celebrate
Mass at two sites in a typical week and 5 percent of parishes celebrate Mass in three or more
sites.
The median number of Sunday/Saturday Vigil Masses each week in U.S. parishes is four
(average of 3.8). One in ten parishes (10 percent) celebrates only one of these Masses per
week. Twenty-eight percent celebrate five or more. The median number of weekday Masses
in parishes is five (average of 5.3).
One in three parishes (29 percent) celebrates Mass at least once a month in a language other
than English. This is an increase from 22 percent of parishes in 2000. Most of these Masses,
81 percent, are in Spanish. Overall, about 6 percent of all Masses (weekday and weekend) are
celebrated in Spanish.
Thirty-seven percent of parishes indicate that they have some special observance for
particular cultural or ethnic groups in the parish. By far, the most common of these is a
celebration for the Feast Day of Our Lady of Guadalupe. Twenty-one percent of all U.S.
parishes indicate a special observance of this day.
The typical U.S. parish has 57 infant baptisms, 58 first communions, 44 confirmations, 14
marriages, and 29 funerals each year. Smaller parishes tend to have more sacramental
activity per registered parishioner than larger parishes. However, in all but the smallest
parishes (those with 200 or fewer registered households) the ratio of infant baptisms to
funerals is on average 2 to 1.
On average, respondents indicated that the proportion of parishioners who are non-Hispanic
white have decreased in the last five years as Catholics of other races and ethnicities make up
a larger part of registered parishioners. Parishes in the South and West are more racially and
ethnically diverse than those in the Midwest and Northeast.
Finances
In the average American parish, the total operating revenue of about $695,000 exceeds
expenses of $626,500. The average surplus is 4.3 percent of revenue. However, 30 percent of
parishes indicate that their expenses exceed their revenue. Of those parishes reporting a
deficit, the average size for the shortfall is 15.8 percent of revenue.
Total weekly offertory is about $9,200 or $9.57 per registered household. Offertory has
grown in the last five years, on average, by more than 14 percent. Smaller parishes generally
collect more per registered household in offertory than larger parishes.
Programs and Ministries
Parishes are most likely to have programs and ministries for sacramental preparation,
religious education, and for the infirm and homebound (86 percent or more). Majorities have
youth ministry (76 percent), ministry to seniors (64 percent), social services to meet
individual needs (59 percent), and ministry to the bereaved (54 percent).

3
A majority of parishes (56 percent) report some sort of commitment to a Catholic school.
Twenty-four percent indicate that they have a parish school, 25 percent support a regional
school, and 8 percent indicate a combination of these commitments.
Staff
The total number of people on parish staffs in the United States is estimated to be 168,448.
This total includes ministry staff and volunteers as well as non-ministry staff and volunteers
(including parish bookkeepers, groundskeepers, cooks, etc.). The average parish has a total
staff size of 9.5 members with 5.4 individuals in ministry positions.
The estimated number of lay ecclesial ministers (paid in ministry for at least 20 hours per
week) in the United States is approximately 38,000 (2.1 per parish). Fourteen percent of
these individuals are vowed religious and 86 percent other lay persons. Overall, 80 percent
are female and 20 percent male. Seven percent are under the age of 30. Eleven percent are in
their 30s and 22 percent in their 40s. Thus, four in ten LEMs are estimated to be under the
age of 50. It is estimated that the U.S. Church is adding about 790 new lay ecclesial
ministers to parish ministry staffs each year.
Nearly half of all individuals on parish staffs are lay women (49 percent). Including religious
sisters (3 percent), parish staffs in the United States are 52 percent female. Priests account for
18 percent of parish staff members and deacons make up 4 percent. Religious brothers are 1
percent of parish staff members and other lay men make up 21 percent of all parish staff
members. Among ministry staff specifically, lay persons are fewer in number and clergy are
more prevalent. One in four ministry staff is a diocesan priest (24 percent). Fourteen percent
of ministry staff are deacons, 6 percent are religious priests, 5 percent are religious sisters,
and 1 percent religious brothers; half are other lay ministry staff. Fifty-six percent of all
parish staff members are between the age of 50 and 69. Fifty-five percent of ministry staff is
of this age.
Ninety-three percent of U.S. parishes indicate that they have a pastoral council and more, 97
percent, say they have a parish finance council.
More than one in four parishes (27 percent) are utilizing multi-parish ministry where the
parish is most often “clustered” or “linked” (among other arrangements) to another parish. A
third of these parishes (33 percent) indicate that this is a relatively new development,
beginning sometime after 2004. These parishes are most likely to share sacramental
preparation ministries (54 percent), RCIA (53 percent), or religious education and faith
formation for children (51 percent).
4
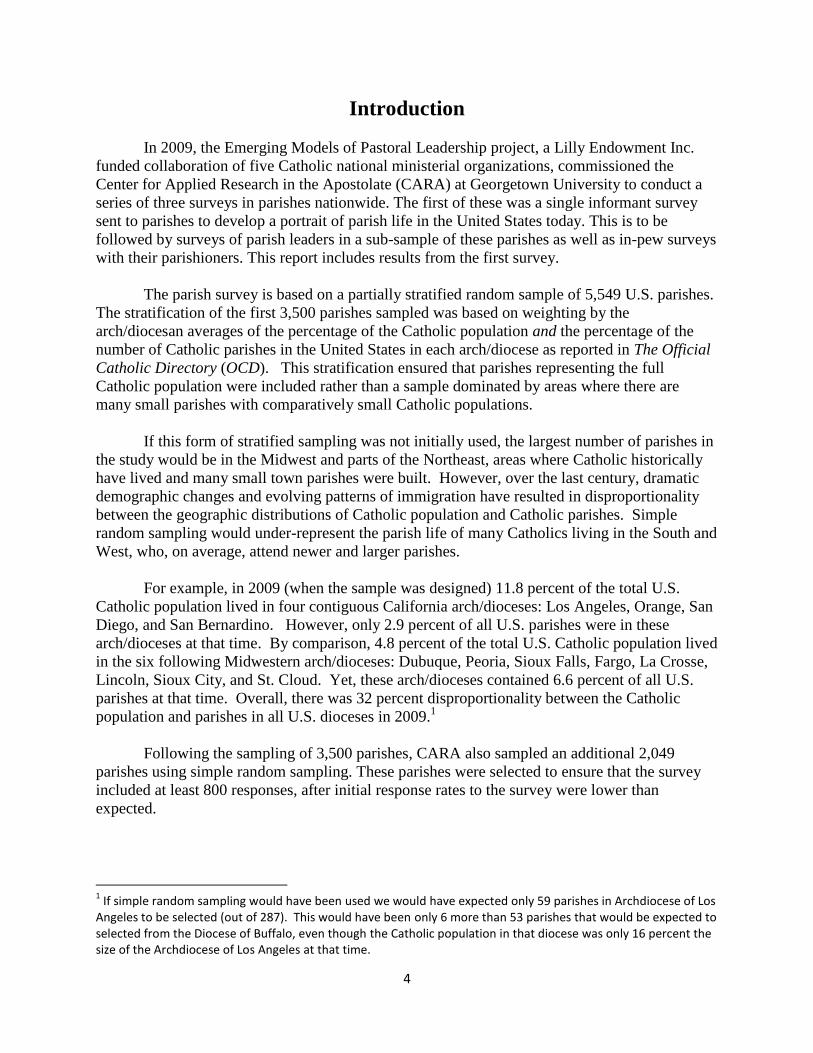
Introduction
In 2009, the Emerging Models of Pastoral Leadership project, a Lilly Endowment Inc.
funded collaboration of five Catholic national ministerial organizations, commissioned the
Center for Applied Research in the Apostolate (CARA) at Georgetown University to conduct a
series of three surveys in parishes nationwide. The first of these was a single informant survey
sent to parishes to develop a portrait of parish life in the United States today. This is to be
followed by surveys of parish leaders in a sub-sample of these parishes as well as in-pew surveys
with their parishioners. This report includes results from the first survey.
The parish survey is based on a partially stratified random sample of 5,549 U.S. parishes.
The stratification of the first 3,500 parishes sampled was based on weighting by the
arch/diocesan averages of the percentage of the Catholic population and the percentage of the
number of Catholic parishes in the United States in each arch/diocese as reported in The Official
Catholic Directory (OCD). This stratification ensured that parishes representing the full
Catholic population were included rather than a sample dominated by areas where there are
many small parishes with comparatively small Catholic populations.
If this form of stratified sampling was not initially used, the largest number of parishes in
the study would be in the Midwest and parts of the Northeast, areas where Catholic historically
have lived and many small town parishes were built. However, over the last century, dramatic
demographic changes and evolving patterns of immigration have resulted in disproportionality
between the geographic distributions of Catholic population and Catholic parishes. Simple
random sampling would under-represent the parish life of many Catholics living in the South and
West, who, on average, attend newer and larger parishes.
For example, in 2009 (when the sample was designed) 11.8 percent of the total U.S.
Catholic population lived in four contiguous California arch/dioceses: Los Angeles, Orange, San
Diego, and San Bernardino. However, only 2.9 percent of all U.S. parishes were in these
arch/dioceses at that time. By comparison, 4.8 percent of the total U.S. Catholic population lived
in the six following Midwestern arch/dioceses: Dubuque, Peoria, Sioux Falls, Fargo, La Crosse,
Lincoln, Sioux City, and St. Cloud. Yet, these arch/dioceses contained 6.6 percent of all U.S.
parishes at that time. Overall, there was 32 percent disproportionality between the Catholic
population and parishes in all U.S. dioceses in 2009.1
Following the sampling of 3,500 parishes, CARA also sampled an additional 2,049
parishes using simple random sampling. These parishes were selected to ensure that the survey
included at least 800 responses, after initial response rates to the survey were lower than
expected.
1 If simple random sampling would have been used we would have expected only 59 parishes in Archdiocese of Los
Angeles to be selected (out of 287). This would have been only 6 more than 53 parishes that would be expected to selected from the Diocese of Buffalo, even though the Catholic population in that diocese was only 16 percent the size of the Archdiocese of Los Angeles at that time.
5
Following a series or reminders and a field period spanning from March 2010 to
December 2010, a total of 846 parishes responded to the survey for a response rate of 15.3
percent. The margin of sampling error for the survey is ±3.3 percentage points.
A number of cross-time comparisons are made in this report to CARA’s National Parish
Inventory (NPI). This is CARA’s database of parish life that was initiated in 1998 and updated
periodically since that time. To compile this database, CARA mailed a one-page questionnaire to
every parish in the country asking for parish characteristics. The database included information
on 87 percent of all U.S. parishes in 2000.
6
Background: Balancing the Parish Life Equation
Parish life in the United States has been undergoing significant changes in the last
decade. A number of evolving trends have combined to alter the ways in which parishes operate.
Church leaders must generally try to balance a delicate equation:
On one side, they must provide worship sites—each of which has its own seating
capacity and number of Masses. These parishes must be staffed by a sufficient number of priests,
deacons, and/or lay ecclesial ministers (LEMs).
On the other side, Church leaders must consider the demands on these parishes in terms
of the local size of the Catholic population, its frequency of Mass attendance, and needs for
sacraments.
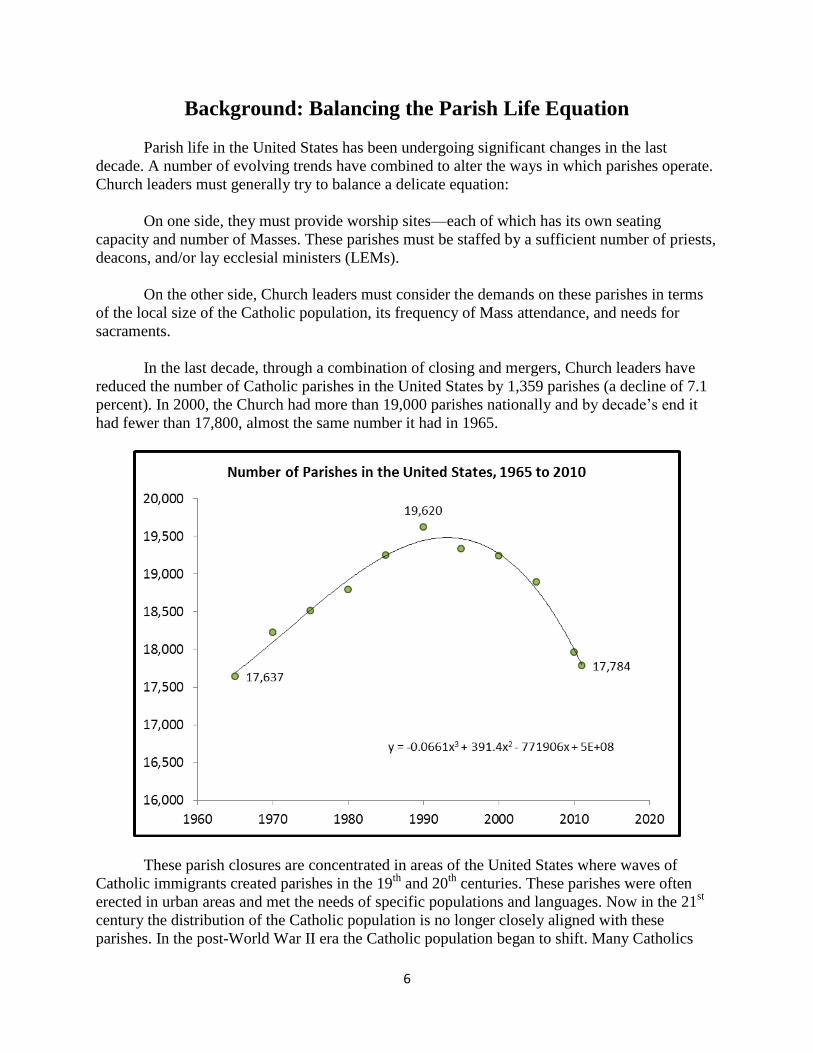
In the last decade, through a combination of closing and mergers, Church leaders have
reduced the number of Catholic parishes in the United States by 1,359 parishes (a decline of 7.1
percent). In 2000, the Church had more than 19,000 parishes nationally and by decade’s end it
had fewer than 17,800, almost the same number it had in 1965.
These parish closures are concentrated in areas of the United States where waves of
Catholic immigrants created parishes in the 19th
and 20th
centuries. These parishes were often
erected in urban areas and met the needs of specific populations and languages. Now in the 21st
century the distribution of the Catholic population is no longer closely aligned with these
parishes. In the post-World War II era the Catholic population began to shift. Many Catholics

7
moved to the suburbs out of the urban ethnic enclaves. They also moved away from the Rustbelt
areas of the Northeast and the farming communities of the Midwest into the Sunbelt. New waves
of Catholic immigration from Latin America have led to even more growth in the South from
coast to coast.
The Catholic population has realigned itself in the course of a few generations. People
move, parishes and schools do not. As the map below shows, many of the parish closures and
mergers have been in inner cities of the Northeast and Midwest where Catholic population has
waned. At the same time, it is also the case that in only a few states (dark green) are there a
significant number of new parishes being created.
There are also fewer priests available to serve in these parishes. Although the average
number of priestly ordinations in the U.S. has been about 500 per year in the last 25 years, there
are fewer men being ordained than what is needed to replace an aging clergy population. The
number of diocesan priests in the United States declined by 11 percent in the last decade and
many of these men are now retired or plan to retire in the next decade. Without an increase in the
number of priestly ordinations these declines are expected to continue in the decades ahead.2
2 For a detailed projection of the number of active diocesan priests expected to be available in the U.S. see “Facing
a future with fewer Catholic priests” by Mark M. Gray in Our Sunday Visitor, June 27, 2010.
8
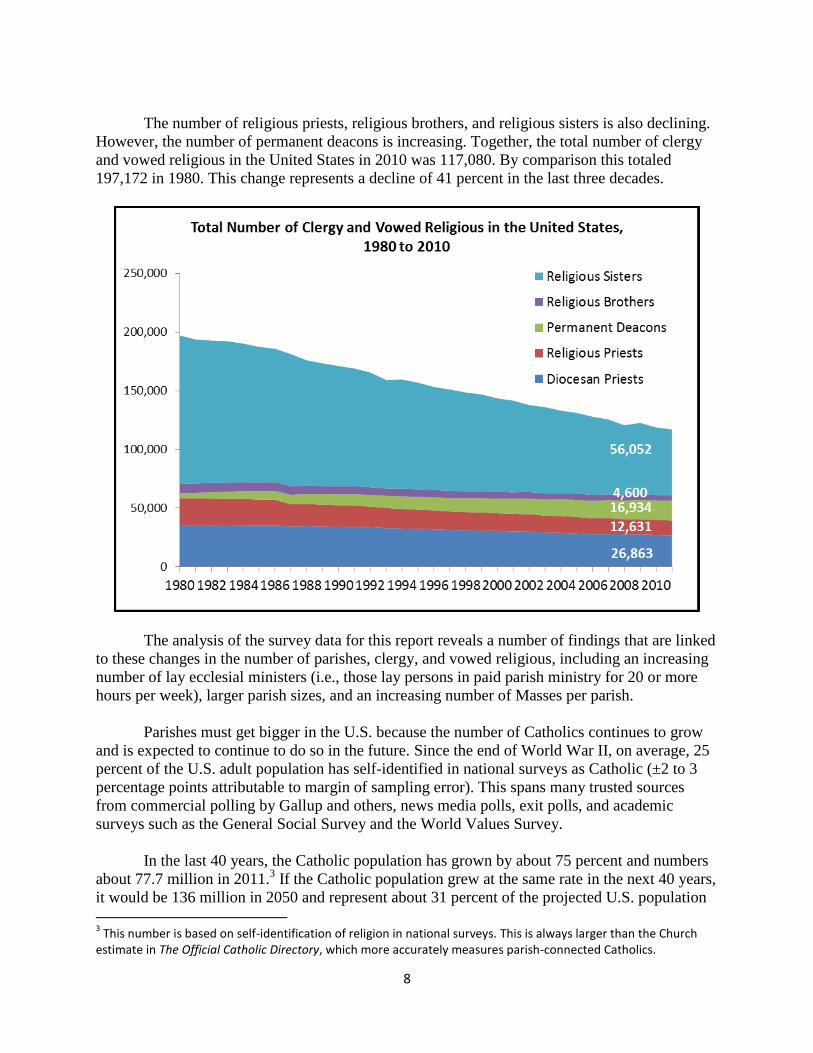
The number of religious priests, religious brothers, and religious sisters is also declining.
However, the number of permanent deacons is increasing. Together, the total number of clergy
and vowed religious in the United States in 2010 was 117,080. By comparison this totaled
197,172 in 1980. This change represents a decline of 41 percent in the last three decades.
The analysis of the survey data for this report reveals a number of findings that are linked
to these changes in the number of parishes, clergy, and vowed religious, including an increasing
number of lay ecclesial ministers (i.e., those lay persons in paid parish ministry for 20 or more
hours per week), larger parish sizes, and an increasing number of Masses per parish.
Parishes must get bigger in the U.S. because the number of Catholics continues to grow
and is expected to continue to do so in the future. Since the end of World War II, on average, 25
percent of the U.S. adult population has self-identified in national surveys as Catholic (±2 to 3
percentage points attributable to margin of sampling error). This spans many trusted sources
from commercial polling by Gallup and others, news media polls, exit polls, and academic
surveys such as the General Social Survey and the World Values Survey.
In the last 40 years, the Catholic population has grown by about 75 percent and numbers
about 77.7 million in 2011.3 If the Catholic population grew at the same rate in the next 40 years,
it would be 136 million in 2050 and represent about 31 percent of the projected U.S. population
3 This number is based on self-identification of religion in national surveys. This is always larger than the Church
estimate in The Official Catholic Directory, which more accurately measures parish-connected Catholics.
9
at that time. This, however, is an unlikely scenario as overall population growth has slowed in
the United States and is expected to slow more as the Baby Boom, and the "echoes" from it,
fade.
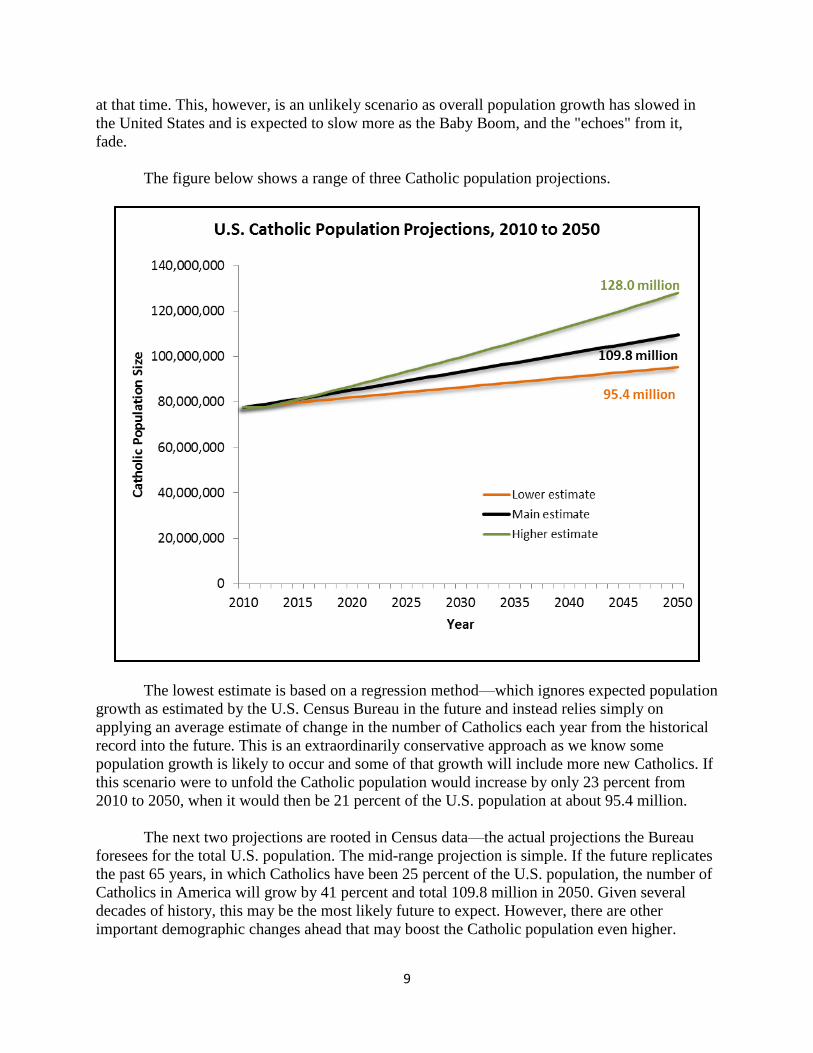
The figure below shows a range of three Catholic population projections.
The lowest estimate is based on a regression method—which ignores expected population
growth as estimated by the U.S. Census Bureau in the future and instead relies simply on
applying an average estimate of change in the number of Catholics each year from the historical
record into the future. This is an extraordinarily conservative approach as we know some
population growth is likely to occur and some of that growth will include more new Catholics. If
this scenario were to unfold the Catholic population would increase by only 23 percent from
2010 to 2050, when it would then be 21 percent of the U.S. population at about 95.4 million.
The next two projections are rooted in Census data—the actual projections the Bureau
foresees for the total U.S. population. The mid-range projection is simple. If the future replicates
the past 65 years, in which Catholics have been 25 percent of the U.S. population, the number of
Catholics in America will grow by 41 percent and total 109.8 million in 2050. Given several
decades of history, this may be the most likely future to expect. However, there are other
important demographic changes ahead that may boost the Catholic population even higher.

10
The final and highest projection accounts for differences by race and ethnicity. In recent
years, polling has consistently indicated that about 60 percent to 65 percent of
Hispanics/Latino(a)s in the United States self-identify as Catholic. However, there is also
evidence that this percentage is dipping slightly lower. This projection assumes that this
percentage falls even further—to only about 55 percent and that Catholic self-identification
among the non-Hispanic population measures about 18.5 percent. Both assumptions are on the
conservative side. Even with these cautious assumptions, the rapid growth expected in this sub-
group will likely boost Catholic population numbers significantly. This projection leads to an
expected growth in the Catholic population of 65 percent between 2010 and 2050, with a
Catholic population total of 128 million in 40 years, representing 29.2 percent of the total U.S.
population.4
Although Mass attendance has declined in the long-term since the 1950s there has been
no recent decline or increase in attendance in the last decade. As Mass attendance remains steady
and the Catholic population grows, this suggests increasing demands on parishes as the real
number of Catholics attending and needing sacraments increases.
4 For more on the expected growth in the U.S. Catholic population see: “Secularism, Fundamentalism, or
Catholicism? The Religious Composition of the United States to 2043” by Vegard Skirbekk, Eric Kaufmann, and Anne Goujon in the Journal for the Scientific Study of Religion, Volume 49, Issue 2, pages 293–310, June 2010.
11
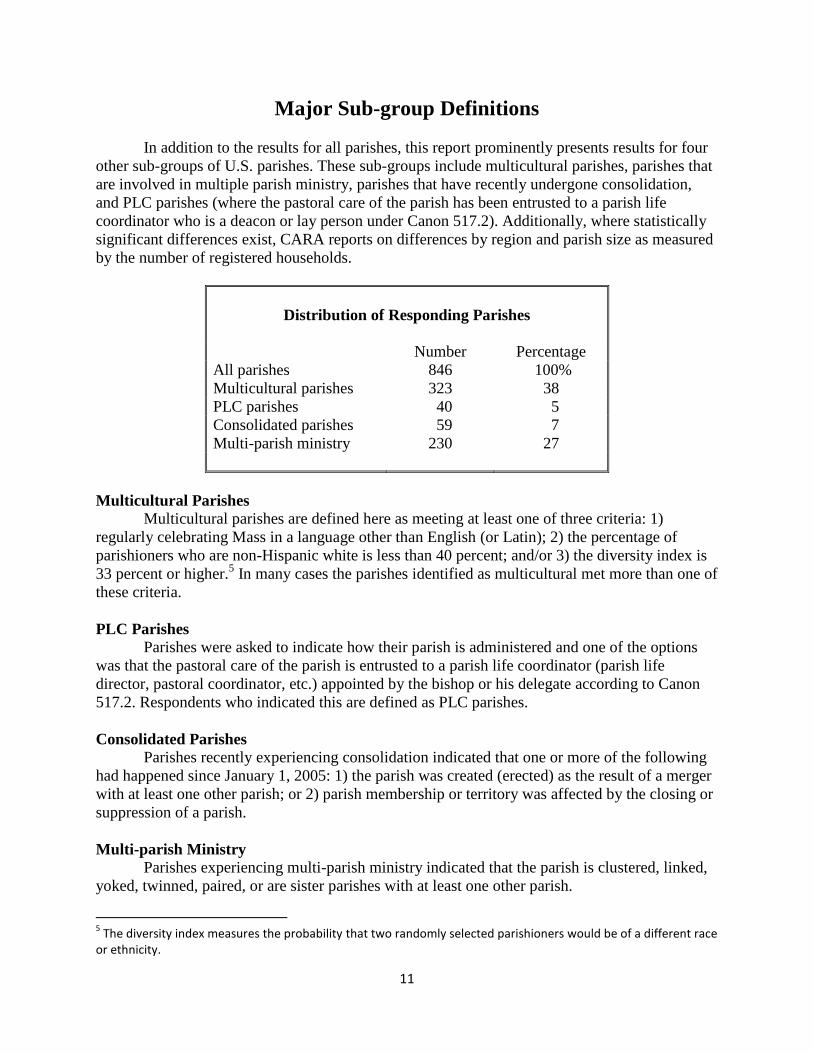
Major Sub-group Definitions
In addition to the results for all parishes, this report prominently presents results for four
other sub-groups of U.S. parishes. These sub-groups include multicultural parishes, parishes that
are involved in multiple parish ministry, parishes that have recently undergone consolidation,
and PLC parishes (where the pastoral care of the parish has been entrusted to a parish life
coordinator who is a deacon or lay person under Canon 517.2). Additionally, where statistically
significant differences exist, CARA reports on differences by region and parish size as measured
by the number of registered households.
Distribution of Responding Parishes
Number Percentage
All parishes 846 100%
Multicultural parishes 323 38
PLC parishes 40 5
Consolidated parishes 59 7
Multi-parish ministry 230 27
Multicultural Parishes
Multicultural parishes are defined here as meeting at least one of three criteria: 1)
regularly celebrating Mass in a language other than English (or Latin); 2) the percentage of
parishioners who are non-Hispanic white is less than 40 percent; and/or 3) the diversity index is
33 percent or higher.5 In many cases the parishes identified as multicultural met more than one of
these criteria.
PLC Parishes
Parishes were asked to indicate how their parish is administered and one of the options
was that the pastoral care of the parish is entrusted to a parish life coordinator (parish life
director, pastoral coordinator, etc.) appointed by the bishop or his delegate according to Canon
517.2. Respondents who indicated this are defined as PLC parishes.
Consolidated Parishes
Parishes recently experiencing consolidation indicated that one or more of the following
had happened since January 1, 2005: 1) the parish was created (erected) as the result of a merger
with at least one other parish; or 2) parish membership or territory was affected by the closing or
suppression of a parish.
Multi-parish Ministry
Parishes experiencing multi-parish ministry indicated that the parish is clustered, linked,
yoked, twinned, paired, or are sister parishes with at least one other parish.
5 The diversity index measures the probability that two randomly selected parishioners would be of a different race
or ethnicity.

12
Characteristics of Responding Parishes
This section of the report provides the characteristics of parishes responding to the survey
such as region and parish size.
Region
The largest share of responding parishes, 37 percent, is in the Midwest. A quarter of
responding parishes are in the Northeast, 22 percent in the South, and 17 percent in the West.
Census Region of Parish
All
Parishes
Multicultural
Parishes
PLC
Parishes
Consolidated
Parishes
Multi-parish
Ministry
Northeast 24% 19% 3% 36% 22%
Midwest 37 17 40 53 57
South 22 32 27 5 13
West 17 32 30 7 8
The Official Catholic Directory (OCD) 2010 indicates that 37 percent of U.S. Catholic
parishes are in the Midwest, 27 percent in the Northeast, 22 percent in the South, and 14 percent
in the West. Thus, the geographic distribution of responding parishes is very similar to the
distribution of all parishes in the United States.6
Among the sub-groups of parishes, PLC, consolidated, and multi-parish ministry parishes
more likely to be in the Midwest than any other single region. Multicultural parishes are
concentrated in the South and West.
6 The slight over-representation of parishes in the West is attributable to the sample design, which also takes into
account the number of Catholics in this region. The West, on average, has fewer parishes than other regions but many more parishioners per parish. To best measure parish life one needs to account for both the proportion of Catholic parishes and the proportion of Catholic parishioners in dioceses when creating the sample design.

13
Age of Parish
About a third of U.S. Catholic parishes (32 percent) were established after 1950. The
average year of parish founding is 1920. The oldest responding parish is in Maryland and was
erected in 1674. The newest parish was erected in 2009 in Texas.
Year the parish was founded (erected as a parish):
All
Parishes
Multicultural
Parishes
PLC
Parishes
Consolidated
Parishes
Multi-parish
Ministry
Before 1875 19% 11% 27% 9% 29%
1875 to 1899 14 12 13 12 24
1900 to 1925 19 22 15 21 20
1926 to 1950 16 21 13 19 9
1951 to 1975 21 22 25 16 11
1976 or later 11 12 7 24 6
Average: 1920 1928 1916 1939 1903
Median: 1922 1929 1915 1945 1895
More than a quarter of multi-parish ministry parishes and PLC parishes were established
before 1875.
The newest parishes are found in the South and West. Each of these regions has an
average year of parish founding of 1933.

14
Most Recent Parish Construction
Parishes also provided the year of construction for the current church building. On
average, most report the current church building was constructed in the 1940s and 1950s.
Year the present church building was built (main parish church only):
All
Parishes
Multicultural
Parishes
PLC
Parishes
Consolidated
Parishes
Multi-parish
Ministry
Before 1875 5% 3% 8% 5% 8%
1875 to 1899 6 5 5 9 8
1900 to 1925 15 14 13 19 22
1926 to 1950 14 14 24 19 15
1951 to 1975 34 35 24 38 30
1976 or later 26 29 26 10 17
Average: 1949 1953 1945 1940 1939
Median: 1958 1959 1953 1952 1949
Parishes in the South and West are most likely to cite recent construction on the main
parish church. On average, the year of construction is 1960 in the South and 1954 in the West.
15
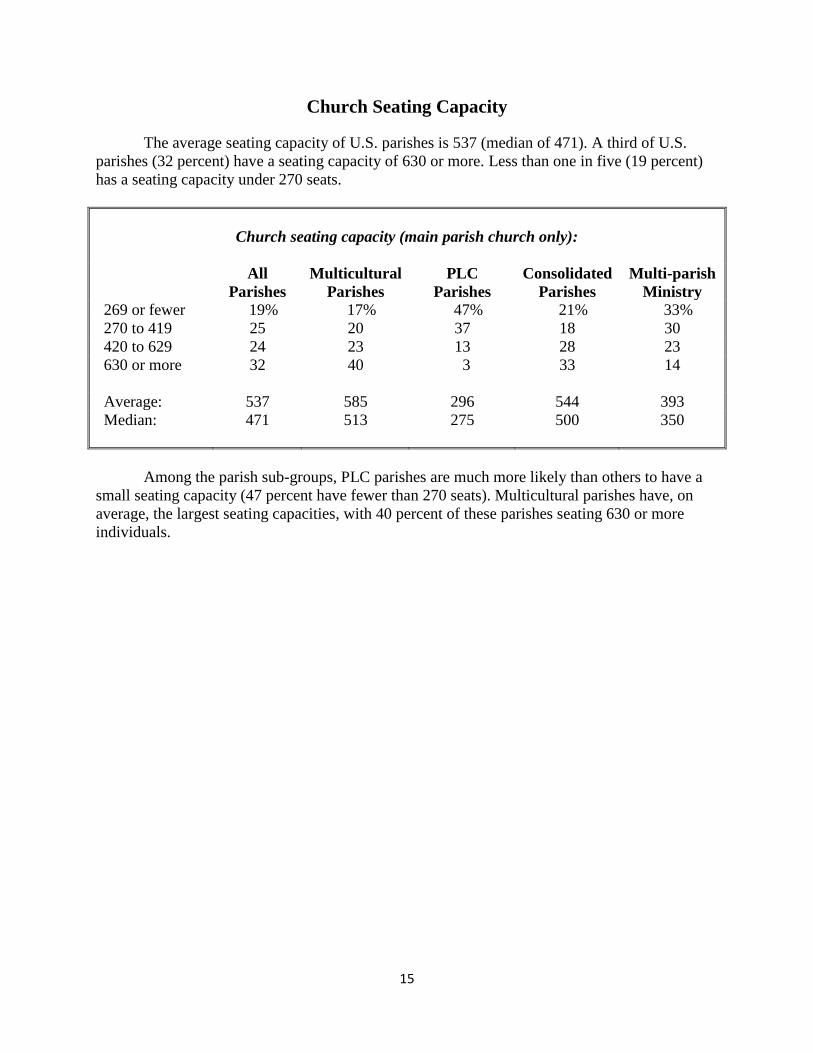
Church Seating Capacity
The average seating capacity of U.S. parishes is 537 (median of 471). A third of U.S.
parishes (32 percent) have a seating capacity of 630 or more. Less than one in five (19 percent)
has a seating capacity under 270 seats.
Church seating capacity (main parish church only):
All
Parishes
Multicultural
Parishes
PLC
Parishes
Consolidated
Parishes
Multi-parish
Ministry
269 or fewer 19% 17% 47% 21% 33%
270 to 419 25 20 37 18 30
420 to 629 24 23 13 28 23
630 or more 32 40 3 33 14
Average: 537 585 296 544 393
Median: 471 513 275 500 350
Among the parish sub-groups, PLC parishes are much more likely than others to have a
small seating capacity (47 percent have fewer than 270 seats). Multicultural parishes have, on
average, the largest seating capacities, with 40 percent of these parishes seating 630 or more
individuals.
16
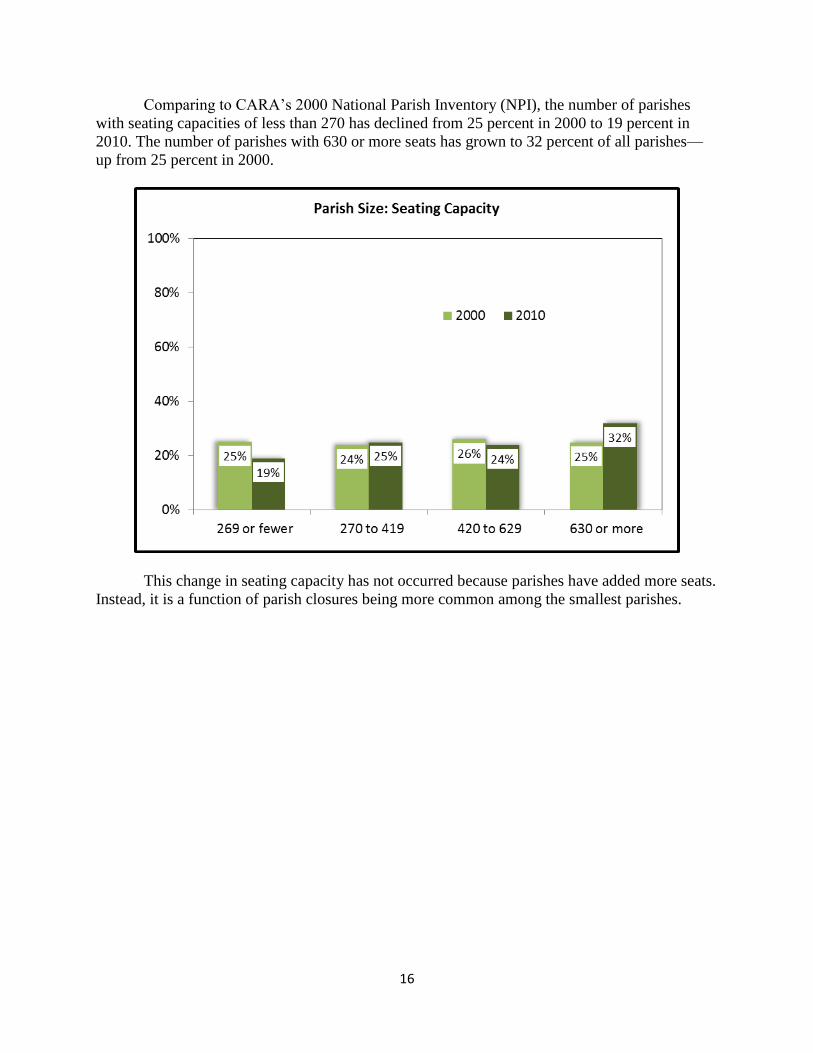
Comparing to CARA’s 2000 National Parish Inventory (NPI), the number of parishes
with seating capacities of less than 270 has declined from 25 percent in 2000 to 19 percent in
2010. The number of parishes with 630 or more seats has grown to 32 percent of all parishes—
up from 25 percent in 2000.
This change in seating capacity has not occurred because parishes have added more seats.
Instead, it is a function of parish closures being more common among the smallest parishes.

17
Number of Registered Households
The average number of registered households in U.S. parishes is 1,168 (median of 761).
A third of parishes (33 percent) have more than 1,200 registered households.
Number of registered families/households:
All
Parishes
Multicultural
Parishes
PLC
Parishes
Consolidated
Parishes
Multi-parish
Ministry
200 or fewer 15% 9% 51% 13% 32%
201 to 549 24 21 41 24 34
550 to 1,200 28 31 0 27 21
1,201 or more 33 39 8 36 13
Average: 1,168 1,445 382 1,236 566
Median: 761 983 200 850 325
Among the parish sub-groups, multicultural parishes and consolidated parishes are most
likely to report larger numbers of registered households. PLC parishes and those using multi-
parish ministry are much more likely to indicate that they have fewer than 550 registered
households.

18
The average number of registered households increased from 855 in 2000 to 1,168 in
2010. The percentage of parishes with 200 or fewer households dropped from 24 percent in 2000
to 15 percent in 2010. Parishes with more than 1,200 registered households now make up a third
of all U.S. parishes.
These changes again are related to the disproportionate numbers of small parishes closing
and/or merging in the last decade.
19
Number of Individual Registered Parishioners
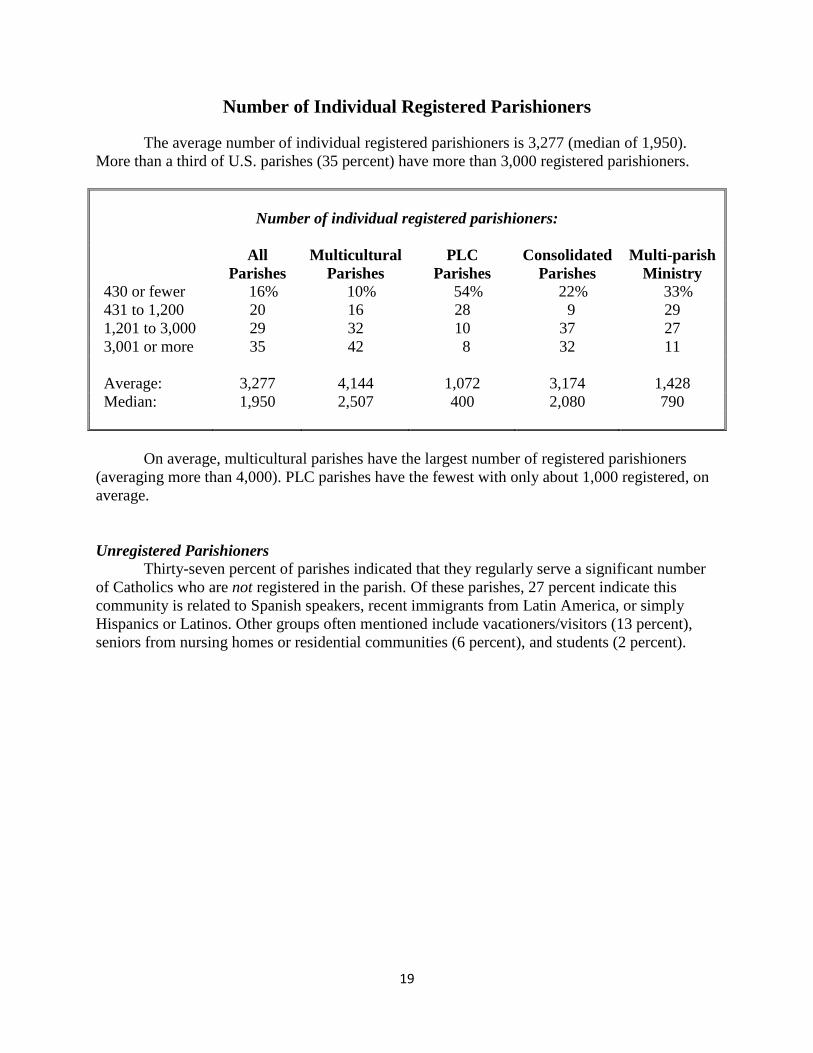
The average number of individual registered parishioners is 3,277 (median of 1,950).
More than a third of U.S. parishes (35 percent) have more than 3,000 registered parishioners.
Number of individual registered parishioners:
All
Parishes
Multicultural
Parishes
PLC
Parishes
Consolidated
Parishes
Multi-parish
Ministry
430 or fewer 16% 10% 54% 22% 33%
431 to 1,200 20 16 28 9 29
1,201 to 3,000 29 32 10 37 27
3,001 or more 35 42 8 32 11
Average: 3,277 4,144 1,072 3,174 1,428
Median: 1,950 2,507 400 2,080 790
On average, multicultural parishes have the largest number of registered parishioners
(averaging more than 4,000). PLC parishes have the fewest with only about 1,000 registered, on
average.
Unregistered Parishioners
Thirty-seven percent of parishes indicated that they regularly serve a significant number
of Catholics who are not registered in the parish. Of these parishes, 27 percent indicate this
community is related to Spanish speakers, recent immigrants from Latin America, or simply
Hispanics or Latinos. Other groups often mentioned include vacationers/visitors (13 percent),
seniors from nursing homes or residential communities (6 percent), and students (2 percent).

20
The average number of registered individual parishioners in U.S. parishes increased from
2,260 in 2000 to 3,283 in 2010. The percentage of parishes with 430 or fewer households
dropped from 25 percent in 2000 to 16 percent in 2010. Parishes with more than 3,000 registered
households now make up 35 percent of all U.S. parishes.

21
Mass Attendance
On average, U.S. parishes have 1,100 Mass attenders at all Saturday Vigil and Sunday
Masses on a typical Sunday in October.7 The median attendance as a percentage of all registered
parishioners is 38 percent and the median capacity used (seating capacity multiplied times the
number of Masses) is 47 percent.
Total number of persons (adults and children) attending
Sunday/Saturday Vigil Masses on a typical weekend in October:
All
Parishes
Multicultural
Parishes
PLC
Parishes
Consolidated
Parishes
Multi-parish
Ministry
344 or fewer 25% 18% 73% 30% 48%
345 to 749 25 19 16 16 30
750 to 1,399 24 26 3 32 15
1,400 or more 26 37 8 22 7
Average: 1,110 1,482 352 972 499
Median: 750 1,000 190 793 350
Median
attenders as a
% of registered:
38%
40%
53%
38%
44%
Median
attenders as a
% of capacity*:
47%
47%
47%
42%
50%
*Capacity is seating capacity of the main church multiplied by the number of Sunday/Saturday Vigil Masses.
In 2000, the average number of Mass attenders per parish was 966. The 2010 average of
1,110 is 15 percent larger. Whether measured by surveys or OCD data, the U.S. Catholic
population is estimated to have grown by 9 percent during this period. With Mass attendance
growing slightly more quickly than the population overall this is an indication of a slight uptick
in Mass attendance in the last decade. However, CARA has conducted 20 national surveys of
self-identified adult Catholics during this period and there has seen no increase or decrease in
Mass attendance measured during this period (see page 8).
7 The month of October is the period many dioceses use to conduct Mass attendance head counts. This time of
year is selected because it is in Ordinary Time and not affected by higher Mass attendance rates, such as in Lent or Advent or lower than typical attendance rates, which occur in many parishes in summer months.
22
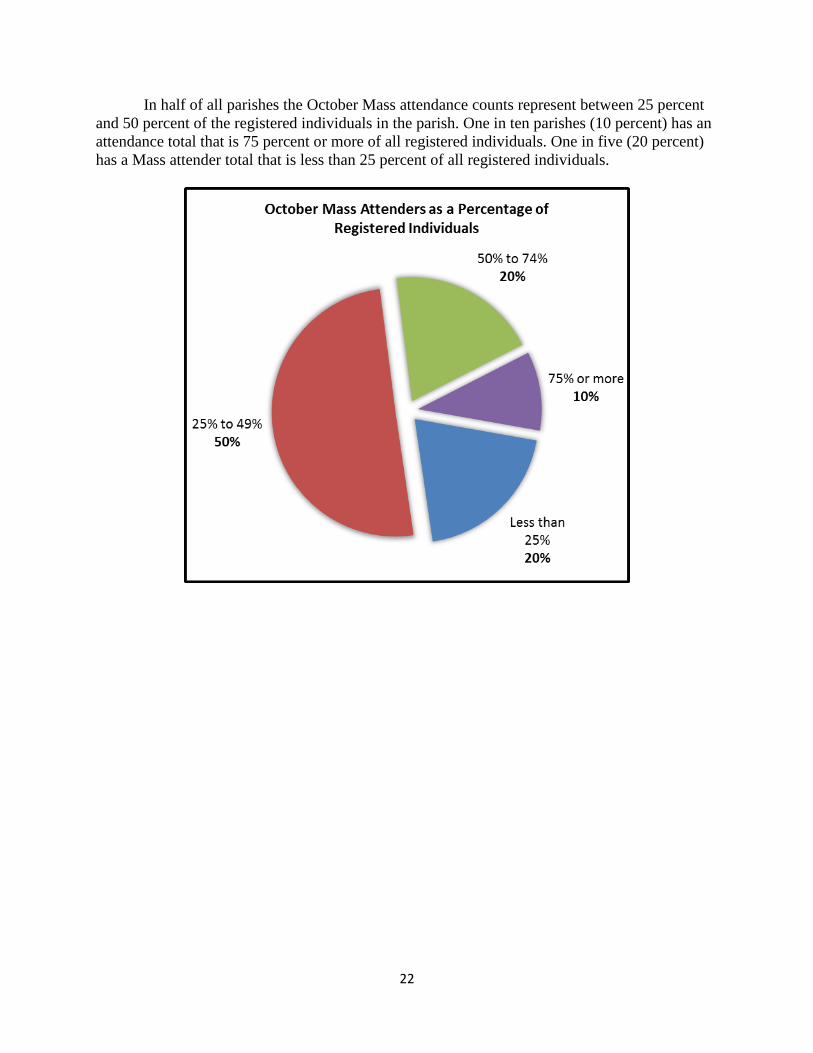
In half of all parishes the October Mass attendance counts represent between 25 percent
and 50 percent of the registered individuals in the parish. One in ten parishes (10 percent) has an
attendance total that is 75 percent or more of all registered individuals. One in five (20 percent)
has a Mass attender total that is less than 25 percent of all registered individuals.
23
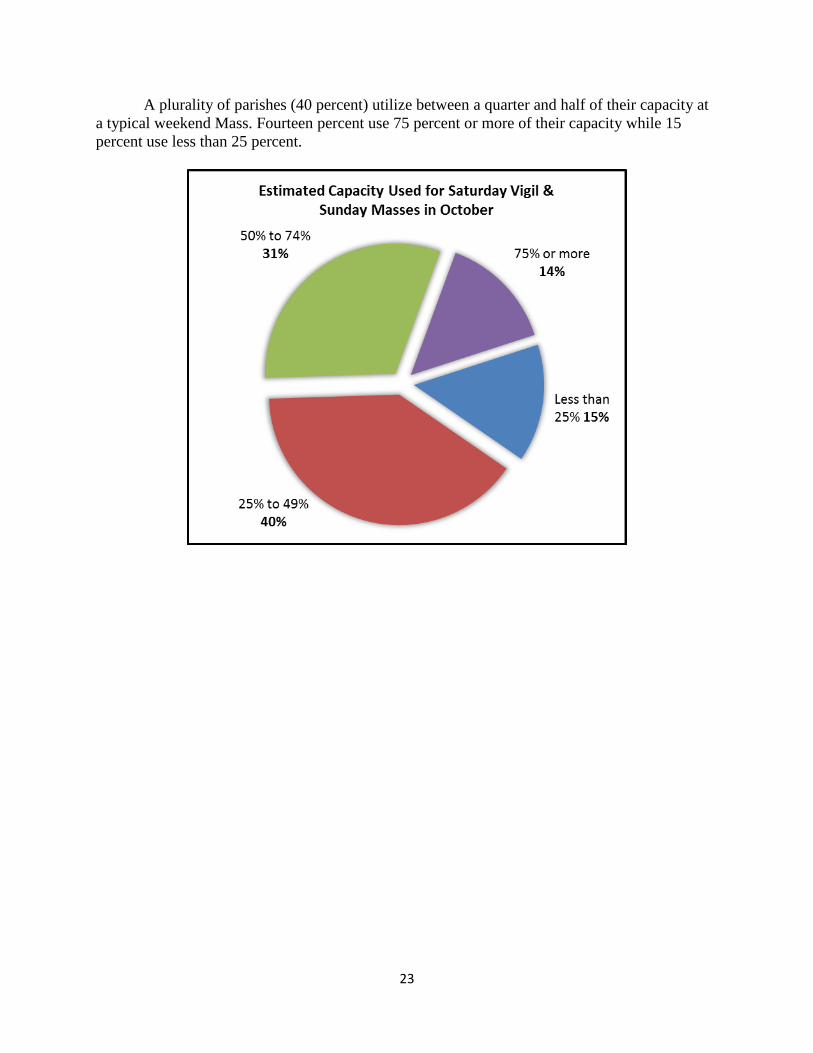
A plurality of parishes (40 percent) utilize between a quarter and half of their capacity at
a typical weekend Mass. Fourteen percent use 75 percent or more of their capacity while 15
percent use less than 25 percent.
24
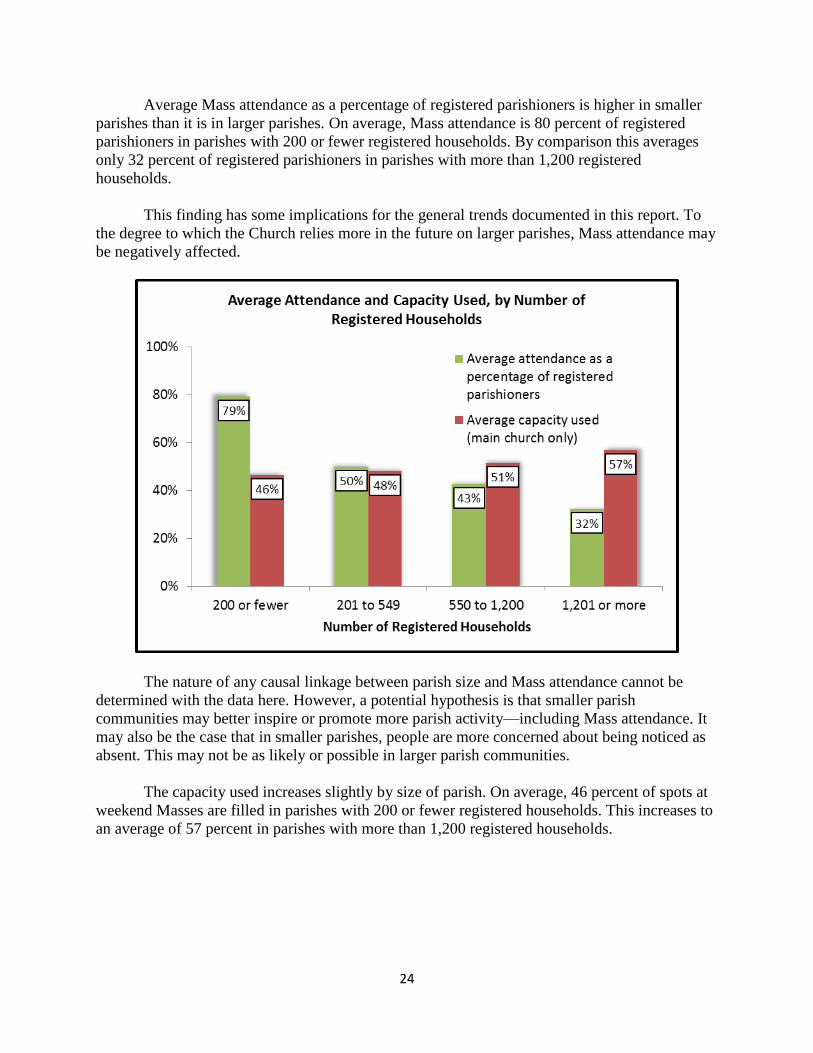
Average Mass attendance as a percentage of registered parishioners is higher in smaller
parishes than it is in larger parishes. On average, Mass attendance is 80 percent of registered
parishioners in parishes with 200 or fewer registered households. By comparison this averages
only 32 percent of registered parishioners in parishes with more than 1,200 registered
households.
This finding has some implications for the general trends documented in this report. To
the degree to which the Church relies more in the future on larger parishes, Mass attendance may
be negatively affected.
The nature of any causal linkage between parish size and Mass attendance cannot be
determined with the data here. However, a potential hypothesis is that smaller parish
communities may better inspire or promote more parish activity—including Mass attendance. It
may also be the case that in smaller parishes, people are more concerned about being noticed as
absent. This may not be as likely or possible in larger parish communities.
The capacity used increases slightly by size of parish. On average, 46 percent of spots at
weekend Masses are filled in parishes with 200 or fewer registered households. This increases to
an average of 57 percent in parishes with more than 1,200 registered households.

25
There are also some regional differences in both measures of attendance. As the figure
below shows, parishes in the South have the highest average Mass attendance as a percentage of
registered parishioners (52 percent) and parishes in the Northeast have the lowest (41 percent).
Parishes in the West utilize 59 percent of capacity, on average. Parishes in the Northeast have the
fewest seats filled (47 percent).
26
Worship and Sacraments
This section of the report includes results related to the number of Masses, sacraments,
and other ceremonies celebrated in parishes.
Number of Worship Sites
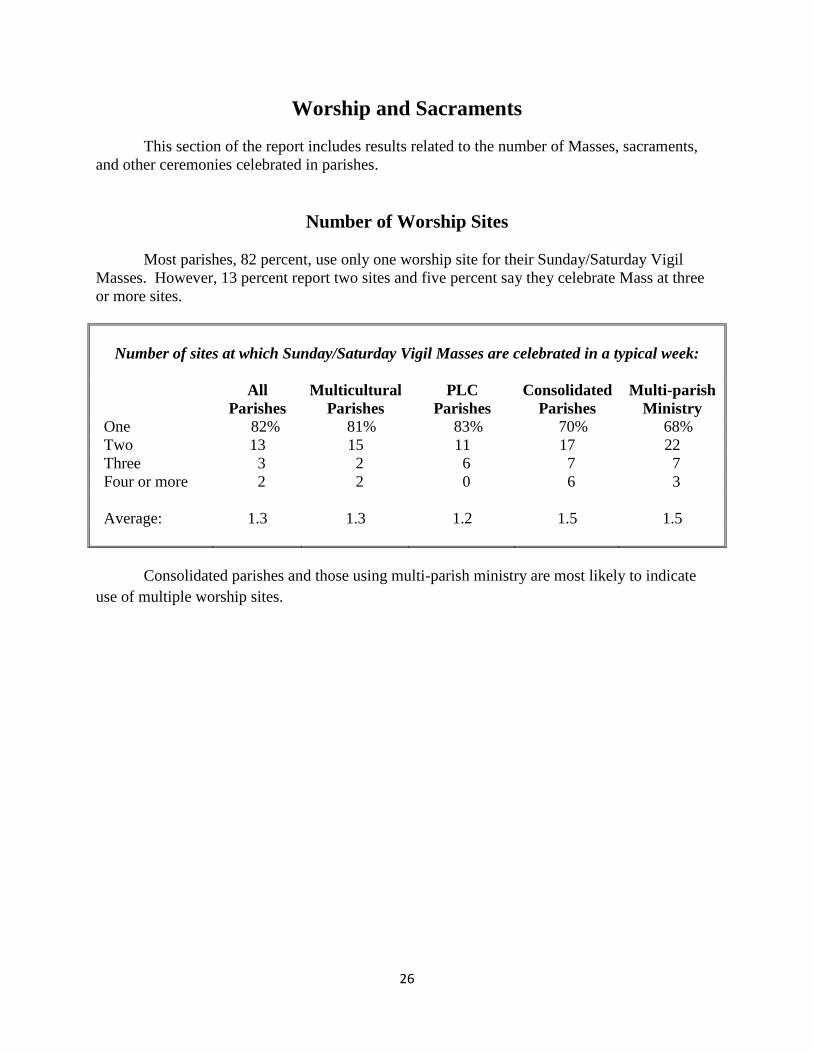
Most parishes, 82 percent, use only one worship site for their Sunday/Saturday Vigil
Masses. However, 13 percent report two sites and five percent say they celebrate Mass at three
or more sites.
Number of sites at which Sunday/Saturday Vigil Masses are celebrated in a typical week:
All
Parishes
Multicultural
Parishes
PLC
Parishes
Consolidated
Parishes
Multi-parish
Ministry
One 82% 81% 83% 70% 68%
Two 13 15 11 17 22
Three 3 2 6 7 7
Four or more 2 2 0 6 3
Average: 1.3 1.3 1.2 1.5 1.5
Consolidated parishes and those using multi-parish ministry are most likely to indicate
use of multiple worship sites.

27
Number of Weekend Masses per Week
On average, parishes celebrate about four Sunday/Saturday Vigil Masses per week (an
average of 3.8 and a median of 4.0). Only one in ten parishes has a single weekend Mass and 16
percent of parishes have six or more Sunday/Saturday Vigil Masses.
Total number of Sunday/Saturday Vigil Masses each week:
All
Parishes
Multicultural
Parishes
PLC
Parishes
Consolidated
Parishes
Multi-parish
Ministry
One 10% 6% 41% 12% 22%
Two 13 9 36 9 24
Three 26 17 10 24 27
Four 23 23 0 24 16
Five 12 14 3 17 4
Six 9 16 5 5 5
Seven or more 7 15 0 9 2
Average: 3.8 4.5 2.3 4.1 2.8
Median: 4.0 4.0 2.0 4.0 3.0
Multicultural parishes are more likely than other sub-groups of parishes to celebrate five
or more weekend Masses per parish. This is in part due to celebrations of Mass in multiple
languages. PLC parishes are much more likely than other parishes to celebrate only one weekend
Mass. This is in part due to the limited availability of priests at these parishes.
28
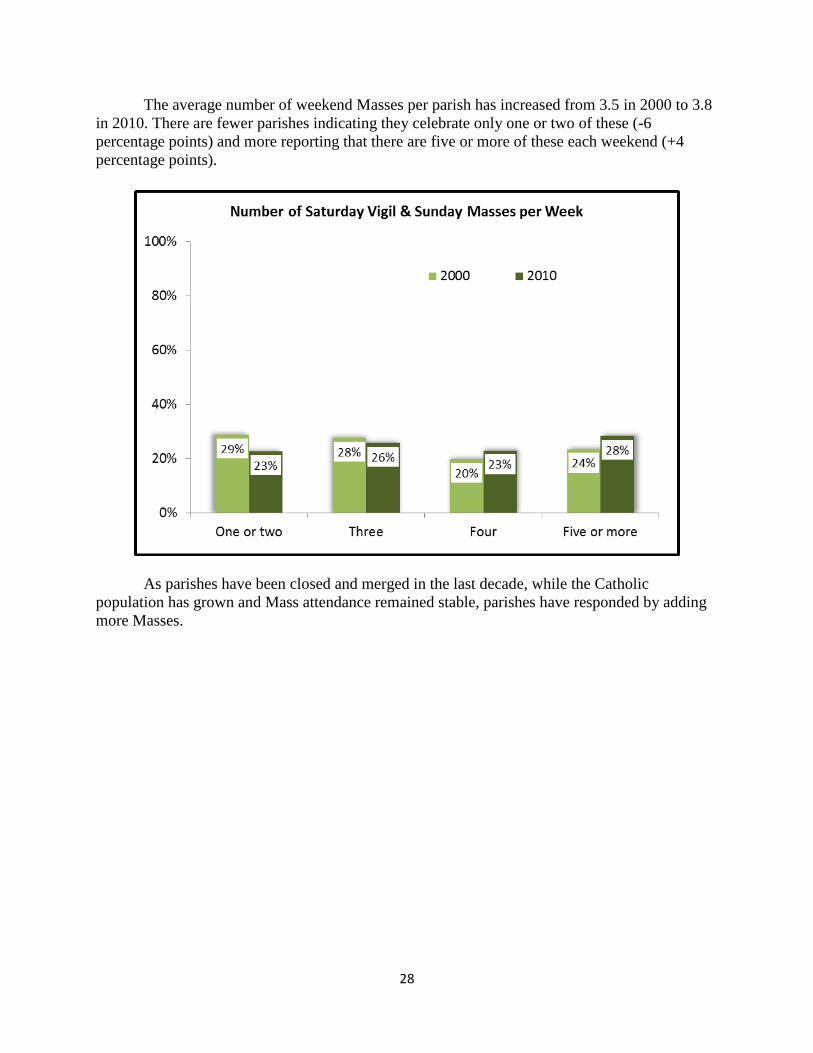
The average number of weekend Masses per parish has increased from 3.5 in 2000 to 3.8
in 2010. There are fewer parishes indicating they celebrate only one or two of these (-6
percentage points) and more reporting that there are five or more of these each weekend (+4
percentage points).
As parishes have been closed and merged in the last decade, while the Catholic
population has grown and Mass attendance remained stable, parishes have responded by adding
more Masses.

29
Number of Weekday Masses per Week
Parishes have an average of 5.3 Masses on weekdays (Monday through Saturday
morning). Fifty-three percent have between four and six of these per week. Four percent of
parishes (many of these PLC parishes) have no weekday Masses.
Total number of weekday Masses each week (Monday through Saturday morning):
All
Parishes
Multicultural
Parishes
PLC
Parishes
Consolidated
Parishes
Multi-parish
Ministry
None 4% 2% 36% 0% 7%
One 9 6 25 16 13
Two 7 6 6 12 11
Three 7 4 6 0 9
Four 21 15 8 36 22
Five 19 19 8 7 17
Six 13 18 0 5 9
Seven 4 6 3 7 3
Eight 1 3 0 0 1
Nine 2 3 3 7 1
Ten 2 2 3 5 1
Eleven or more 11 18 2 5 6
Average: 5.3 6.1 2.4 4.7 4.1
Median: 5.0 5.0 1.0 4.0 4.0

30
Number of Other Services per Week
Most parishes, 94 percent, do not report any Sunday Celebrations in the Absence of a
Priest annually. These are most commonly celebrated in PLC parishes. More than a third (35
percent) of parishes entrusted to a PLC report at least one of these celebrations in 2009.
However, even here most indicate celebrating fewer than ten a year.
Weekday communion services occur with some frequency in more than four in ten
parishes (42 percent). However, there is a bimodal distribution with 15 percent of parishes
indicating they celebrate fewer than ten of these per year and 16 percent indicating they celebrate
40 or more. As with Sunday Celebrations in the Absence of a Priests these are most common and
most frequently available in parishes entrusted to a PLC.
Total number of Sunday Celebrations in the Absence of a Priest during 2009:
All
Parishes
Multicultural
Parishes
PLC
Parishes
Consolidated
Parishes
Multi-parish
Ministry
None 94% 93% 65% 95% 91%
1 to 9 4 4 23 3 5
10 to 19 1 0 2 0 1
20 to 29 0 0 0 2 1
30 to 39 0 1 2 0 1
40 or more 1 2 8 0 1
Total number of weekday communion services during 2009:
All
Parishes
Multicultural
Parishes
PLC
Parishes
Consolidated
Parishes
Multi-parish
Ministry
None 58% 58% 28% 58% 56%
1 to 9 15 15 12 17 17
10 to 19 7 8 17 5 8
20 to 29 3 4 0 7 1
30 to 39 1 2 0 0 1
40 or more 16 13 43 13 17
31
Masses Celebrated in Languages Other than English
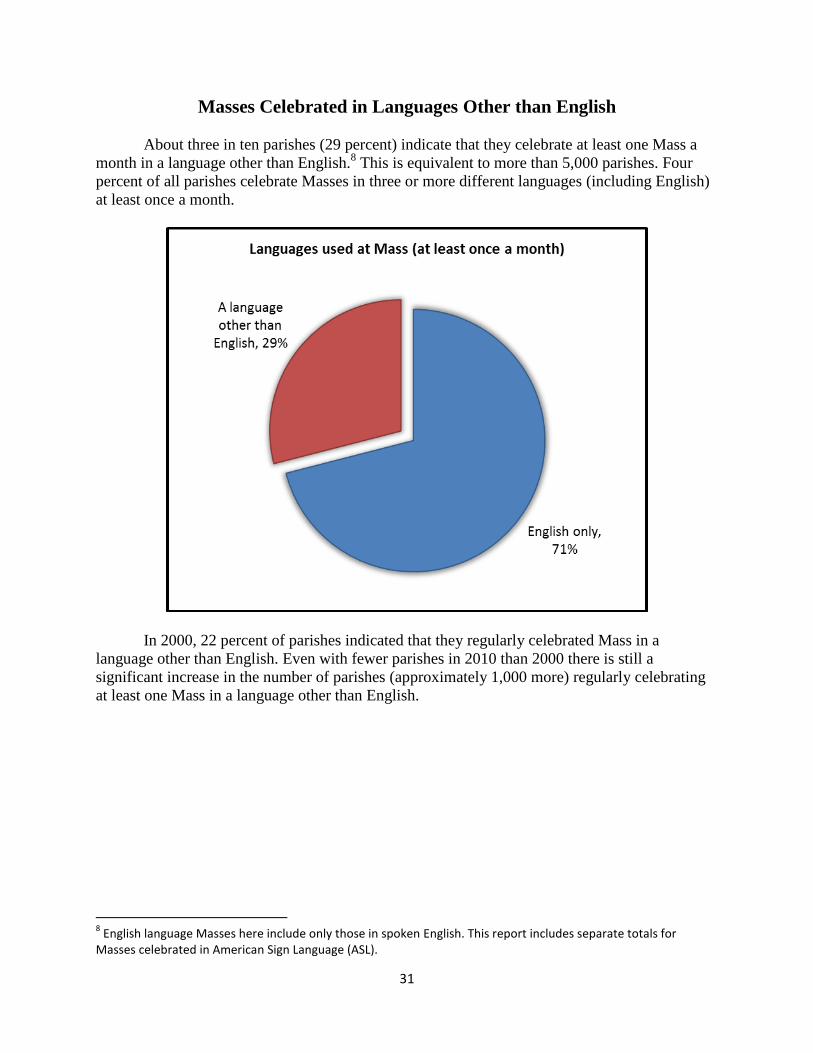
About three in ten parishes (29 percent) indicate that they celebrate at least one Mass a
month in a language other than English.8 This is equivalent to more than 5,000 parishes. Four
percent of all parishes celebrate Masses in three or more different languages (including English)
at least once a month.
In 2000, 22 percent of parishes indicated that they regularly celebrated Mass in a
language other than English. Even with fewer parishes in 2010 than 2000 there is still a
significant increase in the number of parishes (approximately 1,000 more) regularly celebrating
at least one Mass in a language other than English.
8 English language Masses here include only those in spoken English. This report includes separate totals for
Masses celebrated in American Sign Language (ASL).

32
Most of the Masses celebrated in a language other than English in the United States are
celebrated in Spanish (81 percent). Other languages used include Portuguese (6 percent), Latin (4
percent), Vietnamese (2 percent), sign language (1 percent), Italian (1 percent), and Polish (1
percent).
In 2000, 76 percent of parishes regularly celebrating Mass in a language other than
English reported that these were in Spanish. Six percent at that time reported Polish language
Masses and 3 percent Italian.

33
Twenty percent of U.S. parishes celebrate fewer than ten Masses per month in a language
other than English. Five percent celebrate ten to 19 of these, and an additional 3 percent celebrate
20 or more per month. Multicultural parishes are significantly more likely than others to indicate
celebration of Masses in a language other than English.
Masses Celebrated in Languages other than English per Month:
All
Parishes
Multicultural
Parishes
PLC
Parishes
Consolidated
Parishes
Multi-parish
Ministry
None 72% 30% 63% 75% 81%
1 to 9 20 49 23 13 15
10 to 19 5 12 12 12 3
20 to 29 1 4 0 0 0
30 to 39 1 3 2 0 1
40 or more 1 2 0 0 0
Overall, about 6 percent of all Masses (weekend and weekday) in the United States are
celebrated in Spanish.
Parishes that regularly celebrate a Mass in a language other than English tend to be larger
in size, have more registered members, and celebrate more Masses than parishes that only
celebrate Mass in English.
Parish Characteristics by Mass Language(s)
Averages
Only English
Masses
Multi-lingual
Masses
Church seating capacity 517 583
Number of Sunday/Saturday Vigil Masses each week 3.3 4.9
Number of weekday Masses each week 4.7 6.4
Number of registered families/households 1,020 1,497
Number of individual registered parishioners 2,157 3,748

34
Feast Days
Nearly four in ten parishes (37 percent) indicate that they have special observances for
particular ethnic or cultural groups in the parish.
The most common specific celebrations noted are for Our Lady of Guadalupe. A total of
21 percent of all U.S. Catholic parishes have some celebration on December 12. Quinceañera are
also noted in 2 percent of parishes.
A variety of other celebrations are reported by parishes, often in reference to a particular
saint or ethnic or cultural group. For Filipinos this includes Simbang Gabi and other similar
celebrations (4 percent of parishes). Mirroring the language data, celebrations are also noted in
one to three percent of all parishes that are specific to Irish, Italian, Polish, Vietnamese, Haitian,
Cuban, Native American, African/African-American, and/or Portuguese Catholics.
Seventy-five percent of all parishes with a special observance are multicultural parishes.

35
Sacraments and Other Celebrations
In a typical parish in 2009, there was one sacrament or rite celebrated for every 18
members. The most frequent celebrations are related to entry into the faith, with 67 of these
celebrated in the average parish each year (including infant, child, and adult baptisms, and
receptions into full communion). These are followed in frequency by first communions, of which
a typical parish celebrated 58 in 2009. On average, there are 44 confirmations, 14 weddings, and
29 funerals celebrated in the typical parish.
Indicate the total number of sacraments or rites
celebrated in the parish in each category during 2009:
Average numbers celebrated per parish, by parish type
All
Parishes
Multicultural
Parishes
PLC
Parishes
Consolidated
Parishes
Multi-parish
Ministry
Baptisms up to age 7: 56.6 95.1 24.8 42.1 24.7
Baptisms age 7+: 6.0 10.4 2.6 5.1 2.8
Receptions into
full communion:
4.3
5.7
2.1
3.5
1.9
First communions: 57.6 82.5 26.6 47.2 23.3
Confirmations: 43.6 54.4 18.0 36.8 20.2
Marriages between
Catholics:
8.9
12.9
3.7
8.3
4.0
Inter-church marriages: 3.5 3.9 1.1 5.1 2.1
Inter-faith marriages: 1.1 1.4 0.5 1.5 0.4
Funerals: 29.0 34.2 8.8 42.4 17.7
All celebrations: 207.9 294.9 84.0 189.4 95.2
Registered parishioners
per celebration:
17.7
16.2
19.7
17.7
17.5
Among sub-groups of parishes, multicultural parishes report the largest numbers of
sacraments celebrated. PLC and multi-parish ministry parishes indicate lower levels of activity.
These differences remain even after controlling for the number of parishioners in the parish. In
multicultural parishes there are 16.2 parishioners for every sacrament or other celebration. By
comparison there are 19.7 for each of these in PLC parishes.
36
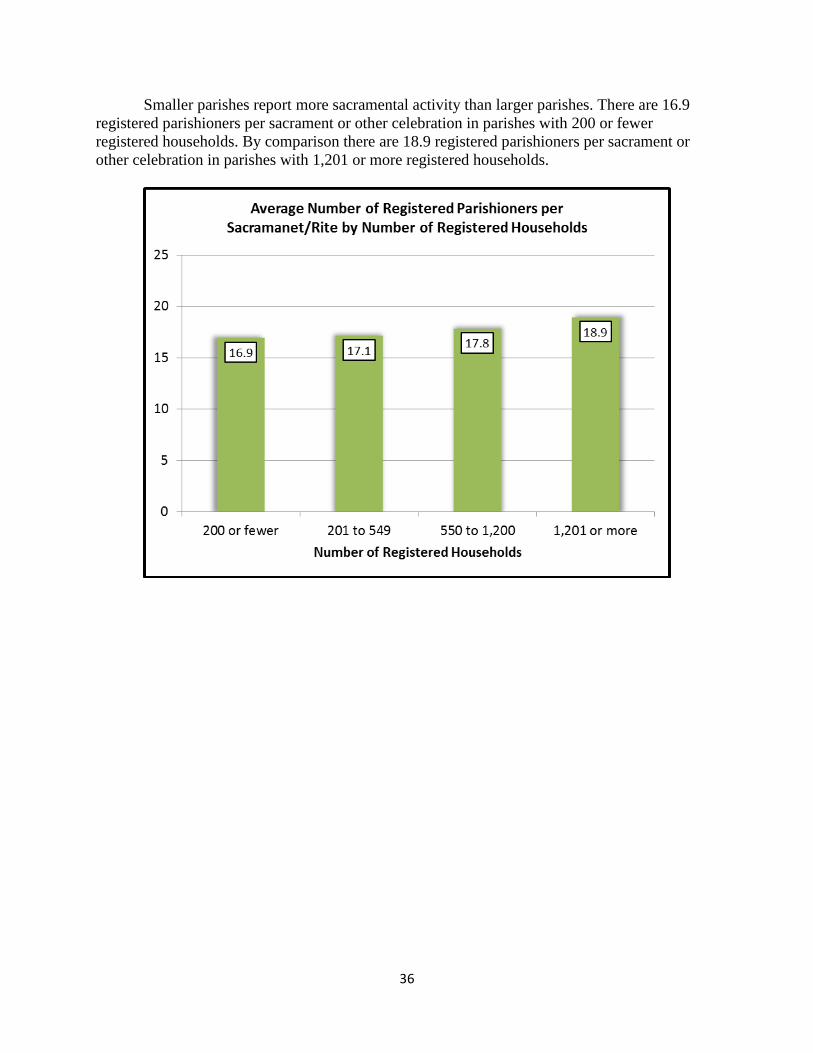
Smaller parishes report more sacramental activity than larger parishes. There are 16.9
registered parishioners per sacrament or other celebration in parishes with 200 or fewer
registered households. By comparison there are 18.9 registered parishioners per sacrament or
other celebration in parishes with 1,201 or more registered households.

37
In demography, the term natural increase is used to describe population growth when
births outnumber deaths. A parallel to this in Church data is to look at the ratio of infant baptisms
to funerals. Where baptisms exceed funerals, growth is likely to occur.9
Infant baptisms are far more common than funerals in both the West and the South
indicating natural growth of the Catholic population in these regions. While infant baptisms also
exceed funerals in the Northeast and Midwest, the differences between these two are slight.
9 Other factors, such as migration and changes in religious affiliation, would matter as well.
38
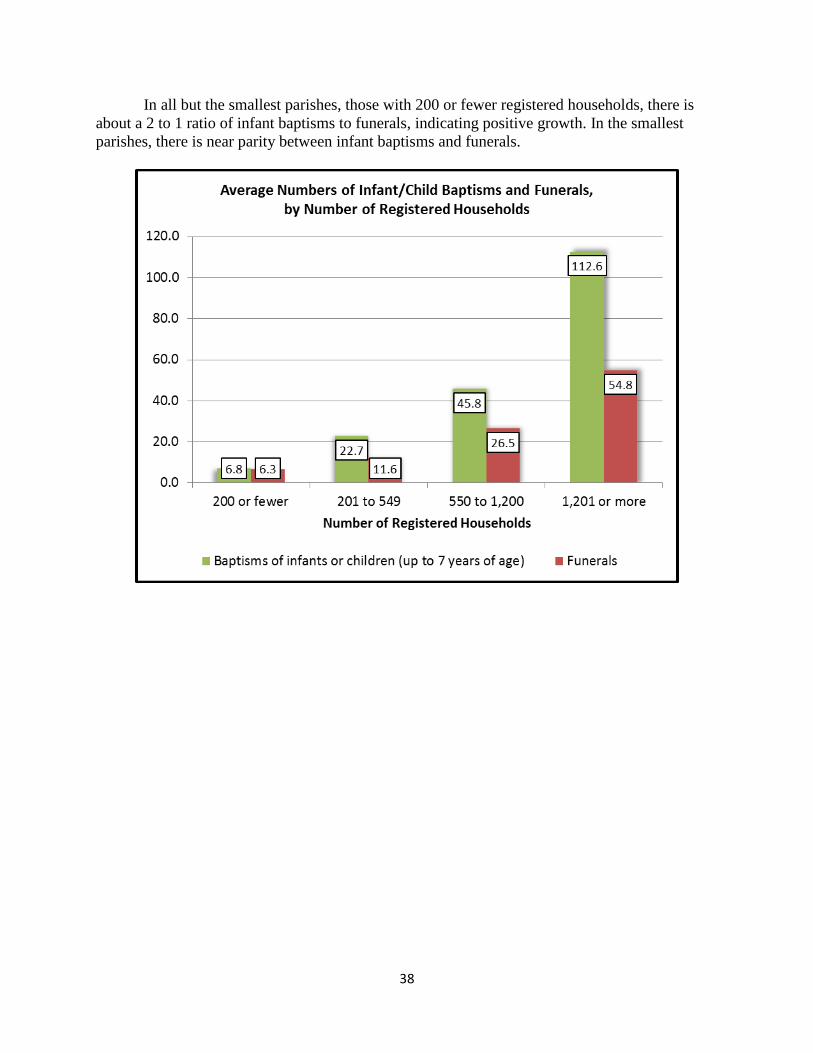
In all but the smallest parishes, those with 200 or fewer registered households, there is
about a 2 to 1 ratio of infant baptisms to funerals, indicating positive growth. In the smallest
parishes, there is near parity between infant baptisms and funerals.
39
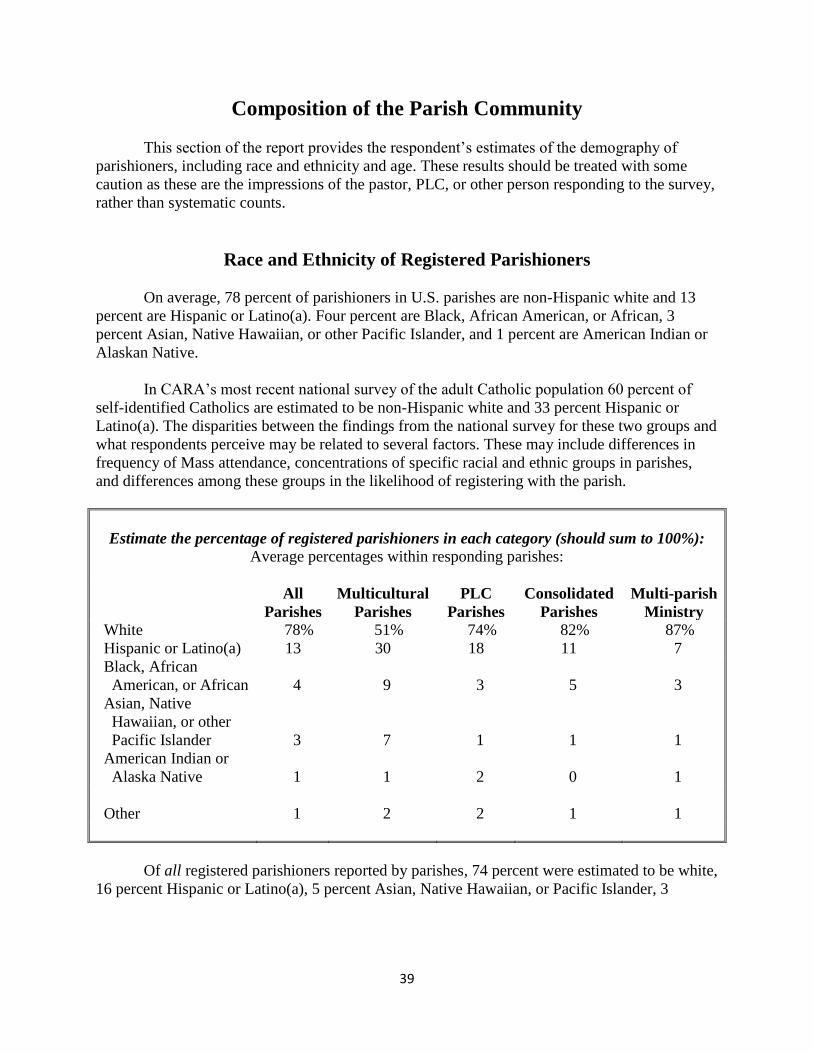
Composition of the Parish Community
This section of the report provides the respondent’s estimates of the demography of
parishioners, including race and ethnicity and age. These results should be treated with some
caution as these are the impressions of the pastor, PLC, or other person responding to the survey,
rather than systematic counts.
Race and Ethnicity of Registered Parishioners
On average, 78 percent of parishioners in U.S. parishes are non-Hispanic white and 13
percent are Hispanic or Latino(a). Four percent are Black, African American, or African, 3
percent Asian, Native Hawaiian, or other Pacific Islander, and 1 percent are American Indian or
Alaskan Native.
In CARA’s most recent national survey of the adult Catholic population 60 percent of
self-identified Catholics are estimated to be non-Hispanic white and 33 percent Hispanic or
Latino(a). The disparities between the findings from the national survey for these two groups and
what respondents perceive may be related to several factors. These may include differences in
frequency of Mass attendance, concentrations of specific racial and ethnic groups in parishes,
and differences among these groups in the likelihood of registering with the parish.
Estimate the percentage of registered parishioners in each category (should sum to 100%):
Average percentages within responding parishes:
All
Parishes
Multicultural
Parishes
PLC
Parishes
Consolidated
Parishes
Multi-parish
Ministry
White 78% 51% 74% 82% 87%
Hispanic or Latino(a) 13 30 18 11 7
Black, African
American, or African
4
9
3
5
3
Asian, Native
Hawaiian, or other
Pacific Islander
3
7
1
1
1
American Indian or
Alaska Native
1
1
2
0
1
Other 1 2 2 1 1
Of all registered parishioners reported by parishes, 74 percent were estimated to be white,
16 percent Hispanic or Latino(a), 5 percent Asian, Native Hawaiian, or Pacific Islander, 3

40
percent Black, African American, or African, 1 percent some other race or ethnicity, and less
than 1 percent American Indian or Alaska Native.10
Parishes in the West and South are more racially and ethnically diverse than those in the
Midwest and Northeast.
10
This is calculated by multiplying the total number of parishioners in each parish by the percentage of registered parishioners in each group. These totals are summed for all responding parishes representing all parishioners for which data are available in all responding parishes.
41
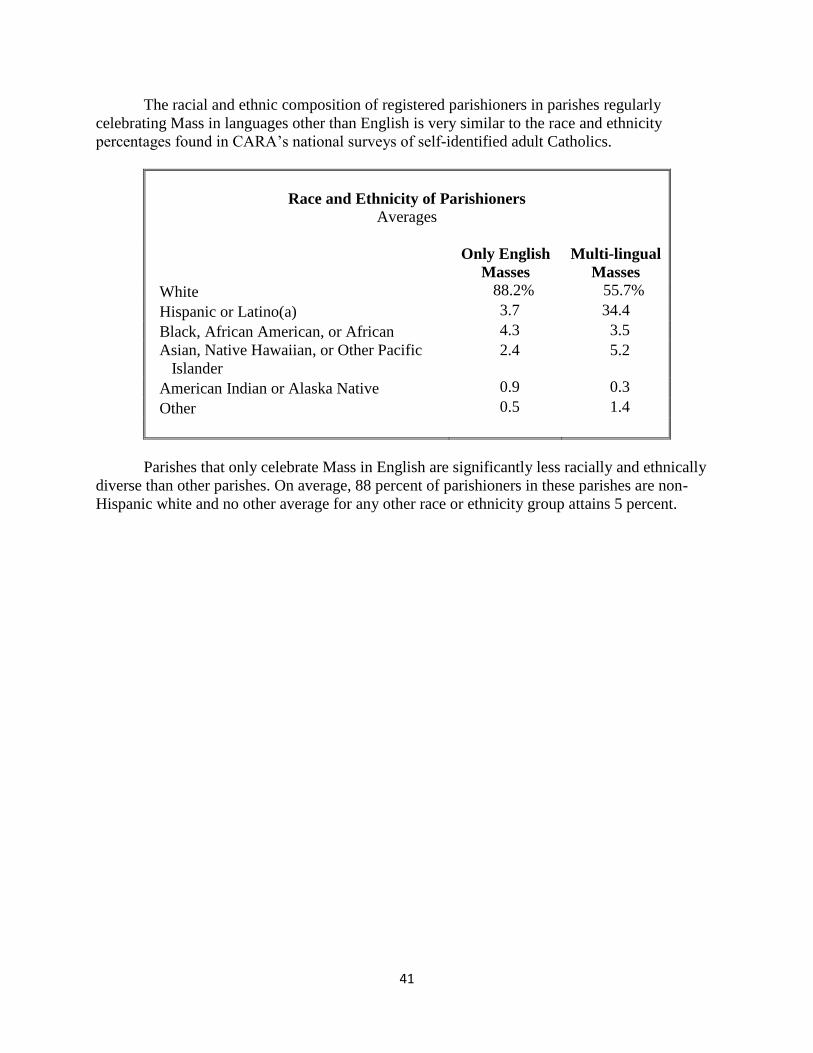
The racial and ethnic composition of registered parishioners in parishes regularly
celebrating Mass in languages other than English is very similar to the race and ethnicity
percentages found in CARA’s national surveys of self-identified adult Catholics.
Race and Ethnicity of Parishioners
Averages
Only English
Masses
Multi-lingual
Masses
White 88.2% 55.7%
Hispanic or Latino(a) 3.7 34.4
Black, African American, or African 4.3 3.5
Asian, Native Hawaiian, or Other Pacific
Islander
2.4 5.2
American Indian or Alaska Native 0.9 0.3
Other 0.5 1.4
Parishes that only celebrate Mass in English are significantly less racially and ethnically
diverse than other parishes. On average, 88 percent of parishioners in these parishes are non-
Hispanic white and no other average for any other race or ethnicity group attains 5 percent.

42
Age of Parishioners
On average, six in ten registered parishioners (60 percent) in U.S. parishes are ages 40
and older. One in five (19 percent) is between the ages of 18 and 39 and the remaining fifth are
under 18 (21 percent). There is not much difference in the age distribution of parishioners among
the different parish sub-groups.
Estimate the percentage of registered parishioners in each category (should sum to 100%):
Average percentages within responding parishes:
All
Parishes
Multicultural
Parishes
PLC
Parishes
Consolidated
Parishes
Multi-parish
Ministry
Children/adolescents
(under 18)
21%
22%
20%
17%
19%
Young adults
(18 to 39)
19
20
17
19
19
Middle aged
(40 to 64)
31
31
29
28
30
Seniors (65+) 29 27 34 36 32
Of all registered parishioners reported by parishes, 32 percent are estimated to be middle
aged (age 40 to 64), 24 percent are children or adolescents (under 18), 23 percent are seniors (65
or older), and 21 percent are young adults (age 18 to 39).

43
Parish Finances
This section of the report details parish finances including parish budgets (e.g., revenue
and expenses) and weekly offertory totals. Note that respondents were asked to exclude any
school budget revenue or expenses.
In the average American parish, the total operating revenue of about $695,000 exceeds
expenses of $626,500. The average surplus is 4.3 percent of revenue. However, 30 percent of
parishes indicate that their expenses exceed their revenue. Of those parishes reporting a deficit,
the average size for the shortfall is 15.8 percent of revenue.
Total weekly offertory is about $9,200 or $9.57 per registered household. Offertory has
grown in the last five years, on average, by more than 14 percent.
Parish Budget and Offertory Collections
Average per parish (excluding schools), by parish type
All
Parishes
Multicultural
Parishes
PLC
Parishes
Consolidated
Parishes
Multi-parish
Ministry
Annual operating
revenue:
$695,291
$756,605
$248,555
$578,943
$346,317
Annual operating
expenses:
$626,589
$723,442
$272,008
$551,871
$313,422
Deficit/surplus as a %
of revenue:
+4.3%
-1.2%
-6.8%
+0.4%
+2.8%
Total weekly offertory
collection:
$9,191
$10,070
$3,216
$7,617
$4,258
Weekly offertory per
registered
household:
$9.57
$8.72
$10.61
$9.96
$9.58
Change in avg. total
weekly offertory in
last 5 years:
+14.5%
+16.1%
+11.0%
+0.9%
+9.3%
PLC parishes are more likely than others to report a deficit. The average revenue in PLC
parishes is smaller than average expenses. On average, these parishes report a deficit that is 6.8
percent of revenue. At the same time, PLC parishes collect more in offertory per registered
household than all other types of parishes.

44
Twenty-three percent of parishes have annual operating revenues of less than $200,000.
Three in ten (29 percent) have budget revenues between $200,000 and $499,999. Twenty-two
percent have revenues of $500,000 to $849,999 and 26 percent have $850,000 or more in
revenue per year.
45
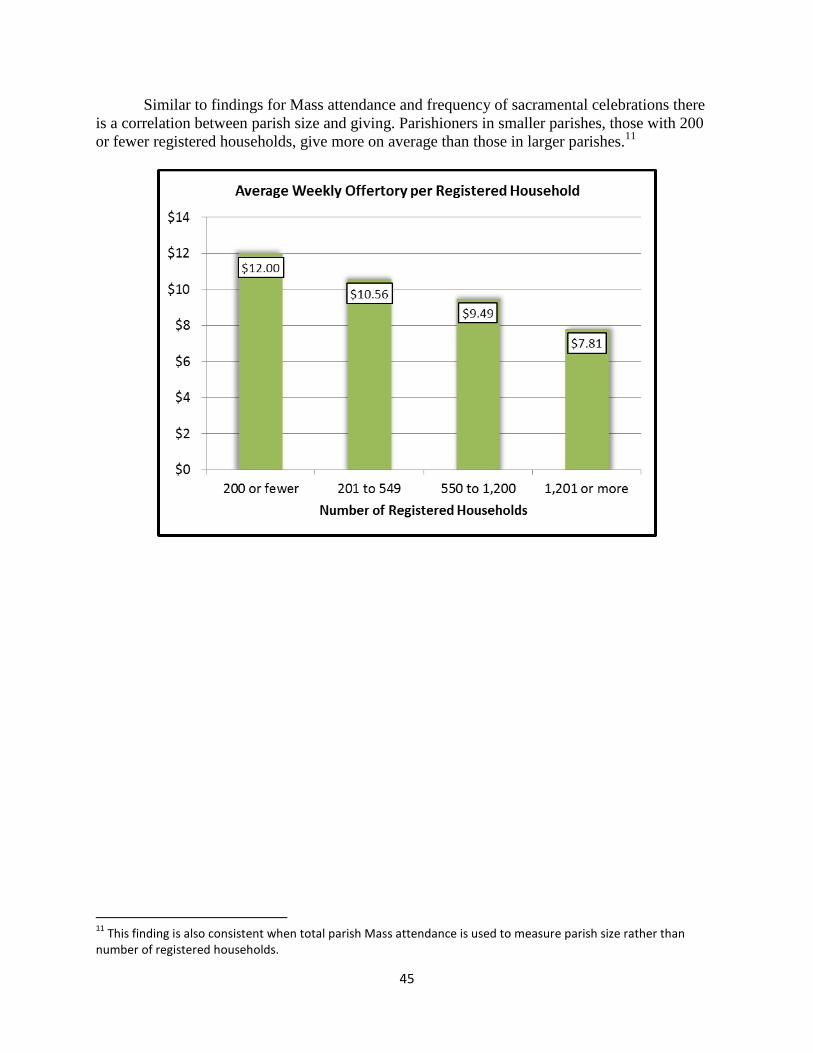
Similar to findings for Mass attendance and frequency of sacramental celebrations there
is a correlation between parish size and giving. Parishioners in smaller parishes, those with 200
or fewer registered households, give more on average than those in larger parishes.11
11
This finding is also consistent when total parish Mass attendance is used to measure parish size rather than number of registered households.

46
Yet, even with more giving, these smaller parishes are more likely than larger parishes to
indicate a budget deficit.12
The largest parishes, those with more than 1,200 registered
households, report the largest average budget surpluses.
12
It is possible that parishioners in these smaller parishes are aware of the financial difficulties of their parish and thus give more, on average, than those in larger parishes, which are less likely to be running a deficit.

47
Parishes in the South report the highest average annual offertory ($602,185) and those in
the Northeast the lowest ($417,812). Parishes in the West have, on average, revenues that are just
a bit higher than expenses. In all other regions these averages represent budget surpluses.
48
Parish Ministries, Programs and Services
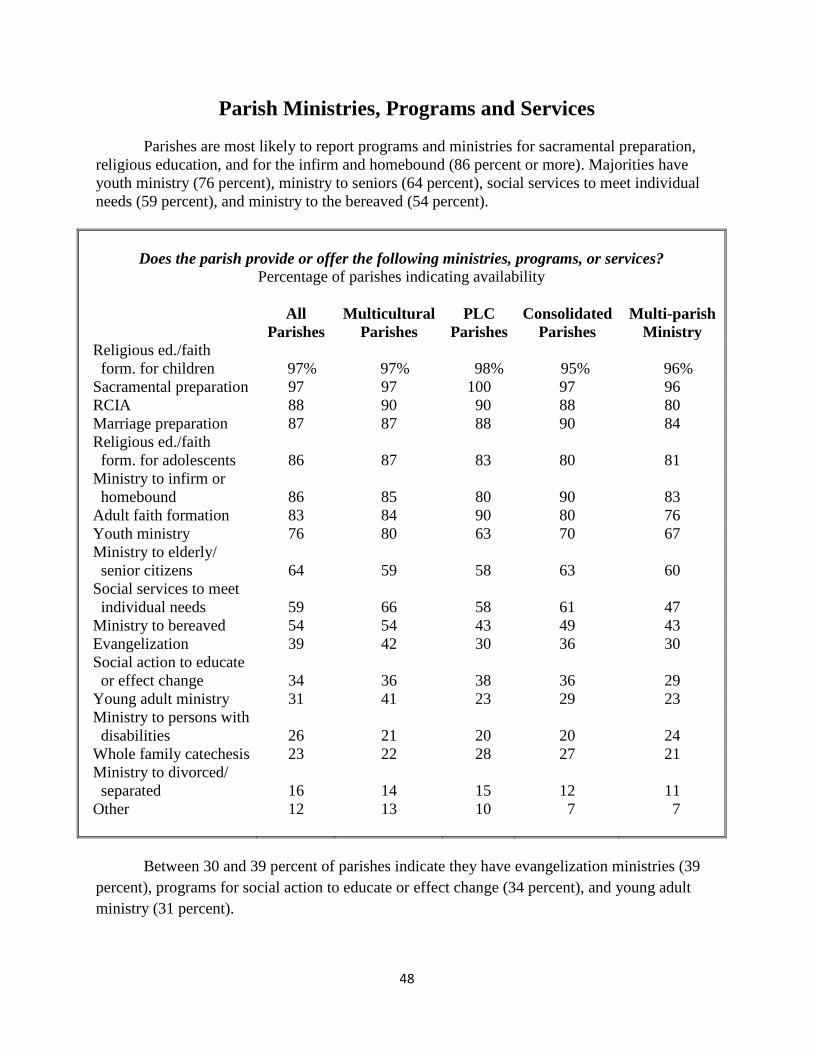
Parishes are most likely to report programs and ministries for sacramental preparation,
religious education, and for the infirm and homebound (86 percent or more). Majorities have
youth ministry (76 percent), ministry to seniors (64 percent), social services to meet individual
needs (59 percent), and ministry to the bereaved (54 percent).
Does the parish provide or offer the following ministries, programs, or services?
Percentage of parishes indicating availability
All
Parishes
Multicultural
Parishes
PLC
Parishes
Consolidated
Parishes
Multi-parish
Ministry
Religious ed./faith
form. for children
97%
97%
98%
95%
96%
Sacramental preparation 97 97 100 97 96
RCIA 88 90 90 88 80
Marriage preparation 87 87 88 90 84
Religious ed./faith
form. for adolescents
86
87
83
80
81
Ministry to infirm or
homebound
86
85
80
90
83
Adult faith formation 83 84 90 80 76
Youth ministry 76 80 63 70 67
Ministry to elderly/
senior citizens
64
59
58
63
60
Social services to meet
individual needs
59
66
58
61
47
Ministry to bereaved 54 54 43 49 43
Evangelization 39 42 30 36 30
Social action to educate
or effect change
34
36
38
36
29
Young adult ministry 31 41 23 29 23
Ministry to persons with
disabilities
26
21
20
20
24
Whole family catechesis 23 22 28 27 21
Ministry to divorced/
separated
16
14
15
12
11
Other 12 13 10 7 7
Between 30 and 39 percent of parishes indicate they have evangelization ministries (39
percent), programs for social action to educate or effect change (34 percent), and young adult
ministry (31 percent).

49
About a quarter or fewer have ministries to persons with disabilities (26 percent), whole
family catechesis (23 percent), and ministry to the divorced or separated (16 percent). Twelve
percent of parishes indicated another ministry that was not listed.
Parishes with greater annual revenue are more likely than those with less revenue to offer
each of these parish ministries.
50
Parishes and Schools
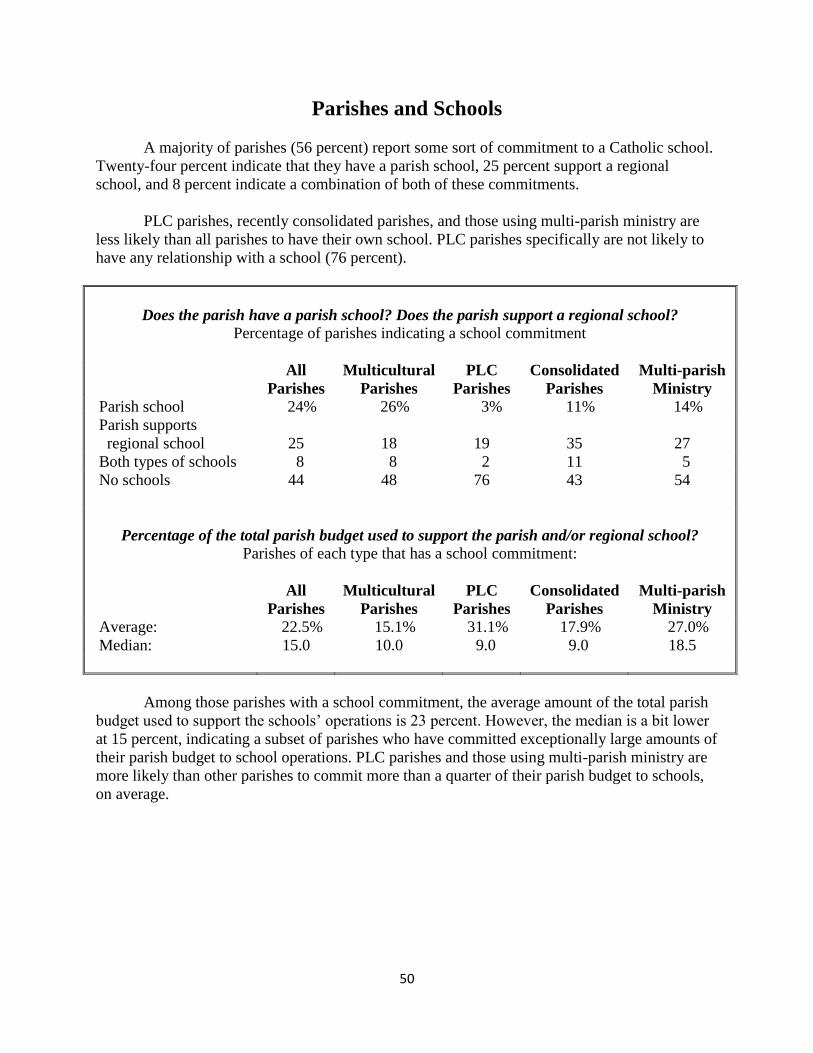
A majority of parishes (56 percent) report some sort of commitment to a Catholic school.
Twenty-four percent indicate that they have a parish school, 25 percent support a regional
school, and 8 percent indicate a combination of both of these commitments.
PLC parishes, recently consolidated parishes, and those using multi-parish ministry are
less likely than all parishes to have their own school. PLC parishes specifically are not likely to
have any relationship with a school (76 percent).
Does the parish have a parish school? Does the parish support a regional school?
Percentage of parishes indicating a school commitment
All
Parishes
Multicultural
Parishes
PLC
Parishes
Consolidated
Parishes
Multi-parish
Ministry
Parish school 24% 26% 3% 11% 14%
Parish supports
regional school
25
18
19
35
27
Both types of schools 8 8 2 11 5
No schools 44 48 76 43 54
Percentage of the total parish budget used to support the parish and/or regional school?
Parishes of each type that has a school commitment:
All
Parishes
Multicultural
Parishes
PLC
Parishes
Consolidated
Parishes
Multi-parish
Ministry
Average: 22.5% 15.1% 31.1% 17.9% 27.0%
Median: 15.0 10.0 9.0 9.0 18.5
Among those parishes with a school commitment, the average amount of the total parish
budget used to support the schools’ operations is 23 percent. However, the median is a bit lower
at 15 percent, indicating a subset of parishes who have committed exceptionally large amounts of
their parish budget to school operations. PLC parishes and those using multi-parish ministry are
more likely than other parishes to commit more than a quarter of their parish budget to schools,
on average.

51
Parish Changes in Last Five Years
This section details results from a series of questions in which the respondent was asked
to reflect on the composition of parish life in 2005—five years before the survey was conducted.
Changes in Parish Registration
The median growth rate of registered households in the last five years in U.S. parishes
was 1.4 percent. The median growth rate for registered individuals was slightly higher at 3.9
percent. Less than one in ten parishes reported no change in their registration numbers. Growing
parishes outnumber parishes losing registrants.

52
Changes in Total Sunday/Saturday Vigil Mass Attendance
Although registration experienced growth in the average parish in the last five years the
median change in total Sunday/Saturday Vigil Mass attendance in U.S. is flat indicating neither
growth nor decline. Five percent have experienced Mass attendance declines of 50 percent or
more while the same percentage has experienced increases of 50 percent or more. As the figure
below shows, there is generally a balance with some parishes experiencing growth and others
decline. Parishes experiencing no change in Mass attendance or declines outnumber those with
growth (58 percent compared to 42 percent).
53
Budget Changes
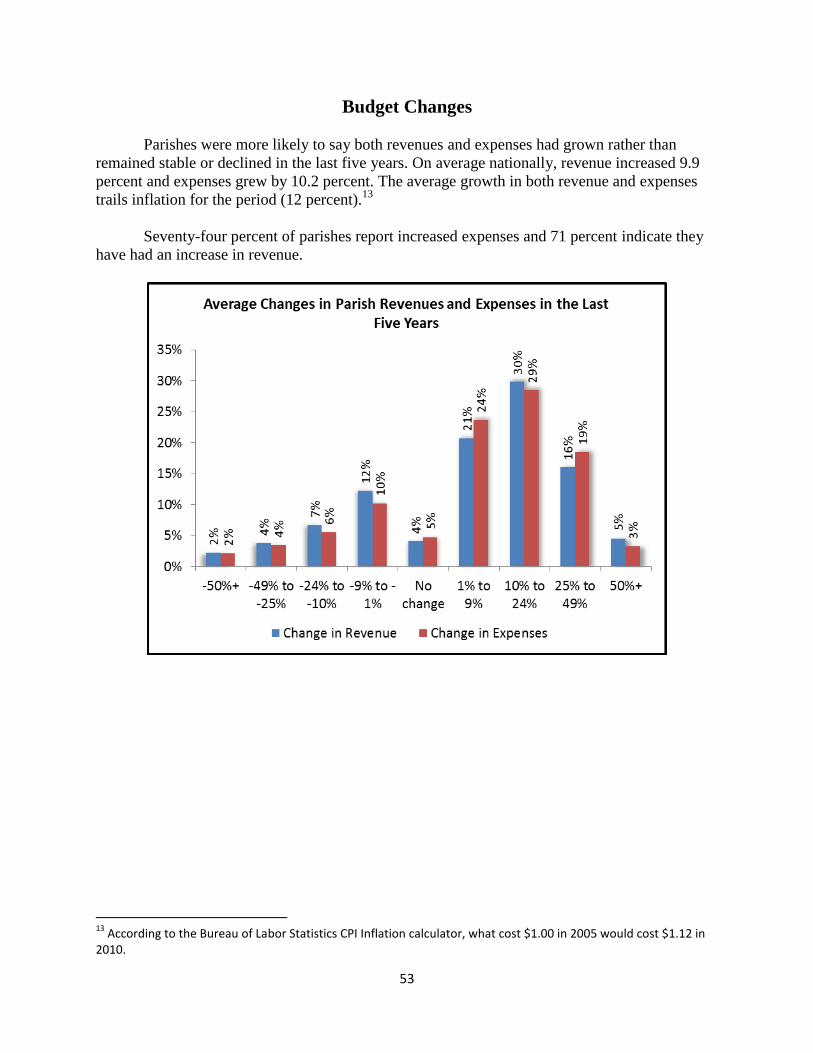
Parishes were more likely to say both revenues and expenses had grown rather than
remained stable or declined in the last five years. On average nationally, revenue increased 9.9
percent and expenses grew by 10.2 percent. The average growth in both revenue and expenses
trails inflation for the period (12 percent).13
Seventy-four percent of parishes report increased expenses and 71 percent indicate they
have had an increase in revenue.
13
According to the Bureau of Labor Statistics CPI Inflation calculator, what cost $1.00 in 2005 would cost $1.12 in 2010.

54
Changes in Parishioner Demographics
On average nationally parishes reported fewer non-Hispanic white registered parishioners
in 2010 than they had in 2005. The percentage of registered parishioners who are non-Hispanic
white declined by 1.5 percentage points during this five year period in parishes nationally. On
average, pastors report growth in the number of Hispanic/Latino(a) (1.3 percentage points) and
Asian, Native Hawaiian, and other Pacific Islander (0.5 percentage points) registered
parishioners during this period. These trends are even more evident in multicultural parishes.
Taking in to account differences in parish size and the racial and ethnic changes reported
by pastors, 40 percent of all growth in registered parishioners in U.S. parishes from 2005 to 2010
was among Hispanic/Latino(a)s.
Parishes report little or no change in the age composition of registered parishioners in the
last five years. For example, the national parish average for the percentage of parishioners who
are age 65 or older was 28.5 percent in 2005 and 28.4 percent in 2010.

55
Parish Staffs
This section of the report details the size and composition of parish staffs in the United
States. Respondents were asked to provide a list of all parish staff, excluding those who only
work in a parish school. This included ministry and non-ministry staff, as well as volunteer
staff.14
Race and Ethnicity of Staff Members
Thirteen percent of parish staff in the United States is Hispanic or Latino(a). Among
ministry staff, paid or volunteer, respondents indicated that only 10 percent is Hispanic or Latino
(a). By comparison, respondents indicated that 16 percent of their parishioners are Hispanic or
Latino(a).
Asian, Native Hawaiian, and other Pacific Islanders are also slightly underrepresented on
parish staffs. Eighty-three percent of ministry staff is non-Hispanic white compared to 74 percent
of parishioners.
14
The National Association of Church Personnel Administrators (NACPA) has produced a report on parish staff salaries and benefits entitled Pay & Benefits Survey of Catholic Parishes, 2011 Edition using the survey data. This report does not include salary or benefit information. The NACPA publication is available at: www.nacpa.org.
56
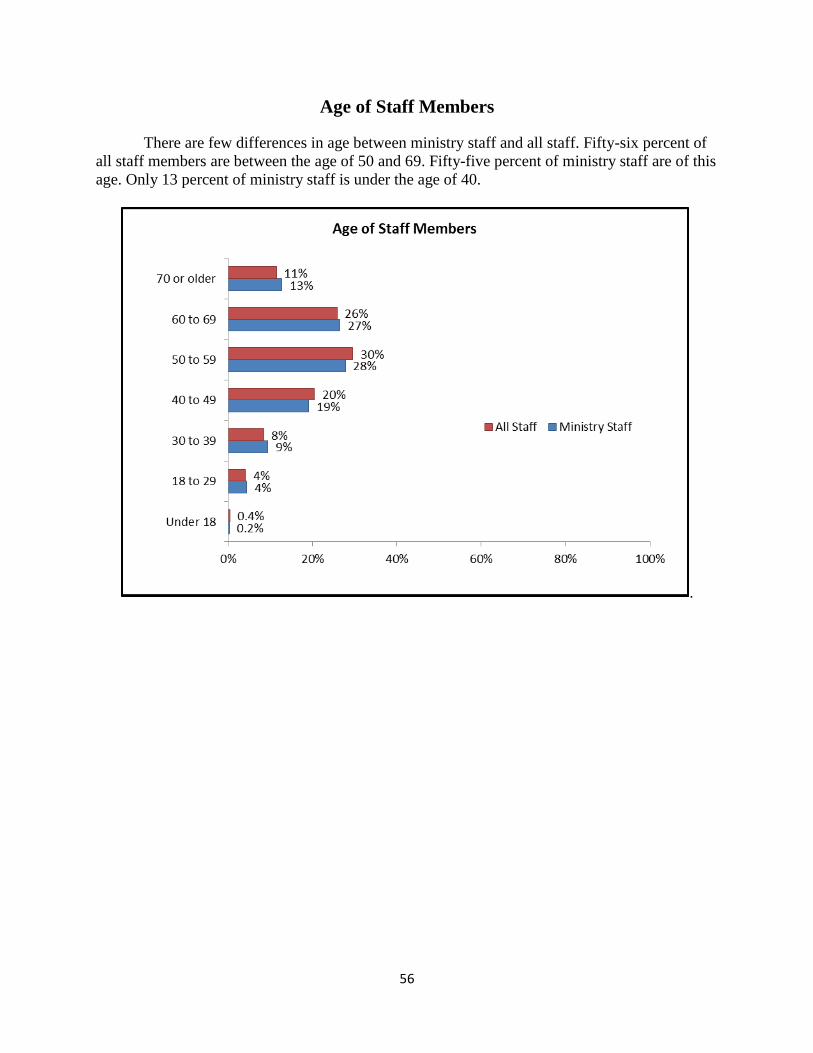
Age of Staff Members
There are few differences in age between ministry staff and all staff. Fifty-six percent of
all staff members are between the age of 50 and 69. Fifty-five percent of ministry staff are of this
age. Only 13 percent of ministry staff is under the age of 40.
.
57
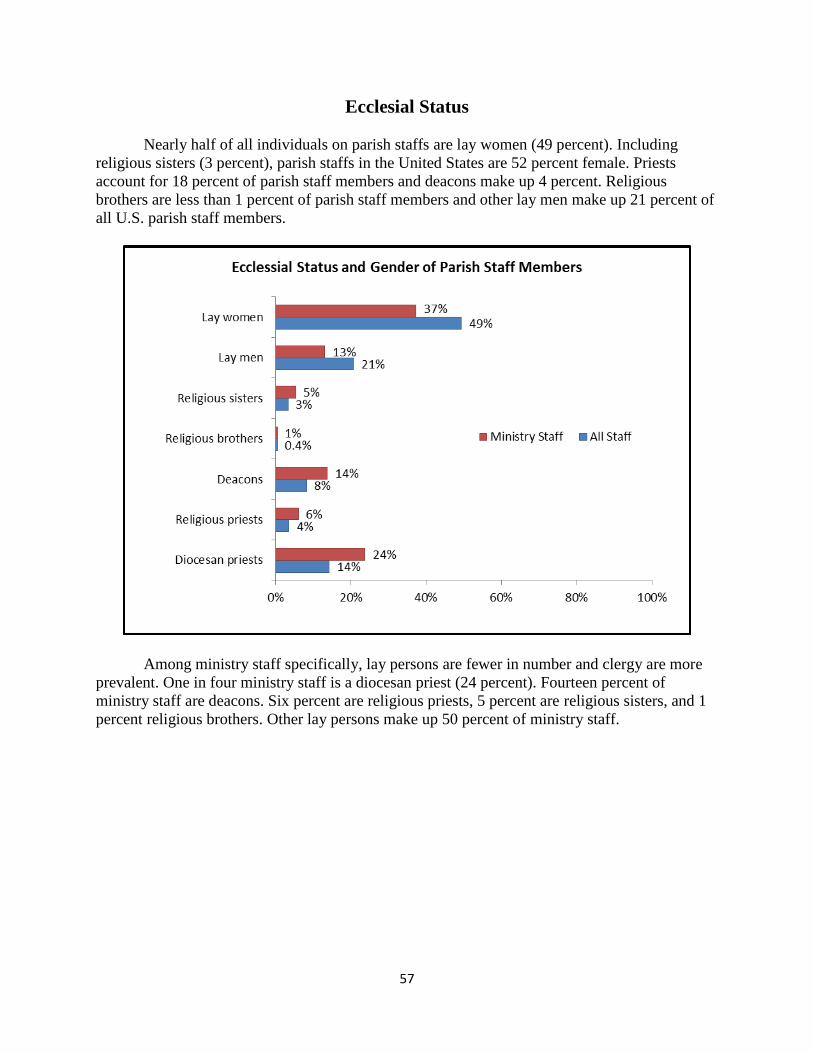
Ecclesial Status
Nearly half of all individuals on parish staffs are lay women (49 percent). Including
religious sisters (3 percent), parish staffs in the United States are 52 percent female. Priests
account for 18 percent of parish staff members and deacons make up 4 percent. Religious
brothers are less than 1 percent of parish staff members and other lay men make up 21 percent of
all U.S. parish staff members.
Among ministry staff specifically, lay persons are fewer in number and clergy are more
prevalent. One in four ministry staff is a diocesan priest (24 percent). Fourteen percent of
ministry staff are deacons. Six percent are religious priests, 5 percent are religious sisters, and 1
percent religious brothers. Other lay persons make up 50 percent of ministry staff.

58
Lay Ecclesial Ministry in U.S. Parishes
In 1992, Msgr. Philip J. Murnion conducted a survey of 1,163 parishes in 43 randomly
selected dioceses. The pastor (or a person designated by the pastor to respond) listed parish staff,
their positions, salaries, hours per week, and other demographic information. From these data
Murnion estimated that there were 21,569 lay ecclesial ministers (LEMs) in the United States.
These were defined as paid, non-ordained parish ministry staff working at least 20 hours per
week. These LEMs were 42 percent vowed religious and 58 percent other lay persons. Overall
85 percent were female and 15 percent male.
In 1997, Murnion and David DeLambo replicated the 1992 study with a survey of 949
parishes in the same 43 dioceses. This study estimated that the number of LEMs had grown to
29,146. These LEMs were 29 percent vowed religious and 71 percent other lay persons. Overall
82 percent were female and 18 percent male.
In 2005, David DeLambo replicated the 1992 and 1997 studies with a survey of 929
parishes in the same 43 dioceses. This study estimated that there were 30,632 LEMs in ministry
in the United States. These LEMs were 16 percent vowed religious and 84 percent other lay
persons. Overall 80 percent were female and 20 percent male.
The data used in this report are from a national random sample survey conducted in all
U.S. territorial dioceses rather than a selection of 43. However, the study also utilized a grid
design that was very similar to that used by Murnion and DeLambo to request information from
respondents about the parish staff. In addition to using the data provided by respondents, CARA
and NACPA researchers also verified staff lists using secondary sources—primarily parish
websites and online parish bulletins. It immediately became evident that many parishes did not
always include their full staff as instructed. In some cases pastors listed themselves and perhaps
a deacon and left off lay staff members.
There are many possible reasons for this omission. Some may have not had the
information about their lay staff members, others simply may have not taken the time to
completely fill out this section, others expressed concerns about confidentiality and providing
this information for their staff. Regardless, relying on survey data alone would have provided an
undercount of LEMs.
This study estimates that the number of LEMs has grown to 37,929.15
They are 14
percent vowed religious and 86 percent other lay persons. Overall 80 percent are female and 20
percent male.
The trend over time since 1992 indicates that, on average, about 790 new LEMs are
added to U.S. parish ministry staffs per year in the last two decades.
15
The survey asked respondents to indicate if a ministry staff member was shared with another parish. However, it is likely that some of the 37,929 total includes some double-counting (i.e., the same person paid and working 20 or more hours per week in two or more parishes). It is not possible to reliably account for double-counting without a parish census or survey with a very large sample and response rate. However, given the number of hours utilized in the LEM definition it is unlikely that this includes any significant amount of double-counting.
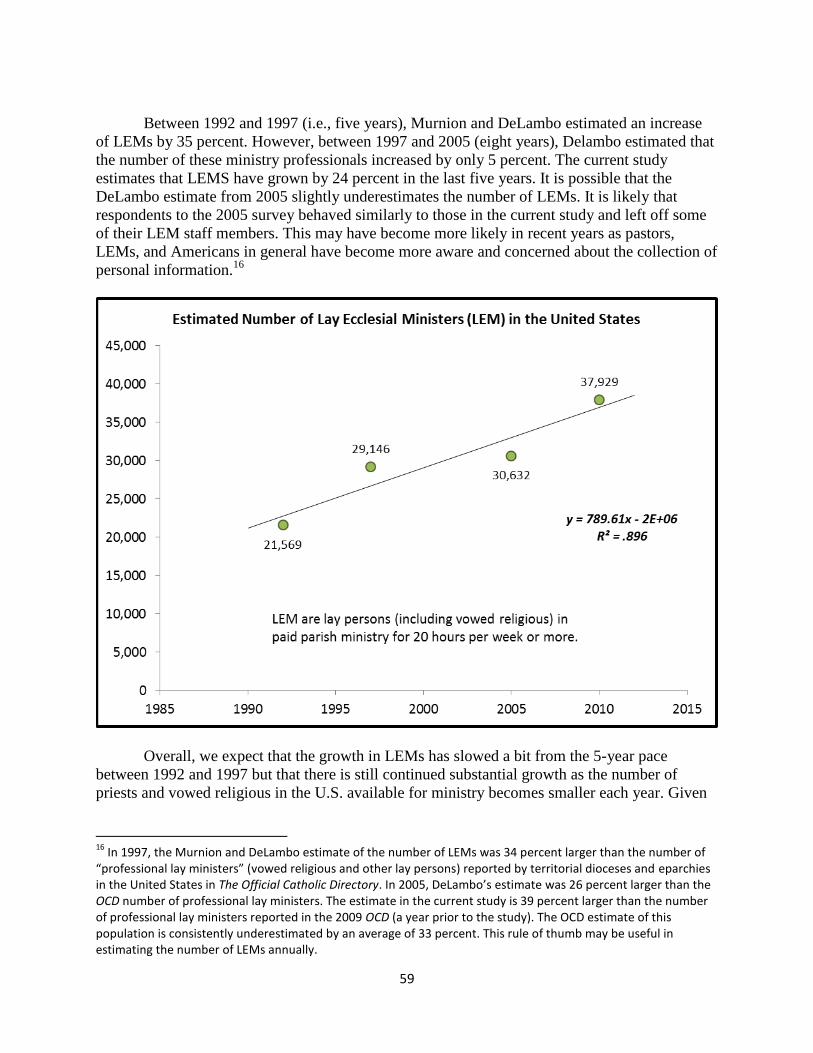
59
Between 1992 and 1997 (i.e., five years), Murnion and DeLambo estimated an increase
of LEMs by 35 percent. However, between 1997 and 2005 (eight years), Delambo estimated that
the number of these ministry professionals increased by only 5 percent. The current study
estimates that LEMS have grown by 24 percent in the last five years. It is possible that the
DeLambo estimate from 2005 slightly underestimates the number of LEMs. It is likely that
respondents to the 2005 survey behaved similarly to those in the current study and left off some
of their LEM staff members. This may have become more likely in recent years as pastors,
LEMs, and Americans in general have become more aware and concerned about the collection of
personal information.16
Overall, we expect that the growth in LEMs has slowed a bit from the 5-year pace
between 1992 and 1997 but that there is still continued substantial growth as the number of
priests and vowed religious in the U.S. available for ministry becomes smaller each year. Given
16
In 1997, the Murnion and DeLambo estimate of the number of LEMs was 34 percent larger than the number of “professional lay ministers” (vowed religious and other lay persons) reported by territorial dioceses and eparchies in the United States in The Official Catholic Directory. In 2005, DeLambo’s estimate was 26 percent larger than the OCD number of professional lay ministers. The estimate in the current study is 39 percent larger than the number of professional lay ministers reported in the 2009 OCD (a year prior to the study). The OCD estimate of this population is consistently underestimated by an average of 33 percent. This rule of thumb may be useful in estimating the number of LEMs annually.

60
the expected continued decline in numbers of priests and vowed religious in the U.S. we expect
LEMs, as well as deacons, to become more numerous on parish staffs in the future.
In the current study we estimate a total staff size in U.S. parishes of 168,448. This total
includes ministry staff and volunteers as well as non-ministry staff and volunteers (including
parish bookkeepers, groundskeepers, cooks, etc.). This results in an estimated staff size of 9.5
members per parish.
Excluding those in non-ministry positions, the total number of paid and volunteer
ministers in parishes (including pastors and deacons) in 2010 is estimated to be 95,951 or 5.4
ministry staff members per parish.
Restricting this further to lay persons only (including vowed religious)—volunteer and
paid—the total number of parish ministers in the U.S. is 50,298 (2.8 per parish). Restricting this
further to those paid and in ministry at least 20 hours per week results in the 37,929 total of
LEMs (2.1 per parish), the number that is most comparable to the Murnion and DeLambo
studies.17
17
See: New Parish Ministers: Laity & Religious on Parish Staffs (1992) by Philip J. Murnion (National Pastoral Life Center), Parishes and Parish ministers: A Study of Parish Lay Ministry (1999) by Philip J. Murnion and David DeLambo (National Pastoral Life Center), and Lay Parish Ministers: A Study of Emerging Leadership (2005) by David DeLambo (National Pastoral Life Center).

61
Hours
Sixteen percent of LEMs work 20 hours a week, on average, and no more. One in four
(26 percent) work more than 20 hours but less than 40 hours per week. Forty-nine percent work
forty hours on average per week. One in ten (9 percent) work more than 40 hours per week.
Race and Ethnicity
Eighty-eight percent of LEMS (unchanged from DeLambo’s 2005 estimates) are non-
Hispanic white. Nine percent are Hispanic or Latino(a). Less than 2 percent are black, African
American or African (1.6 percent). A similar percentage is Asian or Pacific Islander (1.7
percent). Less than 1 percent is Native American or Native Alaskan (0.2 percent).
Age
Seven percent of LEMs are under the age of 30. Eleven percent are in their 30s and 22
percent in their 40s. Thus, four in ten LEMs are estimated to be under the age of 50. Three in ten
are between the ages of 50 and 59 and 22 percent are in their 60s. Seven percent are age 70 or
older.

62
Area of Ministry or Work
Of all parish staff members, 28 percent are in pastoral leadership positions (e.g., pastor,
PLC, pastoral ministry director, permanent deacon).18
Fifteen percent are office or support staff
(e.g., office manager, receptionist, office assistant).
A third of parish staff (33 percent) is involved in ministry outside of parish leadership.
Twelve percent are in religious education, 12 percent in pastoral ministries, and 11 percent in
liturgy and music.
Ten percent of staff is in a business or administrative role (e.g., business manager,
bookkeeper, information technology, website coordinator). Fifteen percent are in a facilities role
(facilities maintenance, groundskeeper, cook).
18
Each respondent was presented with a list of 61 position titles and job descriptions. These titles and descriptions were designed by NACPA and Emerging Models collaborators. Although respondents may use different position titles than what were listed, they were asked to pick the position description that best fit a staff member’s ministry or work area.

63
Most Common Parish Staff Positions
As one would assume, the most common staff position among all U.S. parish staff
persons is a pastor/administrator, representing 11 percent of all those on parish staffs in the
country. All parishes need to fill this position. If this is not possible the parish would be entrusted
to a deacon or lay person or pastoral team (less than 1 percent of staff serve in this capacity).
Permanent deacons are the second most common type of staff member representing 9 percent of
all parish staff.
The figure below shows the most common parish staff positions in the United States with
ministry positions in blue and non-ministry positions in orange. The percentages represent the
share of each among on all parish staffs combined.
The list on the next page includes the percentage among all parishes that have each type
of staff member listed on the questionnaire (see the Appendix for descriptions of each position).
Ninety-seven percent of all parishes indicate they have a Pastor or Administrator.
Seventy-eight percent have a Permanent Deacon on staff and 60 percent have an Associate
Pastor or Parochial Vicar. Catechetical/religious education ministry staff are among the most
common as are staff persons involved in music and liturgy ministries. Three in ten parishes (29
percent) have a business manager or administrator.
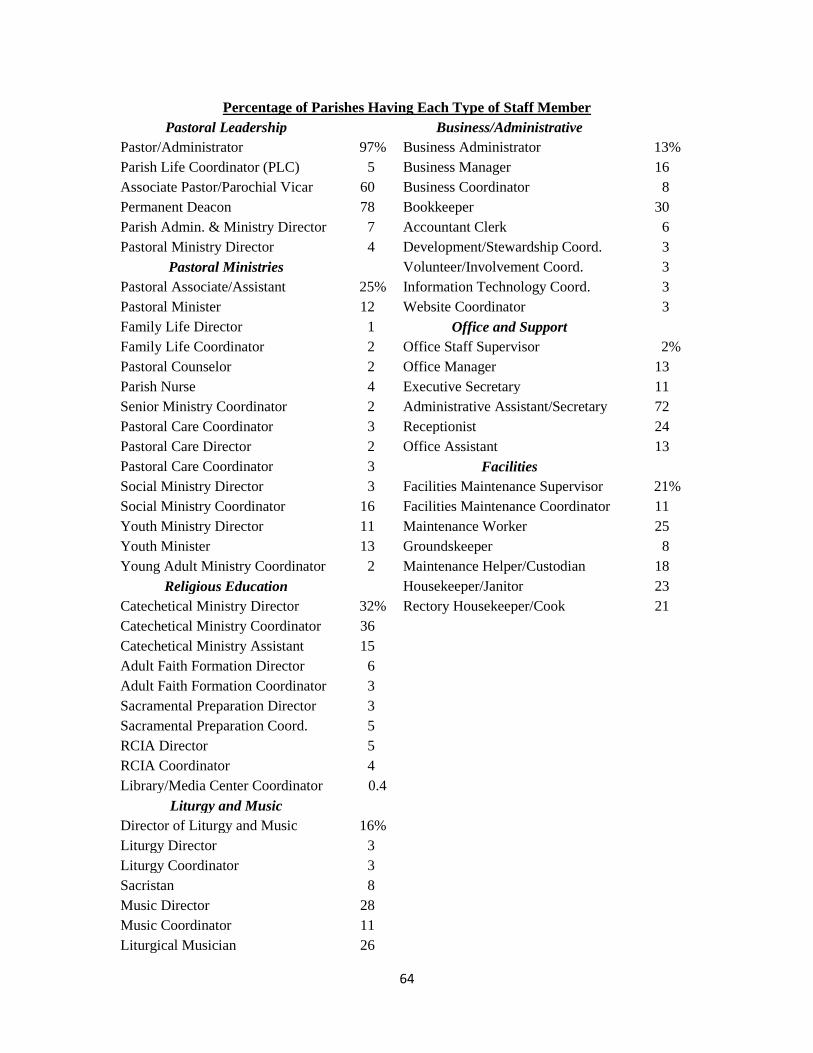
64
Percentage of Parishes Having Each Type of Staff Member
Pastoral Leadership
Business/Administrative
Pastor/Administrator 97% Business Administrator 13%
Parish Life Coordinator (PLC) 5 Business Manager 16
Associate Pastor/Parochial Vicar 60 Business Coordinator 8
Permanent Deacon 78 Bookkeeper 30
Parish Admin. & Ministry Director 7 Accountant Clerk 6
Pastoral Ministry Director 4 Development/Stewardship Coord. 3
Pastoral Ministries
Volunteer/Involvement Coord. 3
Pastoral Associate/Assistant 25% Information Technology Coord. 3
Pastoral Minister 12 Website Coordinator 3
Family Life Director 1 Office and Support
Family Life Coordinator 2 Office Staff Supervisor 2%
Pastoral Counselor 2 Office Manager 13
Parish Nurse 4 Executive Secretary 11
Senior Ministry Coordinator 2 Administrative Assistant/Secretary 72
Pastoral Care Coordinator 3 Receptionist 24
Pastoral Care Director 2 Office Assistant 13
Pastoral Care Coordinator 3 Facilities
Social Ministry Director 3 Facilities Maintenance Supervisor 21%
Social Ministry Coordinator 16 Facilities Maintenance Coordinator 11
Youth Ministry Director 11 Maintenance Worker 25
Youth Minister 13 Groundskeeper 8
Young Adult Ministry Coordinator 2 Maintenance Helper/Custodian 18
Religious Education
Housekeeper/Janitor 23
Catechetical Ministry Director 32% Rectory Housekeeper/Cook 21
Catechetical Ministry Coordinator 36
Catechetical Ministry Assistant 15
Adult Faith Formation Director 6
Adult Faith Formation Coordinator 3
Sacramental Preparation Director 3
Sacramental Preparation Coord. 5
RCIA Director 5
RCIA Coordinator 4
Library/Media Center Coordinator 0.4
Liturgy and Music
Director of Liturgy and Music 16%
Liturgy Director 3
Liturgy Coordinator 3
Sacristan 8
Music Director 28
Music Coordinator 11
Liturgical Musician 26

65
Parish Consultative Bodies
This section of the report includes information about parish pastoral and finance councils.
Parishes are required to have a finance council and encouraged to have a pastoral council.
Pastoral Council
Most parishes, 93 percent, have a pastoral council. There is little variation in this finding
by parish type.

66
Among those parishes with pastoral councils, most indicate that they have 12 members
on this body. PLC parishes tend to have fewer, about nine members, on average and mutli-parish
ministry parishes have slightly more with an average of ten.
Number of members who serve on the Parish Pastoral Council (including ex officio):
All
Parishes
Multicultural
Parishes
PLC
Parishes
Consolidated
Parishes
Multi-parish
Ministry
6 or fewer 8% 9% 24% 11% 16%
7 to 9 22 21 34 20 31
10 to 12 39 37 33 31 35
13 to 15 18 17 3 22 11
16 or more 13 16 6 16 7
Average: 11.7 12.0 9.2 12.8 10.2
Of parishes with a council, the most common meeting frequency is monthly (67 percent).
In PLC parishes and those using multi-parish ministry, the use of bi-monthly meetings is more
common than in other parishes.
How frequently does the Parish Pastoral Council meet?
All
Parishes
Multicultural
Parishes
PLC
Parishes
Consolidated
Parishes
Multi-parish
Ministry
Monthly 67% 72% 51% 68% 57%
Bi-monthly 15 11 30 18 25
Quarterly 13 13 16 10 14
Semi-annually 1 1 3 2 2
Annually <1 <1 0 0 0
Other 3 3 0 2 2
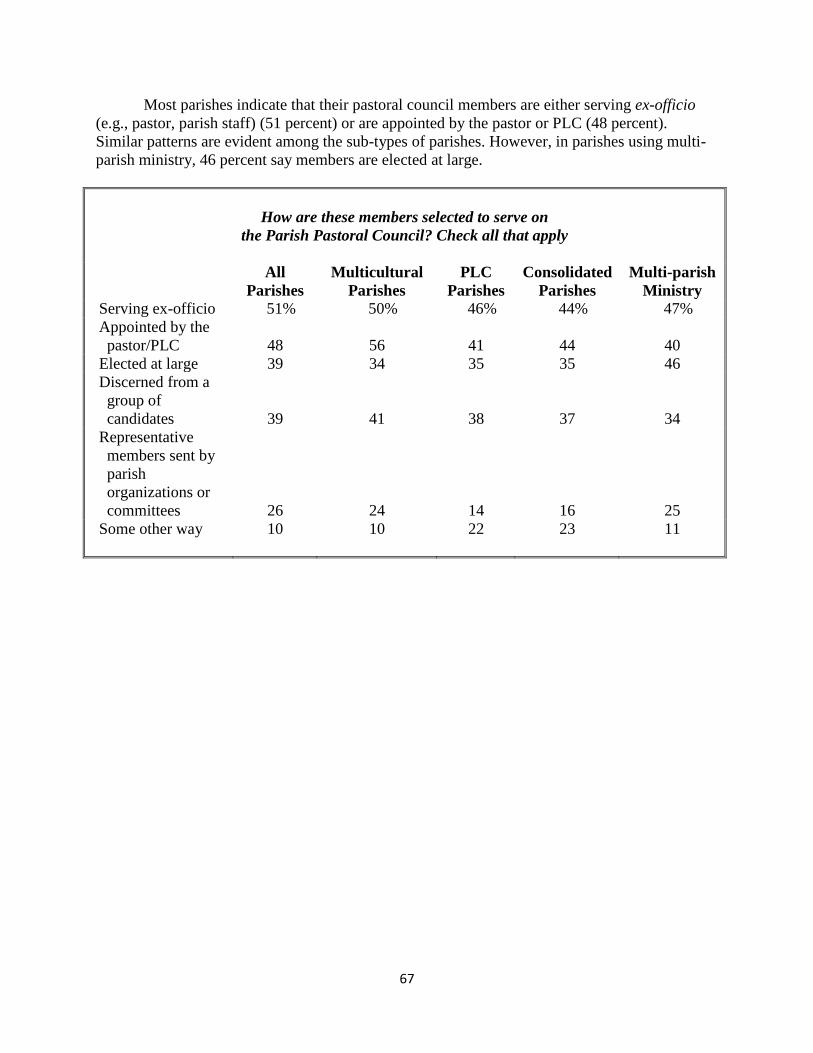
67
Most parishes indicate that their pastoral council members are either serving ex-officio
(e.g., pastor, parish staff) (51 percent) or are appointed by the pastor or PLC (48 percent).
Similar patterns are evident among the sub-types of parishes. However, in parishes using multi-
parish ministry, 46 percent say members are elected at large.
How are these members selected to serve on
the Parish Pastoral Council? Check all that apply
All
Parishes
Multicultural
Parishes
PLC
Parishes
Consolidated
Parishes
Multi-parish
Ministry
Serving ex-officio 51% 50% 46% 44% 47%
Appointed by the
pastor/PLC
48
56
41
44
40
Elected at large 39 34 35 35 46
Discerned from a
group of
candidates
39
41
38
37
34
Representative
members sent by
parish
organizations or
committees
26
24
14
16
25
Some other way 10 10 22 23 11

68
Finance Council
Nearly all parishes report that they have a parish finance council. Recently consolidated
parishes, and multi-parish ministry parishes are slightly less likely than other types of parishes to
report this.
Among those parishes with these councils, most indicate that they have seven members
on the council. The one exception to this is in PLC parishes, which tend to have about five
members on the finance council, on average.
Number of members who serve on the Parish Finance Council (including ex officio):
All
Parishes
Multicultural
Parishes
PLC
Parishes
Consolidated
Parishes
Multi-parish
Ministry
4 or fewer 18% 18% 29% 12% 29%
5 to 7 46 49 55 46 44
8 to 10 29 27 16 32 22
11 to 13 6 4 0 6 4
14 or more 1 2 0 4 1
Average: 6.9 6.9 5.4 7.1 6.5
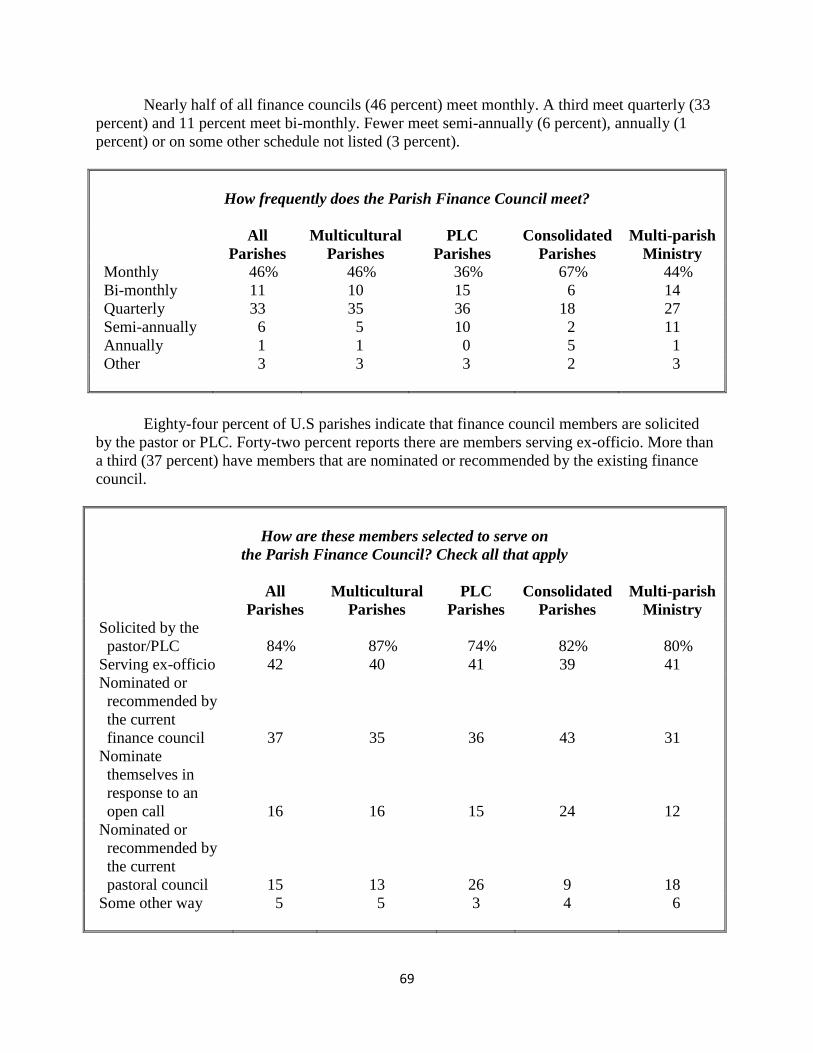
69
Nearly half of all finance councils (46 percent) meet monthly. A third meet quarterly (33
percent) and 11 percent meet bi-monthly. Fewer meet semi-annually (6 percent), annually (1
percent) or on some other schedule not listed (3 percent).
How frequently does the Parish Finance Council meet?
All
Parishes
Multicultural
Parishes
PLC
Parishes
Consolidated
Parishes
Multi-parish
Ministry
Monthly 46% 46% 36% 67% 44%
Bi-monthly 11 10 15 6 14
Quarterly 33 35 36 18 27
Semi-annually 6 5 10 2 11
Annually 1 1 0 5 1
Other 3 3 3 2 3
Eighty-four percent of U.S parishes indicate that finance council members are solicited
by the pastor or PLC. Forty-two percent reports there are members serving ex-officio. More than
a third (37 percent) have members that are nominated or recommended by the existing finance
council.
How are these members selected to serve on
the Parish Finance Council? Check all that apply
All
Parishes
Multicultural
Parishes
PLC
Parishes
Consolidated
Parishes
Multi-parish
Ministry
Solicited by the
pastor/PLC
84%
87%
74%
82%
80%
Serving ex-officio 42 40 41 39 41
Nominated or
recommended by
the current
finance council
37
35
36
43
31
Nominate
themselves in
response to an
open call
16
16
15
24
12
Nominated or
recommended by
the current
pastoral council
15
13
26
9
18
Some other way 5 5 3 4 6
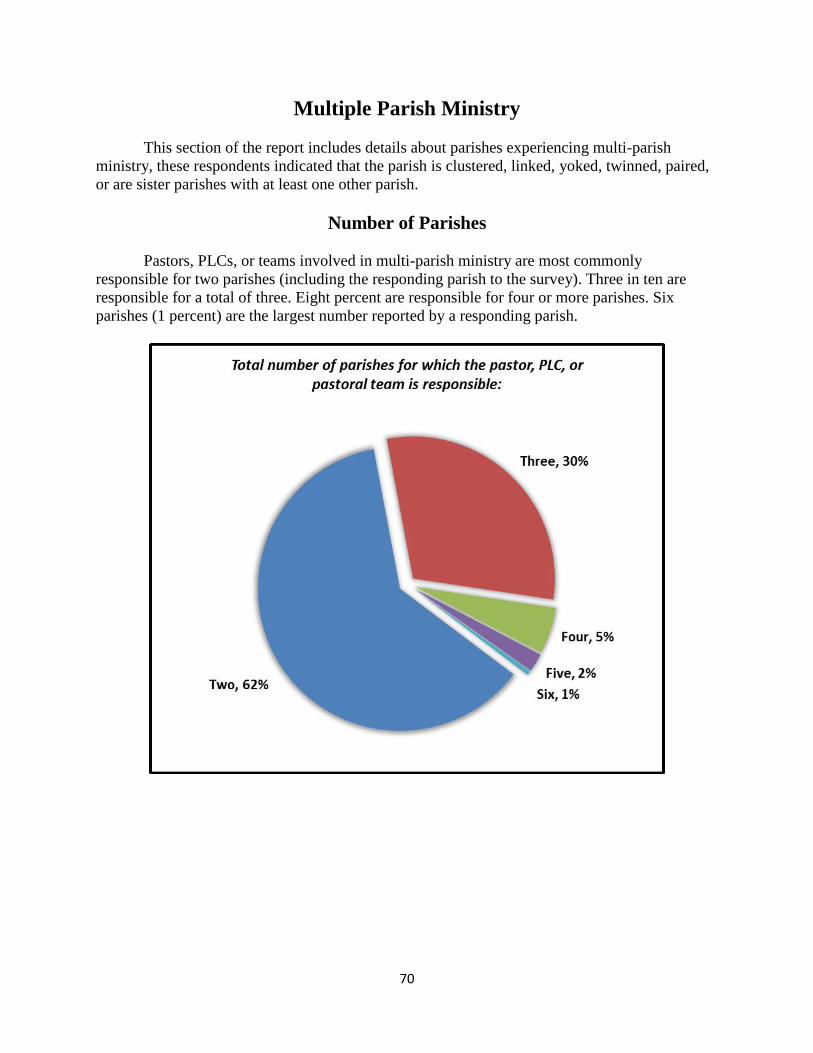
70
Multiple Parish Ministry
This section of the report includes details about parishes experiencing multi-parish
ministry, these respondents indicated that the parish is clustered, linked, yoked, twinned, paired,
or are sister parishes with at least one other parish.
Number of Parishes
Pastors, PLCs, or teams involved in multi-parish ministry are most commonly
responsible for two parishes (including the responding parish to the survey). Three in ten are
responsible for a total of three. Eight percent are responsible for four or more parishes. Six
parishes (1 percent) are the largest number reported by a responding parish.

71
Arrangements between Parishes
A variety of terms are used in dioceses to describe the sharing of priests, ministers, and
other aspects of the parish (e.g., councils, ministries).19
The survey asked respondents to indicate
the term used for the model they use. The most common form of multi-parish arrangement
reported was clustered (31 percent) followed by linked (30 percent). One in ten (11 percent)
indicate the arrangement is as sister parishes. One in 20 (5 percent) indicate a twinned or paired
arrangement and 2 percent indicate a yoked relationship. More than one in five (22 percent)
indicated some other description for the arrangement. This group largely includes those who
were not aware of definitions of the terms listed on the survey.
19
For more see Priestly Ministry in Multiple Parishes (2006) by Katarina Schuth (Liturgical Press). As she describes, “Dioceses use a variety of models for organizing the parishes regardless of how they are named” (pg. 159). Also see: Pastoring Multiple Parishes: An Emerging Model of Pastoral Leadership (2009) by Mark Mogilka and Kate Wiskus (Loyola Press).
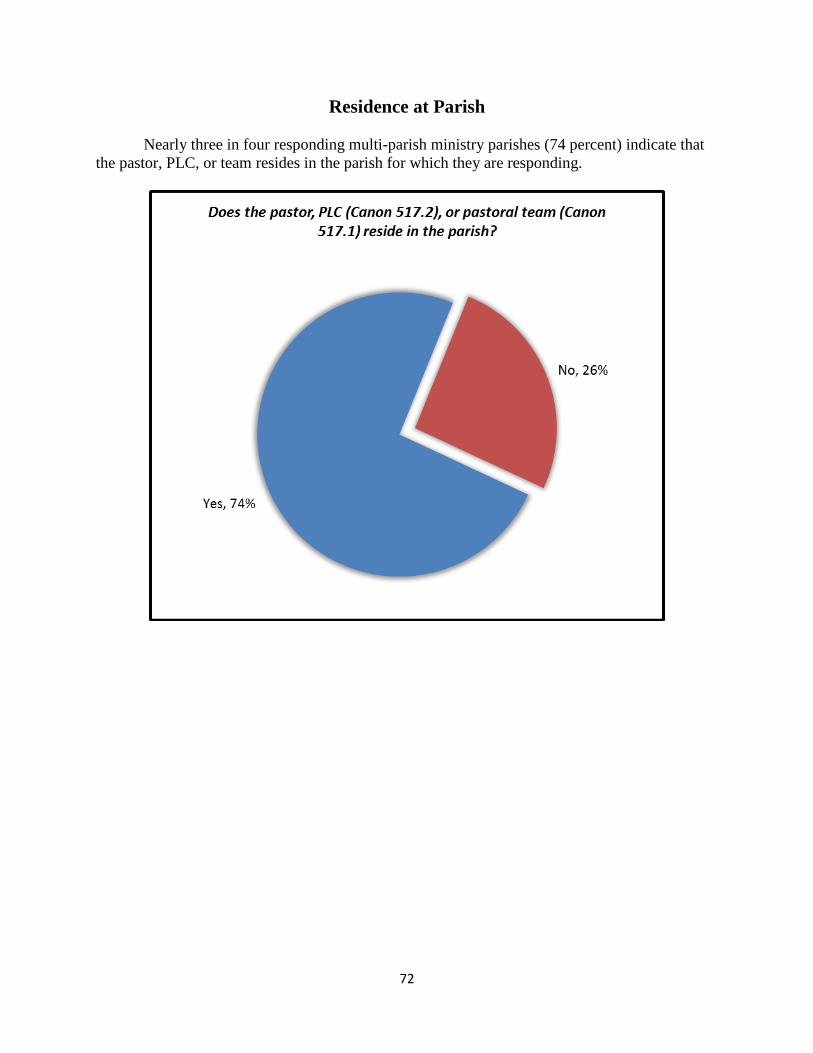
72
Residence at Parish
Nearly three in four responding multi-parish ministry parishes (74 percent) indicate that
the pastor, PLC, or team resides in the parish for which they are responding.

73
Registered Households in All Shared Parishes
A quarter of pastors, PLCs, or teams (26 percent) involved in multi-parish ministry are
responsible for a total of less than 300 registered households in all parishes. Eighteen percent are
responsible for 300 to 499 registered households in total. A plurality, 31 percent, is responsible
for 500 to 999 registered households and a quarter is responsible for 1,000 or more.
On average, these parish leaders are responsible for 788 households in total (a median of
569 households).

74
Year Multi-parish Ministry Began
Most parishes, 68 percent, indicate the multi-parish ministry relationship between
parishes began after 1994. The average year for the initiation of this relationship is 1990 and the
median is 2000. A third (33 percent) indicates the establishment of multi-parish ministry since
2005.

75
Distances between Parishes
On average, it takes 23 minutes (median of 17) to travel the 18 miles (median of 12)
between the two furthest parishes involved in multi-parish ministry.
Twelve percent indicate a distance of 30 or more miles (maximum of 240 miles).
Eighteen percent indicated a travel time of more than a half hour (maximum of 255 minutes).
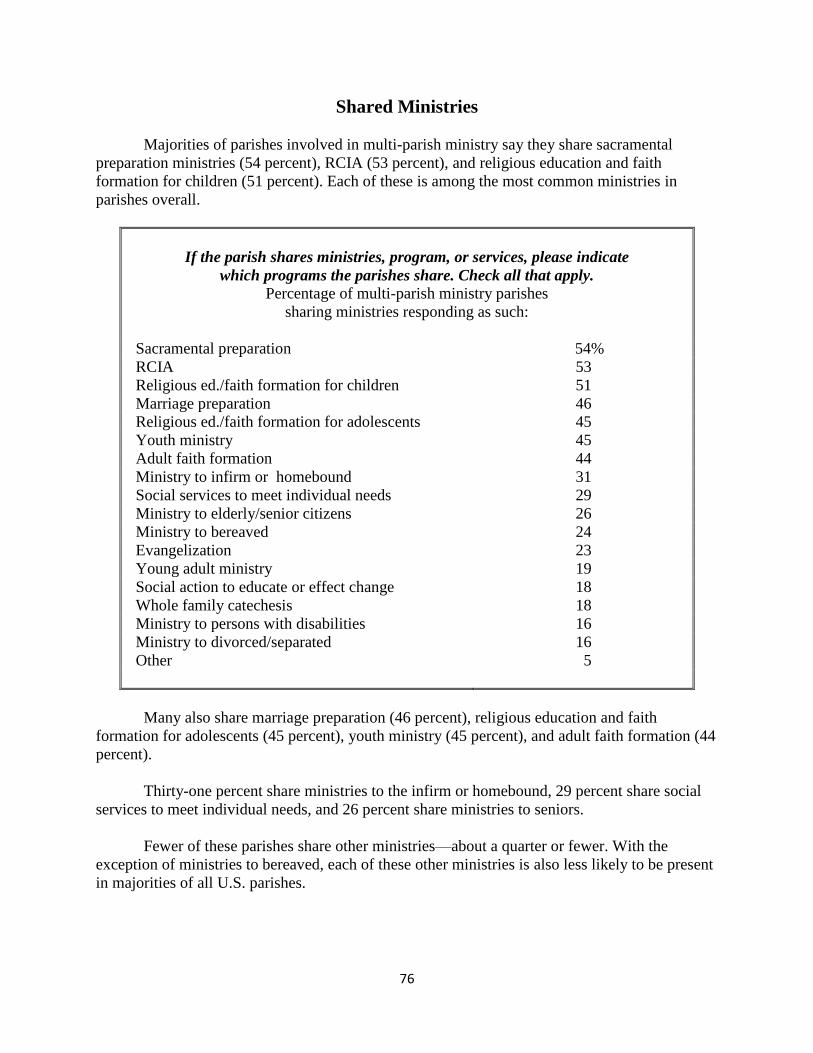
76
Shared Ministries
Majorities of parishes involved in multi-parish ministry say they share sacramental
preparation ministries (54 percent), RCIA (53 percent), and religious education and faith
formation for children (51 percent). Each of these is among the most common ministries in
parishes overall.
If the parish shares ministries, program, or services, please indicate
which programs the parishes share. Check all that apply.
Percentage of multi-parish ministry parishes
sharing ministries responding as such:
Sacramental preparation 54%
RCIA 53
Religious ed./faith formation for children 51
Marriage preparation 46
Religious ed./faith formation for adolescents 45
Youth ministry 45
Adult faith formation 44
Ministry to infirm or homebound 31
Social services to meet individual needs 29
Ministry to elderly/senior citizens 26
Ministry to bereaved 24
Evangelization 23
Young adult ministry 19
Social action to educate or effect change 18
Whole family catechesis 18
Ministry to persons with disabilities 16
Ministry to divorced/separated 16
Other 5
Many also share marriage preparation (46 percent), religious education and faith
formation for adolescents (45 percent), youth ministry (45 percent), and adult faith formation (44
percent).
Thirty-one percent share ministries to the infirm or homebound, 29 percent share social
services to meet individual needs, and 26 percent share ministries to seniors.
Fewer of these parishes share other ministries—about a quarter or fewer. With the
exception of ministries to bereaved, each of these other ministries is also less likely to be present
in majorities of all U.S. parishes.
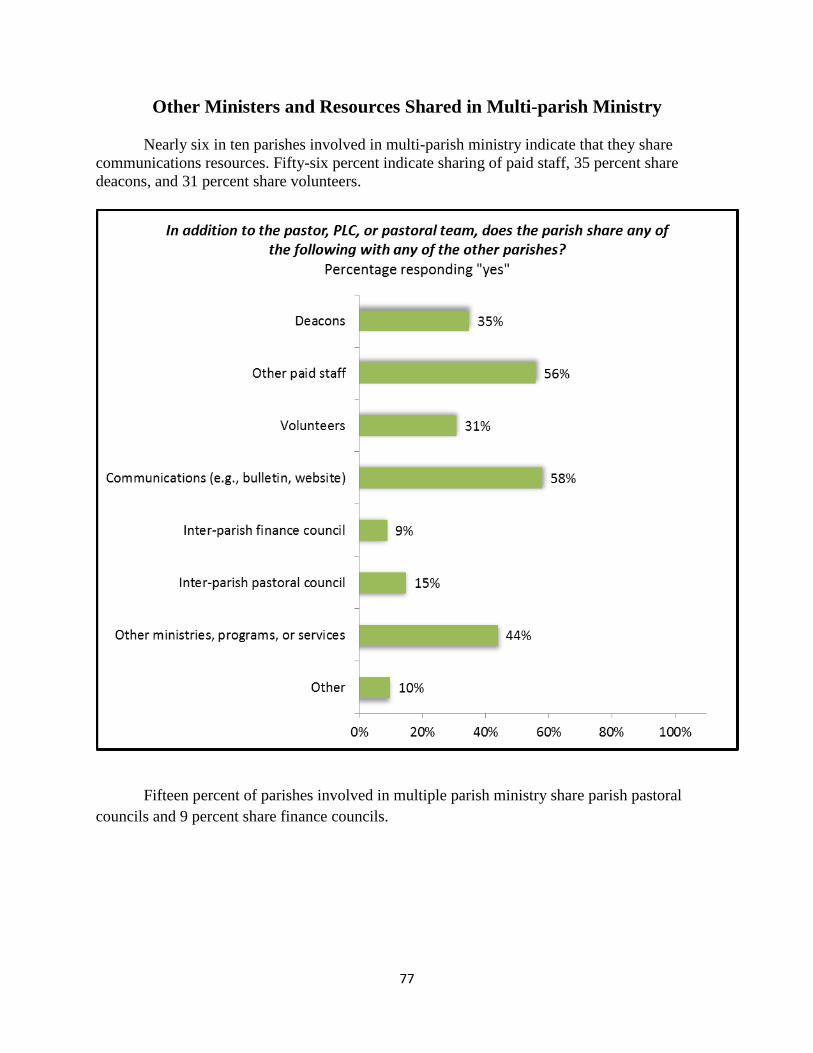
77
Other Ministers and Resources Shared in Multi-parish Ministry
Nearly six in ten parishes involved in multi-parish ministry indicate that they share
communications resources. Fifty-six percent indicate sharing of paid staff, 35 percent share
deacons, and 31 percent share volunteers.
Fifteen percent of parishes involved in multiple parish ministry share parish pastoral
councils and 9 percent share finance councils.

78
Appendix: Questionnaire

Parish Questionnaire Name of the Parish Mailing Address City, State, Zip ID: Arch/diocese PASSWORD: Please provide the following information about this parish. Unless otherwise noted, please include any mission churches or worship sites for which the parish is responsible. If the parish is twinned, clustered, or in some other relationship with one or more other parishes, please respond to the questions only for the parish to which this questionnaire was sent. Please estimate numbers if necessary. Parish Founding and Physical Plant ________ 1. Year the parish was founded (erected as a parish) ________ 2. Year the present church building was built (main parish church only) ________ 3. Church seating capacity (main parish church only) Yes No 1 2 4. Is the parish responsible for any “mission” churches? 1 2 5. Does the parish have more than one worship site that is used for weekly Sunday/Saturday Vigil Masses? 6. List the name and city of each mission church and/or worship site and its seating capacity. Name City Seating capacity Has the parish experienced any of the following since January 1, 2005? Check all that apply.
7 The parish was created (erected) as the result of a merger with at least one other parish. 8 The parish was clustered, linked, or yoked with at least one other parish. 9 Parish membership or territory was affected by the erection of a new parish. 10 Parish membership or territory was affected by the closing or suppression of a parish.
________ 11. If the parish was created (erected) as a result of a merger of parishes since January 1, 2005, indicate the total number of parishes that merged to form the present parish. Parish Administration 12. The parish is administered by or entrusted to:
(a) A pastor or a priest with the faculties of a pastor (b) A team of priests who serve as the pastoral team (in solidum) according to Canon 517.1 (c) A parish life coordinator (parish life director, pastoral coordinator, etc.) appointed by the
bishop or his delegate according to Canon 517.2* *Throughout this questionnaire, PLC (parish life coordinator) refers to those to whom a parish is entrusted according to Canon 517.2.

Worship and Sacraments Indicate the number of the following in the parish: ________ 13. Number of sites at which Sunday/Saturday Vigil Masses are celebrated in a typical week ________ 14. Total number of Sunday/Saturday Vigil Masses each week ________ 15. Total number of weekday Masses each week (Monday through Saturday morning) ________ 16. Total number of persons (adults and children) attending Sunday/Saturday Vigil Masses on a typical weekend in October Indicate the number of the following celebrated in the parish during 2009 (write “0” if none): ________ 17. Total number of Sunday Celebrations in the Absence of a Priest during 2009 ________ 18. Total number of weekday communion services during 2009 19. List the language(s) other than English in which Masses are celebrated and the number of times per month for each language. Language Number of Masses per month Yes No 1 2 20. Does the parish have special observances (e.g., feast days, devotions, or other celebrations) for particular ethnic or cultural groups in the parish? 21. If yes, please describe: Indicate the total number of sacraments or rites celebrated in the parish in each category during 2009: ________ 22. Baptisms of infants or children (up to 7 years of age) ________ 23. Baptisms of youth and adults (over 7 years of age) ________ 24. Receptions into full communion (for those baptized into another Christian tradition) ________ 25. First Communions ________ 26. Confirmations ________ 27. Marriages between two Catholics ________ 28. Inter-church Marriages (one spouse Catholic, the other from another Christian tradition) ________ 29. Inter-faith Marriages (one spouse Catholic, the other from a non-Christian tradition) ________ 30. Funerals Composition of the Parish Community ________ 31. Number of registered families/households ________ 32. Number of individual registered parishioners (adults and children) 33. If the parish regularly serves a significant number of Catholics who are not registered in the parish, please describe and explain.
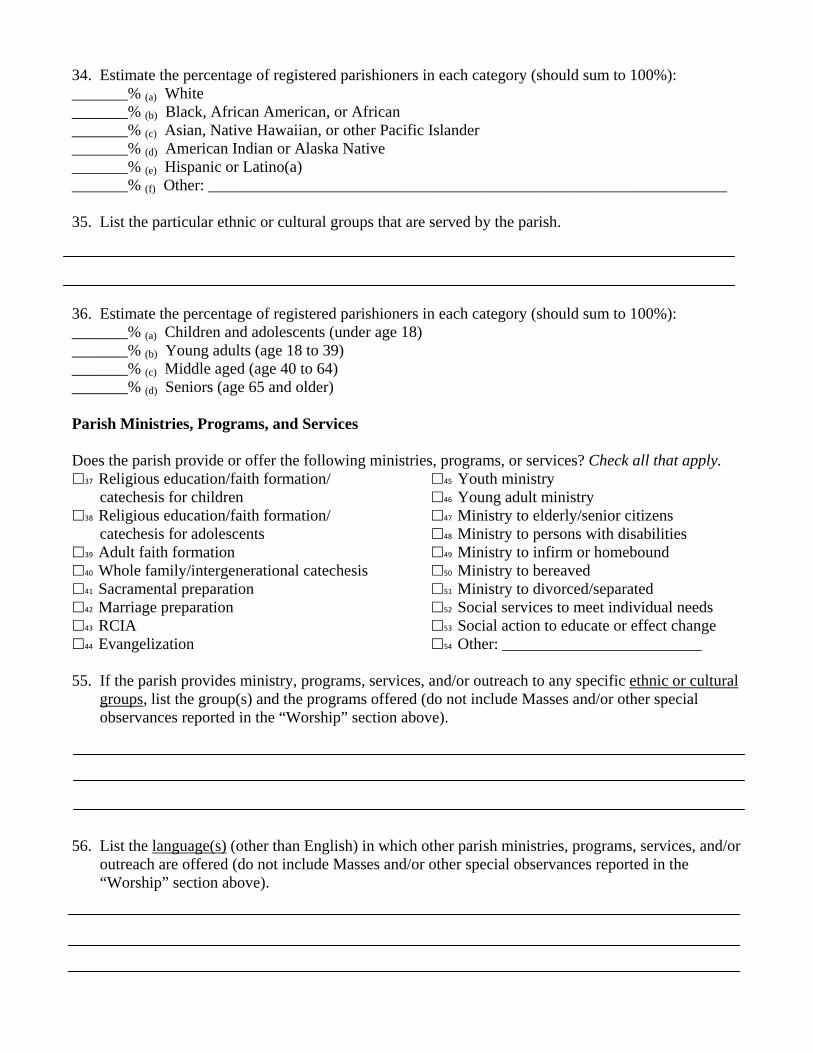
34. Estimate the percentage of registered parishioners in each category (should sum to 100%): _______% (a) White _______% (b) Black, African American, or African _______% (c) Asian, Native Hawaiian, or other Pacific Islander _______% (d) American Indian or Alaska Native _______% (e) Hispanic or Latino(a) _______% (f) Other: _________________________________________________________________ 35. List the particular ethnic or cultural groups that are served by the parish. 36. Estimate the percentage of registered parishioners in each category (should sum to 100%): _______% (a) Children and adolescents (under age 18) _______% (b) Young adults (age 18 to 39) _______% (c) Middle aged (age 40 to 64) _______% (d) Seniors (age 65 and older) Parish Ministries, Programs, and Services Does the parish provide or offer the following ministries, programs, or services? Check all that apply.
37 Religious education/faith formation/ catechesis for children
38 Religious education/faith formation/ catechesis for adolescents
39 Adult faith formation 40 Whole family/intergenerational catechesis 41 Sacramental preparation 42 Marriage preparation 43 RCIA 44 Evangelization
45 Youth ministry 46 Young adult ministry 47 Ministry to elderly/senior citizens 48 Ministry to persons with disabilities 49 Ministry to infirm or homebound 50 Ministry to bereaved 51 Ministry to divorced/separated 52 Social services to meet individual needs 53 Social action to educate or effect change 54 Other: _________________________
55. If the parish provides ministry, programs, services, and/or outreach to any specific ethnic or cultural groups, list the group(s) and the programs offered (do not include Masses and/or other special observances reported in the “Worship” section above). 56. List the language(s) (other than English) in which other parish ministries, programs, services, and/or outreach are offered (do not include Masses and/or other special observances reported in the “Worship” section above).
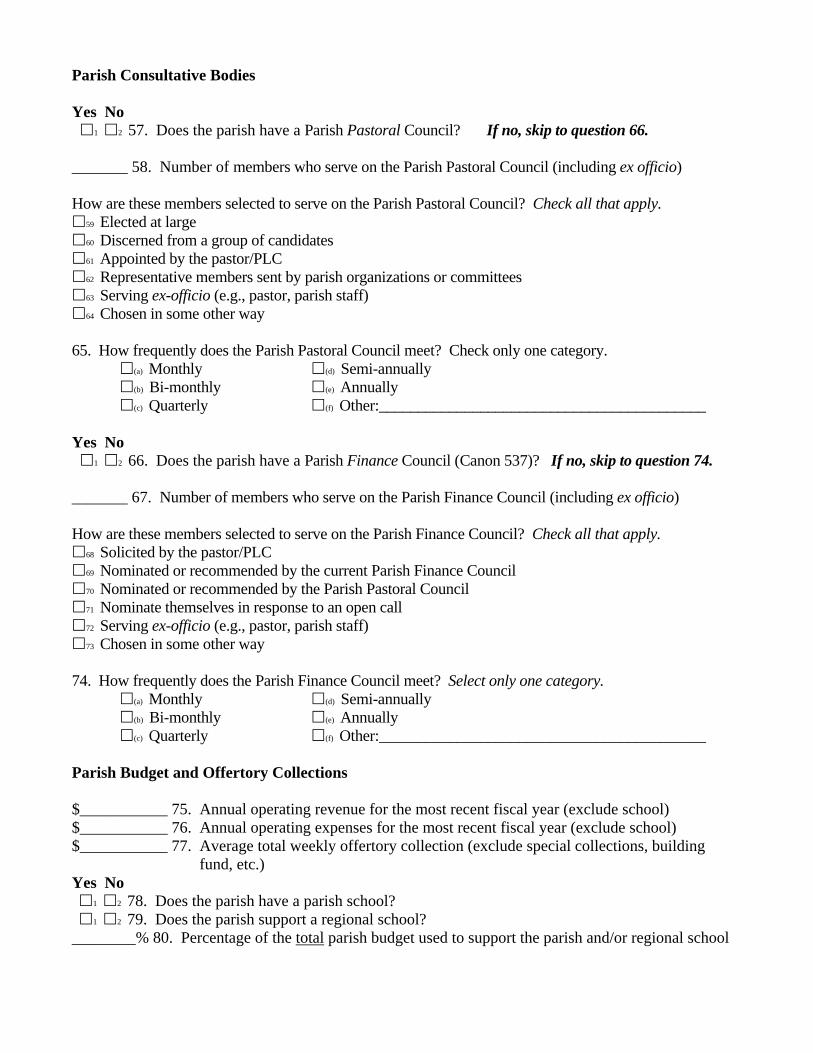
Parish Consultative Bodies Yes No 1 2 57. Does the parish have a Parish Pastoral Council? If no, skip to question 66. _______ 58. Number of members who serve on the Parish Pastoral Council (including ex officio) How are these members selected to serve on the Parish Pastoral Council? Check all that apply.
59 Elected at large 60 Discerned from a group of candidates 61 Appointed by the pastor/PLC 62 Representative members sent by parish organizations or committees 63 Serving ex-officio (e.g., pastor, parish staff) 64 Chosen in some other way
65. How frequently does the Parish Pastoral Council meet? Check only one category.
(a) Monthly (d) Semi-annually (b) Bi-monthly (e) Annually (c) Quarterly (f) Other:__________________________________________
Yes No 1 2 66. Does the parish have a Parish Finance Council (Canon 537)? If no, skip to question 74. _______ 67. Number of members who serve on the Parish Finance Council (including ex officio) How are these members selected to serve on the Parish Finance Council? Check all that apply.
68 Solicited by the pastor/PLC 69 Nominated or recommended by the current Parish Finance Council 70 Nominated or recommended by the Parish Pastoral Council 71 Nominate themselves in response to an open call 72 Serving ex-officio (e.g., pastor, parish staff) 73 Chosen in some other way
74. How frequently does the Parish Finance Council meet? Select only one category.
(a) Monthly (d) Semi-annually (b) Bi-monthly (e) Annually (c) Quarterly (f) Other:__________________________________________
Parish Budget and Offertory Collections $___________ 75. Annual operating revenue for the most recent fiscal year (exclude school) $___________ 76. Annual operating expenses for the most recent fiscal year (exclude school) $___________ 77. Average total weekly offertory collection (exclude special collections, building fund, etc.) Yes No
1 2 78. Does the parish have a parish school? 1 2 79. Does the parish support a regional school?
________% 80. Percentage of the total parish budget used to support the parish and/or regional school
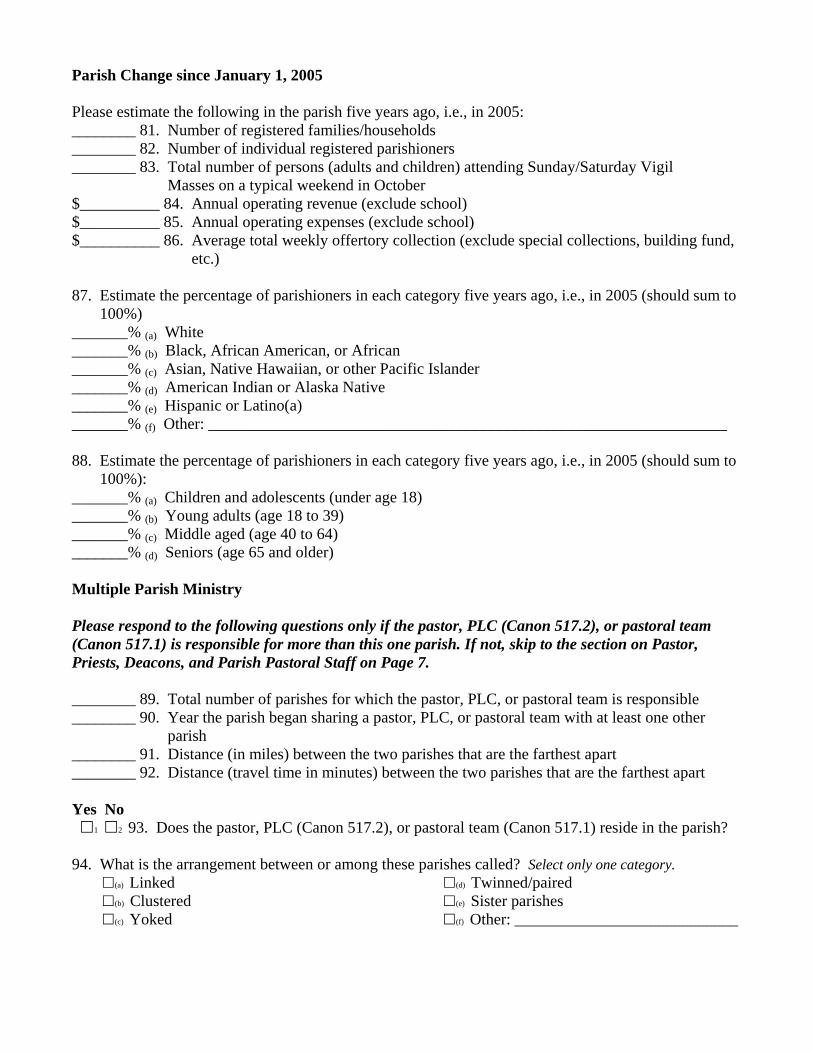
Parish Change since January 1, 2005 Please estimate the following in the parish five years ago, i.e., in 2005: ________ 81. Number of registered families/households ________ 82. Number of individual registered parishioners ________ 83. Total number of persons (adults and children) attending Sunday/Saturday Vigil Masses on a typical weekend in October $__________ 84. Annual operating revenue (exclude school) $__________ 85. Annual operating expenses (exclude school) $__________ 86. Average total weekly offertory collection (exclude special collections, building fund, etc.) 87. Estimate the percentage of parishioners in each category five years ago, i.e., in 2005 (should sum to 100%) _______% (a) White _______% (b) Black, African American, or African _______% (c) Asian, Native Hawaiian, or other Pacific Islander _______% (d) American Indian or Alaska Native _______% (e) Hispanic or Latino(a) _______% (f) Other: _________________________________________________________________ 88. Estimate the percentage of parishioners in each category five years ago, i.e., in 2005 (should sum to 100%): _______% (a) Children and adolescents (under age 18) _______% (b) Young adults (age 18 to 39) _______% (c) Middle aged (age 40 to 64) _______% (d) Seniors (age 65 and older) Multiple Parish Ministry Please respond to the following questions only if the pastor, PLC (Canon 517.2), or pastoral team (Canon 517.1) is responsible for more than this one parish. If not, skip to the section on Pastor, Priests, Deacons, and Parish Pastoral Staff on Page 7. ________ 89. Total number of parishes for which the pastor, PLC, or pastoral team is responsible ________ 90. Year the parish began sharing a pastor, PLC, or pastoral team with at least one other parish ________ 91. Distance (in miles) between the two parishes that are the farthest apart ________ 92. Distance (travel time in minutes) between the two parishes that are the farthest apart Yes No 1 2 93. Does the pastor, PLC (Canon 517.2), or pastoral team (Canon 517.1) reside in the parish? 94. What is the arrangement between or among these parishes called? Select only one category.
(a) Linked (b) Clustered (c) Yoked
(d) Twinned/paired (e) Sister parishes (f) Other: ____________________________

95. List the name, city, and size (number of registered families/households and/or number of individual registered parishioners) of each of the other parishes. Name City Families/households Parishioners In addition to the pastor, PLC, or pastoral team, does the parish share any of the following with any of the other parishes? Check all that apply.
96 Deacon(s) 97 Other paid staff 98 Volunteers 99 Communications (e.g. bulletin, website)
100 Inter-parish pastoral council/committee 101 Inter-parish finance council/committee 102 Other ministries, programs, or services 103 Other:_________________________
If the parish shares ministries, programs, or services, please indicate which programs the parishes share. Check all that apply.
104 Religious education/faith formation/ catechesis for children
105 Religious education/faith formation/ catechesis for adolescents
106 Adult faith formation 107 Whole family/intergenerational catechesis 108 Sacramental preparation 109 Marriage preparation 110 RCIA 111 Evangelization
112 Youth ministry 113 Young adult ministry 114 Ministry to elderly/senior citizens 115 Ministry to persons with disabilities 116 Ministry to infirm or homebound 117 Ministry to bereaved 118 Ministry to divorced/separated 119 Social services to meet individual needs 120 Social action to educate or effect change 121 Other: _________________________
PLEASE USE THE POSITION TITLES LISTED ON THE ENCLOSED SHEET TO ASSIST IN COMPLETING THE GRID ON THE NEXT PAGE OF THIS QUESTIONNAIRE
In the event it is necessary for CARA to contact you for clarification about the data reported here, please supply the following information. Person Completing the Survey: _____________________________________________________ Telephone: ___________________________E-mail:_____________________________________
Center for Applied Research in the Apostolate at Georgetown University PHONE: 202-687-8080 FAX: 202-687-8083
© CARA, 2010 All Rights Reserved
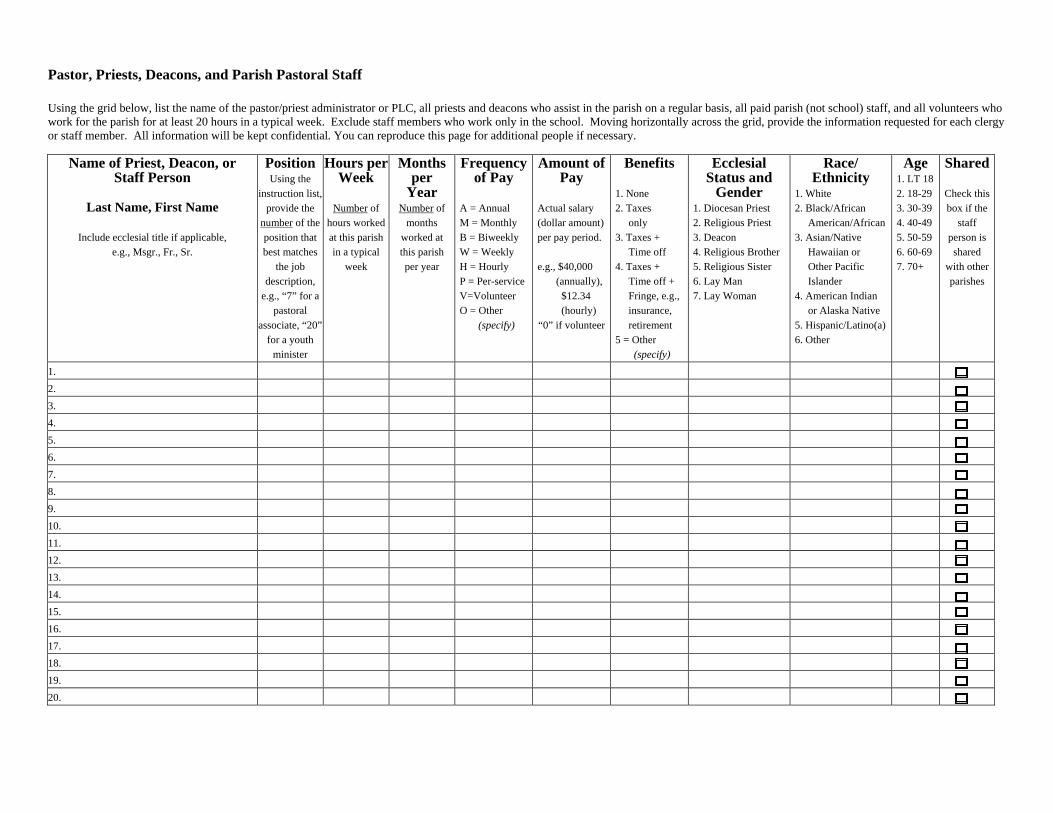
Pastor, Priests, Deacons, and Parish Pastoral Staff Using the grid below, list the name of the pastor/priest administrator or PLC, all priests and deacons who assist in the parish on a regular basis, all paid parish (not school) staff, and all volunteers who work for the parish for at least 20 hours in a typical week. Exclude staff members who work only in the school. Moving horizontally across the grid, provide the information requested for each clergy or staff member. All information will be kept confidential. You can reproduce this page for additional people if necessary.
Name of Priest, Deacon, or Staff Person
Last Name, First Name
Include ecclesial title if applicable,
e.g., Msgr., Fr., Sr.
Position Using the
instruction list, provide the
number of the position that best matches
the job description,
e.g., “7” for a pastoral
associate, “20” for a youth
minister
Hours per Week
Number of
hours worked at this parish in a typical
week
Months per
Year Number of
months worked at this parish per year
Frequency of Pay
A = Annual M = Monthly B = Biweekly W = Weekly H = Hourly P = Per-service V=Volunteer O = Other (specify)
Amount of Pay
Actual salary (dollar amount) per pay period. e.g., $40,000 (annually), $12.34 (hourly) “0” if volunteer
Benefits 1. None 2. Taxes only 3. Taxes + Time off 4. Taxes + Time off + Fringe, e.g., insurance, retirement 5 = Other (specify)
Ecclesial Status and
Gender 1. Diocesan Priest 2. Religious Priest 3. Deacon 4. Religious Brother 5. Religious Sister 6. Lay Man 7. Lay Woman
Race/Ethnicity
1. White 2. Black/African
American/African3. Asian/Native
Hawaiian or Other Pacific Islander
4. American Indian or Alaska Native
5. Hispanic/Latino(a)6. Other
Age 1. LT 18 2. 18-29 3. 30-39 4. 40-49 5. 50-59 6. 60-69 7. 70+
Shared
Check this box if the
staff person is shared
with other parishes
1. 2. 3. 4. 5. 6. 7. 8. 9. 10. 11. 12. 13. 14. 15. 16. 17. 18. 19. 20.

Survey Position Titles With Brief Descriptions
Pastoral Leadership Positions 1 Pastor/Administrator: Priest responsible for directing and implementing all aspects of parish life -- sacramental,
liturgical, educational, ministerial, financial, and administrative, etc. 2 Associate Pastor/Parochial Vicar: Priest who assists Pastor in certain aspects of parish life, especially sacramental,
liturgical, educational, ministerial, etc. 3 Permanent Deacon: Provides unpaid service to parish by assisting in sacramental ministry (deacon at Mass, preaching,
other sacraments), assisting poor, visiting sick & prisoners, etc. (Indicate paid ministry with positions listed below.) 4 Parish Life Coordinator (Canon 517.2): In lieu of a priest pastor/administrator, coordinates the daily pastoral care of a
parish including sacramental, liturgical, educational, ministerial, financial, and administrative functions. 5 Parish Administration & Ministry Director: Directs both pastoral ministries & administration (office, facilities and
business functions) under general oversight of a priest pastor or priest administrator. Includes supervision of staff. 6 Pastoral Ministry Director: Direct the pastoral ministries of a parish under general oversight of a priest pastor or priest
administrator. Includes supervision of staff.
Pastoral Ministries Positions 7 Pastoral Associate/Assistant: Serves as chief assistant to pastor in a parish, coordinating several parish activities and
programs. 8 Pastoral Minister: Responsible for narrow range of pastoral duties under the direction of pastor, pastoral associate or
other staff member. Provides direct services for several ministry areas or for a single ministry. 9 Family Life Director: Oversees & directs large and active parish family life ministry program including counseling,
referral, educational programs and services covering full range of family ministry. 10 Family Life Coordinator: Facilitates, coordinates and conducts parish family life ministry program activities. May
supervise volunteers. 11 Pastoral Counselor: Provides individual and/or group counseling to assist parishioners achieve more effective
personal, social, religious, educational development. 12 Parish Nurse: Performs a wide variety of health care activities including health education, skilled nursing care, CPR and
first aid as needed. Requires licensure as Licensed Practical Nurse. 13 Senior Ministry Coordinator: Coordinates and conducts parish social, educational, spiritual and physical services to
active senior adults. Identifies, implements and coordinates activities. 14 Pastoral Care Director: Directs parish pastoral care ministry to sick, elderly, homebound and bereaved parishioners
and families. Recruits, trains, & evaluates paid & volunteer ministers. 15 Pastoral Care Coordinator: Coordinates and conducts parish outreach to persons who are homebound, disabled
and/or ill. Recruits, screens, trains, and supports volunteers and/or parishioners. 16 Social Ministry Director: Oversees & directs large & active parish social ministry program with service, education,
advocacy and action components covering full range of social ministry. 17 Social Ministry Coordinator: Coordinates and provides direct services in a small parish social ministry program or in
one or more components of a large, parish social ministry program. 18 Youth Ministry Director: Directs comprehensive Youth Ministry Program, including catechetics, spiritual formation,
active worship, leadership training & service opportunities. May minister to young adults. 19 Youth Ministry Coordinator: Coordinates and conducts youth ministry program including spirituality, liturgy, guidance,
and social action (often without responsibility for youth catechesis). May minister to young adults. 20 Youth Minister: Coordinates specific segment of a total youth ministry program and provides direct ministry to youth.
May supervise volunteers. May be filled by those training for Youth Ministry field. 21 Young Adult Ministry Coordinator: Coordinates the evangelical outreach, pastoral ministry, and catechesis to young
adults in college and/or those in their twenties and thirties.
Religious Education Related Positions 22 Catechetical Ministry Director: Directs a comprehensive religious education program including Christian formation for
adults, teens, & children. Supervises staff & volunteers. Requires Master's Degree. 23 Catechetical Ministry Coordinator: Coordinates and conducts parish religious education programs, primarily with
published resources and volunteers. Requires Bachelor’s Degree. 24 Catechetical Ministry Assistant: Implements and provides administrative support for small religious education program
or one facet of large religious education program. 25 Adult Faith Formation Director: Directs, facilitates and conducts a number of adult faith activities and programs in a
parish. Responsible for budget preparation and training of volunteers. May minister to young adults. 26 Adult Faith Formation Coordinator: Conducts and implements adult faith activities and educational programs in a
parish, serving as contact and resource for small groups. May minister to young adults. 27 Sacramental Preparation Director: Directs all aspects of formation and preparation of children & parents for
sacraments of Baptism, Reconciliation, Eucharist & Confirmation and couples for Marriage. 28 Sacramental Preparation Coordinator: Coordinates and conducts sacramental preparation activities for
Reconciliation, Eucharist and Confirmation as well as for children’s baptism and marriage. 29 RCIA Director: Directs RCIA program/process. Recruits & trains team. Oversees entry of potential Catholics,
recruitment of candidate sponsors, catechesis of participants, and liturgical celebrations in year-round program. 30 RCIA Coordinator: Coordinates/conducts parish RCIA process including team assignments, recruitment and religious
formation of candidates, and coordination of RCIA liturgical activities. 31 Library / Media Center Coordinator: Administers small parish and/or school library or media center. May supervise
volunteer staff.

Liturgy and Music Positions 32 Director of Liturgy & Music: Directs comprehensive liturgy and music program for full liturgical cycle, including special
liturgical events, multiple choirs, liturgy teams / committees, training/scheduling, and program / event evaluation. 33 Liturgy Director: Designs & coordinates full liturgical program including liturgical seasons, special liturgical events,
liturgy committees, worship environment, scheduling presiders and other liturgical ministers. 34 Liturgy Coordinator: Coordinates parish liturgies. May include planning, scheduling (lectors, ministers, ushers, etc.),
opening and closing church, set up for Mass and sacraments, supervision of volunteers. 35 Sacristan: Sets up vestments, books, candles, and other liturgical materials in church to prepare for ceremonies.
Monitors maintenance & cleanliness of church facilities. Maintains inventory of supplies. 36 Music Director: Plans and coordinates comprehensive music program including several choirs/musician groups,
supervision & training of musicians/cantors & special music performances. 37 Music Coordinator: Plans and coordinates parish music including scheduling musicians at parish liturgies,
leading/accompanying music for liturgical services & coordinating musical ensembles. 38 Liturgical Musician: As cantor, organist, guitarist, etc, leads / accompanies assembly for musical component of liturgies
and other services. May select music, teach music to assembly, and lead volunteers.
Business/Administrative Positions 39 Business Administrator: Delegated by Pastor to administer finance, human resources, development, communications,
technology, purchasing, and facilities functions in parish. Includes supervision of staff. 40 Business Manager: Manages many administrative functions in parish. Typically supervises support and maintenance
staff and personally performs more complex administrative duties. 41 Business Coordinator: Manages limited range of administrative functions. Often handles finances, prepares financial
reports/statements and assists with annual audit. Little or no supervisory responsibility. 42 Bookkeeper: Maintains records for general ledger, subsidiary ledgers, payroll, accounts receivable, accounts payable,
other accounts and current financial information on all funds. 43 Account Clerk: Performs more routine accounting clerical, data entry and bookkeeping functions. May utilize
accounting computer program to process and keep records. 44 Development/Stewardship Coordinator: Coordinates & implements parish fundraising and stewardship program
including stewardship education, coordination of fundraising activities, and special events. 45 Volunteer / Parish Involvement Coordinator: Coordinates and conducts volunteer program including such volunteer
management techniques as needs assessment, time & talent survey, volunteer training, & background checks. 46 Information Technology Coordinator: Provides technical support for personal computer & system network, including
hardware & software installation, system backups, troubleshooting & computer user training. 47 Website Coordinator: Maintains accuracy of web site content. Develops and designs web pages using Internet and
website software. Writes, edits, codes, and publishes site changes and additions in timely manner.
Office & Support Positions 48 Office Staff Supervisor: Supervises two or more full-time office support staff employees and may supervise volunteers.
Personally performs more sensitive, difficult, and complex office functions as described in the Office Manager position. 49 Office Manager: Performs sensitive & complex office functions, e.g., maintains office systems, schedules & monitors
staff hours and facility usage, coordinates keys & petty cash, Executive Secretary functions. May supervise volunteers. 50 Executive Secretary: Assists Pastor with administrative functions (parish council, parish budget, sacramental records,
personnel matters, keys, petty cash, etc.) and with secretarial functions (correspondence, calendar, other office needs). 51 Administrative Assistant / Secretary: Performs administrative support, secretarial, clerical, and record keeping duties.
May include typing of reports, correspondence, & weekly bulletin; processing mail, entering data, greeting visitors, etc. 52 Receptionist: Performs general receptionist tasks including greeting/referring visitors & telephone callers, taking
messages, distributing mail and performing general clerical work as time permits. 53 Office Assistant: Performs routine clerical tasks such as distributing mail, data entry, typing, file maintenance,
photocopying and duplicating of materials. Requires no previous experience.
Facilities Positions 54 Facilities Maintenance Supervisor: Supervises maintenance, renovation and upkeep of buildings & grounds.
Supervises maintenance & grounds employees. May oversee outside contractors. 55 Facilities Maintenance Coordinator: Coordinates maintenance of buildings & grounds through volunteers, seasonal
help and outside contractors. Personally performs many maintenance functions. 56 Maintenance Worker: Performs maintenance of buildings and grounds including semi-skilled carpentry, plumbing,
electrical, painting and other maintenance and repair work. 57 Groundskeeper: Maintains parish grounds by caring for lawn, trees, shrubs, and flowers; mowing, trimming, raking, and
watering; ice & snow removal; and collecting and disposing of leaves and litter. 58 Maintenance Helper/Custodian: Performs cleaning, facility set up, hauling and moving of equipment, mowing, raking
and watering of grounds, ice and snow removal, and minor maintenance tasks. 59 Housekeeper/Janitor: Maintains church and other buildings in clean and orderly manner, including dusting, vacuuming
and waxing of floors, cleaning bathrooms, washing windows and trash removal. 60 Rectory Housekeeper/Cook: Provides cleaning, cooking and/or laundry services for persons living in rectory.
Other Parish Positions 61 Other: (Please specify Position Title and brief summary of duties.)