Embed Size (px)
Citation preview
UNIVERSITY OF LJUBLJANA
BIOTECHNICAL FACULTY
INTERNATIONAL MASTER OF FRUIT SCIENCE
Tamara PLEIĆ
THE CHANGES IN THE FRUIT CHEMICAL
COMPOSITION OF FOUR APPLE CULTIVARS
(Malus domestica Borkh.)
FROM HARVEST TILL SPRING
M. SC. THESIS
International Master of Fruit Science
Ljubljana, 2015
UNIVERSITY OF LJUBLJANA
BIOTECHNICAL FACULTY
INTERNATIONAL MASTER OF FRUIT SCIENCE
Tamara PLEIĆ
THE CHANGES IN THE FRUIT CHEMICAL COMPOSITION OF
FOUR APPLE CULTIVARS (Malus domestica Borkh.)
FROM HARVEST TILL SPRING
M. SC. THESIS
International Master of Fruit Science
SPREMEMBE V KEMIČNI SESTAVI PLODOV ŠTIRIH SORT
JABLANE (Malus domestica Borkh.) OD OBIRANJA DO POMLADI
MAGISTRSKO DELO
Mednarodni študijski program Sadjarstvo – 2. stopnja
Ljubljana, 2015
Pleić T., The changes in the fruit chemical … from harvest till spring,
M. Sc. Thesis, University of Ljubljana, Biotechnical Faculty, IMFS, 2015 II
INTERNATIONAL MASTER OF FRUIT SCIENCE
Master Degree Thesis
THE CHANGES IN THE FRUIT CHEMICAL COMPOSITION
OF FOUR APPLE CULTIVARS (Malus domestica Borkh.)
FROM HARVEST TILL SPRING
Tamara PLEIĆ
Academic year: 2014/2015
Supervisor:
asocc. prof. dr. Robert VEBERIČ
Commission for assessment and defence:
President of commission: prof. dr. Gregor OSTERC
University of Ljubljana, Biotechnical Faculty
Members of commission: prof. dr. Metka HUDINA
University of Ljubljana, Biotechnical Faculty
prof. dr. Massimo TAGLIAVINI
Free University of Bozen/Bolzano, Faculty of Science and
Technology
dr. Ivo ONDRÁŠEK
Mendel University in Brno, Faculty of Horticulture
Date of defence: 25. 09. 2015
_________________________________________________________________________
I, the undersigned candidate declare that this work is a result of my own research work and
that the electronic and printed versions are identical. I am hereby non-paidly, non-
exclusively, and spatially and timelessly unlimitedly transferring to University the right to
store this authorial work in electronic version and to reproduce it, and the right to enable it
publicly accessible on the web pages of Digital Library of Biotechnical Faculty.
Tamara PLEIĆ
Pleić T., The changes in the fruit chemical … from harvest till spring,
M. Sc. Thesis, University of Ljubljana, Biotechnical Faculty, IMFS, 2015 III
KEY WORDS DOCUMENTATION
DN Du2-IMFS
DC UDC 634.11:543.61:547.97(043.2)
CX fruit grpwing/apple/Malus domestica/sugars/phenolics/acids/storage
AU PLEIĆ, Tamara
AA VEBERIČ, Robert (supervisor)
PP SI-1000 Ljubljana, Jamnikarjeva 101
PB University of Ljubljana, Biotechnical Faculty, Department of Agronomy
PY 2015
TY THE CHANGES IN THE FRUIT CHEMICAL COMPOSITION OF FOUR
APPLE CULTIVARS (Malus domestica Borkh.) FROM HARVEST TILL
SPRING
DT M. Sc. Thesis (Master Study Programmes - International Master of Fruit Science)
NO XVII, 71 (3) p., 16 tab., 28 fig., 2 ann., 54 ref.
LA en
AL en/sl
AB Market for apple (Malus domestica Borkh.) is a demanding one, so we try to keep
our products as good at the end of the sales season as they were at the begining.
Therefore, the aim of this study was to measure fruit firmness, content of soluble
solids, total acid content, ascorbic acid, hydroxycinnamic acid, total sugar content,
total phenolic content, flavanols, dihydrochalcones, flavonoles and anthocyanins in
three different terms (27. 9.2012, 10. 1. and 13. 3. 2013) in fruits of four different
cultivars (‘Granny Smith’, ‘Golden Delicious’, ‘Idared’ and ‘Braeburn’) held in two
types of storage: ULO and standard one. We compared the data between the
measurement terms and we compared the two types of storage on a measurement
term 10. 1. 2013. In comparison of the measurement terms we found that, generally,
there are statistically great differences between them. Moreover, we found that
there are greater differences between the first measuring term (27. 9. 2012) and the
second one (10. 1. 2013), than between the second and the third one (13. 3. 2013).
As for the comparison of the two types of storage on a measuring term 10. 1. 2013.
we concluded that one of the characteristics of apple, its firmness of fruit, was
generally higher in ULO storage than in standard one. The other feaures had higher
results in standard cold-storage than in ULO. We can conclude that this a result of a
greater loss of water from fruits held in standard cold-storage than in ULO, so the
concentration of all its components was greater in fruits held in standard cold-
storage.
Pleić T., The changes in the fruit chemical … from harvest till spring,
M. Sc. Thesis, University of Ljubljana, Biotechnical Faculty, IMFS, 2015 IV
KLJUČNA DOKUMENTACIJSKA INFORMACIJA
ŠD Du2-IMFS
DK UDK 634.11:543.61:547.97(043.2)
KG sadjarstvo/jablana/Malus domestica/sladkorji/fenoli/kisline/skladiščenje
AV PLEIĆ, Tamara
SA VEBERIČ, Robert (mentor)
KZ SI-1000 Ljubljana, Jamnikarjeva 101
ZA Univerza v Ljubljani, Biotehniška fakulteta, Mednarodni študijski program
Sadjarstvo
LI 2015
IN SPREMEMBE V KEMIČNI SESTAVI PLODOV ŠTIRIH SORT JABLANE
(Malus domestica Borkh.) OD OBIRANJA DO POMLADI
TD Magistrsko delo (Mednarodni študijski program Sadjarstvo – 2. stopnja)
OP XVII, 71, [3] str., 16 pregl., 28 sl., 2 pril., 54 vir.
IJ en
JI en/sl
AI Trg za jabolka (Malus domestica Borkh.) je zelo zahteven in plodovi morajo biti
ves čas prodajne sezone podobne kakovosti. Zato je bil cilj naše raziskave, da
izmerimo, kako se med tremi termini skladiščenja (27. 9. 2012, 10. 1. in 13. 3.
2013), pri štirih različnih sortah (‘Granny Smith’, ‘Zlati delišes’, ‘Idared’ in
‘Braeburn’) in dveh načinih skladiščenja (ULO in navadna atmosfera) spreminjajo
trdota plodov, vsebnost topne suhe snovi, vsebnost sladkorjev in organskih kislin,
vsebnost askorbinske kisline, skupni fenoli, vsebnost hidroksicimentnih kislin,
flavanolov, dihidrohalkonov, flavonov in antocianinov. Rezultate pri obeh nčinih
skladiščenja smo primerjali 10. 1. 2013. Prav tako smo pri vsakem načinu
skladiščenja spremljali spreminjanje parametrov z njegovim trajanjem. Ugotovili
smo, da obstajajo statistično značilne razlike med obema načinoma skladiščenja in
med termini. Prav tako smo ugotovili, da obstajajo večje razlike med med prvim
(27. 9. 2012) in drugim vzorčenjem (10. 1. 2013), kot pa med drugim in tretjim (13.
3. 2013). Ob primerjavi obeh načinov skladiščenja (termin 10. 1. 2013) lahko
zaključimo, da je bila trdota plodov večja pri plodovih skladiščenih v ULO
atmosferi v primerjavi z navadno atmosfero. Ostali izmerjeni parametri
skladiščenega sadja so bili praviloma nekoliko večji v navadni atmosferi.
Zaključimo lahko, da je to verjetno posledica hitrejših metabolnih procesov in večje
izgube vode v navadni atmosferi, kjer se kontrolira samo nizka temperaturea kot pa
v ULO atmosferi, kjer se dodatno kontrolira tudi sestava plinov.
Pleić T., The changes in the fruit chemical … from harvest till spring,
M. Sc. Thesis, University of Ljubljana, Biotechnical Faculty, IMFS, 2015 V
TABLE OF CONTENTS
Page
Key words documentation III
Ključna dokumentacijska informacija IV
Table of content V
Index of tables VIII
Index of figures XI
Index of annexes XVI
Glossary XVII
1 INTRODUCTION 1
1.1 REASON OF RESEARCH 1
1.2 WORKING HYPOTHESIS 1
1.3 PURPOSE OF THE RESEARCH 1
2 LITERATURE REVIEW 2
2.1 APPLE (Malus domestica Borkh.) 2
2.2 ECOLOGICAL REQUIREMENTS OF APPLE 2
2.3 DEVELOPMENT OF APPLE FRUIT 2
2.4 PRIMARY AND SECONDARY METABOLITES 4
2.4.1 Phenols 5
2.4.1.1 Phenolic acids and related compounds 5
2.4.1.1.1 Hydroxycinnamic acids 5
2.4.1.1.2 Chalcones 6
2.4.1.2 Flavonoids 6
2.4.1.2.1 Flavonols 7
2.4.1.2.2 Flavanols 7
2.4.1.2.3 Anthocyanidins and anthocyanins 8
2.5 FRUIT FIRMNESS 8
2.6 SOLUBLE SOLIDS CONTENT 9
2.7 ACIDITY 9
3 MATERIALS AND METHODS 10
3.1 ORCHARD 10
3.2 WEATHER CONDITIONS 10
3.3 PLANT MATERIAL 13
3.3.1 Cultivar ‘Braeburn’ 13
3.3.2 Cultivar ‘Golden Delicious’ 13
3.3.3 Cultivar ‘Granny Smith’ 14
3.3.4 Cultivar ‘Idared’ 15
3.4 METHODS 15
3.4.1 Extraction of sugars and organic acids 16
Pleić T., The changes in the fruit chemical … from harvest till spring,
M. Sc. Thesis, University of Ljubljana, Biotechnical Faculty, IMFS, 2015 VI
3.4.2 Extraction of vitamin C 16
3.4.3 Extraction of phenolics 16
3.4.4 HPLC analysis 17
3.4.4.1 HPLC analysis of sugars and organic acids 17
3.4.4.2 HPLC analysis of phenolics 17
3.4.4.3 Analysis of TPC 18
3.4.5 Measurement of fruit firmness 18
3.4.6 Measurement of soluble solids content 18
3.5 STATISTICAL ANALYSIS 18
4 RESULTS 20
4.1 FRUIT FIRMNESS 20
4.2 SOLUBLE SOLIDS CONTENT 21
4.3 TOTAL SUGAR CONTENT 23
4.4 TOTAL ORGANIC ACIDS CONTENT 25
4.5 ASCORBIC ACID CONTENT 27
4.6 TOTAL PHENOLIC CONTENT 29
4.6.1 Total phenolic content in fruit skin 29
4.6.2 Total phenolic content in fruit pulp 31
4.7 HYDROXYCINNAMIC ACID CONTENT 33
4.7.1 Hydroxycinnamic acid content in fruit skin 33
4.7.2 Hydroxycinnamic acid content in fruit pulp 35
4.8 FLAVANOLS CONTENT 37
4.8.1 Flavanols content in fruit skin 37
4.8.2 Flavanols content in fruit pulp 39
4.9 DIHYDROCHALCONES CONTENT 41
4.9.1 Dihydrochalcones content in fruit skin 41
4.9.2 Dihydrochalcones content in fruit pulp 43
4.10 FLAVONOLS CONTENT 43
4.10.1 Flavonols content in fruit skin 45
4.10.2 Flavonols content in fruit pulp 47
4.11 ANTHOCYANINS CONTENT 49
5 DISCUSSION 52
5.1 FRUIT FIRMNESS 52
5.2 SOLUBLE SOLIDS CONTENT 52
5.3 TOTAL SUGAR CONTENT 53
5.4 TOTAL ORGANIC ACIDS CONTENT 53
5.5 ASCORBIC ACID CONTENT 54
5.6 TOTAL PHENOLIC CONTENT 54
5.7 HYDROXYCINNAMIC ACID 55
5.8 FLAVANOLS 56
5.9 DIHYDROCHALCONES 56

Pleić T., The changes in the fruit chemical … from harvest till spring,
M. Sc. Thesis, University of Ljubljana, Biotechnical Faculty, IMFS, 2015 VII
5.10 FLAVONOLS 57
5.11 ANTHOCYANINS 58
6 CONCLUSION 59
7 SUMMARY (POVZETEK) 61
7.1 SUMMARY 61
7.2 POVZETEK 62
8 REFERENCES 67
Pleić T., The changes in the fruit chemical … from harvest till spring,
M. Sc. Thesis, University of Ljubljana, Biotechnical Faculty, IMFS, 2015 VIII
INDEX OF TABLES
Tab. 1. Average fruit firmness (kg/cm2) in 4 different cultivars of apple (‘Granny
Smith’, ‘Golden Delicious’, ‘Idared’ and ‘Braeburn’) in 2 types of storage (ULO
and standard) on measuring term 10. 1. 2013. Standard error is shown next to
average result, and a different letter in the right column indicates a statisticaly
significant difference (p≤0.05) in fruit firmness of a different types of storage
within each cultivar. 21
Tab. 2. Average content of soluble solids (°Brix) in 4 different cultivars of apple
(‘Granny Smith’, ‘Golden Delicious’, ‘Idared’ and ‘Braeburn’) in 2 types of
storage (ULO and standard) on measuring term 10. 1. 2013. Standard error is
shown next to average result, and a different letter in the right column indicates a
statisticaly significant difference (p≤0.05) in the content of soluble solids of a
different types of storage within each cultivar. 23
Tab. 3. Average total sugar content (mg/kg) in 4 different cultivars of apple
(‘Granny Smith’, ‘Golden Delicious’, ‘Idared’ and ‘Braeburn’) in 2 types of
storage (ULO and standard) on measuring term 10. 1. 2013. Standard error is
shown next to average result, and a different letter in the right column indicates a
statisticaly significant difference (p≤0.05) in total sugar content of a different
types of storage within each cultivar. 25
Tab. 4. Average total acids content (mg/kg) in 4 different cultivars of apple
(‘Granny Smith’, ‘Golden Delicious’, ‘Idared’ and ‘Braeburn’) in 2 types of
storage (ULO and standard) on measuring term 10. 1. 2013. Standard error is
shown next to average result, and a different letter in the right column indicates a
statisticaly significant difference (p≤0.05) in total acids content of a different
types of storage within each cultivar. 27
Tab. 5. Average content of ascorbic acid (mg/100 g) in 4 different cultivars of
apple (‘Granny Smith’, ‘Golden Delicious’, ‘Idared’ and ‘Braeburn’) in 2 types of
storage (ULO and standard) on measuring term 10. 1. 2013. Standard error is
shown next to average result, and a different letter in the right column indicates a
statisticaly significant difference (p≤0.05) in content of ascorbic acid of a different
types of storage within each cultivar. 29
Tab. 6. Average total phenolic content in skin (mg/kg) in 4 different cultivars of
apple (‘Granny Smith’, ‘Golden Delicious’, ‘Idared’ and ‘Braeburn’) in 2 types of
storage (ULO and standard) on measuring term 10. 1. 2013. Standard error is
shown next to average result, and a different letter in the right column indicates a
Pleić T., The changes in the fruit chemical … from harvest till spring,
M. Sc. Thesis, University of Ljubljana, Biotechnical Faculty, IMFS, 2015 IX
statisticaly significant difference (p≤0.05) total phenolic content in skin of a
different types of storage within each cultivar. 31
Tab. 7. Average total phenolic content in pulp (mg/kg) in 4 different cultivars of
apple (‘Granny Smith’, ‘Golden Delicious’, ‘Idared’ and ‘Braeburn’) in 2 types of
storage (ULO and standard) on measuring term 10. 1. 2013. Standard error is
shown next to average result, and a different letter in the right column indicates a
statisticaly significant difference (p≤0.05) total phenolic content in pulp of a
different types of storage within each cultivar. 33
Tab. 8. Average hydroxycinnamic acid content in skin (mg/kg) in 4 different
cultivars of apple (‘Granny Smith’, ‘Golden Delicious’, ‘Idared’ and ‘Braeburn’)
in 2 types of storage (ULO and standard) on measuring term 10. 1. 2013. Standard
error is shown next to average result, and a different letter in the right column
indicates a statisticaly significant difference (p≤0.05) hydroxycinnamic acid
content in skin of a different types of storage within each cultivar. 35
Tab. 9. Average hydroxycinnamic acid content in pulp (mg/kg) in 4 different
cultivars of apple (‘Granny Smith’, ‘Golden Delicious’, ‘Idared’ and ‘Braeburn’)
in 2 types of storage (ULO and standard) on measuring term 10. 1. 2013. Standard
error is shown next to average result, and a different letter in the right column
indicates a statisticaly significant difference (p≤0.05) hydroxycinnamic acid
content in pulp of a different types of storage within each cultivar. 37
Tab. 10. Average flavanols content in skin (mg/kg) in 4 different cultivars of
apple (‘Granny Smith’, ‘Golden Delicious’, ‘Idared’ and ‘Braeburn’) in 2 types of
storage (ULO and standard) on measuring term 10. 1. 2013. Standard error is
shown next to average result, and a different letter in the right column indicates a
statisticaly significant difference (p≤0.05) flavanols content in skin of a different
types of storage within each cultivar. 39
Tab. 11. Average flavanols content in pulp (mg/kg) in 4 different cultivars of
apple (‘Granny Smith’, ‘Golden Delicious’, ‘Idared’ and ‘Braeburn’) in 2 types of
storage (ULO and standard) on measuring term 10. 1. 2013. Standard error is
shown next to average result, and a different letter in the right column indicates a
statisticaly significant difference (p≤0.05) flavanols content in pulp of a different
types of storage within each cultivar.
41
Tab. 12. Average dihydrochalcones content in skin (mg/kg) in 4 different cultivars
of apple (‘Granny Smith’, ‘Golden Delicious’, ‘Idared’ and ‘Braeburn’) in 2 types
of storage (ULO and standard) on measuring term 10. 1. 2013. Standard error is
Pleić T., The changes in the fruit chemical … from harvest till spring,
M. Sc. Thesis, University of Ljubljana, Biotechnical Faculty, IMFS, 2015 X
shown next to average result, and a different letter in the right column indicates a
statisticaly significant difference (p≤0.05) dihydrochalcones content in skin of a
different types of storage within each cultivar. 43
Tab. 13. Average dihydrochalcones content in pulp (mg/kg) in 4 different
cultivars of apple (‘Granny Smith’, ‘Golden Delicious’, ‘Idared’ and ‘Braeburn’)
in 2 types of storage (ULO and standard) on measuring term 10. 1. 2013. Standard
error is shown next to average result, and a different letter in the right column
indicates a statisticaly significant difference (p≤0.05) dihydrochalcones content in
pulp of a different types of storage within each cultivar. 45
Tab. 14. Average flavonols content in skin (mg/kg) in 4 different cultivars of
apple (‘Granny Smith’, ‘Golden Delicious’, ‘Idared’ and ‘Braeburn’) in 2 types of
storage (ULO and standard) on measuring term 10. 1. 2013. Standard error is
shown next to average result, and a different letter in the right column indicates a
statisticaly significant difference (p≤0.05) flavonols content in skin of a different
types of storage within each cultivar. 47
Tab. 15. Average flavonols content in pulp (mg/kg) in 4 different cultivars of
apple (‘Granny Smith’, ‘Golden Delicious’, ‘Idared’ and ‘Braeburn’) in 2 types of
storage (ULO and standard) on measuring term 10. 1. 2013. Standard error is
shown next to average result, and a different letter in the right column indicates a
statisticaly significant difference (p≤0.05) flavonols content in pulp of a different
types of storage within each cultivar. 49
Tab. 16. Average anthocyanins content (mg/kg) in 2 different cultivars of apple
(‘Idared’ and ‘Braeburn’) in 2 types of storage (ULO and standard) on measuring
term 10. 1. 2013. Standard error is shown next to average result, and a different
letter in the right column indicates a statisticaly significant difference (p≤0.05)
anthocyanins content in pulp of a different types of storage within each cultivar. 51
Pleić T., The changes in the fruit chemical … from harvest till spring,
M. Sc. Thesis, University of Ljubljana, Biotechnical Faculty, IMFS, 2015 XI
INDEX OF FIGURES
Fig. 1. Skeletal formula of hydroxycinnamic acid (Chemfaces, 2010) 6
Fig. 2. Skeletal formula of chalcone (Sigma Aldrich, 2010) 6
Fig. 3. Skeletal structure of the epicatechin (Mars Cocoa Science, 2010) 7
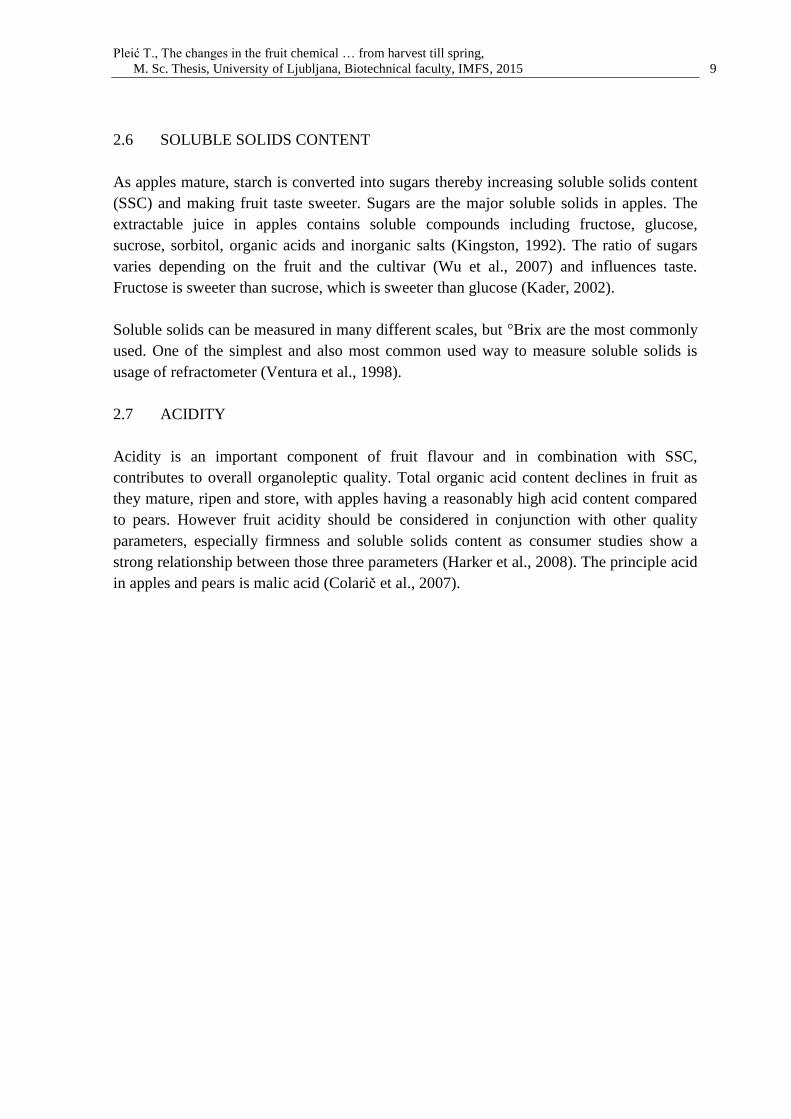
Fig. 4. Deviation of the amount of precipitation in year 2012 with an arrow
pointing to an approximate location of the orchard (DHMZ, 2014) 11
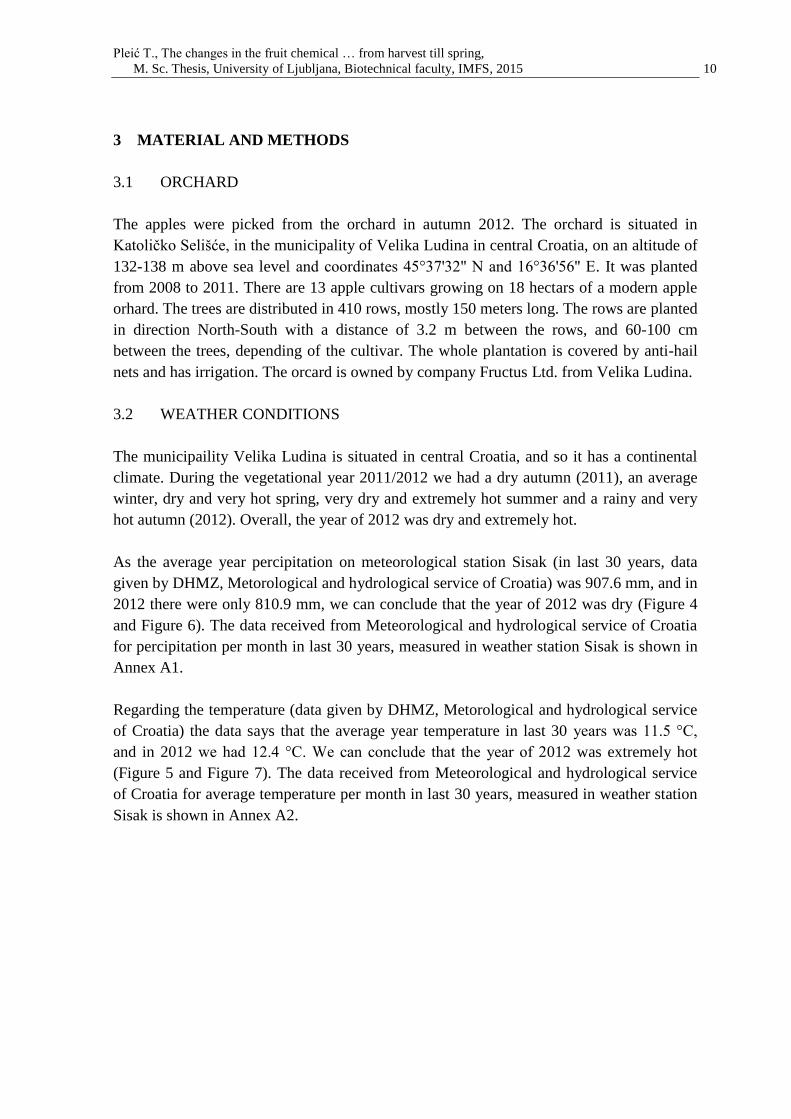
Fig. 5. Deviation of the mean air temperature in year 2012 with an arrow
pointing to an approximate location of the orchard (DHMZ, 2014) 11
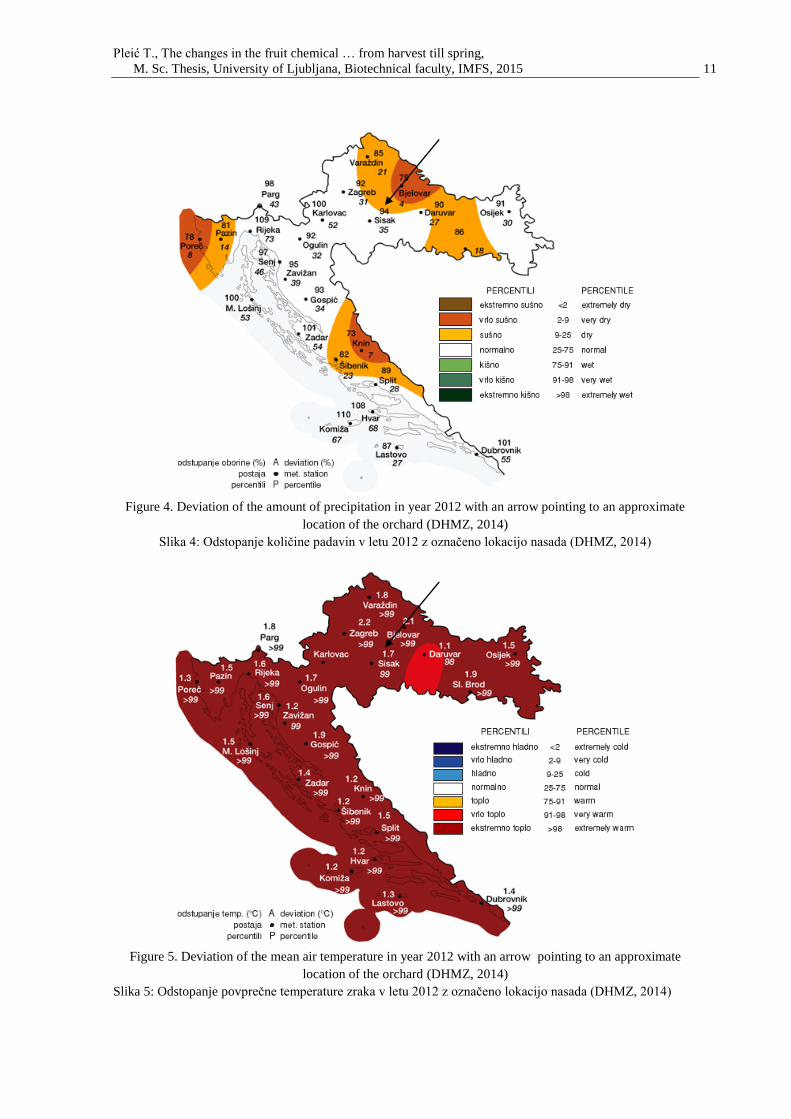
Fig. 6. Relations between long-term average month percipitation and percipitation
in 2012 (in mm), meteorological station Sisak 12
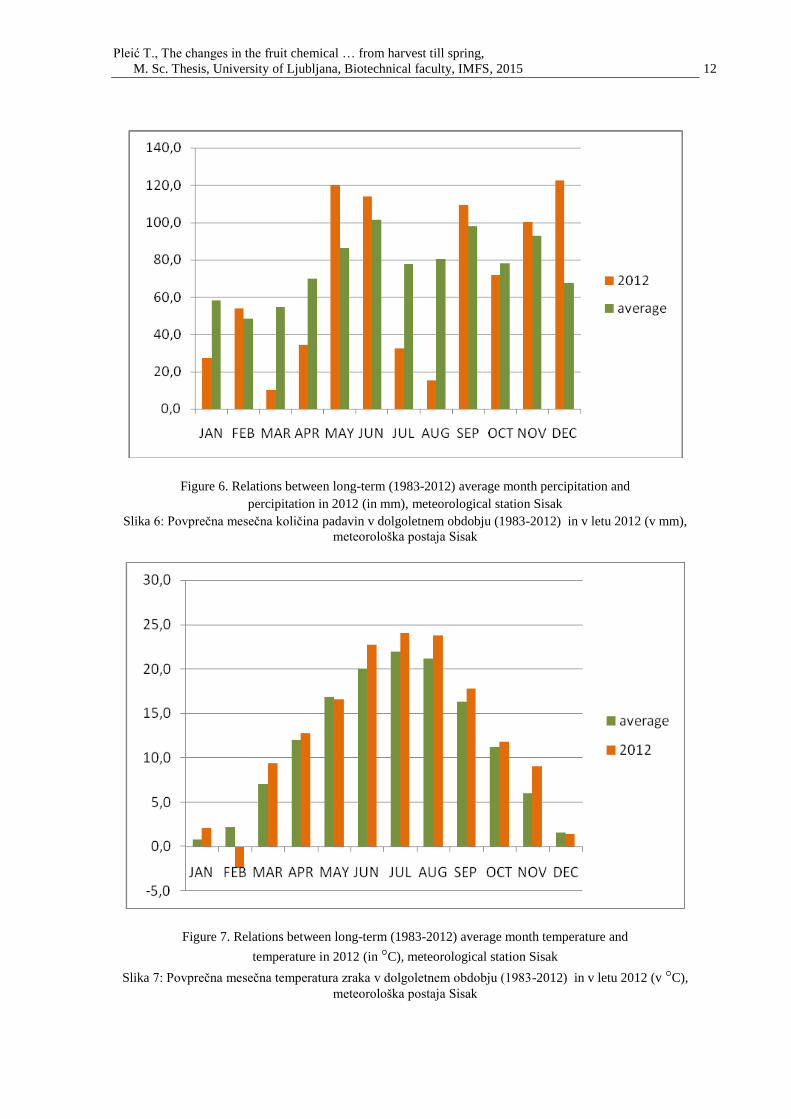
Fig. 7. Relations between long-term average month temperature and temperature
in 2012 (in °C), meteorological station Sisak 12
Fig. 8. The fruit of the ‘Braeburn’ cultivar (private photo, 17. 10. 2014) 13
Fig. 9. The fruit of the ‘Golden Delicious’ cultivar (private photo, 17. 10. 2014) 14
Fig. 10. The fruit of the ‘Granny Smith’ cultivar (private photo, 17. 10. 2014) 14
Fig. 11. The fruit of the ‘Idared’ cultivar (private photo, 17. 10. 2014) 15
Fig. 12. Average fruit firmness (kg/cm2) in 4 different cultivars of apple (‘Granny
Smith’, ‘Golden Delicious’, ‘Idared’ and ‘Braeburn’) in 2 types of storage (ULO
and standard) and in 3 different terms (27. 9. 2012, 10. 1. 2013 and 13. 3. 2013).
A different letter above the columns indicates a statisticaly significant difference
(p≤0.05) in fruit firmness of a certain cultivar within one type of storage. Capital
letter marks a result in ULO storage, and a small one marks a result in standard
cold-storage. Types of storage are also marked in different colors. 20
Fig. 13. Average content of soluble solids in 4 different cultivars of apple
(‘Granny Smith’, ‘Golden Delicious’, ‘Idared’ and ‘Braeburn’) in 2 types of
storage (ULO and standard) and in 3 different terms (27. 9. 2012, 10. 1. 2013 and
13. 3. 2013). A different letter above the columns indicates a statisticaly
significant difference (p≤0.05) in the content of soluble solids of a certain cultivar

Pleić T., The changes in the fruit chemical … from harvest till spring,
M. Sc. Thesis, University of Ljubljana, Biotechnical Faculty, IMFS, 2015 XII
within one type of storage. Capital letter marks a result in ULO storage, and a
small one marks a result in standard cold-storage. Types of storage are also
marked in different colors. 22
Fig. 14. Average total sugar content (mg/kg) in 4 different cultivars of apple
(‘Granny Smith’, ‘Golden Delicious’, ‘Idared’ and ‘Braeburn’) in 2 types of
storage (ULO and standard) and in 3 different terms (27. 9. 2012, 10. 1. 2013 and
13. 3. 2013). A different letter above the columns indicates a statisticaly
significant difference (p≤0.05) in total sugar content of a certain cultivar within
one type of storage. Capital letter marks a result in ULO storage, and a small one
marks a result in standard cold-storage. Types of storage are also marked in
different colors. 24
Fig. 15. Average total acids content (mg/kg) in 4 different cultivars of apple
(‘Granny Smith’, ‘Golden Delicious’, ‘Idared’ and ‘Braeburn’) in 2 types of
storage (ULO and standard) and in 3 different terms (27. 9. 2012, 10. 1. 2013 and
13. 3. 2013). A different letter above the columns indicates a statisticaly
significant difference (p≤0.05) in total acids content of a certain cultivar within
one type of storage. Capital letter marks a result in ULO storage, and a small one
marks a result in standard cold-storage. Types of storage are also marked in
different colors. 26
Fig. 16. Average content of ascorbic acid (mg/100 g) in 4 different cultivars of
apple (‘Granny Smith’, ‘Golden Delicious’, ‘Idared’ and ‘Braeburn’) in 2 types of
storage (ULO and standard) and in 3 different terms (27. 9. 2012, 10. 1. 2013 and
13. 3. 2013). A different letter above the columns indicates a statisticaly
significant difference (p≤0.05) in content of ascorbic acid of a certain cultivar
within one type of storage. Capital letter marks a result in ULO storage, and a
small one marks a result in standard cold-storage. Types of storage are also
marked in different colors. 28
Fig. 17. Average total phenolic content in skin (mg/kg) in 4 different cultivars of
apple (‘Granny Smith’, ‘Golden Delicious’, ‘Idared’ and ‘Braeburn’) in 2 types of
storage (ULO and standard) and in 3 different terms (27. 9. 2012, 10. 1. 2013 and
13. 3. 2013). A different letter above the columns indicates a statisticaly
significant difference (p≤0.05) in total phenolic content in skin of a certain
cultivar within one type of storage. Capital letter marks a result in ULO storage,
and a small one marks a result in standard cold-storage. Types of storage are also
marked in different colors. 30
Pleić T., The changes in the fruit chemical … from harvest till spring,
M. Sc. Thesis, University of Ljubljana, Biotechnical Faculty, IMFS, 2015 XIII
Fig. 18. Average total phenolic content in pulp (mg/kg) in 4 different cultivars of
apple (‘Granny Smith’, ‘Golden Delicious’, ‘Idared’ and ‘Braeburn’) in 2 types of
storage (ULO and standard) and in 3 different terms (27. 9. 2012, 10. 1. 2013 and
13. 3. 2013). A different letter above the columns indicates a statisticaly
significant difference (p≤0.05) in total phenolic content in pulp of a certain
cultivar within one type of storage. Capital letter marks a result in ULO storage,
and a small one marks a result in standard cold-storage. Types of storage are also
marked in different colors. 32
Fig. 19. Average hydroxycinnamic acid content in skin (mg/kg) in 4 different
cultivars of apple (‘Granny Smith’, ‘Golden Delicious’, ‘Idared’ and ‘Braeburn’)
in 2 types of storage (ULO and standard) and in 3 different terms (27. 9. 2012, 10.
1. 2013 and 13. 3. 2013). A different letter above the columns indicates a
statisticaly significant difference (p≤0.05) in hydroxycinnamic acid content in
skin of a certain cultivar within one type of storage. Capital letter marks a result in
ULO storage, and a small one marks a result in standard cold-storage. Types of
storage are also marked in different colors. 34
Fig. 20. Average hydroxycinnamic acid content in pulp (mg/kg) in 4 different
cultivars of apple (‘Granny Smith’, ‘Golden Delicious’, ‘Idared’ and ‘Braeburn’)
in 2 types of storage (ULO and standard) and in 3 different terms (27. 9. 2012, 10.
1. 2013 and 13. 3. 2013). A different letter above the columns indicates a
statisticaly significant difference (p≤0.05) in hydroxycinnamic acid content in
pulp of a certain cultivar within one type of storage. Capital letter marks a result
in ULO storage, and a small one marks a result in standard cold-storage. Types of
storage are also marked in different colors. 36
Fig. 21. Average flavanols content in skin (mg/kg) in 4 different cultivars of apple
(‘Granny Smith’, ‘Golden Delicious’, ‘Idared’ and ‘Braeburn’) in 2 types of
storage (ULO and standard) and in 3 different terms (27. 9. 2012, 10. 1. 2013 and
13. 3. 2013). A different letter above the columns indicates a statisticaly
significant difference (p≤0.05) in flavanols content in skin of a certain cultivar
within one type of storage. Capital letter marks a result in ULO storage, and a
small one marks a result in standard cold-storage. Types of storage are also
marked in different colors. 38
Fig. 22. Average flavanols content in pulp (mg/kg) in 4 different cultivars of apple
(‘Granny Smith’, ‘Golden Delicious’, ‘Idared’ and ‘Braeburn’) in 2 types of
storage (ULO and standard) and in 3 different terms (27. 9. 2012, 10. 1. 2013 and
13. 3. 2013). A different letter above the columns indicates a statisticaly
significant difference (p≤0.05) in flavanols content in pulp of a certain cultivar
Pleić T., The changes in the fruit chemical … from harvest till spring,
M. Sc. Thesis, University of Ljubljana, Biotechnical Faculty, IMFS, 2015 XIV
within one type of storage. Capital letter marks a result in ULO storage, and a
small one marks a result in standard cold-storage. Types of storage are also
marked in different colors. 40
Fig. 23. Average dihydrochalcones content in skin (mg/kg) in 4 different cultivars
of apple (‘Granny Smith’, ‘Golden Delicious’, ‘Idared’ and ‘Braeburn’) in 2 types
of storage (ULO and standard) and in 3 different terms (27. 9. 2012, 10. 1. 2013
and 13. 3. 2013). A different letter above the columns indicates a statisticaly
significant difference (p≤0.05) in dihydrochalcones content in skin of a certain
cultivar within one type of storage. Capital letter marks a result in ULO storage,
and a small one marks a result in standard cold-storage. Types of storage are also
marked in different colors. 42
Fig. 24. Average dihydrochalcones content in pulp (mg/kg) in 4 different cultivars
of apple (‘Granny Smith’, ‘Golden Delicious’, ‘Idared’ and ‘Braeburn’) in 2 types
of storage (ULO and standard) and in 3 different terms (27. 9. 2012, 10. 1. 2013
and 13. 3. 2013). A different letter above the columns indicates a statisticaly
significant difference (p≤0.05) in dihydrochalcones content in pulp of a certain
cultivar within one type of storage. Capital letter marks a result in ULO storage,
and a small one marks a result in standard cold-storage. Types of storage are also
marked in different colors. 44
Fig. 25. Average flavonols content in skin (mg/kg) in 4 different cultivars of apple
(‘Granny Smith’, ‘Golden Delicious’, ‘Idared’ and ‘Braeburn’) in 2 types of
storage (ULO and standard) and in 3 different terms (27. 9. 2012, 10. 1. 2013 and
13. 3. 2013). A different letter above the columns indicates a statisticaly
significant difference (p≤0.05) in flavonols content in skin of a certain cultivar
within one type of storage. Capital letter marks a result in ULO storage, and a
small one marks a result in standard cold-storage. Types of storage are also
marked in different colors. 46
Fig. 26. Average flavonols content in pulp (mg/kg) in 4 different cultivars of
apple (‘Granny Smith’, ‘Golden Delicious’, ‘Idared’ and ‘Braeburn’) in 2 types of
storage (ULO and standard) and in 3 different terms (27. 9. 2012, 10. 1. 2013 and
13. 3. 2013). A different letter above the columns indicates a statisticaly
significant difference (p≤0.05) in flavonols content in pulp of a certain cultivar
within one type of storage. Capital letter marks a result in ULO storage, and a
small one marks a result in standard cold-storage. Types of storage are also
marked in different colors. 48
Pleić T., The changes in the fruit chemical … from harvest till spring,
M. Sc. Thesis, University of Ljubljana, Biotechnical Faculty, IMFS, 2015 XV
Fig. 27. Average anthocyanins content (mg/kg) in 2 different cultivars of apple
(‘Idared’ and ‘Braeburn’) in 2 types of storage (ULO and standard) and in 3
different terms (27. 9. 2012, 10. 1. 2013 and 13. 3. 2013). A different letter above
the columns indicates a statisticaly significant difference (p≤0.05) in anthocyanins
content of a certain cultivar within one type of storage. Capital letter marks a
result in ULO storage, and a small one marks a result in standard cold-storage.
Types of storage are also marked in different colors. 50
Fig. 28. Senescent breakdown of cultivars ‘Braeburn’ and ‘Jonagold’ (private
photo, 23. 01. 2013) 60

Pleić T., The changes in the fruit chemical … from harvest till spring,
M. Sc. Thesis, University of Ljubljana, Biotechnical Faculty, IMFS, 2015 XVI
INDEX OF ANNEXES
Ann. A1: Average precipitation (mm) in each month for last 30 years, meteorological
station in Sisak (data given by DHMZ, Metorological and hydrological service of Croatia,
December 2014)
Ann. A2: Average temperature (mm) in each month for last 30 years, meteorological
station in Sisak (data given by DHMZ, Metorological and hydrological service of Croatia,
December 2014)
Pleić T., The changes in the fruit chemical … from harvest till spring,
M. Sc. Thesis, University of Ljubljana, Biotechnical Faculty, IMFS, 2015 XVII
GLOSSARY
Abbreviation Meaning
ULO
Ultra-low oxygen
‘Golden Del.’ ‘Golden Delicious’
stand. standard cold-storage
WAPA World Apple and Pear Association
HPLC High Performance Liquid Chromotography
TPC Total phenolic content
TSC Total sugars content
LSD multiple comparison test
SSC soluble solids content
hom. group Homogenous group
JAN January
FEB February
MAR March
APR April
JUN June
JUL July
AUG August
SEP September
OCT October
NOV November
DEC December
DHMZ Državni hidrometeorološki zavod
(Meteorological and hydrological service of Croatia)
Pleić T., The changes in the fruit chemical … from harvest till spring,
M. Sc. Thesis, University of Ljubljana, Biotechnical faculty, IMFS, 2015 1
1 INTRODUCTION
1.1 REASON OF RESEARCH
On an apple market in Europe and in the World, there is almost no room for mistakes in
fruit quality. Products should be flawless. As there are certain requirements of production,
there are some in storage as well. Apples have to be picked in the optimal ripening time
and only the ones of the best quality are stored for longer period. Storage creates a large
part of the final price, so it must be as cheap as possible and efficient. It should protect
your product from aging and all the other changes in its composition that go with it. There
is lack of data available what is happening with the chemical composition of fruits during
prolonged time of storage from harvest till spring when the demand and price of apples are
high.
1.2 WORKING HYPOTHESIS
Our hypothesis was that good quality fruits held in a proper storage (Ultra Low Oxygen
chamber) mantain their quality better than those held in a standard cold-storage, without a
controlled atmosphere. Proper storage conditions required also higher costs which should
be balanced with more fruits of better quality.
1.3 PURPOSE OF THE RESEARCH
The purpose of the research was to prove what are really the benefits of the ULO chamber
compared with standard storage treatment. We followed the apple quality during the
storage period based on measurements of different quality parameters.
Pleić T., The changes in the fruit chemical … from harvest till spring,
M. Sc. Thesis, University of Ljubljana, Biotechnical faculty, IMFS, 2015 2
2 LITERATURE REVIEW
2.1 APPLE (Malus domestica Borkh.)
Apple is a fruit species that has a full right to have the title of the queen of fruits. Fruits
ripen from the early summer till the late autumn. That fact is not surprising because we are
familiar with more than 10 000 apple cultivars (Adamič, 1963).
Apple is considered as a member of Rosaceae family. Today’s form of apple is a
descendent of Malus sieversii, but it is considered that Malus orientalis and Malus
sylvestris have also had an impact on its evolution (Štampar et al., 2009).
It is grown throughout the World, but China is leading country with 39 682 618 t, followed
by The United States of America, Turkey and Poland. Croatia is on the 48th
place with 128
211 t (FAOSTAT, 2013).
2.2 ECOLOGICAL REQUIREMENTS OF APPLE
Apple is a continental fruit species and its environmental requirements are consistent with
that. For a successful apple growing following environmental conditions are needed:
average annual temperature between 8 and 12 °C (Mišić, 1978), moderate to relatively
high air humidity (60-75 %), snow during cold winter temperatures etc., soil quality –
deep, sandy-loam structure, slightly sour – pH 5,5, with no more than 5 % of CaCO3, and
relief position - altitude between 120 and 600 m, slope angle around 4 % etc. (Krpina,
2004).
2.3 DEVELOPMENT OF APPLE FRUIT
In fruit development there are three major developmental stages: growth, maturation and
senescence. The developmental stages can overlap and are in thight connection with tree
physiology (Zadravec et al., 2014).
Cell division and subsequent cell enlargement are involved in the first physiological stage,
growth. It leads to a generally irreversible physical increase of the developing plant or fruit
(Zadravec et al., 2014).
Maturation is the time between the stages of growth and senescence. During maturation
phase, many physical and chemical changes occur. The fruit is in most cases still uneatable
but has reached the ability to ripen. The final eating quality of climacteric fruit is affected
not only by postharvest handling, but also with the stage of maturity at the harvest date
(Giovannoni et al., 2004).
Pleić T., The changes in the fruit chemical … from harvest till spring,
M. Sc. Thesis, University of Ljubljana, Biotechnical faculty, IMFS, 2015 3
Ripening is the process by which the physiologically mature but inedible fruit attains its
characteristic appearance and quality. The term is restricted to changes within the fruit and
is considered to begin during the final stages of maturation until the first stages of
senescence. Loss of chlorophyll, synthesis of carotenoids and anthocyanins, loss of acidity,
increase in sweetness (starch-sugar conversion, sugar-starch conversion, conversion of
starch and sugar to CO2 and water through respiration, breakdown of pectins and other
polysacharides, increase in lignin content), tissue softening and formation of flavor
volatiles are changes that occur during ripening (Giovanonni et al., 2004).
Growth and development are mainly completed while fruit is attached to the tree, while
senescence may proceed on or off the plant.
Senescence is the final physiological stage and it is characterized by degradative processes
which lead to deterioration and subsequently death of the plant tissue. With effective
postharvest storage regimes and proper handling senescence can be delayed and slowed
down. Storability of fruit might be prolonged with delayed senescence (Thompson, 2010).
Maturation of stored horticultural products can be accelerated by the influence of some
biological factors (respiration, ethylene production, compositional changes, transpiration,
physiological breadown, physical damage and pathological breakdown) and environmental
factors (temperature, relative humidy, atmospheric composition, ethylene, light and other)
(Thompson, 2010).
Fruits can be classified into two groups according to their pattern of respiration and
ethylene production rates: climacteric and non-climacteric. During ripening, climacteric
fruit, such as apple and pear indicate a distinct inrease in respiration rates and ethylene
production rates. They generally reach fully ripe stage after the respiratory peak. Most
climacteric fruit can be harvested mature and can ripen on or off the plant. Ethylene is
necessary for the completion of ripening. Faster and more uniform ripening can be
achieved by exogenously applying ethylene. Non-climacteric fruits, such as berries,
cherries or grapes are not able to ripen after harvest and produce very small quantities of
ethylene (Thompson, 2010).
Fruit species are divided into five different classes, according to their ethylene production
rate: very low, low, moderate, high and very high. Apple has an ethylene production rate
between 10 and 100, what puts her in “high” class (Thompson, 2010).
Pleić T., The changes in the fruit chemical … from harvest till spring,
M. Sc. Thesis, University of Ljubljana, Biotechnical faculty, IMFS, 2015 4
2.4 PRIMARY AND SECONDARY METABOLITES
Growers strive to improve the quality of fruits which are produced, in terms of eating
potential and its ability to store well after harvest. Assessment of quality is made via a set
of recognised parameters, which, except fruit firmness and soluble bsolids content, include
content of many secondary metabolites (Travers, 2013).
The compounds in living organisms are divided into two main groups: primary and
secondary metabolites. Plants synthesize a large range of organic compounds that are
traditionally classified as primary and secondary metabolites although the precise
boundaries between the two groups can be unclear (Veberič, 2010).
Primary metabolites are those produced by the plant and involved in primary metabolic
processes, such as respiration and photosynthesis (Seigler, 2012). They are synthesized by
the cell because they are indispensable for their growth (Renneberg and Demain, 2008).
Primary metabolites include molecules such as sugars, amino acids, proteins,
polysaccharides etc., of which many are considered as “building blocks” and energy
sources (Seigler, 2012). They have essential roles associated with photosynthesis,
respiration, and growth and development (these include simple sugars, lipids, nucleotides,
amino acids and organic acids, etc.) (Veberič, 2010). Most influence on taste of apples
have sugars and organic acids (Veberič et al., 2010).
Secondary metabolites have an important ecological and protective functions against
different forms of stress and don't have a direct function in growth and maintenance of the
cells. Even though secondary compounds are a normal part of the metabolism of an
organism, they are often produced in specialized cells or tissue, and can be more complex
than primary ones. Plants produce secondary metabolites as a response to adverse
environmental conditions or in specific developmental stages. Their biosynthesis starts
from some primary metabolite or from intermediates of the primary metabolism and many
of them accumulate in surprisingly high concentrations in some species. Thousands of
these chemicals have been identified in several major classes. These chemichals can
sometimes be used as taxonomic characters in classifying plants as each plant family,
genus, and species produces a characteristic mix of them. They have a key role in
protecting plants from herbivores and microbial infection, as attractants for pollinators and
seed-dispersing animals etc. Based on their biosynthetic origins, plant secondary
metabolites can be divided into three main groups: phenolics, terpenoids and nitrogen-
containing compounds (Veberič, 2010).
Pleić T., The changes in the fruit chemical … from harvest till spring,
M. Sc. Thesis, University of Ljubljana, Biotechnical faculty, IMFS, 2015 5
2.4.1 Phenols
The phenolics are found all over the plant kingdom and about 10,000 phenolic structures
have been reported. The content of phenolic compounds in plants varies with the species,
the cultivar, the considered organ, the physiological stage and the pedoclimatic conditions
(Scalbert and Williamson, 2000).
The phenol compounds form one of the main classes of secondary metabolites with a large
range of chemical structure and contribute to the organoleptic and nutritional quality of
fruits and vegetables. Phenols have great antioxidant activities and their possible beneficial
implications to human health is evident. They also have proven biological activity in the
prevention of cancer and cardiovascular diseases (Pearson et al., 1999).
Phenols are present in high concentrations in the epidermis of leaves and the skin of fruits
and contribute to all aspects of plant responses towards biotic and abiotic stimuli. They are
not only indicators of plant stress responses to variation of light or mineral treatment, but
are also key mediators of plant resistance towards pests. Lignin, suberin and similar
phenolic-based polymers contribute substantially to the stability and robustness of
gymnosperms and angiosperms. That greatly helps in prevention of plants mechanical or
environmental damage, like drought or wounding. Phenolics are characterized by having at
least one aromatic ring with one or more hydroxyl groups attached. They extent from
simple, low molecular-weight, single aromatic ringed compounds to large and complex
tannins and derived polyphenols. They can be classified based on the number and
arrangement of their carbon atoms and are usually found to be conjugated to sugars and
organic acids. Phenolics can be classified into two groups: flavonoids and the non-
flavonoids (Veberič, 2010).
2.4.1.1 Phenolic acids and related compounds
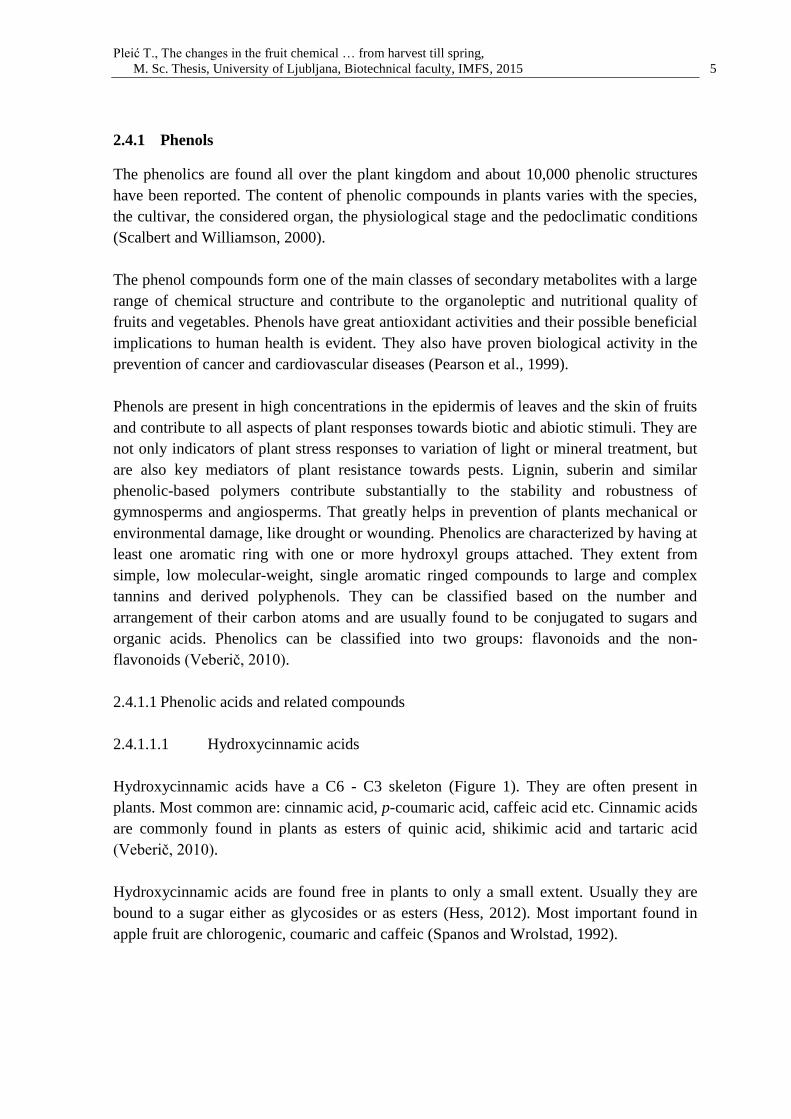
2.4.1.1.1 Hydroxycinnamic acids
Hydroxycinnamic acids have a C6 - C3 skeleton (Figure 1). They are often present in
plants. Most common are: cinnamic acid, p-coumaric acid, caffeic acid etc. Cinnamic acids
are commonly found in plants as esters of quinic acid, shikimic acid and tartaric acid
(Veberič, 2010).
Hydroxycinnamic acids are found free in plants to only a small extent. Usually they are
bound to a sugar either as glycosides or as esters (Hess, 2012). Most important found in
apple fruit are chlorogenic, coumaric and caffeic (Spanos and Wrolstad, 1992).
Pleić T., The changes in the fruit chemical … from harvest till spring,
M. Sc. Thesis, University of Ljubljana, Biotechnical faculty, IMFS, 2015 6
Figure 1. Skeletal formula of hydroxycinnamic acid (Chemfaces, 2010)
Slika 1: Skeletna formula hidroksicimetne kisline (Chemfaces, 2010)
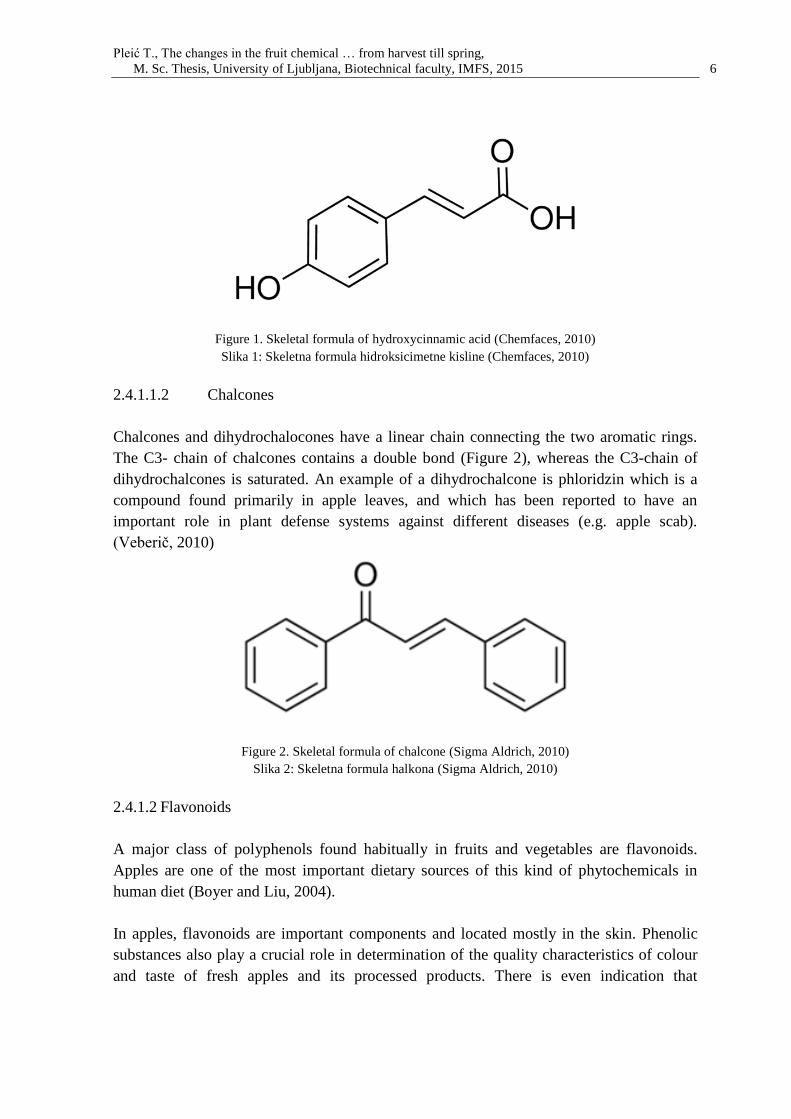
2.4.1.1.2 Chalcones
Chalcones and dihydrochalocones have a linear chain connecting the two aromatic rings.
The C3- chain of chalcones contains a double bond (Figure 2), whereas the C3-chain of
dihydrochalcones is saturated. An example of a dihydrochalcone is phloridzin which is a
compound found primarily in apple leaves, and which has been reported to have an
important role in plant defense systems against different diseases (e.g. apple scab).
(Veberič, 2010)
Figure 2. Skeletal formula of chalcone (Sigma Aldrich, 2010)
Slika 2: Skeletna formula halkona (Sigma Aldrich, 2010)
2.4.1.2 Flavonoids
A major class of polyphenols found habitually in fruits and vegetables are flavonoids.
Apples are one of the most important dietary sources of this kind of phytochemicals in
human diet (Boyer and Liu, 2004).
In apples, flavonoids are important components and located mostly in the skin. Phenolic
substances also play a crucial role in determination of the quality characteristics of colour
and taste of fresh apples and its processed products. There is even indication that
Pleić T., The changes in the fruit chemical … from harvest till spring,
M. Sc. Thesis, University of Ljubljana, Biotechnical faculty, IMFS, 2015 7
flavonoids and phenolic acids may influence fruit firmness. However, the literature
concerning changes in phenolics during storage is much more contradictory (Awad and de
Jager, 2000).
2.4.1.2.1 Flavonols
Flavonols are the most widely spread subclass of flavonoids, being abundant in almost all
fruit species. The distribution and structural variations of flavonols are extensive and have
been well documented. The levels of flavonols found in commonly consumed fruits can
vary due to seasonal changes, varietal differences, used technology as well as storage and
processing (Veberič, 2010).
Most abundant flavonols in apple are quercetin-3-O-rutinoside, quertcetine-3-O-
galactoside and quercetin-3-O-glucoside (Zupan et al., 2014).
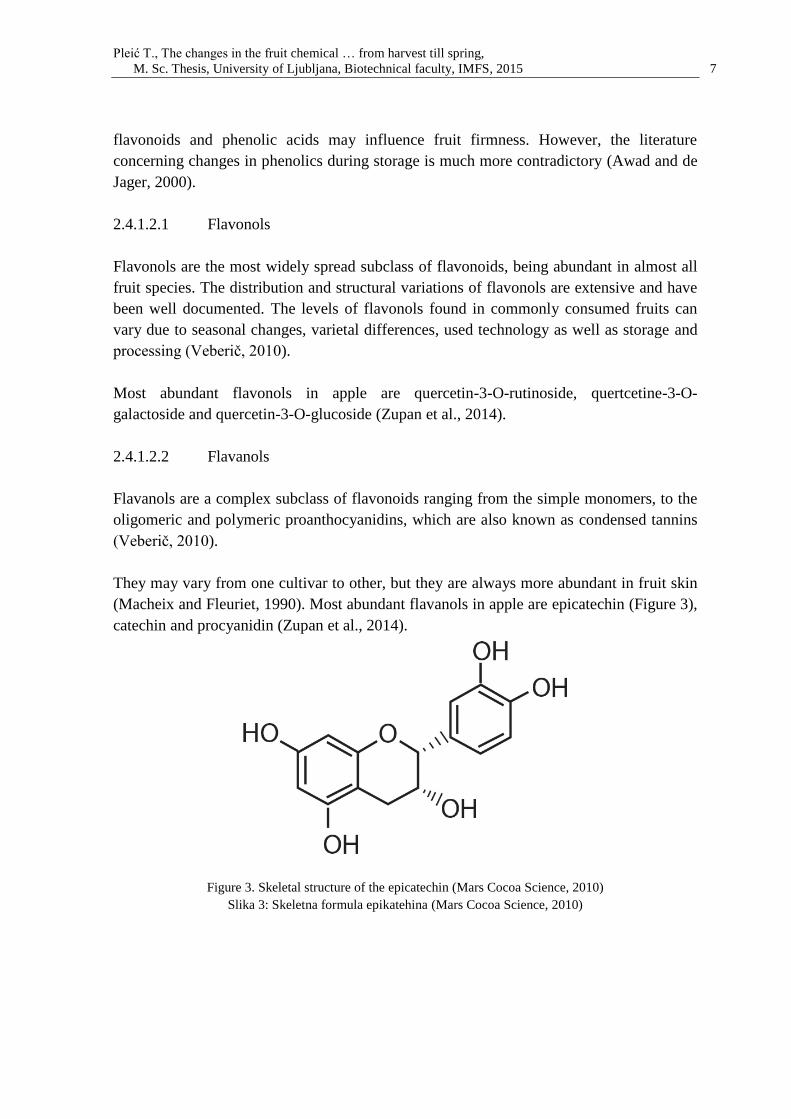
2.4.1.2.2 Flavanols
Flavanols are a complex subclass of flavonoids ranging from the simple monomers, to the
oligomeric and polymeric proanthocyanidins, which are also known as condensed tannins
(Veberič, 2010).
They may vary from one cultivar to other, but they are always more abundant in fruit skin
(Macheix and Fleuriet, 1990). Most abundant flavanols in apple are epicatechin (Figure 3),
catechin and procyanidin (Zupan et al., 2014).
Figure 3. Skeletal structure of the epicatechin (Mars Cocoa Science, 2010)
Slika 3: Skeletna formula epikatehina (Mars Cocoa Science, 2010)
Pleić T., The changes in the fruit chemical … from harvest till spring,
M. Sc. Thesis, University of Ljubljana, Biotechnical faculty, IMFS, 2015 8
2.4.1.2.3 Anthocyanidins and anthocyanins
The physiological roles of anthocyanidins and their conjugated derivatives, anthocyanins,
in vegetative tissues have puzzled scientists for over a century. Anthocyanins can be found
in the vacuoles of almost every cell type in the epidermal, ground and vascular tissues of
all vegetative organs. They occur in roots, hypocotyls, coleoptiles, rhizomes, stolons,
bulbs, leaves etc. (Gould et al., 2008).
They are involved in the protection of plants against excessive light by shading leaf
mesophyll cells and also have an important role to play in attracting pollinating insects.
The most common anthocyanidins are pelargonidin, cyanidin, petunidin and malvidin
(Veberič, 2010).
Cyanidin 3-galactoside was detected as the major anthocyanin in apple skin, accounting for
80 % of total anthocyanins. Cyanidin 3-glucoside, cyanidin 3-arabinoside, cyanidin 3-
rutinoside and cyanidin 3-xyloside were detected as the remaining anthocyanindins (Liu et
al., 2013).
2.5 FRUIT FIRMNESS
Fruit firmness is considered one of the most important criteria concerning eating quality of
apples. Facing demands in this respect represents a big challenge for the industry. Many
factors such as genetics, growing factors, mineral nutrition, harvest maturity and storage
regimes affect firmness (Saei et al., 2011).
Storage has a great impact on maintaining firmness and has been the subject of many
studies. Storage regimes have been optimised encompassing minimal losses due to
physiological disorders and maximum retention of firmness during long-term storage.
Progress has been vital in the past few decades paralleling the introduction of ultra low
oxygen storage. Many studies have also demonstrated improvement of fruit firmness
retention in a wide range of apple cultivars while stored in low and ultra-low oxygen
storage (Hoehn et al., 2003).
Fruit quality assessments usually involve measuring flesh firmness using a penetrometer.
Usually a probe, with either a flat or convex tip, is driven into the flesh, and the maximum
force is recorded. Magness and Taylor have developed early hand-held penetrometers and
from these devices, a range of devices have been developed. The wide use of firmness
measurements has led to the graduall development of new devices for measuring firmness
(Harker et al., 1996).
Pleić T., The changes in the fruit chemical … from harvest till spring,
M. Sc. Thesis, University of Ljubljana, Biotechnical faculty, IMFS, 2015 9
2.6 SOLUBLE SOLIDS CONTENT
As apples mature, starch is converted into sugars thereby increasing soluble solids content
(SSC) and making fruit taste sweeter. Sugars are the major soluble solids in apples. The
extractable juice in apples contains soluble compounds including fructose, glucose,
sucrose, sorbitol, organic acids and inorganic salts (Kingston, 1992). The ratio of sugars
varies depending on the fruit and the cultivar (Wu et al., 2007) and influences taste.
Fructose is sweeter than sucrose, which is sweeter than glucose (Kader, 2002).
Soluble solids can be measured in many different scales, but °Brix are the most commonly
used. One of the simplest and also most common used way to measure soluble solids is
usage of refractometer (Ventura et al., 1998).
2.7 ACIDITY
Acidity is an important component of fruit flavour and in combination with SSC,
contributes to overall organoleptic quality. Total organic acid content declines in fruit as
they mature, ripen and store, with apples having a reasonably high acid content compared
to pears. However fruit acidity should be considered in conjunction with other quality
parameters, especially firmness and soluble solids content as consumer studies show a
strong relationship between those three parameters (Harker et al., 2008). The principle acid
in apples and pears is malic acid (Colarič et al., 2007).
Pleić T., The changes in the fruit chemical … from harvest till spring,
M. Sc. Thesis, University of Ljubljana, Biotechnical faculty, IMFS, 2015 10
3 MATERIAL AND METHODS
3.1 ORCHARD
The apples were picked from the orchard in autumn 2012. The orchard is situated in
Katoličko Selišće, in the municipality of Velika Ludina in central Croatia, on an altitude of
132-138 m above sea level and coordinates 45°37'32'' N and 16°36'56'' E. It was planted
from 2008 to 2011. There are 13 apple cultivars growing on 18 hectars of a modern apple
orhard. The trees are distributed in 410 rows, mostly 150 meters long. The rows are planted
in direction North-South with a distance of 3.2 m between the rows, and 60-100 cm
between the trees, depending of the cultivar. The whole plantation is covered by anti-hail
nets and has irrigation. The orcard is owned by company Fructus Ltd. from Velika Ludina.
3.2 WEATHER CONDITIONS
The municipaility Velika Ludina is situated in central Croatia, and so it has a continental
climate. During the vegetational year 2011/2012 we had a dry autumn (2011), an average
winter, dry and very hot spring, very dry and extremely hot summer and a rainy and very
hot autumn (2012). Overall, the year of 2012 was dry and extremely hot.
As the average year percipitation on meteorological station Sisak (in last 30 years, data
given by DHMZ, Metorological and hydrological service of Croatia) was 907.6 mm, and in
2012 there were only 810.9 mm, we can conclude that the year of 2012 was dry (Figure 4
and Figure 6). The data received from Meteorological and hydrological service of Croatia
for percipitation per month in last 30 years, measured in weather station Sisak is shown in
Annex A1.
Regarding the temperature (data given by DHMZ, Metorological and hydrological service
of Croatia) the data says that the average year temperature in last 30 years was 11.5 °C,
and in 2012 we had 12.4 °C. We can conclude that the year of 2012 was extremely hot
(Figure 5 and Figure 7). The data received from Meteorological and hydrological service
of Croatia for average temperature per month in last 30 years, measured in weather station
Sisak is shown in Annex A2.
Pleić T., The changes in the fruit chemical … from harvest till spring,
M. Sc. Thesis, University of Ljubljana, Biotechnical faculty, IMFS, 2015 11
Figure 4. Deviation of the amount of precipitation in year 2012 with an arrow pointing to an approximate
location of the orchard (DHMZ, 2014) Slika 4: Odstopanje količine padavin v letu 2012 z označeno lokacijo nasada (DHMZ, 2014)
Figure 5. Deviation of the mean air temperature in year 2012 with an arrow pointing to an approximate
location of the orchard (DHMZ, 2014)
Slika 5: Odstopanje povprečne temperature zraka v letu 2012 z označeno lokacijo nasada (DHMZ, 2014)
Pleić T., The changes in the fruit chemical … from harvest till spring,
M. Sc. Thesis, University of Ljubljana, Biotechnical faculty, IMFS, 2015 12
Figure 6. Relations between long-term (1983-2012) average month percipitation and
percipitation in 2012 (in mm), meteorological station Sisak
Slika 6: Povprečna mesečna količina padavin v dolgoletnem obdobju (1983-2012) in v letu 2012 (v mm),
meteorološka postaja Sisak
Figure 7. Relations between long-term (1983-2012) average month temperature and
temperature in 2012 (in °C), meteorological station Sisak
Slika 7: Povprečna mesečna temperatura zraka v dolgoletnem obdobju (1983-2012) in v letu 2012 (v °C),
meteorološka postaja Sisak
Pleić T., The changes in the fruit chemical … from harvest till spring,
M. Sc. Thesis, University of Ljubljana, Biotechnical faculty, IMFS, 2015 13
3.3 PLANT MATERIAL
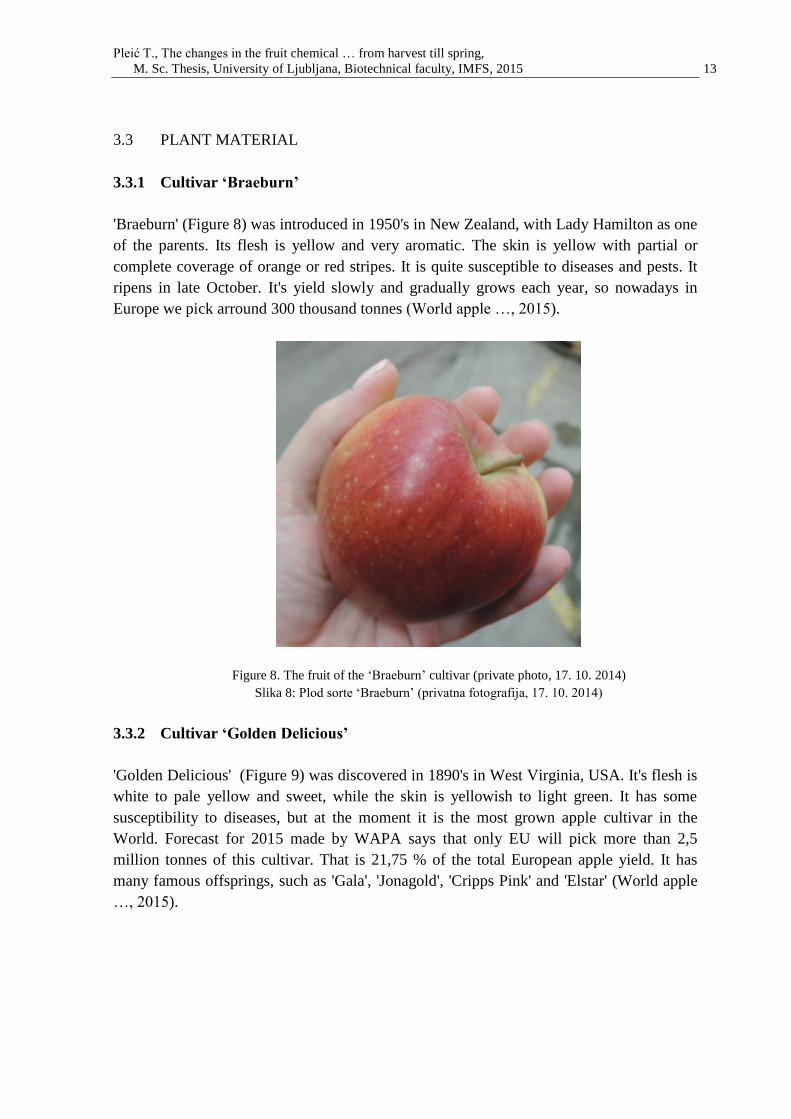
3.3.1 Cultivar ‘Braeburn’
'Braeburn' (Figure 8) was introduced in 1950's in New Zealand, with Lady Hamilton as one
of the parents. Its flesh is yellow and very aromatic. The skin is yellow with partial or
complete coverage of orange or red stripes. It is quite susceptible to diseases and pests. It
ripens in late October. It's yield slowly and gradually grows each year, so nowadays in
Europe we pick arround 300 thousand tonnes (World apple …, 2015).
Figure 8. The fruit of the ‘Braeburn’ cultivar (private photo, 17. 10. 2014)
Slika 8: Plod sorte ‘Braeburn’ (privatna fotografija, 17. 10. 2014)
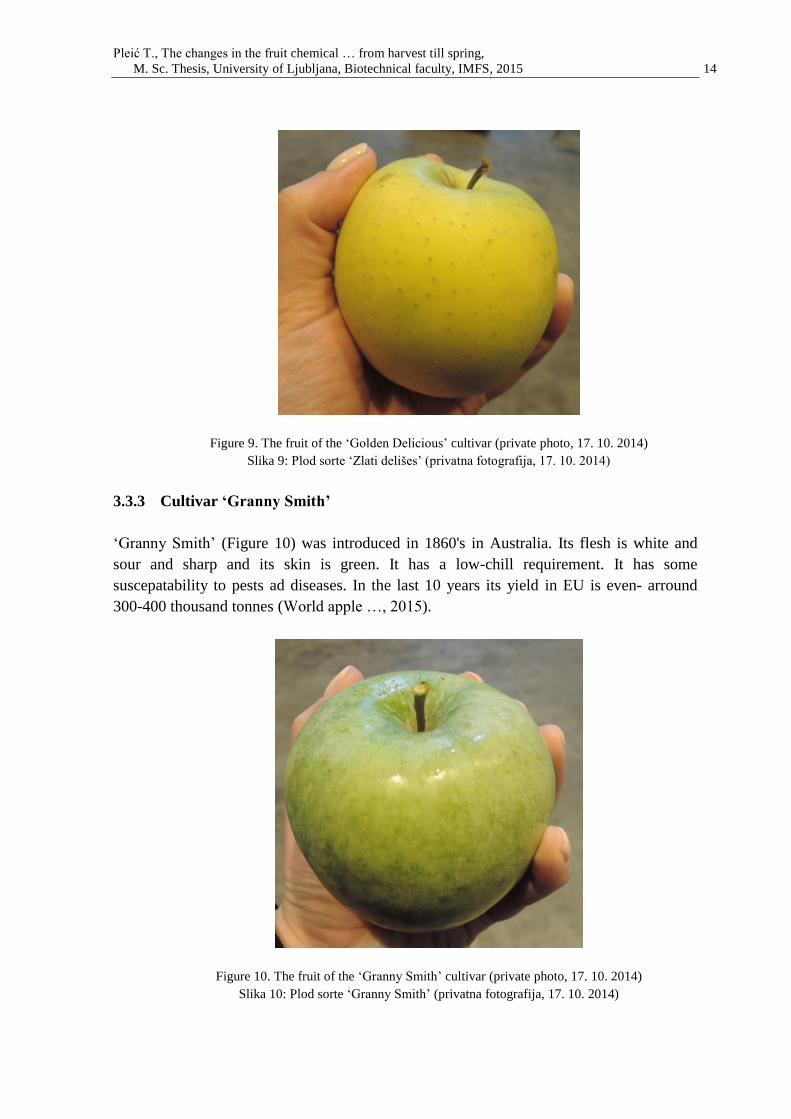
3.3.2 Cultivar ‘Golden Delicious’
'Golden Delicious' (Figure 9) was discovered in 1890's in West Virginia, USA. It's flesh is
white to pale yellow and sweet, while the skin is yellowish to light green. It has some
susceptibility to diseases, but at the moment it is the most grown apple cultivar in the
World. Forecast for 2015 made by WAPA says that only EU will pick more than 2,5
million tonnes of this cultivar. That is 21,75 % of the total European apple yield. It has
many famous offsprings, such as 'Gala', 'Jonagold', 'Cripps Pink' and 'Elstar' (World apple
…, 2015).
Pleić T., The changes in the fruit chemical … from harvest till spring,
M. Sc. Thesis, University of Ljubljana, Biotechnical faculty, IMFS, 2015 14
Figure 9. The fruit of the ‘Golden Delicious’ cultivar (private photo, 17. 10. 2014)
Slika 9: Plod sorte ‘Zlati delišes’ (privatna fotografija, 17. 10. 2014)
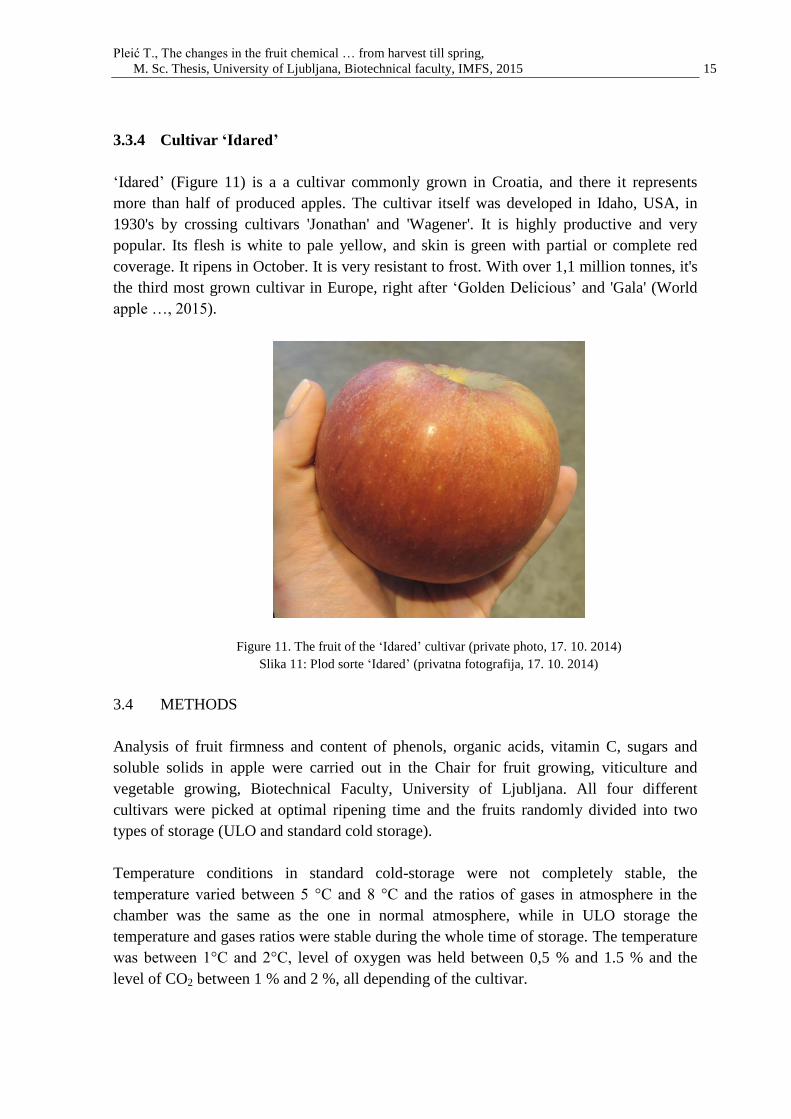
3.3.3 Cultivar ‘Granny Smith’
‘Granny Smith’ (Figure 10) was introduced in 1860's in Australia. Its flesh is white and
sour and sharp and its skin is green. It has a low-chill requirement. It has some
suscepatability to pests ad diseases. In the last 10 years its yield in EU is even- arround
300-400 thousand tonnes (World apple …, 2015).
Figure 10. The fruit of the ‘Granny Smith’ cultivar (private photo, 17. 10. 2014)
Slika 10: Plod sorte ‘Granny Smith’ (privatna fotografija, 17. 10. 2014)
Pleić T., The changes in the fruit chemical … from harvest till spring,
M. Sc. Thesis, University of Ljubljana, Biotechnical faculty, IMFS, 2015 15
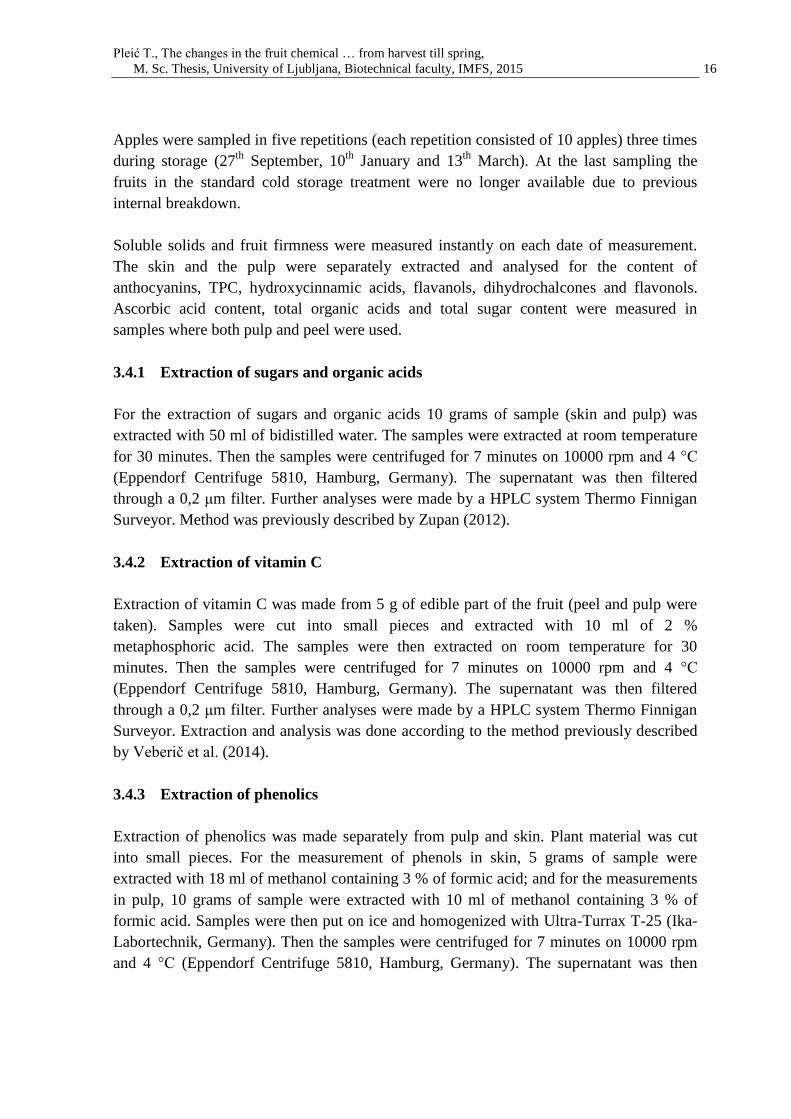
3.3.4 Cultivar ‘Idared’
‘Idared’ (Figure 11) is a a cultivar commonly grown in Croatia, and there it represents
more than half of produced apples. The cultivar itself was developed in Idaho, USA, in
1930's by crossing cultivars 'Jonathan' and 'Wagener'. It is highly productive and very
popular. Its flesh is white to pale yellow, and skin is green with partial or complete red
coverage. It ripens in October. It is very resistant to frost. With over 1,1 million tonnes, it's
the third most grown cultivar in Europe, right after ‘Golden Delicious’ and 'Gala' (World
apple …, 2015).
Figure 11. The fruit of the ‘Idared’ cultivar (private photo, 17. 10. 2014)
Slika 11: Plod sorte ‘Idared’ (privatna fotografija, 17. 10. 2014)
3.4 METHODS
Analysis of fruit firmness and content of phenols, organic acids, vitamin C, sugars and
soluble solids in apple were carried out in the Chair for fruit growing, viticulture and
vegetable growing, Biotechnical Faculty, University of Ljubljana. All four different
cultivars were picked at optimal ripening time and the fruits randomly divided into two
types of storage (ULO and standard cold storage).
Temperature conditions in standard cold-storage were not completely stable, the
temperature varied between 5 °C and 8 °C and the ratios of gases in atmosphere in the
chamber was the same as the one in normal atmosphere, while in ULO storage the
temperature and gases ratios were stable during the whole time of storage. The temperature
was between 1°C and 2°C, level of oxygen was held between 0,5 % and 1.5 % and the
level of CO2 between 1 % and 2 %, all depending of the cultivar.
Pleić T., The changes in the fruit chemical … from harvest till spring,
M. Sc. Thesis, University of Ljubljana, Biotechnical faculty, IMFS, 2015 16
Apples were sampled in five repetitions (each repetition consisted of 10 apples) three times
during storage (27th
September, 10th
January and 13th
March). At the last sampling the
fruits in the standard cold storage treatment were no longer available due to previous
internal breakdown.
Soluble solids and fruit firmness were measured instantly on each date of measurement.
The skin and the pulp were separately extracted and analysed for the content of
anthocyanins, TPC, hydroxycinnamic acids, flavanols, dihydrochalcones and flavonols.
Ascorbic acid content, total organic acids and total sugar content were measured in
samples where both pulp and peel were used.
3.4.1 Extraction of sugars and organic acids
For the extraction of sugars and organic acids 10 grams of sample (skin and pulp) was
extracted with 50 ml of bidistilled water. The samples were extracted at room temperature
for 30 minutes. Then the samples were centrifuged for 7 minutes on 10000 rpm and 4 °C
(Eppendorf Centrifuge 5810, Hamburg, Germany). The supernatant was then filtered
through a 0,2 μm filter. Further analyses were made by a HPLC system Thermo Finnigan
Surveyor. Method was previously described by Zupan (2012).
3.4.2 Extraction of vitamin C
Extraction of vitamin C was made from 5 g of edible part of the fruit (peel and pulp were
taken). Samples were cut into small pieces and extracted with 10 ml of 2 %
metaphosphoric acid. The samples were then extracted on room temperature for 30
minutes. Then the samples were centrifuged for 7 minutes on 10000 rpm and 4 °C
(Eppendorf Centrifuge 5810, Hamburg, Germany). The supernatant was then filtered
through a 0,2 μm filter. Further analyses were made by a HPLC system Thermo Finnigan
Surveyor. Extraction and analysis was done according to the method previously described
by Veberič et al. (2014).
3.4.3 Extraction of phenolics
Extraction of phenolics was made separately from pulp and skin. Plant material was cut
into small pieces. For the measurement of phenols in skin, 5 grams of sample were
extracted with 18 ml of methanol containing 3 % of formic acid; and for the measurements
in pulp, 10 grams of sample were extracted with 10 ml of methanol containing 3 % of
formic acid. Samples were then put on ice and homogenized with Ultra-Turrax T-25 (Ika-
Labortechnik, Germany). Then the samples were centrifuged for 7 minutes on 10000 rpm
and 4 °C (Eppendorf Centrifuge 5810, Hamburg, Germany). The supernatant was then
Pleić T., The changes in the fruit chemical … from harvest till spring,
M. Sc. Thesis, University of Ljubljana, Biotechnical faculty, IMFS, 2015 17
filtered through a 0,2 μm filter. Further analyses were made by a HPLC system Thermo
Finnigan Surveyor. Method was previously described by Zupan (2012).
3.4.4 HPLC analysis
HPLC is an abbreviation for High Performance Liquid Chromatography. Chromatographic
separation can be attained for compounds that migrate at different speeds through a so
called “chromatographic bed”. The phenomenon of different migration velocities is based
on different retentions of the migrating compounds caused by the elementary process of
different distributions of the separands between two phases: a mobile phase and a
stationary phase (Corradini et al., 2011).
3.4.4.1 HPLC analysis of sugars and organic acids
HPLC analysis of sugars and organic acids was done according to Zupan (2012). For the
analysis of sugars we used 20 μl of prepared sample. For the separation of samples we used
Razex RCM-monosaccharide column (300 mm x 7.8 mm) and an IR detector. Mobile
phase was bidistilled water, and the flow rate was 0.6 ml/min. The sample was analysed for
30 minutes on a temperature of 65 °C.
For the analysis of organic acids we used 20 μl of prepared sample. We used column
Razex ROA-organic acid (300 mm x 7.8 mm), the UV detector was set to 210 nm, and the
column was heated up to 65 °C. The mobile phase was 4 mM sulfuric acid in bidistilled
water with the flow rate of 0.6 ml/min. The analysis took 30 minutes.
Concentration of individual acids (ascorbic acid) was determined by the method of external
standard and recalculated regarding the calibration curve, which was made on the basis of
standard solutions.
For the analysis of ascorbic acid we used 20 μl of prepared sample. We used column Razex
ROA-organic acid (300 mm x 7.8 mm), the UV detector was set to 245 nm, and the
column was heated up to 20 °C. The mobile phase was 4 mM sulfuric acid in bidistilled
water with the flow rate of 0.6 ml/min. The analysis took 30 minutes.
3.4.4.2 HPLC analysis of phenolics
HPLC analysis of phenolics was done according to Mikulič-Petkovšek et al. (2014).
Phenolic supstances were analysed with a HPLC system Thermo Finnigan Surveyor (San
Jose, USA). The volume of injected sample was 20 μl, flow rate 1 ml/min. The detection
took place at 280 and 350 nm wave length. The column that we used was a Phenomenex
Pleić T., The changes in the fruit chemical … from harvest till spring,
M. Sc. Thesis, University of Ljubljana, Biotechnical faculty, IMFS, 2015 18
Gemini C18 (150 mm x 4.5 mm, 3 μm) at the temperature of 25 °C. Mobile phases were
aqueuous 0,1 % formic acid in bidistilled water and 0,1 % formic acid in acetonitrile.
Identification of individual supstances started with a comparison of retention time and
spectrum. All phenolic supstances were also confirmed by usage of mass spectrometer
(Thermo Scientific, LCQ Deca XP MAX) with an electrospray ionisation. Concentrations
of phenolic supstances were calculated regarding the peaks of chromatography for samples
and adequate standards. Concentrations were expressed with mg per kg of fruit.
3.4.4.3 Analysis of TPC
Content of TPC was estimated with usage of Colin-Ciocalteu reagent. In 100 μl of sample
we added 6 ml of bidistilled water and 500 μl Colin-Ciocalteu 20 % sodium carbonate and
1,9 ml bidistilled water. Samples were then mixed and were held for 30 minutes on 40 °C.
Afterwords we measured absorbance of samples with a spectrophotometer (Perkin-Elmer,
UV/visible Lambda Bio 20) at wave length of 765 nm. The mixture of reagents and
bidestilled water was used as a blind sample. Amount of total phenols was expressed in mg
of gallic acid per kg of fresh fruit. Absorption was measured in three repetitions. The
analysis of total phenolic content was done according to Novljan (2013).
3.4.5 Measurement of fruit firmness
When measuring fruit firmness, we had to make sure that all the samples were about the
same temperature, since warm fruits are usually softer than cold ones. On each fruit we
made 2 puncture tests, one on each side (on opposite sides), midway between the stem-end
and calyx-end. Before using the manual penetrometer, we removed a disc of skin (about 2
cm in diameter) with a ceramic knife. We used an appropriate tip (plunger) for apple (11
mm). Before penetrating the plunger into the fruit up to a marked line on the plunger, we
had to make sure that the penetrometer was restarted. Fruit firmness was expressed in
kg/cm2.
3.4.6 Measurement of soluble solids content
During the measurements of soluble solids in fruits, we used a digital refractometer that
automatically showed (in ºBrix) the amount of soluble solids in fruit. We made sure that
the juice from two opposite sides of fruit was taken for analysis.
3.5 STATISTICAL ANALYSIS
Data obtained from chemical analysis was statistically analyzed with a statistics program
Statgrapfic Plus for Windows 4.0, program Microsoft Excell 2007 and statistics program

Pleić T., The changes in the fruit chemical … from harvest till spring,
M. Sc. Thesis, University of Ljubljana, Biotechnical faculty, IMFS, 2015 19
R. Statistically significant differences were noted by analysis of variances (ANOVA). The
examination of differences between the measurements was done by LSD test (multiple
comparison test), p≤0.05. Statistically significant differences were marked with different
letters.
Pleić T., The changes in the fruit chemical … from harvest till spring,
M. Sc. Thesis, University of Ljubljana, Biotechnical faculty, IMFS, 2015 20
4 RESULTS
4.1 FRUIT FIRMNESS
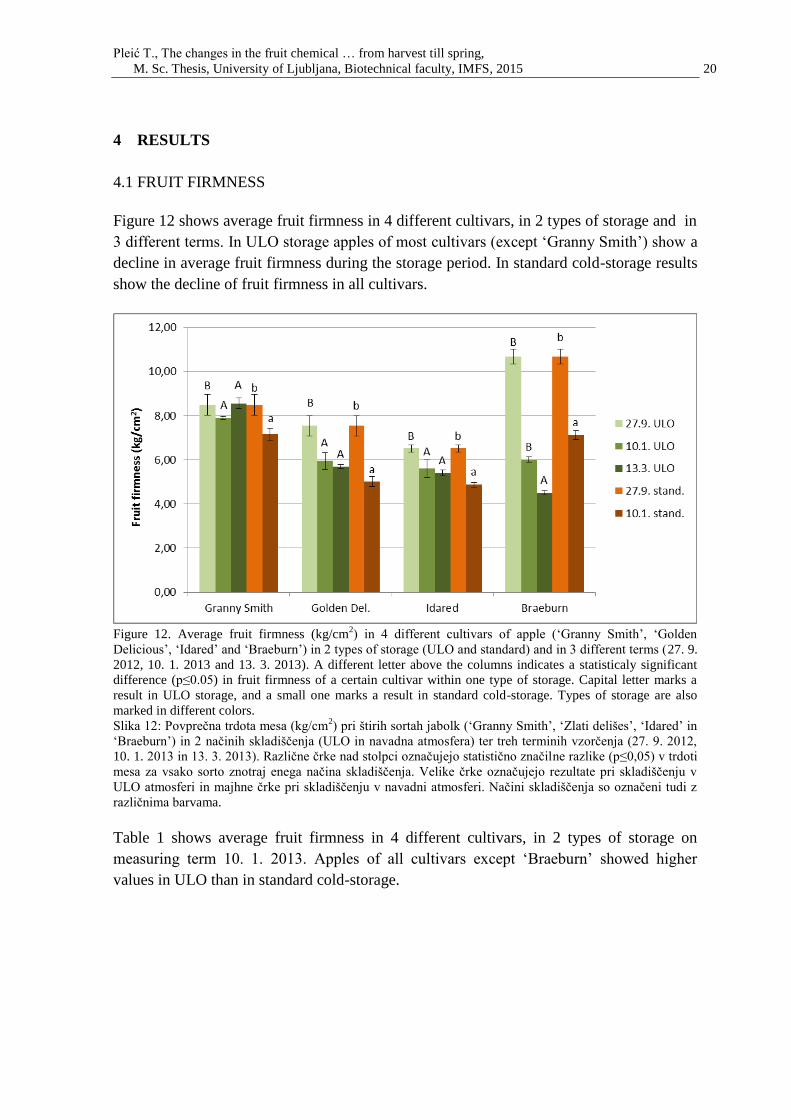
Figure 12 shows average fruit firmness in 4 different cultivars, in 2 types of storage and in
3 different terms. In ULO storage apples of most cultivars (except ‘Granny Smith’) show a
decline in average fruit firmness during the storage period. In standard cold-storage results
show the decline of fruit firmness in all cultivars.
Figure 12. Average fruit firmness (kg/cm
2) in 4 different cultivars of apple (‘Granny Smith’, ‘Golden
Delicious’, ‘Idared’ and ‘Braeburn’) in 2 types of storage (ULO and standard) and in 3 different terms (27. 9.
2012, 10. 1. 2013 and 13. 3. 2013). A different letter above the columns indicates a statisticaly significant
difference (p≤0.05) in fruit firmness of a certain cultivar within one type of storage. Capital letter marks a
result in ULO storage, and a small one marks a result in standard cold-storage. Types of storage are also
marked in different colors.
Slika 12: Povprečna trdota mesa (kg/cm2) pri štirih sortah jabolk (‘Granny Smith’, ‘Zlati delišes’, ‘Idared’ in
‘Braeburn’) in 2 načinih skladiščenja (ULO in navadna atmosfera) ter treh terminih vzorčenja (27. 9. 2012,
10. 1. 2013 in 13. 3. 2013). Različne črke nad stolpci označujejo statistično značilne razlike (p≤0,05) v trdoti
mesa za vsako sorto znotraj enega načina skladiščenja. Velike črke označujejo rezultate pri skladiščenju v
ULO atmosferi in majhne črke pri skladiščenju v navadni atmosferi. Načini skladiščenja so označeni tudi z
različnima barvama.
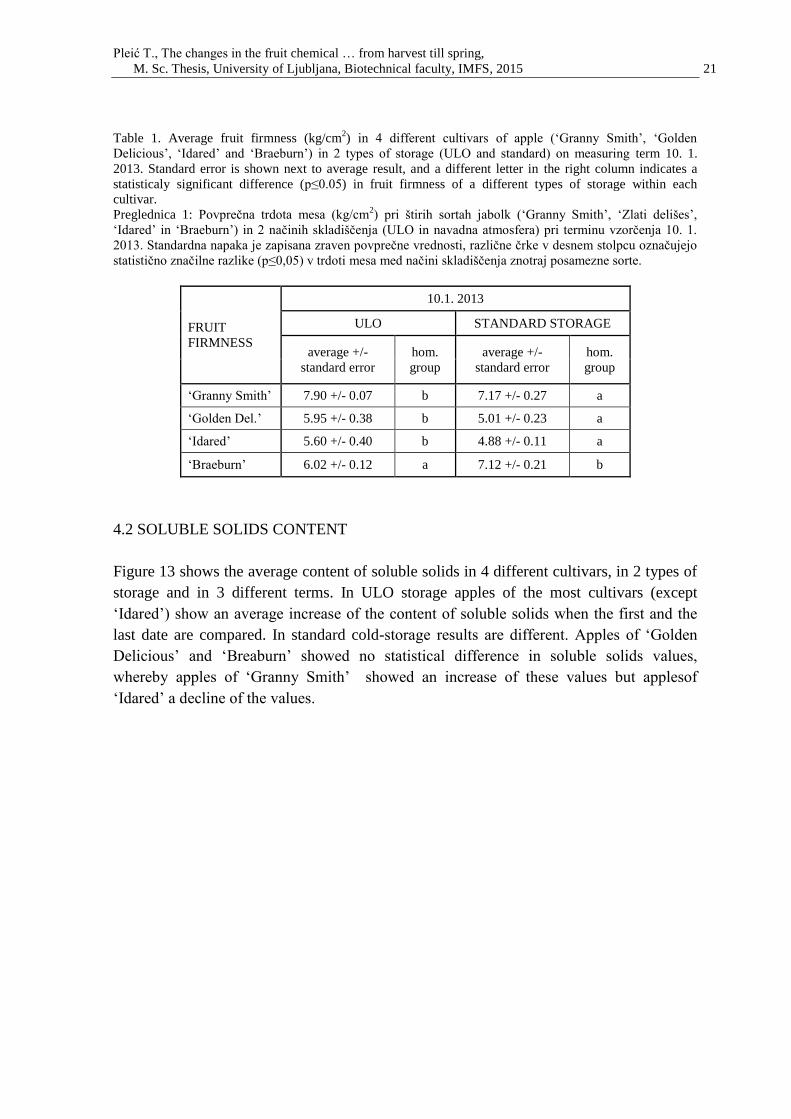
Table 1 shows average fruit firmness in 4 different cultivars, in 2 types of storage on
measuring term 10. 1. 2013. Apples of all cultivars except ‘Braeburn’ showed higher
values in ULO than in standard cold-storage.
Pleić T., The changes in the fruit chemical … from harvest till spring,
M. Sc. Thesis, University of Ljubljana, Biotechnical faculty, IMFS, 2015 21
Table 1. Average fruit firmness (kg/cm2) in 4 different cultivars of apple (‘Granny Smith’, ‘Golden
Delicious’, ‘Idared’ and ‘Braeburn’) in 2 types of storage (ULO and standard) on measuring term 10. 1.
2013. Standard error is shown next to average result, and a different letter in the right column indicates a
statisticaly significant difference (p≤0.05) in fruit firmness of a different types of storage within each
cultivar.
Preglednica 1: Povprečna trdota mesa (kg/cm2) pri štirih sortah jabolk (‘Granny Smith’, ‘Zlati delišes’,
‘Idared’ in ‘Braeburn’) in 2 načinih skladiščenja (ULO in navadna atmosfera) pri terminu vzorčenja 10. 1.
2013. Standardna napaka je zapisana zraven povprečne vrednosti, različne črke v desnem stolpcu označujejo
statistično značilne razlike (p≤0,05) v trdoti mesa med načini skladiščenja znotraj posamezne sorte.
FRUIT
FIRMNESS
10.1. 2013
ULO STANDARD STORAGE
average +/-
standard error
hom.
group
average +/-
standard error
hom.
group
‘Granny Smith’ 7.90 +/- 0.07 b 7.17 +/- 0.27 a
‘Golden Del.’ 5.95 +/- 0.38 b 5.01 +/- 0.23 a
‘Idared’ 5.60 +/- 0.40 b 4.88 +/- 0.11 a
‘Braeburn’ 6.02 +/- 0.12 a 7.12 +/- 0.21 b
4.2 SOLUBLE SOLIDS CONTENT
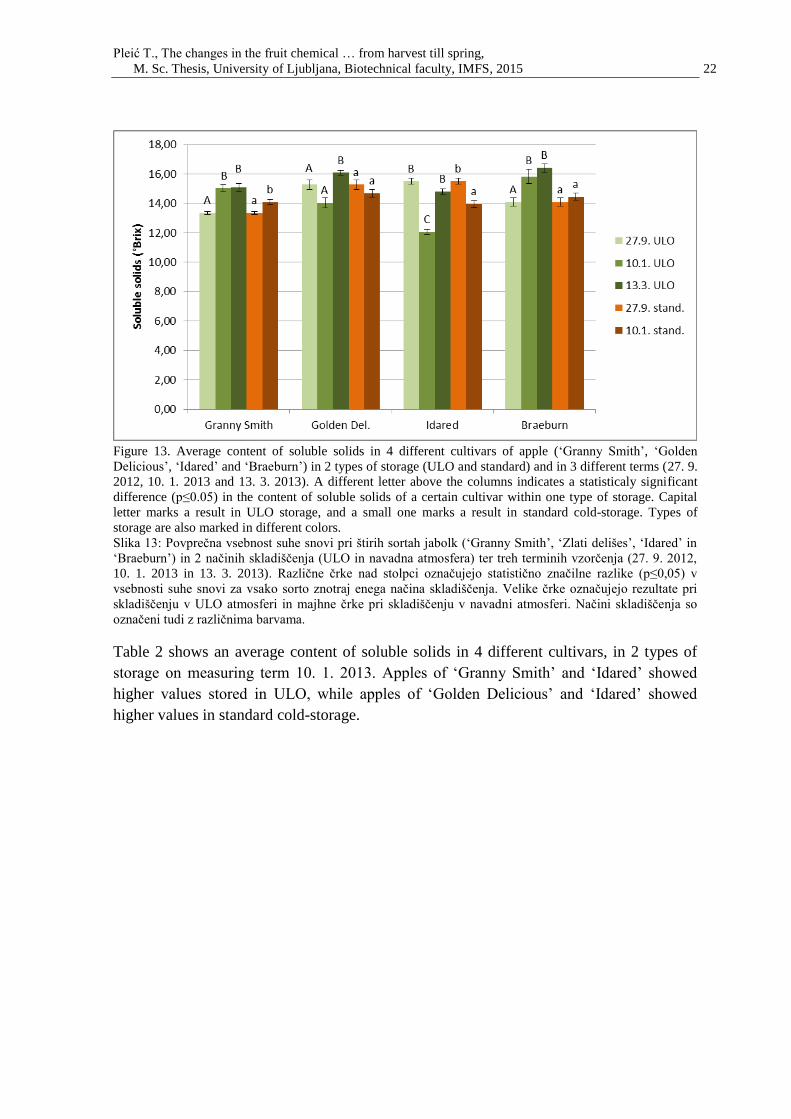
Figure 13 shows the average content of soluble solids in 4 different cultivars, in 2 types of
storage and in 3 different terms. In ULO storage apples of the most cultivars (except
‘Idared’) show an average increase of the content of soluble solids when the first and the
last date are compared. In standard cold-storage results are different. Apples of ‘Golden
Delicious’ and ‘Breaburn’ showed no statistical difference in soluble solids values,
whereby apples of ‘Granny Smith’ showed an increase of these values but applesof
‘Idared’ a decline of the values.
Pleić T., The changes in the fruit chemical … from harvest till spring,
M. Sc. Thesis, University of Ljubljana, Biotechnical faculty, IMFS, 2015 22
Figure 13. Average content of soluble solids in 4 different cultivars of apple (‘Granny Smith’, ‘Golden
Delicious’, ‘Idared’ and ‘Braeburn’) in 2 types of storage (ULO and standard) and in 3 different terms (27. 9.
2012, 10. 1. 2013 and 13. 3. 2013). A different letter above the columns indicates a statisticaly significant
difference (p≤0.05) in the content of soluble solids of a certain cultivar within one type of storage. Capital
letter marks a result in ULO storage, and a small one marks a result in standard cold-storage. Types of
storage are also marked in different colors.
Slika 13: Povprečna vsebnost suhe snovi pri štirih sortah jabolk (‘Granny Smith’, ‘Zlati delišes’, ‘Idared’ in
‘Braeburn’) in 2 načinih skladiščenja (ULO in navadna atmosfera) ter treh terminih vzorčenja (27. 9. 2012,
10. 1. 2013 in 13. 3. 2013). Različne črke nad stolpci označujejo statistično značilne razlike (p≤0,05) v
vsebnosti suhe snovi za vsako sorto znotraj enega načina skladiščenja. Velike črke označujejo rezultate pri
skladiščenju v ULO atmosferi in majhne črke pri skladiščenju v navadni atmosferi. Načini skladiščenja so
označeni tudi z različnima barvama.
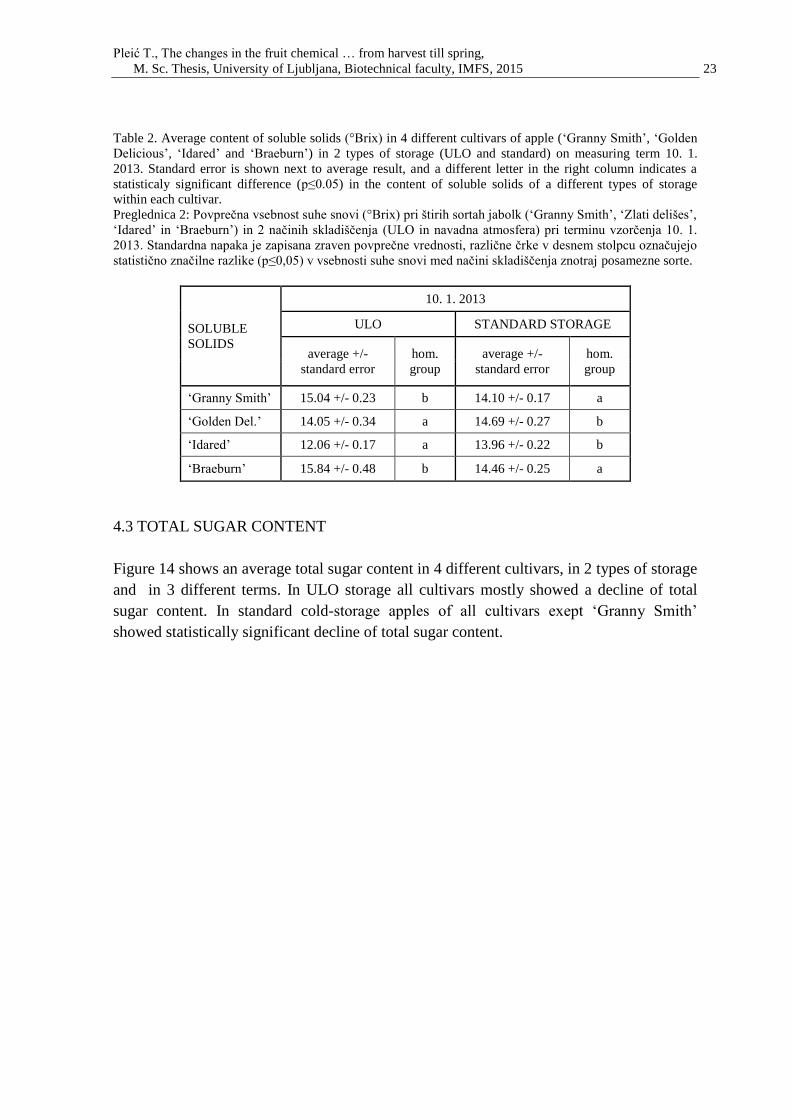
Table 2 shows an average content of soluble solids in 4 different cultivars, in 2 types of
storage on measuring term 10. 1. 2013. Apples of ‘Granny Smith’ and ‘Idared’ showed
higher values stored in ULO, while apples of ‘Golden Delicious’ and ‘Idared’ showed
higher values in standard cold-storage.
Pleić T., The changes in the fruit chemical … from harvest till spring,
M. Sc. Thesis, University of Ljubljana, Biotechnical faculty, IMFS, 2015 23
Table 2. Average content of soluble solids (°Brix) in 4 different cultivars of apple (‘Granny Smith’, ‘Golden
Delicious’, ‘Idared’ and ‘Braeburn’) in 2 types of storage (ULO and standard) on measuring term 10. 1.
2013. Standard error is shown next to average result, and a different letter in the right column indicates a
statisticaly significant difference (p≤0.05) in the content of soluble solids of a different types of storage
within each cultivar.
Preglednica 2: Povprečna vsebnost suhe snovi (°Brix) pri štirih sortah jabolk (‘Granny Smith’, ‘Zlati delišes’,
‘Idared’ in ‘Braeburn’) in 2 načinih skladiščenja (ULO in navadna atmosfera) pri terminu vzorčenja 10. 1.
2013. Standardna napaka je zapisana zraven povprečne vrednosti, različne črke v desnem stolpcu označujejo
statistično značilne razlike (p≤0,05) v vsebnosti suhe snovi med načini skladiščenja znotraj posamezne sorte.
SOLUBLE
SOLIDS
10. 1. 2013
ULO STANDARD STORAGE
average +/-
standard error
hom.
group
average +/-
standard error
hom.
group
‘Granny Smith’ 15.04 +/- 0.23 b 14.10 +/- 0.17 a
‘Golden Del.’ 14.05 +/- 0.34 a 14.69 +/- 0.27 b
‘Idared’ 12.06 +/- 0.17 a 13.96 +/- 0.22 b
‘Braeburn’ 15.84 +/- 0.48 b 14.46 +/- 0.25 a
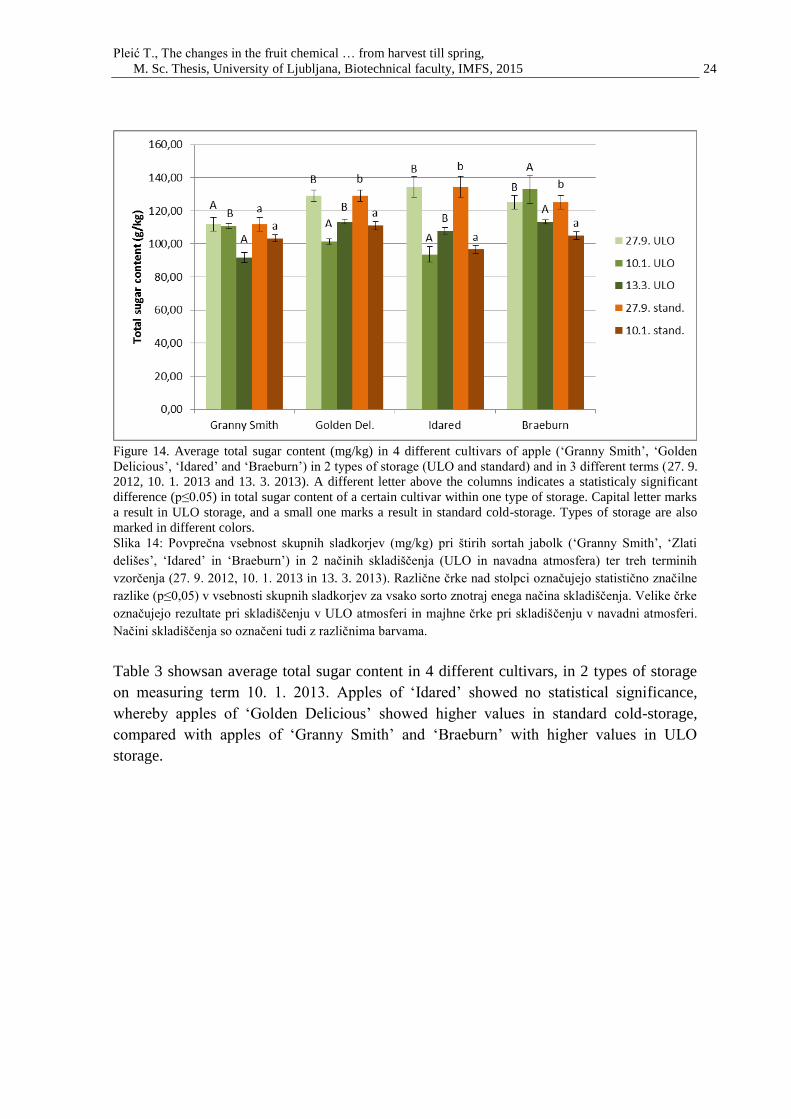
4.3 TOTAL SUGAR CONTENT
Figure 14 shows an average total sugar content in 4 different cultivars, in 2 types of storage
and in 3 different terms. In ULO storage all cultivars mostly showed a decline of total
sugar content. In standard cold-storage apples of all cultivars exept ‘Granny Smith’
showed statistically significant decline of total sugar content.
Pleić T., The changes in the fruit chemical … from harvest till spring,
M. Sc. Thesis, University of Ljubljana, Biotechnical faculty, IMFS, 2015 24
Figure 14. Average total sugar content (mg/kg) in 4 different cultivars of apple (‘Granny Smith’, ‘Golden
Delicious’, ‘Idared’ and ‘Braeburn’) in 2 types of storage (ULO and standard) and in 3 different terms (27. 9.
2012, 10. 1. 2013 and 13. 3. 2013). A different letter above the columns indicates a statisticaly significant
difference (p≤0.05) in total sugar content of a certain cultivar within one type of storage. Capital letter marks
a result in ULO storage, and a small one marks a result in standard cold-storage. Types of storage are also
marked in different colors.
Slika 14: Povprečna vsebnost skupnih sladkorjev (mg/kg) pri štirih sortah jabolk (‘Granny Smith’, ‘Zlati
delišes’, ‘Idared’ in ‘Braeburn’) in 2 načinih skladiščenja (ULO in navadna atmosfera) ter treh terminih
vzorčenja (27. 9. 2012, 10. 1. 2013 in 13. 3. 2013). Različne črke nad stolpci označujejo statistično značilne
razlike (p≤0,05) v vsebnosti skupnih sladkorjev za vsako sorto znotraj enega načina skladiščenja. Velike črke
označujejo rezultate pri skladiščenju v ULO atmosferi in majhne črke pri skladiščenju v navadni atmosferi.
Načini skladiščenja so označeni tudi z različnima barvama.
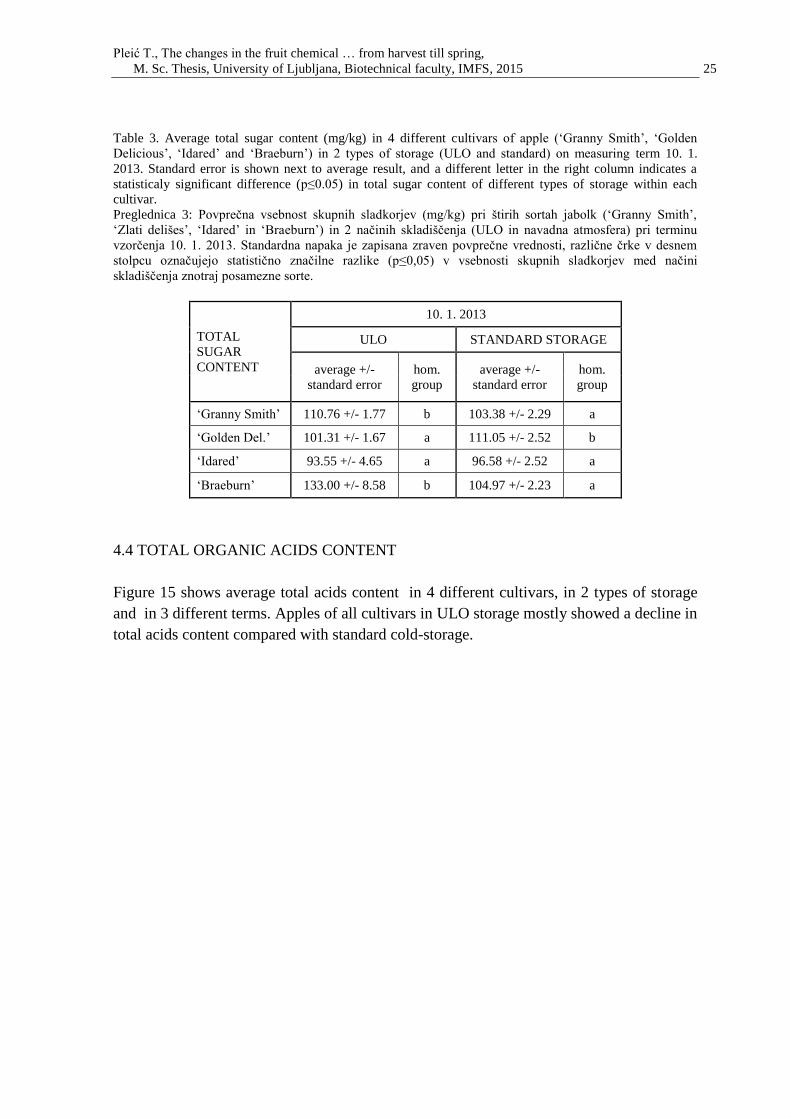
Table 3 showsan average total sugar content in 4 different cultivars, in 2 types of storage
on measuring term 10. 1. 2013. Apples of ‘Idared’ showed no statistical significance,
whereby apples of ‘Golden Delicious’ showed higher values in standard cold-storage,
compared with apples of ‘Granny Smith’ and ‘Braeburn’ with higher values in ULO
storage.
Pleić T., The changes in the fruit chemical … from harvest till spring,
M. Sc. Thesis, University of Ljubljana, Biotechnical faculty, IMFS, 2015 25
Table 3. Average total sugar content (mg/kg) in 4 different cultivars of apple (‘Granny Smith’, ‘Golden
Delicious’, ‘Idared’ and ‘Braeburn’) in 2 types of storage (ULO and standard) on measuring term 10. 1.
2013. Standard error is shown next to average result, and a different letter in the right column indicates a
statisticaly significant difference (p≤0.05) in total sugar content of different types of storage within each
cultivar.
Preglednica 3: Povprečna vsebnost skupnih sladkorjev (mg/kg) pri štirih sortah jabolk (‘Granny Smith’,
‘Zlati delišes’, ‘Idared’ in ‘Braeburn’) in 2 načinih skladiščenja (ULO in navadna atmosfera) pri terminu
vzorčenja 10. 1. 2013. Standardna napaka je zapisana zraven povprečne vrednosti, različne črke v desnem
stolpcu označujejo statistično značilne razlike (p≤0,05) v vsebnosti skupnih sladkorjev med načini
skladiščenja znotraj posamezne sorte.
TOTAL
SUGAR
CONTENT
10. 1. 2013
ULO STANDARD STORAGE
average +/-
standard error
hom.
group
average +/-
standard error
hom.
group
‘Granny Smith’ 110.76 +/- 1.77 b 103.38 +/- 2.29 a
‘Golden Del.’ 101.31 +/- 1.67 a 111.05 +/- 2.52 b
‘Idared’ 93.55 +/- 4.65 a 96.58 +/- 2.52 a
‘Braeburn’ 133.00 +/- 8.58 b 104.97 +/- 2.23 a
4.4 TOTAL ORGANIC ACIDS CONTENT
Figure 15 shows average total acids content in 4 different cultivars, in 2 types of storage
and in 3 different terms. Apples of all cultivars in ULO storage mostly showed a decline in
total acids content compared with standard cold-storage.
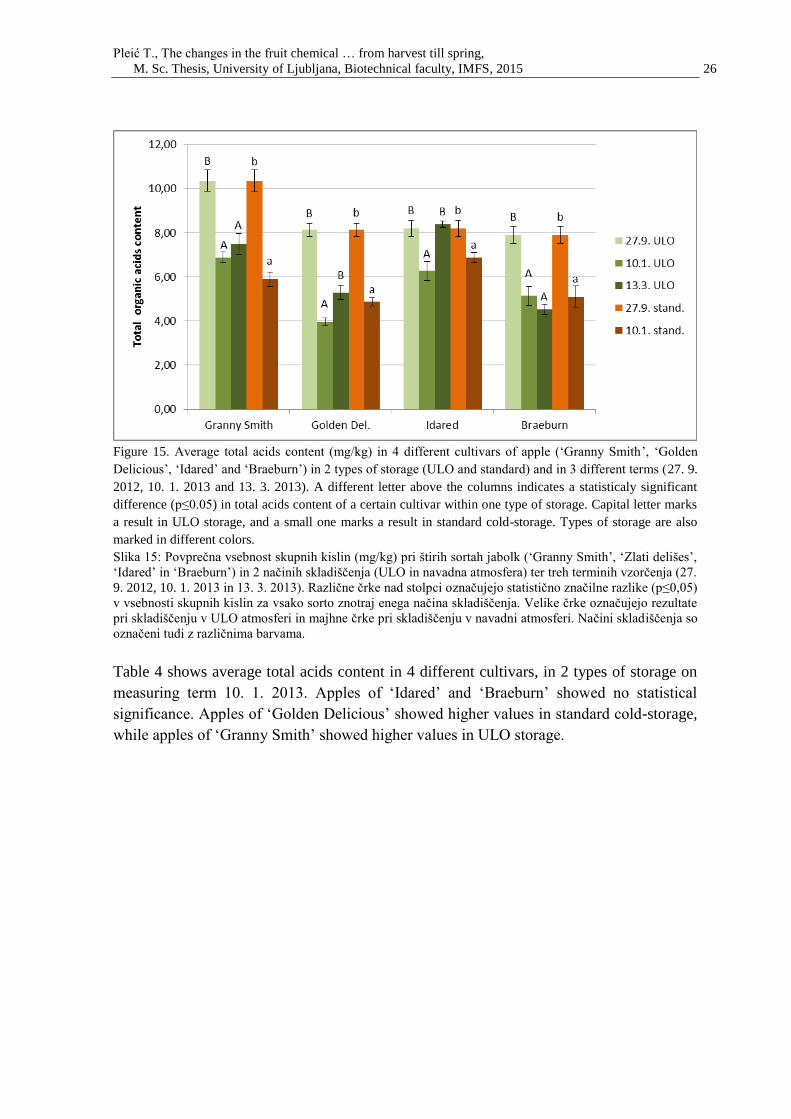
Pleić T., The changes in the fruit chemical … from harvest till spring,
M. Sc. Thesis, University of Ljubljana, Biotechnical faculty, IMFS, 2015 26
Figure 15. Average total acids content (mg/kg) in 4 different cultivars of apple (‘Granny Smith’, ‘Golden
Delicious’, ‘Idared’ and ‘Braeburn’) in 2 types of storage (ULO and standard) and in 3 different terms (27. 9.
2012, 10. 1. 2013 and 13. 3. 2013). A different letter above the columns indicates a statisticaly significant
difference (p≤0.05) in total acids content of a certain cultivar within one type of storage. Capital letter marks
a result in ULO storage, and a small one marks a result in standard cold-storage. Types of storage are also
marked in different colors.
Slika 15: Povprečna vsebnost skupnih kislin (mg/kg) pri štirih sortah jabolk (‘Granny Smith’, ‘Zlati delišes’,
‘Idared’ in ‘Braeburn’) in 2 načinih skladiščenja (ULO in navadna atmosfera) ter treh terminih vzorčenja (27.
9. 2012, 10. 1. 2013 in 13. 3. 2013). Različne črke nad stolpci označujejo statistično značilne razlike (p≤0,05)
v vsebnosti skupnih kislin za vsako sorto znotraj enega načina skladiščenja. Velike črke označujejo rezultate
pri skladiščenju v ULO atmosferi in majhne črke pri skladiščenju v navadni atmosferi. Načini skladiščenja so
označeni tudi z različnima barvama.
Table 4 shows average total acids content in 4 different cultivars, in 2 types of storage on
measuring term 10. 1. 2013. Apples of ‘Idared’ and ‘Braeburn’ showed no statistical
significance. Apples of ‘Golden Delicious’ showed higher values in standard cold-storage,
while apples of ‘Granny Smith’ showed higher values in ULO storage.
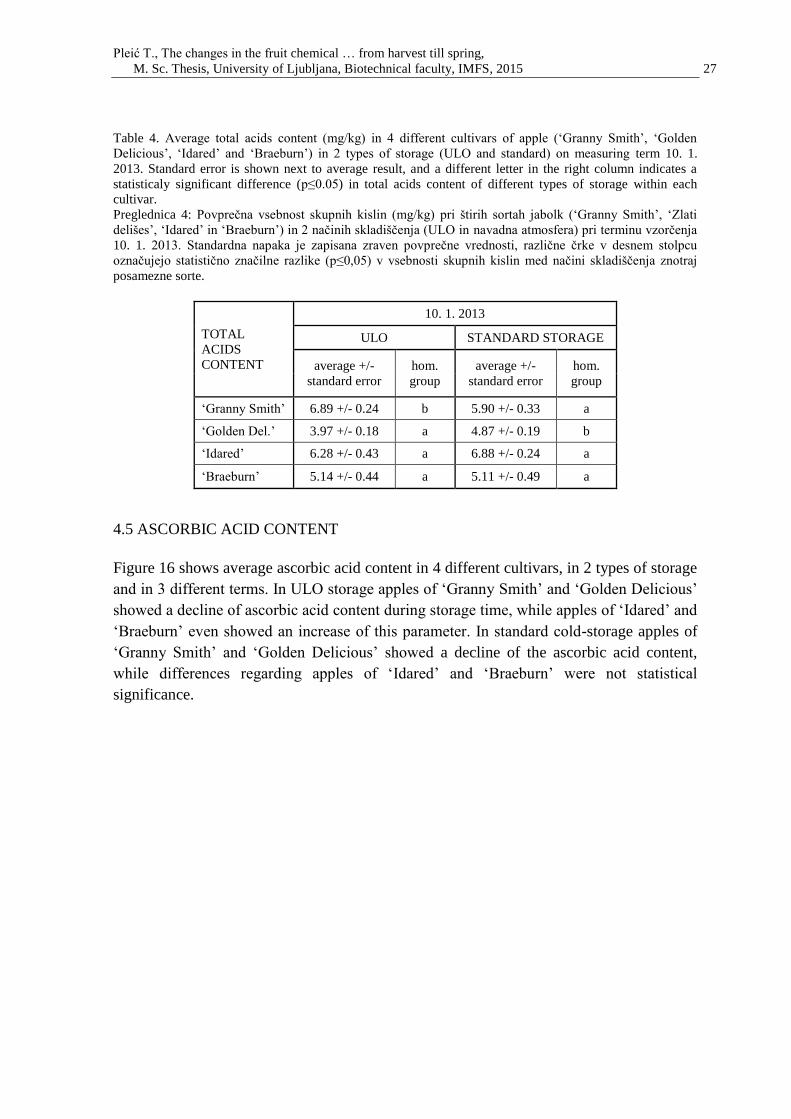
Pleić T., The changes in the fruit chemical … from harvest till spring,
M. Sc. Thesis, University of Ljubljana, Biotechnical faculty, IMFS, 2015 27
Table 4. Average total acids content (mg/kg) in 4 different cultivars of apple (‘Granny Smith’, ‘Golden
Delicious’, ‘Idared’ and ‘Braeburn’) in 2 types of storage (ULO and standard) on measuring term 10. 1.
2013. Standard error is shown next to average result, and a different letter in the right column indicates a
statisticaly significant difference (p≤0.05) in total acids content of different types of storage within each
cultivar.
Preglednica 4: Povprečna vsebnost skupnih kislin (mg/kg) pri štirih sortah jabolk (‘Granny Smith’, ‘Zlati
delišes’, ‘Idared’ in ‘Braeburn’) in 2 načinih skladiščenja (ULO in navadna atmosfera) pri terminu vzorčenja
10. 1. 2013. Standardna napaka je zapisana zraven povprečne vrednosti, različne črke v desnem stolpcu
označujejo statistično značilne razlike (p≤0,05) v vsebnosti skupnih kislin med načini skladiščenja znotraj
posamezne sorte.
TOTAL
ACIDS
CONTENT
10. 1. 2013
ULO STANDARD STORAGE
average +/-
standard error
hom.
group
average +/-
standard error
hom.
group
‘Granny Smith’ 6.89 +/- 0.24 b 5.90 +/- 0.33 a
‘Golden Del.’ 3.97 +/- 0.18 a 4.87 +/- 0.19 b
‘Idared’ 6.28 +/- 0.43 a 6.88 +/- 0.24 a
‘Braeburn’ 5.14 +/- 0.44 a 5.11 +/- 0.49 a
4.5 ASCORBIC ACID CONTENT
Figure 16 shows average ascorbic acid content in 4 different cultivars, in 2 types of storage
and in 3 different terms. In ULO storage apples of ‘Granny Smith’ and ‘Golden Delicious’
showed a decline of ascorbic acid content during storage time, while apples of ‘Idared’ and
‘Braeburn’ even showed an increase of this parameter. In standard cold-storage apples of
‘Granny Smith’ and ‘Golden Delicious’ showed a decline of the ascorbic acid content,
while differences regarding apples of ‘Idared’ and ‘Braeburn’ were not statistical
significance.
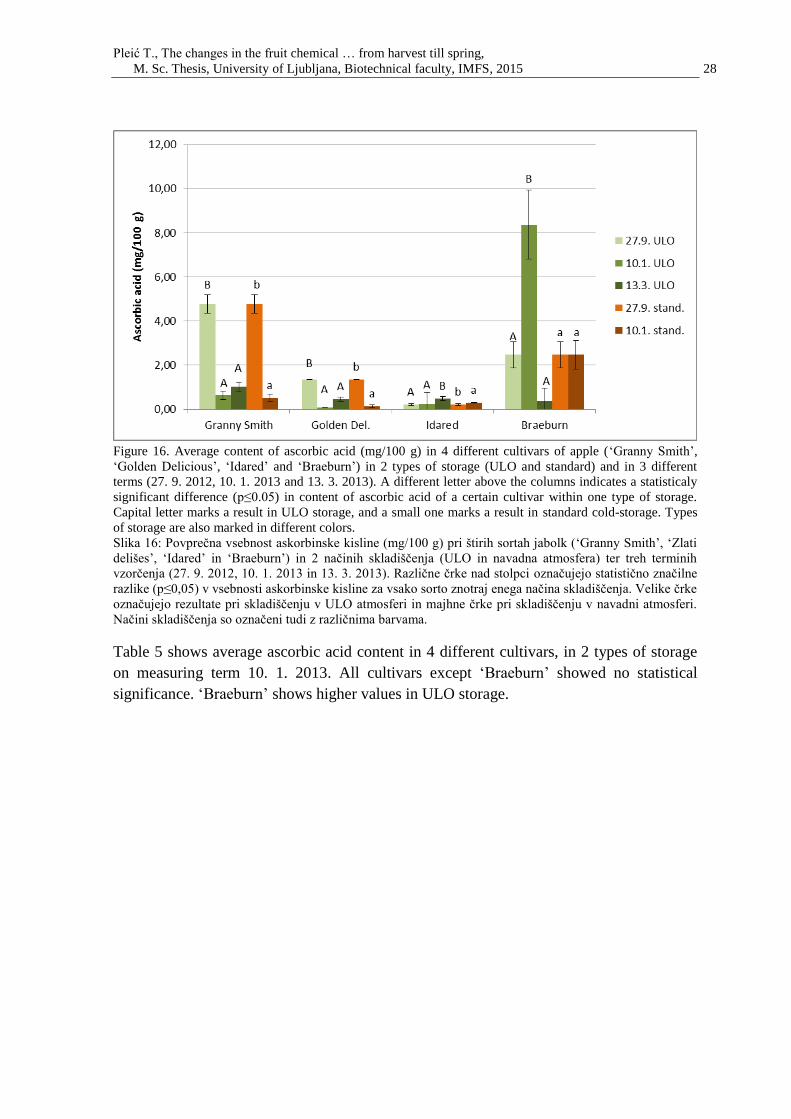
Pleić T., The changes in the fruit chemical … from harvest till spring,
M. Sc. Thesis, University of Ljubljana, Biotechnical faculty, IMFS, 2015 28
Figure 16. Average content of ascorbic acid (mg/100 g) in 4 different cultivars of apple (‘Granny Smith’,
‘Golden Delicious’, ‘Idared’ and ‘Braeburn’) in 2 types of storage (ULO and standard) and in 3 different
terms (27. 9. 2012, 10. 1. 2013 and 13. 3. 2013). A different letter above the columns indicates a statisticaly
significant difference (p≤0.05) in content of ascorbic acid of a certain cultivar within one type of storage.
Capital letter marks a result in ULO storage, and a small one marks a result in standard cold-storage. Types
of storage are also marked in different colors.
Slika 16: Povprečna vsebnost askorbinske kisline (mg/100 g) pri štirih sortah jabolk (‘Granny Smith’, ‘Zlati
delišes’, ‘Idared’ in ‘Braeburn’) in 2 načinih skladiščenja (ULO in navadna atmosfera) ter treh terminih
vzorčenja (27. 9. 2012, 10. 1. 2013 in 13. 3. 2013). Različne črke nad stolpci označujejo statistično značilne
razlike (p≤0,05) v vsebnosti askorbinske kisline za vsako sorto znotraj enega načina skladiščenja. Velike črke
označujejo rezultate pri skladiščenju v ULO atmosferi in majhne črke pri skladiščenju v navadni atmosferi.
Načini skladiščenja so označeni tudi z različnima barvama.
Table 5 shows average ascorbic acid content in 4 different cultivars, in 2 types of storage
on measuring term 10. 1. 2013. All cultivars except ‘Braeburn’ showed no statistical
significance. ‘Braeburn’ shows higher values in ULO storage.
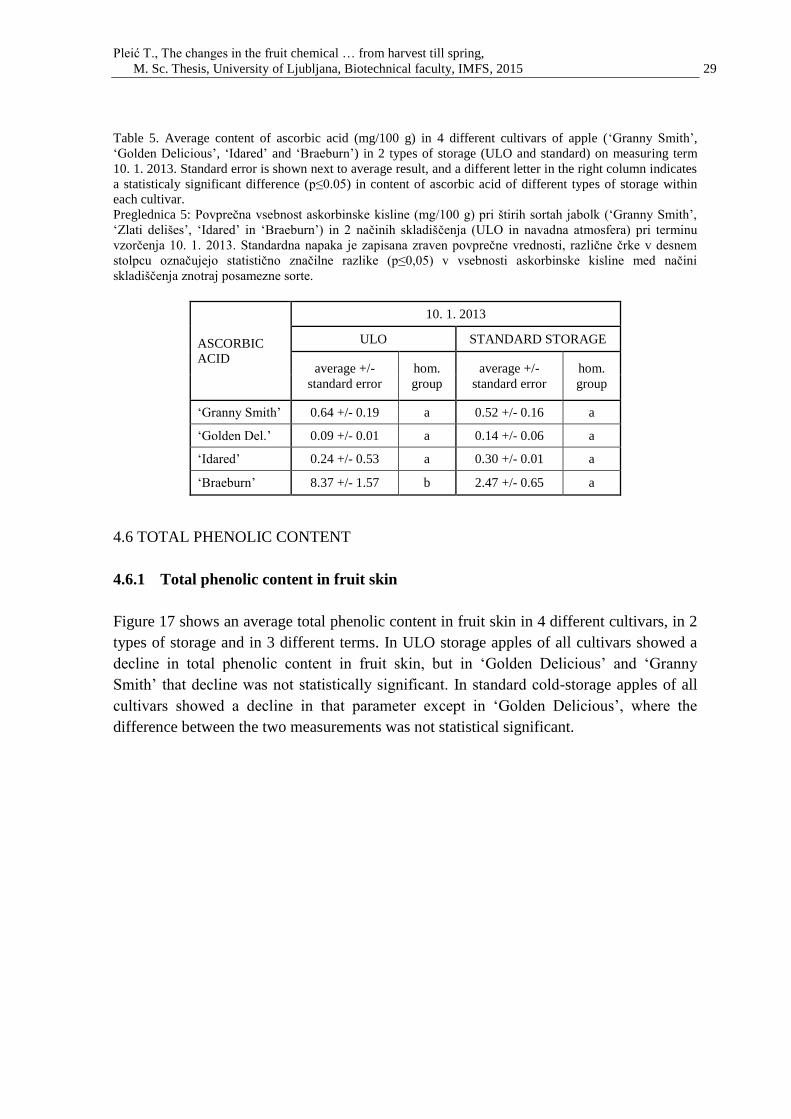
Pleić T., The changes in the fruit chemical … from harvest till spring,
M. Sc. Thesis, University of Ljubljana, Biotechnical faculty, IMFS, 2015 29
Table 5. Average content of ascorbic acid (mg/100 g) in 4 different cultivars of apple (‘Granny Smith’,
‘Golden Delicious’, ‘Idared’ and ‘Braeburn’) in 2 types of storage (ULO and standard) on measuring term
10. 1. 2013. Standard error is shown next to average result, and a different letter in the right column indicates
a statisticaly significant difference (p≤0.05) in content of ascorbic acid of different types of storage within
each cultivar.
Preglednica 5: Povprečna vsebnost askorbinske kisline (mg/100 g) pri štirih sortah jabolk (‘Granny Smith’,
‘Zlati delišes’, ‘Idared’ in ‘Braeburn’) in 2 načinih skladiščenja (ULO in navadna atmosfera) pri terminu
vzorčenja 10. 1. 2013. Standardna napaka je zapisana zraven povprečne vrednosti, različne črke v desnem
stolpcu označujejo statistično značilne razlike (p≤0,05) v vsebnosti askorbinske kisline med načini
skladiščenja znotraj posamezne sorte.
ASCORBIC
ACID
10. 1. 2013
ULO STANDARD STORAGE
average +/-
standard error
hom.
group
average +/-
standard error
hom.
group
‘Granny Smith’ 0.64 +/- 0.19 a 0.52 +/- 0.16 a
‘Golden Del.’ 0.09 +/- 0.01 a 0.14 +/- 0.06 a
‘Idared’ 0.24 +/- 0.53 a 0.30 +/- 0.01 a
‘Braeburn’ 8.37 +/- 1.57 b 2.47 +/- 0.65 a
4.6 TOTAL PHENOLIC CONTENT
4.6.1 Total phenolic content in fruit skin
Figure 17 shows an average total phenolic content in fruit skin in 4 different cultivars, in 2
types of storage and in 3 different terms. In ULO storage apples of all cultivars showed a
decline in total phenolic content in fruit skin, but in ‘Golden Delicious’ and ‘Granny
Smith’ that decline was not statistically significant. In standard cold-storage apples of all
cultivars showed a decline in that parameter except in ‘Golden Delicious’, where the
difference between the two measurements was not statistical significant.
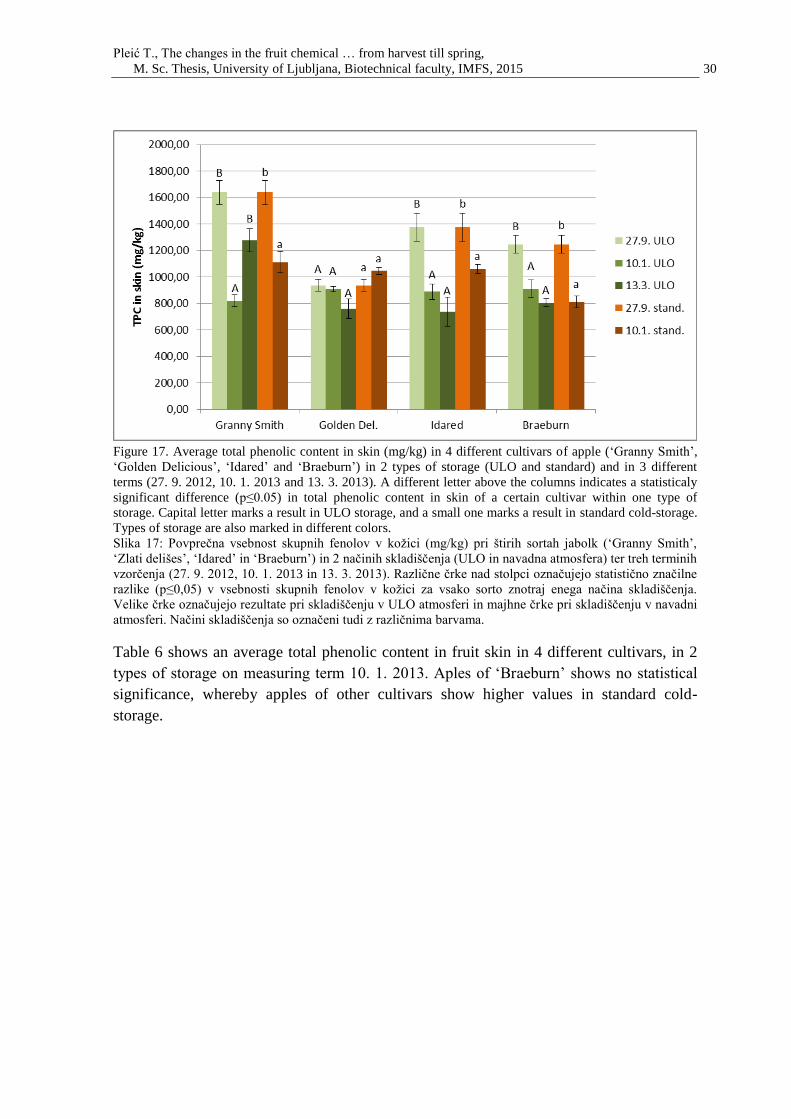
Pleić T., The changes in the fruit chemical … from harvest till spring,
M. Sc. Thesis, University of Ljubljana, Biotechnical faculty, IMFS, 2015 30
Figure 17. Average total phenolic content in skin (mg/kg) in 4 different cultivars of apple (‘Granny Smith’,
‘Golden Delicious’, ‘Idared’ and ‘Braeburn’) in 2 types of storage (ULO and standard) and in 3 different
terms (27. 9. 2012, 10. 1. 2013 and 13. 3. 2013). A different letter above the columns indicates a statisticaly
significant difference (p≤0.05) in total phenolic content in skin of a certain cultivar within one type of
storage. Capital letter marks a result in ULO storage, and a small one marks a result in standard cold-storage.
Types of storage are also marked in different colors.
Slika 17: Povprečna vsebnost skupnih fenolov v kožici (mg/kg) pri štirih sortah jabolk (‘Granny Smith’,
‘Zlati delišes’, ‘Idared’ in ‘Braeburn’) in 2 načinih skladiščenja (ULO in navadna atmosfera) ter treh terminih
vzorčenja (27. 9. 2012, 10. 1. 2013 in 13. 3. 2013). Različne črke nad stolpci označujejo statistično značilne
razlike (p≤0,05) v vsebnosti skupnih fenolov v kožici za vsako sorto znotraj enega načina skladiščenja.
Velike črke označujejo rezultate pri skladiščenju v ULO atmosferi in majhne črke pri skladiščenju v navadni
atmosferi. Načini skladiščenja so označeni tudi z različnima barvama.
Table 6 shows an average total phenolic content in fruit skin in 4 different cultivars, in 2
types of storage on measuring term 10. 1. 2013. Aples of ‘Braeburn’ shows no statistical
significance, whereby apples of other cultivars show higher values in standard cold-
storage.
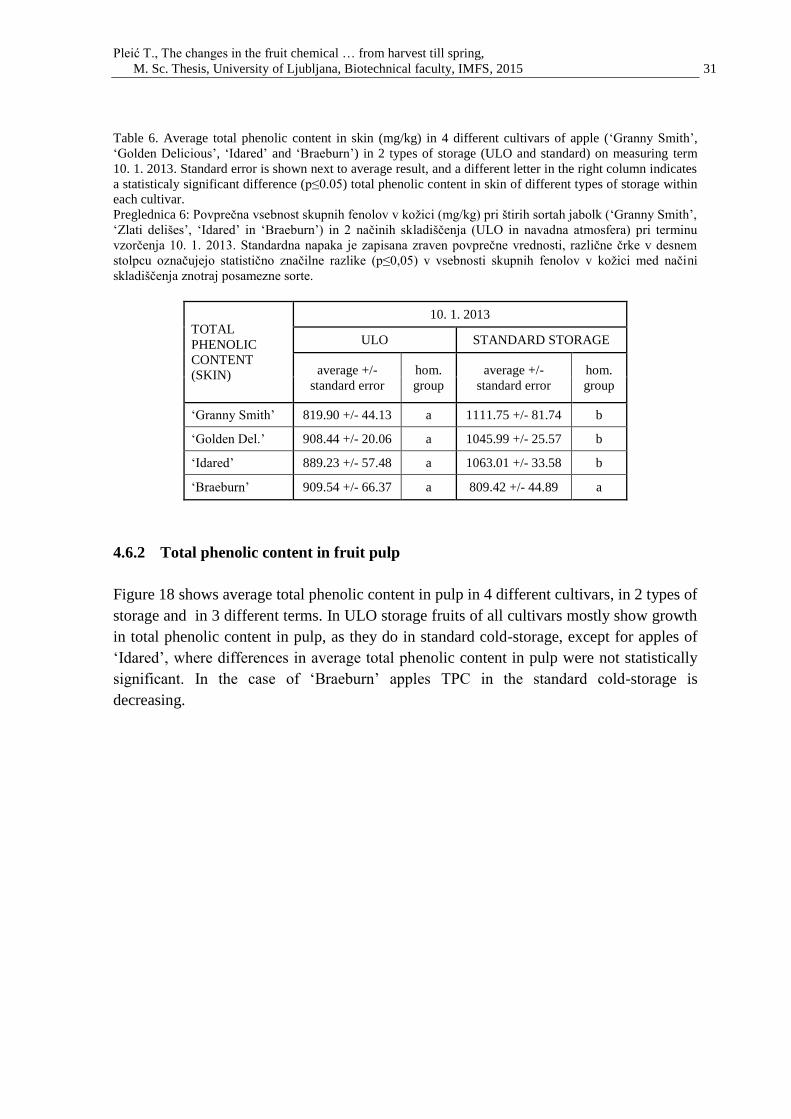
Pleić T., The changes in the fruit chemical … from harvest till spring,
M. Sc. Thesis, University of Ljubljana, Biotechnical faculty, IMFS, 2015 31
Table 6. Average total phenolic content in skin (mg/kg) in 4 different cultivars of apple (‘Granny Smith’,
‘Golden Delicious’, ‘Idared’ and ‘Braeburn’) in 2 types of storage (ULO and standard) on measuring term
10. 1. 2013. Standard error is shown next to average result, and a different letter in the right column indicates
a statisticaly significant difference (p≤0.05) total phenolic content in skin of different types of storage within
each cultivar.
Preglednica 6: Povprečna vsebnost skupnih fenolov v kožici (mg/kg) pri štirih sortah jabolk (‘Granny Smith’,
‘Zlati delišes’, ‘Idared’ in ‘Braeburn’) in 2 načinih skladiščenja (ULO in navadna atmosfera) pri terminu
vzorčenja 10. 1. 2013. Standardna napaka je zapisana zraven povprečne vrednosti, različne črke v desnem
stolpcu označujejo statistično značilne razlike (p≤0,05) v vsebnosti skupnih fenolov v kožici med načini
skladiščenja znotraj posamezne sorte.
TOTAL
PHENOLIC
CONTENT
(SKIN)
10. 1. 2013
ULO STANDARD STORAGE
average +/-
standard error
hom.
group
average +/-
standard error
hom.
group
‘Granny Smith’ 819.90 +/- 44.13 a 1111.75 +/- 81.74 b
‘Golden Del.’ 908.44 +/- 20.06 a 1045.99 +/- 25.57 b
‘Idared’ 889.23 +/- 57.48 a 1063.01 +/- 33.58 b
‘Braeburn’ 909.54 +/- 66.37 a 809.42 +/- 44.89 a
4.6.2 Total phenolic content in fruit pulp
Figure 18 shows average total phenolic content in pulp in 4 different cultivars, in 2 types of
storage and in 3 different terms. In ULO storage fruits of all cultivars mostly show growth
in total phenolic content in pulp, as they do in standard cold-storage, except for apples of
‘Idared’, where differences in average total phenolic content in pulp were not statistically
significant. In the case of ‘Braeburn’ apples TPC in the standard cold-storage is
decreasing.
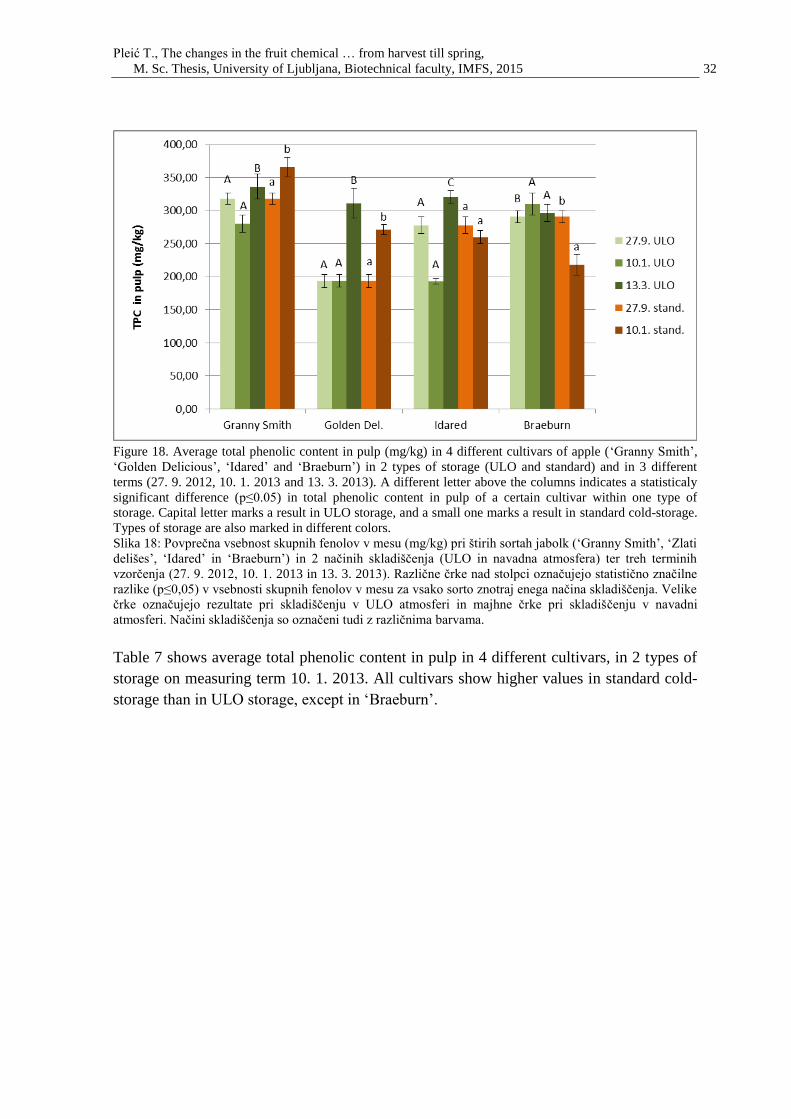
Pleić T., The changes in the fruit chemical … from harvest till spring,
M. Sc. Thesis, University of Ljubljana, Biotechnical faculty, IMFS, 2015 32
Figure 18. Average total phenolic content in pulp (mg/kg) in 4 different cultivars of apple (‘Granny Smith’,
‘Golden Delicious’, ‘Idared’ and ‘Braeburn’) in 2 types of storage (ULO and standard) and in 3 different
terms (27. 9. 2012, 10. 1. 2013 and 13. 3. 2013). A different letter above the columns indicates a statisticaly
significant difference (p≤0.05) in total phenolic content in pulp of a certain cultivar within one type of
storage. Capital letter marks a result in ULO storage, and a small one marks a result in standard cold-storage.
Types of storage are also marked in different colors.
Slika 18: Povprečna vsebnost skupnih fenolov v mesu (mg/kg) pri štirih sortah jabolk (‘Granny Smith’, ‘Zlati
delišes’, ‘Idared’ in ‘Braeburn’) in 2 načinih skladiščenja (ULO in navadna atmosfera) ter treh terminih
vzorčenja (27. 9. 2012, 10. 1. 2013 in 13. 3. 2013). Različne črke nad stolpci označujejo statistično značilne
razlike (p≤0,05) v vsebnosti skupnih fenolov v mesu za vsako sorto znotraj enega načina skladiščenja. Velike
črke označujejo rezultate pri skladiščenju v ULO atmosferi in majhne črke pri skladiščenju v navadni
atmosferi. Načini skladiščenja so označeni tudi z različnima barvama.
Table 7 shows average total phenolic content in pulp in 4 different cultivars, in 2 types of
storage on measuring term 10. 1. 2013. All cultivars show higher values in standard cold-
storage than in ULO storage, except in ‘Braeburn’.
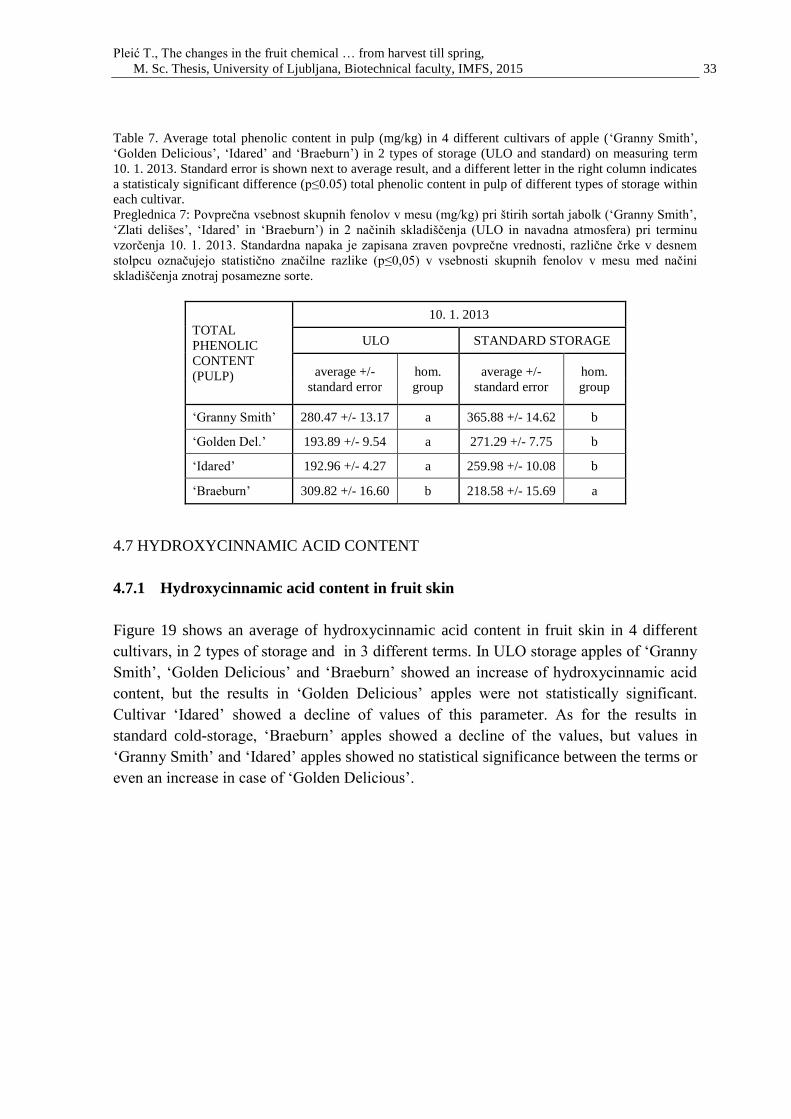
Pleić T., The changes in the fruit chemical … from harvest till spring,
M. Sc. Thesis, University of Ljubljana, Biotechnical faculty, IMFS, 2015 33
Table 7. Average total phenolic content in pulp (mg/kg) in 4 different cultivars of apple (‘Granny Smith’,
‘Golden Delicious’, ‘Idared’ and ‘Braeburn’) in 2 types of storage (ULO and standard) on measuring term
10. 1. 2013. Standard error is shown next to average result, and a different letter in the right column indicates
a statisticaly significant difference (p≤0.05) total phenolic content in pulp of different types of storage within
each cultivar.
Preglednica 7: Povprečna vsebnost skupnih fenolov v mesu (mg/kg) pri štirih sortah jabolk (‘Granny Smith’,
‘Zlati delišes’, ‘Idared’ in ‘Braeburn’) in 2 načinih skladiščenja (ULO in navadna atmosfera) pri terminu
vzorčenja 10. 1. 2013. Standardna napaka je zapisana zraven povprečne vrednosti, različne črke v desnem
stolpcu označujejo statistično značilne razlike (p≤0,05) v vsebnosti skupnih fenolov v mesu med načini
skladiščenja znotraj posamezne sorte.
TOTAL
PHENOLIC
CONTENT
(PULP)
10. 1. 2013
ULO STANDARD STORAGE
average +/-
standard error
hom.
group
average +/-
standard error
hom.
group
‘Granny Smith’ 280.47 +/- 13.17 a 365.88 +/- 14.62 b
‘Golden Del.’ 193.89 +/- 9.54 a 271.29 +/- 7.75 b
‘Idared’ 192.96 +/- 4.27 a 259.98 +/- 10.08 b
‘Braeburn’ 309.82 +/- 16.60 b 218.58 +/- 15.69 a
4.7 HYDROXYCINNAMIC ACID CONTENT
4.7.1 Hydroxycinnamic acid content in fruit skin
Figure 19 shows an average of hydroxycinnamic acid content in fruit skin in 4 different
cultivars, in 2 types of storage and in 3 different terms. In ULO storage apples of ‘Granny
Smith’, ‘Golden Delicious’ and ‘Braeburn’ showed an increase of hydroxycinnamic acid
content, but the results in ‘Golden Delicious’ apples were not statistically significant.
Cultivar ‘Idared’ showed a decline of values of this parameter. As for the results in
standard cold-storage, ‘Braeburn’ apples showed a decline of the values, but values in
‘Granny Smith’ and ‘Idared’ apples showed no statistical significance between the terms or
even an increase in case of ‘Golden Delicious’.
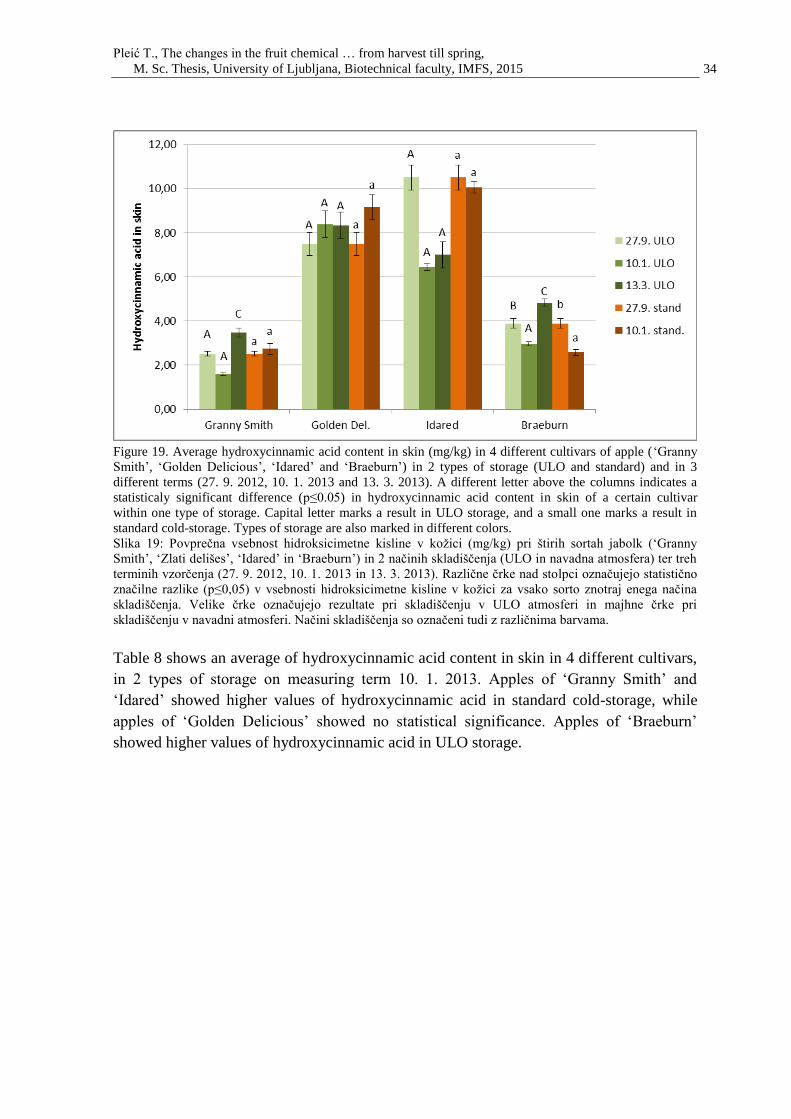
Pleić T., The changes in the fruit chemical … from harvest till spring,
M. Sc. Thesis, University of Ljubljana, Biotechnical faculty, IMFS, 2015 34
Figure 19. Average hydroxycinnamic acid content in skin (mg/kg) in 4 different cultivars of apple (‘Granny
Smith’, ‘Golden Delicious’, ‘Idared’ and ‘Braeburn’) in 2 types of storage (ULO and standard) and in 3
different terms (27. 9. 2012, 10. 1. 2013 and 13. 3. 2013). A different letter above the columns indicates a
statisticaly significant difference (p≤0.05) in hydroxycinnamic acid content in skin of a certain cultivar
within one type of storage. Capital letter marks a result in ULO storage, and a small one marks a result in
standard cold-storage. Types of storage are also marked in different colors.
Slika 19: Povprečna vsebnost hidroksicimetne kisline v kožici (mg/kg) pri štirih sortah jabolk (‘Granny
Smith’, ‘Zlati delišes’, ‘Idared’ in ‘Braeburn’) in 2 načinih skladiščenja (ULO in navadna atmosfera) ter treh
terminih vzorčenja (27. 9. 2012, 10. 1. 2013 in 13. 3. 2013). Različne črke nad stolpci označujejo statistično
značilne razlike (p≤0,05) v vsebnosti hidroksicimetne kisline v kožici za vsako sorto znotraj enega načina
skladiščenja. Velike črke označujejo rezultate pri skladiščenju v ULO atmosferi in majhne črke pri
skladiščenju v navadni atmosferi. Načini skladiščenja so označeni tudi z različnima barvama.
Table 8 shows an average of hydroxycinnamic acid content in skin in 4 different cultivars,
in 2 types of storage on measuring term 10. 1. 2013. Apples of ‘Granny Smith’ and
‘Idared’ showed higher values of hydroxycinnamic acid in standard cold-storage, while
apples of ‘Golden Delicious’ showed no statistical significance. Apples of ‘Braeburn’
showed higher values of hydroxycinnamic acid in ULO storage.
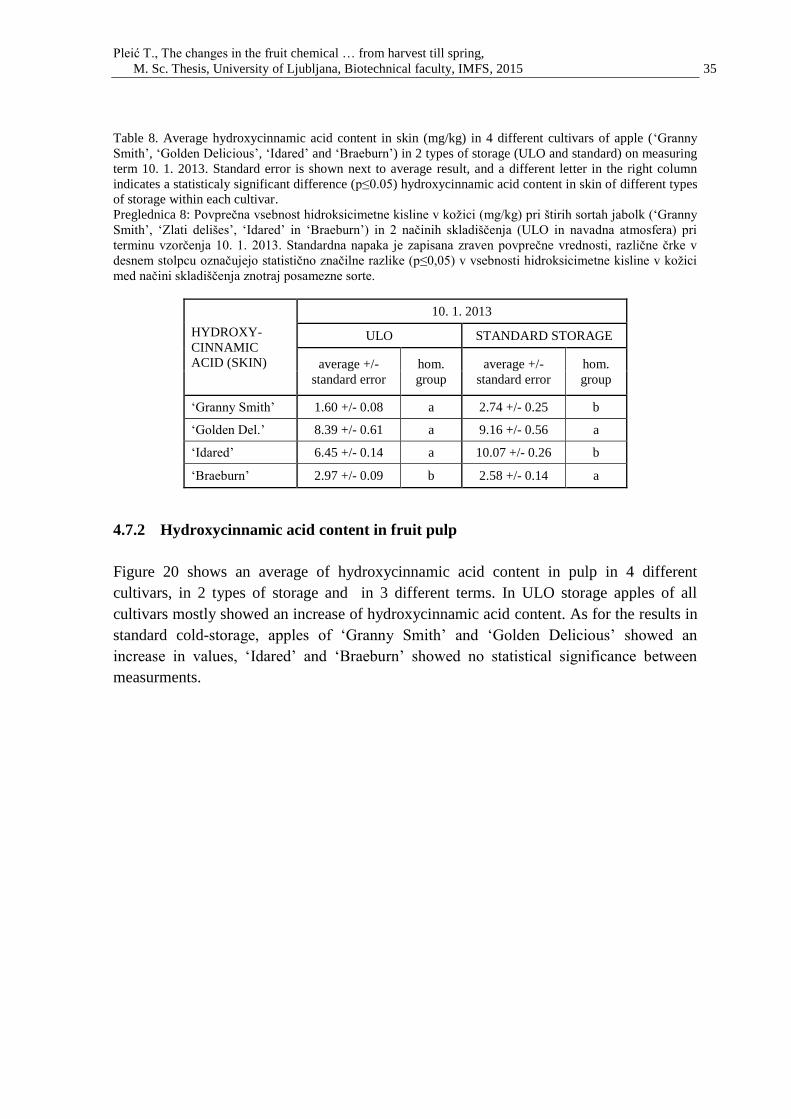
Pleić T., The changes in the fruit chemical … from harvest till spring,
M. Sc. Thesis, University of Ljubljana, Biotechnical faculty, IMFS, 2015 35
Table 8. Average hydroxycinnamic acid content in skin (mg/kg) in 4 different cultivars of apple (‘Granny
Smith’, ‘Golden Delicious’, ‘Idared’ and ‘Braeburn’) in 2 types of storage (ULO and standard) on measuring
term 10. 1. 2013. Standard error is shown next to average result, and a different letter in the right column
indicates a statisticaly significant difference (p≤0.05) hydroxycinnamic acid content in skin of different types
of storage within each cultivar.
Preglednica 8: Povprečna vsebnost hidroksicimetne kisline v kožici (mg/kg) pri štirih sortah jabolk (‘Granny
Smith’, ‘Zlati delišes’, ‘Idared’ in ‘Braeburn’) in 2 načinih skladiščenja (ULO in navadna atmosfera) pri
terminu vzorčenja 10. 1. 2013. Standardna napaka je zapisana zraven povprečne vrednosti, različne črke v
desnem stolpcu označujejo statistično značilne razlike (p≤0,05) v vsebnosti hidroksicimetne kisline v kožici
med načini skladiščenja znotraj posamezne sorte.
HYDROXY-
CINNAMIC
ACID (SKIN)
10. 1. 2013
ULO STANDARD STORAGE
average +/-
standard error
hom.
group
average +/-
standard error
hom.
group
‘Granny Smith’ 1.60 +/- 0.08 a 2.74 +/- 0.25 b
‘Golden Del.’ 8.39 +/- 0.61 a 9.16 +/- 0.56 a
‘Idared’ 6.45 +/- 0.14 a 10.07 +/- 0.26 b
‘Braeburn’ 2.97 +/- 0.09 b 2.58 +/- 0.14 a
4.7.2 Hydroxycinnamic acid content in fruit pulp
Figure 20 shows an average of hydroxycinnamic acid content in pulp in 4 different
cultivars, in 2 types of storage and in 3 different terms. In ULO storage apples of all
cultivars mostly showed an increase of hydroxycinnamic acid content. As for the results in
standard cold-storage, apples of ‘Granny Smith’ and ‘Golden Delicious’ showed an
increase in values, ‘Idared’ and ‘Braeburn’ showed no statistical significance between
measurments.
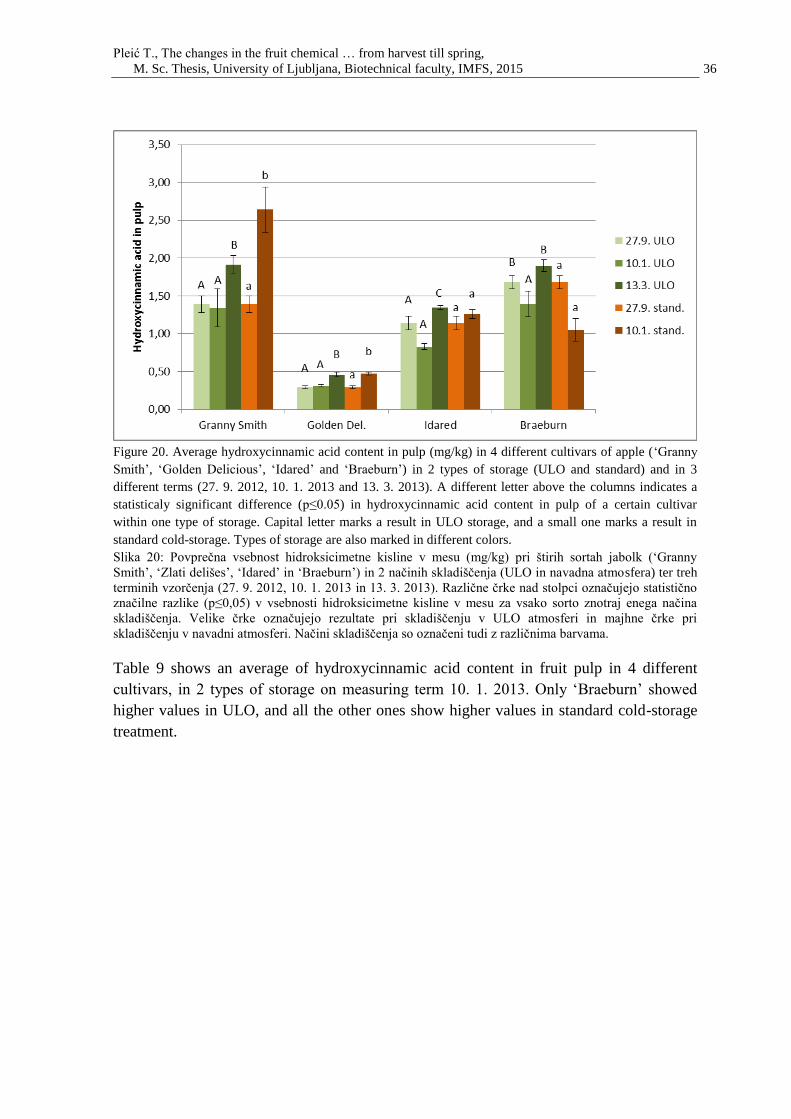
Pleić T., The changes in the fruit chemical … from harvest till spring,
M. Sc. Thesis, University of Ljubljana, Biotechnical faculty, IMFS, 2015 36
Figure 20. Average hydroxycinnamic acid content in pulp (mg/kg) in 4 different cultivars of apple (‘Granny
Smith’, ‘Golden Delicious’, ‘Idared’ and ‘Braeburn’) in 2 types of storage (ULO and standard) and in 3
different terms (27. 9. 2012, 10. 1. 2013 and 13. 3. 2013). A different letter above the columns indicates a
statisticaly significant difference (p≤0.05) in hydroxycinnamic acid content in pulp of a certain cultivar
within one type of storage. Capital letter marks a result in ULO storage, and a small one marks a result in
standard cold-storage. Types of storage are also marked in different colors.
Slika 20: Povprečna vsebnost hidroksicimetne kisline v mesu (mg/kg) pri štirih sortah jabolk (‘Granny
Smith’, ‘Zlati delišes’, ‘Idared’ in ‘Braeburn’) in 2 načinih skladiščenja (ULO in navadna atmosfera) ter treh
terminih vzorčenja (27. 9. 2012, 10. 1. 2013 in 13. 3. 2013). Različne črke nad stolpci označujejo statistično
značilne razlike (p≤0,05) v vsebnosti hidroksicimetne kisline v mesu za vsako sorto znotraj enega načina
skladiščenja. Velike črke označujejo rezultate pri skladiščenju v ULO atmosferi in majhne črke pri
skladiščenju v navadni atmosferi. Načini skladiščenja so označeni tudi z različnima barvama.
Table 9 shows an average of hydroxycinnamic acid content in fruit pulp in 4 different
cultivars, in 2 types of storage on measuring term 10. 1. 2013. Only ‘Braeburn’ showed
higher values in ULO, and all the other ones show higher values in standard cold-storage
treatment.
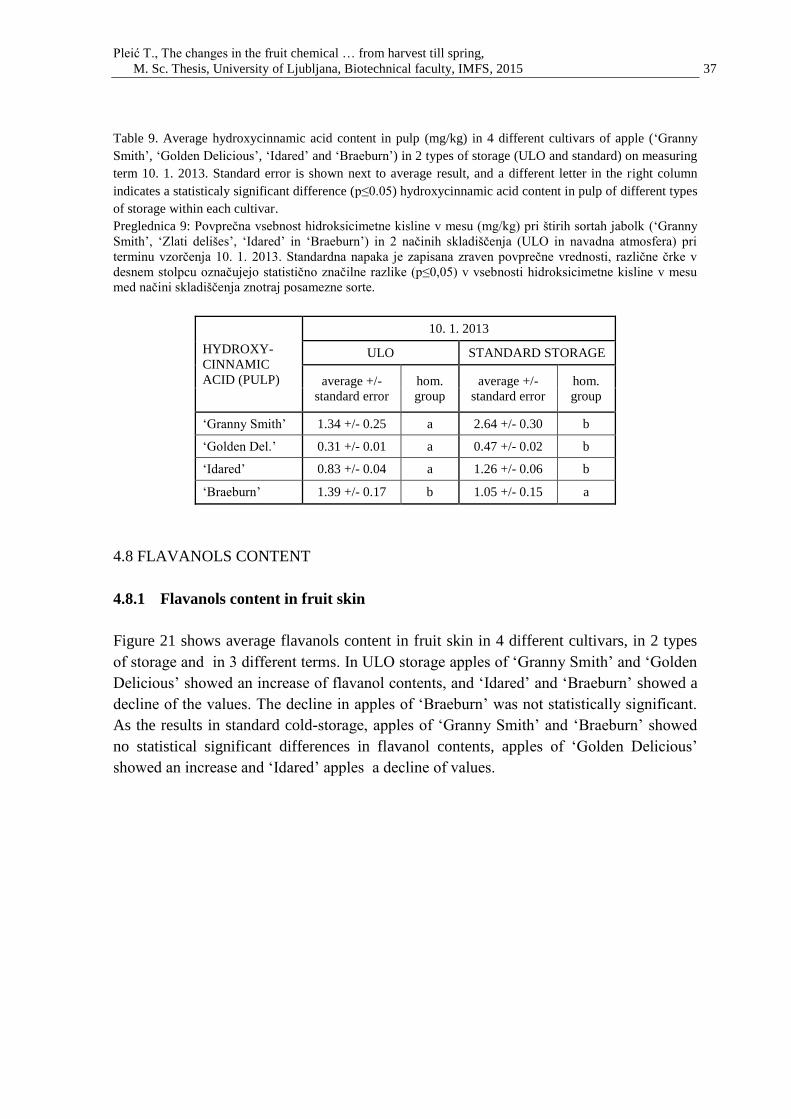
Pleić T., The changes in the fruit chemical … from harvest till spring,
M. Sc. Thesis, University of Ljubljana, Biotechnical faculty, IMFS, 2015 37
Table 9. Average hydroxycinnamic acid content in pulp (mg/kg) in 4 different cultivars of apple (‘Granny
Smith’, ‘Golden Delicious’, ‘Idared’ and ‘Braeburn’) in 2 types of storage (ULO and standard) on measuring
term 10. 1. 2013. Standard error is shown next to average result, and a different letter in the right column
indicates a statisticaly significant difference (p≤0.05) hydroxycinnamic acid content in pulp of different types
of storage within each cultivar.
Preglednica 9: Povprečna vsebnost hidroksicimetne kisline v mesu (mg/kg) pri štirih sortah jabolk (‘Granny
Smith’, ‘Zlati delišes’, ‘Idared’ in ‘Braeburn’) in 2 načinih skladiščenja (ULO in navadna atmosfera) pri
terminu vzorčenja 10. 1. 2013. Standardna napaka je zapisana zraven povprečne vrednosti, različne črke v
desnem stolpcu označujejo statistično značilne razlike (p≤0,05) v vsebnosti hidroksicimetne kisline v mesu
med načini skladiščenja znotraj posamezne sorte.
HYDROXY-
CINNAMIC
ACID (PULP)
10. 1. 2013
ULO STANDARD STORAGE
average +/-
standard error
hom.
group
average +/-
standard error
hom.
group
‘Granny Smith’ 1.34 +/- 0.25 a 2.64 +/- 0.30 b
‘Golden Del.’ 0.31 +/- 0.01 a 0.47 +/- 0.02 b
‘Idared’ 0.83 +/- 0.04 a 1.26 +/- 0.06 b
‘Braeburn’ 1.39 +/- 0.17 b 1.05 +/- 0.15 a
4.8 FLAVANOLS CONTENT
4.8.1 Flavanols content in fruit skin
Figure 21 shows average flavanols content in fruit skin in 4 different cultivars, in 2 types
of storage and in 3 different terms. In ULO storage apples of ‘Granny Smith’ and ‘Golden
Delicious’ showed an increase of flavanol contents, and ‘Idared’ and ‘Braeburn’ showed a
decline of the values. The decline in apples of ‘Braeburn’ was not statistically significant.
As the results in standard cold-storage, apples of ‘Granny Smith’ and ‘Braeburn’ showed
no statistical significant differences in flavanol contents, apples of ‘Golden Delicious’
showed an increase and ‘Idared’ apples a decline of values.
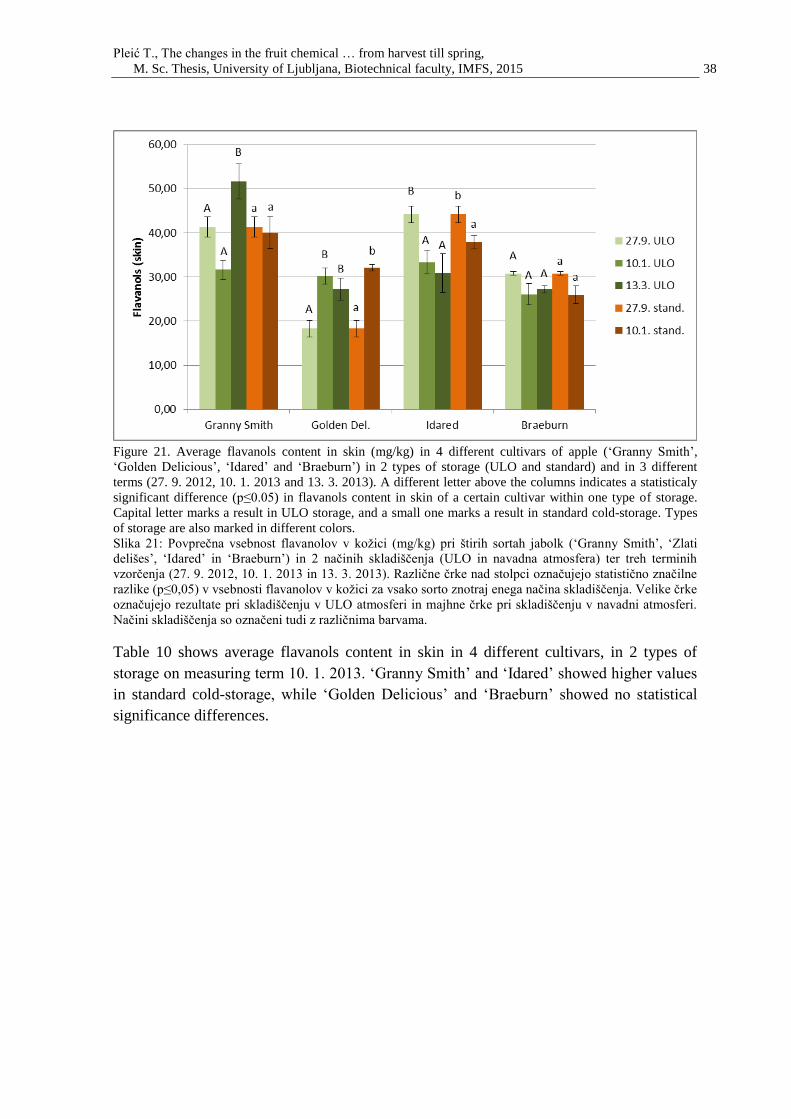
Pleić T., The changes in the fruit chemical … from harvest till spring,
M. Sc. Thesis, University of Ljubljana, Biotechnical faculty, IMFS, 2015 38
Figure 21. Average flavanols content in skin (mg/kg) in 4 different cultivars of apple (‘Granny Smith’,
‘Golden Delicious’, ‘Idared’ and ‘Braeburn’) in 2 types of storage (ULO and standard) and in 3 different
terms (27. 9. 2012, 10. 1. 2013 and 13. 3. 2013). A different letter above the columns indicates a statisticaly
significant difference (p≤0.05) in flavanols content in skin of a certain cultivar within one type of storage.
Capital letter marks a result in ULO storage, and a small one marks a result in standard cold-storage. Types
of storage are also marked in different colors.
Slika 21: Povprečna vsebnost flavanolov v kožici (mg/kg) pri štirih sortah jabolk (‘Granny Smith’, ‘Zlati
delišes’, ‘Idared’ in ‘Braeburn’) in 2 načinih skladiščenja (ULO in navadna atmosfera) ter treh terminih
vzorčenja (27. 9. 2012, 10. 1. 2013 in 13. 3. 2013). Različne črke nad stolpci označujejo statistično značilne
razlike (p≤0,05) v vsebnosti flavanolov v kožici za vsako sorto znotraj enega načina skladiščenja. Velike črke
označujejo rezultate pri skladiščenju v ULO atmosferi in majhne črke pri skladiščenju v navadni atmosferi.
Načini skladiščenja so označeni tudi z različnima barvama.
Table 10 shows average flavanols content in skin in 4 different cultivars, in 2 types of
storage on measuring term 10. 1. 2013. ‘Granny Smith’ and ‘Idared’ showed higher values
in standard cold-storage, while ‘Golden Delicious’ and ‘Braeburn’ showed no statistical
significance differences.
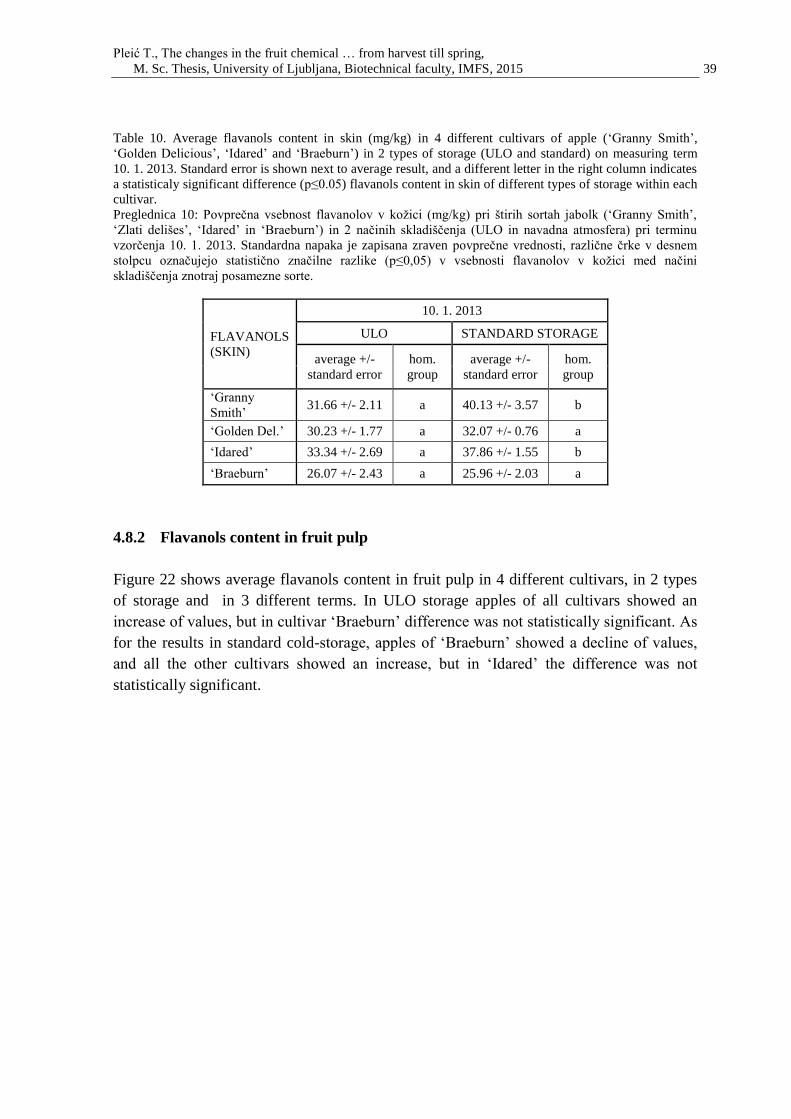
Pleić T., The changes in the fruit chemical … from harvest till spring,
M. Sc. Thesis, University of Ljubljana, Biotechnical faculty, IMFS, 2015 39
Table 10. Average flavanols content in skin (mg/kg) in 4 different cultivars of apple (‘Granny Smith’,
‘Golden Delicious’, ‘Idared’ and ‘Braeburn’) in 2 types of storage (ULO and standard) on measuring term
10. 1. 2013. Standard error is shown next to average result, and a different letter in the right column indicates
a statisticaly significant difference (p≤0.05) flavanols content in skin of different types of storage within each
cultivar.
Preglednica 10: Povprečna vsebnost flavanolov v kožici (mg/kg) pri štirih sortah jabolk (‘Granny Smith’,
‘Zlati delišes’, ‘Idared’ in ‘Braeburn’) in 2 načinih skladiščenja (ULO in navadna atmosfera) pri terminu
vzorčenja 10. 1. 2013. Standardna napaka je zapisana zraven povprečne vrednosti, različne črke v desnem
stolpcu označujejo statistično značilne razlike (p≤0,05) v vsebnosti flavanolov v kožici med načini
skladiščenja znotraj posamezne sorte.
FLAVANOLS
(SKIN)
10. 1. 2013
ULO STANDARD STORAGE
average +/-
standard error
hom.
group
average +/-
standard error
hom.
group
‘Granny
Smith’ 31.66 +/- 2.11 a 40.13 +/- 3.57 b
‘Golden Del.’ 30.23 +/- 1.77 a 32.07 +/- 0.76 a
‘Idared’ 33.34 +/- 2.69 a 37.86 +/- 1.55 b
‘Braeburn’ 26.07 +/- 2.43 a 25.96 +/- 2.03 a
4.8.2 Flavanols content in fruit pulp
Figure 22 shows average flavanols content in fruit pulp in 4 different cultivars, in 2 types
of storage and in 3 different terms. In ULO storage apples of all cultivars showed an
increase of values, but in cultivar ‘Braeburn’ difference was not statistically significant. As
for the results in standard cold-storage, apples of ‘Braeburn’ showed a decline of values,
and all the other cultivars showed an increase, but in ‘Idared’ the difference was not
statistically significant.
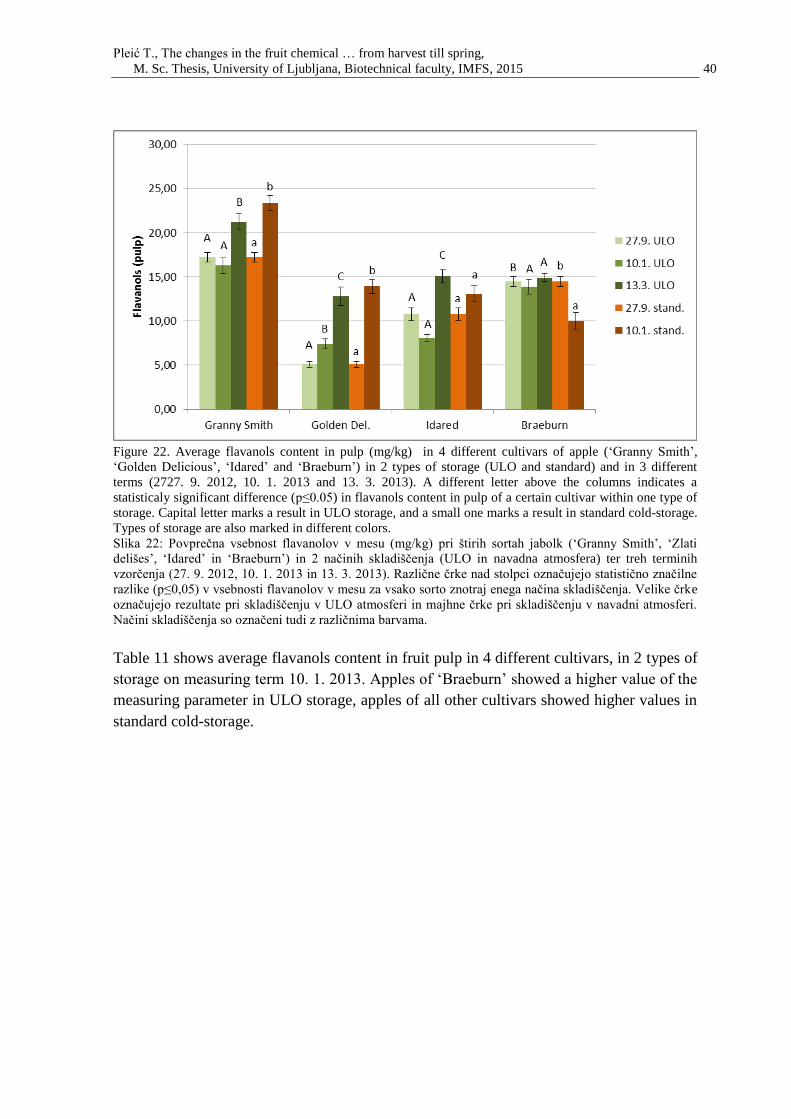
Pleić T., The changes in the fruit chemical … from harvest till spring,
M. Sc. Thesis, University of Ljubljana, Biotechnical faculty, IMFS, 2015 40
Figure 22. Average flavanols content in pulp (mg/kg) in 4 different cultivars of apple (‘Granny Smith’,
‘Golden Delicious’, ‘Idared’ and ‘Braeburn’) in 2 types of storage (ULO and standard) and in 3 different
terms (2727. 9. 2012, 10. 1. 2013 and 13. 3. 2013). A different letter above the columns indicates a
statisticaly significant difference (p≤0.05) in flavanols content in pulp of a certain cultivar within one type of
storage. Capital letter marks a result in ULO storage, and a small one marks a result in standard cold-storage.
Types of storage are also marked in different colors.
Slika 22: Povprečna vsebnost flavanolov v mesu (mg/kg) pri štirih sortah jabolk (‘Granny Smith’, ‘Zlati
delišes’, ‘Idared’ in ‘Braeburn’) in 2 načinih skladiščenja (ULO in navadna atmosfera) ter treh terminih
vzorčenja (27. 9. 2012, 10. 1. 2013 in 13. 3. 2013). Različne črke nad stolpci označujejo statistično značilne
razlike (p≤0,05) v vsebnosti flavanolov v mesu za vsako sorto znotraj enega načina skladiščenja. Velike črke
označujejo rezultate pri skladiščenju v ULO atmosferi in majhne črke pri skladiščenju v navadni atmosferi.
Načini skladiščenja so označeni tudi z različnima barvama.
Table 11 shows average flavanols content in fruit pulp in 4 different cultivars, in 2 types of
storage on measuring term 10. 1. 2013. Apples of ‘Braeburn’ showed a higher value of the
measuring parameter in ULO storage, apples of all other cultivars showed higher values in
standard cold-storage.
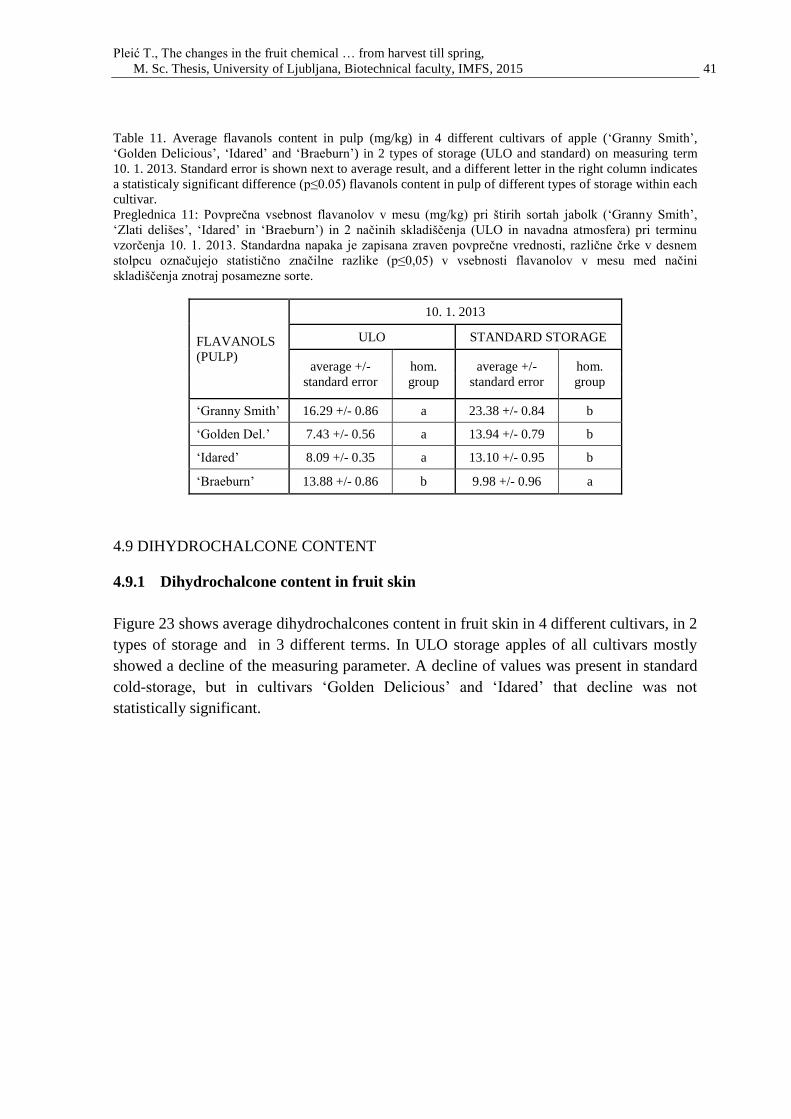
Pleić T., The changes in the fruit chemical … from harvest till spring,
M. Sc. Thesis, University of Ljubljana, Biotechnical faculty, IMFS, 2015 41
Table 11. Average flavanols content in pulp (mg/kg) in 4 different cultivars of apple (‘Granny Smith’,
‘Golden Delicious’, ‘Idared’ and ‘Braeburn’) in 2 types of storage (ULO and standard) on measuring term
10. 1. 2013. Standard error is shown next to average result, and a different letter in the right column indicates
a statisticaly significant difference (p≤0.05) flavanols content in pulp of different types of storage within each
cultivar.
Preglednica 11: Povprečna vsebnost flavanolov v mesu (mg/kg) pri štirih sortah jabolk (‘Granny Smith’,
‘Zlati delišes’, ‘Idared’ in ‘Braeburn’) in 2 načinih skladiščenja (ULO in navadna atmosfera) pri terminu
vzorčenja 10. 1. 2013. Standardna napaka je zapisana zraven povprečne vrednosti, različne črke v desnem
stolpcu označujejo statistično značilne razlike (p≤0,05) v vsebnosti flavanolov v mesu med načini
skladiščenja znotraj posamezne sorte.
FLAVANOLS
(PULP)
10. 1. 2013
ULO STANDARD STORAGE
average +/-
standard error
hom.
group
average +/-
standard error
hom.
group
‘Granny Smith’ 16.29 +/- 0.86 a 23.38 +/- 0.84 b
‘Golden Del.’ 7.43 +/- 0.56 a 13.94 +/- 0.79 b
‘Idared’ 8.09 +/- 0.35 a 13.10 +/- 0.95 b
‘Braeburn’ 13.88 +/- 0.86 b 9.98 +/- 0.96 a
4.9 DIHYDROCHALCONE CONTENT
4.9.1 Dihydrochalcone content in fruit skin
Figure 23 shows average dihydrochalcones content in fruit skin in 4 different cultivars, in 2
types of storage and in 3 different terms. In ULO storage apples of all cultivars mostly
showed a decline of the measuring parameter. A decline of values was present in standard
cold-storage, but in cultivars ‘Golden Delicious’ and ‘Idared’ that decline was not
statistically significant.
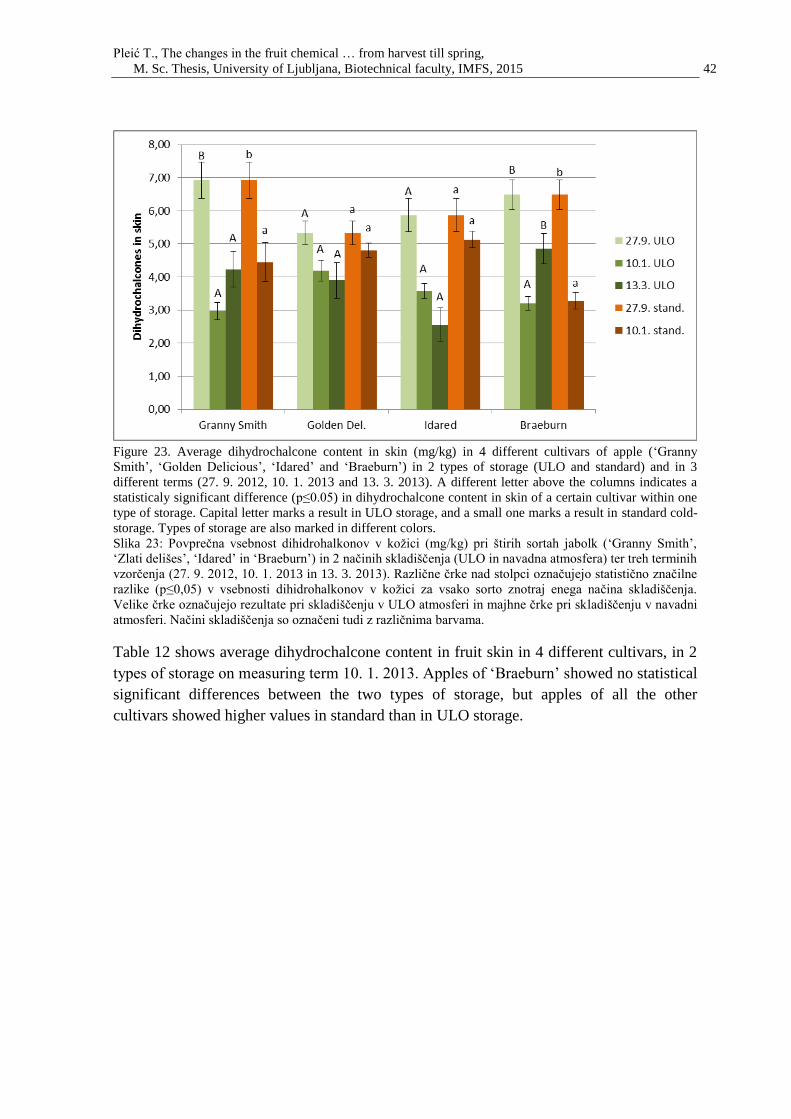
Pleić T., The changes in the fruit chemical … from harvest till spring,
M. Sc. Thesis, University of Ljubljana, Biotechnical faculty, IMFS, 2015 42
Figure 23. Average dihydrochalcone content in skin (mg/kg) in 4 different cultivars of apple (‘Granny
Smith’, ‘Golden Delicious’, ‘Idared’ and ‘Braeburn’) in 2 types of storage (ULO and standard) and in 3
different terms (27. 9. 2012, 10. 1. 2013 and 13. 3. 2013). A different letter above the columns indicates a
statisticaly significant difference (p≤0.05) in dihydrochalcone content in skin of a certain cultivar within one
type of storage. Capital letter marks a result in ULO storage, and a small one marks a result in standard cold-
storage. Types of storage are also marked in different colors.
Slika 23: Povprečna vsebnost dihidrohalkonov v kožici (mg/kg) pri štirih sortah jabolk (‘Granny Smith’,
‘Zlati delišes’, ‘Idared’ in ‘Braeburn’) in 2 načinih skladiščenja (ULO in navadna atmosfera) ter treh terminih
vzorčenja (27. 9. 2012, 10. 1. 2013 in 13. 3. 2013). Različne črke nad stolpci označujejo statistično značilne
razlike (p≤0,05) v vsebnosti dihidrohalkonov v kožici za vsako sorto znotraj enega načina skladiščenja.
Velike črke označujejo rezultate pri skladiščenju v ULO atmosferi in majhne črke pri skladiščenju v navadni
atmosferi. Načini skladiščenja so označeni tudi z različnima barvama.
Table 12 shows average dihydrochalcone content in fruit skin in 4 different cultivars, in 2
types of storage on measuring term 10. 1. 2013. Apples of ‘Braeburn’ showed no statistical
significant differences between the two types of storage, but apples of all the other
cultivars showed higher values in standard than in ULO storage.
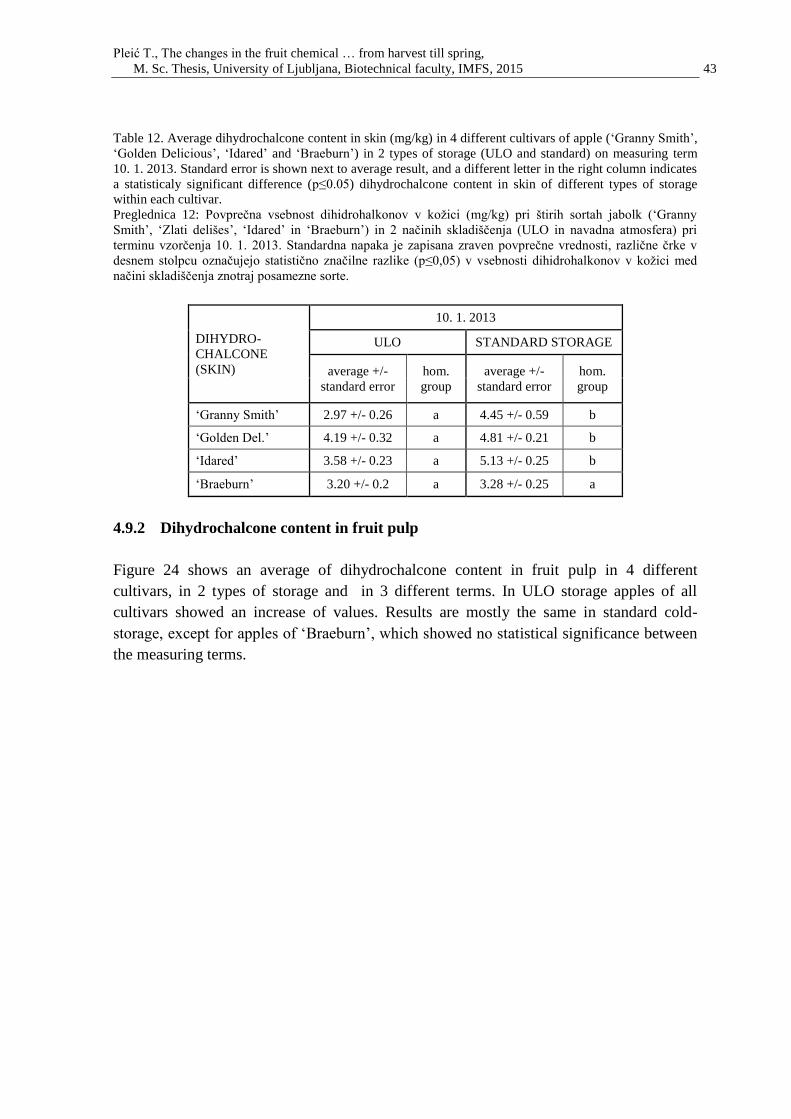
Pleić T., The changes in the fruit chemical … from harvest till spring,
M. Sc. Thesis, University of Ljubljana, Biotechnical faculty, IMFS, 2015 43
Table 12. Average dihydrochalcone content in skin (mg/kg) in 4 different cultivars of apple (‘Granny Smith’,
‘Golden Delicious’, ‘Idared’ and ‘Braeburn’) in 2 types of storage (ULO and standard) on measuring term
10. 1. 2013. Standard error is shown next to average result, and a different letter in the right column indicates
a statisticaly significant difference (p≤0.05) dihydrochalcone content in skin of different types of storage
within each cultivar.
Preglednica 12: Povprečna vsebnost dihidrohalkonov v kožici (mg/kg) pri štirih sortah jabolk (‘Granny
Smith’, ‘Zlati delišes’, ‘Idared’ in ‘Braeburn’) in 2 načinih skladiščenja (ULO in navadna atmosfera) pri
terminu vzorčenja 10. 1. 2013. Standardna napaka je zapisana zraven povprečne vrednosti, različne črke v
desnem stolpcu označujejo statistično značilne razlike (p≤0,05) v vsebnosti dihidrohalkonov v kožici med
načini skladiščenja znotraj posamezne sorte.
DIHYDRO-
CHALCONE
(SKIN)
10. 1. 2013
ULO STANDARD STORAGE
average +/-
standard error
hom.
group
average +/-
standard error
hom.
group
‘Granny Smith’ 2.97 +/- 0.26 a 4.45 +/- 0.59 b
‘Golden Del.’ 4.19 +/- 0.32 a 4.81 +/- 0.21 b
‘Idared’ 3.58 +/- 0.23 a 5.13 +/- 0.25 b
‘Braeburn’ 3.20 +/- 0.2 a 3.28 +/- 0.25 a
4.9.2 Dihydrochalcone content in fruit pulp
Figure 24 shows an average of dihydrochalcone content in fruit pulp in 4 different
cultivars, in 2 types of storage and in 3 different terms. In ULO storage apples of all
cultivars showed an increase of values. Results are mostly the same in standard cold-
storage, except for apples of ‘Braeburn’, which showed no statistical significance between
the measuring terms.
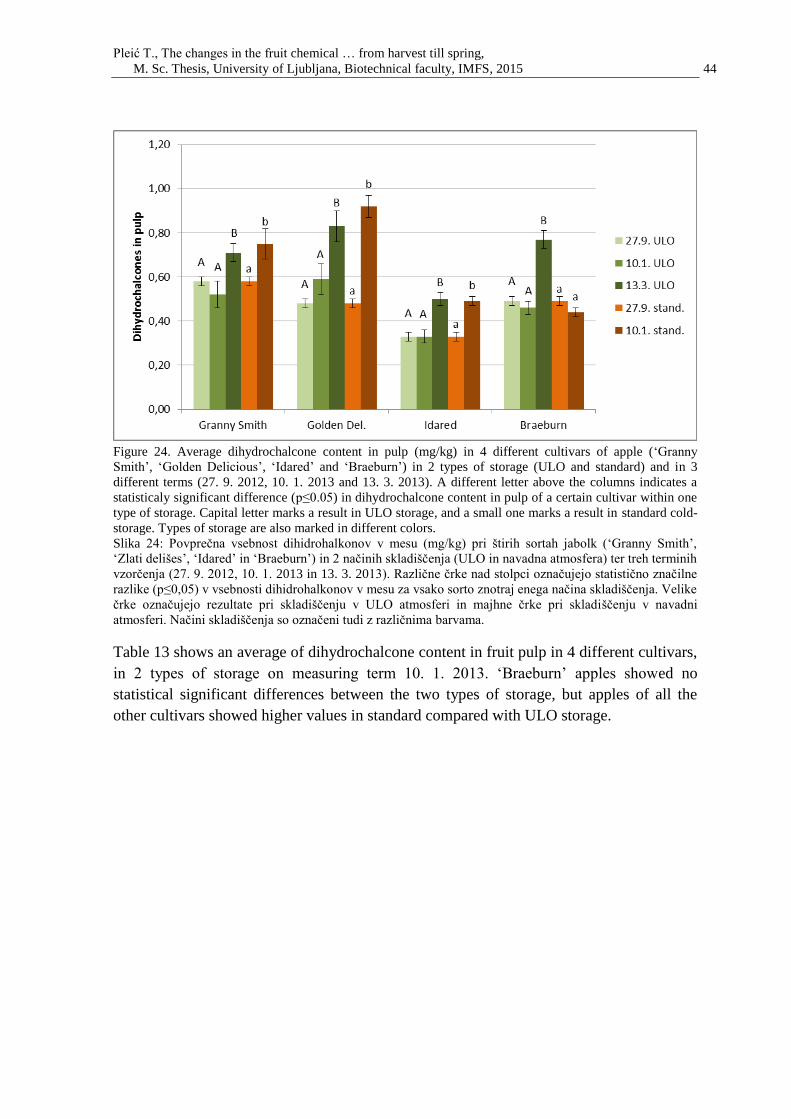
Pleić T., The changes in the fruit chemical … from harvest till spring,
M. Sc. Thesis, University of Ljubljana, Biotechnical faculty, IMFS, 2015 44
Figure 24. Average dihydrochalcone content in pulp (mg/kg) in 4 different cultivars of apple (‘Granny
Smith’, ‘Golden Delicious’, ‘Idared’ and ‘Braeburn’) in 2 types of storage (ULO and standard) and in 3
different terms (27. 9. 2012, 10. 1. 2013 and 13. 3. 2013). A different letter above the columns indicates a
statisticaly significant difference (p≤0.05) in dihydrochalcone content in pulp of a certain cultivar within one
type of storage. Capital letter marks a result in ULO storage, and a small one marks a result in standard cold-
storage. Types of storage are also marked in different colors.
Slika 24: Povprečna vsebnost dihidrohalkonov v mesu (mg/kg) pri štirih sortah jabolk (‘Granny Smith’,
‘Zlati delišes’, ‘Idared’ in ‘Braeburn’) in 2 načinih skladiščenja (ULO in navadna atmosfera) ter treh terminih
vzorčenja (27. 9. 2012, 10. 1. 2013 in 13. 3. 2013). Različne črke nad stolpci označujejo statistično značilne
razlike (p≤0,05) v vsebnosti dihidrohalkonov v mesu za vsako sorto znotraj enega načina skladiščenja. Velike
črke označujejo rezultate pri skladiščenju v ULO atmosferi in majhne črke pri skladiščenju v navadni
atmosferi. Načini skladiščenja so označeni tudi z različnima barvama.
Table 13 shows an average of dihydrochalcone content in fruit pulp in 4 different cultivars,
in 2 types of storage on measuring term 10. 1. 2013. ‘Braeburn’ apples showed no
statistical significant differences between the two types of storage, but apples of all the
other cultivars showed higher values in standard compared with ULO storage.
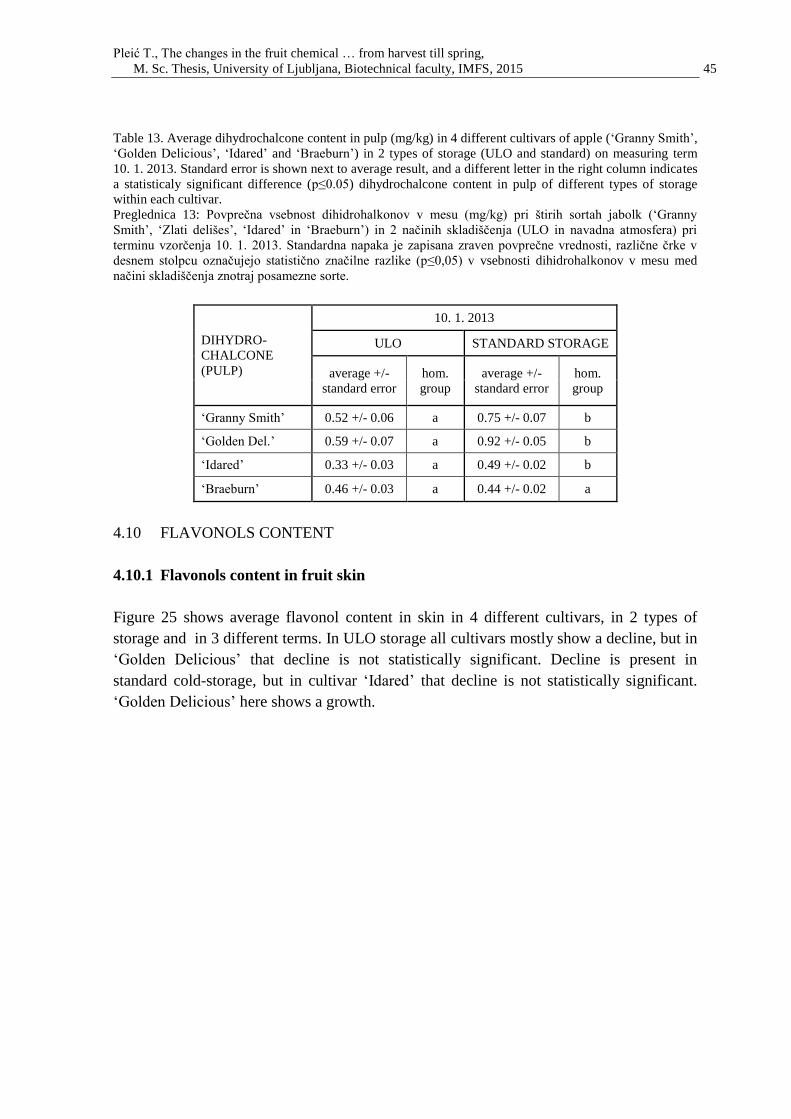
Pleić T., The changes in the fruit chemical … from harvest till spring,
M. Sc. Thesis, University of Ljubljana, Biotechnical faculty, IMFS, 2015 45
Table 13. Average dihydrochalcone content in pulp (mg/kg) in 4 different cultivars of apple (‘Granny Smith’,
‘Golden Delicious’, ‘Idared’ and ‘Braeburn’) in 2 types of storage (ULO and standard) on measuring term
10. 1. 2013. Standard error is shown next to average result, and a different letter in the right column indicates
a statisticaly significant difference (p≤0.05) dihydrochalcone content in pulp of different types of storage
within each cultivar.
Preglednica 13: Povprečna vsebnost dihidrohalkonov v mesu (mg/kg) pri štirih sortah jabolk (‘Granny
Smith’, ‘Zlati delišes’, ‘Idared’ in ‘Braeburn’) in 2 načinih skladiščenja (ULO in navadna atmosfera) pri
terminu vzorčenja 10. 1. 2013. Standardna napaka je zapisana zraven povprečne vrednosti, različne črke v
desnem stolpcu označujejo statistično značilne razlike (p≤0,05) v vsebnosti dihidrohalkonov v mesu med
načini skladiščenja znotraj posamezne sorte.
DIHYDRO-
CHALCONE
(PULP)
10. 1. 2013
ULO STANDARD STORAGE
average +/-
standard error
hom.
group
average +/-
standard error
hom.
group
‘Granny Smith’ 0.52 +/- 0.06 a 0.75 +/- 0.07 b
‘Golden Del.’ 0.59 +/- 0.07 a 0.92 +/- 0.05 b
‘Idared’ 0.33 +/- 0.03 a 0.49 +/- 0.02 b
‘Braeburn’ 0.46 +/- 0.03 a 0.44 +/- 0.02 a
4.10 FLAVONOLS CONTENT
4.10.1 Flavonols content in fruit skin
Figure 25 shows average flavonol content in skin in 4 different cultivars, in 2 types of
storage and in 3 different terms. In ULO storage all cultivars mostly show a decline, but in
‘Golden Delicious’ that decline is not statistically significant. Decline is present in
standard cold-storage, but in cultivar ‘Idared’ that decline is not statistically significant.
‘Golden Delicious’ here shows a growth.
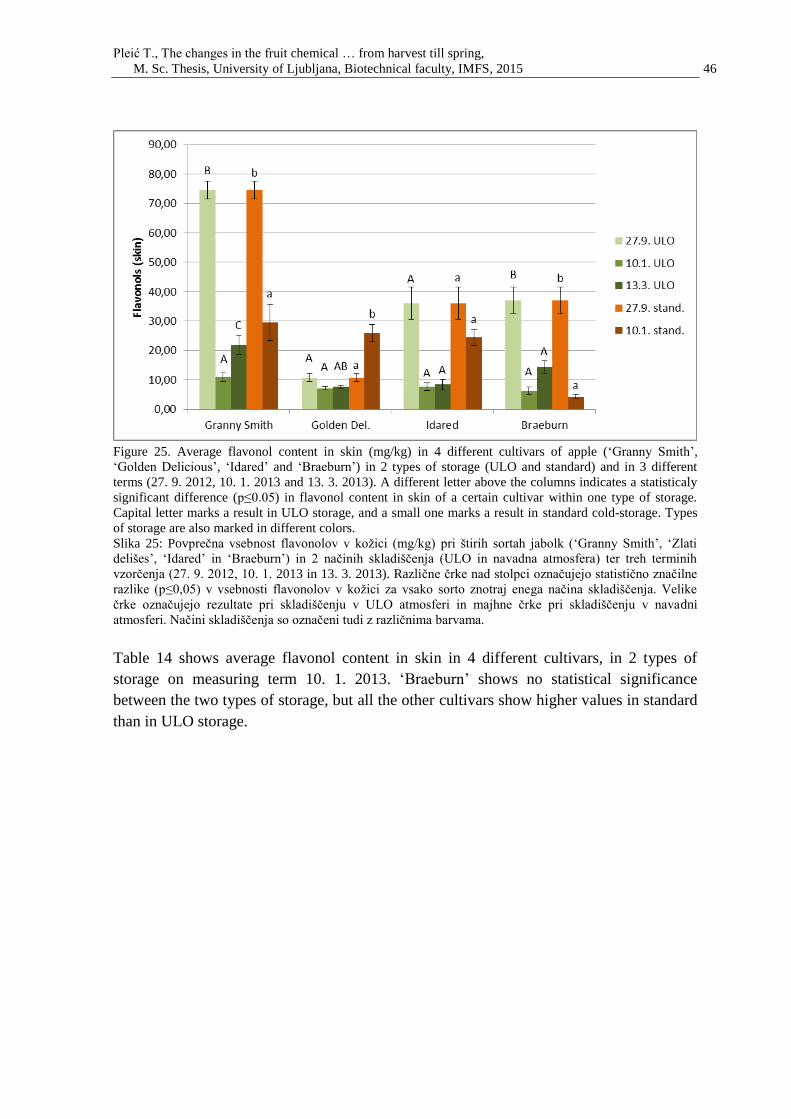
Pleić T., The changes in the fruit chemical … from harvest till spring,
M. Sc. Thesis, University of Ljubljana, Biotechnical faculty, IMFS, 2015 46
Figure 25. Average flavonol content in skin (mg/kg) in 4 different cultivars of apple (‘Granny Smith’,
‘Golden Delicious’, ‘Idared’ and ‘Braeburn’) in 2 types of storage (ULO and standard) and in 3 different
terms (27. 9. 2012, 10. 1. 2013 and 13. 3. 2013). A different letter above the columns indicates a statisticaly
significant difference (p≤0.05) in flavonol content in skin of a certain cultivar within one type of storage.
Capital letter marks a result in ULO storage, and a small one marks a result in standard cold-storage. Types
of storage are also marked in different colors.
Slika 25: Povprečna vsebnost flavonolov v kožici (mg/kg) pri štirih sortah jabolk (‘Granny Smith’, ‘Zlati
delišes’, ‘Idared’ in ‘Braeburn’) in 2 načinih skladiščenja (ULO in navadna atmosfera) ter treh terminih
vzorčenja (27. 9. 2012, 10. 1. 2013 in 13. 3. 2013). Različne črke nad stolpci označujejo statistično značilne
razlike (p≤0,05) v vsebnosti flavonolov v kožici za vsako sorto znotraj enega načina skladiščenja. Velike
črke označujejo rezultate pri skladiščenju v ULO atmosferi in majhne črke pri skladiščenju v navadni
atmosferi. Načini skladiščenja so označeni tudi z različnima barvama.
Table 14 shows average flavonol content in skin in 4 different cultivars, in 2 types of
storage on measuring term 10. 1. 2013. ‘Braeburn’ shows no statistical significance
between the two types of storage, but all the other cultivars show higher values in standard
than in ULO storage.
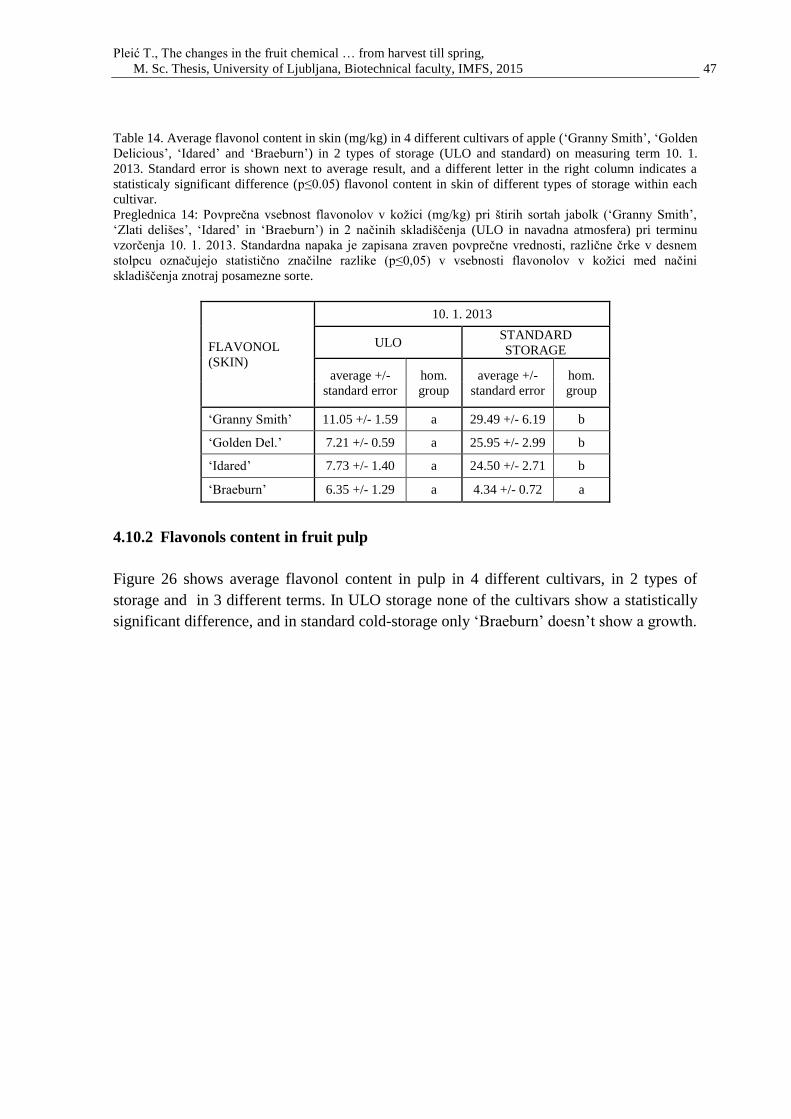
Pleić T., The changes in the fruit chemical … from harvest till spring,
M. Sc. Thesis, University of Ljubljana, Biotechnical faculty, IMFS, 2015 47
Table 14. Average flavonol content in skin (mg/kg) in 4 different cultivars of apple (‘Granny Smith’, ‘Golden
Delicious’, ‘Idared’ and ‘Braeburn’) in 2 types of storage (ULO and standard) on measuring term 10. 1.
2013. Standard error is shown next to average result, and a different letter in the right column indicates a
statisticaly significant difference (p≤0.05) flavonol content in skin of different types of storage within each
cultivar.
Preglednica 14: Povprečna vsebnost flavonolov v kožici (mg/kg) pri štirih sortah jabolk (‘Granny Smith’,
‘Zlati delišes’, ‘Idared’ in ‘Braeburn’) in 2 načinih skladiščenja (ULO in navadna atmosfera) pri terminu
vzorčenja 10. 1. 2013. Standardna napaka je zapisana zraven povprečne vrednosti, različne črke v desnem
stolpcu označujejo statistično značilne razlike (p≤0,05) v vsebnosti flavonolov v kožici med načini
skladiščenja znotraj posamezne sorte.
FLAVONOL
(SKIN)
10. 1. 2013
ULO STANDARD
STORAGE
average +/-
standard error
hom.
group
average +/-
standard error
hom.
group
‘Granny Smith’ 11.05 +/- 1.59 a 29.49 +/- 6.19 b
‘Golden Del.’ 7.21 +/- 0.59 a 25.95 +/- 2.99 b
‘Idared’ 7.73 +/- 1.40 a 24.50 +/- 2.71 b
‘Braeburn’ 6.35 +/- 1.29 a 4.34 +/- 0.72 a
4.10.2 Flavonols content in fruit pulp
Figure 26 shows average flavonol content in pulp in 4 different cultivars, in 2 types of
storage and in 3 different terms. In ULO storage none of the cultivars show a statistically
significant difference, and in standard cold-storage only ‘Braeburn’ doesn’t show a growth.
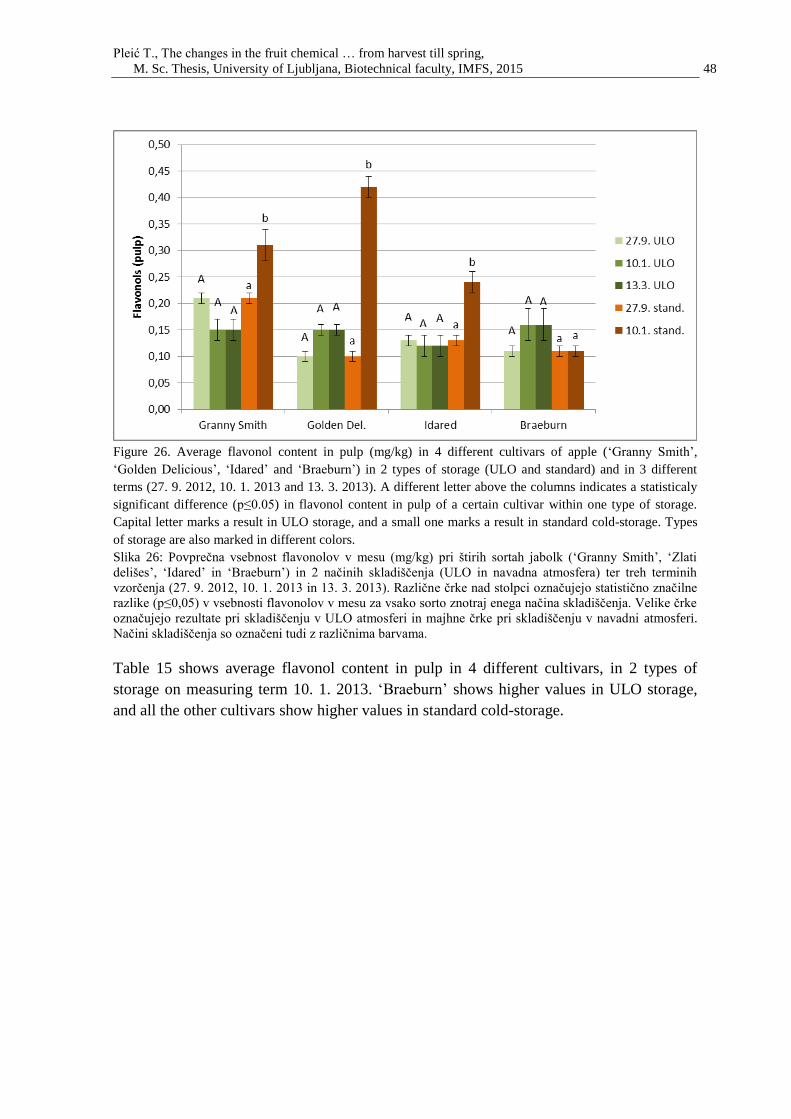
Pleić T., The changes in the fruit chemical … from harvest till spring,
M. Sc. Thesis, University of Ljubljana, Biotechnical faculty, IMFS, 2015 48
Figure 26. Average flavonol content in pulp (mg/kg) in 4 different cultivars of apple (‘Granny Smith’,
‘Golden Delicious’, ‘Idared’ and ‘Braeburn’) in 2 types of storage (ULO and standard) and in 3 different
terms (27. 9. 2012, 10. 1. 2013 and 13. 3. 2013). A different letter above the columns indicates a statisticaly
significant difference (p≤0.05) in flavonol content in pulp of a certain cultivar within one type of storage.
Capital letter marks a result in ULO storage, and a small one marks a result in standard cold-storage. Types
of storage are also marked in different colors.
Slika 26: Povprečna vsebnost flavonolov v mesu (mg/kg) pri štirih sortah jabolk (‘Granny Smith’, ‘Zlati
delišes’, ‘Idared’ in ‘Braeburn’) in 2 načinih skladiščenja (ULO in navadna atmosfera) ter treh terminih
vzorčenja (27. 9. 2012, 10. 1. 2013 in 13. 3. 2013). Različne črke nad stolpci označujejo statistično značilne
razlike (p≤0,05) v vsebnosti flavonolov v mesu za vsako sorto znotraj enega načina skladiščenja. Velike črke
označujejo rezultate pri skladiščenju v ULO atmosferi in majhne črke pri skladiščenju v navadni atmosferi.
Načini skladiščenja so označeni tudi z različnima barvama.
Table 15 shows average flavonol content in pulp in 4 different cultivars, in 2 types of
storage on measuring term 10. 1. 2013. ‘Braeburn’ shows higher values in ULO storage,
and all the other cultivars show higher values in standard cold-storage.
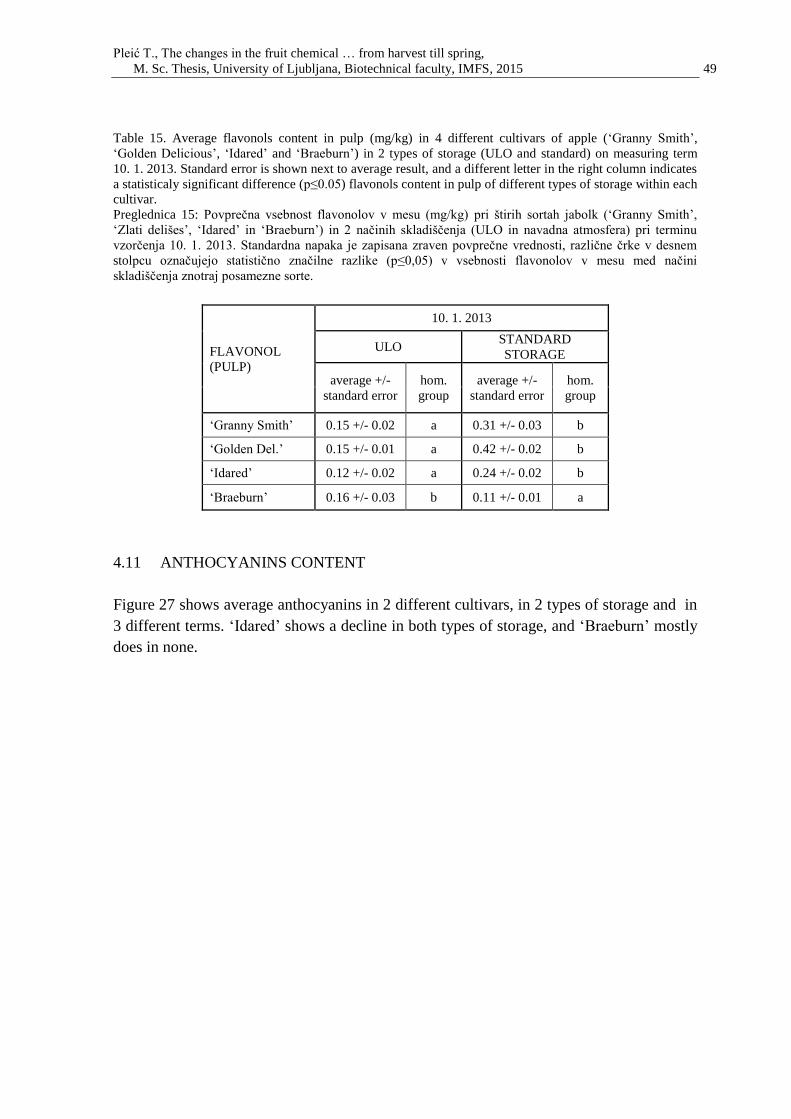
Pleić T., The changes in the fruit chemical … from harvest till spring,
M. Sc. Thesis, University of Ljubljana, Biotechnical faculty, IMFS, 2015 49
Table 15. Average flavonols content in pulp (mg/kg) in 4 different cultivars of apple (‘Granny Smith’,
‘Golden Delicious’, ‘Idared’ and ‘Braeburn’) in 2 types of storage (ULO and standard) on measuring term
10. 1. 2013. Standard error is shown next to average result, and a different letter in the right column indicates
a statisticaly significant difference (p≤0.05) flavonols content in pulp of different types of storage within each
cultivar.
Preglednica 15: Povprečna vsebnost flavonolov v mesu (mg/kg) pri štirih sortah jabolk (‘Granny Smith’,
‘Zlati delišes’, ‘Idared’ in ‘Braeburn’) in 2 načinih skladiščenja (ULO in navadna atmosfera) pri terminu
vzorčenja 10. 1. 2013. Standardna napaka je zapisana zraven povprečne vrednosti, različne črke v desnem
stolpcu označujejo statistično značilne razlike (p≤0,05) v vsebnosti flavonolov v mesu med načini
skladiščenja znotraj posamezne sorte.
FLAVONOL
(PULP)
10. 1. 2013
ULO STANDARD
STORAGE
average +/-
standard error
hom.
group
average +/-
standard error
hom.
group
‘Granny Smith’ 0.15 +/- 0.02 a 0.31 +/- 0.03 b
‘Golden Del.’ 0.15 +/- 0.01 a 0.42 +/- 0.02 b
‘Idared’ 0.12 +/- 0.02 a 0.24 +/- 0.02 b
‘Braeburn’ 0.16 +/- 0.03 b 0.11 +/- 0.01 a
4.11 ANTHOCYANINS CONTENT
Figure 27 shows average anthocyanins in 2 different cultivars, in 2 types of storage and in
3 different terms. ‘Idared’ shows a decline in both types of storage, and ‘Braeburn’ mostly
does in none.
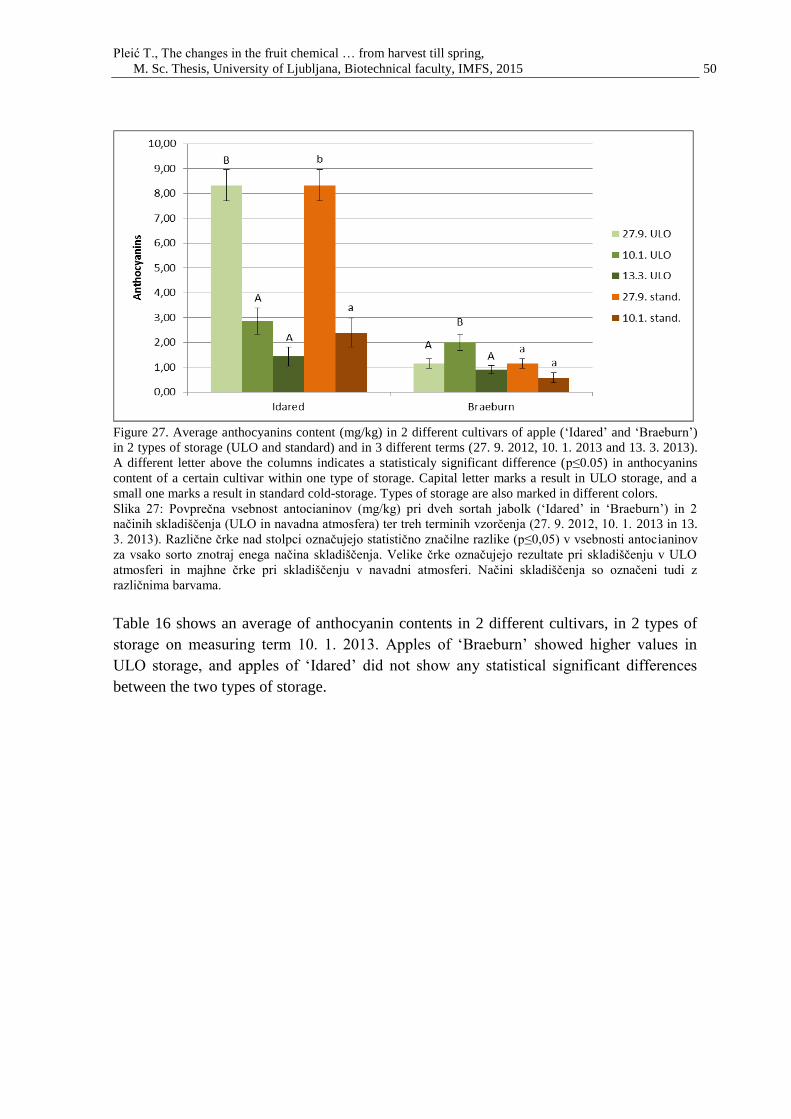
Pleić T., The changes in the fruit chemical … from harvest till spring,
M. Sc. Thesis, University of Ljubljana, Biotechnical faculty, IMFS, 2015 50
Figure 27. Average anthocyanins content (mg/kg) in 2 different cultivars of apple (‘Idared’ and ‘Braeburn’)
in 2 types of storage (ULO and standard) and in 3 different terms (27. 9. 2012, 10. 1. 2013 and 13. 3. 2013).
A different letter above the columns indicates a statisticaly significant difference (p≤0.05) in anthocyanins
content of a certain cultivar within one type of storage. Capital letter marks a result in ULO storage, and a
small one marks a result in standard cold-storage. Types of storage are also marked in different colors.
Slika 27: Povprečna vsebnost antocianinov (mg/kg) pri dveh sortah jabolk (‘Idared’ in ‘Braeburn’) in 2
načinih skladiščenja (ULO in navadna atmosfera) ter treh terminih vzorčenja (27. 9. 2012, 10. 1. 2013 in 13.
3. 2013). Različne črke nad stolpci označujejo statistično značilne razlike (p≤0,05) v vsebnosti antocianinov
za vsako sorto znotraj enega načina skladiščenja. Velike črke označujejo rezultate pri skladiščenju v ULO
atmosferi in majhne črke pri skladiščenju v navadni atmosferi. Načini skladiščenja so označeni tudi z
različnima barvama.
Table 16 shows an average of anthocyanin contents in 2 different cultivars, in 2 types of
storage on measuring term 10. 1. 2013. Apples of ‘Braeburn’ showed higher values in
ULO storage, and apples of ‘Idared’ did not show any statistical significant differences
between the two types of storage.
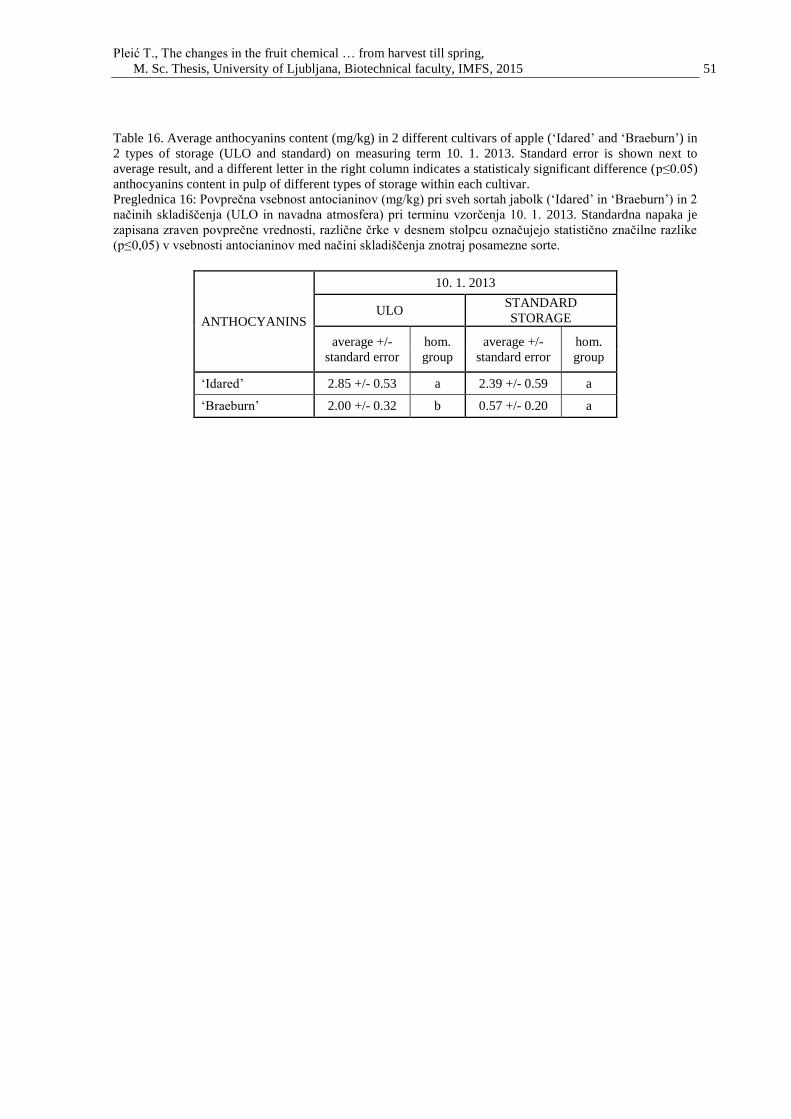
Pleić T., The changes in the fruit chemical … from harvest till spring,
M. Sc. Thesis, University of Ljubljana, Biotechnical faculty, IMFS, 2015 51
Table 16. Average anthocyanins content (mg/kg) in 2 different cultivars of apple (‘Idared’ and ‘Braeburn’) in
2 types of storage (ULO and standard) on measuring term 10. 1. 2013. Standard error is shown next to
average result, and a different letter in the right column indicates a statisticaly significant difference (p≤0.05)
anthocyanins content in pulp of different types of storage within each cultivar.
Preglednica 16: Povprečna vsebnost antocianinov (mg/kg) pri sveh sortah jabolk (‘Idared’ in ‘Braeburn’) in 2
načinih skladiščenja (ULO in navadna atmosfera) pri terminu vzorčenja 10. 1. 2013. Standardna napaka je
zapisana zraven povprečne vrednosti, različne črke v desnem stolpcu označujejo statistično značilne razlike
(p≤0,05) v vsebnosti antocianinov med načini skladiščenja znotraj posamezne sorte.
ANTHOCYANINS
10. 1. 2013
ULO STANDARD
STORAGE
average +/-
standard error
hom.
group
average +/-
standard error
hom.
group
‘Idared’ 2.85 +/- 0.53 a 2.39 +/- 0.59 a
‘Braeburn’ 2.00 +/- 0.32 b 0.57 +/- 0.20 a
Pleić T., The changes in the fruit chemical … from harvest till spring,
M. Sc. Thesis, University of Ljubljana, Biotechnical faculty, IMFS, 2015 52
5 DISSCUSION
5.1 FRUIT FIRMNESS
In fruit firmness we noticed a trend of decline in fruits of almost all cultivars and in both
types of storage. In ULO storage differences between the measurement terms were not as
drastic as those in standard cold-storage. As the values of fruit firmness of apples held in
standard cold-storage of cultivars ‘Idared’ and ‘Golden Delicious’ drop below 5 kg/cm2,
we have to conclude that the fruits were on a border of being marketable.
‘Braeburn’ shows the biggest differences in three measurement terms in ULO storage, and
also in two measurement terms in standard cold-storage.
Only ‘Granny Smith’ shows no statistically significant difference between the initial and
final measurement, and only the middle measurement, after 14 weeks of storage, is
statistically lower than the initial and final measurement. That seems to be a normal
occurrence in cultivar ‘Granny Smith’, according to Watkins et al. (1991).
Also, lower values were observed (in difference between ULO and standard cold-storage)
in standard cold-storage after 14 weeks of storage (measurement term 10. 1. 2013) in all
cultivars except ‘Braeburn’.
Generally, our assumption was confirmed – lower values were achieved in time in both
types of storage. The same results were confirmed by many authors, one of which is Kovač
et al. (2010), where after 30 weeks of storage, flesh firmness of ‘Cripps Pink’ declined
from 8.53 kg/cm2 to 6.78 kg/cm
2.
5.2 SOLUBLE SOLIDS CONTENT
In soluble solids content we noticed a trend of increase in all cultivars, except in ‘Idared’.
Apples of ‘Idared’ showed the lowest value on a measurement made after 15 weeks of
storage, and a statistically insignificant difference between the initial and final measuring
term. As for the measurements of apples held in standard cold-storage, results are mainly
the same, except, again, in ‘Idared’, where we notice a decline. Also growth is not
statistically significant in cultivar ‘Braeburn’ in standard cold-storage.
Regarding the comparison of the two types of storage on a measuring date 10. 1. 2013 (15
weeks after harvest), results show that in cultivars ‘Granny Smith’ and ‘Braeburn’ soluble
solids content was higher in ULO storage, and in cultivars ‘Golden Delicious’ and
‘Braeburn’, it was higher in standard cold-storage.
Pleić T., The changes in the fruit chemical … from harvest till spring,
M. Sc. Thesis, University of Ljubljana, Biotechnical faculty, IMFS, 2015 53
Generally, our assumption was confirmed – higher values of soluble solids with time were
expected. What was not expected was a lower value in ‘Idared’ after 15 weeks of storage,
and a higher one after 24 weeks. Different results were achieved by Kovač et al. (2010),
where they also had 3 terms of measurements (immediately after harvest, after 14 weeks
and after 30 weeks). The lowest value was achieved on the final measurement term, and a
gradual decline with time was noticed.
5.3 TOTAL SUGAR CONTENT
Measurement results of total sugar content were mostly uniform. In fruits of all cultivars in
both types of storage we noticed a decline, statistically significant in all examples except in
‘Granny Smith’ in standard cold-storage.
Results were not so straightforward when comparing two types of storage on measuring
term 10. 1. 2013. ‘Granny Smith’ and ‘Braeburn’ showed higher values in ULO, and
‘Golden Delicious’ and ‘Idared’ in standard cold-storage. The difference was not
statistically significant in cultivar ‘Idared’. Other authors, such as Ackermann at al. (1992)
reported a drop at the beginning of storage and growth until 15th
week of storage, where it
reaches its peek, and stagnation afterwards, until the end of experiment at week 25. The
sudden drop of sugars at the beginning of storage period can be explained by the fact that
the apples were harvested just before the climacteric phase. This phase is characterized by
a period of increased respiration during which the sugars (and acids) are rapidly used as
substrates in the metabolic processes. Once the cell growth period is terminated, the sugar
content does not vary much anymore.
5.4 TOTAL ORGANIC ACIDS CONTENT
In total acids content, there is a visible decline trend in all cultivars and in both types of
storage. We noticed a slight increase in final measurement with cultivars ‘Golden
Delicious’ and ‘Idared’.
As for the differences between the two types of storage on measuring term 10. 1. 2013,
statistically there were no difference in cultivars ‘Idared’ and ‘Braeburn’, while there were
higher values in ULO storage regarding ‘Granny Smith’, and lower regarding ‘Golden
Delicious’. Our results were mostly in accordance with the results of other authors, such as
Napolitano et al. (2004) or Goliáš et al. (2008), where values with the passing time of
storage also decreased.
Pleić T., The changes in the fruit chemical … from harvest till spring,
M. Sc. Thesis, University of Ljubljana, Biotechnical faculty, IMFS, 2015 54
5.5 ASCORBIC ACID CONTENT
In ascorbic acid content, the trend in ‘Granny Smith’ and ‘Golden Delicious’ was, as we
expected - decline in time, both in ULO and standard cold-storage. In cultivar ‘Idared’, in
standard cold-storage there was no statistically significant difference between the data, and
in ULO storage, higher values were measured on the final measurement term. As for the
cultivar ‘Braeburn’, there is a decline (not a statistically significant one) from the initial to
the final measurement, but there were a very high values measured on the second
measuring term, after 14 weeks of storage. As in ‘Idared’, there is no difference between
the terms in standard cold-storage.
As for the differences between the two types of storage on measuring term 10. 1. 2013,
statistically there were none, except for the cultivar ‘Braeburn’, where much higher values
were achieved in ULO than in standard cold-storage.
Our assumptions were generally confirmed, in time, there was a decline in ascorbic acid
content. Similar results were achieved by other authors, such as Kovač et al. (2010), where
with time spent in storage, gradual decline of ascorbic acid was recorded on a cultivar
‘Cripps Pink’. Loss of vitamin C during storage is influenced by storage conditions such as
temperature, storage duration and athmosphere. Kevers at al. (2011) in analysis of
‘Jonagold’ cultivar found that ascorbic acid content is, after 3 months in storage much
higher in ULO storage, while after 6 months they equalize, and the apples held in standard
cold-storage don’t get to be analyzed on final term of measurements as they collapse.
5.6 TOTAL PHENOLIC CONTENT
Total phenolic content was measured in skin and in pulp separately. In TPC measured in
skin, there is a noticeable decline trend in almost all cultivars and in both types of storage.
Cultivar ‘Granny Smith’ shows the lowest value on the second measurement term, after 14
weeks of storage, and no statistically significant difference between the initial and final
measurement. ‘Golden Delicious’ shows no statistical difference between any of the
measuring terms, either in ULO or in standard cold-storage.
The differences between the two types of storage on measuring term 10. 1. 2013 are
statistically significant (higher values in standard cold-storage) in all cultivars, except in
‘Braeburn’, which shows higher values in ULO storage.
In TPC measured in pulp, results are not that straightforward. Cultivar ‘Granny Smith’
shows growth in both types of storage, as does ‘Golden Delicious’. ‘Idared’ shows a
relative growth in ULO, and no change in standard cold-storage, while ‘Braeburn’ shows a
growth in ULO and a decline in standard cold-storage.
Pleić T., The changes in the fruit chemical … from harvest till spring,
M. Sc. Thesis, University of Ljubljana, Biotechnical faculty, IMFS, 2015 55
Comparison of the two types of storage on measuring term 10. 1. 2013. is more simple -
standard cold-storage shows higher values than ULO in all cultivars.
Results obtained by other authors can somewhat confirm our own. Kovač et al. (2010)
found that there is a major drop right after picking, so there is almost no difference
between the values on a measuring term after 14 weeks of storage and the one after 30
weeks. On the other hand, Napolitano et al. (2004) recorded the lowest value right after
picking, the highest value after 3 months of storage and the middle one after 4 months of
storage. Leja et al. (2003) reported an increase after 120 days of storage both in standard
and in ULO storage. Increase was more noticeable in ULO than in standard cold-storage.
The studies available on the phenols composition during storage are mainly focused on the
peels.
The increase of total phenols in apple skin during cold storage could be due to the ethylene
action. This hormone stimulates activity of key enzimes in biosynthesis of phenolic
compounds (Leja et al., 2003).
5.7 HYDROXYCINNAMIC ACIDS
Hydroxycinnamic acid content was measured separately in skin and in pulp. Results in skin
were not so uniform nor we could notice a trend. In ULO values increased with the time
spent in storage in cultivars ‘Granny Smith’, ‘Golden Delicious’ (not statistically
significant) and ‘Braeburn’, while they dropped in ‘Idared’. In standard cold-storage
‘Granny Smith’ and ‘Idared’ show statistically significant difference, ‘Golden Delicious’
shows a growth, and ‘Braeburn’ a decline.
The difference between the two types of storage (10. 1. 2013), shows that there was no
statistically significant difference in cultivar ‘Golden Delicious’, while ‘Granny Smith’ and
‘Idared’ showed a higher value in standard cold-storage and ‘Braeburn’ in ULO storage.
Regarding the results in pulp, results show a growth with time spent in storage, with some
minor fluctuations in ‘Braeburn’. As for the standard cold-storage, ‘Granny Smith’ and
‘Golden Delicious’ show growth, and ‘Idared’ and ‘Braeburn’ show no statistical
difference.
In comparison of the two types of storage (10. 1. 2013), all cultivars, except ‘Braeburn’,
show a higher value in standard cold-storage.
Other authors, such as Golding at al. (2001), where they stored three apple cultivars also in
two types of storage, also didn’t have so straightforward results, but they conclude that
there was almost (if we disregard some minor peeks) no change in hydroxycinnamic acid
Pleić T., The changes in the fruit chemical … from harvest till spring,
M. Sc. Thesis, University of Ljubljana, Biotechnical faculty, IMFS, 2015 56
content in nine months of storage. They connect the high concentrations of cinnamic acid
derivates in peel with the high concentration of chlorogenic acid. The general trends in the
concentrations of chlorogenic acid were similar to those of hydroxycinnamic acid.
5.8 FLAVANOLS
Flavanols content was measured in skin and separately in pulp. Regarding the results
obtained in skin in ULO storage, the flavanol content is higher with time in apples of
‘Granny Smith’ and ‘Golden Delicious’ and decreasing in ‘Idared’ apples. ‘Braeburn’
shows no statistically significant difference.
As for the results in standard cold-storage, ‘Braeburn’ and ‘Granny Smith’ show no
statistical difference, ‘Golden Delicious’ shows a growth and ‘Idared’ shows a decline. The
difference between the two types of storage, observed on the measurement term 10. 1.
2013. shows that there was no statistically significant difference in cultivars ‘Golden
Delicious’ and ‘Braeburn’, while ‘Granny Smith’ and ‘Idared’ show higher values in
standard cold-storage.
Results obtained in pulp in ULO storage show a growing trend, but in cultivar ‘Braeburn’
that growth is not statistically significant. Results are similar in standard cold-storage, but
growth is not statistically significant in cultivar ‘Idared’ and there is a decline present in
cultivar ‘Braeburn’.
Comparing of the two types of storage on measuring term 10. 1. 2013, we noticed higher
values in standard cold-storage in all cultivars except in ‘Braeburn’.
Carbone at al. (2011) measured flavanols immediately after harvest and after three months
of storage both in skin and pulp. Results were somewhat different. In both, ‘Braeburn’ and
‘Golden Delicious’, they measured a decline in flavanols content over time. The same
results were obtained in both skin and pulp. Awad and de Jager (2000) reported almost no
difference between the two types of storage and a decline in flavanols with the time of
storage. Results were the same for the measurements of flavanols in skin.
5.9 DIHYDROCHALCONES
Results obtained in measurements of fruit skin stored both in ULO and standard cold-
storage show a declining trend in all cultivars, but ‘Idared’ and ‘Golden Delicious’ don’t
show a statistically significant difference between the terms in standard cold-storage.
Comparing of the two types of storage on measuring term 10.1.2013, we noticed higher
values in standard cold-storage in all cultivars except in ‘Braeburn’, which shows no
statistically significant difference.
Pleić T., The changes in the fruit chemical … from harvest till spring,
M. Sc. Thesis, University of Ljubljana, Biotechnical faculty, IMFS, 2015 57
Results obtained in measurements of fruit pulp stored both in ULO and standard cold-
storage show a growth trend in all cultivars, but ‘Braeburn’ doesn’t show a statistically
significant difference between the terms in standard cold-storage.
Comparing of the two types of storage on measuring term 10. 1. 2013, we noticed higher
values in standard cold-storage in all cultivars except in ‘Braeburn’, which shows no
statistically significant difference.
Other authors, such as Golding at al. (2001) where they stored three apple cultivars also in
two types of storage, reviewed that the only chalcone identified in the peel of apples was
phloridzin, and it was present at in relatively low concentrations. Levels of phloridzin in
‘Granny Smith’ were practicaly identical throughout the measurement period of nine
months.
5.10 FLAVONOLS
Flavonols content was measured in skin and separately in pulp. Regarding the results
obtained in skin in ULO storage, we can notice a decline in all cultivars, except for
‘Golden Delicious’, where the decline is not statistically significant. In standard cold-
storage, decline is present in all cultivars except in ‘Golden Delicious’, where we can see a
growth.
In comparison of the two types of storage, we noticed higher values in standard cold-
storage in all cultivars except for ‘Braeburn’.
Measurements of flavonols in pulp were somewhat different. Results in ULO storage show
no statistical difference in either of the cultivars, but in standard cold-storage we noticed a
growth in all cultivars except in ‘Braeburn’.
As for the comparison of the two types of storage, we noticed higher values in standard
cold-storage in all cultivars except in ‘Braeburn’.
Patterns of changes in flavonols content during storage are variable. Piretti et al. (1994)
found that they generally decreased in ‘Granny Smith’ towards the end of storage, both in
air and controlled atmosphere. In contrast, Kolesnik et al. (1977) found that the
concentration of flavonols increased during storage. On the other hand Ju et al. (1996)
reported a slow decrease in 4-5 months of storage. This slower decrease in flavonoids
might be credited to the limitation of simple phenols to initiate the oxidation reaction.
Pleić T., The changes in the fruit chemical … from harvest till spring,
M. Sc. Thesis, University of Ljubljana, Biotechnical faculty, IMFS, 2015 58
5.11 ANTHOCYANINS
In anthocyanins content in ULO storage, in cultivar ‘Idared’ we noticed a decline, while in
‘Braeburn’ the measurement made on 10. 1. 2013 showed the highest value, and the initial
and final data measurement were lower and there is almost no statistically significant
difference between them. In both cultivars there is a decline in standard cold-storage, but in
‘Braeburn’ it’s not statistically significant.
As for the comparison of the two types of storage, ‘Idared’ shows no statistical difference
and ‘Braeburn’ shows higher value in ULO storage.
Other authors are displaying somewhat contrary results. Kolesnik et al. (1977) found that
concentration of anthocyanins increased during storage, while Ju at al. (1996) reported no
changes. Leja et al. (2003) reported that content of anthocyanins decreased in fruits stored
in standard cold-storage, while in controlled athmosphere their level did not change.
Pleić T., The changes in the fruit chemical … from harvest till spring,
M. Sc. Thesis, University of Ljubljana, Biotechnical faculty, IMFS, 2015 59
6 CONCLUSIONS
In this experiment we studied the amount of soluble solids, fruit firmness, ascorbic acid,
TSC, total acids content, TPC, hydroxycinnamic acid, flavanols, dihydrochalcones,
flavonols and anthocyanins in four apple cultivars, in two types of storage and in three
different measurement terms: 27th
September 2012, 10th
January 2013 and 13th
March
2013. Fruits held in standard cold-storage did not stay fresh until the measurement term in
March.
In comparison of the measurement terms we found that, generally, there are statistically
great differences between them. Moreover, we found that there are greater differences
between the first measuring term (27. 9. 2012) and the second one (10. 1. 2013), than
between the second and the third one (13. 3. 2013)
Taking the data collected with this experiments into consideration, we can conclude that,
with proper storing and handling, apple can be sold (with almost equal quality and
characteristics) troughout the sales period – from one harvest to the next one.
As for the comparison of the two types of storage on a measuring term 10. 1. 2013. (15
weeks in storage) we concluded that one of the characteristics of apple, its firmness of
fruit, was generally higher in ULO storage than in standard one.
The other measurement parameters were higher in standard cold-storage than in ULO. We
assume that this can be partly explained by a greater loss of water from fruits held in
standard cold-storage than in ULO, so the concentration of all its components was greater
in fruits held in standard cold-storage.
While comparing the measurement terms in one type of storage as well as between both
types of storage, the changes can be probably explained by an increased respiration and
ethylene action.
Values of measurements of soluble solids content, TPC in pulp, hydroxycinammic acids,
flavanols, dihydrochalcones in pulp and flavonols in pulp (in standard cold-storage) were
higher at the end of storage, and those of fruit firmness, ascorbic acid, total sugar content,
total acids content, TPC in skin, dihydrochalcones in skin and flavonoles in skin were
lower. Concentrations of flavonols in pulp and anthocyanins did not change during the
time spent in storage.
Regardless of the component that we measure or observe, or the fact that the trend is
declining or growing, or that all the other cultivars had higher results in ULO, cultivar
‘Braeburn’ almost always opposed. The biggest surprise was that, when comparing the two
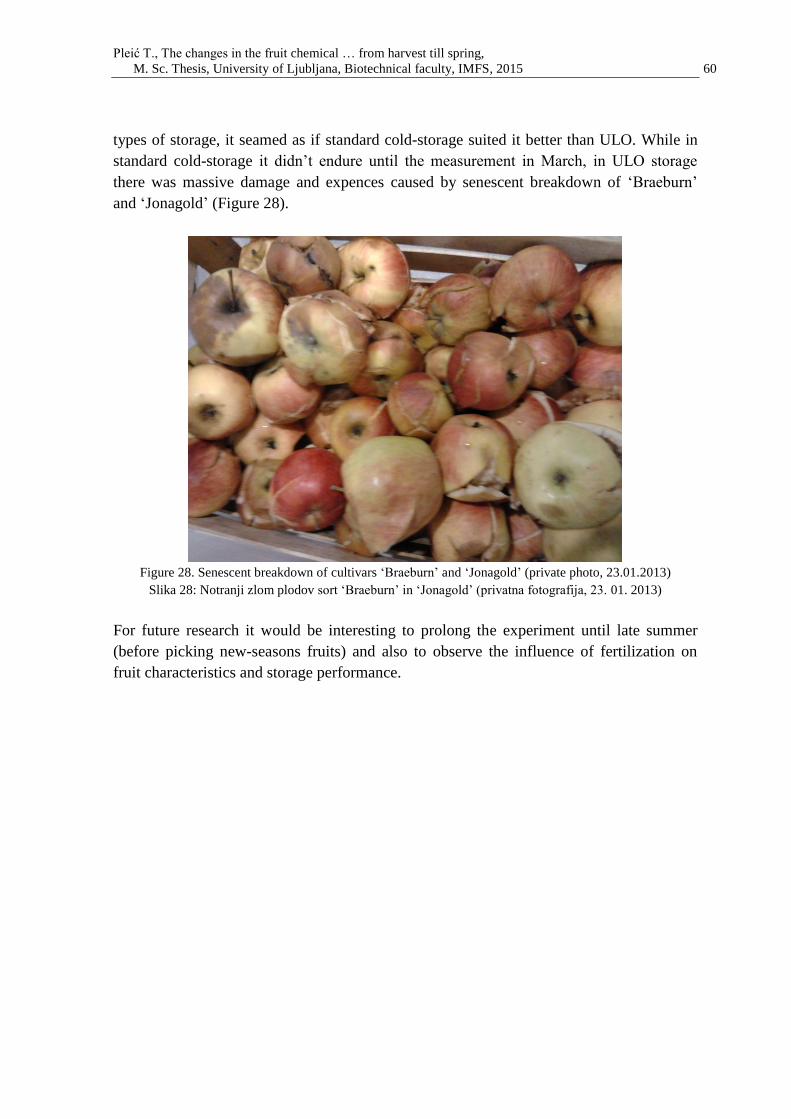
Pleić T., The changes in the fruit chemical … from harvest till spring,
M. Sc. Thesis, University of Ljubljana, Biotechnical faculty, IMFS, 2015 60
types of storage, it seamed as if standard cold-storage suited it better than ULO. While in
standard cold-storage it didn’t endure until the measurement in March, in ULO storage
there was massive damage and expences caused by senescent breakdown of ‘Braeburn’
and ‘Jonagold’ (Figure 28).
Figure 28. Senescent breakdown of cultivars ‘Braeburn’ and ‘Jonagold’ (private photo, 23.01.2013)
Slika 28: Notranji zlom plodov sort ‘Braeburn’ in ‘Jonagold’ (privatna fotografija, 23. 01. 2013)
For future research it would be interesting to prolong the experiment until late summer
(before picking new-seasons fruits) and also to observe the influence of fertilization on
fruit characteristics and storage performance.
Pleić T., The changes in the fruit chemical … from harvest till spring,
M. Sc. Thesis, University of Ljubljana, Biotechnical faculty, IMFS, 2015 61
7 SUMMARY (POVZETEK)
7.1 SUMMARY
In an apple orcard situated in Katoličko Selišće in central Croatia, in year 2012 we picked
our plant material - fruits of four different apple cultivars: ‘Granny Smith’, ‘Golden
Delicious’, ‘Idared’ and ‘Braeburn’. First measurements were made immediately after
picking, on 27th
September 2012. Part of the fruits was stored in standard cold-storage, and
the rest in ULO chamber. The second measurement was made on 10th
January 2013, after
15 weeks in storage, and the third one on 13th
March 2013, after 24 weeks in storage.
Frutis held in standard cold-storage didn’t make it to measurements in March.
With every cultivar, on each date and on each storage type we had 5 repetitions, each
contained of two apples. Analysis of soluble solids, fruit firmness, total acid content,
ascorbic acid, hydroxycinnamic acid, total sugar content, total phenolic content, flavanols,
dihydrochalcones, flavonoles and anthocyanins was made in laboratory of Chair for fruit
growing, viticulture and vegetable growing, Biotechnical Faculty, University of Ljubljana.
In all fruits fruit firmness was measured with a penetrometer on opposite cheeks, soluble
solids with a digital refractometer, and parts of fruits were than frozen for following
analysis. By usage of HPLC, after chemical and physical preparation of samples, the
amount of total acid content, ascorbic acid, hydroxycinnamic acid, total sugar content, total
phenolic content, flavanols, dihydrochalcones, flavonoles and anthocyanins were
determined. For the determination of TPC we used Folin-Ciocaleteu reagent.
We concluded that the amount af almost all components notably changes between the first
and the second measurement terms. The changes were minor between the second and third
measuring terms.
When comparing the two types of storage on a measuring term 10. 1. 2013, we can assume
that apples held in standard cold-storage have lost greater amounts of water and so have
had higher concentrations of all the components. That can also occur due to higher
metabolic activity.
The only exception to the rule in both comparison of measurement terms and types of
storage was cultivar ‘Braeburn’, which later, in ULO storage, showed significant signs of
senescent breakdown.
On the basis of our results we have concluded that both of our hypothesis can be
confirmed. Time spent in storage and the type of storage have influence on fruit firmness,
content of soluble solids and secondary metabolites.
Pleić T., The changes in the fruit chemical … from harvest till spring,
M. Sc. Thesis, University of Ljubljana, Biotechnical faculty, IMFS, 2015 62
7.2 POVZETEK
UVOD
Na zahtevnem evropskem in svetovnem trgu jabolk skoraj ni prostora za napake v
kakovosti in sestavi ploda. Pridelek mora biti brezhiben. Tako kot so določene zahteve pri
pridelavi, so določene tudi pri shranjevanju in skladiščenju. Jabolka je treba obrati, ko so
optimalno zrela. Samo tista najboljše kakovosti se hranijo dalj časa. Njihovo skladiščenje
oblikuje precejšen del končne cene, zato mora biti čim ugodnejše in čim učinkovitejše.
Skladiščenje mora zaščititi pridelek pred staranjem in drugimi spremembami v sestavi, ki
spadajo zraven.
Poleg dejstva, da sadje, ki smo ga skladiščili standardno, ni zdržalo do meritev v marcu, ni
niti približno imelo tako dobrih rezultatov kot tisto, ki smo ga skladiščili v ULO atmosferi.
Glede na to, da smo to predvideli, saj je bila to naša hipoteza, je bil namen raziskave
dokazati, kakšne so dejanske prednosti skladiščenja v ULO atmosferi, kaj izgubimo pri
sadju, če ga po obiranju ne obdelamo pravilno, in kako se jabolko spremeni proti koncu
sezone – katere lastnosti in vrednosti se izgubijo pri tako dolgem skladiščenju.
PREGLED LITERATURE
Jablana (Malus domestica Borkh.)
Jabolko je vrsta sadja, ki ga upravičeno imenujemo kralj sadja. Sadeži zorijo od zgodnjega
poletja do zime, kar ne preseneča, saj poznamo več kot 10.000 sort jabolk.
Jablane sodijo v družino rožnic Rosaceae. Je naslednica Malus sieversii, čeprav sta tudi
Malus orientalis in Malus sylvestris vplivali na njen razvoj.
Jablane rastejo po vsem svetu. Po pridelavi je vodilna Kitajska z 39.682.618 t, sledijo pa ji
Združene države Amerike, Turčija in Poljska. Hrvaška je s 128.211 t na
oseminštiridesetem mestu (FAOSTAT, 2013).
Okoljske zahteve jablane
Jablana je celinska sadna vrsta in skladno s tem so tudi njene okoljske zahteve. Za
zanesljivejšo oceno okoljskih razmer nekaterih območij za uspešno gojenje jabolk je
potrebna obsežna raziskava podnebnih razmer – jablane potrebujejo povprečno letno
temperaturo 8–12 °C, zmerno do relativno visoko zračno vlažnost (60–75 %), sneg pri
mrzlih zimskih temperaturah itd. Tla morajo biti globoka, peščeno-ilovnate sestave, rahlo
Pleić T., The changes in the fruit chemical … from harvest till spring,
M. Sc. Thesis, University of Ljubljana, Biotechnical faculty, IMFS, 2015 63
kisla – pH 5,5, vendar ne z več kot 5 % CaCO3, pomemben pa je tudi relief – nadmorska
višina mora biti 120–600 m, naklon okoli 4 % itd.
Primarni metaboliti
Spojine v rastlinah lahko delimo v dve glavni skupini: primarni in sekundarni metaboliti.
Primarni metaboliti nastanejo in sodelujejo v primarnih presnovnih procesih, kot sta
dihanje in fotosinteza. Sintetizirajo se v celici, kjer so nepogrešljivi za njeno rast. Primarni
metaboliti vključujejo molekule sladkorjev, aminokislin, beljakovin, polisaharidov itd.,
izmed katerih večino štejemo za »gradnike« in izvor energije.
Sekundarni metaboliti
Rastline sintetizirajo ogromno organskih spojin, ki se tradicionalno uvrščajo med primarne
in sekundarne metabolite, čeprav je točna meja med obema skupinama v določenih
primerih nekoliko nejasna. Obstaja veliko opredelitev obeh vrst metabolizma in večina
izmed njih opisuje primarne metabolite kot spojine, ki imajo pomembno vlogo pri
fotosintezi, dihanju, rasti in razvoju (vključujejo preproste sladkorje, maščobe, nukleotide,
aminokisline in organske kisline itd.), medtem ko sekundarni metaboliti nimajo neposredne
funkcije pri rasti in vzdrževanju celic, vendar pa imajo pomembne ekološke in zaščitne
funkcije pred različnimi oblikami stresa. Čeprav so sekundarne spojine običajni del
metabolizma organizma, se pogosto proizvajajo v posebnih celicah ali tkivu in so navadno
kompleksnejše kot primarne spojine.
Rastline proizvajajo sekundarne metabolite kot odziv na škodljive vremenske razmere ali v
določenih fazah razvoja. Dolgo časa so bili spregledani, zdaj pa njihova funkcija v
rastlinah privablja pozornost, ker nakazuje, da imajo nekateri ključno vlogo pri zaščiti
rastlin pred rastlinojedci in mikrobnimi vnetji ter kot atraktanti za opraševalce in živali, ki
širijo semena itd.
Glede na njihov biosintetični izvor rastlinske sekundarne metabolite lahko razdelimo v tri
glavne skupine: fenolne in terpenoidne spojine ter spojine, ki vsebujejo dušik.
MATERIAL IN METODE DELA
Sadovnjak
Jabolka so se obirala v sadovnjaku jeseni 2012. Sadovnjak je v osrednji Hrvaški,
natančneje v Katoličkem Selišću v občini Velika Ludina, na nadmorski višini 132–128 m
ter koordinatah 45° 37' 32'' severne geografske širine in 16° 36' 56'' vzhodne geografske
dolžine. Sadovnjak je bil posajen med letoma 2008 in 2011. Tam raste 13 sort jabolk na 18
Pleić T., The changes in the fruit chemical … from harvest till spring,
M. Sc. Thesis, University of Ljubljana, Biotechnical faculty, IMFS, 2015 64
hektarjih modernega sadovnjaka jablan. Drevesa so razporejena v 410 vrstah, večinoma
dolgih 150 m. Vrste so posajene v smeri sever–jug, medtem ko je razdalja med vrstami 320
cm in med drevesi 60–100 cm, odvisno od sorte. Celotni nasad je pokrit z mrežami proti
toči in ima namakanje. Lastnik sadovnjaka je podjetje Fructus, d. o. o., iz Velike Ludine.
Metode dela
Analiza trdote mesa plodov ter vsebnosti fenolov, kislin, vitamina C, sladkorja in suhe
snovi v jabolkih je bila opravljena na Katedri za sadjarstvo, vinogradništvo in vrtnarstvo,
Oddelek za agronomijo Biotehniške fakultete v Ljubljani. Vse štiri sorte smo shranjevali
na 2 načina (z ULO in navadno atmosfero) in opravili 3 meritve (27. Septembra 2012, 10.
januarja in 13. marca 2013) v 5 ponovitvah (10 jabolk). Vsak plod smo razdelila na 3 dele:
samo kožica, samo meso ter mešanica kožice in mesa skupaj.
Suha snov in trdota mesa sta se merili isti dan vzorčenja. Kožica je bila pripravljena za
meritve askorbinske kisline in antocianov, medtem ko se je skupna vsebnost fenolov
(TPC), hidroksicinaminske kisline, flavan-3-olov, dihidrohalkonov in flavonolov merila
ločeno tako iz kožice kot mesa. Skupno vsebnost kislin in sladkorjev smo izmerili v
mešanici kožice in mesa.
REZULTATI IN RAZPRAVA
Primerjava ob različnih datumih meritev
Pri meritvah trdote mesa smo čez čas dosegli manjše vrednosti pri obeh načinih
skladiščenja. Iste rezultate so potrdili mnogi avtorji, eni izmed njih so Napolitano in sod.
(2004). Samo sorta 'Granny Smith' ni pokazala statistično značilne razlike med prvimi in
končnimi meritvami. Naše domneve so se v splošnem potrdile, čez čas se je zmanjšala tudi
vsebnost askorbinske kisline. Podobne rezultate so dosegli tudi drugi avtorji, na primer
Kovač in sod. (2010).
Rezultati meritev skupne vsebnosti sladkorjev so bili večinoma enotni. Pri vseh sortah in
obeh načinih skladiščenja smo opazili zmanjšanje, statistično značilno je bilo pri vseh
sortah razen sorte 'Granny Smith' pri skladiščenju v navadni atmosferi.
Pri meritvah skupne vsebnosti fenolov v kožici smo opazili pomembno zmanjšanje pri
skoraj vseh sortah in obeh načinih skladiščenja, medtem ko rezultati meritev v mesu niso
bili tako jasni. Obstaja veliko nasprotujočih si rezultatov drugih avtorjev, kot so Kovač in
sod. (2010), Napolitano in sod. (2004) ter Leja in sod. (2003).
Pleić T., The changes in the fruit chemical … from harvest till spring,
M. Sc. Thesis, University of Ljubljana, Biotechnical faculty, IMFS, 2015 65
Pri hidroksicinaminski kislini so meritve v mesu čez čas pokazale rast pri skladiščenju z
manjšimi nihanji pri standardnem skladiščenju v navadni atmosferi.
Pridobljeni rezultati flavan-3-olov v mesu pri skladiščenju v ULO atmosferi kažejo trend
rasti, medtem ko Carbone in sod. (2011) poročajo o njegovem zmanjšanju.
Rezultati meritev mesa pri skladiščenju v ULO in navadni atmosferi kažejo trend rasti pri
vseh sortah, medtem ko sorta 'Braeburn' ne kaže statistično značilnih razlik med datumi
meritev pri skladiščenju v navadni atmosferi.
Primerjava različnih tipov skladiščenja
Manjše vrednosti so se pokazale pri meritvah trdote mesa po 14 tednih skladiščenju v
navadni atmosferi (datum meritev 10. 1. 2013) pri vseh sortah, razen pri sorti 'Braeburn'.
Pri merjenju vsebnosti askorbinske kisline ni bilo statistično značilnih razlik, razen pri sorti
'Braeburn', kjer so bile dosežene bistveno večje vrednosti pri skladiščenju v ULO atmosferi
kot navadni atmosferi.
Pri meritvah skupne vsebnosti fenolov v kožici so vse sorte razen sorte 'Braeburn' pokazale
večje vrednosti pri skladiščenju v navadni atmosferi. Enako se je pokazalo pri meritvah
skupne vsebnosti fenolov v mesu.
Pri vsebnosti hidroksicmetne kisline so vse sorte razen sorte 'Braeburn' imele večjo
vsebnost pri skladiščenju v navadni atmosferi.
Vsebnosti za flavan-3-ole v mesu so bile večje pri skladiščenju v navadni atmosferi pri
vseh sortah, razen pri sorti 'Braeburn'.
Večje vrednosti so bile izmerjene pri skladiščenju v navadni atmosferi v mesu kot v kožici.
Vse sorte, razen sorte 'Braeburn', kažejo večje vsebnosti flavonolov pri skladiščenju v
navadni atmosferi.
Pleić T., The changes in the fruit chemical … from harvest till spring,
M. Sc. Thesis, University of Ljubljana, Biotechnical faculty, IMFS, 2015 66
ZAKLJUČKI
Sadje, ki smo ga skladiščili v navadni atmosferi, ni ostalo sveže do meritev marca 2013.
Pri primerjanju datumov meritev smo ugotovili, da so na splošno med njimi bistvene
razlike. Še več, odkrili smo večje razlike med prvim datumom (27. 9.) in drugim datumom
meritev (10. 1.) kot pa med drugim datumom (10. 1.) in tretjim datumom meritev (13. 3.).
Glede na zbrane podatke lahko zaključimo, da se ob pravilnem shranjevanju in ravnanju
jabolka lahko prodajajo (s skoraj enako kakovostjo in značilnostmi) skozi celotno prodajno
obdobje.
Glede primerjave obeh načinih skladiščenja na datum merjenja 10. 1. 2013 (15 tednov
skladiščenja) lahko zaključimo, da je ena izmed značilnosti jabolk, to je trdota mesa, na
splošno večja pri skladiščenju v ULO atmosferi kot pri skladiščenju v navadni atmosferi.
Druge značilnosti so pokazale večje vsebnosti pri skladiščenju v navadni atmosferi kot pri
skladiščenju v ULO atmosferi. Zaključimo lahko, da je to rezultat večje izgube vode iz
ploda, ko se le ta skladišči v navadni atmosferi, kot pa, če se skladišči v ULO atmosferi,
zato je vsebnost vseh merjenih parametrov večja v plodovih, ki jih skladiščimo v navadni
atmosferi.
Ne glede na parametre, ki smo jih merili ali opazovali, ali se le-ti zmanjšujejo ali rastejo,
ali da so vse druge sorte imele večje vsebnosti v ULO atmosferi, je sorta 'Braeburn' skoraj
vedno izstopala. Največje presenečenje je bilo, ko smo primerjali oba načina skladiščenja
in ugotovili, da tej sorti skladiščenju v navadni atmosferi bolj ustreza kot skladiščenju v
ULO atmosferi. Medtem ko pri skladiščenju v navadni atmosferi sorta ni zdržala do
končnih meritev marca 2013, pa smo imeli pri skladiščenju v ULO atmosferi veliko škodo
in stroške zaradi notranjega zloma plodov sorte 'Braeburn'.
Pleić T., The changes in the fruit chemical … from harvest till spring,
M. Sc. Thesis, University of Ljubljana, Biotechnical faculty, IMFS, 2015 67
8 REFERENCES
Ackerman J., Fischer M., Amadò R. 1992. Changes in sugars, acids, and amino acids
during ripening and storage of apples (Cv. Glockenapfel). Journal of Agricultural
Food and Chemistry, 40: 1131-1134
Adamič F. 1963. Jugoslovenska pomologija. Jabuka. Beograd, Zadružna knjiga: 219 p.
Awad M. A., de Jager A. 2000. Flavonoid and chlorogenic acid concentrations in skin of
'Jonagold' and 'Elstar' apples during and after regular and ultra low oxygen storage.
Postharvest Biology and Technology, 20: 15-24
Boyer J., Liu R. H. 2004. Apple phytochemicals and their health benefits. Nutrition
Journal, 3: 1-15
Carbone K., Giannini B., Picchi V., Lo Scalzo R., Cecchini F. 2011. Phenolic composition
and free radical scavening activity of different apple cultivars in relation to the
cultivar, tissue type and storage. Food Chemistry, 127: 493-500
Chemafaces. 2010. Skeletal formula of hydroxycinnamic acid.
http://www.chemfaces.com/natural/trans-4-Hydroxycinnamic-acid-CFN98794.html
(10. 09. 2010)
Colarič M., Štampar F., Hudina M. 2007. Content levels of various fruit metabolites in the
‘Conference’ pear response to branch bending. Scientia Horticulturae, 113: 261-266
Corradini D., Eksteen E., Eksteen R., Schoenmakers P., Miller N. 2011. Handbook of
HPLC. CRC Press: 1008 p.
DHMZ. 2014. Metorological and hydrological service of Croatia. Review of the year.
http://klima.hr/ocjene_arhiva.php, (12. 08. 2014)
FAOSTAT. 2013.
http://faostat3.fao.org/download/Q/QC/E (10. 09. 2010)
Giovanonni J. J. 2004. Genetic regulation of fruit development and ripening. The Plant
Cell, 16: 170-180
Golding J. B., McGlasson W. B., Wyllie S. G., Leach D. L. 2001. Fate of apple peel
phenolics during cool storage. Journal of Agricultural Food and Chemistry, 49:
2283-2289
Pleić T., The changes in the fruit chemical … from harvest till spring,
M. Sc. Thesis, University of Ljubljana, Biotechnical faculty, IMFS, 2015 68
Goliáš J., Mýlová A., Němcová A. 2008. A comparison of apple cultivars regarding
ethylene production and physic-chemical changes during cold storage. Horticultural
Science, 35: 137-144
Gould K., Davies K. M., Winefield C. 2008. Anthocyanins: biosynthesis, functions and
applications. New York, Springer Science & Business Media: 336 p.
Harker F. R., Kupferman E. M., Marin A. B., Gunson F. A., Triggs, C. M. 2008 Eating
quality standards for apples based on consumer preferences Postharvest Biology
and Technology, 50: 70-78
Harker F.R., Maindonald J.H., Jackson P.J. 1996. Penetrometer measurement of apple and
kiwifruit firmness: operator and instrument differences. Journal of the American
Society for Horticultural Science, 121, 5: 927-936
Hess D. 2012. Plant Phisiology. New York, Springer Science & Business Media: 334 p.
Hoehn E., Gasser F., Guggenbuhl B., Kunsch U. 2003. Efficacy of instrumental
measurements for determination of minimum requirements of firmness, soluble
solids, and acidity of several apple cultivars in comparison to consumer.
Postharvest Biology and Technology, 27: 27–37
Ju Z., Yuan Y., Liu C., Zhan S., Wang M. 1996. Relationships among simple phenol,
flavonoid and anthocyanin in apple fruit peel at harvest and scald susceptibility.
Postharvest Biology and Technology, 8: 83-93
Kader A. A. 2002. Fruits in the global market. In Knee, M. (Ed.) Fruit quality and its
biological basis. Sheffield, UK, Sheffield Academic Press: 1-16
Kevers C., Pincmail J., Tabart J., Defraigne J., Dommes J. 2011. Influence of cultivar,
harvest time, storage conditions, and peeling on the antioxidant capacity and
phenolic and ascorbic acid contents of apples and pears. Journal of Agricultural,
Food and Chemistry, 59: 6165-6171
Kingston C.M. 1992. Maturity indices for apple and pear. Horticultiral Review, 13: 407-
432
Kolesnik A., Elizarova L. G., Starodubsteva T. V., Afanasyeva V. S., Erokhina T. S. 1977.
Changes in polyphenols guring storage of fruits and vegetables. Prikladnaya
Biokhimiya i Microbiologiya, 13: 333-339
Pleić T., The changes in the fruit chemical … from harvest till spring,
M. Sc. Thesis, University of Ljubljana, Biotechnical faculty, IMFS, 2015 69
Kovač A., Skendrović Babojelić M., Pavičić N., Voća S., Voća N., Dobričević N., Jagatić
A. M., Šindrak Z. 2010. Influence of harvest time and storage duration on ‘Cripps
Pink’ apple cultivar (Malus x domestica Borkh) quality parameters. Journal of
Food, 8: 1-6
Krpina I. 2004. Voćarstvo. Zagreb, Nakladni zavod Globus: 448 p.
Leja M., Mareczek A., Ben J. 2003. Antioxidant properties of two apple cultivars during
long-term storage. Food Chemistry 80: 303-307
Liu Y., Che F., Wang L., Meng R., Zhang X., Zhao Z. 2013. Fruit coloration and
anthocyanin biosynthesis after bag removal in non-red and red apples (Malus x
domestica Borkh.). Molecules, 18: 1549-1863
Macheix J., Fleuriet A. 1990. Fruit phenolics. CRC Press: 392 p.
Mars Cocoa Science.2010. Skeletal structure of the epicatechin.
http://www.marscocoascience.com/cocoa-science/chemistry-of-cocoa-flavanols
(10. 09. 2010)
Mikulič-Petkovšek M., Schmitzer V., Slatnar A., Todorović B., Veberič R., Štampar F.,
Ivančić A. 2014. Investigation of anthocyanin profile of four elderberry species and
interspecific hybrids. Journal of Agricultural and Food Chemistry, 62: 5573-5580
Mišić P. D. 1978. Jabuka. Beograd, Nolit: 133 p.
Napolitano A., Cascone A., Graziani G., Ferracane R., Scalfi L., di Vaio C., Ritieni A.,
Fogliano V. 2004. Influence of cultivar and storage on the polyphenol composition
of apple flesh. Journal of Agricultural Food and Chemistry, 52, 21: 6526-6531
Novljan M. 2013. Difference in content of primary metabolites in apple (Malus domestica
Borkh.) fruitlets regarding their position in the inflorescence. Master thesis.
Ljubljana, Biotehniška fakulteta, Univerza v Ljubljani: 88 p.
Pearson D. A., Tan C. H., German J. B., Davies P. A., Gershwin M. A. 1999. Phenolic
contents of apple inhibit human low density lipoprotein oxidation. Life Science, 66:
1913-1920
Piretti M. V., Gallerani G., Pratella G. C. 1994. Polyphenol fate and superficial scald in
apple. Postharvest Biology and Technology, 4: 213-224
Pleić T., The changes in the fruit chemical … from harvest till spring,
M. Sc. Thesis, University of Ljubljana, Biotechnical faculty, IMFS, 2015 70
Renneberg R., Demain A. L. 2008. Biotechnology for beginners. London, Elsevier: 349 p.
Saei A., Tustin D. S., Zamani Z., Talaie A., Hall A. J. 2011. Cropping effects on the loss of
apple fruit firmness during storage: The relationship between texture retention and
fruit dry matter concentration. Scientia Horticulturae, 130: 256-265
Scalbert A., Williamson G. 2000. Diatery intake and bioviability of polyphenols. Journal
of Nutrition, 130: 2073-2085
Seigler D. S. 2012. Plant secondary metabolism. New York, Springer Science & Business
Media: 759 p.
Sigma Aldrich. 2010. Skeletal formula of chalcone.
http://www.sigmaaldrich.com/catalog/product/aldrich/136123?lang=en®ion=H
R (10. 09. 2010)
Spanos G. A., Wrolstad R. E. 1992. Phenolics of apple, pear, and white grape juices and
their changes with processing and storage – A review. Journal of Agricultural Food
and Chemistry, 40, 9: 1478-1487
Štampar F., Lešnik M., Veberič R., Solar A., Koron D., Usenik V., Hudina M., Osterc G.
2009. Sadjarstvo. Ljubljana, Kmečki glas: 416 p.
Thompson A. K. 2010. Controlled atmosphere storage of fruits and vegetables.
Wallingford, CABI: 272 p.
Travers S. 2013. Dry matter and fruit quality: Manipulation in the field and evaluation with
NIR spectroscopy. PhD thesis. Department of Food Science, Aarslev University,
Denmark: 40 p.
Veberič R. 2010. Bioactive compounds in fruit plants. Ljubljana, Biotehniška fakulteta,
Univerza v Ljubljani: 65 p.
Veberič R., Schmitzer V., Mikulič-Petkovšek M., Štampar F. 2010. Impact of Shelf life on
Content of Primary and Secondary Metabolites in Apple (Malus domestica Borkh.).
Journal of Food Science, 75, 9: 461-468
Veberič R., Štampar F., Schmitzer V., Cunja V., Zupan A., Koron D., Mikulič-Petkovšek
M. 2014. Changes in the content of anthocyanins and other compounds in
blackberry fruits due to freezing and long-term frozen storage. Journal of
Agricultural Food and Chemistry, 62, 2: 6926-6935
Pleić T., The changes in the fruit chemical … from harvest till spring,
M. Sc. Thesis, University of Ljubljana, Biotechnical faculty, IMFS, 2015 71
Ventura M., de Jager A., de Putter H., Roelofs F. P. M. M. 1998. Non-destructive
determination of soluble solids I napple fruit by near infrared spectroscopy (NIRS).
Postharvest Biology and Technology, 14: 21-27
Watkins C. B., McMath K. L., Bowen J.H., Brennan C. J., McMillan S. L., Billing D. P.
1991. Controlled athmosphere storage of ‘Granny Smith’ apples. New Zealand
Journal of Crop and Horticultural Science, 19: 61-68
World apple and pear organisation, 2015. European crop forecast.
http://www.wapa-association.org/asp/article_2.asp?doc_id=610 (06. 08. 2010)
Wu, J., Gao, H., Zhao, L., Liao, X., Chen, F., Wang, Z., Hu, X. 2007. Chemical
compositional characterization of some apple cultivars. Food Chemistry, 103: 88-
93.
Zadravec P., Veberič R., Štampar F., Schmitzer V., Eler K. 2014. Fruit growth patterns of
four apple cultivars using nonlinear growth models. Europaean journal of
Horticultural Science, 79: 52-59
Zupan A. 2012. Content of primary and secondary metabolites in black currant (Ribes
nigrum L.) at different ripening time. Master thesis. Ljubljana, Biotehniška
fakulteta, Univerza v Ljubljani: 49 p.
Zupan A., Mikulič-Petkovšek M., Slatnar A., Štampar F., Veberič R. 2014. Individual
phenolic response and peroxidase activity in peel of differently sun-exposed apples
in the period favorable for sunburn occurrence. Journal of plant Physiology, 171:
1706-1712

Pleić T., The changes in the fruit chemical … from harvest till spring,
M. Sc. Thesis, University of Ljubljana, Biotechnical faculty, IMFS, 2015
ACKNOWLEDGMENT
For all professional and expert advices, instructions and assistance in creation of this
Master thesis I would like to thank my mentor, prof. dr. Robert VEBERIČ.
For auditing and additions to my thesis I would like to thank the members of the
commission, especially prof. dr. Metka HUDINA.
For all the assistance in laboratory and with statistical analysis I would like to thank dr.
Ana SLATNAR, mrs. Vlasta CUNJA and Anka ZUPAN.
For all the help with picking and storing the fruit samples I would like to thank the
employees of companies Fructus and Abundan, especially Ana, Dario and Robert.
For all the help with the preparation of samples in laboratory I would like to thank my two
friends Antonija and Marina.
For the mutual support and understanding I would like to thank my international
colleagues, especially Špela, Giorgia, Kristýna, Matúš and Dalibor.
For all the help and support during college I would like to thank my family, especially my
parents and my husband.
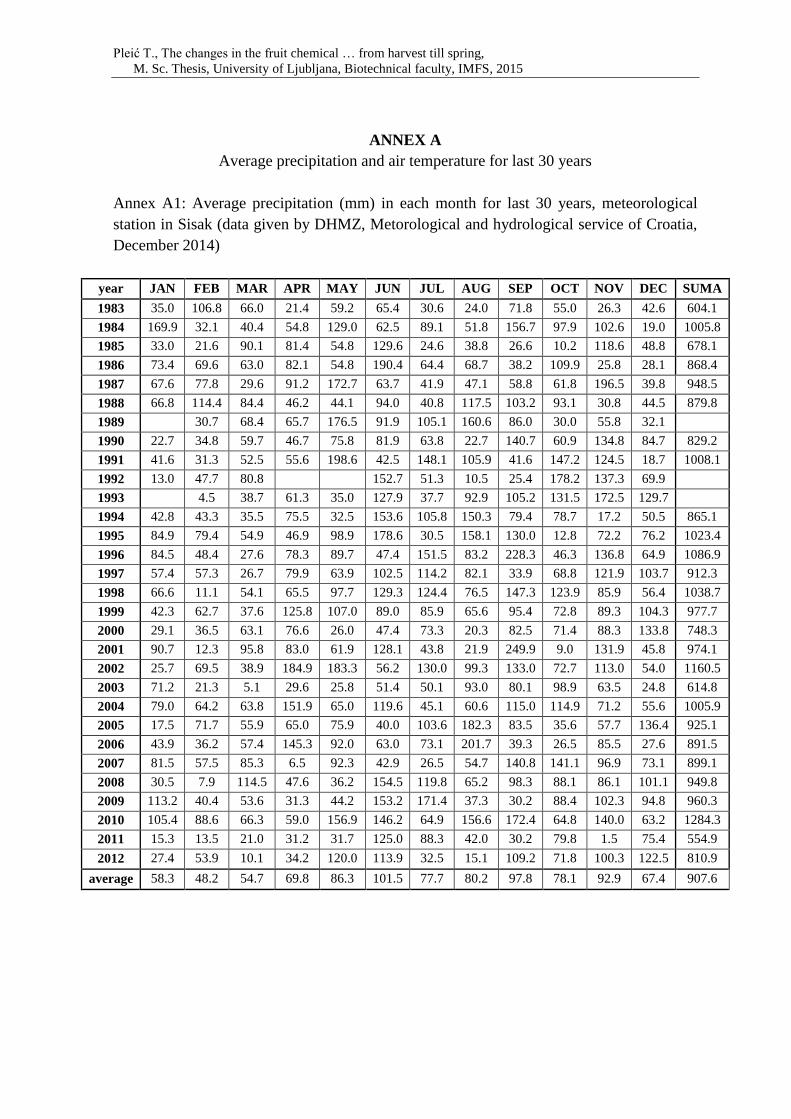
Pleić T., The changes in the fruit chemical … from harvest till spring,
M. Sc. Thesis, University of Ljubljana, Biotechnical faculty, IMFS, 2015
ANNEX A
Average precipitation and air temperature for last 30 years
Annex A1: Average precipitation (mm) in each month for last 30 years, meteorological
station in Sisak (data given by DHMZ, Metorological and hydrological service of Croatia,
December 2014)
year JAN FEB MAR APR MAY JUN JUL AUG SEP OCT NOV DEC SUMA
1983 35.0 106.8 66.0 21.4 59.2 65.4 30.6 24.0 71.8 55.0 26.3 42.6 604.1
1984 169.9 32.1 40.4 54.8 129.0 62.5 89.1 51.8 156.7 97.9 102.6 19.0 1005.8
1985 33.0 21.6 90.1 81.4 54.8 129.6 24.6 38.8 26.6 10.2 118.6 48.8 678.1
1986 73.4 69.6 63.0 82.1 54.8 190.4 64.4 68.7 38.2 109.9 25.8 28.1 868.4
1987 67.6 77.8 29.6 91.2 172.7 63.7 41.9 47.1 58.8 61.8 196.5 39.8 948.5
1988 66.8 114.4 84.4 46.2 44.1 94.0 40.8 117.5 103.2 93.1 30.8 44.5 879.8
1989 30.7 68.4 65.7 176.5 91.9 105.1 160.6 86.0 30.0 55.8 32.1
1990 22.7 34.8 59.7 46.7 75.8 81.9 63.8 22.7 140.7 60.9 134.8 84.7 829.2
1991 41.6 31.3 52.5 55.6 198.6 42.5 148.1 105.9 41.6 147.2 124.5 18.7 1008.1
1992 13.0 47.7 80.8 152.7 51.3 10.5 25.4 178.2 137.3 69.9
1993 4.5 38.7 61.3 35.0 127.9 37.7 92.9 105.2 131.5 172.5 129.7
1994 42.8 43.3 35.5 75.5 32.5 153.6 105.8 150.3 79.4 78.7 17.2 50.5 865.1
1995 84.9 79.4 54.9 46.9 98.9 178.6 30.5 158.1 130.0 12.8 72.2 76.2 1023.4
1996 84.5 48.4 27.6 78.3 89.7 47.4 151.5 83.2 228.3 46.3 136.8 64.9 1086.9
1997 57.4 57.3 26.7 79.9 63.9 102.5 114.2 82.1 33.9 68.8 121.9 103.7 912.3
1998 66.6 11.1 54.1 65.5 97.7 129.3 124.4 76.5 147.3 123.9 85.9 56.4 1038.7
1999 42.3 62.7 37.6 125.8 107.0 89.0 85.9 65.6 95.4 72.8 89.3 104.3 977.7
2000 29.1 36.5 63.1 76.6 26.0 47.4 73.3 20.3 82.5 71.4 88.3 133.8 748.3
2001 90.7 12.3 95.8 83.0 61.9 128.1 43.8 21.9 249.9 9.0 131.9 45.8 974.1
2002 25.7 69.5 38.9 184.9 183.3 56.2 130.0 99.3 133.0 72.7 113.0 54.0 1160.5
2003 71.2 21.3 5.1 29.6 25.8 51.4 50.1 93.0 80.1 98.9 63.5 24.8 614.8
2004 79.0 64.2 63.8 151.9 65.0 119.6 45.1 60.6 115.0 114.9 71.2 55.6 1005.9
2005 17.5 71.7 55.9 65.0 75.9 40.0 103.6 182.3 83.5 35.6 57.7 136.4 925.1
2006 43.9 36.2 57.4 145.3 92.0 63.0 73.1 201.7 39.3 26.5 85.5 27.6 891.5
2007 81.5 57.5 85.3 6.5 92.3 42.9 26.5 54.7 140.8 141.1 96.9 73.1 899.1
2008 30.5 7.9 114.5 47.6 36.2 154.5 119.8 65.2 98.3 88.1 86.1 101.1 949.8
2009 113.2 40.4 53.6 31.3 44.2 153.2 171.4 37.3 30.2 88.4 102.3 94.8 960.3
2010 105.4 88.6 66.3 59.0 156.9 146.2 64.9 156.6 172.4 64.8 140.0 63.2 1284.3
2011 15.3 13.5 21.0 31.2 31.7 125.0 88.3 42.0 30.2 79.8 1.5 75.4 554.9
2012 27.4 53.9 10.1 34.2 120.0 113.9 32.5 15.1 109.2 71.8 100.3 122.5 810.9
average 58.3 48.2 54.7 69.8 86.3 101.5 77.7 80.2 97.8 78.1 92.9 67.4 907.6
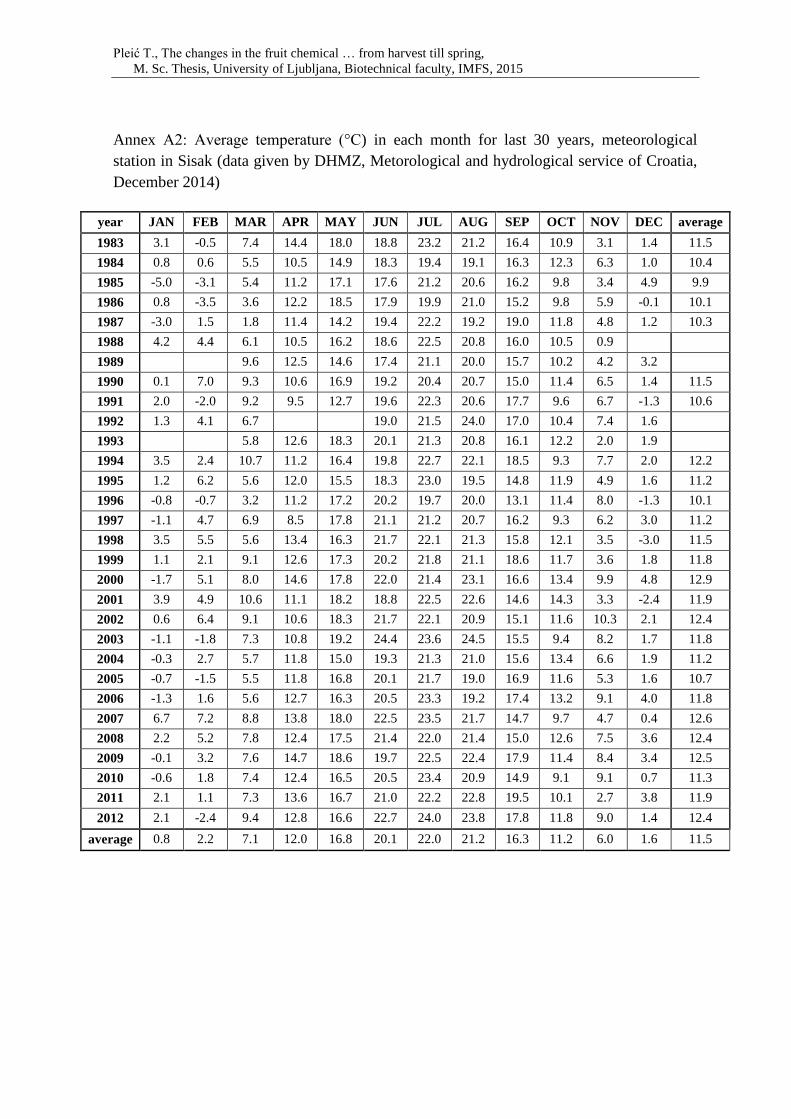
Pleić T., The changes in the fruit chemical … from harvest till spring,
M. Sc. Thesis, University of Ljubljana, Biotechnical faculty, IMFS, 2015
Annex A2: Average temperature (°C) in each month for last 30 years, meteorological
station in Sisak (data given by DHMZ, Metorological and hydrological service of Croatia,
December 2014)
year JAN FEB MAR APR MAY JUN JUL AUG SEP OCT NOV DEC average
1983 3.1 -0.5 7.4 14.4 18.0 18.8 23.2 21.2 16.4 10.9 3.1 1.4 11.5
1984 0.8 0.6 5.5 10.5 14.9 18.3 19.4 19.1 16.3 12.3 6.3 1.0 10.4
1985 -5.0 -3.1 5.4 11.2 17.1 17.6 21.2 20.6 16.2 9.8 3.4 4.9 9.9
1986 0.8 -3.5 3.6 12.2 18.5 17.9 19.9 21.0 15.2 9.8 5.9 -0.1 10.1
1987 -3.0 1.5 1.8 11.4 14.2 19.4 22.2 19.2 19.0 11.8 4.8 1.2 10.3
1988 4.2 4.4 6.1 10.5 16.2 18.6 22.5 20.8 16.0 10.5 0.9
1989 9.6 12.5 14.6 17.4 21.1 20.0 15.7 10.2 4.2 3.2
1990 0.1 7.0 9.3 10.6 16.9 19.2 20.4 20.7 15.0 11.4 6.5 1.4 11.5
1991 2.0 -2.0 9.2 9.5 12.7 19.6 22.3 20.6 17.7 9.6 6.7 -1.3 10.6
1992 1.3 4.1 6.7 19.0 21.5 24.0 17.0 10.4 7.4 1.6
1993 5.8 12.6 18.3 20.1 21.3 20.8 16.1 12.2 2.0 1.9
1994 3.5 2.4 10.7 11.2 16.4 19.8 22.7 22.1 18.5 9.3 7.7 2.0 12.2
1995 1.2 6.2 5.6 12.0 15.5 18.3 23.0 19.5 14.8 11.9 4.9 1.6 11.2
1996 -0.8 -0.7 3.2 11.2 17.2 20.2 19.7 20.0 13.1 11.4 8.0 -1.3 10.1
1997 -1.1 4.7 6.9 8.5 17.8 21.1 21.2 20.7 16.2 9.3 6.2 3.0 11.2
1998 3.5 5.5 5.6 13.4 16.3 21.7 22.1 21.3 15.8 12.1 3.5 -3.0 11.5
1999 1.1 2.1 9.1 12.6 17.3 20.2 21.8 21.1 18.6 11.7 3.6 1.8 11.8
2000 -1.7 5.1 8.0 14.6 17.8 22.0 21.4 23.1 16.6 13.4 9.9 4.8 12.9
2001 3.9 4.9 10.6 11.1 18.2 18.8 22.5 22.6 14.6 14.3 3.3 -2.4 11.9
2002 0.6 6.4 9.1 10.6 18.3 21.7 22.1 20.9 15.1 11.6 10.3 2.1 12.4
2003 -1.1 -1.8 7.3 10.8 19.2 24.4 23.6 24.5 15.5 9.4 8.2 1.7 11.8
2004 -0.3 2.7 5.7 11.8 15.0 19.3 21.3 21.0 15.6 13.4 6.6 1.9 11.2
2005 -0.7 -1.5 5.5 11.8 16.8 20.1 21.7 19.0 16.9 11.6 5.3 1.6 10.7
2006 -1.3 1.6 5.6 12.7 16.3 20.5 23.3 19.2 17.4 13.2 9.1 4.0 11.8
2007 6.7 7.2 8.8 13.8 18.0 22.5 23.5 21.7 14.7 9.7 4.7 0.4 12.6
2008 2.2 5.2 7.8 12.4 17.5 21.4 22.0 21.4 15.0 12.6 7.5 3.6 12.4
2009 -0.1 3.2 7.6 14.7 18.6 19.7 22.5 22.4 17.9 11.4 8.4 3.4 12.5
2010 -0.6 1.8 7.4 12.4 16.5 20.5 23.4 20.9 14.9 9.1 9.1 0.7 11.3
2011 2.1 1.1 7.3 13.6 16.7 21.0 22.2 22.8 19.5 10.1 2.7 3.8 11.9
2012 2.1 -2.4 9.4 12.8 16.6 22.7 24.0 23.8 17.8 11.8 9.0 1.4 12.4
average 0.8 2.2 7.1 12.0 16.8 20.1 22.0 21.2 16.3 11.2 6.0 1.6 11.5