Embed Size (px)
Citation preview

The Central Role of Agriculture in Myanmar’s Economic DevelopmentDuncan Boughton, Professor, International Development, MSU
Ben Belton, Assistant Professor, International Development, MSUSteven Radelet, Georgetown University
Yezin Agricultural University, December 12, 2016

Outline
• Introducing each other• Why is economic growth important?• Why is agriculture important for growth?• What is “agricultural transformation”?• An example from Myanmar• YAU graduates as “change agents”• Why wearing a motorbike helmet is essential to
your contribution to Myanmar’s development

Getting to know each other…..• Do your parents farm?• Do you think of yourself as a future leader in the
workplace or community?• Do you know what job or occupation you want to
pursue when you graduate from YAU?• How many of you want to be farmers?• Do you have a plan to achieve that job or occupation?• Do you where a helmet when you are on a motorcycle
off campus (on a public road or highway)?• Do you where a helmet when you are on a motorcycle
on campus?

Why is Economic Growth Important?• Development is all about creating opportunities, and building
people’s capacities to take advantage of those opportunities. Economic growth helps countries make progress in both of these areas.
• Economic growth is both an increase in production, and an increase in incomes. Economic growth means more jobs and higher income for individuals, families, and society.
• Economic growth is perhaps the single most powerful engine for broad-based development progress: growth leads to gains in health, education, poverty reduction and other dimensions of development.
• These relationships go both ways.• The increases in income allow families and societies to eat more
and better food, put more of their children in school, keep their families healthy, build better schools and clinics, invest in roads and communications facilities, and build more prosperous lives.
4

Why is Sustainable Growth so Important?• Growth must be sustained over years, decades, and
generations in order to translate into broad-based development.
• Even modest growth – if sustained – can be a powerful engine for change. For example, with growth of 3% per capita, average income doubles every 23 years (basically every generation).
• Short spurts of growth (say, from exploiting natural resources for a few years) do not lead to long-term development.
• For growth to be sustained:• Governments must create stability and legitimacy, and invest in
infrastructure and in people.• Individuals and businesses must believe that their own
investments will pay off.• Natural resources must be managed to last a long time.
5

Why is Inclusive Growth so important?• What is inclusive growth? Inclusive growth is economic growth
that includes the majority of a country’s population. Inclusive growth creates new income opportunities for as many people as possible, especially the poor, minority groups, women, and isolated rural populations.
• Typically accompanied by broad-based (inclusive) investments in education, health, and infrastructure, alongside improvements in inclusive governance (with wide participation of, and consultation with, all groups in society).
• Why is inclusive growth important?• Creates an atmosphere of justice and fairness. • Builds the political legitimacy of the government.• Supports peace and reconciliation.• Encourages investment and cooperation, which helps to sustain growth
over time.• Inclusive growth is especially important in conflict and post-
conflict environments. 6

Why is Agriculture Central to Economic Development?
• Almost all developing countries that have achieved sustained and inclusive growth began with a strong focus on agriculture.
• Growth in agriculture:• Creates higher incomes for the rural poor (therefore, it is
highly inclusive).• Reduces poverty rapidly.• Produces more food and related products for the entire
country.• Eventually, allows some workers to shift from agriculture to
processing and manufacturing.• As agricultural productivity grows, fewer workers can
produce more food, so some workers shift to processing, manufacturing, services, other activities.
• A developing economy cannot diversify into other activities without first increasing agricultural productivity.
7

Agriculture and Comparative Advantage
• Agriculture makes particular sense in countries with abundant fertile land and water (like Myanmar).
• These attributes give Myanmar a comparative advantage in agriculture: that is, it has a big advantage in producing agricultural goods compared to other goods (e.g., industrial goods).
• Export of agricultural products can be an important source of foreign exchange to pay for imported goods that Myanmar does not have a comparative advantage in (e.g., aeroplanes)
• Countries that have ignored this kind of comparative advantage (ignored agriculture) and tried to move too quickly to into industry have failed.
• Countries that have focused on their comparative advantage and used it fully have typically experienced more sustained and inclusive growth.
8
As growth proceeds, production shifts to manufacturing and services• Known as the “structural transformation.”• The share of agriculture in total production (GDP) falls, while
the share of manufacturing (including processing) and services rise.
• But in successful countries, during this process, agricultural production continues to grow.
• When the share of agriculture in GDP is falling, it does not mean that agriculture production is falling. It just means that manufacturing (and services) are growing faster.
• For example, in Thailand, since 1970:• Agriculture as a share of GDP has fallen from 25% to 10%.• At the same time, agricultural production has more than tripled.• (Note that processing of agricultural goods is part of
manufacturing).
9

Thailand: Agriculture and Manufacturing (shares of GDP)
10
0
5
10
15
20
25
30
35
1970
1972
1974
1976
1978
1980
1982
1984
1986
1988
1990
1992
1994
1996
1998
2000
2002
2004
2006
2008
2010
2012
2014
Shar
e of
GDP
(%)
Agriculture, value added Manufacturing, value added
Note: Manufacturing includes agricultural processing and certain agricultural-related businesses

Thailand: Agricultural Production (total value added, constant prices)
11
0
50
100
150
200
250
300
350
400
1970
1972
1974
1976
1978
1980
1982
1984
1986
1988
1990
1992
1994
1996
1998
2000
2002
2004
2006
2008
2010
2012
2014
cons
tant
pric
es, 1
970
= 10
0
Agriculture, value added (1970=100)

What is agricultural transformation?
YESTERDAY TOMORROW ??

Transformation pathways….From subsistence farmer to entrepreneur (business person)• Access to reliable, high value markets
• Physical access (roads, secure storage, cold storage)• Quality requirements, SPS and traceability• Agro-processing to avoid perishable produce gluts
• Access to irrigation and land improvement• Access to information on market prices and production
techniques• Information on profitable enterprises and management practices
• Aquaculture, fruits and vegetables, livestock and dairy,
• Access to production inputs and services• Market and ecology suited varieties or breeds• Fertilizers, pesticides, feeds, veterinary services and mechanization
• Access to finance• Seasonal inputs, marketing credit and equipment

Agricultural transformation drives transformation of the rural economy?• Rural transformation refers to the process of growth
and diversification of the rural economy, resulting in higher incomes from both farm and off-farm employment
• A large share of increased smallholder farm incomes are typically spent in the local economy, spurring growth in the rural non-farm economy (RNFE)
• The stronger the synergies between growth in the farm and growth in the non-farm components over time the more sustainable the transformation
• Public policies and investments have the potential to foster or hinder this virtual growth cycle -> hence need to know what is actually happening on the ground

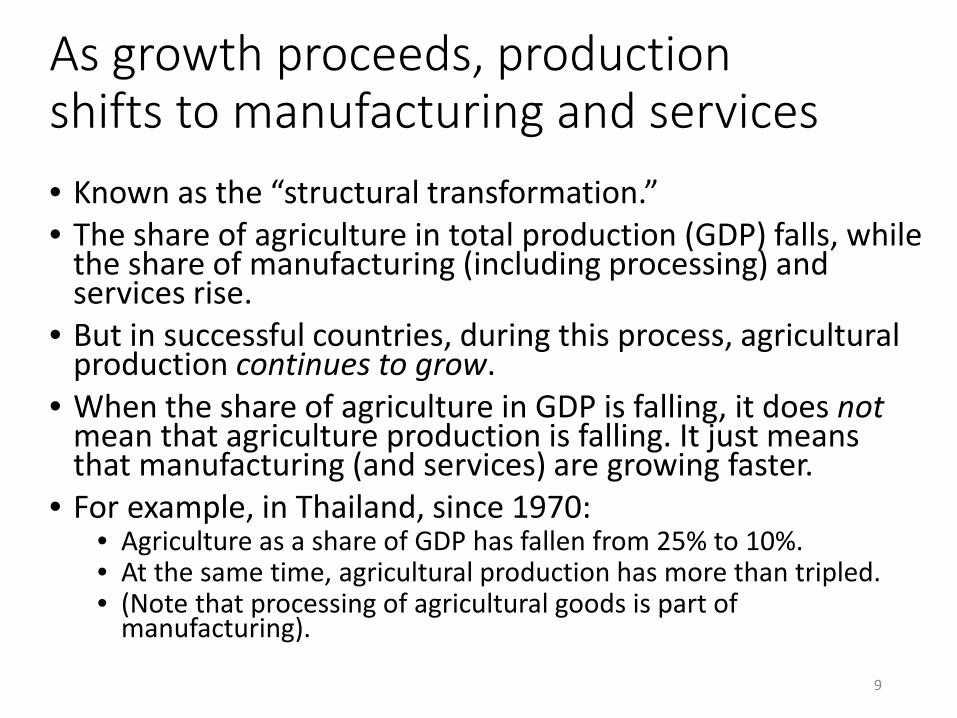
Myanmar Aquaculture Agriculture Survey (MAAS)
Methodology• Purposively selected 2 clusters of ‘aquaculture’ and
‘agriculture’ village tracts for comparison, based on spatial concentration of ponds and prevailing crop farming systems
• Randomly selected ‘enumerations areas’ and households to represent entire populations of both clusters (including non-farm households)
• Total sample = 1102 HHs in 40 village tracts, representing 37,390 HH
Survey locations
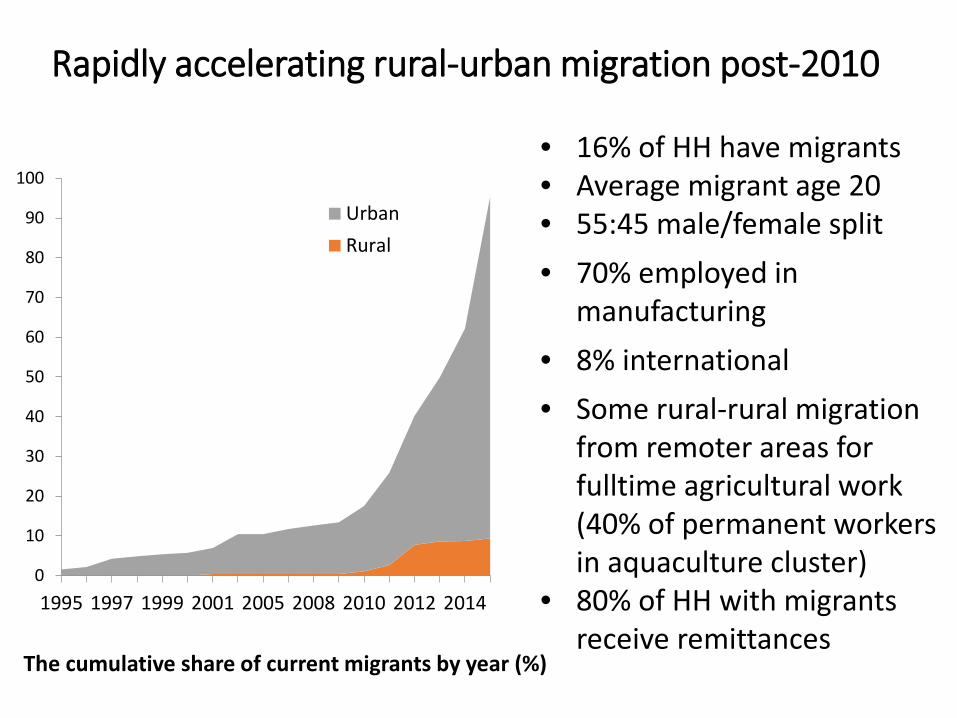
Rapidly accelerating rural-urban migration post-2010
0
10
20
30
40
50
60
70
80
90
100
1995 1997 1999 2001 2005 2008 2010 2012 2014
UrbanRural
The cumulative share of current migrants by year (%)
• 16% of HH have migrants• Average migrant age 20• 55:45 male/female split• 70% employed in
manufacturing• 8% international• Some rural-rural migration
from remoter areas for fulltime agricultural work (40% of permanent workers in aquaculture cluster)
• 80% of HH with migrants receive remittances

Real wage increases
+8%
+32%
0
500
1000
1500
2000
2500
3000
3500
4000
2011 2013 2016
Real
dai
ly w
ages
(MM
K)
Average real daily wage for male agricultural labour(2011-2013)
Main impact of migration is on rural labour supply and wage rates

Labor shortages & rising wages driving mechanization
0
1000
2000
3000
4000
5000
600019
9019
9119
9219
9319
9419
9519
9619
9719
9819
9920
0020
0120
0220
0320
0420
0520
0620
0720
0820
0920
1020
1120
1220
1320
1420
15
Cum
ulat
ive
num
ber o
f mac
hine
s pu
rcha
sed Surface-water Pump
2WTThresher4WTCombine
Cumulative purchases of agricultural machinery, 1990-2015

Adoption supported by rental services
0102030405060708090
100
2006 2011 2016
% o
f hou
seho
lds
usin
g m
achi
nery
Own Rented in Other
2006 2011 2016
Own Rented in Other
Machine Use for Land Preparation
Machine Use for Harvesting

• Access to credit improving due to MFIs and cooperatives
• Average rates of interest paid on informal and semi-formal loans fell from 72% in 2011 to 60% in 2016.
• Very few output-tied agricultural loans
Share of villages with credit access by source (2011-2016)
0
10
20
30
40
50
60
70
80
% o
f vill
ages
with
acc
ess
2011 2016
Sources of credit diversifying

Rapid growth of non-farm enterprise
+229
%
+52%
+46%
+36%
-45%
-56%
0
5
10
15
20M
otor
tran
spor
t
Shop
s
Pers
onal
serv
ices
Food
serv
ices
Craf
ts
Agric
ultu
ral
trad
e
Mea
n bu
sines
ses/
villa
ge
2011 2016
• From 2011-2016, motor vehicles replaced boats as main mode of transport: average journey times to fell 20-30%.
• Increasing mobility: 44% of workers in fulltime employment travel beyond local area but remain resident
• Village stores have attained almost total ubiquity (96% of villages)
Change in average number of businesses per village, 2011-2016

Off-farm employment plays a major role in livelihoods for households in all income and landholdings groups
5 11 1523
3114
12
18
21
22
81 7767
5747
0%
10%
20%
30%
40%
50%
60%
70%
80%
90%
100%
Q1 Q2 Q3 Q4 Q5
Shar
e of
hou
seho
lds
Farm Only Farm & Off-farmOff-farm Only
Household participation in farm and off-farm employment

Agriculture directly provides >70% of primary employment (plus more in related value chains)
Non-farm employment, and off-farm agricultural work, contribute similar shares of primary employment
Agriculture still the major source of primary employment
Own farm, 42%
Agri-labor, 29%
Non-farm occupations,
29%
Share of primary employment, by type

18 2019
30
16
37
0
10
20
30
40
Monsoon Dry season
% of HH planting improved rice variety
2006 2011 2016
46
66
48
70
47
74
0
20
40
60
80
Monsoon Dry season
Paddy yield (baskets/acre)
2006 2011 2016
76 72 69
24 28 31
0%20%40%60%80%
100%
2006 2011 2016
Main paddy crop (% of HH reporting)
Monsoon Dry season
Incipient agricultural intensification
11
42
13
55
22
70
0
20
40
60
80
Monsoon Dry season
% of paddy farms applying herbicide
2006 2011 2016

Monsoon paddy: median gross margin 130,000 kyat / acre
-500000
-400000
-300000
-200000
-100000
0
100000
200000
300000
400000
5000001 7 13 19 25 31 37 43 49 55 61 67 73 79 85 91 97 103
109
115
121
127
133
139
145
151
157
163
169
175
181
187
193
199
205
211
217
223
229
235
241
Gro
ss m
argi
ns in
Mya
nmar
Kya
t
Household ID Gross margins (monsoon paddy)

Dry season paddy median gross margin 175,000 kyat/acre
-400000
-300000
-200000
-100000
0
100000
200000
300000
400000
500000
6000001 4 7 10 13 16 19 22 25 28 31 34 37 40 43 46 49 52 55 58 61 64 67 70 73 76 79 82 85 88 91 94 97 100
103
106
109
112
115
118
Gro
ss m
argi
ns in
Mya
nmar
Kya
t Household ID Gross margins (Dry season paddy)

Green gram median gross margin: 260,000 kyat per acre
-400000
-200000
0
200000
400000
600000
800000
1000000
1 3 5 7 9 11 13 15 17 19 21 23 25 27 29 31 33 35 37 39 41 43 45 47 49 51 53 55 57 59 61 63 65 67 69 71 73 75 77 79
Gro
ss m
argi
ns in
Mya
nmar
Kya
t
Household ID Gross margins (Green gram)

Conclusions
• Rapid transformation of the RNFE taking place close to Yangon, driven by migration
• Migration driven by urban growth & industrialization post 2012
• Leading to: Labor shortages, rising wages → mechanization of agriculture, growth of RNFE
• Growth of RNFE, supported by: Greater mobility (transport services), deeper market integration (labour, inputs, outputs), improving access to and terms of credit
• Mechanization supported by: Expansion of formal finance, falling machine costs, thriving rental markets, scale neutrality

Conclusions• Agricultural productivity and farm profitability appears
to be growing more slowly than RNFE in the case study area
• Indicates need for more effective agricultural public investments and policies to assure sustainable rural economic growth dynamic, for example:
• Access to improved varieties and information on improved crop management practices
• Access to irrigation for expanded dry season crop production• Access to improved financial services for seasonal and
medium-term credit as well as for savings
• New government agricultural policy and development strategy aims to improve profitability of farming
• YAU graduates have a key role as “change agents” (if you wear a motorbike helmet AT ALL TIMES)
THANK YOU