Embed Size (px)
Citation preview

0
The BuzzCity Report
A QUARTERLY BRIEFING ON THE MOBILE INTERNET
VOL 4, ISSUE 4: SEPTEMBER 2014
Contents
Welcome ...................................................................................................................................................................
Market update ......................................................................................................................................................... 1
Mobile advertising ............................................................................................................................................... 1
Quarterly ranking: Top 50 mobile advertising countries ...................................................................................... 3
Featured markets .................................................................................................................................................... 4
India .................................................................................................................................................................... 5
Indonesia............................................................................................................................................................. 6
South Africa......................................................................................................................................................... 7
Nigeria ................................................................................................................................................................. 8
Pakistan .............................................................................................................................................................. 9
Malaysia ............................................................................................................................................................ 10
United States ..................................................................................................................................................... 11
United Kingdom ................................................................................................................................................. 12
Bangladesh ....................................................................................................................................................... 13
Thailand ............................................................................................................................................................ 14
Feature: Online Videos ......................................................................................................................................... 15
Introduction ....................................................................................................................................................... 15
Overview ........................................................................................................................................................... 16
Audience Highlights .......................................................................................................................................... 17
Other Observations ........................................................................................................................................... 20
Conclusions....................................................................................................................................................... 21
Media Insights: Consumers & Advertising ............................................................................................................ 22
Global Highlights ............................................................................................................................................... 22
Summary / Recommendations .......................................................................................................................... 25

Welcome
Dear Mobile Colleagues
Welcome to the latest edition of The BuzzCity Report.
In this report we cover the third quarter of 2014 during which our network
delivered 83 billion paid ads. Over the course of the year we delivered
244 billion ads, a growth of 24% from last year.
As mobile surfing grows, the public’s insatiable demand for content has
spilled over to video on mobile. In a study on video consumption, we
found 84% watch online videos and a quarter of surfers watch videos on
mobile daily. This will no doubt increase as more 4G services roll out in
the key markets we serve.
In this report we also investigate how surfers view advertising and the
media that influences them. Despite their ambivalence towards ads in
general, more than three quarters of mobile surfers rely on advertising to
make purchasing decisions. Even those who claim they don’t trust
advertising appear to be influenced by ads. Key among the influencing
media is digital and the rapid rise of online videos in the consumers’
perception. But the high expectations consumers have of advertising
suggest the need for advertisers to work harder to secure positive
engagement with the consumer if their brand and message is to stand
out.
We also look at those hotspots that have attracted advertising dollars and
are likely to do so in the coming months.
KF Lai
CEO, BuzzCity

1
Market update
The following commentary provides the headline changes and noteworthy developments in mobile advertising emerging from the global markets that we track each month.
Key indicators: Q2 2014 Ads served % of total
Number of ads served by BuzzCity’s top 20 markets 67.3 bil 81%
Number of ads served by BuzzCity’s top 50 markets 74.6 bil 90%
Network total 83.0 bil 100%
Mobile advertising
1. In the third quarter of 2014, 83 billion ad banners were served across the entire network. This brings the total number of ads served this year to 244 billion, a growth of 24% against the same period of 2013.
2. By the end of September 2014, 62% of the audience was accessing the Internet with smartphones. Android powered phones made up 34% of user devices. Notable among the competing operating systems available, Windows Phone now make up 2.5% of user devices globally compared to Apple iOS at 2.8%.
3. Smartphones are now dominant devices in at least 125 markets, where more than 50% of mobile users are equipped with smartphones.
4. At the end of September 2014, CPCs averaged 1.4 cents across the network.
5. Notable among key markets in the third quarter of 2014:
a. India. Despite a seasonal softening of ad spend; carriers as predicted in the last quarter,
continued with off-portal content promotions and other value added services. Notable among the latter are awareness campaigns for mobile money services and services for personalised data plans.
Mobile content players remained active over the last quarter.
By September 2014, our network serves more than 124 million Indian mobile surfers 51% of who surf with smartphones. Among Indian surfers Nokia (39%), Samsung (26%) and Micromax (8%) are the most popular phones.
32% 31% 33%
46% 46% 51%
59% 59% 63%
71% 72%
62%
Global Smartphone Penetration

2
Mobile is growing
faster than other
media and has
greater influence.
b. Indonesia. The pace of gentle growth continued in Q3 with a modest growth of 3% as mobile
content players picked up the pace of competitive campaigns. By the end of September 2014, nearly three quarters of mobile surfers in Indonesia accessed the Internet with smartphones. Our network now serves an audience of 74.8 million Indonesians.
By the end of September, bids prices rose marginally to USD 1.2 cents. Competitive bids are expected to continue as higher audience activity is expected as 4G services become prevalent.
c. South Africa. Advertising traffic grew by another 20% in Q3 (following a 46% growth in Q2)
despite a softening late in Q2 and early Q3.
Notable among the campaigns are the cautious return of independent mobile content players, particularly those promoting mobile messaging services. We expect this to continue as will off portal campaigns among carriers. Telcos too are active promoting personalised data services and mobile money.
We expect brand campaigns in the FMCG sector to increase in Q4 to coincide with annual holiday sales.
By end of September, bid prices averaged at 3.5 cents per click.
d. Nigeria. Advertiser activity softened by another 15% this
quarter although activity remained high. In the third quarter of 2014 our network delivered 3.3 billion ads to 14 million Nigerians.
e. Thailand. After two consecutive quarters of double-digit
growth, advertising declined by 26% as mobile content players in particular cut back on spends as a result of delays in carrier billing processes. Media in general saw weakened earnings in the last few quarters as a result of an economic slowdown brought on by political unrest.
Our network now delivers more than 1.5 billion ads per quarter to 7.9 million Thais.
By the end of September 2014 Samsung (40%), Apple (21%) and Nokia (10%) were among the most used phones among Thai users.
f. Malaysia. Traffic increased by another 20% as 2.4 billion were served to 19.8 million surfers in
the Malaysia. E-commerce portals and mainstream entertainment maintained their campaigns for traffic although there was a softening in activity among mobile content players.
By October 2014, 42% of Malaysian surfers used Samsung devices and more than three quarters (77%) used Android powered phones, notably Lenovo (15%).
CPC rates remained competitive at 2.8 cents per click by the end of September.
3
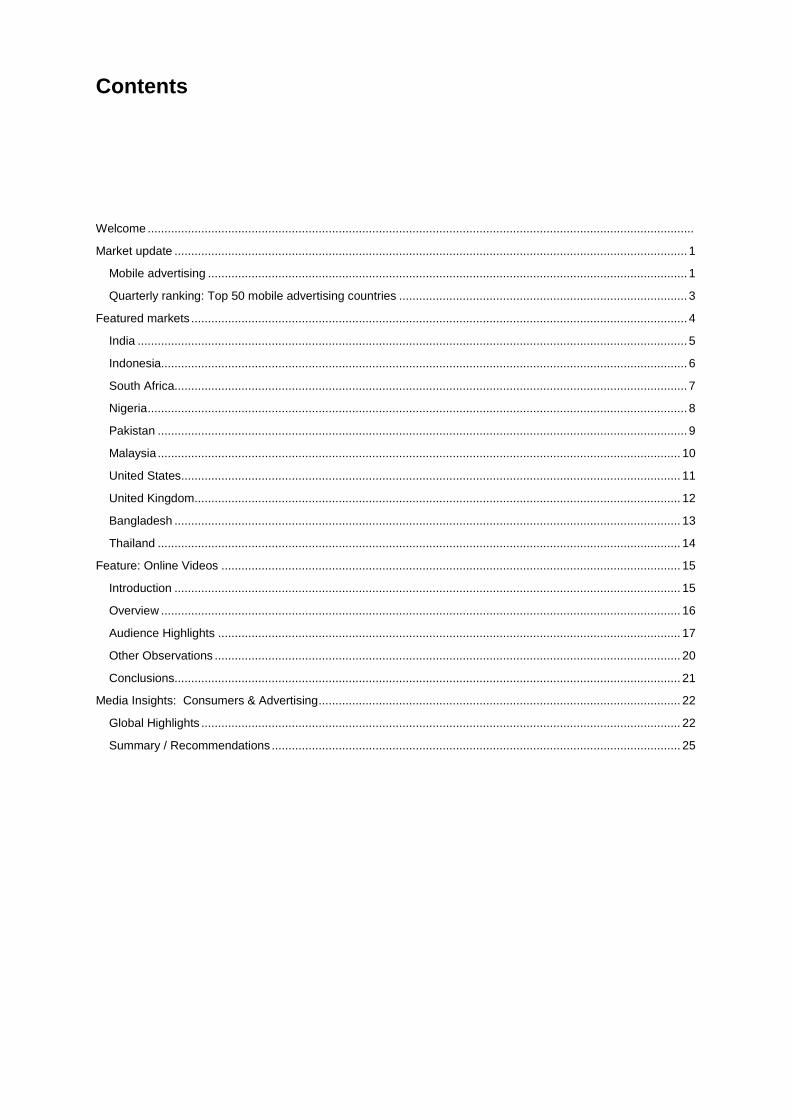
Quarterly ranking: Top 50 mobile advertising countries
Rank Country Banners Served
Q3 2014 Quarterly Growth
1 India 20,024,930,999 -13%
2 Indonesia 16,924,448,748 3%
3 South Africa 4,863,657,094 20%
4 Nigeria 3,293,106,709 -15%
5 Pakistan 2,630,588,670 -14%
6 United States 2,399,393,317 -6%
7 Malaysia 2,373,994,548 20%
8 United Kingdom 2,245,805,219 10%
9 Bangladesh 1,933,339,820 -5%
10 Singapore 1,754,800,889 789%
11 Thailand 1,487,351,334 -26%
12 Kenya 1,082,578,303 -26%
13 Canada 1,054,229,761 -60%
14 Vietnam 964,576,986 -20%
15 Mexico 881,465,845 26%
16 China 861,280,087 35%
17 Argentina 753,477,402 37%
18 France 660,149,745 108%
19 Brazil 572,357,179 -53%
20 Spain 567,479,472 267%
21 Turkey 538,660,655 -17%
22 Philippines 532,286,080 -1%
23 Sri Lanka 525,941,658 -10%
24 Venezuela 525,725,408 -4%
25 Saudi Arabia 439,156,666 -54%
26 Russia 429,817,974 47%
27 Ghana 424,270,236 -29%
28 United Arab Emirates 325,976,522 -21%
29 Germany 316,775,975 23%
30 Colombia 306,636,885 17%
31 Australia 293,725,559 104%
32 Oman 241,667,685 -7%
33 Egypt 224,665,573 -6%
34 Tanzania 201,893,881 -30%
35 Morocco 181,019,372 -5%
36 Sudan 159,651,862 -46%
37 Romania 152,018,647 -11%
38 Costa Rica 150,598,717 -57%
39 Iran 143,956,115 -28%
40 Kuwait 131,295,598 -27%
41 Italy 128,997,690 -47%
42 Uganda 120,262,031 -18%
43 Netherlands 113,836,918 -26%
44 Guatemala 112,911,133 -3%
45 Zimbabwe 105,009,915 -18%
46 Qatar 96,110,968 -24%
47 Serbia 95,469,348 -22%
48 Ecuador 94,262,562 -17%
49 Nicaragua 91,293,324 107%
50 Nepal 89,917,069 -13%
4
Featured markets
The pages that follow provide a snapshot of select markets for June 2014, with traffic growth and handset info. (To find out about any country not listed in the top 10, visit our campaign planner at planner.buzzcity.com.)
Mobile hotspots
The ‘Mobile Hotspot’ badge indicates those countries that we predict are likely to generate rapid and exponential growth in coming months, and with it, excellent value for advertisers.
All of these countries display a crucial mix of factors that we look for when we predict rapid growth (these could include falling cost of Internet access, heavy promotion of web services, cheaper handsets with better usability, and the rollout of new technologies – all leading to rapid consumer adoption).
Over the next year, we predict that there will be a lot more competition for advertising in these countries, and it would benefit advertisers greatly to take advantage now, before we start to see the inevitable increases in required bid rates that are likely to follow.

5
India
Summary
More than 6. 6 billion ads per month served to an audience of more than 124 million mobile surfers.
Carriers are active with off portal promotions of mobile content & OTT services (e.g. mobile money).
Top Phones: Nokia 26% , Samsung 23%
Traffic Distribution:
Featurephone : 51%
Smartphone : 44%
Desktop : 5%
Average CPC : 1.4 cent
6,730 6,617
-
1,000
2,000
3,000
4,000
5,000
6,000
7,000
8,000
9,000
Jan-14 Mar-14 May-14 Jul-14 Sep-14
Mill
ion
s
39%
26%
22%
8%
1%
1%
Nokia
Samsung
Other Makers
Micromax
MAUI
SonyEricsson
Handset Maker
31%
28%
6%
5%
4%
2%
2%
Android OS
Nokia S40
Symbian OS
Samsung OS
Windows OS
Windows Mobile OS
MAUI OS
Handset OS
Glamour & Dating 50%
General Content
25%
Portals 18%
Entertainment & Lifestyle
6%
Community 1%
Channel
6
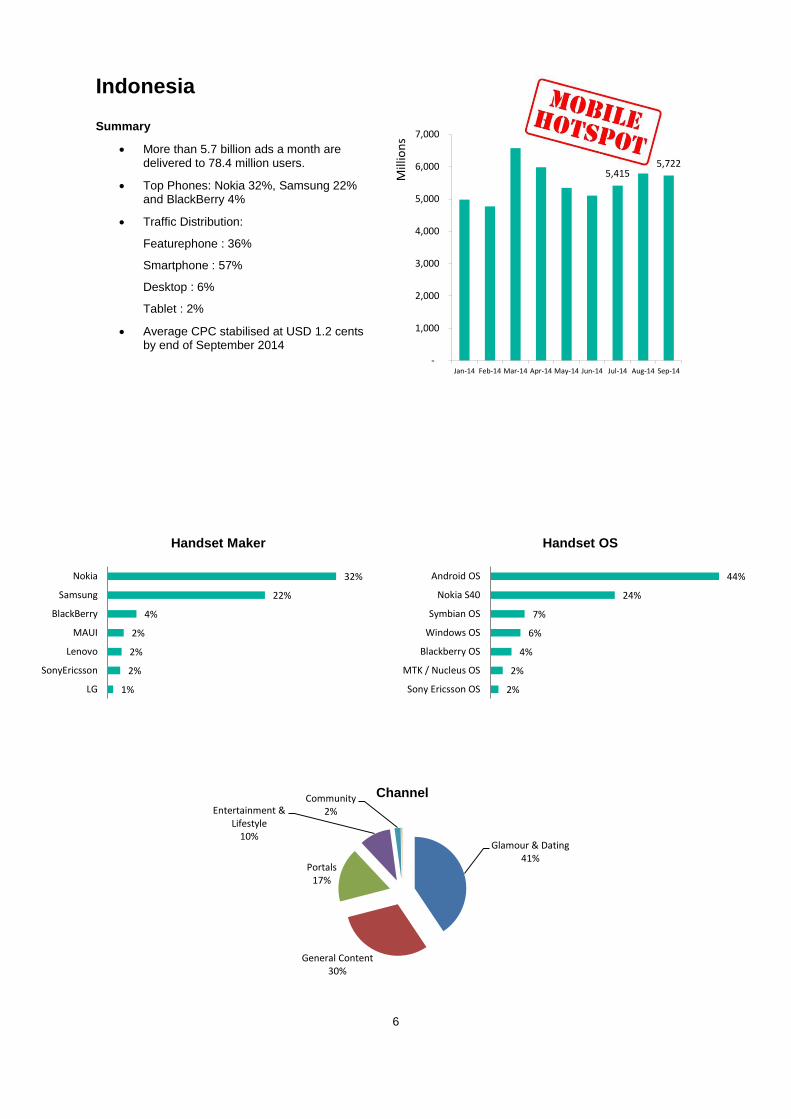
Indonesia
Summary
More than 5.7 billion ads a month are delivered to 78.4 million users.
Top Phones: Nokia 32%, Samsung 22% and BlackBerry 4%
Traffic Distribution:
Featurephone : 36%
Smartphone : 57%
Desktop : 6%
Tablet : 2%
Average CPC stabilised at USD 1.2 cents by end of September 2014
5,415 5,722
-
1,000
2,000
3,000
4,000
5,000
6,000
7,000
Jan-14 Feb-14 Mar-14 Apr-14 May-14 Jun-14 Jul-14 Aug-14 Sep-14
Mill
ion
s
44%
24%
7%
6%
4%
2%
2%
Android OS
Nokia S40
Symbian OS
Windows OS
Blackberry OS
MTK / Nucleus OS
Sony Ericsson OS
Handset OS
32%
22%
4%
2%
2%
2%
1%
Nokia
Samsung
BlackBerry
MAUI
Lenovo
SonyEricsson
LG
Handset Maker
Glamour & Dating 41%
General Content 30%
Portals 17%
Entertainment & Lifestyle
10%
Community 2%
Channel

7
South Africa
Summary
1.4 billion banners served monthly to 20 million users
Top Phones: Nokia 66%, Samsung 14% and Blackberry 5%.
Traffic Distribution:
Featurephone 62%
Smartphone 34%
Desktop 3%
Tablet 1%
Average CPC stabilised at USD 3.6 cents by end of September.
1,764
1,431
-
200
400
600
800
1,000
1,200
1,400
1,600
1,800
2,000
Jan-14 Feb-14 Mar-14 Apr-14 May-14 Jun-14 Jul-14 Aug-14 Sep-14
Mill
ion
s
56%
20%
6%
5%
2%
2%
Nokia S40
Android OS
Symbian OS
Blackberry OS
Windows OS
Windows Mobile OS
Handset OS
66%
14%
8%
5%
4%
1%
1%
Nokia
Samsung
Other Makers
BlackBerry
Huawei
Apple
LG
Handset Maker
Glamour & Dating 54%
General Content 26%
Portals 16%
Community 2%
Entertainment & Lifestyle
2%
Channel

8
Nigeria
Summary
1 billion banners served monthly to 14 million users
Top Phones: Nokia 61%, Samsung 3% and Blackberry 4%.
Traffic Distribution
Featurephone 73%
Smartphone 25%
Desktop 1%
Tablet 0.3%
Average CPC stabilised at USD 1.3 cents
1,403
1,028
-
200
400
600
800
1,000
1,200
1,400
1,600
Jan-14 Feb-14 Mar-14 Apr-14 May-14 Jun-14 Jul-14 Aug-14 Sep-14
Mill
ion
s
61%
25%
4%
3%
2%
2%
1%
1%
Nokia
Other Makers
BlackBerry
Samsung
MAUI
LG
HTC
HUAWEI
Handset Maker
52%
12%
7%
4%
2%
2%
1%
1%
Nokia S40
Android OS
Symbian OS
Blackberry OS
MTK / Nucleus OS
MAUI OS
Windows OS
Samsung OS
Handset OS
Glamour & Dating 45%
General Content 29%
Portals 21%
Entertainment & Lifestyle
3% Community
1%
Channel

9
Pakistan
Summary
More than 960m banners served monthly.
Top Phones: Nokia 62%, Samsung 6%
Traffic Distribution
Featurephone 63%
Smartphone 33%
Desktop 4%
Tablet 0.2%
Average CPCs remain at 1 cent per click. Coupled with high user activity, we expect this market to attract performance driven advertisers.
883 967
-
200
400
600
800
1,000
1,200
1,400
1,600
Jan-14 Feb-14 Mar-14 Apr-14 May-14 Jun-14 Jul-14 Aug-14 Sep-14
Mill
ion
s
47%
16%
12%
6%
5%
4%
1%
Nokia S40
Android OS
Symbian OS
MAUI OS
MTK / Nucleus OS
Windows OS
Blackberry OS
Handset OS
62%
24%
6%
5%
1%
1%
1%
Nokia
Other Makers
SAMSUNG
MAUI
HTC
BlackBerry
HUAWEI
Handset Maker
General Content 42%
Glamour & Dating 34%
Entertainment & Lifestyle
14%
Portals 8%
Community 2%
Channel
10
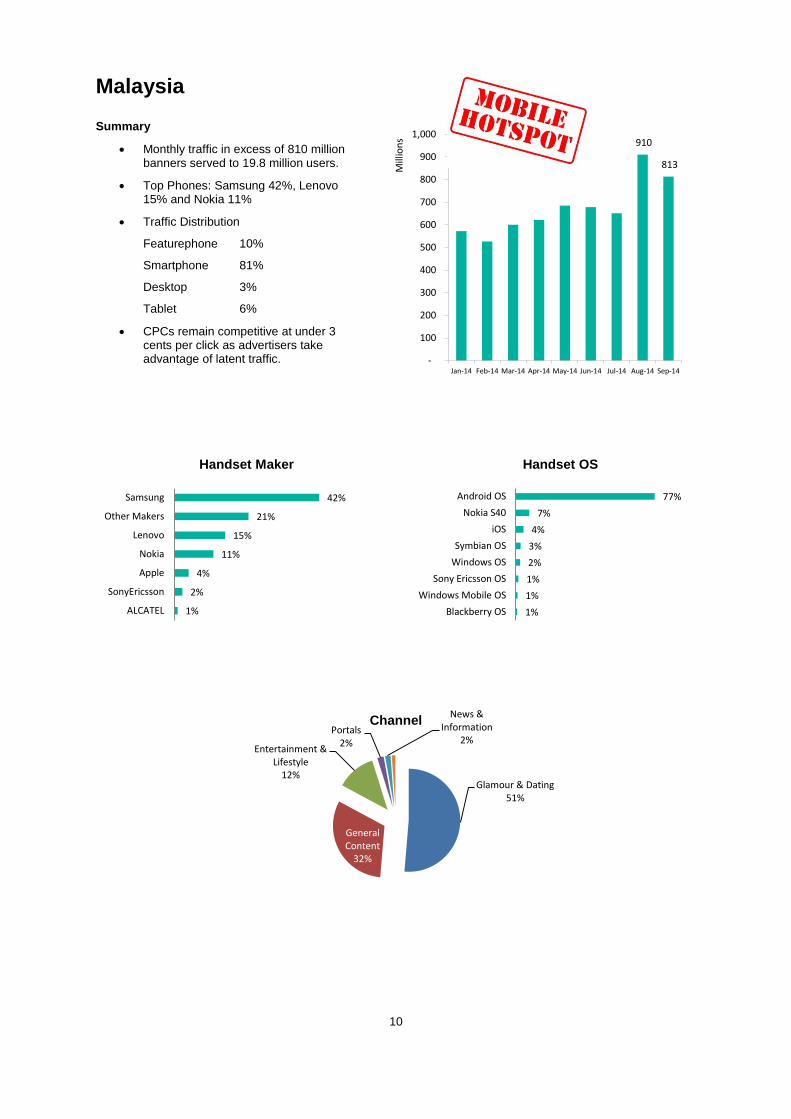
910
813
-
100
200
300
400
500
600
700
800
900
1,000
Jan-14 Feb-14 Mar-14 Apr-14 May-14 Jun-14 Jul-14 Aug-14 Sep-14
Mill
ion
s
Malaysia
Summary
Monthly traffic in excess of 810 million banners served to 19.8 million users.
Top Phones: Samsung 42%, Lenovo 15% and Nokia 11%
Traffic Distribution
Featurephone 10%
Smartphone 81%
Desktop 3%
Tablet 6%
CPCs remain competitive at under 3 cents per click as advertisers take advantage of latent traffic.
42%
21%
15%
11%
4%
2%
1%
Samsung
Other Makers
Lenovo
Nokia
Apple
SonyEricsson
ALCATEL
Handset Maker
77%
7%
4%
3%
2%
1%
1%
1%
Android OS
Nokia S40
iOS
Symbian OS
Windows OS
Sony Ericsson OS
Windows Mobile OS
Blackberry OS
Handset OS
Glamour & Dating 51%
General Content
32%
Entertainment & Lifestyle
12%
Portals 2%
News & Information
2%
Channel
11
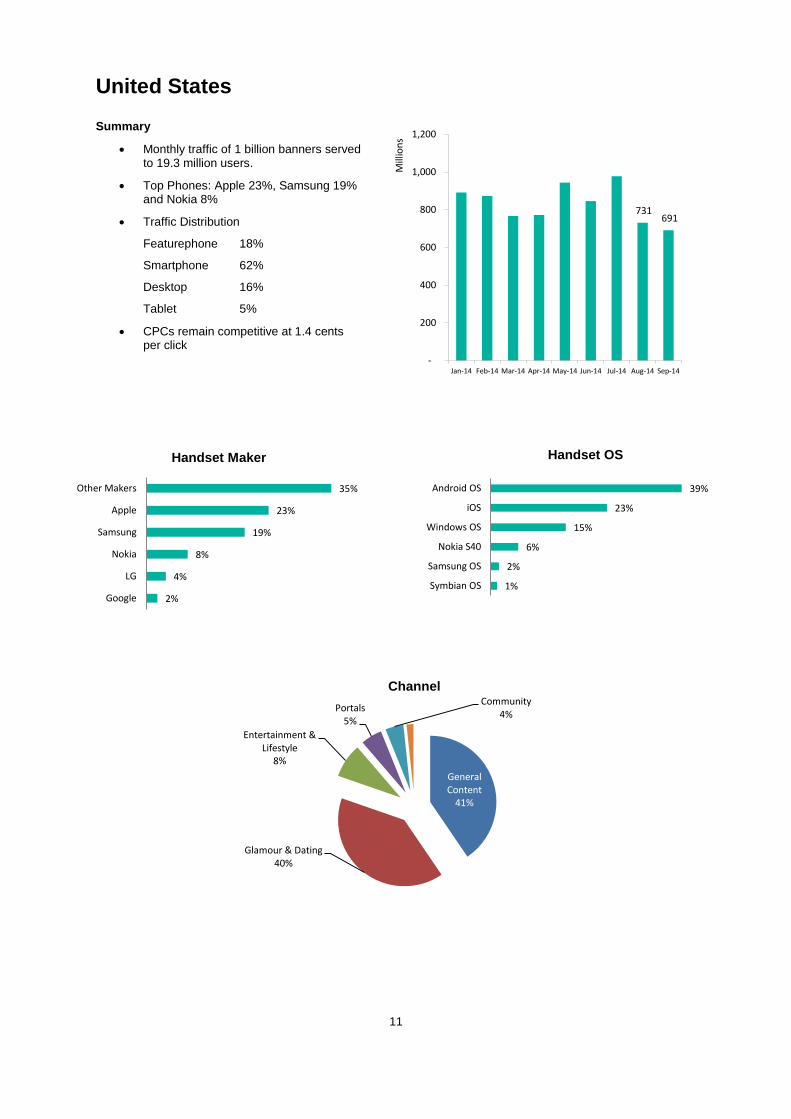
United States
Summary
Monthly traffic of 1 billion banners served to 19.3 million users.
Top Phones: Apple 23%, Samsung 19% and Nokia 8%
Traffic Distribution
Featurephone 18%
Smartphone 62%
Desktop 16%
Tablet 5%
CPCs remain competitive at 1.4 cents per click
731 691
-
200
400
600
800
1,000
1,200
Jan-14 Feb-14 Mar-14 Apr-14 May-14 Jun-14 Jul-14 Aug-14 Sep-14
Mill
ion
s
35%
23%
19%
8%
4%
2%
Other Makers
Apple
Samsung
Nokia
LG
Handset Maker
General Content
41%
Glamour & Dating 40%
Entertainment & Lifestyle
8%
Portals 5%
Community 4%
Channel
39%
23%
15%
6%
2%
1%
Android OS
iOS
Windows OS
Nokia S40
Samsung OS
Symbian OS
Handset OS

12
United Kingdom
Summary
Each month the network serves 705 million impressions to 12.5 million unique visitors in the UK
Top Phones: Samsung 27%, BlackBerry 23% and Apple 16%.
Traffic Distribution
Featurephone 2%
Smartphone 96%
Desktop 1%
Tablet 2%
CPCs remain competitive at 1.7 cents per click
811
705
-
200
400
600
800
1,000
1,200
1,400
Jan-14 Feb-14 Mar-14 Apr-14 May-14 Jun-14 Jul-14 Aug-14 Sep-14
Mill
ion
s
27%
23%
16%
16%
7%
4%
3%
1%
Samsung
BlackBerry
Other Makers
Apple
Nokia
LG
HTC
HUAWEI
Handset Maker
45%
23%
16%
4%
3%
2%
1%
Android OS
Blackberry OS
iOS
Nokia S40
Windows OS
Windows Mobile OS
Symbian OS
Handset OS
General Content
44%
Glamour & Dating 27%
Entertainment & Lifestyle
15%
Portals 8%
Community 3%
Channel
13
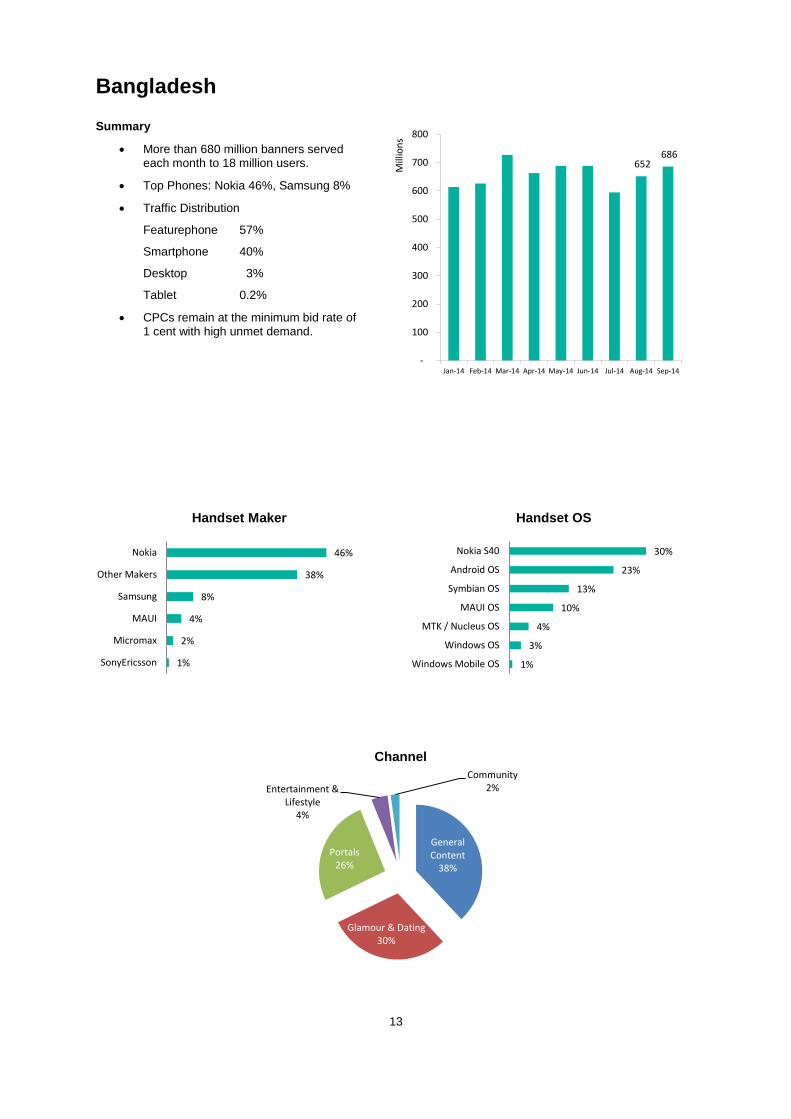
Bangladesh
Summary
More than 680 million banners served each month to 18 million users.
Top Phones: Nokia 46%, Samsung 8%
Traffic Distribution
Featurephone 57%
Smartphone 40%
Desktop 3%
Tablet 0.2%
CPCs remain at the minimum bid rate of 1 cent with high unmet demand.
652 686
-
100
200
300
400
500
600
700
800
Jan-14 Feb-14 Mar-14 Apr-14 May-14 Jun-14 Jul-14 Aug-14 Sep-14
Mill
ion
s
30%
23%
13%
10%
4%
3%
1%
Nokia S40
Android OS
Symbian OS
MAUI OS
MTK / Nucleus OS
Windows OS
Windows Mobile OS
Handset OS
46%
38%
8%
4%
2%
1%
Nokia
Other Makers
Samsung
MAUI
Micromax
SonyEricsson
Handset Maker
General Content
38%
Glamour & Dating 30%
Portals 26%
Entertainment & Lifestyle
4%
Community 2%
Channel

14
673
402
-
100
200
300
400
500
600
700
800
900
Jan-14 Feb-14 Mar-14 Apr-14 May-14 Jun-14 Jul-14 Aug-14 Sep-14
Mill
ion
s
Thailand
Summary
More than 400 million banners served each month to 7.9 million users.
Top Phones: Samsung 40%, Apple 21% and Nokia 10%
Traffic Distribution
Featurephone 5%
Smartphone 85%
Desktop 1%
Tablet 9%
Bid rates stabilised at 4.1 cents per click by end of September
40%
25%
21%
10%
1%
1%
Samsung
Other Makers
Apple
Nokia
ZTE
Lenovo
Handset Maker
67%
21%
5%
4%
1%
1%
Android OS
iOS
Nokia S40
Windows Mobile OS
Windows OS
Symbian OS
Handset OS
General Content 78%
Entertainment & Lifestyle
13%
Glamour & Dating 8%
Portals 1%
Channel
15
Feature: Online Videos
Introduction
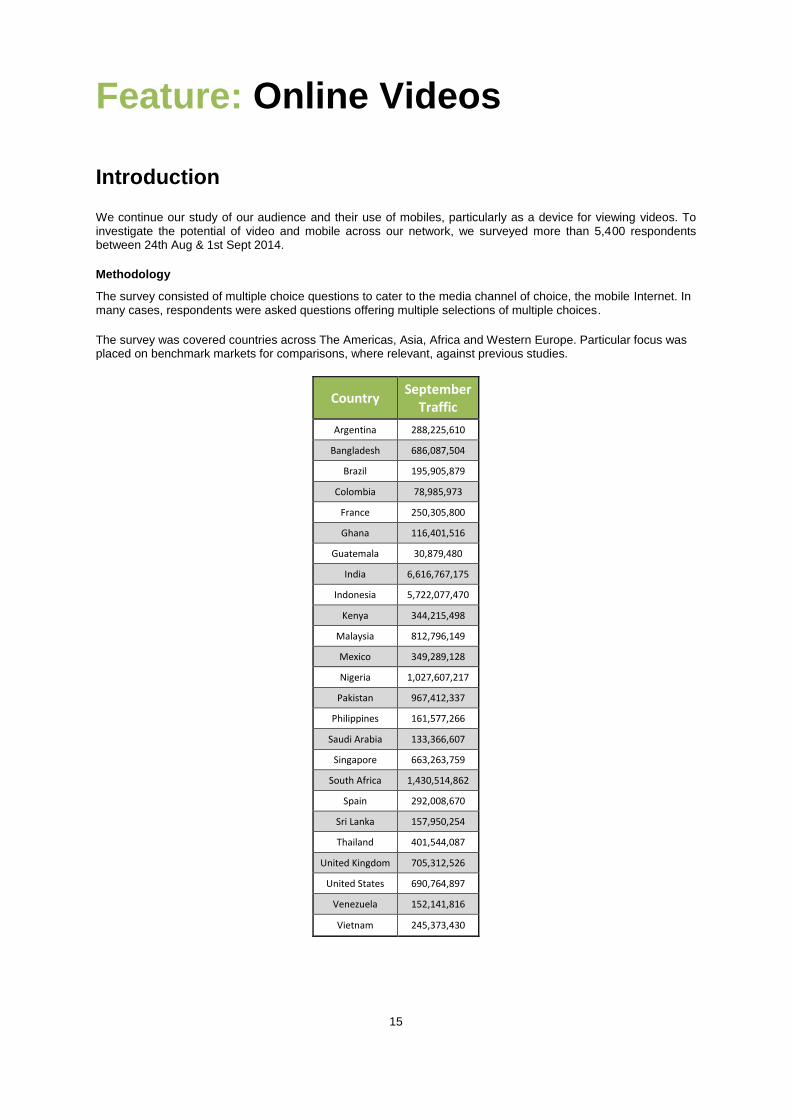
We continue our study of our audience and their use of mobiles, particularly as a device for viewing videos. To investigate the potential of video and mobile across our network, we surveyed more than 5,400 respondents between 24th Aug & 1st Sept 2014.
Methodology
The survey consisted of multiple choice questions to cater to the media channel of choice, the mobile Internet. In many cases, respondents were asked questions offering multiple selections of multiple choices.
The survey was covered countries across The Americas, Asia, Africa and Western Europe. Particular focus was placed on benchmark markets for comparisons, where relevant, against previous studies.
Country September
Traffic
Argentina 288,225,610
Bangladesh 686,087,504
Brazil 195,905,879
Colombia 78,985,973
France 250,305,800
Ghana 116,401,516
Guatemala 30,879,480
India 6,616,767,175
Indonesia 5,722,077,470
Kenya 344,215,498
Malaysia 812,796,149
Mexico 349,289,128
Nigeria 1,027,607,217
Pakistan 967,412,337
Philippines 161,577,266
Saudi Arabia 133,366,607
Singapore 663,263,759
South Africa 1,430,514,862
Spain 292,008,670
Sri Lanka 157,950,254
Thailand 401,544,087
United Kingdom 705,312,526
United States 690,764,897
Venezuela 152,141,816
Vietnam 245,373,430
16
Overview
Many observers believe that mobile video will be a powerful channel for content and consequently, advertisers.
After all, more people are surfing with smartphones, connection speeds are improving and more affordable data
plans are being made available to consumers.
And then there is the public’s insatiable demand for content.
Against this background, we note that our 25 benchmark countries (for the surveys we run) are served by 3G &
4G Networks. Only Kenya and Vietnam do not yet have 4G services. All others are served with at least one
provider; most have at least two 4G providers.
In Indonesia, Internux, were first to market its 4G services, Bolt, in late 2013. Firstmedia is expected to launch its
4G service by end of 2014 and Smartfren Telecom by early of 2015. Kenya expects to launch 4G in 2015 and
Vietnam is expected to issue licences in 2015.
In the first two quarters of 2014, on-going operator campaigns across our network frequently targeted data
hungry users to offer them better surfing packages. During this period we also saw independent video sharing
sites running major membership drives.
By March 2014, reports from Ofcom in the UK suggest “… active 4G mobile subscriptions in the UK has risen
from 318,000 in Q1 2013 to over 6 million Q1 2014.”
The Big question: What do users watch and how will it affect content marketing?

17
Audience Highlights
1. 84% of mobile surfers on our network watch online videos. a. Most, 56%, download the videos they watch and b. 30% watch via online sharing sites. c. 15% also post their own videos.
i. Note: More Video capture apps are emerging - these typically interface with the built-in video recording app, and make it easy to post videos directly to popular social networking sites.
2. When viewing videos, mobiles are the most widely used device (75%) a. ( Our ‘Lifestyle Survey’ of Dec 2013 shows 86% access Internet with their phones) b. Notably, 79% watch on one device only and for 68%, this single device is mobile!
15%
30%
56%
0%
10%
20%
30%
40%
50%
60%
Yes, I also post my own. Yes, I watch online viavideo sharing sites.
Yes, I download videos.
Do you watch or download videos online?
11%
75%
10% 7%
0%
10%
20%
30%
40%
50%
60%
70%
80%
PC / Laptop Mobile Phone Tablet SmartTV / Set-top-box
What do you use to view online videos?
18
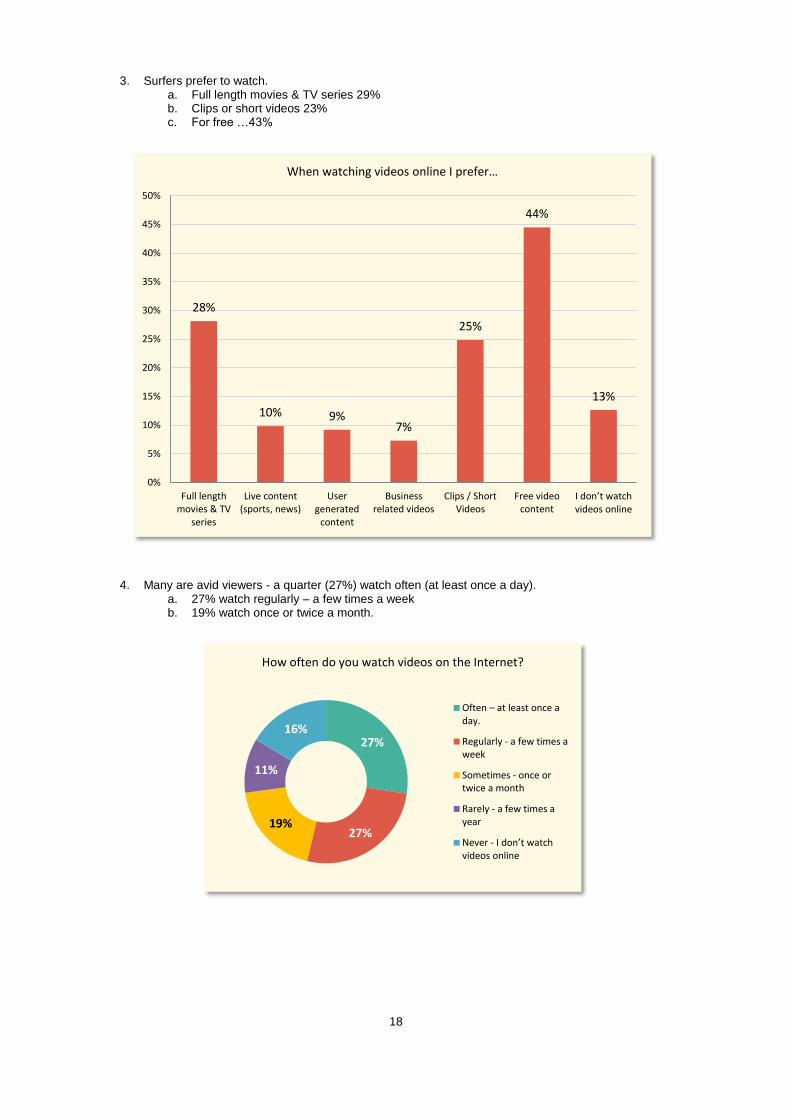
3. Surfers prefer to watch. a. Full length movies & TV series 29% b. Clips or short videos 23% c. For free …43%
4. Many are avid viewers - a quarter (27%) watch often (at least once a day). a. 27% watch regularly – a few times a week b. 19% watch once or twice a month.
27%
27% 19%
11%
16%
How often do you watch videos on the Internet?
Often – at least once a day.
Regularly - a few times aweek
Sometimes - once ortwice a month
Rarely - a few times ayear
Never - I don’t watch videos online
28%
10% 9% 7%
25%
44%
13%
0%
5%
10%
15%
20%
25%
30%
35%
40%
45%
50%
Full lengthmovies & TV
series
Live content(sports, news)
Usergenerated
content
Businessrelated videos
Clips / ShortVideos
Free videocontent
I don’t watch videos online
When watching videos online I prefer…
19
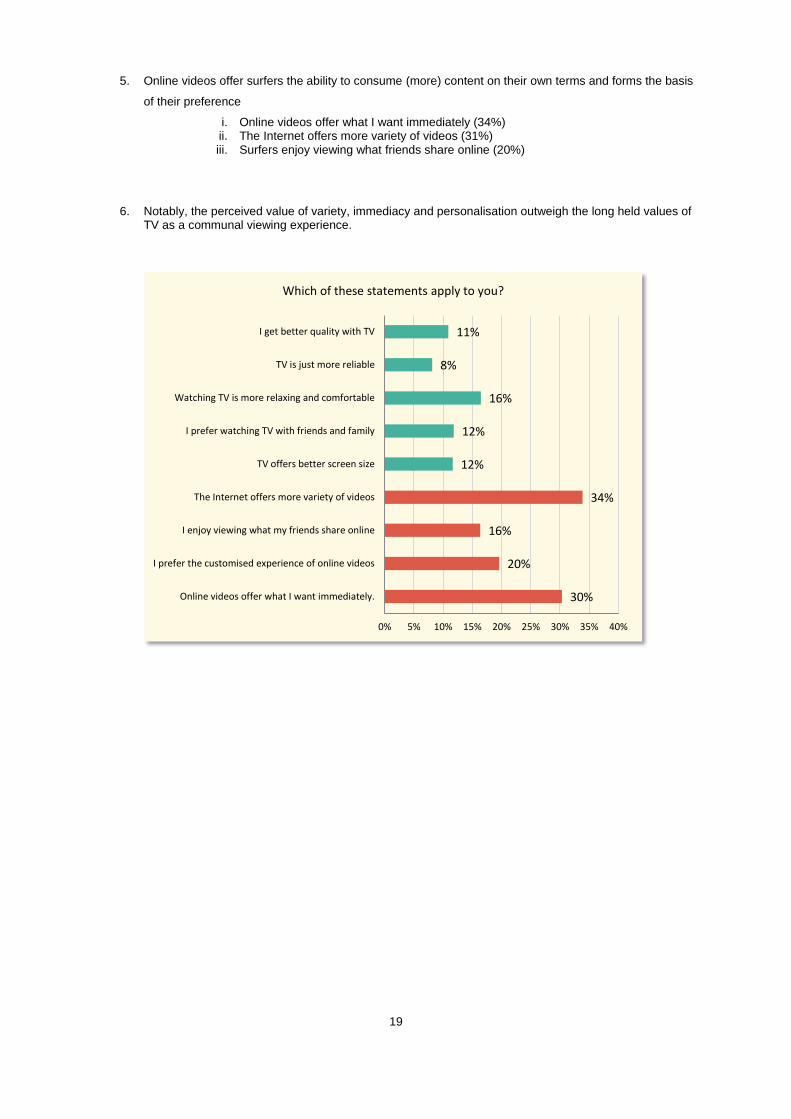
5. Online videos offer surfers the ability to consume (more) content on their own terms and forms the basis
of their preference
i. Online videos offer what I want immediately (34%) ii. The Internet offers more variety of videos (31%) iii. Surfers enjoy viewing what friends share online (20%)
6. Notably, the perceived value of variety, immediacy and personalisation outweigh the long held values of TV as a communal viewing experience.
30%
20%
16%
34%
12%
12%
16%
8%
11%
0% 5% 10% 15% 20% 25% 30% 35% 40%
Online videos offer what I want immediately.
I prefer the customised experience of online videos
I enjoy viewing what my friends share online
The Internet offers more variety of videos
TV offers better screen size
I prefer watching TV with friends and family
Watching TV is more relaxing and comfortable
TV is just more reliable
I get better quality with TV
Which of these statements apply to you?

20
Other Observations
1. We also deduce from the survey that,
Surfing Devices 2012 2013 2014
PC / Laptop 26% 10% 11%
Mobile 78% 86% 75%
Tablet 6% 7% 10%
Smart TV - 4% 7%
a. SmartTV ownership appears to have risen to 7% , while
b. PC ownership remains at approximately 11% having dropped from 2012
c. Tablet ownership has increased to at least 10% but does not seem to have grown as fast as PC’s have dropped.
2. Multi Device Surfing – present among 8% of respondents but not yet part of mainstream user behaviour.
21
Conclusions
1. Mobile video has undoubtedly become a mass consumer phenomenon! Among our audience, 84%
watch videos online and three quarters (75%) use their phones for viewing.
a. Multi device consumption is habitual among 8% of the respondents although we are yet to see
marked growth in the last 3 surveys.
2. At least a quarter (27%) of our audience watch online videos at least once a day and another 27%
watch online videos a few times a week.
3. Not surprisingly, free to view content is much sought after (43%) and this would typically be movies &
TV series (29%) or short videos (23%). We can expect, web videos and web series to play a crucial role
in how we experience entertainment in the very near future.
4. Most videos (56%) are downloaded for viewing but 30% is streamed from video sharing sites (including
premium video sharing sites with paid-content).
5. As with e-commerce, key factors driving the popularity of online videos are variety (34%), immediacy
(30%) and customisation (20%) – for consumers, it’s consumption on their own terms!
a. Notably the communal aspect of video sharing (16%) has rivalled if not outpaced the
communal value watching TV with family and friends (12%). (Not to be confused with replacing
TV – it is another experience of entertainment).
6. Comparisons with previous survey data suggests a growth of 3 percentage points in SmartTV ownership
and some three percentage point growth of tablet ownership in almost two years. Notably, the growth of
tablets is not as rapid as many had predicted.
7. The rise of online videos has led some brands to adapt to become producers and sponsors of their own
original content (and not just repurposing TV commercials). In many ways though, these brands follow
traditional ‘branding on TV’ - once that brand awareness and emotional connection have been
established, the brand runs retail marketing campaigns that encourage consumers to take a test drive
or get a promotional discount.
8. Digital video on the other hand promises the same emotional response with the practicality of direct
response. Advertisers can potentially, track spending directly to purchase in a way not possible with TV
and inspire engagement with mobile surfers.
9. Data and analytics will of course be important. But advertisers also need to be mindful that the user
experience of video is subjective – an emotional quality made more personal by the intimate nature of
mobiles. The only way to secure engagement is to actually create content that people care about or are
interested in - this though is not something to be quantified or measured.

22
Media Insights: Consumers & Advertising
The purpose of advertising is to share information. This information isn't always about a product and advertising
serves everything from businesses to social consciousness to get a message across. But in a fragmented
environment where the pubic consume content across numerous media, which has the ability to influence
consumers to act (or react) the most?
To investigate this we surveyed 5,100 mobile surfers across 25 countries between 11th Sept and 2
nd October
2014.
Respondents were asked of their general opinions of advertising; these were not cast against a particular set of
messages or advertising creatives. In this respect, responses reflect preconceived ideas of advertising. The basic
assumption is derived from findings of numerous external studies - the attention people pay to advertising is
influenced by how much they like to look at or notice advertising.
(Newspapers were not included in this study and forms part of another investigation).
Global Highlights
1. Mobile surfers have mixed feelings towards advertising – just as many have positive views of advertising as they do negative. Generally positive attitudes often coexist with unfavourable opinions about advertising.
2. Among the respondents, 60% agree with positive sounding opinions and 59% agree with the negatives.
a. While quarter (25%) feel advertising is informative, another quarter finds most ads are not relevant to them (23%).
b. Similarly, 22% claim to get value for money from advertised products while another 21% find advertising misleading.
c. Not surprisingly, 19% of respondents agree with positive and negative assertions on advertising.
25%
22%
24%
19%
27%
23%
21%
18%
Most advertising is informative.
I get value for money from advertised products.
In general, I feel I can trust advertising.
Products usually live up to advertiser claims
I ignore most of them.
Most are not relevant to me.
Most advertising is misleading.
Most are offensive and insult my intelligence.
How would you describe your attitude towards advertising?

23
3. Similarly, mobile surfers find all media just as invasive as they are actionable and attitudes are consistent across all media.
a. These responses suggest the influence the respective media have over surfers. Particularly influential are digital media and notably online video.
4. More ambivalence: Surprisingly, those who claim to distrust advertising take note of or act on ads as much as those who trust ads. This is also true for those who claim advertising ‘is just annoying’.
23%
13% 11% 11%
29%
23%
18%
23%
15%
26%
0%
5%
10%
15%
20%
25%
30%
35%
Media Influence
Actionable Ads
Invasive Ads
10% 9%
6% 6%
14% 14%
9% 10% 10% 12%
0%
5%
10%
15%
20%
25%
30%
35%
In which media are you most likely to act on or take notice of ads?
Trust Ads
Don’t Trust
They'reAnnoying

24
21%
18%
20%
18%
23%
How often do you use advertising to help make your purchase decisions?
Often - almost daily
Regularly - perhaps weekly
Sometimes - maybe monthly
Rarely - a few times a year
Never.
5. Despite their ambivalence, 77% of mobile surfers claim to use advertising to make purchasing decisions. 21% use advertising for purchasing decisions daily and another 18% weekly.
6. What do you dislike the most about ads?
34%
24%
28%
35%
22%
28%
There are too many
I don’t trust advertising
They are just annoying
I see the same ad too often
They are not relevant to me
They waste my time
25
Summary / Recommendations
1. Despite numerous mixed feelings about advertising, more than three quarters (77%) of mobile surfers
rely on advertising to make purchasing decisions.
2. While negative attitudes to advertising prevail (59%), consumers are generally well disposed to
advertising (60%).
a. Even those who claim they don’t trust advertising appear to be influenced by ads – they do act
or take notice of ads.
3. Digital media has become more influential than traditional media in generating consumer action or at the
very least strong opinions towards advertising.
4. But consumers have high expectations of advertising and the challenges facing marketers will only
increase. Advertisers should take note though, as a sizeable proportion of respondents feel
i. They see the same ad too often (35%)
ii. There are too many ads (34%)
iii. Advertisements are just annoying (28%)
iv. They are a waste of time (28%)
v. That the ads are not relevant (22%), and
vi. They just don’t trust advertising (24%).
5. If the purpose of advertising is to share information, then publishers too have a role in making sure that
information that is relevant is being shared with consumers. Internet advertising systems often allow
publishers to select advertisers and can help minimize the annoyance and irrelevance of any particular
advertisement – publishers must be diligent in their use of these tools to remain profitably ad supported.
6. The consumer may be ambivalent, but they are not passive. Consumers are behaving the same way
they have for ages. They perceive a need, seek information, assess the value of a product or service,
make a purchase, then use and evaluate it. What has changed is where they collect information and
share experiences – on mobile.
7. So if consumers don’t trust advertising, don’t just push promotion campaigns, build brand! Telling the
brand story becomes more important as consumers look for associative messages that are relevant to
them.
8. Consumers see the same ad too often: Advertisers will need to vary the message and also the ad
format – look beyond banner advertising to other rich media and video formats. Marketers need to look
to rich media or video formats to deliver emotion and engagement beyond the direct response of a
banner.
9. Engagement is of course specific to a brand or product. Marketers will want to consider measuring: -
a. Visit Frequency – how often consumers return is a key reflection of the value they get from a
site or application. The goal is to identify the pattern that is most relevant for your service and
monitor consumer usage against that pattern.
b. Primary Usage - If consumers are consistently performing core actions (browsing products,
creating a wish list, creating product alerts) it is a good indication of the value they derive.
c. Active Time - the total time a user spends on primary usage of the site.
10. A combination of these core metrics (at the very least) helps to uncover the level of user engagement for
any application or online service. To get to the combination that is right requires some thought and it
may not be easy, but it’s essential if marketers want to continuously delight users and in turn increase
their lifetime value.
26
BuzzCity Pte Ltd 1 Lorong 2, Toa Payoh
#02-03, Yellow Pages Building Singapore 319637
+65 6395 3700
General enquiries and feedback [email protected]
Partnerships and Business Development [email protected]
Advertising enquiries [email protected]
For a full list of our global offices and local representation, please visit www.buzzcity.com