Embed Size (px)
Citation preview
EPA/600/R-03/072
July 2003
Characteristics of Spilled Oils, Fuels, and Petroleum
Products:
1. Composition and Properties of Selected Oils
Zhendi Wang, B.P. Hollebone, M. Fingas, B. Fieldhouse,
L. Sigouin, M. Landriault, P. Smith, J. Noonan, and G. Thouin
Emergencies Science and Technology Division
Environmental Technology Centre
Environment Canada
335 River Road, Ottawa, Ontario
James W. Weaver
Project Officer
Ecosystems Research Division
Athens, Georgia 30605
National Exposure Research Laboratory
Office of Research and Development
United States Environmental Protection Agency
Research Triangle Park, North Carolina 27711

Notice
The U.S. Environmental Protection Agency through its Office of Research and Development funded
and managed the research described here under contract (1D-5859-NAFX) to Environment Canada.
It has been subjected to the Agency’s peer and administrative review and has been approved for
publication as an EPA document. Mention of trade names or commercial products does not constitute
endorsement or recommendation for use.
ii
Foreword
The National Exposure Research Laboratory’s Ecosystems Research Division (ERD) in Athens,
Georgia, conducts research on organic and inorganic chemicals, greenhouse gas biogeochemical cycles,
and land use perturbations that create direct and indirect, chemical and non-chemical stresses,
exposures, and potential risks to humans and ecosystems. ERD develops, tests, applies and provides
technical support for exposure and ecosystem response models used for assessing and managing risks
to humans and ecosystems, within a watershed / regional context.
The Regulatory Support Branch (RSB) conducts problem-driven and applied research, develops
technology tools, and provides technical support to customer Program and Regional Offices, States,
Municipalities, and Tribes. Models are distributed and supported via the EPA Center for Exposure
Assessment Modeling (CEAM) and through access to Internet tools (www.epa.gov/athens/onsite).
At the request of the US EPA Oil Program Center, ERD is developing an oil spill model that focusses
on fate and transport of oil components under various response scenarios. Since crude oils and
petroleum products are composed of many chemicals that have varying physical properties, data are
required to characterize these fluids for use in models. The data presented in this report provide input
to compositional models by characterizing oil composition by several approaches, but also by providing
physical transport properties at corresponding levels of weathering and temperature. EPA expects
these data to be useful both for modeling and to provide a resource for the oil spill response community
as a whole.
Rosemarie C. Russo, Ph.D.
Director
Ecosystems Research Division
Athens, Georgia
iii
Abstract
Multicomponent composition and corresponding physical properties data of crude oils and petroleum
products are needed as input to environmental fate simulations. Complete sets of such data, however,
are not available in the literature due to the complexity and expense of making the measurements.
Environment Canada has previously developed a database of various physical and chemical properties
of crude oils and petroleum products. In this cooperative project, ten “typical” crude oils and refined
products in common use or transport were identified for subsequent characterization. Measured oil
physical properties include API gravity, density, sulphur content, water content, flash point, pour point,
viscosity, surface and interfacial tension, adhesion, the equation for predicting evaporation, emulsion
formation, and simulated boiling point distribution. The chemical composition of the oils are quantified
for hydrocarbon groups, volatile organic compounds, n-alkane distribution, distribution of alkylated
polyaromatic hydrocarbon (PAH) homologues and other EPA priority PAHs, and biomarker
concentrations. This project will provide the most complete and comprehensive database for the
selected oils to date. The new composition data will be integrated into the existing Environment Canada
oil properties database. The results will be made available to the public both on the world wide web
and as a database on disc.
iv
Table of Contents
Notice . . . . . . . . . . . . . . . . . . . . . . . . . . . . . . . . . . . . . . . . . . . . . . . . . . . . . . . . . . . . . . . . . . . . ii
Foreword . . . . . . . . . . . . . . . . . . . . . . . . . . . . . . . . . . . . . . . . . . . . . . . . . . . . . . . . . . . . . . . . iii
Abstract . . . . . . . . . . . . . . . . . . . . . . . . . . . . . . . . . . . . . . . . . . . . . . . . . . . . . . . . . . . . . . . . . . iv
1. Introduction . . . . . . . . . . . . . . . . . . . . . . . . . . . . . . . . . . . . . . . . . . . . . . . . . . . . . . . . . . 1
2. List of Definitions . . . . . . . . . . . . . . . . . . . . . . . . . . . . . . . . . . . . . . . . . . . . . . . . . . . . . 3
3. Methods for Measurement of Physical and Chemical Properties of Selected Oils . . . . . 10
4. Summary of Quality Assurance and Quality Control (QA/QC) Plan . . . . . . . . . . . . . . . 28
5. Physical Properties and Chemical Composition of Alaska North Slope Crude Oil (2002)
. . . . . . . . . . . . . . . . . . . . . . . . . . . . . . . . . . . . . . . . . . . . . . . . . . . . . . . . . . . . . . . . . . 34
6. Physical Properties and Chemical Composition of Alberta Sweet Mixed Blend (ASMB, Reference
#5) . . . . . . . . . . . . . . . . . . . . . . . . . . . . . . . . . . . . . . . . . . . . . . . . . . . . . . . . . . . . . . . . 46
7. Physical Properties and Chemical Composition of Arabian Light (2000) . . . . . . . . . . . . 58
8. Physical Properties and Chemical Composition of Sockeye (2000) . . . . . . . . . . . . . . . . 70
9. Physical Properties and Chemical Composition of South Louisiana (2001) . . . . . . . . . . 82
10. Physical Properties and Chemical Composition of West Texas Intermediate (2002) . . . 94
11. Physical Properties and Chemical Composition of Fuel Oil No. 2/Diesel (2002) . . . . . 106
12. Physical Properties and Chemical Composition of Fuel Oil No. 5 (2000) . . . . . . . . . . 118
13. Physical Properties and Chemical Composition of Heavy Fuel Oil 6303 (2002) . . . . . . 129
14. Physical Properties and Chemical Composition of Orimulsion-400 (2001) . . . . . . . . . 140
15. Trace Metals . . . . . . . . . . . . . . . . . . . . . . . . . . . . . . . . . . . . . . . . . . . . . . . . . . . . . . . 148
v
16. References . . . . . . . . . . . . . . . . . . . . . . . . . . . . . . . . . . . . . . . . . . . . . . . . . . . . . . . . . 149
17. Appendices . . . . . . . . . . . . . . . . . . . . . . . . . . . . . . . . . . . . . . . . . . . . . . . . . . . . . . . . 153
1 Chemical Abstract Service (CAS) Registry Numbers for Selected Analytes . . . . . . 153
2 Oil Chemical Analysis Protocol . . . . . . . . . . . . . . . . . . . . . . . . . . . . . . . . . . . . . . . 156
3 GC Chromatograms for Alaska North Slope Crude Oil . . . . . . . . . . . . . . . . . . . . . . 157
4 GC Chromatograms for Alberta Sweet Mixed Blend #5 Crude Oil . . . . . . . . . . . . . 170
5 GC Chromatograms for Arabian Light Crude Oil . . . . . . . . . . . . . . . . . . . . . . . . . . 182
6 GC Chromatograms for Sockeye Crude Oil . . . . . . . . . . . . . . . . . . . . . . . . . . . . . . 194
7 GC Chromatograms for South Louisiana Crude Oil . . . . . . . . . . . . . . . . . . . . . . . . 208
8 GC Chromatograms for West Texas Intermediate Crude Oil . . . . . . . . . . . . . . . . . . 220
9 GC Chromatograms for Fuel Oil Number 2 . . . . . . . . . . . . . . . . . . . . . . . . . . . . . . 231
10 GC Chromatograms for Fuel Oil Number 5 . . . . . . . . . . . . . . . . . . . . . . . . . . . . . 245
11 GC Chromatograms for HFO 6303 . . . . . . . . . . . . . . . . . . . . . . . . . . . . . . . . . . . 257
12 GC Chromatograms for Orimulsion-400 . . . . . . . . . . . . . . . . . . . . . . . . . . . . . . . . 270
vi
1. Introduction
During any oil spill incident, the properties of the spilled oil, including the oil phase composition and
oil compositional changes due to weathering, ideally would be known immediately, so that models could
be used to predict the environmental impacts of the spill or various treatment alternatives. Unfortunately,
the properties routinely measured by oil producers and refiners are not the ones that on-scene commanders
need to know most urgently. Oil producers and refiners typically do not know to what extent or at what
rate their oils will evaporate; the detailed chemical composition of the oil and its differential compositional
changes over time; how these changes affect its behavior and fate in the environment; the viscosity of the
oil at ambient temperature as it evaporates; if the oil likely to sink or submerge; if the use of chemical
dispersants can enhance its dispersion; if emulsions will form; the hazard to on-site personnel during
cleanup; or the oil toxicity to marine or aquatic organisms.
Since 1984, the Emergencies Science and Technology Division (ESTD) of Environment Canada
has continued to develop a database on various physical-chemical properties of crude oils and petroleum
products. This database addresses the properties and behaviors listed in the previous paragraph and can
be queried via the internet atwww.etcentre.org/spills. Through many years endeavor, the oil properties
database now contains information on over 400 oils from all over the world. Environment Canada is the
largest single source of data in the oil properties database.
The U.S. EPA’s immediate interest in developing a database of properties and compositions is for
use in supporting the development of models for application to accidental spills and releases of petroleum
hydrocarbons and other multicomponent oils. This multicomponent composition data is not typically
available in the literature nor immediately available on an incident-specific basis due to the complexity and
expense of making the measurements. Thus the creation of a database containing both physical property
and composition data for various conditions of weathering would be useful for emergency response
modeling. In this situation the data could be used for simulation of an example oil that would be chosen for
its similarity to the spilled oil. This approach recognizes that performing detailed characterization of an oil
during an emergency is more than unlikely. It would further be desirable to have access to similar data for
planning purposes in advance of spills.
Ten representative oils and refined petroleum products with spill potential were chosen after
discussion with the US EPA. These oils were collected fromvarious sources. For each oil, the properties
presented are those that determine its environmental behavior and effects. Whenever possible, ESTD has
used standard test methods, such as those of the American Society for Testing and Materials (ASTM), to
obtain oil property data. The physical property measurements include API gravity, density, sulphur, water
content, flash point, pour point, viscosity, vapor pressure, surface tension, and adhesion. Many oil analytical
methods have been developed by ESTD specifically to determine environmentally-significant individual
components, oil hydrocarbon groups, and chemical properties. These include methods for determining
evaporation equations, emulsion formation and characterization, measuring chemical dispersibility,
measuring volatile organic compounds, important saturated and biomarker compounds, and environmentally
hazardous PAH compounds. Because evaporative loss results in significant changes in physical properties
1

and chemical composition of spilled oils, we measure most properties not only for fresh oils, but also for
evaporated oils prepared in the lab to represent various degrees of evaporation. Upon the completion of
the project, a complete set of physical properties and comprehensive multicomponent data on important
chemical composition of the selected oils will be provided and integrated into the existing ESTD database.
Finally, the unique information produced from this project is intended by EPA to advance the state-of-the-
art of oil spill modeling. As such it will be available to the public through the Internet at
www.etcentre.org/spills.
2
2. List of Definitions
Acyclic: A compound with straight or branched carbon-carbon linkages but without cyclic (ring)
structures.
Adhesion: The degree to which an oil will coat a surface, expressed as the mass of oil adhering per unit
area. A test has been developed for a standard surface that gives a semi-quantitative measure of this
property.
Aliphatics: Hydrocarbons in petroleum that contain saturated and/or single unsaturated bonds and elute
during chromatography using non-polar solvents such hexane. It includes alkanes and alkenes, but not
aromatics.
Alkane (Paraffin): A group of hydrocarbons composed of only carbon and hydrogen with no double
bonds or aromaticity. They are said to be “saturated” with hydrogen. They may by straight-chain (normal),
branched or cyclic. The smallest alkane is methane (CH4), the next, ethane (CH3CH3), then propane
(CH3CH2CH3), and so on.
Alkene (Olefin): An unsaturated hydrocarbon, containing only hydrogen and carbon with one or more
double bonds, but having no aromaticity. Alkenes are not typically found in crude oils, but can occur as
a result of heating.
Alkyl Groups: Ahydrocarbon functional group (CnH2n+1) obtained by dropping one hydrogen from fully
saturated compound; e.g., methyl (-CH3), ethyl (-CH2CH3), propyl (-CH2CH2CH3), or isopropyl
[(CH3)2CH-].
API Gravity: An American Petroleum Institute measure of density for petroleum:
API Gravity = [141.5/(specific gravity at 15.6 °C) - 131.5]
Fresh water has a gravityof 10 °API. The scale is commercially important for ranking oil quality. Heavy,
inexpensive oils are < 25 °API; medium oils are 25 to 35 °API; light, commercially-valuable oils are 35
to 45 °API..
Aromatics: Cyclic, planar hydrocarbon compounds that are stabilized by a delocalized B-electron
system. They include such compounds as the BTEX group (benzene, toluene, ethylbenze and the three
xylene isomers), polycyclic aromatic hydrocarbons (PAHs, such as naphthalene), and some heterocyclic
aromatics such as the di-benzothiophenes.
3
Asphaltenes: A complex mixture of heavy organic compounds precipitated from oils and bitumens by
natural processes or in laboratory by addition of excess n-pentane, or n-hexane. After precipitation of
asphaltenes, the remaining oil or bitumen consists of saturates, aromatics, and resins. Asphaltenes are
so named because they make up the largest percentage of the asphalt used to pave roads.
Biological Marker (Biomarker): Complex organic compounds composed of carbon, hydrogen, and
other elements which are found in oil, bitumen, rocks, and sediments and which have undergone little or
no change in structure from their parent organic molecules in living organisms. Most, but not all, biomarkers
are isoprenoids, composed of isoprene subunits. Biomarkers include pristane, phytane, triterpanes,
steranes, porphyrins, and other compounds. These compounds are typically analyzed by GC/MS.
Bitumen: Mixture ofhydrocarbons of natural or pyrogenous origin or a combination of both. Unlike oil,
bitumen is indigenous to the fine-grained rock in which it is found.
Boiling Point: The temperature at which a liquid begins to boil. That is, it is the temperature at which the
vapour pressure of a liquid is equal to the atmospheric or external pressure. It is measured at standard
pressure. The boiling point distributions of crude oils and petroleum products may be in a range from 30
°C to 700 °C.
BTEX: The collective name given to benzene, toluene, ethylbenzene and the xylene isomers (p-, m-, and
o-xylene).
Carbon Preference Index (CPI): The ratio of odd to even n-alkanes. Odd/even CPI alkanes are
equally abundant in petroleum but not in biological material. A CPI near 1 is an indication of petroleum.
Check Standard: An analyte with a well-characterized property of interest, e.g., concentration, density,
etc... used to verify method, instrument and operator performance during regular operation. Check
standards may be obtained from a certified supplier, may be a pure substance with properties obtained
from the literature or may be developed in-house.
Chemical Dispersion: In relation to oil spills, this term refers to the creation of oil-in-water emulsions
by the use of chemical dispersants made for this purpose.
Complex Modulus: The complex modulus is a measure of the overall resistance of a material to flow
under an applied stress, in units of force per unit area. It combines viscosity and elasticity elements to
provide a measure of “stiffness”, or resistance to flow. The complex modulus is more useful than viscosity
for assessing the physical behaviour of very non-Newtonian materials such as emulsions.
Cycloalkanes (Naphthene, Cycloparaffin): A saturated, cyclic compound containing only carbon and
hydrogen. One of the simplest cycloalkanes is cyclohexane (C6H12). Steranes and triterpanes are branched
naphthenes consisting of multiple condensed five- or six-carbon rings.
4
Density: The mass per unit volume of a substance. Density is temperature-dependent, generally
decreasing with temperature. The densityof oil relative to water, its specific gravity, governs whether a
particular oil will float on water. Most fresh crude oils and fuels will float on water. Bitumen and certain
residual fuel oils, however, may have densities greater than water at some temperature ranges and may
submerge in water. The densityof a spilled oil will also increase with time as components are lost due to
weathering.
Dispersants or Chemical Dispersants: Chemicals that reduce the surface tension between water and
a hydrophobic substance such as oil. In the case of an oil spill, dispersants facilitate the breakup and
dispersal of an oil slick throughout the water column in the form of an oil-in-water emulsion. Chemical
dispersants can only be used in areas where biological damage will not occur and must be approved for
use by government regulatory agencies.
Emulsion: A stable mixture of two immiscible liquids, consisting of a continuous phase and a dispersed
phase. Oil and water can form both oil-in-water and water-in-oil emulsions. The former is termed a
dispersion, whileemulsion implies the latter. Water-in-oil emulsions formed from petroleum and brine can
be grouped into four stability classes: stable, a formal emulsion that will persist indefinitely; meso-stable,
which gradually degrade over time due to a lack of one or more stabilizing factors; entrained water, a
mechanical mixture characterized by high viscosity of the petroleum component which impedes separation
of the two phases; and unstable, which are mixtures that rapidly separate into immiscible layers.
Emulsion stabilityis generally accompanied by a marked increase in viscosity and elasticity, over that of
the parent oil which significantly changes behaviour. Coupled with the increased volume due to the
introduction of brine, emulsion formation has a large effect on the choice of countermeasures employed to
combat a spill.
Emulsification: The process of emulsion formation, typically by mechanical mixing. In the environment,
emulsions are most often formed as a result of wave action. Chemical agents can be used to prevent the
formation of emulsions or to “break” the emulsions to their component oil and water phases.
Equipment Blank: A sample of analyte-free media which has been used to rinse the sampling equipment.
It is collected after completion of decontamination and prior to sampling. This blank is useful in documenting
and controlling the preparation of the sampling and laboratory equipment.
“Fingerprint”: A chromatographic signature of relative intensities used in oil-oil or oil-source rock
correlations. Mass chromatograms ofsteranes or terpanes are examples of fingerprints that can be used
for qualitative or quantitative comparison of oils.
Flash Point: The temperature at which the vapour over a liquid will ignite when exposed to an ignition
source. A liquid is considered to be flammable if its flash point is less than 60 °C.
Flash point is an extremely important factor in relation to the safetyof spill cleanup operations. Gasoline
5
and other light fuels can ignite under most ambient conditions and therefore are a serious hazard when
spilled. Many freshly spilled crude oils also have low flash points until the lighter components have
evaporated or dispersed.
GC-MS: Gas chromatography-mass spectrometry.
GC-TPH: GC detectable total petroleum hydrocarbons, that is the sum of all GC-resolved and unresolved
hydrocarbons. The resolvable hydrocarbons appear as peaks and the unresolvable hydrocarbons appear
as the area between the lower baseline and the curve defining the base of resolvable peaks.
Hydrocarbon: A hydrocarbon is an organic compound containing only hydrogen and carbon.
Hydrocarbons are the principal constituents of crude oils and refined petroleum products. Oil hydrocarbons
can be grouped into four major classes of compounds: saturates (including waxes), aromatics,
asphaltenes, and resins.
Hopane: Pentacyclic hydrocarbons of the triterpane group believed to be derived primarily from
bacteriohopanoids in bacterial membranes.
Interfacial Tension: The net energy per unit area at the interface of two substances, such as oil and water
or oil and air. The air/liquid interfacial tension is often referred to as surface tension. The SI units for
interfacial tension are milliNewtons per meter (mN/m). The higher the interfacial tension, the less
attractive the two surfaces are to each other and the more size of the interface will be minimized. Low
surface tensions can drive the spreading of one fluid on another. The surface tension of an oil, together its
viscosity, affects the rate at which spilled oil will spread over a water surface or into the ground.
Internal Standard (IS): A pure analyte added to a sample extract in a known amount, which is used to
measure the relative responses of other analytes and surrogates that are components of the same solution.
The internal standard must be an analyte that is not a sample component.
PAHs: Polycyclic aromatic hydrocarbons. Alkylated PAHs are alkyl group derivatives of the parent
PAHs. The five target alkylated PAHs referred to in this report are the alkylated naphthalene,
phenanthrene, dibenzothiophene, fluorene, and chrysene series.
Polar Compounds: An organic compound with distinct regions of positive and negative charge. Polar
compounds include alcohols, such as sterols, and some aromatics, such as monoaromatic-steroids.
Because of their polarity, these compounds are more soluble in polar solvents, including water, compared
to non-polar compounds of similar molecular structure.
Pour Point: The lowest temperature at which an oil will appear to flow under ambient pressure over a
period of five seconds. The pour point of crude oils generally varies from -60 °C to 30 °C. Lighter oils
with low viscosities generally have lower pour points.
6
Resins: This is the name given to a large group of polar compounds in oil. These include hetero-
substituted aromatics, acids, ketones, alcohols and monoaromatic steroids. Because of their polarity, these
compounds are more soluble in polar solvents, including water, than the non-polar compounds, such as
waxes and aromatics, of similar molecular weight. They are largely responsible for oil adhesion.
RRF: Relative response factor.
Saturates (Saturated Fraction): Nonaromatichydrocarbons in petroleum. This grouping includes both
normal and branched alkanes (paraffins), and cycloalkanes (naphthenes).
SIM (Selecting Ion Monitoring): Mass spectrometric monitoring of a specific mass/charge (m/z) ratio.
The SIM mode offers better sensitivity than can be obtained using the full scan mode.
Solubility: The amount of a substance (solute) that dissolves in a given amount of another substance
(solvent). Particularly relevant to oil spill cleanup is the measure of how much and the composition of oil
which will dissolve in the water column. This is important as the soluble fractions of the oil are often toxic
to aquatic life, especially at high concentrations. Thesolubility of oil in water is very low, generally less than
1parts per million (ppm).
Steranes: A class of tetracyclic, saturated biomarkers constructed from six isoprene subunits (~C30).
Steranes are derived from sterols, which are important membrane and hormone components in eukaryotic
organisms. Most commonly used steranes are in the range of C26 to C30 and are detected using m/z 217
mass chromatograms.
Surrogate Analyte: A pure analyte that is extremely unlikely to be found in any sample, which is added
to a sample aliquot in a known amount and is measured with the same procedures used to measure other
components. The purpose of a surrogate analyte is to monitor the method performance with each sample.
Terpanes: A broad class of complex branched, cyclic alkane biomarkers including hopanes and tricyclic
compounds. They are commonly monitored using m/z 191 mass chromatograms.
Triterpanes: A class of cyclic saturated biomarkers constructed from six isoprene subunits. Cyclic
terpane compounds containing two, four, and six isoprene subunits are called monoterpane (C10),
diterpane (C20) and triterpane (C30), respectively.
Total n-alkanes: The sum of all resolved n-alkanes (from C8 to C40 plus pristane and phytane).
Total 5 Alkylated PAH Homologues: The sum of the 5 target PAHs (naphthalene, phenanthrene,
dibenzothiophene, fluorene, chrysene) and their alkylated (C1 to C4) homologues, as determined by GC
MS. These 5 target alkylated PAH homologous series are oil-characteristic aromatic compounds.
7
Total Aromatics: The sum of all resolved and unresolved aromatic hydrocarbons including the total of
BTEX and other alkyl benzene compounds, total 5 target alkylated PAH homologues, and other EPA
priority PAHs.
Total Saturates: The sum of all resolved and unresolved aliphatic hydrocarbons including the total n-
alkanes, branched alkanes, and cyclic saturates.
Vapour Pressure: A measure of how oil partitions between the liquid and gas phases, or the partial
pressure of a vapour above a liquid oil at a fixed temperature.
Viscosity: Viscosity is the resistance of a fluid to shear, movement or flow. The viscosity of an oil is a
function of its composition. In general, the greater the fraction of saturates and aromatics and the lower
the amount of asphaltenes and resins, the lower the viscosity. As oil weathers, the evaporation of the
lighter components leads to increased viscosity. Viscosity also increases with decreased temperature, and
decreases with increased temperature.
The viscosity of an ideal, non-interacting fluid does not change with shear rate. Such fluids are called
Newtonian. Most crude oils and oil products are Newtonian. The viscosity of non-Newtonian materials
may vary with shear rate, as well as duration of shear. Oils with highwax content are often non-Newtonian,
and stable water-in-oil emulsions are always non-Newtonian. A material that exhibits a decrease in
viscositywith shear stress is termed pseudoplastic, while those that exhibit a decrease in viscosity with time
of applied shear force are referred to as thixotropic. Both effects are caused by internal interactions of the
molecules and larger structures in the fluid which change with the movement of the material under applied
stress. Generally, non-Newtonian oils are pseudoplastic, while emulsions may be either thixotropic or
pseudoplastic.
In terms of oil spill cleanup, viscous oils do not spread rapidly, do not penetrate soils as rapidly, and affect
the ability of pumps and skimmers to handle the oil.
Volatile Organic Compounds (VOC): Organic compounds with high vapour pressures at normal
temperatures. VOCs include light saturates and aromatics, such as pentane, hexane, BTEX and other
lighter substituted benzene compounds, which can make up to a few percent of the total mass of some
crude oils.
Waxes: Waxes are predominately straight-chain saturates with melting points above 20 °C (generally,
the n-alkanes C18 and heavier).
Weathering: Processes related to the physical and chemical actions of air, water and organisms after oil
spill. The major weathering processes include evaporation, dissolution, dispersion, photochemical oxidation,
water-in-oil emulsification, microbial degradation, adsorption onto suspended particulate materials,
interaction with mineral fines, sinking, sedimentation, and formation of tar balls.
8

UCM: GC unresolved complex mixture of hydrocarbons. The UCM appear as the “envelope” or hump
area between the solvent baseline and the curve defining the base of resolvable peaks.
9
3. Methods for Measurement of Physical and Chemical Properties of
Selected Oils
3.1 Selection and Collection of Oils
Ten oils and refined petroleum products with significant potential to be spilled in U.S. waters were
chosen based on discussion with the US EPA. These oils were collected by ESTD from various
oil companies and refineries in North America. The oils include: Alberta Sweet Mix Blend
(Reference #5), Arabian Light, South Louisiana, West Texas Intermediate, Sockeye, Alaska North
Slope, Fuel Oil No.2, Fuel Oil No.5 (“Bunker B”), Heavy Fuel Oil 6303 (“Bunker C”), and
Orimulsion-400.
3.2 Instruments
The major instruments used to determine the oil physical properties and chemical composition are
the following:
•Oil Weathering System (Wheaton Spin-Vap –10)
•GC-MS (HP)
•GC-FID (HP)
•XRF (Spectro Titan)
•Viscometer (ThermoHaake VT550)
•Rheometer (ThermoHaake RheoStress 300)
•Density meter (Anton Parr DMA 48)
•Flash point analyzer (Herzog HFP360/362)
•Vapor pressure tester (Herzog HVP970)
•Karl Fisher automatic titrator (Metrohm)
•Tensiometer (Krüss K10)
3.3 Evaporation (Weathering) of Oils
A laboratory oil-weathering technique by rotary evaporation is used by Emergencies Science and
Technology Division to artificially weather oils with varying degrees of weight loss. The oil-
weathering system consists of a Wheaton N-10 Spin Vap with a 10 L flask, an integral water bath
(capacity 14 L), a Haake F3-CH circulating bath and a Millipore vacuum pump (Figure 1). The
bath temperature can be set from 20 °C to 100 °C ± 0.5 °C. The rotation speed can be
continuously varied from 10 to 135 rpm.
10
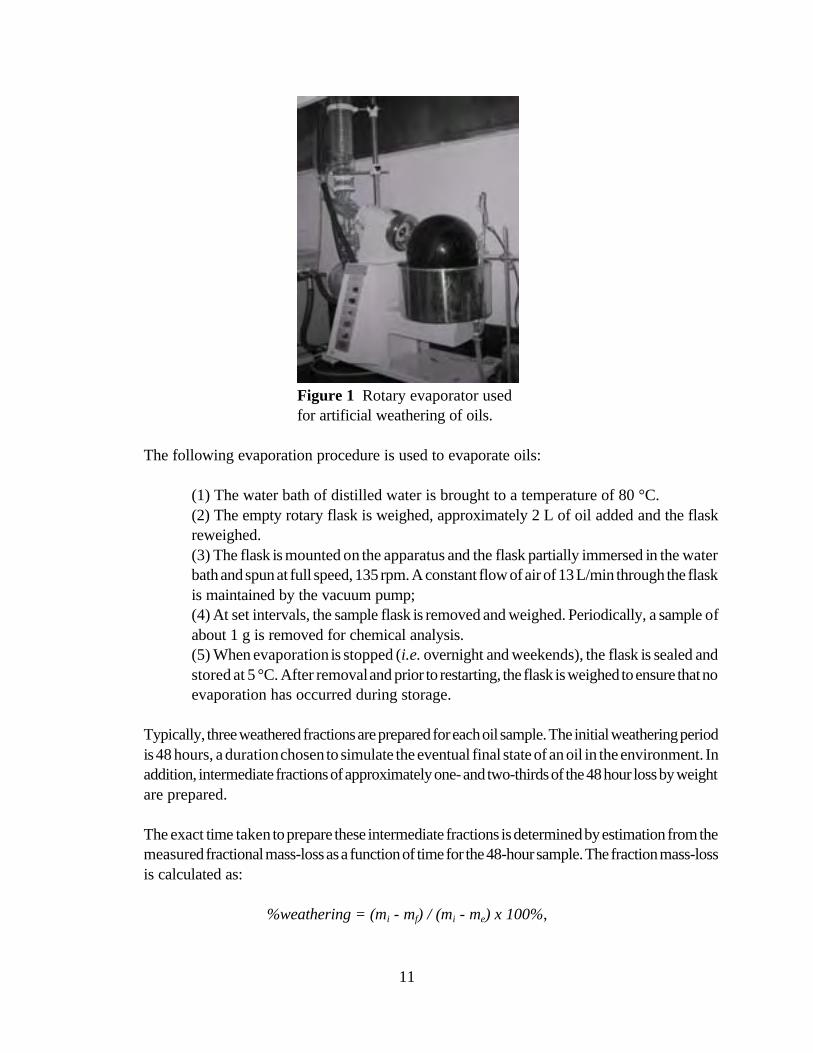
Figure 1 Rotary evaporator used
for artificial weathering of oils.
The following evaporation procedure is used to evaporate oils:
(1) The water bath of distilled water is brought to a temperature of 80 °C.
(2) The empty rotary flask is weighed, approximately 2 L of oil added and the flask
reweighed.
(3) The flask is mounted on the apparatus and the flask partially immersed in the water
bath and spun at full speed, 135 rpm. A constant flow of air of 13 L/min through the flask
is maintained by the vacuum pump;
(4) At set intervals, the sample flask is removed and weighed. Periodically, a sample of
about 1 g is removed for chemical analysis.
(5) When evaporation is stopped (i.e. overnight and weekends), the flask is sealed and
stored at 5 °C. After removal and prior to restarting, the flask is weighed to ensure that no
evaporation has occurred during storage.
Typically, three weathered fractions are prepared for each oil sample. The initial weathering period
is 48 hours, a duration chosen to simulate the eventual final state of an oil in the environment. In
addition, intermediate fractions of approximately one- and two-thirds of the 48 hour loss by weight
are prepared.
The exact time taken to prepare these intermediate fractions is determined by estimation from the
measured fractional mass-loss as a function of time for the 48-hour sample. The fraction mass-loss
is calculated as:
%weathering = (mi - mf) / (mi - me) x 100%,
11
where, %weathering is the percentage evaporative mass-loss over the 48 hour period, mi is the
initial mass of the flask and oil, mf is the final mass of the flask and oil, and me is the mass of the
emptyflask. A graph of %weathering as a function of time is plotted using the interval weighing
data.
The times for one-third (t1/3) and two-thirds (t2/3) of the final mass loss are interpolated from the
time-weathering graph. Typical times for t1/3 range from 30 minutes to 2 hours, for t2/3, 8 to 12
hours.
This technique allows for precise control of the evaporative weight loss for a target oil, and can be
directly correlated to compositional changes of the target weathered oil. By tracking weight loss
as a function of time, an equation for predicting evaporation can be found. Also, from this same
graph, it is possible to determine a point at which the evaporation rate is sufficiently slow that the
oil may be considered to have achieved the maximum evaporative loss likely to be observed under
the conditions of a marine spill.
3.4 Equation(s) for Predicting Evaporation
The evaporation kinetics, reported as percentage mass loss as a function of time, are determined
for each oil by measuring the weight loss over time from a shallow dish (Fingas 97, Fingas 98a,
Fingas 01). Approximately 20 g of oil is weighed into a 139mm petri dish. Measurements are
conducted in a climate-controlled chamber at 15 °C. Temperatures are monitored by a digital
thermometer. The oil weight is recorded by an electronic balance accurate to 0.01 g at
geometrically increasing intervals and collected on a computer logging system. Near the anticipated
end of the run, the measurement interval is reset such that the number of points near the beginning
and end of the run are approximately equal. The evaporation period can last froma few days for
light oils to weeks for heavier products.
The time versus weight loss data series are fitted to a set of simple equations. From long
experience (Fingas 98a, Fingas 01), either a square-root or a natural logarithm function is chosen
as the simplest, most representative equation for evaporative mass loss. The best-fit equations have
the form:
%Ev = ( A + B T) ln t
%Ev = ( A + B T) t1/2
where: %Ev is weight-percent evaporated, T is the oil surface temperature (°C), t is time (in
minutes), and A and B are constants fitted to the measured data.
The apparatus is periodically checked by conducting a run with a 15-g mass in place of the oil.
12
- -
3.5 Method for Determining Sulphur Content
The mass fraction of atomic sulphur in oil is determined using X-ray fluorescence by closely
following ASTM method D 4294.
The XRF spectrometer is calibrated using a duplicate series of six NIST sulphur-in-oil standards.
A linear calibration chart is prepared from the twelve standard measurements. Single element
standards are used to calibrate and remove chlorine interference in the sulphur signal. Instrument
and operator performance is monitored by a triplicate measurement of a check standard consisting
of a known crude oil. Check standard measurements are tracked on a quality control chart.
Approximately 3 g of oil is weighed out into 31mm HDPE XRF cells, sealed with 0.25 mm thick
mylar film. The sealed cells are measured on a Spectro Titan XRF spectrometer. Each unknown
is measured in triplicate and the mean reported as the final value.
3.6 Method for Determining Water Content
The mass fraction of water in oil or an emulsion, expressed as a percentage, is determined by Karl
Fischer titration using a Metrohm 701 automatic titrator. The method used closely follows ASTM
method D 4377. The Karl Fischer reaction is an amine-catalyzed reduction of water in a
methanolic solution:
-CH3OH + SO2 + RN 6 [RNH]+ [SO3CH3]
2RN + H2O + I2 + [RNH]SO3CH3 6 [RNH]+ [SO4CH3] + 2 [RNH]+ I
The amine, RN, or mixture of amines is proprietary to each manufacturer.
A sample of oil or emulsion in the range of 50 to 100 mg is accurately weighed and introduced to
the reaction vessel of the autotitrator. A solution of 1:1:2 (by volume) mixture of
methanol:chloroform:toluene is used as a working fluid. The autotitrator is loaded with 5-mg/mL,
pyridine-free Karl Fischer reagent from a certified supplier. Samples are repeated in triplicate and
the mean reported as the water percentage. The instrument calibration is checked by a series of
five replicate titrations of 25 :L of distilled, deionized water.
3.7 Method for Determining Flash Point
The flash point of an oil or product sample, in degrees Celcius, is determined by one of two
methods, depending on the sample. Lower viscositysamples, including light fuel oils and most
crudes, are measured using a Herzog HFP 362 TAG2 analyzer (Figure 2), following ASTM
method D 1310. Heavier samples, such as intermediate and heavy fuel oils or highly weather crude
oils, are measured using a Herzog 360 Pensky-Martens analyser, following ASTM D 93.
13
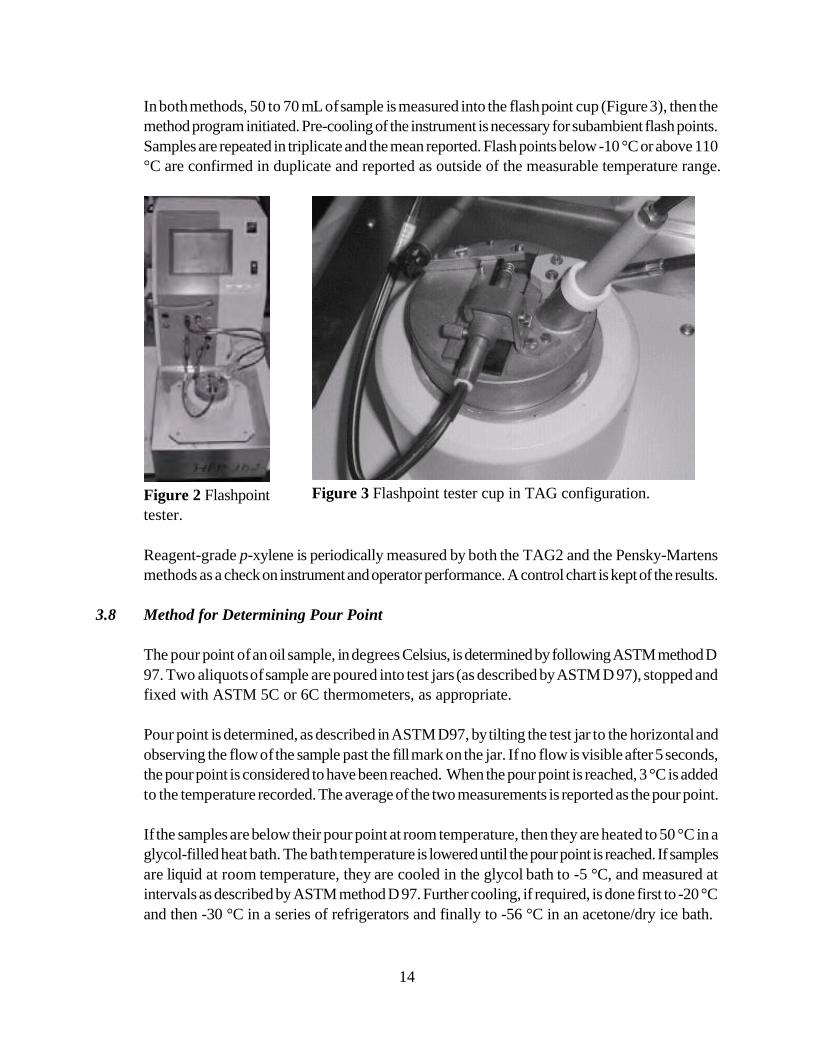
In both methods, 50 to 70 mL of sample is measured into the flash point cup (Figure 3), then the
method program initiated. Pre-cooling of the instrument is necessary for subambient flash points.
Samples are repeated in triplicate and the mean reported. Flash points below -10 °C or above 110
°C are confirmed in duplicate and reported as outside of the measurable temperature range.
Figure 2 Flashpoint Figure 3 Flashpoint tester cup in TAG configuration.
tester.
Reagent-grade p-xylene is periodically measured by both the TAG2 and the Pensky-Martens
methods as a check on instrument and operator performance. A control chart is kept of the results.
3.8 Method for Determining Pour Point
The pour point of an oil sample, in degrees Celsius, is determined by following ASTM method D
97. Two aliquots of sample are poured into test jars (as described by ASTM D 97), stopped and
fixed with ASTM 5C or 6C thermometers, as appropriate.
Pour point is determined, as described in ASTM D97, by tilting the test jar to the horizontal and
observing the flow of the sample past the fill mark on the jar. If no flow is visible after 5 seconds,
the pour point is considered to have been reached. When the pour point is reached, 3 °C is added
to the temperature recorded. The average of the two measurements is reported as the pour point.
If the samples are below their pour point at room temperature, then they are heated to 50 °C in a
glycol-filled heat bath. The bath temperature is lowered until the pour point is reached. If samples
are liquid at room temperature, they are cooled in the glycol bath to -5 °C, and measured at
intervals as described by ASTM method D 97. Further cooling, if required, is done first to -20 °C
and then -30 °C in a series of refrigerators and finally to -56 °C in an acetone/dry ice bath.
14
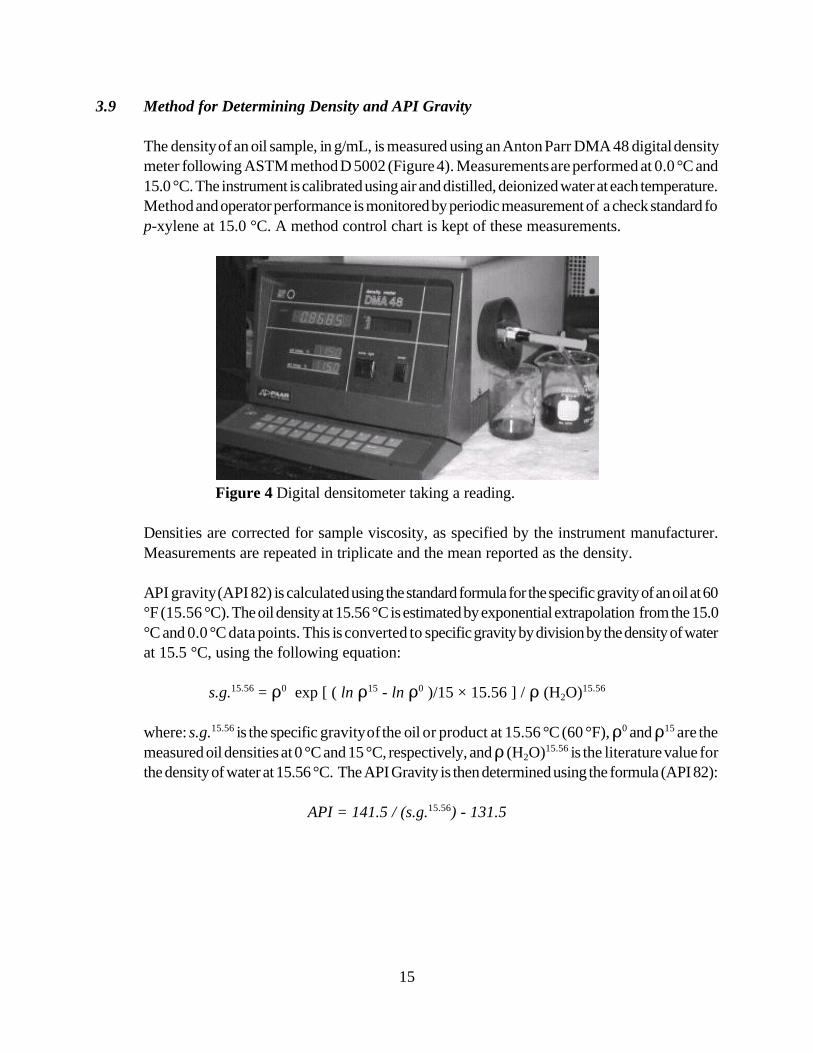
3.9 Method for Determining Density and API Gravity
The density of an oil sample, in g/mL, is measured using an Anton Parr DMA 48 digital density
meter following ASTM method D 5002 (Figure 4). Measurements are performed at 0.0 °C and
15.0 °C. The instrument is calibrated using air and distilled, deionized water at each temperature.
Method and operator performance is monitored by periodic measurement of a check standard fo
p-xylene at 15.0 °C. A method control chart is kept of these measurements.
Figure 4 Digital densitometer taking a reading.
Densities are corrected for sample viscosity, as specified by the instrument manufacturer.
Measurements are repeated in triplicate and the mean reported as the density.
API gravity(API 82) is calculated using the standard formula for the specific gravity of an oil at 60
°F (15.56 °C). The oil density at 15.56 °C is estimated by exponential extrapolation from the 15.0
°C and 0.0 °C data points. This is converted to specific gravity by division by the density of water
at 15.5 °C, using the following equation:
0 0s.g. 15.56 = D exp [ ( ln D15 - ln D )/15 × 15.56 ] / D (H2O)15.56
where: s.g. 15.56 is the specific gravityof the oil or product at 15.56 °C (60 °F), D0 and D15 are the
measured oil densities at 0 °C and 15 °C, respectively, and D (H2O)15.56 is the literature value for
the density of water at 15.56 °C. The API Gravity is then determined using the formula (API 82):
API = 141.5 / (s.g.15.56) - 131.5
15
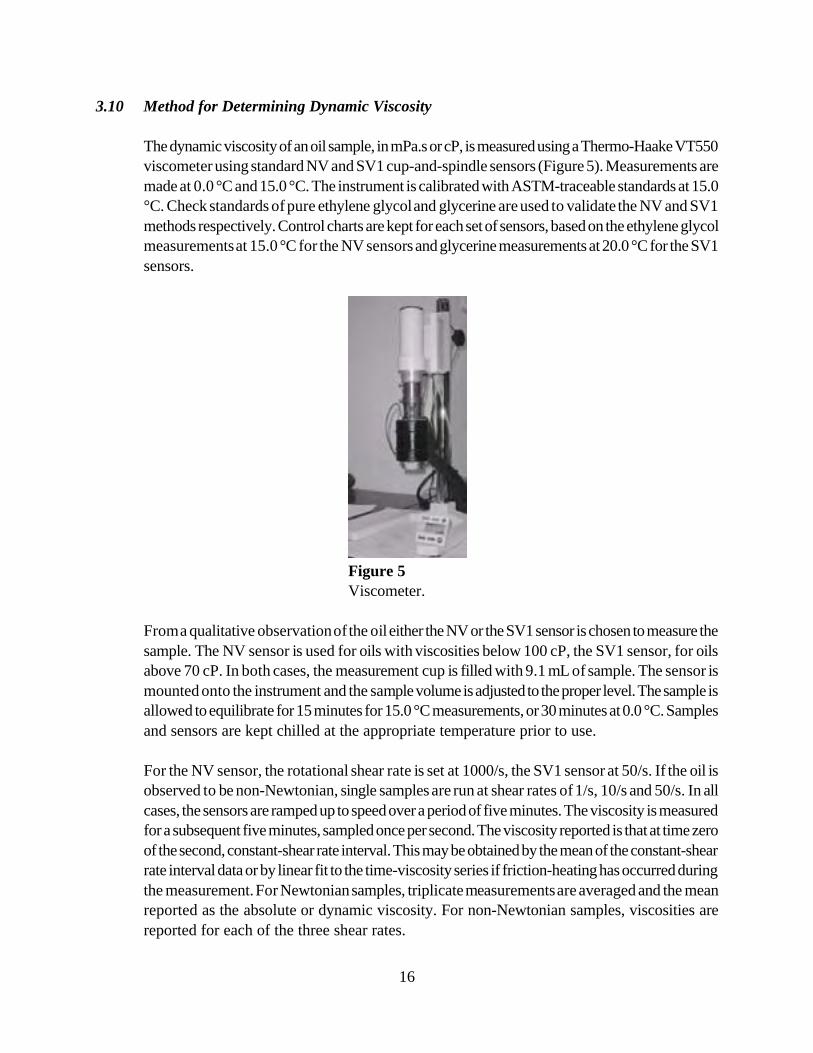
3.10 Method for Determining Dynamic Viscosity
The dynamic viscosity of an oil sample, in mPa.s or cP, is measured using a Thermo-Haake VT550
viscometer using standard NV and SV1 cup-and-spindle sensors (Figure 5). Measurements are
made at 0.0 °C and 15.0 °C. The instrument is calibrated with ASTM-traceable standards at 15.0
°C. Check standards of pure ethylene glycol and glycerine are used to validate the NV and SV1
methods respectively. Control charts are kept for each set of sensors, based on the ethylene glycol
measurements at 15.0 °C for the NV sensors and glycerine measurements at 20.0 °C for the SV1
sensors.
Figure 5
Viscometer.
From a qualitative observation of the oil either the NV or the SV1 sensor is chosen to measure the
sample. The NV sensor is used for oils with viscosities below 100 cP, the SV1 sensor, for oils
above 70 cP. In both cases, the measurement cup is filled with 9.1 mL of sample. The sensor is
mounted onto the instrument and the sample volume is adjusted to the proper level. The sample is
allowed to equilibrate for 15 minutes for 15.0 °C measurements, or 30 minutes at 0.0 °C. Samples
and sensors are kept chilled at the appropriate temperature prior to use.
For the NV sensor, the rotational shear rate is set at 1000/s, the SV1 sensor at 50/s. If the oil is
observed to be non-Newtonian, single samples are run at shear rates of 1/s, 10/s and 50/s. In all
cases, the sensors are ramped up to speed over a period of five minutes. The viscosity is measured
for a subsequent five minutes, sampled once per second. The viscosity reported is that at time zero
of the second, constant-shear rate interval. This may be obtained by the mean of the constant-shear
rate interval data or by linear fit to the time-viscosity series if friction-heating has occurred during
the measurement. For Newtonian samples, triplicate measurements are averaged and the mean
reported as the absolute or dynamic viscosity. For non-Newtonian samples, viscosities are
reported for each of the three shear rates.
16
3.11 Method for the Evaluation of the Stability of Emulsions Formed from Saline and Oils
and Oil Products
Water-in-oil emulsions are formed in 2.2-litre fluorinated vessels on an end-over-end rotary mixer
(Associated Design, VA) at a nominal rotational speed of 50 RPM (Jokuty 95, Fingas 98b).
(1) A 600-mL volume of salt water (3.3% w/v NaCl) is dispensed into a mixing vessel.
(2) A 30-mL aliquot of oil is added to each vessel for a 1:20 oil:water ratio.
(3) The vessels are sealed and placed in the rotary mixer such that the cap of each mixing
vessel follows, rather than leads, the direction of rotation. The rotary mixer is kept in a
temperature controlled cold room at 15 °C .
(4) The vessels and their contents are allowed to stand for approximately 4 hours before
rotation begins, then mixed continuously for 12 hours.
(5) At the conclusion of the mixing time, the emulsions are collected from the vessels for
measurement of water content, viscosity and the complex modulus. The emulsions are
stored in the cold room at 15 °C for one week, then observed for changes in physical
appearance.
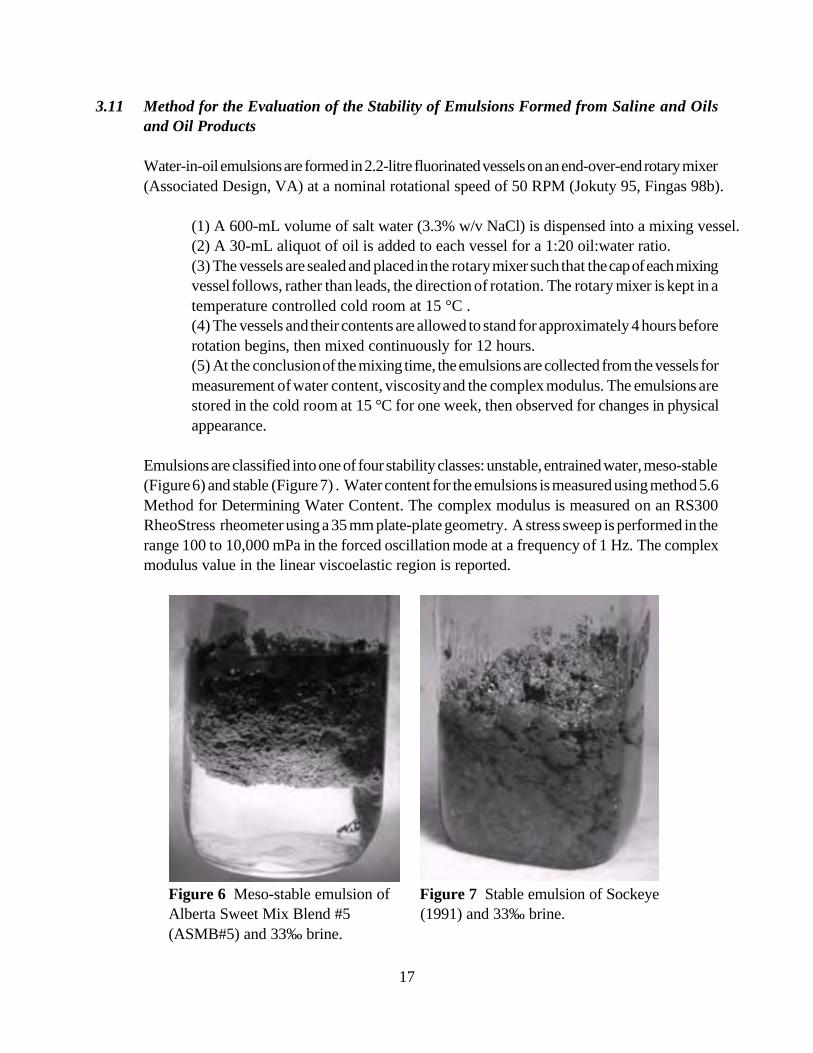
Emulsions are classified into one of four stability classes: unstable, entrained water, meso-stable
(Figure 6) and stable (Figure 7) . Water content for the emulsions is measured using method 5.6
Method for Determining Water Content. The complex modulus is measured on an RS300
RheoStress rheometer using a 35 mm plate-plate geometry. A stress sweep is performed in the
range 100 to 10,000 mPa in the forced oscillation mode at a frequency of 1 Hz. The complex
modulus value in the linear viscoelastic region is reported.
Figure 6 Meso-stable emulsion of Figure 7 Stable emulsion of Sockeye
Alberta Sweet Mix Blend #5 (1991) and 33‰ brine.
(ASMB#5) and 33‰ brine.
17
3.12 Method for Determining the Chemical Dispersibility of an Oil or Oil Product
This method determines the relative ranking of effectiveness for the dispersibility of an oil sample
by the surfactant Corexit 9500. This method follows closely ASTM F2059.
A pre-mix of 1:25.0 dispersant:oil is made up by adding oil to 100mg of dispersant (approximately
2.50mL of oil in total).
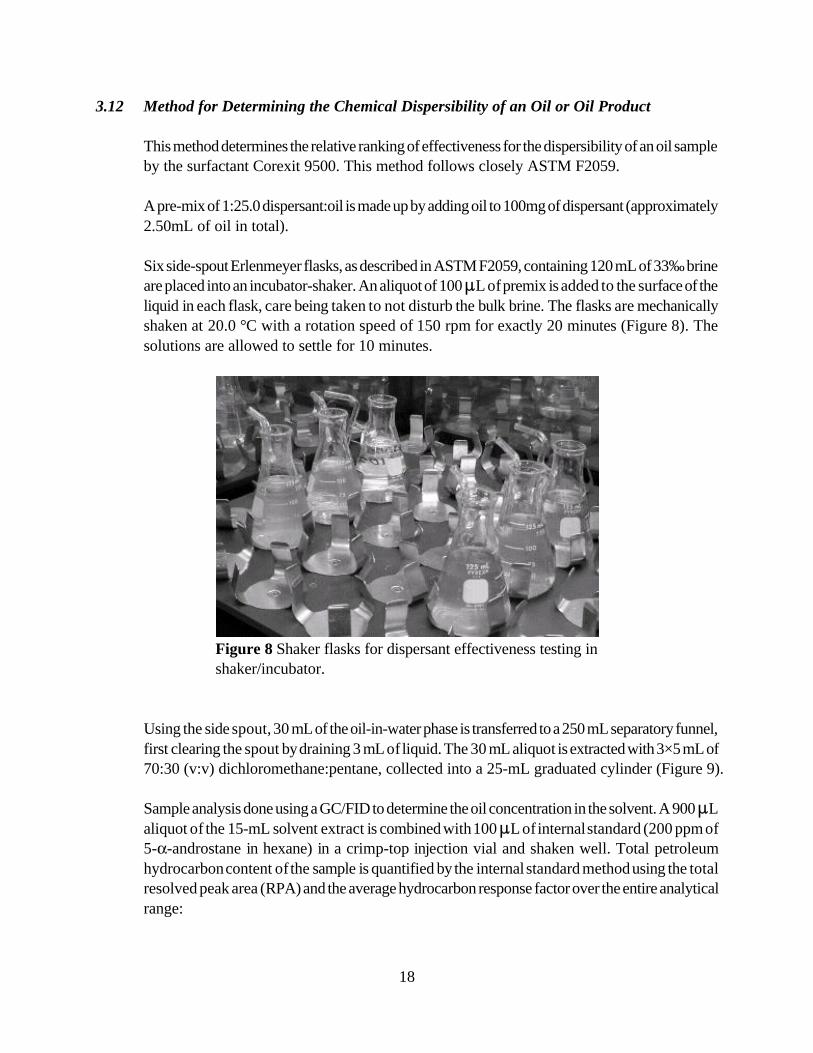
Six side-spout Erlenmeyer flasks, as described in ASTM F2059, containing 120 mL of 33‰ brine
are placed into an incubator-shaker. An aliquot of 100 :L of premix is added to the surface of the
liquid in each flask, care being taken to not disturb the bulk brine. The flasks are mechanically
shaken at 20.0 °C with a rotation speed of 150 rpm for exactly 20 minutes (Figure 8). The
solutions are allowed to settle for 10 minutes.
Figure 8 Shaker flasks for dispersant effectiveness testing in
shaker/incubator.
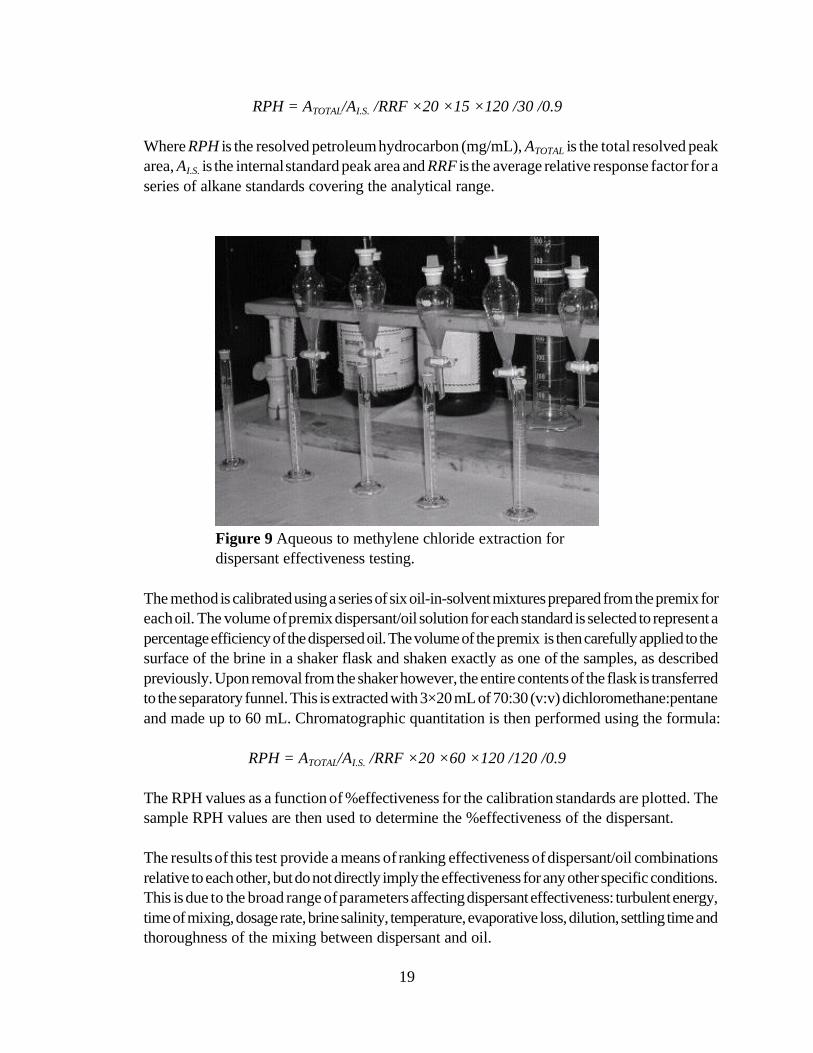
Using the side spout, 30 mL of the oil-in-water phase is transferred to a 250 mL separatory funnel,
first clearing the spout by draining 3 mL of liquid. The 30 mL aliquot is extracted with 3×5 mL of
70:30 (v:v) dichloromethane:pentane, collected into a 25-mL graduated cylinder (Figure 9).
Sample analysis done using a GC/FID to determine the oil concentration in the solvent. A 900 :L
aliquot of the 15-mL solvent extract is combined with 100 :L of internal standard (200 ppm of
5-α-androstane in hexane) in a crimp-top injection vial and shaken well. Total petroleum
hydrocarbon content of the sample is quantified by the internal standard method using the total
resolved peak area (RPA) and the average hydrocarbon response factor over the entire analytical
range:
18
RPH = ATOTAL/AI.S. /RRF ×20 ×15 ×120 /30 /0.9
Where RPH is the resolved petroleum hydrocarbon (mg/mL), ATOTAL is the total resolved peak
area, AI.S. is the internal standard peak area and RRF is the average relative response factor for a
series of alkane standards covering the analytical range.
Figure 9 Aqueous to methylene chloride extraction for
dispersant effectiveness testing.
The method is calibrated using a series of six oil-in-solvent mixtures prepared from the premix for
each oil. The volume of premix dispersant/oil solution for each standard is selected to represent a
percentage efficiency of the dispersed oil. The volume of the premix is then carefully applied to the
surface of the brine in a shaker flask and shaken exactly as one of the samples, as described
previously. Upon removal from the shaker however, the entire contents of the flask is transferred
to the separatory funnel. This is extracted with 3×20 mL of 70:30 (v:v) dichloromethane:pentane
and made up to 60 mL. Chromatographic quantitation is then performed using the formula:
RPH = ATOTAL/AI.S. /RRF ×20 ×60 ×120 /120 /0.9
The RPH values as a function of %effectiveness for the calibration standards are plotted. The
sample RPH values are then used to determine the %effectiveness of the dispersant.
The results of this test provide a means of ranking effectiveness of dispersant/oil combinations
relative to each other, but do not directly imply the effectiveness for any other specific conditions.
This is due to the broad range of parameters affecting dispersant effectiveness: turbulent energy,
time of mixing, dosage rate, brine salinity, temperature, evaporative loss, dilution, settling time and
thoroughness of the mixing between dispersant and oil.
19
3.13 Method for the Determination of the Hydrocarbon Group Constituents
The asphaltene and resin mass fractions (Speight 91) of an oil or oil product are determined
gravimetrically. The asphaltene precipitation is a minor variation on the procedure given in ASTM
method D 2007. The saturate fraction (F1) and aromatic fraction (F2) are calculated by mass-
balance from the total petroleum hydrocarbon measurement, method 3.17, following. Wax content
is determined by summing the individual areas for then-alkanes n-C18 upto n-C120 in the simulated
boiling point chromatograms, obtained in method 3.16.
A 60 mL quantity ofn-pentane is added to a pre-weighed sample of approximately 5g of oil. The
flask is shaken well and allowed to stand for 30 minutes. The sample is filtered through a 0.45-:m
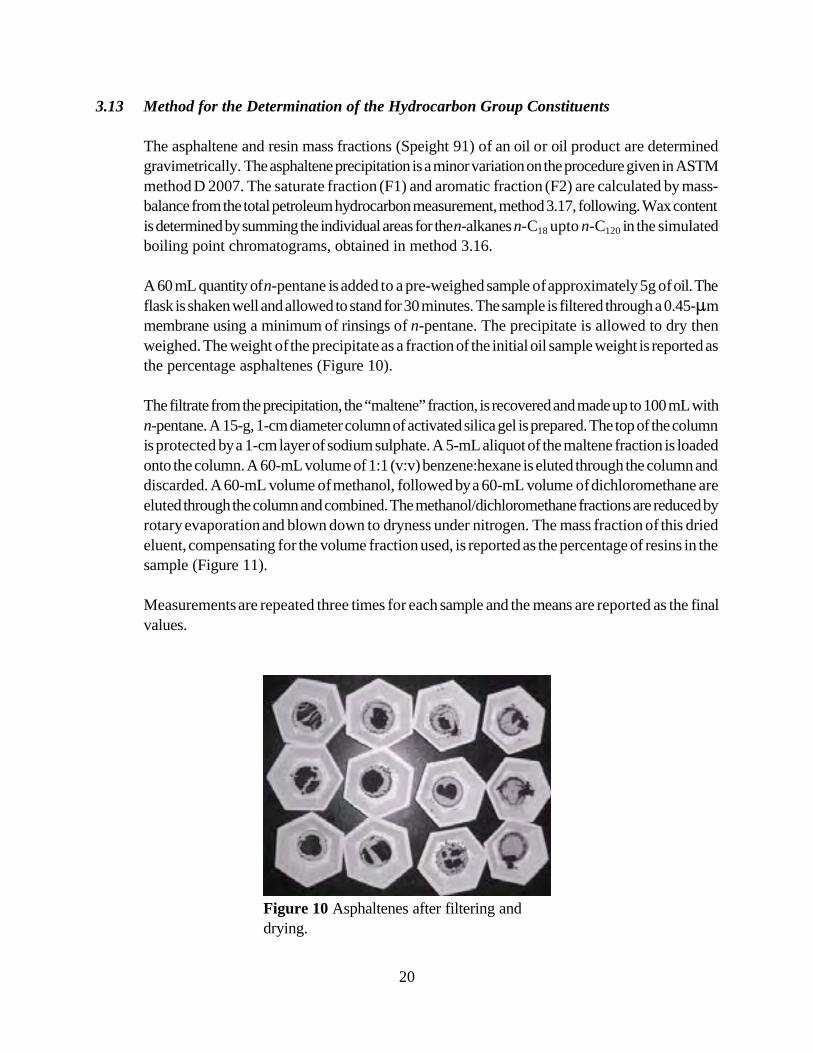
membrane using a minimum of rinsings of n-pentane. The precipitate is allowed to dry then
weighed. The weight of the precipitate as a fraction of the initial oil sample weight is reported as
the percentage asphaltenes (Figure 10).
The filtrate from the precipitation, the “maltene” fraction, is recovered and made up to 100 mL with
n-pentane. A 15-g, 1-cm diameter column of activated silica gel is prepared. The top of the column
is protected by a 1-cm layer of sodium sulphate. A 5-mL aliquot of the maltene fraction is loaded
onto the column. A 60-mL volume of 1:1 (v:v) benzene:hexane is eluted through the column and
discarded. A 60-mL volume of methanol, followed by a 60-mL volume of dichloromethane are
eluted through the column and combined. The methanol/dichloromethane fractions are reduced by
rotary evaporation and blown down to dryness under nitrogen. The mass fraction of this dried
eluent, compensating for the volume fraction used, is reported as the percentage of resins in the
sample (Figure 11).
Measurements are repeated three times for each sample and the means are reported as the final
values.
Figure 10 Asphaltenes after filtering and
drying.
20
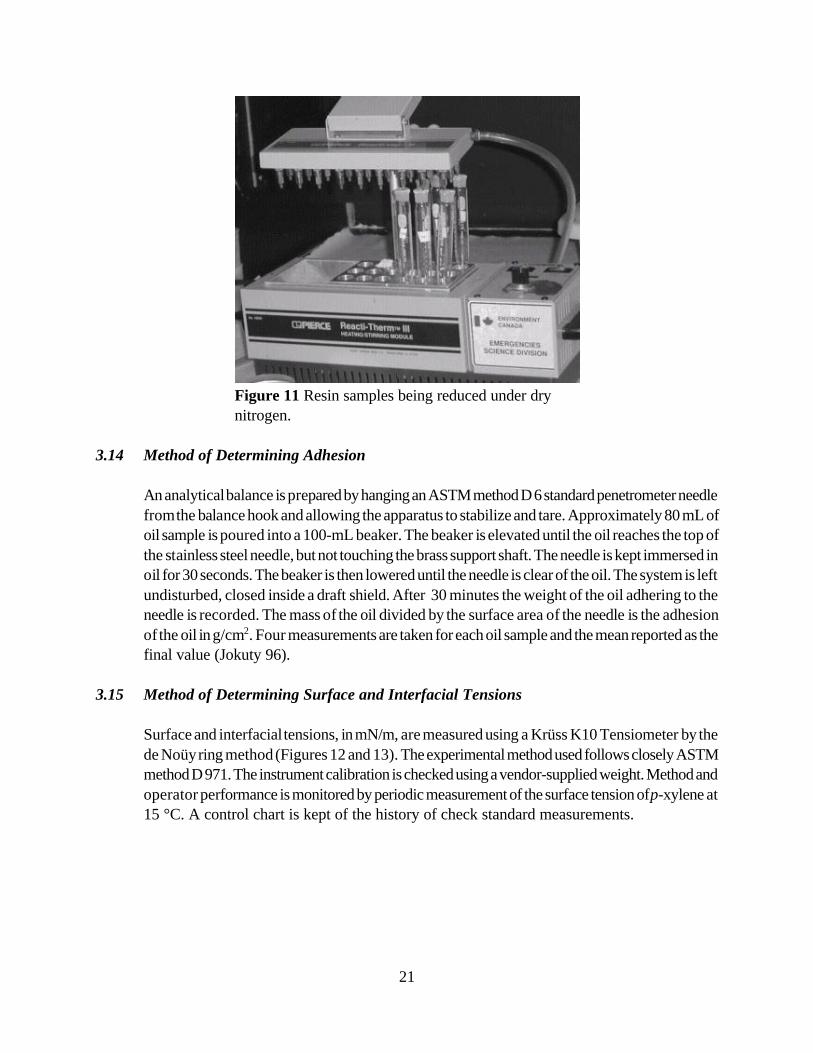
Figure 11 Resin samples being reduced under dry
nitrogen.
3.14 Method of Determining Adhesion
An analytical balance is prepared by hanging an ASTM method D 6 standard penetrometer needle
fromthe balance hook and allowing the apparatus to stabilize and tare. Approximately 80 mL of
oil sample is poured into a 100-mL beaker. The beaker is elevated until the oil reaches the top of
the stainless steel needle, but not touching the brass support shaft. The needle is kept immersed in
oil for 30 seconds. The beaker is then lowered until the needle is clear of the oil. The system is left
undisturbed, closed inside a draft shield. After 30 minutes the weight of the oil adhering to the
needle is recorded. The mass of the oil divided by the surface area of the needle is the adhesion
of the oil in g/cm2. Four measurements are taken for each oil sample and the mean reported as the
final value (Jokuty 96).
3.15 Method of Determining Surface and Interfacial Tensions
Surface and interfacial tensions, in mN/m, are measured using a Krüss K10 Tensiometer by the
de Noüy ring method (Figures 12 and 13). The experimental method used follows closely ASTM
method D 971. The instrument calibration is checked using a vendor-supplied weight. Method and
operator performance is monitored by periodic measurement of the surface tension of p-xylene at
15 °C. A control chart is kept of the history of check standard measurements.
21
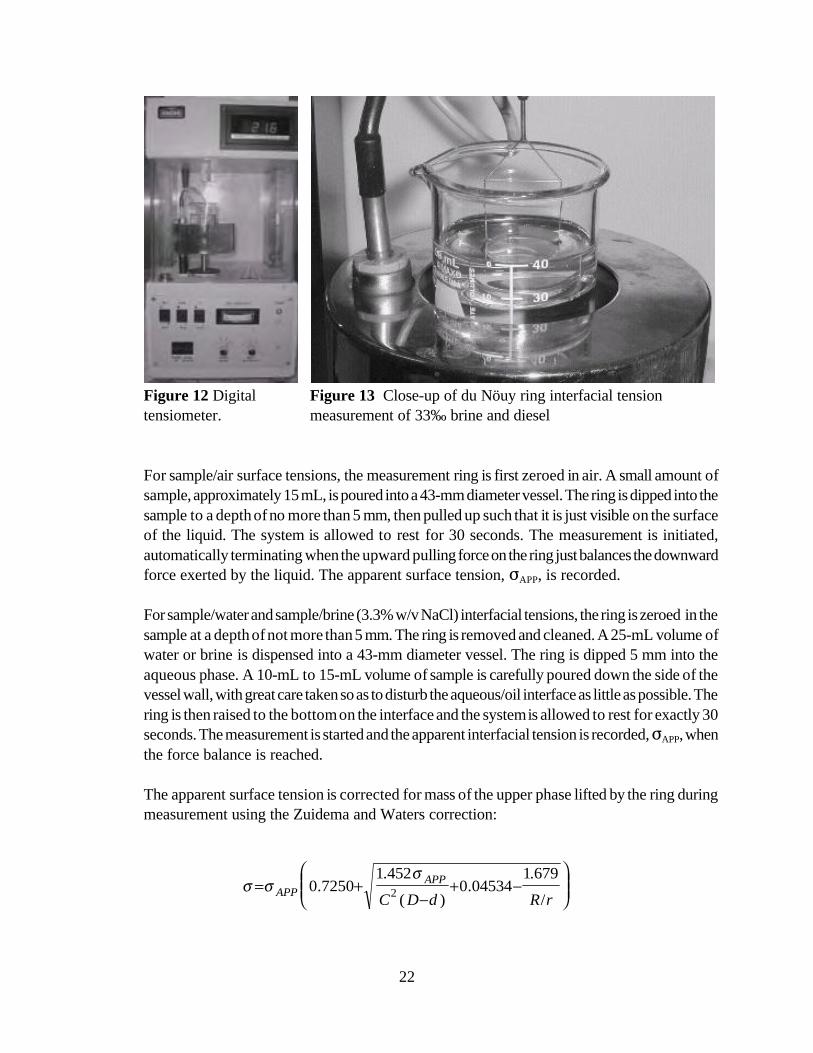
Figure 12 Digital Figure 13 Close-up of du Nöuy ring interfacial tension
tensiometer. measurement of 33‰ brine and diesel
For sample/air surface tensions, the measurement ring is first zeroed in air. A small amount of
sample, approximately 15 mL, is poured into a 43-mm diameter vessel. The ring is dipped into the
sample to a depth of no more than 5 mm, then pulled up such that it is just visible on the surface
of the liquid. The system is allowed to rest for 30 seconds. The measurement is initiated,
automatically terminating when the upward pulling force on the ring just balances the downward
force exerted by the liquid. The apparent surface tension, FAPP, is recorded.
For sample/water and sample/brine (3.3% w/v NaCl) interfacial tensions, the ring is zeroed in the
sample at a depth of not more than 5 mm. The ring is removed and cleaned. A 25-mL volume of
water or brine is dispensed into a 43-mm diameter vessel. The ring is dipped 5 mm into the
aqueous phase. A 10-mL to 15-mL volume of sample is carefully poured down the side of the
vessel wall, with great care taken so as to disturb the aqueous/oil interface as little as possible. The
ring is then raised to the bottom on the interface and the system is allowed to rest for exactly 30
seconds. The measurement is started and the apparent interfacial tension is recorded, FAPP, when
the force balance is reached.
The apparent surface tension is corrected for mass of the upper phase lifted by the ring during
measurement using the Zuidema and Waters correction:
⎛ 1 452σ 1 679 ⎞ APP .
σ =σ APP ⎜⎜⎝
0 7250 . + .
2 −+0 04534. − ⎟⎟⎠C ( D d ) R r/
22
where: F is the interfacial tension, FAPP is the instrument scale reading, C is the ring diameter, D
is the densityof the lower phase, d is the density of the upper phase, R is the radius of the du Noüy
ring, and r is the radius of the ring wire. Measurements are made at 0.0 °C and 15.0 °C and
repeated in triplicate. Samples, aqueous phases and glassware are all kept at temperature for a
minimum of 30 minutes before measurement. The mean of at least three corrected interfacial
tensions is reported as the measured value.
3.16 Method for Determining the Simulated Boiling Point Distribution
This analysis is performed on an Analytical Controls SIMDIS analyser, a modified Hewlett-
Packard 5890 series II gas chromatograph. The system has a custom cryogenically-cooled inlet
and a high-temperature column. Reference and calibration mixtures are run according to Analytical
Controls specifications.
Oil samples are made up as 2% (m/m) solutions in carbon disulphide. An aliquot of 0.5 :L is
injected into the inlet. The inlet temperature program runs from 40 °C to 430 °C a 70 °C per
minute. The oven temperature program runs from -20 °C for 1 min, ramp at 10 0C/min to 430 0C,
and hold for 3 minutes at this final temperature. The flame ionization detector operates at 430 °C.
The Analytical Controls Software outputs a series of simulated boiling point ranges as a function
of temperature and has the option of producing a “wax report” for the relative abundances of all
n-alkanes in the oil sample.
3.17 Method for the Determination of Individual (n–Alkanes and Isoprenoids) and Total
Petroleum Hydrocarbons (TPH), Polycyclic Aromatic Hydrocarbons (PAHs) and
Biomarker Triterpanes and Steranes in Oil and Oil-spill-related Environmental Samples
(Water, Particulates and Soils/Sediments)
A chromatographic column with a PTFE-stopcock (10.5 mm I.D. x 200 mm length) is plugged
with borosilicate glass wool at the bottom, and serially rinsed with methanol, hexane and
dichloromethane, and allowed to dry. The column is dry-packed with 3 grams of activated silica
gel with tapping to settle the silica gel, and topped with about 0.5 cm anhydrous sodium sulphate.
The column is conditioned with 20 mL of hexane, and the eluent is discarded. Just prior to
exposure of the sodium sulphate layer to air, a 200 :L of crude oil solution containing
approximately 16 mg of oil (~80 mg/mL in hexane) is quantitatively transferred onto the column
using an additional 3 mL of hexane to complete the transfer. All eluent up to this point is discarded.
Twelve mL of hexane is used to elute aliphatic hydrocarbons, and 15 mL of 50% benzene in
hexane (v/v) is used to elute aromatic hydrocarbons.
Half of the hexane fraction (labelled "F1") is used for analysis of aliphatics, triterpanes and steranes;
half of the 50% benzene fraction is labelled "F2" and used for analysis of target PAHs and alkylated
PAH homologues. The remaining half of F1 and F2 is combined into a fraction (labelled as "F3")
23
and used for the determination of total petroleum hydrocarbons (TPH). These three fractions are
concentrated under a stream of nitrogen to appropriate volumes, spiked with internal standards (5-
α-androstane for GC-TPH and n-alkane determination, d14-terphenyl for PAH analysis, and C30-
ββ-hopane for biomarker analysis), and then adjusted to accurate preinjection volume of 0.5 mL
for GC-MS and GC-FID analysis (see Figure 1 for oil analysis protocol).
The concentrations of individual n-alkanes, selected isoprenoids such as pristane and phytane, and
total petroleum hydrocarbons are determined by high resolution capillary GC/FID using the
following equation:
A W D Concentration (µg / g) = 2 × S IS
RRF WSAIS
where:
AS = Response for the analyte in the sample, units may be in area counts or
A
peak height.
IS = Response for the internal standard in the sample, units same as As.
WIS = Amount (µg) of internal standard added to the sample.
D = Dilution factor. If dilution was made on the sample prior to analysis. If no
dilution was made, D = 1, dimensionless.
WS = Weight of sample extracted, g. Either a dry or wet weight may be used,
depending upon the specific application of the data.
Note that F1 and F2 are split in half for analyses, so the final concentration of
individual analytes must be multiplied by 2 in the Equation.
Prior to sample analysis, the instrument is calibrated using a standard solution, which is composed
of C8 through C34 n-alkanes, and 5-α-androstane as the internal standard. A 5-point calibration
is established demonstrating the linear range of the analysis. The relative response factor (RRF) for
each hydrocarbon component is calculated relative to the internal standard. Total GC detectable
petroleum hydrocarbons (TPH), defined as the sum of resolved plus unresolved aliphatic and
aromatic hydrocarbons, is quantified by the internal standard method using the baseline corrected
total area of the chromatogram. The RRF used for the determination of TPH is the average of the
n-alkane relative response factors over the entire analytical range.
Quantitation of target PAHs, alkylated PAH, and dibenzothiophene homologues is performed on
GC/MS in SIM mode with RRFs for each compound determined during instrument calibration. The
ions monitored are 128, 142, 156, 170, and 184 for alkyl homologues of naphthalene; 178, 192,
206, 220, and 234 for phenanthrene alkyl series; 184, 198, 212, and 226 for dibenzothiophene
alkyl series; and 166, 180, 194 and 208 for fluorene alkyl series. The RRF for target PAH
compounds are calculated from authentic standards. PAH alkyl homologues are quantified by using
the straight baseline integration of each level of alkylation. Although the alkylated homologue groups
can be quantified using the RRF of the respective unsubstituted parent PAH compounds, it is
24
preferable to obtain the RRFs directly from alkylated PAH standards, if they are commercially
available. In this project, the RRFs obtained from 1-methyl-naphthalene, 2-methyl-naphthalene,
2,6-dimethyl-naphthalene, 2,3,5-trimethyl-naphthalene, and 1-methyl-phenanthrene are used for
quantitation of 1-methyl-naphthalene, 2-methyl-naphthalene, C2-naphthalene, C3-naphthalene, and
C1-phenanthrene in oil, respectively. The RRFs of 2,3,5-trimethyl-naphthalene and 1-methyl-
phenanthrene are used for quantification of C4-naphthalene, and C2-, C3-, and C4-phenanthrenes
respectively. The selection criteria for the integration and reporting of each alkylated homologue
are based primarily on pattern recognition and the presence of selected confirmation ions.
The average RRF for the biomaker compound C30 17β(H) 21α(H)-hopane is determined relative
to the internal standard C30 17β(H) 21β(H)-hopane. The average RRF for C30 17β(H) 21 α(H)-
hopane (m/z 191) is used for quantitation of C30 17α(H) 21β(H)-hopane and other triterpanes
in the oil sample. For quantitation of steranes, the RRF of C29 20R ααα-ethylcholestane
monitored at m/z 217 is determined relative to C30 17β(H) 21β(H)-hopane monitored at m/z 191,
and then the average RRF of C29 20R ααα-ethylcholestane is used for estimation of sterane
compounds in the oil.
3.18 Analytical Method for Identification of BTEX Compounds and Alkyl Benzenes and
Direct Determination of BTEX and (BTEX + C3-benzenes) in Oils and Refined Products
by Gas Chromatography / Mass Spectrometry
The identification of BTEX and other alkyl substituted benzene components in oils are
accomplished based on mass spectral data, comparison of GC retention data with reference
standards, and calculation of retention index values and comparison with those reported in the
literature.
Quantitation of BTEX and (BTEX + C3-benzenes) is accomplished by GC/MS using an internal
standard method. The strict quality control measures are used in order to guarantee the precision
and accuracy of analytical data. The GC/MS is carefully maintained and tuned daily to achieve the
required sensitivity. Prior to sample analysis, the instrument is calibrated using a standard solution
that is composed of 5 BTEX compounds, 6 C3-benzene compounds, 2 C4-, 2 C5-, 1 C6- and 1
C7-benzene compounds. The internal standard used is d10-ethylbenzene. A 5-point calibration
curve that demonstrates the linear range (0.01 ppm to 200 ppm) of the analysis is established for
each target compound. The RRFs for each compounds are calculated relative to the internal
standard.
Oil samples are directly weighed and dissolved in n-pentane (without using any solvent evaporation
and concentration step, which may result in the loss of BTEX compounds) to an approximately
concentration of 2 mg/mL for GC/MS analysis. To achieve improved precision and accuracy of
analytical data, the following refinements are implemented in addition to the routine quality control
measures: (1) The oil solutions in vials are tightly capped to avoid any possible loss of volatile
BTEX compounds, and are then put in a refrigerator for 30 minutes to precipitate the asphaltenes
25
to the bottom of the vials in order to void performance deterioration of the column due to
introduction of asphaltenes; (2) Blanks and calibration check standards are analyzed before and
after each sample batch (about 7-10 samples) to monitor analysis precision; (3) C3-benzenes in
oil are quantified using the RRF directly obtained from the respective individual C3-benzene
standards instead of using the RRF obtained from benzene or C1/C2 substituted benzenes.
The concentration of the analyte of interest in the sample is determined using the following equation:
A W DS ISConcentration (µg / g) =
A RRF WIS S
where:
AS = Response for the analyte in the sample, units may be in area counts or
A
peak height.
IS = Response for the internal standard in the sample, units same as As.
WIS = Amount (µg) of internal standard added to the sample.
D = Dilution factor, if dilution was made on the sample prior to analysis. If no
W
dilution is made, D = 1. Dimensionless.
S = Weight of sample, in g.
The extensive qualitative and quantitative information obtained pertaining to alkylbenzenes is useful
for evaluating weathering behaviour, potential toxicity, composition and concentration changes of
oil in the short term following a spill. The data can be also used to evaluate the fate and transport
of alkylated benzene compounds and other petroleum hydrocarbons in the environment and to
assess the possible biological effects and damage of the spill to the environment and natural
resources.
3.19 Method for the Determination of Trace Metals in Oil Samples
The metal content of an oil or oil product is determined by oxidation of the oil in hot acid,
dissolution in aqueous solution then measurement by inductively-coupled plasma atomic emission
spectroscopy (ICP-AES).
The oil sample is warmed in a water bath and mixed thoroughly. Approximately 1g of sample is
weighed into a 150 mL teflon beaker. To the oil is added 0.5 mL of concentrated nitric acid and
1.5 mL of concentrated hydrochloric acid. The beaker is covered and heated on a 120 °C
hotplate. The beaker is swirled gently until the mixture begins to fume. A further amount of 0.5 mL
of concentrated nitric acid and 1.5 mL of concentrated hydrochloric acid is added to the beaker.
The beaker is recovered and heated until approximately 0.5 mL of the mixture remains.
The acid-mixture is quantitatively filtered into a glass test tube through a Number 4 Whatman filter
with a deionized water rinse. The solution is made up to 10.00 mL. The solution is mixed
26
thoroughly by vortex and submitted to the ICP-AES for analysis.
The ICP-AES is calibrated with commercial multi-element aqueous standards and verified using
a certified aqueous reference standard. The 29 metal analytes are determined from each respective
calibration chart and corrected for the 10:1 dilution in sample preparation. Duplicate measurements
are made for each sample. Method blanks, matrix blanks, and blind standards were included with
the analyte samples to ensure method performance.
The ICP-AES analysis was performed under contract to Environment Canada by Caduceon
Environmental Laboratories of Ottawa, Canada.
3.20 Method for the Sample Handling, Storage and Disposal of Oil and Oil Products
This method describes the procedures for the safe and non-destructive manipulation and sampling
of hydrocarbon unknowns. Procedures are outlined for the reception and disbursal of samples to
and from the laboratory, the handling of oil to avoid damaging the sample, the techniques necessary
to obtain a representative sample and the safe storage and disposal of oil.
27
4. Summary of Quality Assurance and Quality Control (QA/QC) Plan
4.1 Quality Assurance Statement
As a federal government science and technology institute it has been one of our fundamental operating
principles that the Oil Research Laboratory of the Emergencies Science and Technology Division (ESTD)
of Environment Canada should set an example by adopting the most stringent standards possible for our
work. A critical part of our official Mission Statement is to provide “specialized sampling and analytical
expertise and services of the highest standards”. Quality management has always been a fundamental
element of our programs. We continue to refine our quality procedures and protocols whenever new
information and processes become available. Our quality program is certified through SCC-CAEAL, the
Standards Council of Canada/Canadian Association for Environmental Analytical Laboratories.
Participation in the SCC-CAEAL accreditation program provides us a systematic, internationally
recognized quality system. A quality web site has been created which provides staff with easy and fast
access to all current and approved quality system documentation. The Emergencies Science and
Technology Division QA/QC system includes the following:
-Laboratory profile, mission and organization;
-Quality system;
-Personnel;
-Methodology;
-Service, equipment and supplies;
-Facilities;
-Sample management;
-Data management;
-Work load management.
4.2 Quality Assurance in Chemical Composition Methods
The Oil Research Laboratory at Emergencies Science and Technology Division presently performs the
following chemical measurements for crude oils, oil products, and oil-spill-related environmental samples:
total petroleum hydrocarbons (TPH), total saturates, total aromatics,n-alkane distribution, oil-characteristic
alkylated PAH homologous series, and other EPA priority PAHs, BTEX and alkyl-benzene compounds,
biomarker triterpanes and steranes. The methods of “Analytical Method for Identification of BTEX
Compounds and Alkyl Benzenes and Direct Determination of BTEX and (BTEX + C3-benzenes) in
Oils and Refined Products by Gas Chromatography/Mass Spectrometry” and “Analytical Method
for the Determination of Individual n-Alkanes and Isoprenoids and Total Petroleum Hydrocarbons
(TPH), Polycyclic Aromatic Hydrocarbons (PAHs), and Biomarker Triterpanes and Steranes in Oils,
Petroleum Products, and Oil-spill-related Environmental Samples” have been approved by SCC and
CAEAL and have become official ETC methods.
28
Chromatographic techniques are used for analyses of oil chemical compositions. In addition to a formal
quality control program, a number of specific measures have been added to the processing of oil samples
to monitor quality control and to aid in assessment of the data quality with respect to the project objectives.
An important part of this is the evaluation of specific QC samples for accuracy, precision, and potential
contamination. Before sample analysis, a five point initial calibration composed of the target oil components
(for example, n-alkanes and EPA priority PAHs) are established, demonstrating the linear range of the
analyses. Check standards at the mid-point of the established calibration curves are run before and after
each analytical batch of samples (7-10 samples) to validate the integrity of the initial calibration. The method
of internal standards (such as EPA Method 8000 for PAH analysis) using the average relative response
factors (RRF) generated from the linear initial calibration is used to quantify the target oil compounds. The
RRF stability is a key factor in maintaining the quality of the analysis. Mass discrimination, that is the
reduced response of high molecular weight components, must be carefully monitored. If there is a problem
with mass discrimination, it can be minimized by trimming the capillary column and by replacing the quartz
liner in the injection port. All samples and qualitycontrol samples are spiked with appropriate surrogate
compounds to measure individual sample matrix effects associated with sample preparation and analysis.
Method detection limits (MDL) studies of target compounds are performed according to the procedure
described in the EPA protocol titled “Definition and Procedure for the Determination of the Method
Detection Limit” (Code of Federal Regulations 40 CFR Part 136). Control charts of standards are
prepared and monitored. Validations of analytes in the control chart should be no more than 25% from
historical average.
Trace metal analysis was performed under contract by Caduceon Environmental Laboratories, a CAEAL
certfied laboratory in Ottawa, Canada. Each batch of samples contained reagent blanks, method duplicates
and matrix-matched reference materials. Blind standards were also submitted with the oils for analysis. The
ICP-AES was calibrated using commercial standards and verified against a certified reference standard.
4.3 Quality Assurance in Physical Property Methods
The ESTD Oil Research Laboratory performs the following physical property measurements on crude oils
and oil products: adhesion, boiling point distribution, density/API gravity, dispersibility, evaporation
equation, flash point, hydrocarbon group analysis, sulphur content, surface and interfacial tensions,
viscosity, and water content. Many of these procedures are ASTM standard methods, and must meet the
reproducibility and repeatability of the appropriate method. Others, however, are methods developed in
house and control systems are defined for them in the standard operating procedures (SOP) for those
methods. The following table details the measurement procedures:
Adhesion In-house Method
Boiling Point Distribution Commercial Package
Density/API Gravity ASTM D5002
Dispersibility ASTM F2059
Evaporation Equation In-house Method
Flash Point ASTM D93 and ASTM D56
29
Hydrocarbon Group Analysis In-house Method
Pour Point ASTM D97
Sulphur Content ASTM D4294
Surface and Interfacial Tensions ASTM D971
Viscosity In-house Method
Water Content ASTM D4377
Two physical property methods are considered semi-quantitative: adhesion and pour point. For these
methods, although the range of variability in the results is closely monitored, no calibrations, blanks or check
standards are preformed. Note that while pour point is measured according to ASTM D97, no calibration
or check standard is specified by that method. While the ASTM D97 reproducibility requirements are
achieved, no further controls for pour point are used in the Emergencies Science and Technology Division
Oil Research Laboratory.
Several physical property methods rely on a single instrument and involve a simple measurement with little
sample manipulation. These measurements include: density/API gravity, the development of the evaporation
equation, flash point, sulphur content, surface and interfacial tensions, viscosity and water content. For all
of these methods, the instruments are calibrated as directed by the manufacturer or the appropriate ASTM
method with chemical and/or gravimetric standards as appropriate. In addition, instrumental and operator
performance is monitored by periodic measurement of check standards. A log is kept for each instrument,
in which calibration and check standard measurements are recorded. The check standard measurements
are monitored closely. Failure of the check standard measurement to fall within the smaller of either a
historical 95% confidence limit or the appropriate ASTM required repeatability results in an investigation
of the procedure. This investigation includes recalibration and measurement of the check standard until the
desired precision and accuracy is reached.
Finally, the last class of physical property methods involve significant sample preparation, followed by a
measurement by gas chromatography or gravimetry. These methods include: boiling point distribution,
dispersibility, and hydrocarbon group analysis. The boiling point distribution is measured using a commercial
package provided by Analytical Controls. The quality control for this procedure involves the minimization
of the variance of a check sample chromatogram. The dispersibilitytest is defined by ASTM F2059 and
uses the calibration and standard procedure defined by that method. The hydrocarbon group analysis is
carried out under the same protocols as described for the other chromatographic techniques previously.
4.4 Example Method Quality Control Procedures
As examples, the QA/QC procedures follow taken from a typical physical property method, for Surface
and Interfacial Tension (see method 5.15), and from the chemical composition method for determination
of the oil characteristic alkylated PAH homologues and other EPA priority unsubstituted PAH compounds
(see method 5.17):
30
From the Standard Operating Procedure for the determination of the oil characteristic
alkylated PAH homologues and other EPA priority unsubstituted PAH compounds:
14. QUALITY CONTROL
14.1 Each laboratory that uses this method is required to operate a formal quality control program. The
minimum requirements of this program consist of an initial demonstration of laboratory capability
and the analysis of spiked samples as a continuing check on performance.
The laboratory is required to maintain performance records to define the quality of data that is
generated. Ongoing performance checks must be compared with established performance criteria
to determine if the results of analyses are within accuracy and precision limits expected of the
method.
14.2 The reliability of this method is dependent on the quality control procedures followed with each
analytical batch (approximately 7-10 samples), one procedure blank, one check standard, and one
standard oil are analyzed.
14.3 Initial Calibration and Continuing Calibration Check
14.3.1 Prior to the use of this method, a five-point response factor calibration curve must be
established showing the linear range of the analysis. Each calibration standard is
analyzed and the response factor (RRF) for each compound at each concentration level
is calculated.
14.3.2 A check standard at about the mid-point of the established calibration curve must be
analyzed before and after each set of up to 7 samples or once per working day, whichever
is more frequent, in order to determine the response factors for the analytes of interest
relative to the initial calibration. The PAH calibration standard (NIST SRM 1491)
contains 24 PAH compounds plus dibenzothiophene and 4 deuderated PAH surrogate
compounds. d14-terphenyl is added to purified sample extract prior to GC/MS analysis as
an internal standard.
14.3.3 The percent difference between the response factors in the check standard and those of the
initial calibration is calculated using Equation 9:
(RRF − RRFC )IDifference(%)= ×100% (9)
RRFI
where:
RRFI = Average response factor from the initial calibration
RRFC = Response factor from continuing calibration
If the difference of response factors is within 20%, analyses may proceed. If not, a five-point
calibration curve must be repeated for that compound prior to analysis of the sample.
14.3.4 RRF stability is a key factor in maintaining the quality of the analysis. Mass
discrimination, that is the reduced response of high molecular weight compounds, must be
carefully monitored. The ratio of RRF of n-C32 to n-C21 should not be allowed to fall below
80% in the check standard. If there is a problem with mass discrimination, it can be
reduced by trimming the first 20 cm of the capillary column and by replacing the quartz
31
liner in the injection port.
14.4 Procedural Blank Analysis
14.5 Surrogate Compounds Analysis
14.5.1 All samples and quality control samples are required to be spiked with surrogate o
terphenyl (OTP). OTP is spiked into sample prior to extraction. This will measure
individual sample matrix effects associated with sample preparation and analysis.
Recovery of surrogate OTP should be within 60% to 120%. If the recovery for any
surrogate standard does not fall within the control limits for method performance, the
following corrective actions can be taken:
(1) Check calculations to ensure there are no errors.
(2) Check instrument performance and initial standard and surrogate solutions for
degradation, contamination or other possible problems.
(3) reanalyze the sample or extract if the steps above fail to reveal a problem. If reanalysis
yields surrogate recoveries within the stated limits, the reanalysis data will be used.
14.5.2 If the surrogate could not be measured because the sample diluted prior to analysis, or
surrogate co-elutes with a compound, no corrective action needs be taken.
14.6 A control chart of the standard should be prepared and monitored. Variations of analytes in the
control chart should be no more than 25% from historical average.
14.7 Detection Limit
Under optimum conditions an instrumental detection limit of 8 pg/:L per PAH target analyte (mean
value) can be achieved.
14.8 GC Resolution
The target compounds, surrogate and internal standards must be resolved from one another and
from interfering compounds. Potential problems may arise from the lack of baseline resolution of
these compounds. Corrective action must be taken to correct resolution problem, i.e. rerun samples
with a different temperature program.
From the Standard Operating Procedure for the determination of surface and interfacial
tensions:
10 QUALITY CONTROL
10.1 Each laboratory that uses this method is required to operate a formal quality control program. The
minimum requirements of this program consist of an initial demonstration of laboratory capability
and the analysis of reference standards as a continuing check on performance.
10.2 The laboratory is required to maintain performance records to define the quality of data that is
generated. Ongoing performance checks must be compared with established performance criteria
to determine if the results of analyses are within accuracy and precision limits expected of the
method.
10.3 Before performing any analysis, the analyst must demonstrate the ability to generate acceptable
accuracy and precision with this method.
32
10.4 A method log book is maintained, containing all instrumental maintenance and calibration and
check standard measurements.
10.5 The instrument is calibrated using a standard weight provided by the manufacturer. The instrument
calibration is checked before each batch of samples and recorded in the log book. If the instrument
calibration is outside the manufacturer’s parameters, the cause must be investigated and the fault
corrected.
10.6 A check standard of p-xylene is used to define the operating characteristics of the instrument. Before
each batch of samples is measured, a sample of reagent grade p-xylene is measured in triplicate at
15 °C. These measurements are noted in the instrument log book and tracked to ensure instrument
and operator performance.
10.7 If the check standard falls outside the historical 95% confidence limit, as tracked by a control plot,
the instrument function and/or operator technique is corrected as necessary. ASTM method D971
requires a repeatability of 4%, approximately ±1.2 mN/m. Measurements are not to be taken until
the check standard measurements fall within the acceptable range for accuracy and precision.
33
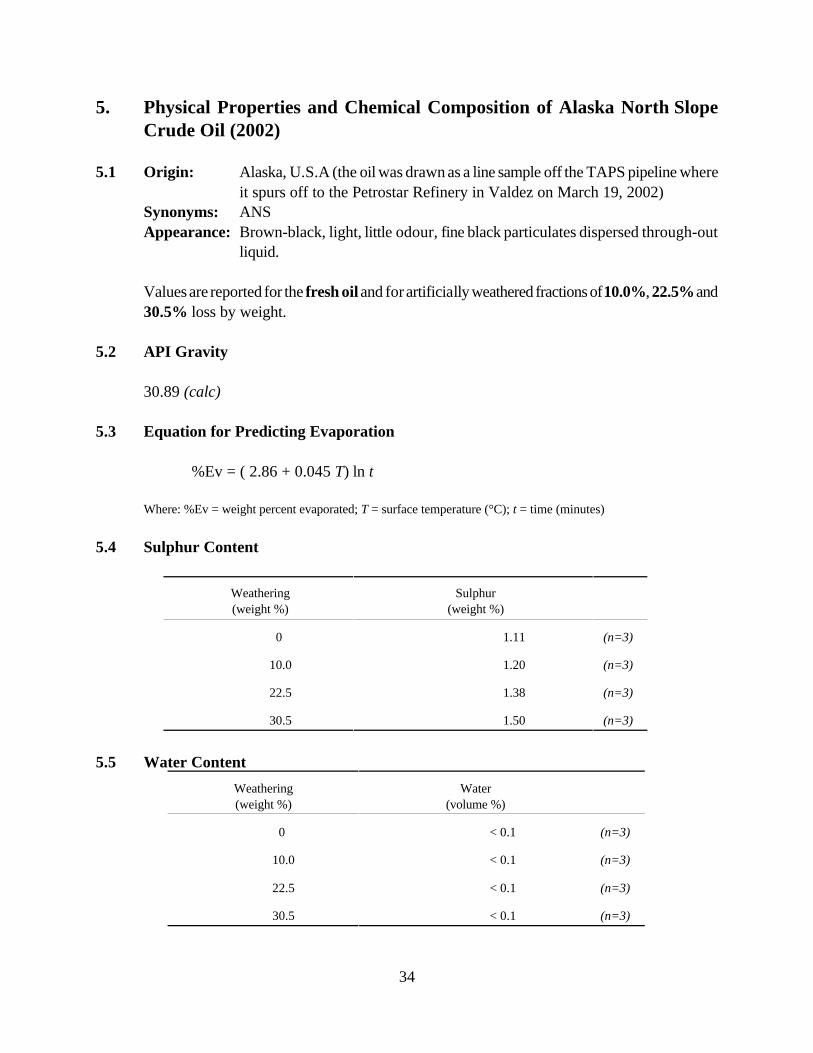
5.5
5. Physical Properties and Chemical Composition of Alaska North Slope
Crude Oil (2002)
5.1 Origin: Alaska, U.S.A (the oil was drawn as a line sample off the TAPS pipeline where
it spurs off to the Petrostar Refinery in Valdez on March 19, 2002)
Synonyms: ANS
Appearance: Brown-black, light, little odour, fine black particulates dispersed through-out
liquid.
Values are reported for the fresh oil and for artificially weathered fractions of 10.0%, 22.5% and
30.5% loss by weight.
5.2 API Gravity
30.89 (calc)
5.3 Equation for Predicting Evaporation
%Ev = ( 2.86 + 0.045 T) ln t
Where: %Ev = weight percent evaporated; T = surface temperature (°C); t = time (minutes)
5.4 Sulphur Content
Weathering Sulphur
(weight %) (weight %)
0 1.11 (n=3)
10.0 1.20 (n=3)
22.5 1.38 (n=3)
30.5 1.50 (n=3)
Water Content
Weathering Water
(weight %) (volume %)
0 (n=3)
10.0 < 0.1 (n=3)
22.5 < 0.1 (n=3)
30.5 < 0.1 (n=3)
34
< 0.1

5.6 Flash Point
Density
Weathering
(weight %)
Flash Point
(°C)
0 <-8 (n=3)
10.0 19 (n=3)
22.5 75 (n=3)
30.5 115 (n=3)
Weathering
(weight %)
Temperature
(°C)
Density
(g/mL)
0 0 0.8777 (n=3)
15 0.8663 (n=3)
10.0 0 0.9054 (n=3)
15 0.8940 (n=3)
22.5 0 0.9303 (n=3)
15 0.9189 (n=3)
30.5 0 0.9457 (n=3)
15 0.9340 (n=3)
Pour Point
Weathering
(weight %)
Pour Point
(°C)
0 -32 (n=2)
10.0 -20 (n=2)
22.5 -9 (n=2)
30.5 -6 (n=2)
35
5.7
5.8
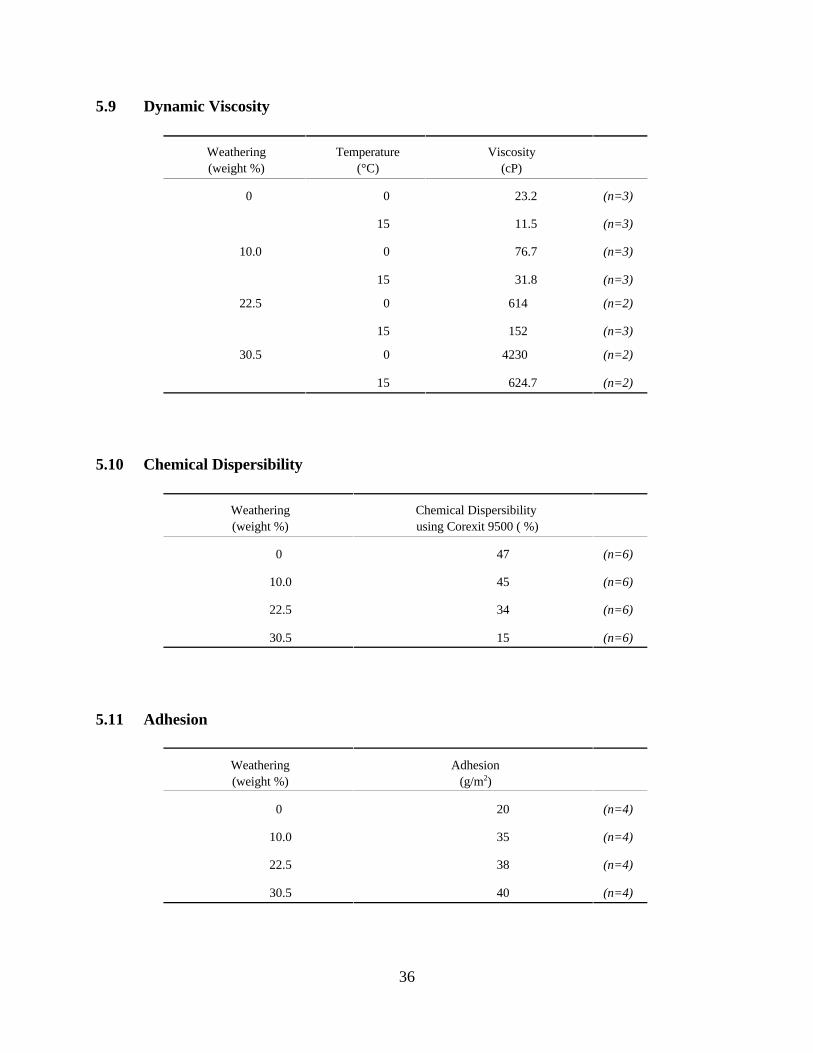
5.9 Dynamic Viscosity
Weathering
(weight %)
Temperature
(°C)
Viscosity
(cP)
0 0 23.2 (n=3)
15 11.5 (n=3)
10.0 0 76.7 (n=3)
15 31.8 (n=3)
22.5 0 614 (n=2)
15 152 (n=3)
30.5 0 4230 (n=2)
15 624.7 (n=2)
5.10
Weathering Chemical Dispersibility
(weight %) using Corexit 9500 ( %)
0 (n=6)
10.0 45 (n=6)
22.5 34 (n=6)
30.5 15 (n=6)
Weathering Adhesion
(weight %) (g/m2)
0 (n=4)
10.0 35 (n=4)
22.5 38 (n=4)
30.5 40 (n=4)
5.11 Adhesion
Chemical Dispersibility
47
20
36
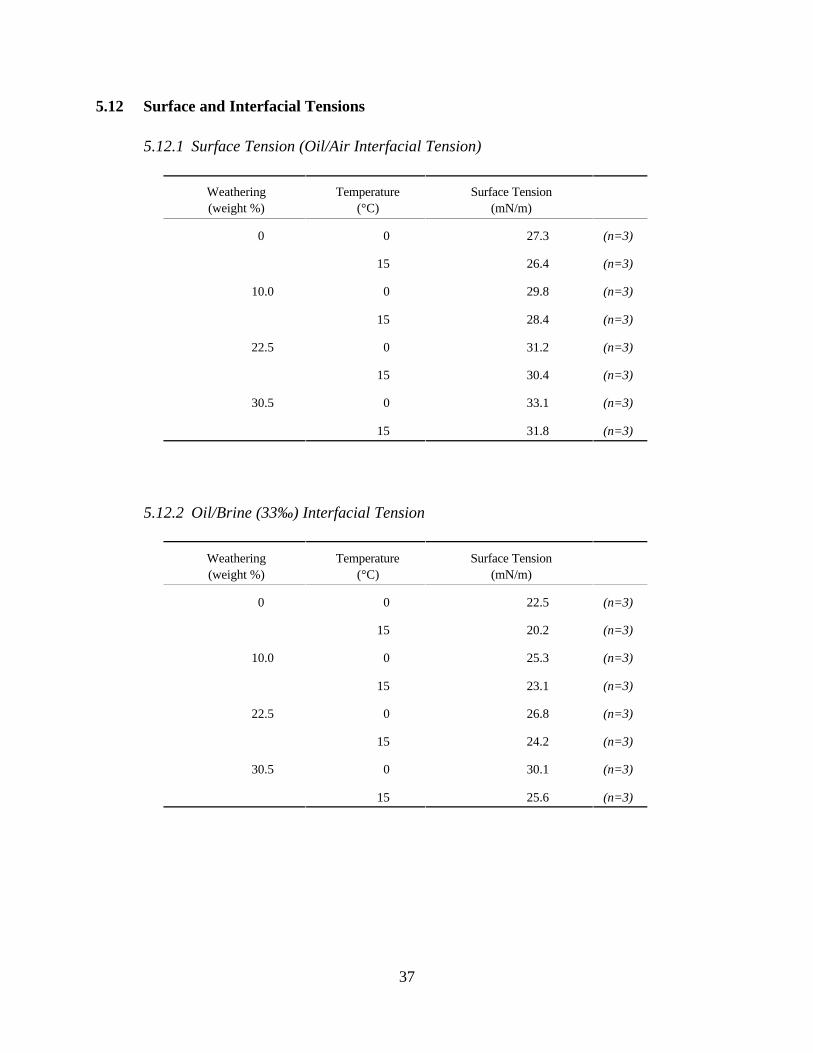
5.12 Surface and Interfacial Tensions
5.12.1 Surface Tension (Oil/Air Interfacial Tension)
Weathering
(weight %)
Temperature
(°C)
Surface Tension
(mN/m)
0 0 27.3 (n=3)
15 26.4 (n=3)
10.0 0 29.8 (n=3)
15 28.4 (n=3)
22.5 0 31.2 (n=3)
15 30.4 (n=3)
30.5 0 33.1 (n=3)
15 31.8 (n=3)
Weathering Temperature Surface Tension
(weight %) (mN/m)
0
10.0
0
15
0
22.5
20.2
25.3
(n=3)
(n=3)
(n=3)
22.5
30.5
15
0
15
0
23.1
26.8
24.2
30.1
(n=3)
(n=3)
(n=3)
(n=3)
15 25.6 (n=3)
5.12.2 Oil/Brine (33‰) Interfacial Tension
(°C)
37
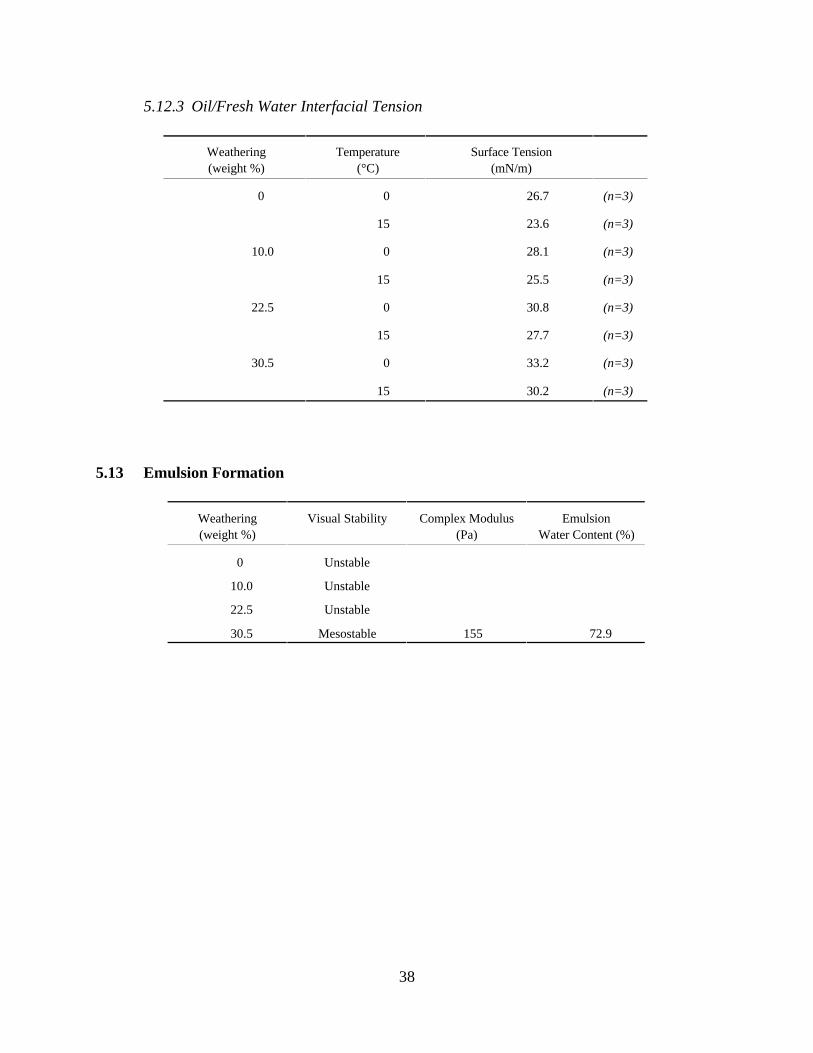
5.12.3 Oil/Fresh Water Interfacial Tension
Weathering
(weight %)
Temperature
(°C)
Surface Tension
(mN/m)
0 0 26.7 (n=3)
15 23.6 (n=3)
10.0 0 28.1 (n=3)
15 25.5 (n=3)
22.5 0 30.8 (n=3)
15 27.7 (n=3)
30.5 0 33.2 (n=3)
15 30.2 (n=3)
5.13
Weathering
(weight %)
Visual Stability Complex Modulus
(Pa)
Emulsion
Water Content (%)
0
10.0
22.5
30.5
Unstable
Unstable
Unstable
Mesostable 155 72.9
Emulsion Formation
38
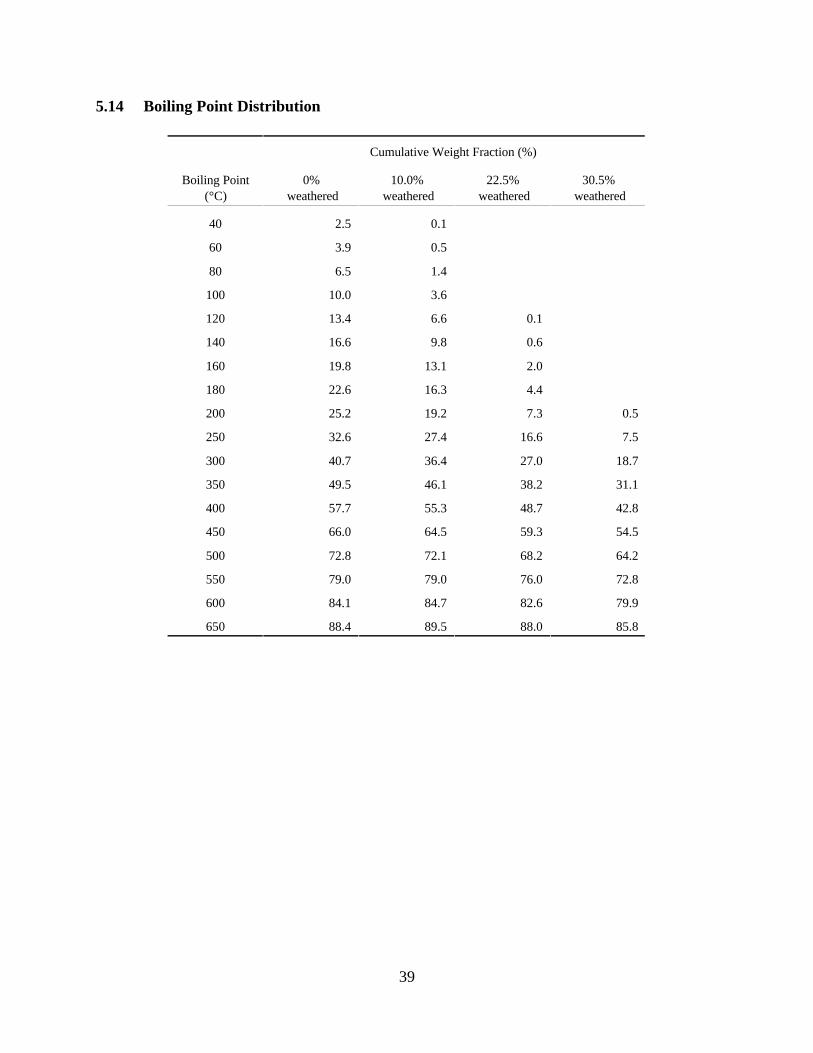
5.14 Boiling Point Distribution
Cumulative Weight Fraction (%)
Boiling Point
(°C)
0%
weathered w
10.0%
eathered w
22.5%
eathered w
30.5%
eathered
40 2.5 0.1
60 3.9 0.5
80 6.5 1.4
100 10.0 3.6
120 13.4 6.6 0.1
140 16.6 9.8 0.6
160 19.8 13.1 2.0
180 22.6 16.3 4.4
200 25.2 19.2 7.3 0.5
250 32.6 27.4 16.6 7.5
300 40.7 36.4 27.0 18.7
350 49.5 46.1 38.2 31.1
400 57.7 55.3 48.7 42.8
450 66.0 64.5 59.3 54.5
500 72.8 72.1 68.2 64.2
550 79.0 79.0 76.0 72.8
600 84.1 84.7 82.6 79.9
650 88.4 89.5 88.0 85.8
39

5.15 Hydrocarbon Groups
Concentration
(weight %)
0% 10.0% 22.5% 30.5%
Component weathered weathered weathered weathered
Saturates 75.0 72.1 69.2 64.8
Aromatics 15.0 16.0 16.5 18.5
Resins 6.1 7.4 8.9 10.3
Asphaltenes 4.0 4.4 5.4 6.4
Waxes
5.16 Volatile Organic Compounds
Concentration
(µg/g oil)
0% 30.5%
Component weathered weathered
Benzene 2866 0
Toluene 5928 0
Ethylbenzene 1319 0
Xylenes† 6187 0
C3-Benzenes‡ 5620 30
Total BTEX 16300 0
Total BTEX and C3 - 21920 30
Benzenes‡
†“Xylenes” include o-, m-, and p-xylene isomers.
‡“C3-Benzenes” include eight isomers.
2.6 2.9 3.3 3.6
40
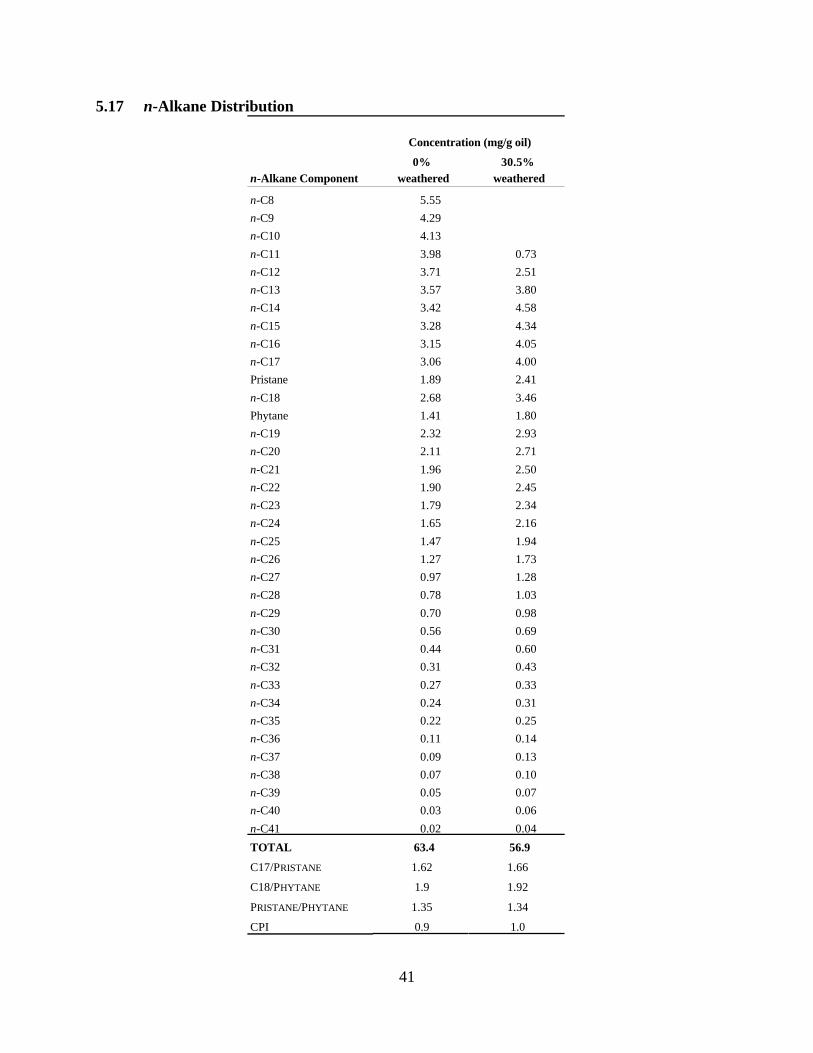
5.17 n-Alkane Distribution
Concentration (mg/g oil)
0% 30.5%
n-Alkane Component weathered weathered
n-C8 5.55
n-C9 4.29
n-C10 4.13
n-C11 3.98 0.73
n-C12 3.71 2.51
n-C13 3.57 3.80
n-C14 3.42 4.58
n-C15 3.28 4.34
n-C16 3.15 4.05
n-C17 3.06 4.00
Pristane 1.89 2.41
n-C18 2.68 3.46
Phytane 1.41 1.80
n-C19 2.32 2.93
n-C20 2.11 2.71
n-C21 1.96 2.50
n-C22 1.90 2.45
n-C23 1.79 2.34
n-C24 1.65 2.16
n-C25 1.47 1.94
n-C26 1.27 1.73
n-C27 0.97 1.28
n-C28 0.78 1.03
n-C29 0.70 0.98
n-C30 0.56 0.69
n-C31 0.44 0.60
n-C32 0.31 0.43
n-C33 0.27 0.33
n-C34 0.24 0.31
n-C35 0.22 0.25
n-C36 0.11 0.14
n-C37 0.09 0.13
n-C38 0.07 0.10
n-C39 0.05 0.07
n-C40 0.03 0.06
n-C41 0.02 0.04
TOTAL 63.4 56.9
C17/PRISTANE 1.62 1.66
C18/PHYTANE 1.9 1.92
PRISTANE/PHYTANE 1.35 1.34
CPI 0.9 1.0
41
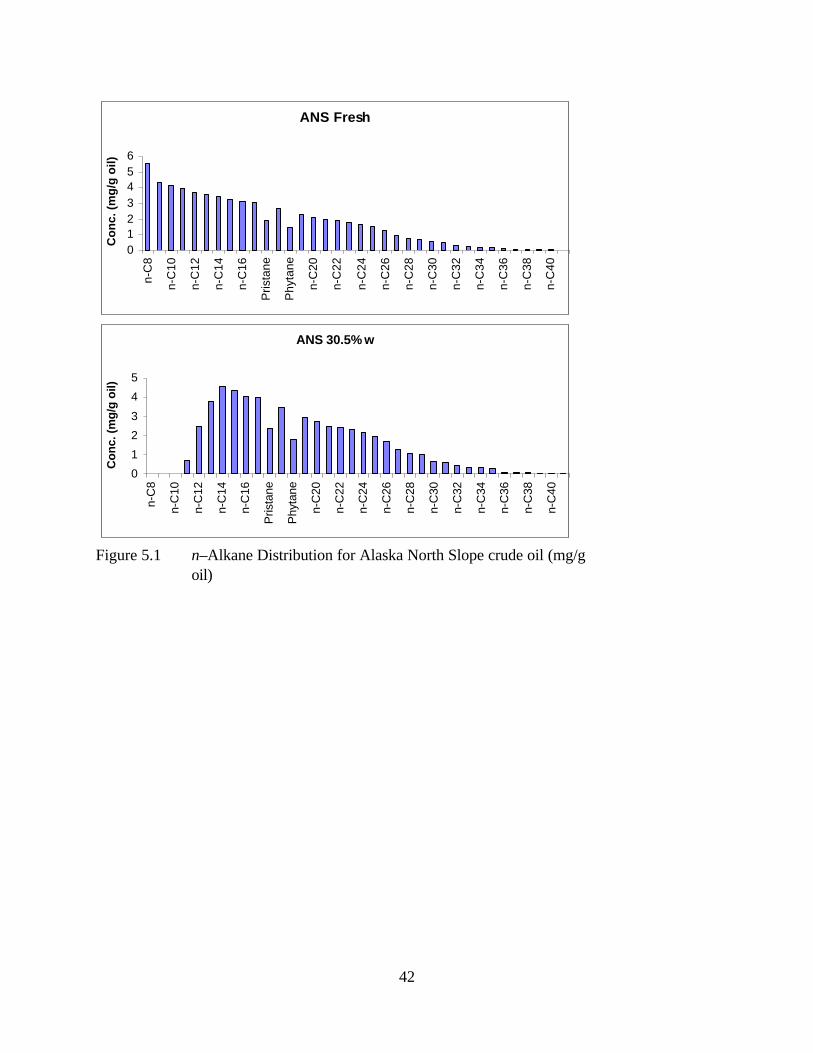
0
1
2
3
4
5
6 n
-C8
n-C
10
n-C
12
n-C
14
n-C
16
Pri
sta
ne
Ph
yta
ne
n-C
20
n-C
22
n-C
24
n-C
26
n-C
28
n-C
30
n-C
32
n-C
34
n-C
36
n-C
38
n-C
40
Co
nc
. (m
g/g
oil
)
0
1
2
3
4
5
n-C
8
n-C
10
n-C
12
n-C
14
n-C
16
Prista
ne
Phyta
ne
n-C
20
n-C
22
n-C
24
n-C
26
n-C
28
n-C
30
n-C
32
n-C
34
n-C
36
n-C
38
n-C
40
Co
nc. (m
g/g
oil)
ANS Fresh
ANS 30.5% w
Figure 5.1 n–Alkane Distribution for Alaska North Slope crude oil (mg/g
oil)
42
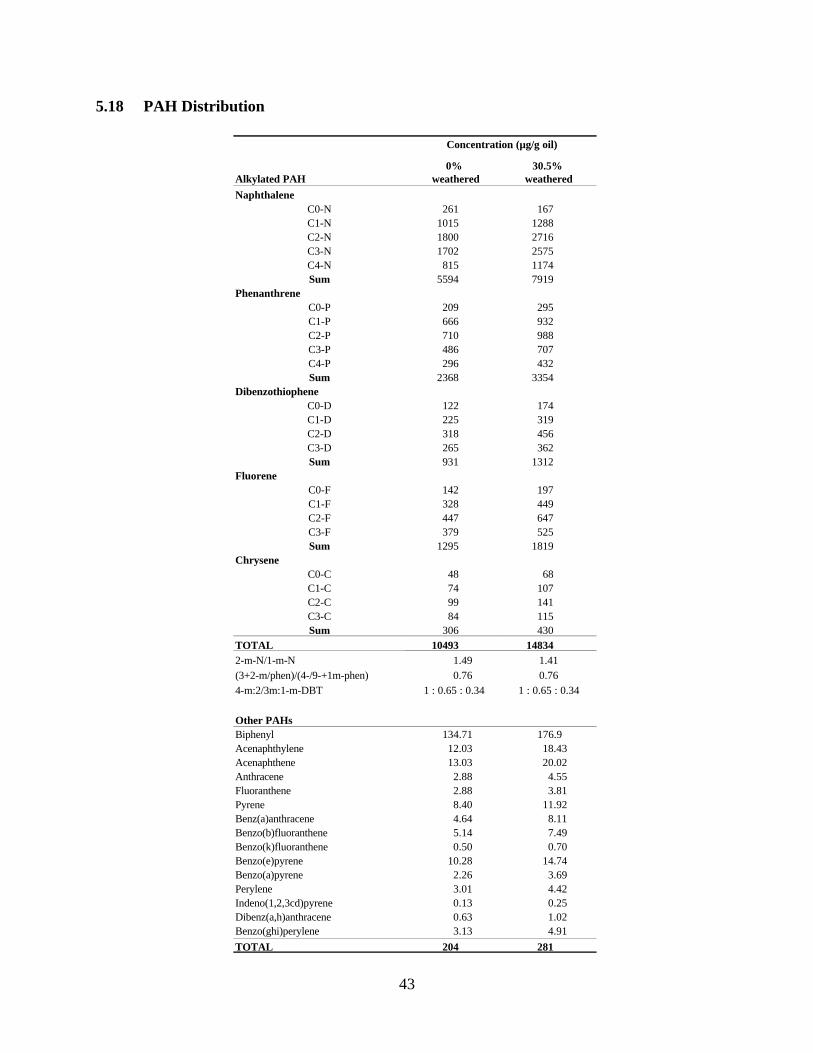
5.18 PAH Distribution
Concentration (µg/g oil)
0% 30.5%
Alkylated PAH weathered weathered
Naphthalene
C0-N 261 167
C1-N 1015 1288
C2-N 1800 2716
C3-N 1702 2575
C4-N 815 1174
Sum 5594 7919
Phenanthrene
C0-P 209 295
C1-P 666 932
C2-P 710 988
C3-P 486 707
C4-P 296 432
Sum 2368 3354
Dibenzothiophene
C0-D 122 174
C1-D 225 319
C2-D 318 456
C3-D 265 362
Sum 931 1312
Fluorene
C0-F 142 197
C1-F 328 449
C2-F 447 647
C3-F 379 525
Sum 1295 1819
Chrysene
C0-C 48 68
C1-C 74 107
C2-C 99 141
C3-C 84 115
Sum 306 430
Other PAHs
TOTAL 10493 14834
2-m-N/1-m-N 1.49 1.41
(3+2-m/phen)/(4-/9-+1m-phen) 0.76 0.76
4-m:2/3m:1-m-DBT 1 : 0.65 : 0.34
Biphenyl 134.71 176.9
Acenaphthylene 12.03 18.43
Acenaphthene 13.03 20.02
Anthracene 2.88 4.55
Fluoranthene 2.88 3.81
Pyrene 8.40 11.92
Benz(a)anthracene 4.64 8.11
Benzo(b)fluoranthene 5.14 7.49
Benzo(k)fluoranthene 0.50 0.70
Benzo(e)pyrene 10.28 14.74
Benzo(a)pyrene 2.26 3.69
Perylene 3.01 4.42
Indeno(1,2,3cd)pyrene 0.13 0.25
Dibenz(a,h)anthracene 0.63 1.02
Benzo(ghi)perylene 3.13 4.91
TOTAL
1 : 0.65 : 0.34
204 281
43
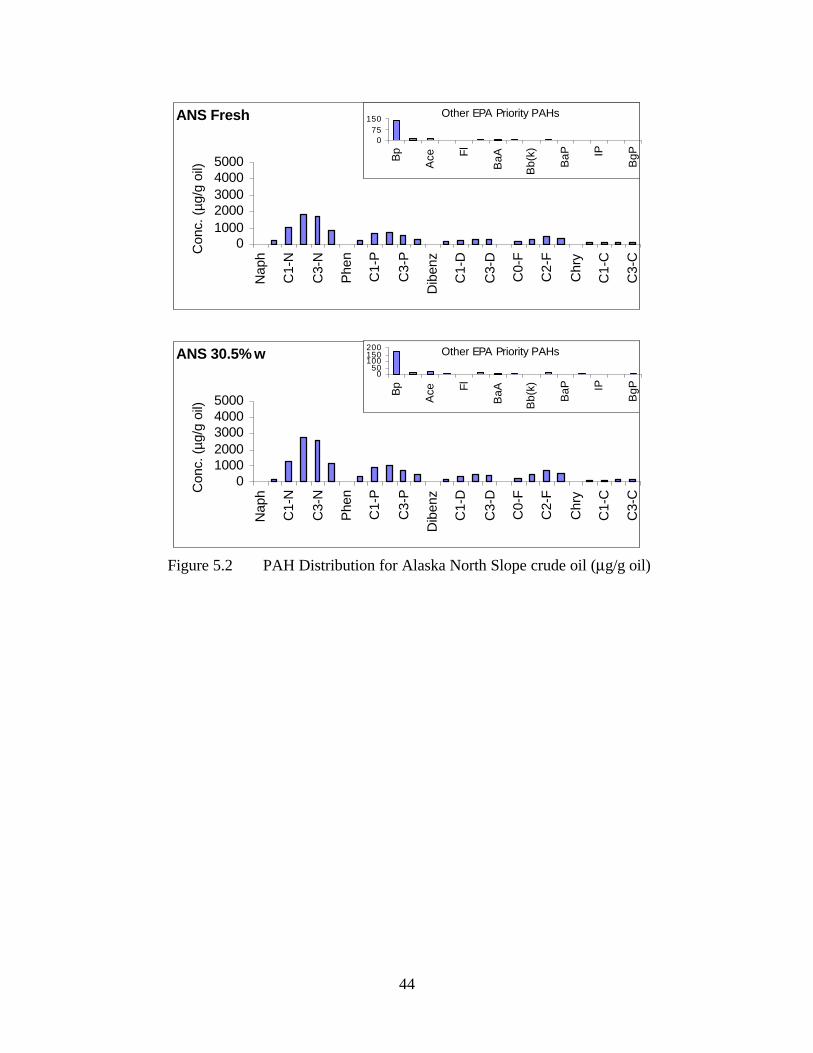
ANS Fresh
0 1000
2000
3000
4000
5000
Naph
C1-N
C3-N
Phen
C1-P
C3-P
Dib
enz
C1-D
C3-D
C0-F
C2-F
Chry
C1-C
C3-C
Conc.
(µg/g
oil)
0
75
150
Bp
Ace Fl
Ba
A
Bb
(k)
Ba
P IP
Bg
P
Other EPA Priority PAHs
0
1000
2000
3000
4000
5000
Naph
C1-N
C3-N
Phen
C1-P
C3-P
Dib
enz
C1-D
C3-D
C0-F
C2-F
Chry
C1-C
C3-C
Conc.
(µg/g
oil)
0 50
100 150 200
Bp
Ace Fl
Ba
A
Bb
(k)
Ba
P IP
Bg
P
ANS 30.5% w Other EPA Priority PAHs
Figure 5.2 PAH Distribution for Alaska North Slope crude oil (µg/g oil)
44
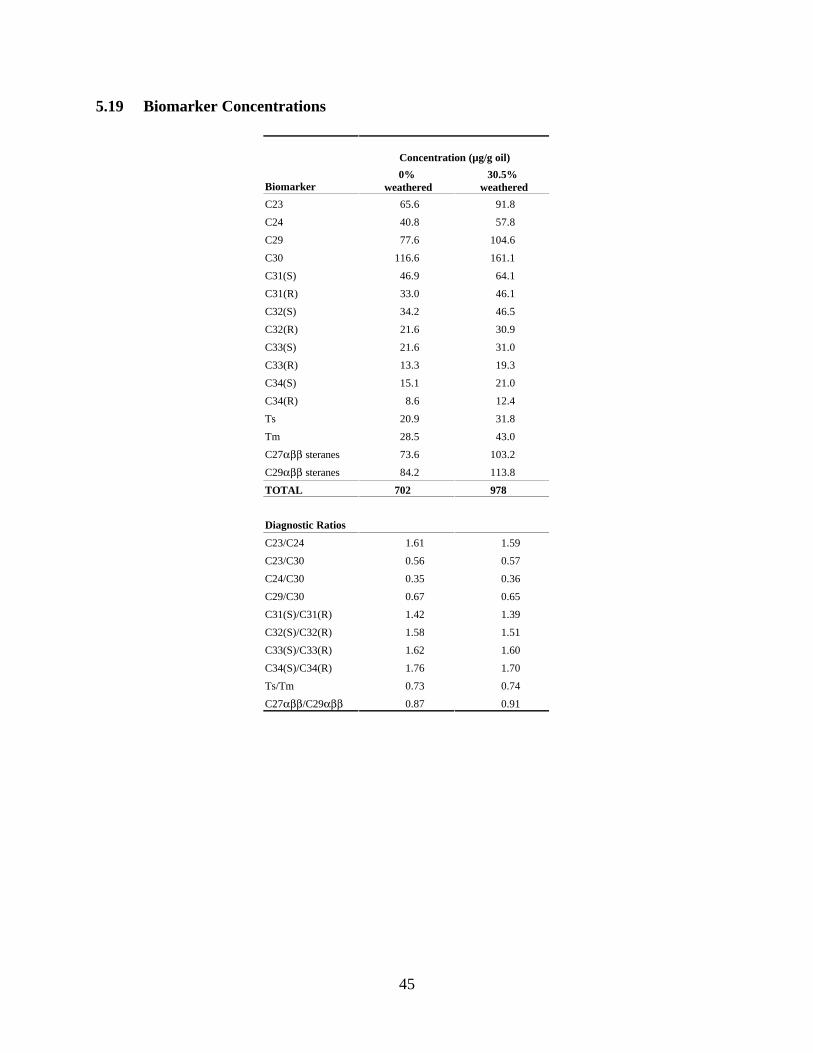
5.19 Biomarker Concentrations
Biomarker
Concentrati
0%
weathered
on (µg/g oil)
30.5%
weathered
65.6 91.8
40.8 57.8
77.6 104.6
116.6 161.1
C31(S) 46.9 64.1
C31(R) 33.0 46.1
C32(S) 34.2 46.5
C32(R) 21.6 30.9
C33(S) 21.6 31.0
C33(R) 13.3 19.3
C34(S) 15.1 21.0
C34(R) 12.4
20.9 31.8
Tm 28.5 43.0
C27αββ 73.6 103.2
C29αββ 84.2 113.8
TOTAL
Diagnostic Ratios
C23/C24
C23/C30
C24/C30
C29/C30
C31(S)/C31(R)
C32(S)/C32(R)
C33(S)/C33(R)
C34(S)/C34(R)
Ts/Tm
C27αββ/C29αββ
1.61
0.56
0.35
0.67
1.42
1.58
1.62
1.76
0.73
0.87
1.59
0.57
0.36
0.65
1.39
1.51
1.60
1.70
0.74
0.91
C23
C24
C29
C30
8.6
Ts
steranes
steranes
702 978
45
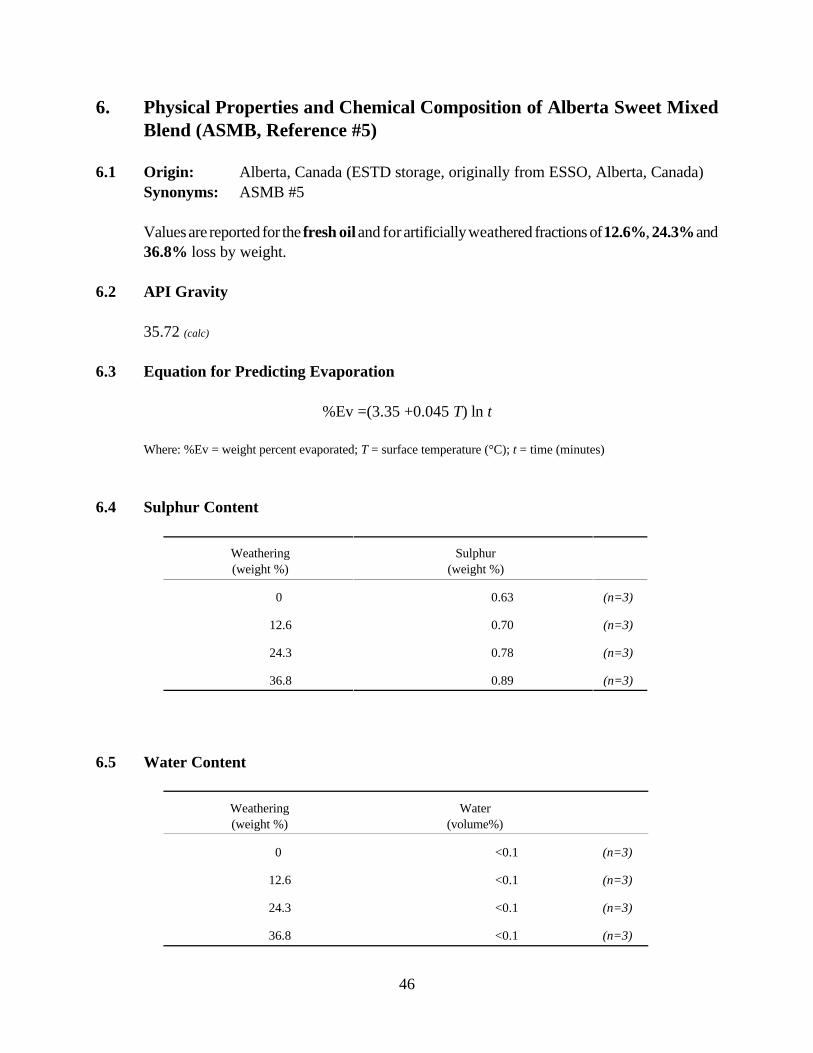
6.5
6. Physical Properties and Chemical Composition of Alberta Sweet Mixed
Blend (ASMB, Reference #5)
6.1 Origin: Alberta, Canada (ESTD storage, originally from ESSO, Alberta, Canada)
Synonyms: ASMB #5
Values are reported for the fresh oil and for artificially weathered fractions of 12.6%, 24.3% and
36.8% loss by weight.
6.2 API Gravity
35.72 (calc)
6.3 Equation for Predicting Evaporation
%Ev =(3.35 +0.045 T) ln t
Where: %Ev = weight percent evaporated; T = surface temperature (°C); t = time (minutes)
6.4 Sulphur Content
Weathering Sulphur
(weight %) (weight %)
0 0.63 (n=3)
12.6 0.70 (n=3)
24.3 0.78 (n=3)
36.8 0.89 (n=3)
Water Content
Weathering
(weight %)
Water
(volume%)
0
12.6
24.3
36.8
<0.1
<0.1
<0.1
<0.1
(n=3)
(n=3)
(n=3)
(n=3)
46

6.6 Flash Point
Density
Weathering
(weight %)
Flash Point
(°C)
0 -4.3 (n=2)
12.6 27.8 (n=3)
24.3 67.8 (n=3)
36.8 >110 (n=2)
Weathering
(weight %)
Temperature
(°C)
Density
(g/mL)
0 0 0.8536 (n=3)
15 0.8404 (n=3)
12.6 0 0.8805 (n=3)
15 0.8676 (n=3)
24.3 0 0.8987 (n=3)
15 0.8852 (n=3)
36.8 0 0.9151 (n=3)
15 0.9017 (n=3)
Pour Point
Weathering
(weight %)
Pour Point
(°C)
0 -18 (n=2)
12.6 -12 (n=2)
24.3 -12 (n=2)
36.8 9 (n=2)
47
6.7
6.8
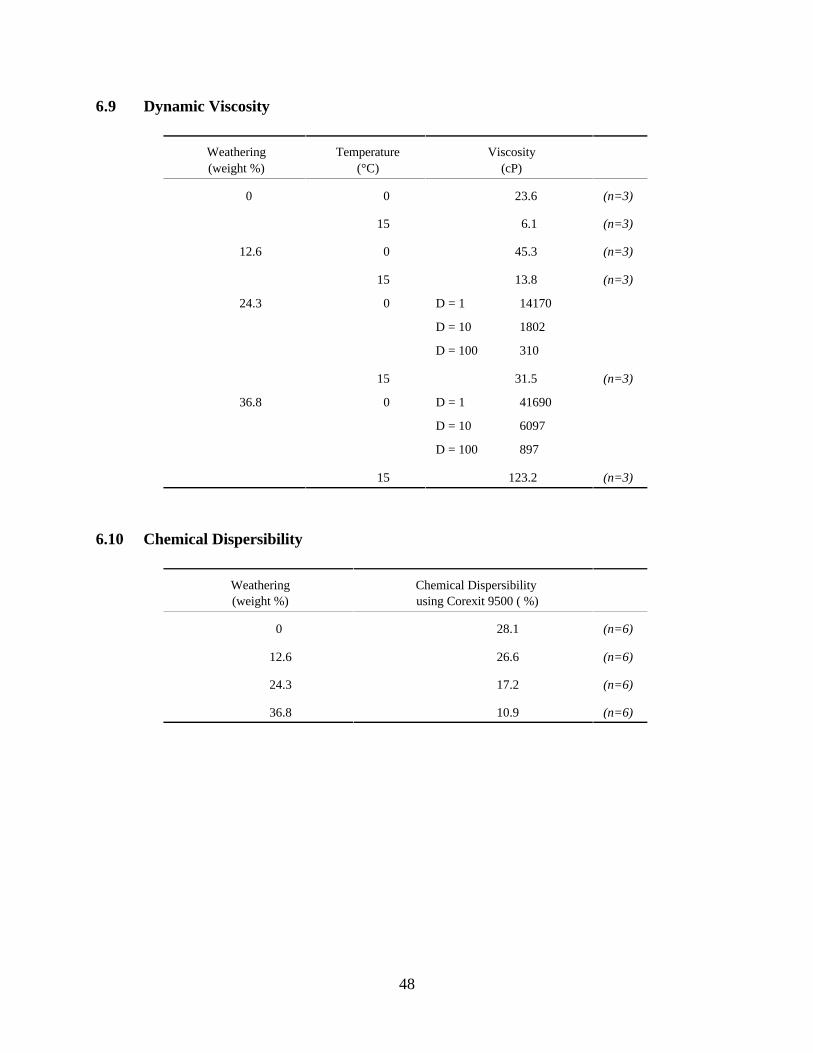
6.9 Dynamic Viscosity
Weathering
(weight %)
Temperature
(°C)
Viscosity
(cP)
0 0 23.6 (n=3)
15 6.1 (n=3)
12.6 0 45.3 (n=3)
15 13.8 (n=3)
24.3 0 14170
D = 10 1802
D = 100 310
15 31.5 (n=3)
36.8 0 41690
D = 10 6097
D = 100 897
15 123.2 (n=3)
6.10
Weathering Chemical Dispersibility
(weight %) using Corexit 9500 ( %)
0 28.1 (n=6)
12.6 26.6 (n=6)
24.3 17.2 (n=6)
36.8 10.9 (n=6)
D = 1
D = 1
Chemical Dispersibility
48
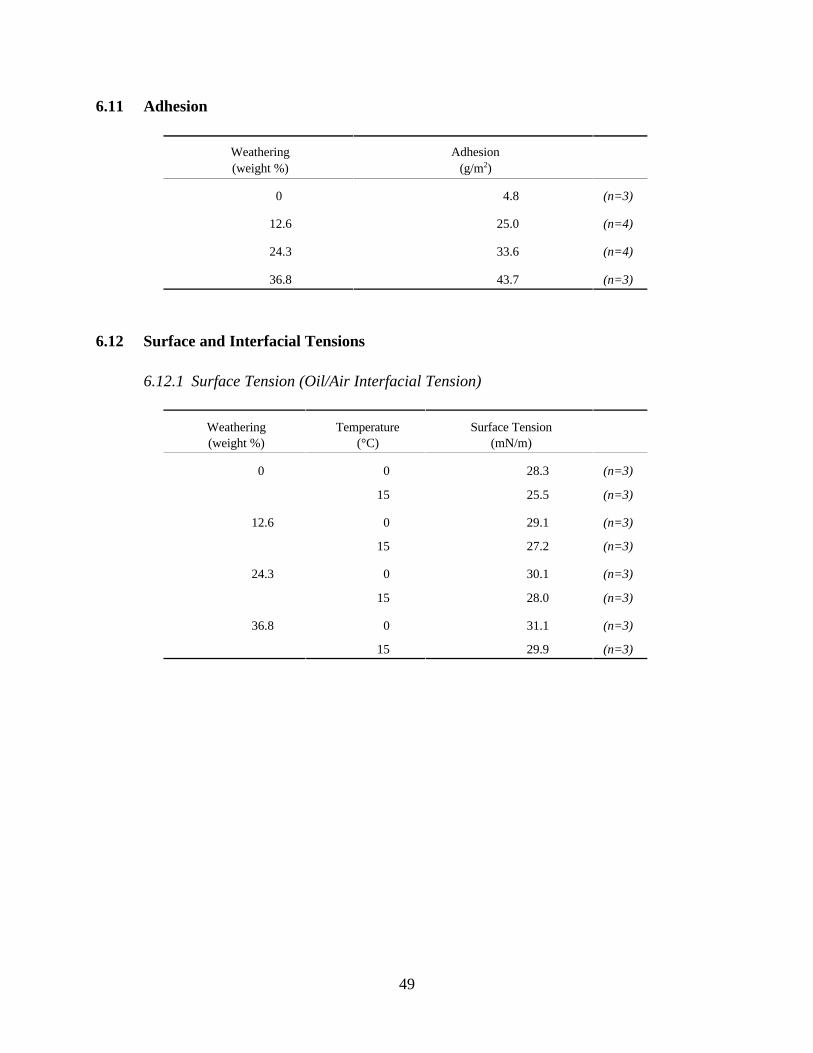
6.11 Adhesion
Weathering Adhesion
(weight %) (g/m2)
0 4.8 (n=3)
12.6 25.0 (n=4)
24.3 33.6 (n=4)
36.8 43.7 (n=3)
6.12 Surface and Interfacial Tensions
Weathering Temperature Surface Tension
(weight %) (°C) (mN/m)
0 0
15
28.3
25.5
(n=3)
(n=3)
12.6 0
15
29.1
27.2
(n=3)
(n=3)
24.3 0
15
30.1
28.0
(n=3)
(n=3)
36.8 0
15
31.1
29.9
(n=3)
(n=3)
6.12.1 Surface Tension (Oil/Air Interfacial Tension)
49
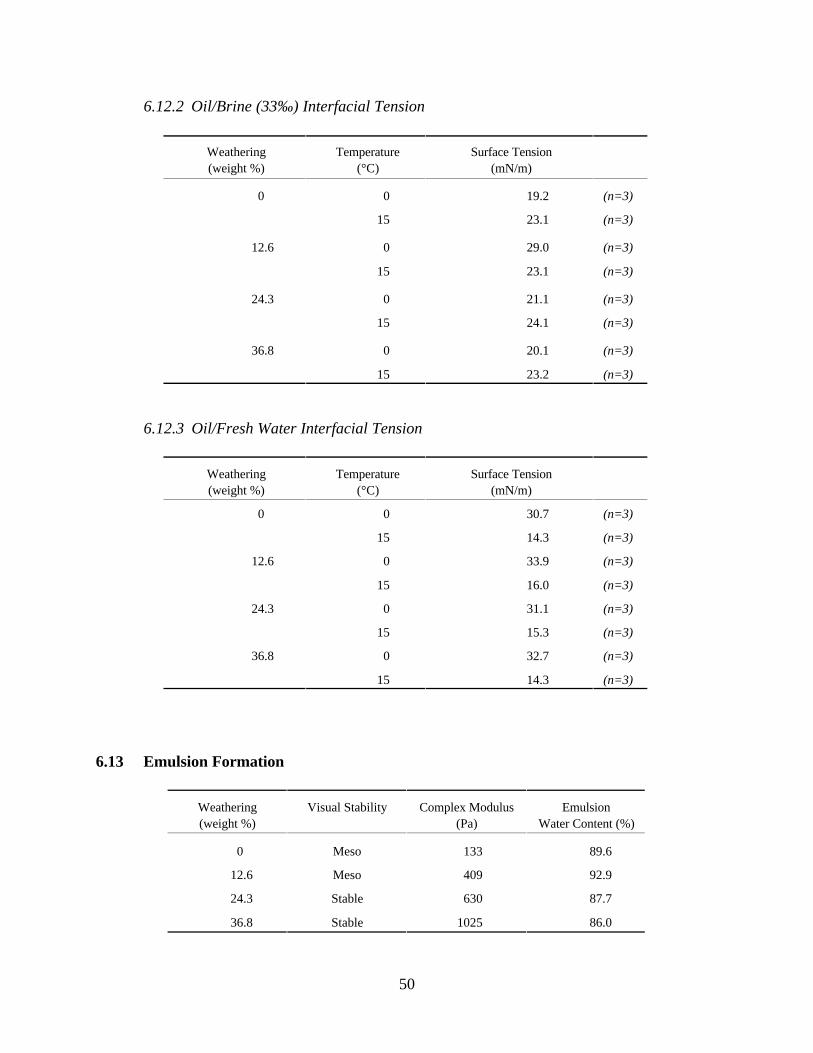
6.12.2 Oil/Brine (33‰) Interfacial Tension
Weathering
(weight %)
Temperature
(°C)
Surface Tension
(mN/m)
0 0 19.2 (n=3)
15 23.1 (n=3)
12.6 0 29.0 (n=3)
15 23.1 (n=3)
24.3 0 21.1 (n=3)
15 24.1 (n=3)
36.8 0 20.1 (n=3)
15 23.2 (n=3)
Weathering
(weight %)
Temperature
(°C)
Surface Tension
(mN/m)
0 0 30.7 (n=3)
15 14.3 (n=3)
12.6 0 33.9 (n=3)
15 16.0 (n=3)
24.3 0 31.1 (n=3)
15 15.3 (n=3)
36.8 0 32.7 (n=3)
15 14.3 (n=3)
6.13
Weathering
(weight %)
Visual Stability Complex Modulus
(Pa)
Emulsion
Water Content (%)
0
12.6
24.3
36.8
Meso
Meso
Stable
Stable
133
409
630
1025
89.6
92.9
87.7
86.0
50
6.12.3 Oil/Fresh Water Interfacial Tension
Emulsion Formation
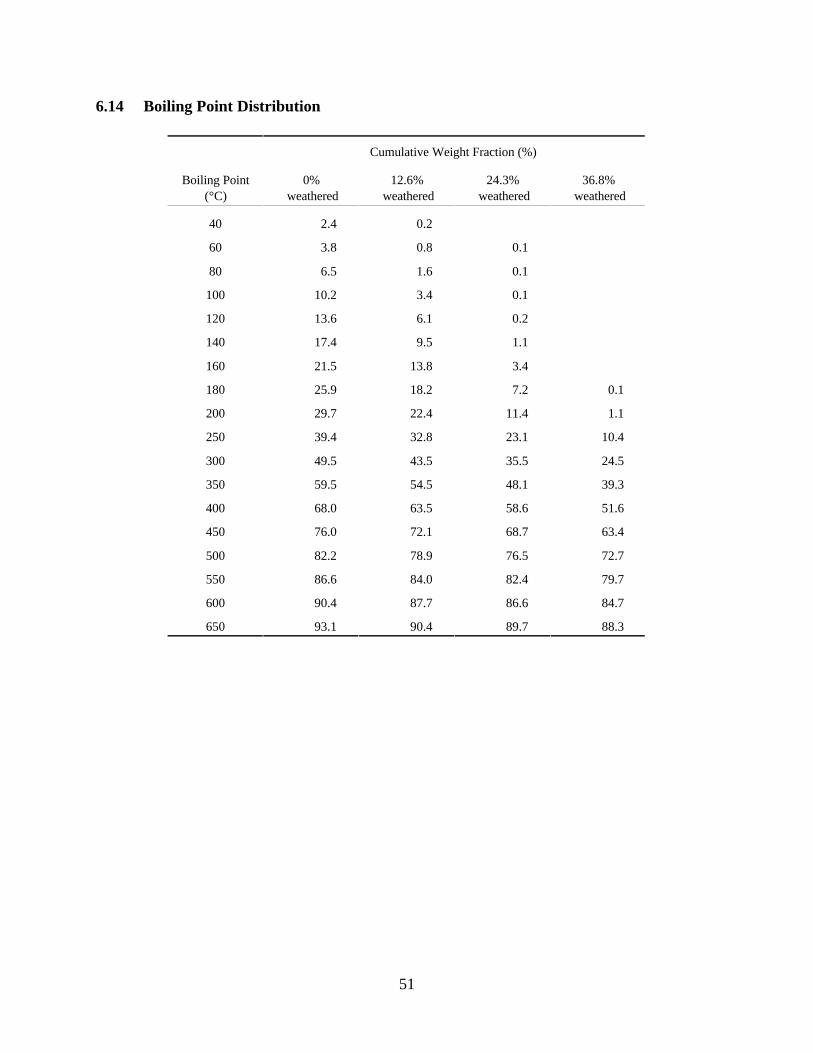
6.14 Boiling Point Distribution
Cumulative Weight Fraction (%)
Boiling Point 0% 12.6% 24.3% 36.8%
(°C) weathered weathered weathered weathered
40 2.4 0.2
60 3.8 0.8 0.1
80 6.5 1.6 0.1
100 10.2 3.4 0.1
120 13.6 6.1 0.2
140 17.4 9.5 1.1
160 21.5 13.8 3.4
180 25.9 18.2 7.2 0.1
200 29.7 22.4 11.4 1.1
250 39.4 32.8 23.1 10.4
300 49.5 43.5 35.5 24.5
350 59.5 54.5 48.1 39.3
400 68.0 63.5 58.6 51.6
450 76.0 72.1 68.7 63.4
500 82.2 78.9 76.5 72.7
550 86.6 84.0 82.4 79.7
600 90.4 87.7 86.6 84.7
650 93.1 90.4 89.7 88.3
51

6.15 Hydrocarbon Groups
Concentration
(weight %)
Component
0%
weathered
12.6%
weathered
24.3%
weathered
36.8%
weathered
Saturates
Aromatics
Resins
Asphaltenes
Waxes
77.3
16.8
4.2
1.7
3.2
77.0
15.7
5.4
2.0
3.5
76.5
15.4
5.7
2.4
4.0
72.4
18.0
6.5
3.1
4.4
6.16 Volatile Organic Compounds
Concentration
(µg/g oil)
0% 36.8%
Component weathered weathered
Benzene 2261 0
Toluene 5308 10
Ethylbenzene 1646 0
Xylenes† 8954 0
C3-Benzenes‡ 1240 110
Total BTEX 18170 10
Total BTEX and C3 - 30570 120
Benzenes‡
†“Xylenes” include o-, m-, and p-xylene isomers.
‡“C3-Benzenes” include eight isomers.
52

6.17 n-Alkane Distribution
Concentration (mg/g oil)
0% 36.8%
n-Alkane Component weathered weathered
n-C8
n-C9 5.52
n-C10 5.09
n-C11 5.02 1.39
n-C12 4.45 4.12
n-C13 4.43 5.93
n-C14 4.37 5.92
n-C15 4.57 6.98
n-C16 4.18 6.69
n-C17 3.85 6.16
Pristane 2.45 4.05
n-C18 3.14 5.19
Phytane 1.96 3.28
n-C19 3.01 4.85
n-C20 2.80 4.33
n-C21 2.56 4.13
n-C22 2.29 3.72
n-C23 2.02 3.34
n-C24 1.86 2.96
n-C25 1.75 2.83
n-C26 1.56 2.44
n-C27 1.30 2.07
n-C28 1.14 1.83
n-C29 1.03 1.66
n-C30 0.76 1.28
n-C31 0.66 1.06
n-C32 0.44 0.74
n-C33 0.35 0.52
n-C34 0.29 0.49
n-C35 0.24 0.43
n-C36 0.10 0.18
n-C37 0.08 0.12
n-C38 0.05 0.09
n-C39 0.04 0.06
n-C40 0.03 0.05
n-C41
TOTAL 78.8 88.9
C17/PRISTANE 1.58 1.52
C18/PHYTANE 1.61 1.58
PRISTANE/PHYTANE 1.25 1.23
CPI 0.96 1.04
53
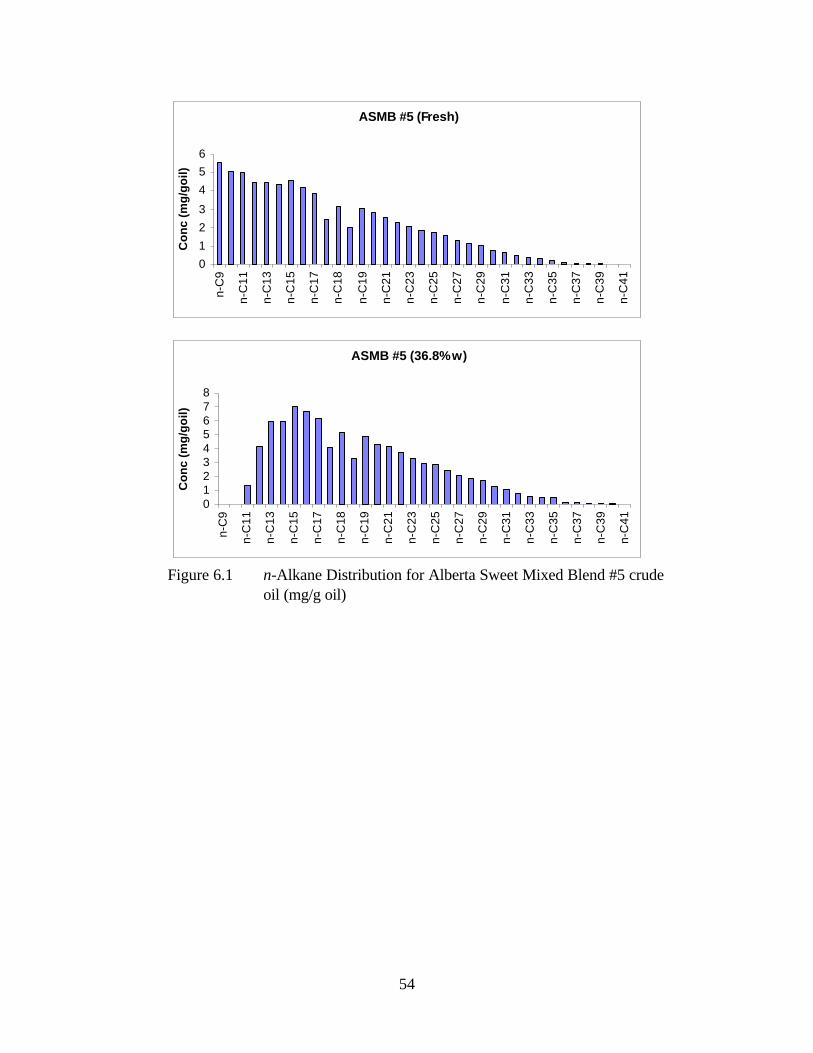
6
5C
on
c (
mg
/go
il)
4
3 n
-C9
2
1 n
-C1
1 0
n-C
13
n-C
15
n-C
17
n-C
18
n-C
19
n-C
21
n-C
23
n-C
25
n-C
27
n-C
29
n-C
31
n-C
33
n-C
35
n-C
37
n-C
39
n-C
41
Co
nc
(m
g/g
oil
)
n-C
9
n-C
11
n-C
13
n-C
15
n-C
17
n-C
18
n-C
19
n-C
21
8
7 n
-C2
3
6 5
n-C
25
4
n-C
27
3
2 n
-C2
9
1
0 n
-C3
1
n-C
33
n-C
35
n-C
37
n-C
39
n-C
41
ASMB #5 (Fresh)
ASMB #5 (36.8% w)
Figure 6.1 n-Alkane Distribution for Alberta Sweet Mixed Blend #5 crude
oil (mg/g oil)
54
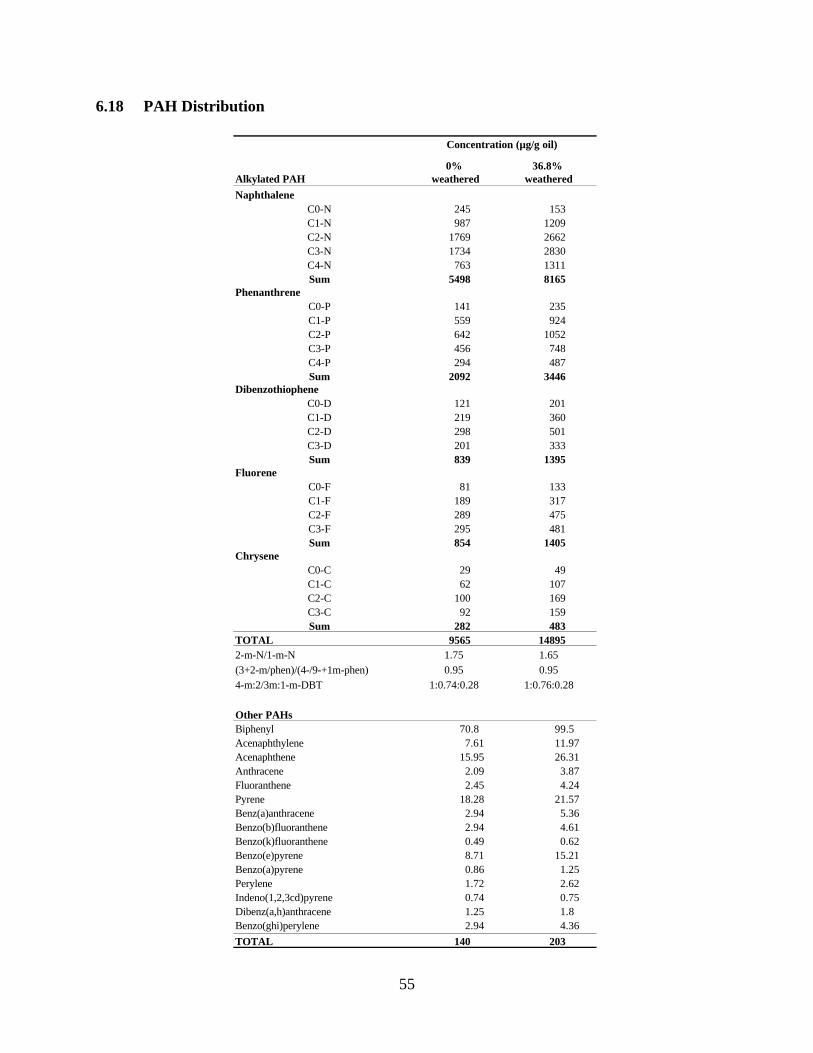
6.18 PAH Distribution
Concentration (µg/g oil)
Alkylated PAH
0%
weathered
36.8%
weathered
Naphthalene
C0-N 245 153
C1-N 987 1209
C2-N 1769 2662
C3-N 1734 2830
C4-N 763 1311
Phenanthrene
Sum 5498 8165
C0-P 141 235
C1-P 559 924
C2-P 642 1052
C3-P 456 748
C4-P 294 487
Sum
Dibenzothiophene
C0-D
2092
121
3446
201
C1-D 219 360
C2-D 298 501
C3-D 201 333
Fluorene
Sum 839 1395
C0-F 81 133
C1-F 189 317
C2-F 289 475
C3-F 295 481
Chrysene
Sum
C0-C
854
29
1405
49
C1-C 62 107
C2-C 100 169
C3-C 92 159
Sum 282 483
TOTAL 9565 14895
2-m-N/1-m-N 1.75 1.65
(3+2-m/phen)/(4-/9-+1m-phen) 0.95 0.95
4-m:2/3m:1-m-DBT 1:0.74:0.28 1:0.76:0.28
Other PAHs
Biphenyl 70.8 99.5
Acenaphthylene 7.61 11.97
Acenaphthene 15.95 26.31
Anthracene 2.09 3.87
Fluoranthene 2.45 4.24
Pyrene 18.28 21.57
Benz(a)anthracene 2.94 5.36
Benzo(b)fluoranthene 2.94 4.61
Benzo(k)fluoranthene 0.49 0.62
Benzo(e)pyrene 8.71 15.21
Benzo(a)pyrene 0.86 1.25
Perylene 1.72 2.62
Indeno(1,2,3cd)pyrene 0.74 0.75
Dibenz(a,h)anthracene 1.25 1.8
Benzo(ghi)perylene 2.94 4.36
TOTAL 140 203
55
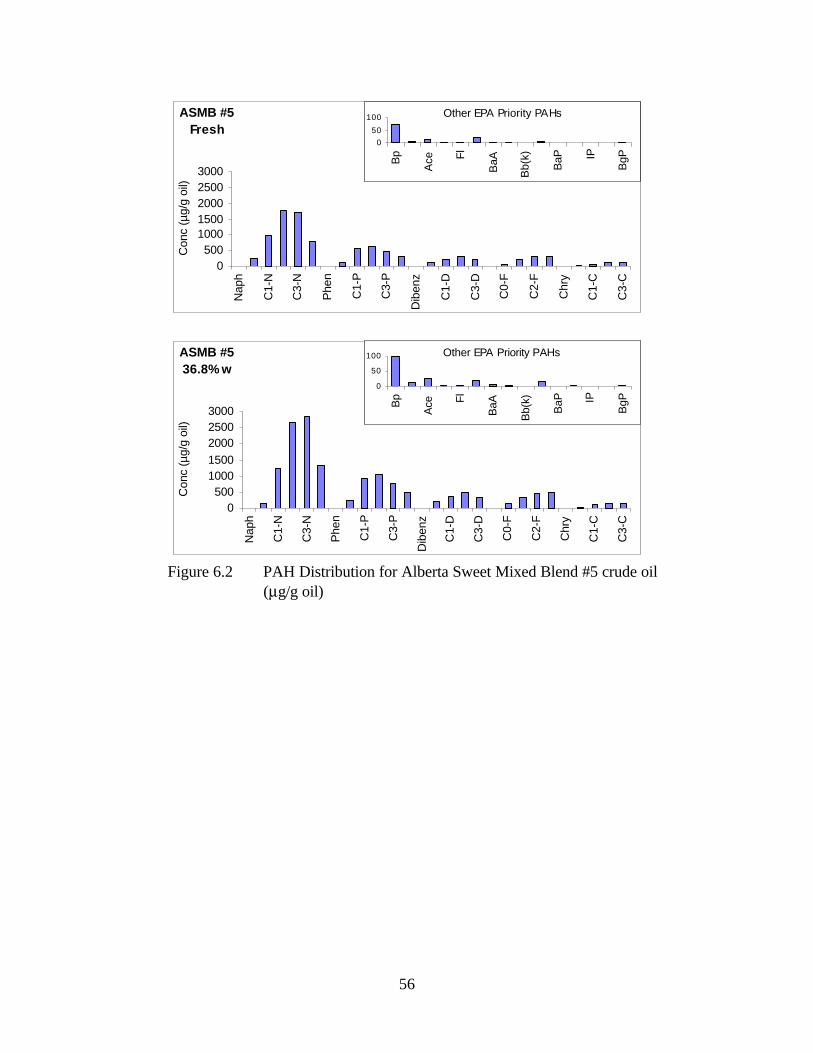
ASMB #5
0
500
1000
1500
2000
2500
3000
Naph
C1-N
C3-N
Phen
C1-P
C3-P
Dib
enz
C1-D
C3-D
C0-F
C2-F
Chry
C1-C
C3-C
Conc (
µg/g
oil)
0
50
100
Bp
Ace Fl
BaA
Bb(k
)
BaP IP
BgP
ASMB #5
0
500
1000
1500
2000
2500
3000
0
50
100
36.8% w
Other EPA Priority PAHs
Fresh
Other EPA Priority PAHs
Conc (
µg/g
oil)
Naph
C1-N
C3-N
Phen
C1-P
C3-P
B
p
Dib
enz
Ace
C1-D
Fl
C3-D
BaA
C0-F
Bb
(k)
C2-F
BaP
Chry
C1-C
IP
C3-C
B
gP
Figure 6.2 PAH Distribution for Alberta Sweet Mixed Blend #5 crude oil
(µg/g oil)
56
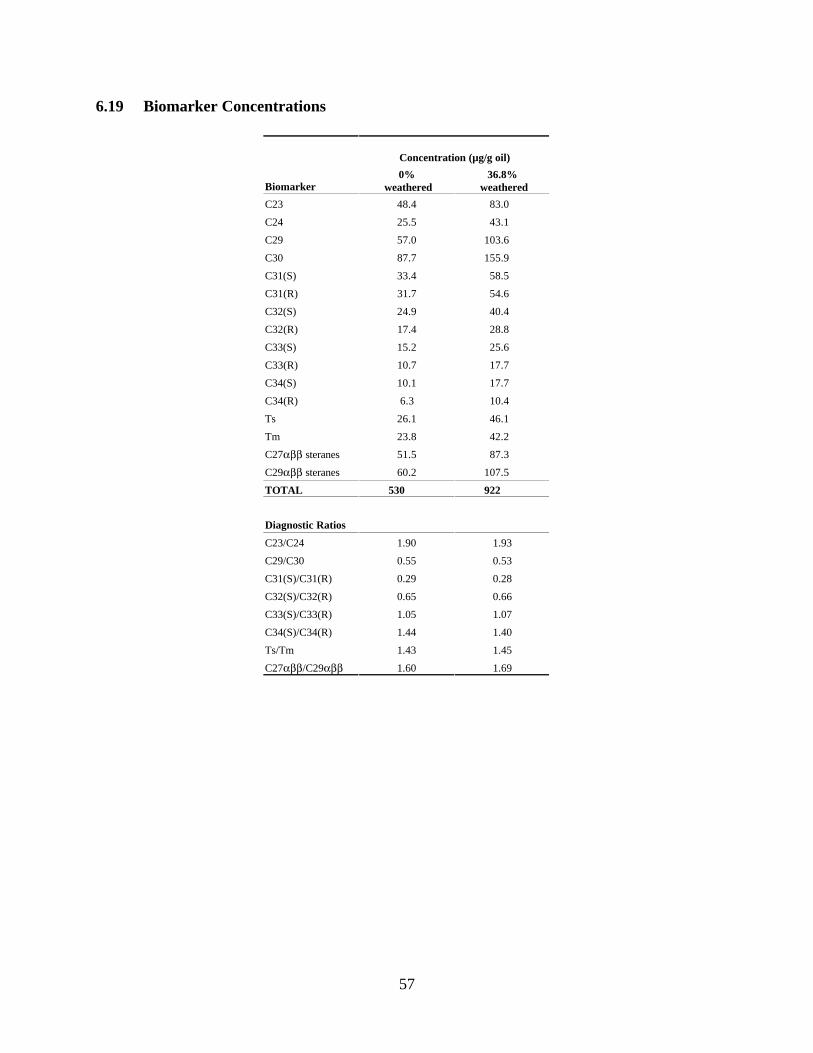
6.19 Biomarker Concentrations
Biomarker
Concentrat
0%
weathered
ion (µg/g oil)
36.8%
weathered
48.4 83.0
25.5 43.1
57.0 103.6
87.7 155.9
C31(S) 33.4 58.5
C31(R) 31.7 54.6
C32(S) 24.9 40.4
C32(R) 17.4 28.8
C33(S) 15.2 25.6
C33(R) 10.7 17.7
C34(S) 10.1 17.7
C34(R) 10.4
26.1 46.1
Tm 23.8 42.2
C27αββ 51.5 87.3
C29αββ 60.2 107.5
TOTAL
Diagnostic Ratios
C23/C24
C29/C30
C31(S)/C31(R)
C32(S)/C32(R)
C33(S)/C33(R)
C34(S)/C34(R)
Ts/Tm
C27αββ/C29αββ
1.90
0.55
0.29
0.65
1.05
1.44
1.43
1.60
1.93
0.53
0.28
0.66
1.07
1.40
1.45
1.69
C23
C24
C29
C30
6.3
Ts
steranes
steranes
530 922
57
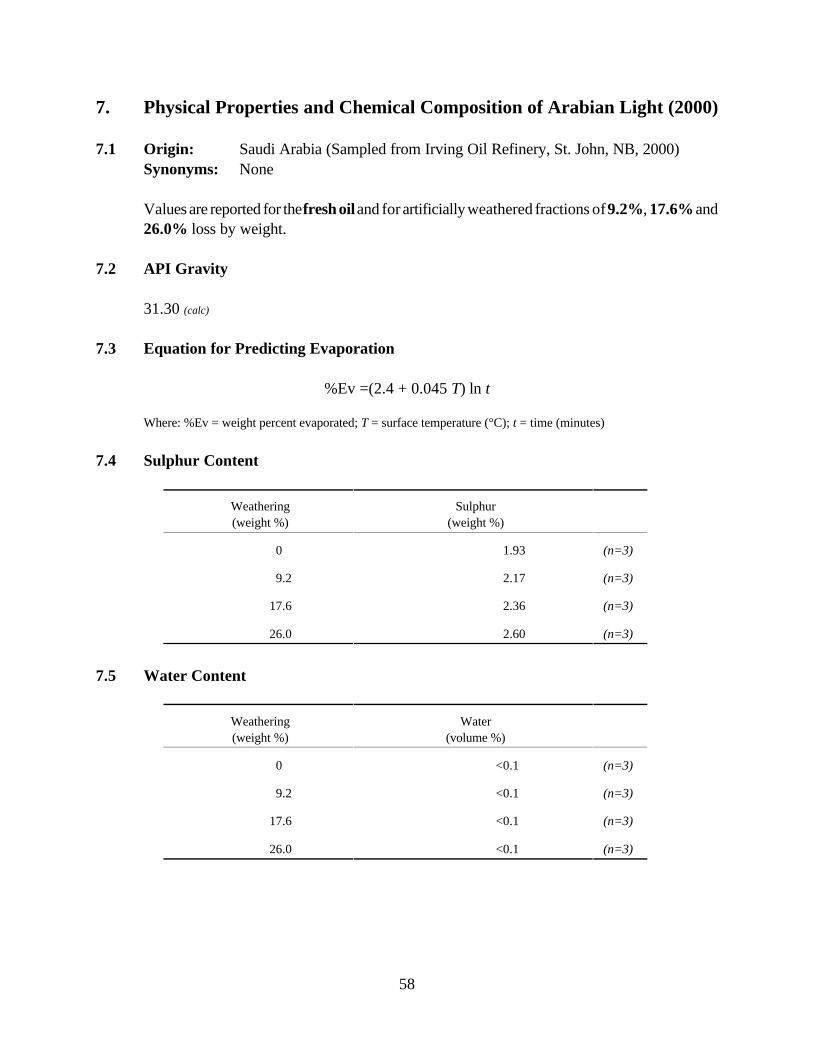
7.5
7. Physical Properties and Chemical Composition of Arabian Light (2000)
7.1 Origin: Saudi Arabia (Sampled from Irving Oil Refinery, St. John, NB, 2000)
Synonyms: None
Values are reported for the fresh oil and for artificially weathered fractions of 9.2%, 17.6% and
26.0% loss by weight.
7.2 API Gravity
31.30 (calc)
7.3 Equation for Predicting Evaporation
%Ev =(2.4 + 0.045 T) ln t
Where: %Ev = weight percent evaporated; T = surface temperature (°C); t = time (minutes)
7.4 Sulphur Content
Weathering Sulphur
(weight %) (weight %)
0 1.93 (n=3)
9.2 2.17 (n=3)
17.6 2.36 (n=3)
26.0 2.60 (n=3)
Water Content
Weathering Water
(weight %) (volume %)
0 (n=3)
9.2 <0.1 (n=3)
17.6 <0.1 (n=3)
26.0 <0.1 (n=3)
<0.1
58
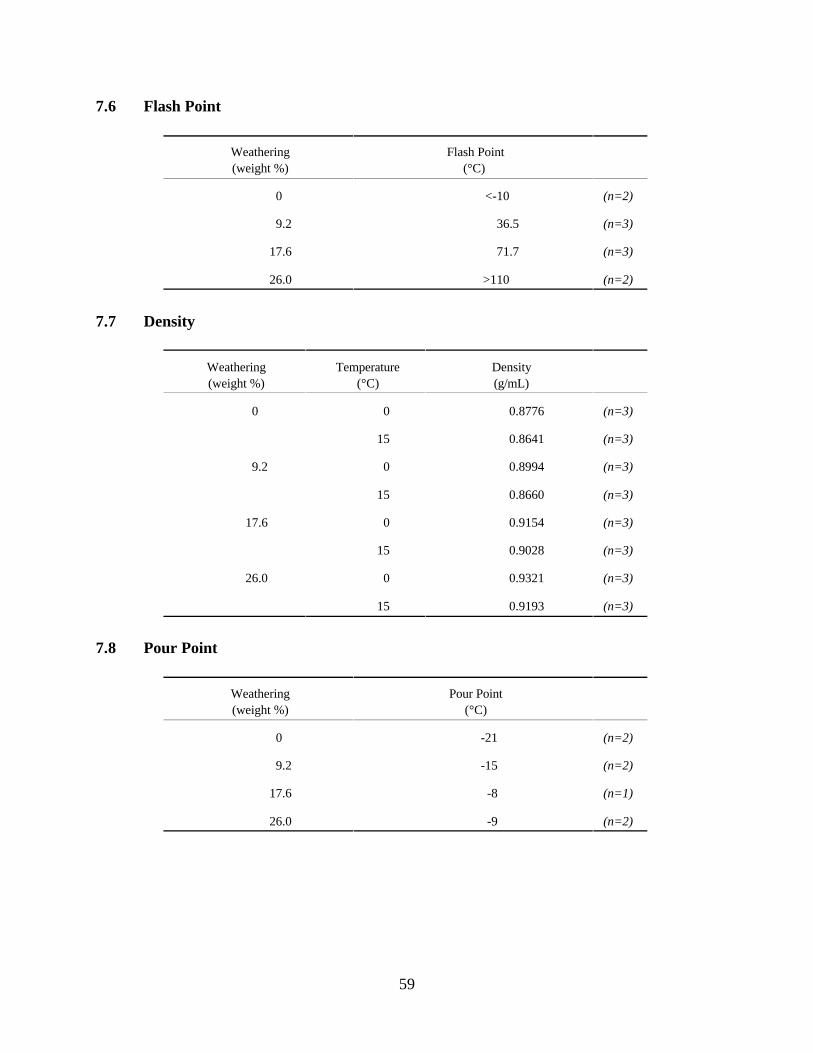
7.6 Flash Point
Density
Weathering
(weight %)
Flash Point
(°C)
0 <-10 (n=2)
9.2 36.5 (n=3)
17.6 71.7 (n=3)
26.0 >110 (n=2)
Weathering
(weight %)
Temperature
(°C)
Density
(g/mL)
0 0 0.8776 (n=3)
15 0.8641 (n=3)
9.2 0 0.8994 (n=3)
15 0.8660 (n=3)
17.6 0 0.9154 (n=3)
15 0.9028 (n=3)
26.0 0 0.9321 (n=3)
15 0.9193 (n=3)
Pour Point
Weathering
(weight %)
Pour Point
(°C)
0 -21 (n=2)
9.2 -15 (n=2)
17.6 -8 (n=1)
26.0 -9 (n=2)
7.7
7.8
59
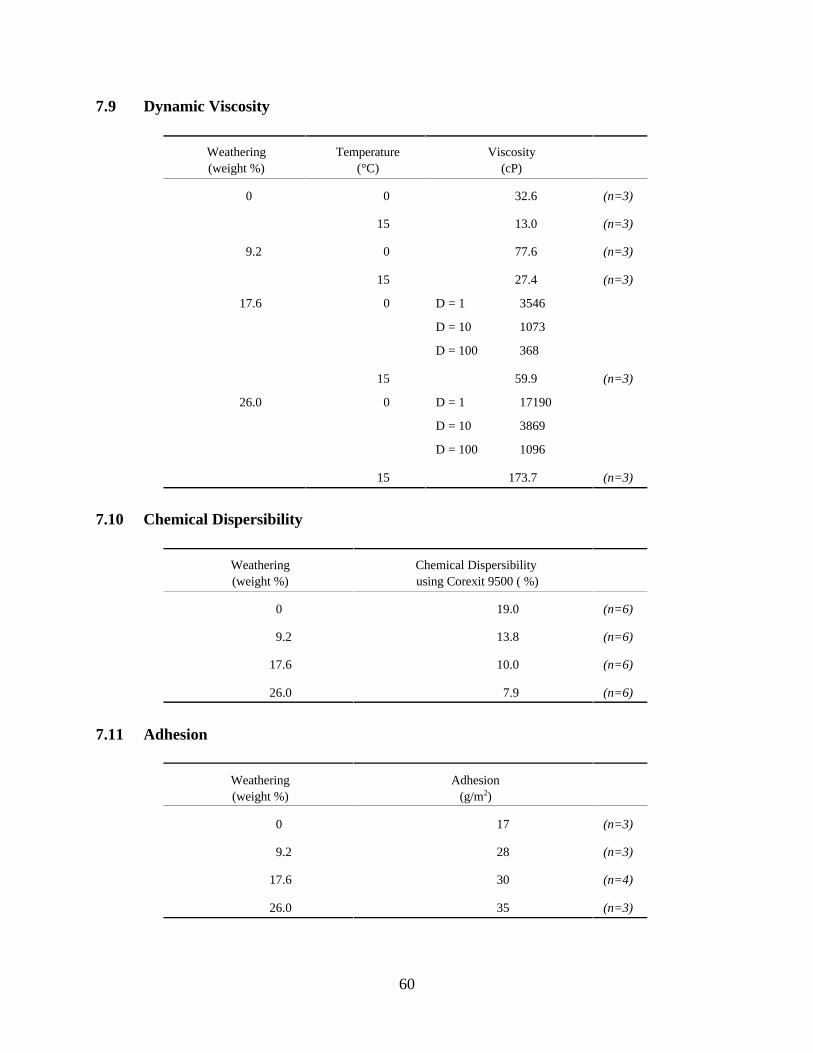
7.9 Dynamic Viscosity
Weathering
(weight %)
Temperature
(°C)
Viscosity
(cP)
0 0 32.6 (n=3)
15 13.0 (n=3)
9.2 0 77.6 (n=3)
15 27.4 (n=3)
17.6 0 3546
D = 10 1073
D = 100 368
15 59.9 (n=3)
26.0 0 17190
D = 10 3869
D = 100 1096
15 173.7 (n=3)
7.10
Weathering
(weight %)
Chemical Dispersibility
using Corexit 9500 ( %)
0 19.0 (n=6)
9.2 13.8 (n=6)
17.6 10.0 (n=6)
26.0 7.9 (n=6)
7.11 Adhesion
Weathering Adhesion
(weight %) (g/m2)
0 (n=3)
9.2 28 (n=3)
17.6 30 (n=4)
26.0 35 (n=3)
D = 1
D = 1
Chemical Dispersibility
17
60
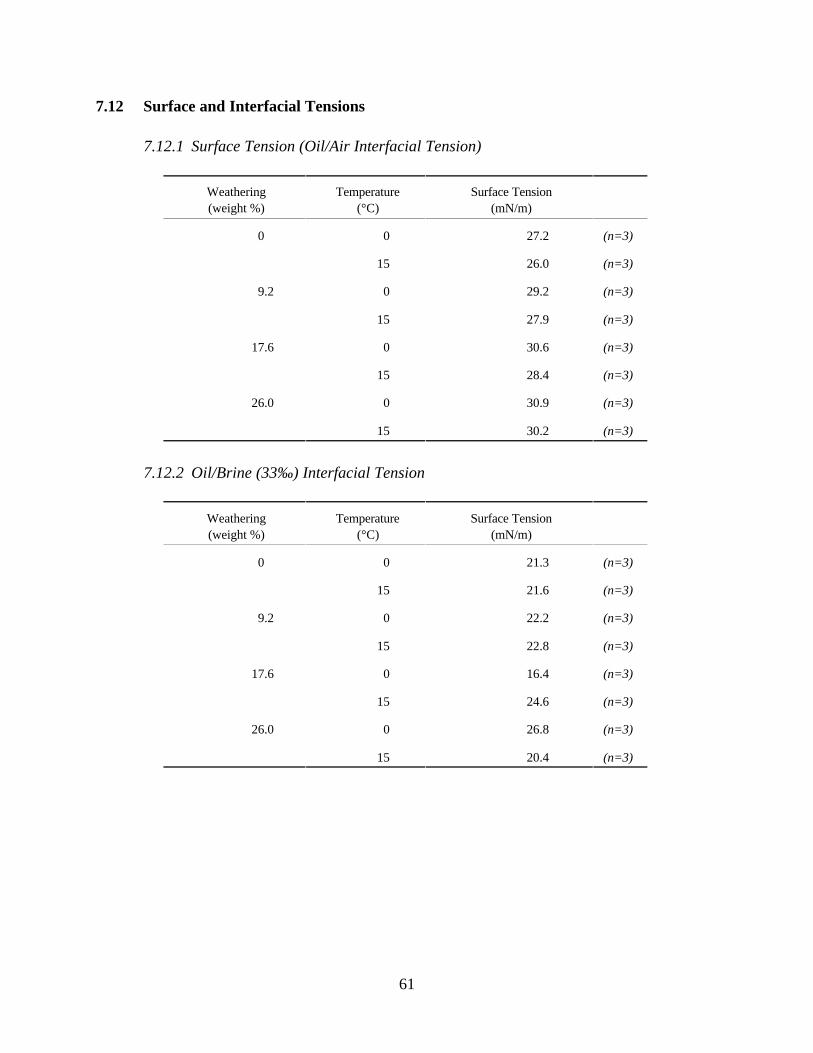
7.12 Surface and Interfacial Tensions
7.12.1 Surface Tension (Oil/Air Interfacial Tension)
Weathering
(weight %)
Temperature
(°C)
Surface Tension
(mN/m)
0 0 27.2 (n=3)
15 26.0 (n=3)
9.2 0 29.2 (n=3)
15 27.9 (n=3)
17.6 0 30.6 (n=3)
15 28.4 (n=3)
26.0 0 30.9 (n=3)
15 30.2 (n=3)
Weathering Temperature Surface Tension
(weight %) (mN/m)
0
9.2
0
15
0
21.3
21.6
22.2
(n=3)
(n=3)
(n=3)
17.6
26.0
15
0
15
0
22.8
16.4
24.6
26.8
(n=3)
(n=3)
(n=3)
(n=3)
15 20.4 (n=3)
7.12.2 Oil/Brine (33‰) Interfacial Tension
(°C)
61
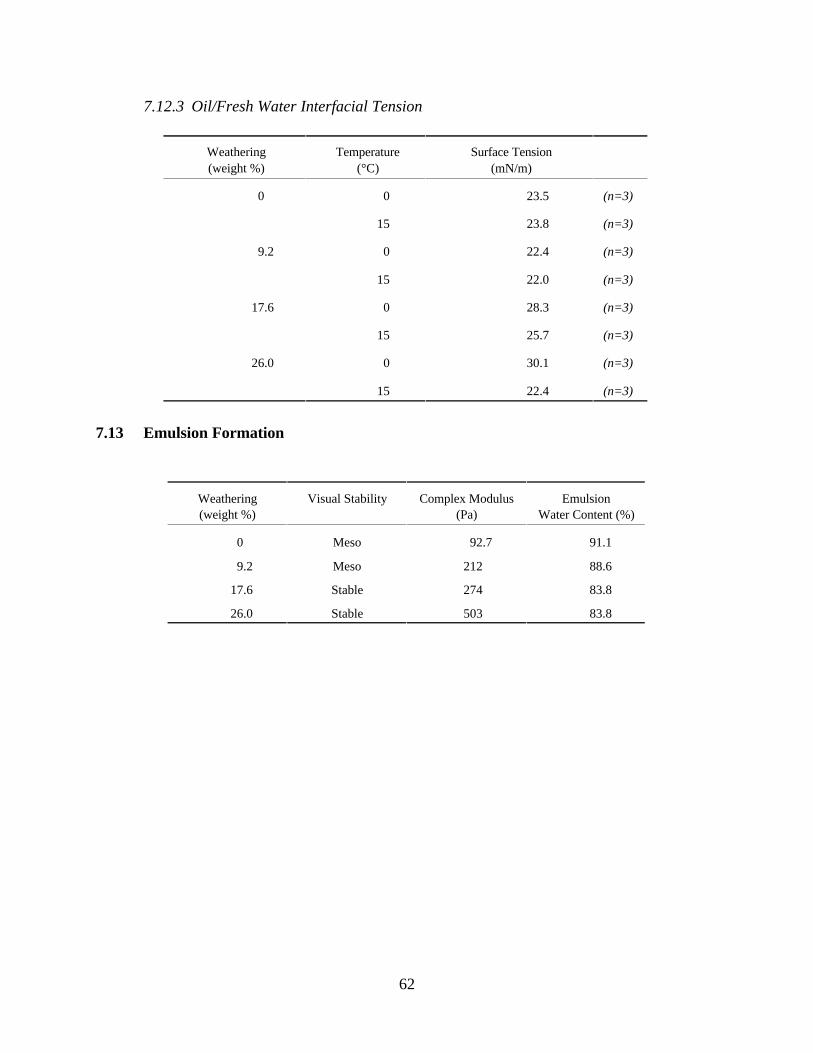
7.12.3 Oil/Fresh Water Interfacial Tension
Weathering
(weight %)
Temperature
(°C)
Surface Tension
(mN/m)
0 0 23.5 (n=3)
15 23.8 (n=3)
9.2 0 22.4 (n=3)
15 22.0 (n=3)
17.6 0 28.3 (n=3)
15 25.7 (n=3)
26.0 0 30.1 (n=3)
15 22.4 (n=3)
7.13
Weathering Complex Modulus Emulsion
(weight %) (Pa)
0 Meso 92.7 91.1
9.2 Meso 212 88.6
17.6 Stable 274 83.8
26.0 Stable 503 83.8
Emulsion Formation
Visual Stability
Water Content (%)
62
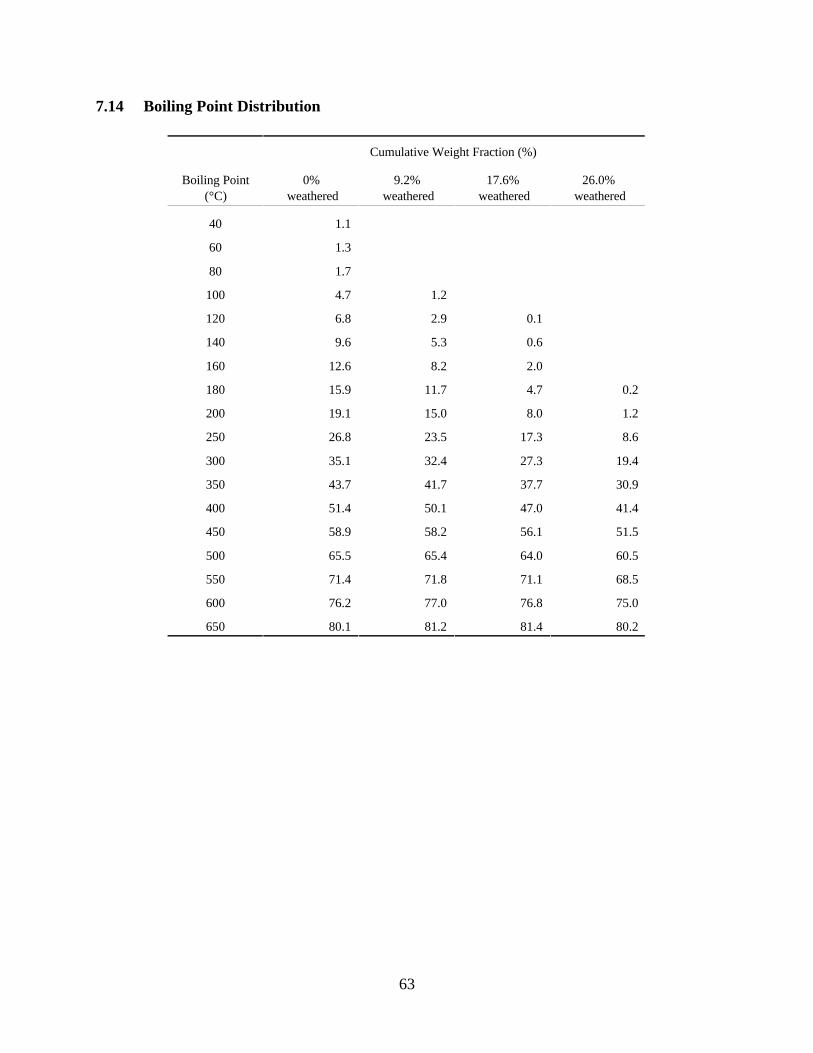
7.14 Boiling Point Distribution
Cumulative Weight Fraction (%)
Boiling Point
(°C)
0%
weathered w
9.2%
eathered w
17.6%
eathered w
26.0%
eathered
40 1.1
60 1.3
80 1.7
100 4.7 1.2
120 6.8 2.9 0.1
140 9.6 5.3 0.6
160 12.6 8.2 2.0
180 15.9 11.7 4.7 0.2
200 19.1 15.0 8.0 1.2
250 26.8 23.5 17.3 8.6
300 35.1 32.4 27.3 19.4
350 43.7 41.7 37.7 30.9
400 51.4 50.1 47.0 41.4
450 58.9 58.2 56.1 51.5
500 65.5 65.4 64.0 60.5
550 71.4 71.8 71.1 68.5
600 76.2 77.0 76.8 75.0
650 80.1 81.2 81.4 80.2
63

7.15 Hydrocarbon Groups
Concentration
(weight %)
Component
0%
weathered
9.2%
weathered
17.6%
weathered
26.0%
weathered
Saturates
Aromatics
Resins
Asphaltenes
Waxes
75.5
15.2
5.7
3.6
2.7
73.3
16.9
6.0
3.8
2.9
72.4
16.7
6.6
4.3
3.2
70.1
16.3
8.8
4.8
3.6
7.16 Volatile Organic Compounds
Concentration
(µg/g oil)
0% 26.0%
Component weathered weathered
Benzene
Toluene 3050 74
Ethylbenzene 1995 434
Xylenes† 4927 1508
C3-Benzenes‡ 8620 6520
Total BTEX 10950 2030
Total BTEX and C3 - 19570 8550
Benzenes‡
†“Xylenes” include o-, m-, and p-xylene isomers.
‡“C3-Benzenes” include eight isomers.
979 11
64
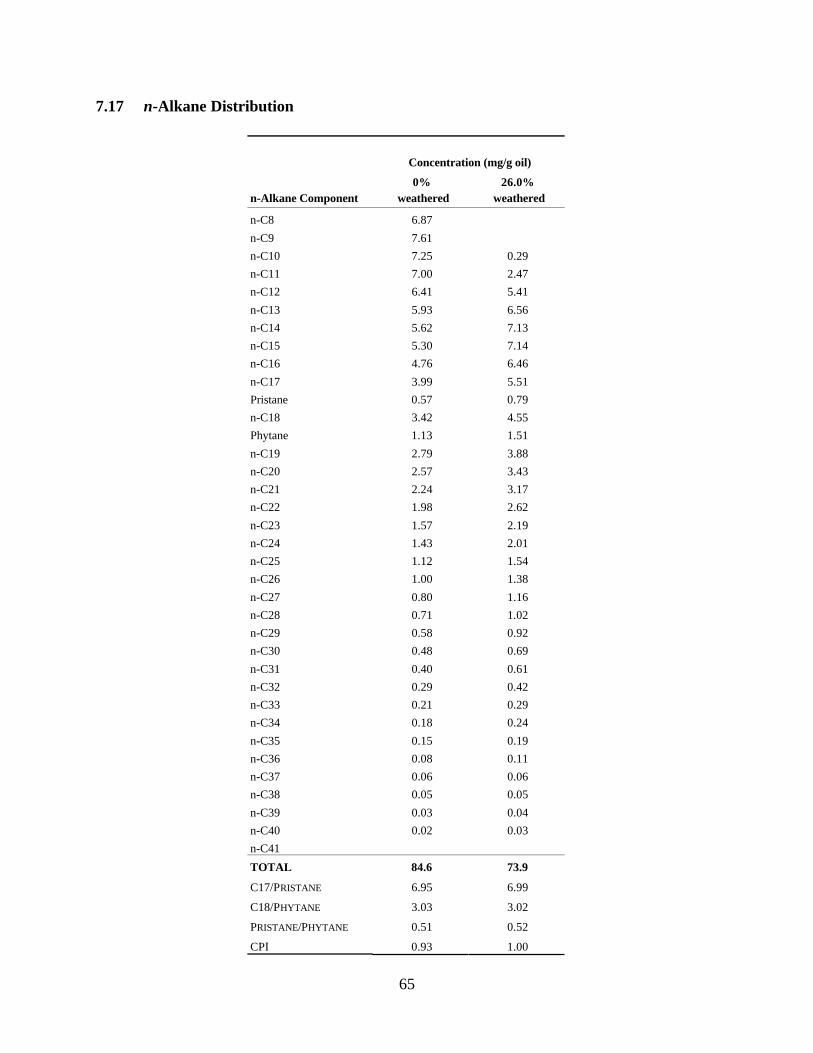
7.17 n-Alkane Distribution
Concentration (mg/g oil)
0% 26.0%
n-Alkane Component weathered weathered
n-C8 6.87
n-C9 7.61
n-C10 7.25 0.29
n-C11 7.00 2.47
n-C12 6.41 5.41
n-C13 5.93 6.56
n-C14 5.62 7.13
n-C15 5.30 7.14
n-C16 4.76 6.46
n-C17 3.99 5.51
Pristane 0.57 0.79
n-C18 3.42 4.55
Phytane 1.13 1.51
n-C19 2.79 3.88
n-C20 2.57 3.43
n-C21 2.24 3.17
n-C22 1.98 2.62
n-C23 1.57 2.19
n-C24 1.43 2.01
n-C25 1.12 1.54
n-C26 1.00 1.38
n-C27 0.80 1.16
n-C28 0.71 1.02
n-C29 0.58 0.92
n-C30 0.48 0.69
n-C31 0.40 0.61
n-C32 0.29 0.42
n-C33 0.21 0.29
n-C34 0.18 0.24
n-C35 0.15 0.19
n-C36 0.08 0.11
n-C37 0.06 0.06
n-C38 0.05 0.05
n-C39 0.03 0.04
n-C40 0.02 0.03
n-C41
TOTAL 84.6 73.9
C17/PRISTANE 6.95 6.99
C18/PHYTANE 3.03 3.02
PRISTANE/PHYTANE 0.51 0.52
CPI 0.93 1.00
65
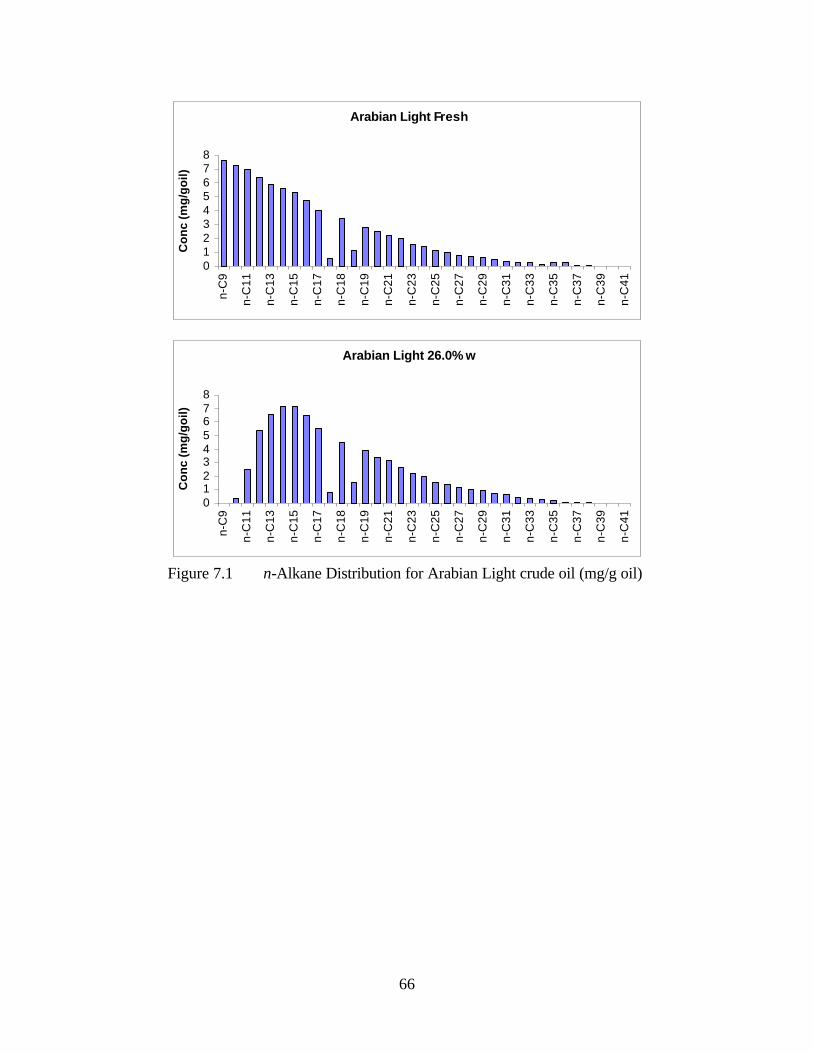
Arabian Light Fresh
87
65
43
Co
nc
(m
g/g
oil
) C
on
c (
mg
/go
il)
n-C
9n
-C9
2n
-C1
1n
-C1
1
1
0n
-C1
3n
-C1
3
n-C
15
n-C
15
n-C
17
n-C
17
n-C
18
n-C
18
Arabian Light 26.0% w n
-C1
9n
-C1
9
n-C
21
n
-C2
18
7n
-C2
3
n-C
23
6
5n
-C2
5
n-C
25
4n
-C2
7
n-C
27
3
2n
-C2
9
n-C
29
1
0n
-C3
1n
-C3
1
n-C
33
n-C
33
n-C
35
n-C
35
Figure 7.1 n-Alkane Distribution for Arabian Light crude oil (mg/g oil)n
-C3
7n
-C3
7
n-C
39
n-C
39
n-C
41
n
-C4
1
66
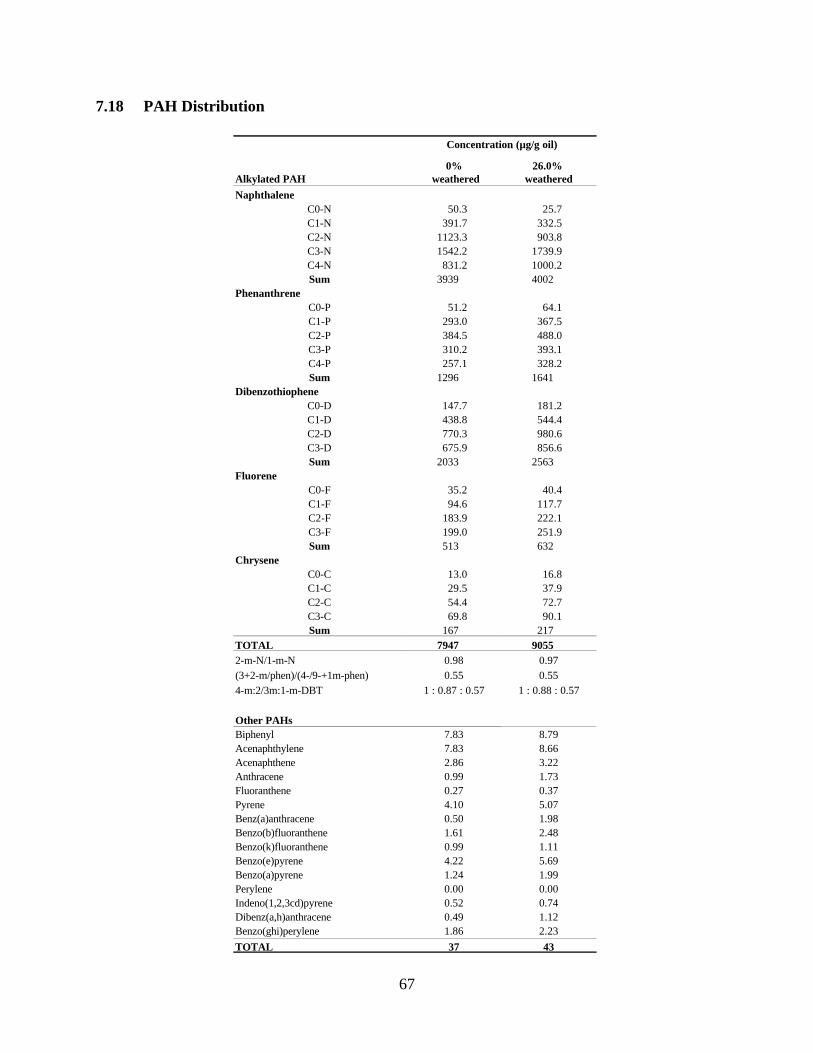
7.18 PAH Distribution
Concentration (µg/g oil)
0% 26.0%
Alkylated PAH weathered weathered
Naphthalene
C0-N 50.3 25.7
C1-N 391.7 332.5
C2-N 1123.3 903.8
C3-N 1542.2 1739.9
C4-N 831.2 1000.2
Sum 3939 4002
Phenanthrene
C0-P 51.2 64.1
C1-P 293.0 367.5
C2-P 384.5 488.0
C3-P 310.2 393.1
C4-P 257.1 328.2
Sum 1296 1641
Dibenzothiophene
C0-D 147.7 181.2
C1-D 438.8 544.4
C2-D 770.3 980.6
C3-D 675.9 856.6
Sum 2033 2563
Fluorene
C0-F 35.2 40.4
C1-F 94.6 117.7
C2-F 183.9 222.1
C3-F 199.0 251.9
Sum 513 632
Chrysene
C0-C 13.0 16.8
C1-C 29.5 37.9
C2-C 54.4 72.7
C3-C 69.8 90.1
Sum 167 217
TOTAL 7947 9055
2-m-N/1-m-N 0.98 0.97
(3+2-m/phen)/(4-/9-+1m-phen) 0.55 0.55
4-m:2/3m:1-m-DBT 1 : 0.88 : 0.57
Other PAHs
Biphenyl 7.83 8.79
Acenaphthylene 7.83 8.66
Acenaphthene 2.86 3.22
Anthracene 0.99 1.73
Fluoranthene 0.27 0.37
Pyrene 4.10 5.07
Benz(a)anthracene 0.50 1.98
Benzo(b)fluoranthene 1.61 2.48
Benzo(k)fluoranthene 0.99 1.11
Benzo(e)pyrene 4.22 5.69
Benzo(a)pyrene 1.24 1.99
Perylene 0.00 0.00
Indeno(1,2,3cd)pyrene 0.52 0.74
Dibenz(a,h)anthracene 0.49 1.12
Benzo(ghi)perylene 1.86 2.23
TOTAL
1 : 0.87 : 0.57
37 43
67
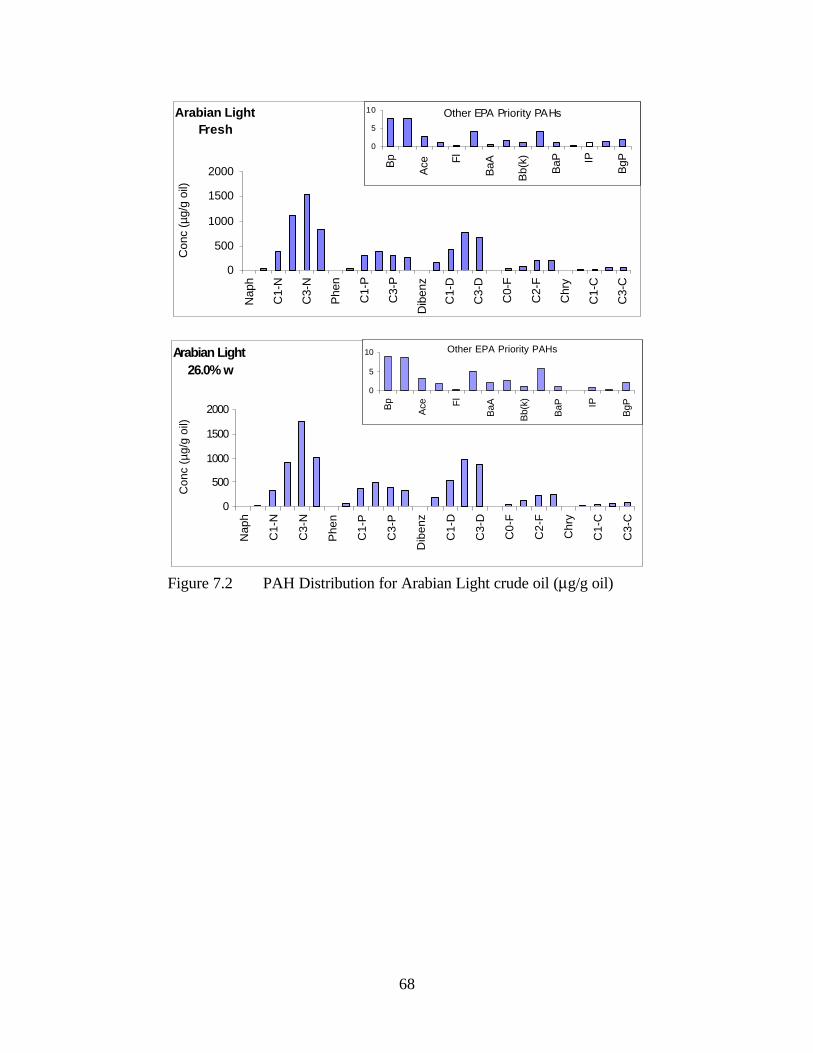
26.0% w
0
500
1000
1500
2000
Na
ph
C1
-N
C3
-N
Ph
en
C1
-P
C3
-P
Dib
en
z
C1
-D
C3
-D
C0
-F
C2
-F
Ch
ry
C1
-C
C3
-C
Co
nc (
µg
/g o
il)
Other EPA Priority PAHs
0
5
10
Bp
Ace Fl
BaA
Bb(k
)
BaP IP
BgP
Arabian Light
0
500
1000
1500
2000
0
5
10
Arabian Light
Fresh
Other EPA Priority PAHs
Conc (
µg/g
oil)
Naph
C1-N
C3-N
Phen
C1-P
Bp
C3-P
Dib
enz
Ace
C1-D
Fl
C3-D
BaA
C0-F
Bb(k
)
C2-F
BaP
Chry
IPC
1-C
C3-C
B
gP
Figure 7.2 PAH Distribution for Arabian Light crude oil (µg/g oil)
68
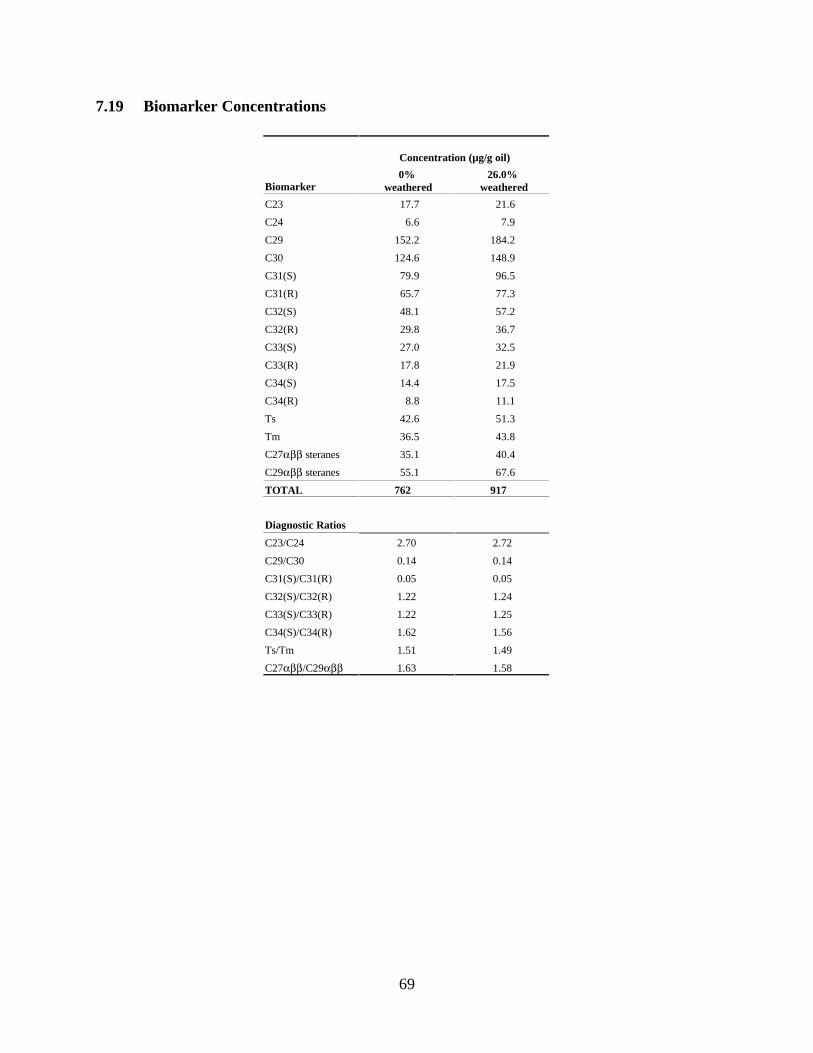
7.19 Biomarker Concentrations
Biomarker
Concentrati
0%
weathered
on (µg/g oil)
26.0%
weathered
17.7 21.6
6.6 7.9
152.2 184.2
124.6 148.9
C31(S) 79.9 96.5
C31(R) 65.7 77.3
C32(S) 48.1 57.2
C32(R) 29.8 36.7
C33(S) 27.0 32.5
C33(R) 17.8 21.9
C34(S) 14.4 17.5
C34(R) 11.1
42.6 51.3
Tm 36.5 43.8
C27αββ 35.1 40.4
C29αββ 55.1 67.6
TOTAL
Diagnostic Ratios
C23/C24
C29/C30
C31(S)/C31(R)
C32(S)/C32(R)
C33(S)/C33(R)
C34(S)/C34(R)
Ts/Tm
C27αββ/C29αββ
2.70
0.14
0.05
1.22
1.22
1.62
1.51
1.63
2.72
0.14
0.05
1.24
1.25
1.56
1.49
1.58
C23
C24
C29
C30
8.8
Ts
steranes
steranes
762 917
69
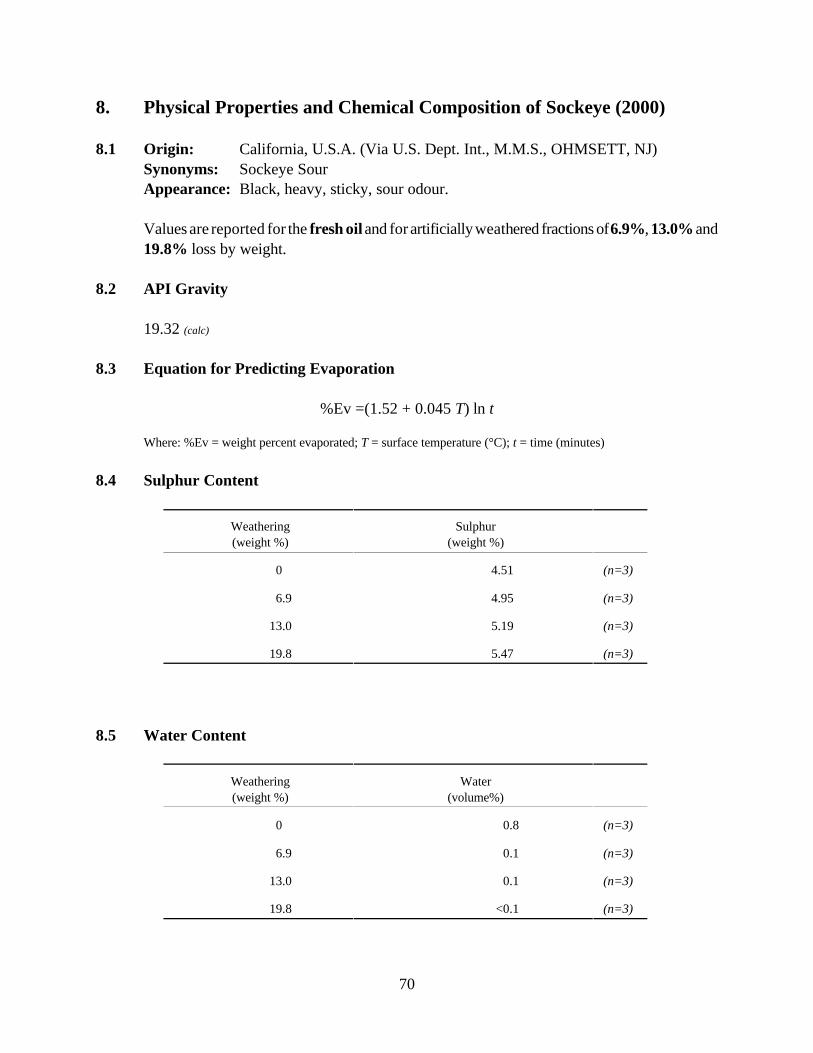
8.5
8. Physical Properties and Chemical Composition of Sockeye (2000)
8.1 Origin: California, U.S.A. (Via U.S. Dept. Int., M.M.S., OHMSETT, NJ)
Synonyms: Sockeye Sour
Appearance: Black, heavy, sticky, sour odour.
Values are reported for the fresh oil and for artificially weathered fractions of 6.9%, 13.0% and
19.8% loss by weight.
8.2 API Gravity
19.32 (calc)
8.3 Equation for Predicting Evaporation
%Ev =(1.52 + 0.045 T) ln t
Where: %Ev = weight percent evaporated; T = surface temperature (°C); t = time (minutes)
8.4 Sulphur Content
Weathering Sulphur
(weight %) (weight %)
0 4.51 (n=3)
6.9 4.95 (n=3)
13.0 5.19 (n=3)
19.8 5.47 (n=3)
Water Content
Weathering
(weight %)
Water
(volume%)
0 0.8 (n=3)
6.9 0.1 (n=3)
13.0 0.1 (n=3)
19.8 <0.1 (n=3)
70

8.6 Flash Point
Density
Weathering
(weight %)
Flash Point
(°C)
0 (n=4)
6.9 35 (n=3)
13.0 72 (n=3)
19.8 >110 (n=2)
Weathering
(weight %)
Temperature
(°C)
Density
(g/mL)
0 0 0.9465 (n=3)
15 0.9354 (n=3)
6.9 0 0.9642 (n=3)
15 0.9537 (n=3)
13.0 0 0.9798 (n=3)
15 0.9692 (n=3)
19.8 0 0.9951 (n=3)
15 0.9839 (n=3)
Pour Point
Weathering
(weight %)
Pour Point
(°C)
0 -25 (n=2)
6.9 -18 (n=2)
13.0 2 (n=2)
19.8 13 (n=2)
71
8.7
-4
8.8
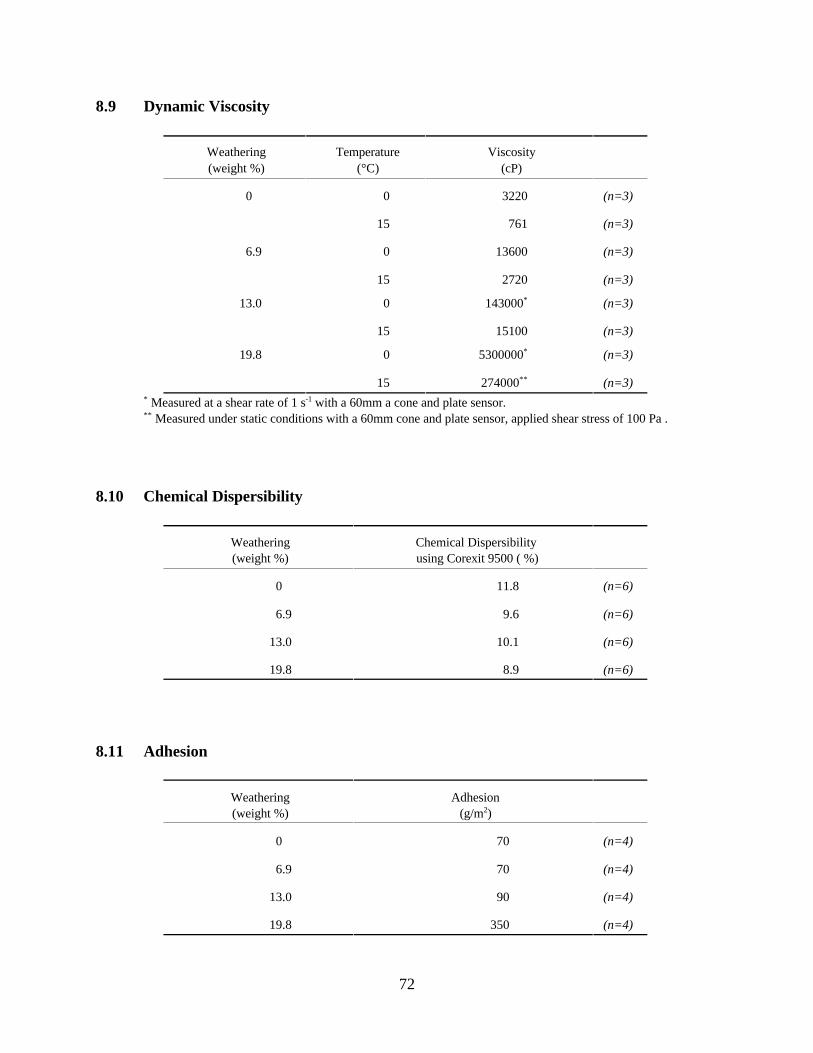
8.9 Dynamic Viscosity
8.10
8.11
Weathering
(weight %)
Temperature
(°C)
Viscosity
(cP)
0 0 3220 (n=3)
15 761 (n=3)
6.9 0 13600 (n=3)
15 2720 (n=3)
13.0 0 143000 * (n=3)
15 15100 (n=3)
19.8 0 5300000 * (n=3)
15 274000 ** (n=3)
* Measured at a shear rate of 1 s-1 with a 60mm a cone and plate sensor. ** Measured under static conditions with a 60mm cone and plate sensor, applied shear stress of 100 Pa .
Adhesion
Weathering Adhesion
(weight %) (g/m2)
0 (n=4)
6.9 70 (n=4)
13.0 90 (n=4)
19.8 350 (n=4)
Weathering Chemical Dispersibility
(weight %) using Corexit 9500 ( %)
0 11.8 (n=6)
6.9 9.6 (n=6)
13.0 10.1 (n=6)
19.8 8.9 (n=6)
Chemical Dispersibility
70
72
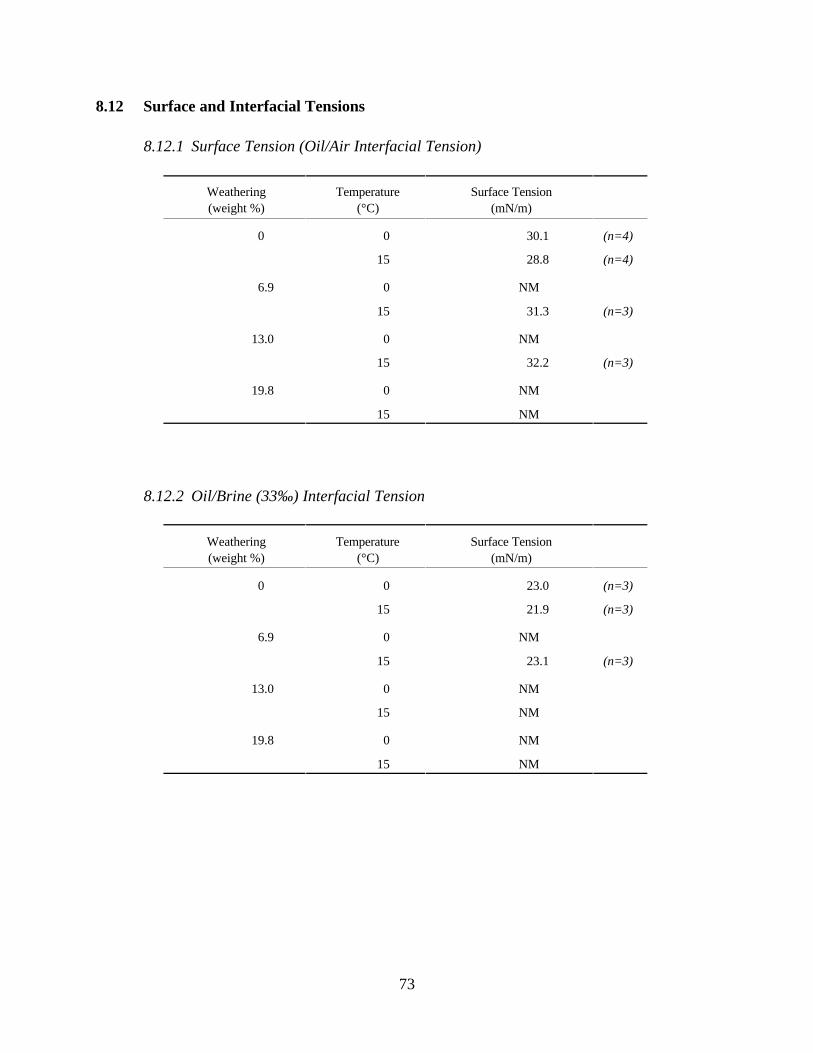
8.12 Surface and Interfacial Tensions
8.12.1 Surface Tension (Oil/Air Interfacial Tension)
Weathering
(weight %)
Temperature
(°C)
Surface Tension
(mN/m)
0 0 30.1 (n=4)
15 28.8 (n=4)
6.9 0
15 31.3 (n=3)
13.0 0
15 32.2 (n=3)
19.8 0
15
Weathering Temperature Surface Tension
(weight %) (mN/m)
0 0
15
23.0
21.9
(n=3)
(n=3)
6.9 0
15 23.1 (n=3)
13.0 0
15
19.8 0
15
NM
NM
NM
NM
8.12.2 Oil/Brine (33‰) Interfacial Tension
(°C)
NM
NM
NM
NM
NM
73
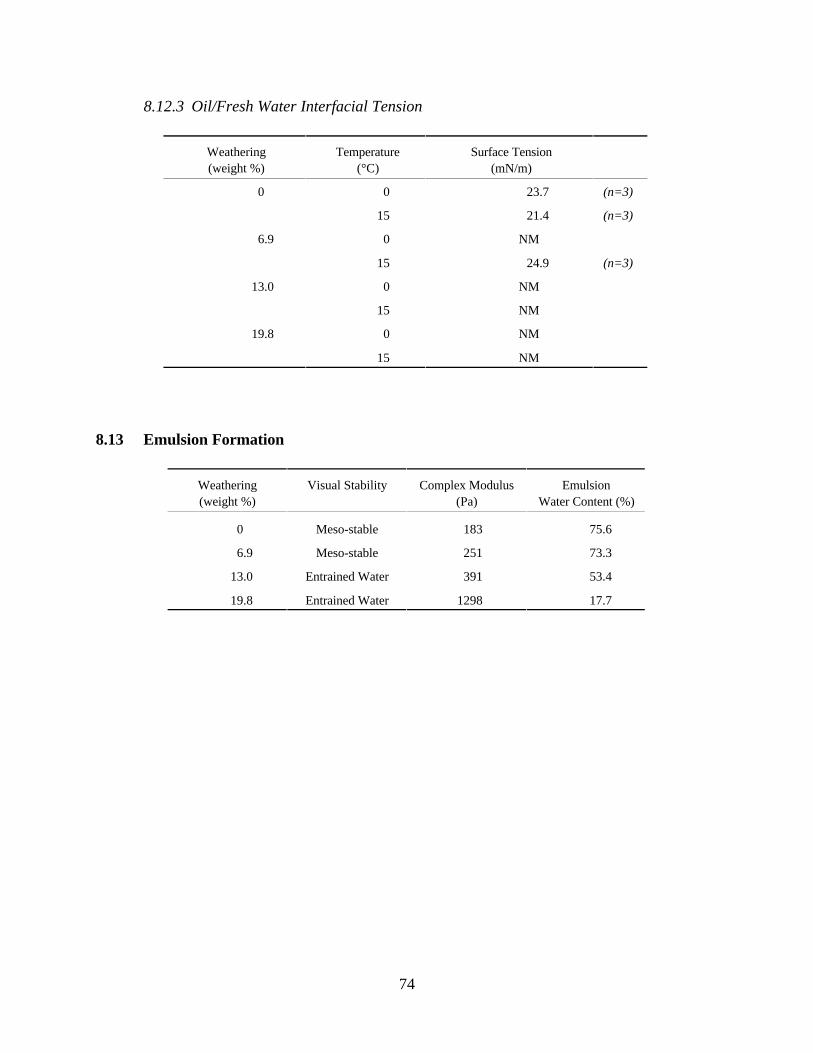
8.12.3 Oil/Fresh Water Interfacial Tension
Weathering
(weight %)
Temperature
(°C)
Surface Tension
(mN/m)
0 0 23.7 (n=3)
15 21.4 (n=3)
6.9 0
15 24.9 (n=3)
13.0 0
15
19.8 0
15
8.13
Weathering
(weight %)
Visual Stability Complex Modulus
(Pa)
Emulsion
Water Content (%)
0
6.9
13.0
19.8
Meso-stable
Meso-stable
Entrained Water
Entrained Water
183
251
391
1298
75.6
73.3
53.4
17.7
NM
NM
NM
NM
NM
Emulsion Formation
74

8.14 Boiling Point Distribution
Cumulative Weight Fraction (%)
Boiling Point
(°C)
0%
weathered w
6.9%
eathered w
13.0%
eathered w
19.8%
eathered
40 0.4
60 0.4
80 1.5 0.1
100 3.3 0.7
120 5.1 1.6
140 7.1 3.1 0.2
160 9.2 5.0 0.9
180 11.3 7.1 2.3
200 13.2 9.2 4.1 0.4
250 18.9 15.4 10.5 4.6
300 24.7 21.6 17.1 11.3
350 30.9 28.3 24.2 19.0
400 36.8 34.6 30.9 26.3
450 43.3 41.7 28.5 34.6
500 50.1 49.0 46.4 43.4
550 57.3 56.6 54.9 52.9
600 63.5 63.2 62.1 60.9
650 69.2 69.1 68.5 68.0
75
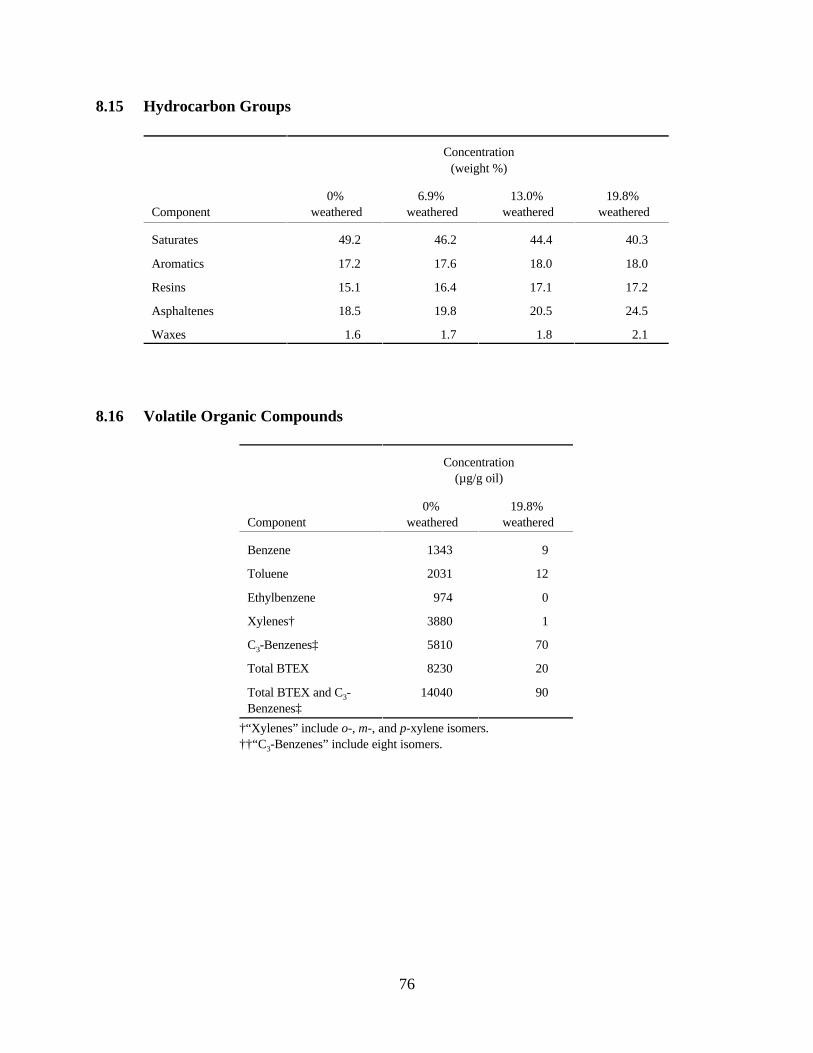
8.15 Hydrocarbon Groups
Concentration
(weight %)
0% 6.9% 13.0% 19.8%
Component weathered weathered weathered weathered
Saturates 49.2 46.2 44.4 40.3
Aromatics 17.2 17.6 18.0 18.0
Resins 15.1 16.4 17.1 17.2
Asphaltenes 18.5 19.8 20.5 24.5
Waxes
8.16 Volatile Organic Compounds
Concentration
(µg/g oil)
0% 19.8%
Component weathered weathered
Benzene 1343 9
Toluene 2031 12
Ethylbenzene 0
Xylenes† 3880 1
C3-Benzenes‡ 5810 70
Total BTEX 8230 20
Total BTEX and C3 - 14040 90
Benzenes‡
†“Xylenes” include o-, m-, and p-xylene isomers.
††“C3-Benzenes” include eight isomers.
1.6 1.7 1.8 2.1
974
76
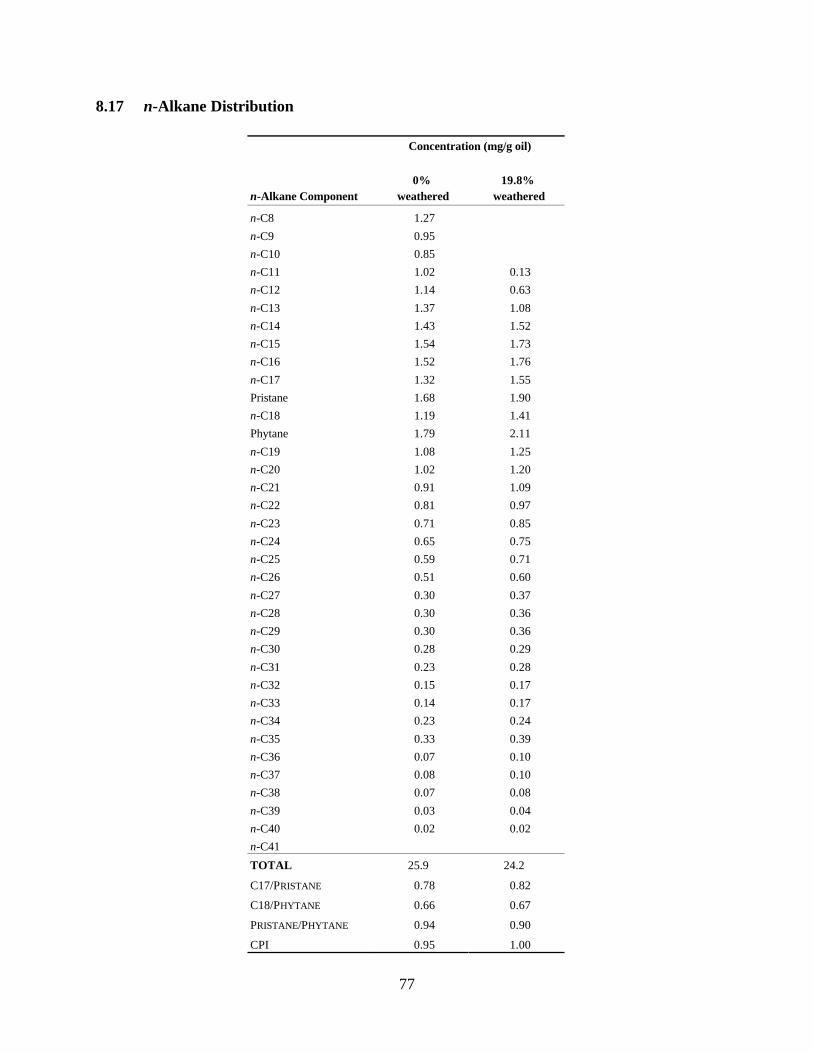
8.17 n-Alkane Distribution
Concentration (mg/g oil)
19.8%
n-Alkane Component weathered weathered
n 1.27
n 0.95
n-C10 0.85
n-C11 1.02 0.13
n-C12 1.14 0.63
n-C13 1.37 1.08
n-C14 1.43 1.52
n-C15 1.54 1.73
n-C16 1.52 1.76
n-C17 1.32 1.55
Pristane 1.68 1.90
n-C18 1.19 1.41
Phytane 1.79 2.11
n-C19 1.08 1.25
n-C20 1.02 1.20
n-C21 0.91 1.09
n-C22 0.81 0.97
n-C23 0.71 0.85
n-C24 0.65 0.75
n-C25 0.59 0.71
n-C26 0.51 0.60
n-C27 0.30 0.37
n-C28 0.30 0.36
n-C29 0.30 0.36
n-C30 0.28 0.29
n-C31 0.23 0.28
n-C32 0.15 0.17
n-C33 0.14 0.17
n-C34 0.23 0.24
n-C35 0.33 0.39
n-C36 0.07 0.10
n-C37 0.08 0.10
n-C38 0.07 0.08
n-C39 0.03 0.04
n-C40 0.02 0.02
n-C41
TOTAL 25.9 24.2
C17/PRISTANE 0.78 0.82
C18/PHYTANE 0.66 0.67
PRISTANE/PHYTANE 0.94 0.90
0%
-C8
-C9
0.95 1.00CPI
77
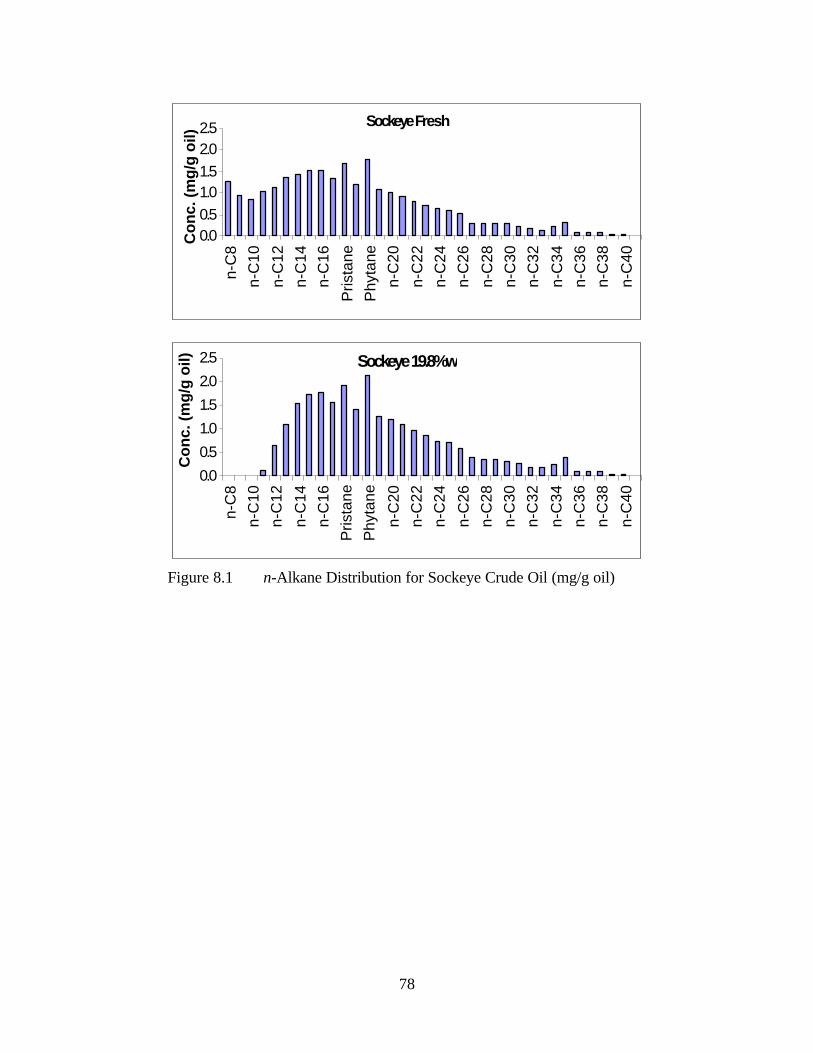
0.0
0.5
1.0
1.5
2.0
2.5
n-C
8
n-C
10
n-C
12
n-C
14
n-C
16
Pri
sta
ne
Ph
yta
ne
n-C
20
n-C
22
n-C
24
n-C
26
n-C
28
n-C
30
n-C
32
n-C
34
n-C
36
n-C
38
n-C
40
Co
nc. (m
g/g
oil)
0.0
0.5
1.0
1.5
2.0
2.5
n-C
8
n-C
10
n-C
12
n-C
14
n-C
16
Pri
sta
ne
Ph
yta
ne
n-C
20
n-C
22
n-C
24
n-C
26
n-C
28
n-C
30
n-C
32
n-C
34
n-C
36
n-C
38
n-C
40
Co
nc. (m
g/g
oil)
Sockeye 19.8%w
Sockeye Fresh
Figure 8.1 n-Alkane Distribution for Sockeye Crude Oil (mg/g oil)
78
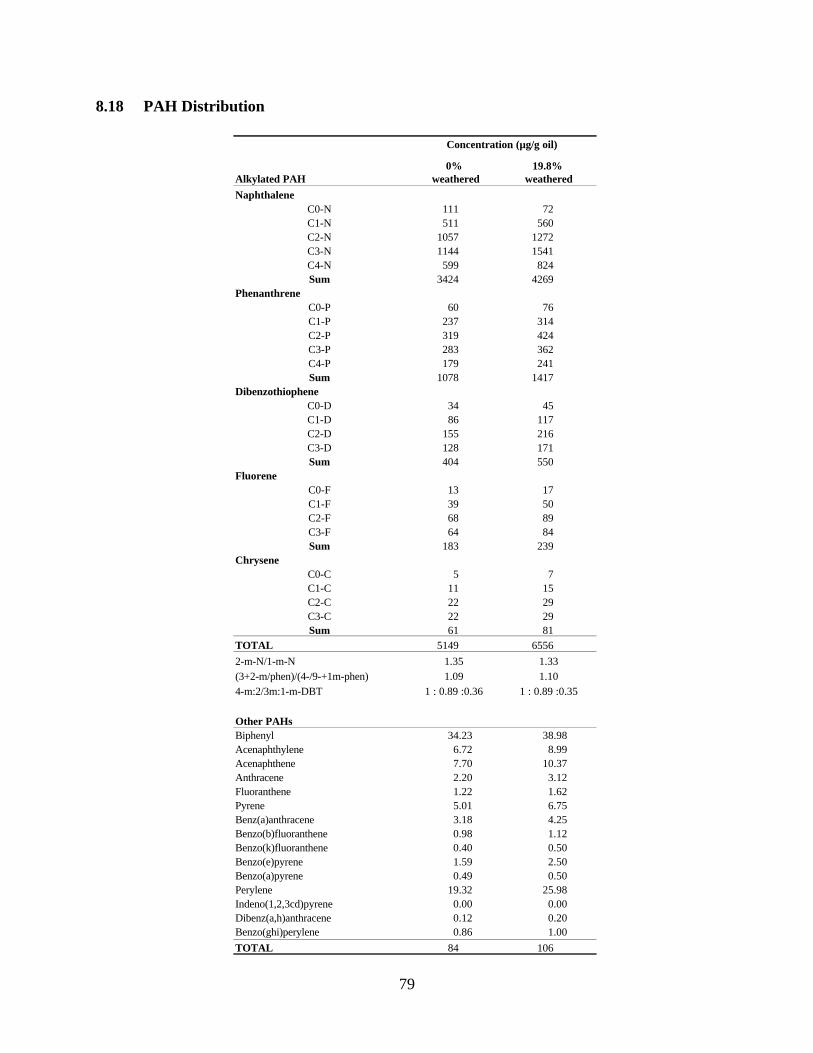
8.18 PAH Distribution
Concentration (µg/g oil)
0% 19.8%
Alkylated PAH weathered weathered
Naphthalene
C0-N 111 72
C1-N 511 560
C2-N 1057 1272
C3-N 1144 1541
C4-N 599 824
Sum 3424 4269
Phenanthrene
C0-P 60 76
C1-P 237 314
C2-P 319 424
C3-P 283 362
C4-P 179 241
Sum 1078 1417
Dibenzothiophene
C0-D 34 45
C1-D 86 117
C2-D 155 216
C3-D 128 171
Sum 404 550
Fluorene
C0-F 13 17
C1-F 39 50
C2-F 68 89
C3-F 64 84
Sum 183 239
Chrysene
C0-C 5 7
C1-C 11 15
C2-C 22 29
C3-C 22 29
Sum 61 81
TOTAL 5149 6556
2-m-N/1-m-N
(3+2-m/phen)/(4-/9-+1m-phen)
4-m:2/3m:1-m-DBT
1.35 1.33
1.09 1.10
1 : 0.89 :0.36 1 : 0.89 :0.35
Other PAHs
Biphenyl
Acenaphthylene
Acenaphthene
Anthracene
Fluoranthene
Pyrene
Benz(a)anthracene
Benzo(b)fluoranthene
Benzo(k)fluoranthene
Benzo(e)pyrene
Benzo(a)pyrene
Perylene
Indeno(1,2,3cd)pyrene
Dibenz(a,h)anthracene
Benzo(ghi)perylene
34.23
6.72
7.70
2.20
1.22
5.01
3.18
0.98
0.40
1.59
0.49
19.32
0.00
0.12
0.86
38.98
8.99
10.37
3.12
1.62
6.75
4.25
1.12
0.50
2.50
0.50
25.98
0.00
0.20
1.00
TOTAL 84 106
79
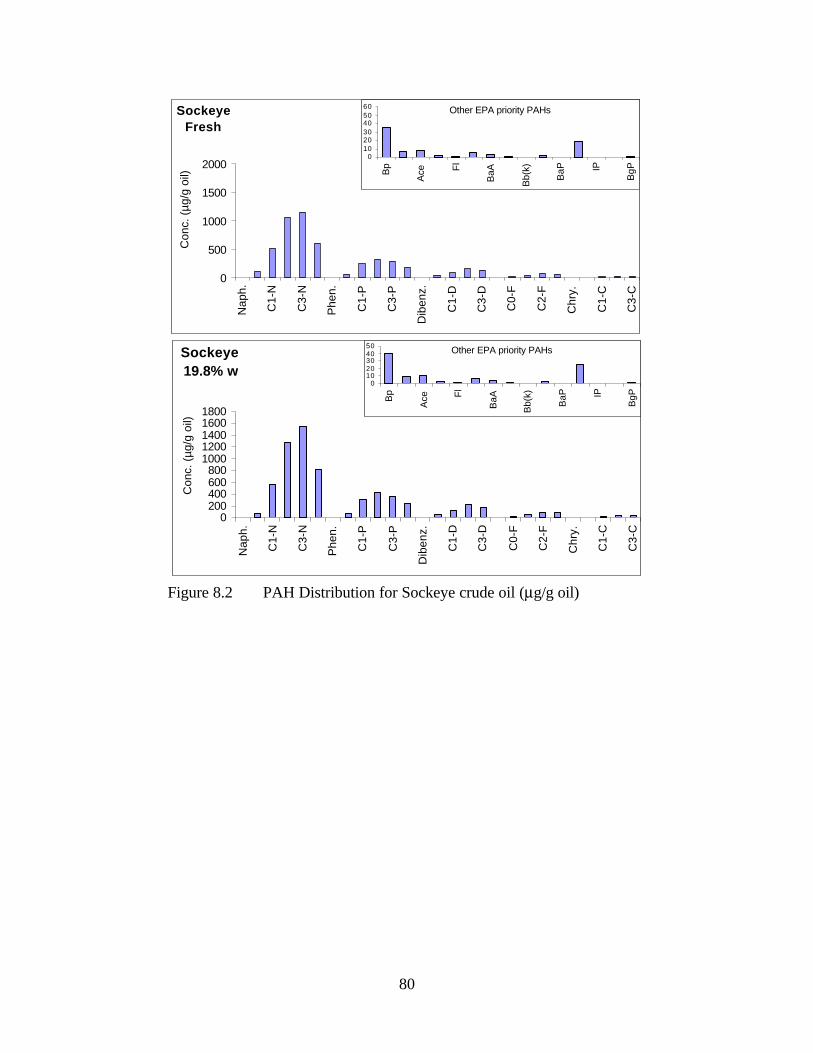
Sockeye
Fresh
0
500
1000
1500
2000
Na
ph
.
C1
-N
C3
-N
Ph
en
.
C1
-P
C3
-P
Dib
en
z.
C1
-D
C3
-D
C0
-F
C2
-F
Ch
ry.
C1
-C
C3
-C
Co
nc.
(µg
/g o
il)
Other EPA priority PAHs
0 10
20 30
40 50
60
Bp
Ace Fl
BaA
Bb(k
)
BaP IP
BgP
Sockeye
0 200 400 600 800
1000 1200 1400 1600 1800
Na
ph
.
C1
-N
C3
-N
Ph
en
.
C1
-P
C3
-P
Dib
en
z.
C1
-D
C3
-D
C0
-F
C2
-F
Ch
ry.
C1
-C
C3
-C
Co
nc.
(µg
/g o
il)
Other EPA priority PAHs
0 10 20 30 40 50
Bp
Ace Fl
Ba
A
Bb
(k)
Ba
P IP
Bg
P
19.8% w
Figure 8.2 PAH Distribution for Sockeye crude oil (µg/g oil)
80
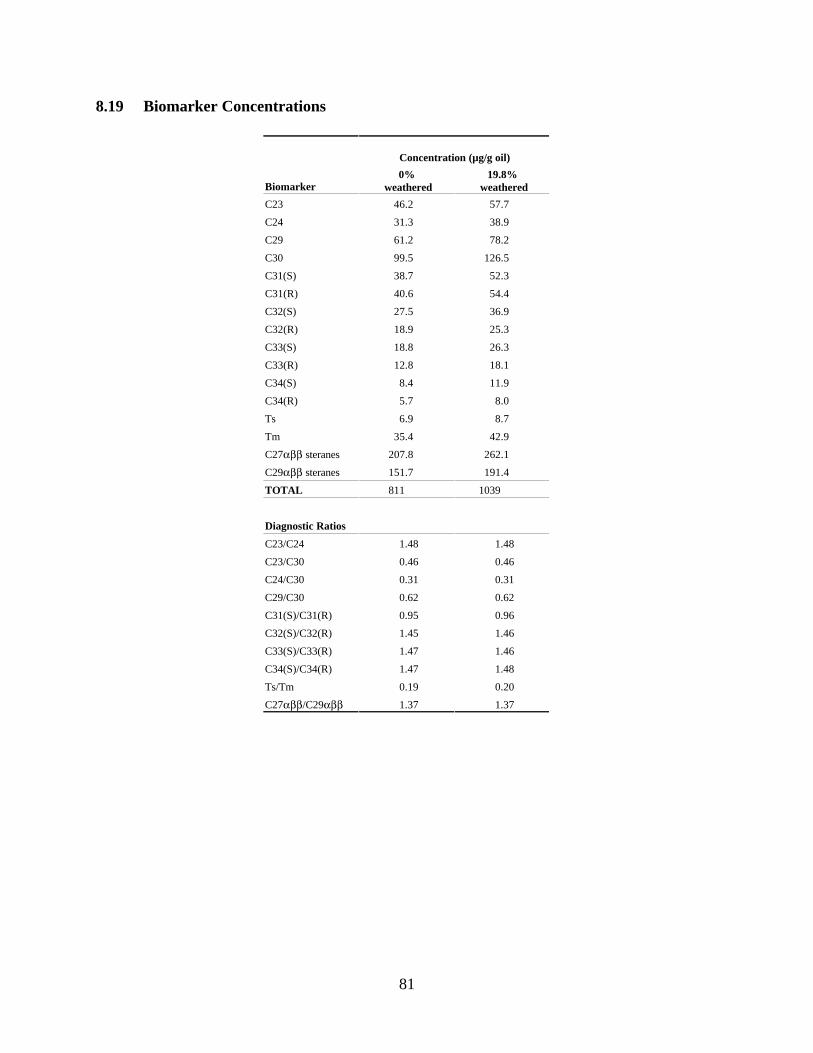
8.19 Biomarker Concentrations
Biomarker
Concentra
0%
weathered
tion (µg/g oil)
19.8%
weathered
46.2 57.7
31.3 38.9
61.2 78.2
99.5 126.5
C31(S) 38.7 52.3
C31(R) 40.6 54.4
C32(S) 27.5 36.9
C32(R) 18.9 25.3
C33(S) 18.8 26.3
C33(R) 12.8 18.1
C34(S) 11.9
C34(R)
6.9 8.7
Tm 35.4 42.9
C27αββ 207.8 262.1
C29αββ 151.7 191.4
TOTAL 811 1039
Diagnostic Ratios
C23/C24
C23/C30
C24/C30
C29/C30
C31(S)/C31(R)
C32(S)/C32(R)
C33(S)/C33(R)
C34(S)/C34(R)
Ts/Tm
C27αββ/C29αββ
1.48
0.46
0.31
0.62
0.95
1.45
1.47
1.47
0.19
1.37
1.48
0.46
0.31
0.62
0.96
1.46
1.46
1.48
0.20
1.37
C23
C24
C29
C30
8.4
5.7 8.0
Ts
steranes
steranes
81
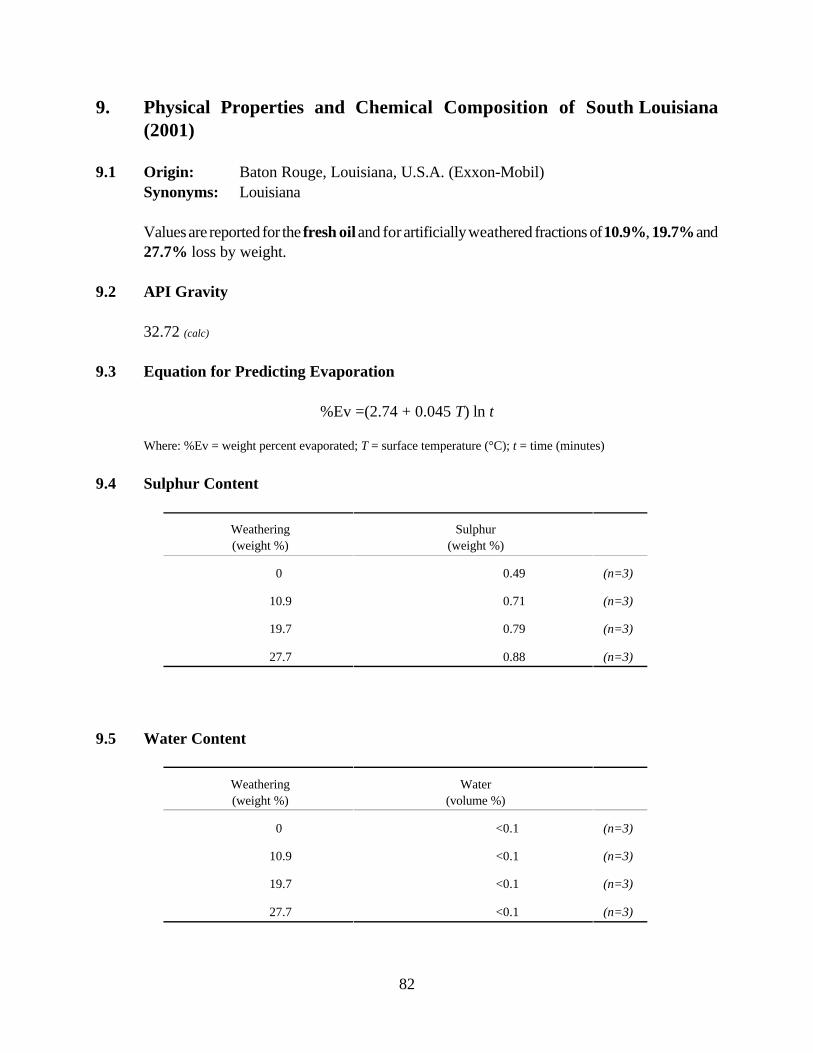
9.5
9. Physical Properties and Chemical Composition of South Louisiana
(2001)
9.1 Origin: Baton Rouge, Louisiana, U.S.A. (Exxon-Mobil)
Synonyms: Louisiana
Values are reported for the fresh oil and for artificially weathered fractions of 10.9%, 19.7% and
27.7% loss by weight.
9.2 API Gravity
32.72 (calc)
9.3 Equation for Predicting Evaporation
%Ev =(2.74 + 0.045 T) ln t
Where: %Ev = weight percent evaporated; T = surface temperature (°C); t = time (minutes)
9.4 Sulphur Content
Weathering Sulphur
(weight %) (weight %)
0 0.49 (n=3)
10.9 0.71 (n=3)
19.7 0.79 (n=3)
27.7 0.88 (n=3)
Water Content
Weathering
(weight %)
Water
(volume %)
0 <0.1 (n=3)
10.9 <0.1 (n=3)
19.7 <0.1 (n=3)
27.7 <0.1 (n=3)
82
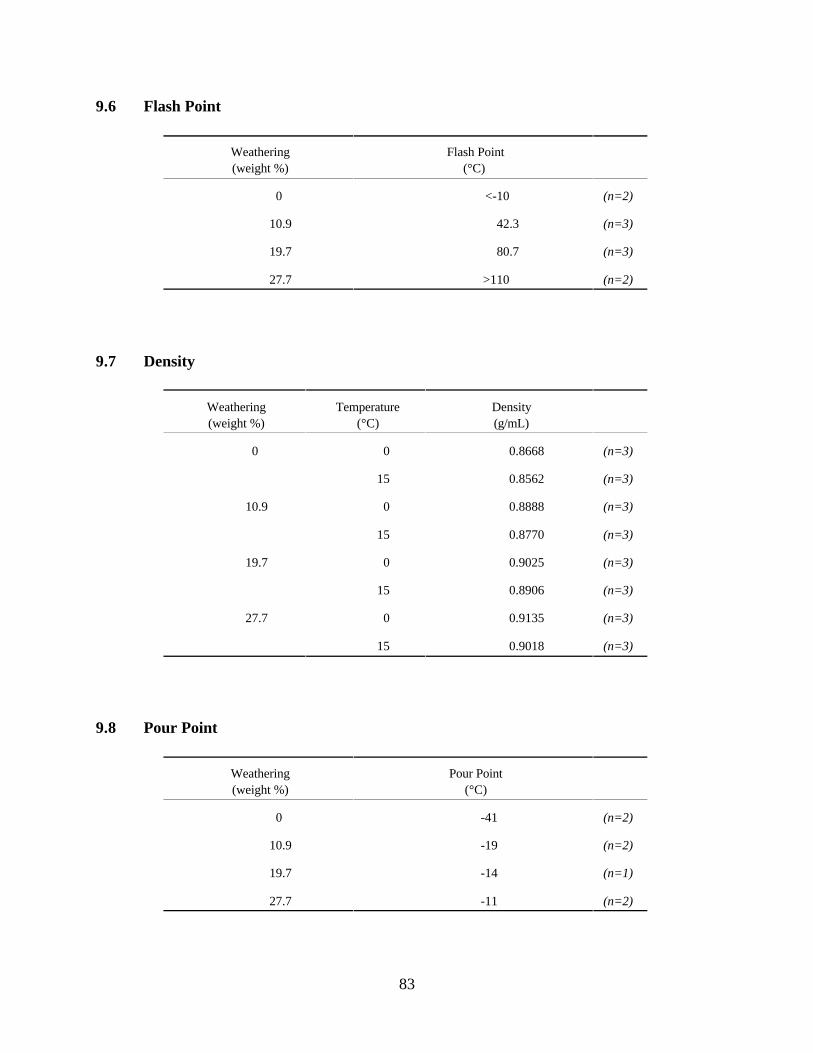
9.6 Flash Point
Density
Weathering
(weight %)
Flash Point
(°C)
0 <-10 (n=2)
10.9 42.3 (n=3)
19.7 80.7 (n=3)
27.7 >110 (n=2)
Weathering
(weight %)
Temperature
(°C)
Density
(g/mL)
0 0 0.8668 (n=3)
15 0.8562 (n=3)
10.9 0 0.8888 (n=3)
15 0.8770 (n=3)
19.7 0 0.9025 (n=3)
15 0.8906 (n=3)
27.7 0 0.9135 (n=3)
15 0.9018 (n=3)
Pour Point
Weathering
(weight %)
Pour Point
(°C)
0 -41 (n=2)
10.9 -19 (n=2)
19.7 -14 (n=1)
27.7 -11 (n=2)
83
9.7
9.8
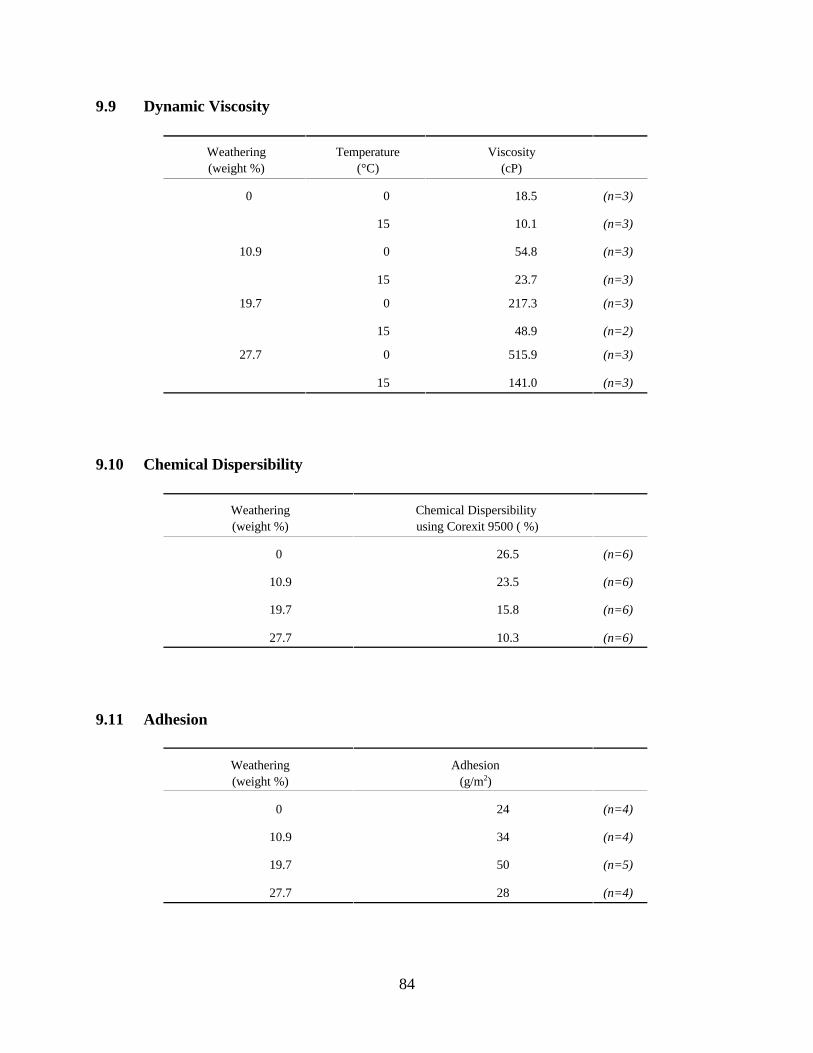
9.9 Dynamic Viscosity
Weathering
(weight %)
Temperature
(°C)
Viscosity
(cP)
0 0 18.5 (n=3)
15 10.1 (n=3)
10.9 0 54.8 (n=3)
15 23.7 (n=3)
19.7 0 217.3 (n=3)
15 48.9 (n=2)
27.7 0 515.9 (n=3)
15 141.0 (n=3)
9.10
Weathering Chemical Dispersibility
(weight %) using Corexit 9500 ( %)
0 26.5 (n=6)
10.9 23.5 (n=6)
19.7 15.8 (n=6)
27.7 10.3 (n=6)
Weathering Adhesion
(weight %) (g/m2)
0 (n=4)
10.9 34 (n=4)
19.7 50 (n=5)
27.7 28 (n=4)
9.11 Adhesion
Chemical Dispersibility
24
84
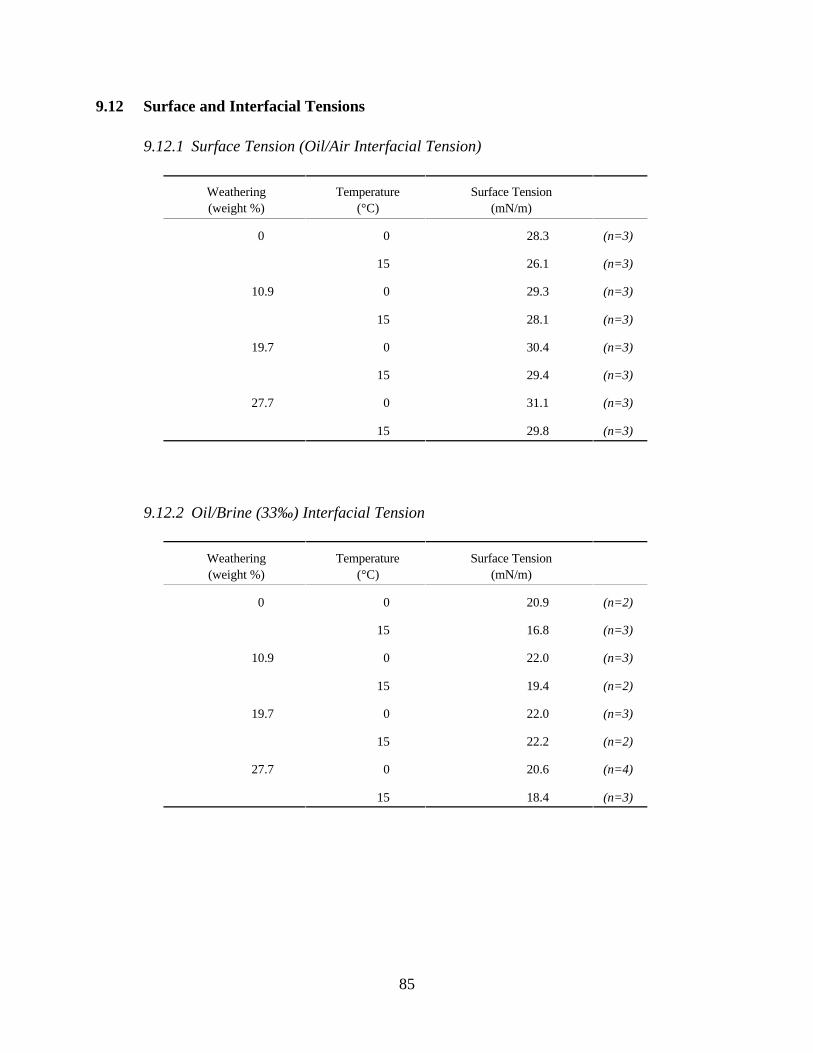
9.12 Surface and Interfacial Tensions
9.12.1 Surface Tension (Oil/Air Interfacial Tension)
Weathering
(weight %)
Temperature
(°C)
Surface Tension
(mN/m)
0 0 28.3 (n=3)
15 26.1 (n=3)
10.9 0 29.3 (n=3)
15 28.1 (n=3)
19.7 0 30.4 (n=3)
15 29.4 (n=3)
27.7 0 31.1 (n=3)
15 29.8 (n=3)
Weathering Temperature Surface Tension
(weight %) (mN/m)
0
10.9
0
15
0
20.9
16.8
22.0
(n=2)
(n=3)
(n=3)
19.7
27.7
15
0
15
0
19.4
22.0
22.2
20.6
(n=2)
(n=3)
(n=2)
(n=4)
15 18.4 (n=3)
9.12.2 Oil/Brine (33‰) Interfacial Tension
(°C)
85
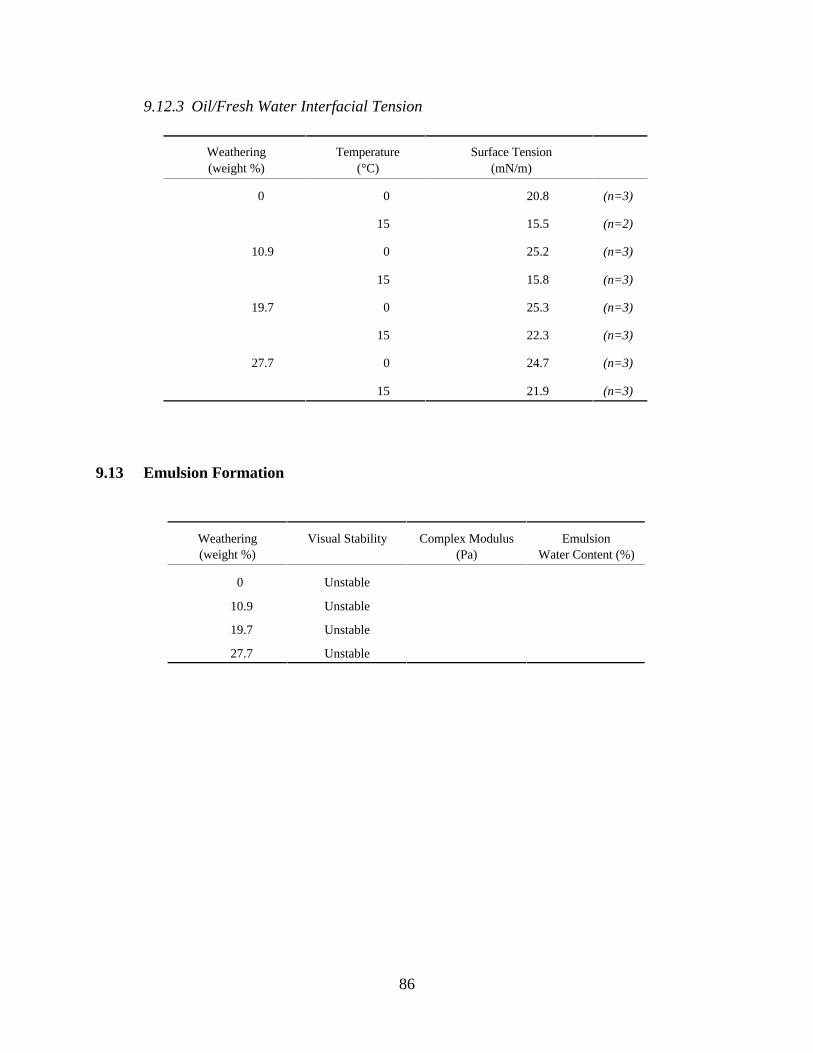
9.12.3 Oil/Fresh Water Interfacial Tension
Weathering
(weight %)
Temperature
(°C)
Surface Tension
(mN/m)
0 0 20.8 (n=3)
15 15.5 (n=2)
10.9 0 25.2 (n=3)
15 15.8 (n=3)
19.7 0 25.3 (n=3)
15 22.3 (n=3)
27.7 0 24.7 (n=3)
15 21.9 (n=3)
9.13
Weathering Complex Modulus Emulsion
(weight %) (Pa)
0 Unstable
10.9 Unstable
19.7 Unstable
27.7 Unstable
Emulsion Formation
Visual Stability
Water Content (%)
86
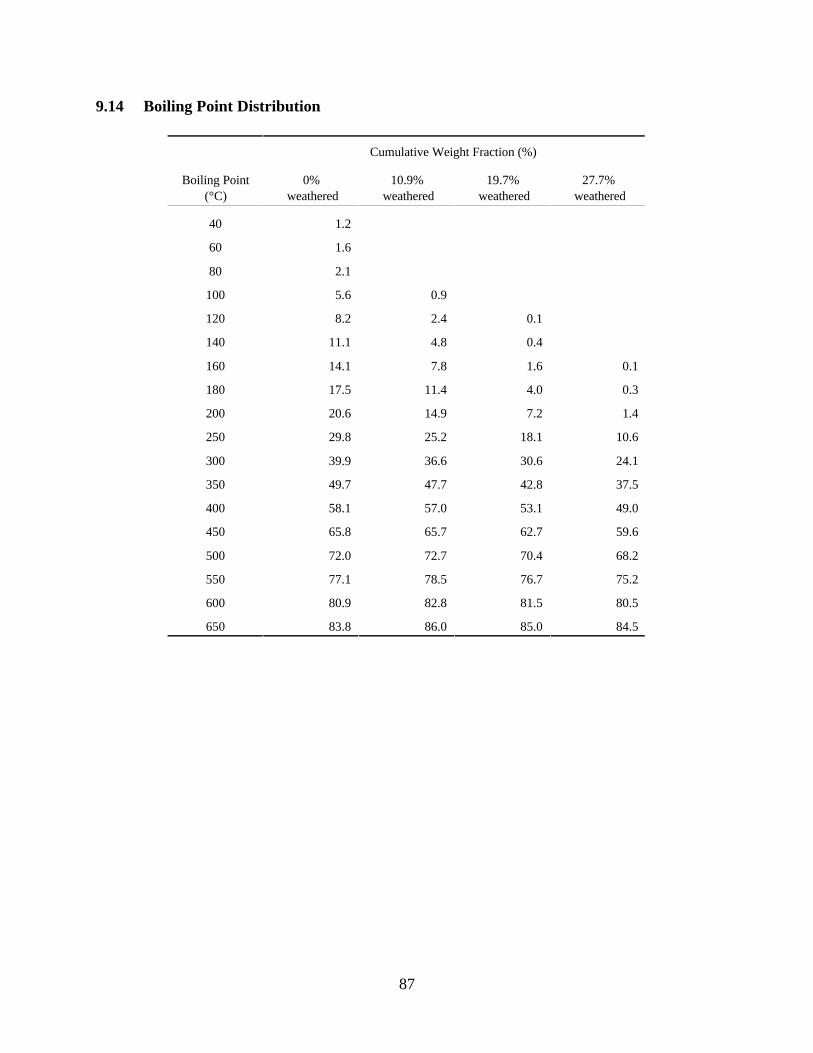
9.14 Boiling Point Distribution
Cumulative Weight Fraction (%)
Boiling Point
(°C)
0%
weathered w
10.9%
eathered w
19.7%
eathered w
27.7%
eathered
40 1.2
60 1.6
80 2.1
100 5.6 0.9
120 8.2 2.4 0.1
140 11.1 4.8 0.4
160 14.1 7.8 1.6 0.1
180 17.5 11.4 4.0 0.3
200 20.6 14.9 7.2 1.4
250 29.8 25.2 18.1 10.6
300 39.9 36.6 30.6 24.1
350 49.7 47.7 42.8 37.5
400 58.1 57.0 53.1 49.0
450 65.8 65.7 62.7 59.6
500 72.0 72.7 70.4 68.2
550 77.1 78.5 76.7 75.2
600 80.9 82.8 81.5 80.5
650 83.8 86.0 85.0 84.5
87

9.15 Hydrocarbon Groups
Concentration
(%)
Component
0%
weathered
10.9%
weathered
19.7%
weathered
27.7%
weathered
Saturates
Aromatics
Resins
Asphaltenes
Waxes
80.8
12.6
5.9
0.8
1.7
80.4
12.3
6.4
0.9
1.8
78.4
12.5
8.0
1.1
2.0
77.3
13.3
8.0
1.5
2.2
9.16 Volatile Organic Compounds
Concentration
(µg/g oil)
0% 27.7%
Component weathered weathered
Benzene 1598 0
Toluene 3552 10
Ethylbenzene 0
Xylenes† 6164 2
C3-Benzenes‡ 6680 190
Total BTEX 12210 12
Total BTEX and C3 - 18890 202
Benzenes‡
†“Xylenes” include o-, m-, and p-xylene isomers.
‡“C3-Benzenes” include eight isomers.
891
88
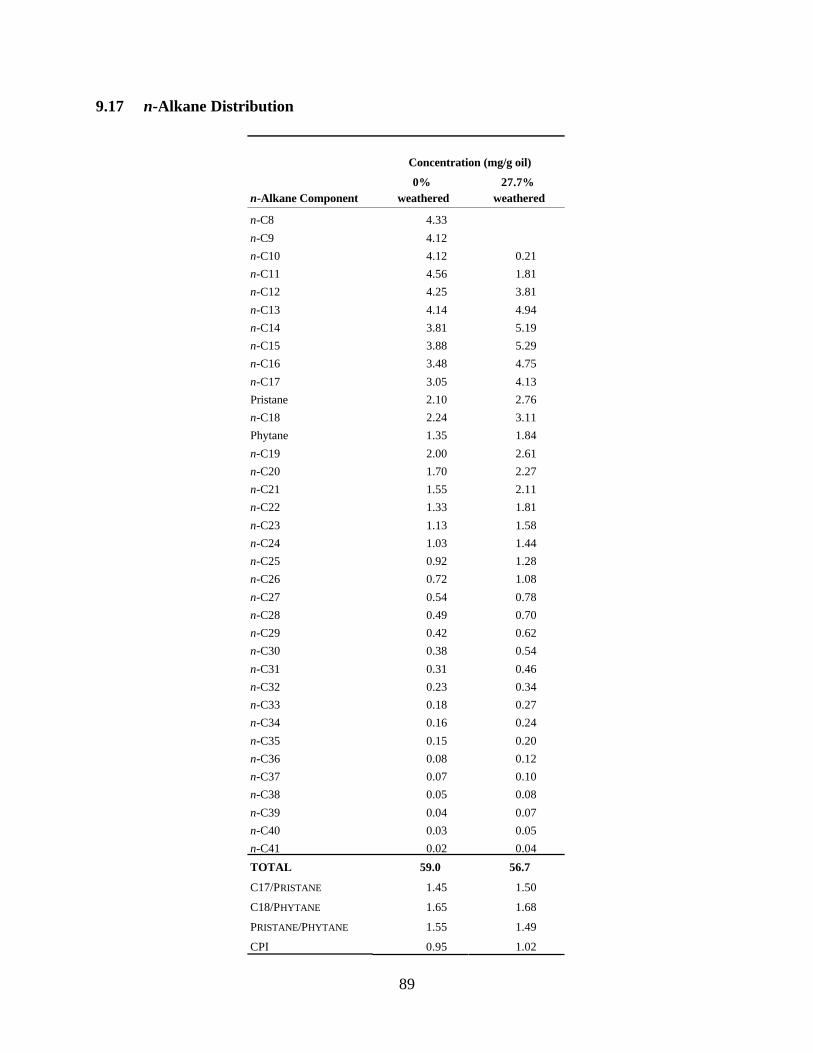
9.17 n-Alkane Distribution
Concentration (mg/g oil)
0% 27.7%
n-Alkane Component weathered weathered
n-C8 4.33
n-C9 4.12
n-C10 4.12 0.21
n-C11 4.56 1.81
n-C12 4.25 3.81
n-C13 4.14 4.94
n-C14 3.81 5.19
n-C15 3.88 5.29
n-C16 3.48 4.75
n-C17 3.05 4.13
Pristane 2.10 2.76
n-C18 2.24 3.11
Phytane 1.35 1.84
n-C19 2.00 2.61
n-C20 1.70 2.27
n-C21 1.55 2.11
n-C22 1.33 1.81
n-C23 1.13 1.58
n-C24 1.03 1.44
n-C25 0.92 1.28
n-C26 0.72 1.08
n-C27 0.54 0.78
n-C28 0.49 0.70
n-C29 0.42 0.62
n-C30 0.38 0.54
n-C31 0.31 0.46
n-C32 0.23 0.34
n-C33 0.18 0.27
n-C34 0.16 0.24
n-C35 0.15 0.20
n-C36 0.08 0.12
n-C37 0.07 0.10
n-C38 0.05 0.08
n-C39 0.04 0.07
n-C40 0.03 0.05
n-C41 0.02 0.04
TOTAL 59.0 56.7
C17/PRISTANE 1.45 1.50
C18/PHYTANE 1.65 1.68
PRISTANE/PHYTANE 1.55 1.49
CPI 0.95 1.02
89
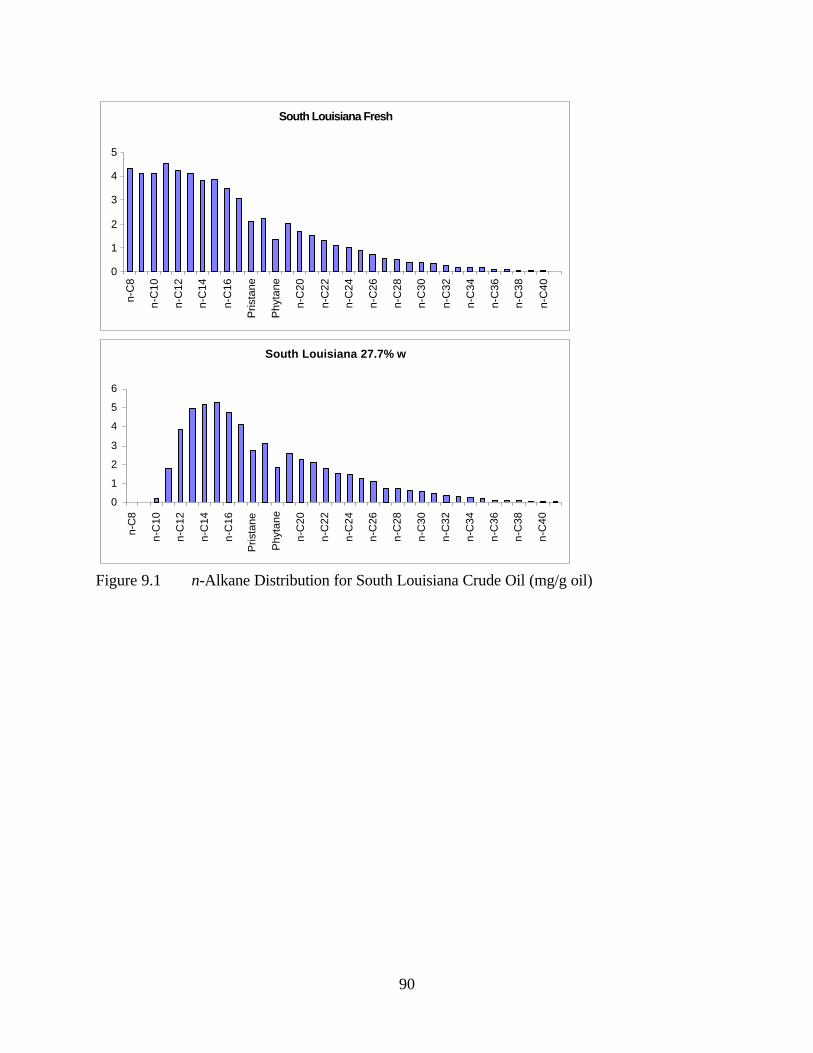
South Louisiana Fresh
5
4
3
2
1
0
n-C
8
n-C
10
n-C
12
n-C
14
n-C
16
Pri
sta
ne
Ph
yta
ne
n-C
20
n-C
22
n-C
24
n-C
26
n-C
28
n-C
30
n-C
32
n-C
34
n-C
36
n-C
38
n-C
40
South Louisiana 27.7% w
6
5
4
3
2
1
n-C
8
n-C
10
n-C
12
n-C
14
n-C
16
Prista
ne
Ph
yta
ne
n-C
20
n-C
22
n-C
24
n-C
26
n-C
28
n-C
30
n-C
32
n-C
34
n-C
36
0
n-C
38
n-C
40
Figure 9.1 n-Alkane Distribution for South Louisiana Crude Oil (mg/g oil)
90
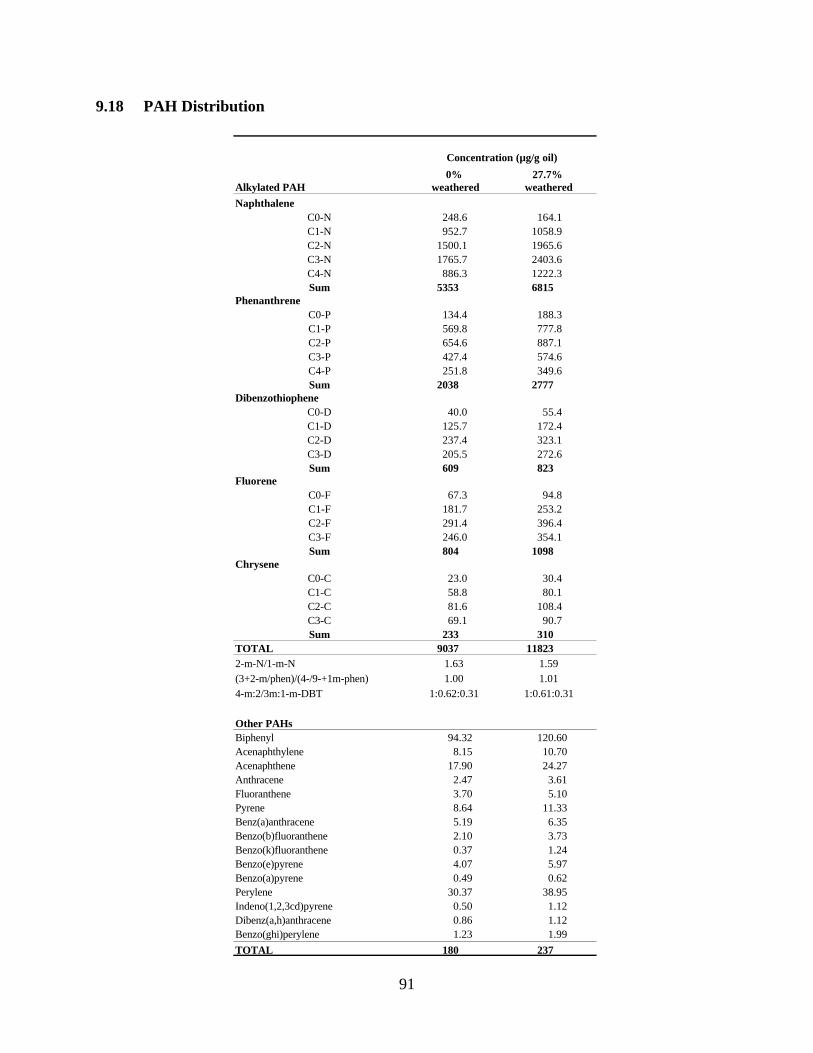
9.18 PAH Distribution
Alkylated PAH
Concentrati
0%
weathered
on (µg/g oil)
27.7%
weathered
Naphthalene
C0-N 248.6 164.1
C1-N 952.7 1058.9
C2-N 1500.1 1965.6
C3-N 1765.7 2403.6
C4-N 886.3 1222.3
Sum 5353 6815
Phenanthrene
C0-P 134.4 188.3
C1-P 569.8 777.8
C2-P 654.6 887.1
C3-P 427.4 574.6
C4-P 251.8 349.6
Sum 2038 2777
Dibenzothiophene
C0-D 40.0 55.4
C1-D 125.7 172.4
C2-D 237.4 323.1
C3-D 205.5 272.6
Sum 609 823
Fluorene
C0-F 67.3 94.8
C1-F 181.7 253.2
C2-F 291.4 396.4
C3-F 246.0 354.1
Sum 804 1098
Chrysene
C0-C 23.0 30.4
C1-C 58.8 80.1
C2-C 81.6 108.4
C3-C 69.1 90.7
Sum 233 310
TOTAL 9037 11823
2-m-N/1-m-N 1.63 1.59
(3+2-m/phen)/(4-/9-+1m-phen) 1.00 1.01
4-m:2/3m:1-m-DBT 1:0.62:0.31 1:0.61:0.31
Other PAHs
Biphenyl 94.32 120.60
Acenaphthylene 8.15 10.70
Acenaphthene 17.90 24.27
Anthracene 2.47 3.61
Fluoranthene 3.70 5.10
Pyrene 8.64 11.33
Benz(a)anthracene 5.19 6.35
Benzo(b)fluoranthene 2.10 3.73
Benzo(k)fluoranthene 0.37 1.24
Benzo(e)pyrene 4.07 5.97
Benzo(a)pyrene 0.49 0.62
Perylene 30.37 38.95
Indeno(1,2,3cd)pyrene 0.50 1.12
Dibenz(a,h)anthracene 0.86 1.12
Benzo(ghi)perylene 1.23 1.99
TOTAL 180
91
237
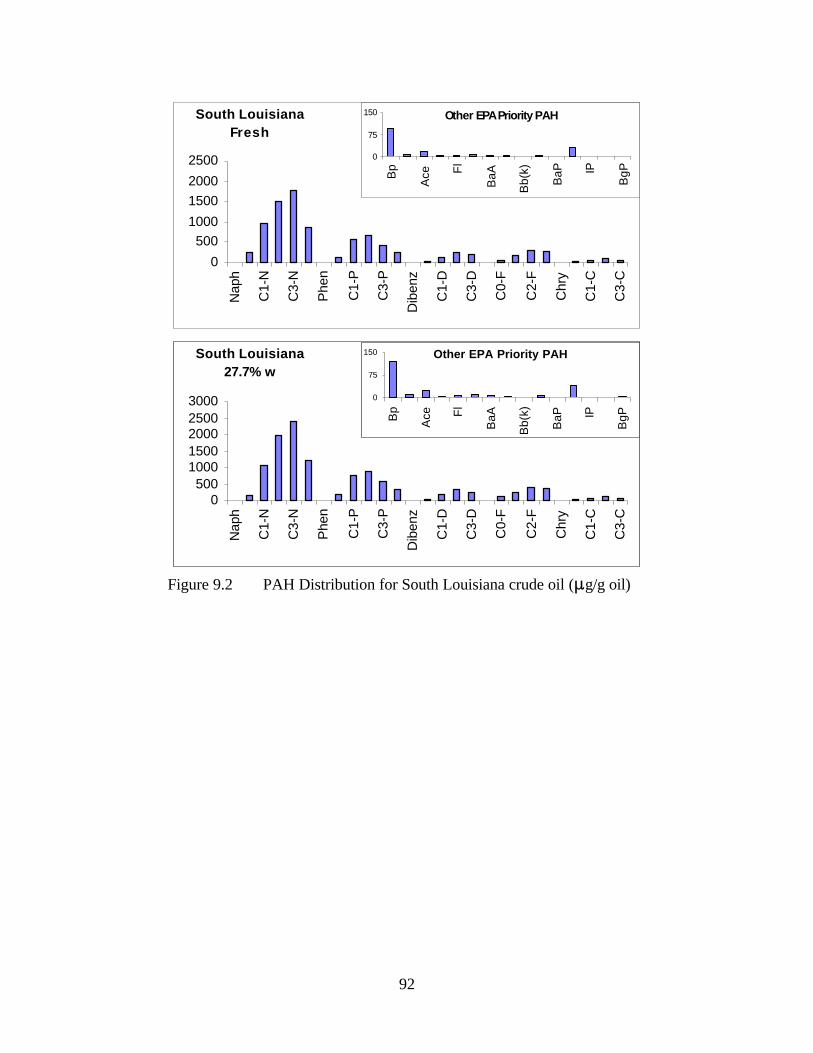
South Louisiana
0
500
1000
1500
2000
2500
Naph
C1-N
C3-N
Phen
C1-P
C3-P
Dib
enz
C1-D
C3-D
C0-F
C2-F
Chry
C1-C
C3-C
0
75
150
Bp
Ace Fl
Ba
A
Bb
(k)
Ba
P IP
Bg
P
South Louisiana
27.7% w
0
500
1000
1500
2000 2500
3000
Naph
C1-N
C3-N
Phen
C1-P
C3-P
Dib
enz
C1-D
C3-D
C0-F
C2-F
Chry
C1-C
C3-C
Other EPA Priority PAH
0
75
150
Bp
Ace Fl
Ba
A
Bb
(k)
Ba
P IP
Bg
P
Fresh
Other EPA Priority PAH
Figure 9.2 PAH Distribution for South Louisiana crude oil (:g/g oil)
92

9.19 Biomarker Concentrations
Biomarker
Concentrati
0%
weathered
on (µg/g oil)
27.7%
weathered
16.9 22.7
11.2 14.7
59.9 75.9
81.5 105.6
C31(S) 31.0 40.2
C31(R) 27.5 35.7
C32(S) 20.1 25.1
C32(R) 13.6 17.4
C33(S) 12.2 15.4
C33(R) 10.5
C34(S)
C34(R)
19.0 24.3
Tm 23.1 30.3
C27αββ 65.0 85.8
C29αββ 72.8 94.3
TOTAL
Diagnostic Ratios
C23/C24
C23/C30
C24/C30
C29/C30
C31(S)/C31(R)
C32(S)/C32(R)
C33(S)/C33(R)
C34(S)/C34(R)
Ts/Tm
C27αββ/C29αββ
1.50
0.21
0.14
0.73
1.13
1.48
1.39
1.37
0.82
0.89
1.54
0.21
0.14
0.72
1.13
1.44
1.46
1.41
0.80
0.91
C23
C24
C29
C30
8.8
6.1 7.3
4.4 5.2
Ts
steranes
steranes
473 610
93
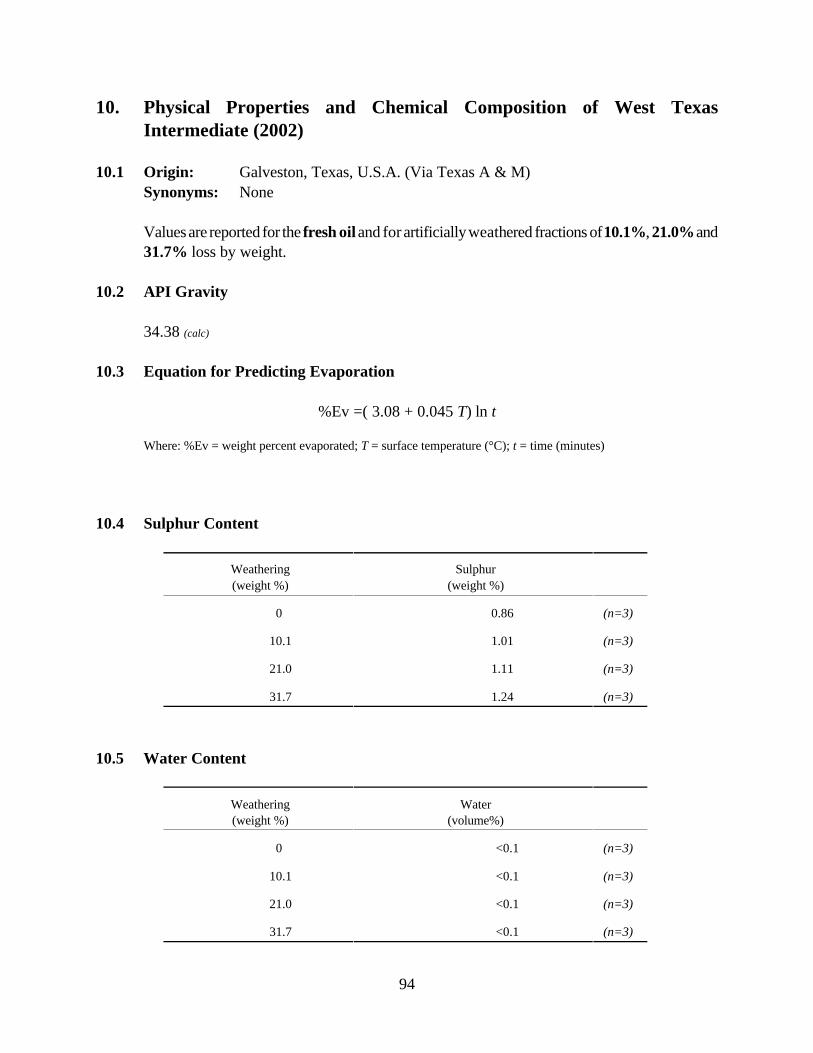
10.5
10. Physical Properties and Chemical Composition of West Texas
Intermediate (2002)
10.1 Origin: Galveston, Texas, U.S.A. (Via Texas A & M)
Synonyms: None
Values are reported for the fresh oil and for artificially weathered fractions of 10.1%, 21.0% and
31.7% loss by weight.
10.2 API Gravity
34.38 (calc)
10.3 Equation for Predicting Evaporation
%Ev =( 3.08 + 0.045 T) ln t
Where: %Ev = weight percent evaporated; T = surface temperature (°C); t = time (minutes)
10.4 Sulphur Content
Weathering Sulphur
(weight %) (weight %)
0 0.86 (n=3)
10.1 1.01 (n=3)
21.0 1.11 (n=3)
31.7 1.24 (n=3)
Weathering Water
(weight %) (volume%)
0 (n=3)
10.1 <0.1 (n=3)
21.0 <0.1 (n=3)
31.7 <0.1 (n=3)
94
Water Content
<0.1
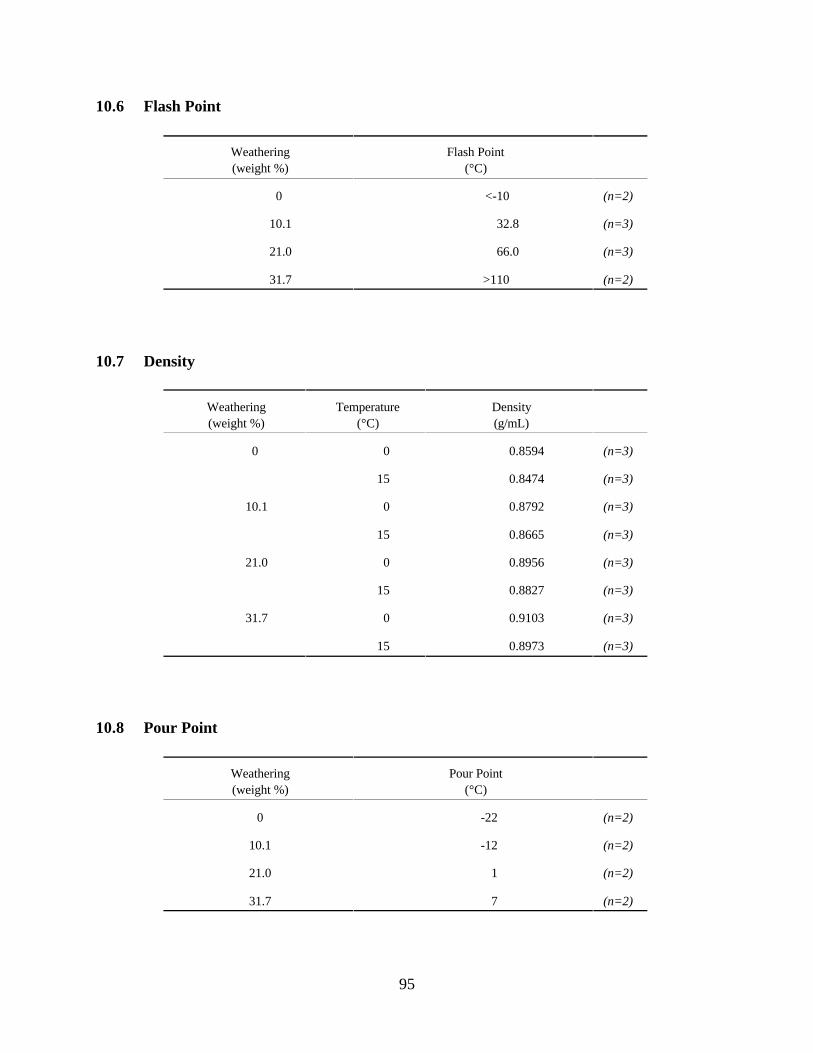
10.6 Flash Point
10.7
Weathering
(weight %)
Flash Point
(°C)
0 <-10 (n=2)
10.1 32.8 (n=3)
21.0 66.0 (n=3)
31.7 >110 (n=2)
Weathering
(weight %)
Temperature
(°C)
Density
(g/mL)
0 0 0.8594 (n=3)
15 0.8474 (n=3)
10.1 0 0.8792 (n=3)
15 0.8665 (n=3)
21.0 0 0.8956 (n=3)
15 0.8827 (n=3)
31.7 0 0.9103 (n=3)
15 0.8973 (n=3)
10.8 Pour Point
Weathering
(weight %)
Pour Point
(°C)
0 -22 (n=2)
10.1 -12 (n=2)
21.0 1 (n=2)
31.7 7 (n=2)
95
Density
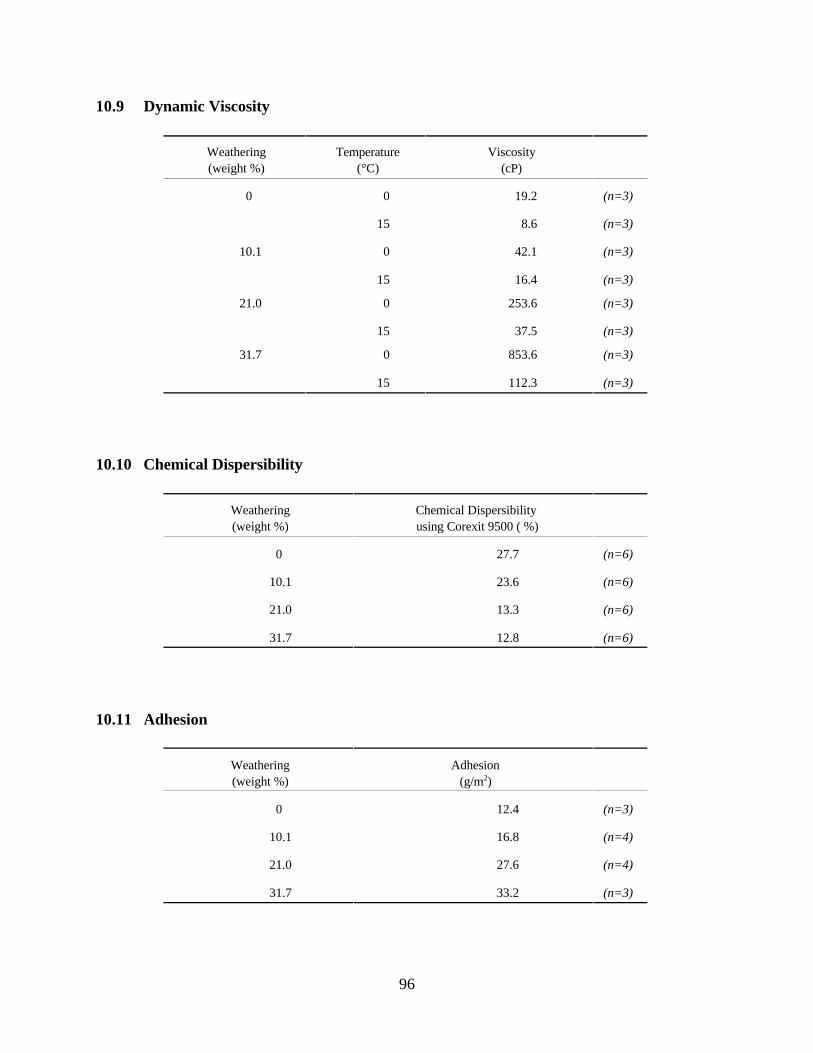
10.9 Dynamic Viscosity
Weathering
(weight %)
Temperature
(°C)
Viscosity
(cP)
0 0 19.2 (n=3)
15 8.6 (n=3)
10.1 0 42.1 (n=3)
15 16.4 (n=3)
21.0 0 253.6 (n=3)
15 37.5 (n=3)
31.7 0 853.6 (n=3)
15 112.3 (n=3)
10.10
Weathering Chemical Dispersibility
(weight %) using Corexit 9500 ( %)
0 27.7 (n=6)
10.1 23.6 (n=6)
21.0 13.3 (n=6)
31.7 12.8 (n=6)
Weathering Adhesion
(weight %) (g/m2)
0 12.4 (n=3)
10.1 16.8 (n=4)
21.0 27.6 (n=4)
31.7 33.2 (n=3)
10.11 Adhesion
Chemical Dispersibility
96
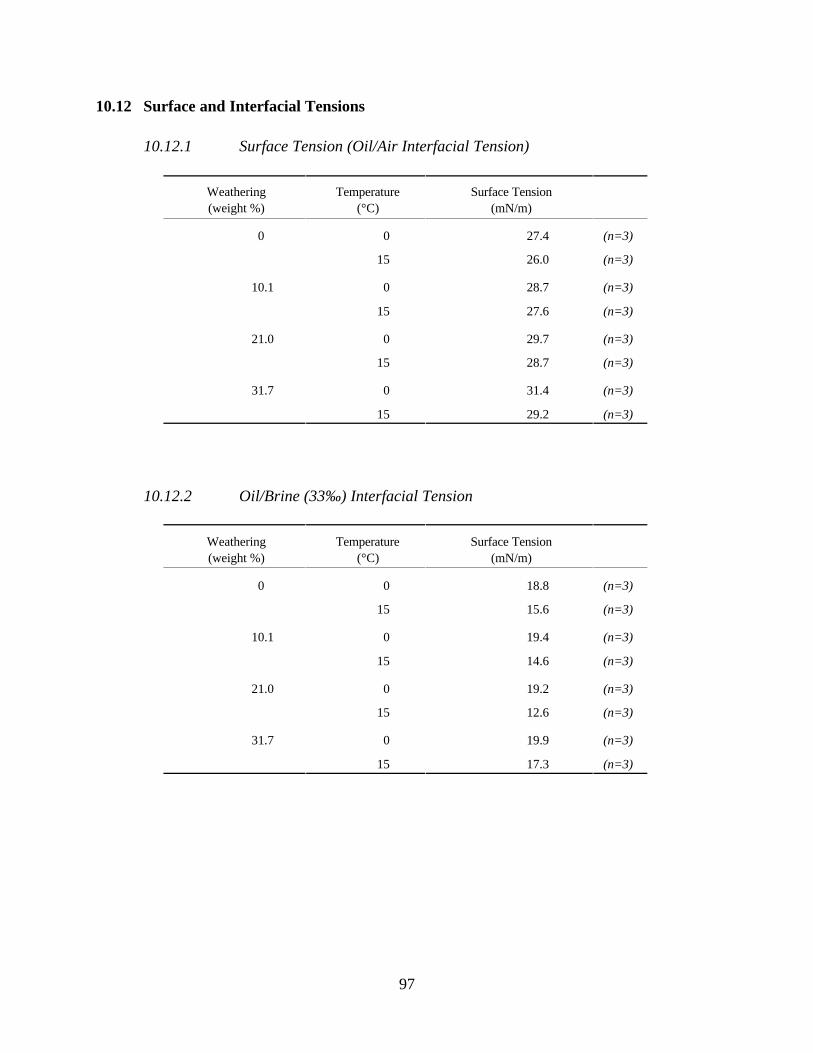
10.12 Surface and Interfacial Tensions
10.12.1 Surface Tension (Oil/Air Interfacial Tension)
Weathering
(weight %)
Temperature
(°C)
Surface Tension
(mN/m)
0 0 27.4 (n=3)
15 26.0 (n=3)
10.1 0 28.7 (n=3)
15 27.6 (n=3)
21.0 0 29.7 (n=3)
15 28.7 (n=3)
31.7 0 31.4 (n=3)
15 29.2 (n=3)
10.12.2
Weathering Temperature Surface Tension
(weight %) (mN/m)
0 0
15
18.8
15.6
(n=3)
(n=3)
10.1 0
15
19.4
14.6
(n=3)
(n=3)
21.0 0
15
19.2
12.6
(n=3)
(n=3)
31.7 0
15
19.9
17.3
(n=3)
(n=3)
Oil/Brine (33‰) Interfacial Tension
(°C)
97
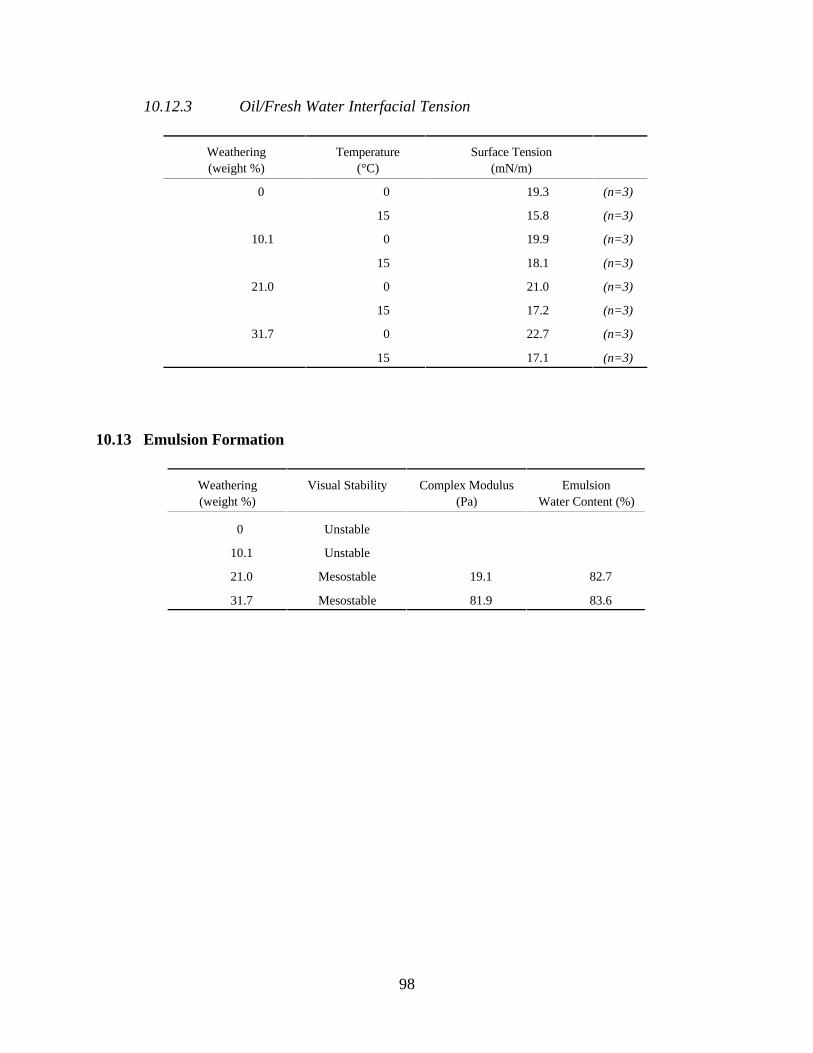
10.12.3 Oil/Fresh Water Interfacial Tension
Weathering
(weight %)
Temperature
(°C)
Surface Tension
(mN/m)
0 0 19.3 (n=3)
15 15.8 (n=3)
10.1 0 19.9 (n=3)
15 18.1 (n=3)
21.0 0 21.0 (n=3)
15 17.2 (n=3)
31.7 0 22.7 (n=3)
15 17.1 (n=3)
10.13
Weathering Complex Modulus Emulsion
(weight %) (Pa)
0 Unstable
10.1 Unstable
21.0 Mesostable 19.1 82.7
31.7 Mesostable 81.9 83.6
Emulsion Formation
Visual Stability
Water Content (%)
98
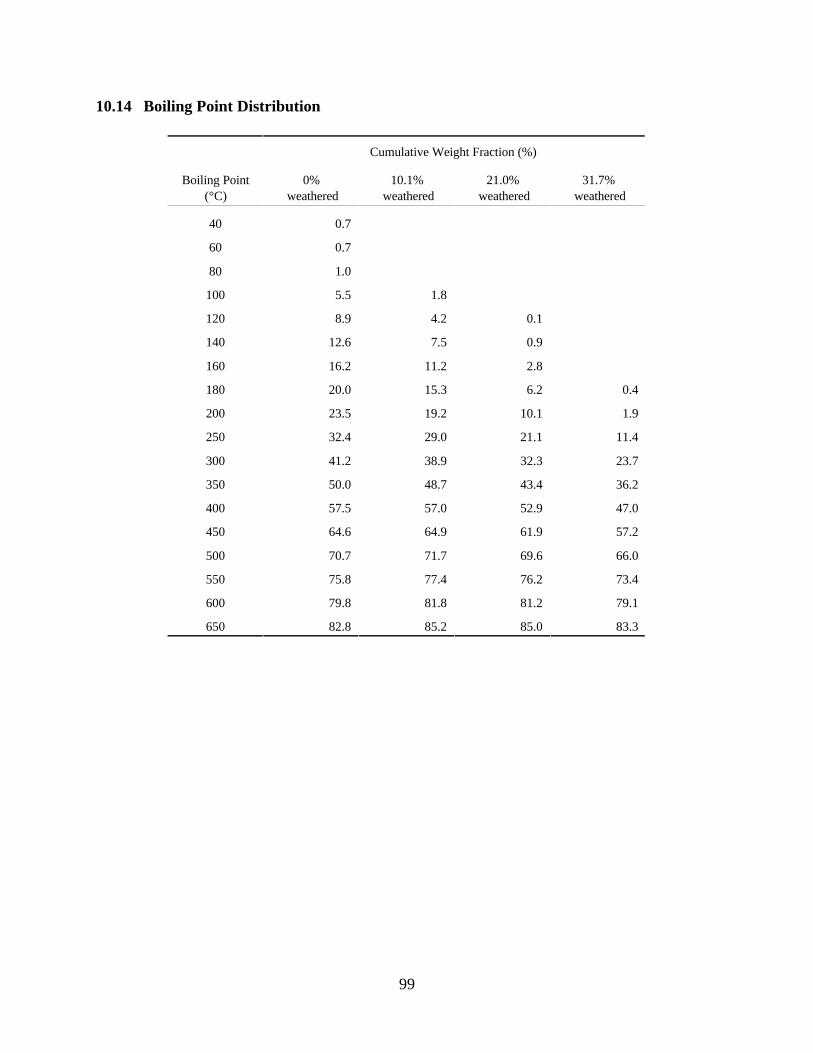
10.14 Boiling Point Distribution
Cumulative Weight Fraction (%)
Boiling Point
(°C)
0%
weathered w
10.1%
eathered w
21.0%
eathered w
31.7%
eathered
40 0.7
60 0.7
80 1.0
100 5.5 1.8
120 8.9 4.2 0.1
140 12.6 7.5 0.9
160 16.2 11.2 2.8
180 20.0 15.3 6.2 0.4
200 23.5 19.2 10.1 1.9
250 32.4 29.0 21.1 11.4
300 41.2 38.9 32.3 23.7
350 50.0 48.7 43.4 36.2
400 57.5 57.0 52.9 47.0
450 64.6 64.9 61.9 57.2
500 70.7 71.7 69.6 66.0
550 75.8 77.4 76.2 73.4
600 79.8 81.8 81.2 79.1
650 82.8 85.2 85.0 83.3
99

10.15 Hydrocarbon Groups
Concentration
(weight %)
0% 10.1% 21.0% 31.7%
Component weathered weathered weathered weathered
Saturates 78.5 78.6 76.3 74.8
Aromatics 14.8 13.7 14.6 13.8
Resins 6.0 6.9 8.0 9.9
Asphaltenes 0.7 0.8 1.1 1.6
Waxes
10.16 Volatile Organic Compounds
Concentration
(µg/g oil)
0% 31.7%
Component weathered weathered
Benzene 4026 0
Toluene 7395 13
Ethylbenzene 4845 0
Xylenes† 7105 1
C3-Benzenes‡ 10190 310
Total BTEX 23370 14
Total BTEX and C3 - 33560 324
Benzenes‡
†“Xylenes” include o-, m-, and p-xylene isomers.
‡“C3-Benzenes” include eight isomers.
2.8 3.1 3.4 4.0
100
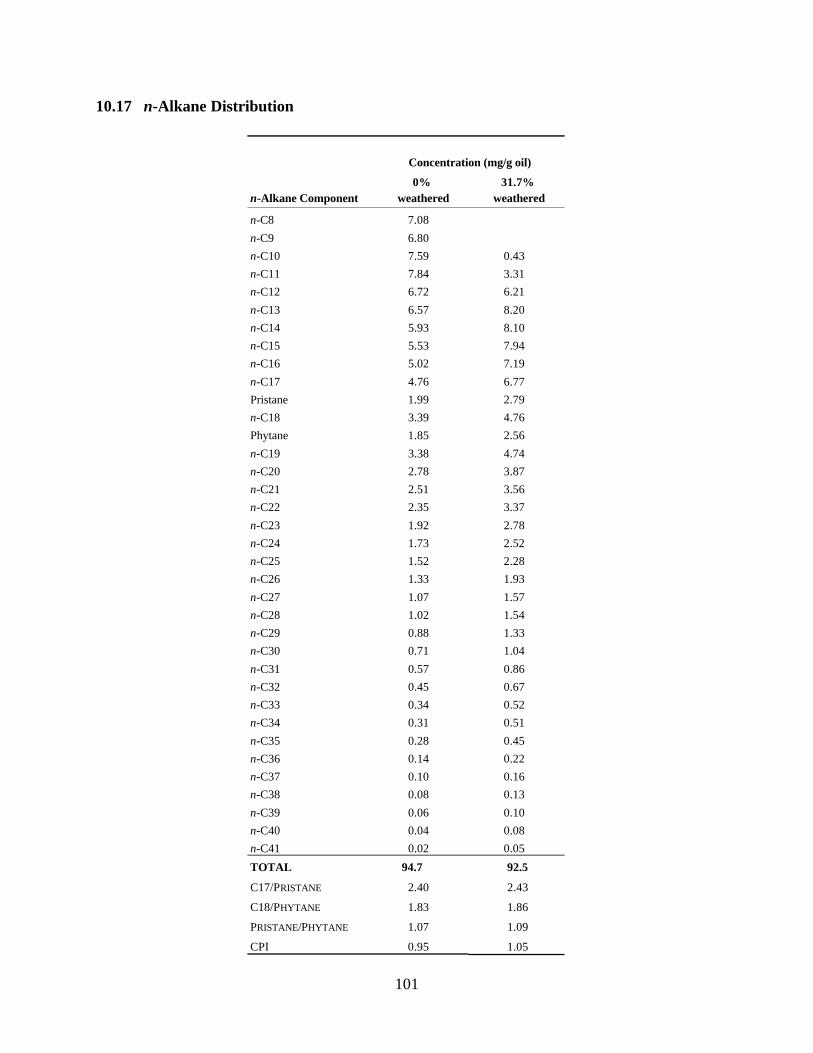
10.17 n-Alkane Distribution
Concentration (mg/g oil)
0% 31.7%
n-Alkane Component weathered weathered
n-C8 7.08
n-C9 6.80
n-C10 7.59 0.43
n-C11 7.84 3.31
n-C12 6.72 6.21
n-C13 6.57 8.20
n-C14 5.93 8.10
n-C15 5.53 7.94
n-C16 5.02 7.19
n-C17 4.76 6.77
Pristane 1.99 2.79
n-C18 3.39 4.76
Phytane 1.85 2.56
n-C19 3.38 4.74
n-C20 2.78 3.87
n-C21 2.51 3.56
n-C22 2.35 3.37
n-C23 1.92 2.78
n-C24 1.73 2.52
n-C25 1.52 2.28
n-C26 1.33 1.93
n-C27 1.07 1.57
n-C28 1.02 1.54
n-C29 0.88 1.33
n-C30 0.71 1.04
n-C31 0.57 0.86
n-C32 0.45 0.67
n-C33 0.34 0.52
n-C34 0.31 0.51
n-C35 0.28 0.45
n-C36 0.14 0.22
n-C37 0.10 0.16
n-C38 0.08 0.13
n-C39 0.06 0.10
n-C40 0.04 0.08
n-C41 0.02 0.05
TOTAL 94.7 92.5
C17/PRISTANE 2.40 2.43
C18/PHYTANE 1.83 1.86
PRISTANE/PHYTANE 1.07 1.09
CPI 0.95 1.05
101
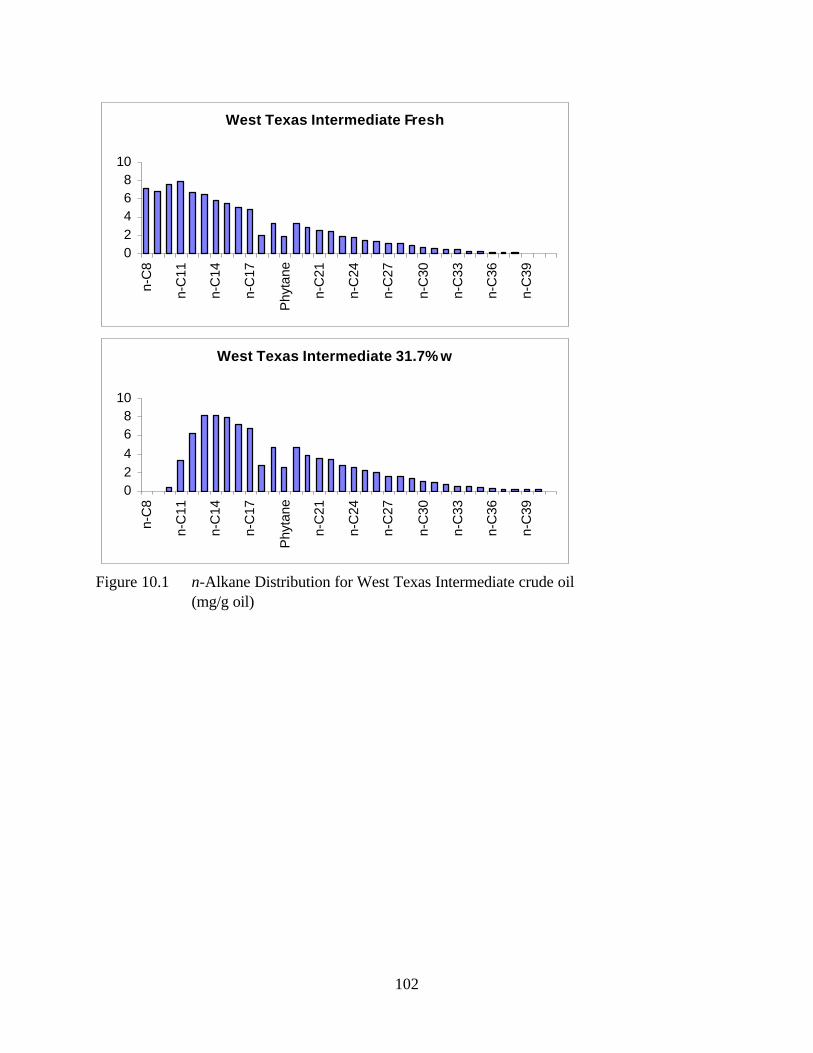
West Texas Intermediate Fresh
n-C
810
8 n-C
11
6
4n-C
14
2 n-C
17
0
Phyta
ne
n-C
21
n-C
24
n-C
27
n-C
30
n-C
33
n-C
36
n-C
39
Figure 10.1 n-Alkane Distribution for West Texas Intermediate crude oil
(mg/g oil)
102
West Texas Intermediate 31.7% w
10
8
6
4
2
n-C
8
0
n-C
11
n-C
14
n-C
17
Phyta
ne
n-C
21
n-C
24
n-C
27
n-C
30
n-C
33
n-C
36
n-C
39
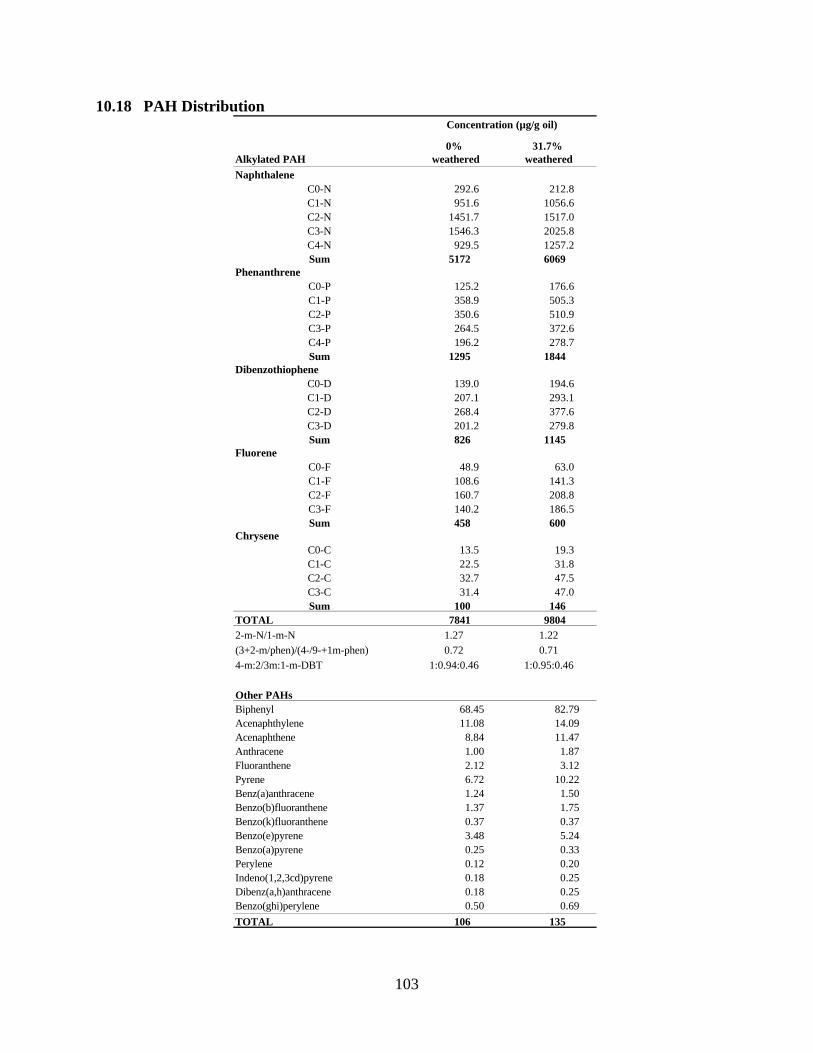
10.18 PAH Distribution Concentration (µg/g oil)
0% 31.7%
Alkylated PAH weathered weathered
Naphthalene
C0-N 292.6 212.8
C1-N 951.6 1056.6
C2-N 1451.7 1517.0
C3-N 1546.3 2025.8
C4-N 929.5 1257.2
Sum 5172 6069
Phenanthrene
C0-P 125.2 176.6
C1-P 358.9 505.3
C2-P 350.6 510.9
C3-P 264.5 372.6
C4-P 196.2 278.7
Sum 1295 1844
Dibenzothiophene
C0-D 139.0 194.6
C1-D 207.1 293.1
C2-D 268.4 377.6
C3-D 201.2 279.8
Sum 826 1145
Fluorene
C0-F 48.9 63.0
C1-F 108.6 141.3
C2-F 160.7 208.8
C3-F 140.2 186.5
Sum 458 600
Chrysene
C0-C 13.5 19.3
C1-C 22.5 31.8
C2-C 32.7 47.5
C3-C 31.4 47.0
Sum 100 146
TOTAL 7841 9804
2-m-N/1-m-N 1.27 1.22
(3+2-m/phen)/(4-/9-+1m-phen) 0.72 0.71
4-m:2/3m:1-m-DBT 1:0.94:0.46 1:0.95:0.46
Other PAHs
Biphenyl 68.45 82.79
Acenaphthylene 11.08 14.09
Acenaphthene 8.84 11.47
Anthracene 1.00 1.87
Fluoranthene 2.12 3.12
Pyrene 6.72 10.22
Benz(a)anthracene 1.24 1.50
Benzo(b)fluoranthene 1.37 1.75
Benzo(k)fluoranthene 0.37 0.37
Benzo(e)pyrene 3.48 5.24
Benzo(a)pyrene 0.25 0.33
Perylene 0.12 0.20
Indeno(1,2,3cd)pyrene 0.18 0.25
Dibenz(a,h)anthracene 0.18 0.25
Benzo(ghi)perylene 0.50 0.69
TOTAL 106 135
103
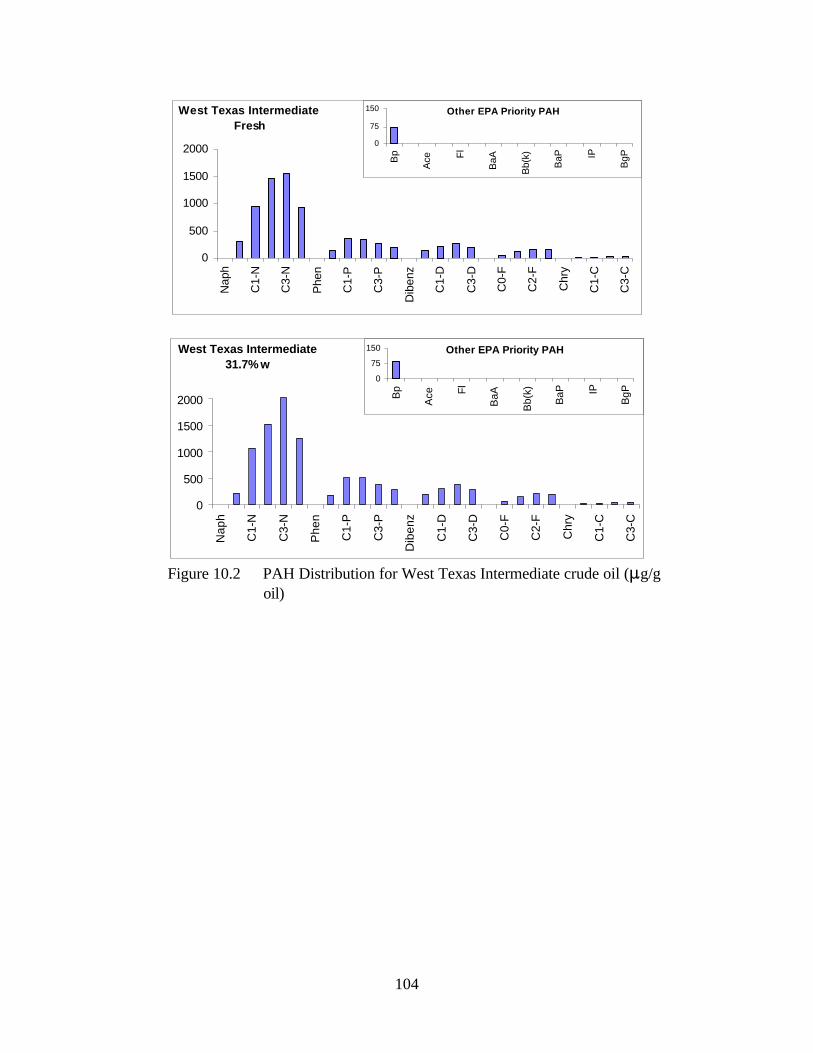
0
500
1000
1500
2000 0
75
150
Bp
Ace Fl
BaA
Bb(k
)
BaP IP
BgP
Naph
C1-N
C3-N
Phen
C1-P
C3-P
Dib
enz
C1-D
C3-D
C0-F
C2-F
Chry
C1-C
C3-C
Na
ph
C1-N
C3-N
Ph
en
C1-P
West Texas Intermediate 150
75
0C
3-P
Bp
2000 D
ibe
nz
1500 A
ce
C1-D
1000
Fl
C3-D
500
BaA
C
0-F
0
Bb
(k)
C2-F
BaP
C
hry
IP
C1-C
BgP
C
3-C
West Texas Intermediate
Fresh
Other EPA Priority PAH
Other EPA Priority PAH
31.7% w
Figure 10.2 PAH Distribution for West Texas Intermediate crude oil (:g/g
oil)
104
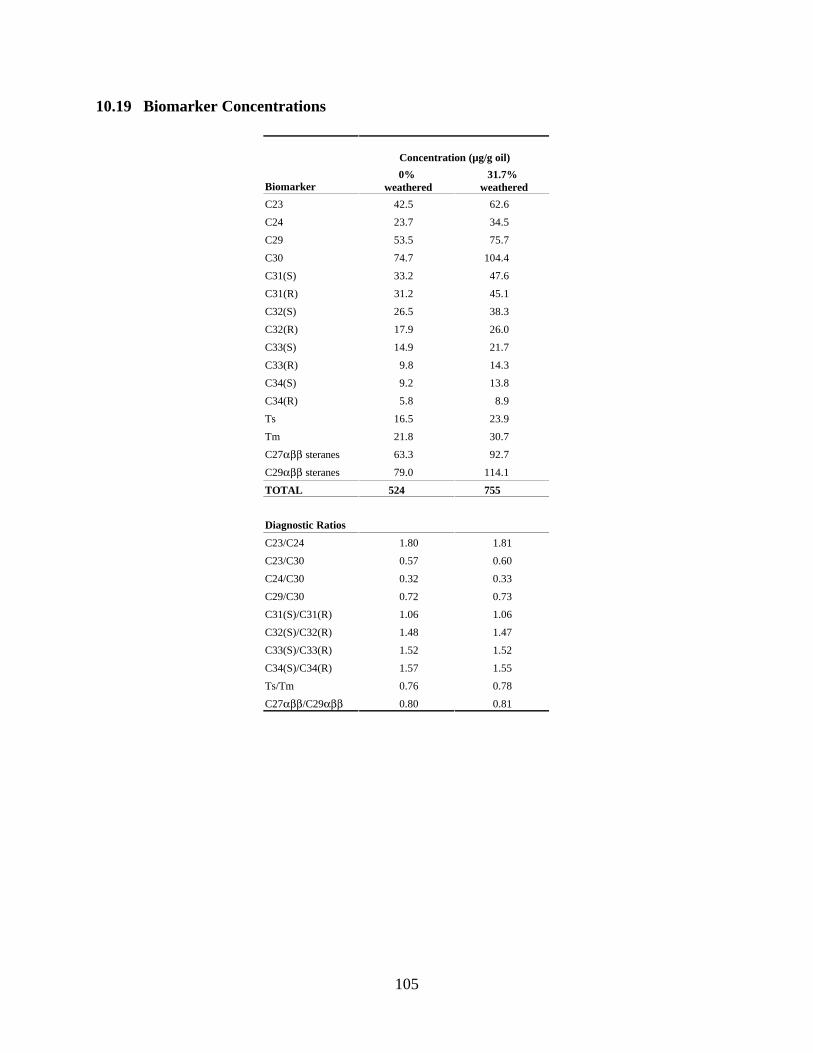
10.19 Biomarker Concentrations
Biomarker
Concentra
0%
weathered
tion (µg/g oil)
31.7%
weathered
42.5 62.6
23.7 34.5
53.5 75.7
74.7 104.4
C31(S) 33.2 47.6
C31(R) 31.2 45.1
C32(S) 26.5 38.3
C32(R) 17.9 26.0
C33(S) 14.9 21.7
C33(R) 14.3
C34(S) 13.8
C34(R)
16.5 23.9
Tm 21.8 30.7
C27αββ 63.3 92.7
C29αββ 79.0 114.1
TOTAL
Diagnostic Ratios
C23/C24
C23/C30
C24/C30
C29/C30
C31(S)/C31(R)
C32(S)/C32(R)
C33(S)/C33(R)
C34(S)/C34(R)
Ts/Tm
C27αββ/C29αββ
1.80
0.57
0.32
0.72
1.06
1.48
1.52
1.57
0.76
0.80
1.81
0.60
0.33
0.73
1.06
1.47
1.52
1.55
0.78
0.81
C23
C24
C29
C30
9.8
9.2
5.8 8.9
Ts
steranes
steranes
524 755
105
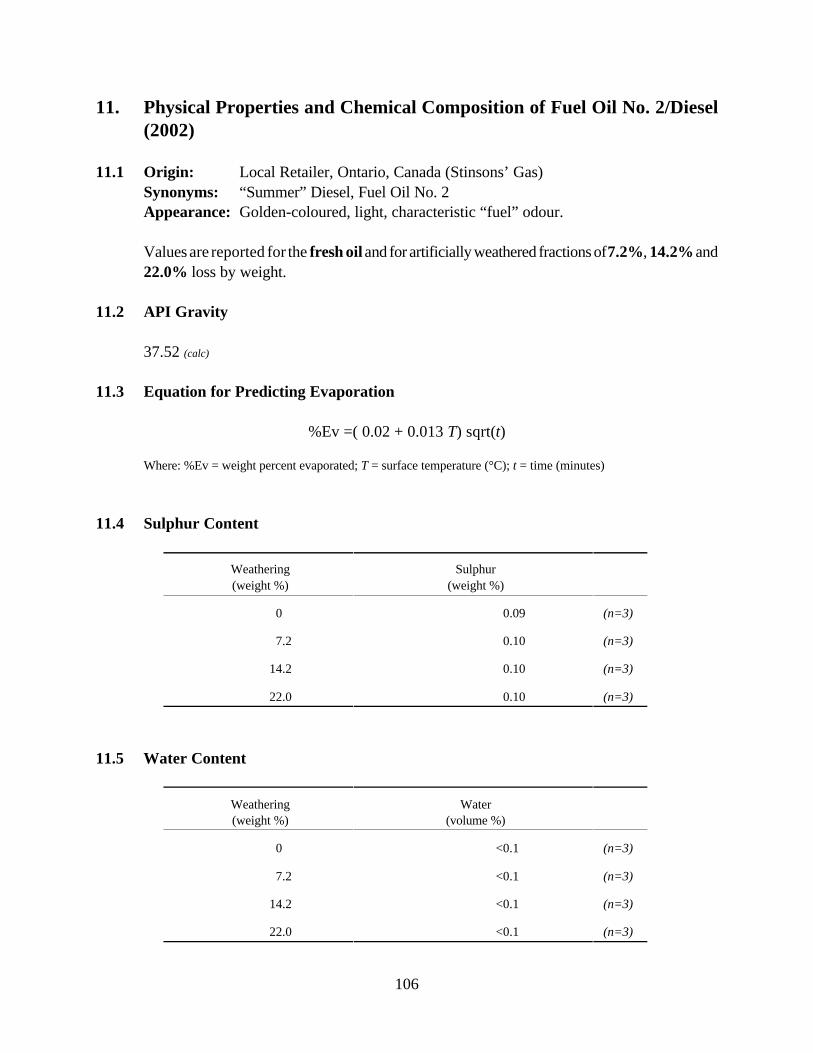
11.5
11. Physical Properties and Chemical Composition of Fuel Oil No. 2/Diesel
(2002)
11.1 Origin: Local Retailer, Ontario, Canada (Stinsons’ Gas)
Synonyms: “Summer” Diesel, Fuel Oil No. 2
Appearance: Golden-coloured, light, characteristic “fuel” odour.
Values are reported for the fresh oil and for artificially weathered fractions of 7.2%, 14.2% and
22.0% loss by weight.
11.2 API Gravity
37.52 (calc)
11.3 Equation for Predicting Evaporation
%Ev =( 0.02 + 0.013 T) sqrt(t)
Where: %Ev = weight percent evaporated; T = surface temperature (°C); t = time (minutes)
11.4 Sulphur Content
Weathering Sulphur
(weight %) (weight %)
0 0.09 (n=3)
7.2 0.10 (n=3)
14.2 0.10 (n=3)
22.0 0.10 (n=3)
Weathering Water
(weight %) (volume %)
0 (n=3)
7.2 <0.1 (n=3)
14.2 <0.1 (n=3)
22.0 <0.1 (n=3)
106
Water Content
<0.1
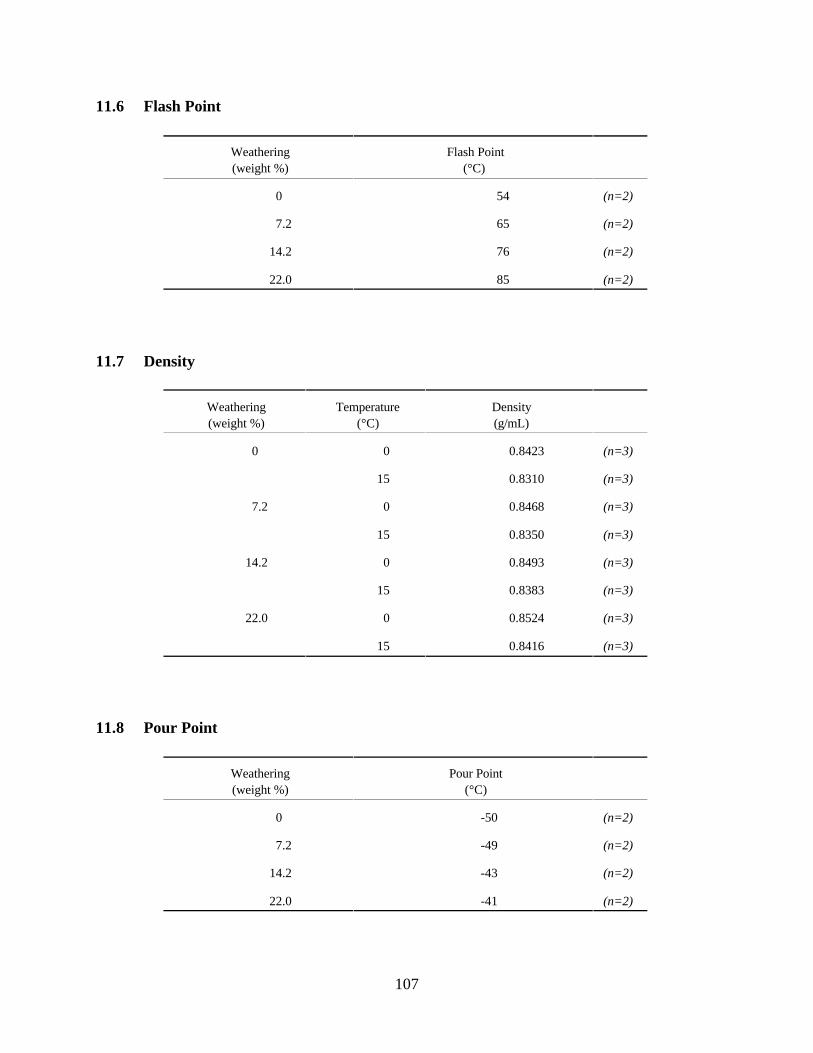
11.6 Flash Point
11.7
Weathering
(weight %)
Flash Point
(°C)
0 (n=2)
7.2 65 (n=2)
14.2 76 (n=2)
22.0 85 (n=2)
Weathering
(weight %)
Temperature
(°C)
Density
(g/mL)
0 0 0.8423 (n=3)
15 0.8310 (n=3)
7.2 0 0.8468 (n=3)
15 0.8350 (n=3)
14.2 0 0.8493 (n=3)
15 0.8383 (n=3)
22.0 0 0.8524 (n=3)
15 0.8416 (n=3)
11.8 Pour Point
Weathering
(weight %)
Pour Point
(°C)
0 -50 (n=2)
7.2 -49 (n=2)
14.2 -43 (n=2)
22.0 -41 (n=2)
107
Density
54
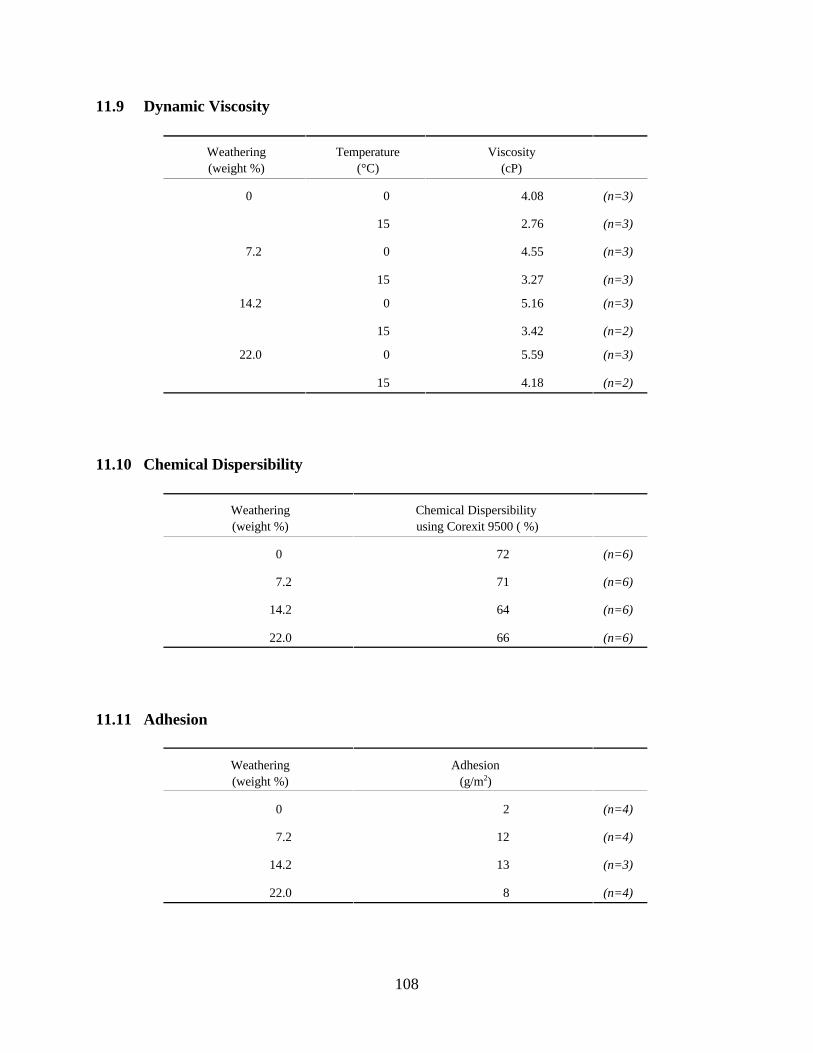
11.9 Dynamic Viscosity
Weathering
(weight %)
Temperature
(°C)
Viscosity
(cP)
0 0 4.08 (n=3)
15 2.76 (n=3)
7.2 0 4.55 (n=3)
15 3.27 (n=3)
14.2 0 5.16 (n=3)
15 3.42 (n=2)
22.0 0 5.59 (n=3)
15 4.18 (n=2)
11.10
Weathering Chemical Dispersibility
(weight %) using Corexit 9500 ( %)
0 (n=6)
7.2 71 (n=6)
14.2 64 (n=6)
22.0 66 (n=6)
Weathering Adhesion
(weight %) (g/m2)
0 2 (n=4)
7.2 12 (n=4)
14.2 13 (n=3)
22.0 8 (n=4)
11.11 Adhesion
Chemical Dispersibility
72
108
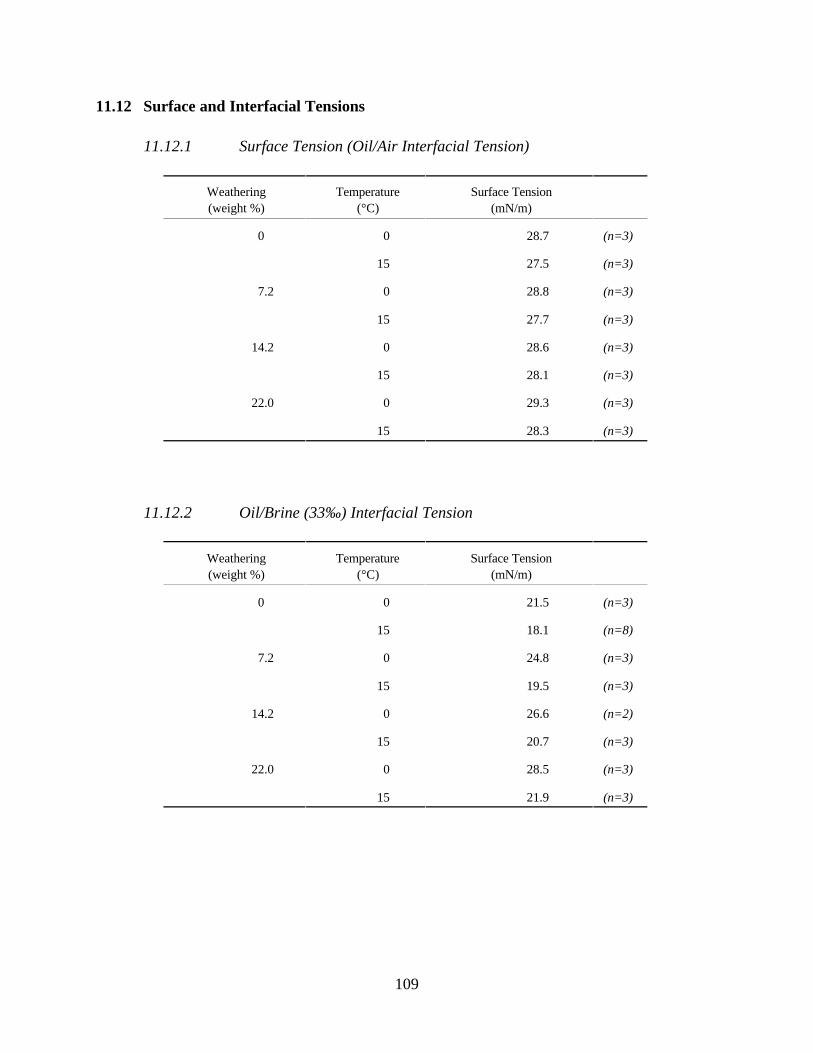
11.12 Surface and Interfacial Tensions
11.12.1 Surface Tension (Oil/Air Interfacial Tension)
Weathering
(weight %)
Temperature
(°C)
Surface Tension
(mN/m)
0 0 28.7 (n=3)
15 27.5 (n=3)
7.2 0 28.8 (n=3)
15 27.7 (n=3)
14.2 0 28.6 (n=3)
15 28.1 (n=3)
22.0 0 29.3 (n=3)
15 28.3 (n=3)
11.12.2
Weathering Temperature Surface Tension
(weight %) (mN/m)
0
7.2
0
15
0
21.5
18.1
24.8
(n=3)
(n=8)
(n=3)
14.2
22.0
15
0
15
0
19.5
26.6
20.7
28.5
(n=3)
(n=2)
(n=3)
(n=3)
15 21.9 (n=3)
Oil/Brine (33‰) Interfacial Tension
(°C)
109
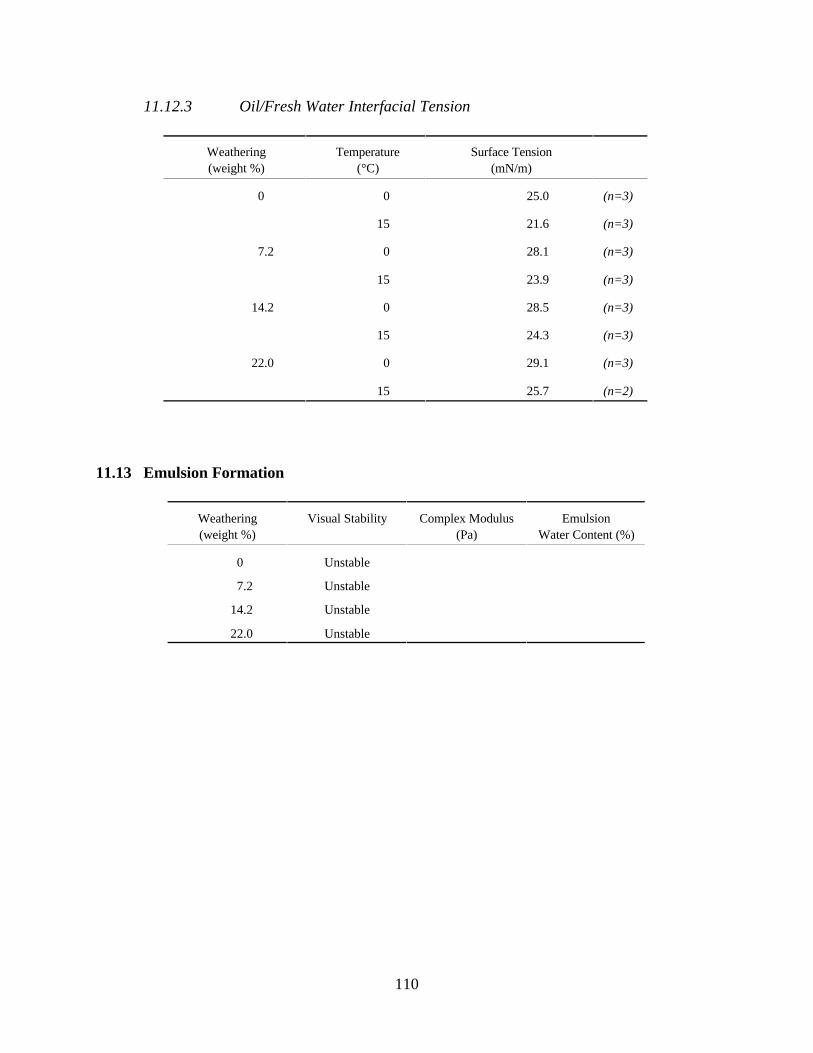
11.12.3 Oil/Fresh Water Interfacial Tension
Weathering
(weight %)
Temperature
(°C)
Surface Tension
(mN/m)
0 0 25.0 (n=3)
15 21.6 (n=3)
7.2 0 28.1 (n=3)
15 23.9 (n=3)
14.2 0 28.5 (n=3)
15 24.3 (n=3)
22.0 0 29.1 (n=3)
15 25.7 (n=2)
11.13
Weathering Complex Modulus Emulsion
(weight %) (Pa)
0 Unstable
7.2 Unstable
14.2 Unstable
22.0 Unstable
Emulsion Formation
Visual Stability
Water Content (%)
110
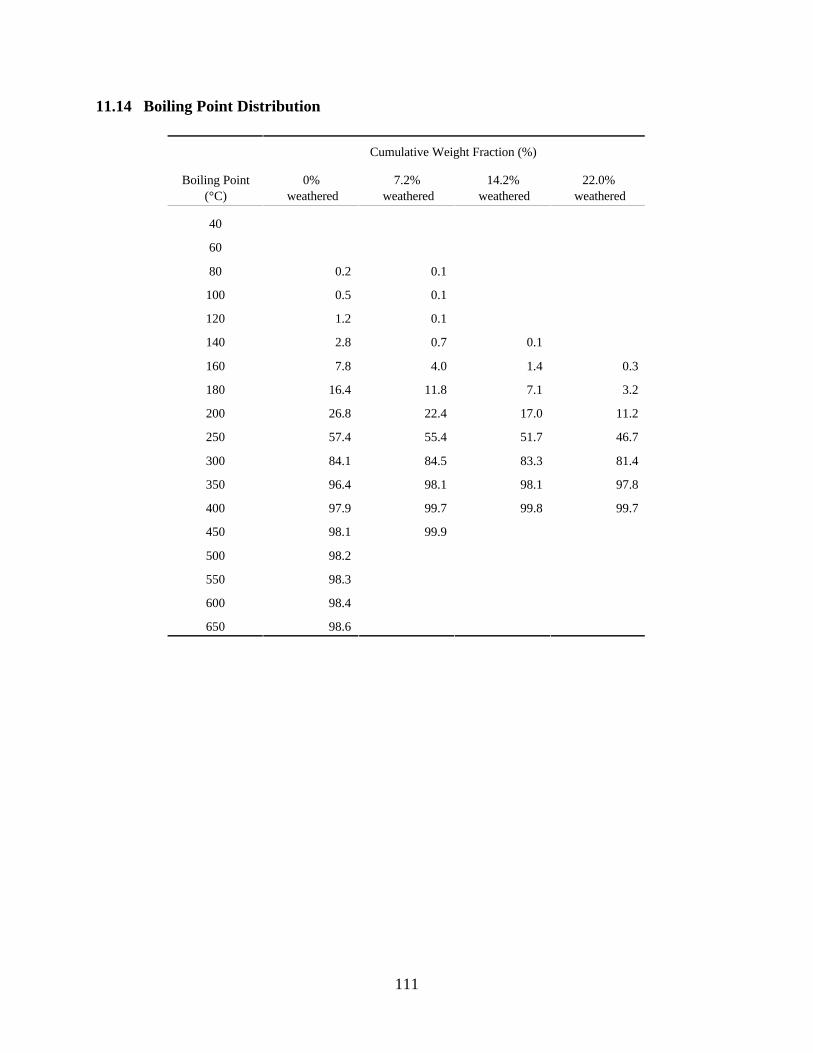
11.14 Boiling Point Distribution
Cumulative Weight Fraction (%)
Boiling Point 14.2% 22.0%
(°C) weathered weathered
0%
weathered
7.2%
weathered
40
60
80 0.2 0.1
100 0.5 0.1
120 1.2 0.1
140 2.8 0.7 0.1
160 7.8 4.0 1.4 0.3
180 16.4 11.8 7.1 3.2
200 26.8 22.4 17.0 11.2
250 57.4 55.4 51.7 46.7
300 84.1 84.5 83.3 81.4
350 96.4 98.1 98.1 97.8
400 97.9 99.7 99.8 99.7
450 98.1 99.9
500 98.2
550 98.3
600 98.4
650 98.6
111
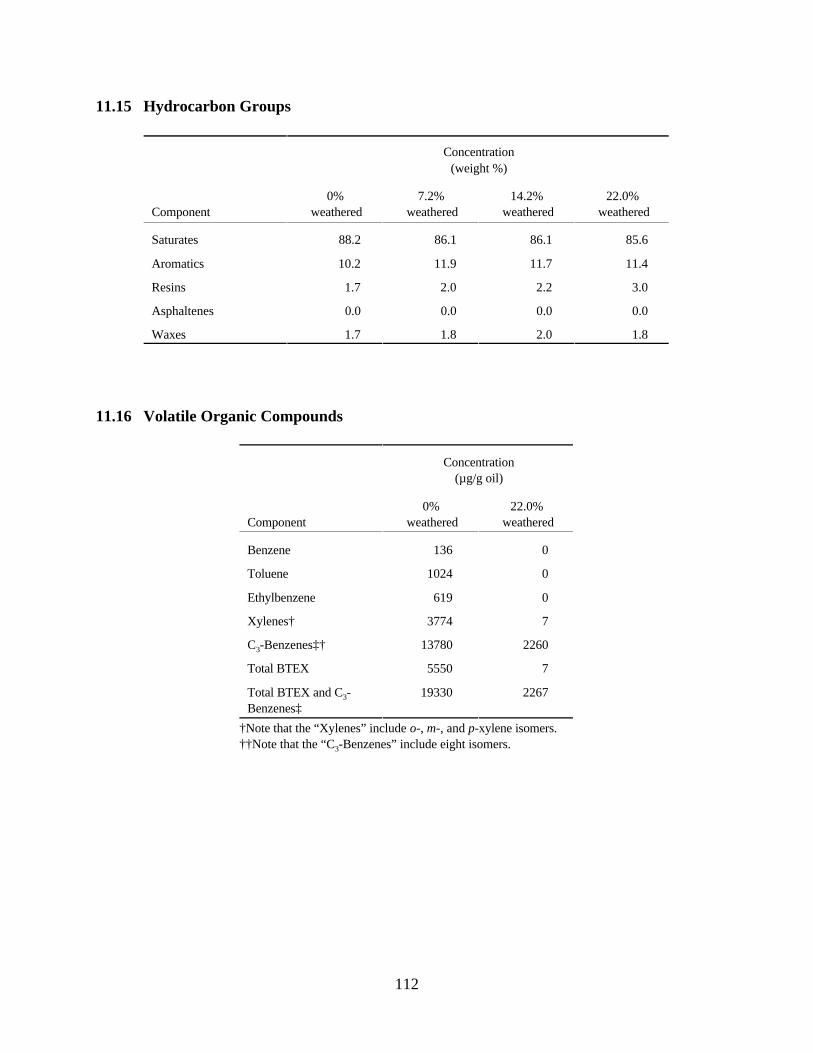
11.15 Hydrocarbon Groups
Concentration
(weight %)
0% 7.2% 14.2% 22.0%
Component weathered weathered weathered weathered
Saturates 88.2 86.1 86.1 85.6
Aromatics 10.2 11.9 11.7 11.4
Resins 1.7 2.0 2.2 3.0
Asphaltenes 0.0 0.0 0.0 0.0
Waxes
11.16 Volatile Organic Compounds
Concentration
(µg/g oil)
0% 22.0%
Component weathered weathered
Benzene 0
Toluene 1024 0
Ethylbenzene 0
Xylenes† 3774 7
C3-Benzenes‡† 13780 2260
Total BTEX 5550 7
Total BTEX and C3 - 19330 2267
Benzenes‡
†Note that the “Xylenes” include o-, m-, and p-xylene isomers.
††Note that the “C3-Benzenes” include eight isomers.
1.7 1.8 2.0 1.8
136
619
112
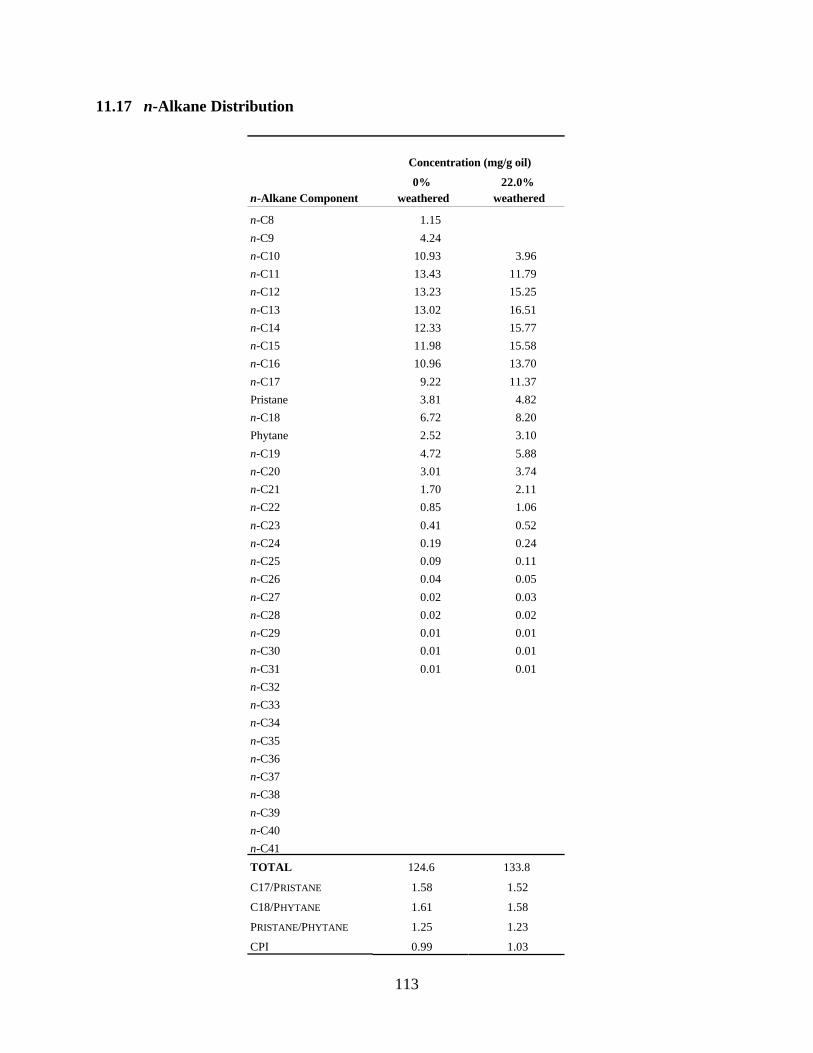
11.17 n-Alkane Distribution
Concentration (mg/g oil)
0% 22.0%
n-Alkane Component weathered weathered
n-C8 1.15
n-C9 4.24
n-C10 10.93 3.96
n-C11 13.43 11.79
n-C12 13.23 15.25
n-C13 13.02 16.51
n-C14 12.33 15.77
n-C15 11.98 15.58
n-C16 10.96 13.70
n-C17 9.22 11.37
Pristane 3.81 4.82
n-C18 6.72 8.20
Phytane 2.52 3.10
n-C19 4.72 5.88
n-C20 3.01 3.74
n-C21 1.70 2.11
n-C22 0.85 1.06
n-C23 0.41 0.52
n-C24 0.19 0.24
n-C25 0.09 0.11
n-C26 0.04 0.05
n-C27 0.02 0.03
n-C28 0.02 0.02
n-C29 0.01 0.01
n-C30 0.01 0.01
n-C31 0.01 0.01
n-C32
n-C33
n-C34
n-C35
n-C36
n-C37
n-C38
n-C39
n-C40
n-C41
TOTAL 124.6 133.8
C17/PRISTANE 1.58 1.52
C18/PHYTANE 1.61 1.58
PRISTANE/PHYTANE 1.25 1.23
CPI 0.99 1.03
113
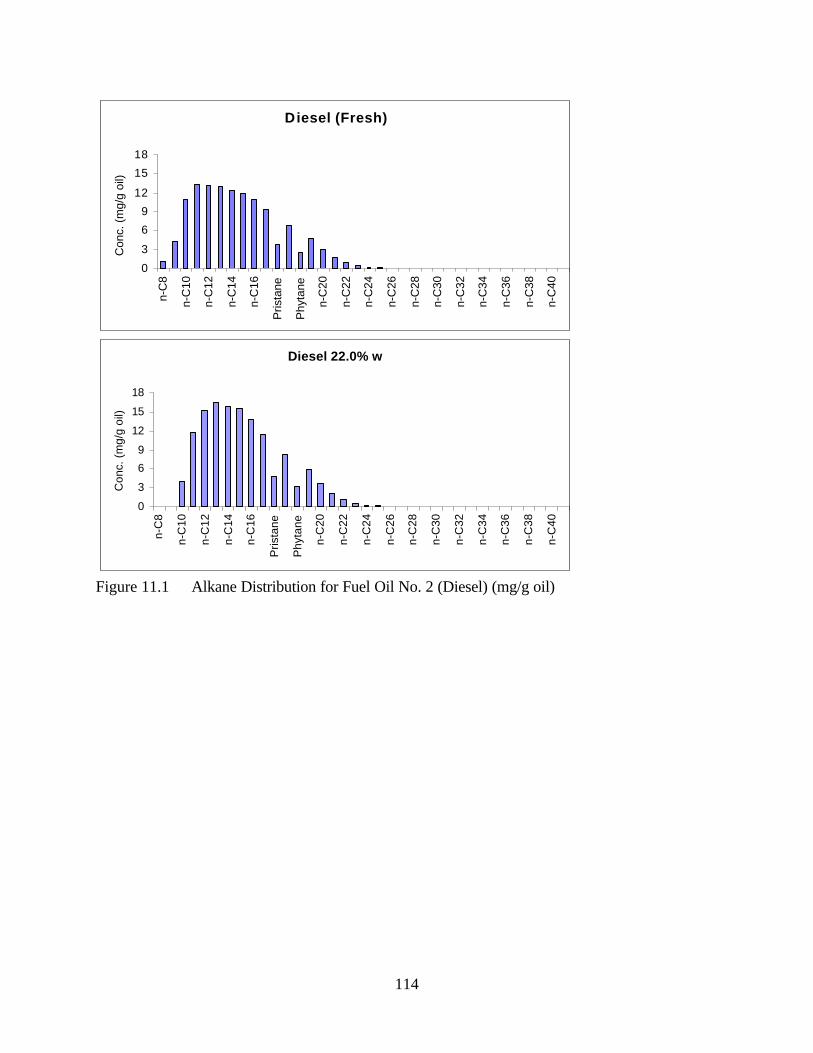
D iesel (Fresh) C
on
c.
(mg
/g o
il)
Conc. (m
g/g
oil)
18n
-C8
n-C
815
n-C
10
n-C
10
12n
-C1
2n-C
12
9
6n
-C1
4n-C
14
3n
-C1
6n-C
16
0 P
rista
ne
Prista
ne
Ph
yta
ne
Phyta
ne
n-C
20
n-C
20
n-C
22
n-C
22
Diesel 22.0% w n
-C2
4n-C
24
n-C
26
n-C
26
18
15n
-C2
8n-C
28
12n
-C3
0n-C
30
9n
-C3
2n-C
32
6
n-C
34
n-C
34
3
0n
-C3
6n-C
36
n-C
38
n-C
38
n-C
40
n-C
40
Figure 11.1 Alkane Distribution for Fuel Oil No. 2 (Diesel) (mg/g oil)
114
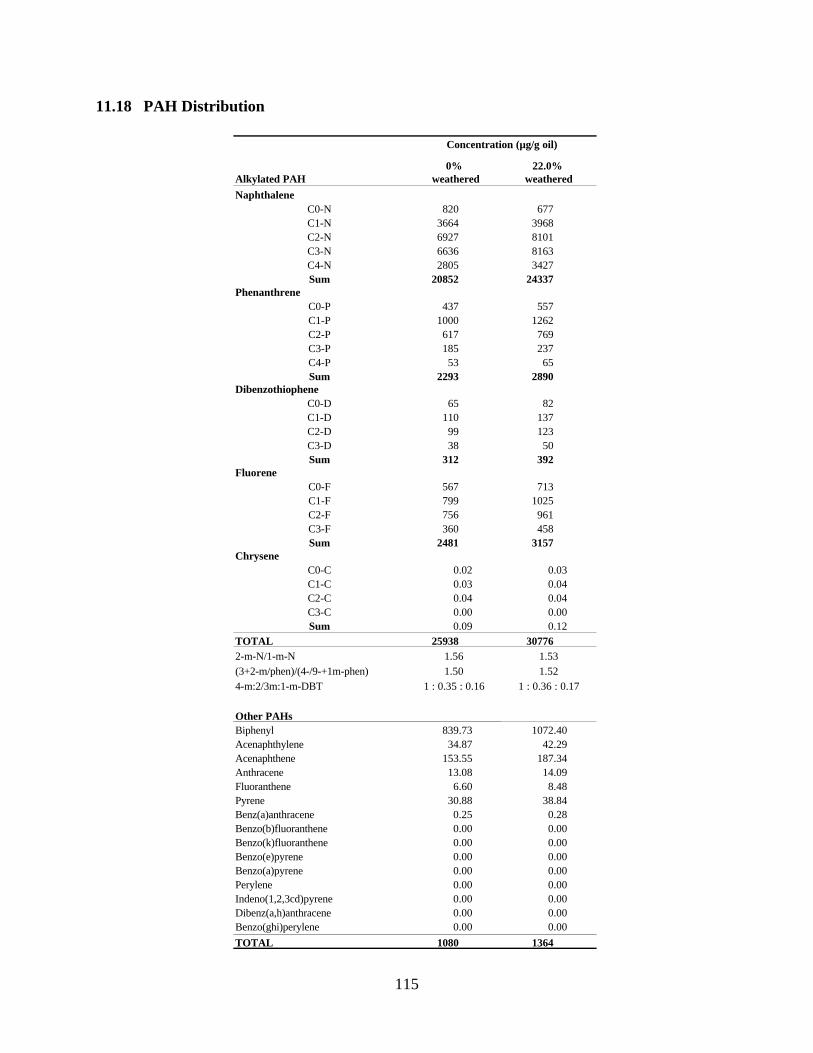
11.18 PAH Distribution
Concentration (µg/g oil)
0% 22.0%
Alkylated PAH weathered weathered
Naphthalene
C0-N 820 677
C1-N 3664 3968
C2-N 6927 8101
C3-N 6636 8163
C4-N 2805 3427
Sum 20852 24337
Phenanthrene
C0-P 437 557
C1-P 1000 1262
C2-P 617 769
C3-P 185 237
C4-P 53 65
Sum 2293 2890
Dibenzothiophene
C0-D 65 82
C1-D 110 137
C2-D 99 123
C3-D 38 50
Sum 312 392
Fluorene
C0-F 567 713
C1-F 799 1025
C2-F 756 961
C3-F 360 458
Sum 2481 3157
Chrysene
C0-C 0.02 0.03
C1-C 0.03 0.04
C2-C 0.04 0.04
C3-C 0.00 0.00
Sum 0.09 0.12
TOTAL 25938 30776
2-m-N/1-m-N 1.56 1.53
(3+2-m/phen)/(4-/9-+1m-phen) 1.50 1.52
4-m:2/3m:1-m-DBT 1 : 0.36 : 0.17
Other PAHs
Biphenyl 839.73 1072.40
Acenaphthylene 34.87 42.29
Acenaphthene 153.55 187.34
Anthracene 13.08 14.09
Fluoranthene 6.60 8.48
Pyrene 30.88 38.84
Benz(a)anthracene 0.25 0.28
Benzo(b)fluoranthene 0.00 0.00
Benzo(k)fluoranthene 0.00 0.00
Benzo(e)pyrene 0.00 0.00
Benzo(a)pyrene 0.00 0.00
Perylene 0.00 0.00
Indeno(1,2,3cd)pyrene 0.00 0.00
Dibenz(a,h)anthracene 0.00 0.00
Benzo(ghi)perylene 0.00 0.00
TOTAL 1080 1364
1 : 0.35 : 0.16
115
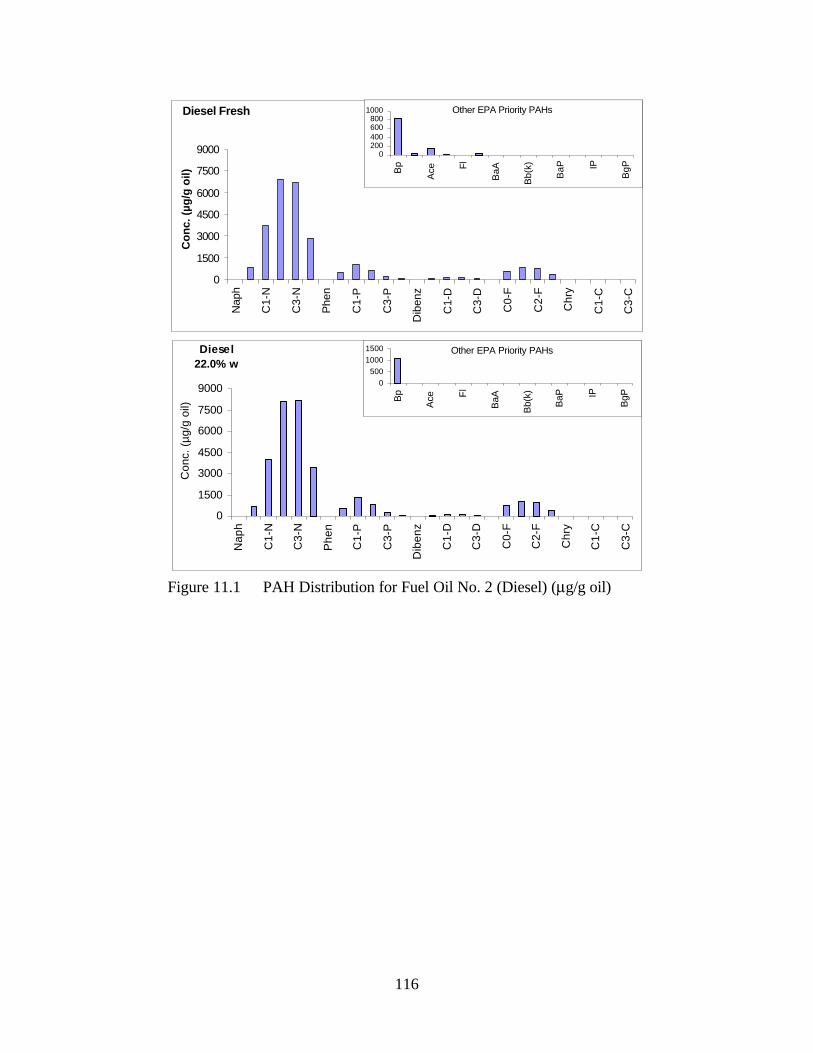
Diesel Fresh
0
1500
3000
4500
6000
7500
9000
Naph
C1
-N
C3
-N
Phen
C1
-P
C3
-P
Dib
enz
C1
-D
C3
-D
C0
-F
C2
-F
Ch
ry
C1
-C
C3
-C
Co
nc
. (µ
g/g
oil
)
Other EPA Priority PAHs
0 200 400
600 800
1000
Bp
Ace Fl
Ba
A
Bb
(k)
Ba
P IP
Bg
P
22.0% w
0
1500
3000
4500
6000
7500
9000
Na
ph
C1
-N
C3
-N
Ph
en
C1
-P
C3
-P
Dib
en
z
C1
-D
C3
-D
C0
-F
C2
-F
Ch
ry
C1
-C
C3
-C
Co
nc.
(µg
/g o
il)
Other EPA Priority PAHs
0
500
1000
1500
Bp
Ace Fl
BaA
Bb(k
)
BaP IP
BgP
Diese l
Figure 11.1 PAH Distribution for Fuel Oil No. 2 (Diesel) (µg/g oil)
116
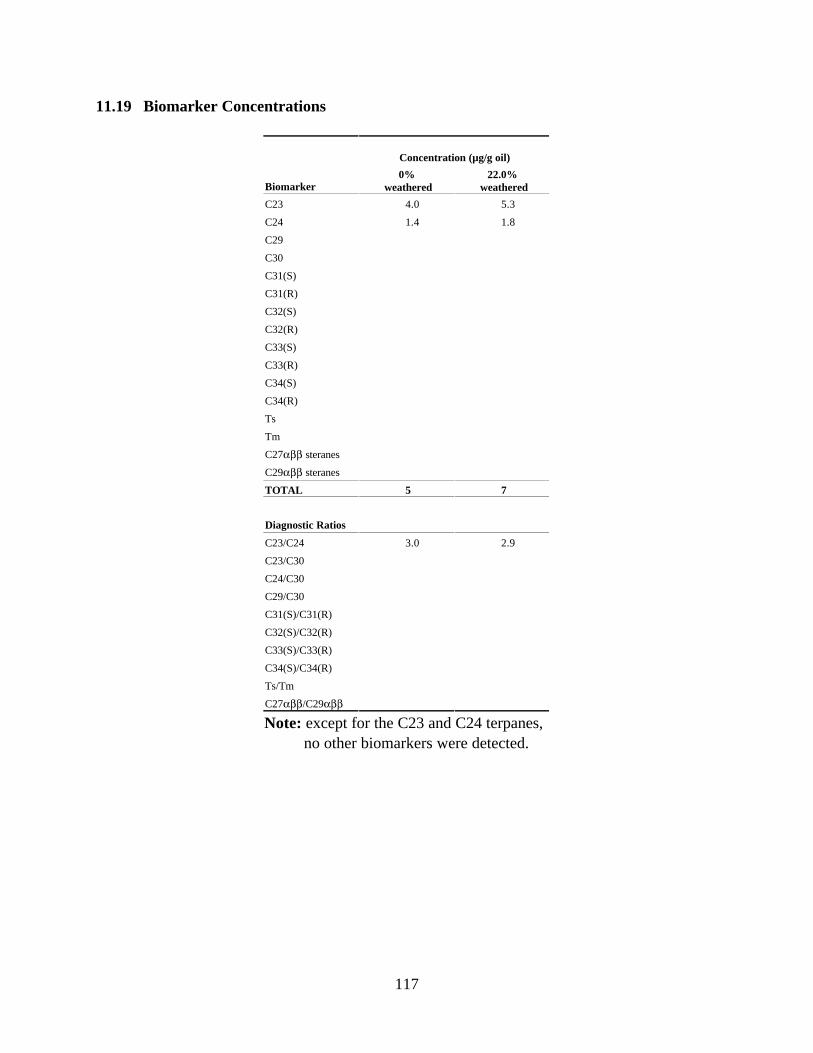
11.19 Biomarker Concentrations
Biomarker
Concentratio
0%
weathered
n (µg/g oil)
22.0%
weathered
4.0 5.3
1.4 1.8
C29
C30
C31(S)
C31(R)
C32(S)
C32(R)
C33(S)
C33(R)
C34(S)
C34(R)
Ts
Tm
C27αββ steranes
C29αββ steranes
TOTAL 5 7
Diagnostic Ratios
C23/C24
C23/C30
C24/C30
C29/C30
C31(S)/C31(R)
C32(S)/C32(R)
C33(S)/C33(R)
C34(S)/C34(R)
Ts/Tm
C27αββ/C29αββ
Note: except for the C23 and C24 terpanes,
no other biomarkers were detected.
C23
C24
3.0 2.9
117
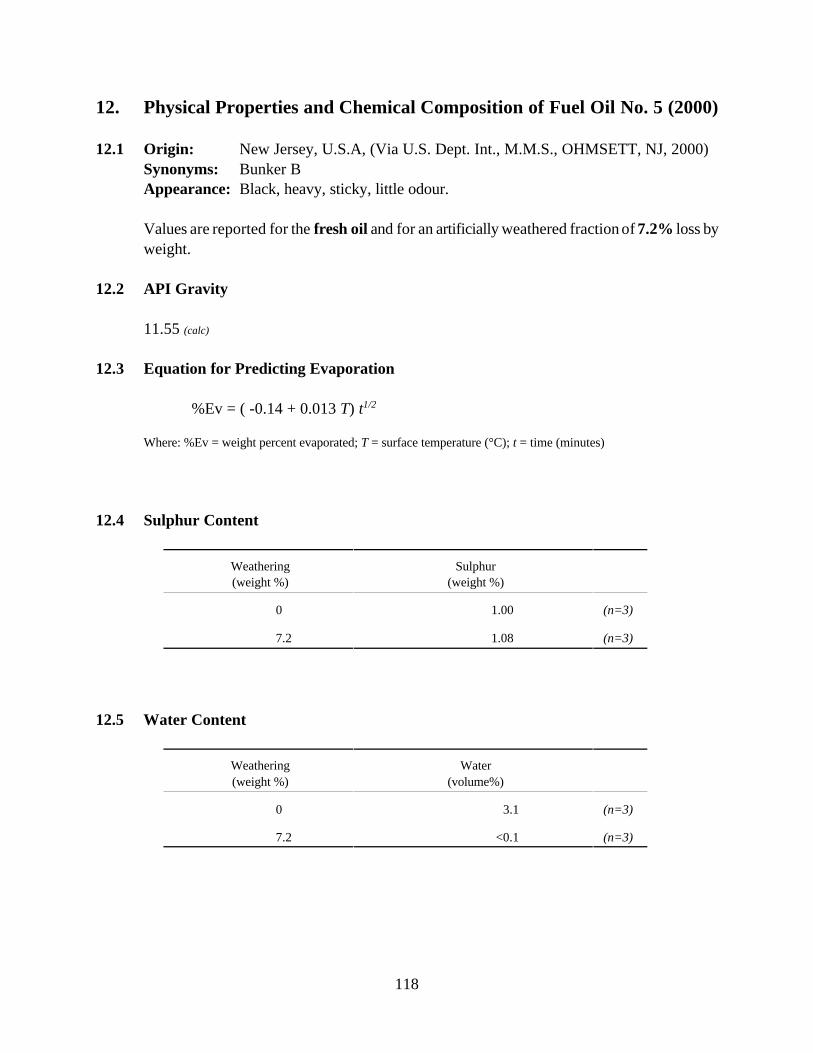
12.1
12.
12.2
12.3
12.4
12.5
Physical Properties and Chemical Composition of Fuel Oil No. 5 (2000)
Origin: New Jersey, U.S.A, (Via U.S. Dept. Int., M.M.S., OHMSETT, NJ, 2000)
Synonyms: Bunker B
Appearance: Black, heavy, sticky, little odour.
Values are reported for the fresh oil and for an artificially weathered fraction of 7.2% loss by
weight.
API Gravity
11.55 (calc)
Equation for Predicting Evaporation
%Ev = ( -0.14 + 0.013 T) t1/2
Where: %Ev = weight percent evaporated; T = surface temperature (°C); t = time (minutes)
Sulphur Content
Weathering Sulphur
(weight %) (weight %)
0 1.00 (n=3)
7.2 1.08 (n=3)
Water Content
Weathering Water
(weight %) (volume%)
0 3.1 (n=3)
7.2 <0.1 (n=3)
118
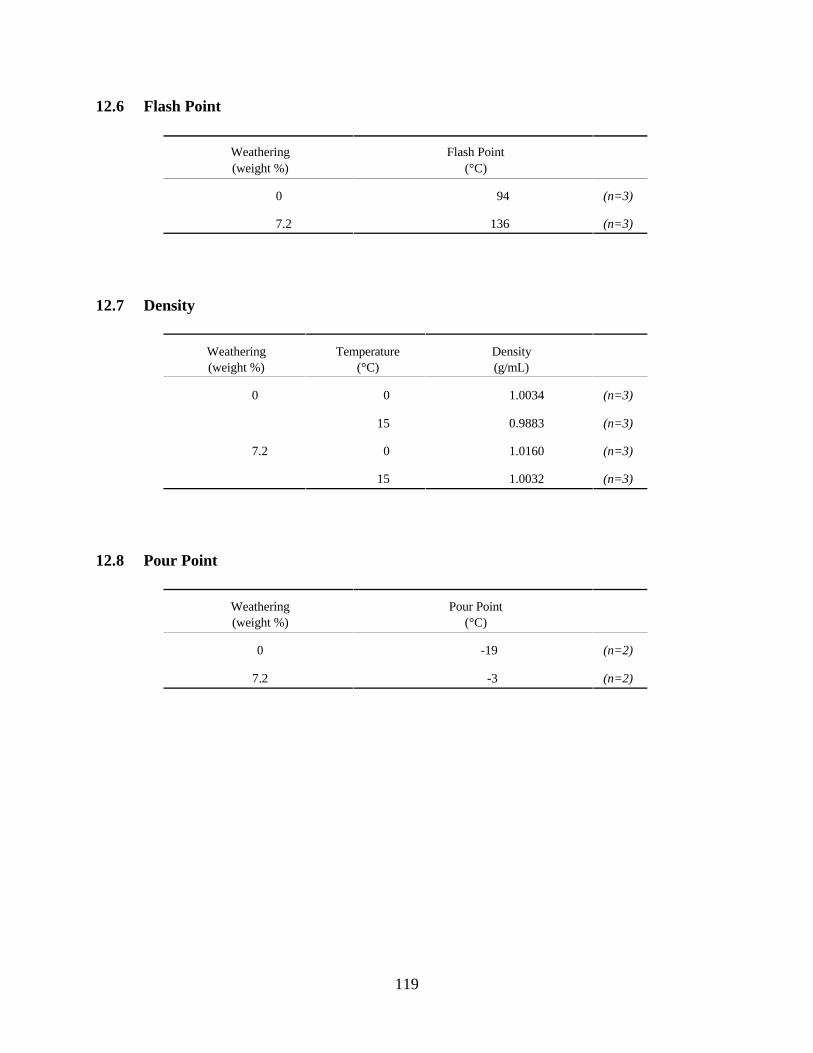
12.6 Flash Point
Weathering
(weight %)
Flash Point
(°C)
0 (n=3)
7.2 136 (n=3)
Weathering Temperature Density
(weight %) (°C) (g/mL)
0 0 1.0034 (n=3)
15 0.9883 (n=3)
7.2 0 1.0160 (n=3)
15 1.0032 (n=3)
12.7
Weathering
(weight %)
0 -19 (n=2)
7.2 -3 (n=2)
12.8 Pour Point
94
Density
Pour Point
(°C)
119
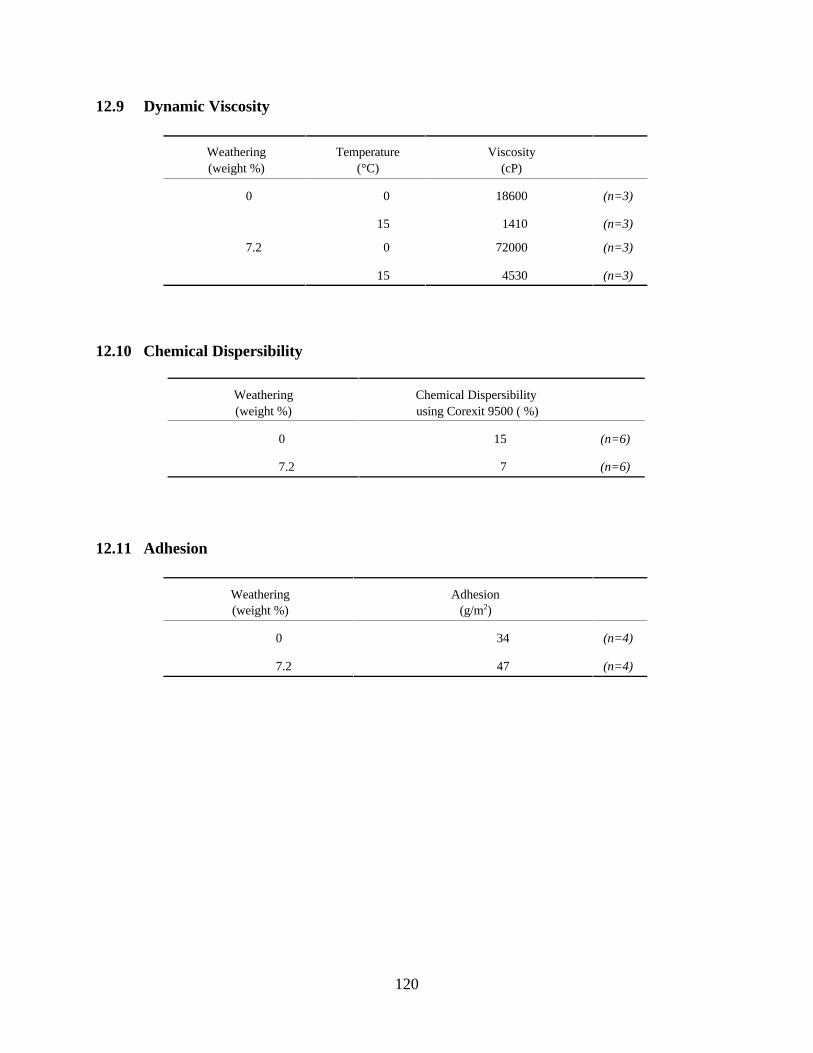
12.9 Dynamic Viscosity
Weathering
(weight %)
Temperature
(°C)
Viscosity
(cP)
0 0 18600 (n=3)
7.2
15
0
1410
72000
(n=3)
(n=3)
15 4530 (n=3)
12.10
Weathering Chemical Dispersibility
(weight %) using Corexit 9500 ( %)
0 (n=6)
7.2 7 (n=6)
Weathering Adhesion
(weight %) (g/m2)
0 (n=4)
7.2 47 (n=4)
12.11 Adhesion
Chemical Dispersibility
15
34
120
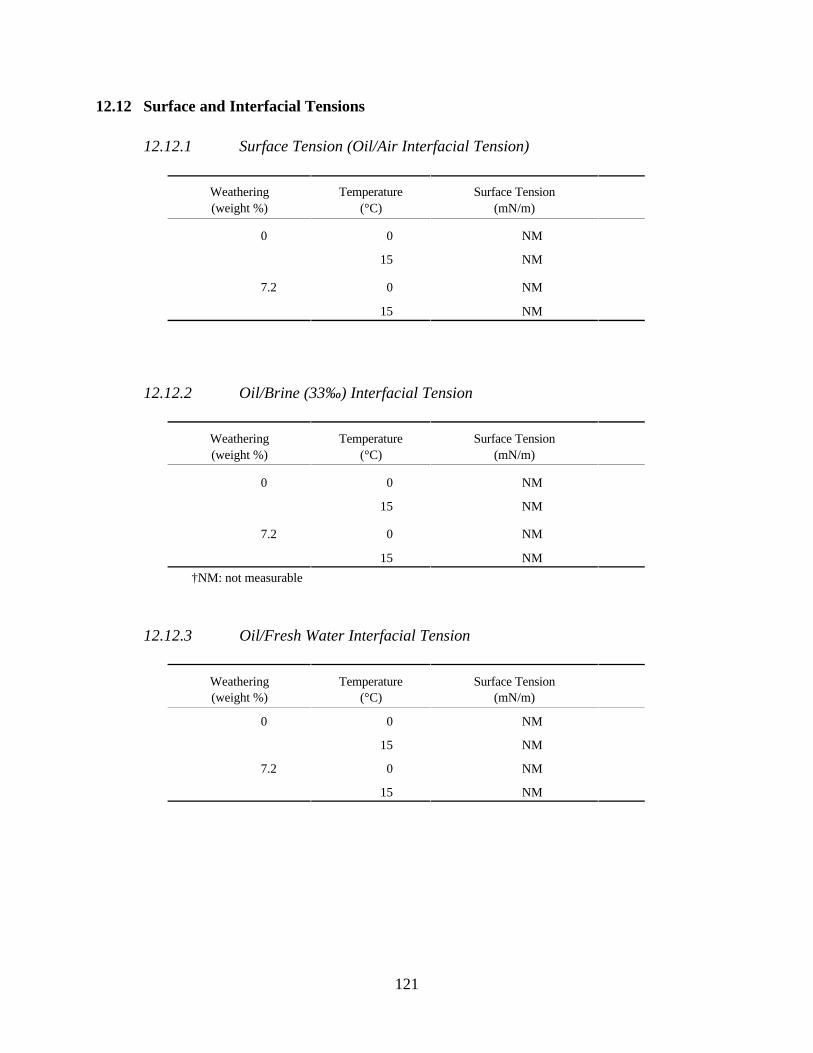
12.12 Surface and Interfacial Tensions
12.12.1
Weathering Temperature Surface Tension
(weight %) (°C) (mN/m)
0 0
15
7.2 0
15
12.12.2
Weathering Temperature Surface Tension
(weight %) (°C) (mN/m)
0 0
15
7.2 0
15
†NM: not measurable
12.12.3 Oil/Fresh Water Interfacial Tension
Weathering Temperature Surface Tension
(weight %) (°C) (mN/m)
0 0
15
7.2 0
15
Surface Tension (Oil/Air Interfacial Tension)
NM
NM
NM
NM
Oil/Brine (33‰) Interfacial Tension
NM
NM
NM
NM
NM
NM
NM
NM
121
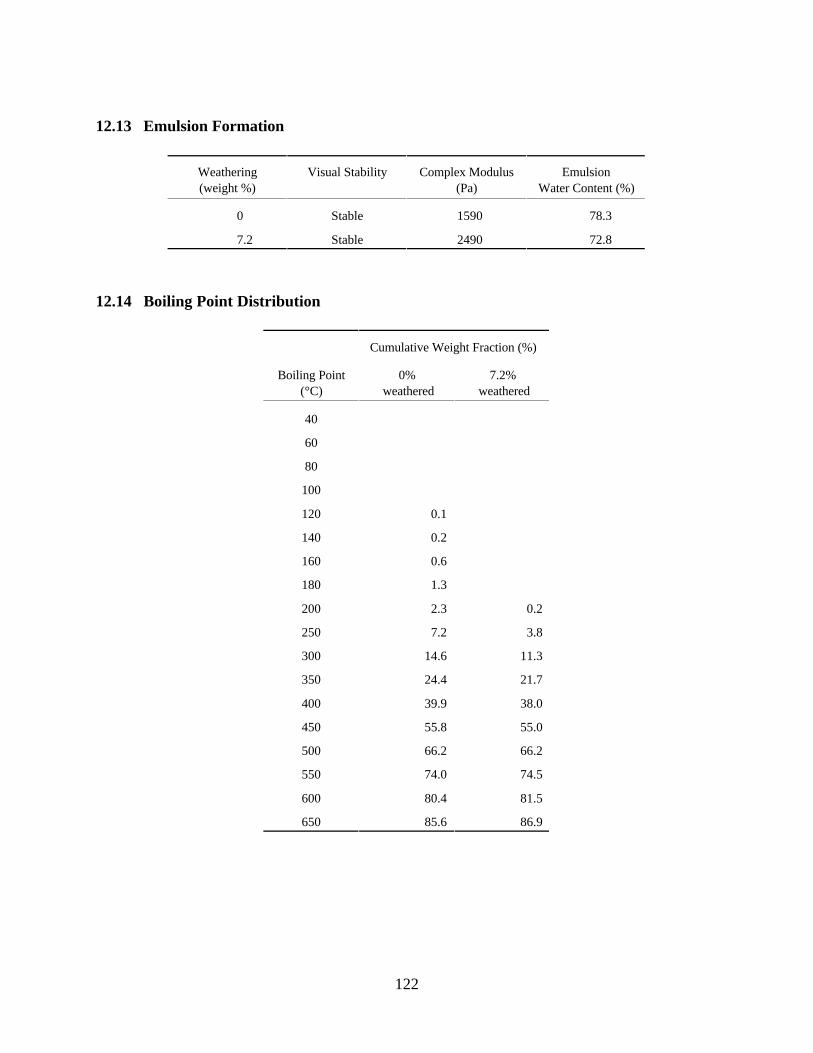
12.13 Emulsion Formation
Weathering Complex Modulus Emulsion
(weight %) (Pa)
0 Stable 1590 78.3
7.2 Stable 2490 72.8
12.14 Boiling Point Distribution
Boiling Point
(°C)
Cumulative Weight Fraction (%)
0%
weathered w
7.2%
eathered
40
60
80
100
120 0.1
140 0.2
160 0.6
180 1.3
200 2.3 0.2
250 7.2 3.8
300 14.6 11.3
350 24.4 21.7
400 39.9 38.0
450 55.8 55.0
500 66.2 66.2
550 74.0 74.5
600 80.4 81.5
650 85.6 86.9
Visual Stability
Water Content (%)
122
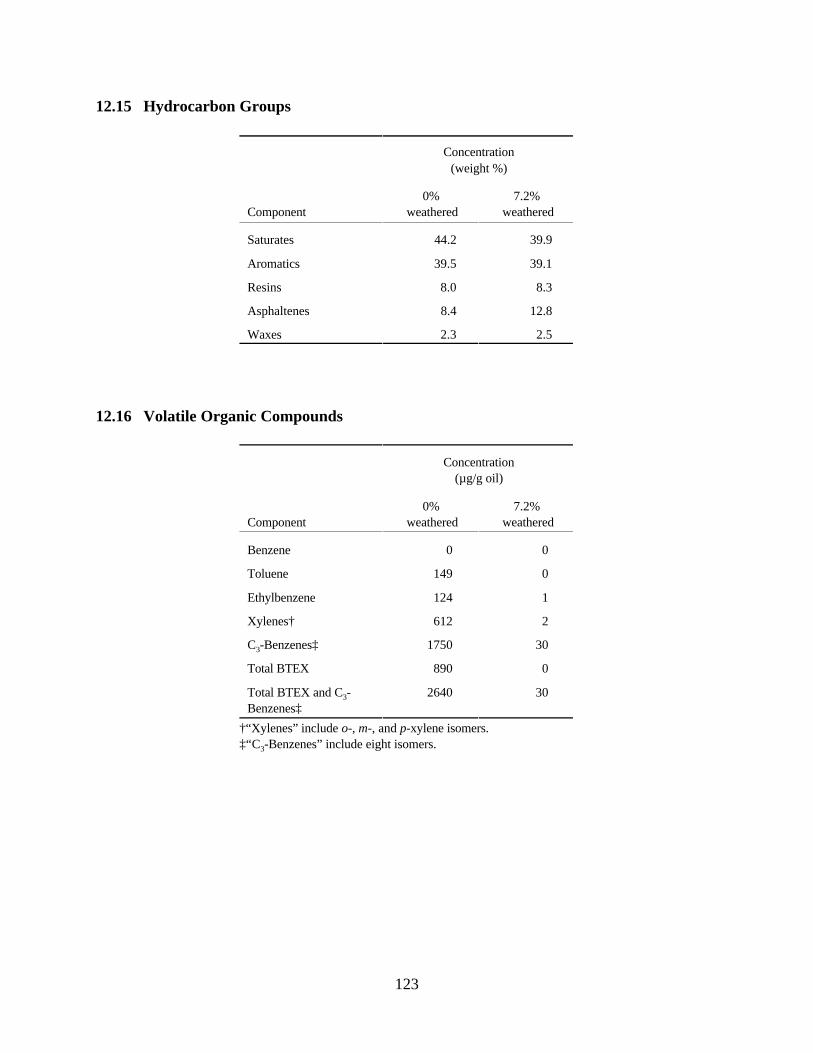
12.15 Hydrocarbon Groups
Concentration
(weight %)
0% 7.2%
Component weathered weathered
Saturates 44.2 39.9
Aromatics 39.5 39.1
Resins 8.0 8.3
Asphaltenes 8.4 12.8
Waxes
12.16 Volatile Organic Compounds
Concentration
(µg/g oil)
0% 7.2%
Component weathered weathered
Benzene 0 0
Toluene 0
Ethylbenzene 1
Xylenes† 2
C3-Benzenes‡ 1750 30
Total BTEX 0
Total BTEX and C3 - 2640 30
Benzenes‡
†“Xylenes” include o-, m-, and p-xylene isomers.
‡“C3-Benzenes” include eight isomers.
2.3 2.5
149
124
612
890
123

12.17 n-Alkane Distribution
Concentration (mg/g oil)
0% 7.2%
n-Alkane Component weathered weathered
n-C8
n-C9 0.34
n-C10 0.54
n-C11 0.74 0.1
n-C12 1.01 0.49
n-C13 1.35 1.08
n-C14 1.71 1.60
n-C15 1.89 2.11
n-C16 2.22 2.53
n-C17 2.03 2.38
Pristane 1.11 1.27
n-C18 1.79 2.10
Phytane 0.76 0.88
n-C19 1.70 1.90
n-C20 1.55 1.90
n-C21 1.70 2.00
n-C22 1.85 2.23
n-C23 2.25 2.73
n-C24 2.46 2.98
n-C25 2.47 3.03
n-C26 2.08 2.55
n-C27 1.77 2.20
n-C28 1.34 1.66
n-C29 1.01 1.26
n-C30 0.58 0.70
n-C31 0.37 0.48
n-C32 0.21 0.26
n-C33 0.14 0.17
n-C34 0.11 0.12
n-C35 0.07 0.09
n-C36 0.06 0.07
n-C37 0.04 0.06
n-C38 0.02 0.03
n-C39 0.01 0.02
n-C40 0.02
n-C41
TOTAL 37.3 41
C17/PRISTANE 1.83 1.87
C18/PHYTANE 2.35 2.39
PRISTANE/PHYTANE 1.45 1.45
CPI 1.02 1.02
124
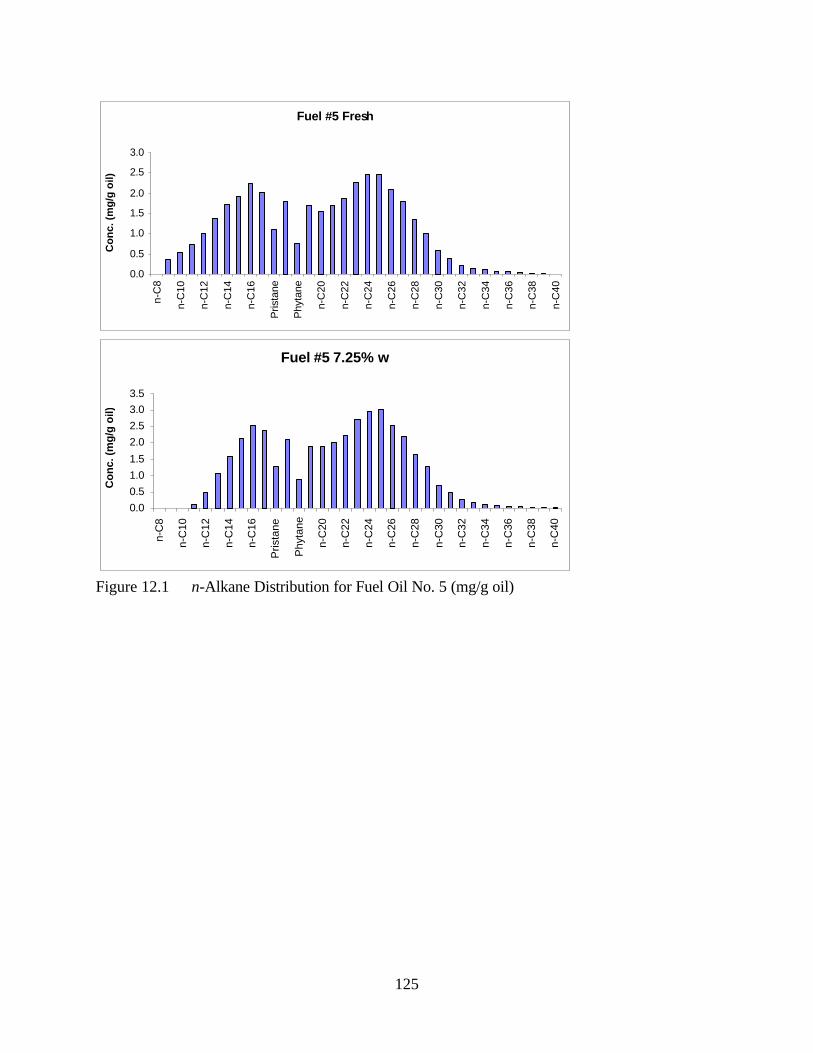
Co
nc. (m
g/g
oil)
3.0 n
-C8
2.5 n-C
10
2.0 n-C
12
1.5
n-C
14
1.0
n-C
16
0.5
0.0 P
rista
ne
Phyta
ne
n-C
20
n-C
22
n-C
24
n-C
26
n-C
28
n-C
30
n-C
32
n-C
34
n-C
36
n-C
38
n-C
40
Co
nc. (m
g/g
oil)
n-C
8
n-C
10
n-C
12
n-C
14
n-C
16
Pri
sta
ne
Ph
yta
ne
n-C
20
n-C
22
n-C
24
n-C
26
3.5
3.0 n-C
28
2.5
n-C
30
2.0
1.5 n-C
32
1.0 n-C
34
0.5
0.0 n-C
36
n-C
38
n-C
40
Fuel #5 Fresh
Fuel #5 7.25% w
Figure 12.1 n-Alkane Distribution for Fuel Oil No. 5 (mg/g oil)
125
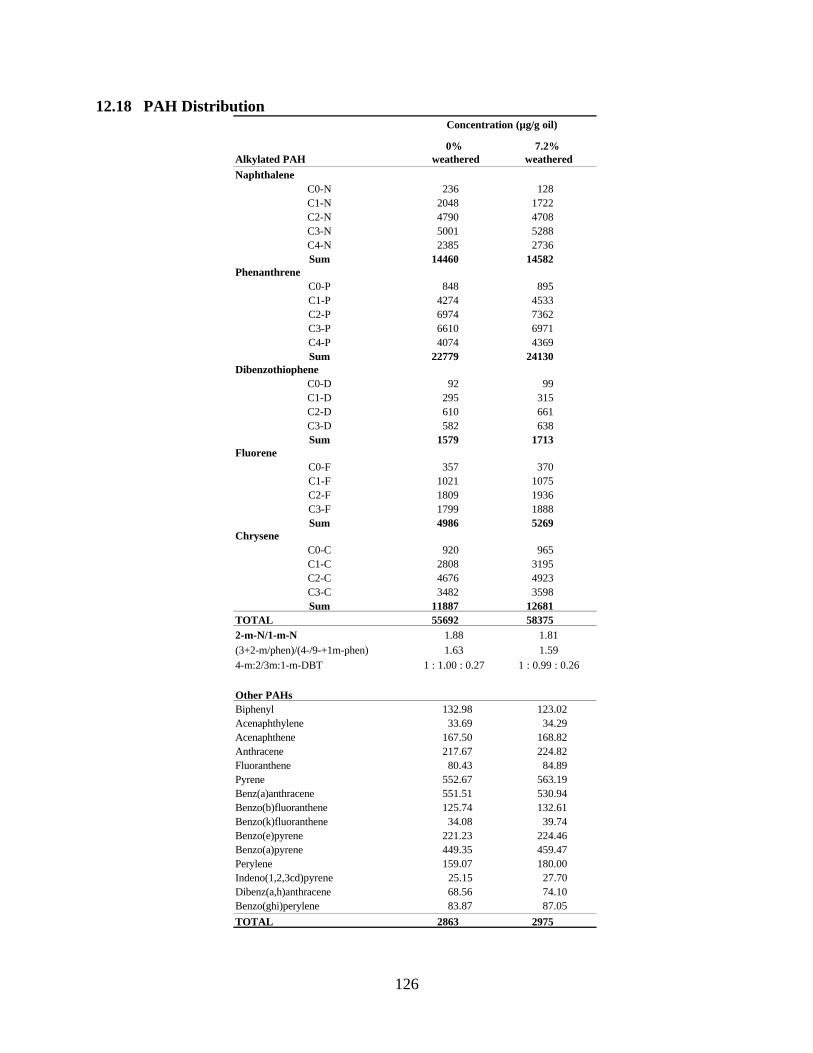
12.18 PAH Distribution Concentration (µg/g oil)
0% 7.2%
Alkylated PAH weathered weathered
Naphthalene
C0-N 236 128
C1-N 2048 1722
C2-N 4790 4708
C3-N 5001 5288
C4-N 2385 2736
Sum 14460 14582
Phenanthrene
C0-P 848 895
C1-P 4274 4533
C2-P 6974 7362
C3-P 6610 6971
C4-P 4074 4369
Sum 22779 24130
Dibenzothiophene
C0-D 92 99
C1-D 295 315
C2-D 610 661
C3-D 582 638
Sum 1579 1713
Fluorene
C0-F 357 370
C1-F 1021 1075
C2-F 1809 1936
C3-F 1799 1888
Sum 4986 5269
Chrysene
C0-C 920 965
C1-C 2808 3195
C2-C 4676 4923
C3-C 3482 3598
Sum 11887 12681
TOTAL 55692 58375
2-m-N/1-m-N 1.88 1.81
(3+2-m/phen)/(4-/9-+1m-phen) 1.63 1.59
4-m:2/3m:1-m-DBT 1 : 0.99 : 0.26
Other PAHs
Biphenyl 132.98 123.02
Acenaphthylene 33.69 34.29
Acenaphthene 167.50 168.82
Anthracene 217.67 224.82
Fluoranthene 80.43 84.89
Pyrene 552.67 563.19
Benz(a)anthracene 551.51 530.94
Benzo(b)fluoranthene 125.74 132.61
Benzo(k)fluoranthene 34.08 39.74
Benzo(e)pyrene 221.23 224.46
Benzo(a)pyrene 449.35 459.47
Perylene 159.07 180.00
25.15 27.70
Dibenz(a,h)anthracene 68.56 74.10
Benzo(ghi)perylene 83.87 87.05
TOTAL 2863 2975
1 : 1.00 : 0.27
Indeno(1,2,3cd)pyrene
126
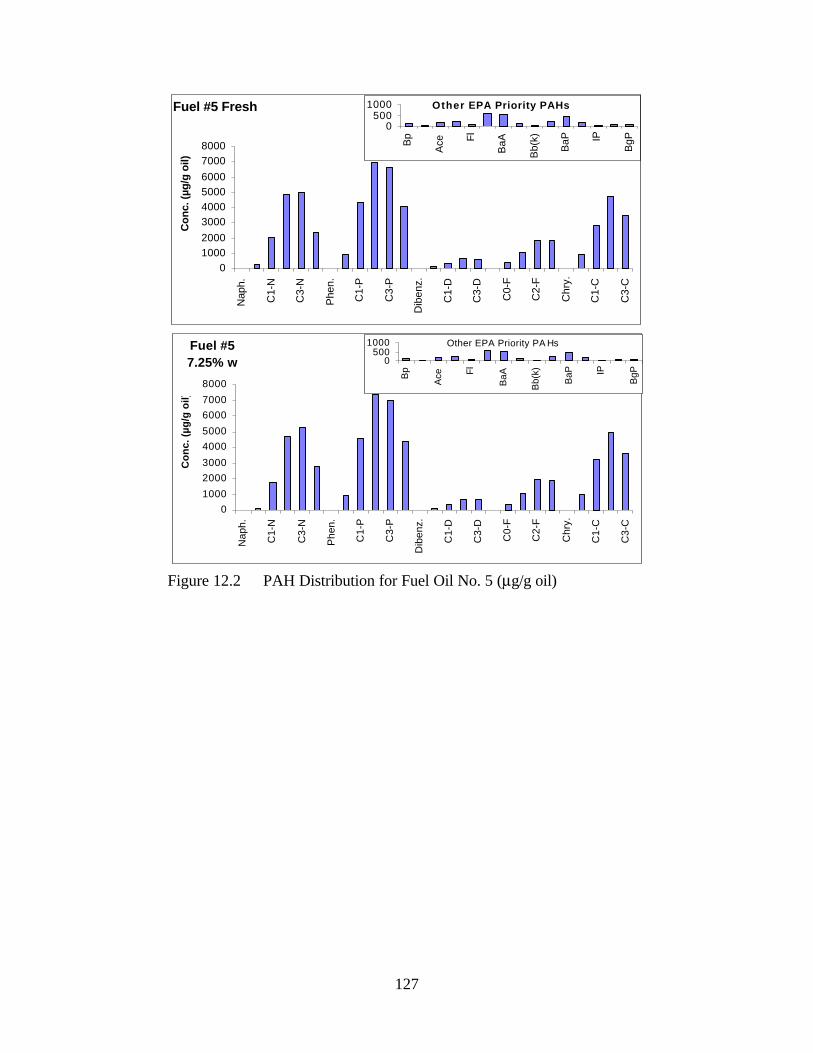
Fuel #5
7.25% w
0
1000
2000
3000
4000
5000
6000
7000
8000
Na
ph
.
C1
-N
C3
-N
Ph
en
.
C1
-P
C3
-P
Dib
en
z.
C1
-D
C3
-D
C0
-F
C2
-F
Ch
ry.
C1
-C
C3
-C
Co
nc
. (µ
g/g
oil
)
Fuel #5 Fresh
0
1000
2000
3000
4000
5000
6000
7000
8000
Naph.
C1-N
C3-N
Phen.
C1-P
C3-P
Dib
enz.
C1-D
C3-D
C0-F
C2-F
Ch
ry.
C1-C
C3-C
Co
nc. (µ
g/g
oil)
0 500
1000
Bp
Ace Fl
Ba
A
Bb
(k)
Ba
P IP
Bg
P
0 500
1000
Bp
Ace Fl
Ba
A
Bb
(k)
Ba
P IP
Bg
P
Other EPA Priority PA Hs
Other EPA Priority PAHs
Figure 12.2 PAH Distribution for Fuel Oil No. 5 (µg/g oil)
127
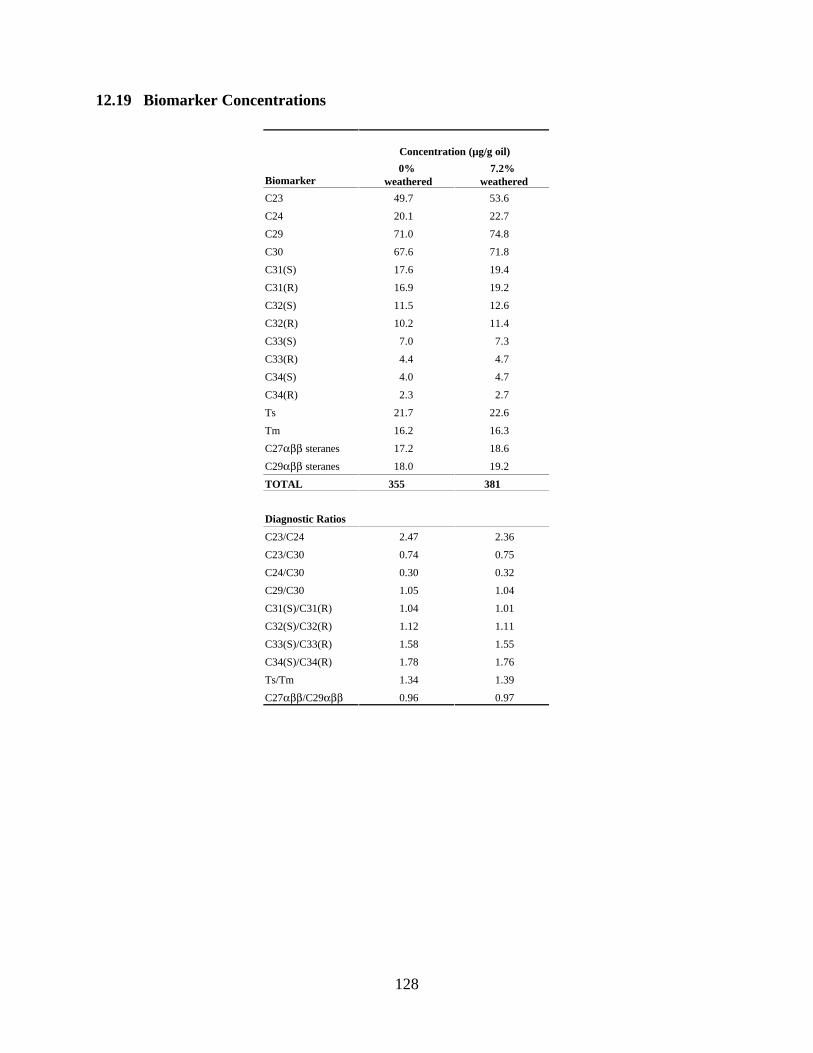
12.19 Biomarker Concentrations
Biomarker
Concentra
0%
weathered
tion (µg/g oil)
7.2%
weathered
49.7 53.6
20.1 22.7
71.0 74.8
67.6 71.8
C31(S) 17.6 19.4
C31(R) 16.9 19.2
C32(S) 11.5 12.6
C32(R) 10.2 11.4
C33(S)
C33(R)
C34(S)
C34(R)
21.7 22.6
Tm 16.2 16.3
C27αββ 17.2 18.6
C29αββ steranes 18.0 19.2
TOTAL
Diagnostic Ratios
C23/C24
C23/C30
C24/C30
C29/C30
C31(S)/C31(R)
C32(S)/C32(R)
C33(S)/C33(R)
C34(S)/C34(R)
Ts/Tm
C27αββ/C29αββ
2.47
0.74
0.30
1.05
1.04
1.12
1.58
1.78
1.34
0.96
2.36
0.75
0.32
1.04
1.01
1.11
1.55
1.76
1.39
0.97
C23
C24
C29
C30
7.0 7.3
4.4 4.7
4.0 4.7
2.3 2.7
Ts
steranes
355 381
128
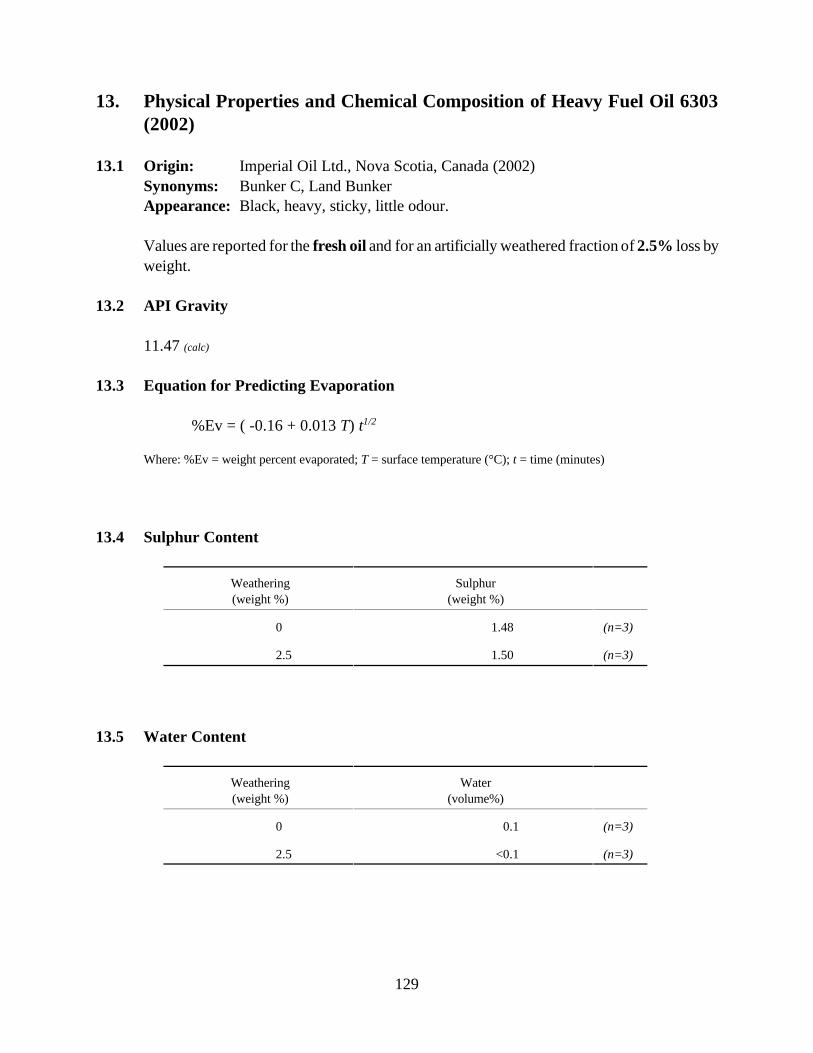
13.
13.1
13.2
13.3
13.4
13.5
Physical Properties and Chemical Composition of Heavy Fuel Oil 6303
(2002)
Origin: Imperial Oil Ltd., Nova Scotia, Canada (2002)
Synonyms: Bunker C, Land Bunker
Appearance: Black, heavy, sticky, little odour.
Values are reported for the fresh oil and for an artificially weathered fraction of 2.5% loss by
weight.
API Gravity
11.47 (calc)
Equation for Predicting Evaporation
%Ev = ( -0.16 + 0.013 T) t1/2
Where: %Ev = weight percent evaporated; T = surface temperature (°C); t = time (minutes)
Sulphur Content
Weathering Sulphur
(weight %) (weight %)
0 1.48 (n=3)
2.5 1.50 (n=3)
Water Content
Weathering Water
(weight %) (volume%)
0 0.1 (n=3)
2.5 <0.1 (n=3)
129
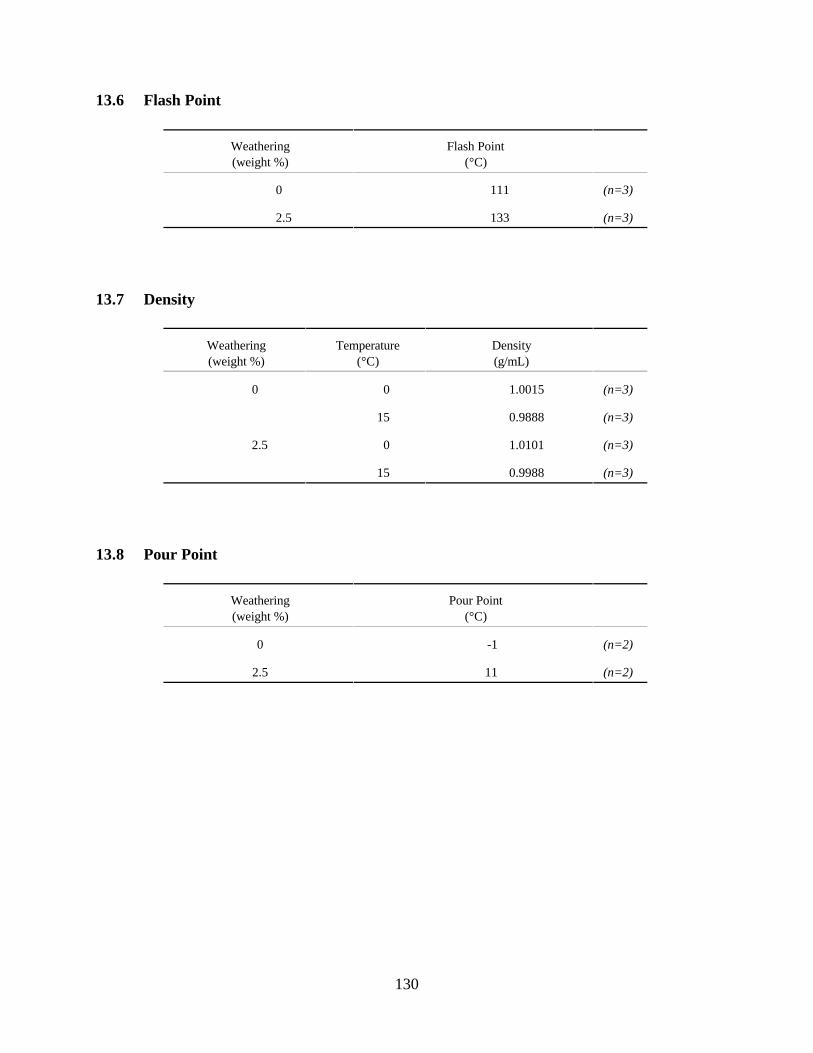
13.6 Flash Point
Weathering
(weight %)
Flash Point
(°C)
0 111 (n=3)
2.5 133 (n=3)
Weathering Temperature Density
(weight %) (°C) (g/mL)
0 0 1.0015 (n=3)
15 0.9888 (n=3)
2.5 0 1.0101 (n=3)
15 0.9988 (n=3)
13.7
Weathering
(weight %)
0 (n=2)
2.5 11 (n=2)
13.8 Pour Point
Density
Pour Point
(°C)
-1
130
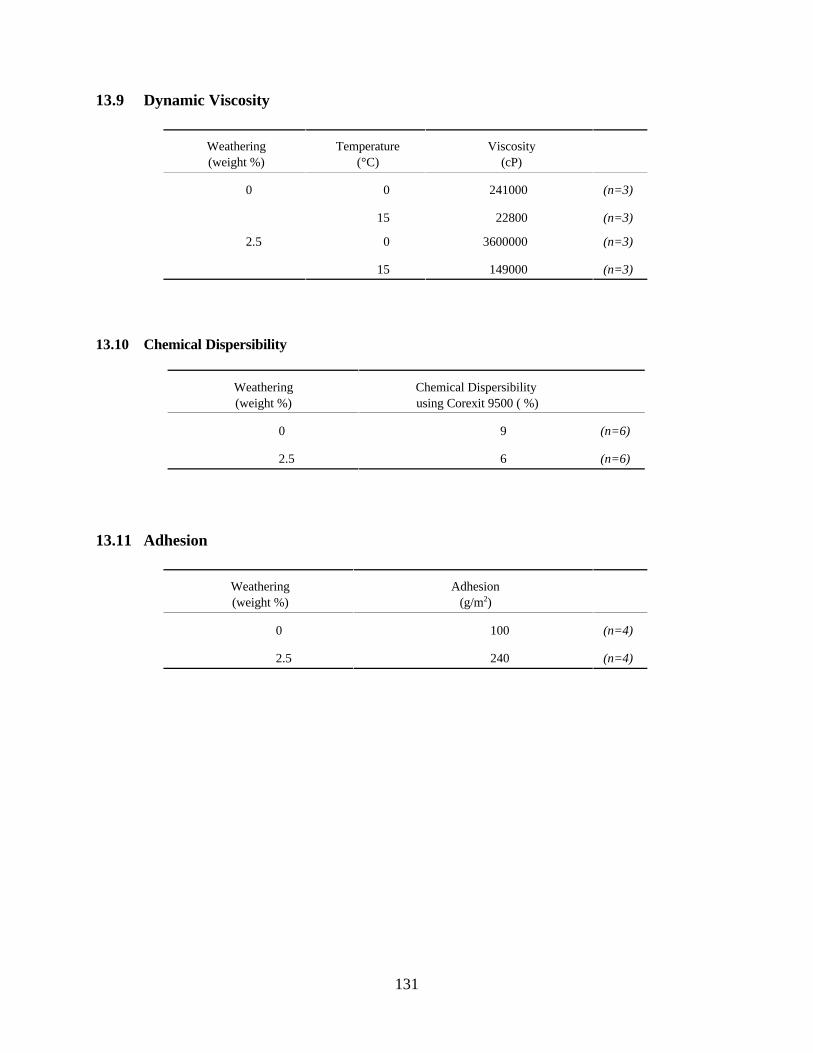
13.9 Dynamic Viscosity
Weathering
(weight %)
Temperature
(°C)
Viscosity
(cP)
0 0 241000 (n=3)
2.5
15
0
22800
3600000
(n=3)
(n=3)
15 149000 (n=3)
13.10 Chemical Dispersibility
Weathering Chemical Dispersibility
(weight %) using Corexit 9500 ( %)
0 9 (n=6)
2.5 6 (n=6)
Weathering Adhesion
(weight %) (g/m2)
0 100 (n=4)
2.5 240 (n=4)
13.11 Adhesion
131
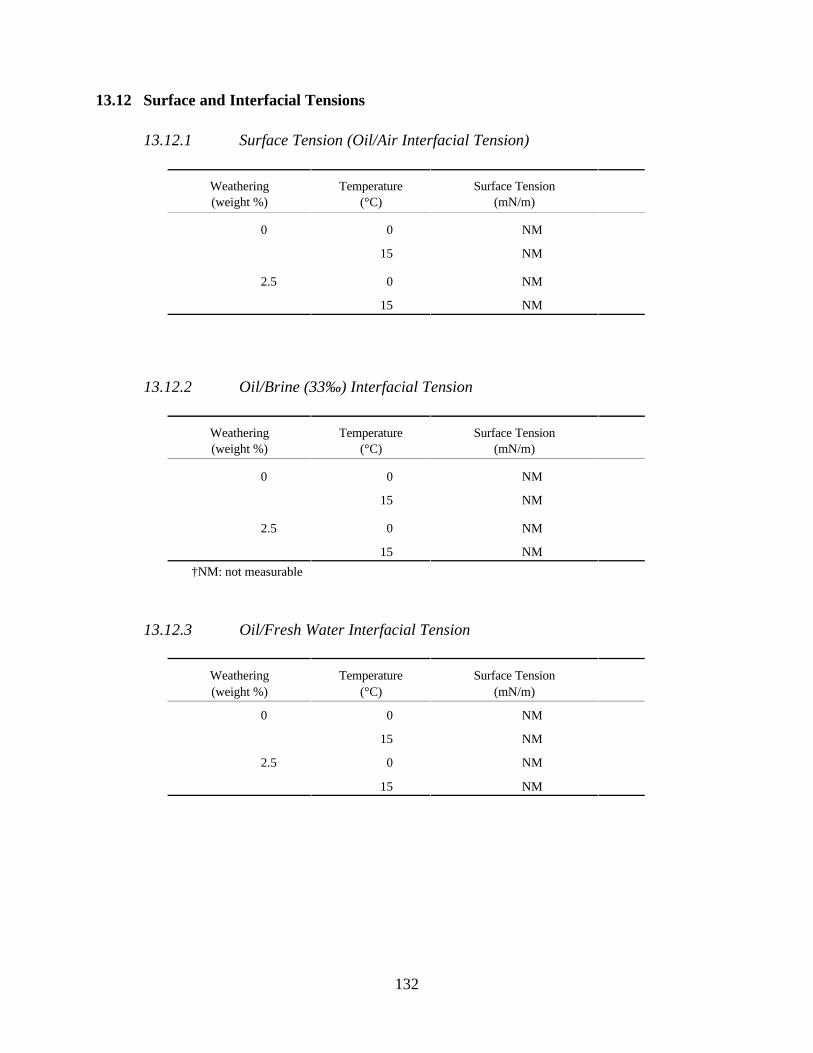
13.12 Surface and Interfacial Tensions
13.12.1
Weathering Temperature Surface Tension
(weight %) (°C) (mN/m)
0 0
15
2.5 0
15
13.12.2
Weathering Temperature Surface Tension
(weight %) (°C) (mN/m)
0 0
15
2.5 0
15
†NM: not measurable
13.12.3 Oil/Fresh Water Interfacial Tension
Weathering Temperature Surface Tension
(weight %) (°C) (mN/m)
0 0
15
2.5 0
15
Surface Tension (Oil/Air Interfacial Tension)
NM
NM
NM
NM
Oil/Brine (33‰) Interfacial Tension
NM
NM
NM
NM
NM
NM
NM
NM
132
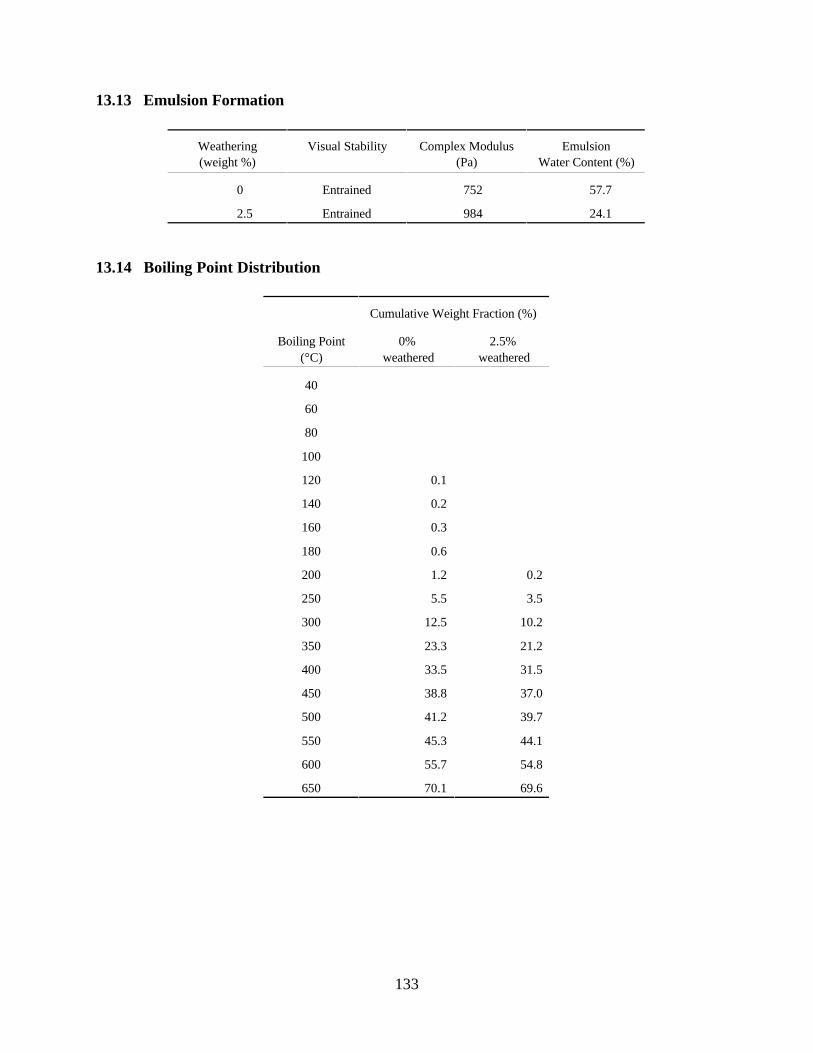
13.13 Emulsion Formation
Weathering Complex Modulus Emulsion
(weight %) (Pa)
0 Entrained 752 57.7
2.5 Entrained 984 24.1
13.14 Boiling Point Distribution
Boiling Point
(°C)
Cumulative Weight Fraction (%)
0%
weathered w
2.5%
eathered
40
60
80
100
120 0.1
140 0.2
160 0.3
180 0.6
200 1.2 0.2
250 5.5 3.5
300 12.5 10.2
350 23.3 21.2
400 33.5 31.5
450 38.8 37.0
500 41.2 39.7
550 45.3 44.1
600 55.7 54.8
650 70.1 69.6
Visual Stability
Water Content (%)
133

13.15 Hydrocarbon Groups
Concentration
(weight %)
0% 2.5%
Component weathered weathered
Saturates 42.5 38.8
Aromatics 29.0 26.9
Resins 15.5 16.6
Asphaltenes 13.0 17.7
Waxes
13.16 Volatile Organic Compounds
Concentration
(µg/g oil)
0% 2.5%
Component weathered weathered
Benzene 0
Toluene 0
Ethylbenzene 0
Xylenes† 0
C3-Benzenes‡
Total BTEX 0
Total BTEX and C3 - 1570 50
Benzenes‡
†“Xylenes” include o-, m-, and p-xylene isomers.
‡“C3-Benzenes” include eight isomers.
2.5 2.7
40
136
58
396
940 50
630
134
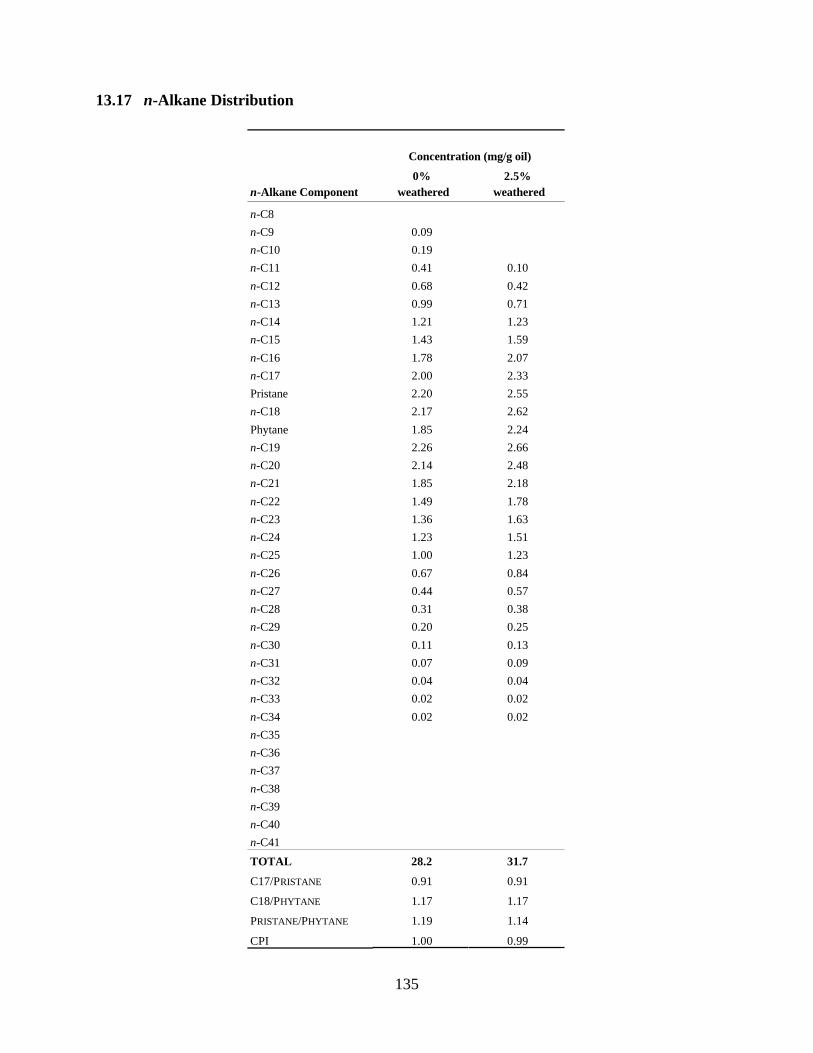
13.17 n-Alkane Distribution
Concentration (mg/g oil)
0% 2.5%
n-Alkane Component weathered weathered
n-C8
n-C9 0.09
n-C10 0.19
n-C11 0.41 0.10
n-C12 0.68 0.42
n-C13 0.99 0.71
n-C14 1.21 1.23
n-C15 1.43 1.59
n-C16 1.78 2.07
n-C17 2.00 2.33
Pristane 2.20 2.55
n-C18 2.17 2.62
Phytane 1.85 2.24
n-C19 2.26 2.66
n-C20 2.14 2.48
n-C21 1.85 2.18
n-C22 1.49 1.78
n-C23 1.36 1.63
n-C24 1.23 1.51
n-C25 1.00 1.23
n-C26 0.67 0.84
n-C27 0.44 0.57
n-C28 0.31 0.38
n-C29 0.20 0.25
n-C30 0.11 0.13
n-C31 0.07 0.09
n-C32 0.04 0.04
n-C33 0.02 0.02
n-C34 0.02 0.02
n-C35
n-C36
n-C37
n-C38
n-C39
n-C40
n-C41
TOTAL 28.2 31.7
C17/PRISTANE 0.91 0.91
C18/PHYTANE 1.17 1.17
PRISTANE/PHYTANE 1.19 1.14
CPI 1.00 0.99
135
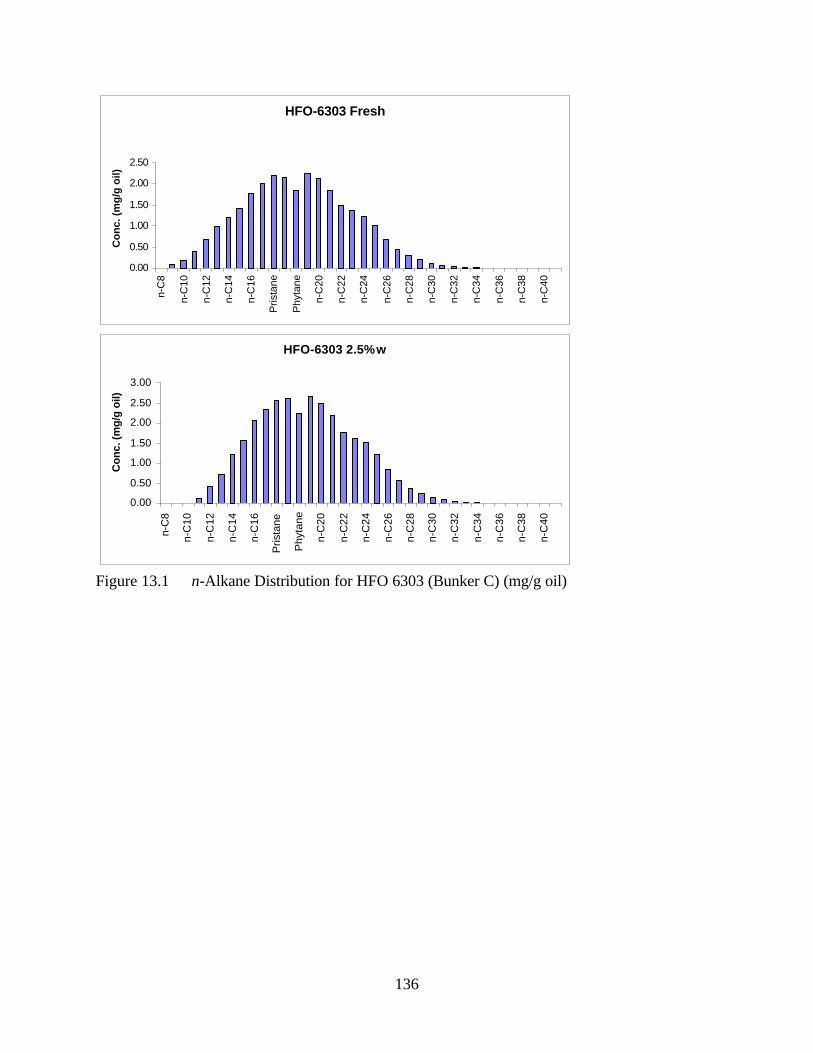
HFO-6303 Fresh C
on
c.
(mg
/g o
il)
n-C
8
2.50
2.00 n-C
10
1.50 n-C
12
1.00 n-C
14
0.50 n-C
16 0.00
Prista
ne
Phyta
ne
n-C
20
n-C
22
n-C
24
n-C
26
n-C
28
n-C
30
n-C
32
n-C
34
n-C
36
n-C
38
n-C
40
Co
nc. (m
g/g
oil)
n-C
8
n-C
10
n-C
12
n-C
14
n-C
16
Pri
sta
ne
Ph
yta
ne
n-C
20
n-C
22
n-C
24
3.00 n
-C2
6
2.50 n
-C2
8
2.00 n
-C3
0
1.50 n
-C3
2
1.00
n-C
34
0.50
n-C
36
0.00
n-C
38
n-C
40
HFO-6303 2.5% w
Figure 13.1 n-Alkane Distribution for HFO 6303 (Bunker C) (mg/g oil)
136
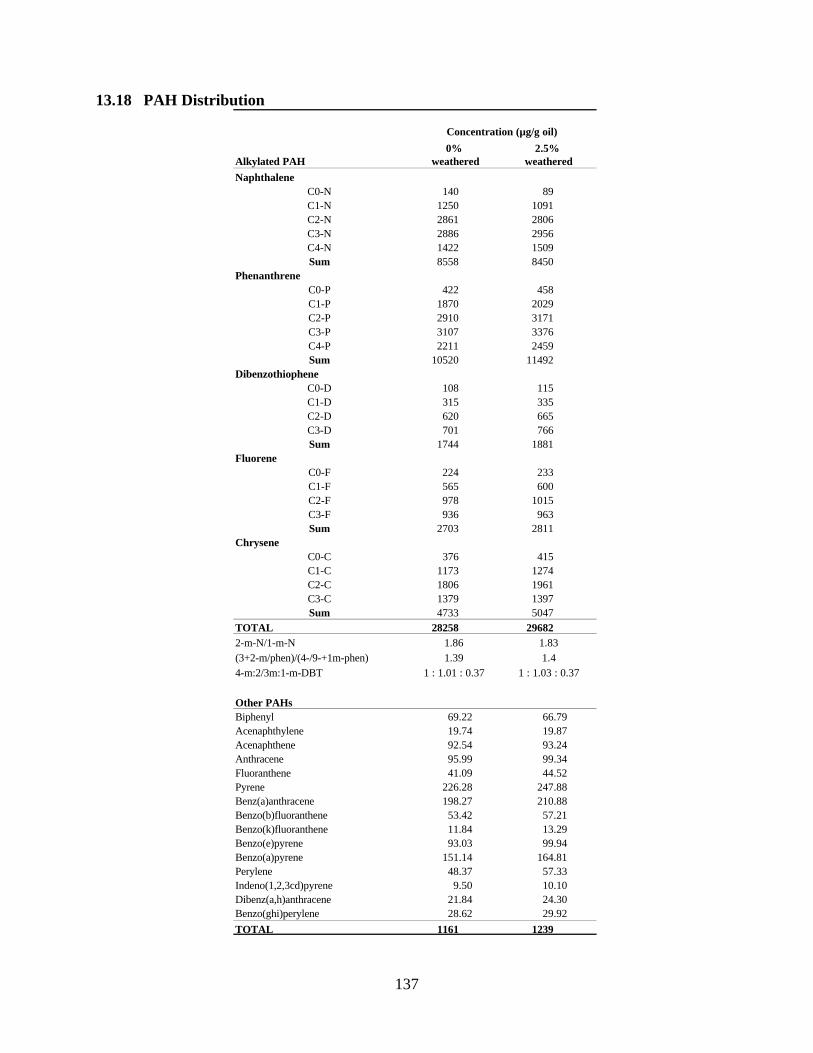
13.18 PAH Distribution
Alkylated PAH
Concentrati
0%
weathered
on (µg/g oil)
2.5%
weathered
Naphthalene
C0-N 140 89
C1-N 1250 1091
C2-N 2861 2806
C3-N 2886 2956
C4-N 1422 1509
Sum 8558 8450
Phenanthrene
C0-P 422 458
C1-P 1870 2029
C2-P 2910 3171
C3-P 3107 3376
C4-P 2211 2459
Sum 10520 11492
Dibenzothiophene
C0-D 108 115
C1-D 315 335
C2-D 620 665
C3-D 701 766
Sum 1744 1881
Fluorene
C0-F 224 233
C1-F 565 600
C2-F 978 1015
C3-F 936 963
Sum 2703 2811
Chrysene
C0-C 376 415
C1-C 1173 1274
C2-C 1806 1961
C3-C 1379 1397
Sum 4733 5047
Other PAHs
TOTAL 28258 29682
2-m-N/1-m-N 1.86 1.83
(3+2-m/phen)/(4-/9-+1m-phen) 1.39
4-m:2/3m:1-m-DBT 1 : 1.03 : 0.37
Biphenyl 69.22 66.79
Acenaphthylene 19.74 19.87
Acenaphthene 92.54 93.24
Anthracene 95.99 99.34
Fluoranthene 41.09 44.52
Pyrene 226.28 247.88
Benz(a)anthracene 198.27 210.88
Benzo(b)fluoranthene 53.42 57.21
Benzo(k)fluoranthene 11.84 13.29
Benzo(e)pyrene 93.03 99.94
Benzo(a)pyrene 151.14 164.81
Perylene 48.37 57.33
Indeno(1,2,3cd)pyrene 9.50 10.10
Dibenz(a,h)anthracene 21.84 24.30
Benzo(ghi)perylene 28.62 29.92
TOTAL 1161 1239
1.4
1 : 1.01 : 0.37
137
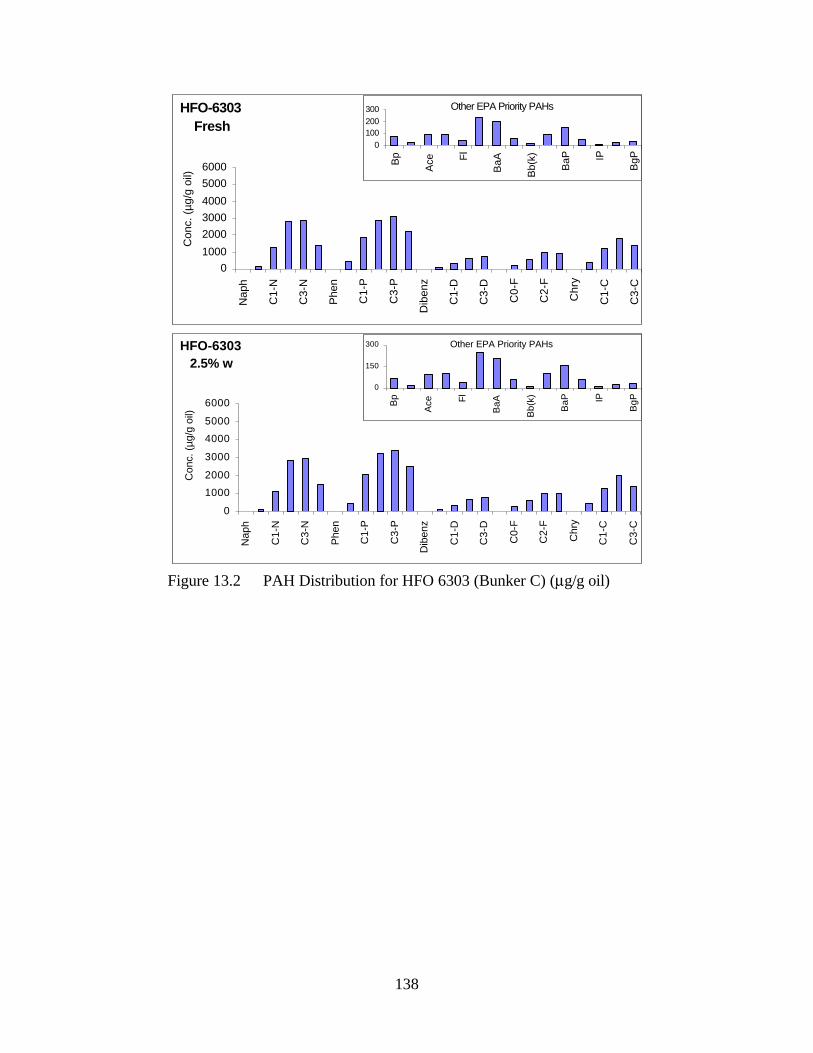
HFO-6303
2.5% w
0
1000
2000
3000
4000
5000
6000
Naph
C1
-N
C3
-N
Phen
C1
-P
C3
-P
Dib
enz
C1
-D
C3
-D
C0
-F
C2
-F
Chry
C1
-C
C3
-C
Conc. (µ
g/g
oil)
HFO-6303
Fresh
0
1000
2000
3000
4000
5000
6000
Naph
C1
-N
C3
-N
Phen
C1
-P
C3
-P
Dib
enz
C1
-D
C3
-D
C0
-F
C2
-F
Ch
ry
C1
-C
C3
-C
Co
nc.
(µg
/g o
il)
Other EPA Priority PAHs
0
100
200
300
Bp
Ace Fl
Ba
A
Bb(k
)
Ba
P IP
Bg
P
Other EPA Priority PAHs
0
150
300
Bp
Ace Fl
Ba
A
Bb
(k)
Ba
P IP
Bg
P
Figure 13.2 PAH Distribution for HFO 6303 (Bunker C) (µg/g oil)
138
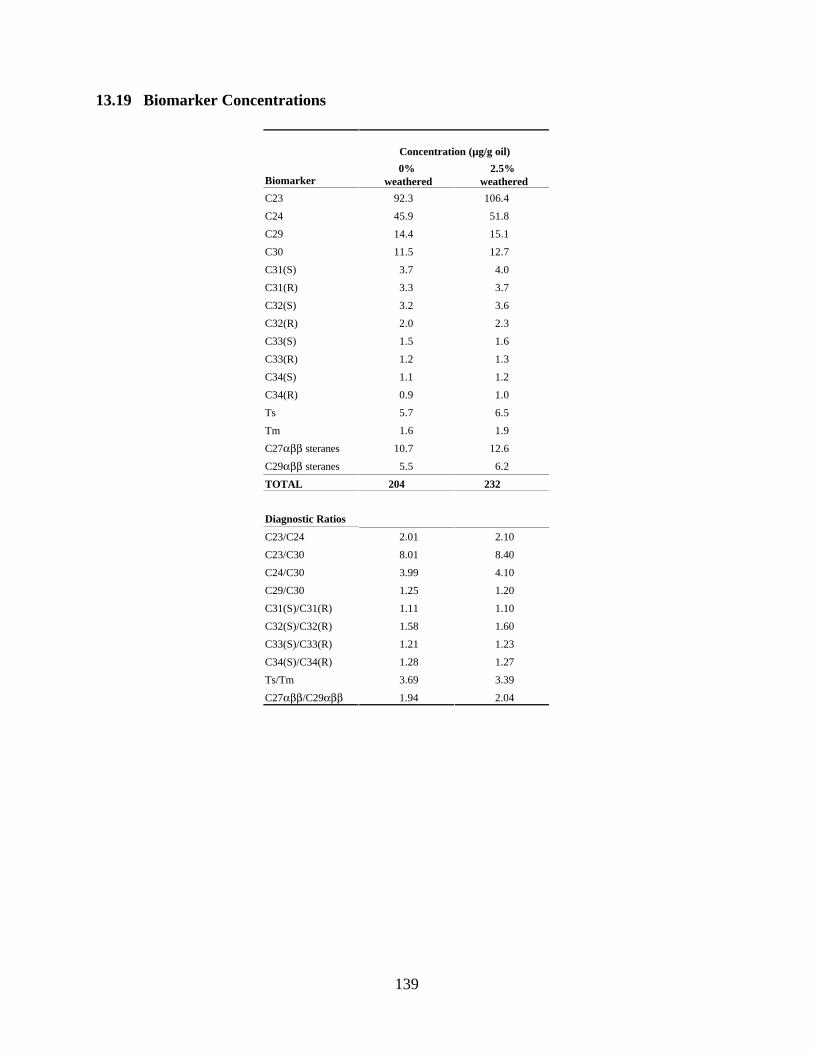
13.19 Biomarker Concentrations
Biomarker
Concentra
0%
weathered
tion (µg/g oil)
2.5%
weathered
92.3 106.4
45.9 51.8
14.4 15.1
11.5 12.7
C31(S)
C31(R)
C32(S)
C32(R)
C33(S)
C33(R)
C34(S)
C34(R)
5.7 6.5
Tm 1.6 1.9
C27αββ 10.7 12.6
C29αββ steranes
TOTAL
Diagnostic Ratios
C23/C24 2.01 2.10
C23/C30 8.01 8.40
C24/C30 3.99 4.10
C29/C30 1.25 1.20
C31(S)/C31(R) 1.11 1.10
C32(S)/C32(R) 1.58 1.60
C33(S)/C33(R) 1.21 1.23
C34(S)/C34(R) 1.28 1.27
Ts/Tm 3.69 3.39
C27αββ/C29αββ 1.94 2.04
C23
C24
C29
C30
3.7 4.0
3.3 3.7
3.2 3.6
2.0 2.3
1.5 1.6
1.2 1.3
1.1 1.2
0.9 1.0
Ts
steranes
5.5 6.2
204 232
139
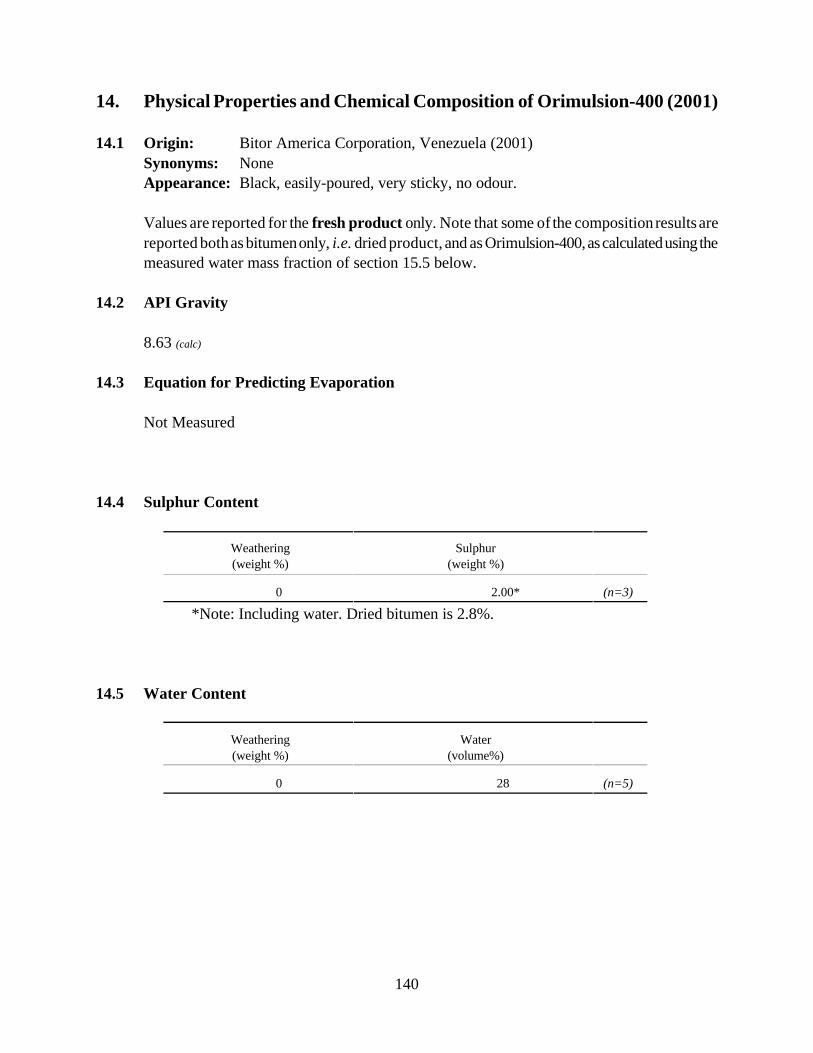
14. Physical Properties and Chemical Composition of Orimulsion-400 (2001)
14.1 Origin: Bitor America Corporation, Venezuela (2001)
Synonyms: None
Appearance: Black, easily-poured, very sticky, no odour.
Values are reported for the fresh product only. Note that some of the composition results are
reported both as bitumen only, i.e. dried product, and as Orimulsion-400, as calculated using the
measured water mass fraction of section 15.5 below.
14.2 API Gravity
8.63 (calc)
14.3 Equation for Predicting Evaporation
Not Measured
14.4 Sulphur Content
Weathering Sulphur
(weight %) (weight %)
0 2.00* (n=3)
*Note: Including water. Dried bitumen is 2.8%.
14.5
Weathering Water
(weight %) (volume%)
0 (n=5)
Water Content
28
140
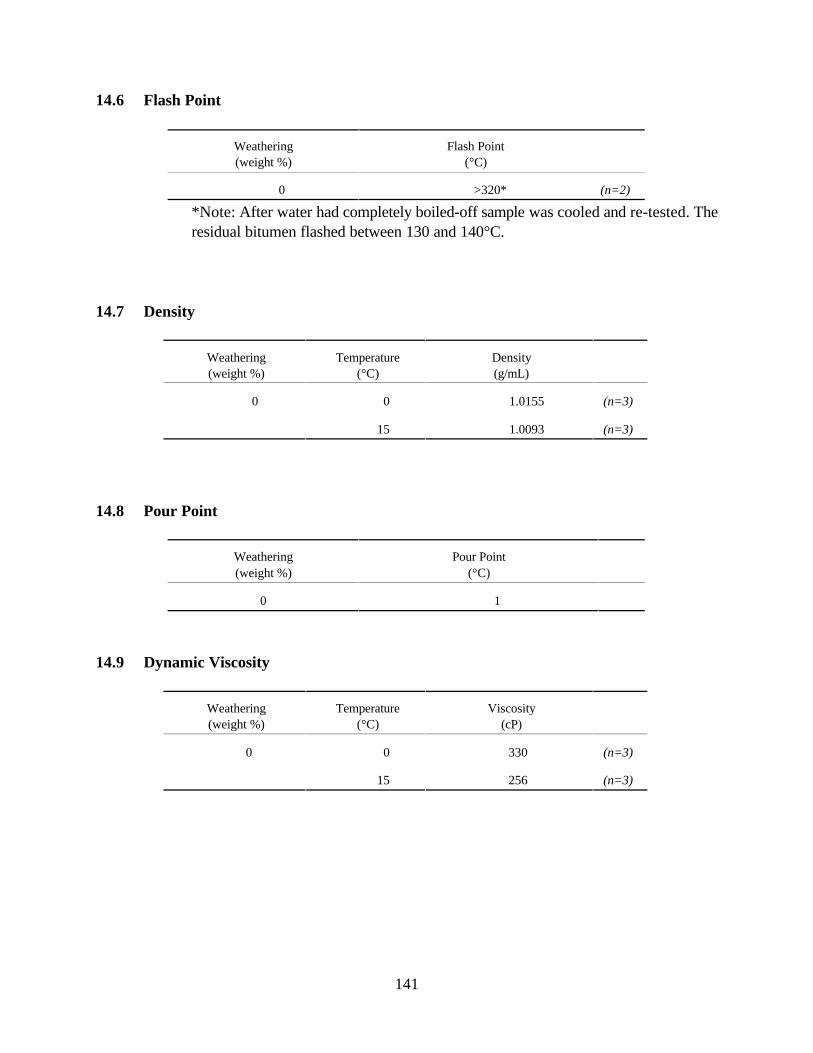
14.6 Flash Point
Weathering Flash Point
(weight %) (°C)
0 >320* (n=2)
residual bitumen flashed between 130 and 140°C.
14.7
Weathering Temperature Density
(weight %) (°C) (g/mL)
14.8 Pour Point
Weathering
(weight %)
Pour Point
(°C)
0 1
0 0 1.0155 (n=3)
15 1.0093 (n=3)
14.9 Dynamic Viscosity
Weathering Temperature Viscosity
(weight %)
0 0 330 (n=3)
15 256 (n=3)
*Note: After water had completely boiled-off sample was cooled and re-tested. The
Density
(°C) (cP)
141
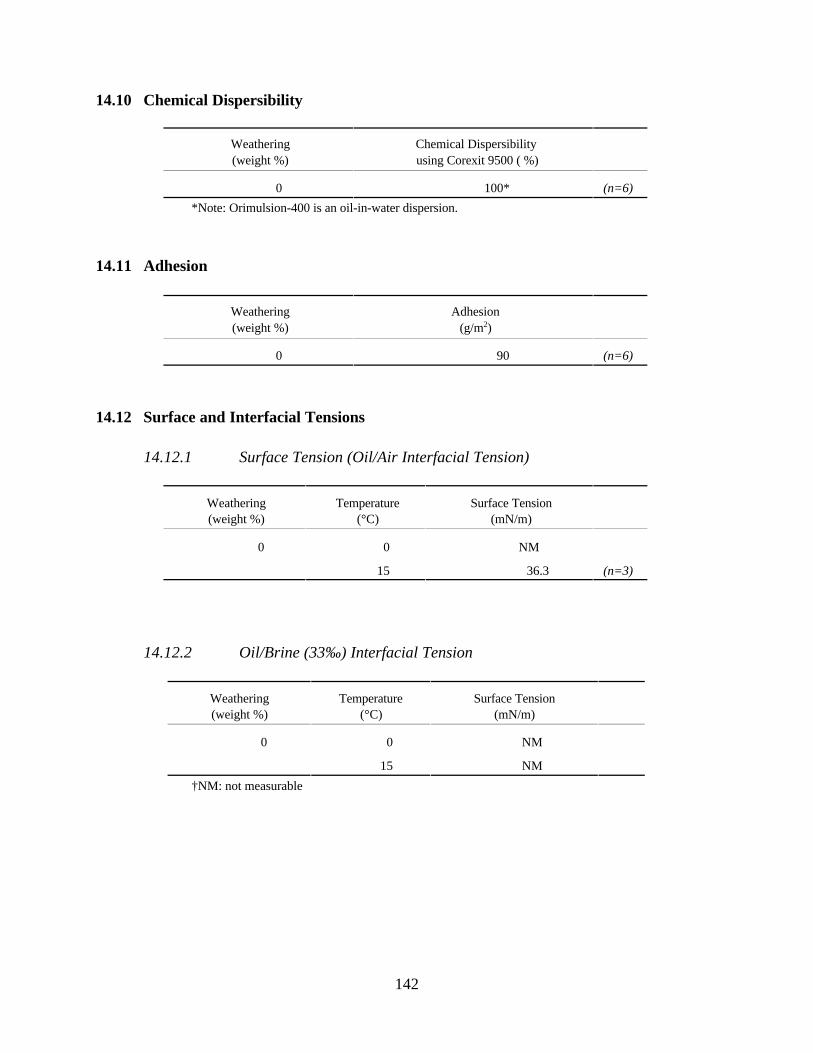
14.10 Chemical Dispersibility
Weathering Chemical Dispersibility
(weight %) using Corexit 9500 ( %)
0 100* (n=6)
*Note: Orimulsion-400 is an oil-in-water dispersion.
14.11 Adhesion
Weathering Adhesion
(weight %) (g/m2)
0 (n=6)
14.12
14.12.1
Weathering Temperature Surface Tension
(weight %) (°C) (mN/m)
0 0
15 36.3 (n=3)
14.12.2
Weathering Temperature Surface Tension
(weight %) (mN/m)
0 0
15
†NM: not measurable
90
Surface and Interfacial Tensions
Surface Tension (Oil/Air Interfacial Tension)
NM
Oil/Brine (33‰) Interfacial Tension
(°C)
NM
NM
142
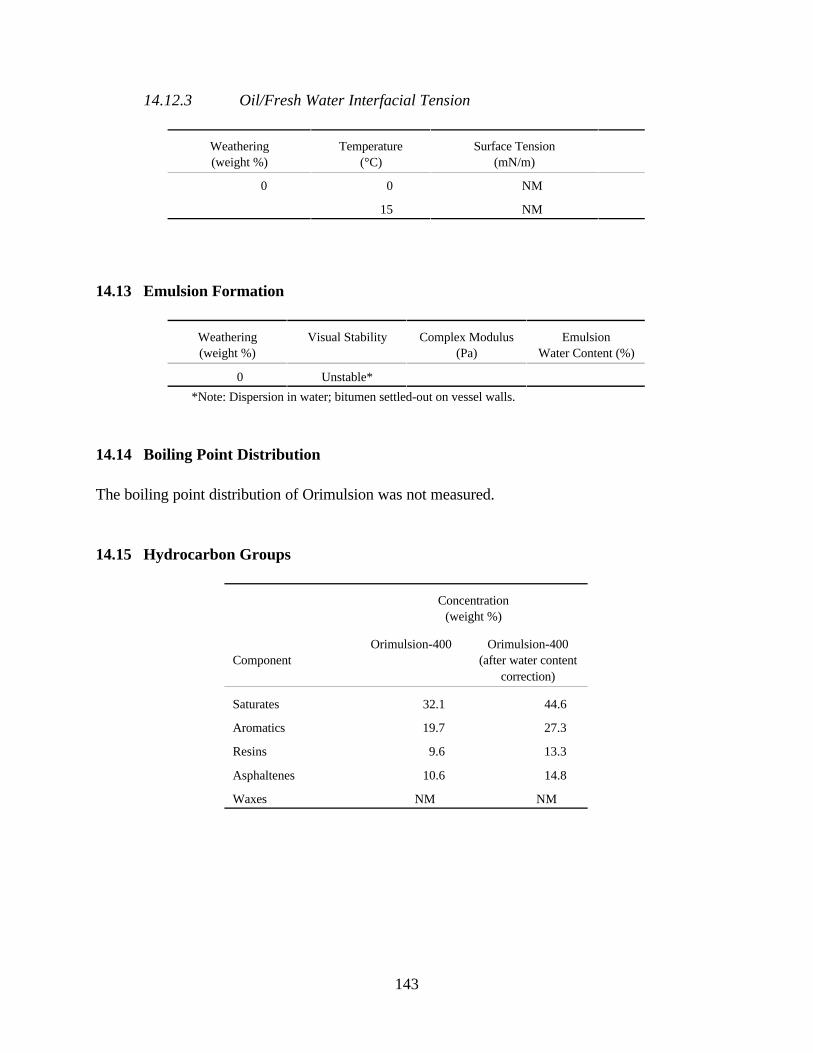
14.12.3 Oil/Fresh Water Interfacial Tension
Weathering Temperature Surface Tension
(weight %) (°C) (mN/m)
0 0
15
14.13
Weathering Complex Modulus Emulsion
(weight %) (Pa)
0 Unstable*
*Note: Dispersion in water; bitumen settled-out on vessel walls.
14.14 Boiling Point Distribution
The boiling point distribution of Orimulsion was not measured.
14.15 Hydrocarbon Groups
Concentration
(weight %)
Orimulsion-400 Orimulsion-400
Component (after water content
correction)
Saturates 32.1 44.6
Aromatics 19.7 27.3
Resins 9.6 13.3
Asphaltenes 10.6 14.8
Waxes
NM
NM
Emulsion Formation
Visual Stability
Water Content (%)
NM NM
143
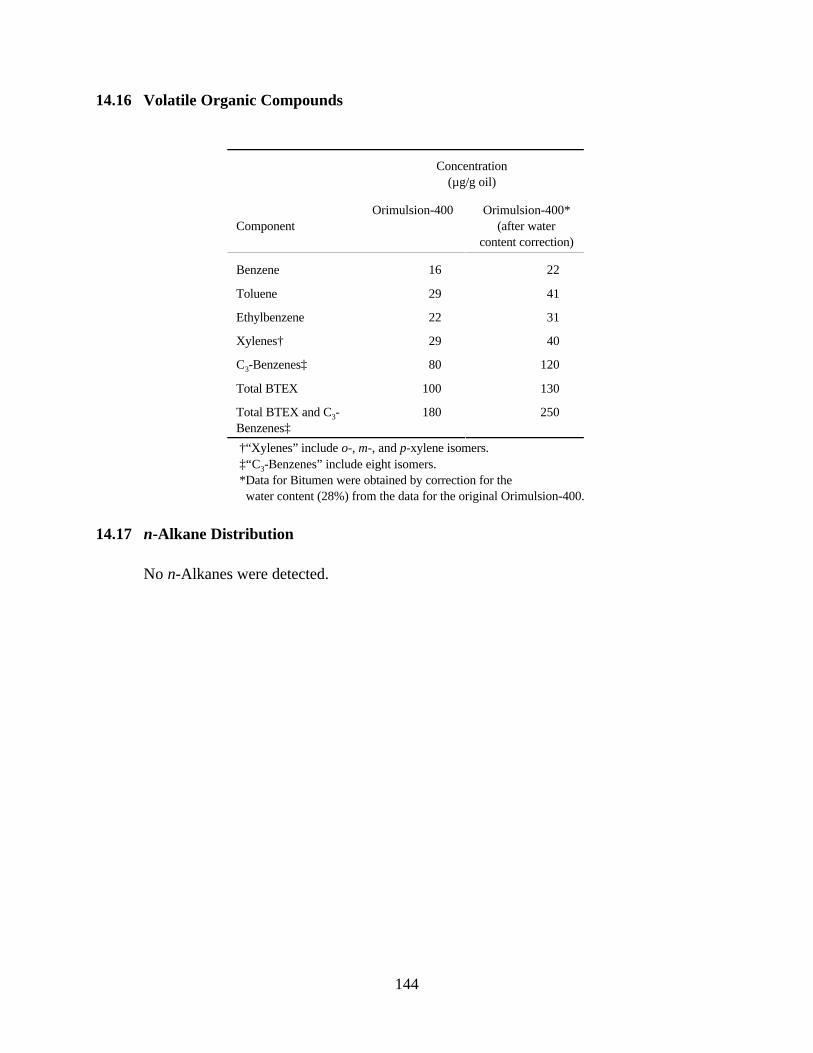
14.16 Volatile Organic Compounds
Concentration
(µg/g oil)
Orimulsion-400 Orimulsion-400*
Component (after water
content correction)
Benzene
Toluene
Ethylbenzene
Xylenes†
C3-Benzenes‡
Total BTEX
Total BTEX and C3 - 180 250
Benzenes‡
16 22
29 41
22 31
29 40
80 120
100 130
†“Xylenes” include o-, m-, and p-xylene isomers.
‡“C3-Benzenes” include eight isomers.
*Data for Bitumen were obtained by correction for the
water content (28%) from the data for the original Orimulsion-400.
14.17 n-Alkane Distribution
No n-Alkanes were detected.
144
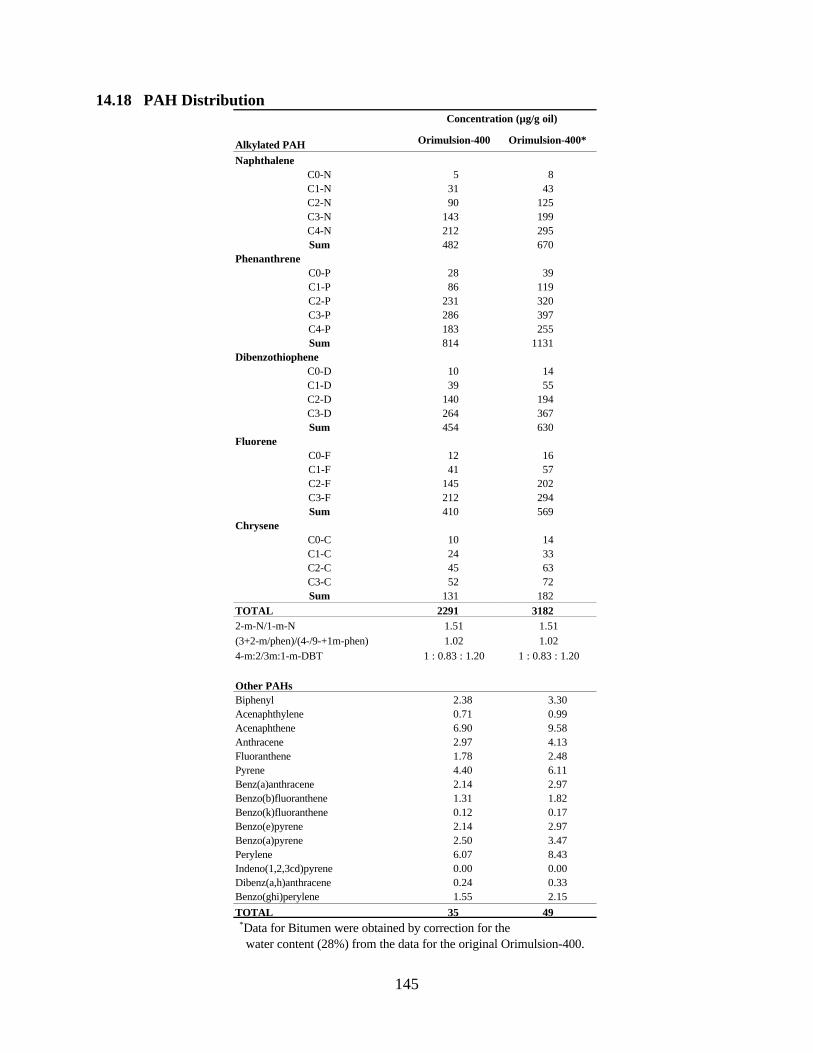
14.18 PAH Distribution Concentration (µg/g oil)
Alkylated PAH Orimulsion-400 Orimulsion-400*
Naphthalene
C0-N 5 8
C1-N 31 43
C2-N 90 125
C3-N 143 199
C4-N 212 295
Sum 482 670
Phenanthrene
C0-P 28 39
C1-P 86 119
C2-P 231 320
C3-P 286 397
C4-P 183 255
Sum 814 1131
Dibenzothiophene
C0-D 10 14
C1-D 39 55
C2-D 140 194
C3-D 264 367
Sum 454 630
Fluorene
C0-F 12 16
C1-F 41 57
C2-F 145 202
C3-F 212 294
Sum 410 569
Chrysene
C0-C 10 14
C1-C 24 33
C2-C 45 63
C3-C 52 72
Sum 131 182
Other PAHs
TOTAL 2291 3182
2-m-N/1-m-N 1.51 1.51
(3+2-m/phen)/(4-/9-+1m-phen) 1.02 1.02
4-m:2/3m:1-m-DBT 1 : 0.83 : 1.20
Biphenyl 2.38 3.30
Acenaphthylene 0.71 0.99
Acenaphthene 6.90 9.58
Anthracene 2.97 4.13
Fluoranthene 1.78 2.48
Pyrene 4.40 6.11
Benz(a)anthracene 2.14 2.97
Benzo(b)fluoranthene 1.31 1.82
Benzo(k)fluoranthene 0.12 0.17
Benzo(e)pyrene 2.14 2.97
Benzo(a)pyrene 2.50 3.47
Perylene 6.07 8.43
Indeno(1,2,3cd)pyrene 0.00 0.00
Dibenz(a,h)anthracene 0.24 0.33
Benzo(ghi)perylene 1.55 2.15
TOTAL
1 : 0.83 : 1.20
35 49 * Data for Bitumen were obtained by correction for the
water content (28%) from the data for the original Orimulsion-400.
145
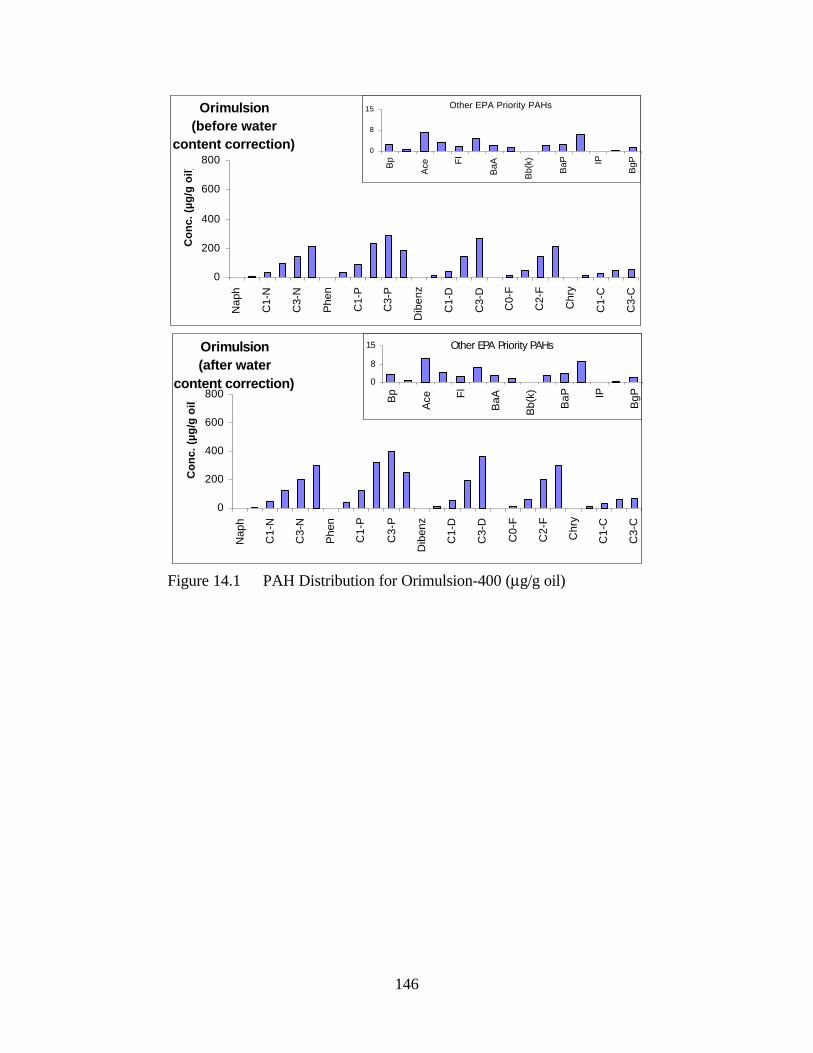
(after water
content correction)
0
200
400
600
800
Naph
C1
-N
C3
-N
Phen
C1
-P
C3
-P
Dib
enz
C1
-D
C3
-D
C0
-F
C2
-F
Ch
ry
C1
-C
C3
-C
Co
nc
. (µ
g/g
oil
)
(before water
content correction)
0
200
400
600
800
Na
ph
C1-N
C3-N
Ph
en
C1-P
C3-P
Dib
en
z
C1-D
C3-D
C0-F
C2-F
Ch
ry
C1-C
C3-C
Co
nc
. (µ
g/g
oil
)
Other EPA Priority PAHs
0
8
15
Bp
Ace F
l
BaA
Bb(k
)
BaP IP
BgP
0
8
15
Bp
Ace Fl
Ba
A
Bb(k
)
Ba
P IP
Bg
P
Orimulsion
Orimulsion
Other EPA Priority PAHs
Figure 14.1 PAH Distribution for Orimulsion-400 (µg/g oil)
146
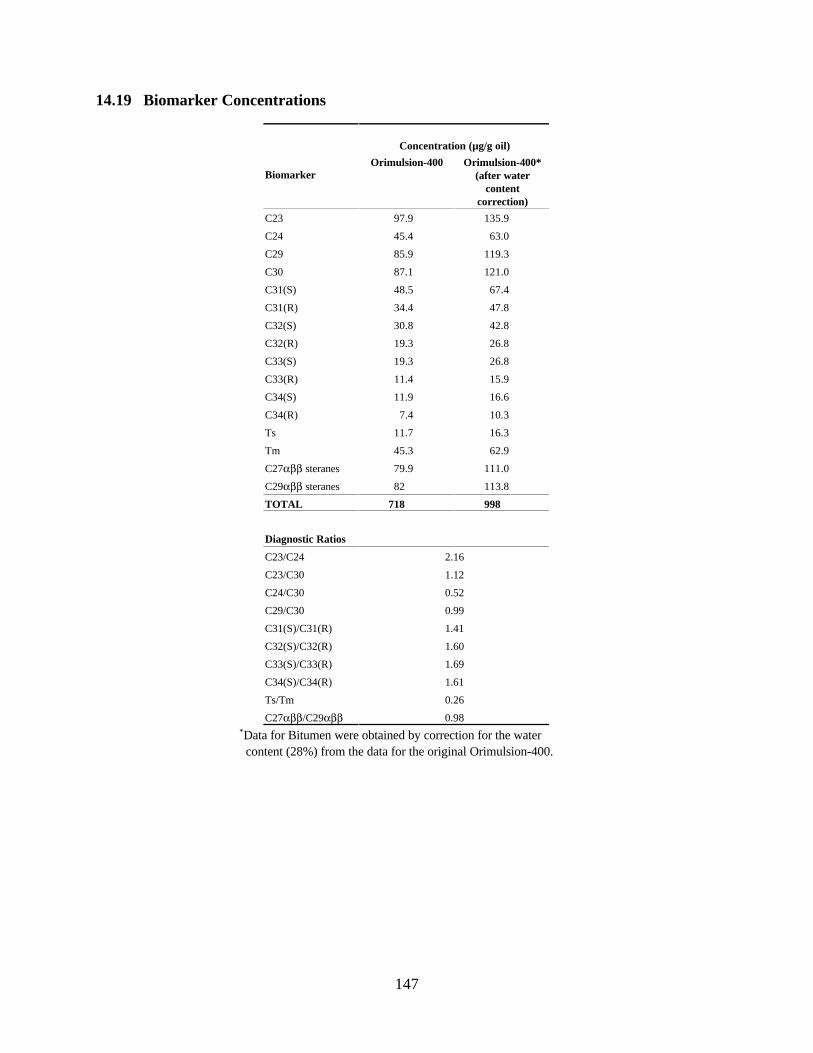
14.19 Biomarker Concentrations
Concentration (µg/g oil)
Orimulsion-400 Orimulsion-400*
Biomarker (after water
content
correction)
97.9 135.9
45.4 63.0
85.9 119.3
87.1 121.0
C31(S) 48.5 67.4
C31(R) 34.4 47.8
C32(S) 30.8 42.8
C32(R) 19.3 26.8
C33(S) 19.3 26.8
C33(R) 11.4 15.9
C34(S) 11.9 16.6
C34(R) 10.3
11.7 16.3
Tm 45.3 62.9
C27αββ 79.9 111.0
C29αββ steranes 113.8
TOTAL
Diagnostic Ratios
C23/C24 2.16
C23/C30 1.12
C24/C30 0.52
C29/C30 0.99
C31(S)/C31(R) 1.41
C32(S)/C32(R) 1.60
C33(S)/C33(R) 1.69
C34(S)/C34(R) 1.61
Ts/Tm 0.26
C27αββ/C29αββ 0.98
* Data for Bitumen were obtained by correction for the water
content (28%) from the data for the original Orimulsion-400.
C23
C24
C29
C30
7.4
Ts
steranes
82
718 998
147
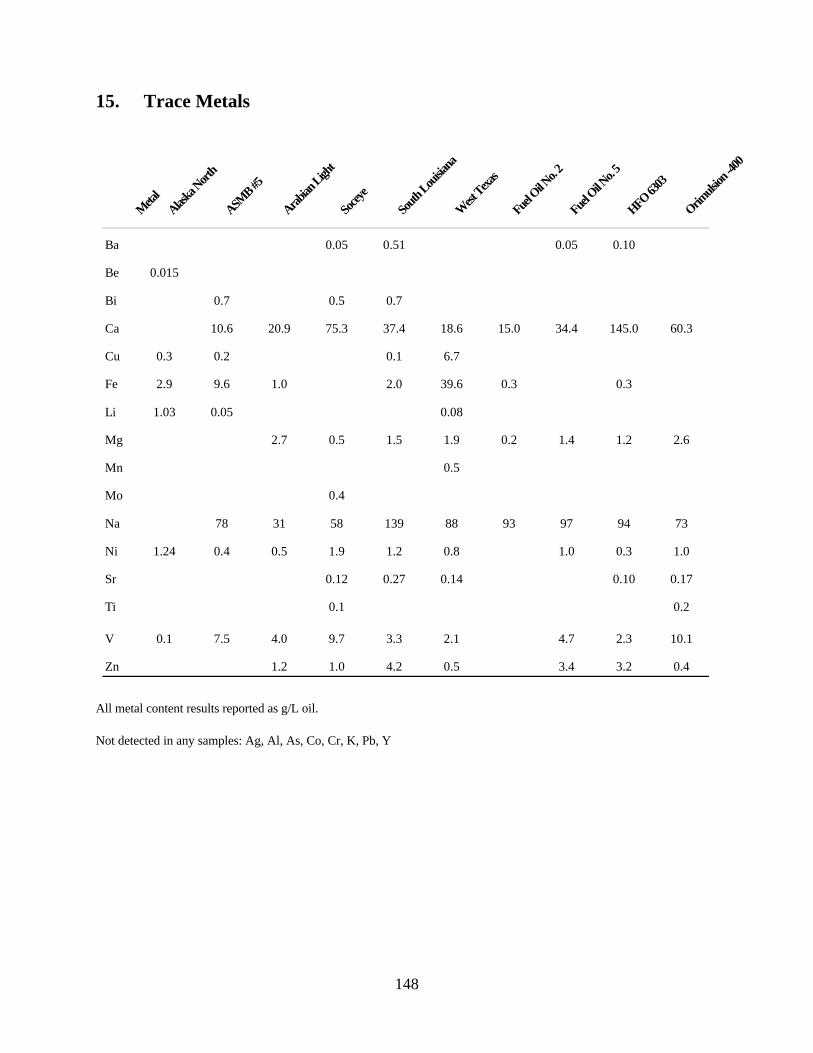
15. Trace Metals
Meta
l
Alask
a Nor
th
ASM
B #5
Ara
bian
Ligh
t
Soce
ye
Sout
h Lou
isian
a
West T
exas
Fuel O
il No.
2
Fuel O
il No.
5
HFO
6303
Orim
ulsio
n -400
0.05 0.51
0.015
0.7 0.5 0.7
10.6 20.9 75.3 37.4 18.6
Cu 0.3 0.2 0.1 6.7
Fe 2.9 9.6 1.0 2.0 39.6
1.03 0.05 0.08
2.7 0.5 1.5 1.9
0.5
0.4
Na 78 31 58 139 88
Ni 1.24 0.4 0.5 1.9 1.2 0.8
0.12 0.27 0.14
0.1
V 0.1 7.5 4.0 9.7 3.3 2.1
1.2 1.0 4.2 0.5
15.0
0.3
0.2
93
0.05 0.10
34.4 145.0 60.3
0.3
1.4 1.2 2.6
97 94 73
1.0 0.3 1.0
0.10 0.17
0.2
4.7 2.3 10.1
3.4 3.2 0.4
All metal content results reported as g/L oil.
Not detected in any samples: Ag, Al, As, Co, Cr, K, Pb, Y
Ba
Be
Bi
Ca
Li
Mg
Mn
Mo
Sr
Ti
Zn
148
16. References
API 82 American Petroleum Institute (API), Petroleum Measurement Tables - Volume XI/XII,
Philadelphia, PA, American Petroleum Institute, Washington DC, 1982.
API 92 American Petroleum Institute (API), API Methods for Determination of Petroleum
Hydrocarbons in Soil (Revision 1), American Petroleum Institute, Washington DC, 1992.
ASTM D5 American Society for Testing and Materials (ASTM), “Standard test method for
penetration of bituminous materials”, in Annual Books of ASTM Standards Section 4
Construction, Volume 04.03, ASTM, West Conshohocken, PA, 1999.
ASTM D56 American Society for Testing and Materials (ASTM), “Standard test method for flash
point by Tag closed tester”, in Annual Books of ASTM Standards Section 5 - Petroleum
Products, Lubricants and Fossil Fuels, Volume 05.01, ASTM, West Conshohocken, PA,
1999.
ASTM D93 American Society for Testing and Materials (ASTM), “Standard test method for flash
point by Pensky-Martens closed cup tester”, in Annual Books of ASTM Standards
Section 5 - Petroleum Products, Lubricants and Fossil Fuels, Volume 05.01, ASTM,
West Conshohocken, PA, 1999.
ASTM D97 American Society for Testing and Materials (ASTM), “Standard test method for pour
point of petroleum oils”, in Annual Books of ASTM Standards Section 5 - Petroleum
Products, Lubricants and Fossil Fuels, Volume 05.01, ASTM, West Conshohocken, PA,
1999.
ASTM D971 American Society for Testing and Materials (ASTM), “Standard test method for interfacial
tension of oil against water by the ring method”, in Annual Books of ASTM Standards
Section 10 - Electrical Insulation and Electronics, Volume 10.03, ASTM, West
Conshohocken, PA, 1999.
ASTM D2887 American Society for Testing and Materials (ASTM), “Standard test method for boiling
range distribution of petroleum fractions by gas chromatography”, in Annual Books of
ASTM Standards Section 5 - Petroleum Products, Lubricants and Fossil Fuels, Volume
05.02, ASTM, West Conshohocken, PA, 1999.
ASTM D3710 American Society for Testing and Materials (ASTM), “Standard test method for boiling
range distribution of gasoline and gasoline fractions by gas chromatography”, in Annual
Books of ASTM Standards Section 5 - Petroleum Products, Lubricants and Fossil Fuels,
Volume 05.02, ASTM, West Conshohocken, PA, 1999.
149
ASTM D4377 American Society for Testing and Materials (ASTM), “Standard test method for water in
crude oils by potentiometric Karl Fischer titration”, in Annual Books of ASTM Standards
Section 5 - Petroleum Products, Lubricants and Fossil Fuels, Volume 05.02, ASTM,
West Conshohocken, PA, 1999.
ASTM D4294 American Society for Testing and Materials (ASTM), “Standard test method for sulfur in
petroleum products by energy-dispersive x-ray fluorescence spectroscopy”, in Annual
Books of ASTM Standards Section 5 -Petroleum Products, Lubricants and Fossil Fuels,
Volume 05.02, ASTM, West Conshohocken, PA, 1999.
ASTM D5002 American Society for Testing and Materials (ASTM), “Standard test method for density
and relative densityof crude oils by digital density analyzer”, in Annual Books of ASTM
Standards Section 5 - Petroleum Products, Lubricants and Fossil Fuels, Volume 05.03,
ASTM, West Conshohocken, PA, 1999.
ASTM F2059 American Society for Testing and Materials (ASTM), “Standard test method for
Laboratory Oil Spill Dispersant Effectiveness Using The Swirling Flask”, in Annual Books
of ASTM Standards Section 11 - Water and Environmental Technology, Volume 11.04,
ASTM, West Conshohocken, PA, 2001.
EPA 92 U.S. EPA Method 3500A, Organic Extraction and Sample Preparation (Revision 1),
U. S. Environmental Protection Agency, Washington, DC, 1992.
EPA 94 U.S. EPA Method 3630B, Silica Gel Cleanup (Revision 2), U. S. Environmental
Protection Agency, Washington, DC, 1994.
EPA 84 U.S. EPA Method 610, Polynuclear Aromatic Hydrocarbons, U. S. Environmental
Protection Agency, Washington, DC, 1984.
EPA 92 U.S. EPA Method 8000A, Gas Chromatography (Revision 1), U. S. Environmental
Protection Agency, Washington, DC, 1992.
EPA 86 U.S. EPA Method 8100A, Polynuclear Aromatic Hydrocarbons, U. S. Environmental
Protection Agency, Washington, DC, 1986.
EPA 94 U.S. EPA Method 8260A, Volatile Organic Compounds by Gas
Chromatography/Mass Spectrometry (GC/MS): Capillary Column Technique
(Revision 1), U. S. Environmental Protection Agency, Washington, DC, 1994.
EPA 94 U.S. EPA Method 8270B, Semivolatile Organic Compounds by Gas
Chromatography/Mass Spectrometry (GC/MS): Capillary Column Technique
(Revision 1), U. S. Environmental Protection Agency, Washington, DC, 1994.
150
EPA 99 EPA Guidance for Quality Assurance Project Plans, EPA QA/G-5, U. S. EPA,
Washington, DC, 1998.
ETC 01 Quality Manual, Environmental Technology Centre, Environment Canada, Ottawa,
Ontario, 2001.
ETC 02 Wang, Z., Analytical Methods for Determination of Oil Components, ETC Method
No.: 5.3/1.3/M, 2002. Environmental Technology Centre, Environment Canada, Ottawa,
Ontario.
ETC 03 Wang, Z., Analytical Methods for Identification and Determination of BTEX and
Other Alkyl Benzene Compounds, ETC Method No.: 5.3/1.2/M, 2002. Environmental
Technology Centre, Environment Canada, Ottawa, Ontario.
ETC 04 Environmental Technology Centre (ETC) web site: http://www.etc-
cte.ec.gc.ca/databases/spills_e.html, 2003.
Fingas 97 Fingas, M., "Studies on the Evaporation of Crude Oil and Petroleum Products: I. The
Relationship Between Evaporation Rate and Time”, J. Haz. Mat., 56, pp. 227-236, 1997.
Fingas 98a Fingas, M., "Studies on the Evaporation of Crude Oil and Petroleum Products: II.
“Boundary Layer Regulation”, J. Haz. Mat., 57, pp. 41-58, 1998.
Fingas 98b Fingas, M., B. Fieldhouse, and J. Mullin, “Studies of water-in-oil emulsions: stability and
oil properties”, in Proceedings of the 21st Arctic and Marine Oil Spill Program Technical
Seminar, Environment Canada, Ottawa, On, 1998, pp. 1-25.
Fingas 01 Fingas, M., “The Evaporation of Oil Spills: Development and Implementation of New
Prediction Methodology”, Chapter 5 in Oil Spill Modelling and Processes, C.A. Brebbia,
ed., Wit Press, Southampton, U.K., pp.111-138, 2001
Jokuty 95 Jokuty, P., M. Fingas, S. Whiticar, and B. Fieldhouse, A study of viscosity and
interfacial tension of oils and emulsions, Manuscript Report EE-153, Environment
Canada, Ottawa, ON, 50 p, 1995.
Jokuty 96 Jokuty, P., S. Whiticar, K. McRoberts, and J. Mullin, “Oil adhesion testing - recent
results”, in Proceedings of the 19th Arctic and Marine Oil Spill Program Technical
Seminar, Environment Canada, Ottawa, ON, 1996, pp. 9-27.
Jokuty 99 Jokuty, P., S. Whiticar, Z. Wang, M. Fingas, B. Fieldhouse, P. Lambert and J. Mullin,
Properties of Crude Oils and Oil Products, Manuscript Report EE-165, Environmental
Protection Service, Environment Canada, Ottawa, ON, 1999.
151
Peters 93 Peters, K. E., J. W. Moldowan, The Biomarker Guide: Interpreting Molecular Fossils
in Petroleum and Ancient Sediments, Prentice Hall, Englewood Cliffs, NJ, 1993.
Speight 91 Speight, J.G., The Chemistry and Technology of Petroleum, New York, NY, Marcel
Dekker, Inc., 1991.
Wang 94 Wang, Z., M. Fingas, and K. Li, “Fractionation of ASMB Oil, Identification and
Quantitation of Aliphatic Aromatic and Biomarker Compounds by GC/FID and GC/MSD
(Part 1)”, J. Chromatogr. Sci., 2, pp. 361-366, 1994.
Wang 94 Wang, Z., M. Fingas, and K. Li, “Fractionation of ASMB Oil, Identification and
Quantitation of Aliphatic Aromatic and Biomarker Compounds by GC/FID and GC/MSD
(Part 2)”, J. Chromatogr. Sci., 2, pp. 367-382, 1994.
Wang 94 Wang, Z., M. Fingas, and G. Sergy, “Study of 22-year-old Arrow Oil Samples Using
Biomarker Compounds by GC/MS”, Environ. Sci. Technol., 28, pp.1733-1746, 1994.
Wang 95 Wang, Z., M. Fingas, M. Landriault, L. Sigouin, and N. Xu, “Identification of
Alkylbenzenes and Direct Determination of BTEX and (BTEX + C3-Benzenes) in Oil by
GC/MS”, Anal. Chem., 67, pp. 3491-3500, 1995.
Wang 96 Wang, Z., M. Fingas, “Separation and Characterization of Petroleum Hydrocarbons and
Surfactant in Orimulsion Dispersion Samples”, Environ. Sci. Technol., 30(11), pp. 3351
3361, 1996.
Wang 98 Wang, Z., M. Fingas, “Characterization of Alkylated Benzene Compounds and Direct
Quantitation of BTEX and (BTEX + C3-Benzenes) in Oils Using GC/MS”, in The
Encyclopaedia of Environmental Analysis and Remediation (Eight Volumes), Robert.
A. Meyers (Editor-in-Chief), John Wiley & Sons, Inc., New York, NY, 1998; Vol. 2, pp
829-852.
Wang 99 Wang, Z., M. Fingas, Y.Y. Shu, L. Sigouin, M. Landriault, and P. Lambert, “Quantitative
Characterization of PAHs in Burn Residue and Soot Samples and Differentiation of
Pyrogenic PAHs from Petrogenic PAHs - the 1994 Mobile Burn Study”, Environ. Sci.
Technol., 33, 3100-3109.
Wang 99 Wang, Z. M. Fingas, and D. Page, “Oil Spill Identification”, J. Chromatogr., 843, pp.
369-411, 1999.
Wang 00 Wang Z., M. Fingas, “Differentiation of PAHs in Burn Residue and Soot Samples and
Differentiation of Pyrogenic and Petrogenic PAHs - The 1994 and 1997 Mobile Burn
Study”, in Chemistry of Diesel Fuel, C. S. Hsu, I. Mochida and C. Song (eds.), Taylor
and Francis Publishing Company, New York, 2000, Chapter 13, pp237-254.
152
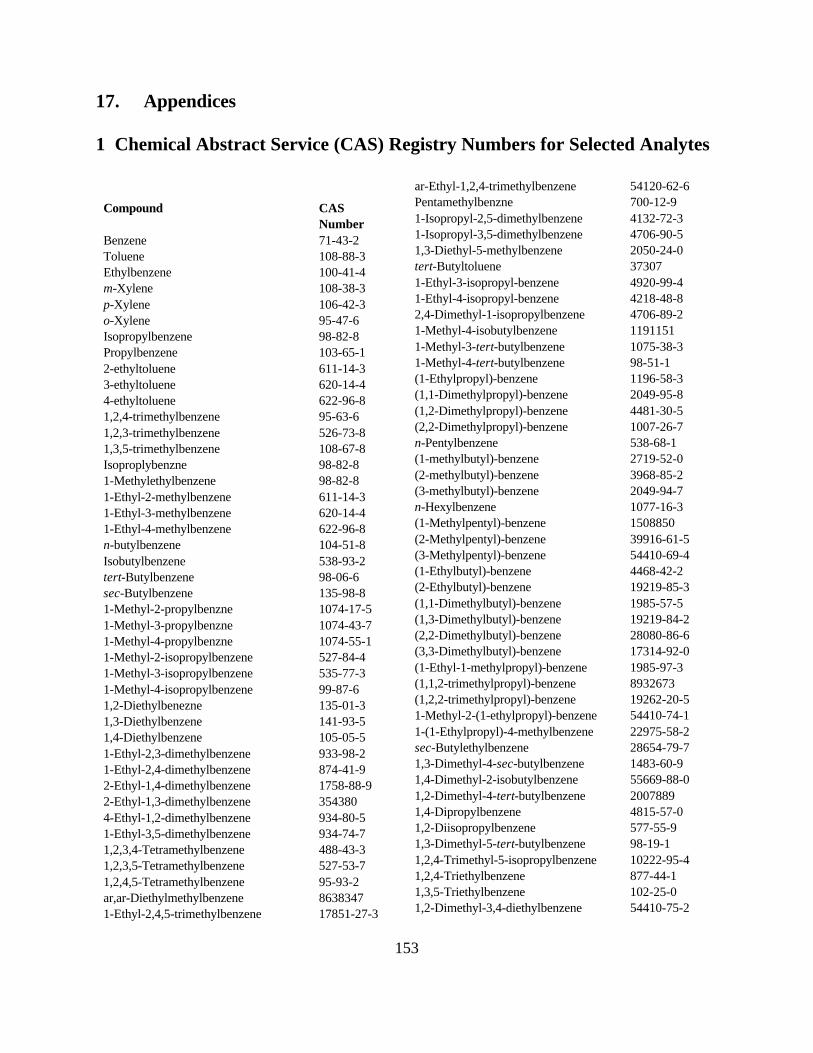
17. Appendices
1 Chemical Abstract Service (CAS) Registry Numbers for Selected Analytes
ar-Ethyl-1,2,4-trimethylbenzene 54120-62-6
Compound CAS Pentamethylbenzne 700-12-9
Number 1-Isopropyl-2,5-dimethylbenzene 4132-72-3
Benzene 71-43-2 1-Isopropyl-3,5-dimethylbenzene 4706-90-5
Toluene 108-88-3 1,3-Diethyl-5-methylbenzene 2050-24-0
Ethylbenzene 100-41-4 tert-Butyltoluene 37307
m-Xylene 108-38-3 1-Ethyl-3-isopropyl-benzene 4920-99-4
p-Xylene
o-Xylene
Isopropylbenzene
106-42-3
95-47-6
98-82-8
1-Ethyl-4-isopropyl-benzene
2,4-Dimethyl-1-isopropylbenzene
1-Methyl-4-isobutylbenzene
4218-48-8
4706-89-2
1191151
Propylbenzene 103-65-1 1-Methyl-3-tert-butylbenzene 1075-38-3
2-ethyltoluene
3-ethyltoluene
4-ethyltoluene
611-14-3
620-14-4
622-96-8
1-Methyl-4-tert-butylbenzene
(1-Ethylpropyl)-benzene
(1,1-Dimethylpropyl)-benzene
98-51-1
1196-58-3
2049-95-8
1,2,4-trimethylbenzene 95-63-6 (1,2-Dimethylpropyl)-benzene 4481-30-5
1,2,3-trimethylbenzene
1,3,5-trimethylbenzene
Isoproplybenzne
526-73-8
108-67-8
98-82-8
(2,2-Dimethylpropyl)-benzene
n-Pentylbenzene
(1-methylbutyl)-benzene
1007-26-7
538-68-1
2719-52-0
1-Methylethylbenzene 98-82-8 (2-methylbutyl)-benzene 3968-85-2
1-Ethyl-2-methylbenzene
1-Ethyl-3-methylbenzene
1-Ethyl-4-methylbenzene
611-14-3
620-14-4
622-96-8
(3-methylbutyl)-benzene
n-Hexylbenzene
(1-Methylpentyl)-benzene
2049-94-7
1077-16-3
1508850
n-butylbenzene 104-51-8 (2-Methylpentyl)-benzene 39916-61-5
Isobutylbenzene
tert-Butylbenzene
sec-Butylbenzene
538-93-2
98-06-6
135-98-8
(3-Methylpentyl)-benzene
(1-Ethylbutyl)-benzene
(2-Ethylbutyl)-benzene
54410-69-4
4468-42-2
19219-85-3
1-Methyl-2-propylbenzne 1074-17-5 (1,1-Dimethylbutyl)-benzene 1985-57-5
1-Methyl-3-propylbenzne
1-Methyl-4-propylbenzne
1-Methyl-2-isopropylbenzene
1074-43-7
1074-55-1
527-84-4
(1,3-Dimethylbutyl)-benzene
(2,2-Dimethylbutyl)-benzene
(3,3-Dimethylbutyl)-benzene
19219-84-2
28080-86-6
17314-92-0
1-Methyl-3-isopropylbenzene 535-77-3 (1-Ethyl-1-methylpropyl)-benzene 1985-97-3
1-Methyl-4-isopropylbenzene
1,2-Diethylbenezne
1,3-Diethylbenzene
99-87-6
135-01-3
141-93-5
(1,1,2-trimethylpropyl)-benzene
(1,2,2-trimethylpropyl)-benzene
1-Methyl-2-(1-ethylpropyl)-benzene
8932673
19262-20-5
54410-74-1
1,4-Diethylbenzene 105-05-5 1-(1-Ethylpropyl)-4-methylbenzene 22975-58-2
1-Ethyl-2,3-dimethylbenzene
1-Ethyl-2,4-dimethylbenzene
2-Ethyl-1,4-dimethylbenzene
933-98-2
874-41-9
1758-88-9
sec-Butylethylbenzene
1,3-Dimethyl-4-sec-butylbenzene
1,4-Dimethyl-2-isobutylbenzene
28654-79-7
1483-60-9
55669-88-0
2-Ethyl-1,3-dimethylbenzene 354380 1,2-Dimethyl-4-tert-butylbenzene 2007889
4-Ethyl-1,2-dimethylbenzene
1-Ethyl-3,5-dimethylbenzene
1,2,3,4-Tetramethylbenzene
934-80-5
934-74-7
488-43-3
1,4-Dipropylbenzene
1,2-Diisopropylbenzene
1,3-Dimethyl-5-tert-butylbenzene
4815-57-0
577-55-9
98-19-1
1,2,3,5-Tetramethylbenzene 527-53-7 1,2,4-Trimethyl-5-isopropylbenzene 10222-95-4
1,2,4,5-Tetramethylbenzene
ar,ar-Diethylmethylbenzene
1-Ethyl-2,4,5-trimethylbenzene
95-93-2
8638347
17851-27-3
1,2,4-Triethylbenzene
1,3,5-Triethylbenzene
1,2-Dimethyl-3,4-diethylbenzene
877-44-1
102-25-0
54410-75-2
153
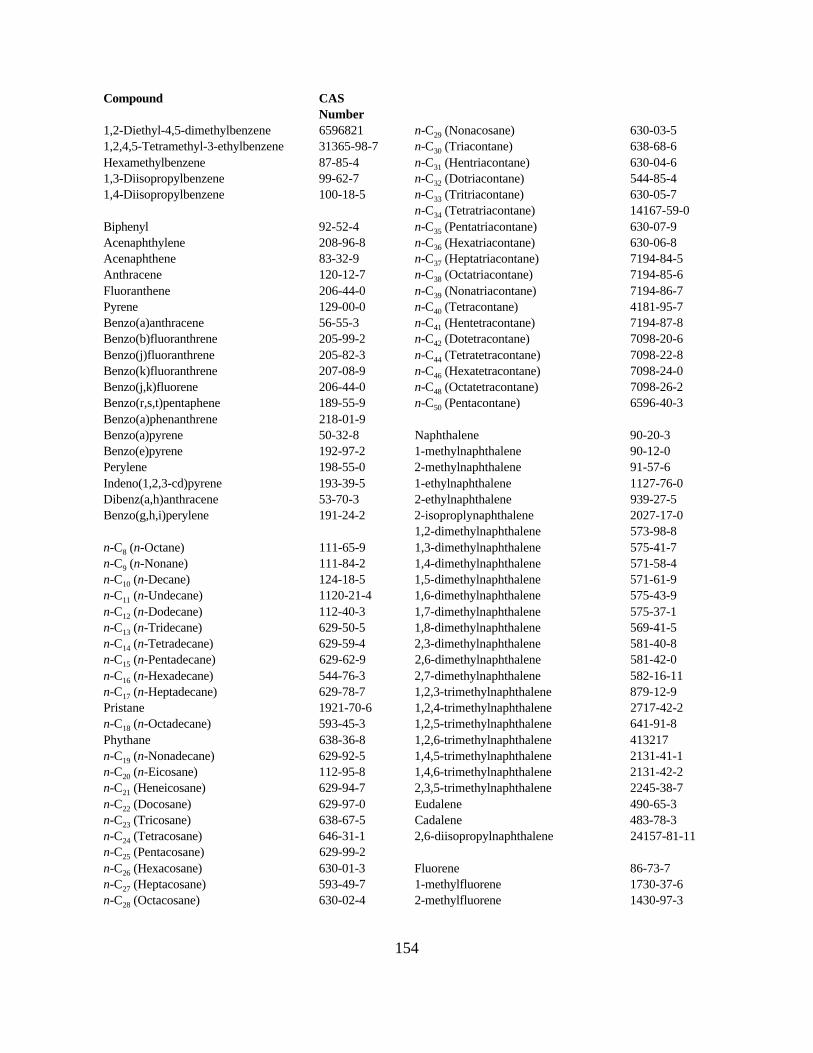
Compound CAS
Number
1,2-Diethyl-4,5-dimethylbenzene 6596821 n-C29 (Nonacosane) 630-03-5
1,2,4,5-Tetramethyl-3-ethylbenzene 31365-98-7 n-C30 (Triacontane) 638-68-6
Hexamethylbenzene 87-85-4 n-C31 (Hentriacontane) 630-04-6
1,3-Diisopropylbenzene 99-62-7 n-C32 (Dotriacontane) 544-85-4
1,4-Diisopropylbenzene 100-18-5 n-C33 (Tritriacontane) 630-05-7
n-C34 (Tetratriacontane) 14167-59-0
Biphenyl 92-52-4 n-C35 (Pentatriacontane) 630-07-9
Acenaphthylene 208-96-8 n-C36 (Hexatriacontane) 630-06-8
Acenaphthene 83-32-9 n-C37 (Heptatriacontane) 7194-84-5
Anthracene 120-12-7 n-C38 (Octatriacontane) 7194-85-6
Fluoranthene 206-44-0 n-C39 (Nonatriacontane) 7194-86-7
Pyrene 129-00-0 n-C40 (Tetracontane) 4181-95-7
Benzo(a)anthracene 56-55-3 n-C41 (Hentetracontane) 7194-87-8
Benzo(b)fluoranthrene 205-99-2 n-C42 (Dotetracontane) 7098-20-6
Benzo(j)fluoranthrene 205-82-3 n-C44 (Tetratetracontane) 7098-22-8
Benzo(k)fluoranthrene 207-08-9 n-C46 (Hexatetracontane) 7098-24-0
Benzo(j,k)fluorene 206-44-0 n-C48 (Octatetracontane) 7098-26-2
Benzo(r,s,t)pentaphene 189-55-9 n-C50 (Pentacontane) 6596-40-3
Benzo(a)phenanthrene 218-01-9
Benzo(a)pyrene 50-32-8 Naphthalene 90-20-3
Benzo(e)pyrene 192-97-2 1-methylnaphthalene 90-12-0
Perylene 198-55-0 2-methylnaphthalene 91-57-6
Indeno(1,2,3-cd)pyrene 193-39-5 1-ethylnaphthalene 1127-76-0
Dibenz(a,h)anthracene 53-70-3 2-ethylnaphthalene 939-27-5
Benzo(g,h,i)perylene 191-24-2 2-isoproplynaphthalene 2027-17-0
1,2-dimethylnaphthalene 573-98-8
n-C8 (n-Octane) 111-65-9 1,3-dimethylnaphthalene 575-41-7
n-C9 (n-Nonane) 111-84-2 1,4-dimethylnaphthalene 571-58-4
n-C10 (n-Decane) 124-18-5 1,5-dimethylnaphthalene 571-61-9
n-C11 (n-Undecane) 1120-21-4 1,6-dimethylnaphthalene 575-43-9
n-C12 (n-Dodecane) 112-40-3 1,7-dimethylnaphthalene 575-37-1
n-C13 (n-Tridecane) 629-50-5 1,8-dimethylnaphthalene 569-41-5
n-C14 (n-Tetradecane) 629-59-4 2,3-dimethylnaphthalene 581-40-8
n-C15 (n-Pentadecane) 629-62-9 2,6-dimethylnaphthalene 581-42-0
n-C16 (n-Hexadecane) 544-76-3 2,7-dimethylnaphthalene 582-16-11
n-C17 (n-Heptadecane) 629-78-7 1,2,3-trimethylnaphthalene 879-12-9
Pristane 1921-70-6 1,2,4-trimethylnaphthalene 2717-42-2
n-C18 (n-Octadecane) 593-45-3 1,2,5-trimethylnaphthalene 641-91-8
Phythane 638-36-8 1,2,6-trimethylnaphthalene 413217
n-C19 (n-Nonadecane) 629-92-5 1,4,5-trimethylnaphthalene 2131-41-1
n-C20 (n-Eicosane) 112-95-8 1,4,6-trimethylnaphthalene 2131-42-2
n-C21 (Heneicosane) 629-94-7 2,3,5-trimethylnaphthalene 2245-38-7
n-C22 (Docosane) 629-97-0 Eudalene 490-65-3
n-C23 (Tricosane) 638-67-5 Cadalene 483-78-3
n-C24 (Tetracosane) 646-31-1 2,6-diisopropylnaphthalene 24157-81-11
n-C25 (Pentacosane) 629-99-2
n-C26 (Hexacosane) 630-01-3 Fluorene 86-73-7
n-C27 (Heptacosane) 593-49-7 1-methylfluorene 1730-37-6
n-C28 (Octacosane) 630-02-4 2-methylfluorene 1430-97-3
154
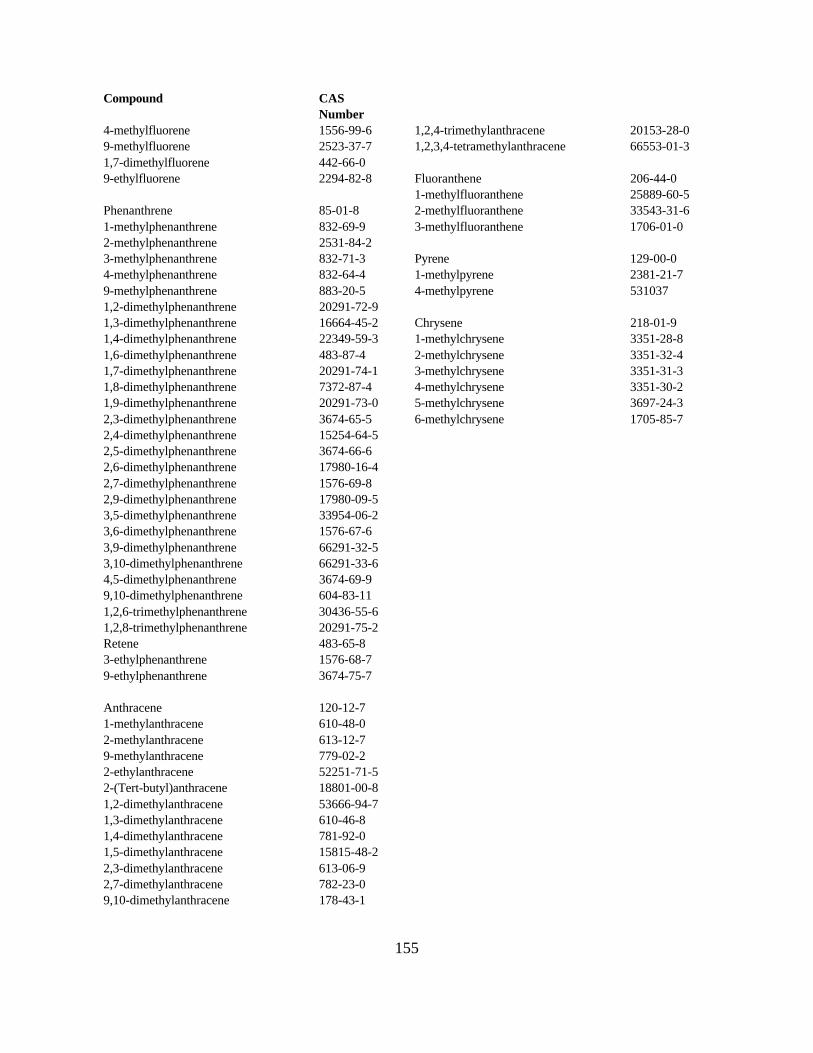
Compound CAS
Number
4-methylfluorene 1556-99-6 1,2,4-trimethylanthracene 20153-28-0
9-methylfluorene 2523-37-7 1,2,3,4-tetramethylanthracene 66553-01-3
1,7-dimethylfluorene 442-66-0
9-ethylfluorene 2294-82-8 Fluoranthene 206-44-0
1-methylfluoranthene 25889-60-5
Phenanthrene 85-01-8 2-methylfluoranthene 33543-31-6
1-methylphenanthrene 832-69-9 3-methylfluoranthene 1706-01-0
2-methylphenanthrene 2531-84-2
3-methylphenanthrene 832-71-3 Pyrene 129-00-0
4-methylphenanthrene 832-64-4 1-methylpyrene 2381-21-7
9-methylphenanthrene 883-20-5 4-methylpyrene 531037
1,2-dimethylphenanthrene 20291-72-9
1,3-dimethylphenanthrene 16664-45-2 Chrysene 218-01-9
1,4-dimethylphenanthrene 22349-59-3 1-methylchrysene 3351-28-8
1,6-dimethylphenanthrene 483-87-4 2-methylchrysene 3351-32-4
1,7-dimethylphenanthrene 20291-74-1 3-methylchrysene 3351-31-3
1,8-dimethylphenanthrene 7372-87-4 4-methylchrysene 3351-30-2
1,9-dimethylphenanthrene 20291-73-0 5-methylchrysene 3697-24-3
2,3-dimethylphenanthrene 3674-65-5 6-methylchrysene 1705-85-7
2,4-dimethylphenanthrene 15254-64-5
2,5-dimethylphenanthrene 3674-66-6
2,6-dimethylphenanthrene 17980-16-4
2,7-dimethylphenanthrene 1576-69-8
2,9-dimethylphenanthrene 17980-09-5
3,5-dimethylphenanthrene 33954-06-2
3,6-dimethylphenanthrene 1576-67-6
3,9-dimethylphenanthrene 66291-32-5
3,10-dimethylphenanthrene 66291-33-6
4,5-dimethylphenanthrene 3674-69-9
9,10-dimethylphenanthrene 604-83-11
1,2,6-trimethylphenanthrene 30436-55-6
1,2,8-trimethylphenanthrene 20291-75-2
Retene 483-65-8
3-ethylphenanthrene 1576-68-7
9-ethylphenanthrene 3674-75-7
Anthracene 120-12-7
1-methylanthracene 610-48-0
2-methylanthracene 613-12-7
9-methylanthracene 779-02-2
2-ethylanthracene 52251-71-5
2-(Tert-butyl)anthracene 18801-00-8
1,2-dimethylanthracene 53666-94-7
1,3-dimethylanthracene 610-46-8
1,4-dimethylanthracene 781-92-0
1,5-dimethylanthracene 15815-48-2
2,3-dimethylanthracene 613-06-9
2,7-dimethylanthracene 782-23-0
9,10-dimethylanthracene 178-43-1
155
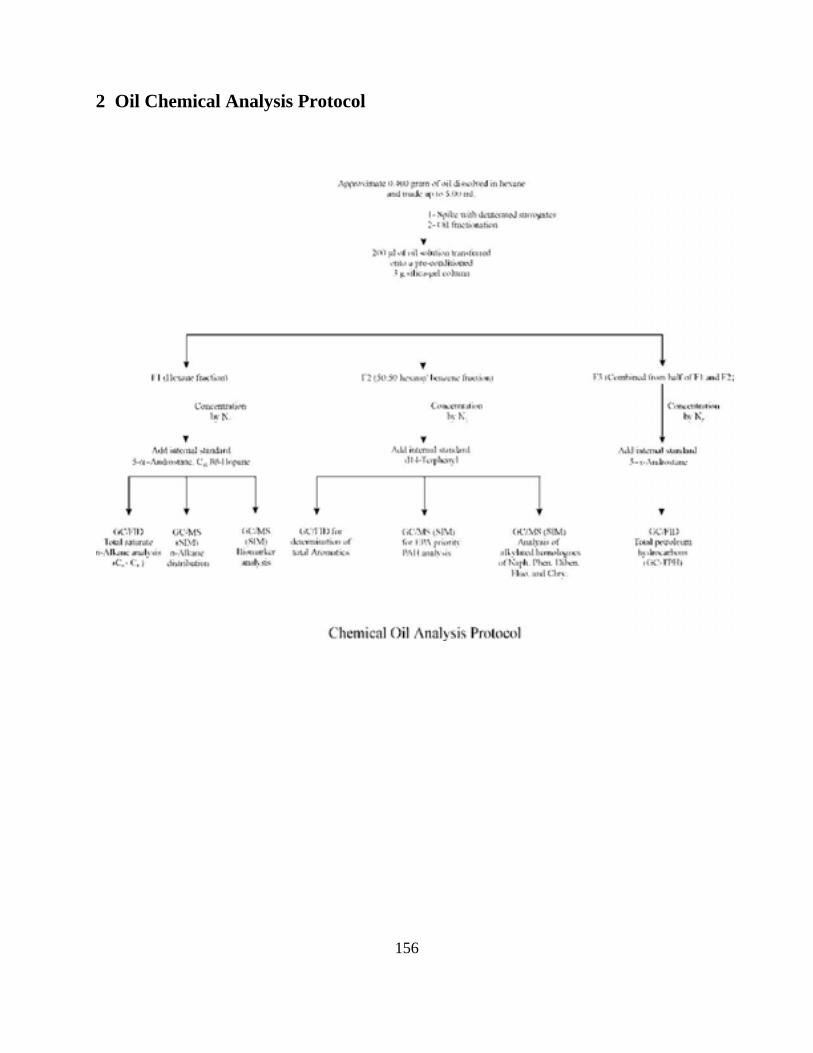
2 Oil Chemical Analysis Protocol
156
3 GC Chromatograms for Alaska North Slope Crude Oil
Figure A3-1 GC-FID chromatograms of fraction 1 (F1) for saturates of Alaska North Slope
crude oil
Figure A3-2 GC-FID chromatograms of fraction 3 (F3) for total petroleum hydrocarbons
(TPH) of Alaska North Slope crude oil
Figure A3-3 GC-MS chromatograms of fraction 1 (F1) for n-alkane distribution (m/z 85) of
Alaska North Slope crude oil
Figure A3-4 Total ion GC-MS chromatograms of fraction 2 (F2) for determination of PAHs
of Alaska North Slope crude oil
Figure A3-5 Extracted ion GC-MS chromatograms of fraction 2 (F2) for determination of the
5 target alkylated PAH homologues (m/z: 128, 142, 156, 170, 184, 178, 192,
206, 220, 234, 198, 212, 226, 166, 180, 194, 208, 228, 242, 256, and 270) of
Alaska North Slope crude oil
Figure A3-6 GC-MS chromatograms of fraction 1 (F1) for biomarker terpane analysis (m/z
191) of Alaska North Slope crude oil
Figure A3-7 GC-MS chromatograms of fraction 1 (F1) for biomarker sterane analysis (m/z
217/218) of Alaska North Slope crude oil
157
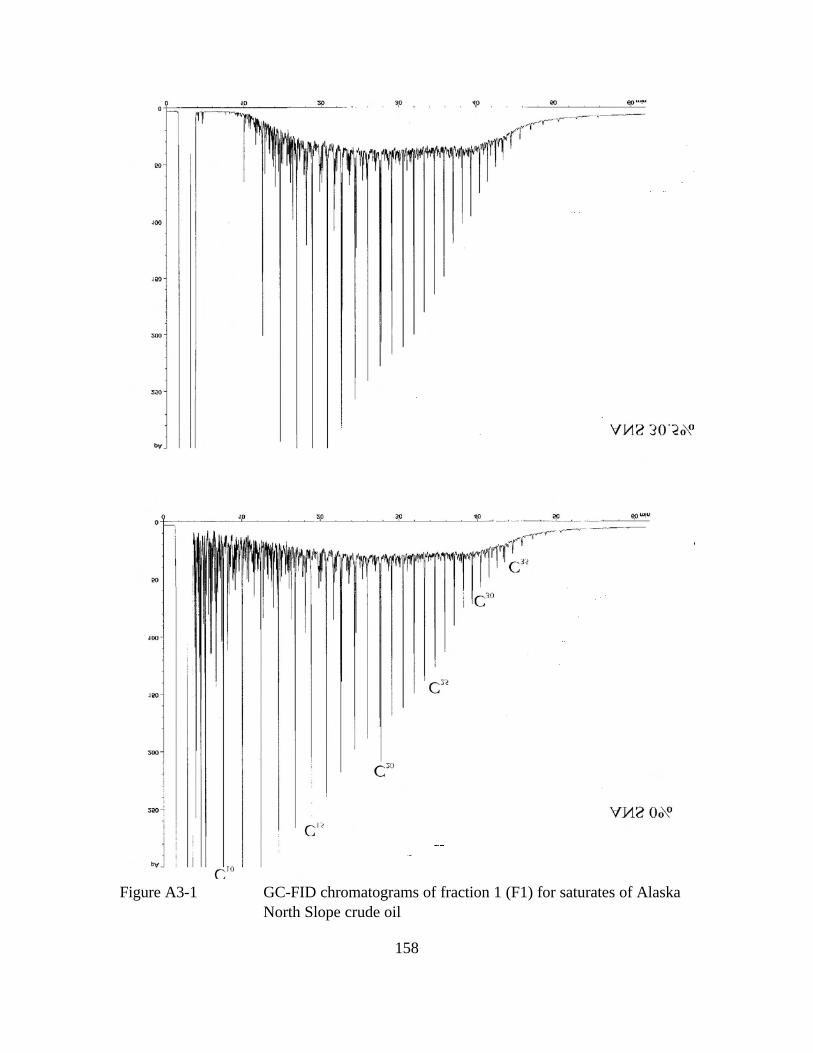
Figure A3-1 GC-FID chromatograms of fraction 1 (F1) for saturates of Alaska
North Slope crude oil
158
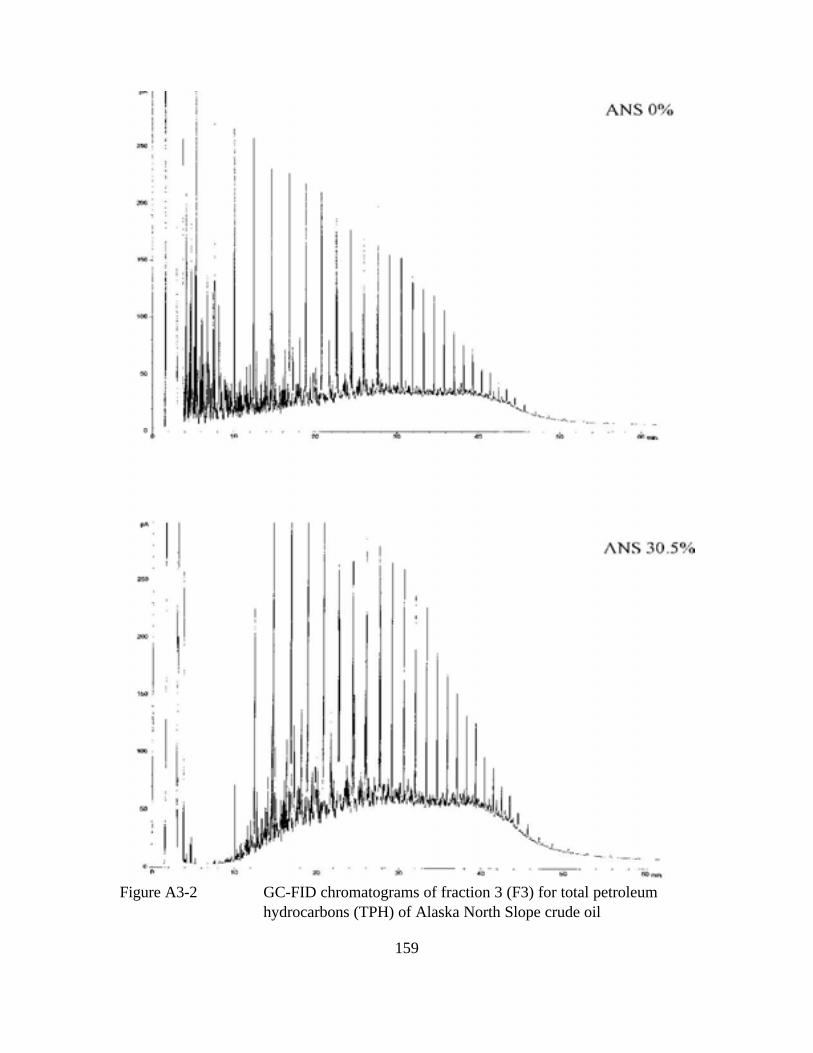
Figure A3-2 GC-FID chromatograms of fraction 3 (F3) for total petroleum
hydrocarbons (TPH) of Alaska North Slope crude oil
159
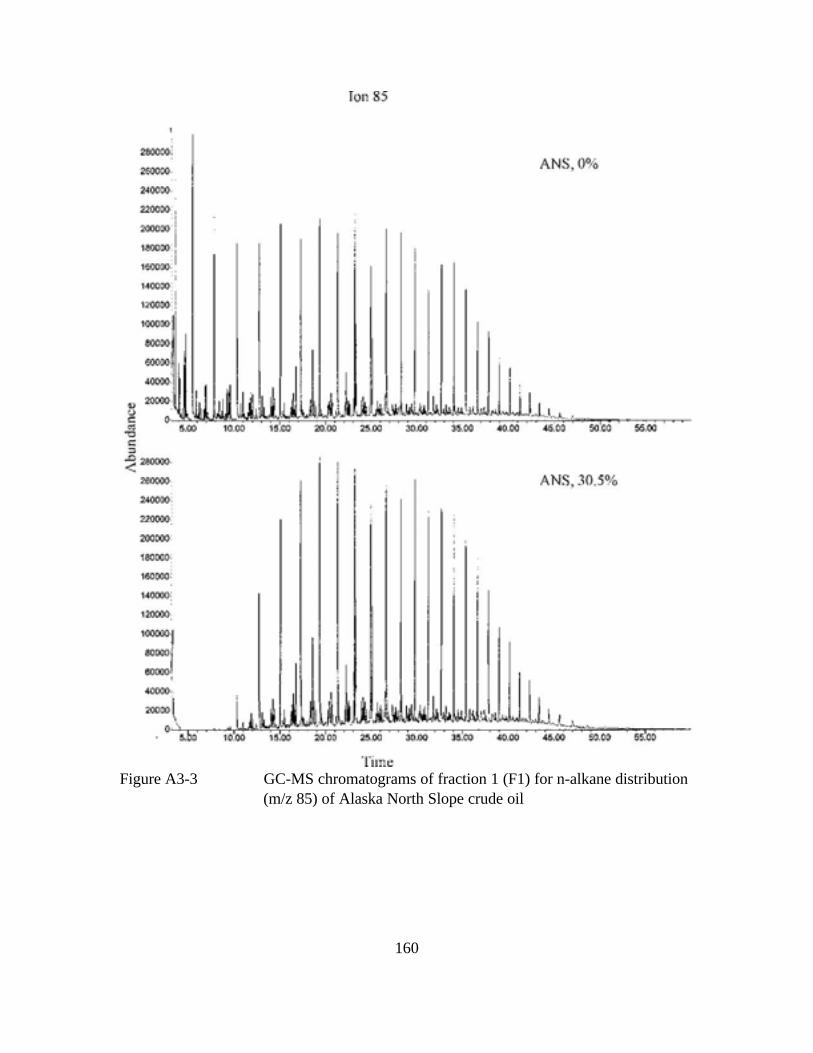
Figure A3-3 GC-MS chromatograms of fraction 1 (F1) for n-alkane distribution
(m/z 85) of Alaska North Slope crude oil
160
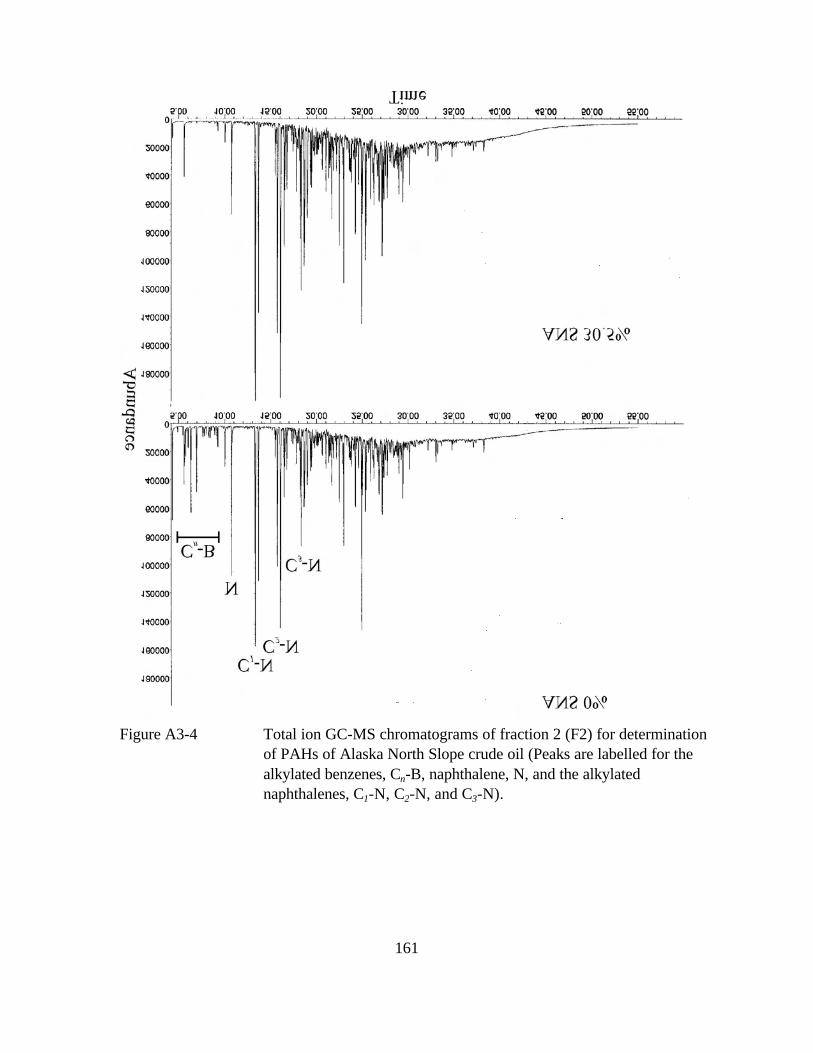
Figure A3-4 Total ion GC-MS chromatograms of fraction 2 (F2) for determination
of PAHs of Alaska North Slope crude oil (Peaks are labelled for the
alkylated benzenes, Cn-B, naphthalene, N, and the alkylated
naphthalenes, C1-N, C2-N, and C3-N).
161
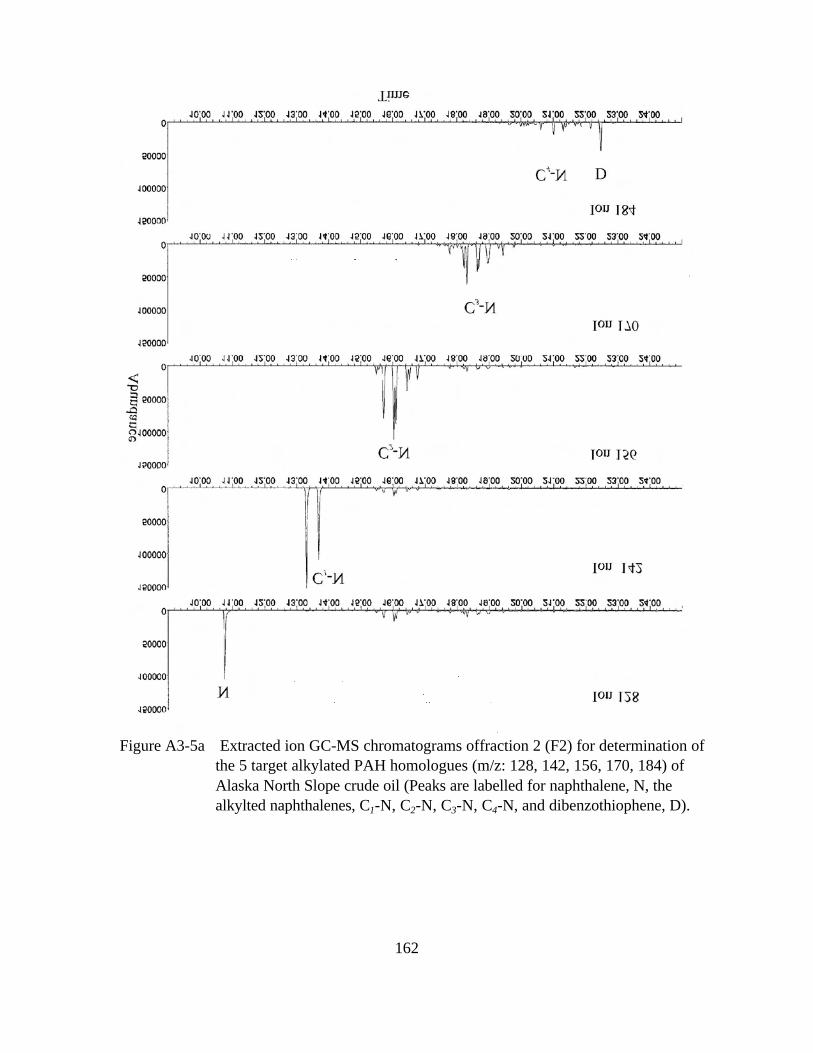
Figure A3-5a Extracted ion GC-MS chromatograms of fraction 2 (F2) for determination of
the 5 target alkylated PAH homologues (m/z: 128, 142, 156, 170, 184) of
Alaska North Slope crude oil (Peaks are labelled for naphthalene, N, the
alkylted naphthalenes, C1-N, C2-N, C3-N, C4-N, and dibenzothiophene, D).
162
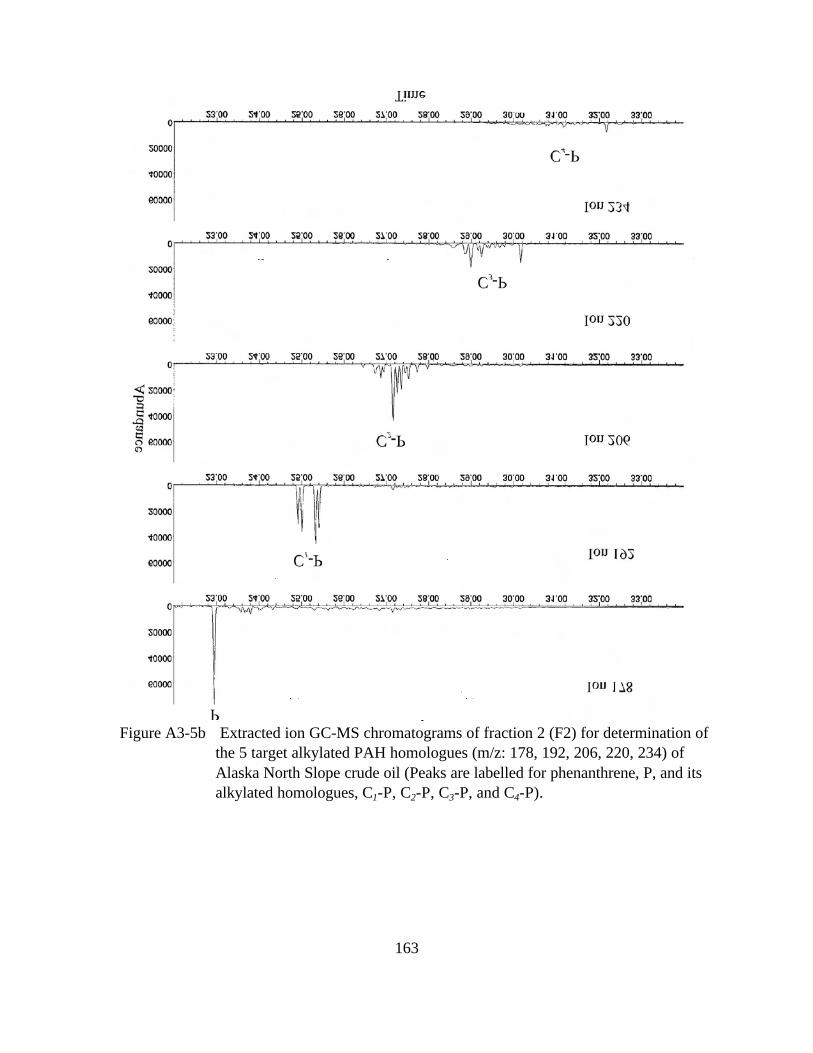
Figure A3-5b Extracted ion GC-MS chromatograms of fraction 2 (F2) for determination of
the 5 target alkylated PAH homologues (m/z: 178, 192, 206, 220, 234) of
Alaska North Slope crude oil (Peaks are labelled for phenanthrene, P, and its
alkylated homologues, C1-P, C2-P, C3-P, and C4-P).
163
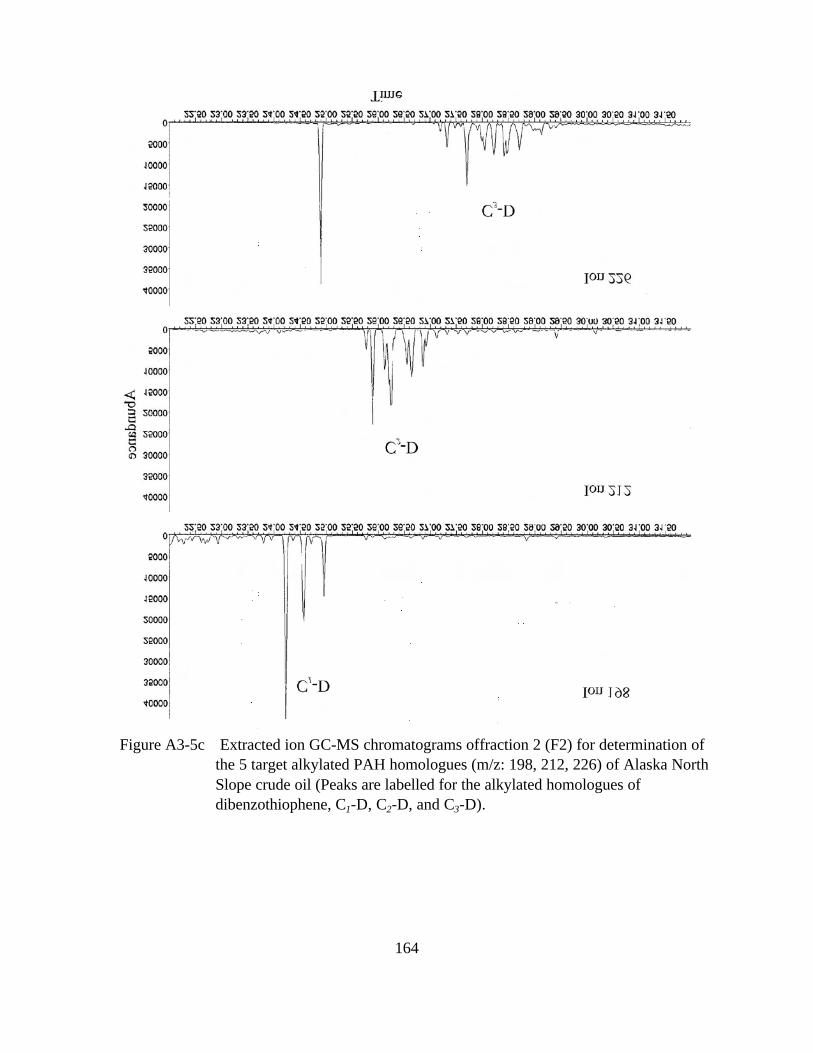
Figure A3-5c Extracted ion GC-MS chromatograms of fraction 2 (F2) for determination of
the 5 target alkylated PAH homologues (m/z: 198, 212, 226) of Alaska North
Slope crude oil (Peaks are labelled for the alkylated homologues of
dibenzothiophene, C1-D, C2-D, and C3-D).
164
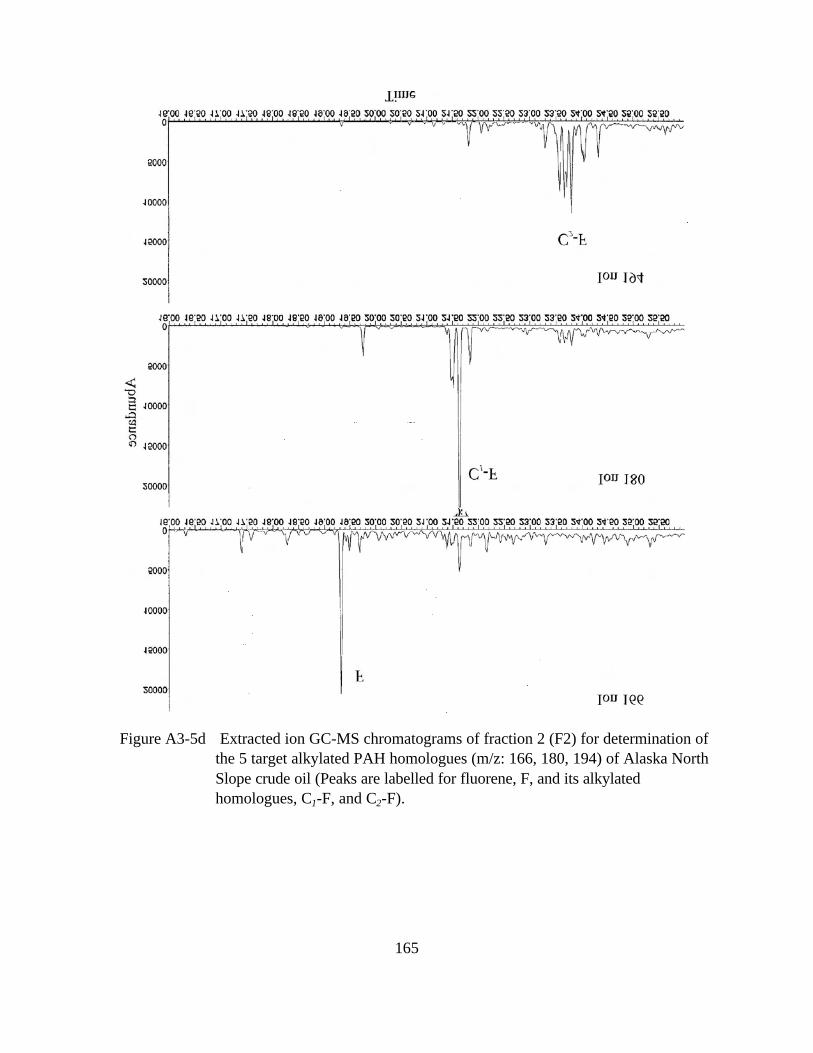
Figure A3-5d Extracted ion GC-MS chromatograms of fraction 2 (F2) for determination of
the 5 target alkylated PAH homologues (m/z: 166, 180, 194) of Alaska North
Slope crude oil (Peaks are labelled for fluorene, F, and its alkylated
homologues, C1-F, and C2-F).
165
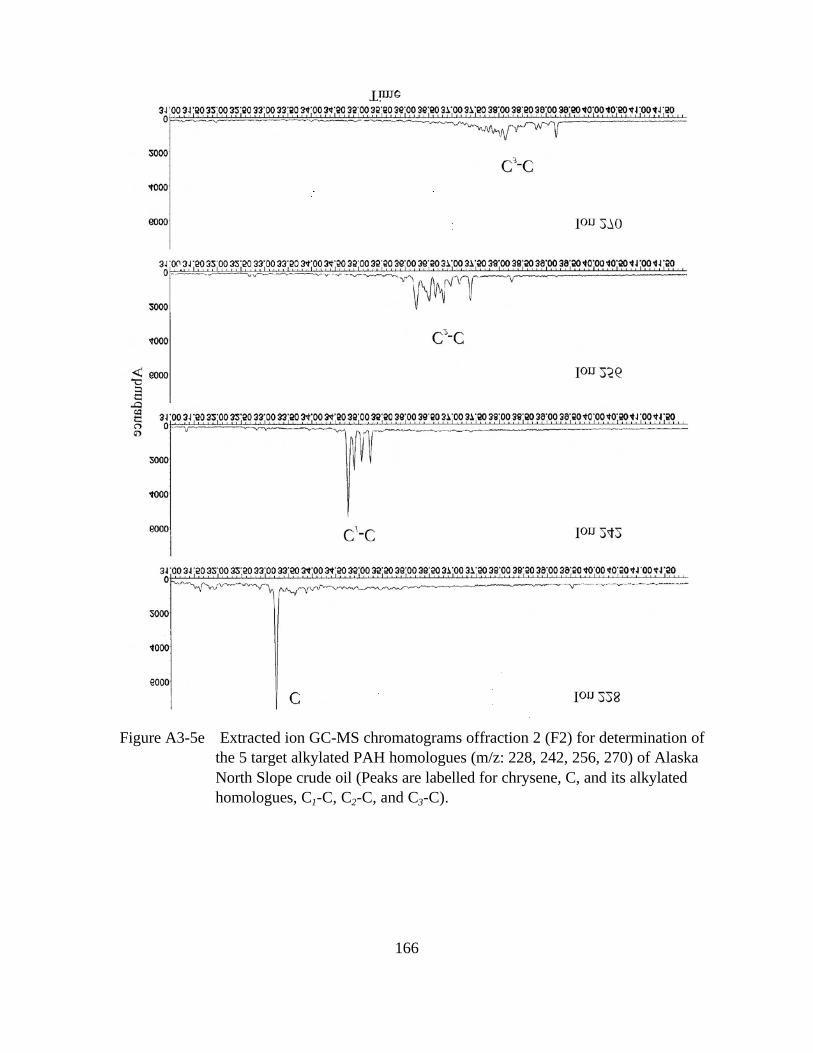
Figure A3-5e Extracted ion GC-MS chromatograms of fraction 2 (F2) for determination of
the 5 target alkylated PAH homologues (m/z: 228, 242, 256, 270) of Alaska
North Slope crude oil (Peaks are labelled for chrysene, C, and its alkylated
homologues, C1-C, C2-C, and C3-C).
166
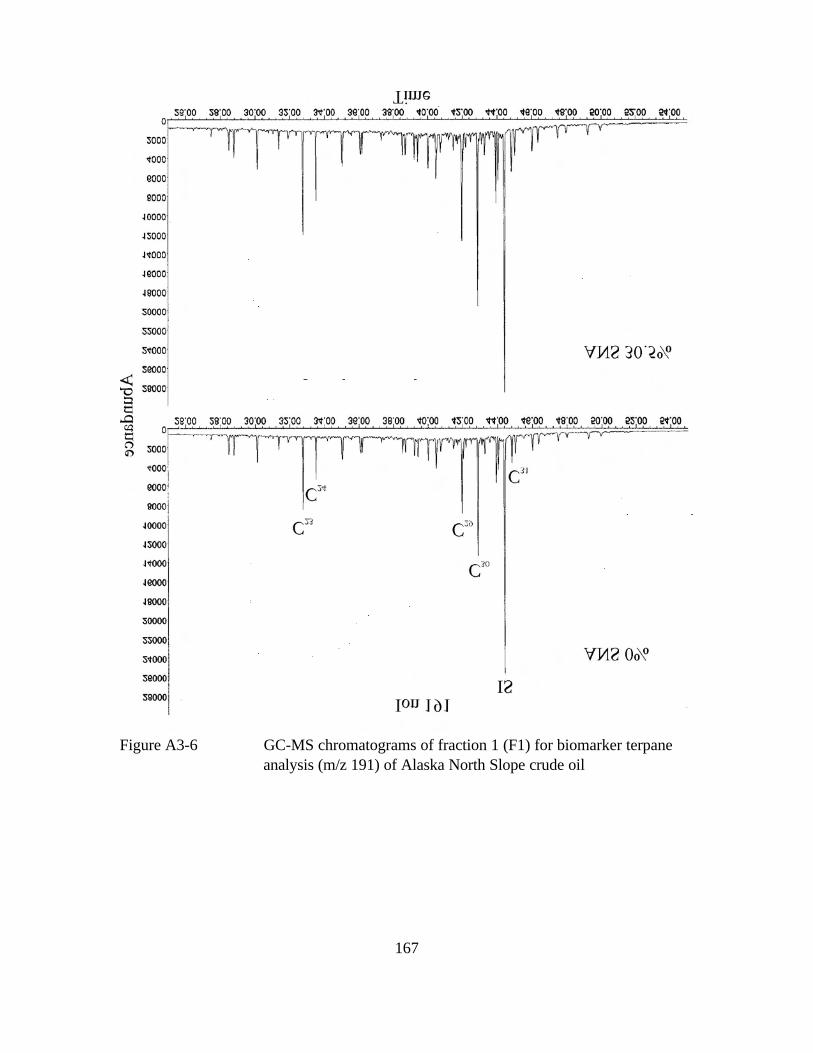
Figure A3-6 GC-MS chromatograms of fraction 1 (F1) for biomarker terpane
analysis (m/z 191) of Alaska North Slope crude oil
167
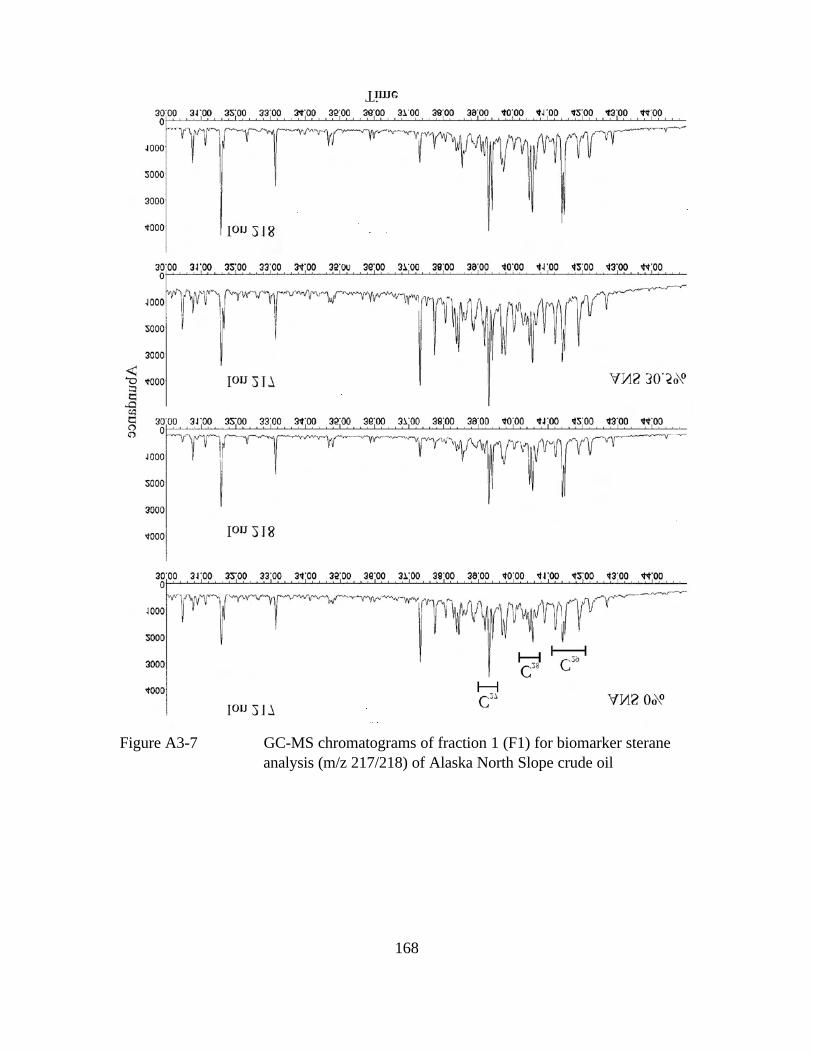
Figure A3-7 GC-MS chromatograms of fraction 1 (F1) for biomarker sterane
analysis (m/z 217/218) of Alaska North Slope crude oil
168

169
4 GC Chromatograms for Alberta Sweet Mixed Blend #5 Crude Oil
Figure A4-1 GC-FID chromatograms of fraction 1 (F1) for saturates of ASMB #5 crude oil
Figure A4-2 GC-FID chromatograms of fraction 3 (F3) for total petroleum hydrocarbons
(TPH) of ASMB #5 crude oil
Figure A4-3 GC-MS chromatograms of fraction 1 (F1) for n-alkane distribution (m/z 85) of
ASMB #5 crude oil
Figure A4-4 Total ion GC-MS chromatograms of fraction 2 (F2) for determination of PAHs
of ASMB #5 crude oil
Figure A4-5 Extracted ion GC-MS chromatograms of fraction 2 (F2) for determination of the
5 target alkylated PAH homologues (m/z: 128, 142, 156, 170, 184, 178, 192,
206, 220, 234, 198, 212, 226, 166, 180, 194, 228, 242, 256, and 270) of
ASMB #5 crude oil
Figure A4-6 GC-MS chromatograms of fraction 1 (F1) for biomarker terpane analysis (m/z
191) of ASMB #5 crude oil
Figure A4-7 GC-MS chromatograms of fraction 1 (F1) for biomarker sterane analysis (m/z
217/218)
170
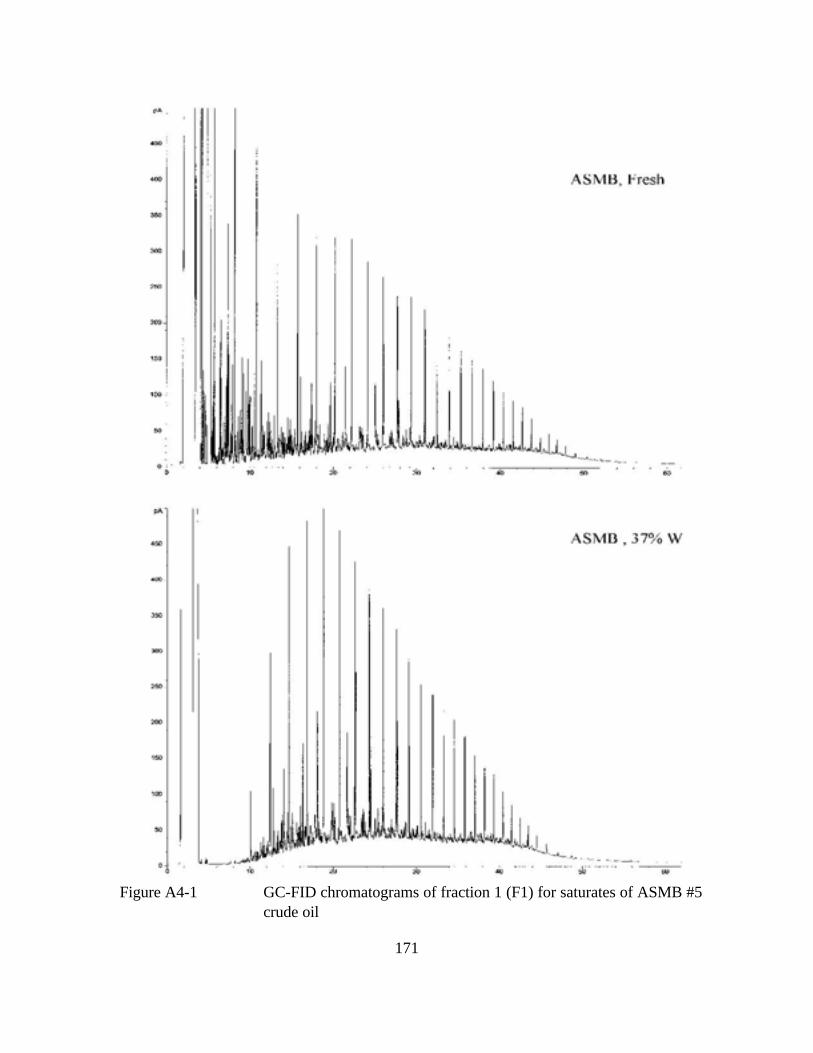
Figure A4-1 GC-FID chromatograms of fraction 1 (F1) for saturates of ASMB #5
crude oil
171
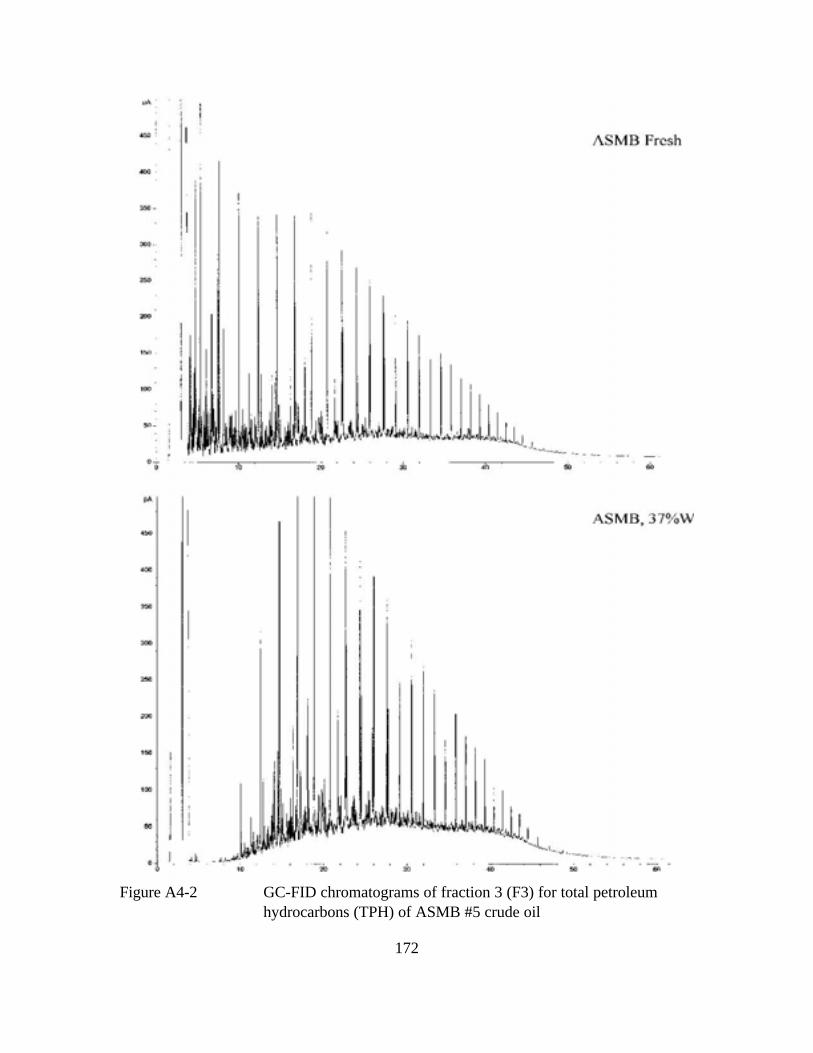
Figure A4-2 GC-FID chromatograms of fraction 3 (F3) for total petroleum
hydrocarbons (TPH) of ASMB #5 crude oil
172
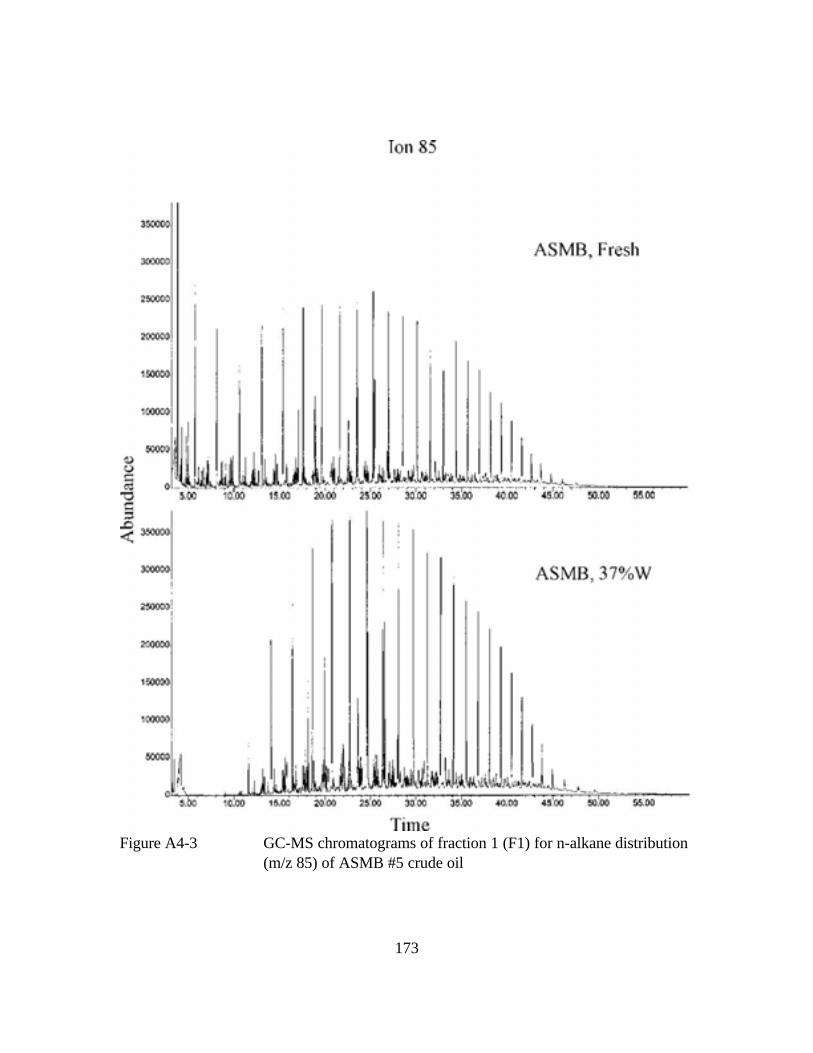
Figure A4-3 GC-MS chromatograms of fraction 1 (F1) for n-alkane distribution
(m/z 85) of ASMB #5 crude oil
173
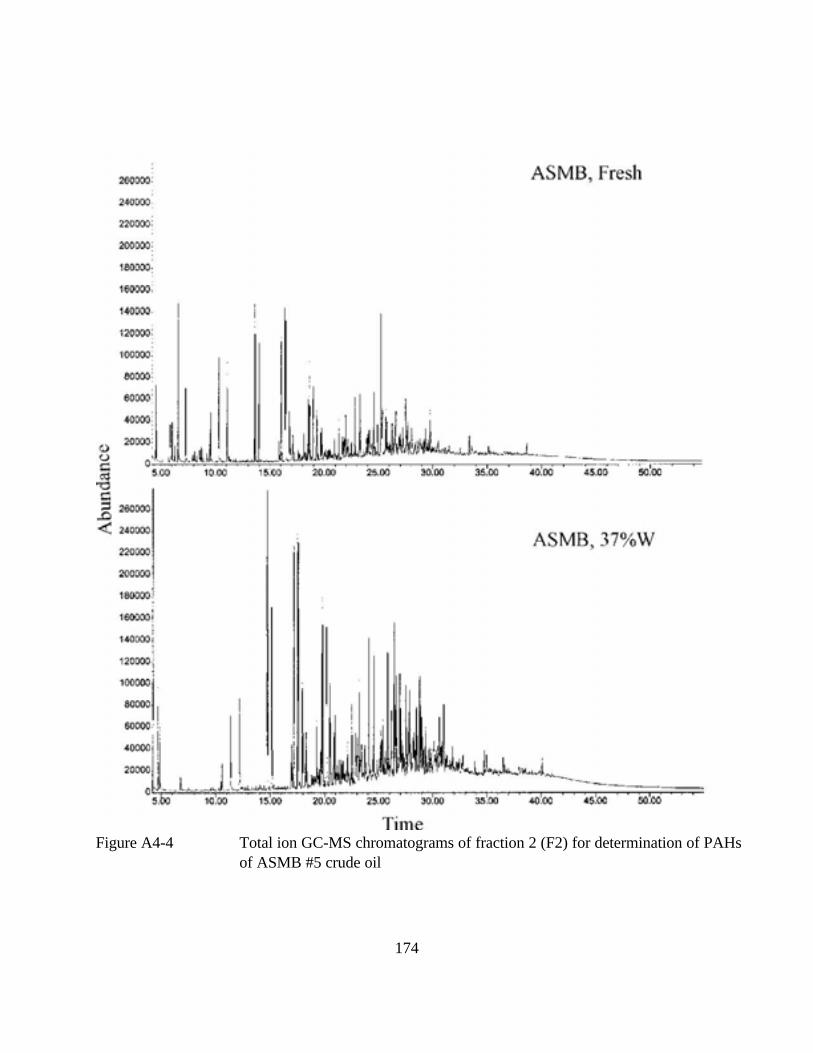
Figure A4-4 Total ion GC-MS chromatograms of fraction 2 (F2) for determination of PAHs
of ASMB #5 crude oil
174
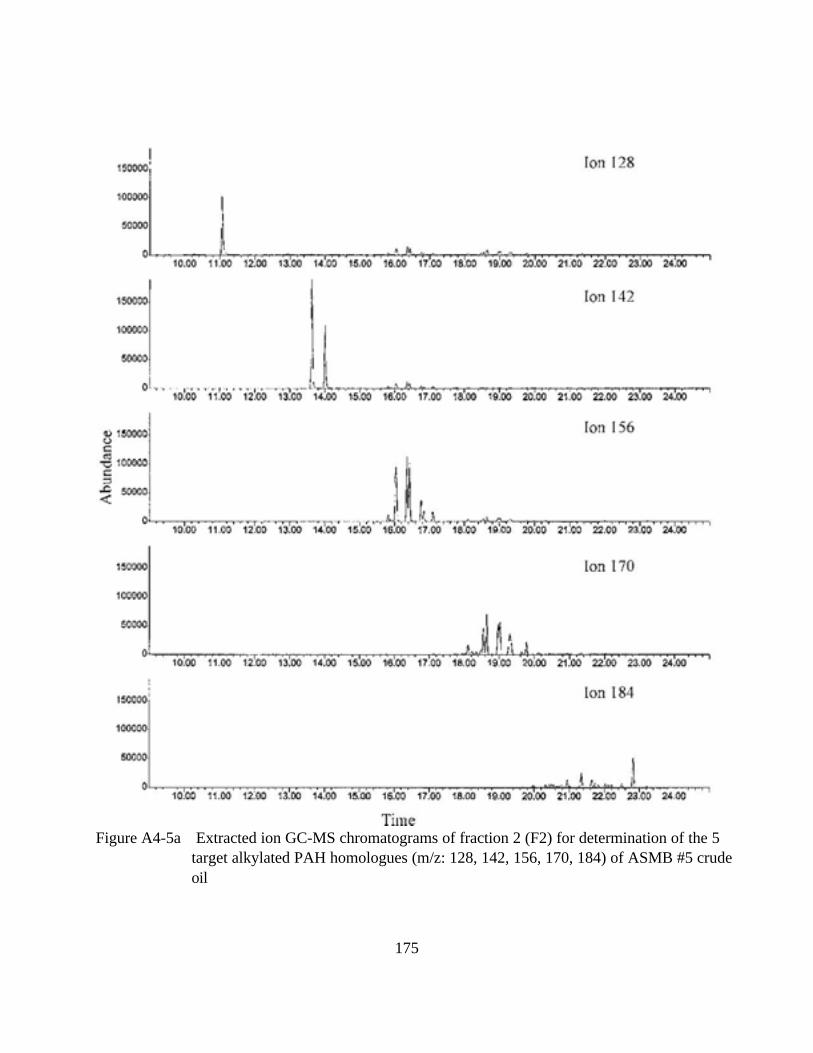
Figure A4-5a Extracted ion GC-MS chromatograms of fraction 2 (F2) for determination of the 5
target alkylated PAH homologues (m/z: 128, 142, 156, 170, 184) of ASMB #5 crude
oil
175
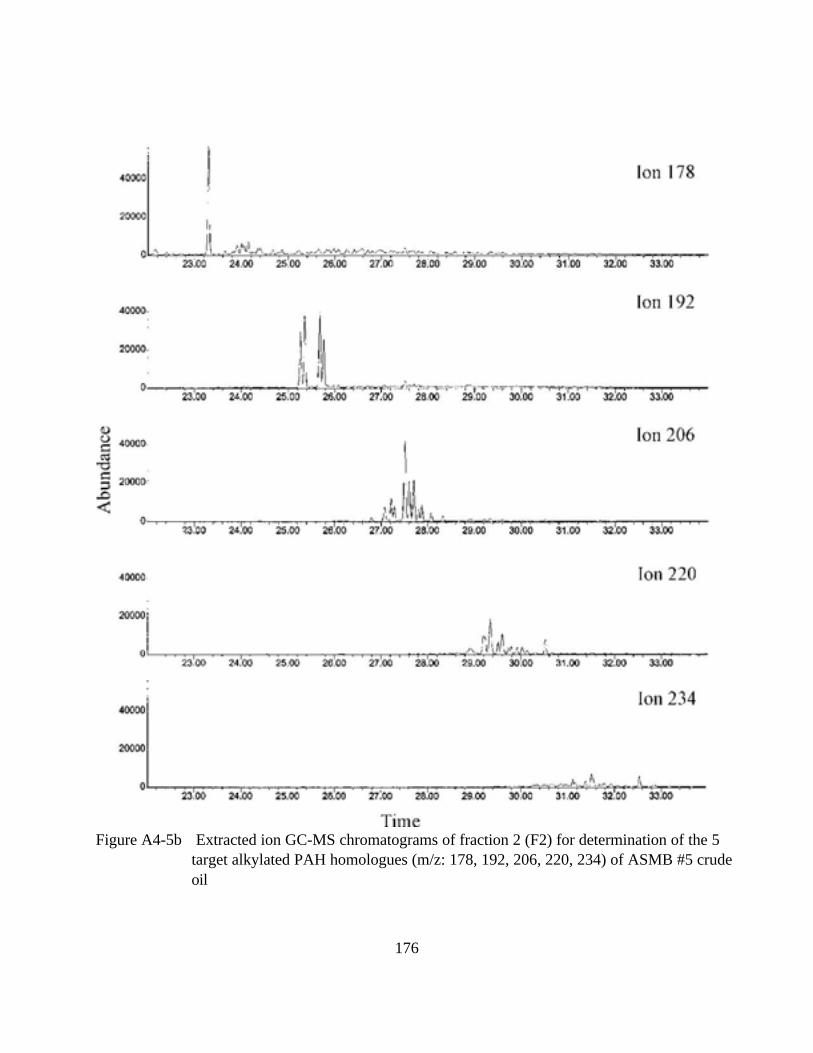
Figure A4-5b Extracted ion GC-MS chromatograms of fraction 2 (F2) for determination of the 5
target alkylated PAH homologues (m/z: 178, 192, 206, 220, 234) of ASMB #5 crude
oil
176
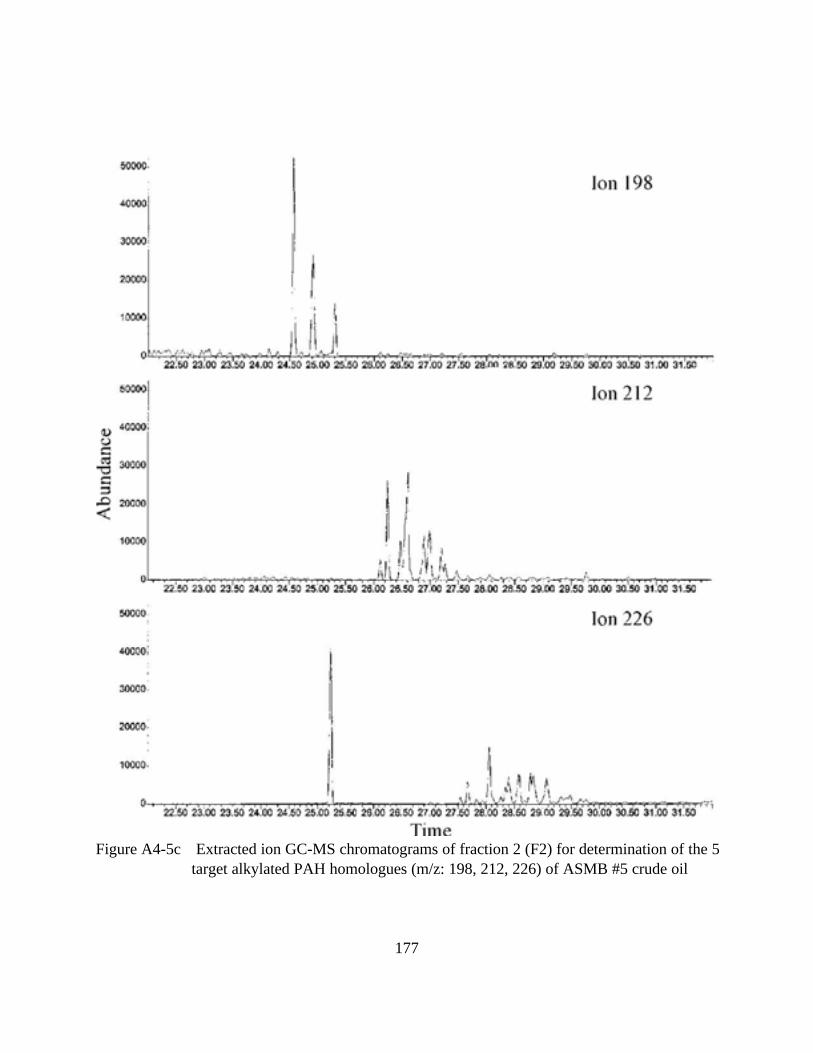
Figure A4-5c Extracted ion GC-MS chromatograms of fraction 2 (F2) for determination of the 5
target alkylated PAH homologues (m/z: 198, 212, 226) of ASMB #5 crude oil
177
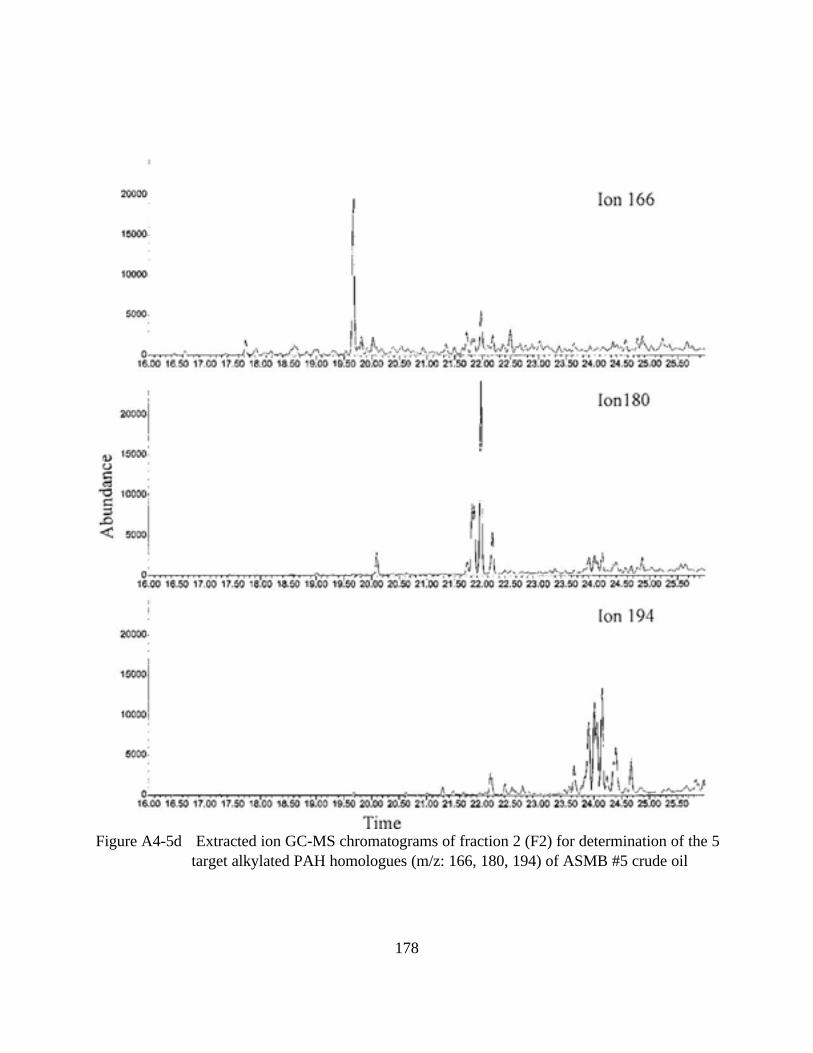
Figure A4-5d Extracted ion GC-MS chromatograms of fraction 2 (F2) for determination of the 5
target alkylated PAH homologues (m/z: 166, 180, 194) of ASMB #5 crude oil
178
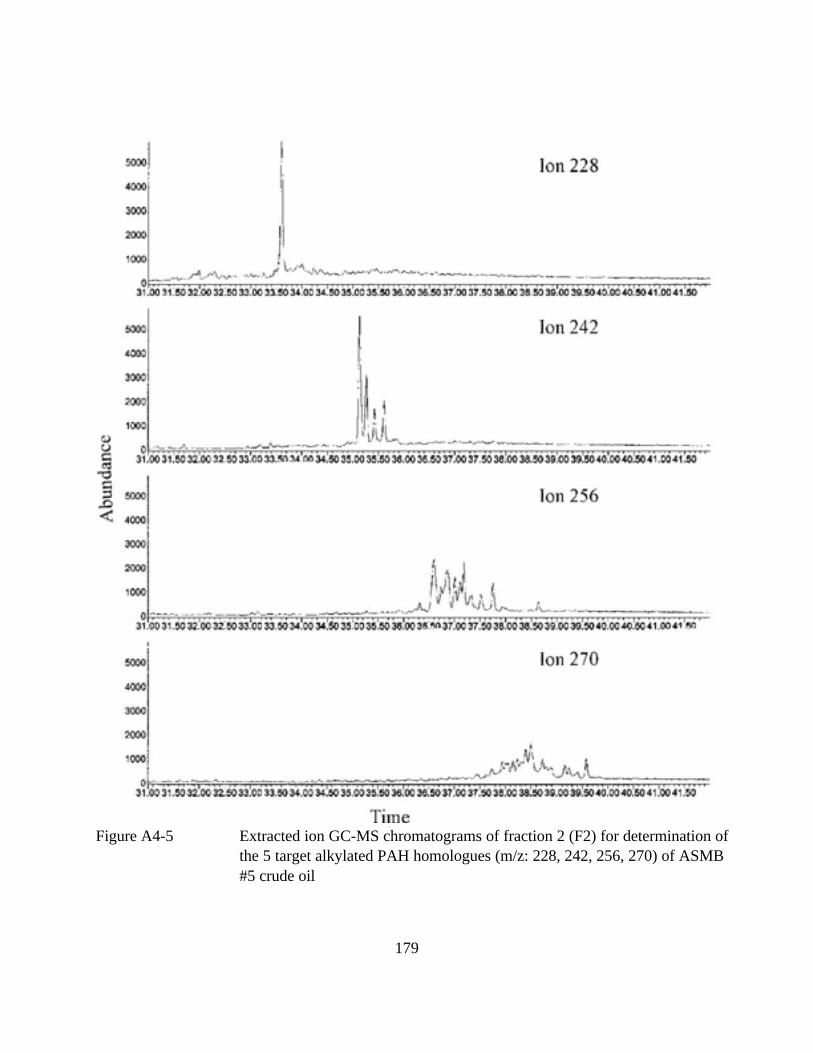
Figure A4-5 Extracted ion GC-MS chromatograms of fraction 2 (F2) for determination of
the 5 target alkylated PAH homologues (m/z: 228, 242, 256, 270) of ASMB
#5 crude oil
179
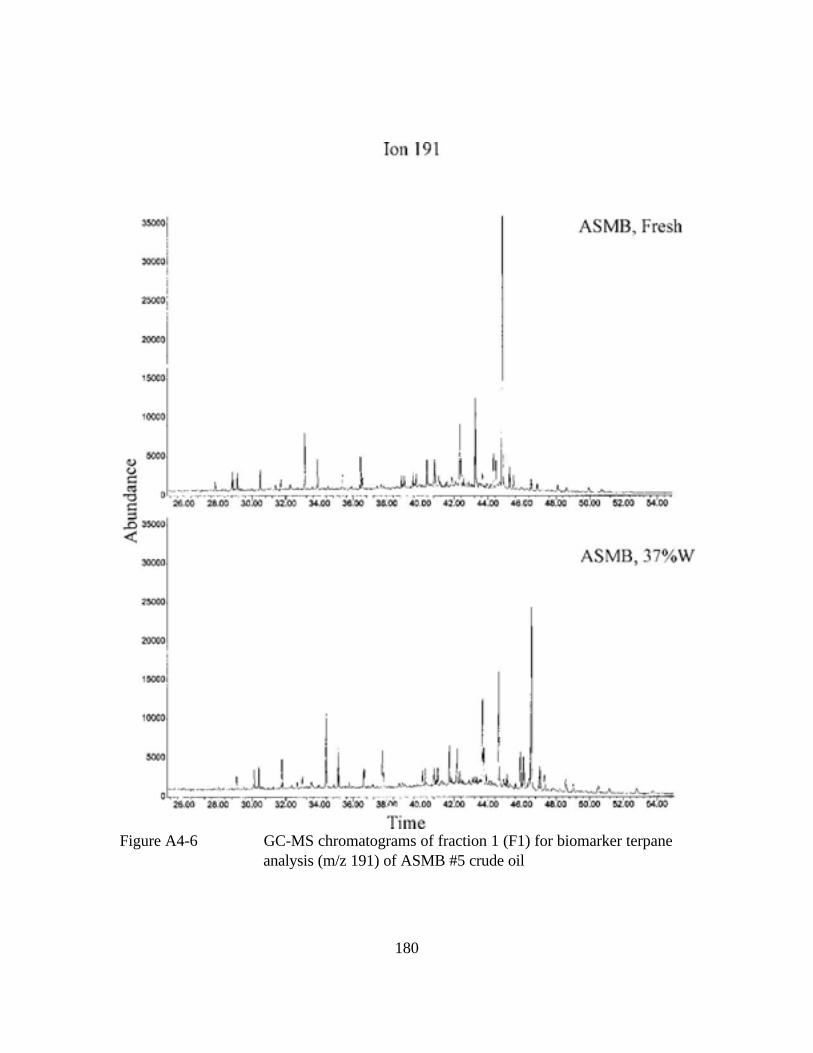
Figure A4-6 GC-MS chromatograms of fraction 1 (F1) for biomarker terpane
analysis (m/z 191) of ASMB #5 crude oil
180
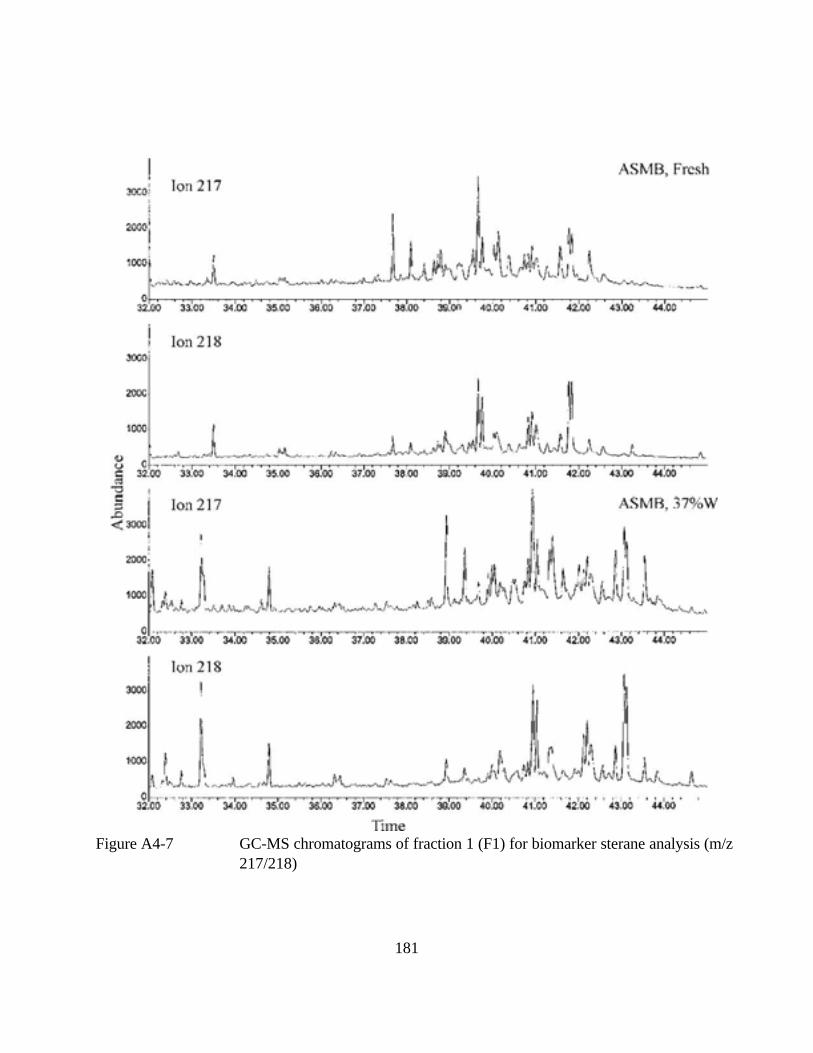
Figure A4-7 GC-MS chromatograms of fraction 1 (F1) for biomarker sterane analysis (m/z
217/218)
181
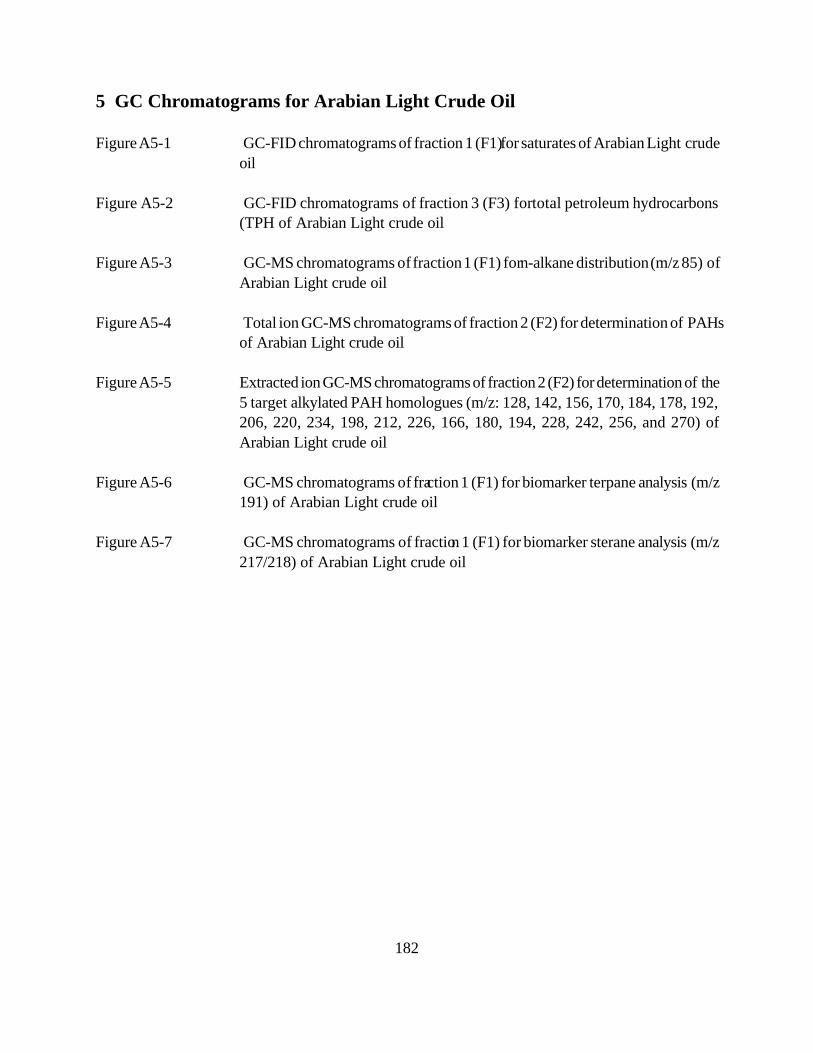
5 GC Chromatograms for Arabian Light Crude Oil
Figure A5-1 GC-FID chromatograms of fraction 1 (F1) for saturates of Arabian Light crude
oil
Figure A5-2 GC-FID chromatograms of fraction 3 (F3) for total petroleum hydrocarbons
(TPH of Arabian Light crude oil
Figure A5-3 GC-MS chromatograms of fraction 1 (F1) for n-alkane distribution (m/z 85) of
Arabian Light crude oil
Figure A5-4 Total ion GC-MS chromatograms of fraction 2 (F2) for determination of PAHs
of Arabian Light crude oil
Figure A5-5 Extracted ion GC-MS chromatograms of fraction 2 (F2) for determination of the
5 target alkylated PAH homologues (m/z: 128, 142, 156, 170, 184, 178, 192,
206, 220, 234, 198, 212, 226, 166, 180, 194, 228, 242, 256, and 270) of
Arabian Light crude oil
Figure A5-6 GC-MS chromatograms of fraction 1 (F1) for biomarker terpane analysis (m/z
191) of Arabian Light crude oil
Figure A5-7 GC-MS chromatograms of fraction 1 (F1) for biomarker sterane analysis (m/z
217/218) of Arabian Light crude oil
182
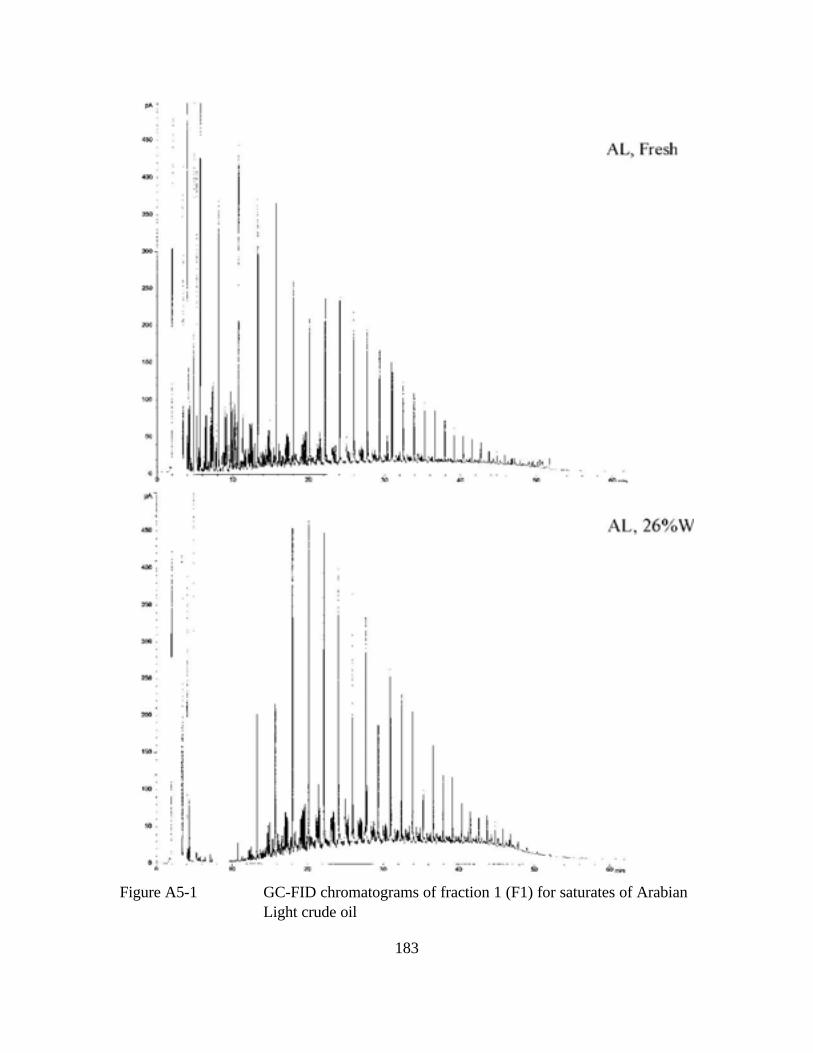
Figure A5-1 GC-FID chromatograms of fraction 1 (F1) for saturates of Arabian
Light crude oil
183
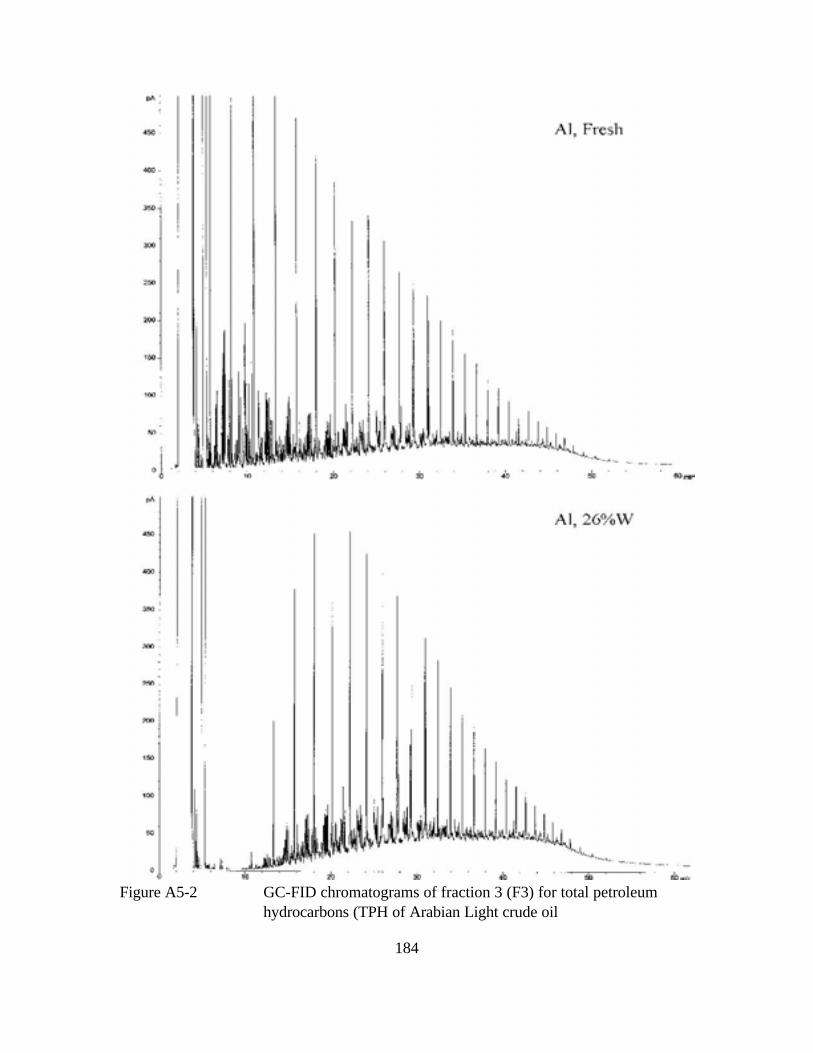
Figure A5-2 GC-FID chromatograms of fraction 3 (F3) for total petroleum
hydrocarbons (TPH of Arabian Light crude oil
184
Figure A5-3 GC-MS chromatograms of fraction 1 (F1) for n-alkane distribution (m/z 85) of
Arabian Light crude oil
185
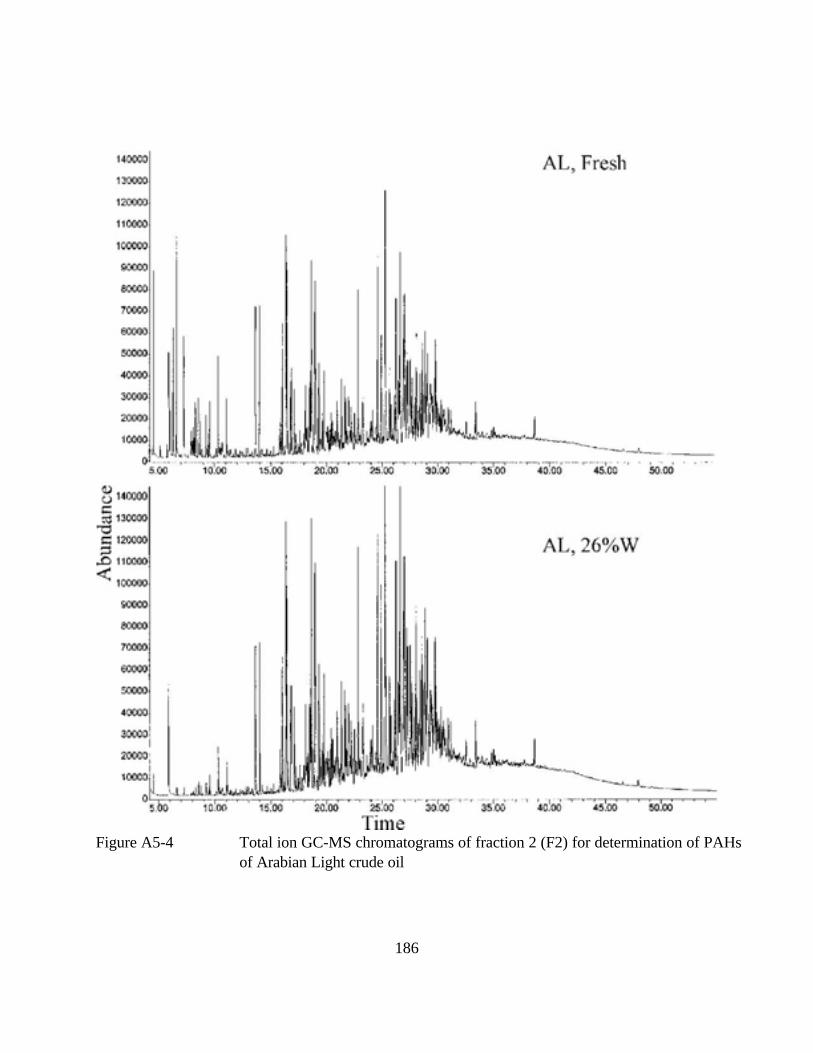
Figure A5-4 Total ion GC-MS chromatograms of fraction 2 (F2) for determination of PAHs
of Arabian Light crude oil
186
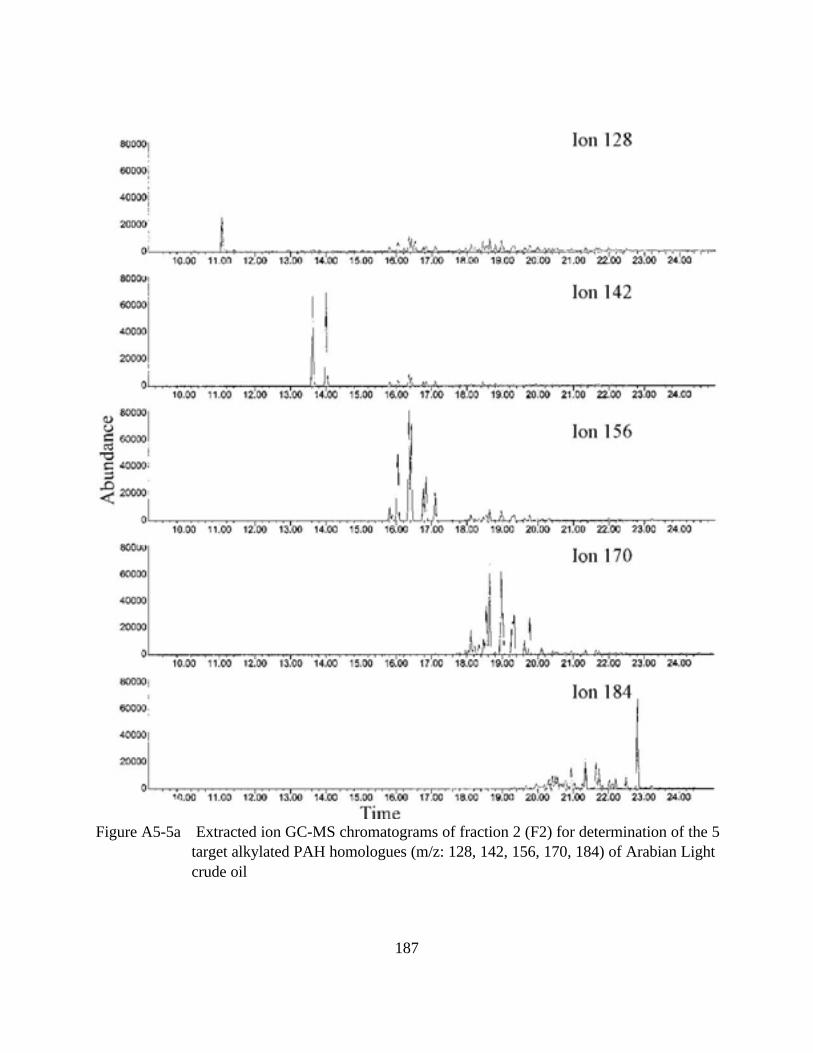
Figure A5-5a Extracted ion GC-MS chromatograms of fraction 2 (F2) for determination of the 5
target alkylated PAH homologues (m/z: 128, 142, 156, 170, 184) of Arabian Light
crude oil
187
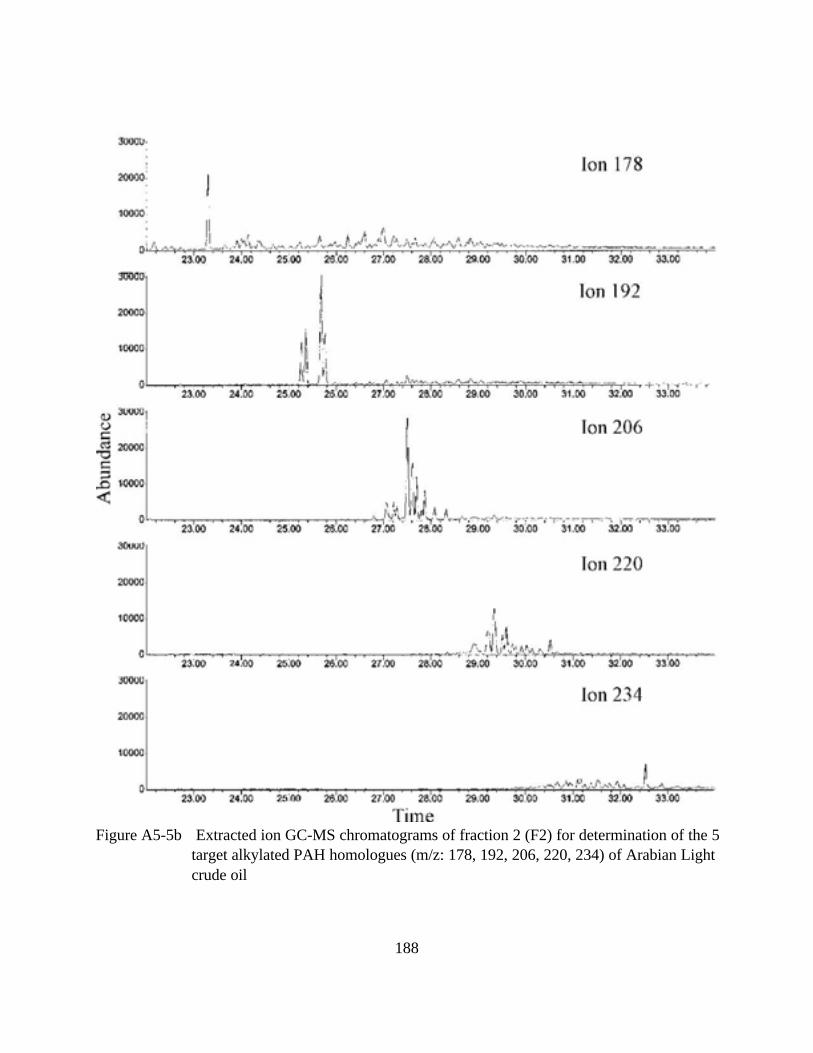
Figure A5-5b Extracted ion GC-MS chromatograms of fraction 2 (F2) for determination of the 5
target alkylated PAH homologues (m/z: 178, 192, 206, 220, 234) of Arabian Light
crude oil
188
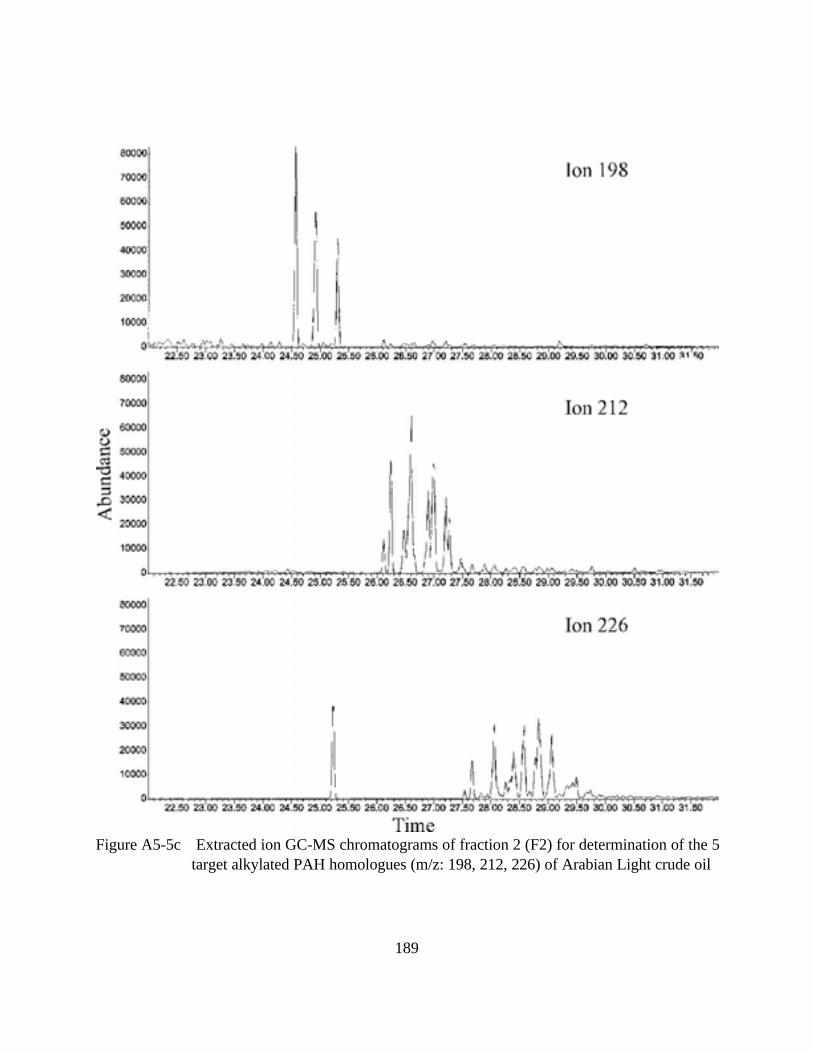
Figure A5-5c Extracted ion GC-MS chromatograms of fraction 2 (F2) for determination of the 5
target alkylated PAH homologues (m/z: 198, 212, 226) of Arabian Light crude oil
189
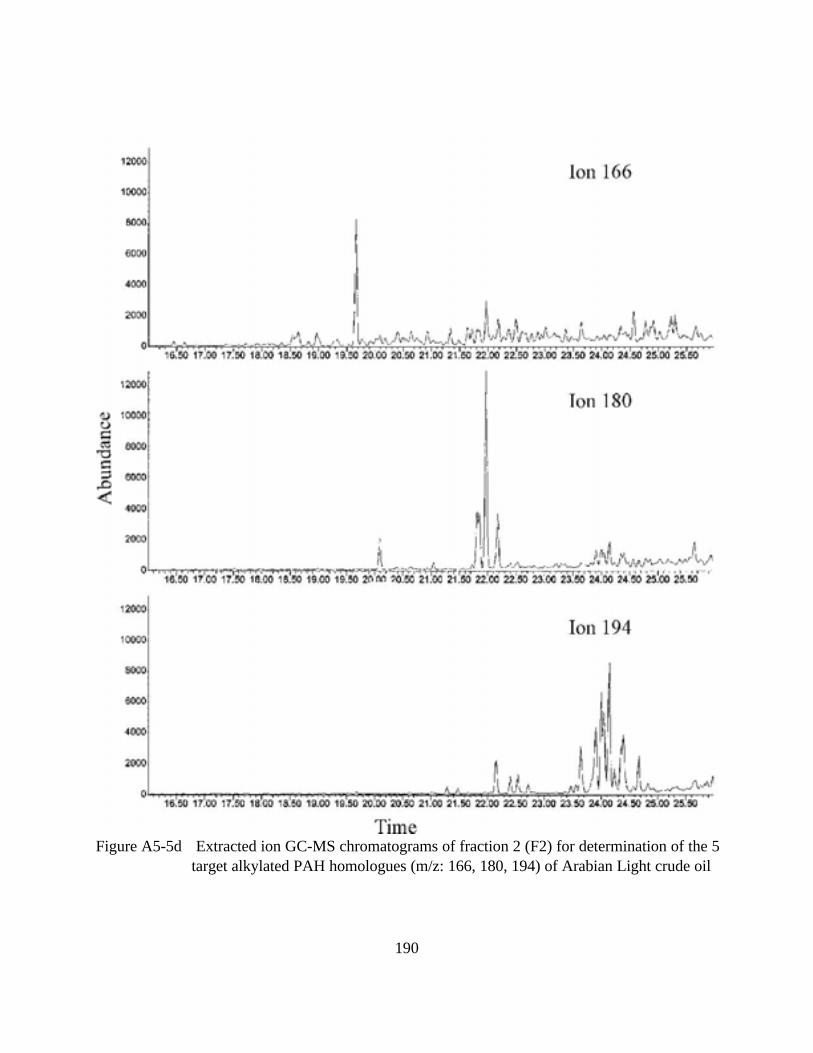
Figure A5-5d Extracted ion GC-MS chromatograms of fraction 2 (F2) for determination of the 5
target alkylated PAH homologues (m/z: 166, 180, 194) of Arabian Light crude oil
190
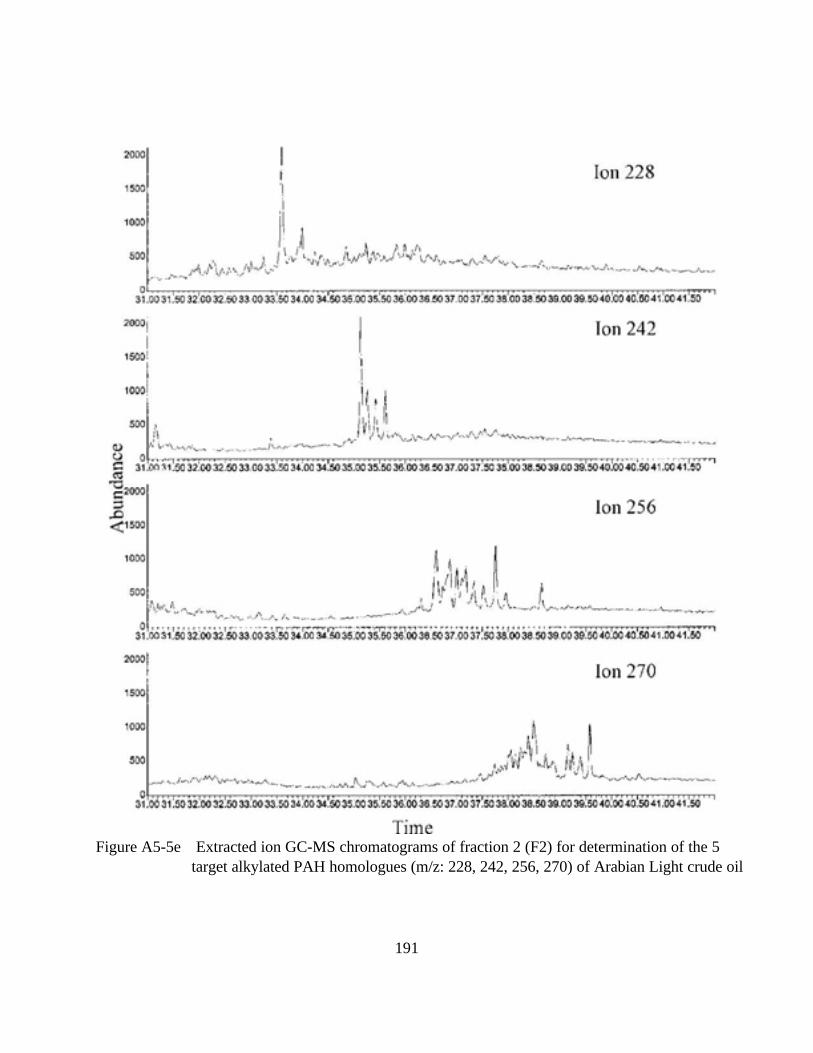
Figure A5-5e Extracted ion GC-MS chromatograms of fraction 2 (F2) for determination of the 5
target alkylated PAH homologues (m/z: 228, 242, 256, 270) of Arabian Light crude oil
191
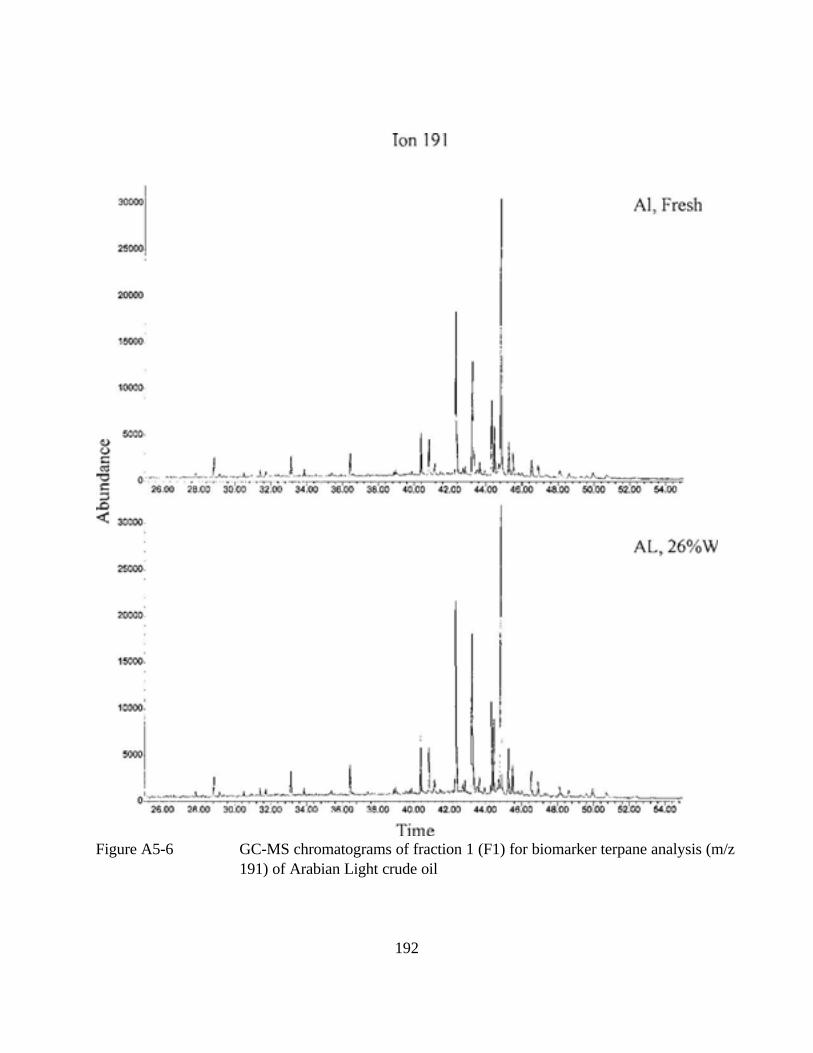
Figure A5-6 GC-MS chromatograms of fraction 1 (F1) for biomarker terpane analysis (m/z
191) of Arabian Light crude oil
192
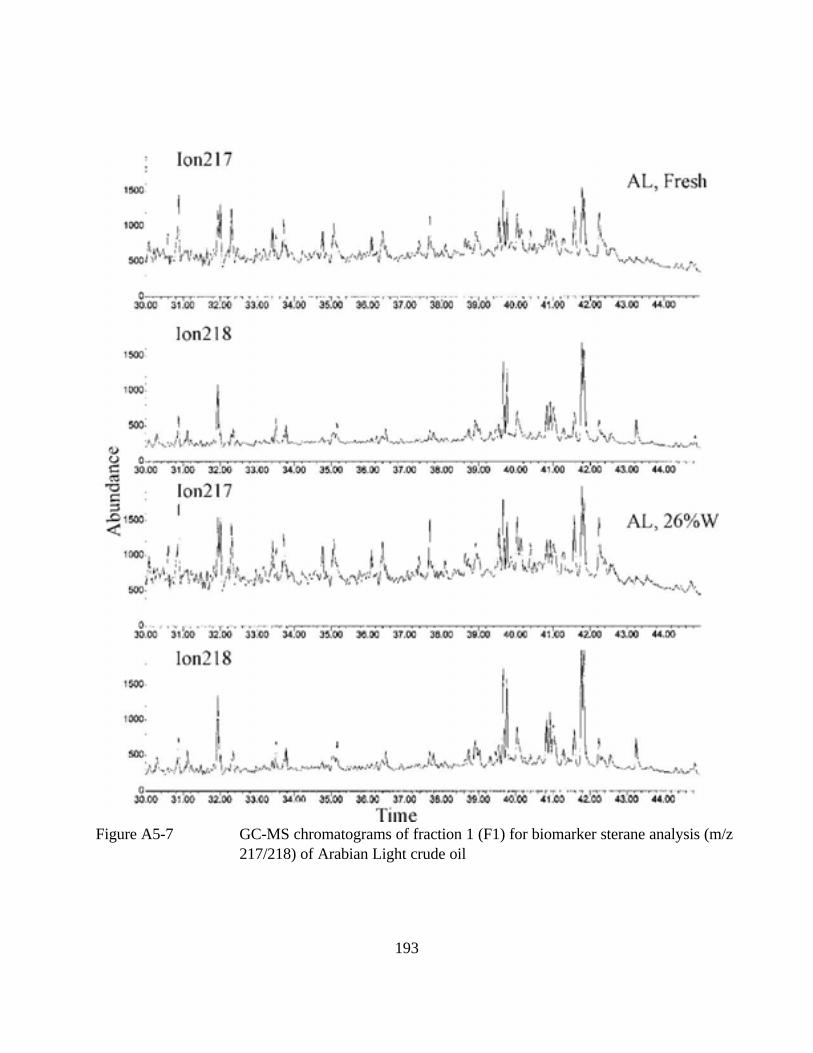
Figure A5-7 GC-MS chromatograms of fraction 1 (F1) for biomarker sterane analysis (m/z
217/218) of Arabian Light crude oil
193
6 GC Chromatograms for Sockeye Crude Oil
Figure A6-1 GC-FID chromatograms of fraction 1 (F1) for saturates of Sockeye crude oil
Figure A6-2 GC-FID chromatograms of fraction 3 (F3) for total petroleum hydrocarbons
(TPH) of Sockeye crude oil
Figure A6-3 GC-MS chromatograms of fraction 1 (F1) for n-alkane distribution (m/z 85) of
Sockeye crude oil
Figure A6-4 Total ion GC-MS chromatograms of fraction 2 (F2) for determination of PAHs
of Sockeye crude oil
Figure A6-5 Extracted ion GC-MS chromatograms of fraction 2 (F2) for determination of the
5 target alkylated PAH homologues (m/z: 128, 142, 156, 170, 184, 178, 192,
206, 220, 234, 198, 212, 226, 166, 180, 194, 228, 242, 256, and 270) of
Sockeye crude oil
Figure A6-6 GC-MS chromatograms of fraction 1 (F1) for biomarker terpane analysis (m/z
191) of Sockeye crude oil
Figure A6-7 GC-MS chromatograms of fraction 1 (F1) for biomarker sterane analysis (m/z
217/218) of Sockeye crude oil
194
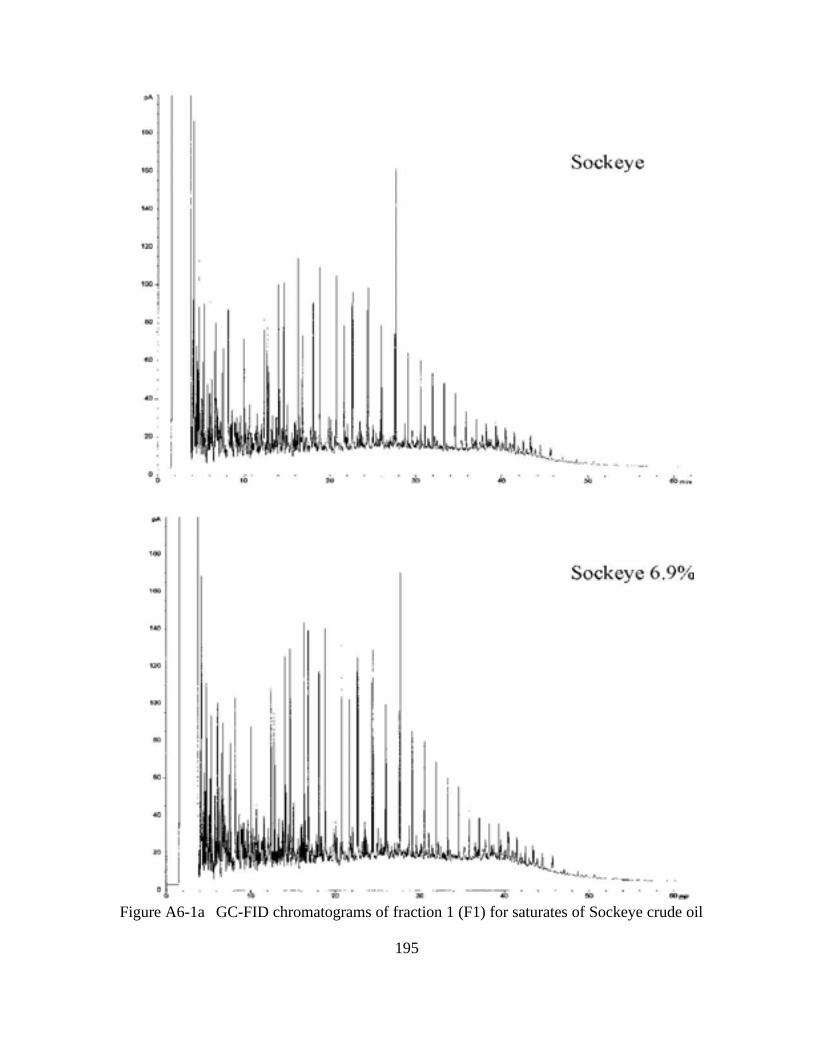
Figure A6-1a GC-FID chromatograms of fraction 1 (F1) for saturates of Sockeye crude oil
195
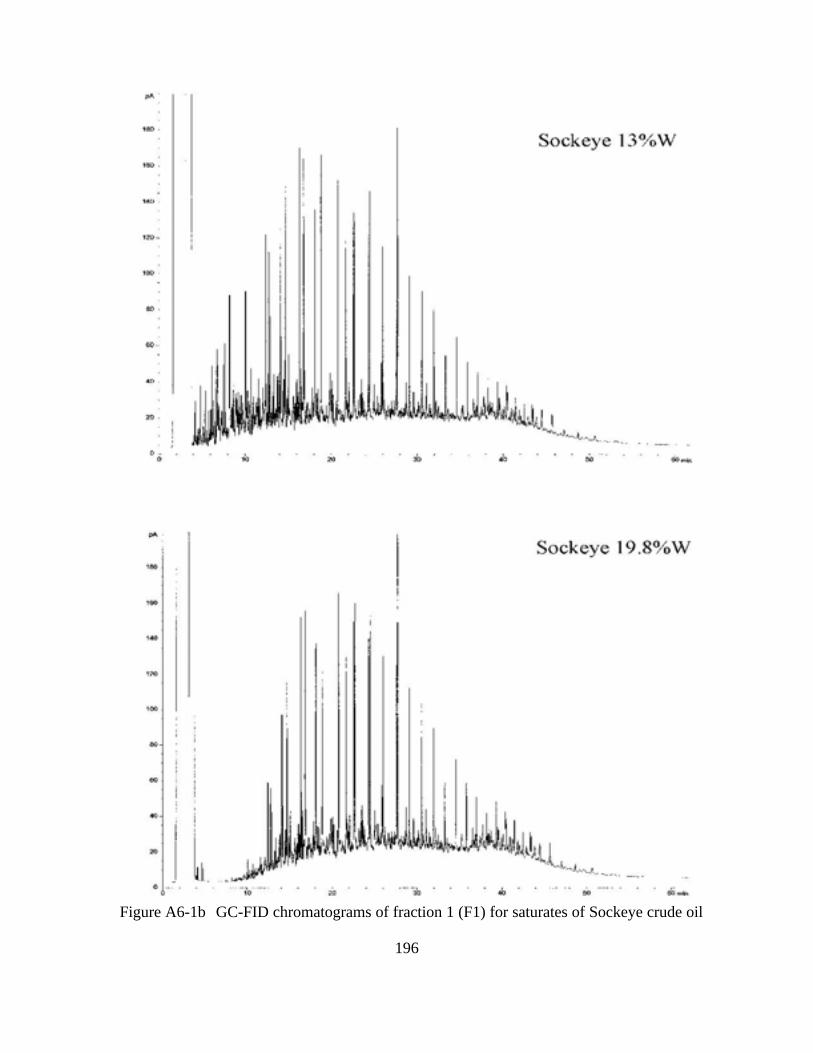
Figure A6-1b GC-FID chromatograms of fraction 1 (F1) for saturates of Sockeye crude oil
196
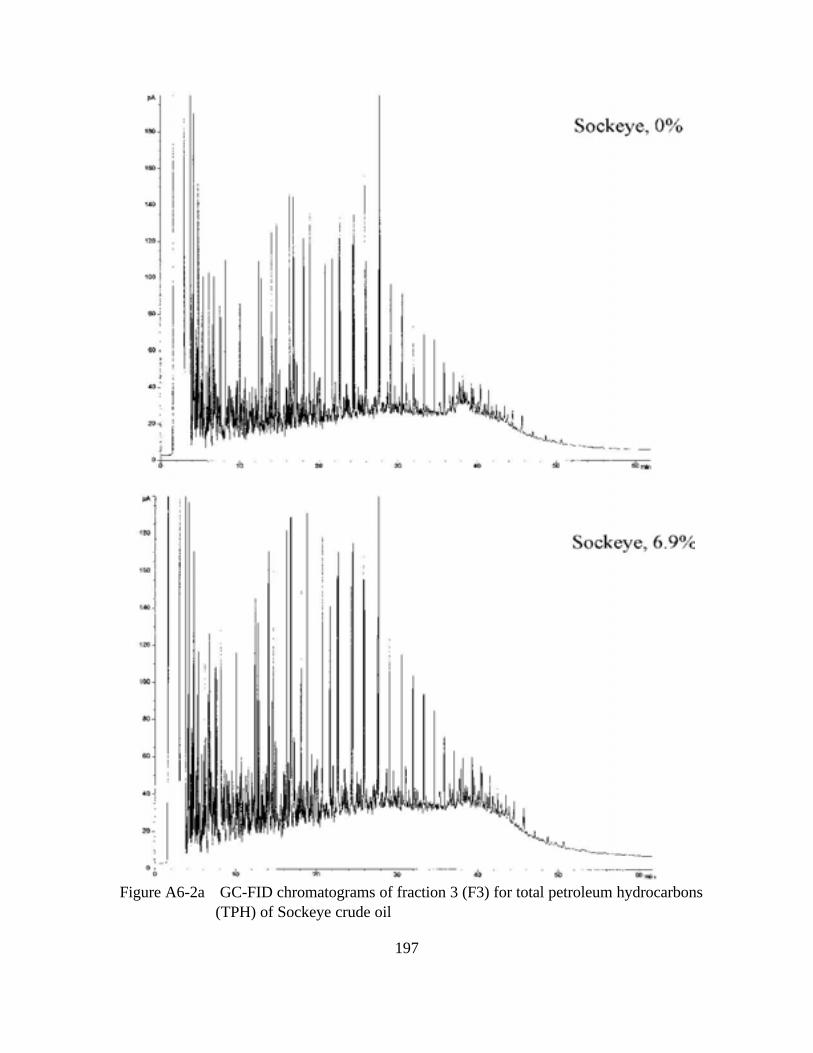
Figure A6-2a GC-FID chromatograms of fraction 3 (F3) for total petroleum hydrocarbons
(TPH) of Sockeye crude oil
197
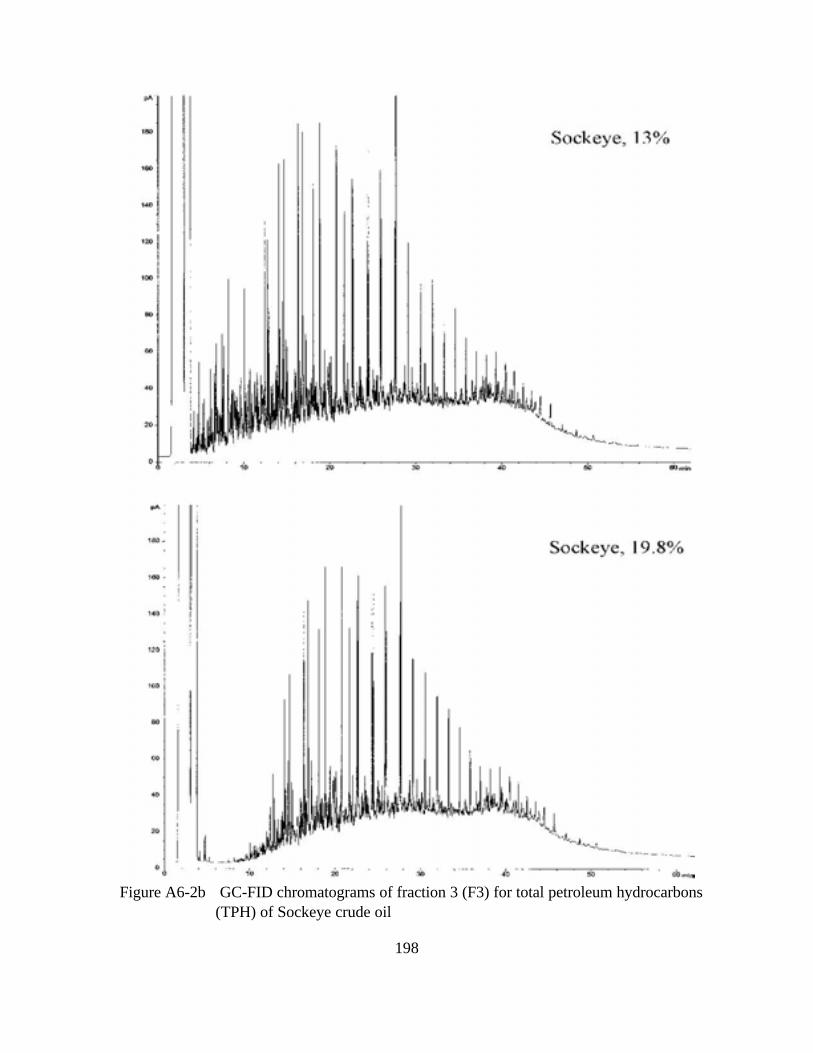
Figure A6-2b GC-FID chromatograms of fraction 3 (F3) for total petroleum hydrocarbons
(TPH) of Sockeye crude oil
198
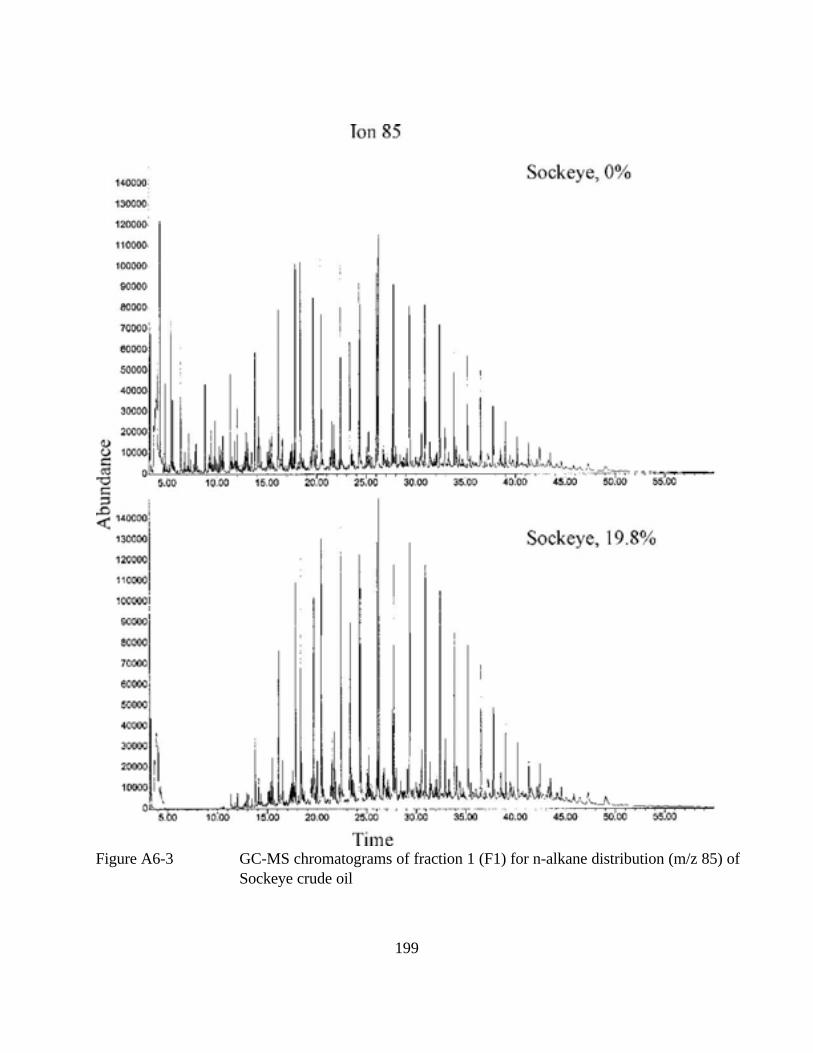
Figure A6-3 GC-MS chromatograms of fraction 1 (F1) for n-alkane distribution (m/z 85) of
Sockeye crude oil
199
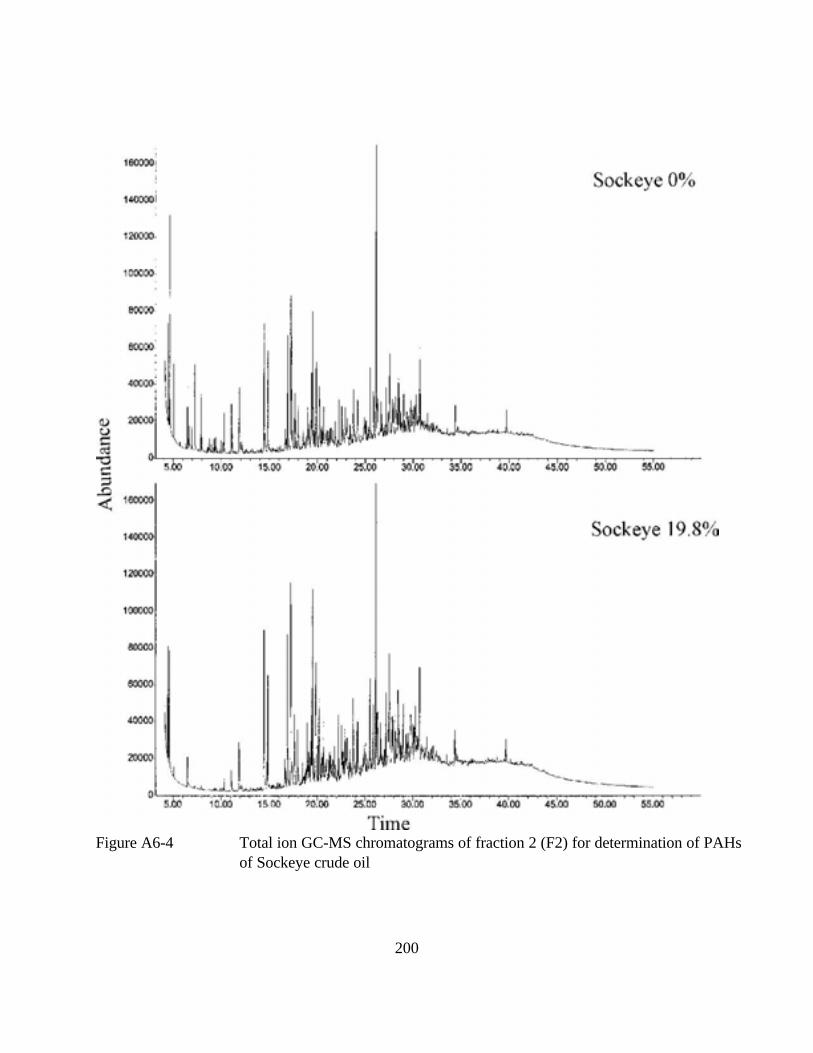
Figure A6-4 Total ion GC-MS chromatograms of fraction 2 (F2) for determination of PAHs
of Sockeye crude oil
200
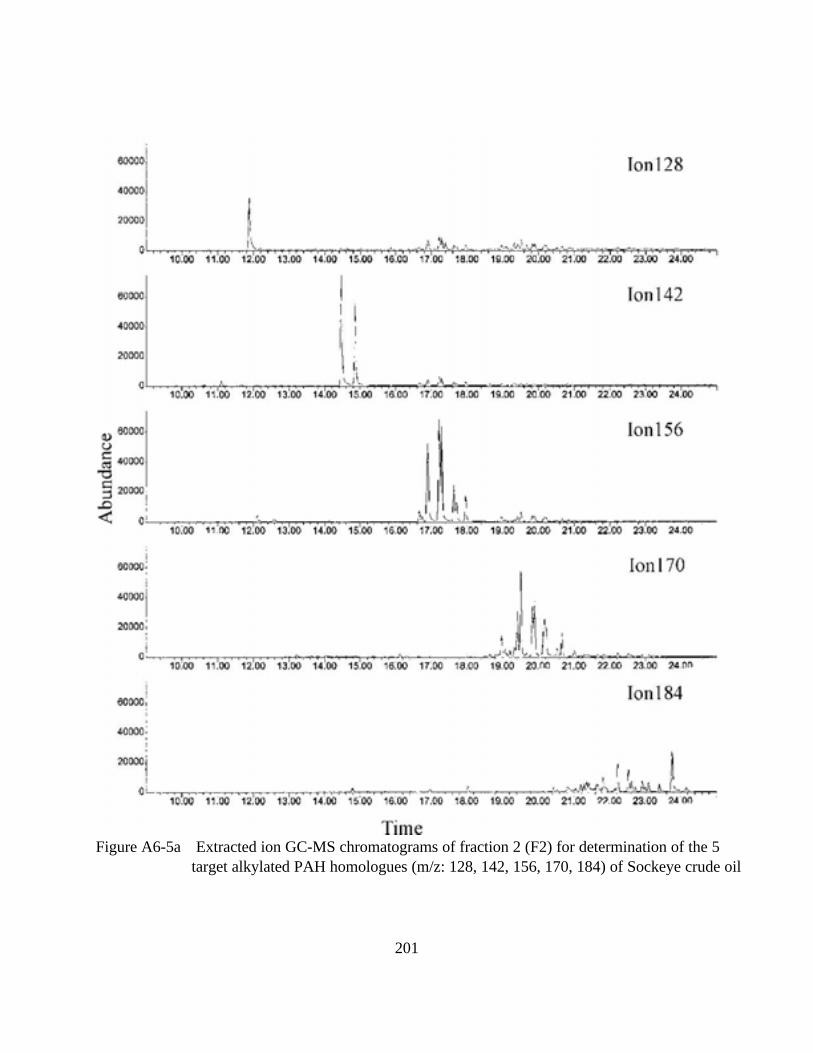
Figure A6-5a Extracted ion GC-MS chromatograms of fraction 2 (F2) for determination of the 5
target alkylated PAH homologues (m/z: 128, 142, 156, 170, 184) of Sockeye crude oil
201
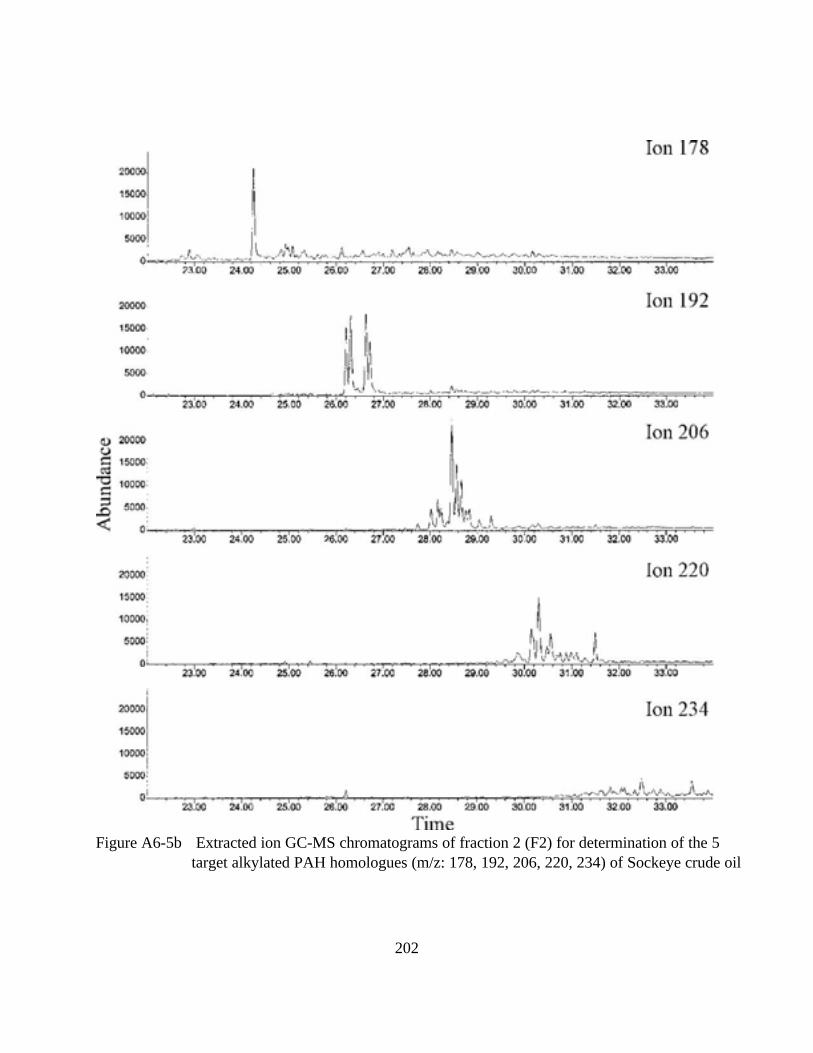
Figure A6-5b Extracted ion GC-MS chromatograms of fraction 2 (F2) for determination of the 5
target alkylated PAH homologues (m/z: 178, 192, 206, 220, 234) of Sockeye crude oil
202
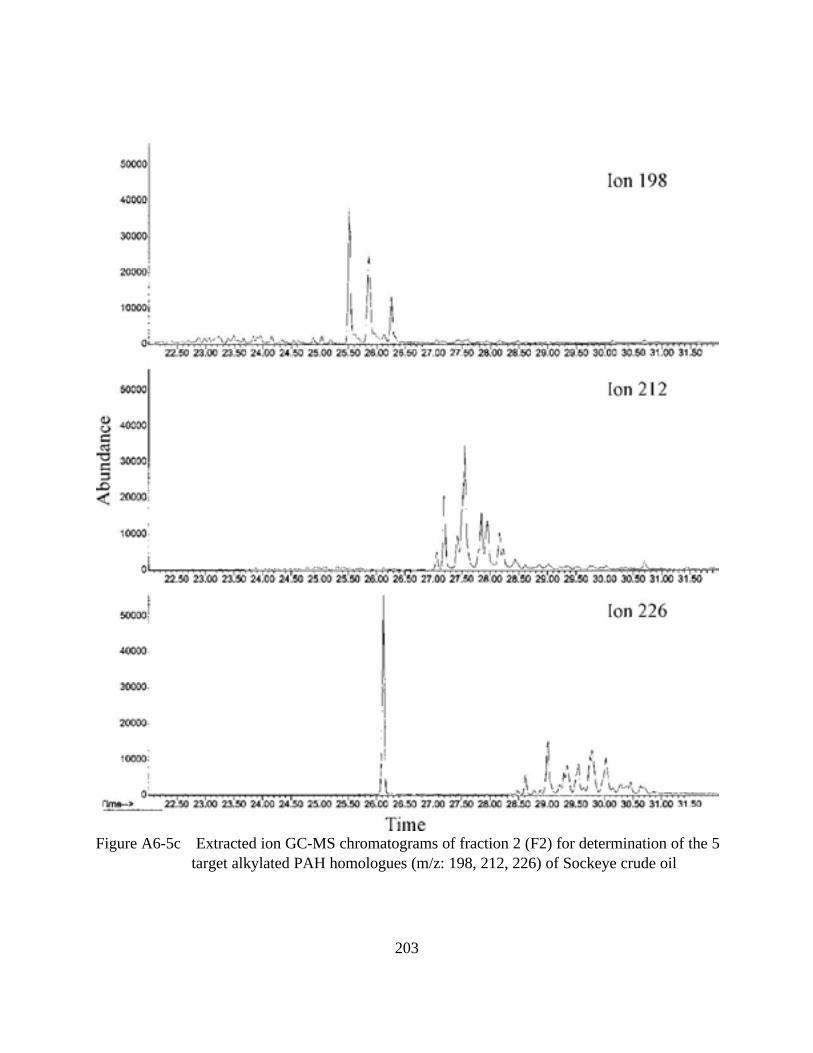
Figure A6-5c Extracted ion GC-MS chromatograms of fraction 2 (F2) for determination of the 5
target alkylated PAH homologues (m/z: 198, 212, 226) of Sockeye crude oil
203
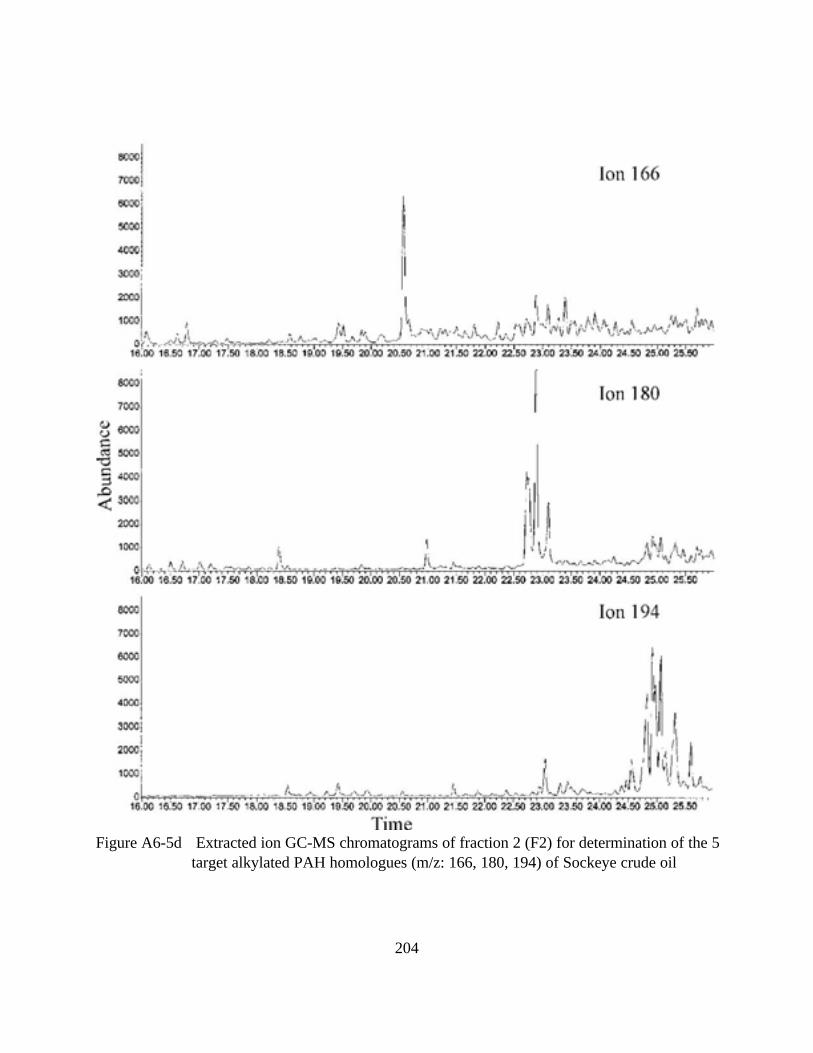
Figure A6-5d Extracted ion GC-MS chromatograms of fraction 2 (F2) for determination of the 5
target alkylated PAH homologues (m/z: 166, 180, 194) of Sockeye crude oil
204
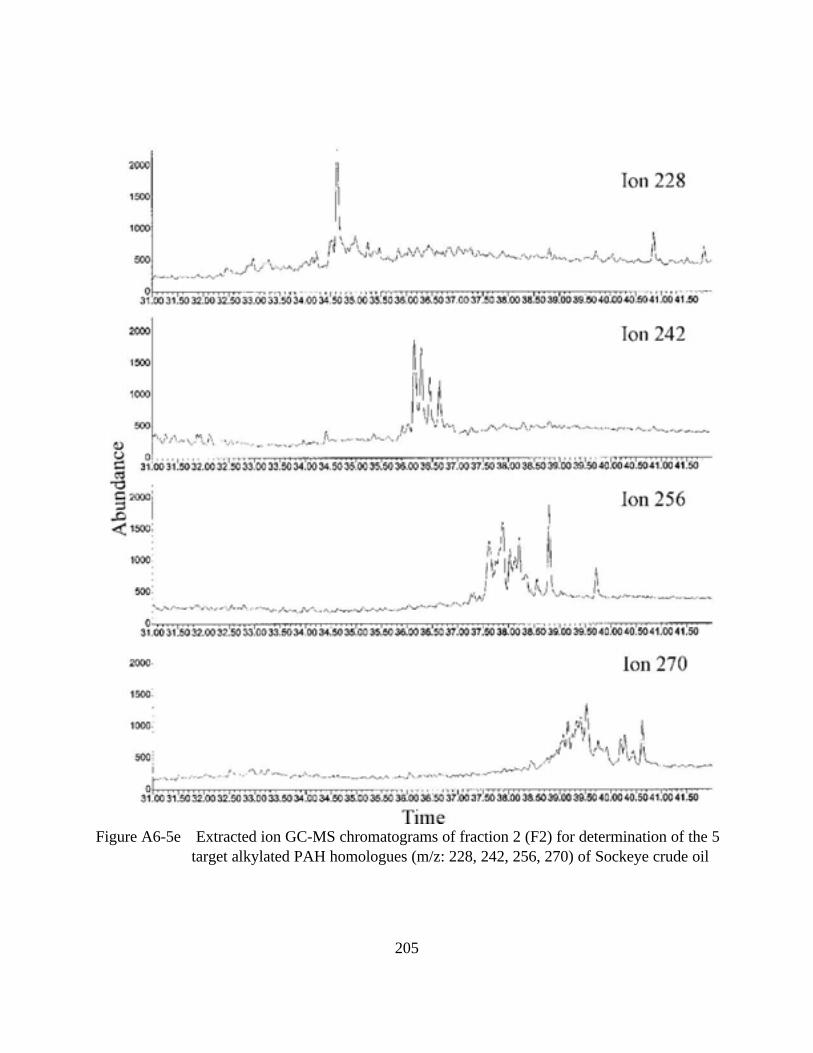
Figure A6-5e Extracted ion GC-MS chromatograms of fraction 2 (F2) for determination of the 5
target alkylated PAH homologues (m/z: 228, 242, 256, 270) of Sockeye crude oil
205
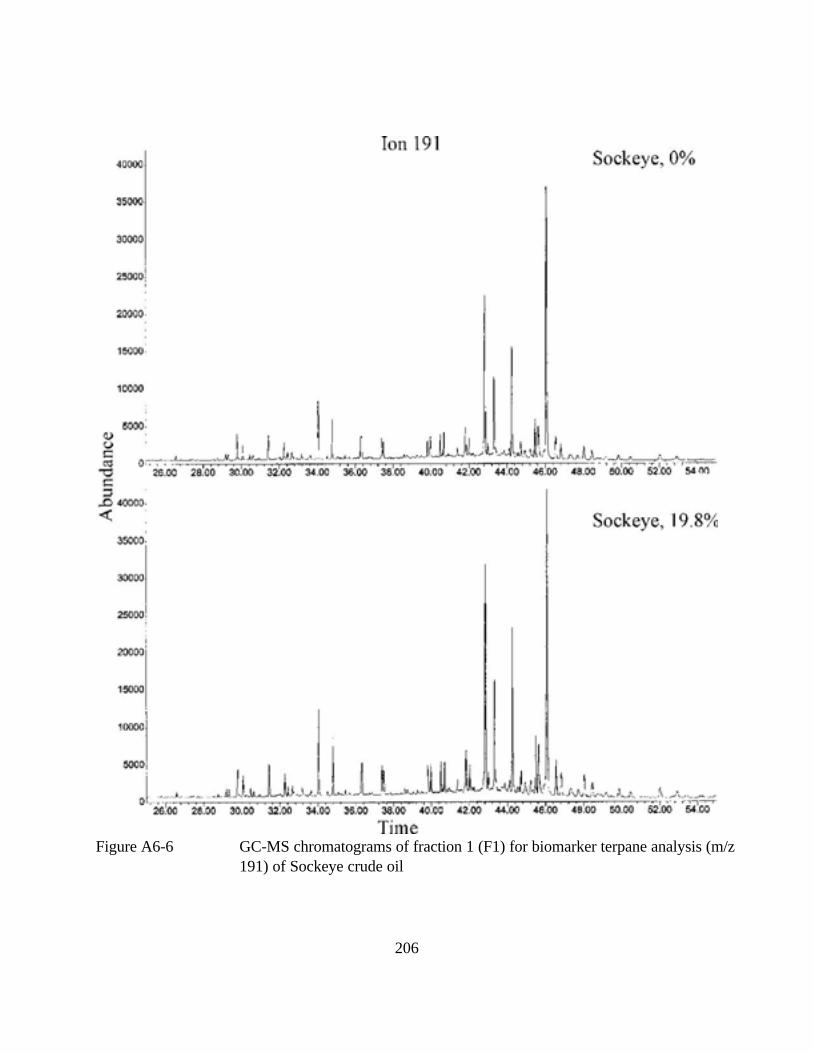
Figure A6-6 GC-MS chromatograms of fraction 1 (F1) for biomarker terpane analysis (m/z
191) of Sockeye crude oil
206
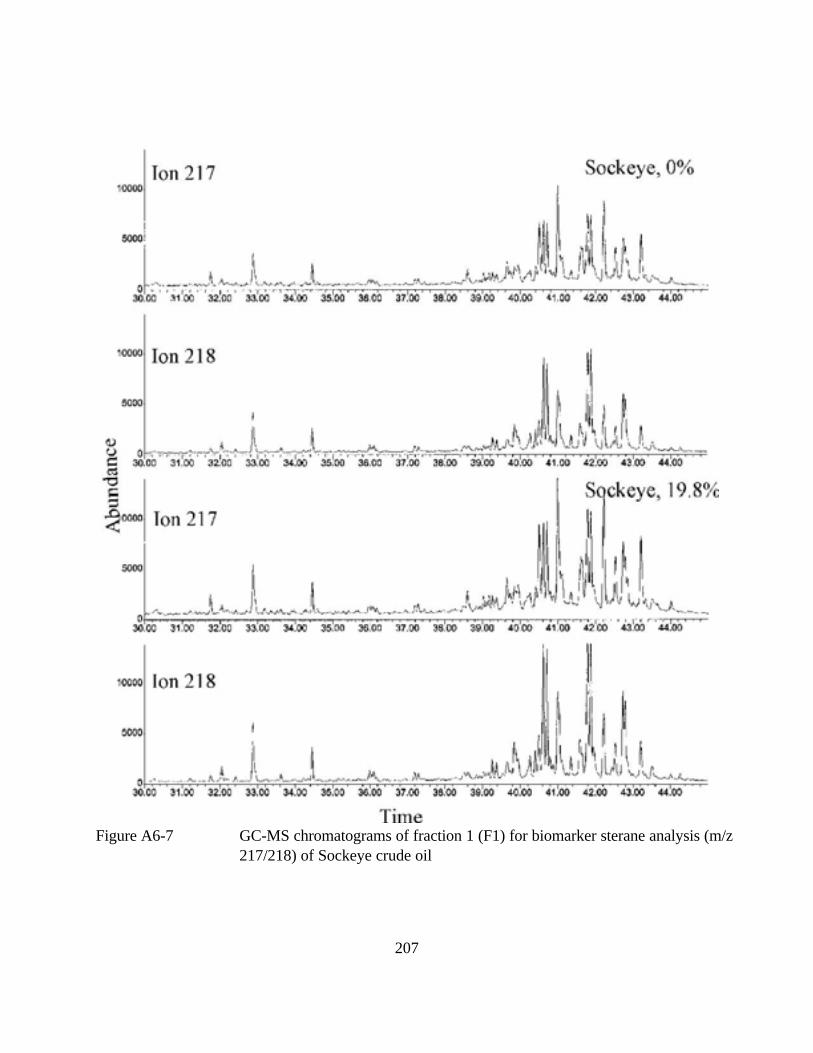
Figure A6-7 GC-MS chromatograms of fraction 1 (F1) for biomarker sterane analysis (m/z
217/218) of Sockeye crude oil
207
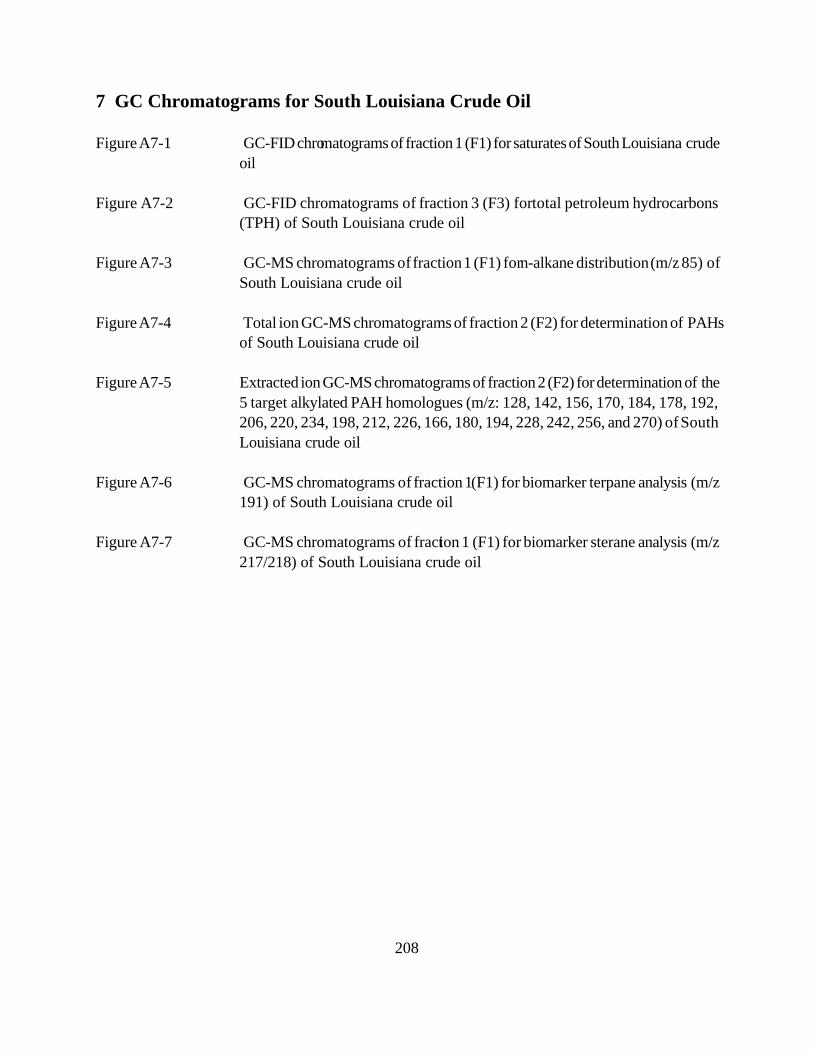
7 GC Chromatograms for South Louisiana Crude Oil
Figure A7-1 GC-FID chromatograms of fraction 1 (F1) for saturates of South Louisiana crude
oil
Figure A7-2 GC-FID chromatograms of fraction 3 (F3) for total petroleum hydrocarbons
(TPH) of South Louisiana crude oil
Figure A7-3 GC-MS chromatograms of fraction 1 (F1) for n-alkane distribution (m/z 85) of
South Louisiana crude oil
Figure A7-4 Total ion GC-MS chromatograms of fraction 2 (F2) for determination of PAHs
of South Louisiana crude oil
Figure A7-5 Extracted ion GC-MS chromatograms of fraction 2 (F2) for determination of the
5 target alkylated PAH homologues (m/z: 128, 142, 156, 170, 184, 178, 192,
206, 220, 234, 198, 212, 226, 166, 180, 194, 228, 242, 256, and 270) of South
Louisiana crude oil
Figure A7-6 GC-MS chromatograms of fraction 1 (F1) for biomarker terpane analysis (m/z
191) of South Louisiana crude oil
Figure A7-7 GC-MS chromatograms of fraction 1 (F1) for biomarker sterane analysis (m/z
217/218) of South Louisiana crude oil
208
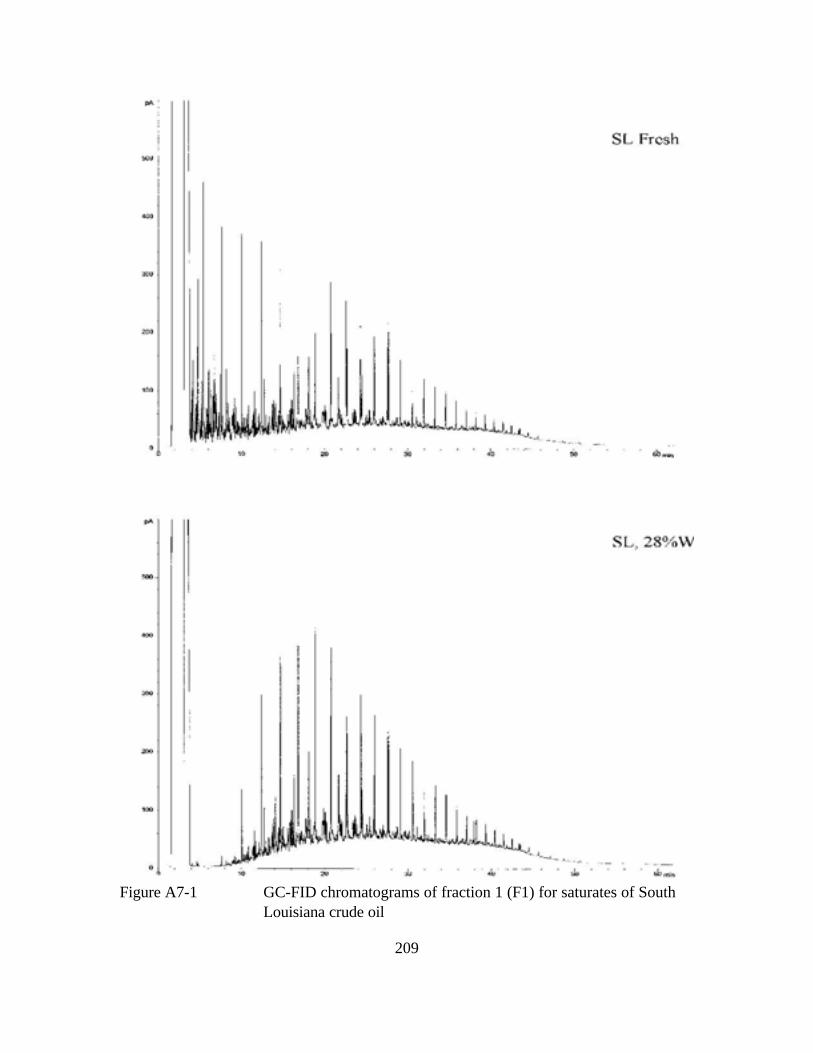
Figure A7-1 GC-FID chromatograms of fraction 1 (F1) for saturates of South
Louisiana crude oil
209
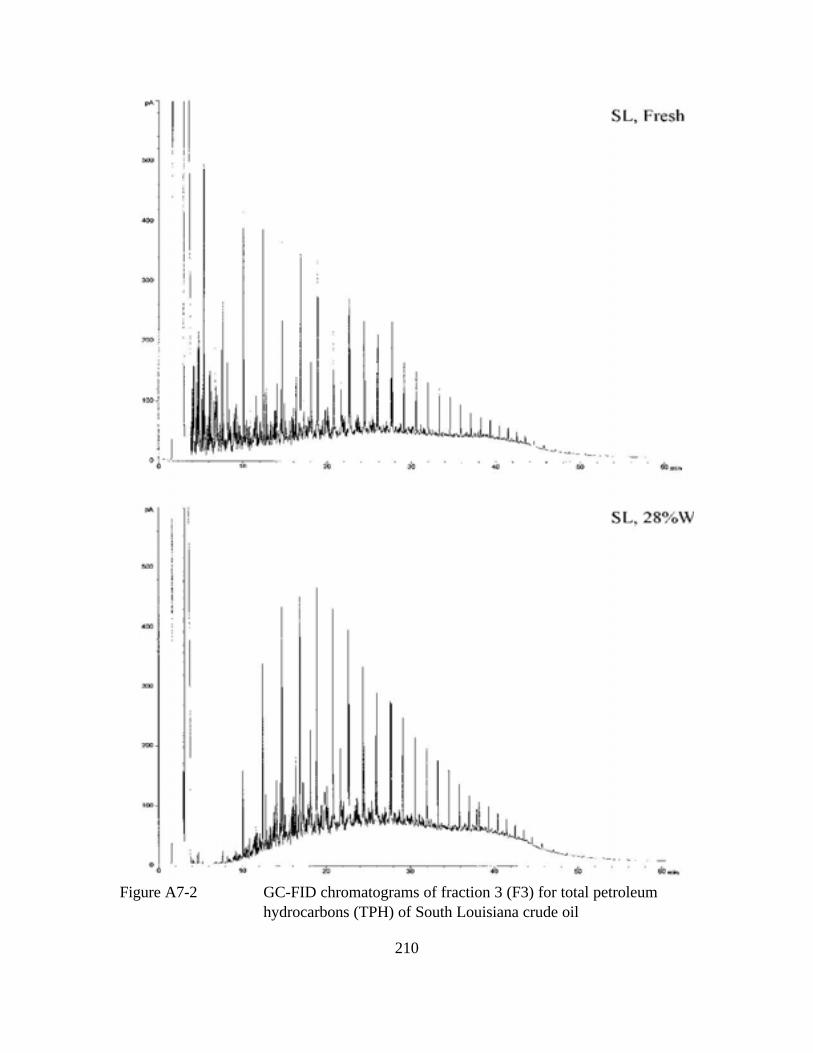
Figure A7-2 GC-FID chromatograms of fraction 3 (F3) for total petroleum
hydrocarbons (TPH) of South Louisiana crude oil
210
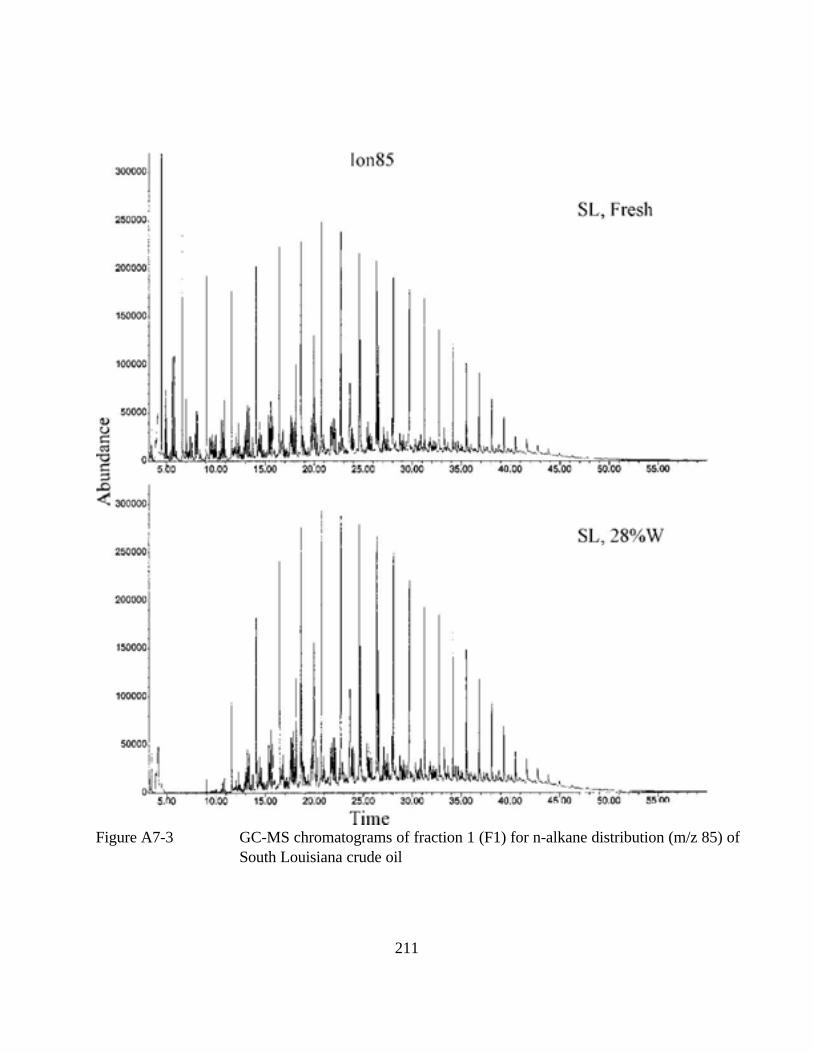
Figure A7-3 GC-MS chromatograms of fraction 1 (F1) for n-alkane distribution (m/z 85) of
South Louisiana crude oil
211

Figure A7-4 Total ion GC-MS chromatograms of fraction 2 (F2) for determination of PAHs
of South Louisiana crude oil
212
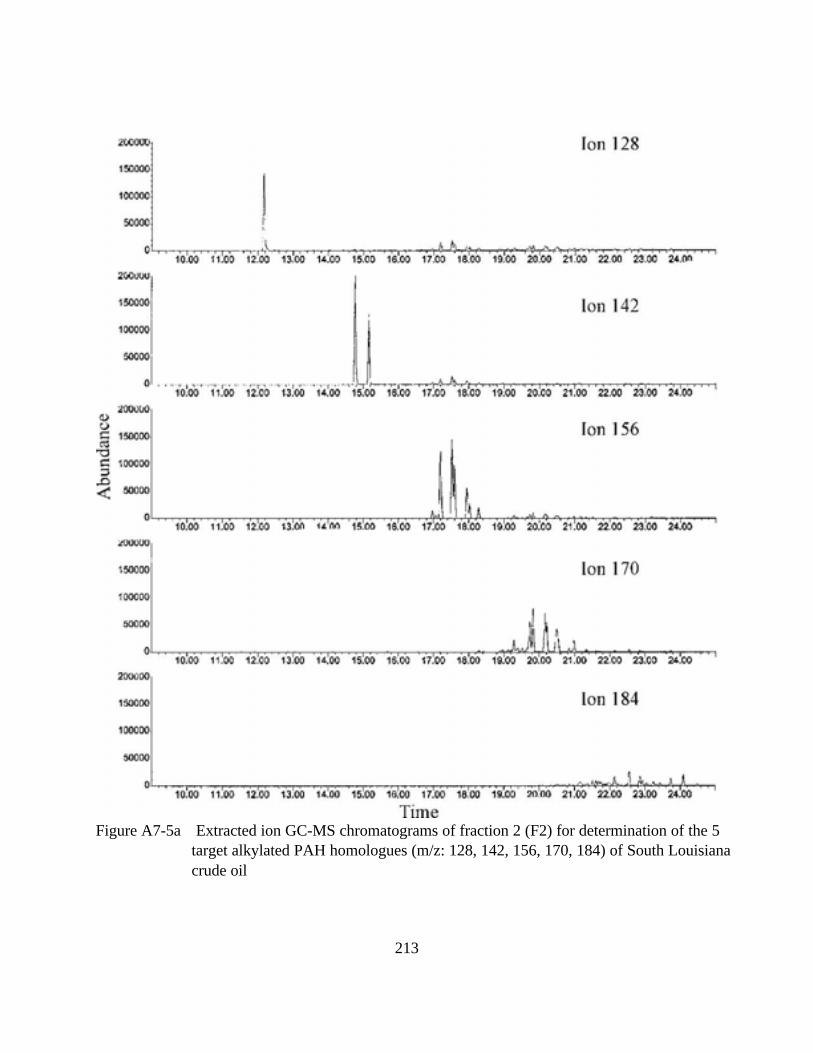
Figure A7-5a Extracted ion GC-MS chromatograms of fraction 2 (F2) for determination of the 5
target alkylated PAH homologues (m/z: 128, 142, 156, 170, 184) of South Louisiana
crude oil
213
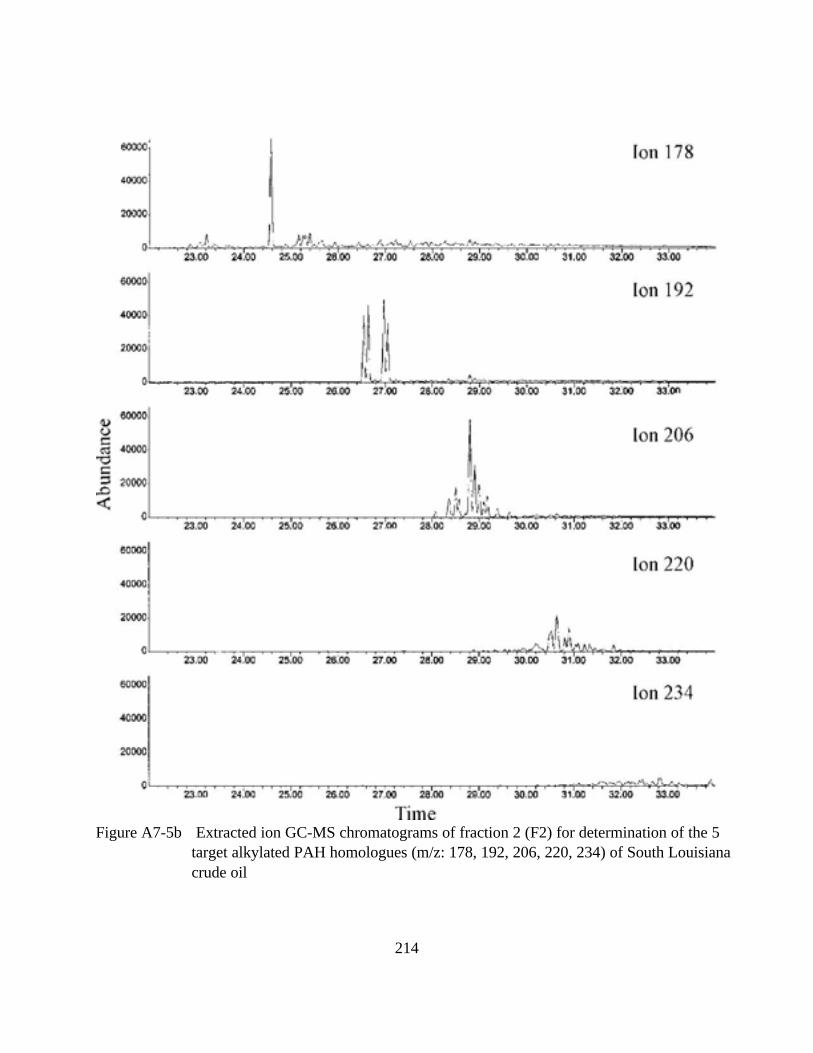
Figure A7-5b Extracted ion GC-MS chromatograms of fraction 2 (F2) for determination of the 5
target alkylated PAH homologues (m/z: 178, 192, 206, 220, 234) of South Louisiana
crude oil
214
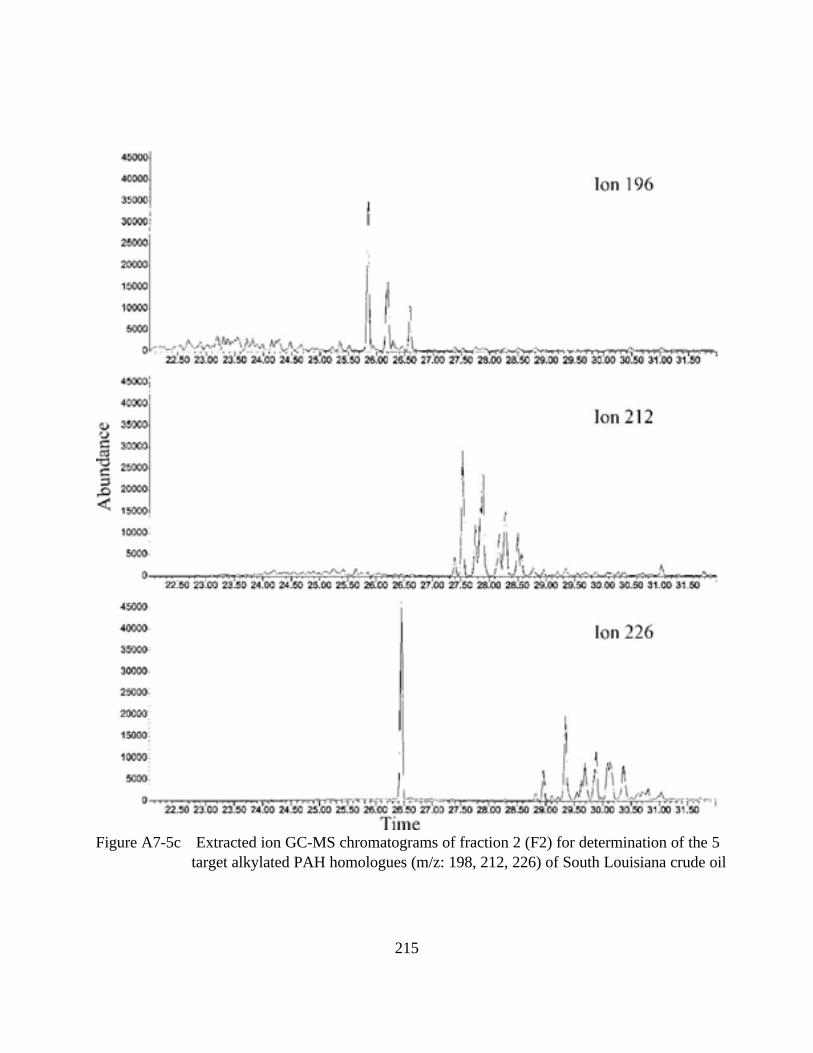
Figure A7-5c Extracted ion GC-MS chromatograms of fraction 2 (F2) for determination of the 5
target alkylated PAH homologues (m/z: 198, 212, 226) of South Louisiana crude oil
215
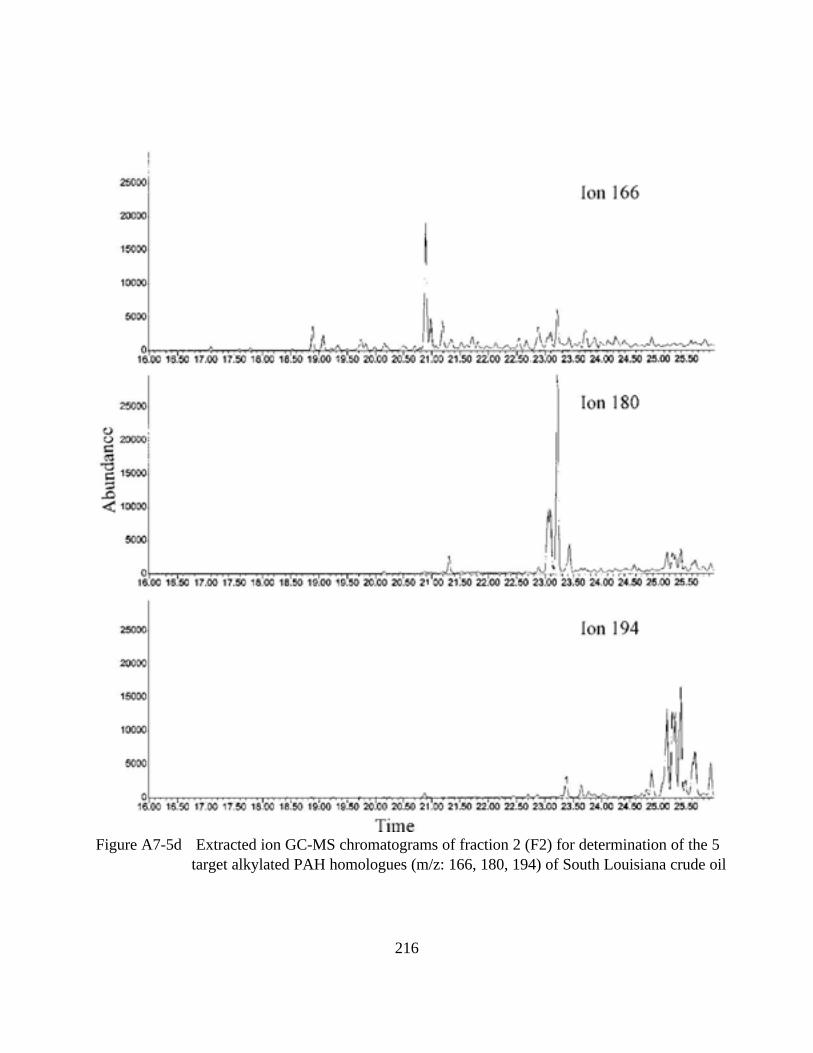
Figure A7-5d Extracted ion GC-MS chromatograms of fraction 2 (F2) for determination of the 5
target alkylated PAH homologues (m/z: 166, 180, 194) of South Louisiana crude oil
216
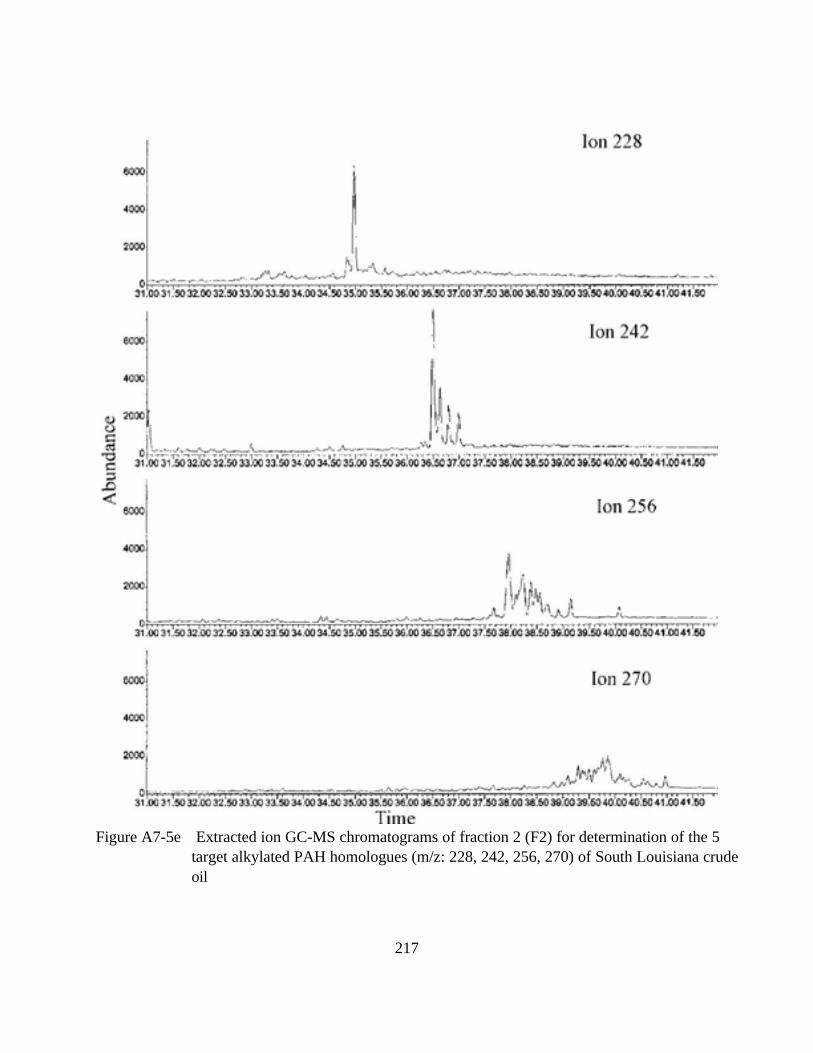
Figure A7-5e Extracted ion GC-MS chromatograms of fraction 2 (F2) for determination of the 5
target alkylated PAH homologues (m/z: 228, 242, 256, 270) of South Louisiana crude
oil
217
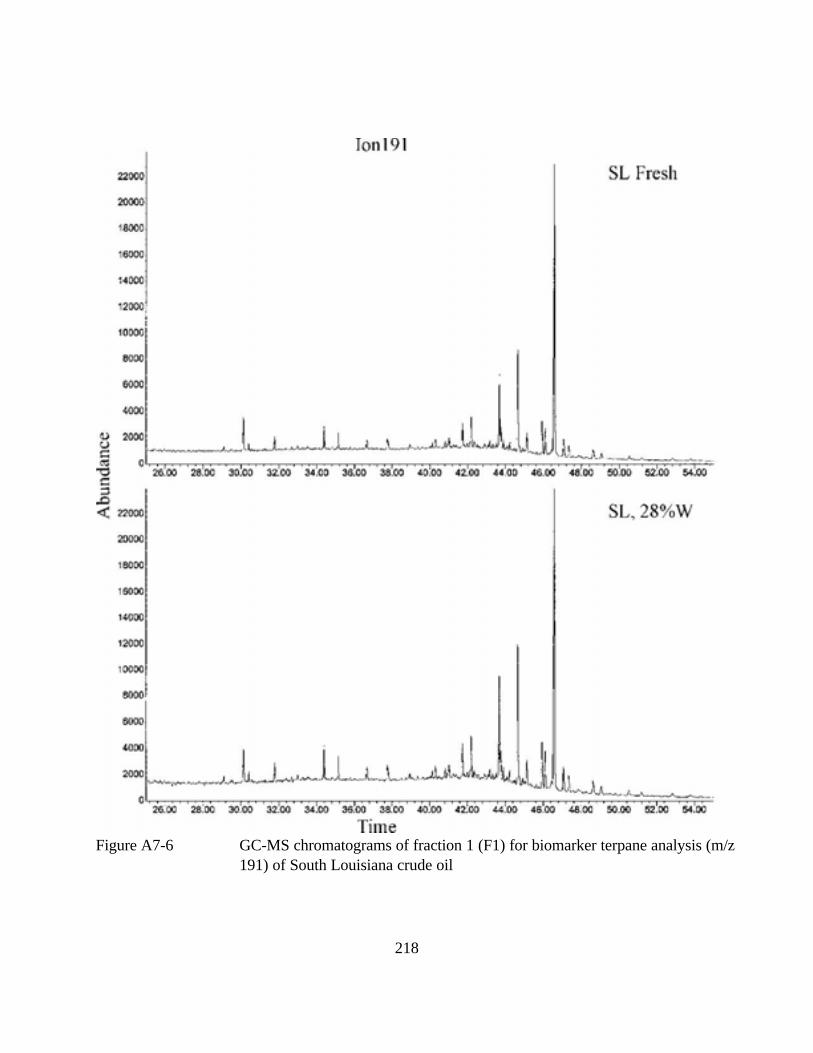
Figure A7-6 GC-MS chromatograms of fraction 1 (F1) for biomarker terpane analysis (m/z
191) of South Louisiana crude oil
218
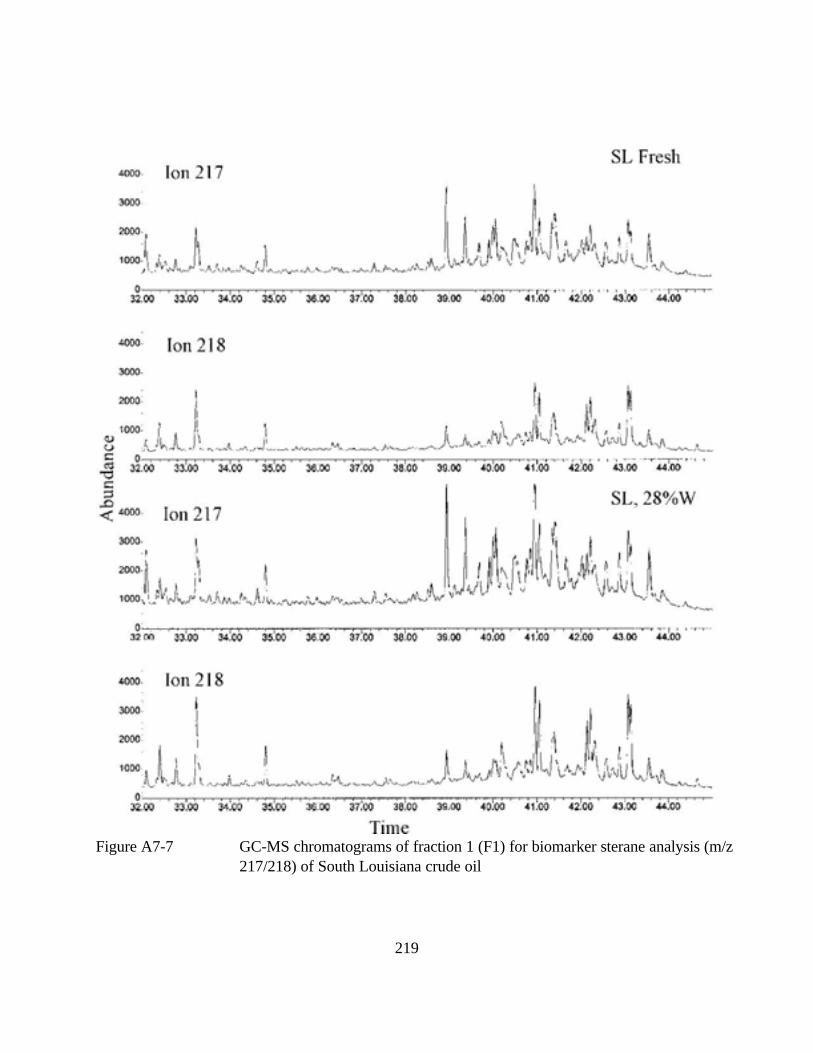
Figure A7-7 GC-MS chromatograms of fraction 1 (F1) for biomarker sterane analysis (m/z
217/218) of South Louisiana crude oil
219
8 GC Chromatograms for West Texas Intermediate Crude Oil
Figure A8-1 GC-FID chromatograms of fraction 1 (F1) for saturates of West Texas
Intermediate crude oil
Figure A8-2 GC-FID chromatograms of fraction 3 (F3) for total petroleum hydrocarbons
(TPH) of West Texas Intermediate crude oil
Figure A8-3 GC-MS chromatograms of fraction 1 (F1) for n-alkane distribution (m/z 85) of
West Texas Intermediate crude oil
Figure A8-4 Total ion GC-MS chromatograms of fraction 2 (F2) for determination of PAHs
of West Texas Intermediate crude oil
Figure A8-5 Extracted ion GC-MS chromatograms of fraction 2 (F2) for determination of the
5 target alkylated PAH homologues (m/z: 128, 142, 156, 170, 184, 178, 192,
206, 220, 234, 198, 212, 226, 166, 180, 194, 228, 242, 256, and 270) of West
Texas Intermediate crude oil
Figure A8-6 GC-MS chromatograms of fraction 1 (F1) for biomarker terpane analysis (m/z
191) of West Texas Intermediate crude oil
Figure A8-7 GC-MS chromatograms of fraction 1 (F1) for biomarker sterane analysis (m/z
217/218) of West Texas Intermediate crude oil
220
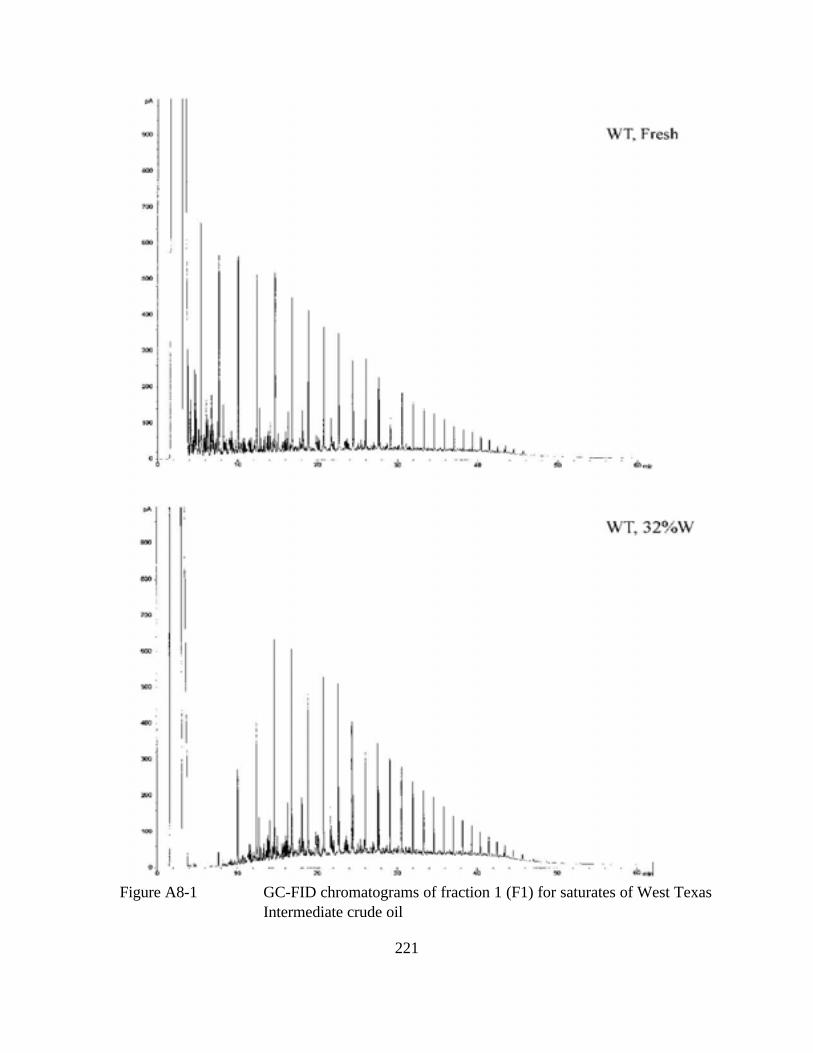
Figure A8-1 GC-FID chromatograms of fraction 1 (F1) for saturates of West Texas
Intermediate crude oil
221
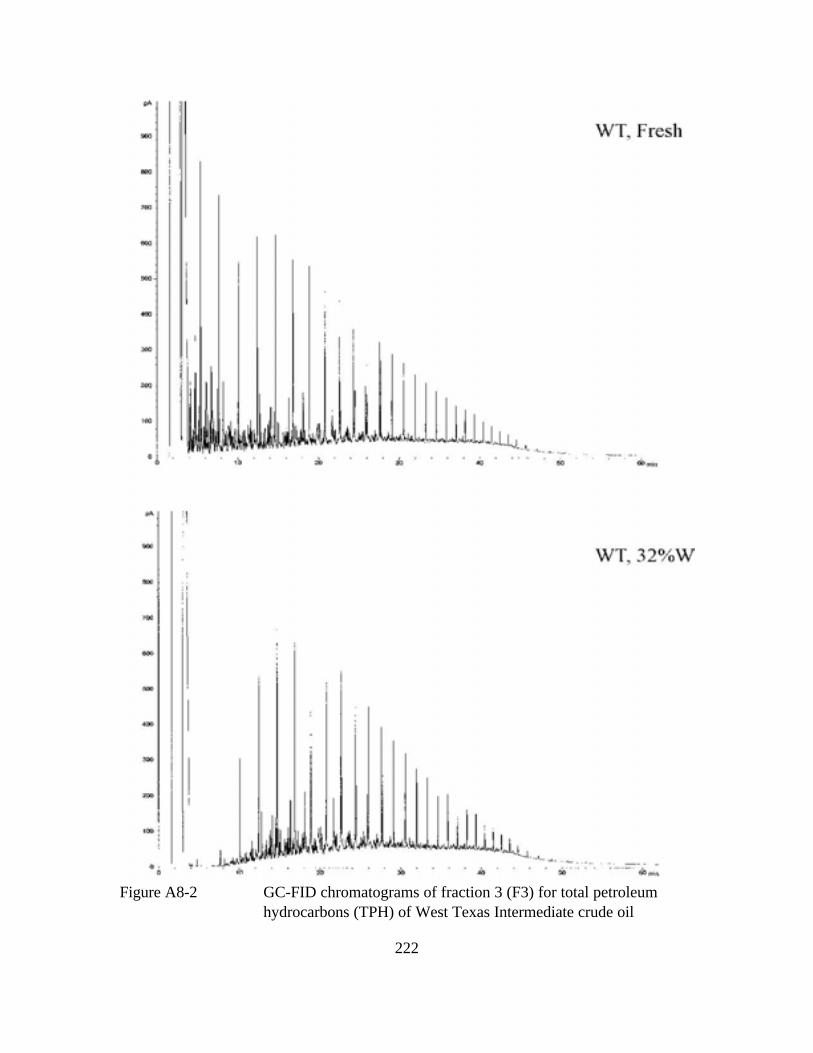
Figure A8-2 GC-FID chromatograms of fraction 3 (F3) for total petroleum
hydrocarbons (TPH) of West Texas Intermediate crude oil
222
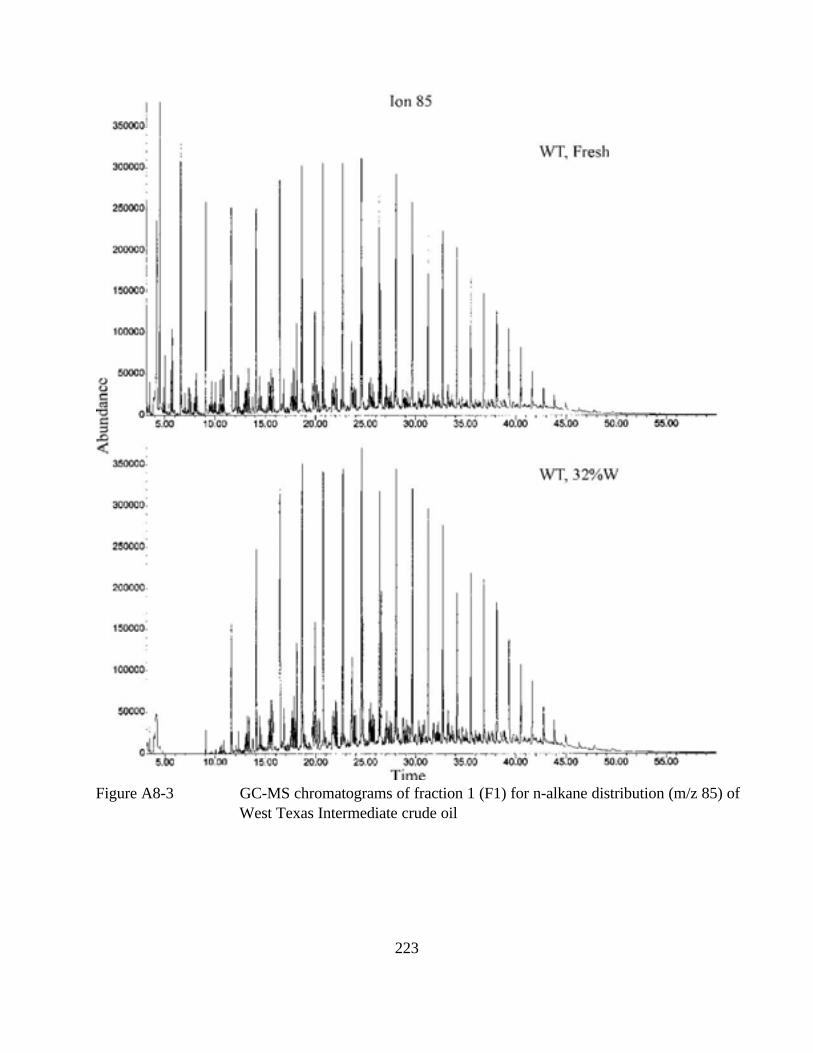
Figure A8-3 GC-MS chromatograms of fraction 1 (F1) for n-alkane distribution (m/z 85) of
West Texas Intermediate crude oil
223
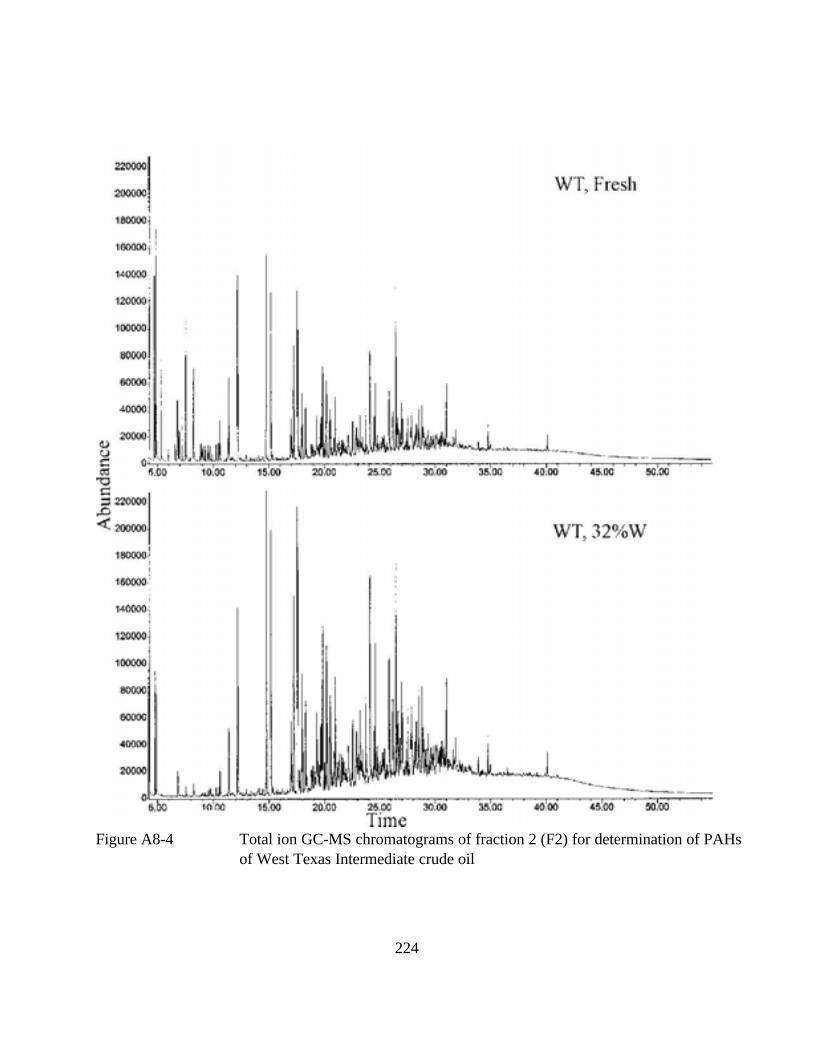
Figure A8-4 Total ion GC-MS chromatograms of fraction 2 (F2) for determination of PAHs
of West Texas Intermediate crude oil
224
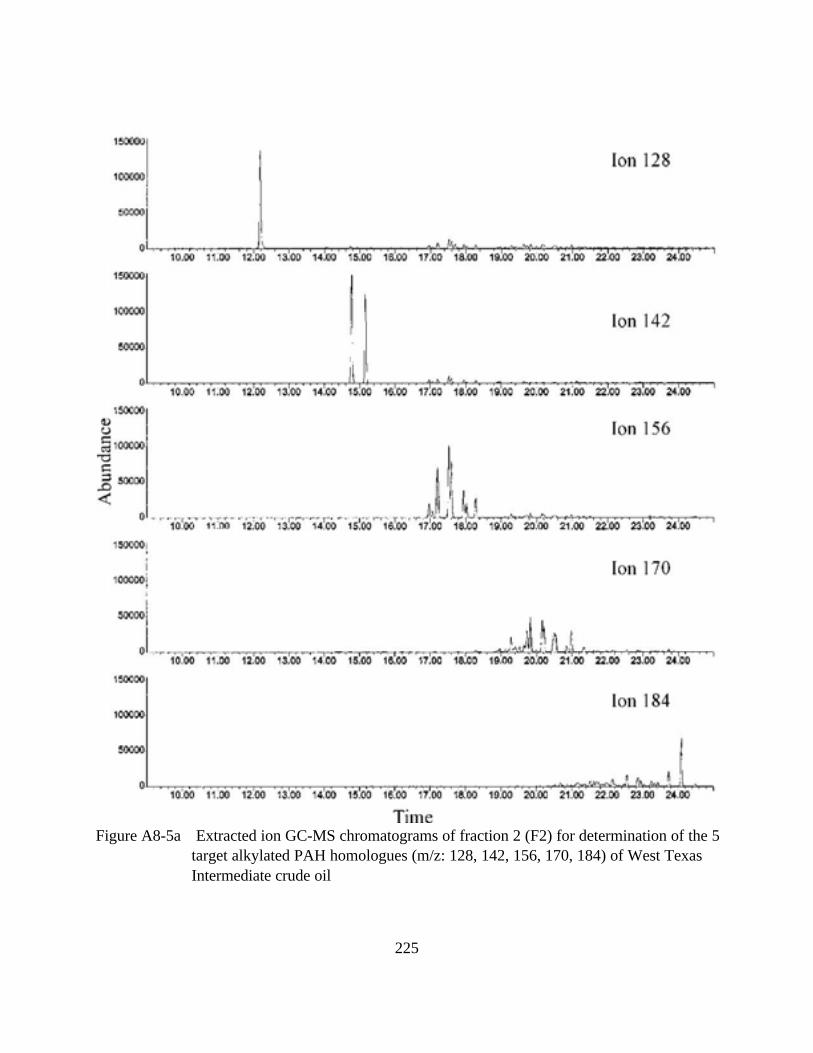
Figure A8-5a Extracted ion GC-MS chromatograms of fraction 2 (F2) for determination of the 5
target alkylated PAH homologues (m/z: 128, 142, 156, 170, 184) of West Texas
Intermediate crude oil
225
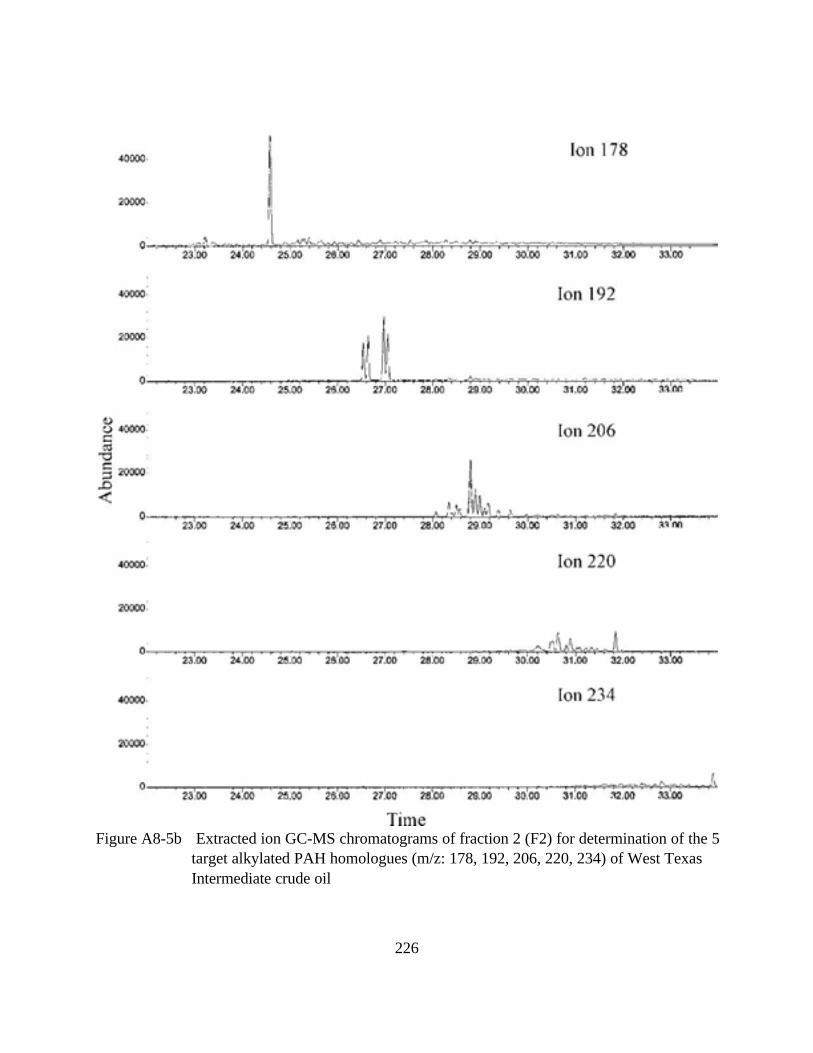
Figure A8-5b Extracted ion GC-MS chromatograms of fraction 2 (F2) for determination of the 5
target alkylated PAH homologues (m/z: 178, 192, 206, 220, 234) of West Texas
Intermediate crude oil
226
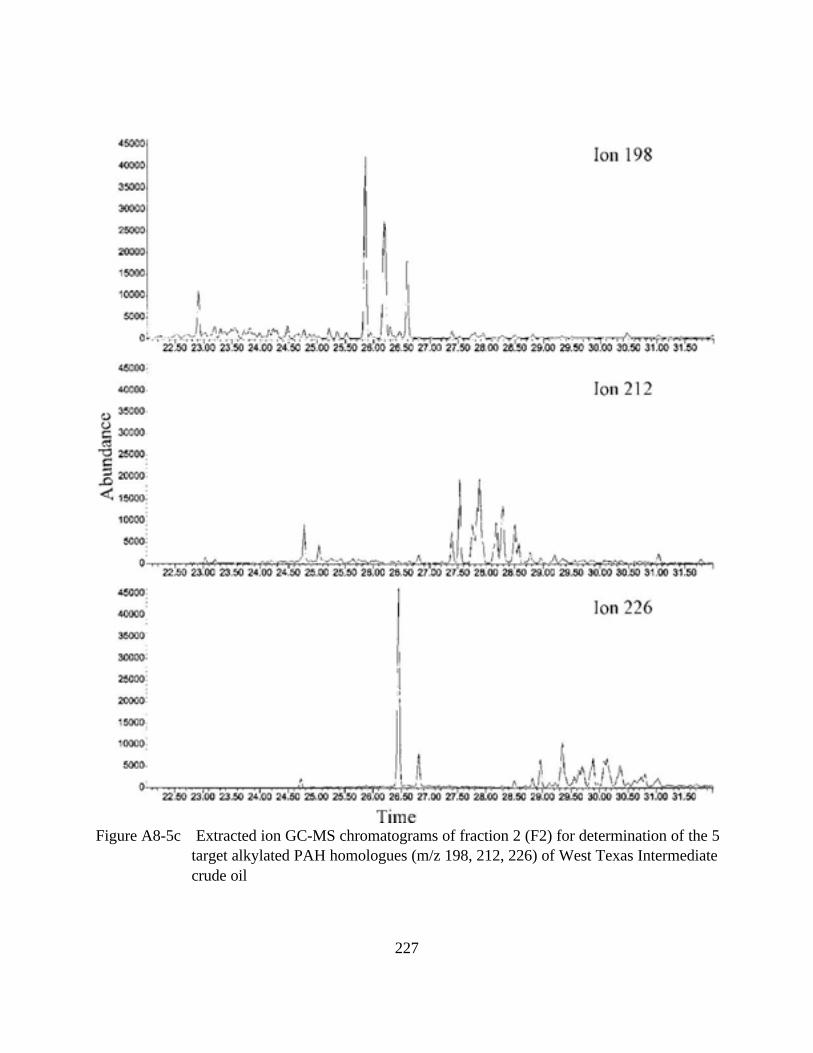
Figure A8-5c Extracted ion GC-MS chromatograms of fraction 2 (F2) for determination of the 5
target alkylated PAH homologues (m/z 198, 212, 226) of West Texas Intermediate
crude oil
227
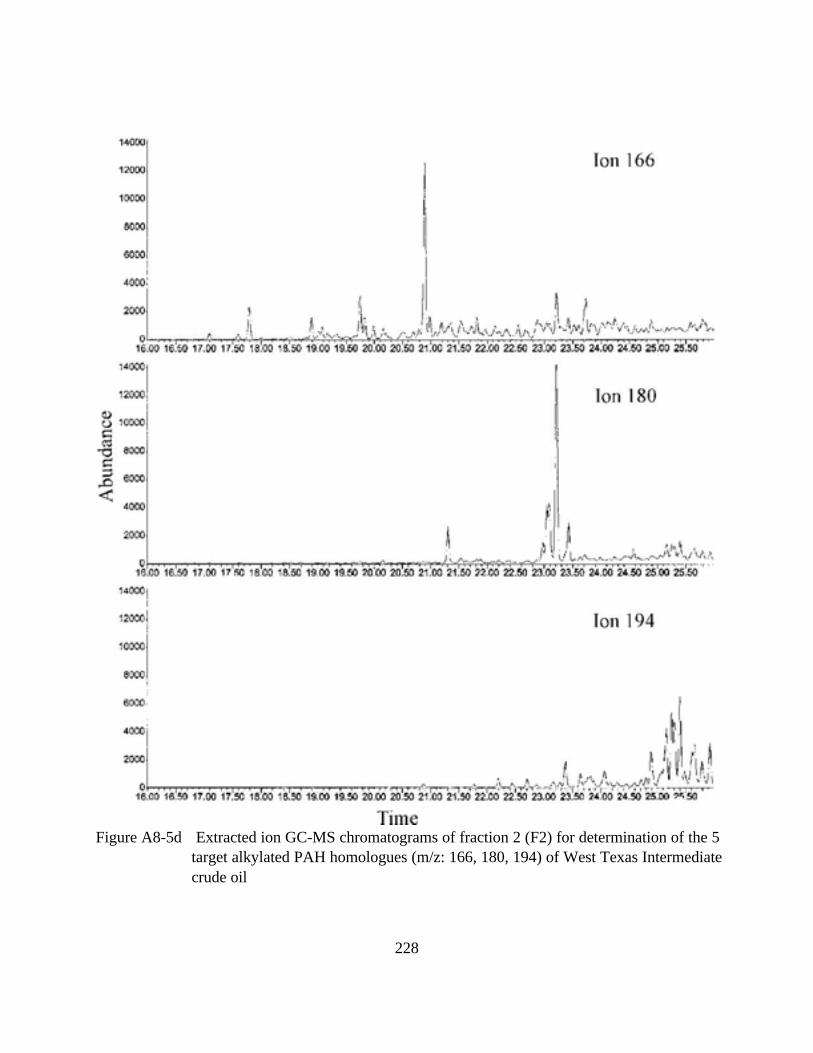
Figure A8-5d Extracted ion GC-MS chromatograms of fraction 2 (F2) for determination of the 5
target alkylated PAH homologues (m/z: 166, 180, 194) of West Texas Intermediate
crude oil
228
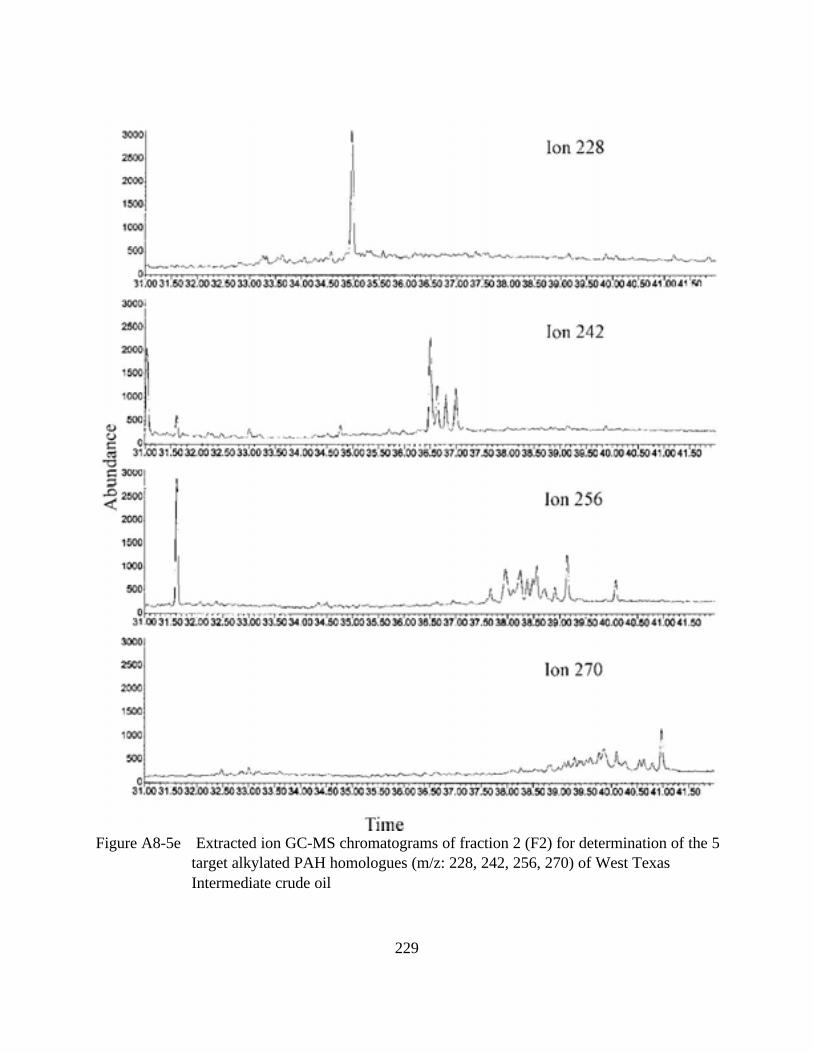
Figure A8-5e Extracted ion GC-MS chromatograms of fraction 2 (F2) for determination of the 5
target alkylated PAH homologues (m/z: 228, 242, 256, 270) of West Texas
Intermediate crude oil
229
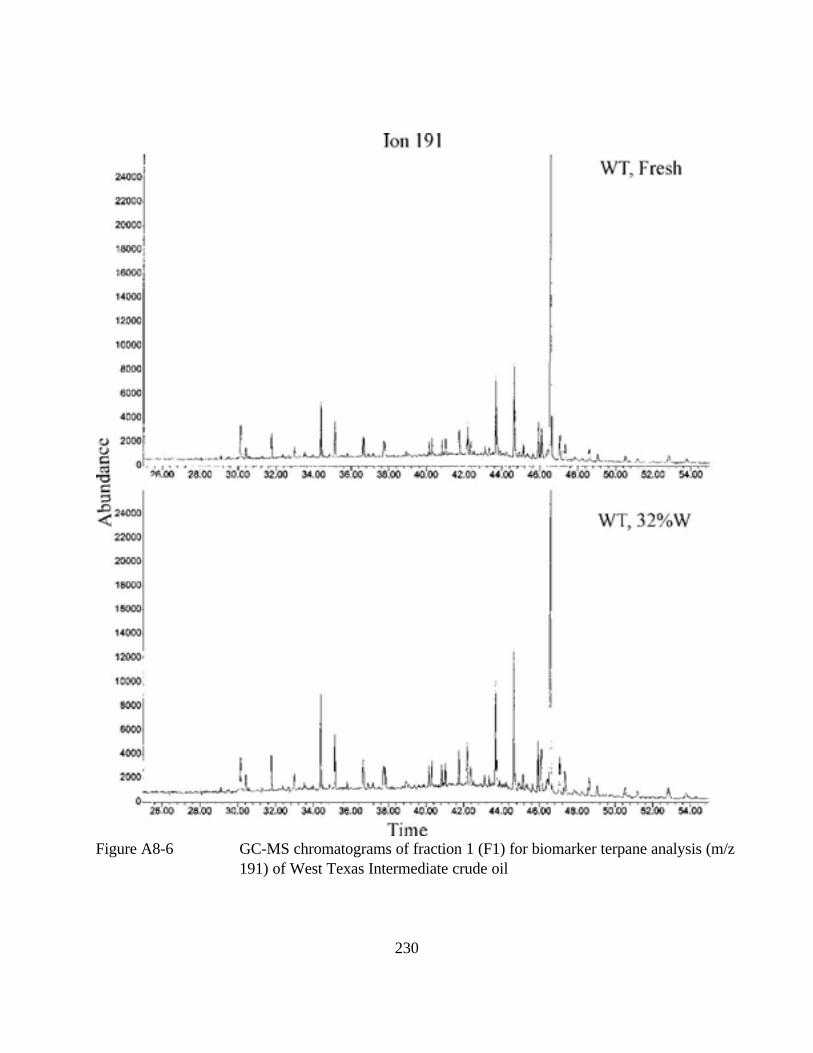
Figure A8-6 GC-MS chromatograms of fraction 1 (F1) for biomarker terpane analysis (m/z
191) of West Texas Intermediate crude oil
230
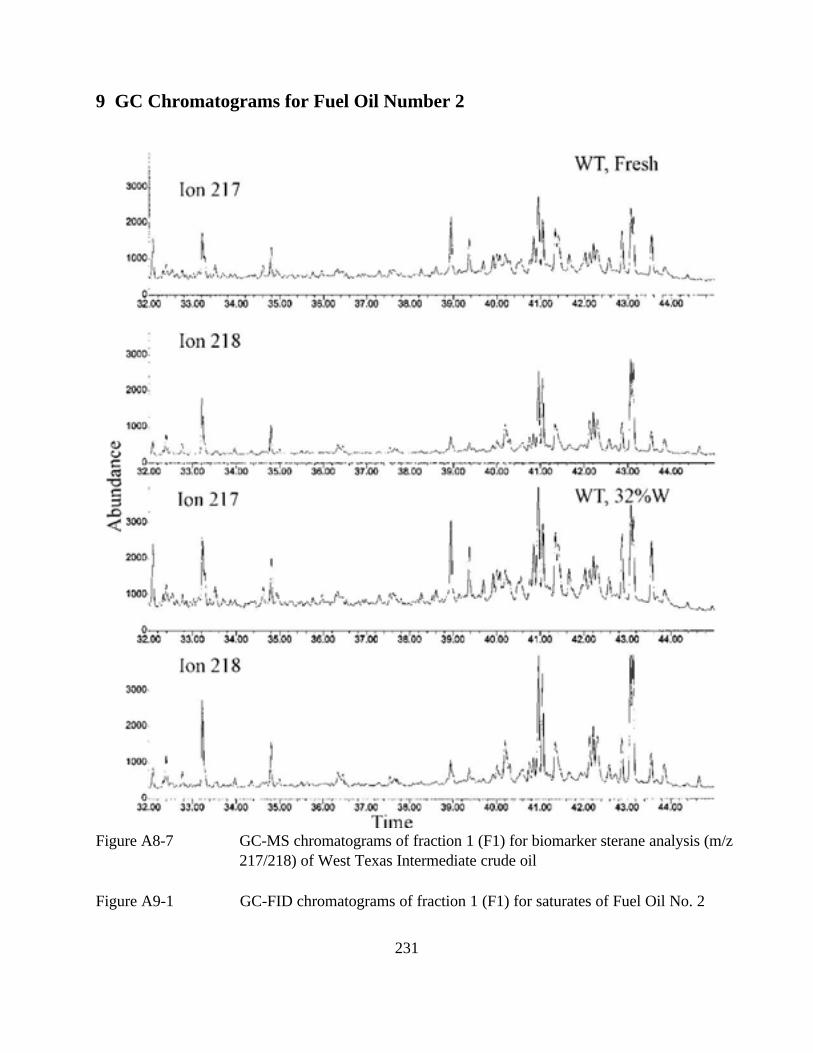
9 GC Chromatograms for Fuel Oil Number 2
Figure A8-7 GC-MS chromatograms of fraction 1 (F1) for biomarker sterane analysis (m/z
217/218) of West Texas Intermediate crude oil
Figure A9-1 GC-FID chromatograms of fraction 1 (F1) for saturates of Fuel Oil No. 2
231
Figure A9-2 GC-FID chromatograms of fraction 3 (F3) for total petroleum hydrocarbons
(TPH) of of Fuel Oil No. 2
Figure A9-3 GC-MS chromatograms of fraction 1 (F1) for n-alkane distribution (m/z 85) of
Fuel Oil No. 2
Figure A9-4 Total ion GC-MS chromatograms of fraction 2 (F2) for determination of PAHs
of Fuel Oil No. 2
Figure A9-5 Extracted ion GC-MS chromatograms of fraction 2 (F2) for determination of the
5 target alkylated PAH homologues (m/z: 128, 142, 156, 170, 184, 178, 192,
206, 220, 234, 198, 212, 226, 166, 180, 194, 228, 242, 256, and 270) of Fuel
Oil No. 2
Figure A9-6 GC-MS chromatograms of fraction 1 (F1) for biomarker terpane analysis (m/z
191) of Fuel Oil No. 2
Figure A9-7 GC-MS chromatograms of fraction 1 (F1) for biomarker sterane analysis (m/z
217/218) of Fuel Oil No. 2
232
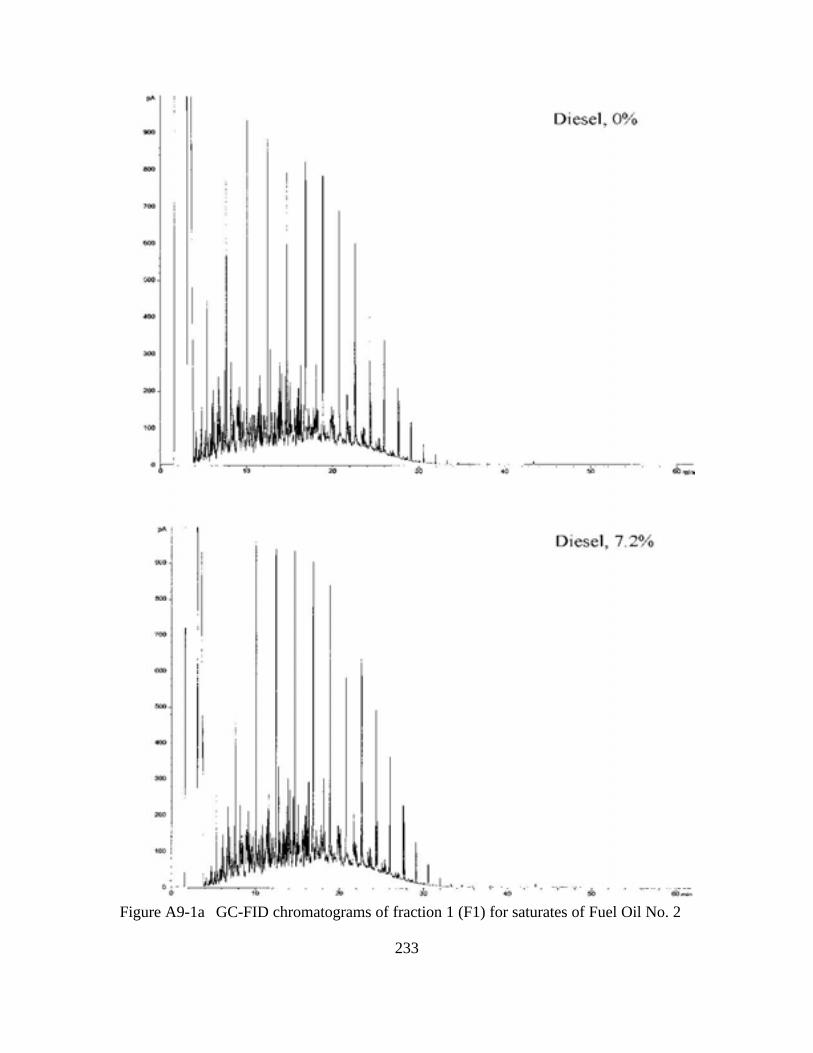
Figure A9-1a GC-FID chromatograms of fraction 1 (F1) for saturates of Fuel Oil No. 2
233
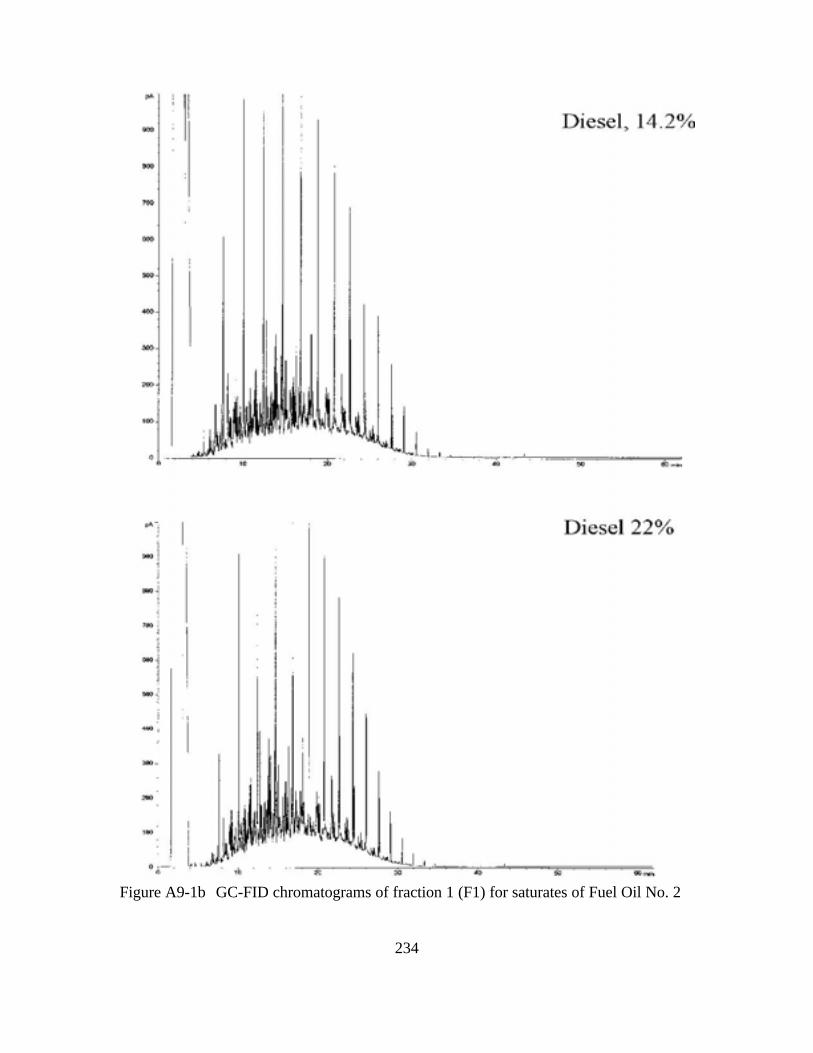
Figure A9-1b GC-FID chromatograms of fraction 1 (F1) for saturates of Fuel Oil No. 2
234
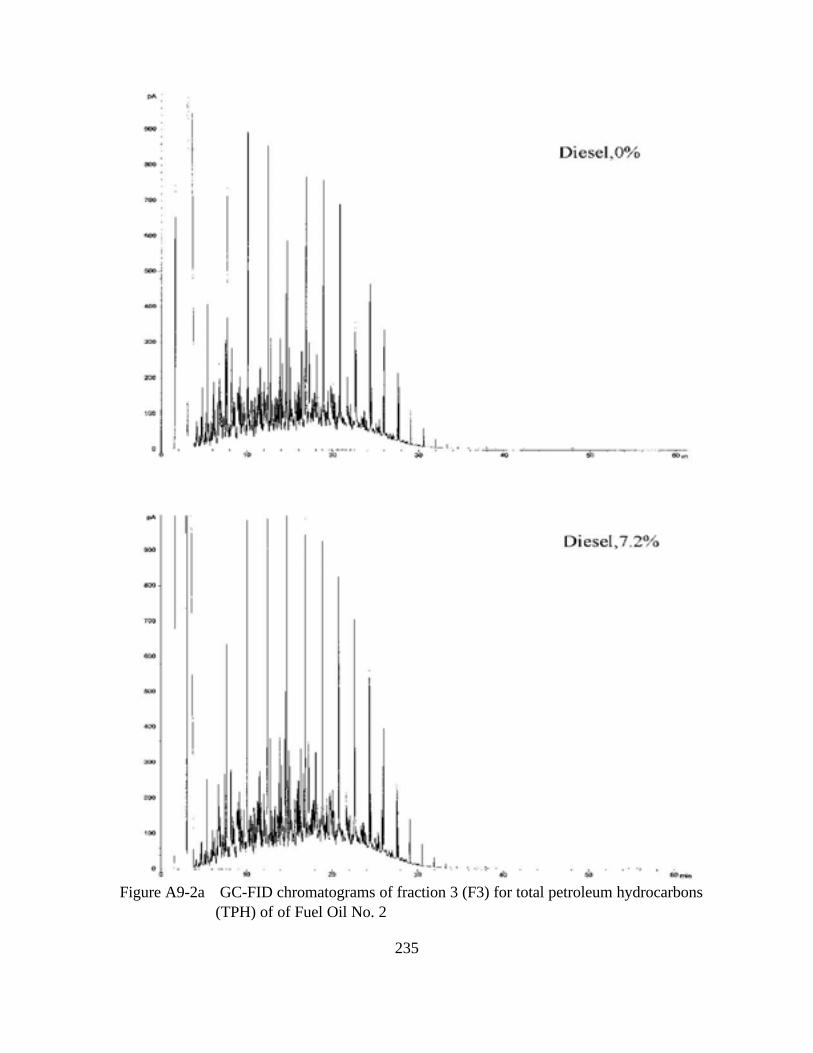
Figure A9-2a GC-FID chromatograms of fraction 3 (F3) for total petroleum hydrocarbons
(TPH) of of Fuel Oil No. 2
235
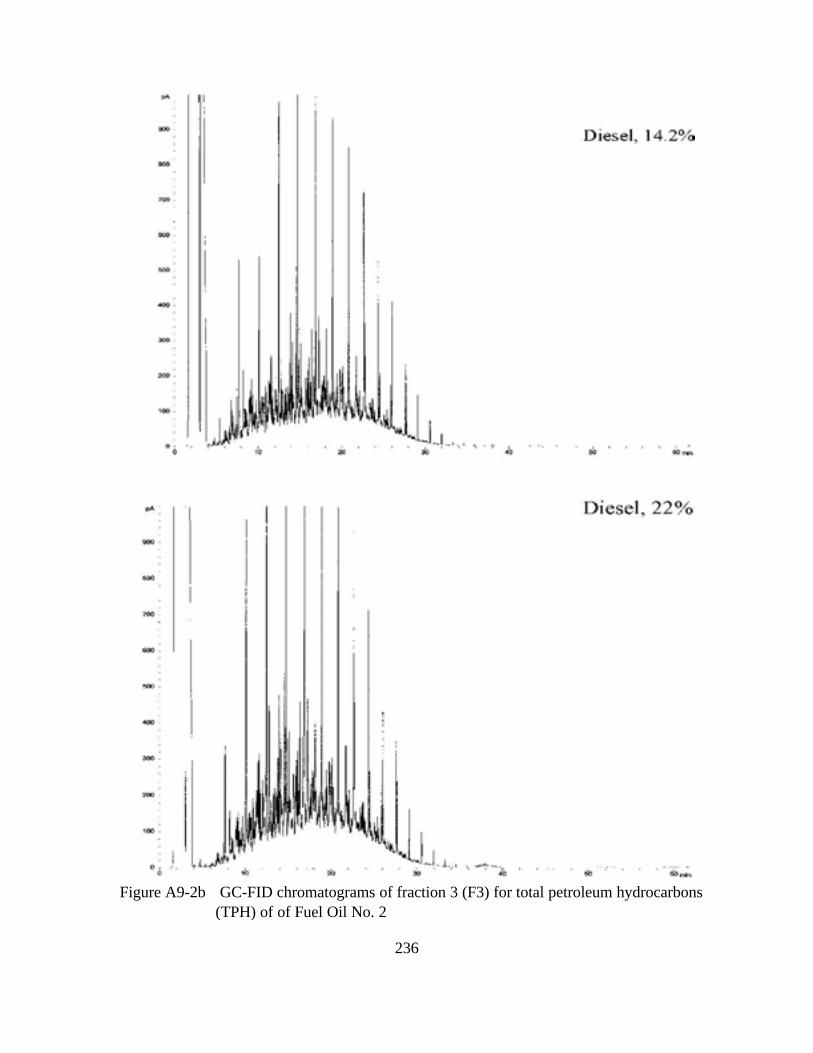
Figure A9-2b GC-FID chromatograms of fraction 3 (F3) for total petroleum hydrocarbons
(TPH) of of Fuel Oil No. 2
236
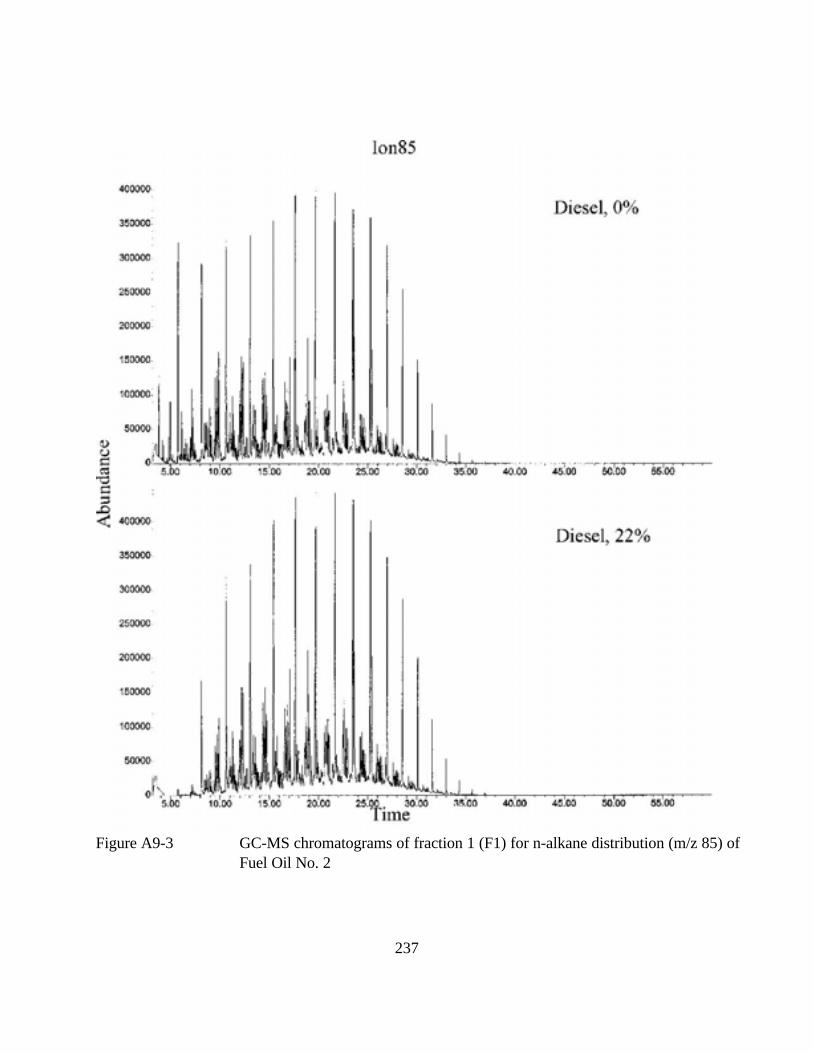
Figure A9-3 GC-MS chromatograms of fraction 1 (F1) for n-alkane distribution (m/z 85) of
Fuel Oil No. 2
237
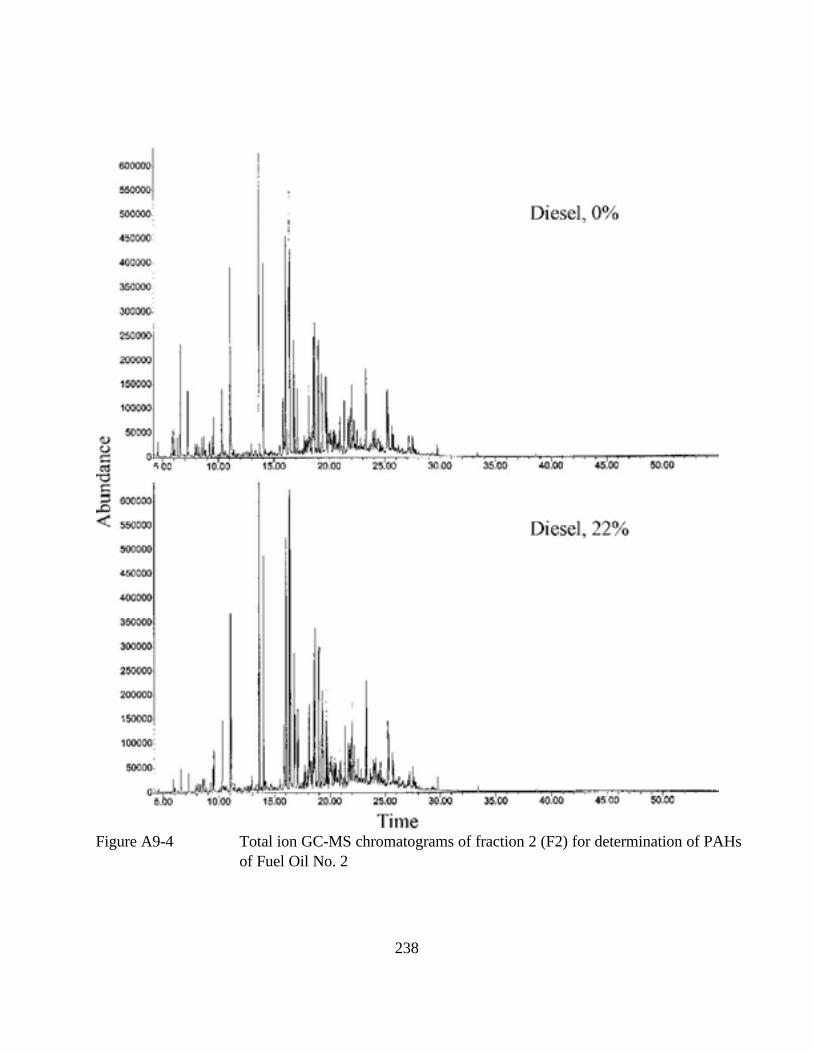
Figure A9-4 Total ion GC-MS chromatograms of fraction 2 (F2) for determination of PAHs
of Fuel Oil No. 2
238
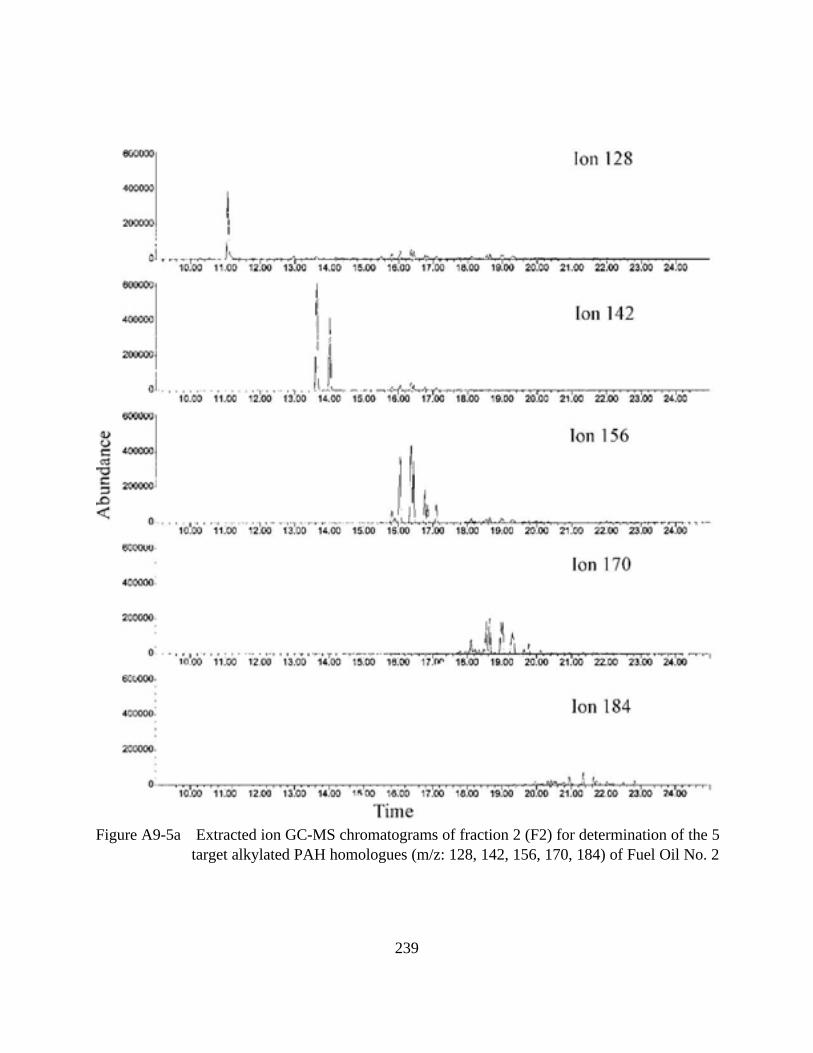
Figure A9-5a Extracted ion GC-MS chromatograms of fraction 2 (F2) for determination of the 5
target alkylated PAH homologues (m/z: 128, 142, 156, 170, 184) of Fuel Oil No. 2
239
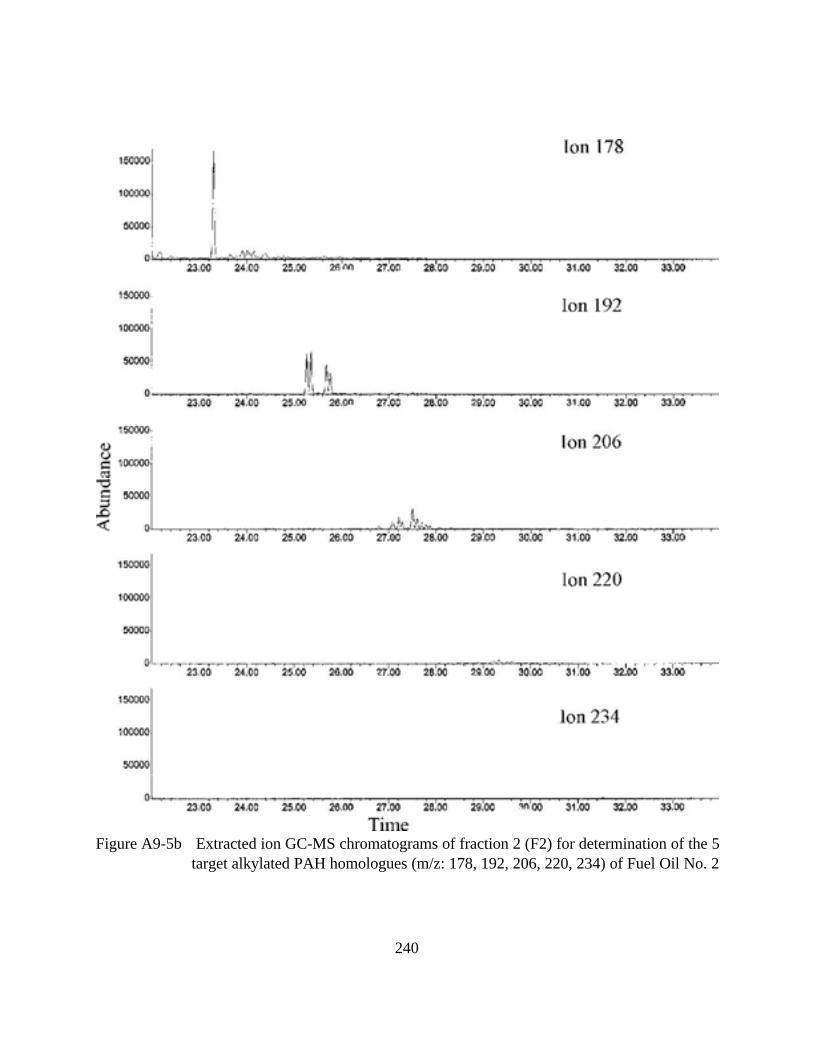
Figure A9-5b Extracted ion GC-MS chromatograms of fraction 2 (F2) for determination of the 5
target alkylated PAH homologues (m/z: 178, 192, 206, 220, 234) of Fuel Oil No. 2
240
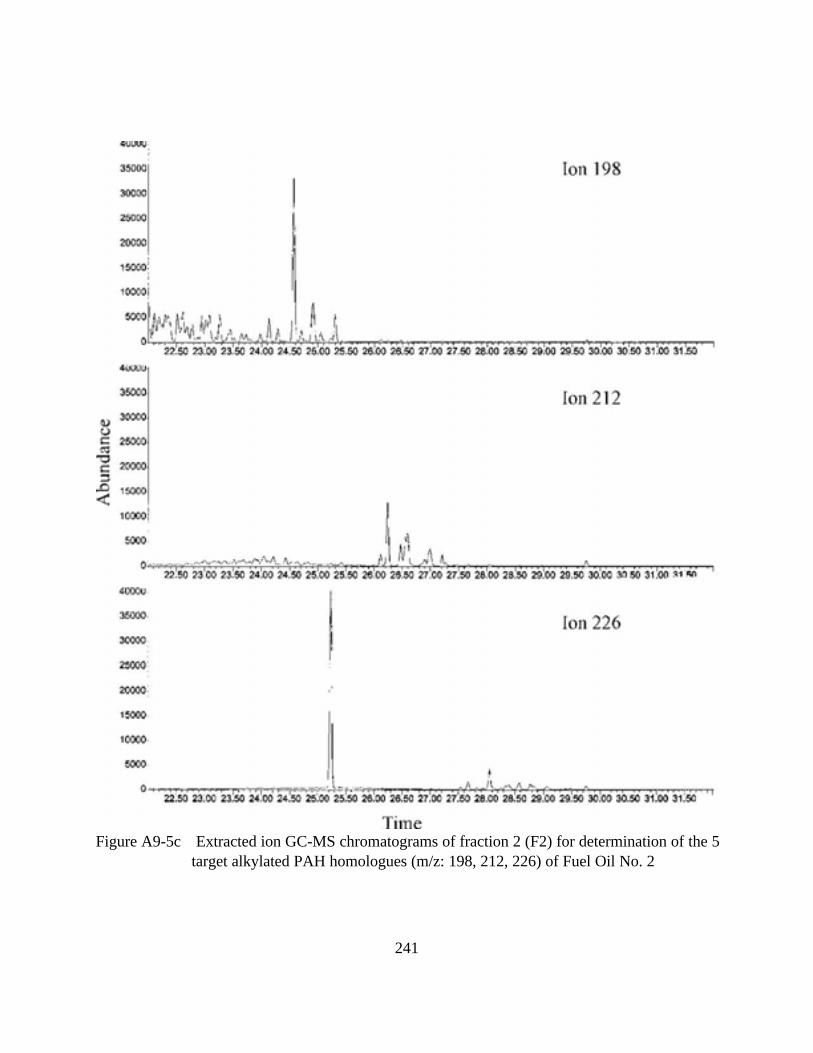
Figure A9-5c Extracted ion GC-MS chromatograms of fraction 2 (F2) for determination of the 5
target alkylated PAH homologues (m/z: 198, 212, 226) of Fuel Oil No. 2
241
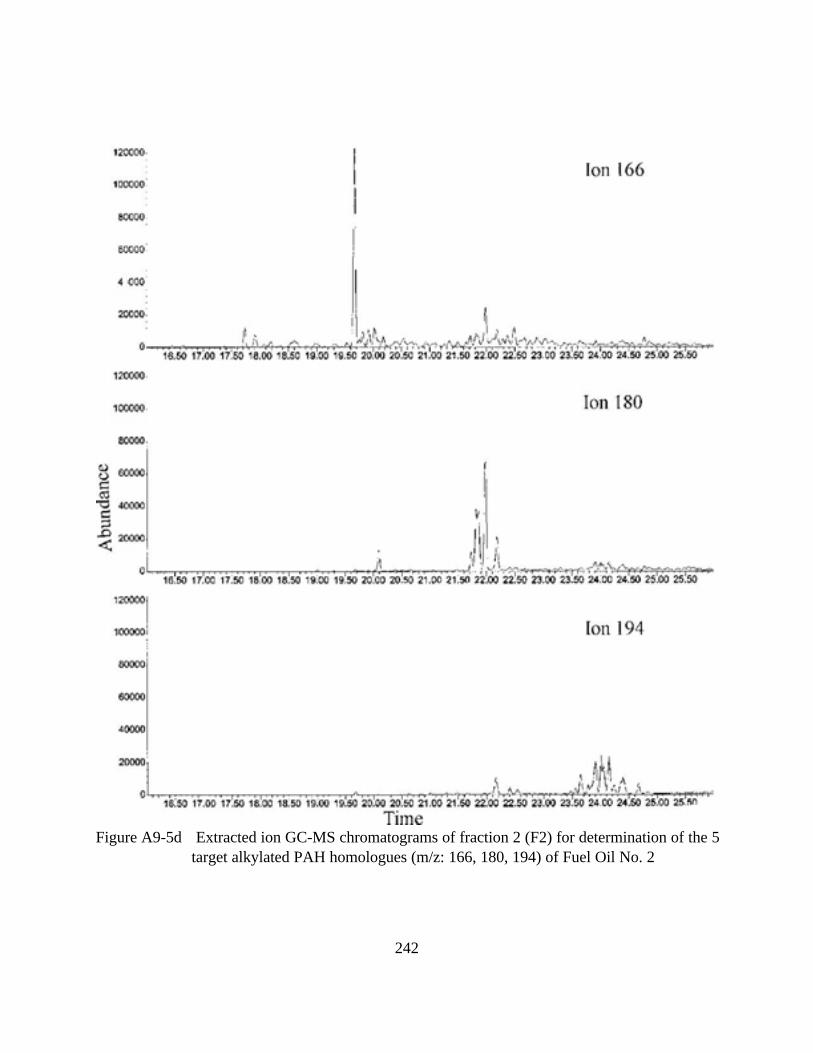
Figure A9-5d Extracted ion GC-MS chromatograms of fraction 2 (F2) for determination of the 5
target alkylated PAH homologues (m/z: 166, 180, 194) of Fuel Oil No. 2
242
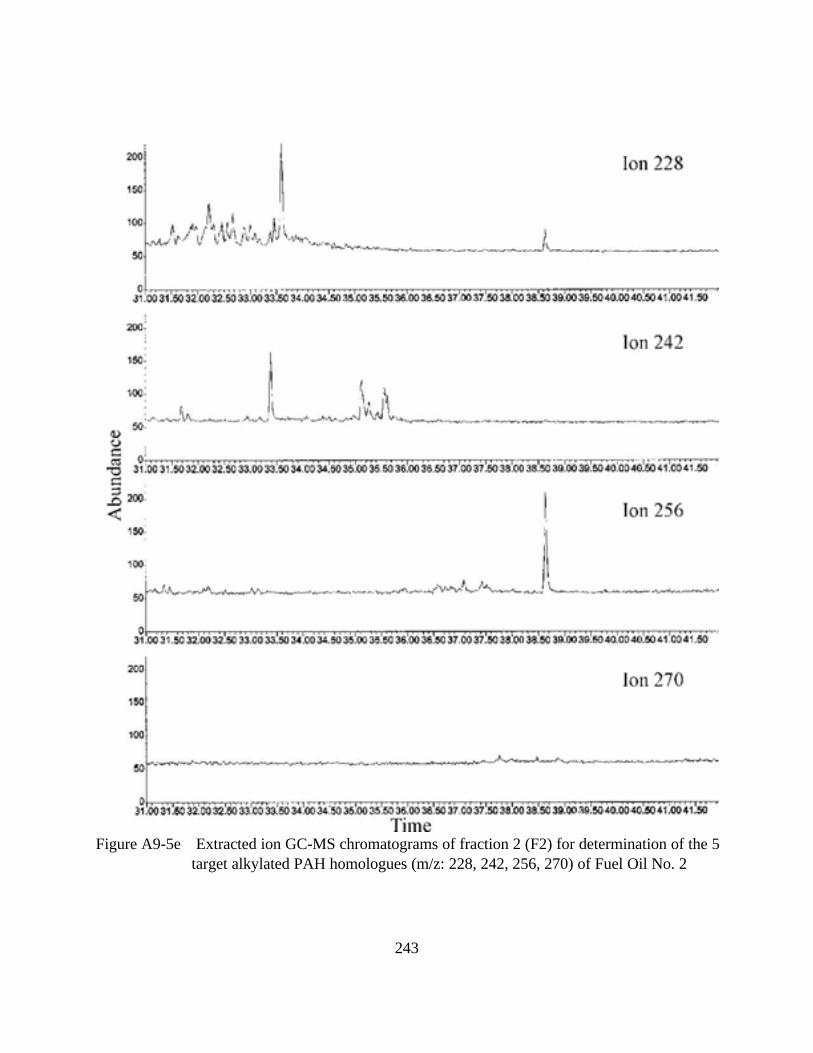
Figure A9-5e Extracted ion GC-MS chromatograms of fraction 2 (F2) for determination of the 5
target alkylated PAH homologues (m/z: 228, 242, 256, 270) of Fuel Oil No. 2
243
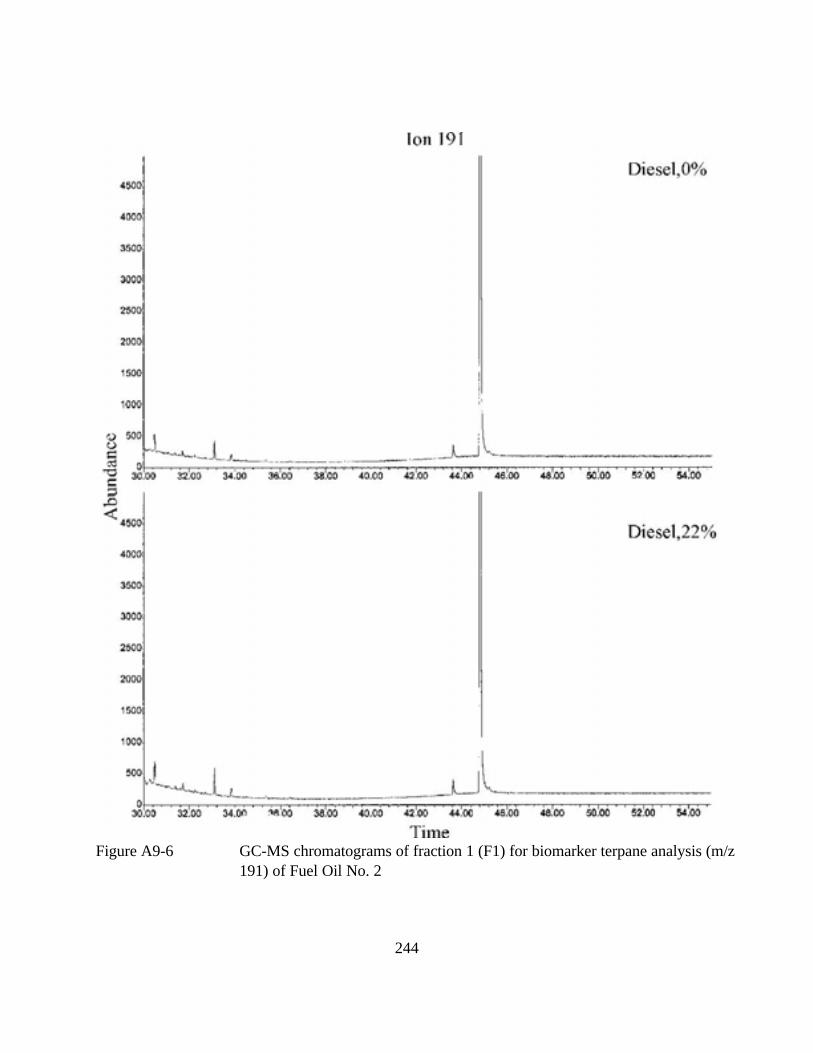
Figure A9-6 GC-MS chromatograms of fraction 1 (F1) for biomarker terpane analysis (m/z
191) of Fuel Oil No. 2
244
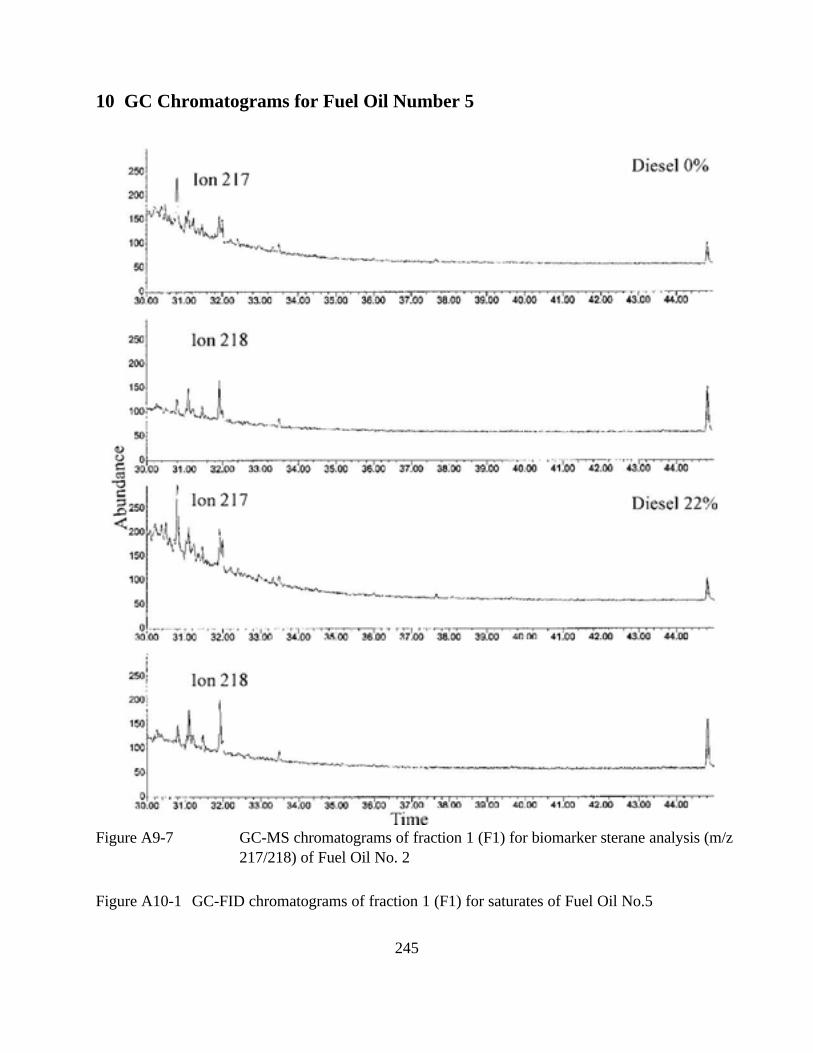
10 GC Chromatograms for Fuel Oil Number 5
Figure A9-7 GC-MS chromatograms of fraction 1 (F1) for biomarker sterane analysis (m/z
217/218) of Fuel Oil No. 2
Figure A10-1 GC-FID chromatograms of fraction 1 (F1) for saturates of Fuel Oil No.5
245
Figure A10-2 GC-FID chromatograms of fraction 3 (F3) for total petroleum hydrocarbons (TPH) of
Fuel Oil No.5
Figure A10-3 GC-MS chromatograms of fraction 1 (F1) for n-alkane distribution (m/z 85) of Fuel Oil
No. 5
Figure A10-4 Total ion GC-MS chromatograms of fraction 2 (F2) for determination of PAHs of Fuel Oil
No. 5
Figure A10-5 Extracted ion GC-MS chromatograms of fraction 2 (F2) for determination of the 5 target
alkylated PAH homologues (m/z: 128, 142, 156, 170, 184, 178, 192, 206, 220, 234,
198, 212, 226, 166, 180, 194, 228, 242, 256, and 270) of Fuel Oil No. 5
Figure A10-6 GC-MS chromatograms of fraction 1 (F1) for biomarker terpane analysis (m/z 191) of
Fuel Oil No. 5
Figure A10-7 GC-MS chromatograms of fraction 1 (F1) for biomarker sterane analysis (m/z 217/218)
of Fuel Oil No. 5
246
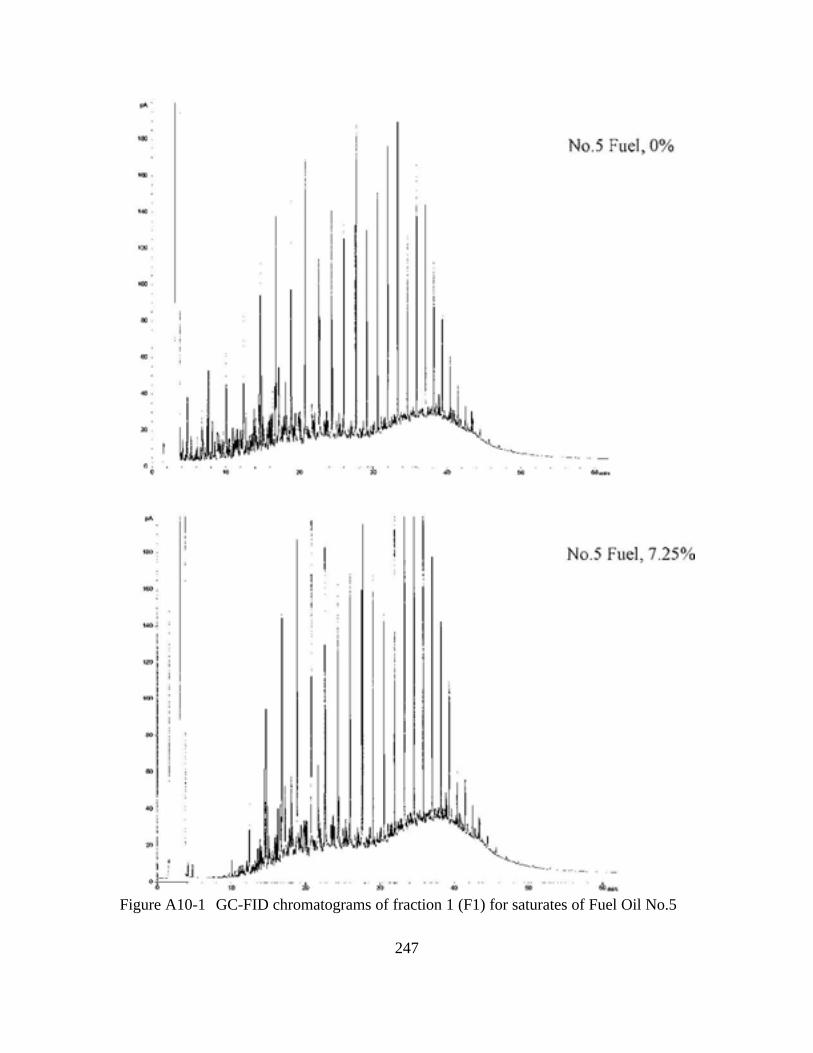
Figure A10-1 GC-FID chromatograms of fraction 1 (F1) for saturates of Fuel Oil No.5
247
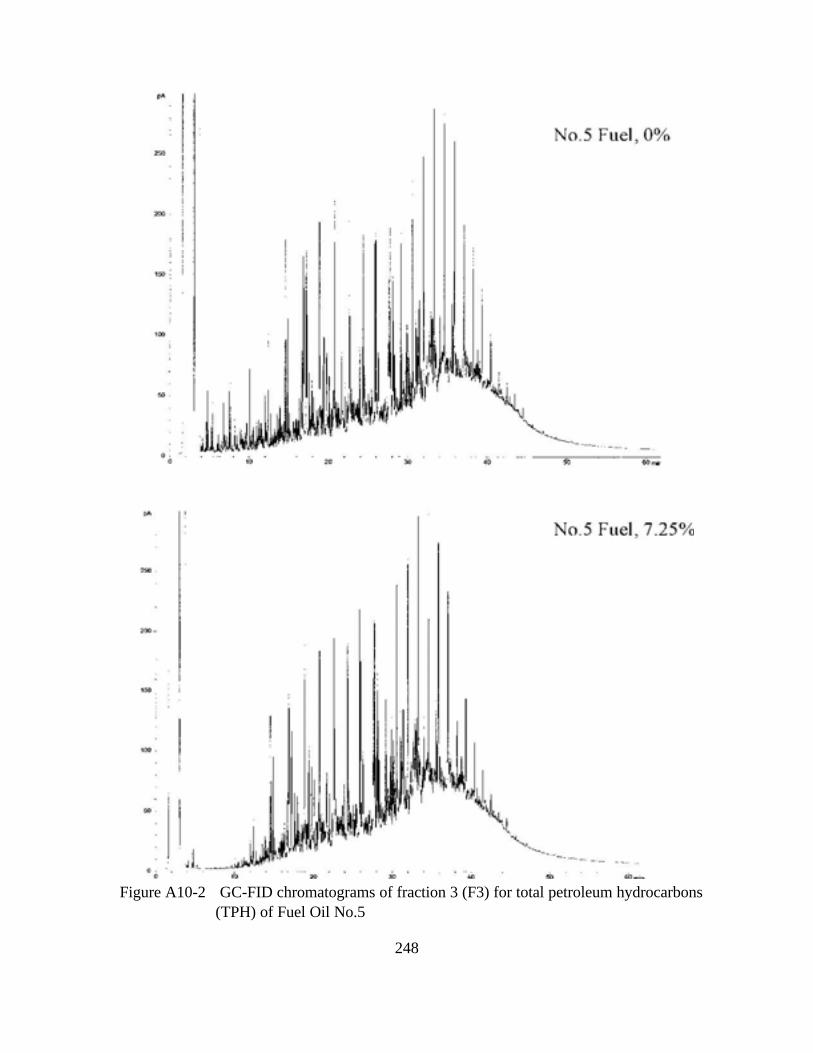
Figure A10-2 GC-FID chromatograms of fraction 3 (F3) for total petroleum hydrocarbons
(TPH) of Fuel Oil No.5
248
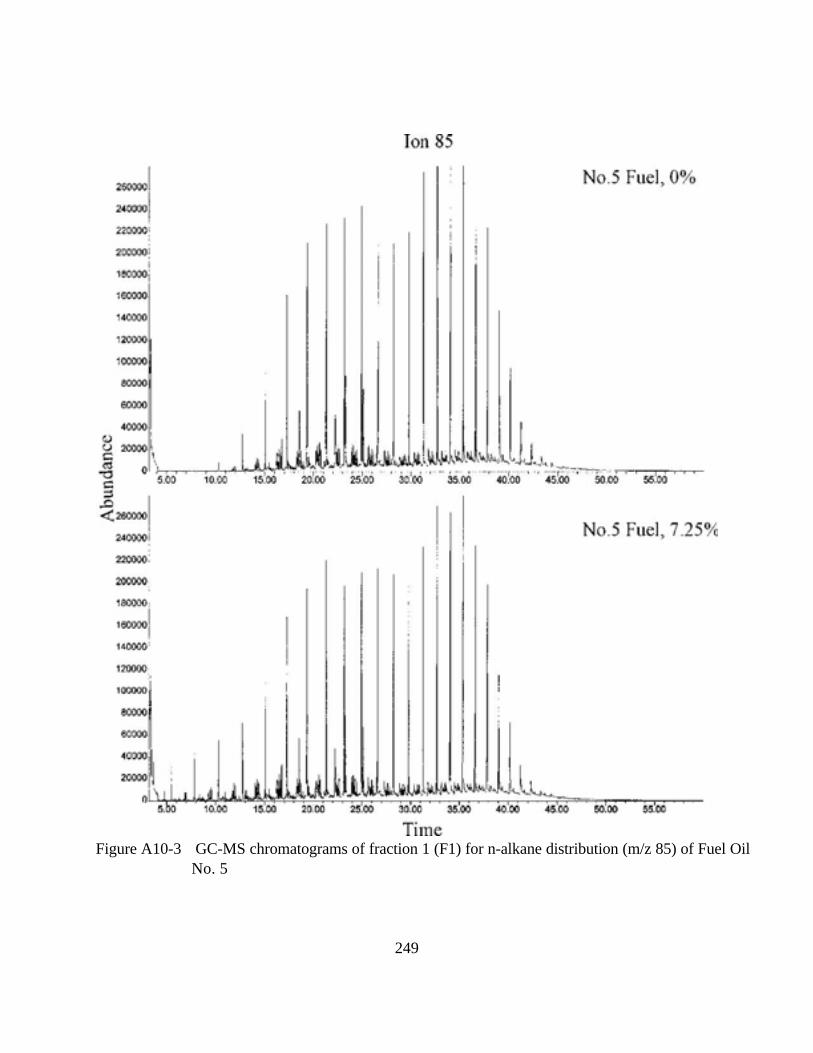
Figure A10-3 GC-MS chromatograms of fraction 1 (F1) for n-alkane distribution (m/z 85) of Fuel Oil
No. 5
249
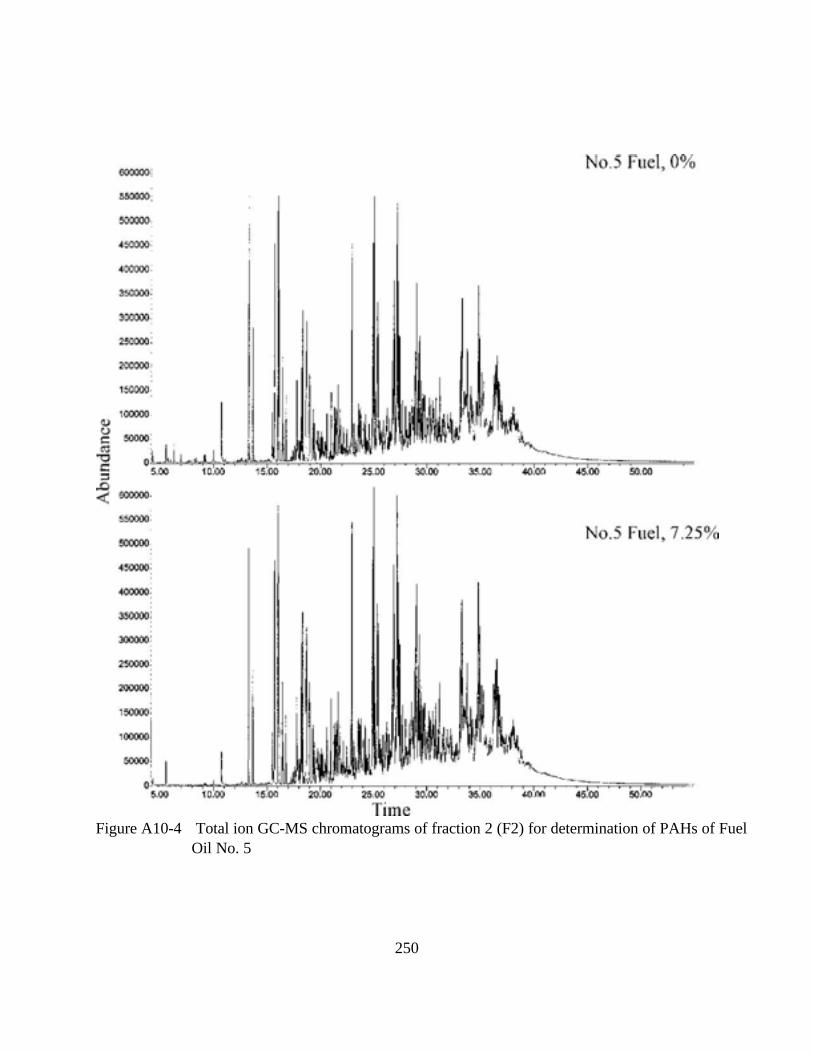
Figure A10-4 Total ion GC-MS chromatograms of fraction 2 (F2) for determination of PAHs of Fuel
Oil No. 5
250
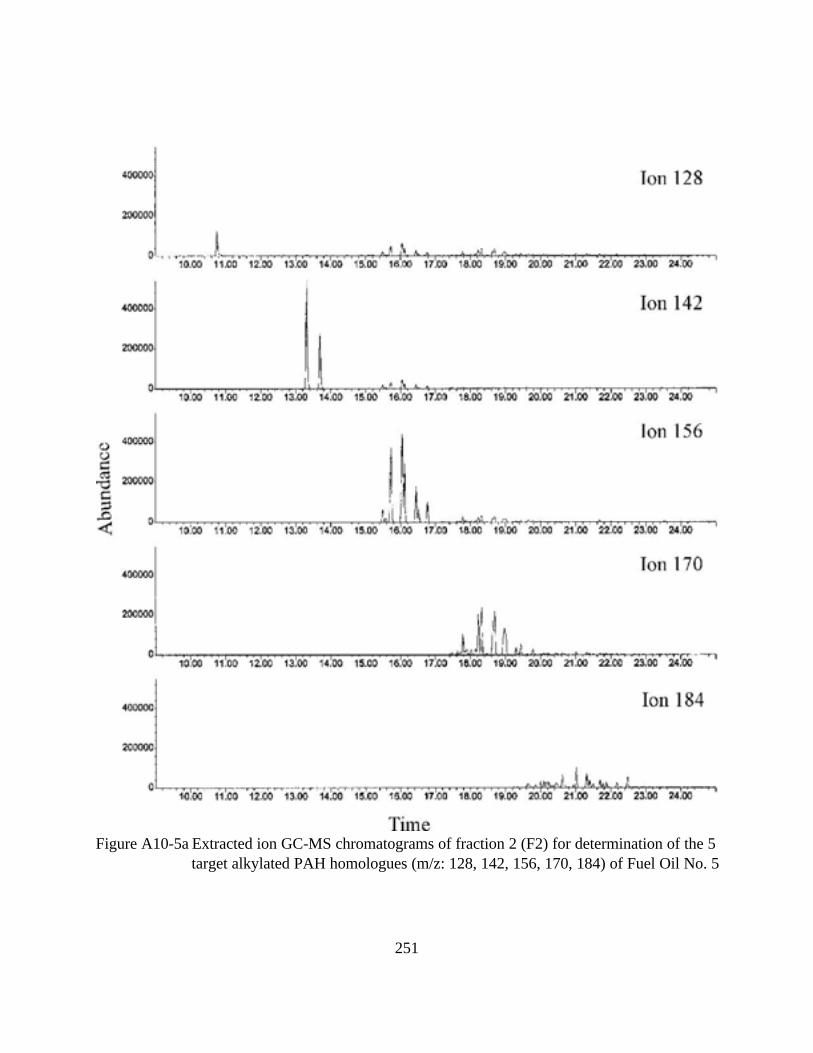
Figure A10-5a Extracted ion GC-MS chromatograms of fraction 2 (F2) for determination of the 5
target alkylated PAH homologues (m/z: 128, 142, 156, 170, 184) of Fuel Oil No. 5
251
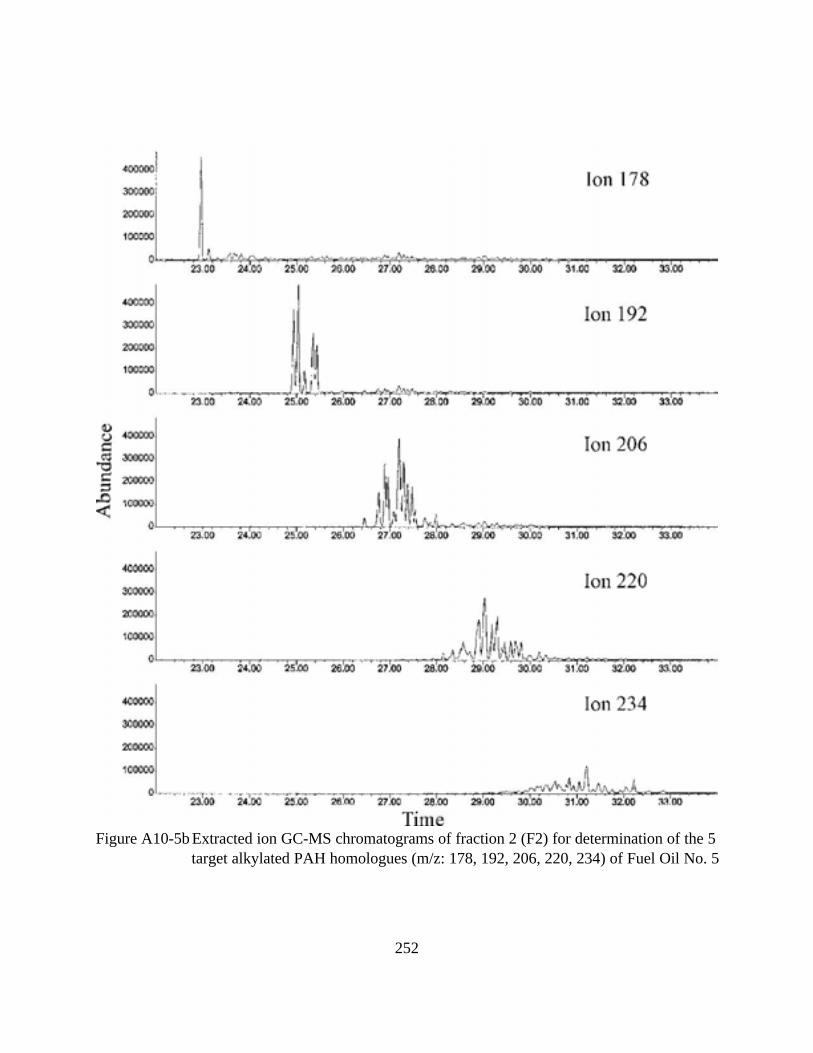
Figure A10-5b Extracted ion GC-MS chromatograms of fraction 2 (F2) for determination of the 5
target alkylated PAH homologues (m/z: 178, 192, 206, 220, 234) of Fuel Oil No. 5
252
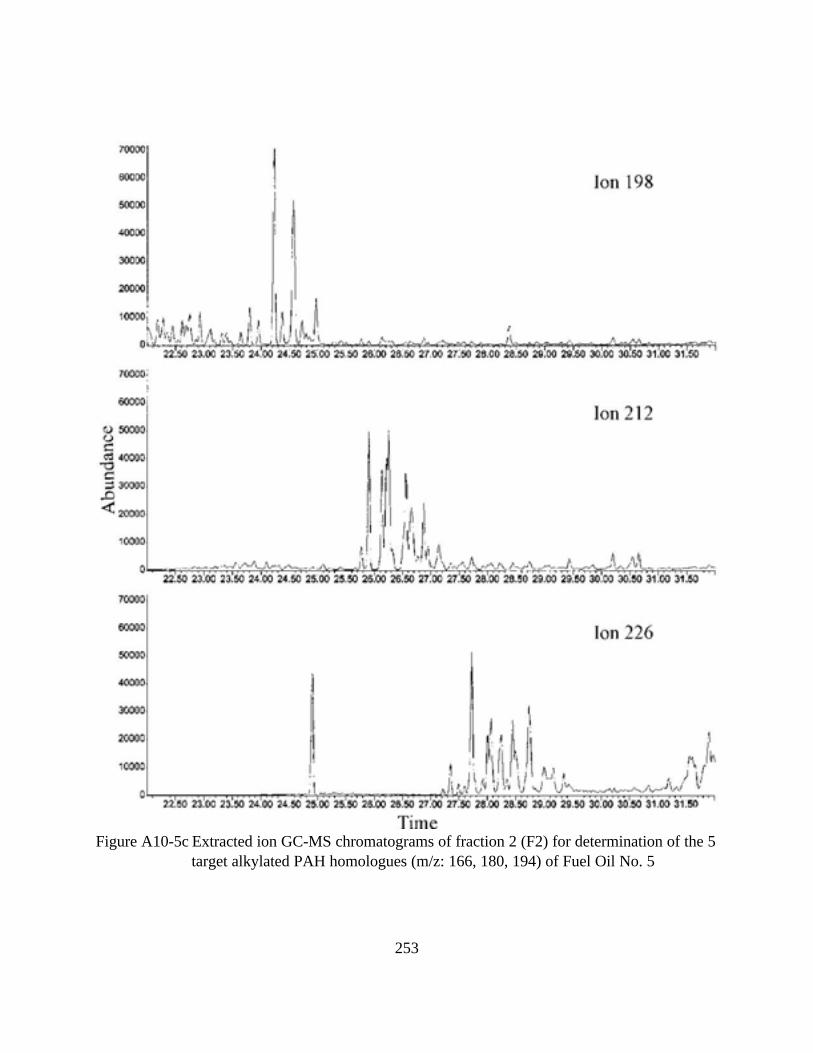
Figure A10-5c Extracted ion GC-MS chromatograms of fraction 2 (F2) for determination of the 5
target alkylated PAH homologues (m/z: 166, 180, 194) of Fuel Oil No. 5
253
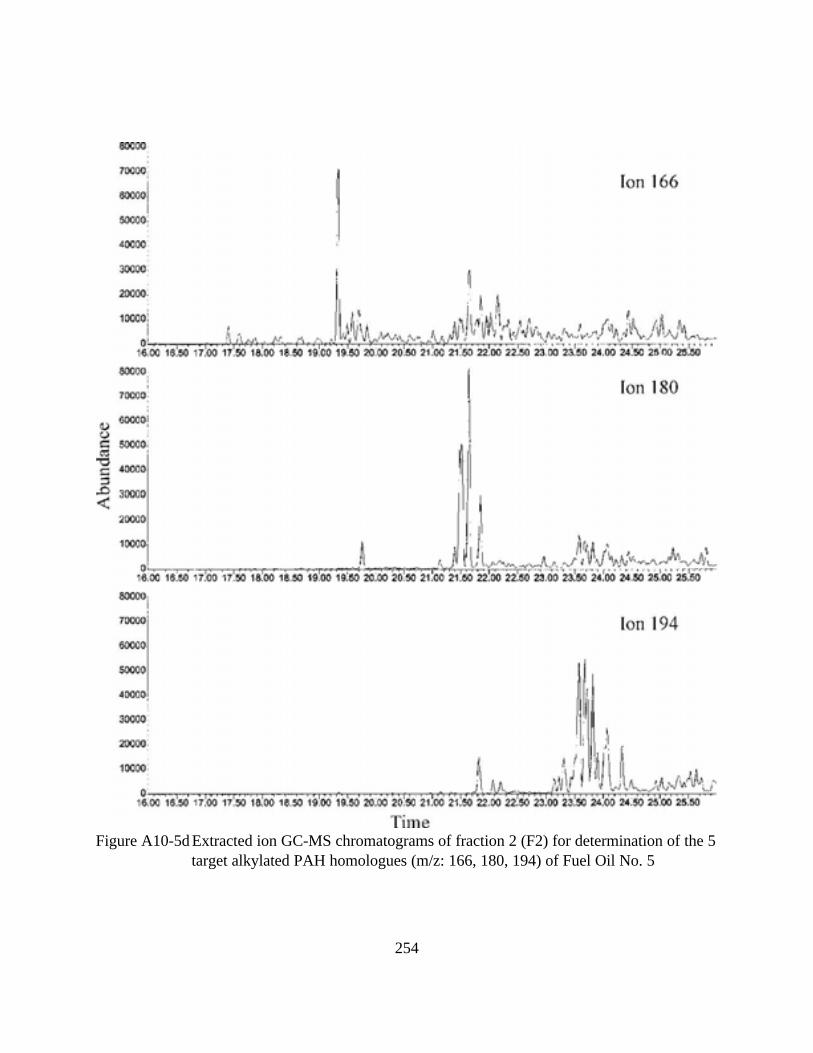
Figure A10-5d Extracted ion GC-MS chromatograms of fraction 2 (F2) for determination of the 5
target alkylated PAH homologues (m/z: 166, 180, 194) of Fuel Oil No. 5
254
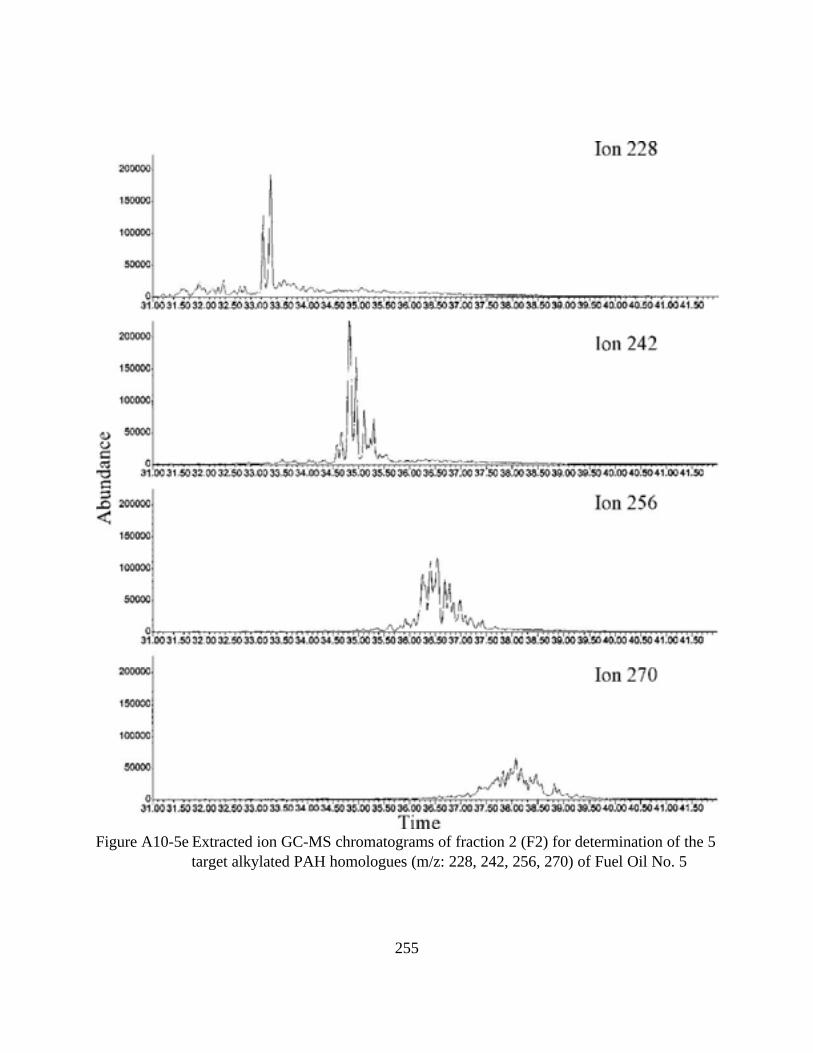
Figure A10-5e Extracted ion GC-MS chromatograms of fraction 2 (F2) for determination of the 5
target alkylated PAH homologues (m/z: 228, 242, 256, 270) of Fuel Oil No. 5
255
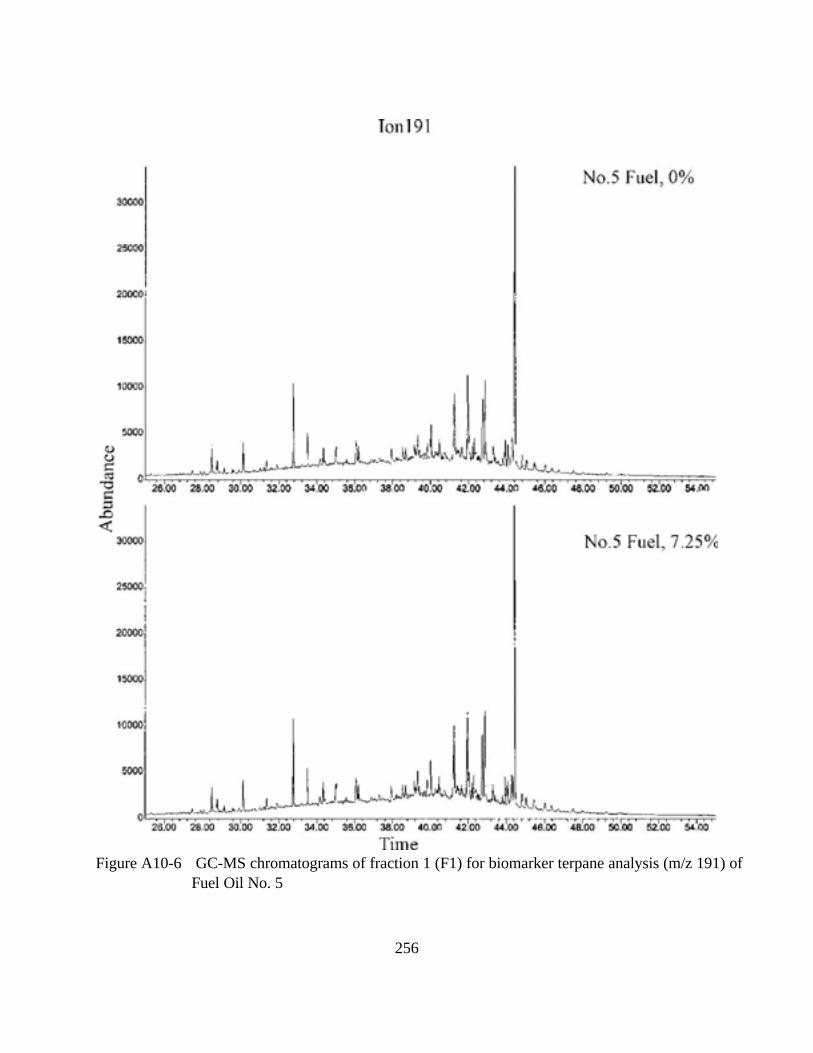
Figure A10-6 GC-MS chromatograms of fraction 1 (F1) for biomarker terpane analysis (m/z 191) of
Fuel Oil No. 5
256
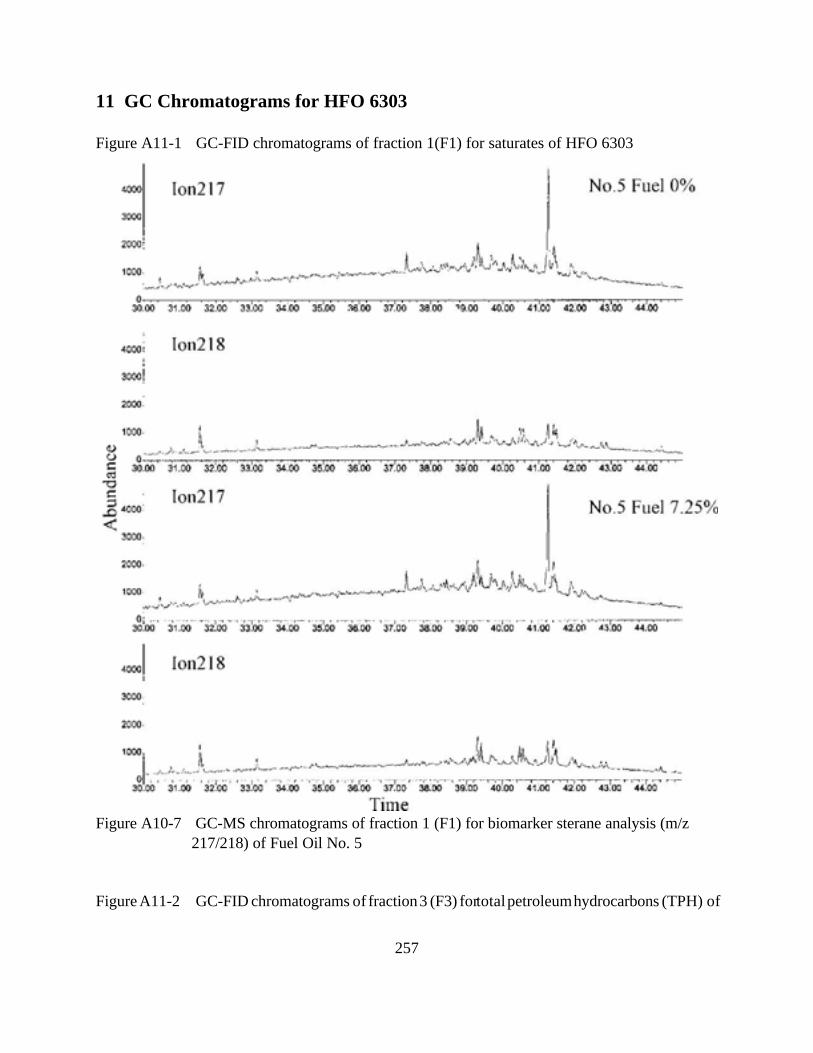
11 GC Chromatograms for HFO 6303
Figure A11-1 GC-FID chromatograms of fraction 1 (F1) for saturates of HFO 6303
Figure A10-7 GC-MS chromatograms of fraction 1 (F1) for biomarker sterane analysis (m/z
217/218) of Fuel Oil No. 5
Figure A11-2 GC-FID chromatograms of fraction 3 (F3) for total petroleum hydrocarbons (TPH) of
257
HFO 6303
Figure A11-3 GC-MS chromatograms of fraction 1 (F1) for n-alkane distribution (m/z 85) of HFO 6303
Figure A11-4 Total ion GC-MS chromatograms of fraction 2 (F2) for determination of PAHs of HFO
6303
Figure A11-5 Extracted ion GC-MS chromatograms of fraction 2 (F2) for determination of the 5 target
alkylated PAH homologues (m/z: 128, 142, 156, 170, 184, 178, 192, 206, 220, 234,
198, 212, 226, 166, 180, 194, 228, 242, 256, and 270) of HFO 6303
Figure A11-6 GC-MS chromatograms of fraction 1 (F1) for biomarker terpane analysis (m/z 191) of
HFO 6303
Figure A11-7 GC-MS chromatograms of fraction 1 (F1) for biomarker sterane analysis (m/z 217/218)
of HFO 6303
258

Figure A11-1 GC-FID chromatograms of fraction 1 (F1) for saturates of HFO 6303
259
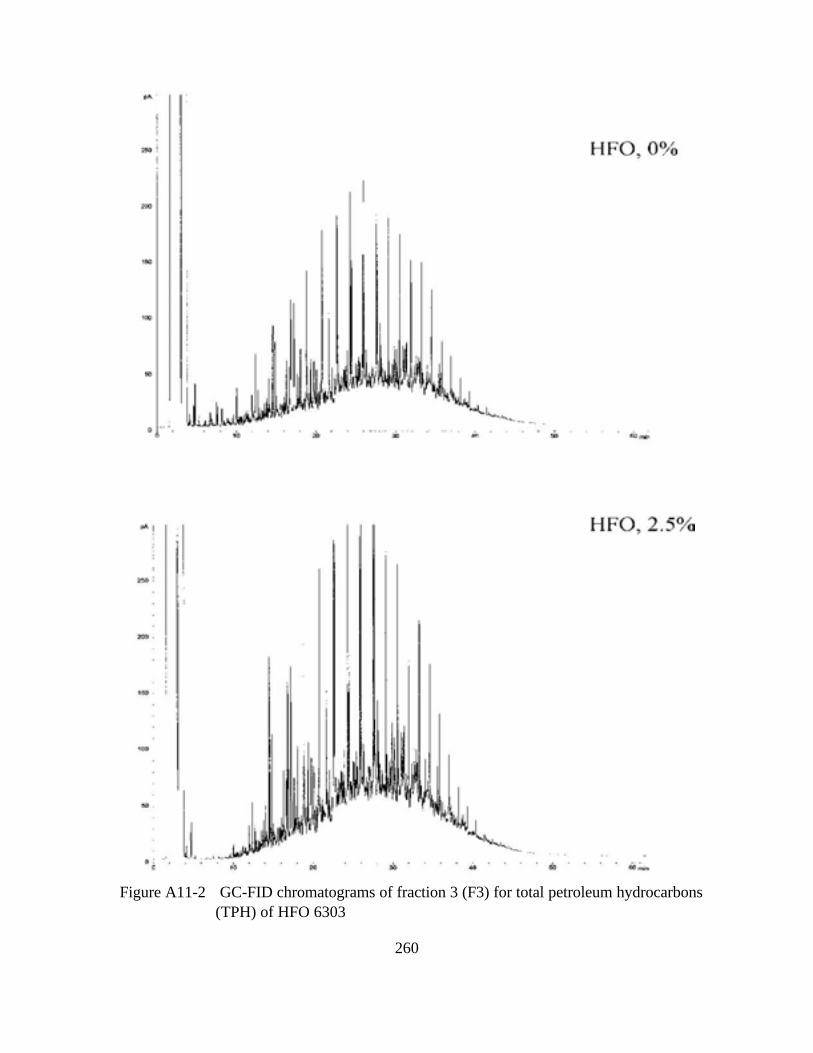
Figure A11-2 GC-FID chromatograms of fraction 3 (F3) for total petroleum hydrocarbons
(TPH) of HFO 6303
260
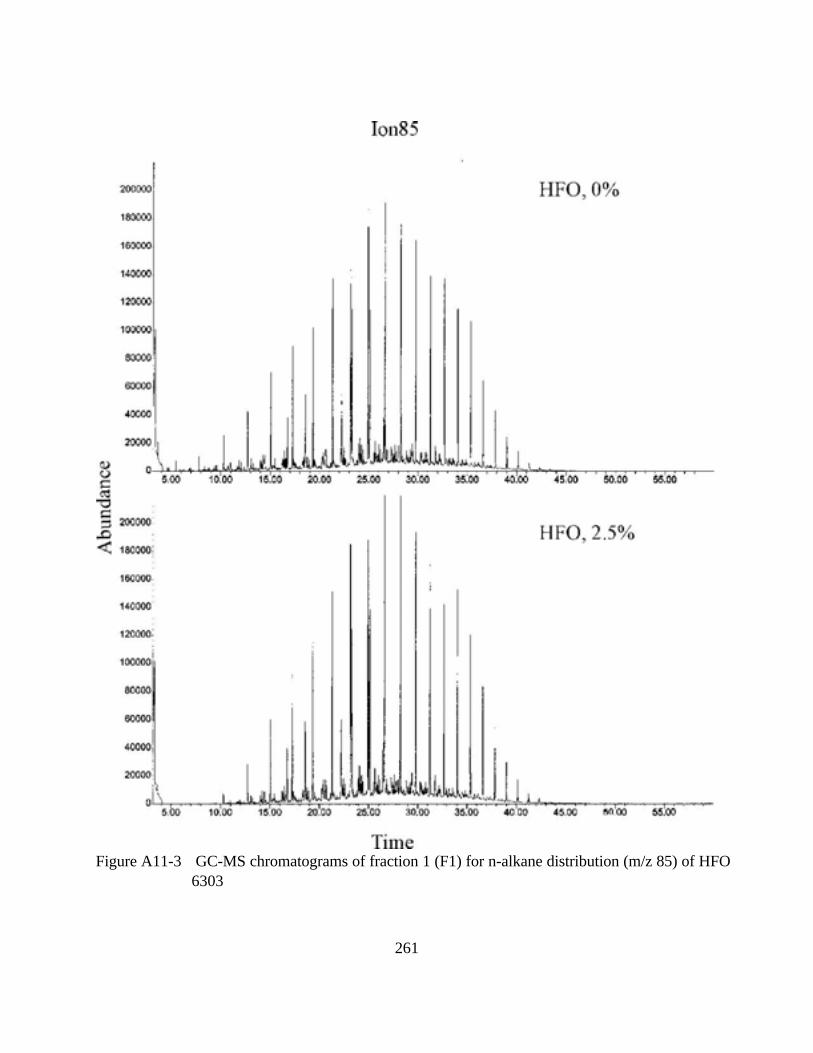
Figure A11-3 GC-MS chromatograms of fraction 1 (F1) for n-alkane distribution (m/z 85) of HFO
6303
261
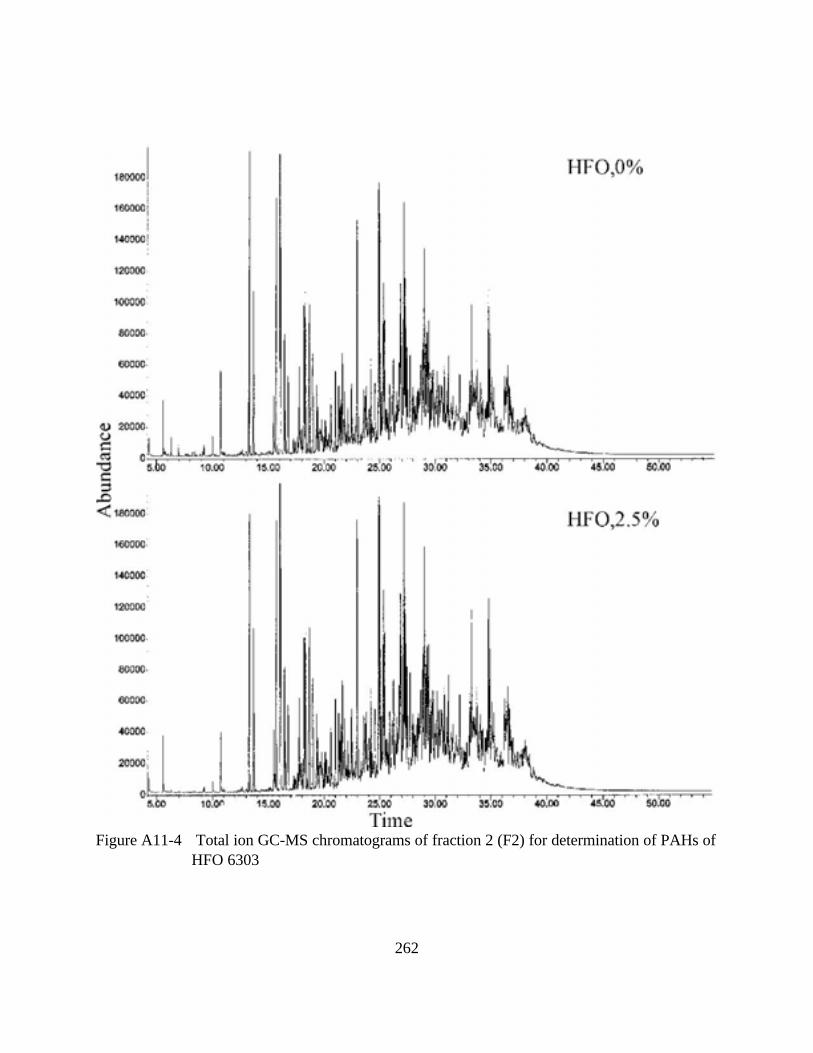
Figure A11-4 Total ion GC-MS chromatograms of fraction 2 (F2) for determination of PAHs of
HFO 6303
262
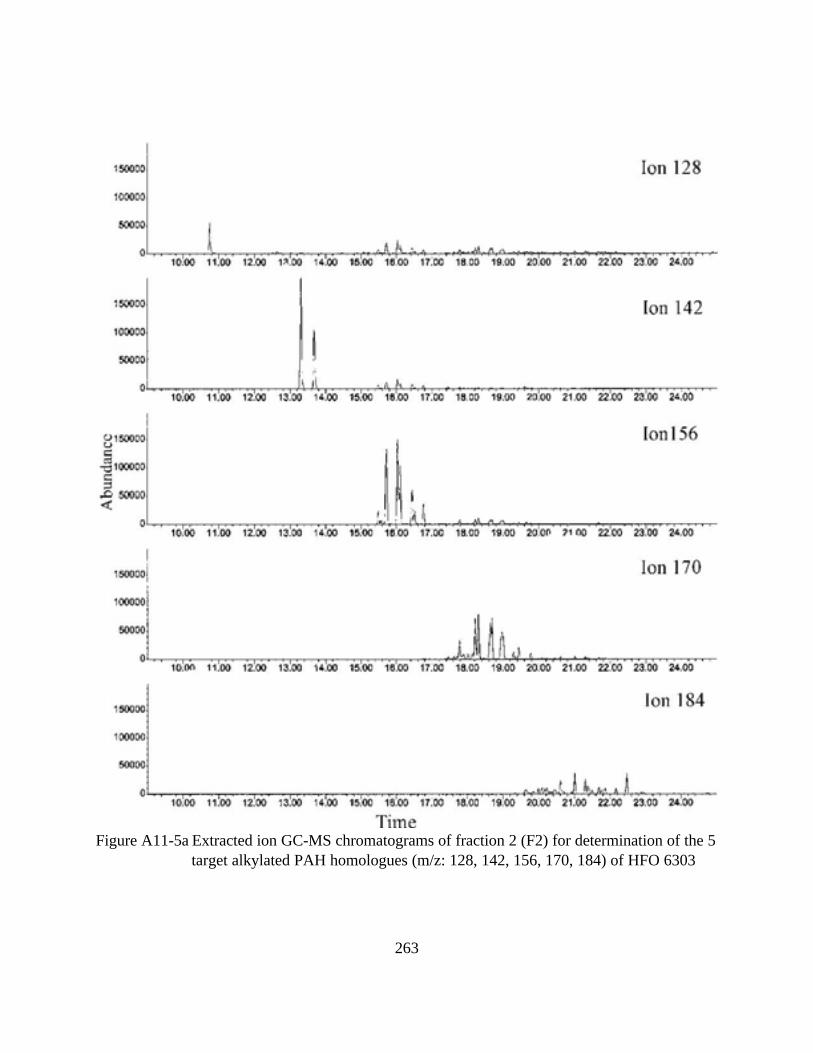
Figure A11-5a Extracted ion GC-MS chromatograms of fraction 2 (F2) for determination of the 5
target alkylated PAH homologues (m/z: 128, 142, 156, 170, 184) of HFO 6303
263
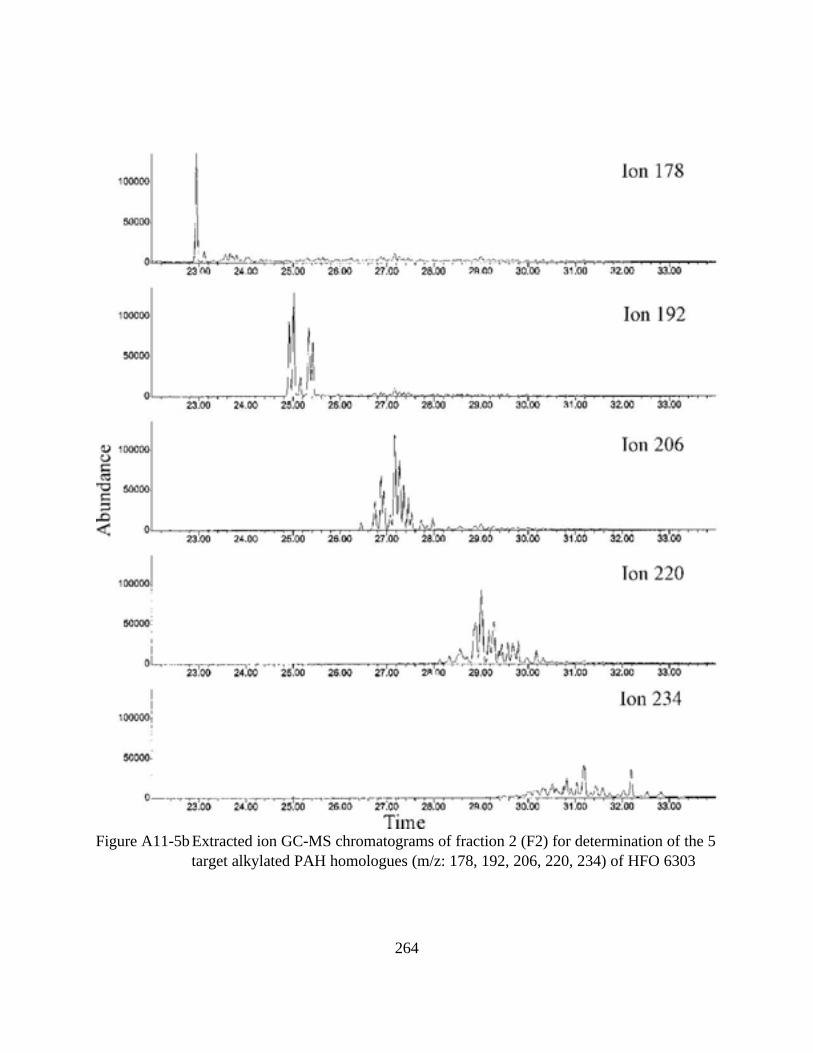
Figure A11-5b Extracted ion GC-MS chromatograms of fraction 2 (F2) for determination of the 5
target alkylated PAH homologues (m/z: 178, 192, 206, 220, 234) of HFO 6303
264
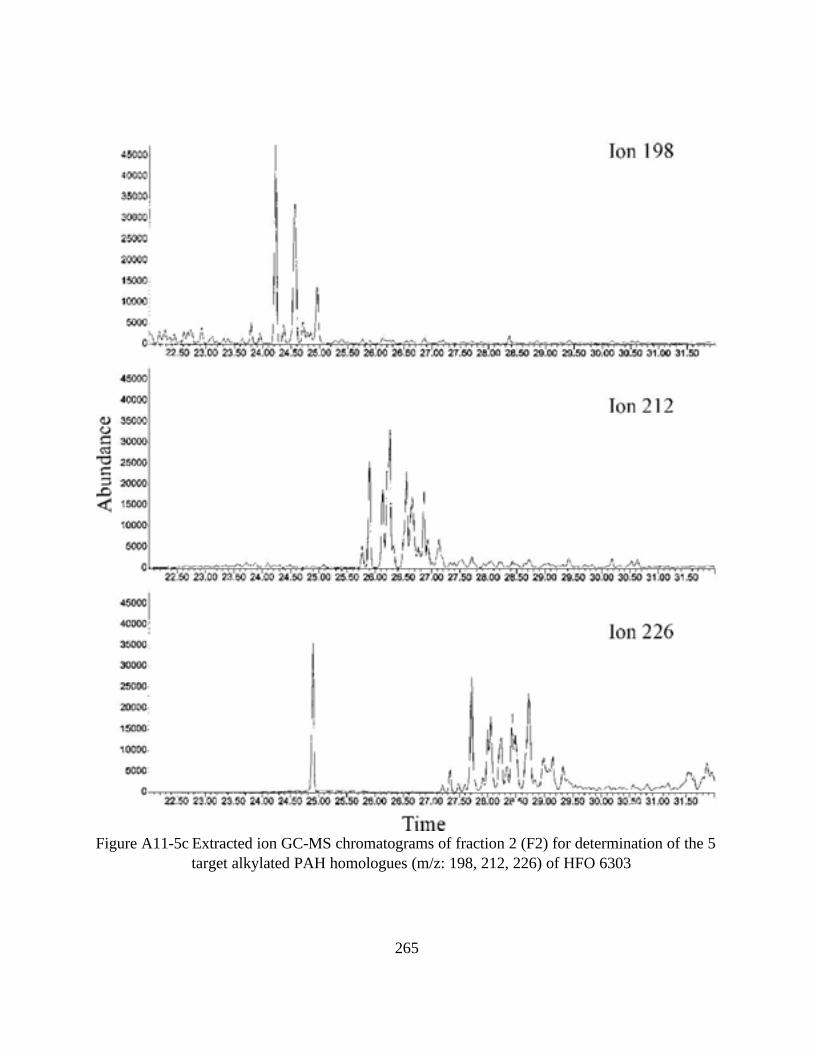
Figure A11-5c Extracted ion GC-MS chromatograms of fraction 2 (F2) for determination of the 5
target alkylated PAH homologues (m/z: 198, 212, 226) of HFO 6303
265
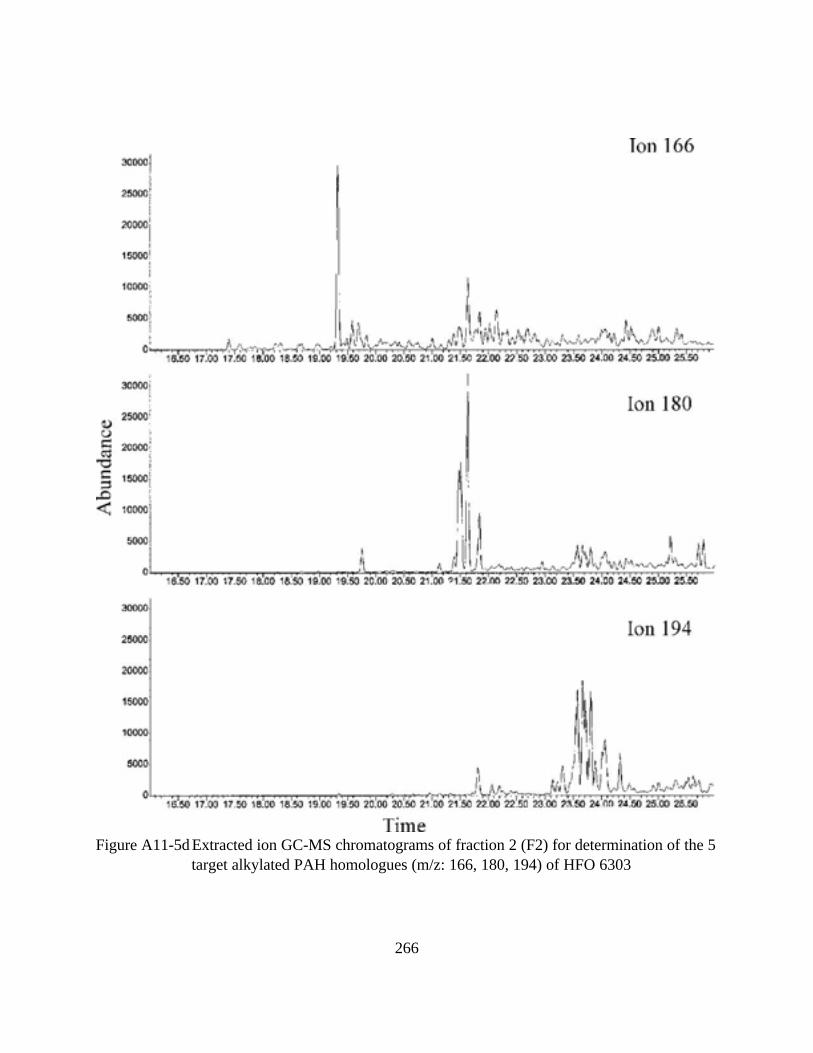
Figure A11-5d Extracted ion GC-MS chromatograms of fraction 2 (F2) for determination of the 5
target alkylated PAH homologues (m/z: 166, 180, 194) of HFO 6303
266
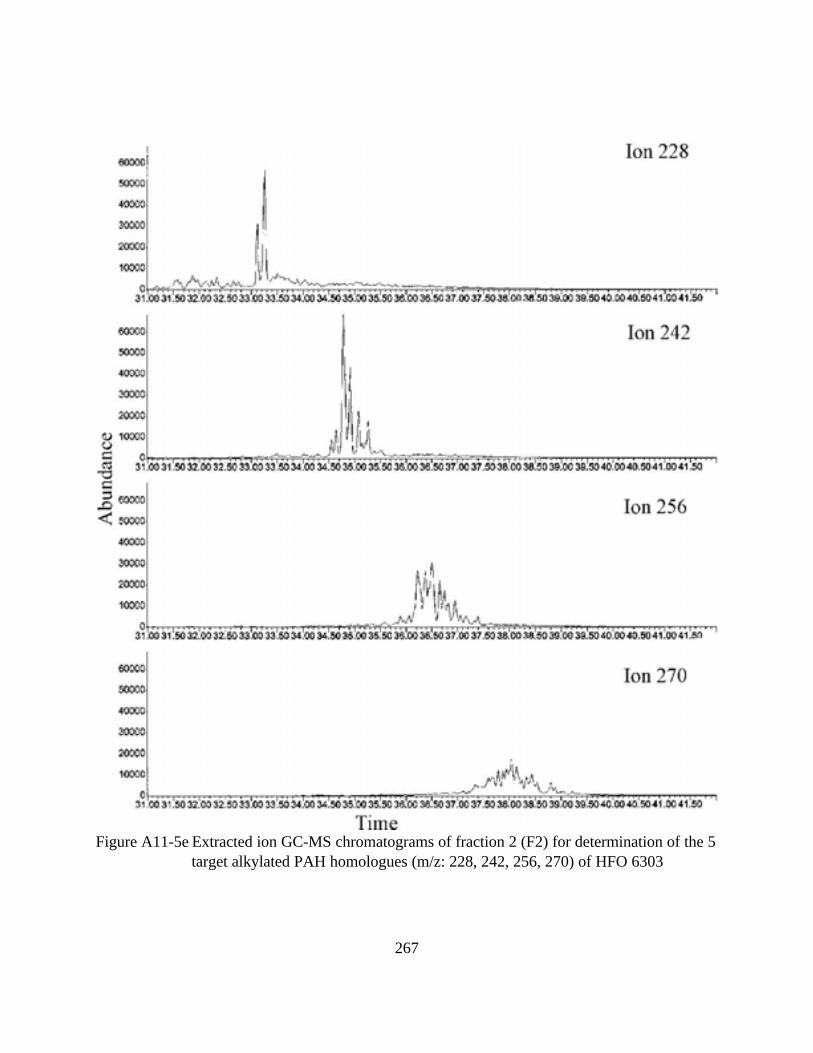
Figure A11-5e Extracted ion GC-MS chromatograms of fraction 2 (F2) for determination of the 5
target alkylated PAH homologues (m/z: 228, 242, 256, 270) of HFO 6303
267
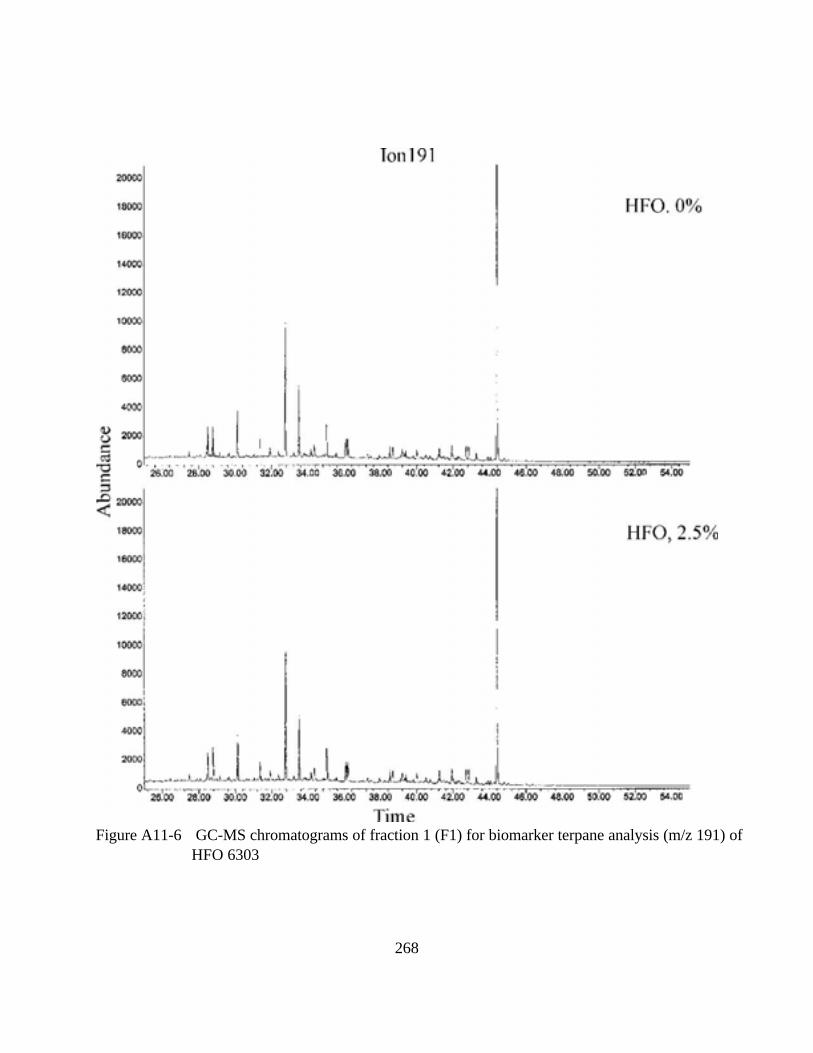
Figure A11-6 GC-MS chromatograms of fraction 1 (F1) for biomarker terpane analysis (m/z 191) of
HFO 6303
268
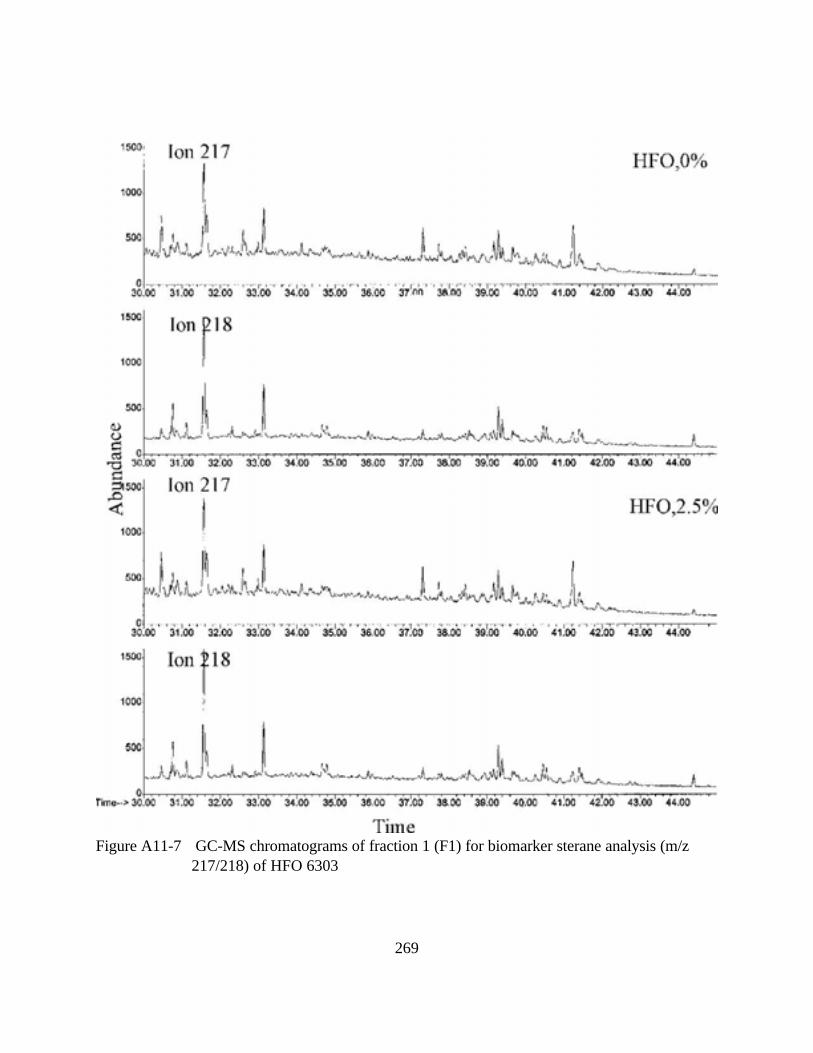
Figure A11-7 GC-MS chromatograms of fraction 1 (F1) for biomarker sterane analysis (m/z
217/218) of HFO 6303
269
12 GC Chromatograms for Orimulsion-400
Figure A12-1 GC-FID chromatograms of fraction 1 (F1) for saturates and of fraction 3 (F3) for total
petroleum hydrocarbons (TPH) of Orimulsion-400
Figure A12-2 GC-MS chromatograms of fraction 1 (F1) for n-alkane distribution (m/z 85) of
Orimulsion-400
Figure A12-3 Total ion GC-MS chromatograms of fraction 2 (F2) for determination of PAHs of
Orimulsion-400
Figure A12-4 Extracted ion GC-MS chromatograms of fraction 2 (F2) for determination of the 5 target
alkylated PAH homologues (m/z: 128, 142, 156, 170, 184, 178, 192, 206, 220, 234,
198, 212, 226, 166, 180, 194, 228, 242, 256, and 270) of Orimulsion-400
Figure A12-5 GC-MS chromatograms of fraction 1 (F1) for biomarker terpane analysis (m/z 191) of
Orimulsion-400
Figure A12-6 GC-MS chromatograms of fraction 1 (F1) for biomarker sterane analysis (m/z 217/218)
of Orimulsion-400
270
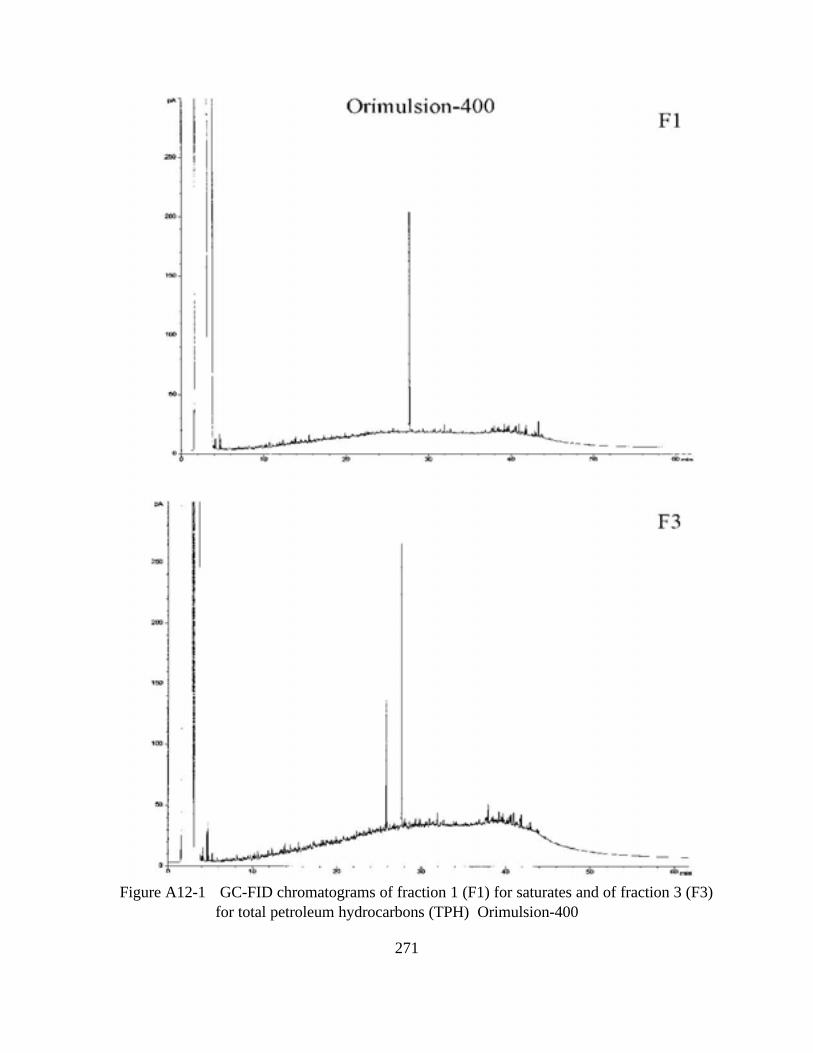
Figure A12-1 GC-FID chromatograms of fraction 1 (F1) for saturates and of fraction 3 (F3)
for total petroleum hydrocarbons (TPH) Orimulsion-400
271
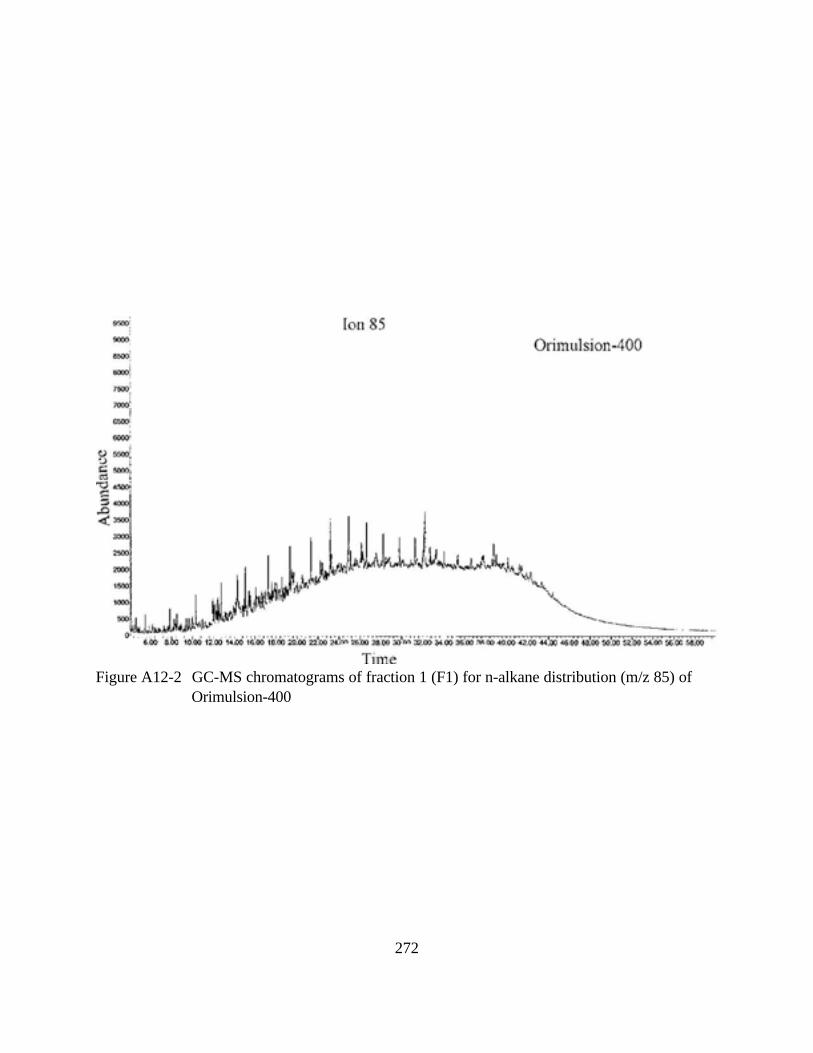
Figure A12-2 GC-MS chromatograms of fraction 1 (F1) for n-alkane distribution (m/z 85) of
Orimulsion-400
272
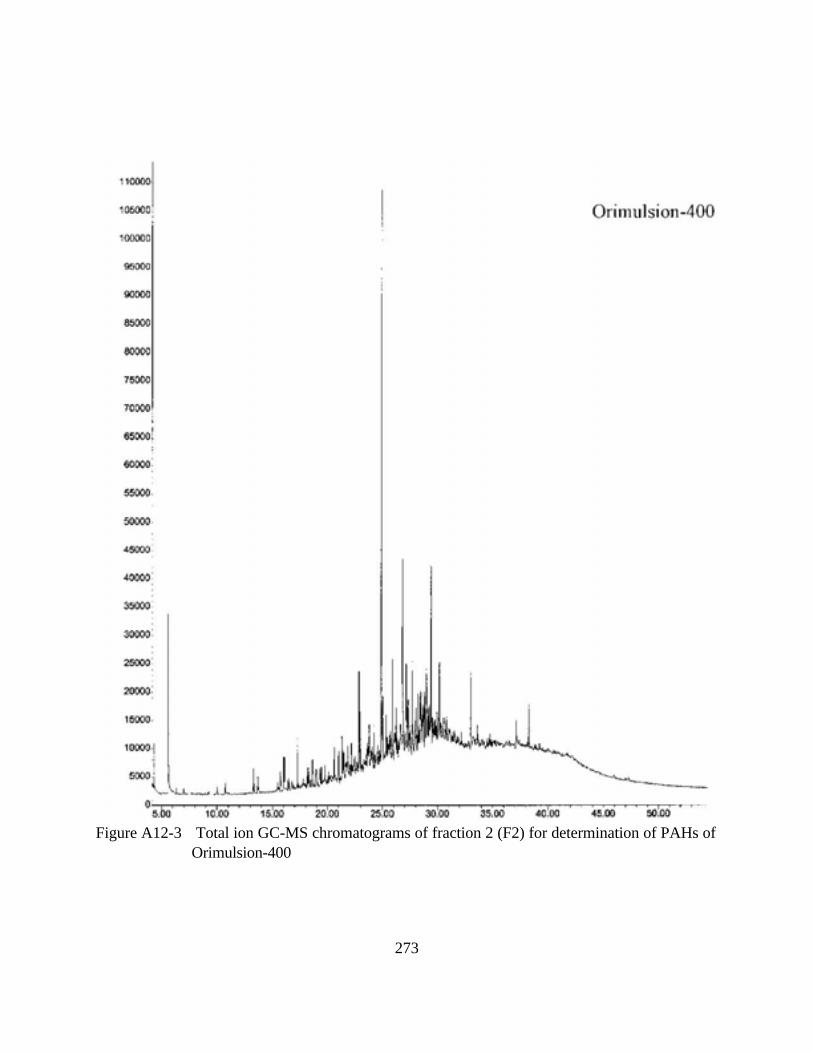
Figure A12-3 Total ion GC-MS chromatograms of fraction 2 (F2) for determination of PAHs of
Orimulsion-400
273
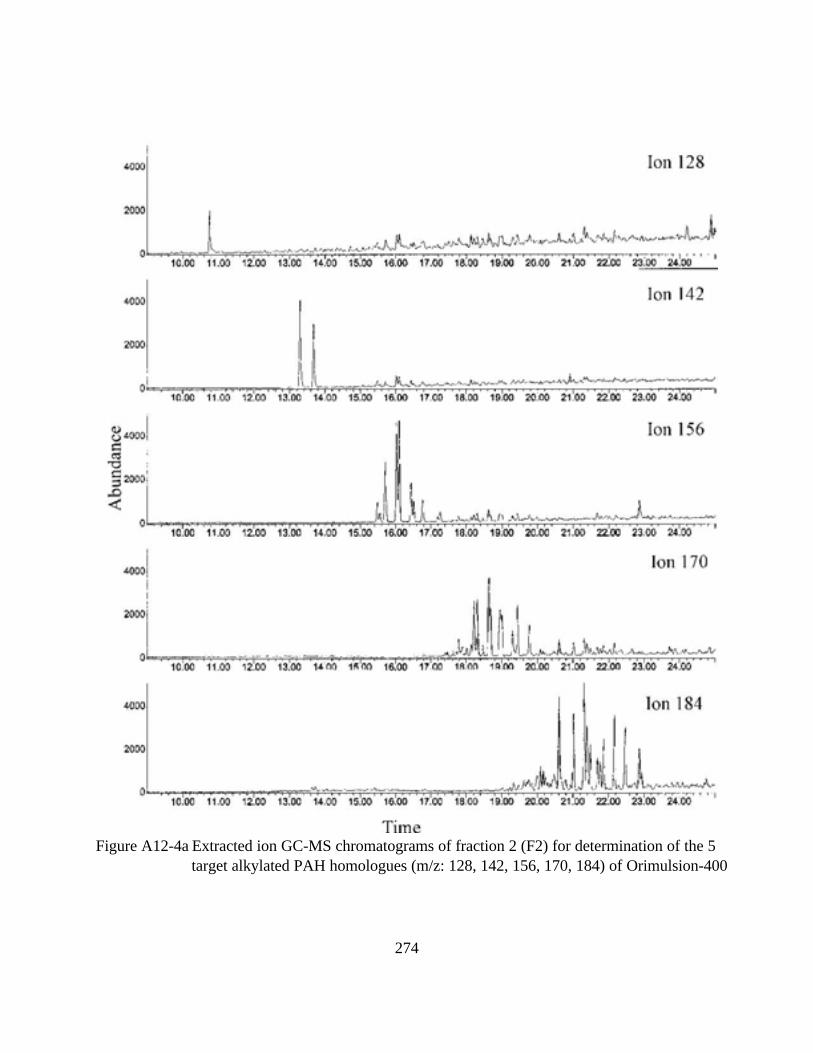
Figure A12-4a Extracted ion GC-MS chromatograms of fraction 2 (F2) for determination of the 5
target alkylated PAH homologues (m/z: 128, 142, 156, 170, 184) of Orimulsion-400
274
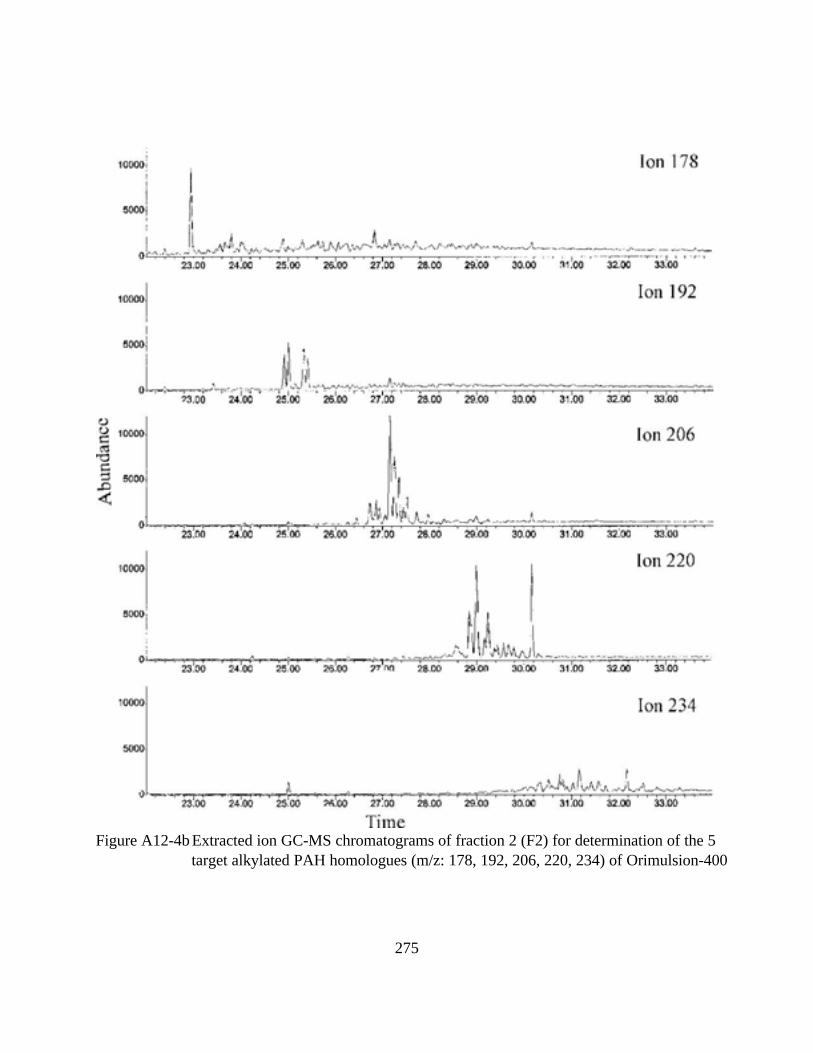
Figure A12-4b Extracted ion GC-MS chromatograms of fraction 2 (F2) for determination of the 5
target alkylated PAH homologues (m/z: 178, 192, 206, 220, 234) of Orimulsion-400
275
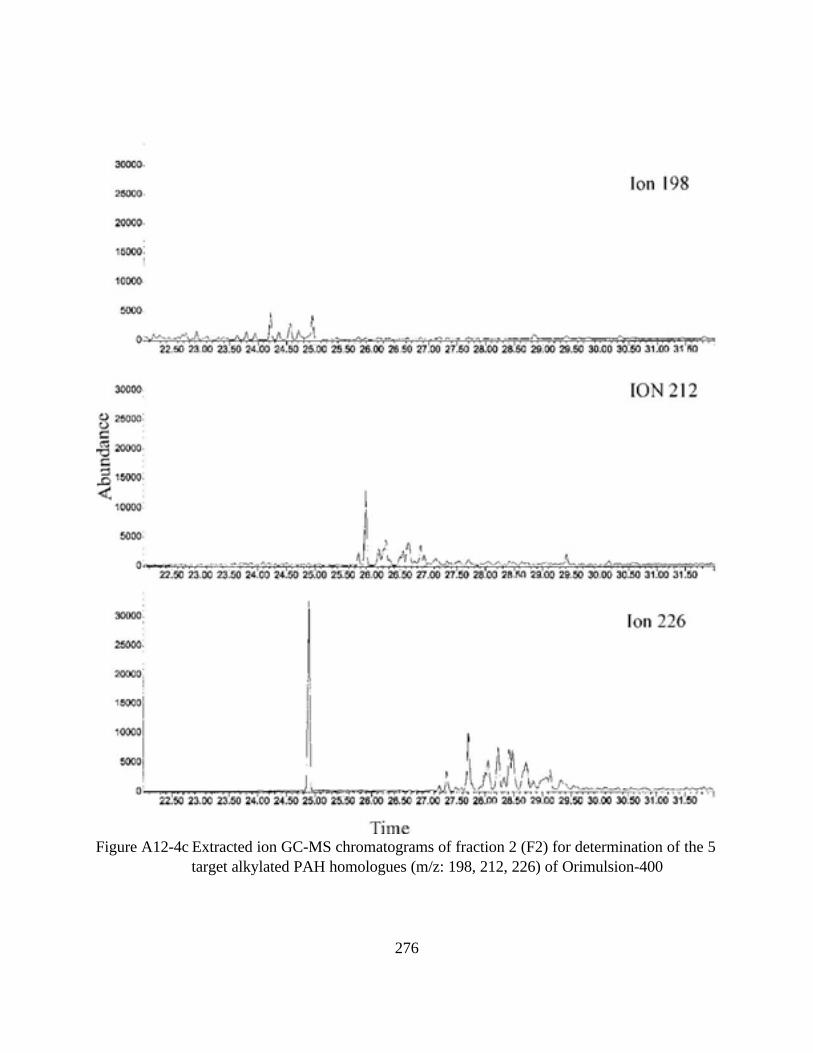
Figure A12-4c Extracted ion GC-MS chromatograms of fraction 2 (F2) for determination of the 5
target alkylated PAH homologues (m/z: 198, 212, 226) of Orimulsion-400
276
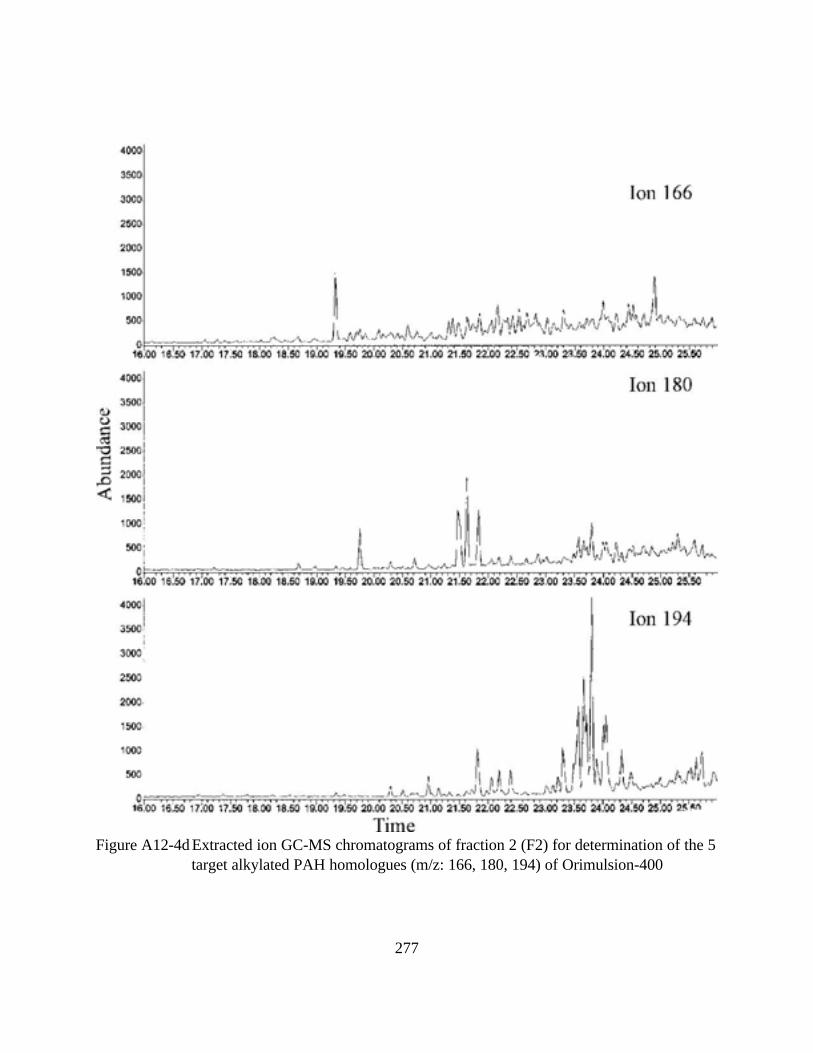
Figure A12-4d Extracted ion GC-MS chromatograms of fraction 2 (F2) for determination of the 5
target alkylated PAH homologues (m/z: 166, 180, 194) of Orimulsion-400
277
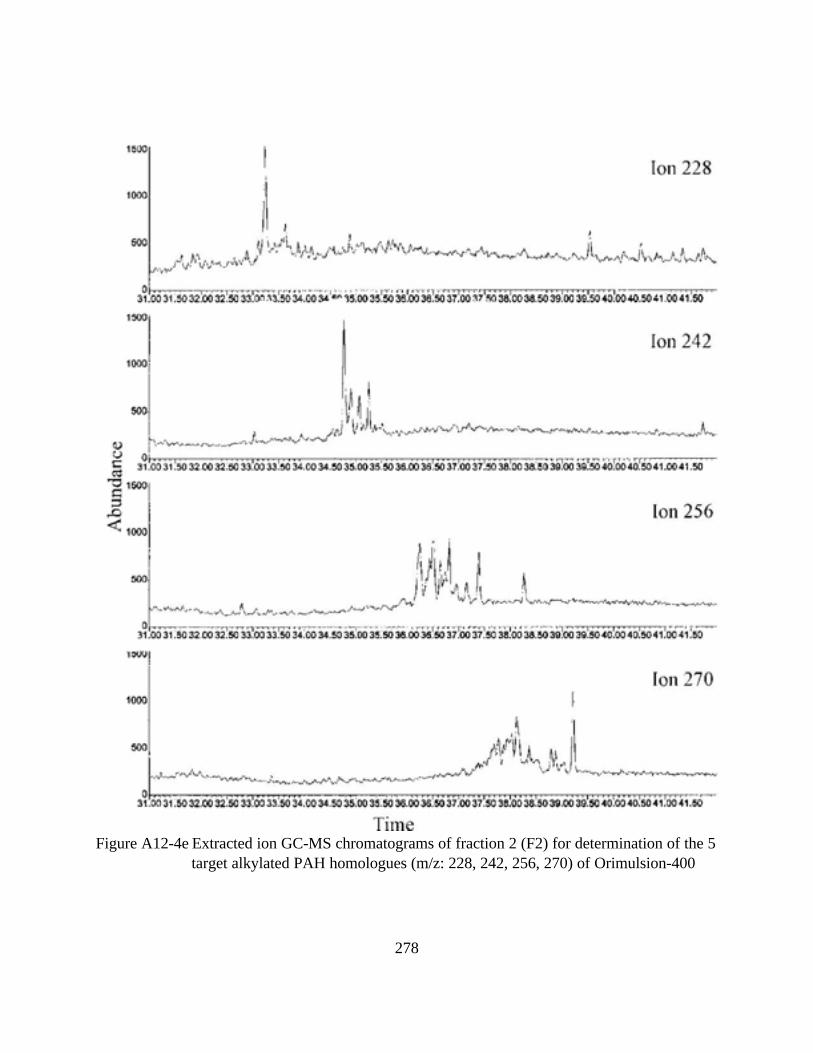
Figure A12-4e Extracted ion GC-MS chromatograms of fraction 2 (F2) for determination of the 5
target alkylated PAH homologues (m/z: 228, 242, 256, 270) of Orimulsion-400
278
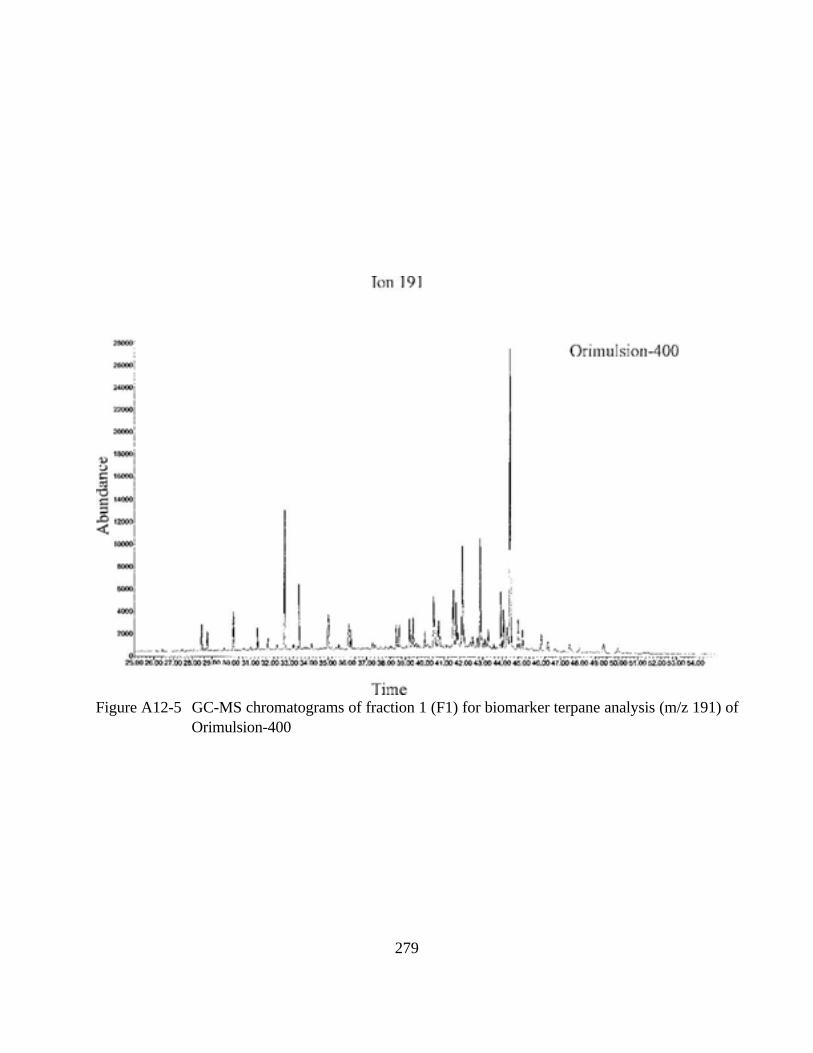
Figure A12-5 GC-MS chromatograms of fraction 1 (F1) for biomarker terpane analysis (m/z 191) of
Orimulsion-400
279
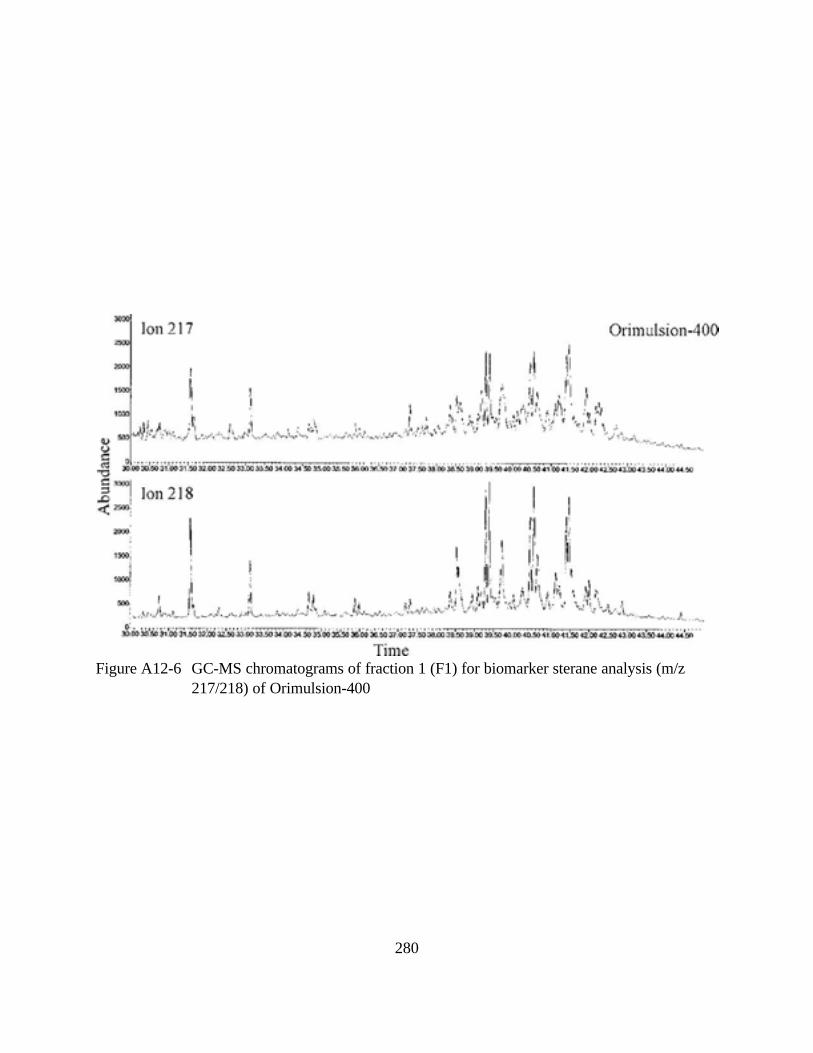
Figure A12-6 GC-MS chromatograms of fraction 1 (F1) for biomarker sterane analysis (m/z
217/218) of Orimulsion-400
280