Embed Size (px)
Citation preview
Pepperdine UniversityPepperdine Digital Commons
School of Public Policy Working Papers School of Public Policy
11-6-2012
The Broadband Digital Divide and the EconomicBenefits of Mobile Broadband for Rural AreasJames Prieger
Follow this and additional works at: http://digitalcommons.pepperdine.edu/sppworkingpapersPart of the Public Affairs, Public Policy and Public Administration Commons
This Article is brought to you for free and open access by the School of Public Policy at Pepperdine Digital Commons. It has been accepted forinclusion in School of Public Policy Working Papers by an authorized administrator of Pepperdine Digital Commons. For more information, pleasecontact [email protected].
Recommended CitationPrieger, James, "The Broadband Digital Divide and the Economic Benefits of Mobile Broadband for Rural Areas" (2012). PepperdineUniversity, School of Public Policy Working Papers. Paper 41.http://digitalcommons.pepperdine.edu/sppworkingpapers/41
S c h o o l o f P u b l i c P o l i c y 2 4 2 5 5 P a c i f i c C o a s t H i g h w a y
M a l i b u , C A 9 0 2 6 3 - 7 4 9 0
Author contact
information:
Associate Professor
Pepperdine University
School of Public Policy
Phone: 310-506-7150
Abstract
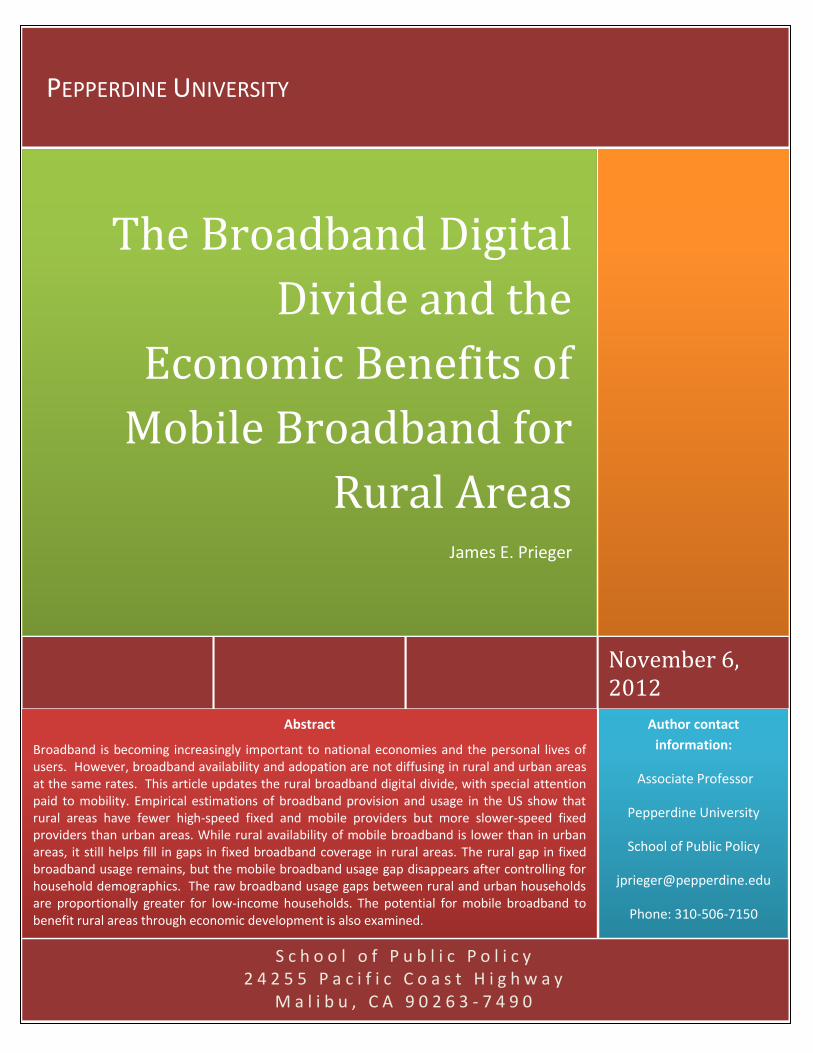
Broadband is becoming increasingly important to national economies and the personal lives of users. However, broadband availability and adopation are not diffusing in rural and urban areas at the same rates. This article updates the rural broadband digital divide, with special attention paid to mobility. Empirical estimations of broadband provision and usage in the US show that rural areas have fewer high-speed fixed and mobile providers but more slower-speed fixed providers than urban areas. While rural availability of mobile broadband is lower than in urban areas, it still helps fill in gaps in fixed broadband coverage in rural areas. The rural gap in fixed broadband usage remains, but the mobile broadband usage gap disappears after controlling for household demographics. The raw broadband usage gaps between rural and urban households are proportionally greater for low-income households. The potential for mobile broadband to benefit rural areas through economic development is also examined.
November 6, 2012
The Broadband Digital
Divide and the
Economic Benefits of
Mobile Broadband for
Rural Areas
James E. Prieger
PEPPERDINE UNIVERSITY

1
Note: This working paper is a pre-print version of an article with the same title
published in the Elsevier journal Telecommunications Policy. All citations should be to
the published version of the article. Permission to post this working paper is granted
by the publisher (see
http://www.elsevier.com/wps/find/authorsview.authors/rights).
This working paper also supercedes a previous version, posted as:
Prieger, James, "The Economic Benefits of Mobile Broadband" (2012). Pepperdine
University, School of Public Policy Working Papers. Paper 38.
2
1. Introduction
Broadband internet access in general and mobile broadband in particular are becoming
increasingly important to national economies and the personal lives of users. In the US alone there
were 120 million mobile broadband connections in mid-2011, more than the number of fixed broadband
connections (FCC 2012b, Table 1). Nevertheless, some in the realm of public policy still express concern
that broadband availability and adoption are not diffusing as quickly in rural areas as elsewhere
(Stenberg et al., 2009; Genachowski, 2011). This article presents an updated view of the rural digital
divide based on recent statistics, showing that some gaps in both availability and usage persist.
Surprisingly, however, there is no apparent rural disadvantage in the availability of relatively slow forms
of fixed broadband. There is also no significant evidence of a rural disadvantage in mobile broadband
usage after controlling for household demographics, even without accounting for lower rural availability.
The potential for mobile broadband to be an engine of growth for rural economic development is also
examined.
The empirical investigation work leads to six main results. The first three pertain to broadband
availability. For fixed broadband, the expected rural digital divide shows up for faster forms of
broadband, whether considering availability or the number of providers, but the opposite holds for
lower-speed fixed broadband (Result 1). There are more fixed lower-speed broadband suppliers
offering service in rural Census tracts than in urban tracts. This finding does not necessarily imply that
rural households have access to more broadband choices among these service providers, as will be
discussed below. However, this is the first documentation of an inversion of any form of the Digital
Divide between rural and urban areas of which I am aware. Next, for mobile broadband, the rural/urban
availability divide is in evidence (Result 2). However, in Result 3 I find some evidence that mobile
broadband is helping to fill in gaps in fixed broadband coverage in rural areas.
The final three main results concern the usage of broadband by households, gathered from
Federal Communications Commission (FCC) data and a US Census Bureau survey. The present study is
one of the first econometric studies using the new Census broadband usage data. Result 4 is that there
remains a sizeable gap in usage rates between urban and rural areas for fixed broadband (Result 1
notwithstanding). Result 5 refines the previous result: the broadband usage digital divide between
urban and rural dwellers is proportionally greater for low-income households, at least when not
3
controlling for other demographic characteristics. The final result is novel and surprising: after
controlling for demographics, there is no apparent rural disadvantage in usage of mobile broadband,
even though there is an availability gap (Result 6). This result, coupled with Result 4, implies that mobile
broadband usage is filling in part of the rural usage gap in fixed broadband.
The article proceeds by documenting the gaps in availability and usage between rural and urban
areas, where they exist, in the next section. Both external evidence and novel examinations of recent
FCC and Census data are presented. The data for the empirical study come from the FCC’s census of all
broadband providers and Census Bureau survey data on broadband usage, both for late 2010. In section
3 the promise for broadband to spur local economic growth is reviewed. The final section summarizes
the results, reviews current federal policy responses to the broadband digital divide, and mentions other
policy implications. Although the digital divide has an international dimension (Eggerton, 2011), the
focus here is on the US.
2. The State of Broadband Availability and Usage in the US
2.1. Broadband Availability
Rural areas in the US are generally measured to lag their urban counterparts in broadband
availability. For example, one study of broadband deployment in South Carolina using the latest official
broadband data from the National Telecommunications and Information Administration (NTIA) found
that broadband service is scarcer in the more rural areas of the state (Li, Turner-Lee, Gambhir, & Baek,
2011). There are also far fewer wireline and mobile options in the 10 poorest (rural) counties in South
Carolina compared to the 10 with the highest incomes (which are more urbanized). Nationally, figures
from the FCC (2012a) for mid-2011 indicate that 23.7% of Americans living in rural areas lack access to
fixed broadband satisfying a benchmark of 3 mbps upload/768 kbps download, compared to only 1.8%
of Americans in urban areas.1 The same analysis finds that over three quarters of US residents lacking
access to broadband meeting the benchmark speed live in rural areas.
1 The FCC (2012a) calculations rely on Census block-level estimates of broadband availability from the State
Broadband Initiative (SBI) Grant Program and third-party demographic estimates of block population.
4
The present analysis of recent FCC Form 477 broadband data,2 for year-end 2010, shows that
almost everyone in the US has access to broadband in some form. These data are at the Census tract
level, and thus are not as granular as the more recent FCC (2012a) estimates. The source of the
broadband coverage data also differs between the analysis here and the FCC (2012a) estimates, and
thus the two are not directly comparable.3 The analysis here may overstate availability, if in many cases
tracts are only partially covered by broadband service providers. Nevertheless, Figure 1 (for the original
FCC definition of broadband as 200 kbps upload or download) and Figure 2 (for the National Broadband
Plan (NBP) definition of broadband of at least 3 mbps downstream and 768 kbps upstream (FCC, 2010))
show that virtually no one lives in tracts without at least one fixed broadband service provider, whether
urban or rural.4 The Census tract level figures are population weighted, and so reflect the probabilities
of the access options available to an individual in the US (subject to the caveat about incomplete
coverage within a tract). It has in fact been the case for several years that virtually everybody in the US
lives in a tract with fixed broadband coverage, as Figure 3 shows. The figure shows the population-
weighted breakdown of the number of fixed broadband providers since the Form 477 was redesigned in
2008. In Figure 3, the fraction of tracts with no fixed providers is so small that it cannot be discerned on
the graph. It is also striking from the figure how little the distribution of the number of providers per
tract has changed in recent years (which is one reason why the statistical analysis to follow will be
performed on a recent cross-section of data instead of panel data).
Given the near ubiquity of at least the slower forms of fixed broadband, most of the analysis
below focuses instead on the number of providers. Several studies have found local broadband
2 The FCC requires all broadband providers in the US to file the semi-annual Form 477 with information on where
service is offered, the speed of service, and the number of subscribers. The publicly available data include the number of fixed residential broadband providers and the number of mobile broadband providers by Census tract, where the latter is available at two speed thresholds as described below in the text. The public data also include subscription rates by tract, grouped into a few categories, as explained below. 3 The National Telecommunications and Information Administration (NTIA) coordinates with the FCC to collect the
SBI data (see previous footnote) to create the National Broadband Map (http://broadbandmap.gov). The Form 477 data analyzed here are reported to the FCC under separate rules. While the SBI data are more granular (census block instead of tract level) and may be more useful for future analysis, the National Broadband Map has also been criticized by some authors for relying on inaccurate data and misstating availability (Ford, 2011; FCC, 2012a, at 36ff). 4 In both cases, providers are counted only if they offer residential broadband service. Data from the Economic
Research Service (ERS) of the US Department of Agriculture are used to classify each tract as rural or non-rural. The ERS data categorize tracts based on population density, urbanization, and daily commuting patterns. A tract is considered rural if it has a Census 2000 Rural/Urban Commuting Area code in the range 4-10. I use the terms “urban” and “non-rural” interchangeably herein, although the latter is the technically correct term.
5
competition, particularly of intermodal form, to be an important determinant of broadband diffusion
and usage (Denni & Gruber, 2006; Distaso, Lupi, & Manenti, 2006; Bouckaert, Van Dijk, & Verboven,
2010). The results of Wallsten and Mallahan (2010) suggest why: in the US, greater competition as
proxied by the number of providers in an area leads to higher quality (speed) and lower prices, even
after controlling for other factors.
Figure 1 reveals an additional, unexpected observation, introduced as Result 1 above. For this
most-inclusive (FCC) definition of broadband, not only is there no apparent urban/rural divide for access
of any sort—only 0.1% of rural or urban population lives in tracts with no providers—but there are a
greater number of fixed broadband providers in rural areas. Comparing the left and right panels of
Figure 1, one sees that there is a greater chance of living in a tract with four, five, six, or more than six
providers in rural areas than in urban areas, where the most common category is only one to three
providers. This unexpected reversal of the urban/rural Digital Divide may be an artifact of the larger
territories covered by rural Census tracts. The mean (median) urban tract covers 13 (1.2) square miles,
while in rural areas the comparable figure is 199 (54) square miles. There is no guarantee that the
service territories of all providers operating in the tract overlap. Nevertheless, this appears to be the
first evidence of any sort of rural advantage in broadband provision.
When the speed threshold for fixed broadband is higher, as in Figure 2, or we consider mobile
broadband (Figure 4), the situation reverses: rural residents have fewer providers available. Figure 4
shows that while mobile broadband coverage is ubiquitous in urban areas, 1.5% of rural residents live in
tracts with no mobile broadband provision. This is Result 2 from the introduction. While the gap in
availability of any mobile broadband is small, there is more difference in how many options are available
between rural and urban areas. For example, the figure shows that while only 10% of non-rural areas
have fewer than four mobile broadband providers, about three-quarters of rural tracts have fewer than
four. Figure 5 shows the time series for recent years of the distribution of the number of mobile
broadband providers. As with the fixed providers depicted in Figure 3, the percentage of people living in
tracts with no mobile broadband providers is minuscule in all periods and the distribution of the
provider counts changes little over these years, apart from a small drift toward a greater number of
providers.
6
Figure 6 presents another view of mobile broadband provision, showing a map of the number of
providers in the US by Census tract, with hatching to show rural areas.5 Darker areas on the map have a
greater number of mobile providers in the area. The map shows that, in accord with Figure 4, most
areas have one to three mobile broadband providers. There are a large number of mobile providers in
major metropolitan areas like Chicago and Houston. With some exceptions such as the California Central
Valley, rural areas have almost uniformly lower numbers of providers than urban areas. Given that
Figure 4 is population weighted and the map is not, the disparity in mobile broadband coverage
between rural and urban areas is even more visually striking in Figure 6.
Although rural areas lag non-rural areas in the availability of access to higher-speed and mobile
broadband, the third major result is that mobile broadband partially fills in geographical gaps in fixed-
line broadband coverage in the US. Table 1 presents statistics from the FCC broadband data showing
access to residential fixed and mobile broadband providers. The figures are population weighted, and
so reflect the probabilities of the access combinations available to an individual in the US.6 Of the
population underserved by fixed-line providers meeting the NBP threshold (advertised service of at least
3 mbps upstream and 768 kbps downstream), 96.8% live in tracts with at least one mobile broadband
provider and over a quarter have access to four or more mobile providers. The FCC data include mobile
broadband providers offering relatively slow broadband such as EVDO and HSPA, and there is no way to
distinguish between 3G and 4G service in the data, but the major wireless carriers in the US were
deploying 4G technology in their service areas at the time. If the analysis is repeated with the FCC
definition of broadband, then 96.6% of people living in the few tracts with no fixed broadband have
access to mobile broadband (see the bottom half of the in Table 1). The data thus indicate that mobile
providers can play a significant role in extending broadband service to areas underserved by fixed
broadband. This finding is complementary to other work finding that the number of mobile broadband
providers in an area is positively correlated with the quality (i.e., speed) of fixed broadband provided in
the same area, as would happen if mobile broadband competition spurred fixed broadband deployment
(Molnar & Savage, 2012).
The next research question is whether the digital divides in the number of providers, whichever
way they fall along the urban/rural distinction, are intrinsic to rural areas or are instead driven mainly by
5 This map is an update of that in Prieger and Church (2012).
6 This section relies on and updates the analysis in Prieger and Church (2012).
7
demographics. The answer can help inform policymakers whether it is better to subsidize areas based
on population density or demographic characteristics of residents in the area.7 Multiple regression
analysis shows that even after controlling for the demographics of local areas, the same patterns
observed in Figure 1, Figure 2, and Figure 4 persists. Table 2 presents the results of Poisson regressions
on the number of broadband providers of various types in the Census tract, using the 2010 year-end
data from the FCC. The regressors include a rural tract indicator, population density, the number of
households, median income in the tract, the racial and ethnic composition of the tract, and state-level
fixed effects to capture the influence of any regulatory, economic, or social factors related to broadband
that are common to the state.8 Previous waves of FCC Form 477 data have been examined via
regressions by numerous authors (Prieger, 2003; Grubesic & Murray, 2004; Xiao & Orazem, 2011;
Flamm, 2005; Prieger & Lee, 2008; Wallsten & Mallahan, 2010; Prieger & Church, 2012). Unlike some of
these investigations that are concerned with testing hypotheses about the causal impacts of various
policy variables, the regressions performed here is purely for descriptive purposes. These FCC data are
censored—provider counts in the range from one to three are grouped—and so the methodology of
Prieger and Church (2012) for maximum likelihood estimation for interval censored Poisson regression is
employed. The coefficients can be interpreted as usual for a Poisson model; that is, as if they were from
a log-linear regression.
The results in the first columns of Table 2, labeled Poisson Estimation 1, show that even after
controlling for area income, racial composition, and unobserved state-specific factors, rural areas and
areas with lower population density have more fixed broadband providers satisfying the original FCC
threshold of 200 kpbs at least one direction. The next two estimations in Table 2 show that this odd
result (which, recall, is in accord with the non-regression-adjusted findings in Figure 1) is driven by the
relatively slow service providers that offer broadband satisfying the FCC definition but not the NBP
definition. For convenient reference, refer to such “slow” service as FCC\NBP broadband (where the
notation is inspired by set theory). Thus, Result 1 persists in the regression analysis. Poisson Estimation
2 in Table 2 repeats the first estimation for providers of FCC\NBP service.9 Even controlling for
7 Current US broadband subsidies for unserved areas mingle the two criteria (USDA, 2011).
8 The tract-level demographic data are from GeoLytics 2010 Estimates. The rural indicator is from the ERS, as
described above. 9 The FCC does not report provider counts by tract for FCC\NBP broadband. The dependent variable for estimation
2 is the reported count of total residential providers under the FCC definition less the reported count of residential
8
demographics and population density, the rural coefficient of 0.038 indicates that the expected number
of FCC\NBP broadband providers in rural areas is about four percent higher than in urban areas. On the
other hand, Poisson Estimation 3 in the next columns shows that rural areas have nine percent fewer
NBP-definition broadband providers. While the differences between rural and other areas are not large
(in part because the coefficients for population density absorb some of the difference), they are highly
statistically significant.10
In Poisson Estimation 4 for the number of mobile broadband providers in the area, in the final
columns of Table 2, the coefficient for the rural indicator variable implies that rural areas have
approximately 42% fewer providers (other things equal). Thus, Result 2 also survives when controlling
for demographics. The coefficient of 0.07 for log population density is the elasticity, and is not as small
as it may appear. An elasticity of 0.07 implies that it would take about an eight-fold increase in
population density for the number of mobile broadband providers to increase from two to three, for
example. However, such an increase does not represent a huge movement across the range of density
in the data: it is less than the interquartile range, for example.11 The coefficient estimates for the rural
indicator and population density are all statistically significant. In sum, even after controlling for
population density and income, rural areas continue to be associated with a lower number of mobile
providers.
2.2. Broadband Usage
If broadband of a particular speed or type (e.g., mobile) is not available in rural areas, people
cannot use it. The latest broadband report from the NTIA reveals that while the general broadband
usage gap between rural and urban areas is shrinking, a differential in broadband adoption of over 10
percentage points continues to exist (NTIA, 2011). Lack of broadband availability appears to be a much
providers satisfying the NBP definition. Given that both counts are interval censored (counts one to three are grouped) and right censored (counts seven and higher are grouped), the difference of the two is censored in complicated ways. For example, if there are five total firms and one to three NBP firms in a tract, then the number of FCC\NBP providers is two to four. The censored Poisson regression methodology appropriately handles all such cases observation by observation (details and Stata 12.1 estimation code for MLE available upon request from the author). 10
If either the rural dummy variable or the population density variable is dropped from the estimations, the results are qualitatively similar. Whether measured by rural status, population density, or both, the same patterns first seen in Figure 1, Figure 2, and Figure 4 persist. 11
One need move only from the 31st
percentile of population density to the 69th
percentile to achieve an eight-fold increase in population density.
9
larger barrier to personal usage in rural areas than urban areas. The NTIA (2011) examined the top
reasons for a household not to adopt broadband. Unavailability is the top reason for non-usage for
almost one in 10 households in rural locations, whereas it is the top reason only 1% of the time in the
rest of America. However, it is important to note that “unavailability” as a reason for not subscribing to
broadband is self-reported and unverified in the NTIA survey, and indeed is suspect given the ubiquity of
satellite broadband.12 Even when broadband is available to rural communities, its quality—whether
measured by speed or other characteristics like mobility—often lags that found in the nearest urban
center. Comparison of Figure 1 to Figure 2 shows that while nearly every area has fixed broadband
satisfying the FCC definition, and nearly every urban area has fixed broadband satisfying the NBP
definition, 7.7% of rural areas lack fixed broadband meeting the NBP threshold.
Table 3 presents an analysis of the same data used by NTIA (2011), the Current Population
Survey (CPS) from the US Census Bureau, for October 2010.13 In the survey instrument, NTIA implicitly
defines broadband as Internet access services faster than dial-up, a definition that roughly matches the
FCC definition of speeds greater than 200 kbps. The advantages of the CPS data are the large sample
size, state of the art sampling scheme and weighting of observations by the Census Bureau, the wealth
of household and individual characteristics recorded, and the detailed information on the mode of
broadband usage. Survey weights are used to calculate the statistics presented here, so the figures in
the table are estimates for the US population of households. The survey designates households as in a
metropolitan area or not, the closest determination to rural status available.14 The first column of Table
3 shows that while 70.3% of households in metro areas use some form of broadband in the home, only
57.2% of households in non-metro areas use broadband.15 This is Result 4, the persistence of the
12
Given that satellite broadband is available to nearly every area in the US from multiple providers, it is perhaps best to interpret a given reason of “unavailable” in the survey as actually meaning “unavailable in the form or at the price this household desires.” 13
The data are from the publicly available file from the School Enrollment and Internet Use Supplement to Current Population Survey, October 2010, a survey of about 54,000 US households sponsored by NTIA and administered by the US Census Bureau. 14
A non-metropolitan area is defined differently than the rural areas used in the analysis of the FCC data (see footnote 4 for definition of the latter). A household is designated as non-metropolitan in the CPS data is it is not located in a Core Based Statistical Area (CBSA), a contiguous region based around an urban center. The two definitions are largely similar: with the two datasets I calculate that 19.5% of people live in rural tracts, while 15.6% of people and 16.1% of households are non-metropolitan. 15
While the metropolitan figure matches the estimate in NTIA (2011), the non-metro estimate is a few percentage points lower than NTIA’s (2011) estimate for “rural” households. The reason for the discrepancy (which this author learned through personal communication with the authors of the NTIA study) is that NTIA (2011) relies on
10
rural/urban usage gap for fixed broadband. The large sample size results in relatively precise estimates,
as shown by the narrow confidence intervals in the table.16 The Pearson F test for independence of the
rows and columns shows that the differences between these metro and non-metro usage rates are
statistically significant. Thus, non-metro households are only four-fifths as likely as metropolitan
households to use broadband.
The second column of Table 3 contains a similar break-down for mobile broadband. The
household usage rate of mobile broadband is 6.6% for metropolitan areas but only 5.8% in non-metro
areas, for a ratio of non-metro to metro usage of 88%.17 Thus the usage gap between rural and urban
users is much smaller, in both absolute and relative terms, for mobile broadband than it is for fixed
broadband. However, the rural/urban divide for mobile broadband is nonetheless statistically
significant at the 1% level, when not controlling for any demographics of the household.18 Once one
controls for household characteristics, however, the digital divide for mobile broadband usage
disappears, as will be shown below.
The FCC recently adopted a formal goal of ensuring broadband availability for low-income
subscribers, and has made available various subsidies for broadband.19 Given the concern in policy
circles about broadband usage among lower-income households, it is informative to repeat the
examination of which households use broadband for the subpopulation consisting of the lowest income
group of households, those with annual income of less than $20,000 (roughly the bottom income
quartile in the population). The third and fourth columns of Table 3 contain the results, which show that
the broadband usage digital divide between urban and non-metro dwellers is proportionally greater for
data tabulated by the Census Bureau, which had access to non-public information on the actual Census block (and its rural status) of the household. 16
The variance of all estimates presented here using the CPS data accounts for the survey design effects of
weighting and stratification, using the svy prefix commands in Stata 12.1. Although the CPS follows a stratified sampling scheme, the publicly available data do not include stratum identifiers. Instead, I created synthetic strata following the method of Davern, Jones, Lepkowski, Davidson, and Blewett (2007) (see Appendix A of Prieger and Faltis (2012) for exact details), which they show to closely match results using the true strata. 17
While it is perhaps most natural to treat mobile broadband usage as a personal rather than a household choice, the CPS data contain information on mobile broadband usage only at the household level. 18
Whether statistical significance is assessed by the Pearson F test (reported in Table 3) or by a Wald test for equality of the estimates, the resulting p-value is lower than 0.01. 19
Under the Lifeline program for low-income households, bundles of services that include voice communication and broadband are eligible for discounts. The FCC has also established a Broadband Pilot Program to fund pricing experiments by broadband providers to test the sensitivity of household broadband adoption to discounts of various levels and rate structures (see FCC (2012a) and references therein).
11
low-income households. Among the low-income subpopulation, the broadband usage rate is 42.6% in
metro areas but only 32.0% in non-metro areas, while the mobile broadband usage rates are 4.3% and
3.3%, respectively. The finding that low-income households are less likely to use broadband is not
new—that has been shown to be true in most studies of usage in the US and abroad (e.g., Kridel,
Rappoport, & Taylor, 2001; Rappoport, Kridel, Taylor, Alleman, & Duffy-Deno, 2003; Chaudhuri, Flamm,
& Horrigan, 2005; Prieger & Hu, 2008). Of greater interest is that the rural/urban divide is
proportionally more severe among low-income households. For both fixed and mobile broadband, non-
metro low-income households are only about 75% as likely as metropolitan low-income households to
use broadband. These ratios are lower than the comparable figures for the entire population (81.4% for
any broadband and 87.9% for mobile broadband, as reported in the first two columns of Table 3).20
There are two possible reasons for why the urban/rural divide is greater among low income
households. First, since lower-income households are those most sensitive to the price of broadband, it
may be that prices are greater in rural areas than in urban areas. Although there are no official statistics
on broadband prices in the US, there is evidence from other sources that rural users pay more on
average for broadband than urban users (Pociask, 2005).21 Second, it may be that the rural poor are
more likely to live in areas without broadband coverage (or with lower quality or fewer options) than
their urban counterparts. This appears to be the case: if the four Poisson estimations in Table 2 are
repeated with the inclusion of an interaction term between population density and income (results not
shown), the coefficient on the interaction term is negative and statistically significant in each regression.
Thus, where population density is high, as in urban areas, the income of the area has less impact on the
number of broadband providers than in sparsely settled rural areas. To put it another way, low-income,
low-density areas have the fewest predicted number of broadband providers, other things equal.22
While the results in Table 3 indicate that the urban/rural divide remains for fixed and mobile
broadband usage, the question remains as to whether the divide is inherent to rural location per se, or
20
The ratio of non-metro to metro usage of any type of broadband in the entire population is statistically different than the same ratio for the low-income population, with a p-value of less than 0.0001. For mobile broadband, the difference in the ratios has a p-value of 0.145. 21
Pociask (2005) found that rural small businesses paid 9.9% more for non-T1 broadband service than urban small businesses. 22
One of the other factors held constant in this statement is the rural indicator for the area. The inclusion of the interaction term for density and income does not reverse the positive sign of the coefficient estimate for rural location in Poisson Estimations 1 and 2.
12
rather is actually driven by differences in the sociodemographic characteristics of urban and rural
dwellers. We explore this further now with multiple regressions for usage. It is important to note that
because the data contain no specific information on prices or quality, these characteristics of broadband
are not included in the following usage regressions, notwithstanding that they have been found in other
studies to be significant predictors of demand for broadband (e.g., Savage & Waldman, 2005; Prieger &
Hu, 2008; Rosston, Savage, & Waldman, 2010). Thus, the rural indicator variable included in the
regressions captures systematic differences in broadband price and quality between rural and other
areas. If we find that rural location predicts household broadband usage even after controlling for
characteristics such as income, education levels, and race, then rural-specific factors such as price,
availability, or differing perceived value of broadband in rural areas would appear to be important. If
rural location is not a significant determinant of broadband usage when controlling for other factors,
then policy aimed at closing an urban/rural digital divide should target households with characteristics
associated with non-adoption (low-income, less education, and some minority groups, as we will see)
regardless of where they live.
Evidence on usage can be explored in both the FCC and CPS data. The FCC broadband
subscription data allow an examination of the digital divide in fixed broadband usage between rural and
urban areas. The results of an ordered logit regression of the December 2010 subscription rate
categories for residential fixed broadband are reported in Table 4. The FCC reports residential fixed
broadband subscription at the Census tract level in six categories: no subscription, a subscription rate
between zero and 20%, a rate between 20% and 40%, a rate between 40% and 60%, a rate between
60% and 80%, and a rate greater than 80%. The FCC does not report similar statistics for mobile
broadband usage. In the first estimations, broadband is defined to be 200 kbps in at least one direction.
The results using the same regressors as for the Poisson regression are in the columns labeled Ordered
Logit Estimation 1 in Table 4. The estimated odds ratios23 are all significant, and show that subscription
lags in rural areas and is higher in more densely populated areas, even after controlling for income, race,
and ethnicity. Thus, Result 4 holds in both the raw and regression-adjusted data. The odds ratio for the
rural indicator, 0.693, implies that the odds of having a subscription rate higher than 40% (for example)
23
Group the categories into higher and lower sets. The odds ratio for a regressor x shows the impact (in multiplicative terms) of a one unit increase in x on the odds of being in the higher set of categories instead of the lower set. In an ordered logit regression, the odds ratio is the same regardless of where the dividing line between the sets is.
13
in a rural area are only 69.3% as large as the odds in a non-rural area.24 Similarly, the odds ratio of 18.7
for log income implies that the income elasticity of the odds of having a subscription rate higher than
40% (for example) is 17.7 (and statistically significant). Usage of fixed broadband is thus still highly
sensitive to income.
In the next set of columns in Table 4 (labeled Ordered Logit Estimation 2), the ordered logit
estimation on the subscription rate is repeated with the addition of an indicator variable for having
more than three fixed broadband providers in the tract. This variable serves as a rough proxy for both
price competition and a more attractive set of service offerings. The odds ratio on the provider
indicator is significant and greater than one, as expected. More importantly for present purposes, it
does not significantly change the estimates of the rural or population density odds ratios. Thus even
after controlling for income and (in an admittedly rough way) the price and the variety of broadband
options, there is still significant evidence of a rural digital divide in fixed broadband adoption. Ordered
Logit Estimation 3 in the final columns of Table 4 shows that even when a stricter definition of
broadband is used (at least 768 kbps downstream and greater than 200 kbps upstream, the NBP
definition) for the subscription rates, the results are very similar.
Turning from the tract level analysis of the FCC data to household level analysis with the CPS
data, Table 5 contains the results of weighted logit regressions for the household’s binary decision to
use fixed and mobile broadband. Demographic and economic variables for income, household size,
education, race, and ethnicity (all available in the CPS data itself) are included to control for factors
correlated with the non-metro status of the household. In Logit Estimation 1, for fixed broadband, the
odds ratio for non-metropolitan location is 0.72 and significant. Thus, even after controlling for other
demographic factors, the odds of using fixed broadband in non-metro areas are 28% lower than in urban
areas. This odds ratio confirms that found in Ordered Logit Estimation 1 (see Table 4), the estimation
using the FCC data with the most comparable broadband definition, even though its interpretation
differs (refer to footnote 23). This is further confirmation that Result 4 holds even when controlling for
demographics. The odds ratios for the other explanatory factors are in line with results from previous
studies of demand for broadband (e.g., Savage & Waldman, 2005; Prieger & Hu, 2008; NTIA 2011):
larger income and household size, greater educational attainment, and Asian race are associated with a
24
Similarly, the odds of having a subscription rate higher than 20% in a rural tract area is only 69% of the same odds in a non-rural tract, and so on.
14
greater propensity to use broadband in the home, while blacks, Native Americans, and Hispanics have a
lower propensity. Given the evidence from Table 3 that the effect of rural status on broadband usage
may depend on income, I repeated the regression specification with an added interaction term between
non-metro location and the low income category. Since the interaction term’s coefficient is insignificant
and its inclusion barely changes the odds ratio for the main non-metro indicator, results are not shown
in the table.
Turn now to mobile broadband usage. Logit Estimation 2 shows that after controlling for the
impacts of income, education, and race, non-metro location is not significantly associated with mobile
broadband usage. In fact, Logit Estimation 3 in the next columns shows that controlling for household
income alone is enough to remove the statistical significance of non-metro location. Using the results of
Logit Estimation 2, the regression-adjusted predicted usage rate is 6.6% for metropolitan households
(identical to that found in Table 3) and 6.1% for non-metro households. The latter rate is higher than
the raw non-metro usage rate from Table 3, because demographic factors that are negative predictors
of mobile broadband usage (such as low income and low educational attainment) are more commonly
found in rural areas. The difference between the two regression-adjusted usage rates is small and
statistically insignificant, which is Result 6.25 This finding is especially interesting given the lower
availability and number of providers of mobile broadband in rural areas found above.26
Finally, return to the question of whether mobile broadband is filling in gaps in fixed broadband
availability, but now look at usage. Researchers are just beginning to explore fixed and mobile
substitution for broadband; a recent review article found virtually no published empirical work on the
subject (Vogelsang, 2010; but see Lee, Marcu, & Lee, 2011). Without data on prices, it is not possible to
estimate a demand system to determine whether fixed and mobile broadband are substitutes or
complements. However, Table 6 shows contingency tables for fixed and mobile broadband usage from
the CPS data, split by metropolitan status. In metro areas, 68% of households subscribe to fixed or
mobile broadband, while only 2.5% subscribe to both. In non-metro areas, 56% of households subscribe
to fixed or mobile broadband but not both, while only 1.4% subscribe to both. It would appear that, at
least as of late 2010, fixed and mobile broadband are complementary goods for relatively few
25
The p-value for equality of the two predicted usage rates is 0.174, by a Wald test. 26
Adding a income×non-metro interaction term to the specification (results not shown) does not materially change the conclusions, and the coefficient for the added term is insignificant.
15
households. There is more evidence mobile broadband is used in place of fixed broadband, particularly
in rural areas. While only 62% of metropolitan mobile broadband users do not have fixed broadband in
the home, in rural areas 75% of metropolitan broadband users do not use fixed broadband at home.
3. Broadband as an Engine of Rural Economic Development
How much does broadband matter to local and national economies? If the benefits of fixed and
mobile broadband were primarily personal in nature, mainly allowing users to consume online
entertainment, then the diffusion of broadband would perhaps be of no more policy concern than the
spread of other entertainment technology such as DVD players or movie rental businesses. Unlike these
other technologies, however, broadband is a general purpose technology (GPT) whose impact on the
economy extends far beyond the walls of the household. Bresnahan and Trajtenberg (1995)
characterize a GPT by its pervasiveness, potential for technical improvements, usefulness to businesses,
and potential to increase the productivity of R&D in downstream sectors. A GPT like broadband thus
spreads throughout all aspects of the economy and creates productivity gains in many industries. In this
section, I shift the focus from residential broadband to more general uses and their impact on the
economy.
A rapidly growing literature suggests there are many potential and demonstrated ways in which
broadband deployment benefits economic development. The research to date includes case studies,
qualitative analyses, and systematic empirical work. This section reviews a sampling of what we now
know about the linkages between broadband and economic development. Given that wide availability
of high-speed mobile broadband in the US is just beginning, the review of the literature begins with a
general discussion of the economic benefits from any form of broadband. Next, what studies have
uncovered regarding the specific contribution that broadband makes to rural economies is discussed.
The section concludes with lessons concerning mobile broadband in particular and its potential as an
engine of rural development.
3.1. The Impact of Broadband on the Economy
Over the past decade, enough experience with widespread adoption of broadband has been
gained to begin to allow systematic empirical exploration of the linkages between broadband and
16
economic development. Given the nascence of the mobile broadband era, the review of the literature
begins with a general discussion of the economic benefits from any form of broadband, mobile or fixed.
As a GPT, mobile broadband (as with fixed broadband) has tremendous potential to transform
economic activity. In the case of Internet and broadband GPT, the technology directly raises
productivity in ICT-intensive industries (Varian, Litan, Elder, & Shutter, 2002). The beneficial effects of
improved productivity and lower costs in industries that are heavy users of ICT ripple outward to other
sectors of the economy that use these firms’ outputs as inputs. Prieger and Heil (2010a,b) review the
mechanisms by which the diffusion of ICT leads to general microeconomic and macroeconomic growth.
Below, some of the specific personal economic benefits of broadband for local areas are also discussed,
including making telemedicine possible and enhancing distance-learning opportunities. There are many
more potential benefits of broadband for rural areas than have ever been quantified, such as expanding
the access of rural businesses to supplier networks and increasing the attractiveness of rural tourism,
just to mention two.
The economic literature on technology and economic growth characterizes the linkages
between broadband and productivity according to whether the technology’s benefits for the firm are
directly related to the firm’s decisions of which inputs and production processes to use. In this view, the
direct impact of an ICT such as broadband follows from a firm’s decision to adopt the technology to
lower its production costs and to enhance the productivity of its labor by providing its workers with
better “tools.” In addition, broadband’s role as a GPT leads to indirect productivity enhancements for
firms, through what Mayo and Wallsten (2011) term growth externalities. Mayo and Wallsten (2011)
posit two ways in which broadband can lead to growth externalities. Both are framed in the context of
the endogenous growth model that has dominated the academic field of macroeconomic growth for
more than two decades.27 First, as broadband technology improves and its diffusion increases, society’s
stock of “knowledge” (here used as a catchall term for the disembodied product of research and
development technology, i.e., information that increases the production possibilities of firms apart from
any physical inputs used) increases, which in itself raises each firm’s productivity “from the outside.”
Thus, a firm becomes more productive when general knowledge increases apart from any decision of its
own to adopt a particular technology. An example of this mechanism is how a firm designing new
27
See pp. 178-179 in Mayo and Wallsten (2011) for the mathematical models of endogenous growth underlying the following discussion.
17
products can take advantage of the diffusion of broadband in society. Such a firm can design certain
aspects of products and software assuming that consumers will have broadband connections to update
firmware, register products, or download additional functionality. A second way broadband leads to
growth externalities is that it lowers transaction costs for firms to acquire and use knowledge. Rather
than being part of the knowledge itself, as in the first mechanism, under this view broadband is valuable
as a facilitator of knowledge acquisition and deployment. For example, in a broadband world,
knowledge useful to a particular industry can be disseminated quickly to interested parties, and
broadband can aid the acquisition of new products and services complementary to the new knowledge.
What might the overall impact on the US economy be from broadband? Estimates vary
according to how widely one defines “broadband” and the statistical methodology used, but the impacts
appear to be large. Greenstein and McDevitt (2009) tackle the task of finding broadband’s net
contribution to US GDP. Using the same methodology as for official calculation of the national income
and product accounts, they conclude that the direct, net impact of broadband’s deployment was
approximately $8.3 to $10.6 billion of new GDP in 2006. They also find an additional $4.8-6.7 billion in
new consumer surplus created by broadband (net of what would have accrued with dial-up service),
which does not show up in GDP.28
Greenstein and McDevitt’s figures are notably smaller than most other estimates of
broadband’s impact on the US economy, for at least two reasons. They focus only on direct benefits of
broadband and carefully net out the benefits from the replaced technology, dial-up Internet access.
Most other studies, often not published in peer reviewed journals, come to estimates of broadband
benefits that are much higher, often by an order of magnitude (e.g., Crandall & Jackson, 2003; Entner,
2008; Deighton & Quelch, 2009; Dutz, Orszag, & Willig, 2009).29 Before continuing on to results from
other individual studies, it should be noted that while a growing body of research finds a positive
association between broadband availability and economic growth, pinning down the exact magnitude of
the causal relationships is difficult. The task is conceptually difficult, because while broadband may
promote development, economic growth stimulates further deployment and usage of broadband in
turn. Thus, real-world data differ markedly from data generated from a controlled experiment, and
28
Other estimates of net or gross consumer surplus from broadband include work by Goolsbee and Klenow (2006) and Rosston et al. (2010). 29
See also the four other non-peer reviewed studies cited in Table 1 of Rohman and Bohlin (2012), claiming to find broadband investment multipliers of 1.45 to 3.6.
18
disentangling the simultaneous causality in the former is hard. Further difficulty stems from the lack of
sufficiently granular data on broadband deployment and usage over periods long enough to enable such
studies. With improved data being released by the FCC and the National Broadband Map, this may
change in coming years. Looking back, however, Holt and Jamison (2009) conclude their review of the
empirical literature with the caution that although broadband’s positive economic impact in the US
appears to be clear, the impact cannot be analyzed with precision. In an even more recent review,
Mayo and Wallsten (2011) characterize the theoretical and empirical research addressing how
broadband enhances economic performance as “nascent and as yet emerging” (p.175). In part, this is
because the impact of broadband changes rapidly over time as technologies, industries, and business’
adaptation to ICT evolve. Whatever the exact question should be and its precise answer, the scope of
the importance of broadband to the modern economy is clearly large.
3.2. Broadband and Economic Development
This section discusses evidence from three major studies that empirically analyze the link
between broadband deployment or usage and economic growth in the US and abroad. The growing
literature indicates that the potential for broadband to stimulate economic development is real,
although perhaps hard to quantify.30
In the US, several studies have shown that output and employment are correlated with the
deployment of broadband infrastructure. In one of the first, Crandall, Lehr, and Litan (2007) examine
private employment growth in the 48 contiguous states during 2003-2005, and find that it is positively
associated with broadband penetration (measured as broadband subscriber lines per capita in a state).
Their regression methodology does not control for the simultaneity of broadband penetration and
economic growth, or for other potentially contaminating effects of unobserved factors within a state.
Nonetheless, the study documents that the association between broadband and employment growth
persists after controlling for related factors such as the wage level, unionization rates, education of the
work force, and the tax climate.31 The particular methodology of Crandall et al. does not allow the
authors to claim that they have precisely identified the causal role of broadband in stimulating growth.
Furthermore, Mayo and Wallsten (2011) show that Crandall et al.’s results may be particular to the
30
For other research on the same topic, refer to the literature review in ITU (2012). 31
Crandall et al. (2007) also find that the correlation between broadband penetration and state GDP is positive, although the result lacks statistical significance.
19
relatively short period they study. However, other studies have found a more robust set of results with
econometric methods that allow researchers greater claim to having uncovered causal relationships
between broadband and economic development. We review a few of these studies in the rest of this
section.
Gillett, Lehr, Osorio, and Sirbu (2006) perform one of the first careful econometric studies on
broadband availability and local economic development in the US using sub-state geographic data. The
authors state that “[t]he results support the view that broadband access does enhance economic
growth and performance, and that the assumed economic impacts of broadband are real and
measurable” (p. 3). The study classified each ZIP code area in the nation based on its broadband
availability in 1999, using the FCC Form 477 data on broadband providers, and then followed the growth
in employment and other economic indicators over time. The statistical methodology included
matching ZIP code areas with broadband to those without to create “treatment” and “control” groups,
regression analysis, and other econometric techniques designed to distinguish causality from mere
correlation.
The major findings are that broadband added 1.0-1.4% to the growth rate of local employment
and 0.5-1.2% to the growth rate of the number of business establishments over the years 1998-2002.
Housing rents, as a proxy for property values, were more than 6% higher in 2000 in areas where
broadband was available by 1999. Broadband availability also appeared to add 0.3-0.6% to the share of
businesses in sectors that are intensive users of ICT. As has generally proved to be the case with such
studies, Gillett et al. did not find a statistically significant impact of broadband on wages. The authors
conclude that “broadband is clearly related to economic well-being and is thus a critical component of
our national communications infrastructure” (p. 3).
In another nationwide study, Kolko (2010) finds that broadband expansion is correlated with
economic growth over the period 1999-2006. This relationship, naturally enough, is strongest in
industries that rely heavily on ICT: information; professional, scientific, and technical services;
management; and administrative services. The design of the study benefits from looking at outcomes at
the subcounty (ZIP code) level and from taking seriously the question of reverse causality. Regarding
the latter, the author finds that broadband providers do not merely target areas where they expect
higher economic growth, because later employment growth does not predict earlier broadband growth.
20
In another attempt to move from correlation to causality, Kolko (2010) estimates an instrumental
variables regression that explicitly accounts for the potential simultaneity of broadband and
employment growth.32 The results, while apparently sensitive to the exact specification of the statistical
model, strengthen the claim that the association between broadband and employment growth is at
least partly causal.
Some of the particular findings of Kolko (2010) include that broadband is associated with
population and employment growth. Compared to areas that had no broadband providers, areas with
one to three providers had 6.4% higher employment growth and 2.4% more population growth.
Although the figures cited indicate that employment grew more than population, the research
uncovered no significant effect of broadband on the employment rate. The author suggests that may be
because people follow the jobs—not a bad outcome in itself for areas seeking to grow.
There are also several explorations of the linkage between broadband penetration and
economic growth at the national level using international data. The research in recent years comes to a
consensus that a 10 percentage point increase in broadband’s household penetration boosts a country’s
GDP in the range of 0.1 percent to 1.4 percent.
In a typical cross-country study, LECG (2009) adopts a macroeconomic growth model to look at
the experience of 15 developed Western countries over the period 1980-2007. The report finds that the
countries with high levels of general ICT diffusion enjoyed significant productivity gains from broadband.
In particular, in such countries an increase of 10 percentage points in broadband penetration increases
productivity by about 1.3%.33 Countries that have low general ICT diffusion see no productivity increase
from broadband. The report suggests that the countries without broad ICT diffusion—mostly the
southern European countries in the study’s sample—may have high costs of adopting new technology or
barriers to “re-skilling” their workforce to take advantage of ICT to improve labor productivity. These
32
As Kolko (2010) explains: “The instrumental variable strategy identifies a factor – in this case, slope of terrain – that affects broadband expansion without independently affecting employment growth, holding other factors constant. The relationship between employment growth and the variation in broadband expansion that is predicted by slope identifies the causal portion of the effect of broadband on growth, at least for the areas in which slope is a good predictor of broadband expansion.” Instrumental variables estimation is a standard tool of econometrics and has been applied fruitfully in many economic inquiries. Van Gaasbeck (2008) also employed the technique of instrumental variables to conclude that broadband usage leads to employment growth in her study of California counties. 33
The report estimates several specifications of the model, including versions designed to minimize bias caused by unobserved, country-specific factors and the simultaneity of broadband and general economic expansion.
21
factors are less likely to be an issue in the US, even in rural areas, although ensuring that labor is
properly trained to use modern ICT should be a goal in any country. We discuss broadband’s potential
to encourage human capital formation through distance learning in a subsequent section.
Other international studies use broader samples of countries, but come to similar conclusions.
Qiang and Rossotto (2009) use a macroeconomic growth modeling framework similar to that of LECG
(2009), but look at a large panel of 120 countries for the period 1980-2006. They find that broadband
penetration—measured by broadband subscribers per 100 people—has a statistically significant
association with the growth rate of real GDP in a country. The “broadband dividend” for a high-income
country of an extra 10 percentage points of broadband penetration during the period is an extra 1.2
percentage points of per capita GDP growth. The magnitude is about the same (but less statistically
precise) for low-income countries. Although their study did not fully control for the simultaneous
causality between broadband usage and economic growth and omitted factors potentially causing both,
other studies that do employ these controls come to similar results. In one, Czernich, Falck, Kretschmer,
and Woessmann (2011) estimate a sophisticated econometric model in the spirit of Qiang and Rossotto
(2009), using data for 25 OECD (developed) countries during 1996–2007. The authors conclude that a
10 percentage point increase in broadband penetration raised annual per capita growth by 0.9–1.5
percentage points, in accord with the earlier study, although the methodology was quite different.
Studies linking development to mobile broadband are still few in number, and are often
consulting reports with a “back of the envelope” flavor rather than carefully documented, academically
rigorous econometric studies. A recent report by Deloitte (2011) gives a sense of the magnitudes
involved. The estimated $25-53 billion investment in 4G mobile wireless technology in the US is
projected, using standard GDP multipliers for the industry, to create $73-151 billion in GDP growth and
between 371,000 and 771,000 new jobs.
3.3. Broadband and Rural Development
Dickes, Lamie, and Whitacre (2010) notes that there is now a body of “substantial research” on
the economic and social benefits that rural areas can enjoy from access to broadband service. Of
course, the general economic benefits discussed above also apply to rural areas, such as cost savings
and improved efficiency for business. Today, e-commerce virtually requires broadband. While the
advantages for companies of adopting e-commerce have been well studied (Prieger & Heil, 2010b,
22
2012), the benefits need not accrue only to firms in urban areas. Barkley, Markley, and Lamie (2007)
performed a series of over two dozen qualitative case studies on rural businesses that adopted e-
commerce. While the authors note that their findings are not necessarily statistically representative of
all rural businesses, e-business was successfully adopted by most of the firms in the studies. In fact, one
of the potential dangers Barkley et al. note for small firms moving into the world of e-commerce is lack
of preparation for the rapid sales growth that can occur. Uses of e-commerce included developing new
products, lowering marketing costs, increasing sales and reaching new markets, and improving the
efficiency of managing inventory and distributing products and services. While many of these functions
can be accomplished with both wired and wireless broadband networks, some tasks such as updating
inventory and delivery records at the point of delivery are uniquely suited to mobile broadband.
A few examples of benefits of broadband that are of particular interest for rural communities
are increased community involvement, greater opportunities for income expansion through telework,
and increased human capital through distance learning and telemedicine (Stenberg et al., 2009). The
Internet can foster community interaction by lowering the effective cost of civic engagement and
community participation. It is much easier for a rural resident to inform himself about local land-use
planning issues, for example, by accessing information online than it would be to go to a municipal
records center in town. In this example, downloading all of the necessary documents and maps with
anything slower than a broadband Internet connection would be painfully slow. Stenberg et al. (2009)
cite several empirical sociological studies that find the Internet use bolsters civic engagement.
Importantly, some of the research indicates that the quality of the Internet experience—using
broadband technology, for example—is important for a community’s participation by residents and its
general civic health. While the mechanism of causality may not be clear, the data show that using
broadband is positively correlated with higher levels of community involvement (Stern, Adams, & Boase,
2011). One avenue by which improved ICT leads to greater civic engagement is ICT’s contribution to
social capital. That is, as Stern and Adams (2010) claim, better communication technologies “lead to
increased contacts and the broadening of one’s social network as well as [to] a new avenue to find
information about participating at the local level” (p. 1390). The authors suggest that such social capital
formation is most important in rural communities, where residents must rely more on local relationships
with others to achieve personal and community goals.
23
Stenberg et al. (2009) discuss the survey work of Morris and Goodridge (2008) to draw together
three related facts indicating that broadband may have an interesting role to play in rural telework.
First, as is well known, many US businesses engage in global outsourcing for service support. Second,
despite the cost advantages to businesses of outsourcing, 57% of customers in one survey were
dissatisfied with services outsourced to foreign countries. Third, almost two-fifths of rural residents are
interested in working from home and would be open to telework opportunities. The percentage was
even higher for retirees, many of whom have decades of experience as knowledgeable and responsible
employees. Stenberg et al. bring these facts into conjunction with the finding that about three-fourths
of outsourcing businesses are interested in bringing some outsourced positions back to the US if rural
employees could fill the roles. For many such positions to work out, however, quality broadband
connections would presumably be a necessity.
Telemedicine is an application that is often mentioned as a beneficial service enabled by
broadband in rural areas. While the appeal of telemedicine is clear—it gives rural communities access
to some of the same health care infrastructure that urban areas enjoy, albeit “virtually”—its benefits are
hard to quantify broadly. In one of the few empirical studies on the potential economic benefits of
telemedicine, Whitacre, Hartman, Boggs, and Schott (2009) found that five rural communities in
Oklahoma that participated in telemedicine saved a total of $3.5M in healthcare cost for teleradiology
and telepsychiatry alone. The authors note that the economic benefits of telemedicine in rural areas
can include “transportation savings and improved productivity for residents, increased lab and
pharmacy work performed locally, and potential cost savings to the hospital from outsourcing
telemedicine procedures” (p.194). Note further that to the extent that rural wages in the healthcare
sector are lower than their urban counterparts, any medical service like lab work that e-medicine allows
to be performed in rural areas instead of in urban areas produces an economic savings for society.
Some studies on specific aspects of telemedicine show its great promise. Seto (2008) conducted
a comprehensive review of studies calculating economic analyses of heart failure telemonitoring
systems in the field. Seto found that all the studies concluded that e-monitoring was less expensive
than usual care in a hospital, with a range of 2-68% cost savings, even before accounting for additional
factors such as travel costs and a lower incidence of rehospitalization.
24
When considering the possible benefits of mobile telemedicine, it is important to note that
advanced mobile technology may be particularly suited to such applications. For example, the low
latency in LTE networks mean that there is far less delay from data transmission to receipt, compared to
previous generation wireless technology.34 The low latency and high throughput of LTE enable creation
of efficient mobile telemedicine applications and complementary services such as VOIP and video
conferencing.
What might be the overall impact on rural economies from all these factors? In one of the most
careful studies of broadband’s effect on the rural economy, Stenberg et al. (2009) used a quasi-
experimental design approach to examine the impact of broadband on rural employment and income.
Each of 228 rural counties that had high broadband availability in 2000 was paired with a similar
“control” county that had low broadband availability. The matched counties were as similar as possible
in terms of local economic structure, population density, income, and other factors. Use of a treatment
and control group allows the researchers to focus on differences in employment and income growth
when broadband is widely available. Over the years 2002-2006, the “treatment group” of early-
adopting counties experienced more job growth, particularly in the nonfarm sector. Broadband-
available counties also had more population growth in all years and higher personal income and
nonfarm earnings growth in some of the years. The positive association between broadband and
personal income, which is significant in 2002, stands in contrast to the finding of no association by Kolko
(2010). The difference may be due either to a stronger impact of broadband availability on personal
economic welfare in rural areas or the improved study design the quasi-experimental design offers.
While not all of the differences Stenberg et al. found are statistically significant, the counties with low
broadband availability in 2000 never significantly outperformed the treatment group in any year of the
study.
3.4. Mobile Broadband and Rural Development
Virtually no econometric studies attempt to quantify the particular impact of mobile broadband
on rural development.35 However, some lessons can be drawn from the closely related literature on
34
See AT&T, Declaration of John Donovan, filed with the FCC on April 21, 2011, available at http://fjallfoss.fcc.gov/ecfs/document/view?id=7021240423. 35
Some industry-funded studies published outside of peer-reviewed journals, not reviewed here, find large economic impacts of mobile broadband deployment on rural economies (e.g., Katz, Avila, and Meille, 2011).
25
mobile telecommunications of any sort on macroeconomic development and growth. Given the
different services enabled by mobile broadband and general mobile telecommunications, however, the
lessons may not apply directly to the deployment of mobile broadband infrastructure. Nevertheless,
there are some similarities between the two areas of technology. As with general broadband
technology, the mobile telecommunications and broadband industry contributes to national economic
performance through direct and indirect channels. Mobile technology boosts growth directly, through
deployment of infrastructure and other direct economic activity. Mobile technology also induces
growth indirectly through the positive externalities provided by mobile telecommunications as a general
purpose technology. As the economy grows, demand for mobile services increases, creating a virtuous
cycle of increasing penetration and economic growth. The cycle implies that the simple correlation of
GDP with mobile telecommunications usage reflects two-way causality. Gruber and Koutroumpis (2011)
perform one of the most ambitious cross-country studies looking at how mobile telecommunications
infrastructure and usage affects growth and productivity. The authors isolate the one-way impact of
mobile infrastructure and its externalities on GDP by controlling for increased demand for mobile
services due to higher economic output. With a structural econometric model that accounts for reverse
causality and the several relationships among GDP, mobile infrastructure, and supply and demand in the
mobile industry, the authors find a sizable positive impact of mobile infrastructure on GDP across 192
countries and two recent decades.
Arguing that network effects in the mobile telecommunications market lead to increasing
returns in economic output, Gruber and Koutroumpis (2011) break down their findings by low, medium,
and high mobile penetration countries. In accord with the notion of increasing returns, the authors find
that while the impact of mobile infrastructure on GDP is significant for all groups, it rises with the level
of penetration. This implies that areas with little mobile infrastructure suffer from compounding
disadvantages: not only do low-penetration areas miss out on its direct economic benefits because they
have low levels of infrastructure, the little infrastructure they have does not cause as much growth per
unit as more highly mobilized countries. The advantages of increasing mobile penetration are further
compounded, because with increasing returns, high penetration increases the incentives for further
investment and even more GDP growth. The magnitude of mobile infrastructure’s contribution to GDP
is both statistically significant and sizable. The authors calculate that mobile telecommunications in
26
high-income OECD countries contributed 0.4% to their GDP growth, while in low income countries as a
group the contribution was about half that. Caution is warranted here in assuming their results also
apply to mobile broadband, since the nature of the positive externalities due to network effects in
mobile broadband (if they exist, which has not been demonstrated in the literature) may be quite
different than for mobile telecommunications in general.
To the extent that rural areas in the US lag urban areas in the development of ICT infrastructure,
some of the lessons from the literature examining the role that mobile broadband can play in the
economic growth of developing nations are relevant. Thompson and Garbacz (2011) estimate the
impact of fixed and mobile broadband diffusion on national GDP and the gap between potential and
actual GDP (inefficiency). They find that mobile—but not fixed—broadband usage has a positive effect
on GDP per household, with the highest impact in less developed countries. Mobile broadband usage
also reduces national inefficiency, and again the impacts are largest in low-income countries. Thus, in
contrast to Gruber and Koutroumpis’ (2011) findings that the largest impact of mobile
telecommunications infrastructure are on high-income countries, which they attribute to network
effects, the opposite appears to be true for mobile broadband.
The McKinsey report discussed in Buttkerelt et al. (2009) estimates the potential economic
impact of bringing the developing economies across the world up to the level of broadband deployment
and usage of Western Europe. The report projects that world GDP would rise by USD 300-420 billion.
The exercise is similar in spirit, if not in numerical detail, to considering the impact of bringing rural
areas up to the broadband level of urban areas. The impacts on GDP occur through the channels
discussed at the beginning of this section. There are measurable contributions to GDP from direct
investment in ICT industries, which are further multiplied as related businesses create new value from
equipment, content, and applications enabled by mobile broadband. The report mentions as an
example that the ubiquity of mobile broadband in Japan has led to forecasts that applications like
mobile music downloads, games, and online video will grow at 6–9% per year in the near future.
Deployment of mobile broadband also improves GDP through the indirect channels of increasing firms’
productivity and efficiency, attracting investment from outside the area, and improving local human
capital through improved healthcare, civic engagement, and education.
27
It is straightforward to apply all of these notions directly to rural areas in the US, although since
the economic gap between rural and urban areas in the US is not as great as the development gaps that
exist between lesser developed countries and the West, the scale of the impacts may be lower.
However, the rural incremental benefits may still be substantial.
4. Summary and Conclusions
The major results from the empirical study of the FCC and CPS broadband data are summarized
here:
Result 1: For faster forms of fixed broadband, availability and the number of providers in rural
areas is lower than in urban areas broadband, but rural availability appears to be
greater than urban availability for lower-speed fixed broadband.
Result 2: For mobile broadband, rural availability is lower than in urban areas. While few rural
tracts lack any mobile broadband provision, rural areas have significantly fewer
providers.
Result 3: Mobile broadband coverage appears to fill many of the gaps in fixed broadband
coverage in rural areas.
Result 4: For fixed broadband, there is still a sizeable gap in usage rates between urban and
rural areas.
Result 5: For fixed and mobile broadband, the raw usage gaps between rural and urban
households are proportionally greater for low-income households.
Result 6: For mobile broadband, the regression-adjusted difference in usage between rural and
urban households has disappeared, notwithstanding the lower availability in rural areas.
The second part of Result 1 is novel, and is obscured in the latest FCC report on the status of
broadband in the US (FCC 2012a, Table 2). In the report, the FCC “defined up” broadband to a standard
of 4 mbps download/1 mbps upload, and when discussing the rural/urban availability divide does not
show figures for slower broadband.36 While higher speed broadband may be necessary to stream HD
36
While the FCC defines its speed threshold in the report as stated, the figures in presents actually use a threshold equal to the NBP threshold. See FCC (2012a, at 29).
28
video or participate in multiple-player online graphic-intensive video games, some of the economic,
social, and civic benefits of broadband claimed by proponents would accrue at lower speeds as well.
Based on the remaining broadband digital divide, the FCC (2012a) has concluded that
“broadband is not yet being deployed to all Americans in a reasonable and timely fashion,” and has
identified several barriers to deployment and adoption that are of policy concern.37 The barriers include
the cost of extending broadband networks, inadequate broadband service quality, unaffordability, lack
of computers in the household, the perceived lack of broadband’s relevance to a potential subscriber,
poor digital literacy, and consumers’ lack of trust in broadband and general Internet insecurity. Federal
efforts to address these barriers to close the broadband gap are of three forms. The first is to provide
better information to broadband consumers. This approach tacitly assumes that consumers are
suboptimally underinformed, and that usage will increase with better information on how providers’
advertised and actual speeds compare, ways broadband can be relevant to daily life and work, or how to
safeguard personal financial information on the Internet. While there are many case studies that intend
to show that particular governmental and private-sector initiatives stimulate broadband adoption, high-
quality econometric evidence on such demand-side program’s efficacy remains rare (Hauge & Prieger,
2010). The second form that current federal effort takes is the removal of legal obstacles to
deployment. Examples of this approach include looking into local, state, and federal regulations and
practices that hinder broadband build-out and revising federal law to ease deploying additional
broadband infrastructure on existing wireless communications towers.38 The third type of federal effort
is the most interventionist: explicit subsidy of broadband deployment and usage. Existing funding for
universal telecommunications service now extends to providers who further rural broadband
connectivity and to low-income consumers who subscribe to broadband.39 Given the nascence of these
subsidy programs for broadband it is too soon to assess their success.
Results 3 and 6, also novel in the digital divide literature, suggest that mobile broadband usage
is filling in part of the rural availability and usage gaps in fixed broadband, and so it is clear that mobile
broadband plays an increasingly important role in the broadband ecosystem. It is interesting to note
that the FCC broadband status report (FCC 2012a) presents data from which Result 3 can be concluded,
37
See FCC (2012a) at 139-156. 38
The latter action was enacted in the Middle Class Tax Relief Act, § 6409(a)(1), 126 Stat. at 232–34. 39
The former program is the FCC’s Universal Service Fund; the latter is the FCC’s Lifeline program. See FCC (2012a) at 143, 147-148. Both programs have existed for decades, but their extension to include broadband is recent.
29
although the report fails to make the connection.40 Regardless, some federal effort to promote
broadband is aimed directly at mobility: freeing up additional wireless spectrum for broadband use,
allocation of $350 million to the Mobility and Tribal Mobility Funds to extend access along rural
roadways, and the abovementioned tower order.41
The expansion of mobile broadband in the US will continue to have important economic and
social benefits. In many developing countries, policymakers treat mobile broadband as one of the most
important tools to close digital divides (ITU, 2012, p. 89). Similarly, rural areas in the US can benefit from
mobile broadband’s cost advantages in some areas with difficult terrain and low-income areas can
benefit from mobile broadband not requiring ownership of a computer in the household. The evidence
suggests that as mobile and other forms of broadband diffuse in rural areas, they will stimulate local
economic growth, although estimates vary concerning the magnitude of the causal impact. Thus, any
policy affecting broadband diffusion—not just those currently pursued by the FCC—is highly important.
For example, antitrust review of wireless mergers should recognize the importance of mobile
broadband’s role in bringing high-speed Internet access to rural areas. Regardless of the details of the
particular policy being debated, the participants in the discussion should be cognizant that the stakes
are large.
References
Barkley, D. L., Markley, D. M., & Lamie, R. D. (2007). E-commerce as a business strategy: Lessons learned
from case studies of rural and small town businesses (Award No. 2005-45064-03212). Southern
Rural Development Center’s National Rural e-Commerce Extension Initiative. Washington D.C.:
U.S. Department of Agriculture. Retrieved from
http://www.energizingentrepreneurs.org/site/images/research/cp/cs/cs7.pdf.
Bouckaert, J., Van Dijk, T., & Verboven, F. (2010, December). Access regulation, competition, and
broadband penetration: An international study. Telecommunications Policy, 34(11), 661-671.
Bresnahan, T. F., & Trajtenberg, M. (1995). General purpose technologies:”Engines of growth”? Journal
of Econometrics, 65 (1), 83-108.
40
In FCC (2012a), Table 15 shows that 6% of Americans lack fixed broadband access under the NBP definition, but only 1.7% lack access to fixed and mobile broadband. The implication not mentioned in the report is that the data thus imply that for 4.3% of US residents (about 15 million people), mobile broadband is filling in coverage gaps in fixed broadband access. 41
See FCC (2012a) at 145, 143, and 144, respectively.
30
Buttkerelt, S., Enriquez, L., Grijpink, F., Moraje, S., Torfs, W., & Vaheri-Delmulle, T. (2009). Mobile
broadband for the masses: Regulatory levers to make it happen. McKinsey & Company.
Retrieved from
http://ww1.mckinsey.com/clientservice/telecommunications/Mobile_broadband_for_the_mass
es.pdf.
Chaudhuri, A., Flamm, K., & Horrigan J. (2005). An analysis of the determinants of Internet access.
Telecommunications Policy, 29, 731–755.
Crandall, R. W., & Jackson, C. L. (2003). The $500 billion opportunity: The potential economic benefit of
widespread diffusion of broadband Internet access. In A. L. Shampine (Ed.). Down to the wire:
Studies in the diffusion and regulation of telecommunications technologies (ch.8). Haupaugge,
NY: Nova Science Press.
Crandall, R., Lehr, W., & Litan, R. (2007, July). The effects of broadband deployment on output and
employment: A cross-sectional analysis of U.S. data. Issues in Economic Policy , no. 6. Brookings
Institution.
Czernich, N., Falck, O., Kretschmer, T., & Woessmann, L. (2011). Broadband infrastructure and economic
growth. The Economic Journal, 121, 505–532.
Davern, M., Jones, A., Jr., Lepkowski, J., Davidson, G., & Blewett, L. A. (2007). Estimating regression
standard errors with data from the current population survey’s public use file. Inquiry, 44(2),
211-224.
Deighton, J., & Quelch, J. (2009). Economic value of the advertising-supported Internet ecosystem.
Hamilton Consultants. Retrieved from
http://www.iab.net/insights_research/industry_data_and_landscape/economicvalue.
Deloitte. (2011, August). The impact of 4G technology on commercial interactions, economic growth, and
U.S. competitiveness. Retrieved from http://www.deloitte.com/assets/Dcom-
UnitedStates/Local%20Assets/Documents/TMT_us_tmt/us_tmt_impactof4g_081911.pdf.
Denni, M., & Gruber, H. (2007). The diffusion of broadband telecommunications in the US: The role of
different forms of competition. Communications & Strategies, 68, 139-157
Dickes, L. A., Lamie, R. D., & Whitacre, B. E. (2010). The struggle for broadband in rural America. Choices,
25(4). Retrieved from http://www.choicesmagazine.org/magazine/article.php?article=156.
Distaso, W., Lupi, P., & Manenti, F. (2006). Platform competition and broadband uptake: Theory and
empirical evidence from the European Union. Information Economics and Policy, 18(1), 87-106.
Dutz, M., Orszag, J., & Willig, R. (2009, July). The substantial consumer benefits of broadband
connectivity for U.S. households. Compass LexEcon report.
Eggerton, J. (2011, October 25). ITU, UNESCO push for affordable broadband everywhere by 2015.
Broadcasting & Cable. Retrieved from http://www.broadcastingcable.com/
31
Entner, R. (2008). The increasingly important impact of wireless broadband technology and services on
the U.S. economy. Study by Ovum, for CTIA. Retrieved from
http://files.ctia.org/pdf/Final_OvumEconomicImpact_Report_5_21_08.pdf.
Federal Communications Commission. (FCC) (2010). Connecting America: The national broadband plan.
Retrieved from http://www.broadband.gov/download-plan/.
Federal Communications Commission. (FCC) (2012a). Eighth broadband progress report. FCC 12-90.
Released August 21, 2012.
Federal Communications Commission. (FCC) (2012b). Internet access services: Status as of June 30, 2011.
Industry Analysis and Technology Division, Wireline Competition Bureau. Released June 2012.
Flamm, K. (2005). The role of economics, demographics, and state policy in broadband availability. Paper
presented at the PURC/London Business School Conference on “The future of broadband: wired
and wireless, 2005”, Gainesville, Florida.
Ford, G. S. (2011, March). Challenges in using the national broadband map’s data. Phoenix Center Policy
Bulletin, No. 27.
Genachowski, J. (2011, June 17). Bringing broadband to rural America: Update to report on a rural
broadband strategy. Federal Communications Commission. GN Docket No. 11-16.
Gillett, S., Lehr, W. H., Osorio C. A., & Sirbu M. A. (2006, February). Measuring broadband’s economic
impact. U.S. Department of Commerce, Economic Development Administration, National
Technical Assistance, Training, Research, and Evaluation Project #99-07-13829.
Goolsbee, A., & Klenow, P. J. (2006). Valuing consumer products by the time spent using them: An
application to the Internet. American Economic Review, 96(2), 108-113.
Greenstein, S. M., & McDevitt, R. C. (2011). The broadband bonus: Estimating broadband Internet’s
economic value. Telecommunications Policy, 35, 617-632.
Gruber, H., & Koutroumpis, P. (2011). Mobile telecommunications and the impact on economic
development. Economic Policy, 26(67), 387-426.
Grubesic, T. H., & Murray, A. T. (2004). Waiting for broadband: Local competition and the spatial
distribution of advanced telecommunication services in the United States. Growth and Change,
35(2), 139-165.
Hauge, J. A., & Prieger, J. E. (2010). Demand-side programs to stimulate adoption of broadband: What
works? Review of Network Economics, 9(3), Article 4.
Holt, L., & Jamison, M. (2009). Broadband and contributions to economic growth: Lessons from the U.S.
experience. Telecommunications Policy, 33, 575-581.
International Telecommunications Union. (ITU) (2012, April). The impact of broadband on the economy:
Research to date and policy issues. Telecommunications Development Sector, Regulatory and
32
Market Environment, Broadband Series. Retrieved from http://www.itu.int/ITU-
D/treg/broadband/ITU-BB-Reports_Impact-of-Broadband-on-the-Economy.pdf.
Katz, R. L., Avila, J., & Meille, G. (2011). Economic impact of wireless broadband in rural america. Study
by Telecom Advisory Services, LLC, for the Rural Cellular Association. Retrieved from http://rca-
usa.org/wp-content/uploads/2011/02/Economic-Study-02.24.11.pdf.
Kolko, J. (2010). Does broadband boost local economic development? Public Policy Institute of
California. Retrieved from http://www.ppic.org/main/publication.asp?i=866.
Kridel, D., Rappoport, P., & Taylor, L. (2001). The demand for high-speed access to the Internet: The case
of cable modems. In D. Loomis, & L. Taylor (Eds.). Forecasting the Internet: Understanding the
explosive growth of data communications (pp.11-22). Boston, MA: Kluwer.
LECG Ltd. (2009, February 22). The economic impact of broadband: An empirical study. Report related
to Connectivity Scorecard 2009, prepared for Nokia Siemens Networks. Retrieved from
http://www.itu.int/wsis/stocktaking/doc/activities/1286203195/Report_BroadbandStudy_LECG
_March6[1].pdf.
Lee, S., Marcu, M., & Lee, S. (2011). An empirical analysis of fixed and mobile broadband diffusion.
Information Economics and Policy, 23, 227-233.
Li, Y., Turner-Lee, N., Gambhir, S., & Baek, M. (2011, April 4). Does Place really matter? Broadband
availability, race and income. Joint Center for Political and Economic Studies Working Paper
Series. Retrieved from
http://4909e99d35cada63e7f757471b7243be73e53e14.gripelements.com/publications/jcpes_b
roadband_mapping_paper_2011_0322.pdf.
Mayo, J. W., & Wallsten, S. (2011). From network externalities to broadband growth externalities: A
bridge not yet built. Review of Industrial Organization, 38(2), 173-190.
Molnar, G., and Savage, S. (2012, July 2012). Market structure and product quality: Evidence from United
States broadband Internet markets. Paper presented at WEAI Annual Conference, San Francisco,
CA.
Morris, D. E., & Goodridge, L. E. (2008, Sept. 29). What skills are at the end of broadband cables in rural
America? Do they match up with firms wishing to engage rural sourcing? Paper presented at the
Broadband in the Rural Economy Workshop, Economic Research Service, USDA, Washington,
DC.
National Telecommunications and Information Administration. (2011, February). Digital nation:
Expanding Internet usage: NTIA research preview. Washington D.C.: U.S. Department of
Commerce. Retrieved from
http://www.ntia.doc.gov/reports/2011/NTIA_Internet_Use_Report_February_2011.pdf.
Pociask, S. B. (2005, December). Broadband use by rural small businesses. Study by TeleNomic Research,
LLC, for the Small Business Administration Office of Advocacy. Retrieved from
http://www.marketingtechie.com/articles/SmallBusiness%20-%20Dec20.pdf.
33
Prieger, J. E. (2003). The supply side of the digital divide: Is there equal availability in the broadband
Internet access market? Economic Inquiry, 41(2), 346-363.
Prieger, J. E., & Church, T. V. (2012). Deployment of mobile broadband service in the United States. In I.
Lee (Ed). Mobile services industries, technologies, and applications in the global economy (pp.1-
24). Hershey, PA: IGI Global.
Prieger, J. E., & Faltis, K. (2012). Civic engagement in California: Why do we lag? Pepperdine University,
School of Public Policy Working Papers. Paper 37.
Prieger, J. E., & Heil, D. (2012). Economic implications of e-business for organizations. In F. Martínez-
López (Ed.). Research handbook on e-business strategic management. Springer-Verlag,
forthcoming.
Prieger, J. E., & Heil, D. (2010a). The macroeconomic impact of e-business. In I. Lee (Ed.). Encyclopedia of
e-business development and management in the global economy (pp.1-11). Hershey, PA: IGI
Global.
Prieger, J. E., & Heil, D. (2010b). The microeconomic impact of e-business. In I. Lee (Ed.). Encyclopedia of
e-business development and management in the global economy (pp.12-22). Hershey, PA: IGI
Global.
Prieger, J. E., & Hu, W.-M. (2008). The broadband digital divide and the nexus of race, competition, and
quality. Information Economics and Policy, 20(2), 150-167.
Prieger, J. E., & Lee, S. (2008). Regulation and the deployment of broadband. In Dwivedi, et al. (Eds.).
Handbook of research on global diffusion of broadband data transmission (pp.278-303).
Hershey, PA: IGI Global.
Qiang, C. Z.-W., & Rossotto, C. M. (2009). Economic impacts of broadband. In World Bank (Ed.).
Information and communications for development 2009: Extending reach and increasing impact,
(ch.3). Retrieved from http://go.worldbank.org/NATLOH7HV0.
Rappoport, P. N., Kridel, D. J., Taylor, L. D., Alleman, J. H., & Duffy-Deno, K. T. (2003). Residential
demand for access to the Internet. In G. Madden (Ed.). Emerging telecommunications networks
(pp. 55-72). The international handbook of telecommunications economics (Vol. 2). Cheltenham,
U.K.: Edward Elgar.
Rohman, I. K., & Bohlin, E. (2012). Does broadband speed really matter for driving economic growth?
Investigating OECD countries. Retrieved from SSRN: http://ssrn.com/abstract=2034284 or
http://dx.doi.org/10.2139/ssrn.2034284.
Rosston, G. L., Savage, S. J., & Waldman, D. M. (2010). Household demand for broadband Internet in
2010. The B.E. Journal of Economic Analysis & Policy (Advances), 10(1), Article 79.
Savage, S. J., & Waldman, D. (2005). Broadband Internet access, awareness, and use: Analysis of United
States household data. Telecommunications Policy, 29(8), 615-633. doi:
10.1016/j.telpol.2005.06.001. ISSN: 0308-5961.
34
Seto, E. (2008). Cost comparison between telemonitoring and usual care of heart failure: A systematic
review. Telemedicine Journal and e-Health, 14(7), 679-686.
Stenberg, P., Morehart, M., Vogel, S., Cromartie, J., Breneman, V., & Brown, D. (2009). Broadband
Internet’s value for rural America. Washington D.C.: U.S. Department of Agriculture, Economic
Research Service, Economic Research Report No. 78.
Stern, M. J., & Adams, A. E. (2010). Do rural residents really use the Internet to build social capital? An
empirical investigation. American Behavioral Scientist, 53(9), 1389-1422.
Stern, M. J., Adams, A. E., & Boase, J. (2011). Rural community participation, social networks, and
broadband use: Examples from localized and national survey data. Agricultural and Resource
Economics Review, 40(2), 158-171.
Thompson, H. G., Jr., & Garbacz, C. (2011). Economic impacts of mobile versus fixed broadband.
Telecommunications Policy, 35(11), 999-1009.
United States Department of Agriculture. (USDA) (2011, January). Advancing broadband: A foundation
for strong rural communities. Broadband Initiatives Program, Awards Report.
Van Gaasbeck, K. A. (2008). A rising tide: Measuring the economic effects of broadband use across
California. The Social Science Journal, 45, 691–699.
Varian, H., Litan, R. E., Elder, A., & Shutter, J. (2002). Net impact study: The projected economic benefits
of the Internet in the United States, United Kingdom, France, and Germany. Retrieved from
http://netimpact_2002/net-impact-us-euro.pdf.
Vogelsang, I. (2010). The relationship between mobile and fixed-line communications: A survey.
Information Economics and Policy, 22(1), 4-17.
Wallsten, S., & Mallahan, C. (2010). Residential broadband competition in the United States. Working
paper, SSRN. Retrieved from http://ssrn.com/abstract=1684236
Whitacre, B. E., Hartman, P. S., Boggs, S. A., & Schott, V. (2009). A community perspective on quantifying
the economic impact of teleradiology and telepsychiatry. Journal of Rural Health, 25(2), 194-
197.
Xiao, M., & Orazem, P. F. (2011). Does the fourth entrant make any difference? Entry and competition in
the early U.S. broadband market. International Journal of Industrial Organization, 29(5), 547-
561.
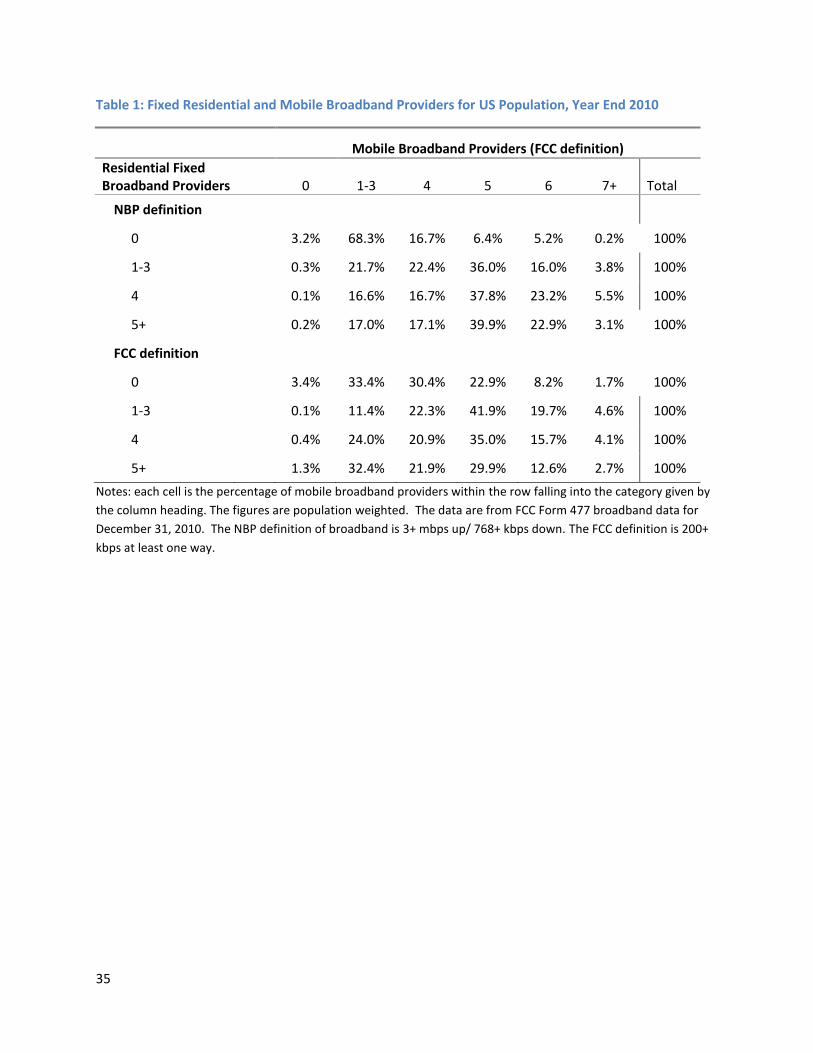
35
Table 1: Fixed Residential and Mobile Broadband Providers for US Population, Year End 2010
Mobile Broadband Providers (FCC definition)
Residential Fixed Broadband Providers 0 1-3 4 5 6 7+ Total
NBP definition
0
3.2% 68.3% 16.7% 6.4% 5.2% 0.2% 100%
1-3
0.3% 21.7% 22.4% 36.0% 16.0% 3.8% 100%
4
0.1% 16.6% 16.7% 37.8% 23.2% 5.5% 100%
5+ 0.2% 17.0% 17.1% 39.9% 22.9% 3.1% 100%
FCC definition
0
3.4% 33.4% 30.4% 22.9% 8.2% 1.7% 100%
1-3
0.1% 11.4% 22.3% 41.9% 19.7% 4.6% 100%
4
0.4% 24.0% 20.9% 35.0% 15.7% 4.1% 100%
5+ 1.3% 32.4% 21.9% 29.9% 12.6% 2.7% 100%
Notes: each cell is the percentage of mobile broadband providers within the row falling into the category given by
the column heading. The figures are population weighted. The data are from FCC Form 477 broadband data for
December 31, 2010. The NBP definition of broadband is 3+ mbps up/ 768+ kbps down. The FCC definition is 200+
kbps at least one way.
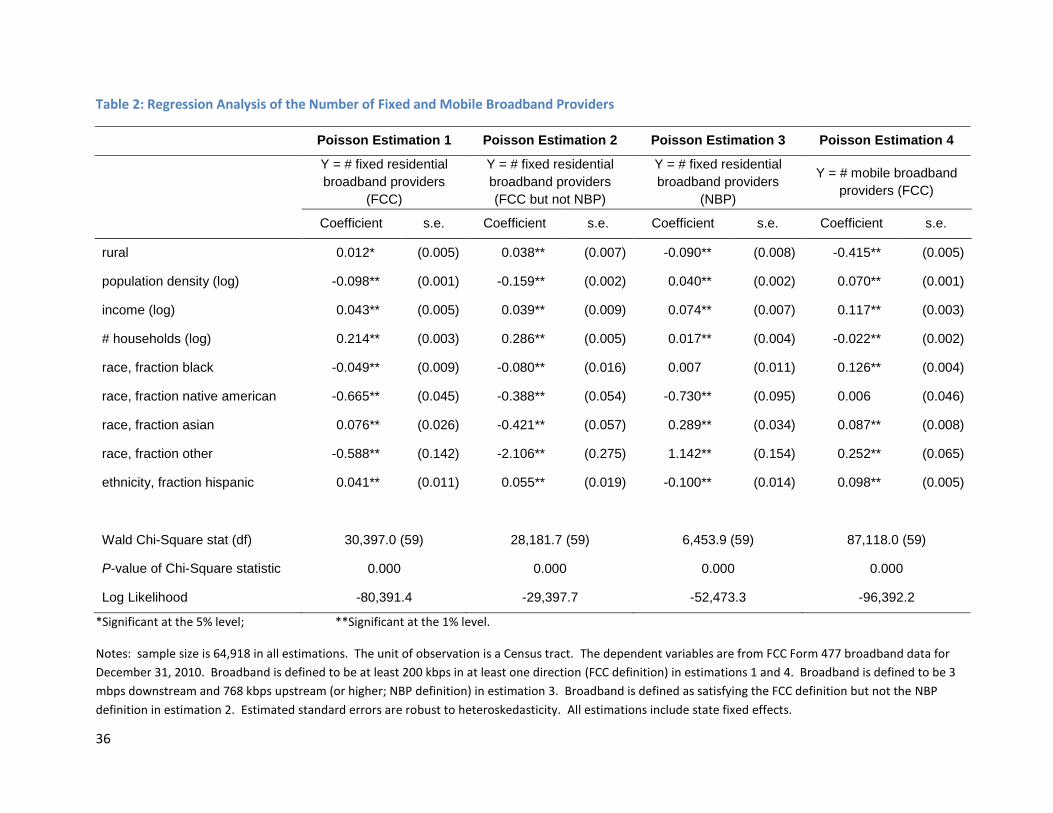
36
Table 2: Regression Analysis of the Number of Fixed and Mobile Broadband Providers
Poisson Estimation 1 Poisson Estimation 2 Poisson Estimation 3 Poisson Estimation 4
Y = # fixed residential
broadband providers
(FCC)
Y = # fixed residential
broadband providers
(FCC but not NBP)
Y = # fixed residential
broadband providers
(NBP)
Y = # mobile broadband
providers (FCC)
Coefficient s.e. Coefficient s.e. Coefficient s.e. Coefficient s.e.
rural 0.012* (0.005) 0.038** (0.007) -0.090** (0.008) -0.415** (0.005)
population density (log) -0.098** (0.001) -0.159** (0.002) 0.040** (0.002) 0.070** (0.001)
income (log) 0.043** (0.005) 0.039** (0.009) 0.074** (0.007) 0.117** (0.003)
# households (log) 0.214** (0.003) 0.286** (0.005) 0.017** (0.004) -0.022** (0.002)
race, fraction black -0.049** (0.009) -0.080** (0.016) 0.007 (0.011) 0.126** (0.004)
race, fraction native american -0.665** (0.045) -0.388** (0.054) -0.730** (0.095) 0.006 (0.046)
race, fraction asian 0.076** (0.026) -0.421** (0.057) 0.289** (0.034) 0.087** (0.008)
race, fraction other -0.588** (0.142) -2.106** (0.275) 1.142** (0.154) 0.252** (0.065)
ethnicity, fraction hispanic 0.041** (0.011) 0.055** (0.019) -0.100** (0.014) 0.098** (0.005)
Wald Chi-Square stat (df) 30,397.0 (59) 28,181.7 (59) 6,453.9 (59) 87,118.0 (59)
P-value of Chi-Square statistic 0.000 0.000 0.000 0.000
Log Likelihood -80,391.4 -29,397.7 -52,473.3 -96,392.2
*Significant at the 5% level; **Significant at the 1% level.
Notes: sample size is 64,918 in all estimations. The unit of observation is a Census tract. The dependent variables are from FCC Form 477 broadband data for
December 31, 2010. Broadband is defined to be at least 200 kbps in at least one direction (FCC definition) in estimations 1 and 4. Broadband is defined to be 3
mbps downstream and 768 kbps upstream (or higher; NBP definition) in estimation 3. Broadband is defined as satisfying the FCC definition but not the NBP
definition in estimation 2. Estimated standard errors are robust to heteroskedasticity. All estimations include state fixed effects.
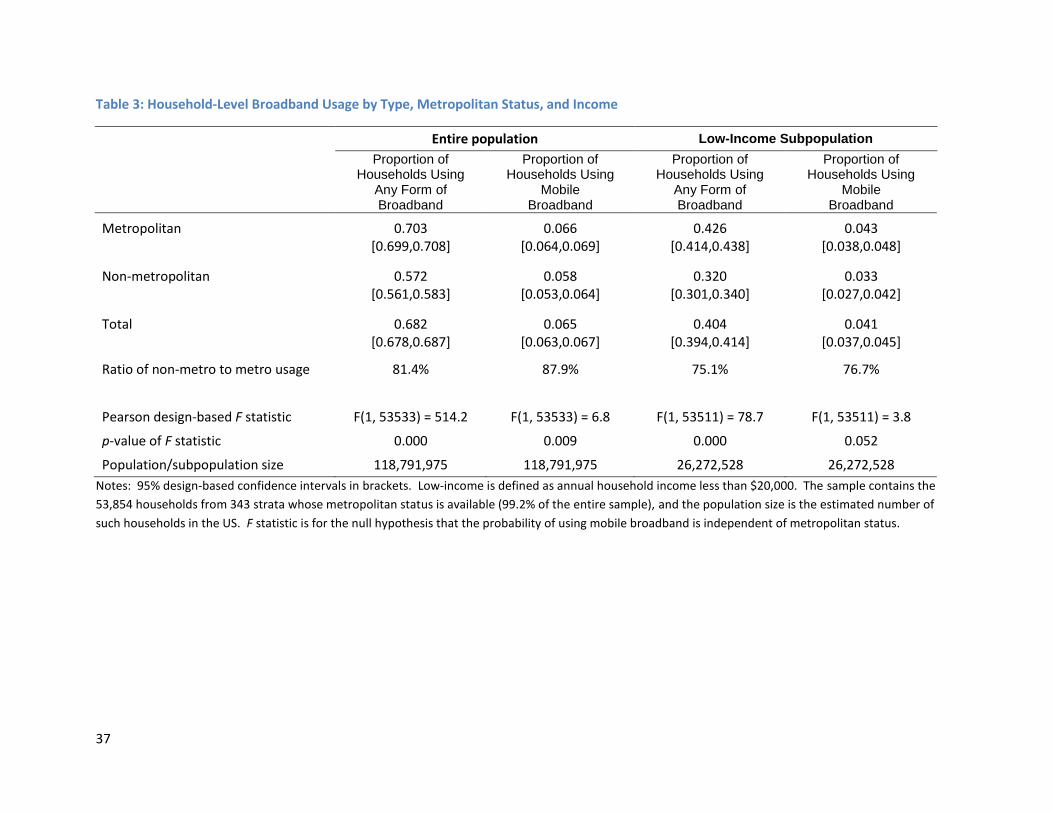
37
Table 3: Household-Level Broadband Usage by Type, Metropolitan Status, and Income
Entire population Low-Income Subpopulation
Proportion of Households Using
Any Form of Broadband
Proportion of Households Using
Mobile Broadband
Proportion of Households Using
Any Form of Broadband
Proportion of Households Using
Mobile Broadband
Metropolitan 0.703 0.066 0.426 0.043
[0.699,0.708] [0.064,0.069] [0.414,0.438] [0.038,0.048]
Non-metropolitan 0.572 0.058 0.320 0.033
[0.561,0.583] [0.053,0.064] [0.301,0.340] [0.027,0.042]
Total 0.682 0.065 0.404 0.041
[0.678,0.687] [0.063,0.067] [0.394,0.414] [0.037,0.045]
Ratio of non-metro to metro usage 81.4% 87.9% 75.1% 76.7%
Pearson design-based F statistic F(1, 53533) = 514.2 F(1, 53533) = 6.8 F(1, 53511) = 78.7 F(1, 53511) = 3.8
p-value of F statistic 0.000 0.009 0.000 0.052
Population/subpopulation size 118,791,975 118,791,975 26,272,528 26,272,528
Notes: 95% design-based confidence intervals in brackets. Low-income is defined as annual household income less than $20,000. The sample contains the
53,854 households from 343 strata whose metropolitan status is available (99.2% of the entire sample), and the population size is the estimated number of
such households in the US. F statistic is for the null hypothesis that the probability of using mobile broadband is independent of metropolitan status.
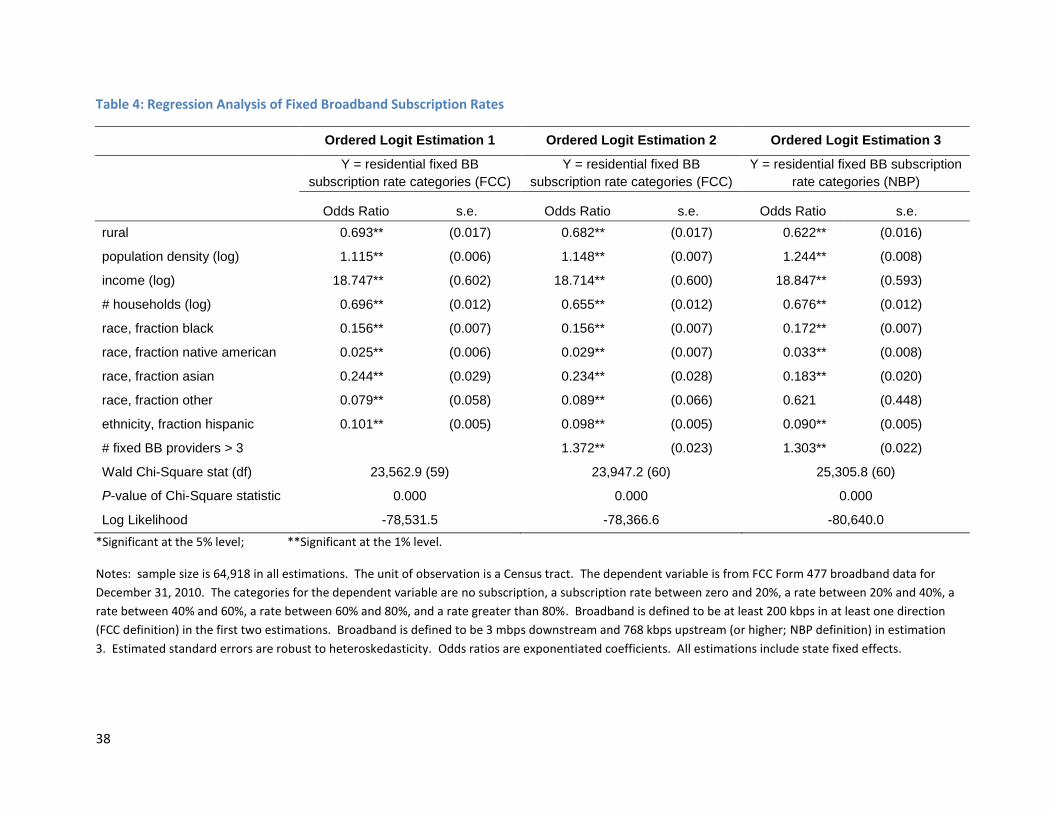
38
Table 4: Regression Analysis of Fixed Broadband Subscription Rates
Ordered Logit Estimation 1 Ordered Logit Estimation 2 Ordered Logit Estimation 3
Y = residential fixed BB
subscription rate categories (FCC)
Y = residential fixed BB
subscription rate categories (FCC)
Y = residential fixed BB subscription
rate categories (NBP)
Odds Ratio s.e. Odds Ratio s.e. Odds Ratio s.e.
rural 0.693** (0.017) 0.682** (0.017) 0.622** (0.016)
population density (log) 1.115** (0.006) 1.148** (0.007) 1.244** (0.008)
income (log) 18.747** (0.602) 18.714** (0.600) 18.847** (0.593)
# households (log) 0.696** (0.012) 0.655** (0.012) 0.676** (0.012)
race, fraction black 0.156** (0.007) 0.156** (0.007) 0.172** (0.007)
race, fraction native american 0.025** (0.006) 0.029** (0.007) 0.033** (0.008)
race, fraction asian 0.244** (0.029) 0.234** (0.028) 0.183** (0.020)
race, fraction other 0.079** (0.058) 0.089** (0.066) 0.621 (0.448)
ethnicity, fraction hispanic 0.101** (0.005) 0.098** (0.005) 0.090** (0.005)
# fixed BB providers > 3 1.372** (0.023) 1.303** (0.022)
Wald Chi-Square stat (df) 23,562.9 (59) 23,947.2 (60) 25,305.8 (60)
P-value of Chi-Square statistic 0.000 0.000 0.000
Log Likelihood -78,531.5 -78,366.6 -80,640.0
*Significant at the 5% level; **Significant at the 1% level.
Notes: sample size is 64,918 in all estimations. The unit of observation is a Census tract. The dependent variable is from FCC Form 477 broadband data for
December 31, 2010. The categories for the dependent variable are no subscription, a subscription rate between zero and 20%, a rate between 20% and 40%, a
rate between 40% and 60%, a rate between 60% and 80%, and a rate greater than 80%. Broadband is defined to be at least 200 kbps in at least one direction
(FCC definition) in the first two estimations. Broadband is defined to be 3 mbps downstream and 768 kbps upstream (or higher; NBP definition) in estimation
3. Estimated standard errors are robust to heteroskedasticity. Odds ratios are exponentiated coefficients. All estimations include state fixed effects.
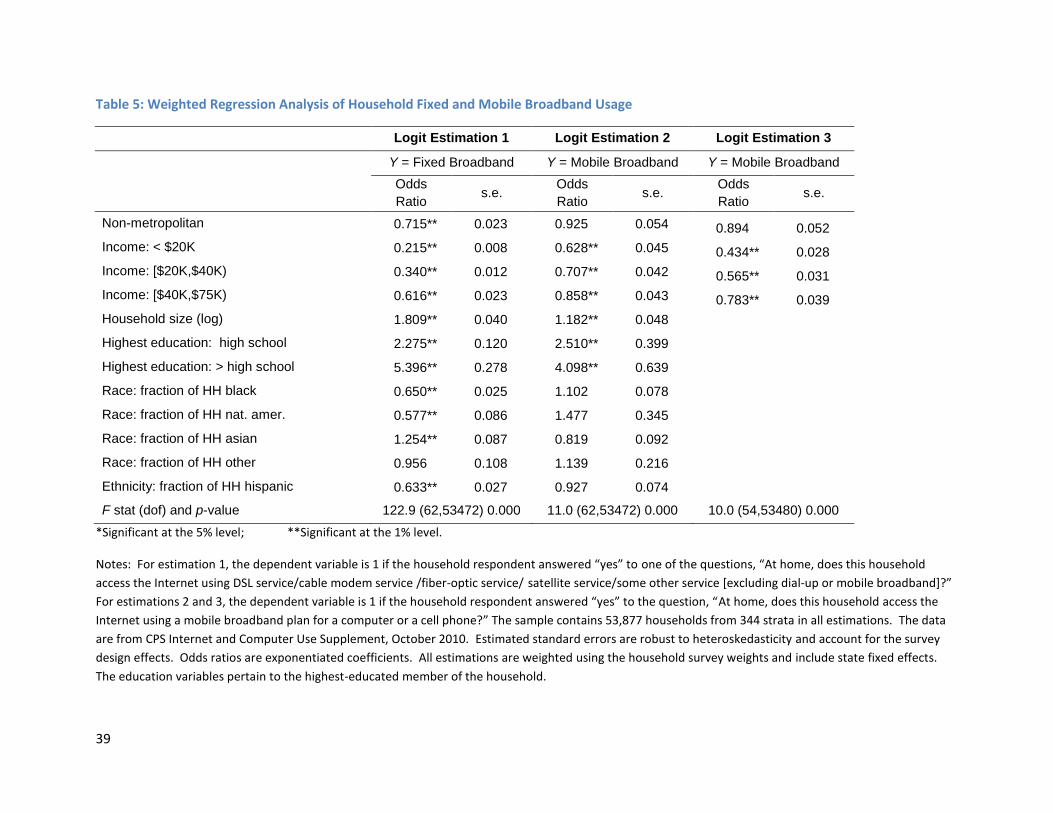
39
Table 5: Weighted Regression Analysis of Household Fixed and Mobile Broadband Usage
Logit Estimation 1 Logit Estimation 2 Logit Estimation 3
Y = Fixed Broadband Y = Mobile Broadband Y = Mobile Broadband
Odds
Ratio s.e.
Odds
Ratio s.e.
Odds
Ratio s.e.
Non-metropolitan 0.715** 0.023 0.925 0.054 0.894 0.052
Income: < $20K 0.215** 0.008 0.628** 0.045 0.434** 0.028
Income: [$20K,$40K) 0.340** 0.012 0.707** 0.042 0.565** 0.031
Income: [$40K,$75K) 0.616** 0.023 0.858** 0.043 0.783** 0.039
Household size (log) 1.809** 0.040 1.182** 0.048
Highest education: high school 2.275** 0.120 2.510** 0.399
Highest education: > high school 5.396** 0.278 4.098** 0.639
Race: fraction of HH black 0.650** 0.025 1.102 0.078
Race: fraction of HH nat. amer. 0.577** 0.086 1.477 0.345
Race: fraction of HH asian 1.254** 0.087 0.819 0.092
Race: fraction of HH other 0.956 0.108 1.139 0.216
Ethnicity: fraction of HH hispanic 0.633** 0.027 0.927 0.074
F stat (dof) and p-value 122.9 (62,53472) 0.000 11.0 (62,53472) 0.000 10.0 (54,53480) 0.000
*Significant at the 5% level; **Significant at the 1% level.
Notes: For estimation 1, the dependent variable is 1 if the household respondent answered “yes” to one of the questions, “At home, does this household
access the Internet using DSL service/cable modem service /fiber-optic service/ satellite service/some other service [excluding dial-up or mobile broadband]?”
For estimations 2 and 3, the dependent variable is 1 if the household respondent answered “yes” to the question, “At home, does this household access the
Internet using a mobile broadband plan for a computer or a cell phone?” The sample contains 53,877 households from 344 strata in all estimations. The data
are from CPS Internet and Computer Use Supplement, October 2010. Estimated standard errors are robust to heteroskedasticity and account for the survey
design effects. Odds ratios are exponentiated coefficients. All estimations are weighted using the household survey weights and include state fixed effects.
The education variables pertain to the highest-educated member of the household.
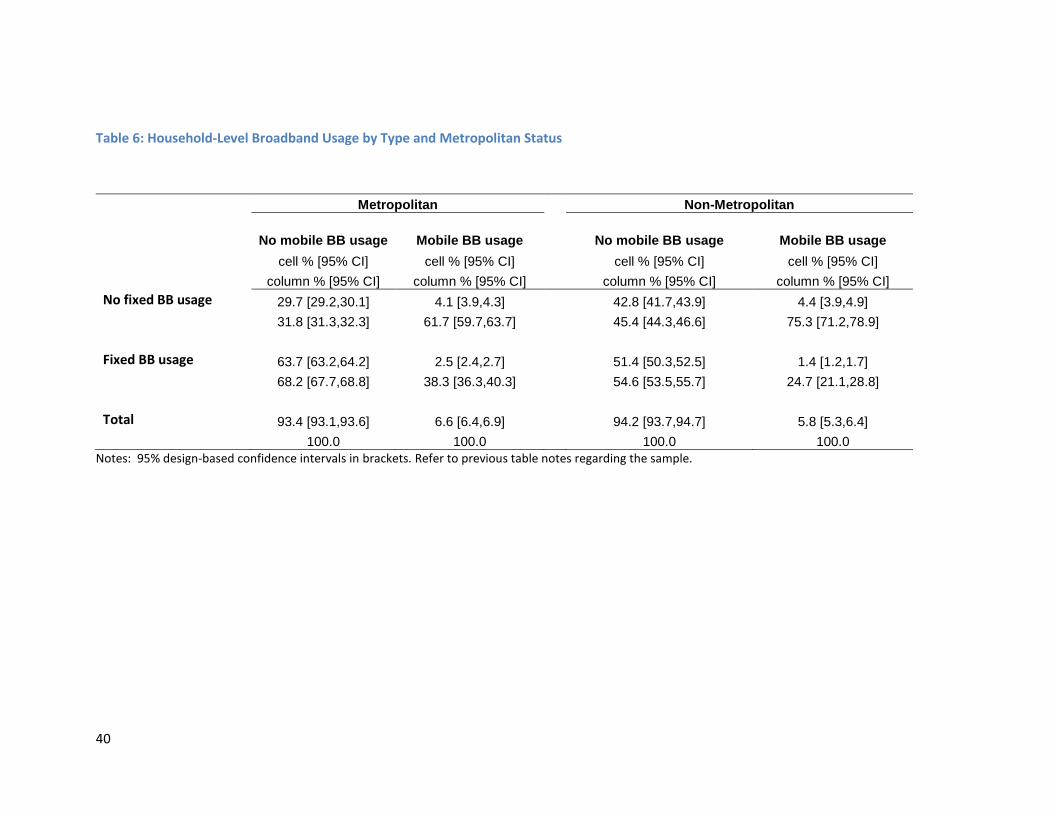
40
Table 6: Household-Level Broadband Usage by Type and Metropolitan Status
Metropolitan
Non-Metropolitan
No mobile BB usage Mobile BB usage
No mobile BB usage Mobile BB usage
cell % [95% CI] cell % [95% CI]
cell % [95% CI] cell % [95% CI]
column % [95% CI] column % [95% CI]
column % [95% CI] column % [95% CI]
No fixed BB usage 29.7 [29.2,30.1] 4.1 [3.9,4.3]
42.8 [41.7,43.9] 4.4 [3.9,4.9]
31.8 [31.3,32.3] 61.7 [59.7,63.7]
45.4 [44.3,46.6] 75.3 [71.2,78.9]
Fixed BB usage 63.7 [63.2,64.2] 2.5 [2.4,2.7]
51.4 [50.3,52.5] 1.4 [1.2,1.7]
68.2 [67.7,68.8] 38.3 [36.3,40.3]
54.6 [53.5,55.7] 24.7 [21.1,28.8]
Total 93.4 [93.1,93.6] 6.6 [6.4,6.9]
94.2 [93.7,94.7] 5.8 [5.3,6.4]
100.0 100.0
100.0 100.0
Notes: 95% design-based confidence intervals in brackets. Refer to previous table notes regarding the sample.
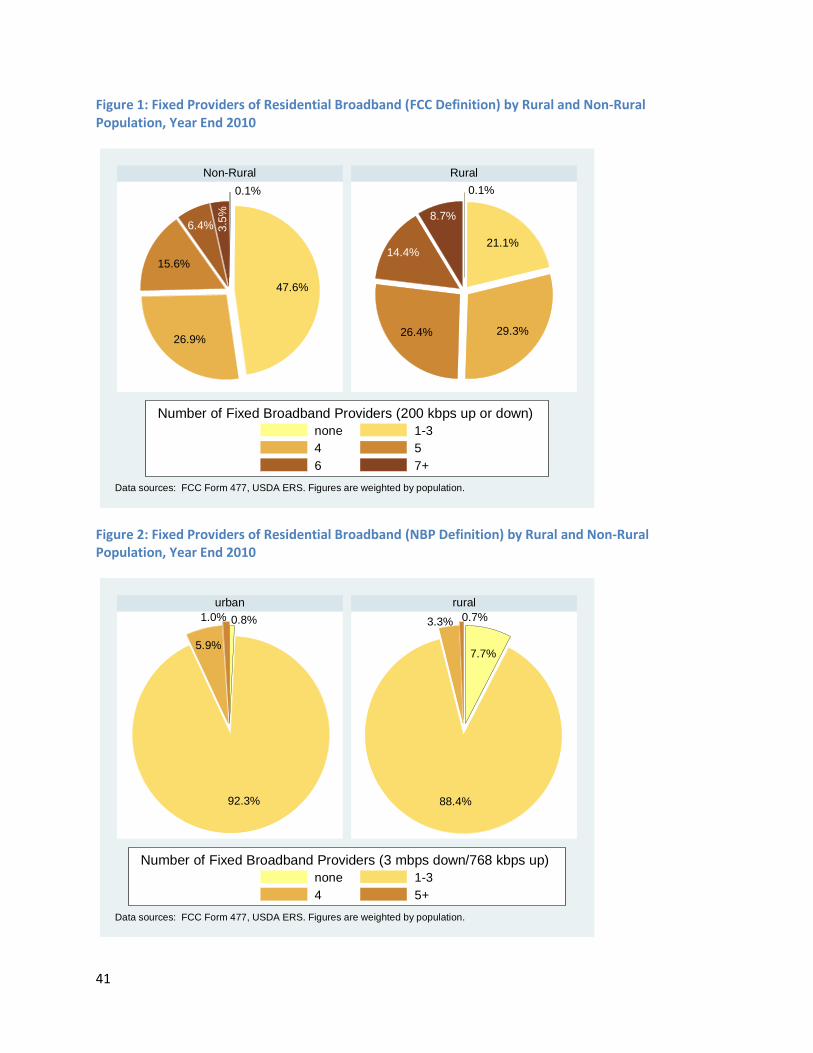
41
Figure 1: Fixed Providers of Residential Broadband (FCC Definition) by Rural and Non-Rural Population, Year End 2010
Figure 2: Fixed Providers of Residential Broadband (NBP Definition) by Rural and Non-Rural Population, Year End 2010
0.1%
47.6%
26.9%
15.6%
6.4% 3.5
%
0.1%
21.1%
29.3%26.4%
14.4%
8.7%
Non-Rural Rural
none 1-3
4 5
6 7+
Number of Fixed Broadband Providers (200 kbps up or down)
Data sources: FCC Form 477, USDA ERS. Figures are weighted by population.
0.8%
92.3%
5.9%
1.0%
7.7%
88.4%
3.3% 0.7%
urban rural
none 1-3
4 5+
Number of Fixed Broadband Providers (3 mbps down/768 kbps up)
Data sources: FCC Form 477, USDA ERS. Figures are weighted by population.
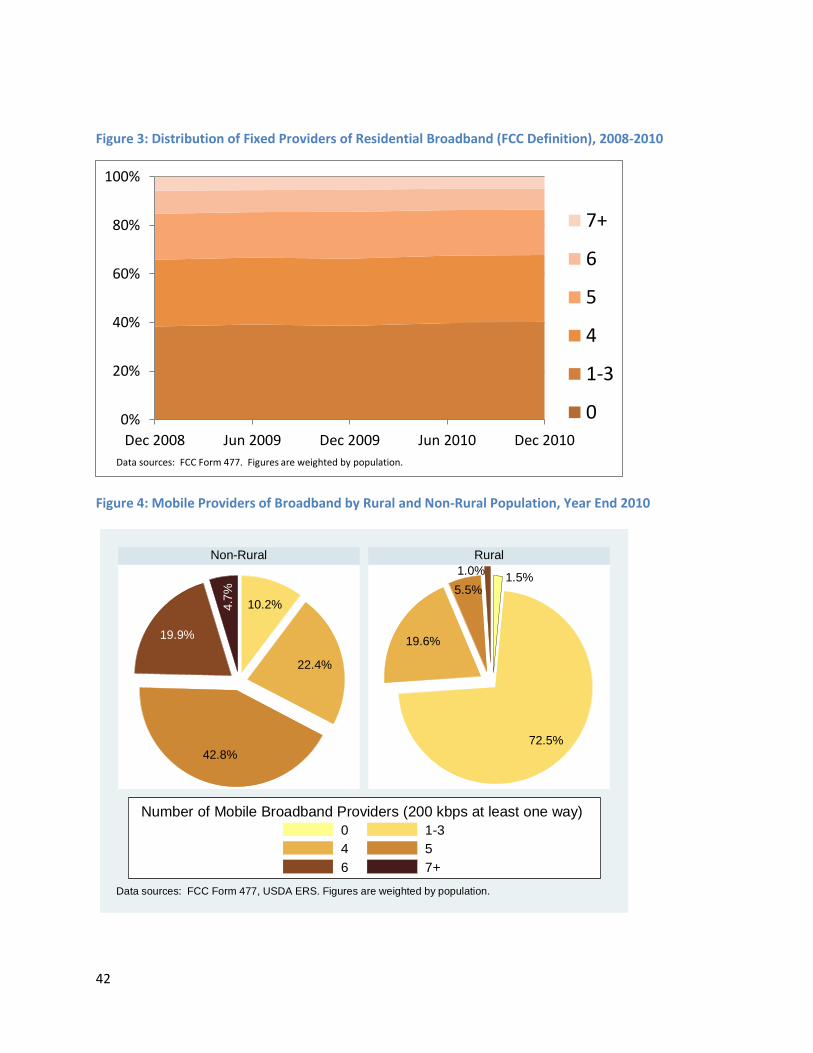
42
Figure 3: Distribution of Fixed Providers of Residential Broadband (FCC Definition), 2008-2010
Figure 4: Mobile Providers of Broadband by Rural and Non-Rural Population, Year End 2010
0%
20%
40%
60%
80%
100%
Dec 2008 Jun 2009 Dec 2009 Jun 2010 Dec 2010
7+
6
5
4
1-3
0
Data sources: FCC Form 477. Figures are weighted by population.
10.2%
22.4%
42.8%
19.9%
4.7
%
1.5%
72.5%
19.6%
5.5%
1.0%
Non-Rural Rural
0 1-3
4 5
6 7+
Number of Mobile Broadband Providers (200 kbps at least one way)
Data sources: FCC Form 477, USDA ERS. Figures are weighted by population.
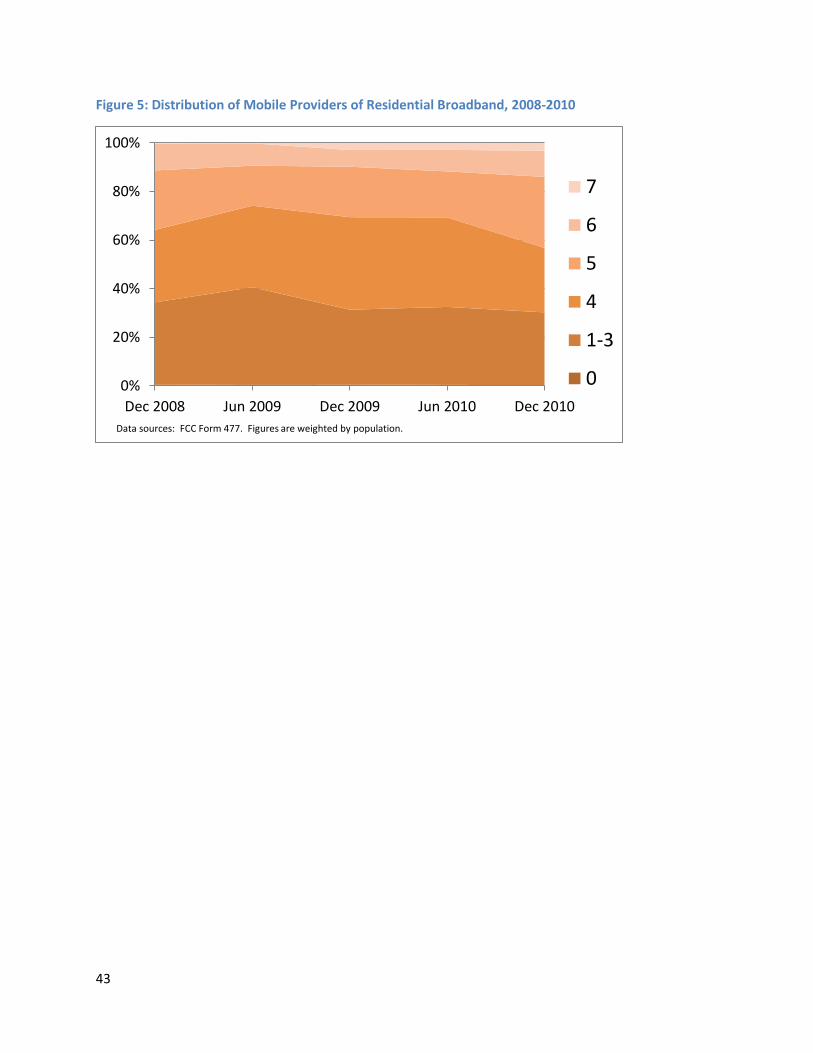
43
Figure 5: Distribution of Mobile Providers of Residential Broadband, 2008-2010
0%
20%
40%
60%
80%
100%
Dec 2008 Jun 2009 Dec 2009 Jun 2010 Dec 2010
7
6
5
4
1-3
0
Data sources: FCC Form 477. Figures are weighted by population.
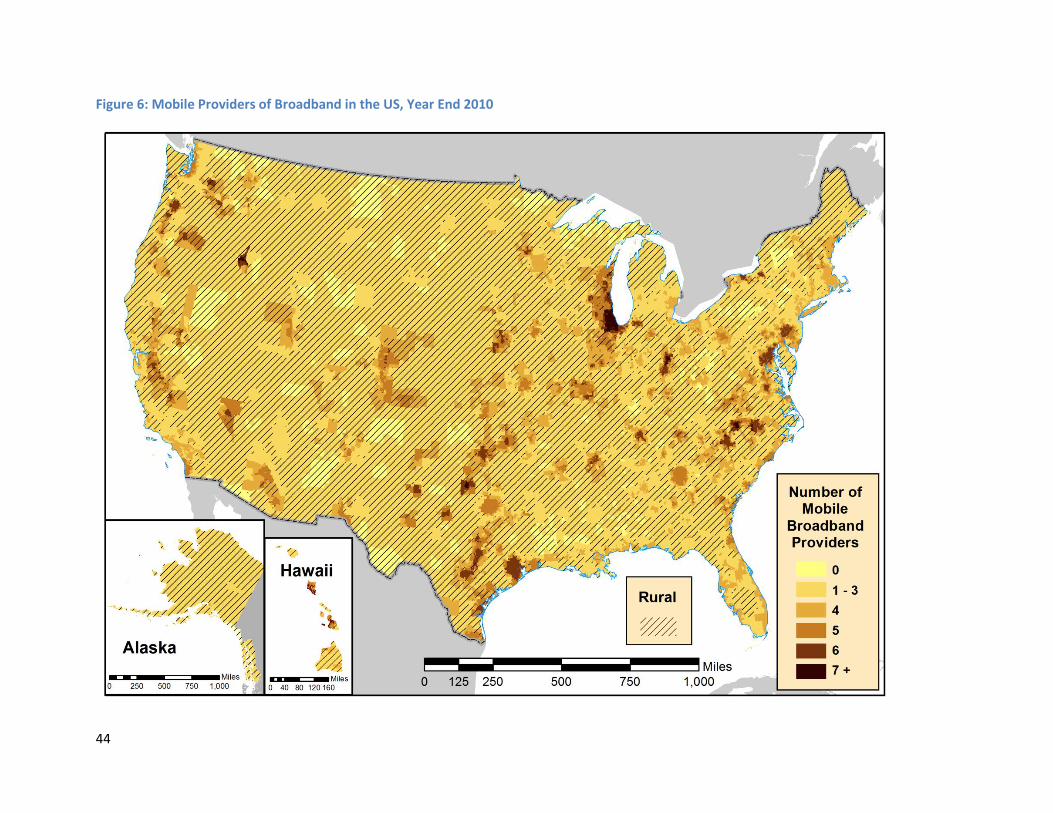
44
Figure 6: Mobile Providers of Broadband in the US, Year End 2010